The Application of Consensus Weighted Gene Co-expression ...
10
ORIGINAL RESEARCH published: 24 February 2022 doi: 10.3389/fneur.2022.807349 Frontiers in Neurology | www.frontiersin.org 1 February 2022 | Volume 13 | Article 807349 Edited by: Frederic Sampedro, Sant Pau Institute for Biomedical Research, Spain Reviewed by: Bahman Panahi, Agricultural Biotechnology Research Institute of Iran, Iran Atul Kumar, Lund University, Sweden Zhijie Han, Chongqing Medical University, China *Correspondence: Keping Chai [email protected] Feng Wan [email protected] Jiawei Liang [email protected] Daojiang Shen [email protected] † These authors have contributed equally to this work Specialty section: This article was submitted to Dementia and Neurodegenerative Diseases, a section of the journal Frontiers in Neurology Received: 01 December 2021 Accepted: 24 January 2022 Published: 24 February 2022 Citation: Chai K, Zhang X, Tang H, Gu H, Ye W, Wang G, Chen S, Wan F, Liang J and Shen D (2022) The Application of Consensus Weighted Gene Co-expression Network Analysis to Comparative Transcriptome Meta-Datasets of Multiple Sclerosis in Gray and White Matter. Front. Neurol. 13:807349. doi: 10.3389/fneur.2022.807349 The Application of Consensus Weighted Gene Co-expression Network Analysis to Comparative Transcriptome Meta-Datasets of Multiple Sclerosis in Gray and White Matter Keping Chai 1 * † , Xiaolin Zhang 2† , Huitao Tang 1 , Huaqian Gu 1 , Weiping Ye 1 , Gangqiang Wang 1 , Shufang Chen 1 , Feng Wan 2 *, Jiawei Liang 3 * and Daojiang Shen 1 * 1 Department of Pediatrics, Zhejiang Hospital, Hangzhou, China, 2 Department of Neurological Surgery, Tongji Hospital, Tongji Medical College, Huazhong University Science and Technology, Wuhan, China, 3 College of Life Science and Technology, Huazhong University of Science and Technology, Wuhan, China Multiple sclerosis (MS) is a chronic inflammatory disease of the central nervous system characterized by demyelination, which leads to the formation of white matter lesions (WMLs) and gray matter lesions (GMLs). Recently, a large amount of transcriptomics or proteomics research works explored MS, but few studies focused on the differences and similarities between GMLs and WMLs in transcriptomics. Furthermore, there are astonishing pathological differences between WMLs and GMLs, for example, there are differences in the type and abundance of infiltrating immune cells between WMLs and GMLs. Here, we used consensus weighted gene co-expression network analysis (WGCNA), single-sample gene set enrichment analysis (ssGSEA), and machine learning methods to identify the transcriptomic differences and similarities of the MS between GMLs and WMLs, and to find the co-expression modules with significant differences or similarities between them. Through weighted co-expression network analysis and ssGSEA analysis, CD56 bright natural killer cell was identified as the key immune infiltration factor in MS, whether in GM or WM. We also found that the co-expression networks between the two groups are quite similar (density = 0.79), and 28 differentially expressed genes (DEGs) are distributed in the midnightblue module, which is most related to CD56 bright natural killer cell in GM. Simultaneously, we also found that there are huge disparities between the modules, such as divergences between darkred module and lightyellow module, and these divergences may be relevant to the functions of the genes in the modules. Keywords: WGCNA, random forest, multiple sclerosis, ssGSEA, RNA-seq
-
Upload
khangminh22 -
Category
Documents
-
view
0 -
download
0
Transcript of The Application of Consensus Weighted Gene Co-expression ...

ORIGINAL RESEARCHpublished: 24 February 2022
doi: 10.3389/fneur.2022.807349
Frontiers in Neurology | www.frontiersin.org 1 February 2022 | Volume 13 | Article 807349
Edited by:
Frederic Sampedro,
Sant Pau Institute for Biomedical
Research, Spain
Reviewed by:
Bahman Panahi,
Agricultural Biotechnology Research
Institute of Iran, Iran
Atul Kumar,
Lund University, Sweden
Zhijie Han,
Chongqing Medical University, China
*Correspondence:
Keping Chai
Feng Wan
Jiawei Liang
Daojiang Shen
†These authors have contributed
equally to this work
Specialty section:
This article was submitted to
Dementia and Neurodegenerative
Diseases,
a section of the journal
Frontiers in Neurology
Received: 01 December 2021
Accepted: 24 January 2022
Published: 24 February 2022
Citation:
Chai K, Zhang X, Tang H, Gu H, Ye W,
Wang G, Chen S, Wan F, Liang J and
Shen D (2022) The Application of
Consensus Weighted Gene
Co-expression Network Analysis to
Comparative Transcriptome
Meta-Datasets of Multiple Sclerosis in
Gray and White Matter.
Front. Neurol. 13:807349.
doi: 10.3389/fneur.2022.807349
The Application of ConsensusWeighted Gene Co-expressionNetwork Analysis to ComparativeTranscriptome Meta-Datasets ofMultiple Sclerosis in Gray and WhiteMatterKeping Chai 1*†, Xiaolin Zhang 2†, Huitao Tang 1, Huaqian Gu 1, Weiping Ye 1,
Gangqiang Wang 1, Shufang Chen 1, Feng Wan 2*, Jiawei Liang 3* and Daojiang Shen 1*
1Department of Pediatrics, Zhejiang Hospital, Hangzhou, China, 2Department of Neurological Surgery, Tongji Hospital, Tongji
Medical College, Huazhong University Science and Technology, Wuhan, China, 3College of Life Science and Technology,
Huazhong University of Science and Technology, Wuhan, China
Multiple sclerosis (MS) is a chronic inflammatory disease of the central nervous system
characterized by demyelination, which leads to the formation of white matter lesions
(WMLs) and gray matter lesions (GMLs). Recently, a large amount of transcriptomics or
proteomics research works explored MS, but few studies focused on the differences
and similarities between GMLs and WMLs in transcriptomics. Furthermore, there are
astonishing pathological differences between WMLs and GMLs, for example, there
are differences in the type and abundance of infiltrating immune cells between WMLs
and GMLs. Here, we used consensus weighted gene co-expression network analysis
(WGCNA), single-sample gene set enrichment analysis (ssGSEA), and machine learning
methods to identify the transcriptomic differences and similarities of the MS between
GMLs and WMLs, and to find the co-expression modules with significant differences
or similarities between them. Through weighted co-expression network analysis and
ssGSEA analysis, CD56 bright natural killer cell was identified as the key immune
infiltration factor in MS, whether in GM or WM. We also found that the co-expression
networks between the two groups are quite similar (density = 0.79), and 28 differentially
expressed genes (DEGs) are distributed in the midnightblue module, which is most
related to CD56 bright natural killer cell in GM. Simultaneously, we also found that there
are huge disparities between themodules, such as divergences between darkredmodule
and lightyellow module, and these divergences may be relevant to the functions of the
genes in the modules.
Keywords: WGCNA, random forest, multiple sclerosis, ssGSEA, RNA-seq

Chai et al. Application of WGCNA in MS
INTRODUCTION
Multiple sclerosis (MS) is a chronic inflammatory disease of thecentral nervous system characterized by demyelination, whichleads to the formation of white matter lesions (WMLs) and graymatter lesions (GMLs) (1, 2). Axon demyelination in differentbrain regions would lead to distinct symptoms, for example,cerebellar lesions may lead to ataxia, etc. (3, 4). Recently, manystudies have shown that although the pathological changes inGMLs andWMLs are both focal demyelinations, themechanismsof the two are still different. Some hypotheses were put forwardto insinuate that varying degrees of immune cell infiltration,such as CD8+ T-cells, CD4+ T-cells, and B cells, may playa key role in the progression of the disease. However, theregion-specific differences of immune infiltration in MS remainunclear (3, 5–7).
Weighted gene co-expression network analysis (WGCNA)is a classic gene clustering biological method, which relatesgenes with phenotypes or pathways. It is mainly based ontwo theories: (1) genes with similar expression patternsmay be co-regulated, functionally related, or in the samepathway, and (2) the distribution of gene networks conformsto scale-free. In WGCNA, the weighted value of thecorrelation coefficient is used, that is, the gene correlationcoefficient is taken to the power of N so that the connectionsamong the genes in the network conform to the scale-freenetwork distribution, and this algorithm is more biologicallymeaningful. It has been widely applied in Alzheimer’s disease,Parkinson’s disease, cancers, and green halophytic microalgaeDunaliella salina (8–13). The consensus network basedon WGCNA could discover the similarity and differenceof two gene co-expression networks better. It has beenperformed to measure the similarity of gene expressionpatterns in the livers of patients with different gender, orin neurodegenerative diseases, such as Alzheimer’s disease,Parkinson’s disease, etc. (14, 15).
Here, we applied consensus WGCNA and single-sample gene
set enrichment analysis (ssGSEA) on the MS transcriptomics
data of WM and GM, detected the similarities and differences
in the gene expression patterns between WMLs and GMLs,and performed ssGSEA and machine learning analysis to
identify the most relevant immune infiltration pathways of MS.
Through the analysis above, we obtained the most relevant
immune infiltration pathways in GMLs andWMLs (CD56 bright
natural killer cell). Furthermore, the most different module
between WMLs and GMLs was detected (the darkred andlightyellow modules). We also overlapped the differentially
expressed genes (DEGs) in WMLs and GMLs and found that
most DEGs in GM were kept in WM DEGs. OverlappedDEGs were mainly distributed in midnightblue, pink, yellow,
magenta, and purple modules, which were most similar modulesbetween WMLs and GMLs. Finally, we found that the genesin midnightblue module, such as heat shock proteins (HSPs),may be involved in the pathway in which CD56 bright naturalkiller cell could resist T- and B-cell-associated inflammatorybrain damage.
METHODS AND MATERIALS
Data Acquisition and PreprocessingThe data used in this article were obtained from the GEOdatabase GSE123496, which contains five patients with MS(average age= 57.6 years) and five age-matched healthy controls(CON; average age = 56.2 years), and fresh frozen autopsysamples were obtained from Human Brain and Spinal FluidResearch Center in Los Angeles, USA (https://www.ncbi.nlm.nih.gov/geo/query/acc.cgi?acc=GSE123496). Gene expression inthe frontal cortex (MS = 5, CON = 5) and parietal cortex(MS = 5, CON = 5) was selected as the gene expressionprofile in GM, compared with gene expression profile inWM represented by data from an internal capsule (MS =
5, CON = 5) and the corpus callosum (MS = 5, CON= 5). The normalized gene expression matrix data weredownloaded, and data filtering was performed before WGCNA.In order to filter data, first, eliminate abnormal samples throughhierarchical clustering. Second, eliminate duplicate probes andgene expression data in the expression matrix. Ultimately, therewere about 33,000 genes in the dataset used for the follow-up analysis.
Single-Sample Gene set EnrichmentAnalysisThe detailed mathematical principle of ssGSEA can be found inReference (16). The main steps are as follows:
a) First, assuming that there is a sample’s expression data, thenit should be like this, the first column is the gene, the secondcolumn is the expression value, such as a two-column datamatrix. The expression levels of all genes in the sample aresorted to obtain their rank among all genes, and the set of thesegenes is BG.
b) Assuming that we want to analyze the Kyoto Encyclopedia ofGenes and Genomes (KEGG), first, we need to find the gmtfile corresponding to KEGG on the GSEA official website. Themain format of the gmt file is: each line represents a pathway,the first column is the pathway ID, the second column isthe description corresponding to the pathway, and the thirdcolumn to the last column is the gene in the pathway.
c) Then, for any pathway A, we can get the gene list GL of thispathway, find the genes present in BG from GL, count themas NC, and add the expression levels of these genes to SG. EScalculation should be started: for any gene G in the expressionprofile, if G is a gene in the set GL, then the ES value is equalto the expression level of the gene divided by SG, otherwise,the ES value of the gene is equal to 1 divided by the valueof gene set BG total number minus NC. The ES value of thegenes in each BG, in turn, should be calculated, and the ESwith the largest absolute value as the A.ES of pathway A shouldbe found.
d) After the calculation of the ES value of this pathway A iscompleted, a statistical method is required to evaluate whetherthe ES is significant, that is, non-random. According to theabove method of calculating ES, first, the expression order ofgenes in the expression profile should be randomly shuffled,
Frontiers in Neurology | www.frontiersin.org 2 February 2022 | Volume 13 | Article 807349

Chai et al. Application of WGCNA in MS
and then the ES value is calculated. It has to be repeated athousand times to obtain a thousand ES values. Accordingto the distribution of these thousand ES values, to calculatethe position of A.ES in this distribution and the probabilityof appearing in this position, the p-value is obtained. The ESand p-values of each channel are, in turn, calculated, and thenmultiple test corrections are used to obtain the false discoveryrate (FDR) of each channel.
In this study, the GSVA package based on R 3.4.2 was used asa tool for the ssGSEA analysis, which is a method proposedfor ssGSEA (17). The gene sets were acquired from MolecularSignatures Database (MSigDB) according to the description inthe section “Introduction,” , and 28 signaling pathways involvedimmune infiltration were included, such as CD56 bright naturalkiller cell, CD56 dim natural killer cell, effector memory CD8+ Tcell, etc.
Application of Random Forest to Find thekey Immune Infiltration Pathway inClassifying the MS and CON in DifferentBrain RegionsThe samples in each brain region were grouped into MS andCON. Inputting the ssGSEA enrichment scores of these 28immune infiltration pathways in these samples into randomforest (RF) classifier via sklearn package based on python topredict which group the samples belong to and to identify themost important pathway for classifying.
Construction of Weighted GeneCo-expression Network and Identificationof Significant ModulesThe consensus weighted gene co-expression network wasconstructed by WGCNA package based on R 3.4.2 toidentify consensus modules for cross-dataset (GM and WM)comparisons. First, the Pearson correlation coefficient wascalculated to assess the similarity of the gene expression profiles,and then the correlation matrices were converted into adjacencymatrices. Second, the adjacency matrices between genes wereweighted by a soft power (14 for both datasets) function toobtain a scale-free network. The dynamic tree-cut method wasused to identify different modules, the adjacency matrix wasconverted to a topology overlay matrix (TOM), and moduleswere detected by cluster analysis during module selection.DeepSplit and the minModuleSize adopted the default values.Lastly, the hierarchical cluster was used to identify gene modules,and different modules were represented by different colors.
Correlation Analysis of Gene Modules WithClinical PhenotypeTo detect the associations between modules and clinicalphenotypes (ssGSEA scores), first, the match function inWGCNA is used to associate ssGSEA scores with expressionmatrices. Second, the correlations of the consensus moduleeigengene (ME) and the ssGSEA scores were calculated byPearson’s analysis. Modules showing significant differences
between GM and WM were obtained. Lastly, to further confirmthe consensus modules with significant differences in GMand WM datasets, the correlation coefficients between modulemembership (gene expression level) and gene significance (GS,for assessing the association of genes with phenotypes) werecalculated using the labeledHeatmap function, and the p-valueswere obtained.
Find the Overlapping Genes Between theGM and WM DEGs (Gray Matter MS vs.CON; White Matter MS vs. CON)The samples were divided into two groups (MS and CON),respectively, in WM and GM, and the Limma packages werepreformed to normalize and identify the DEGs (18, 19).Next, using the Venn tool (http://bioinformatics.psb.ugent.be/webtools/Venn/) to discover the overlapping genes betweenWML and GML DEGs.
Cross-Validation Criteria for RandomForestThe criteria used for cross-validation are as follows: the data sizeof the validation set accounts for 25% of the entire data, andthe training data account for 75%, which means that a five-foldcross-validation is used.
The Construction of Protein–ProteinInteraction NetworkThese overlapped genes were also analyzed usingGeneMANIA (https://genemania.org/) (20, 21) to constructthe co-expression network.
RESULTS
Data Preprocessing and StandardizationThe GSE123496 dataset includes samples from 5 brain regions,and each sample has 60,234 gene counts (22). We extracted thesample data from different brain regions and divided them into2 regions roughly (GM and WM, 20 samples in each group,Supplementary Figure 1A). We inputted the gene counts into Rfor log2 conversion and removed blank and duplicate values, andfinally, 32,353 genes were reserved.
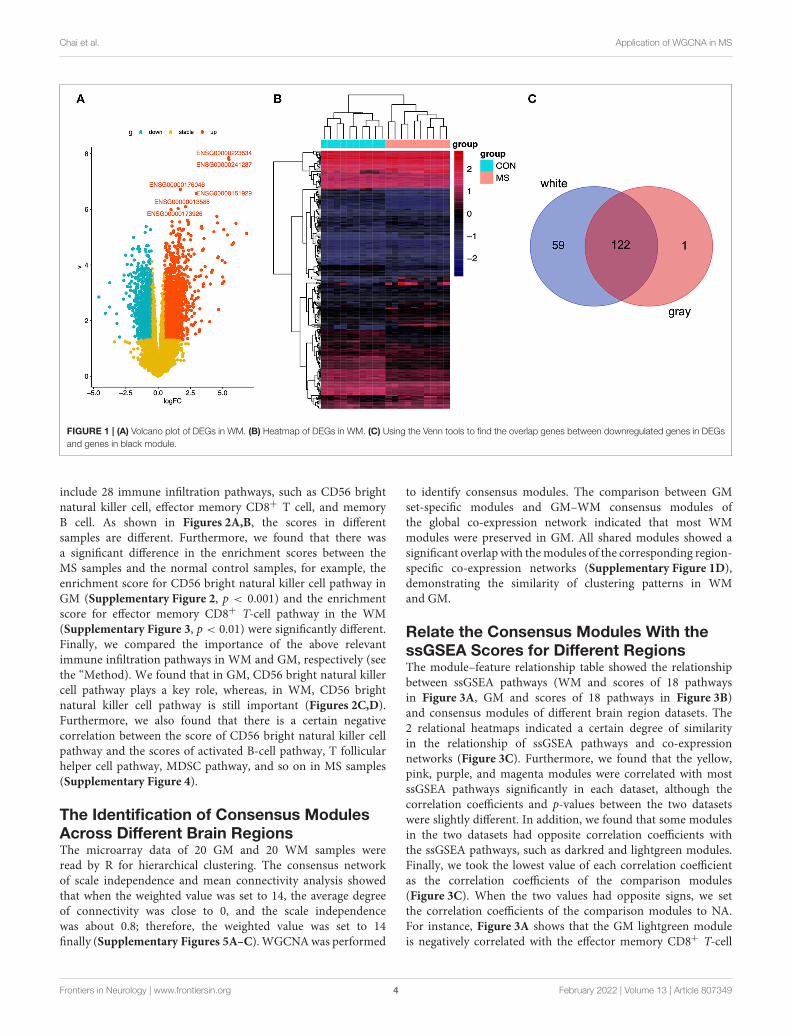
Identify the Overlapped DEGs BetweenWMLs and GMLsFirst, we calculated the DEGs between the WMLs and the WMnormal control samples, the DEGs between the GMLs and theGM normal control samples. We found 181 DEGs in the WMgroup (p < 0.001, Figures 1A,B), 123 DEGs in the GM group(p < 0.001, Supplementary Figures 1B,C), and 122 overlappedDEGs were identified through overlapping analysis (Figure 1C).
ssGSEA Analysis of MS Gene ExpressionMatrix in WM and GMThe ssGSEA analysis was performed on the gene expressionmatrix of 20 GM (10 GMLs vs. 10 normal) and 20 WM(10 WMLs vs. 10 normal). The analysis pathways mainly
Frontiers in Neurology | www.frontiersin.org 3 February 2022 | Volume 13 | Article 807349
Chai et al. Application of WGCNA in MS
FIGURE 1 | (A) Volcano plot of DEGs in WM. (B) Heatmap of DEGs in WM. (C) Using the Venn tools to find the overlap genes between downregulated genes in DEGs
and genes in black module.
include 28 immune infiltration pathways, such as CD56 brightnatural killer cell, effector memory CD8+ T cell, and memoryB cell. As shown in Figures 2A,B, the scores in differentsamples are different. Furthermore, we found that there wasa significant difference in the enrichment scores between theMS samples and the normal control samples, for example, theenrichment score for CD56 bright natural killer cell pathway inGM (Supplementary Figure 2, p < 0.001) and the enrichmentscore for effector memory CD8+ T-cell pathway in the WM(Supplementary Figure 3, p < 0.01) were significantly different.Finally, we compared the importance of the above relevantimmune infiltration pathways in WM and GM, respectively (seethe “Method). We found that in GM, CD56 bright natural killercell pathway plays a key role, whereas, in WM, CD56 brightnatural killer cell pathway is still important (Figures 2C,D).Furthermore, we also found that there is a certain negativecorrelation between the score of CD56 bright natural killer cellpathway and the scores of activated B-cell pathway, T follicularhelper cell pathway, MDSC pathway, and so on in MS samples(Supplementary Figure 4).
The Identification of Consensus ModulesAcross Different Brain RegionsThe microarray data of 20 GM and 20 WM samples wereread by R for hierarchical clustering. The consensus networkof scale independence and mean connectivity analysis showedthat when the weighted value was set to 14, the average degreeof connectivity was close to 0, and the scale independencewas about 0.8; therefore, the weighted value was set to 14finally (Supplementary Figures 5A–C).WGCNAwas performed
to identify consensus modules. The comparison between GMset-specific modules and GM–WM consensus modules ofthe global co-expression network indicated that most WMmodules were preserved in GM. All shared modules showed asignificant overlap with themodules of the corresponding region-specific co-expression networks (Supplementary Figure 1D),demonstrating the similarity of clustering patterns in WMand GM.
Relate the Consensus Modules With thessGSEA Scores for Different RegionsThe module–feature relationship table showed the relationshipbetween ssGSEA pathways (WM and scores of 18 pathwaysin Figure 3A, GM and scores of 18 pathways in Figure 3B)and consensus modules of different brain region datasets. The2 relational heatmaps indicated a certain degree of similarityin the relationship of ssGSEA pathways and co-expressionnetworks (Figure 3C). Furthermore, we found that the yellow,pink, purple, and magenta modules were correlated with mostssGSEA pathways significantly in each dataset, although thecorrelation coefficients and p-values between the two datasetswere slightly different. In addition, we found that some modulesin the two datasets had opposite correlation coefficients withthe ssGSEA pathways, such as darkred and lightgreen modules.Finally, we took the lowest value of each correlation coefficientas the correlation coefficients of the comparison modules(Figure 3C). When the two values had opposite signs, we setthe correlation coefficients of the comparison modules to NA.For instance, Figure 3A shows that the GM lightgreen moduleis negatively correlated with the effector memory CD8+ T-cell
Frontiers in Neurology | www.frontiersin.org 4 February 2022 | Volume 13 | Article 807349

Chai et al. Application of WGCNA in MS
FIGURE 2 | (A,C) Heatmap shows the ssGSEA scores of different gene sets in WM (A) and GM (C). (B,D) The bar plot shows the relative importance of features
(immune infiltration pathway) in the random forest classification model [(B) WM; (D) GM].
pathway, whereas in the WM dataset, the lightgreen moduleis positively correlated with the effector memory CD8+ T-cellpathway (Figure 3A), and the correlation between the consensusmodules and the ssGSEA pathway is NA in the comparison table(Figure 3C). Next, we further analyzed the genes inmidnightbluemodule because we found that there were 28 DEGs identified ashub genes in the midnightblue module (GPR31,HOXD4, PAPPA,BPIFB4, LDHBP3, TMEM207, etc.).
Differential Consensus Module EigengeneNetwork Analysis Reveals HighlyPreserved Network StructureIn order to explore the overall preservation of correlationin the consensus module pairs between WM- and GM-specific networks, we analyzed the differential eigengene network(Figure 4). Based on the correlation of the pairwise consensusmodules, we built eigengene network to evaluate the preservationof modules between WM and GM datasets. Figures 4A,B showsthe overall preservation of the three networks is a positivecorrelation. The mean density of the two networks exceeded0.79 in WM and GM datasets, demonstrating that the overallstructures of the co-expression networks were similar betweendifferent brain regions. Furthermore, in Figure 4C, we foundthat the first meta-modules included red, brown, royalblue,lightgreen, and black module, and the second meta-modules
included darkturquoise, midnightblue, darkred module, etc.However, these meta-modules also approximately existed in GMdatasets. These results indicated that the differences betweenWM and GM may exist in the particular genes within theconsensus networks.
Identification of the Significant Modulesand Genes in WMLs and GMLs andConstruction of the NetworkIn the above results, we obtained 122 overlapped DEGs, suchas gene GPR31 and so on, and then, we identified the modulesin which these genes were mainly distributed in. As shown inFigure 5A, we found that these genes were mainly distributedin the midnightblue module (28, DEGs), followed by the yellowmodule (9, DEGs) and purple module (8, DEGs).
To identify the most important genes in classifying MS andnormal samples, the 28 genes in the midnightblue module(Figure 5B) were further filtered by the RF classification. Genecounts were inputted into the RF classifier model, and 40 (MSand normal) samples were shuffled. Furthermore, we used about75% of the data as the training set and 25% of the data as thetest set. Disease state was regarded as the classification target,and cross-validation was used to train the RF model. As shownin Figure 5C and Supplementary Figure 5D, in the test set, thef1 = 0.8 and AUC = 0.86. Furthermore, we also obtained the
Frontiers in Neurology | www.frontiersin.org 5 February 2022 | Volume 13 | Article 807349

Chai et al. Application of WGCNA in MS
FIGURE 3 | WM–GM consensus module construction. (A) Pearson correlation coefficients between the ssGSEA scores and module eigengenes (MEs) in WM
dataset; numbers in brackets indicate the corresponding p-values. (B) Pearson correlation coefficients between the ssGSEA scores and module eigengenes in GM
dataset; numbers in brackets indicate the corresponding p-values. (C) Pearson correlation coefficients between the ssGSEA scores and consensus module
eigengenes; numbers in brackets indicate the corresponding p-values.
relative importance of the genes in the trained RF model. Asshown in Figure 5D and Supplementary Table 1, 21 importantgenes (PCBP1, HSP90AB1, HSPA7, CHMP6, LRIF1, SNAPC5P1,STIP1, AHSA6, etc.) were screened (imp > 0.01), and theywere subjected to GeneMANIA to construct the protein–proteininteraction (PPI) network (Figure 5E).We found that these genesonly had a co-expression relationship, and few of them had aninteraction between themselves.
DISCUSSION
Multiple sclerosis is an autoimmune neurological disease, and itspathological mechanism is still unclear (5, 6, 23). Furthermore,although the pathological changes in different brain regionsare all mainly demyelinating lesions, the mechanisms are quitedifferent. For instance, in theWMLs, the pathological mechanismis mainly the infiltration of immune cells, such as CD8+ Tcells, whereas, in the GMLs, such immune cell infiltration israre (3, 6, 7, 24). At present, although many studies focusedon immune infiltration through ssGSEA, such as studying therole of immune infiltration in the tumor microenvironment andother autoimmune system diseases (25–27), it is rarely applied instudying MS in the brain. Therefore, integrating transcriptomicsand ssGSEA to study the immune infiltration of MS plays a keyrole in elucidating its pathological mechanisms and searchingfor therapeutic targets. Therefore, we performed ssGSEA analysison the pathways related to immune infiltration of WM andGM samples and found that 18 immune infiltration pathwayswere significantly different between the normal samples andthe MS samples (Figure 2; Supplementary Figures 2, 3), such asthe activated B-cell pathway and central memory CD4+ T-cell
pathway. The memory B-cell pathway of immune infiltrationpathways in theMS samples was significantly higher than those inthe normal control samples, and these results are consistent withmany previous studies (28–31). However, by the RF algorithmmodel, we identified that the most important pathway in theWMwas the CD56 bright natural killer cell pathway, and in the GM,it remained the most important signal pathway (Figures 2C,D).Many researchers reported that, as the main type of natural killercells, CD56 bright natural killer cell mainly played a role ininhibiting the T-cell signaling pathway in the disease progressionof MS (32–34), thereby reducing its damage to the brain. In ourstudy, we found that the score of CD56 bright natural killercell signaling pathway in patients with MS is higher than thatin the normal control samples, which may also be due to theresistance to T-cell damage. Furthermore, we also found thatthe scores of the CD56 bright natural killer cell pathway in thedisease samples were negatively correlated with T-cell pathwayscores (Supplementary Figure 4), which further indicated thatthe increase of CD56 bright natural killer cell pathway scores wasdue to the reduction of T-cell damage to the brain.
As a classic co-expression network algorithm, WGCNA iswidely used in various diseases to find related hub genes. Inthis study, we perform the consensus WGCNA on the two brainregion datasets, and then specific and opposite modules betweenWMLs and GMLs were identified. The mean density of thetwo networks exceeded 0.79 in consensus modules (Figure 4),demonstrating that the overall structures of the co-expressionnetworks were similar in the WMLs and GMLs. We also foundthat there were 122 overlapped DEGs between WM and GM,and most of the DEGs in GM were kept in WM (Figure 1C)and modules with similar expression patterns between the twodatasets, such as magenta, yellow, and pink modules. These
Frontiers in Neurology | www.frontiersin.org 6 February 2022 | Volume 13 | Article 807349

Chai et al. Application of WGCNA in MS
FIGURE 4 | (A,B) Clustering dendrograms of consensus module eigengenes (MEs) for identifying meta-modules show the presence of similar major
branching pattern in WM and GM eigengene networks. (C,F) The heatmap shows the eigengene adjacencies in WM and GM eigengene networks. Each row and column
(Continued)
Frontiers in Neurology | www.frontiersin.org 7 February 2022 | Volume 13 | Article 807349

Chai et al. Application of WGCNA in MS
FIGURE 4 | corresponds to an eigengene tagged by consensus module colors. Within each heatmap, red represents high adjacency (positive correlation) and blue
represents low adjacency (negative correlation) as represented by the color legend. (D) Bar plot shows the preservation degree of each consensus eigengene as the
height of the bar (y-axis), and each colored bar corresponds to the eigengene of the associated consensus module. The high-density value D (preserve WM and GM)
= 0.79 indicates the high overall preservation between the WM and GM networks. (E) Adjacency heatmap of the preservation network between WM and GM
consensus eigengene networks. The saturation of the red color indicates correlation preservation of WM and GM MEs.
FIGURE 5 | (A) Identifying the overlap genes between DEGs and genes in consensus modules. (B) Heatmap shows the expression of the overlapping genes in the
midnightblue module. (C) The plot shows the changes of the f1 index with the changes of the max-feature in the training set and test set. (D) The bar plot shows the
relative importance of features (genes) in the random forest classification model. (E) The PPI network of important genes via GeneMANIA.
results showed that the pathological mechanisms of the two werevery analogous. In Figure 3, we found that the darkred modulehas opposite relationships in immune infiltration pathways, withthe highest positive correlations with Mast cell in WM andnegative correlations in GM, which indicated that there is anopposite relationship between the two gene expression patternsin the signaling pathway with Mast cell. These gaps may also beone of the reasons for the different pathological mechanisms ofWM and GM.
Many studies are focusing on the mechanism of MS, andmost studies showed that the pathological mechanisms in theGM and WM are similar to a certain degree (35–37). Inthis study, we found that there are certain differences andsimilarities between the pathological mechanisms of MS inGMLs and WMLs. Specifically, in our results, we found thatthe CD56 bright natural killer cell pathway plays the mostimportant role in MS, regardless of whether it is in WM orGM. When the modules and the immune infiltration signalingpathways were analyzed for correlation, we found that the
most relevant module to the CD56 bright natural killer cellpathway is the midnightblue module in GM (r = 0.82, p =
2e-06, Figure 3B). In order to better identify the hub genesin the midnightblue module, we overlapped the DEGs withthe genes in midnightblue module and found 28 importanthub genes, such as genes GPR31, HOXD4, PAPPA, BPIFB4,LDHBP3, TMEM207, etc. Similarly, we found the modules,which were most relevant to the CD56 bright natural killercell pathway in WMLs, the darkturquoise module (r = 0.67,p = 0.001, Figure 3A), and we identified DEGs as hub genes,such as PARVG, FCGR2A, HLA-DRB5, and OXTR (Figure 3C).These results indicate that although the CD56 bright naturalkiller cell plays a key role in the WM and GM of MS, thereare still some differences in the molecular mechanisms thatmediate it.
In this study, we found that most of the DEGs belonged tothe HSPs family (Figure 5B), which indicated that HSPs playa key role in MS. Although many studies reported that HSPsare involved in the pathological processes of many diseases
Frontiers in Neurology | www.frontiersin.org 8 February 2022 | Volume 13 | Article 807349
Chai et al. Application of WGCNA in MS
in the brain, such as Alzheimer’s disease, stroke, and braintrauma (38–40), in the pathological process of MS, the specificmechanism is still unclear. Some reports suggested that in thebrain of MS, the level of HSPs is significantly increased (41, 42).However, whether these elevated HSPs are beneficial or harmfulto patients with MS is still controversial. In our study, we alsofound that HSPs as important genes (Figure 5D) were mainlydistributed in the midnightblue module, which further impliedthat HSP-related genes may play a synergistic effect with thegenes in this module. In Figure 3C, we could discover that theimmune infiltration pathway, which was most relevant to thismodule, was the CD56 bright natural killer cell pathway, andit implied that HSPs, which could inhibit the T-cell damage tothe brain, may be involved in the CD56 bright natural killer cellpathway in MS.
CONCLUSION
In this study, we compared the gene co-expression networksin GMLs and WMLs through WGCNA and ssGSEA methodsand identified that the co-expression networks of the two hadhigh similarities. Furthermore, we also identified the similaritiesand differences between the two co-expression networks inimmune infiltration. The gene expression patterns of the twohad similar expression in signal pathways, such as the activatedB-cell pathway, central memory CD4+ T-cell pathway, andimmature B-cell pathway. The differences between the two weremainly distributed in the CD56 bright natural killer cell pathway.Furthermore, we found that the HSPs, as the hub genes, weremainly distributed in the module, which was most relevant to the
CD56 bright natural killer cell pathway, and it may be involvedin antagonizing the damage caused by T-cells.
DATA AVAILABILITY STATEMENT
The datasets presented in this study can be found in onlinerepositories. The names of the repository/repositoriesand accession number(s) can be found in thearticle/Supplementary Material.
AUTHOR CONTRIBUTIONS
KC: conceptualization, methodology, investigation, datacuration, visualization, and writing the original draft. XZ:
conceptualization and investigation. HT and GW: software. HG:resources and software. WY: data curation. SC: supervision.FW, DS, and JL: supervision, writing, reviewing, and editing.All authors contributed to the article and approved thesubmitted version.
ACKNOWLEDGMENTS
We are very grateful for the data platform provided by theGEO database.
SUPPLEMENTARY MATERIAL
The Supplementary Material for this article can be foundonline at: https://www.frontiersin.org/articles/10.3389/fneur.2022.807349/full#supplementary-material
REFERENCES
1. Correale J, Gaitán MI, Ysrraelit MC, Fiol MP. Progressive multiple
sclerosis: from pathogenic mechanisms to treatment. Brain. (2017) 140:527–
46. doi: 10.1093/brain/aww258
2. Dendrou CA, Fugger L, Friese MA. Immunopathology of multiple sclerosis.
Nat Rev Immunol. (2015) 15:545–58. doi: 10.1038/nri3871
3. Kawachi I, Nishizawa M. Significance of gray matter brain lesions in
multiple sclerosis and neuromyelitis optica. Neuropathology. (2015) 35:481–
6. doi: 10.1111/neup.12216
4. Ramagopalan SV, Dobson R, Meier UC, Giovannoni G. Multiple sclerosis:
risk factors, prodromes, and potential causal pathways. Lancet Neurol. (2010)
9:727–39. doi: 10.1016/S1474-4422(10)70094-6
5. Wildner P, Stasiołek M, Matysiak M. Differential diagnosis of multiple
sclerosis and other inflammatory CNS diseases.Mult Scler Relat Disord. (2020)
37:101452. doi: 10.1016/j.msard.2019.101452
6. van der Poel M, Ulas T, Mizee MR, Hsiao C-C, Miedema SSM, Adelia null,
et al. Transcriptional profiling of human microglia reveals grey-white matter
heterogeneity andmultiple sclerosis-associated changes.Nat Commun. (2019)
10:1139. doi: 10.1038/s41467-019-08976-7
7. Prins M, Schul E, Geurts J, van der Valk P, Drukarch B, van Dam A-M.
Pathological differences between white and grey matter multiple sclerosis
lesions. Ann N Y Acad Sci. (2015) 1351:99–13. doi: 10.1111/nyas.12841
8. Langfelder P, Horvath S. WGCNA: an R package for weighted
correlation network analysis. BMC Bioinformatics. (2008)
9:559. doi: 10.1186/1471-2105-9-559
9. Liang J-W, Fang Z-Y, Huang Y, Liuyang Z-Y, Zhang X-L, Wang J-L,
et al. application in Alzheimer’s Disease. J Alzheimers Dis. (2018) 65:1353–
1364. doi: 10.3233/JAD-180400
10. Cui S, Sun H, Gu X, Lv E, Zhang Y, Dong P, et al. Gene expression profiling
analysis of locus coeruleus in idiopathic Parkinson’s disease by bioinformatics.
Neurol Sci. (2015) 6:56. doi: 10.1007/s10072-015-2304-0
11. Chai K, Liang J, Zhang X, Cao P, Chen S, Gu H, et al. Application of
machine learning and weighted gene co-expression network algorithm to
explore the hub genes in the aging brain. Front Aging Neurosci. (2021)
13:707165. doi: 10.3389/fnagi.2021.707165
12. Farhadian M, Rafat SA, Panahi B, Mayack C. Weighted gene co-expression
network analysis identifies modules and functionally enriched pathways in the
lactation process. Sci Rep. (2021) 11:2367. doi: 10.1038/s41598-021-81888-z
13. Panahi B, Hejazi MA. Weighted gene co-expression network analysis
of the salt-responsive transcriptomes reveals novel hub genes in
green halophytic microalgae Dunaliella salina. Sci Rep. (2021)
11:1607. doi: 10.1038/s41598-020-80945-3
14. Yuan H, Lu J. Consensus module analysis of abdominal fat
deposition across multiple broiler lines. BMC Genomics. (2021)
22:115. doi: 10.1186/s12864-021-07423-6
15. Fang Q, Wang Q, Zhou Z, Xie A. Consensus analysis via weighted gene
co-expression network analysis (WGCNA) reveals genes participating in
early phase of acute respiratory distress syndrome (ARDS) induced by
sepsis. Bioengineered. (2021) 12:1161–72. doi: 10.1080/21655979.2021.19
09961
16. Barbie DA, Tamayo P, Boehm JS, Kim SY,Moody SE, Dunn IF, et al. Systematic
RNA interference reveals that oncogenic KRAS-driven cancers require TBK1.
Nature. (2009) 462:108–12. doi: 10.1038/nature08460
17. Subramanian A, Tamayo P, Mootha VK, Mukherjee S, Ebert BL, Gillette
MA, et al. Gene set enrichment analysis: a knowledge-based approach for
interpreting genome-wide expression profiles. Proc Natl Acad Sci U S A.
(2005) 102:15545–50. doi: 10.1073/pnas.0506580102
Frontiers in Neurology | www.frontiersin.org 9 February 2022 | Volume 13 | Article 807349
Chai et al. Application of WGCNA in MS
18. Diboun I, Wernisch L, Orengo CA, Koltzenburg M. Microarray analysis after
RNA amplification can detect pronounced differences in gene expression
using limma. BMC Genomics. (2006) 7:252. doi: 10.1186/1471-2164-7-252
19. Ritchie ME, Phipson B, Wu D, Hu Y, Law CW, Shi W, et al. limma powers
differential expression analyses for RNA-sequencing and microarray studies.
Nucleic Acids Res. (2015) 43:e47. doi: 10.1093/nar/gkv007
20. Warde-Farley D, Donaldson SL, Comes O, Zuberi K, Badrawi R, Chao P,
et al. The GeneMANIA prediction server: biological network integration for
gene prioritization and predicting gene function. Nucleic Acids Res. (2010)
38:W214–20. doi: 10.1093/nar/gkq537
21. Franz M, Rodriguez H, Lopes C, Zuberi K, Montojo J, Bader GD,
et al. GeneMANIA update 2018. Nucleic Acids Res. (2018) 46:W60–
4. doi: 10.1093/nar/gky311
22. Voskuhl RR, Itoh N, Tassoni A, Matsukawa MA, Ren E, Tse V, et al.
Gene expression in oligodendrocytes during remyelination reveals cholesterol
homeostasis as a therapeutic target in multiple sclerosis. Proc Natl Acad Sci U
S A. (2019) 116:10130–10139. doi: 10.1073/pnas.1821306116
23. Hemmer B, Kerschensteiner M, Korn T. Role of the innate and adaptive
immune responses in the course of multiple sclerosis. Lancet Neurol. (2015)
14:406–19. doi: 10.1016/S1474-4422(14)70305-9
24. Waldman A, Ghezzi A, Bar-Or A, Mikaeloff Y, Tardieu M,
Banwell B. Multiple sclerosis in children: an update on clinical
diagnosis, therapeutic strategies, and research. Lancet Neurol. (2014)
13:936–48. doi: 10.1016/S1474-4422(14)70093-6
25. Ye L, Zhang T, Kang Z, Guo G, Sun Y, Lin K, et al. Tumor-infiltrating immune
cells act as a marker for prognosis in colorectal cancer. Front Immunol. (2019)
10:2368. doi: 10.3389/fimmu.2019.02368
26. Su J, Long W, Ma Q, Xiao K, Li Y, Xiao Q, et al. Identification
of a tumor microenvironment-related eight-gene signature for
predicting prognosis in lower-grade gliomas. Front Genet. (2019)
10:1143. doi: 10.3389/fgene.2019.01143
27. Wang Z, Yang H, Zhang R, Luo B, Xu B, Zhu Z, et al. MEOX2 serves as a novel
biomarker associated with macrophage infiltration in oesophageal squamous
cell carcinoma and other digestive system carcinomas. Autoimmunity. (2021)
54:373–383. doi: 10.1080/08916934.2021.1919880
28. Danikowski KM, Jayaraman S, Prabhakar BS. Regulatory T cells in
multiple sclerosis and myasthenia gravis. J Neuroinflammation. (2017)
14:117. doi: 10.1186/s12974-017-0892-8
29. Lin C-C, Edelson BT. New Insights into the Role of IL-1β in Experimental
Autoimmune Encephalomyelitis and Multiple Sclerosis. J Immunol. (2017)
198:4553–4560. doi: 10.4049/jimmunol.1700263
30. Maglione A, Rolla S, Mercanti SFD, Cutrupi S, Clerico M. The
adaptive immune system in multiple sclerosis: an estrogen-
mediated point of view. Cells. (2019) 8:E1280. doi: 10.3390/cells81
01280
31. Gross CC, Schulte-Mecklenbeck A, Rünzi A, Kuhlmann T, Posevitz-Fejfár
A, Schwab N, et al. Impaired NK-mediated regulation of T-cell activity
in multiple sclerosis is reconstituted by IL-2 receptor modulation. Proc
Natl Acad Sci U S A. (2016) 113:E2973–2982. doi: 10.1073/pnas.15249
24113
32. Fehniger TA, Cooper MA, Nuovo GJ, Cella M, Facchetti F, Colonna M, et al.
CD56bright natural killer cells are present in human lymph nodes and are
activated by T cell-derived IL-2: a potential new link between adaptive and
innate immunity. Blood. (2003) 101:3052–7. doi: 10.1182/blood-2002-09-2876
33. Laroni A, Uccelli A. CD56bright natural killer cells: a possible biomarker
of different treatments in multiple sclerosis. J Clin Med. (2020)
9:E1450. doi: 10.3390/jcm9051450
34. Wang H, Zeng Y, Zhang M, Ma H, Xu B, Jiang H, et al. CD56brightCD16-
natural killer cells are shifted toward an IFN-γ-promoting phenotype with
reduced regulatory capacity in osteoarthritis. Hum Immunol. (2019) 80:871–
877. doi: 10.1016/j.humimm.2019.07.283
35. Lee JK, Kim N-J. Recent advances in the inhibition of p38 mapk as
a potential strategy for the treatment of Alzheimer’s Disease. (2017)
23:1287. doi: 10.3390/molecules22081287
36. Frischer JM, Bramow S, Dal-Bianco A, Lucchinetti CF, Rauschka
H, Schmidbauer M, et al. The relation between inflammation
and neurodegeneration in multiple sclerosis brains. Brain. (2009)
132:1175–89. doi: 10.1093/brain/awp070
37. Zhang J, Giorgio A, Vinciguerra C, Stromillo ML, Battaglini M,
Mortilla M, et al. Gray matter atrophy cannot be fully explained
by white matter damage in patients with MS. Mult Scler. (2021)
27:39–51. doi: 10.1177/1352458519900972
38. Thuringer D, Garrido C. Molecular chaperones in the brain endothelial
barrier: neurotoxicity or neuroprotection? FASEB J. (2019) 33:11629–
39. doi: 10.1096/fj.201900895R
39. Lackie RE, Maciejewski A, Ostapchenko VG, Marques-Lopes J,
Choy W-Y, Duennwald ML, et al. The Hsp70/Hsp90 chaperone
machinery in neurodegenerative diseases. Front Neurosci. (2017)
11:254. doi: 10.3389/fnins.2017.00254
40. Salminen A, Kaarniranta K, Kauppinen A, Ojala J, Haapasalo A, Soininen H,
et al. Impaired autophagy and APP processing in Alzheimer’s disease: The
potential role of Beclin 1 interactome. Prog Neurobiol. (2013) 106–107:33–
54. doi: 10.1016/j.pneurobio.2013.06.002
41. Wali G, Sue CM, Mackay-Sim A. Patient-derived stem cell models in
SPAST HSP: disease modelling and drug discovery. Brain Sci. (2018)
8:E142. doi: 10.3390/brainsci8080142
42. Kim JY, Kim JW, Yenari MA. Heat shock protein signaling
in brain ischemia and injury. Neurosci Lett. (2020)
715:134642. doi: 10.1016/j.neulet.2019.134642
Conflict of Interest: The authors declare that the research was conducted in the
absence of any commercial or financial relationships that could be construed as a
potential conflict of interest.
Publisher’s Note: All claims expressed in this article are solely those of the authors
and do not necessarily represent those of their affiliated organizations, or those of
the publisher, the editors and the reviewers. Any product that may be evaluated in
this article, or claim that may be made by its manufacturer, is not guaranteed or
endorsed by the publisher.
Copyright © 2022 Chai, Zhang, Tang, Gu, Ye, Wang, Chen, Wan, Liang and Shen.
This is an open-access article distributed under the terms of the Creative Commons
Attribution License (CC BY). The use, distribution or reproduction in other forums
is permitted, provided the original author(s) and the copyright owner(s) are credited
and that the original publication in this journal is cited, in accordance with accepted
academic practice. No use, distribution or reproduction is permitted which does not
comply with these terms.
Frontiers in Neurology | www.frontiersin.org 10 February 2022 | Volume 13 | Article 807349