
The Apache Longbow–Hellfire Missile Test at Yuma Proving Ground: Ecological Risk Assessment for...
29
Human and Ecological Risk Assessment, 14: 919–946, 2008 Copyright C Taylor & Francis Group, LLC ISSN: 1080-7039 print / 1549-7680 online DOI: 10.1080/10807030802387531 The Apache Longbow–Hellfire Missile Test at Yuma Proving Ground: Ecological Risk Assessment for Tracked Vehicle Movement across Desert Pavement Mark J. Peterson, William W. Hargrove, and Rebecca A. Efroymson Environmental Sciences Division, Oak Ridge National Laboratory (ORNL), Oak Ridge, TN, USA ABSTRACT A multiple stressor risk assessment was conducted at Yuma Proving Ground, Ari- zona, as a demonstration of the Military Ecological Risk Assessment Framework (MERAF). The focus was a testing program at Cibola Range that involved an Apache Longbow helicopter firing Hellfire missiles at moving targets, that is, M60-A1 tanks. This article describes the ecological risk assessment, using the MERAF, for the tracked vehicle movement component of the testing program. The principal stressor associ- ated with tracked vehicle movement was soil disturbance, and a resulting, secondary stressor was hydrological change. Water loss to desert wash vegetation was hypothe- sized to result from increased infiltration and/or evaporation associated with vehicle disturbances to surrounding desert pavement, potentially affecting mule deer as well as vegetation. The simulated exposure of wash vegetation to water loss was quantified using estimates of disturbed land area from a digital orthogonal quarter quadrangle aerial photo and field observations, a 30-m digital elevation model, the flow accu- mulation feature of ESRI ArcInfo GIS, and a two-step runoff process dependent on soil characteristics and the extent of disturbance. In all simulated scenarios, the absolute amount of water lost increased with distance from the disturbance downs- lope in the washes; however, the percentage of water lost was greatest in land areas immediately downslope of a disturbance. Potential effects on growth and survival of desert wash trees were quantified by comparing water availability from the hydro- logic model to water volume thresholds required for wash trees to survive and persist, derived from a local study. For both the incremental risk of the test program and for the combination of test and pretest disturbances, this demonstration of MERAF Received 23 January 2008; revised manuscript accepted 11 April 2008. Current address for William W. Hargrove: Eastern Forest Environmental Threat Assessment Center, Southern Research Station, USDA Forest Service, Asheville, NC 28804-3454, USA. This article has been authored by a contractor of the U.S. Government under contract DE- AC05-00OR22725. Accordingly, the U.S. Government retains a nonexclusive, royalty-free li- cense to publish or reproduce the published form of this contribution, or allow others to do so, for U.S. Government purposes. Address correspondence to Mark J. Peterson, Environmental Sciences Division, Oak Ridge National Laboratory (ORNL), Oak Ridge, TN 37831-6036, USA. E-mail: [email protected] 919
-
Upload
independent -
Category
Documents
-
view
3 -
download
0
Transcript of The Apache Longbow–Hellfire Missile Test at Yuma Proving Ground: Ecological Risk Assessment for...
Human and Ecological Risk Assessment, 14: 919–946, 2008Copyright C© Taylor & Francis Group, LLCISSN: 1080-7039 print / 1549-7680 onlineDOI: 10.1080/10807030802387531
The Apache Longbow–Hellfire Missile Test at YumaProving Ground: Ecological Risk Assessment forTracked Vehicle Movement across Desert Pavement
Mark J. Peterson, William W. Hargrove, and Rebecca A. EfroymsonEnvironmental Sciences Division, Oak Ridge National Laboratory (ORNL),Oak Ridge, TN, USA
ABSTRACTA multiple stressor risk assessment was conducted at Yuma Proving Ground, Ari-
zona, as a demonstration of the Military Ecological Risk Assessment Framework(MERAF). The focus was a testing program at Cibola Range that involved an ApacheLongbow helicopter firing Hellfire missiles at moving targets, that is, M60-A1 tanks.This article describes the ecological risk assessment, using the MERAF, for the trackedvehicle movement component of the testing program. The principal stressor associ-ated with tracked vehicle movement was soil disturbance, and a resulting, secondarystressor was hydrological change. Water loss to desert wash vegetation was hypothe-sized to result from increased infiltration and/or evaporation associated with vehicledisturbances to surrounding desert pavement, potentially affecting mule deer as wellas vegetation. The simulated exposure of wash vegetation to water loss was quantifiedusing estimates of disturbed land area from a digital orthogonal quarter quadrangleaerial photo and field observations, a 30-m digital elevation model, the flow accu-mulation feature of ESRI ArcInfo GIS, and a two-step runoff process dependenton soil characteristics and the extent of disturbance. In all simulated scenarios, theabsolute amount of water lost increased with distance from the disturbance downs-lope in the washes; however, the percentage of water lost was greatest in land areasimmediately downslope of a disturbance. Potential effects on growth and survival ofdesert wash trees were quantified by comparing water availability from the hydro-logic model to water volume thresholds required for wash trees to survive and persist,derived from a local study. For both the incremental risk of the test program andfor the combination of test and pretest disturbances, this demonstration of MERAF
Received 23 January 2008; revised manuscript accepted 11 April 2008.Current address for William W. Hargrove: Eastern Forest Environmental Threat AssessmentCenter, Southern Research Station, USDA Forest Service, Asheville, NC 28804-3454, USA.This article has been authored by a contractor of the U.S. Government under contract DE-AC05-00OR22725. Accordingly, the U.S. Government retains a nonexclusive, royalty-free li-cense to publish or reproduce the published form of this contribution, or allow others to doso, for U.S. Government purposes.Address correspondence to Mark J. Peterson, Environmental Sciences Division, Oak RidgeNational Laboratory (ORNL), Oak Ridge, TN 37831-6036, USA. E-mail: [email protected]
919
M. J. Peterson et al.
found no significant risk to either wash vegetation growth and survival or mule deerabundance and reproduction.
Key Words: ecological risk assessment, tracked vehicle, desert wash, desert pave-ment, surface varnish, vegetation, water loss, soil disturbance.
INTRODUCTION
Evaluations of ecological impacts of military training and testing programs in-volving vehicles are a common component of U.S. National Environmental Pol-icy Act (NEPA) Environmental Assessments and Environmental Impact Statements(BRACD 2007; YPG 2001), as well as scientific research on military installations. Par-ticularly numerous are studies of tracked vehicle effects on vegetation (e .g ., Daleet al. 2005; Haugen et al. 2003; Prosser et al. 2000; Wilson 1988). The impacts oftracked vehicle movement on various fauna and their habitats have also been in-vestigated, including impacts on small mammals (Leis et al. 2007), reptiles and am-phibians (Guyer et al. 2006; Adams et al. 2005), bird populations (Severinghausand Severinghaus 1982), and soil invertebrates (Althoff and Thien 2005). Trackedvehicle disturbances are also commonly evaluated as part of military testing, plan-ning, and predictive models, such as the Ecological Dynamics Simulation Model(EDYS; Childress et al. 1999) and the Army Training and Testing Carrying Capacity(ATTACC) model (USAEC 1999). However, until now, impacts of tracked vehiclesand other military activities involving physical stressors have not been investigatedthrough the use of a risk assessment framework.
The U.S. Environmental Protection Agency’s (USEPA) Guidelines for EcologicalRisk Assessment (1998) were written to apply broadly to any chemical, physical, orbiological stressor. The Military Ecological Risk Assessment Framework (MERAF)was developed as an elaboration of the EPA guidelines for multiple military activities(Suter et al. 2002; Efroymson et al. 2001a,b; Efroymson and Suter 2001; Efroymsonet al. 2000). This article aims to demonstrate the application of MERAF and to assessthe risks associated with tracked vehicle movement on desert wash vegetation anddesert mule deer (Odocoileus hemionus crooki) at Yuma Proving Ground (YPG). Oneof the strengths of MERAF is its ability to characterize the interactions of multiplestressors from a disturbance. This article is one of a series of papers describing anecological risk assessment for the Apache Longbow–Hellfire missile test at YPG,conducted in August 2000 (see Efroymson et al. 2008a,b and Jones et al. 2008, allthis issue). The Apache Longbow–Hellfire missile test and the YPG environmentis described in Efroymson et al. (2001b) and Efroymson et al. (2008a, this issue),and includes missile firing and helicopter overflight activities in addition to trackedvehicle activity. The evaluation of tracked vehicle activity was centered on an areaadjacent to McAllister Wash within the Cibola Range, in the northwest section of thebase, where as part of the test the Apache Longbow helicopter fired Hellfire missilesat moving targets, M60-A1 tanks.
This article presents an application of the MERAF framework to one type ofmilitary activity (tracked vehicle disturbance) and includes suggestions for vari-ous factors to consider in such an assessment as well as general procedures or ap-proaches that could be used. Any risk assessment, however, depends on the particular
920 Hum. Ecol. Risk Assess. Vol. 14, No. 5, 2008
Yuma Proving Ground: Ecological Risk Assessment for Tracked Vehicles
characteristics of the ecosystem or habitat where the activities occur. Several charac-teristics relatively unique to the YPG desert ecosystem were relevant for the assess-ment of risks posed from military testing there and are discussed in the characteri-zation of exposure section of this article.
The most important aspect of the YPG environment for this assessment is theunique nature of “desert pavement” soils, which refers to a continuous, glazed var-nish that develops over these soils as a result of prolonged weathering. This aged soilsurface at YPG is relatively impermeable to infrequent high-volume rainfall events(Glass 2000; Cochran 1991). A connected aspect of YPG ecology is the desert wash,a lower-lying drainage area that can receive large volumes of flowing surface waterfrom the surrounding impervious rock surfaces and soil pavements. Because of thewashes’ hydrologic connectivity to larger upslope contributing areas and their in-creased surface permeability, washes can support larger and more diverse vegetationcommunities than surrounding areas (YPG 2001; Bern 1995). These desert washvegetation communities and the wildlife they support thus represent ecologicallyvaluable endpoints for impact assessment. This study integrates the growing field ofdesert ecohydrology (Hamerlynck et al. 2002; Huxman et al. 2005) with ecologicalrisk assessment.
The evaluation of ecological risks associated with tracked vehicle movement ischaracterized in this article in the problem formulation, characterization of expo-sure, characterization of effects, and risk characterization stages of MERAF. For theexposure, effects, and risk characterization stages of this assessment, the findingsare organized for (1) vegetation in washes and (2) mule deer.
PROBLEM FORMULATION
Potential Stressors, Modes of Action, and Conceptual Model
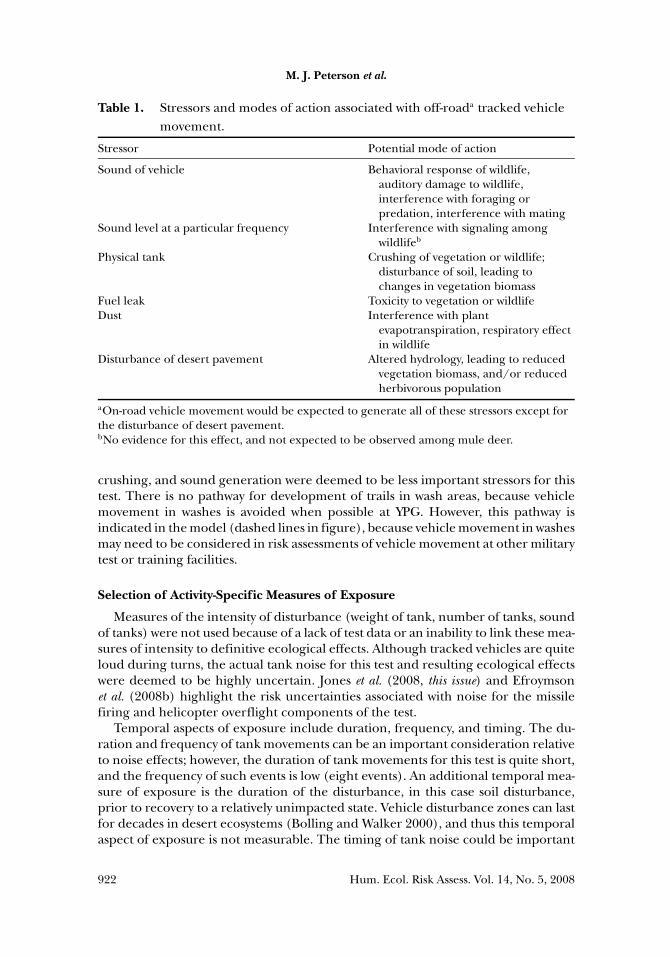
Stressors and modes of action associated with movement of the target vehiclesin the Apache Longbow–Hellfire missile test are listed in Table 1. The stressor thatis emphasized in this activity-specific risk assessment is the disturbance of desertpavement, which causes altered hydrology, a secondary stressor. Vibration resultingfrom tank movement is not considered as a potential stressor here, because theconsequences of vibration are largely unknown.
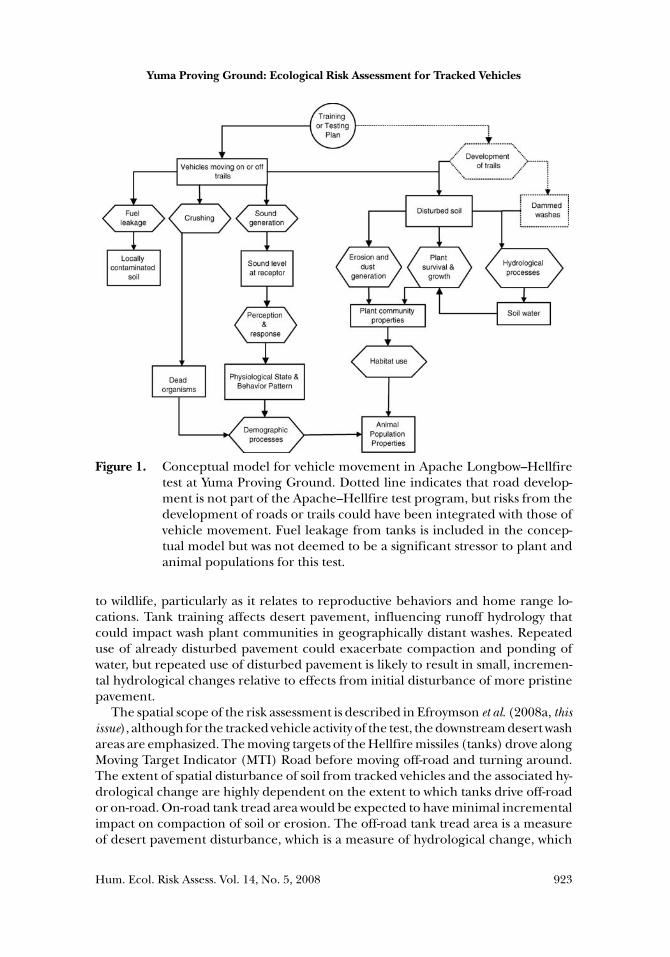
The conceptual model for vehicle movement is depicted in Figure 1. The modelrepresents the combination of stressors associated with vehicle movement in theApache Longbow–Hellfire missile test, without depicting the importance of eachstressor. At YPG the stressor pathway of most importance was deemed to be vehiclemovement on soils, which potentially affects hydrology, plant properties and habitat,and ultimately animal populations. The assessment endpoints were the biomass anddiversity of desert wash vegetation and abundance and reproduction of the localpopulation of desert mule deer (see general problem formulation in Efroymson et al.2008a, this issue). Erosion has been linked to tank tracks (Watts 1998), and erosionand plant exposure to eroded soils could be a major component of some MERAFassessments of tracked vehicle movement (Figure 1). Evaluations of exposure andeffects of the Apache Longbow–Hellfire missile test include modeled estimates of anactual test in August 2000 as well as reasonable hypothetical scenarios. Fuel leakage,
Hum. Ecol. Risk Assess. Vol. 14, No. 5, 2008 921
M. J. Peterson et al.
Table 1. Stressors and modes of action associated with off-roada tracked vehiclemovement.
Stressor Potential mode of action
Sound of vehicle Behavioral response of wildlife,auditory damage to wildlife,interference with foraging orpredation, interference with mating
Sound level at a particular frequency Interference with signaling amongwildlifeb
Physical tank Crushing of vegetation or wildlife;disturbance of soil, leading tochanges in vegetation biomass
Fuel leak Toxicity to vegetation or wildlifeDust Interference with plant
evapotranspiration, respiratory effectin wildlife
Disturbance of desert pavement Altered hydrology, leading to reducedvegetation biomass, and/or reducedherbivorous population
aOn-road vehicle movement would be expected to generate all of these stressors except forthe disturbance of desert pavement.bNo evidence for this effect, and not expected to be observed among mule deer.
crushing, and sound generation were deemed to be less important stressors for thistest. There is no pathway for development of trails in wash areas, because vehiclemovement in washes is avoided when possible at YPG. However, this pathway isindicated in the model (dashed lines in figure), because vehicle movement in washesmay need to be considered in risk assessments of vehicle movement at other militarytest or training facilities.
Selection of Activity-Specific Measures of Exposure
Measures of the intensity of disturbance (weight of tank, number of tanks, soundof tanks) were not used because of a lack of test data or an inability to link these mea-sures of intensity to definitive ecological effects. Although tracked vehicles are quiteloud during turns, the actual tank noise for this test and resulting ecological effectswere deemed to be highly uncertain. Jones et al. (2008, this issue) and Efroymsonet al. (2008b) highlight the risk uncertainties associated with noise for the missilefiring and helicopter overflight components of the test.
Temporal aspects of exposure include duration, frequency, and timing. The du-ration and frequency of tank movements can be an important consideration relativeto noise effects; however, the duration of tank movements for this test is quite short,and the frequency of such events is low (eight events). An additional temporal mea-sure of exposure is the duration of the disturbance, in this case soil disturbance,prior to recovery to a relatively unimpacted state. Vehicle disturbance zones can lastfor decades in desert ecosystems (Bolling and Walker 2000), and thus this temporalaspect of exposure is not measurable. The timing of tank noise could be important
922 Hum. Ecol. Risk Assess. Vol. 14, No. 5, 2008
Yuma Proving Ground: Ecological Risk Assessment for Tracked Vehicles
Figure 1. Conceptual model for vehicle movement in Apache Longbow–Hellfiretest at Yuma Proving Ground. Dotted line indicates that road develop-ment is not part of the Apache–Hellfire test program, but risks from thedevelopment of roads or trails could have been integrated with those ofvehicle movement. Fuel leakage from tanks is included in the concep-tual model but was not deemed to be a significant stressor to plant andanimal populations for this test.
to wildlife, particularly as it relates to reproductive behaviors and home range lo-cations. Tank training affects desert pavement, influencing runoff hydrology thatcould impact wash plant communities in geographically distant washes. Repeateduse of already disturbed pavement could exacerbate compaction and ponding ofwater, but repeated use of disturbed pavement is likely to result in small, incremen-tal hydrological changes relative to effects from initial disturbance of more pristinepavement.
The spatial scope of the risk assessment is described in Efroymson et al. (2008a, thisissue), although for the tracked vehicle activity of the test, the downstream desert washareas are emphasized. The moving targets of the Hellfire missiles (tanks) drove alongMoving Target Indicator (MTI) Road before moving off-road and turning around.The extent of spatial disturbance of soil from tracked vehicles and the associated hy-drological change are highly dependent on the extent to which tanks drive off-roador on-road. On-road tank tread area would be expected to have minimal incrementalimpact on compaction of soil or erosion. The off-road tank tread area is a measureof desert pavement disturbance, which is a measure of hydrological change, which
Hum. Ecol. Risk Assess. Vol. 14, No. 5, 2008 923
M. J. Peterson et al.
is a measure of changes in wash vegetation. The greater the spatial area of distur-bance, the greater the change in surface flows to downslope desert washes and thegreater the potential impact to wash vegetation. An example of the use of spatiallyexplicit disturbances as measures of erosion is the use of the ATTACC model, whichmeasures training load in terms of maneuver impact miles (MIM): “One MIM hasthe equivalent impact on soil erosion as an M1A2 tank driving one mile in an Armorbattalion (BN) [field training exercise]” (USAEC 1999).
Selection of Measures of Effects
The primary measures of the effects of tracked vehicle movement for this assess-ment relate to the effect of soil disturbance on hydrology, and the effect of changesin hydrology on desert wash plant communities (Figure 1). The primary metricsare estimates of water loss from disturbance in particular soil types and the mod-eled overall loss of water to the wash vegetation community. Water loss could affectplant biomass or community properties in geographically distant downslope desertwashes (the assessment endpoint). Direct measurements of wash plant communitieswere not conducted as part of this assessment. Few published data are available doc-umenting the direct effect of pavement disturbance on hydrology and wash plantcommunities. Supporting lines of evidence from other studies in the area and ob-servational information were used as inputs to simulations.
CHARACTERIZATION OF EXPOSURE
The exposure assessment focused on direct and indirect tracked vehicle stressorson (1) vegetation in washes and (2) mule deer. The primary focus of the character-ization of exposure was on the hydrological analysis that modeled tank disturbanceof desert pavement and the resultant changes to surface water runoff to wash vege-tation.
Vegetation in Washes
It is assumed for this exposure assessment that desert wash vegetation is not di-rectly exposed to tank track disturbance, such as crushing, dust, or erosion fromtanks traveling in washes. Tanks do not travel through washes at YPG, includingMcAllister Wash, which is the focus of this assessment, based on three lines of evi-dence: (1) the description of tank training and testing programs by Yuma ProvingGround staff, (2) the lack of visible tank tracks in washes in aerial Digital Orthogo-nal Quarter Quadrangle (DOQQ) photos of the area, and (3) YPG plant protectionpolicies designed to avoid or minimize disturbance to rare plants, many of which arefound in washes. In addition, exposure of wash vegetation to dust was considerednegligible because of the distance of the test from washes. Erosion related to theApache Longbow–Hellfire missile test was also considered negligible, as rain eventswere extremely rare, and there was little direct evidence of erosion features nearlocations of tracked vehicle use at YPG. At more vegetated military sites, it is conceiv-able that tank track area could directly be related to the response of an ecological
924 Hum. Ecol. Risk Assess. Vol. 14, No. 5, 2008
Yuma Proving Ground: Ecological Risk Assessment for Tracked Vehicles
endpoint entity (Ayers 1994). Such exposure could be measured empirically, orestimated using models such as ATTACC.
Indirect exposure and effects to wash vegetation could occur from tank distur-bance of desert pavement (primary stressor), resulting in changes in hydrology (sec-ondary stressor) (Figure 1). The impact of soil disturbance on hydrology and vege-tation is a key concern in desert environments. Any change to the soil surface in anarid environment can change the hydrology of the soil system, and desert plants arestrongly limited by the availability and spatial distribution of soil moisture (Caldwellet al. 2006; Kade and Warren 2002; McAuliffe 1994). At YPG, most of the plant andanimal diversity is associated with the desert wash communities (YPG 2001; Bern1995) that rely on surface flow and deep water supply (vadose zone) recharge dur-ing seasonal rain events (McDonald 2000). Therefore, soil–water–plant interactionsassociated with the tracked vehicle component of the Apache–Hellfire test was amajor focus of this study.
For most soil types and desert crusts outside of the hyperarid desert, tracked vehi-cle disturbances related to soil and vegetation compaction would include decreasedsoil permeability, and increased runoff and erosion due to vehicle disturbance (Ayers1994; Prose 1985). At YPG, however, the principal mechanism by which desert washvegetation is impacted in the modeled scenarios is by tank disturbance of desertpavement that results in infiltration and evaporation of water in the resulting rutsand depressions, or upslope of berms along tank tracks, resulting in less surface wa-ter runoff to washes (Gilewitch 2004). Depending on a variety of factors includingthe amount of rain and distance from washes, all trapped water found in depressionsin desert pavements might expect to evaporate or infiltrate. Such depressional areascan also create microhabitats for disturbance-adapted plants, potentially resultingin additional water losses via plant retention and transpiration (Kade and Warren2002). Generally, transpiration loss is minimal in the upland areas because of thegeneral absence of vegetation in desert pavements and mountainous slopes.
For the purposes of the MERAF demonstration, the underlying assumption thattank pavement disturbance limits water runoff to washes was modeled because slope,soil, and desert pavement characteristics of the test area suggested that this scenariowas reasonable (McDonald 2000; Ayres Associates 1996), and direct observation indi-cated drier conditions downslope from roads and water retention at some disturbedsites (e .g ., upstream of road crossings, pavement craters; Glass 2000; Bern 1995).In addition, the potential for decreased water flow to desert washes from variousdisturbances was an interest of natural resource managers at the installation, andthe scenario is the most conservative risk assessment approach (i.e ., if “sensitive”wash vegetation is impacted, it is likely from water loss, not from too much water tothe washes).
Hydrological Analysis Assumptions and Input Variables
An estimate of tank track area served as an input to the hydrological analysis.Several test and hypothetical vehicle disturbance scenarios were considered. Theseincluded pre-existing disturbance, test disturbance plus pre-existing disturbance, ahypothetical scenario of no disturbance, and three hypothetical scenarios involvingroadside disturbances (Table 2). The latter three scenarios represent allowable, but
Hum. Ecol. Risk Assess. Vol. 14, No. 5, 2008 925
M. J. Peterson et al.
Table 2. Vehicle disturbance scenarios for hydrological analysis.
Scenario Justification or reference
(1) No disturbance Conditions prior to establishment of test area(2) Existing disturbance from
previous tests on MTI RoadDisturbance conditions evident from July 1998
DOQQ image(3) Conservative estimate of
disturbance from ApacheLongbow–Hellfire test, plusexisting disturbance
Field observations, August 15, 2000
Hypothetical estimates of 100-mwide roadside disturbancesalong 900–1000-m sections of:
YPG Aviation and Airdrop Systems hadauthorization from the Environment Office todisturb land up to 100 m on either side of thecenter line of the roads; thus this level ofdisturbance could have occurred.
(4) MTI Road, between West Targetand Red Hill Road
(5) MTI Road, between Red Hill andEast Target Roads
(6) East Target Road, above WestTarget Road
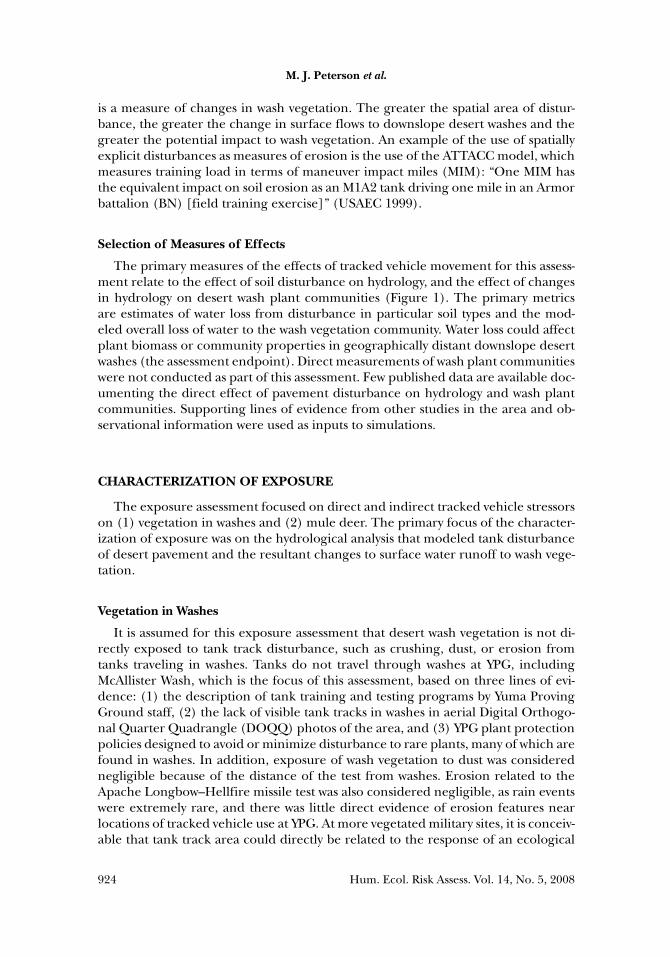
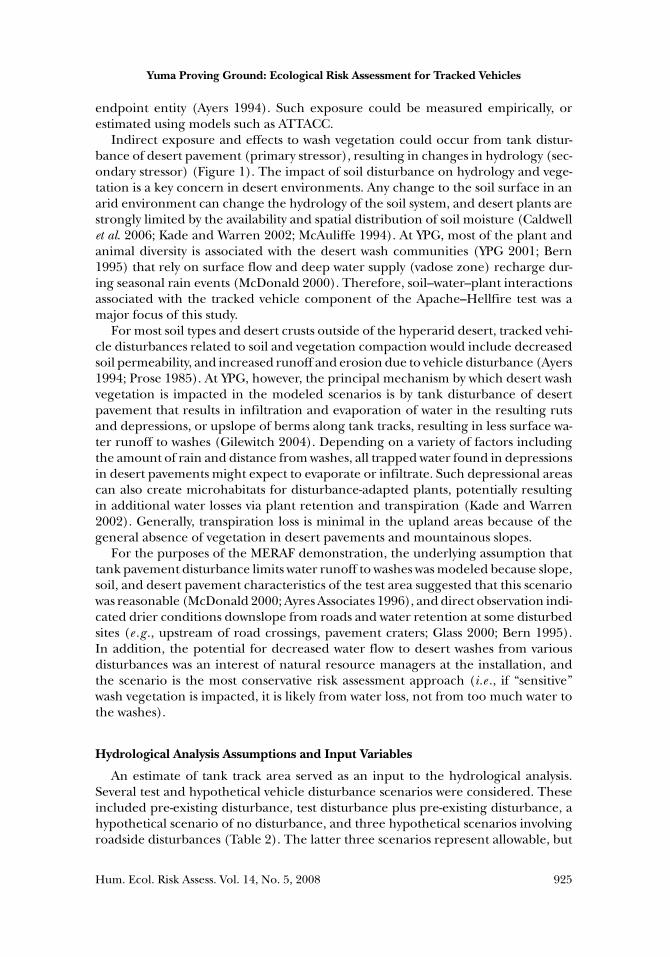
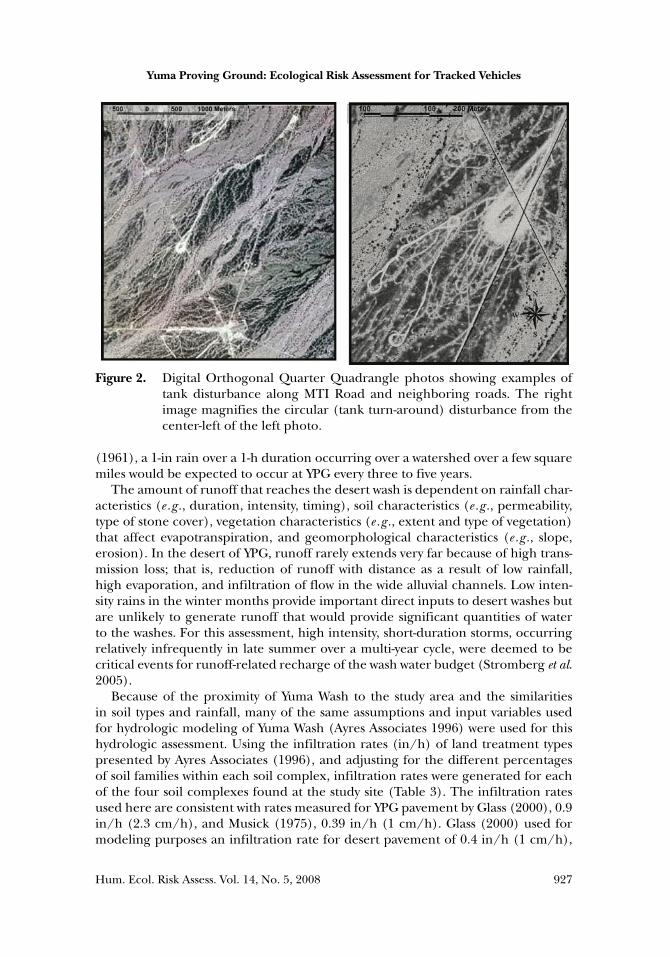
not observed, test disturbances as part of the Apache Longbow–Hellfire missile test.Pre-existing tank track areas were estimated from a 1998 DOQQ aerial photo of thestudy area (Figure 2). The tank track areas from additional locations of disturbance(an off-road path and tank turnarounds) were estimated from measurements of asingle turnaround area during a post-test site visit in fall of 2000 and the assumptionthat most tank turnarounds are approximately equivalent in size. It was assumed thatall or none of each 30 × 30-m cell, which is the resolution of the DEM, was disturbed(Figure 3). Thus, disturbances at spatial scales smaller than the majority of a 30 ×30-m cell (about 450 m2) were not considered. The estimate of disturbance areasprobably represents a conservative (i.e ., high) estimate of impacts of the ApacheLongbow–Hellfire missile test, because other tests may have been performed in thearea between the time of the 1998 DOQQ and the August 2000 test. In future riskassessments, an assessor could use a time series of DOQQs to attribute tank tracksto particular tests, with knowledge of which tests or training programs utilized thesite during which period.
To provide estimates of runoff associated with land areas that were disturbed ornot disturbed by tracked vehicle movement, this analysis focused on a simulatedrainfall event of sufficient intensity and duration to provide runoff to the wash:one inch of rain over a 1-h duration over the entire McAllister and Indian Washwatersheds encompassing the test area. (Indian Wash drains the northwest part ofthe study area.) Rainfall events of exceptionally high intensity (10- to 100-year returnperiods) were not considered in this analysis, because much of the water from suchan event could not be assimilated by the wash and its vegetation (most of the waterwould flow downstream out of YPG to the Colorado River), and events of such raritywould not be relevant to plant wash communities in the short term. Based on rainfalldistribution calculations used by Ayres Associates (1996) for Yuma Wash (an uplanddesert wash northwest of the study area), and using rainfall data from Hershfield
926 Hum. Ecol. Risk Assess. Vol. 14, No. 5, 2008
Yuma Proving Ground: Ecological Risk Assessment for Tracked Vehicles
Figure 2. Digital Orthogonal Quarter Quadrangle photos showing examples oftank disturbance along MTI Road and neighboring roads. The rightimage magnifies the circular (tank turn-around) disturbance from thecenter-left of the left photo.
(1961), a 1-in rain over a 1-h duration occurring over a watershed over a few squaremiles would be expected to occur at YPG every three to five years.
The amount of runoff that reaches the desert wash is dependent on rainfall char-acteristics (e .g ., duration, intensity, timing), soil characteristics (e .g ., permeability,type of stone cover), vegetation characteristics (e .g ., extent and type of vegetation)that affect evapotranspiration, and geomorphological characteristics (e .g ., slope,erosion). In the desert of YPG, runoff rarely extends very far because of high trans-mission loss; that is, reduction of runoff with distance as a result of low rainfall,high evaporation, and infiltration of flow in the wide alluvial channels. Low inten-sity rains in the winter months provide important direct inputs to desert washes butare unlikely to generate runoff that would provide significant quantities of waterto the washes. For this assessment, high intensity, short-duration storms, occurringrelatively infrequently in late summer over a multi-year cycle, were deemed to becritical events for runoff-related recharge of the wash water budget (Stromberg et al.2005).
Because of the proximity of Yuma Wash to the study area and the similaritiesin soil types and rainfall, many of the same assumptions and input variables usedfor hydrologic modeling of Yuma Wash (Ayres Associates 1996) were used for thishydrologic assessment. Using the infiltration rates (in/h) of land treatment typespresented by Ayres Associates (1996), and adjusting for the different percentagesof soil families within each soil complex, infiltration rates were generated for eachof the four soil complexes found at the study site (Table 3). The infiltration ratesused here are consistent with rates measured for YPG pavement by Glass (2000), 0.9in/h (2.3 cm/h), and Musick (1975), 0.39 in/h (1 cm/h). Glass (2000) used formodeling purposes an infiltration rate for desert pavement of 0.4 in/h (1 cm/h),
Hum. Ecol. Risk Assess. Vol. 14, No. 5, 2008 927
M. J. Peterson et al.
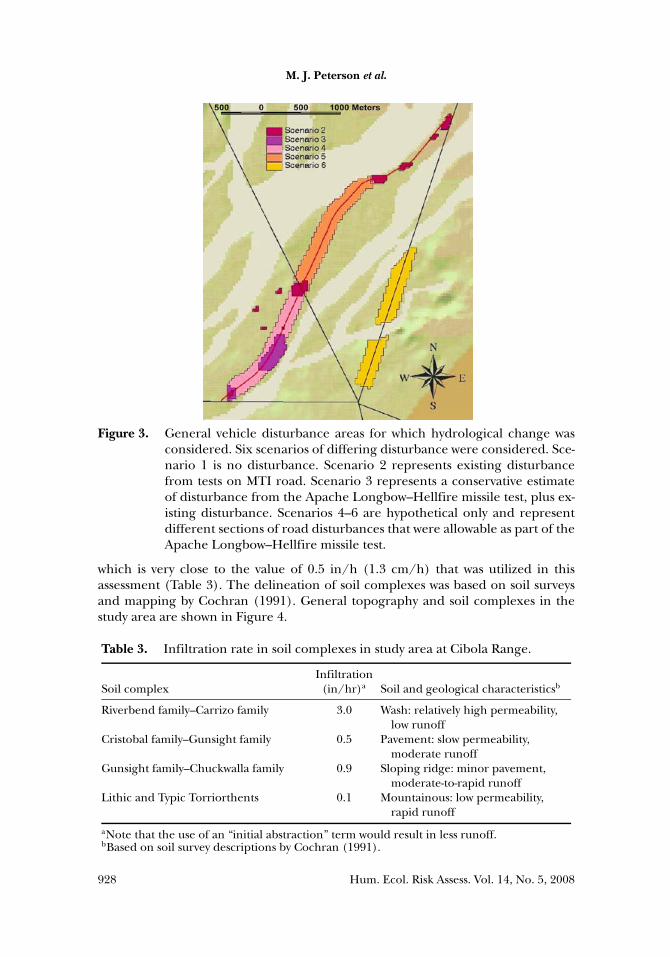
Figure 3. General vehicle disturbance areas for which hydrological change wasconsidered. Six scenarios of differing disturbance were considered. Sce-nario 1 is no disturbance. Scenario 2 represents existing disturbancefrom tests on MTI road. Scenario 3 represents a conservative estimateof disturbance from the Apache Longbow–Hellfire missile test, plus ex-isting disturbance. Scenarios 4–6 are hypothetical only and representdifferent sections of road disturbances that were allowable as part of theApache Longbow–Hellfire missile test.
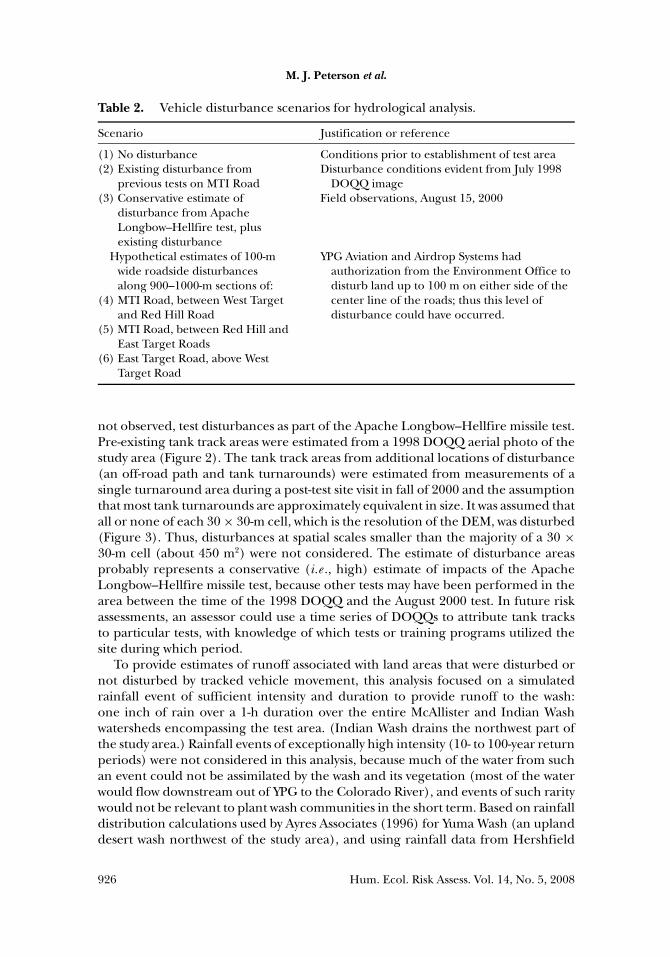
which is very close to the value of 0.5 in/h (1.3 cm/h) that was utilized in thisassessment (Table 3). The delineation of soil complexes was based on soil surveysand mapping by Cochran (1991). General topography and soil complexes in thestudy area are shown in Figure 4.
Table 3. Infiltration rate in soil complexes in study area at Cibola Range.
Soil complexInfiltration
(in/hr)a Soil and geological characteristicsb
Riverbend family–Carrizo family 3.0 Wash: relatively high permeability,low runoff
Cristobal family–Gunsight family 0.5 Pavement: slow permeability,moderate runoff
Gunsight family–Chuckwalla family 0.9 Sloping ridge: minor pavement,moderate-to-rapid runoff
Lithic and Typic Torriorthents 0.1 Mountainous: low permeability,rapid runoff
aNote that the use of an “initial abstraction” term would result in less runoff.bBased on soil survey descriptions by Cochran (1991).
928 Hum. Ecol. Risk Assess. Vol. 14, No. 5, 2008
Yuma Proving Ground: Ecological Risk Assessment for Tracked Vehicles
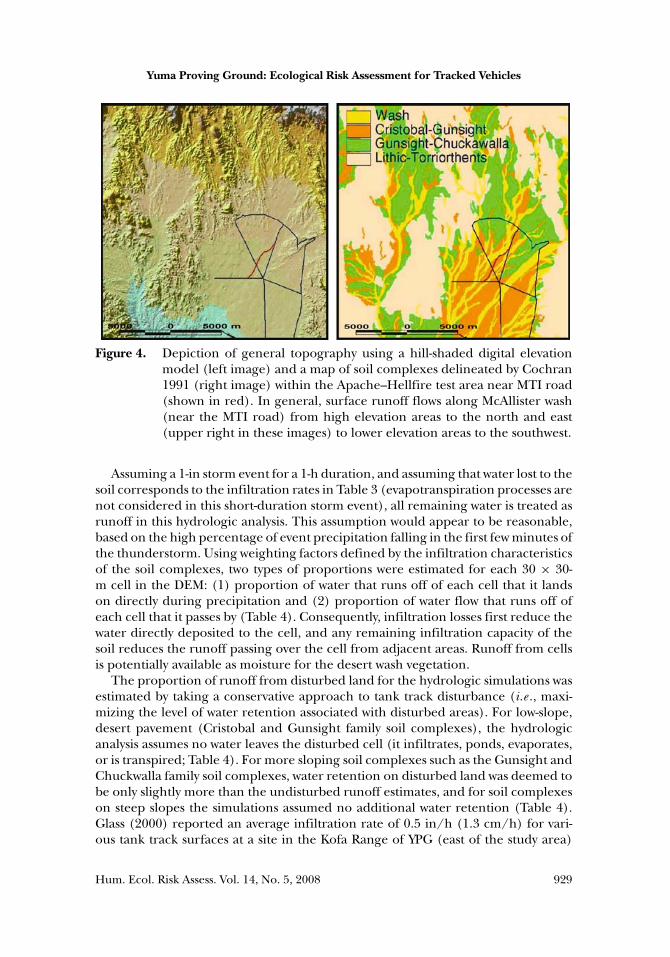
Figure 4. Depiction of general topography using a hill-shaded digital elevationmodel (left image) and a map of soil complexes delineated by Cochran1991 (right image) within the Apache–Hellfire test area near MTI road(shown in red). In general, surface runoff flows along McAllister wash(near the MTI road) from high elevation areas to the north and east(upper right in these images) to lower elevation areas to the southwest.
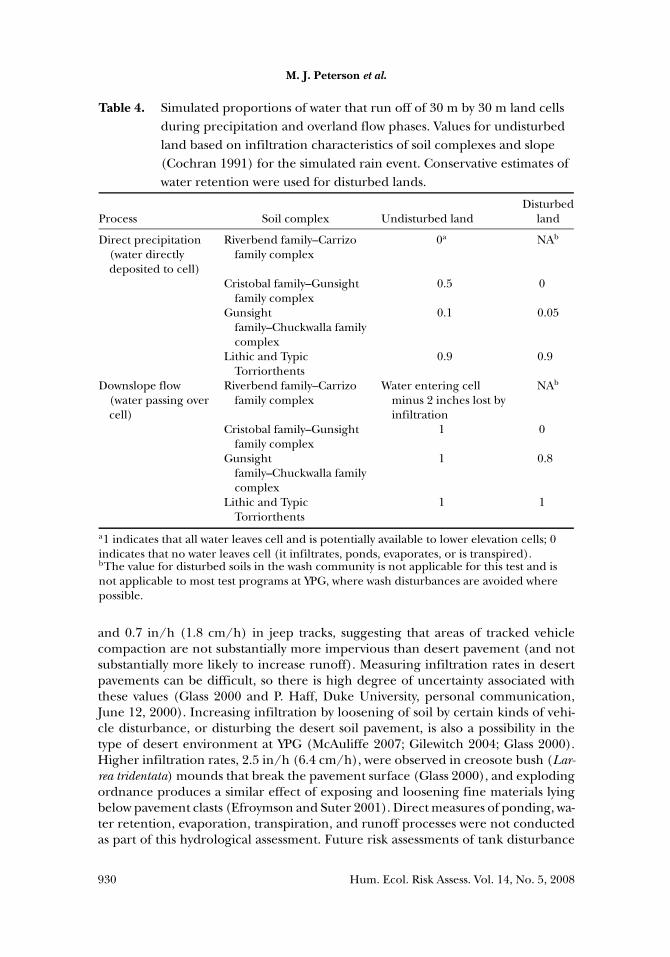
Assuming a 1-in storm event for a 1-h duration, and assuming that water lost to thesoil corresponds to the infiltration rates in Table 3 (evapotranspiration processes arenot considered in this short-duration storm event), all remaining water is treated asrunoff in this hydrologic analysis. This assumption would appear to be reasonable,based on the high percentage of event precipitation falling in the first few minutes ofthe thunderstorm. Using weighting factors defined by the infiltration characteristicsof the soil complexes, two types of proportions were estimated for each 30 × 30-m cell in the DEM: (1) proportion of water that runs off of each cell that it landson directly during precipitation and (2) proportion of water flow that runs off ofeach cell that it passes by (Table 4). Consequently, infiltration losses first reduce thewater directly deposited to the cell, and any remaining infiltration capacity of thesoil reduces the runoff passing over the cell from adjacent areas. Runoff from cellsis potentially available as moisture for the desert wash vegetation.
The proportion of runoff from disturbed land for the hydrologic simulations wasestimated by taking a conservative approach to tank track disturbance (i.e ., maxi-mizing the level of water retention associated with disturbed areas). For low-slope,desert pavement (Cristobal and Gunsight family soil complexes), the hydrologicanalysis assumes no water leaves the disturbed cell (it infiltrates, ponds, evaporates,or is transpired; Table 4). For more sloping soil complexes such as the Gunsight andChuckwalla family soil complexes, water retention on disturbed land was deemed tobe only slightly more than the undisturbed runoff estimates, and for soil complexeson steep slopes the simulations assumed no additional water retention (Table 4).Glass (2000) reported an average infiltration rate of 0.5 in/h (1.3 cm/h) for vari-ous tank track surfaces at a site in the Kofa Range of YPG (east of the study area)
Hum. Ecol. Risk Assess. Vol. 14, No. 5, 2008 929
M. J. Peterson et al.
Table 4. Simulated proportions of water that run off of 30 m by 30 m land cellsduring precipitation and overland flow phases. Values for undisturbedland based on infiltration characteristics of soil complexes and slope(Cochran 1991) for the simulated rain event. Conservative estimates ofwater retention were used for disturbed lands.
DisturbedProcess Soil complex Undisturbed land land
Direct precipitation(water directlydeposited to cell)
Riverbend family–Carrizofamily complex
0a NAb
Cristobal family–Gunsightfamily complex
0.5 0
Gunsightfamily–Chuckwalla familycomplex
0.1 0.05
Lithic and TypicTorriorthents
0.9 0.9
Downslope flow(water passing overcell)
Riverbend family–Carrizofamily complex
Water entering cellminus 2 inches lost byinfiltration
NAb
Cristobal family–Gunsightfamily complex
1 0
Gunsightfamily–Chuckwalla familycomplex
1 0.8
Lithic and TypicTorriorthents
1 1
a1 indicates that all water leaves cell and is potentially available to lower elevation cells; 0indicates that no water leaves cell (it infiltrates, ponds, evaporates, or is transpired).bThe value for disturbed soils in the wash community is not applicable for this test and isnot applicable to most test programs at YPG, where wash disturbances are avoided wherepossible.
and 0.7 in/h (1.8 cm/h) in jeep tracks, suggesting that areas of tracked vehiclecompaction are not substantially more impervious than desert pavement (and notsubstantially more likely to increase runoff). Measuring infiltration rates in desertpavements can be difficult, so there is high degree of uncertainty associated withthese values (Glass 2000 and P. Haff, Duke University, personal communication,June 12, 2000). Increasing infiltration by loosening of soil by certain kinds of vehi-cle disturbance, or disturbing the desert soil pavement, is also a possibility in thetype of desert environment at YPG (McAuliffe 2007; Gilewitch 2004; Glass 2000).Higher infiltration rates, 2.5 in/h (6.4 cm/h), were observed in creosote bush (Lar-rea tridentata) mounds that break the pavement surface (Glass 2000), and explodingordnance produces a similar effect of exposing and loosening fine materials lyingbelow pavement clasts (Efroymson and Suter 2001). Direct measures of ponding, wa-ter retention, evaporation, transpiration, and runoff processes were not conductedas part of this hydrological assessment. Future risk assessments of tank disturbance
930 Hum. Ecol. Risk Assess. Vol. 14, No. 5, 2008
Yuma Proving Ground: Ecological Risk Assessment for Tracked Vehicles
sites at YPG would benefit from using site and test-specific data for calculating waterinfiltration rates, evaporation, and runoff for various desert soil types.
Implementation of the Spatial Hydrological Model
The “flow accumulation” feature within ArcInfo was used to provide a spatiallyexplicit assessment of the amount of runoff and water loss in disturbed and undis-turbed soils in the study area. This analysis made use of the DEM and estimates ofrunoff from four soil complexes, under both disturbed and undisturbed conditions.The results of the analyses were maps of net water loss in and downslope from thetest area.
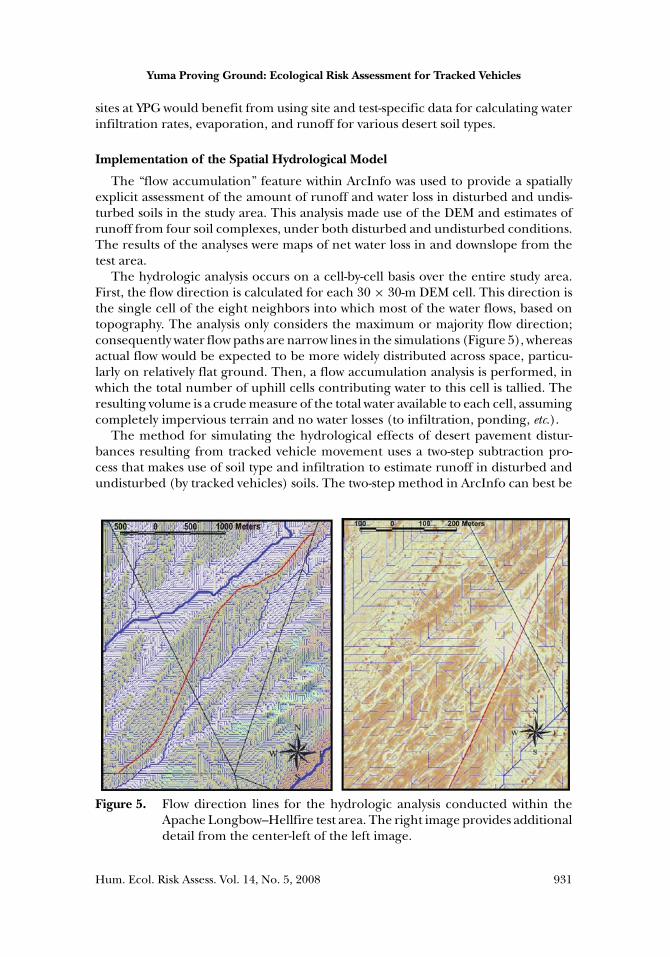
The hydrologic analysis occurs on a cell-by-cell basis over the entire study area.First, the flow direction is calculated for each 30 × 30-m DEM cell. This direction isthe single cell of the eight neighbors into which most of the water flows, based ontopography. The analysis only considers the maximum or majority flow direction;consequently water flow paths are narrow lines in the simulations (Figure 5), whereasactual flow would be expected to be more widely distributed across space, particu-larly on relatively flat ground. Then, a flow accumulation analysis is performed, inwhich the total number of uphill cells contributing water to this cell is tallied. Theresulting volume is a crude measure of the total water available to each cell, assumingcompletely impervious terrain and no water losses (to infiltration, ponding, etc.).
The method for simulating the hydrological effects of desert pavement distur-bances resulting from tracked vehicle movement uses a two-step subtraction pro-cess that makes use of soil type and infiltration to estimate runoff in disturbed andundisturbed (by tracked vehicles) soils. The two-step method in ArcInfo can best be
Figure 5. Flow direction lines for the hydrologic analysis conducted within theApache Longbow–Hellfire test area. The right image provides additionaldetail from the center-left of the left image.
Hum. Ecol. Risk Assess. Vol. 14, No. 5, 2008 931
M. J. Peterson et al.
understood from the perspective of a single map cell. Three hydrological areas areof importance for each cell: (1) the upslope or uphill contributing area from whichwater flows into this cell; (2) the cell itself; and (3) the downslope or downhill areainto which water flows from this cell.
For the flow-accumulation step of the analysis, a runoff weighting grid was devised.This grid consists of numbers between zero and one, representing the estimatedproportion of incipient precipitation falling on this cell that was lost to infiltration(Table 4). A unique loss percentage was supplied for each of the four soil types,depending on whether the cell was disturbed or undisturbed. Runoff losses fromupslope areas were accounted for in a second, separate subtraction step from theflow accumulation layer. As in the first decrement step, the second subtraction alsotakes into account the infiltration capacity of the respective soil type and whetherthe cell is disturbed by tracked vehicles.
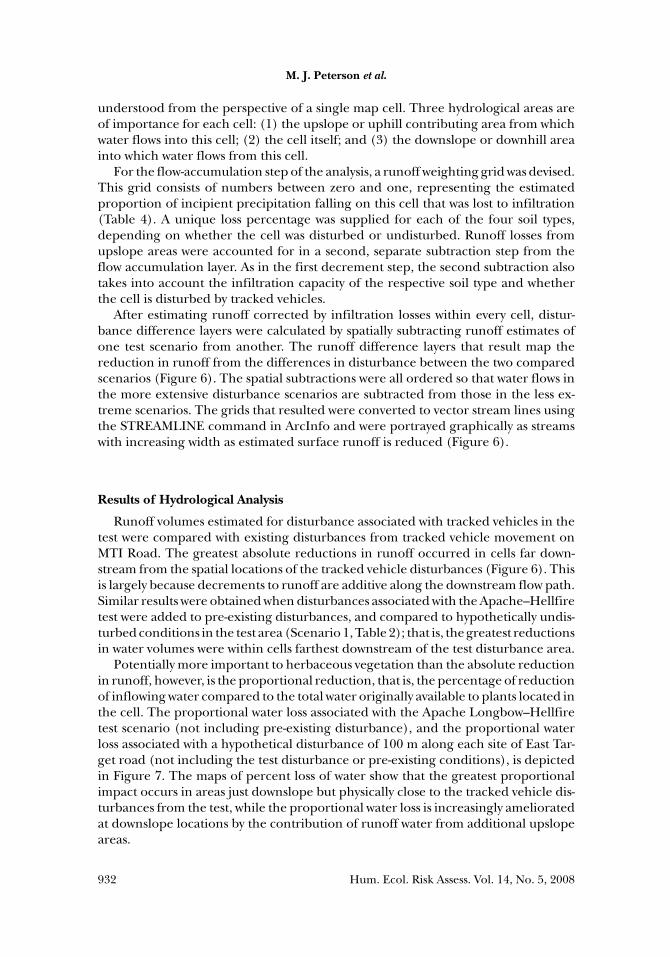
After estimating runoff corrected by infiltration losses within every cell, distur-bance difference layers were calculated by spatially subtracting runoff estimates ofone test scenario from another. The runoff difference layers that result map thereduction in runoff from the differences in disturbance between the two comparedscenarios (Figure 6). The spatial subtractions were all ordered so that water flows inthe more extensive disturbance scenarios are subtracted from those in the less ex-treme scenarios. The grids that resulted were converted to vector stream lines usingthe STREAMLINE command in ArcInfo and were portrayed graphically as streamswith increasing width as estimated surface runoff is reduced (Figure 6).
Results of Hydrological Analysis
Runoff volumes estimated for disturbance associated with tracked vehicles in thetest were compared with existing disturbances from tracked vehicle movement onMTI Road. The greatest absolute reductions in runoff occurred in cells far down-stream from the spatial locations of the tracked vehicle disturbances (Figure 6). Thisis largely because decrements to runoff are additive along the downstream flow path.Similar results were obtained when disturbances associated with the Apache–Hellfiretest were added to pre-existing disturbances, and compared to hypothetically undis-turbed conditions in the test area (Scenario 1, Table 2); that is, the greatest reductionsin water volumes were within cells farthest downstream of the test disturbance area.
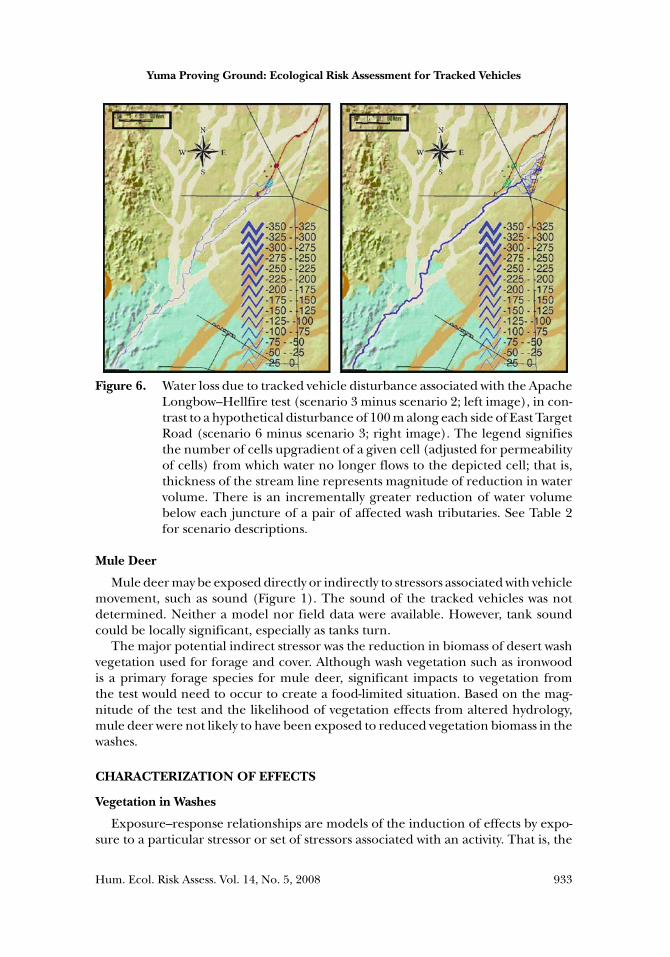
Potentially more important to herbaceous vegetation than the absolute reductionin runoff, however, is the proportional reduction, that is, the percentage of reductionof inflowing water compared to the total water originally available to plants located inthe cell. The proportional water loss associated with the Apache Longbow–Hellfiretest scenario (not including pre-existing disturbance), and the proportional waterloss associated with a hypothetical disturbance of 100 m along each site of East Tar-get road (not including the test disturbance or pre-existing conditions), is depictedin Figure 7. The maps of percent loss of water show that the greatest proportionalimpact occurs in areas just downslope but physically close to the tracked vehicle dis-turbances from the test, while the proportional water loss is increasingly amelioratedat downslope locations by the contribution of runoff water from additional upslopeareas.
932 Hum. Ecol. Risk Assess. Vol. 14, No. 5, 2008
Yuma Proving Ground: Ecological Risk Assessment for Tracked Vehicles
Figure 6. Water loss due to tracked vehicle disturbance associated with the ApacheLongbow–Hellfire test (scenario 3 minus scenario 2; left image), in con-trast to a hypothetical disturbance of 100 m along each side of East TargetRoad (scenario 6 minus scenario 3; right image). The legend signifiesthe number of cells upgradient of a given cell (adjusted for permeabilityof cells) from which water no longer flows to the depicted cell; that is,thickness of the stream line represents magnitude of reduction in watervolume. There is an incrementally greater reduction of water volumebelow each juncture of a pair of affected wash tributaries. See Table 2for scenario descriptions.
Mule Deer
Mule deer may be exposed directly or indirectly to stressors associated with vehiclemovement, such as sound (Figure 1). The sound of the tracked vehicles was notdetermined. Neither a model nor field data were available. However, tank soundcould be locally significant, especially as tanks turn.
The major potential indirect stressor was the reduction in biomass of desert washvegetation used for forage and cover. Although wash vegetation such as ironwoodis a primary forage species for mule deer, significant impacts to vegetation fromthe test would need to occur to create a food-limited situation. Based on the mag-nitude of the test and the likelihood of vegetation effects from altered hydrology,mule deer were not likely to have been exposed to reduced vegetation biomass in thewashes.
CHARACTERIZATION OF EFFECTS
Vegetation in Washes
Exposure–response relationships are models of the induction of effects by expo-sure to a particular stressor or set of stressors associated with an activity. That is, the
Hum. Ecol. Risk Assess. Vol. 14, No. 5, 2008 933
M. J. Peterson et al.
Figure 7. Percent water decrement associated with approximate vehicle distur-bance areas from the Apache Longbow–Hellfire test (scenario 3 minusscenario 2; left image). Percent water decrement associated with hypo-thetical disturbance of 100 m along each side of East Target Road is alsoshown for comparison (scenario 6 minus scenario 3; right image). SeeTable 2 for scenario descriptions.
level of expected effect increases with increasing exposure to the stressor. For manystressors and receptors there is a threshold exposure level below which no conse-quential effects occur, an increasing level of effects with increasing exposure, and alevel at which the maximum effects occur (e .g ., extinction or complete denuding ofvegetation).
Ideally, direct measurement of changes in vegetation as a consequence of trackedvehicle disturbance before and after the Apache Longbow–Hellfire missile test wouldbe conducted as a line of evidence in the effects (and risk) characterization. However,the natural variability in measures of vegetation that are associated with droughtand other environmental influences can be difficult to capture with field plots. Forexample, in a 72-year study Goldman and Turner (1986) observed that changesin blue palo verde (Parkinsonia floridum) cover over time fluctuated too much fortrends to be discerned in 100-m2 plots. Given the high drought tolerance of desertwash vegetation, it may be many years before changes in plant communities can bedetected. A vegetation survey was not conducted as part of this study.
The characterization of effects for the assessment of tracked vehicle movementon desert wash vegetation relied on information derived from other studies. YPG-specific studies and observations were found to be the most useful in characterizingeffects. Estimates of response thresholds, in this case the volume of water neededfor growth and survival of desert wash tree species, were generated using these study
934 Hum. Ecol. Risk Assess. Vol. 14, No. 5, 2008
Yuma Proving Ground: Ecological Risk Assessment for Tracked Vehicles
results. As these thresholds that relate hydrological exposure to plant survival arecombined with the results of the hydrologic analysis (i.e ., amount of water volumelost due to vehicle disturbance), an approximate estimate of risk can be determined.
Relationships between Surface Hydrology and Vegetation in Washes
The condition of desert wash vegetation is in large part dependent on the timingand duration of precipitation and associated runoff. Many herbaceous wash specieslie dormant as seeds until adequate rain is available for germination and subsequentflowering, which may occur once in several years. Because of the capacity of seedsto remain viable over a decade or longer, the long-term effects of low moistureon herbaceous plant populations are extremely difficult to measure. The moisturestress of arid woody shrub and tree species is also difficult to evaluate. Short-termimpacts from drought may be measurable in individuals (e .g ., loss of leaves, presenceof standing snags, low growth) but may not indicate community-level impacts overthe long term. Interpretation of community-level metrics is also complicated by thespatial variation of wash species. For example, locally significant desert wash treespecies such as palo verde, ironwood (Olneya tesota), catclaw acacia (Acacia greggi),and smoketree (Psorothamnus spinosa) are adapted to low moisture regimes, andpopulations may expand or contract with the changing channel and shifting ofalluvial deposits typical of wash soil dynamics.
Schlesinger and Jones (1984) (as reported in Schlesinger et al. 1989) showedthat diversion of overland flow from alluvial piedmonts resulted in lower shrubdensity and biomass compared to that in adjacent areas that received overland flow.At YPG, water available to desert wash tree species is presumably dependent onadequate runoff from the adjacent desert pavements during storm events. Pavementdisturbances that affect runoff to the washes have the potential to affect the qualityand quantity of wash vegetation, thereby affecting wildlife that utilize this vegetation.
McDonald (2000) studied the relationship between surface and soil moistureand desert shrubs and trees at YPG. Spring and mid-summer predawn and middaywater potentials achieved in palo verde and ironwood are much higher than wouldbe expected, given the very low volumetric moisture content of the soils (<1 m).McDonald suggests that these species have access to deeper water supplies (2–6 m,vadose zone, not groundwater). His preliminary results indicate that infrequent,high energy storms may be necessary to create enough overland runoff to rechargedeeper soil depths in the wash. These deeper water supplies may help sustain washplant activity over prolonged dry periods (>1 to 3 years), where direct precipitationmay be insufficient to recharge shallower surface layers.
Ayres Associates (1996) identified changes in hydrologic processes from historicalmilitary disturbances as a major factor affecting vegetation in Yuma Wash, althoughspecific changes in vegetation metrics as a result of changes in water volumes werenot quantified. As part of the Land Condition Trend Analysis program at YPG (Bern1995), the number of ironwood and palo verde were counted “upstream” and “down-stream” of Pole Line Road in the Kofa Range, and the number of plants were reduceddownstream (4 compared to 20 upstream), presumably due to changes in hydrologyfrom the road crossing of the wash (Bern 1995). The number of dead plants wasalso twice as high on the downstream plot. Reductions in plant biomass below road
Hum. Ecol. Risk Assess. Vol. 14, No. 5, 2008 935
M. J. Peterson et al.
crossings, where the road was sufficiently elevated over the surrounding landscape,were also observed by the MERAF team.
Glass (2000) investigated the relationship between disturbance in hydrology andchannel vegetation in a very small, undisturbed watershed (0.2 km2) in the KofaRange of YPG. Results show that for a 20% increase in infiltration depth, the per-centage of the total gully length no longer supporting wash trees increases between6% and 18%. Although the vegetation measures conducted for the Glass (2000)study do not represent a detailed botanical assessment, the study nevertheless pro-vides useful YPG-specific information for making a more quantitative link betweenwater loss due to disturbance and changes in vegetation. This Masters Thesis studywas used extensively for the characterization of effects and risk characterizationstages of this risk assessment.
Physiological Water Requirements of Desert Wash Species
Data on the specific water requirements of tree and shrub species in the studyarea, in terms of volume of water, were not readily available in the literature. Clearly,wash shrub and tree species, by the nature of their presence in washes and absence inmore upland areas, have higher water requirements than the more abundant speciesfound at YPG [such as white bursage (Ambrosia dumosa) and creosote bush]. Usingwater potential from various literature sources as an index for how much water aplant requires, Glass (2000) ranked four desert plant species in the following orderfor water need (reported water potentials in parentheses): ironwood (–22 to –35bars) > foothill palo verde (–36 bars) > brittlebush (–37 bars) > creosote (–40 to–60 bars). Glass (2000) also measured vegetation frequencies of these species in twogullies within YPG, and these results correlate with the water potential data: creosoteand brittlebush are the first to appear in the upper section of the gully, followed bypalo verde, then ironwood.
Determination of Water Volume Thresholds for Wash Trees
The relationship between contributing area runoff and vegetation observed ingullies in the Kofa Range of YPG by Glass (2000) was used to estimate the volume ofwater needed for growth and survival of desert wash tree species. Glass assumed thatthe position and size of the species in a gully was an indicator of water requirement;that is, plants grew to their maximum potential height and biomass in each wash, andplants with greater water need would require greater runoff contributing area, andwould be located further downstream. This general finding was common at YPG; forexample, ironwood trees at YPG tend to be two to four meters tall at the tops of firstorder flues, and they become increasingly larger with increasing hydrologic orderof the wash.
The Glass (2000) study area was similar to the Apache–Hellfire test area, althoughthe study was of much smaller scale with a focus on relatively narrow gullies, relativeto the wide, braided channels of the test area. The Glass (2000) study area was domi-nated by pavement with little or no vegetation, dissected by gullies where plants withhigher moisture requirements predominated. Gully infiltration rates were similarlyhigh as those in McAllister Wash, and the surrounding pavement had low infiltrationrates. Glass (2000) cited the similarity of the site on Kofa Range to many areas of
936 Hum. Ecol. Risk Assess. Vol. 14, No. 5, 2008
Yuma Proving Ground: Ecological Risk Assessment for Tracked Vehicles
YPG and particularly mentioned its relevance to an adjacent watershed where PoleLine Road crosses the wash, resulting in dead and dying ironwood trees downstreamof the crossing.
Glass (2000) studied three subbasins, each with two to six individual gullies wherethe number of individuals of ironwood and palo verde species were recorded atselect intervals over the entire length of each gully. Of importance in the analysiswas the most upstream location in each gully of an individual plant of ironwoodand palo verde. Assuming the first location of ironwood or palo verde in each basinrepresents the limit of the species’ water requirements (upstream of the location thespecies would not have enough water to survive, downstream it would), the associatedwater volume running over and into the soil is the minimal volume required for theplant to survive. Discharge volume (V) was calculated as (P – I ) × A, where P isprecipitation, I is infiltration, A is contributing area, and V is discharge volume. TheGlass (2000) simulations used a 0.03-m storm (1.2 in) for a 1-h duration (a onceevery 5-year event), and an infiltration rate of 0.01-m (0.4 in) for the surroundingpavement, to calculate discharge volumes at various points within each sub-basin(similar to the assumptions in this article’s hydrological analysis).
Results from Glass (2000) were deemed the best available for the basis of anexposure–response relationship for water volume and wash vegetation. Glass con-cluded that the volume of water needed in the simulated event for ironwood andpalo verde survival ranges from 150 to 350 m3 with an average of 250 m3. This is thesurvival effects threshold for trees in an approximately 5-m-wide gully. A conversionfactor of 6 was used to calculate a volume of water needed for survival of wash treesfor each 30 × 30-m cell in this article’s hydrologic model (1500 m3) because of thefactor-of-6 greater width. Differences between lengths of gullies and cells compris-ing the desert washes were not considered significant determinants of runoff watervolumes.
Glass (2000) also measured the sizes of ironwood and palo verde trees, and clas-sified them as small (<2 m), medium (2–4 m), and large (5–7 m). A pattern wasobserved of small individuals near the top of the gully, and increased numbers andsizes of individuals with distance downstream. A growth effects threshold was es-timated by determining the point where large trees were first observed, assumingthat smaller individuals represent stressed (or water-challenged) individuals. Largeironwoods are important for wildlife cover, and large trees may be important for suc-cessful propagation of the ironwood species. Glass (2000) reported the first down-stream location of large trees was approximately 100 to 300 m farther downstreamthan the first small tree in three representative gullies. Distances between small andlarge trees were not measured at YPG, but we assumed that 220 m was the distancebetween first small and first large trees, as determined from graphs presented inGlass (2000).
Using slopes for the three gullies relating distance downstream (m) to dischargevolume (m3), an average discharge volume of 987 m3 was needed for “growth” ofwash trees. Using the 6× conversion factor as explained earlier, the volume of wa-ter needed for adequate “growth” of wash trees for each cell in the YPG MERAFhydrologic model was calculated as 5900 m3.
The 1500 m3 water threshold associated with survival and the 5900 m3 thresholdof water associated with growth of desert wash trees during the modeled storm
Hum. Ecol. Risk Assess. Vol. 14, No. 5, 2008 937
M. J. Peterson et al.
event should not be considered physiological water requirements. Far more waterpermeates the soil and runs overland than is needed for plant growth. The valuesare more representative of watershed areas, and the amount of water that permeatessoil without evaporating or leaching appreciably (plant-available water) is assumedto approximate physiological water requirements.
Timing of Precipitation
The timing of precipitation was not explicitly included in the exposure–responserelationship derived for the YPG risk assessment; however, the timing of precipi-tation is important to plant biomass in desert ecosystems. Factors include rainfallduring periods when high temperatures cause large losses via evapotranspiration,rainfall during periods when plants are in a state of high temperature dormancy,high intensity rainfall where runoff is considerable, and cool spring temperaturesthat decrease evapotranspiration, permitting more soil moisture to be utilized intranspiration.
Mule Deer
A relationship between desert wash vegetation and mule deer populations was notdetermined for this test case, because there was no significant exposure to deer basedon the findings for vegetation. If the exposure had been found to be significant, arelationship between mule deer reproduction, foraging and habitat could have beendeveloped through the use of a mechanistic model. Such a model could include thepotential for reduction of forage (e .g ., reduction in biomass or change in durationof leaf-on period), change in forage quality, or change in cover quality, leading toan alteration of the deer diet, home range, and/or likelihood of predation (Figure8). For example, Schmitz (1992) developed a foraging model for white-tailed deer(Odocoileus virginianus) to predict the diet selection when deer face starvation risksduring a reproductive period.
RISK CHARACTERIZATION
Vegetation in Washes
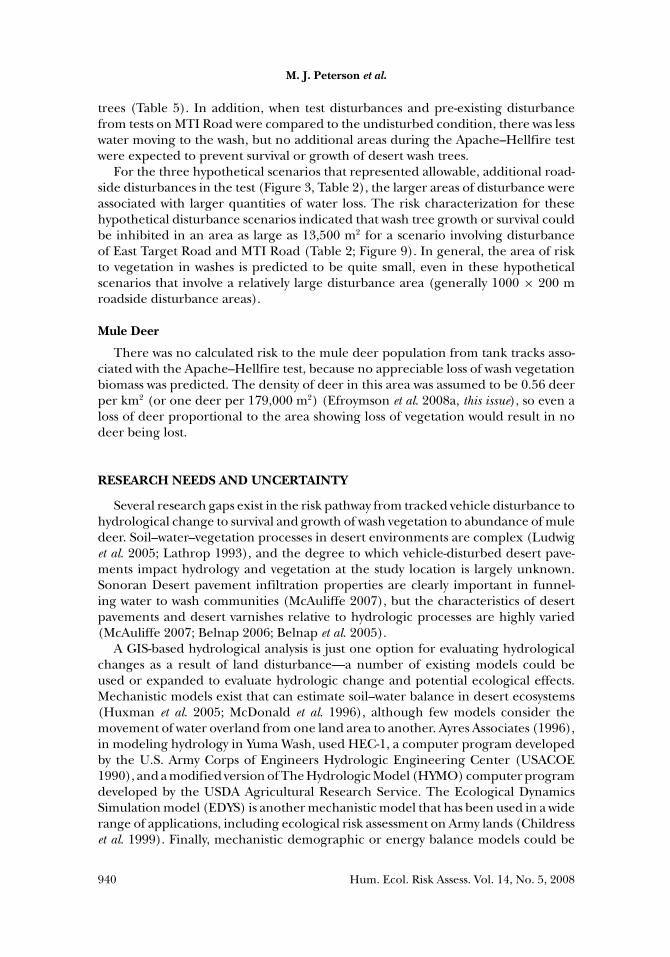
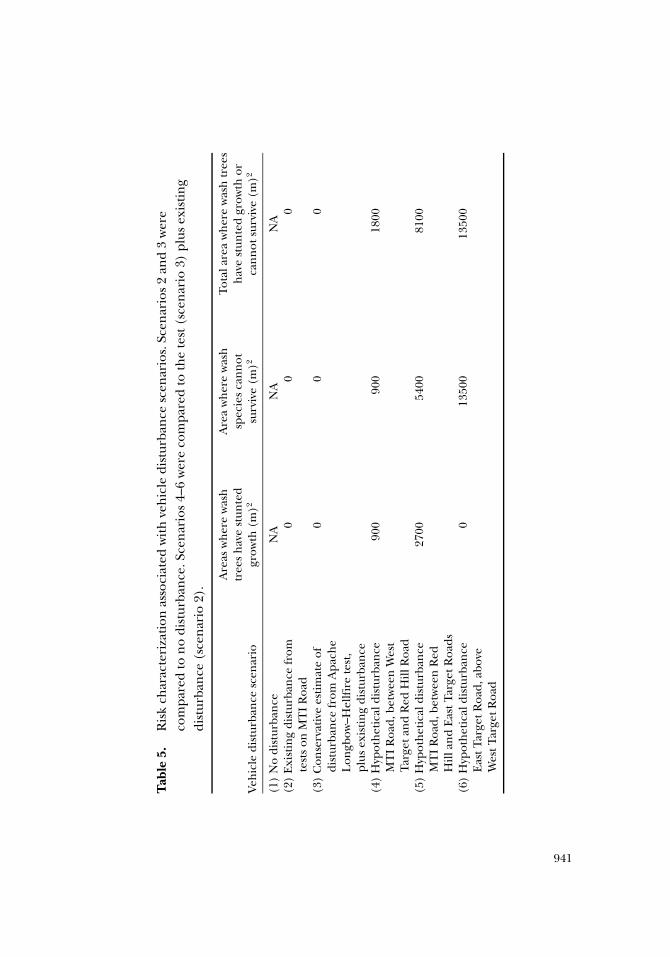
The amount of water needed in the modeled storm event for survival and growthof key wash tree species was 1500 m3 and 5900 m3, respectively, and these values repre-sent the selected thresholds for assessment of vegetation effects. Areas of McAllisterWash that have adequate quantities of water to support the growth and survival ofwash tree species, in the absence of any disturbance, according to this analysis, areshown in Figure 9. When undisturbed, the main wash channels have adequate waterfor growth and survival of trees, and areas of the washes where growth is affectedtend to be located in the upstream sections of the tributaries. The results of thisanalysis are consistent with field observations and available literature describing therelationship between hydrology and wash tree populations.
Based on the results of the hydrologic analysis, tank disturbance of desert pave-ments in the Apache Longbow–Hellfire missile test is predicted to result in waterlosses to McAllister Wash and tributaries, with the greatest percentage of water loss
938 Hum. Ecol. Risk Assess. Vol. 14, No. 5, 2008
Yuma Proving Ground: Ecological Risk Assessment for Tracked Vehicles
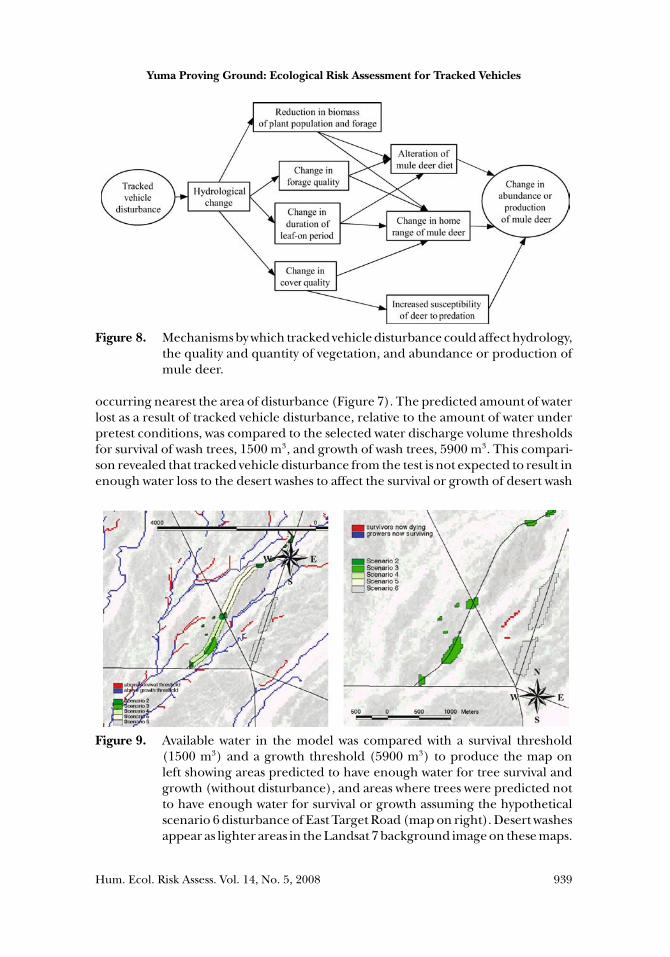
Figure 8. Mechanisms by which tracked vehicle disturbance could affect hydrology,the quality and quantity of vegetation, and abundance or production ofmule deer.
occurring nearest the area of disturbance (Figure 7). The predicted amount of waterlost as a result of tracked vehicle disturbance, relative to the amount of water underpretest conditions, was compared to the selected water discharge volume thresholdsfor survival of wash trees, 1500 m3, and growth of wash trees, 5900 m3. This compari-son revealed that tracked vehicle disturbance from the test is not expected to result inenough water loss to the desert washes to affect the survival or growth of desert wash
Figure 9. Available water in the model was compared with a survival threshold(1500 m3) and a growth threshold (5900 m3) to produce the map onleft showing areas predicted to have enough water for tree survival andgrowth (without disturbance), and areas where trees were predicted notto have enough water for survival or growth assuming the hypotheticalscenario 6 disturbance of East Target Road (map on right). Desert washesappear as lighter areas in the Landsat 7 background image on these maps.
Hum. Ecol. Risk Assess. Vol. 14, No. 5, 2008 939
M. J. Peterson et al.
trees (Table 5). In addition, when test disturbances and pre-existing disturbancefrom tests on MTI Road were compared to the undisturbed condition, there was lesswater moving to the wash, but no additional areas during the Apache–Hellfire testwere expected to prevent survival or growth of desert wash trees.
For the three hypothetical scenarios that represented allowable, additional road-side disturbances in the test (Figure 3, Table 2), the larger areas of disturbance wereassociated with larger quantities of water loss. The risk characterization for thesehypothetical disturbance scenarios indicated that wash tree growth or survival couldbe inhibited in an area as large as 13,500 m2 for a scenario involving disturbanceof East Target Road and MTI Road (Table 2; Figure 9). In general, the area of riskto vegetation in washes is predicted to be quite small, even in these hypotheticalscenarios that involve a relatively large disturbance area (generally 1000 × 200 mroadside disturbance areas).
Mule Deer
There was no calculated risk to the mule deer population from tank tracks asso-ciated with the Apache–Hellfire test, because no appreciable loss of wash vegetationbiomass was predicted. The density of deer in this area was assumed to be 0.56 deerper km2 (or one deer per 179,000 m2) (Efroymson et al. 2008a, this issue), so even aloss of deer proportional to the area showing loss of vegetation would result in nodeer being lost.
RESEARCH NEEDS AND UNCERTAINTY
Several research gaps exist in the risk pathway from tracked vehicle disturbance tohydrological change to survival and growth of wash vegetation to abundance of muledeer. Soil–water–vegetation processes in desert environments are complex (Ludwiget al. 2005; Lathrop 1993), and the degree to which vehicle-disturbed desert pave-ments impact hydrology and vegetation at the study location is largely unknown.Sonoran Desert pavement infiltration properties are clearly important in funnel-ing water to wash communities (McAuliffe 2007), but the characteristics of desertpavements and desert varnishes relative to hydrologic processes are highly varied(McAuliffe 2007; Belnap 2006; Belnap et al. 2005).
A GIS-based hydrological analysis is just one option for evaluating hydrologicalchanges as a result of land disturbance—a number of existing models could beused or expanded to evaluate hydrologic change and potential ecological effects.Mechanistic models exist that can estimate soil–water balance in desert ecosystems(Huxman et al. 2005; McDonald et al. 1996), although few models consider themovement of water overland from one land area to another. Ayres Associates (1996),in modeling hydrology in Yuma Wash, used HEC-1, a computer program developedby the U.S. Army Corps of Engineers Hydrologic Engineering Center (USACOE1990), and a modified version of The Hydrologic Model (HYMO) computer programdeveloped by the USDA Agricultural Research Service. The Ecological DynamicsSimulation model (EDYS) is another mechanistic model that has been used in a widerange of applications, including ecological risk assessment on Army lands (Childresset al. 1999). Finally, mechanistic demographic or energy balance models could be
940 Hum. Ecol. Risk Assess. Vol. 14, No. 5, 2008
Tab
le5.
Ris
kch
arac
teri
zati
onas
soci
ated
wit
hve
hic
ledi
stur
ban
cesc
enar
ios.
Scen
ario
s2
and
3w
ere
com
pare
dto
no
dist
urba
nce
.Sce
nar
ios
4–6
wer
eco
mpa
red
toth
ete
st(s
cen
ario
3)pl
usex
isti
ng
dist
urba
nce
(sce
nar
io2)
.
Are
asw
her
ew
ash
Are
aw
her
ew
ash
Tota
lare
aw
her
ew
ash
tree
str
ees
hav
est
unte
dsp
ecie
sca
nn
oth
ave
stun
ted
grow
thor
Veh
icle
dist
urba
nce
scen
ario
grow
th(m
)2su
rviv
e(m
)2ca
nn
otsu
rviv
e(m
)2
(1)
No
dist
urba
nce
NA
NA
NA
(2)
Exi
stin
gdi
stur
ban
cefr
omte
sts
onM
TI
Roa
d0
00
(3)
Con
serv
ativ
ees
tim
ate
ofdi
stur
ban
cefr
omA
pach
eL
ongb
ow–H
ellf
ire
test
,pl
usex
isti
ng
dist
urba
nce
00
0
(4)
Hyp
oth
etic
aldi
stur
ban
ceM
TI
Roa
d,be
twee
nW
est
Targ
etan
dR
edH
illR
oad
900
900
1800
(5)
Hyp
oth
etic
aldi
stur
ban
ceM
TI
Roa
d,be
twee
nR
edH
illan
dE
astT
arge
tRoa
ds
2700
5400
8100
(6)
Hyp
oth
etic
aldi
stur
ban
ceE
astT
arge
tRoa
d,ab
ove
Wes
tTar
getR
oad
013
500
1350
0
941
M. J. Peterson et al.
developed for key vertebrate species that are prevalent at multiple installations.In some cases, ranges of input parameters might be available to contribute to aquantitative uncertainty analysis.
A formal uncertainty analysis was not conducted for this risk characterization, butsources of uncertainty and variability are described in both the problem formulationand characterization of effects stages of the risk assessment. Key assumptions relateto quantities of water assumed in this assessment: the amount of precipitation, theamount of infiltration, and the amount of overland flow in the hydrologic modelassociated with particular soil types or disturbance. Conservative assumptions wereused in the absence of local data for this risk assessment, but empirical studiescould be performed to relate particular types and intensities of disturbance (e .g .,disturbance by X number of tanks of Y weight and Z track width on pavement or othersoils) to water infiltration, runoff, and other changes in hydrology. The cause–effectrelationship between water and plant growth and survival should also be validated, asshould the importance of particular intensities and durations of precipitation eventson disturbance-impacted vegetation growth.
CONCLUSIONS
This article demonstrates the use of MERAF for tracked vehicle activity, includingdefining a conceptual model for this type of assessment, potential analysis tools andapproaches that could be used (e .g ., hydrologic and mechanistic models), and futureresearch needs. This article also presents a highly site-specific example of the useof MERAF, focused on the ecological risks associated with one Apache Longbow–Hellfire Missile test activity in the rather unique desert environment of YPG. Theabsence of significant risk to desert wash vegetation and mule deer reflects notonly the small spatial and temporal scale of the test activity, but also the absence ofsensitive vegetation and wildlife directly impacted by the test disturbances. Pretestplanning and range management controls were also a factor, in that test activities inecologically sensitive wash communities were avoided, and there were establishedlimits to tank movement for the test.
Given that various conservative assumptions were used, this risk assessment pro-vides reasonable assurance to Department of Defense resource managers that indi-vidual, small-scale tracked vehicle disturbances in desert pavements at YPG that aresimilar to those from the Apache–Longbow missile test are unlikely to significantlyreduce water runoff to desert wash vegetation downslope of the vehicle disturbance.Logically, future risk assessments must consider site and test-specific conditions, aswell as cumulative risk. For this assessment, some wash vegetation impacts could beexpected if the vehicle disturbance was substantially larger in scale or more intrusive,although even in the hypothetical scenario with the greatest area of disturbance, therelative impacts to wash vegetation were small.
This risk assessment outlines a reasonable conceptual model and one type of hy-drologic approach for evaluating the effects of tracked vehicles on water runoff overdesert pavements and associated vegetation and wildlife. Other arid ecosystems thathave desert pavements whose principal response to disturbance is an increase in lo-cal permeability might benefit from a similar conceptual approach to that employed
942 Hum. Ecol. Risk Assess. Vol. 14, No. 5, 2008
Yuma Proving Ground: Ecological Risk Assessment for Tracked Vehicles
here. Indeed, risk to any system whose main response to disturbance is a significantchange in infiltration (either increased or decreased) might be subjected to suchan approach. Risk from new building and parking lot construction within urbansystems, for example, results in the addition of impermeable surface and might beamenable to such a semiquantitative risk assessment. The common response charac-teristics shared across such systems is that hydrologic consequences of a disturbanceare realized as effects localized in spatially removed downslope areas. The magnitudeof such disturbances are spatially concentrated and amplified with downslope dis-tance, while the proportion of the hydrological change is greatest in the downslopeareas immediately adjacent to the disturbance.
ACKNOWLEDGEMENTS
This research was funded by a contract from the U.S. Department of DefenseStrategic Environmental Research and Development Program (SERDP) project CS-1054, A Risk Assessment Framework for Natural Resources on Military Training and TestingLands, to Oak Ridge National Laboratory, which is managed by UT-Battelle, LLC,for the U.S. Department of Energy under contract DE-AC05-00OR22725. We thankBob Holst and John Hall for serving as project sponsors. We also acknowledge thecontributions of the following people for data, guidance, manuals, programmingadvice, text reviews, activity descriptions, and other assistance: Valerie Morrill, ChuckBotdorf, and Junior Kerns from the Yuma Proving Ground Environmental SciencesDivision; Sergio Obregon, David McIntyre, and Bruce Goff from Jason & Associates,Yuma Proving Ground Office; Rick Douglas and Bert Evans from Yuma ProvingGround Aviation and Airdrop Systems; Dick Gebhart and Kim Majerus from the U.S.Army Corps of Engineers Construction Engineering Research Laboratory; and ToddKuiken, Robert Washington-Allen, and S. Marshall Adams from Oak Ridge NationalLaboratory. Lastly, we acknowledge and thank the many people who conducted andreported field study results at YPG, without which we would not have been able toconduct this risk assessment.
REFERENCES
Adams SM, Peterson MJ, Hewitt AJ, et al. 2005. Assessing the Health and Fitness of TES onMilitary Ranges: Importance of Incorporating Integrated Chemical and Habitat Character-ization Studies in Experimental Designs. SERDP Partners in Environmental TechnologyTechnical Symposium and Workshop, November 29 to December 1, 2005, Washington,DC, USA
Althoff PS and Thien SJ. 2005. Impact of M1A1 main battle tank disturbance on soil quality,invertebrates, and vegetation characteristics. J Terramech 42:159–76
Ayers PD. 1994. Environmental damage from tracked vehicle operation. J Terramech31(3):173–83
Ayres Associates. 1996. Geomorphic, Hydrologic, and Vegetation Characterization and Base-line Conditions, of Yuma Wash, Yuma Proving Ground, Arizona. Final Report. Ayres ProjectNo. 92-0904.01
Belnap J. 2006. The potential roles of biological soil crusts in dryland hydrologic cycles. HydrolProcess 20:3159–78
Hum. Ecol. Risk Assess. Vol. 14, No. 5, 2008 943
M. J. Peterson et al.
Belnap J, Welter JR, Grimm NB, et al. 2005. Linkages between microbial and hydrologicprocesses in arid and semiarid watersheds. Ecology 86(2):298–07
Bern CM. 1995. Land Condition Trend Analysis Installation Report. Yuma Proving Ground,Arizona, 1991–1994. Center for Ecological Management of Military Lands, Colorado StateUniversity, Fort Collins, CO, USA
Bolling JD and Walker LR. 2000. Plant and soil recovery along a series of abandoned desertroads. J Arid Environ 46:1–24
BRACD (U.S. Army Base Realignment and Closure Division). 2007. Available athttp://www.hqda.army.mil/acsim/brac/braco.htm. Accessed August 25, 2007
Caldwell TG, McDonald EV, and Young MH. 2006. Soil disturbance and hydrologic responseat the National Training Center, Ft. Irwin, California. J Arid Environ 67(3):456–72
Childress WM, Price DL, Coldren CL, et al. 1999. A Functional Description of the Ecolog-ical Dynamics Simulation Model, with Applications for Army and Other Federal LandManagers. SMI Technical Report SMI-ES-009. USACERL Technical Report 99/DRAFT1999
Cochran CC. 1991. Soil Survey of the U.S. Army Yuma Proving Ground, Arizona—Parts ofLaPaz and Yuma Counties. US Department of Agriculture, Soil Conservation Service,Washington, DC, USA
Dale VH, Druckenbrod D, Baskaran L, et al. 2005. Vehicle impacts on the environment atdifferent spatial scales: Observations in west central Georgia, USA. J Terramech 4:383–402
Efroymson RA and Suter II GW. 2001. Ecological risk assessment framework for low-altitudeaircraft overflights: II. Estimating effects on wildlife. Risk Anal 21:263–74
Efroymson RA, Rose WH, Nemeth S, et al. 2000. Ecological Risk Assessment Frameworkfor Low-altitude Overflights by Fixed-wing and Rotary-wing Military Aircraft, ORNL/TM-2000/289. Oak Ridge National Laboratory, Oak Ridge, TN, USA
Efroymson RA, Suter II GW, Rose WH, et al. 2001a. Ecological risk assessment framework forlow-altitude aircraft overflights: I. Planning the analysis and estimating exposure. Risk Anal21:251–62
Efroymson RA, Hargrove WW, Peterson MJ, et al. 2001b. Demonstration of the Military Eco-logical Risk Assessment Framework (MERAF): Apache-Longbow–Hellfire Missile Test atYuma Proving Ground. ORNL/TM-2001/211. Oak Ridge National Laboratory, Oak Ridge,TN, USA
Efroymson RA, Peterson MJ, Jones DS, et al. 2008a. The Apache Longbow–Hellfire missile testat Yuma Proving Ground: Introduction and problem formulation for a multiple stressorrisk assessment. Hum Ecol Risk Assess (in press)
Efroymson RA, Hargrove WW, and Suter GW. 2008b. The Apache Longbow–Hellfire missiletest at Yuma Proving Ground: Ecological risk assessment for helicopter overflight. HumEcol Risk Assess (in press)
Gilewitch DA. 2004. The effect of Military Operation on Desert Pavement. A case study fromButler Pass, AZ (USA). In: Caldwell DR, Ehlen J, and Harmon RS (eds), Studies in MilitaryGeography and Geology, Chapter 19. Springer, The Netherlands, 243–258
Glass LS. 2000. Indexing Gully Discharge Deficit to Modifications of Interfluve Properties onDesert Pavement Fans and Implications for Gully Vegetation, Sonoran Desert, Arizona.Masters Thesis. Division of Earth and Ocean Sciences, Duke University, Durham, NC, USA
Goldman DE and Turner RM. 1986. Vegetation change and plant demography in permanentplots in the Sonoran Desert. Ecology 67:695–712
Guyer C, Birkhead R, and Balbach H. 2006. Effects of Tracked-Vehicle Training Activity onGopher Tortoise (Gopherus polyphemus) Behavior at Fort Benning, GA. Technical Report,01 Dec 06. ERDC/CERL, Champaign, IL, Report Number ERDC/CERL TR-06-10
Hamerlynck EP, McAuliffe JR, McDonald EV, et al. 2002. Ecological responses of two Mojavedesert shrubs to soil horizon development and soil water dynamics. Ecology 83(3):768–79
944 Hum. Ecol. Risk Assess. Vol. 14, No. 5, 2008
Yuma Proving Ground: Ecological Risk Assessment for Tracked Vehicles
Haugen LB, Ayers PD, and Anderson AB. 2003. Vehicle movement patterns and vegetativeimpacts during military training exercises. J Terramech 40(2):83–95
Hershfield DM. 1961. Rainfall Frequency Atlas of the United States for durations from 30minutes to 24 hours and return periods from 1 to 100 years. U.S. Department of Commerce,Weather Bureau Technical Paper No. 40, as cited in Ayres Associates 1996
Huxman TE, Wilcox BP, Breshears DD, et al. 2005. Ecohydrological implications of woodyplant encroachment. Ecology 86:308–319
Jones DS, Efroymson RA, Suter II GW, et al. 2008. The Apache Longbow–Hellfire missile test atYuma Proving Ground: Ecological risk assessment for missile firing. Hum Ecol Risk Assess(this issue)
Kade A and Warren SD. 2002. Soil and plant recovery after historic military disturbances inthe Sonoran Desert, USA. Arid Land Res Manage 16(3):231–43
Lathrop EW. 1993. Recovery of perennial vegetation in military maneuver areas, In: WebbRH and Wilshire HG (eds), Environmental Effects of Off-road Vehicles. Impacts and Man-agement in Arid Regions, pp 265–277. Springer-Verlag, New York, NY, USA
Leis SA, Leslie Jr DM, Engle DM, et al. 2007. Small mammals as indicators of short-term andlong-term disturbance in mixed prairie. Environ Monitor and Assess 137:75–84
Ludwig JA, Wilcox BP, Breshears DD, et al. 2005. Vegetation patches and runoff–erosion asinteracting ecohydrological processes in semiarid landscapes. Ecology 86(2):288–97
McAuliffe JR. 1994. Landscape evolution, soil formation, and ecological patterns and processesin Sonoran Desert bajadas, Ecol Monographs 64:111–48
McAuliffe JR. 2007. Desert Soils. Arizona-Sonora Desert Museum. Available athttp://www.desertmuseum.org/books/nhsd desert soils.php. Accessed 8/26/2007
McDonald E. 2000. Developing effective ecosystem monitoring strategies for military activitiesin deserts: Preliminary results from Yuma Proving Ground. Partners in EnvironmentalTechnology Technical Symposium and Workshop, November 28–30, 2000, Alexandria,VA, USA. Poster 61 Abstract
McDonald EV, Pierson FB, Flerchinger GN, et al. 1996. Application of a soil-water balancemodel to evaluate the influence of Holocene climate change on calcic soils, Mojave Desert,California, USA. Geoderma 74:167–92
Musick HB. 1975. Barrenness of desert pavement in Yuma County, Arizona. Arizona-NevadaAcademy of Sciences Journal 10:24–8, as cited in Ayres Associates 1996
Prose DV. 1985. Persisting effects of armored military maneuvers on some soils of the MojaveDesert. Environ Geol Water Sci 7(3):163–70
Prosser CW, Sedivec KK, and Barker WT. 2000. Tracked vehicle effects on vegetation and soilcharacteristics. J Range Manage 53:666–70
Schlesinger WH and Jones CS. 1984. The comparative importance of overland runoff andmean annual rainfall to shrub communities of the Mojave Desert. Bot Gaz 145:116–24
Schlesinger WH, Fonteyn PJ, and Reiners WA. 1989. Effects of overland flow on plant waterrelations, erosion, and soil water percolation on a Mojave Desert landscape. Soil Sci SocAm J 53:1567–72
Schmitz OJ. 1992. Optimal diet selection by white-tailed deer: Balancing reproduction withstarvation risk. Evol Ecol 6:125–41
Severinghaus WD and Severinghaus MC. 1982. Effects of tracked vehicle activity on birdpopulations. J Environ Manage. 6:163–9
Stromberg JC, Bagstad KJ, Leenhouts JM, et al. 2005. Effects of stream flow intermittency onriparian vegetation of a semiarid region river (San Pedro River, Arizona). J River Res andAppl 21(8):925–938
Suter II GW, Reinbold KA, Rose WH, et al. 2002. Military Ecological Risk Assessment Frame-work (MERAF) for Assessment of Risks of Military Training and Testing to Natural Re-sources. ORNL/TM-2002/295. Oak Ridge National Laboratory, Oak Ridge, TN, USA
Hum. Ecol. Risk Assess. Vol. 14, No. 5, 2008 945
M. J. Peterson et al.
USACOE (US Army Corps of Engineers). 1990. HEC-1 Flood Hydrograph Package, UsersManual, as cited in Ayres Associates 1996
USAEC (US Army Environmental Center). 1999. U.S. Army Training and Testing Area Car-rying Capacity (ATTACC). Handbook for Installations. Version 1.1. Aberdeen ProvingGround, MD, USA
USEPA (US Environmental Protection Agency). 1998. Guidelines for Ecological Risk Assess-ment. EPA/630/R-95/002F. Risk Assessment Forum, Washington, DC, USA
Watts SE. 1998. Short-term influence of tank tracks on vegetation and microphytic crusts inshrubsteppe habitat. Environ Manage 22(4):611–6
Wilson SD. 1988. The effects of military tank traffic on prairie—A management model. Envi-ron Manage 12(3):397–403
YPG (US Army Yuma Proving Ground). 2001. Final Range Wide Environmental Impact State-ment, prepared by Gutierrez-Palmenberg, Inc., Yuma Proving Ground, Yuma, AZ, USA
946 Hum. Ecol. Risk Assess. Vol. 14, No. 5, 2008


![Navy Ohio Replacement (SSBN[X]) Ballistic Missile ...](https://static.fdokumen.com/doc/165x107/6322a5b0887d24588e045283/navy-ohio-replacement-ssbnx-ballistic-missile-.jpg)