Students engaged in proving - ERIC - Department of Education
277
-
Upload
khangminh22 -
Category
Documents
-
view
2 -
download
0
Transcript of Students engaged in proving - ERIC - Department of Education


PME31―2007 4-ii
Proceedings of the 31st Conference of the
International Group for the Psychology of Mathematics Education
Volume 4
Editors
Jeong-Ho Woo, Hee-Chan Lew
Kyo-Sik Park, Dong-Yeop Seo
The Korea Society of Educational Studies in Mathematics
The Republic of Korea
The Proceedings are also available on CD-ROM
Copyright © 2007 left to the authors
All rights reserved
ISSN 0771-100X
Cover Design: Hyun-Young Kang

PME31―2007 4-iii
TABLE OF CONTENTS
VOLUME 4
Research Reports
Na, GwiSoo & Han, DaeHee & Lee, KyungHwa & Song, SangHun 4-1
Mathematically Gifted Students’ Problem Solving Approaches
on Conditional Probability
Nachlieli, Talli & Herbst, Patricio 4-9
Students Engaged in Proving - Participants in an Inquiry Process or
Executers of a Predetermined Script?
Noh, Jihwa & Kang, Ok-Ki 4-17
Exploring the Idea of Curriculum Materials Supporting
Teacher Knowledge
Novotná, Jarmila & Hošpesová, Alena 4-25
What is the Price of Topaze?
Ohtani, Minoru 4-33
Designing Unit for Teaching Proportion Based on Cultural-Historical
Activity Theory: Process of Symbolizing through Collective Discourse
Okazaki, Masakazu & Fujita, Taro 4-41
Prototype Phenomena and Common Cognitive Paths in the
Understanding of the Inclusion Relations between Quadrilaterals
in Japan and Scotland
Olson, Melfried & Olson, Judith & Okazaki, Claire 4-49
A Study of Gender Differences in Language Used by Parents
and Children Working on Mathematical Tasks
Pantziara, Marilena & Philippou, George 4-57
Students’ Motivation and Achievement and Teachers’ Practices
in the Classroom
Peled, Irit & Meron, Ruth & Rota, Shelly 4-65
Using a Multiplicative Approach to Construct Decimal Structure

PME31―2007 4-iv
Perger, Pamela 4-73
If You Don’t Listen to the Teacher, You Won’t Know What to Do:
Voices of Pasifika Learners
Presmeg, Norma & Barrett, Jeff & McCrone, Sharon 4-81
Fostering Generalization in Connecting Registers of Dynamic Geometry
and Euclidean Constructions
Proulx, Jérôme 4-89
Addressing the Issue of the Mathematical Knowledge
of Secondary Mathematics Teachers
Rivera, F. D. & Rossi Becker, Joanne 4-97
Abduction in Pattern Generalization
Roh, Kyeong Hah 4-105
An Activity for Development of the Understanding
of the Concept of Limit
Rojano, Teresa Ceballos & Perrusquía, Elvia Máximo 4-113
Early Access to Algebraic Ideas: The Role of Representations and
of the Mathematics of Variation
Rolka, Katrin & Rösken, Bettina & Liljedahl, Peter 4-121
The Role of Cognitive Conflict in Belief Changes
Rossi Becker, Joanne & Rivera, F. D. 4-129
Factors Affecting Seventh Graders’ Cognitive Perceptions
of Patterns Involving Constructive and Deconstructive Generalizations
Ryu, HyunAh & Chong, YeongOk & Song, SangHun 4-137
Mathematically Gifted Students’ Spatial Visualization Ability
of Solid Figures
Safuanov, Ildar S. 4-145
Genetic Approach to Teaching Geometry
Sakonidis, H. & Klothou, A. 4-153
On Primary Teachers’ Assessment of Pupils’ Written Work
in Mathematics

PME31―2007 4-v
Seah, Wee Tiong 4-161
Qualities Co-valued in Effective Mathematics Lessons in Australia:
Preliminary Findings
Sela, Hagit & Zaslavsky, Orit 4-169
Resolving Cognitive Conflict with Peers
- Is There a Difference between Two and Four?
Shimizu, Yoshinori 4-177
Explicit Linking in the Sequence of Consecutive Lessons
in Mathematics Classrooms in Japan
Shinno, Yusuke 4-185
On the Teaching Situation of Conceptual Change:
Epistemological Considerations of Irrational Numbers
Song, SangHun & Yim, JaeHoon & Shin, EunJu & Lee, HyangHoon 4-193
Posing Problems with Use the ‘What If Not?’ Strategy in NIM Game
Stewart, Sepideh & Thomas, Michael O. J. 4-201
Embodied, Symbolic and Formal Aspects of Basic Linear
Algebra Concepts
Suh, Jennifer M. & Moyer-Packenham, Patricia S. 4-209
The Application of Dual Coding Theory in Multi-Representational
Virtual Mathematics Environments
Tsai, Wen-Huan 4-217
Interactions Between Teaching Norms of Teacher’s Professional
Community and Learning Norms of Classroom Communities
Tunç-Pekkan, Zelha 4-225
Analysis of a Learning Case: Jasmine
Walter, Janet G. & Johnson, Christine 4-233
Elementary Teachers’ Linguistic Inventions and Semantic
Warrants for Mathematical Inferences
Wang, Chih-Yeuan & Chin, Chien 4-241
How Do Mentors Decide: Intervening in Practice Teachers’
Teaching of Mathematics or Not

PME31―2007 4-vi
Warren, Elizabeth 4-249
Exploring an Understanding of Equals as Quantitative Sameness
with 5 Year Old Students
Williams, Gaye 4-257
Classroom Teaching Experiment:
Eliciting Creative Mathematical Thinking
Zodik, Iris & Zaslavsky, Orit 4-265
Is a Visual Example in Geometry always Helpful?

2007. In Woo, J. H., Lew, H. C., Park, K. S. & Seo, D. Y. (Eds.). Proceedings of the 31st Conference of
the International Group for the Psychology of Mathematics Education, Vol. 4, pp. 1-8. Seoul: PME. 4-1
MATHEMATICALLY GIFTED STUDENTS’ PROBLEM SOLVING APPROACHES ON CONDITIONAL PROBABILITY1
GwiSoo Na*, DaeHee Han*, KyungHwa Lee** and SangHun Song***
*Cheongju National University of Education / **Korea National University of
Education / ***Gyeongin National University of Education
This research intends to look into how mathematically gifted 6th graders (age12) who
have not learned conditional probability before solve conditional probability
problems. In this research, 9 conditional probability problems were given to 3 gifted
students, and their problem solving approaches were analysed through the
observation of their problem solving processes and interviews. The approaches the
gifted students made in solving conditional probability problems were categorized,
and characteristics revealed in their approaches were analysed. As a result of this
research, the gifted students’ problem solving approaches were classified into three
categories and it was confirmed that their approaches depend on the context included
in the problem.
INTRODUCTION
There are diverse definitions of mathematically gifted students made by many
researchers (e.g., Bluton, 1983; Miller, 1990; Gagne, 1991), but there has been no
agreed definition yet. In this research, the mathematically gifted students are defined,
applying the definition of Gagne (1991), as “students who are distinguished by
experts to have excellent ability and potential for great achievements.” According to
some researches (e.g., Krutetskii, 1976; Sriraman, 2003; Lee, 2005) that observed
and analysed the thinking characteristics of mathematically gifted students, their
problem solving and reasoning are displayed very differently from those of ordinary
students in terms of speed and depth. Krutetskii (1976) confirmed that
mathematically gifted students recognize mathematical principles through
formalization and their ability to grasp the form and the structure of a problem is
excellent. Lee (2005) verified the process in which gifted students make efforts to
advance into the stage of intellectual reasoning that takes the mathematical form,
passing through the practical reasoning and systemic reasoning.
Freudenthal (1973), through the analysis of the history of probability theory, insisted
that solving probability problems correctly in mathematical terms is very difficult.
Researches on the characteristics of probabilistic thinking (e.g., Hari, 2003; Iasonas
& Thekla, 2003) reported the differences between probabilistic thinking and other
mathematical thinking, students’ misconceptions and development paths thereof, etc.
Especially conditional probability has been known as the topic that students have
1 This work was supported by Korea Research Foundation Grant funded by Korea
Government(MOEHRD, Basic Research Promotion Fund) (KRF-2005-079-BS0123)

Na, Han, Lee & Song
PME31―2007 4-2
difficulties in understanding (e.g., Tversky & Kahneman, 1983; Shaughnessy, 1992;
Jones et al., 1999). Shaughnessy (1992), with regard to conditional probability,
reported the misconceptions made by students where they confuse between the
dependency and sequence of events. Tversky & Kahneman (1983) reported a
misconception related to the conjunction that connects two events in conditional
probability.
However, few researches have been made on gifted students’ solving problems on
conditional probability. This paper intends to analyse the approaches showed by 3
gifted students in solving conditional probability problems through case study. A
more specific description of the research questions is as follows:
(1) How to categorize the approaches of gifted students as displayed in solving
conditional probability problems?
(2) What are the characteristics that gifted students display while solving
conditional probability problems?
FRAMEWORK FOR GIFTED STUDENTS’ CONDITIONAL
PROBABILISTIC THINKING
In this research, to categorize the gifted students’ problem-solving approaches on
conditional probability, the frameworks suggested by Jones et al. (1999) were used as
the 1st-stage analysis tool. Jones et al. (1999) divided the characteristics of
conditional probabilistic thinking into four levels: the subjective level, transitional
level, informal quantitative level and numerical level. They explained them as
follows:
Thinking Level Thinking Characteristics
Level 1:
Subjective
- Following one trial of a one-stage experiment, does not give a
complete list of outcomes even though a complete list was given
prior to the first trial
- Recognizes when certain and impossible events arise in non-
replacement situations
Level 2:
Transitional
- Recognizes that the probabilities of some events change in a non-
replacement situation; however, recognition is incomplete and is
usually restricted to events that have previously occurred
Level 3:
Informal
Quantitative
- Can determine changing probability measures in a non-replacement
situation
- Recognizes that the probabilities of all events change in a non-
replacement situation
Level 4:
Numerical
- Assigns numerical probability in replacement and non-replacement situations
- Distinguishes dependent and independent events
Table 1: Framework of Conditional Probability Thinking (Jones et al., 1999, p.489)

Na, Han, Lee & Song
PME31―2007 4-3
METHODOLOGY
Participants
The subjects of this research are three 6th graders (age 12), all of whom are receiving
gifted education in the C-institute for the gifted attached to a national university. This
institute supported by Korean government selects mathematically gifted students
through the written tests and in-depth interviews. Selection of the gifted in the C-
institute is administered by the professors of the department of mathematics
education, and is focused on confirming high intellectual ability, task commitment,
creativity, etc., which Renzulli & Reis (1986) defined as the elements of giftedness.
Accordingly, it can be said that the students who participated in this research are
mathematically gifted as confirmed by experts in mathematics education at C-
institute to have potential for excellent mathematical achievements (c.f., Gagne,
1991).
In Korea, where the curriculum is implemented on a national-level, the basic
concepts of probability are dealt with in the 6th grade (age 12); those about
conditional probability in the 11th grade (age 16). Therefore, the three gifted students
participated in this research in the state that they had learned the basic concepts of
probability at school but had never learned conditional probability concepts.
Procedure
This research deals with the three hours, out of the total 27 hours over 9 weeks of
problem-solving activity of the gifted students, which covers solving conditional
probability problems. In this research, 9 problems related to conditional probability
were given to the 3 gifted students, and they were asked to solve the problems by
themselves and, after solving the problems, to explain their problem solving
approaches in detail; and if deemed necessary, an in-depth interview was conducted.
One of the researchers kept a field note during the three-hour problem solving session.
Each of the three research assistants took charge of one gifted student, observed the
whole problem-solving process and wrote an observation record based on a half-
structuralized checklist that was agreed upon beforehand among researchers. The
researchers and research assistants did not intervene in the students’ problem solving,
and no hint was provided related to problem solving.
Data Collection
Data collection and analysis for this research was made from Oct. 2006 to Dec. 2006.
To ensure the credibility of the data collection and analysis of this research, the
process of problem solving and interview were video/audio recorded. Analysis of the
results of this research was made utilizing data from diverse sources, including the
problem-solving records of the students, field note of the researcher, observation
record of research assistants, video or audio-recorded materials, etc. The reason for
using data from such diverse sources was, in pursuit of the triangulation of data, to
raise the validity of the results of the research.

Na, Han, Lee & Song
PME31―2007 4-4
As for data analysis, with a view to overcome the possible partiality of a certain
researcher, the students’ problem-solving approaches were continuously analysed
until all the four researchers reached an agreement.
Tasks
9 conditional probability problems [Q1], [Q2], … , [Q9] were given to the gifted
students. As the space of this paper being limited, 4 problems are presented here.
[Q2] There are 10 cards in the box on which the figures 1 to 10 are written. When one
randomly took out a card, it was a divisor of 10. Find the probability that this
figure is an even number.
[Q3-Q4] There are 3 white balls and 3 black balls in a bag. After taking out a ball,
without putting it in the bag again, another ball is taken out.
[Q3] When the first ball taken is white, find the probability that second ball is white.
[Q4] When the second ball taken is white, find the probability that the ball taken out
first is white.
[Q5] There are a total of 200 CDs (Compact-Discs), 100 CDs produced by Company X
and 100 CDs produced by Company Y. Of them 2 inferior CDs were made by
Company X and 3 inferior CDs by Company Y. When 3 CDs were taken out from
200 CDs, one was an inferior CD. Find the probability that this inferior CD is
made by Company X.
RESULTS AND DISCUSSION
Research Question 1: Categorization of Gifted Students’ Problem-Solving
Approaches on Conditional Probability
In this research, Jones et al.’s (1999) frameworks were applied as the 1st analysis tool.
However, as a result of analysing the gifted students’ problem-solving approaches,
the framework suggested by Jones et al. was found not to fit to analyse them. The
reason was that the thinking characteristics of Jones et al. was mainly centred on non-
replacement contexts, while in this research, problems that contain diverse contexts
related to conditional probability in addition to non-placement contexts were
suggested to the gifted students. From this, the necessity to reconsider and expand
Jones et al.’s framework to various contexts was found.
For the above-mentioned reason, the researchers draw the 2nd
analysis categories C1,
C2, C3 based on the problem-solving approaches made by the gifted students. For
instance, to the problem, “Find the probability that event B will happen under the
condition that event A happened”, the problem solving approaches that come under
each of C1, C2 and C3 are as follows;
� C1: Ignore the conditional event A and find P(B) considering only event B. (The
mathematical symbol, P(B) represents the probability that event B will happen.);
� C2: Find P(A∩B), the probability that both event A and event B will happen in
the same time.

Na, Han, Lee & Song
PME31―2007 4-5
� C3: Find the conditional probability P(B|A) and suggest a mathematically valid
reason for it. (The mathematical symbol, P(B|A) represents the conditional
probability that event B will happen under the conditional event A happened.)
C1 and C2 are the states where one has failed to grasp the dependency between
events that are contained in a problem – the level that has not reached the Level 4 of
Jones et al. (1999). But it is hard to tell that the problem solving approaches that fall
under C1 or C2 belong to any one of the Levels 1, 2 and 3; rather, it is proper to say
that C1 and C2 fall between the Level 3 and Level 4. C3 is the state where one can
recognize the dependency between events, find the value of conditional probability
correctly and suggest a valid mathematical explanation; and falls under Level 4.
The gifted students’ problem solving approaches are categorized as follows:
ES1 ES2 ES3
1st
Analysis
2nd
Analysis
1st
Analysis
2nd
Analysis
1st
Analysis
2nd
Analysis
Q1 C1 Level 4 C3 Level 4 C3
Q2
Level 3 ~
Level 4 C2 Level 3 ~
Level 4
C2 Level 4 C3
Q3 Level 4 C3 Level 4 C3 Level 4 C3
Q4 C1 Level 3 ~
Level 4
C1 Level 3 ~
Level 4
C2
Q5 C2 Level 4 C3 Level 4 C3
Q6 C2 Level 4 C3 C2
Q7 C2 Level 4 C3
Level 3 ~
Level 4 C2
Q8 C2 Level 4 C3 Level 4 C3
Q9
Level 3 ~
Level 4
C2 Level 4 C3 Level 4 C3
Table 2: Approaches Made by the 3 Mathematically Gifted Students
From this categorization, it can be said that gifted students could recognize
dependency between events in solving problems and get the value of conditional
probability by themselves, even if the student ES1 failed to get the conditional
probability in many problems.
Research Question 2: Characteristics of Gifted Students’ Problem-Solving
Approaches on Conditional Probability
(a) Gifted students’ dependence on the context included in the problem
Each gifted student displayed different thinking approaches for each different
problem according to the context included in the problem (Refer to [Table 2]). Each
gifted student clearly recognized the dependency between events in some contexts
but failed to recognize it in other contexts. For instance, ES2 displayed the

Na, Han, Lee & Song
PME31―2007 4-6
approaches that fall under C2 as to [Q2], but he displayed the approaches that fall
under C3 as to [Q3]. The problem solving approaches ES2 suggested as to [Q2] and
[Q3] are as follows:
ES2 [Q2]: The probability is 1/5. Of the 10 cards, the figures that satisfy the conditions of a divisor of 10 and an even number are 2 and 10. And the probability that the cards 2 and 10 will be taken out is 2/10=1/5.
ES2 [Q3]: After taking out a white ball first, 2 white balls and 3 black balls are left. So, the total number is 5, and there are 2 white balls. Accordingly, the probability is 2/5.
As to [Q2], ES2 failed to recognize that the event “an even number is taken out” is
dependent on “a divisor of 10 was taken out.” On the other hand, regarding [Q3], he
recognized that the event “second ball is white” is dependent on “the first ball taken
is white” and got the correct value of conditional probability.
(b) Qualitative differences between gifted students in solving problems
The three gifted students each displayed qualitative differences in solving conditional
probability problems (Refer to [Table 2]). ES1 failed to grasp the dependent events
contained in the problems and tried to solve them applying the basic probability
concepts he had already learned at school. In 8 out of the 9 problems he failed to
recognize the dependent events and employed the problem solving approaches that
belong to C1 or C2. On the other hand, ES2 and ES3 grasped the dependency
between events contained in the problems, and succeeded in solving 6 or 7 of the 9
problems. They tried to understand the contexts included in the problems, instead of
applying the basic probability concepts they had learned at school. However, some
differences were found between ES2 and ES3 in the contexts of problems where each
of them could recognize the dependent events and get the conditional probability
value. For instance, though both ES2 and ES3 got the correct conditional probability
values for [Q1], [Q3], [Q5], [Q8], [Q9], but in the case of [Q2], [Q4], [Q6], [Q7],
they recognized the dependency between events differently.
(c) Difficulty in distinction between dependency and sequence of events
[Q4] was the only problem out of the 9 problems that all the three gifted students
failed to solve (Refer to [Table 2]). The problem solving approaches to [Q4] of ES1,
ES2, and ES3 are as follows:
ES1 [Q4]: Even if you know the colour of the ball that was taken out second, you can’t know the colour of the ball taken out first. Therefore, 3/6=1/2.
ES2 [Q4]: No matter which-coloured ball is taken out at the second time, there are three white balls and three black balls at the first time. So the probability is 3/6 = 1/2.
ES32 [Q4]: (2/5) multiply (3/6) =1/5.
Student ES1 and ES2 ignored the conditional event “the ball taken out second is
white” for the reason that it happened second. They found only the probability that
the ball taken out first is white. Student ES3 found the probability that the ball taken

Na, Han, Lee & Song
PME31―2007 4-7
out first is white and the one taken out second is white. All the three gifted students
had difficulty in distinguishing between the sequence and the dependency of events.
This result is consistent with the representative misconception related to conditional
probability that was reported by Shaughnessy (1992). From this, it can be drawn that
the biggest difficulty students go through in relation to conditional probability
concept is distinguishing between the sequence and the dependency of events.
(d) Consideration of the formal instruction of Bayes Formula
In Korea, when conditional probability is dealt with in the 11th grade (age 16) in
regular class, it is focused on the Bayes Formula. But the gifted students, who
participated in this research without having learned conditional probability at school,
solved the conditional probability problems applying different approaches from
Bayes Formula. For instance, problem-solving approaches made by ES2 and ES3 to
[Q5] are as follows:
ES2: Since the problem asks the company that made the inferior CD, we do not need the probability that an inferior CD will be taken out. So, [the number of inferior CD made by X company / the total number of inferior CDs] = 2/5.
ES3: 2/5. Since one inferior CD has been taken out already, we need to consider only [the inferior CD made by X Company / total number of inferior CDs].
ES2 and ES3 grasped at once the conditional event, “one inferior CD has been taken
out” and got the conditional probability value 2/5. [Q5] is a typical problem dealt
with in the mathematics textbook of the 11th grade in Korea. In the textbook, the
problem solving process that uses Bayes formula is suggested as follows:
ES2 and ES3, not knowing Bayes Formula, utilized a much finer solution by grasping
the dependency between events that are contained in the context of the problem.
From this, the necessity to give careful consideration to the teaching method of
conditional probability in regular class in Korea was found.
CONCLUSION
As a result of this research, gifted students’ problem solving approaches were
classified into three categories and it was confirmed that their approaches depend on
the context included in the problem. Also it was confirmed that gifted students could
get the value of conditional probability in solving problems by themselves. From this
research, a suggestion on the education of the gifted can be drawn that it is more
desirable to suggest problems that contain plenty of mathematical contexts and have
students find mathematical concepts and principles in the process of solving them by
themselves rather than to directly teach the problem solving approaches to them.

Na, Han, Lee & Song
PME31―2007 4-8
While, the necessity to reconsider and expand Jones et al.’s (1999) framework to
various context was revealed. And the necessity to give careful consideration to the
teaching method of conditional probability in regular class in Korea was revealed.
The investigations on these issues are needed in future research.
References
Bluton, C. (1983). Science Talent: The Elusive Gift. School Science and Mathematics, 83(8).
654-664.
Freudenthal, H. (1973). Mathematics as an Educational Task. Dortrecht, The Netherlands:
D. Reidel Publishing Company, 581-614.
Gagne, F. (1991). Toward a differentiated Model of Gifted and Talent. In Colangelo N. &
Davis G. A. (Eds.), Handbook of Gifted Education. Boston: Allyn and Bacon, 65-80.
Hari, P. K. (2003). Secondary School Mathematics Pre-service Teachers' Probabilistic
Reasoning in Individual and Pair Settings. In Pateman, N. A., Dougherty, B. J., & Zilliox,
J. (Eds.), Proc. 27th Conf. of the Int. Group for the Psychology of Mathematics Education
(Vol 3. pp.149-155). Honolulu, USA: PME.
Iasonas, L., & Thekla, A. L. (2003). The Probabilistic Thinking of Primary School Pupils in
Cyprus - The Case of Tree Diagrams. In Pateman N. A., Dougherty, B. J., & Zilliox, J.
(Eds.), Proc. 27th Conf. of the Int. Group for the Psychology of Mathematics Education
(Vol 3. pp.173-180). Honolulu, USA: PME.
Jones, G. A., Langrall, C. W., Thornton, C. A., & Mogill, A. T. (1999). Students'
Probabilistic Thinking in Instruction. Journal for Research in Mathematics Education,
30(5), 487-521.
Krutetskii, V. A. (1976). The Psychology of Mathematical Abilities in Schoolchildren.
University of Chicago Press.
Lee, K. H. (2005). Mathematically Gifted Students' Geometrical Reasoning and Informal
Proof. In Helen L. C. & Jill, L. V. (Eds.), Proc. 29th Conf. of the Int. Group for the
Psychology of Mathematics Education (Vol 3. pp.241-248). Melbourn, AUSTRALIA:
PME.
Miller, R. C. (1990). Discovering Mathematical Talent. ERIC E482. Office of Educational
Research and Improvement. Washing, D.C.
Renzulli, J. S. & Reis, S. (1986). The Schoolwide Enrichment Model: A Comprehensive
Plan for Educational Excellence. Mansfield Center, CT: Creative Learning Press.
Shaughnessy, J. M. (1992). Research in Probability and Statistics: Reflections and
Directions. In Douglas A. Grows (Ed.), Handbook of Research on Mathematics
Teaching and Learning. New York, NY: Macmillan Publishing Company, 465-494.
Sriraman, B. (2003). Mathematical Giftedness, Problem Solving, and the Ability to
Formulate Generalizations: The Problem-Solving Experiences of Four Gifted Students.
Journal of Secondary Gifted Education, 14, 151-165.
Tversky, A., & Kahneman, D. (1983). Extensional versus intuitive reasoning: The
conjunction fallacy in probability judgement. Psychological Review, 90, 293-315.

2007. In Woo, J. H., Lew, H. C., Park, K. S. & Seo, D. Y. (Eds.). Proceedings of the 31st Conference of
the International Group for the Psychology of Mathematics Education, Vol. 4, pp. 9-16. Seoul: PME. 4-9
STUDENTS ENGAGED IN PROVING - PARTICIPANTS IN AN
INQUIRY PROCESS OR EXECUTERS OF A PREDETERMINED
SCRIPT?
Talli Nachlieli and Patricio Herbst
University of Michigan
Is making an assumption and proceeding with the proof an acceptable action? We
used a video from a class in which a teacher encouraged a student to do this to
prompt conversations amongst high school geometry teachers. In their reactions,
teachers made explicit tacit norms that regulate the situation of engaging students in
proving in US geometry classrooms. By analysing the transcripts of those
conversations we found that teachers perceive the development of a proof on the
board as the involvement of students in two kinds of mathematical work:
Participation in the inquiry process of producing a proof and presentation of the end-
product of such process. Those interpretations attest to competing dispositions to
handle the norm that one should not make extra assumptions when doing a proof.
INTRODUCTION AND PURPOSE
Consider the following episode from a high school geometry lesson in which a
student at the board was trying to prove that the angle bisectors of a parallelogram
make a rectangle. As he was going through the proof, Eamonn stated that the angle
bisectors of opposite angles are parallel. However, he could not justify that statement
with a corresponding reason, as expected in a two-column proof. At that moment, the
following conversation between Eamonn and the teacher took place:
[1] Eamonn: But I'm, all I'm saying is I'm stuck on this step.
[2] Teacher: Okay.
[3] Eamonn: Cause after this step it'll be easy. It's just...
[4] Teacher: Oh, so what you're saying is that if you could assume that the lines are parallel you could continue.
[5] Eamonn: Yeah.
[6] Teacher: Why don't we let him go ahead and then we'll complete the details.
The teacher chose to allow the student to make an assumption and continue with the
proof, keeping in mind that the assumption should be justified later ([6]). Was this an
acceptable move for a geometry teacher or did it breach norms a teacher should abide
by when engaging students in proving?
To address this question we have shown edited video clips from the lesson where the
episode above took place to groups of high school geometry teachers who
commented and discussed the episode. We hoped that from the participants' reactions
to the video we could learn about teachers' norms and dispositions in the situation of

Nachlieli & Herbst
PME31―2007 4-10
engaging students in proving in US geometry classes. This work is a part of a larger
research agenda aimed at revealing that which shapes what teachers consider viable
to do in selected instructional situations: The tacit norms around which practitioners
make instructional decisions and the dispositions (categories of perception and value)
that moderate the way that they relate to those norms (Herbst & Chazan, 2003).
THEORETICAL FRAMEWORK
Mathematics teachers have certain obligations that tie them to the subject and the
students they teach. For geometry teachers in the US, these obligations have included
for more than a century the need to teach students how to do proofs (Herbst, 2002b).
The actions that teachers perform in their classes have often been explained with the
assistance of two perspectives. One explains action as structured by obligations
between teacher, student, and subject matter, or alternatively as the execution of
cultural scripts (Brousseau, 1997; Stigler and Hiebert, 1999), and the other explains
action as an expression of goals, beliefs, and knowledge (e.g. Clarke, 1997; Cooney
et al., 1998). We consider those two perspectives to be complementary means of
explaining the strategies that teachers utilize in acting. Yet, as Erickson (2004) notes,
action is constituted by tactical moves whose appropriateness depends as much on the
immediate interactive context as on the longer-term goals that could be accomplished
with the work done. Like other practitioners, geometry teachers possess a “feel for
the game” (Bourdieu, 1998) or practical rationality that enables them to make on the
spot decisions when they participate in specific situations in real time. This practical
reason is articulated in the form of a system of dispositions to act, activated in
specific situations, such as engaging students in proving. These dispositions influence
what a practitioner would consider viable to do as they participate in a situation. The
norms and dispositions that influence teachers’ actions are often tacit for the actors.
However, they can be made explicit by way of confronting practitioners with
instances of practice that in many ways resemble what they usually do but depart
from it in some particular ways (Mehan & Wood, 1975). Accordingly, we elicit the
practical rationality of US geometry teachers by confronting groups of them with
instances of practice that show a teacher acting in ways that, we hypothesize, they
normally would not. Research on secondary teachers’ work on proof has concentrated
on teachers’ individual beliefs and knowledge or on accounting for their actions.
From that work we know that teachers expect students to write geometric proofs in
two columns, justifying every statement with a reason (Knuth, 2002), and that the
default way of producing proofs has each statement followed by its reason (Herbst,
2002a). Hence, we hypothesized that geometry teachers might not consider the action
of the teacher in line [6] to be acceptable. We add to that research by making explicit
norms that are part of the situation of engaging student in proving and detailing the
dispositions that allow teachers to relate to an action that appears to deviate from the
norm.

Nachlieli & Herbst
PME31―2007 4-11
DATA SOURCES AND METHODOLOGY
Our data includes videos and transcripts of five focus group sessions that focused on
engaging students in proving. A total of 26 geometry teachers from 19 different high
schools participated in those sessions, which lasted three hours each. Participants
watched a video of a geometry class in which students were engaged in proving that
the angle bisectors of a parallelogram form a rectangle. In the video, a student claims
that bisectors of opposite angles of a parallelogram are parallel, cannot justify it, and
remarks that he could continue if only he could skip the specific step. To address the
question of whether the teacher’s choice to allow the student to make an assumption
and continue with the proof was viable, as well as to surface norms of the situation of
engaging students in proving and teachers’ dispositions towards those norms, we
used thematic analysis to identify the themes that the teachers chose to discuss in
their reactions to the video and to examine how they talked about them. This analysis
considers how language is used to develop themes (Participants and Processes), and
to relate them to one another (Lemke, 1983). It is based on Halliday’s systemic
functional linguistics (SFL) theory according to which language is a resource for
making meaning through choice. The sets of possible choices in English were
clustered by Halliday in terms of the functions that they serve (and therefore are
called metafunctions): (1) the ideational (what is talked about), (2) the interpersonal
(the way in which language constructs relationships between participants), and (3) the
textual (organization of the text) (Halliday, 1978). Thematic analysis considers the
ideational and textual aspects of the text. To learn about the participants’ attitudes
towards what it is that they saw in the video, we tracked the evaluative orientations of
participants toward the episode, as suggested by their usage of modal verbs, hedges,
and pronouns. Halliday (Halliday & Matthiesen, 2004) identifies four types of
modality: probability (‘may be’), usuality (‘sometimes’), obligation (‘is wanted to’)
and inclination (‘wants to’) (see also Lemke, 1983). The values of those modalities
are presented in Table 1.
Probability Ususality Obligation Inclination
High Certain Always Required Determined
Median Probable Usually Supposed Keen
Low Possible Sometimes Allowed Willing
Table 1: Three values of modality (from Halliday & Matthiesen, 2004, p. 620)
IS MAKING AN ASSUMPTION FORBIDDEN OR DESIRABLE?
Our analysis of the focus groups' transcripts reveals that our participants identified
the action of making an assumption while writing a proof on the board as one that
would not actually happen in class. However, whereas some teachers talked about it
as a desirable action, others considered it undesirable, and yet others referred to it as
forbidden. To explain those differences we sought the themes that the practitioners
referred to in their reactions to the video. The teachers that rejected the making of an
assumption altogether have referred to this choice as one that violates the natural

Nachlieli & Herbst
PME31―2007 4-12
rules according to which a proof should proceed – “Cause that’s how proofs proceed,
right? You have to show something before you can proceed” (Max, 91, FG081704-
G1). That is, the development of a proof should follow precise steps, and allowing
students to make an assumption and continue violates those rules. Some teachers
specified the norms that would be violated if this action took place while proving.
176 Jane … it would certainly be the case with teachers working at home, but is there something un-mathematical about doing it? … unmathematical about doing that in the sense that you should only really work with what you can? Uh …
177 Megan It's sinful.
178 Jake Yeah, yeah [laughter]
179 Mod Why is it sinful?
180 Megan It just goes against, like, what you have learned, that you have this set amount of information, and that's all you can use. You know, we don't do that.
181 Jane Yeah, so you can't use stuff that's coming later to prove something the way before, … because that's not how it's done... (FG051703).
The participants use the words unmathematical and sinful when relating to the choice
of making an assumption while writing a proof on the board. They stress that one of
the rules according to which a proof can proceed is that only “information” that was
previously learnt can be used, and allowing a student to assume that a proposition is
true without justifying it, violates this rule (176, 180, 181). However, while some
teachers considered the choice of making an assumption a forbidden one, others
considered it desirable as it is similar to the process that they themselves experience
while producing a proof at home or when mathematicians write a proof. Erwin, one
of the participants described it as follows:
You know, actually, I think one of the troubles with kids learning proofs is they don’t see
us do proofs. … and what they see us do is, we know proofs …, we start at the beginning
and go to the end. … it would be fun if they could see us work on our own problems that
we don't know how to solve because certainly that’s the case for them. And so to model
something that, you know, where we’re puzzling over, and where do you jump in? … I
think we even pressure kids to start at the beginning and work to the end kind of thing,
and they don’t see us kind of puzzling, stop and pause and ponder. You know, and so
when they get up there and do it, they’re just kind of thinking you're supposed to start at
the beginning, and you’re supposed to be smart enough to know how to get right to the
end. (Erwin, 124, 126, FG112202)
These teachers focus on the process that students engage in while writing a proof on
the board, and stress the differences between that process and the one of producing a
proof by teachers or mathematicians out of the geometry classroom. However, if it is
unmathematical to make an assumption in the process of proving as it violates the
rules according to which a proof is written then why might teachers do it when
proving at home (as Jane states in 176)? We argue that the teachers talk about two
different types of engagement in proving – making explicit the process of producing

Nachlieli & Herbst
PME31―2007 4-13
a proof and thus allowing a student to participate in that process, and presenting the
end-product of such process by writing a predetermined proof. By “a predetermined
proof” we mean not that the student has already written it or knows it in advance; we
rather mean that the proof is known to the teacher who facilitates its writing and thus
controls the sequence and the level of detail of what actually gets written down.
UNDER WHICH CIRCUMSTANCES IS MAKING AN ASSUMPTION
DESIRABLE?
In the previous excerpt discussed, Erwin does not specifically relate to the choice of
making an assumption but rather to the entire process of producing a proof, a process
in which the choice of making an assumption is a natural one. However, most
teachers that reacted to the choice as a desirable one have not talked about the
strategy, but rather about the tactics. They considered the specific circumstances that
would allow for the violation of the linear order in which a proof should be written –
when the student that is standing at the board cannot justify a statement that was just
written. The choice of making an assumption and moving on may serve the purpose
of eliciting responses from students - “I like the idea of moving ahead just to kind of
trigger some more responses” (Edward, 247, FG081704-G1), or of following the
student’s thought process, if she knows how to proceed. In both cases, this choice
allows the teacher to fulfil her role of being sensitive to students’ emotional needs -
“They’re having a tough time formalizing it, and if you stop with that, you could, you
could do more harm in terms of their egos. I can’t find another word for it.” (Martin,
92, FG081704-G2). It seems that in this case, the teachers’ disposition that a teacher
should be sensitive to students’ emotional needs overrides the need for a proof to
proceed linearly. Our participants emphasize that this is not the only possible tactic
that a teacher could take and state other possible choices – asking the other students
in class to justify the statement, departing from writing the proof on the board and
providing time for the students to think of the justification while working in pairs, or
“working backwards” - considering what needs to be proved, and going back, step
by step, inquiring about possible statements that could be useful in making the
argument. Teachers stated that this is a tactic they often follow, unlike the choice of
making an assumption. In our attempts to explain the reasons for the existence of this
last tactic and the lack of the former (making an assumption), we searched for those
norms that align with working on a proof “backwards” that were violated by making
an assumption. One possible explanation to the difference between these two tactics
seems to lie in the teachers’ use of the Process saying when referring to the choice of
working backwards rather than the Process proving or doing a proof that is used
when referring to the actual writing of lines of the proof on the board. As Luis, a
participant in one of our focus groups, described: “we always work backwards…
talking about it backwards and then going back and doing the proof forward” (Luis,
162, FG051703). Choosing this tactic allows for maintaining the linear sequence in
which the proof gets written down, as it involves pausing the writing of the proof on
the board in favor of a verbal discussion. This prevents the violation of the order in

Nachlieli & Herbst
PME31―2007 4-14
which things get written down in the process of proving, unlike the choice of making
an assumption. The norm that is made explicit here is that it is the writing of a proof
on the board that should follow a specific sequence, not necessarily the verbal
discussion. Although the teachers have stressed that making an assumption while
proving could be helpful to the student, they made explicit that this is only in the case
in which the teacher already knows that the statement to be assumed is true. It is the
teacher's duty to protect students from going astray by following a wrong path. Some
teachers made explicit the concern of assuming a statement that is wrong and
specified the stress that students will face once realizing that the assumption they
made is wrong. In case a student faces difficulties in justifying a statement while
proving, if the teacher knows it is true, then it could be assumed. Only statements that
are true may get written down on the board. This strengthens our hypothesis that to
many teachers the situation in which a student writes a proof on the board is not one
of participation in the inquiry process of developing a proof which may include
following a false assumption and realizing its untrue nature only later, but rather a
controlled situation of writing down the end-product of that process.
WHY IS MAKING AN ASSUMPTION NOT DESIRABLE?
Unlike teachers that talked about the circumstances under which an assumption could
be made while writing a proof on the board, some have discussed tensions that could
arise should this choice be made. These tensions regard the students and time.
Students. In their reactions to the video some participants focused on the students
who were not at the board, and considered issues of confusion and of engagement.
They have referred to the lesson presented in the video as a confusing one as a result
of allowing a student to make an assumption thus violating the order by which a
proof is expected to proceed. Students then find it difficult to follow the rationale of
the argument. Others have talked about a tension between the time a student spends
at the board and the engagement of other students in class. What concerned them was
not the mere idea of a student writing a proof on the board but rather the length of
time that the student spent at the board thinking how to continue with the proof.
Time. Some participants talked about a lesson as a time frame by which certain
activities need to start and end. They stated that it is possible, although not desirable,
to end class before a proof is complete, knowing that up to that point all the details
are written and that all that is written is correct. The participants expressed a tension
between their desire to allow students to go on with the proof and the need to prove
the assumption before the class ends - “I like the idea of moving ahead just to kind of
trigger some more responses but maybe only go one step ahead or two steps ahead”
(Edward, 247, FG051703). They wanted to balance allowing students to make an
assumption and the need to prove the assumption before the class ends.
DISCUSSION
We have presented norms of the situation of engaging students in proving and
teachers’ dispositions towards a teacher’s choice to allow a student to make an

Nachlieli & Herbst
PME31―2007 4-15
assumption and continue with the proof while writing a proof on the board, a choice
which we considered unlikely, based on previous studies. Transcript analysis of five
focus group sessions revealed those norms and dispositions from participants'
reactions to a video of a lesson in which such choice was made. Although most
participants confessed that teachers rarely make this choice, their attitudes towards
this move varied. Some considered it desirable as it resembled the work of the
mathematician and allowed focusing on the student who writes the proof, others
regarded it undesirable and even forbidden, as it violates rules of mathematics and
ignored other students. We suggest that although the different attitudes towards the
choice of making the assumption while writing a proof on the board in class could be
attributed to personal preferences, those differences originate in how the teachers
perceive of the situation in which a student writes a proof on the board. Whereas
some teachers see this as a situation in which student participate in the process of
producing the proof, others see it as a presentation of the end-product of this process.
However, even teachers who consider it desirable to engage students in producing the
proof while making explicit the actual process involved do not necessarily engage
students in such process. We hypothesize that the reason for that stems from the fact
that this type of engagement violates obligations between the teacher, students, and
the curriculum. In class a teacher is obligated to a specific curriculum, to all her
students in class and to the time frame available. In the situation of engaging students
in proving, having a student write a predetermined proof on the board allows the
teacher to more easily consider all those constraints. But is this the most that we wish
to yield from this situation of engaging students in proving for the benefit of learning
how to prove geometry statements? Should we want students to also have the chance
to learn the creative process of developing a proof? According to the ‘participation
metaphor’, learning is conceived mainly as a “peripheral participation in a
community of practice” (Lave & Wenger, 1991), and learning mathematics as a
“process of becoming a member of a mathematical community” (Sfard, 1996).
Engaging students in proving while making explicit the end-product only rather than
focusing on both the process and its product may miss the goal of the students
becoming experienced participants in the mathematics discourse. We do not suggest
the process is more important than the product and that the situation of engaging
students in proving the process should always be made explicit. We do suggest that
ignoring the process altogether conspires against creating the opportunity to learn
sought after in engaging students in proving.
REFERENCES
Bourdieu, P. (1998). Practical reason. Palo Alto, CA: Stanford University Press.
Brousseau, G. (1997). Theory of didactical situations in mathematics: Didactique des
mathématiques, 1970-1990. Dordrecht, The Netherlands: Kluwer.
Clarke, D. (1997). The changing role of the mathematics teacher. Journal for Research in
Mathematics Education, 28 (3), 278-308.
Cooney, T., Shealy, B., & Arvold, B. (1998). Conceptualizing belief structures of preservice

Nachlieli & Herbst
PME31―2007 4-16
secondary mathematics teachers. Journal for Research in Mathematics Education, 29 (3),
306-333.
Erickson, F. (2004). Talk and Social Theory. London: Polity Press.
Halliday, M. A. K. & Matthiessen, C. (2004). An introduction to functional grammar.
Hodder Arnold.
Herbst, P. (2002a). Engaging students in proving: A double bind on the teacher. Journal
for Research in Mathematics Education, 33(3), 176-203.
Herbst, P. (2002b). Establishing a custom of proving in American school geometry.
Educational Studies in Mathematics, 49, 283-312.
Herbst, P. & Chazan, D. (2003). Exploring the practical rationality of mathematics teaching
through conversations about videotaped episodes. FLM, 23(1), pp.2-14.
Knuth, E. J. (2002). Secondary school mathematics teachers’ conceptions of proof. Journal
for Research in Mathematics Education, 33(5), 379-405.
Lave, J. and Wenger, E. (1991). Situated Learning: Legitimate Peripheral Participation,
Cambridge University Press, Cambridge.
Lemke, J. L (1998). Resources for Attitudinal Meaning: Evaluative Orientations in Text
Semantics. Functions of Language 5(1): 33-56.
Mehan, H. & Wood, H. (1975). The reality of ethnomethodology. Malabar, FL: Krieger.
Sfard, A. (1996). On acquisitionist metaphor and the participationist metaphor for
mathematics learning. In C. Alsina, et al. (Eds.), Eighth International Congress on Mathematics Education Selected Lectures (pp. 397-412). Seville, Spain: Thales.
Stigler, J. & Hiebert, J. (1999). The Teaching Gap. New York: Free Press.

2007. In Woo, J. H., Lew, H. C., Park, K. S. & Seo, D. Y. (Eds.). Proceedings of the 31st Conference of
the International Group for the Psychology of Mathematics Education, Vol. 4, pp. 17-23. Seoul: PME. 4-17
EXPLORING THE IDEA OF CURRICULUM MATERIALS
SUPPORTING TEACHER KNOWLEDGE
Jihwa Noh and Ok-Ki Kang
University of Northern Iowa / Sung Kyun Kwan University
In addressing the need for teachers to be equipped with the kinds of knowledge of
mathematics needed to teach in the vision of current mathematics education reforms
occurring in the United States, it is important that teachers have support to learn about
and improve them. Curriculum materials seem well situated to provide ongoing
learning opportunities for teachers because curriculum materials are ubiquitous in
classrooms. This paper presents an exploration of the role of teaching experience with
reform-oriented, mathematically-supportive curriculum materials (that have the
potential to be educative for teachers as well as students) in supporting teachers’
learning of mathematics.
PERSPECTIVES
Reform efforts calling for enhancing students’ conceptual understanding and
proficiency place a heavy demand on teachers’ expertise (e.g., Conference Board on
Mathematical Sciences [CBMS], 2001; National Council of Teachers of Mathematics,
1991, 2000). Such a demand has been dramatically increased due to the availability of
reform-oriented curriculum materials that challenge teachers to teach unfamiliar
content in unfamiliar ways. Although university preservice programs and professional
development programs are typical, prominent ways in which teachers acquire and
expand their knowledge base, these supports often fall short of their potential to
develop the kinds of knowledge that is advocated for teachers, partly due to the
practical problems such as insufficient opportunities to explore K-12 mathematical
topics and use of context-independent tasks. More recently, the role of curriculum
materials themselves and their potential to impact teacher learning has been a point of
discussion (Ball & Cohen, 1996; Collopy; 2003; Remillard, 2000; Russell et al, 1995).
These reports suggest curriculum materials can support teachers’ learning in ways that
contribute to establishing contexts where teacher learning takes place, by genuinely
presenting reform ideas about mathematics and embedding informational features for
teachers, along with the usual scope and sequence of instructional activities for
students. This paper presents an investigation that attempted to detect the impact that
curriculum materials might have on teachers’ development of mathematical
knowledge in their own teaching.
Potential Support of Reform-Oriented Curriculum Materials for enhancing
Teacher Knowledge
Although reform materials have incorporated specific aspects of reform
recommendations in diverse ways (emphasizing different themes or activities), those

Noh & Kang
PME31―2007 4-18
materials share certain qualities that have the potential to be educative for teachers
(that thus distinguish them from traditional mathematics textbooks) in at least two
important ways. First, reform-oriented curricula take a novel approach to content by
emphasizing reasoning, problem solving, and modeling where students are encouraged
to make sense of the mathematics they are learning and to use procedures that they
understand. This approach likely contributes to teacher learning as well as student
performance. While evidence about the positive impact of reform curricula on
students’ learning of mathematics has been extensively documented (Senk &
Thopmson, 2003), studies that focus on the impact of those curricula in supporting
teachers learning are much needed. Second, reform-oriented curricula offer extensive
information for teachers such things as importance of particular content, different ways
of representing a mathematical topic, various strategies students may use and why they
work, relationships to other topics, and sample dialogue a teacher may have with
students on a particular mathematical idea.
METHODOLOGY
The investigation presented in this paper is part of a larger descriptive study that
investigated high school and middle school mathematics teachers’ mathematical
content and pedagogical content knowledge of rate of change (in the context of algebra
and functions) while they were utilizing reform-oriented curriculum materials. Due to
the space constraints of this paper, this paper focuses on findings associated with high
school teachers’ mathematical content knowledge of rate of change.
A Guiding Framework for Assessing Rate of Change Knowledge
To depict teachers’ mathematical knowledge of rate of change, this study employed
Shulman’s conceptualization of teacher’s content knowledge (Shulman, 1986).
Content knowledge, according to Shulman, is “the amount and organization of
knowledge . . . in the mind of teachers” (p. 9). Included in this category are both facts
and concepts in a domain, but also why facts and concepts are true, and how
knowledge is generated and structured in the discipline.
Articulating Shulman’s notion of content knowledge and synthesizing various relating
frameworks used by others (e.g., Stump, 1997; Wilson, 1994) and current reform
recommendations (e.g., CBMS, 2001; NCTM, 2000), a guiding framework was
designed and used for this study to provide a comprehensive guide for what it means to
know rate of change. In the framework, rate of change knowledge was elaborated in
three contexts: use and interpretation of multiple representations (tabular, graphic,
symbolic, and verbal form) and connections among them, linear connections (e.g.,
making connections between average rate of change and instantaneous rate of change),
and modeling (i.e., being able to analyze data, interpret results, make predictions from
data, and generalize a method that can be used and adapted to find solutions to
problems in a range of contexts that exhibit a rate of change). The mathematical
understanding of rate of change across these contexts is a continuum beginning with
basic concepts involving simple rate of change ideas to deeper and more-connected

Noh & Kang
PME31―2007 4-19
understandings. See Noh (2006) for detailed elaboration of each of the components in
the framework.
Teachers
The teachers discussed in this paper are twelve high school teachers in a mid-west state
of the United States. These teachers had varying levels of teaching experience with one
of the NSF-funded reform curricula, Contemporary Mathematics in Context: A Unified
Approach [CMIC] (which emphasizes change as a central theme), ranged from half a
year to ten years with a median of five years. The years of teaching (in general) for
these teachers range from half a year to thirty seven years. For the purpose of the
comparison among teachers, these teachers were coded as: 1) HE for teachers with
extensive CMIC teaching experience, 2) ME for teachers having a moderate amount of
experience teaching CMIC, and 3) LE for teachers with the least amount of experience
teaching CMIC. Three LE teachers, five ME teachers and four HE teachers were
identified.
Data Collection and Analysis
All twelve teachers were individually interviewed using a set of six mathematical
problems selected based on the guiding framework. (See Figure 1 for sample
problems.) During the interviews, teachers were asked to think aloud as they
completed the problems and responses were audiotaped and later transcribed. A subset
of four teachers (two LE teachers and two HE teachers) from the group of 12 was
observed while they taught units where the focus on rate of change was central, to
further investigate their knowledge of rate of change and differences among teachers.
The four teachers were purposefully selected, with the potential to provide the greatest
contrast in experience levels using CMIC. Classes and follow-up interviews were
audiotaped and later transcribed. Initially, individual teacher’s data were examined.
Then, a comparison was made among the three groups of teachers.
RESULTS AND DISCUSSION
Although data were collected from individual teachers, the results and relevant
discussion are reported by emerged themes rather than by individuals.
Overall Patterns among All Teachers
Teachers demonstrated a similar understanding in situations involving constant (or
nearly constant) rate of change and varied understanding in situations involving
non-constant rate of change. In situations involving constant rate of change, teachers
demonstrated flexibility in their thinking about and ability to describe change/rate of
change using a variety of types of representations—tables, graphs, equations and
verbal descriptions. In CMIC, use of multiple representations is consistently required
in many problems using the prompts: make a table, make a graph, write a rule, and
write NOW-NEXT equation. Based on this study, it appears that such an approach
helped teachers understand the importance of using different representations and view
rate of change in multiple ways.

Noh & Kang
PME31―2007 4-20
1. Suppose that a laboratory experiment uses fruit flies that double in number every five
days. If the initial population contains 100 flies, the number at any time t days into the
experiment will be modeled by the function with the rule P(t) = 100(20.2t
).
Use the function rule above to answer these questions as accurately as possible.
(a) What is the average growth rate of the population (flies per day) from day 0 to
day 20?
(b) What are the estimated rates at which the fly population will be growing on day 10
and on day 20?
(c) How are the growth rates calculated in parts (a) and (b) shown in the shape of a
(t, P(t)) graph?
2. What can you tell about the behavior of the original function f(x) from the behavior of
its derivative function f´(x) illustrated below? Be as complete as possible in your
response.
Figure 1: Sample problems used in the task-based interview
In situations involving non-constant rates of change, teachers’ levels of understanding
of multiple representations differed. All teachers were able to distinguish between
constant and non-constant rates of change and construct representations to recognize
patterns of change. Most teachers demonstrated the ability to move between various
representations. These teachers were the most flexible in moving from graphs to words
and the least flexible in moving from one type of graph to another. Inferring graphs of
rate of change from graphs of accumulated quantities proved to be difficult for most
teachers. Teachers often confused the slope of the tangent line of the derivative
function as the rate of change of the original function. Making connections between
average rate of change and instantaneous rate of change appeared to be the most
challenging area to understand. Many teachers held a very procedural understanding of
the derivative.
Context played an important role with regard to the teachers’ ability to explore rate of
change. More teachers were able to interpret situations involving non-constant change
when they were embedded in a context-rich setting. For example, teachers were more
accomplished in discussing average rate of change and instantaneous rate of change

Noh & Kang
PME31―2007 4-21
and their connection in a contextualized problem such as the fruit fly population
problem shown in Figure 1.
There was only one ME teacher who “gave up” when completing the task-based
interview, due to the teacher’s insufficient understanding of mathematics. The teacher
consistently had difficulty discussing rate of change in nonlinear situations, and in fact,
was not successful with any of the problems involving non-constant rates of change
that he attempted to solve. This may also relate to the fact that the teacher has taught
only the first course of the CMIC series for several years, and deeper treatment of
non-constant situations are explored in the later CMIC courses. This may suggest that
there have been limited opportunities for this teacher to develop his understanding of
situations involving non-constant rates of change.
Comparison among LE, ME and HE Teachers
HE teachers demonstrated a strength at working with contexts involving non-constant
rate of change and the concept of derivative, not exhibited by the LE or ME groups.
These teachers approached problems in a sense-making way using their understanding
of rate of change in linear relationships. Teachers who had more experience using
CMIC were more apt to use graphs to describe non-constant rates of change, while LE
teachers demonstrated a strong tendency to analyze information on tasks using tables
and equations.
LE teachers and some ME teachers demonstrated a weakness in understanding
instantaneous rate of change. They did not seem to recognize that finding a rate of
change depends on treating the curve as if it were a series of very short line segments
that approximate the curve. For them, it was necessary to have two points or know the
symbolic rule for the derivative function to find instantaneous rates of change.
Although HE teachers demonstrated a deeper and more well-connected understanding
of ideas involving the concept of derivative than most of the other teachers, one of the
observed HE teachers did not demonstrate the recognition of the effect of a second
derivative function on the rate of change in its original function. This suggests that HE
teachers may also exhibit gaps in their understanding of rate of change and that certain
aspects of derivative remain challenging.
An error in viewing a graph as a picture of an event instead of depicting a relationship
between two variables was demonstrated by some LE and ME teachers on the
task-based interview and one HE teacher during classroom teaching. This HE teacher’s
error did not surface when he was interviewed. This may suggest that this teacher’s
graphical ideas of rate of change is not thorough and, more generally, that teaching
demands more mathematical flexibility in order to use such knowledge in practice as
teachers need to readily unpack their own knowledge to understand mathematical ideas
being discussed in classrooms.
Some differences demonstrated among teachers’ understanding may be due to their
levels of experience using CMIC, indicating that the development of knowledge of rate
of change may be enhanced by the use of curriculum materials that contain rich

Noh & Kang
PME31―2007 4-22
connections among different rates of change through various representations, such as
those in the CMIC curriculum. However, some of the misconceptions displayed by HE
teachers (and also noted by others (e.g., Monk & Nemirovsky, 1994; Porzio, 1997))
also suggest that additional work may be required, regardless of how the concepts are
developed in a particular curriculum.
CONCLUSION
This study hoped to detect the role that curriculum materials might play in offering
learning opportunities beyond those of typical teacher education experiences. There is
no question that teachers also learn from professional development programs as well as
from teaching experience in general. This study does not claim that teaching
experience with such a curriculum is the factor that really impacts teachers’ learning,
as resulted in the differences in teacher knowledge of rate of change presented in this
paper. Rather, curriculum was used as a context for investigating teachers’ knowledge
to explore its influence on the knowledge teachers possess. The findings of this study
suggest that reform-oriented curriculum materials may support teachers as they learn
ideas involving rate of change as they teach them.
References
Ball, D. L., & Cohen, D. K. (1996). Reform by the book: What is--or might be--the role of
curriculum materials in teacher learning and instructional reform? Educational Researcher,
25(9), 6-8, 14.
Conference Board on Mathematical Sciences. (2001). The mathematical education of
teachers. Washington, DC: Author.
Collopy, R. (2003). Curriculum materials as a professional development tool: How a
mathematics textbook affected two teachers’ learning. Elementary School Journal, 103,
287-311.
Contemporary Mathematics in Context: A Unified Approach (2003). Columbus, OH:
Glencoe/McGraw-Hill.
Monk, G. S., & Nemirovsky, R. (1994). The case of Dan: Student construction of a functional
situation through visual attributes. CBMS Issues in Mathematics Education, 4, 139-168:
American Mathematical Society.
National Council of Teachers of Mathematics. (1991). Professional standards for school
mathematics. Reston, VA: Author.
National Council of Teachers of Mathematics. (2000). Principles and standards for school
mathematics. Reston, VA: Author.
Noh, J. (2006). The impact of teaching experience with reform curriculum materials on
teacher learning. Paper presented at the Annual Meeting of the American Educational
Research Association, Chicago, Illinois.
Porzio, D. T. (1997). Effects of different instructional approaches on calculus students'
understanding of the relationship between slope, rate of change, and the first derivative. In
J. A. Dossey & J. O. Swafford & M. Parmantie & A. E. Dossey (Eds.), Proc. 19th Conf. of

Noh & Kang
PME31―2007 4-23
the North American Chapter of the International Group for the Psychology of
Mathematics Education (Vol. 1, pp. 37-44). Bloomington-Normal, IL.
Remillard, J. T. (2000). Can curriculum materials support teachers’ learning? Two
fourth-grade teachers’ use of a new mathematics text. Elementary School Journal, 100,
331-350.
Russell, S. J., Schifter, D., Bastable, V., Yaffee, L., Lester, J. B., & Cohen, S. (1995).
Learning mathematics while teaching. In B. S. Nelson (Ed.), Inquiry and the development
of teaching: Issues in the transformation of mathematics teaching (pp. 9-16). Newton,
MA: Center for the Development of Teaching.
Senk, S. L., & Thompson, D. R. (2003). Standards-based school mathematics curricula:
What are they? What do students learn? Mahwah, NJ: Lawrence Erlbaum.
Stump, S. L. (1997). Secondary mathematics teachers' knowledge of the concept of slope.
Paper presented at the Annual Meeting of the American Educational Research Association,
Chicago, Illinois.
Wilson, M. S. (1994). One preservice secondary teachers understanding of function: The
impact of a course integrating mathematical content and pedagogy. Journal for Research
in Mathematics Education, 25, 346-370.

2007. In Woo, J. H., Lew, H. C., Park, K. S. & Seo, D. Y. (Eds.). Proceedings of the 31st Conference of the International Group for the Psychology of Mathematics Education, Vol. 4, pp. 25-32. Seoul: PME. 4-25
WHAT IS THE PRICE OF TOPAZE?
Jarmila Novotná, Alena Hošpesová
Charles University in Prague, University of South Bohemia České Budějovice
Abstract: In this paper we study the influence of Topaze effect on 14-15 year old
students’ learning in a sequence of mathematics. We use transcripts of interaction
between the teacher and her students and statements of the students and the teachers
from post-lesson interviews to document both the teacher’s pedagogical beliefs
leading to the effect and the consequences of overuse of Topaze effect on quality of
students’ understanding of mathematics.
“If we consider the intimate sphere of everyday discourse in mathematics classroom, we can discover patterns and routines in the lessons’ micro-structures which constitute the “smooth” functioning of the classroom discourse, while nevertheless having undesirable consequences for the pupils’ learning behaviour.”
Voigt (1985, p. 71)
RATIONALE OF THE STUDY
Learning mathematics is viewed as a discursive activity (Forman, 1996). It is broadly accepted that the social dimension of learning influences individual’s ways of acquiring and using knowledge of mathematics. Environmental effects on learning mathematics are e.g. explained using Brousseau’s concept of didactical contract presented in the 1980s, i.e. the set of the teacher’s behaviours (specific to the taught knowledge) expected by the student and the set of the student’s behaviour expected by the teacher. It equally concerns subjects of all didactical situations (students and teachers). This contract is not a real contract; in fact it has never been ‘contracted’ either explicitly or implicitly between the teacher and students and its regulation and criteria of satisfaction can never be really expressed precisely by either of them. (Brousseau, 1997; Sarrazy, 2002)
The interplay of relationships and constraints between the teacher and students may also produce certain unwanted effects and developments that can be observed (e.g. the Topaze effect, the Jourdain effect, metacognitive shift, the improper use of analogy). (Brousseau, 1997) They are inappropriate for the learning (especially from the metacognitive point of view) but often inevitable (Binterova et al., 2006). It is more their systematic use that is detrimental. In our analysis of videotaped lessons we will focus on the Topaze effect. Its occurrence in a teaching unit influences significantly the quality of the envisaged learning process.
Topaze effect
The Topaze effect can be described as follows: When the teacher wants the students to be active (find themselves an answer) and they cannot, then the teacher disguises the expected answer or performance by different behaviours or attitudes without

Novotná & Hošpesová
PME31―2007 4-26
providing it directly. In order to help the student give the expected answer, the teacher ‘suggests’ the answer, hiding it behind progressively more transparent didactical coding. During this process, the knowledge, necessary to produce the answer, changes. (Brousseau, 1997)
In most cases, the use of Topaze effect is accompanied by lowering of intellectual demands on students (lowering of intellectual demandingness of the given tasks). It is a reaction, an action or an answer that is expected from students. Understanding is not checked. The teacher replaces explanation by a hint.1
Let us illustrate what we perceive as manifestations of Topaze effect using a teaching episode from teaching of linear equations in the 8th grade (students aged 14, 15). The students’ task was to solve the following word problem: In a laboratory, 2l of 30-percent solution of sulphuric acid is mixed with 4.5 l of 50-percent solution of sulphuric acid. What percent solution is created? The transcript of the episode comes from the initial phase of the solving process. The teacher, guided by in the Czech Republic deep-rooted methodology of solving word problems led the students through analysis of the problem and its brief record. A brief written record of the word problem as the first step is, with very few exceptions, used by all teachers in the Czech Republic. This method imitates word problem solving carried out by experts (Odvárko et al., 1999; Novotná, 2000) and is widespread in Czech schools.
In our teaching episode, the teacher wrote the record of the given data on the blackboard on her own, without any effort to activate her students. Only then did she try to involve them in the activity. However, the effect of her questions was not that her students would look for the data needed for the problem solving and their coherence, which was crucial in this phase of the solving process. Answers to her questions only needed retrieval and reproduction of data from the wording of the problem. The teacher wanted to activate the students but was not patient enough. Application of Topaze effect secured smooth progress of the solving process. The teacher formulated the questions in such a way that the students had no chance to influence its direction. Her aim seems to have been to secure that each step of mathematization of the word problem is understood by the students.
That is why we perceive this teaching episode as a manifestation of the Topaze effect. The students did not search for a structure in the assigned data, they only reacted to the teacher’s questions. We present here a relatively long extract with the aim to illustrate that what is at stake here in not just one isolated question but the teacher’s
1 In mathematics teaching and learning, explanations play an important role. Traditionally, explanation belongs to monological teaching methods where the information is transmitted in the direction teacher to students. In this perspective, explanation is seen as the task fulfilled by the teacher with students passively receiving what is presented. In (Levenson, Tirosh, Tsamir, 2006), explanation is seen in a much broader sense: An explanation can be given by students and teachers as a means for clarification of their mathematical thinking that they consider not clear to the others.

Novotná & Hošpesová
PME31―2007 4-27
strategy as a whole. The places which are in our opinion manifestations of the Topaze effect are printed in bold letters.
601 Teacher (from now on T):
So what? 2 l, that is an important piece of data. And with it goes 30 %, see, and thirty percent acid. And 4 and a half and with it goes fifty percent acid. What percent solution is created? Let’s
complete the third line.
602 Lenka: That is x.
603 T: And how much of it is there, Denisa? 604 Denisa: 6,5
605 T: So I can write it down there. (The teacher finishes her record on the blackboard.)
606 T: So. Now we have an unknown and we will have to make an equation. What will we equate with what? .... What does
thirty percent acid mean in fact? Or fifty. Well? 607 Student: Concentration.
608 T: Pardon? Concentration. To put in other words, what is it ... Dddddd... Di ... Dilution, isn’t it? There is some chemical and the remainder is ...
609 Students: water
610 T Yes. And when we mix it … 611 Student: New dilution is created
612 T: New dilution. And that which was added, that of the different concentration, you see, and that which was added from the first liquid, the chemical substance, and from the other, must in the end be in the result, mustn’t it? (She imitates by gestures pouring of two liquids into one container.) So what will be equated, what? ... The pure chemical substance, not the concentration, but the chemical substance. So, how much of it is there in the first
liquid, Vojta? Say, how much, Vojta? 613 Student: Thirty percent.
614 T: Thirty percent. How much of this is 30 %? (She points at the item “2l” in the record on the blackboard.) How can this be
calculated? Lucka. 615 Lucka: 0.6 616 T: Yes, but how did you come to it? I would prefer to have it
written, you see, to… 617 Lucka: 30 % in one litre is 0.3. 618 T: Aha. How do we calculate 30 % of anything? Vojta.

Novotná & Hošpesová
PME31―2007 4-28
619 Vojta: Divided by 100, times 30.
620 T: OK. Now to avoid division, it is always better to avoid it wherever possible, it will be
621 Student: Times 0.3.
622 T: Times 0.3, yes. So it is 0.3 times 2 litres, is it? Written it down so that everybody can see how we got it. Which is exactly what you said, that was correct, 0.6, yes. So how do we calculate 50%
from the other liquid?
The consequences can be seen in the following sequence which is basically routine solving of the problem arising from mathematization. The teacher well aware of the students’ passivity says: “You only copy it. I can see that very few of you are making any calculations.” It is due to the Topaze effect that the teacher, instead of asking for mathematization of the wording of the problem (i.e. its translation from common language to the language of mathematics), contented herself with simple expression with the help of decimal numbers.
OUR RESEARCH
Research questions
To be able to study the influence of Topaze effect on students’ learning, our decision was to start by attempting to answer the following questions: How does Topaze effect reflect teacher’s beliefs? How does Topaze effect influence students’ work?
Method
Data for this study were gathered in the 8th grade (students aged 14-15) of a junior secondary grammar school, the alternative to more academic education. The framework was based on the method used in Learner’s Perspective Study (LPS) (Clarke, 2001). A significant characteristic of LPS is its documentation of the teaching of sequences of lessons. This feature enables to take into account the teacher’s purposeful selection of instructional strategies. Another important feature of LPS is the exploration of learner practices. LPS methodology is based on the use of three video-cameras in the classroom supplemented by post-lesson video-stimulated interviews (Clarke, Keitel, Shimizu, 2006). What is vital here is that all interviews be held immediately after the lesson. They enable revelation of the teacher’s beliefs.
Our experiment
In the following text, we will call experiment the ten consecutive lessons on linear equations in one eighth grade classroom together with post-lesson interviews. The length of one lesson is 45 minutes. The experiment was video-recorded, transcribed and analysed in order to localise Topaze effect. (The teaching episode commented above was from Lesson 6, 28:00 – 31:50)
The experiment was carried out in a school in a county town with approximately 100 000 inhabitants. The chosen teacher was recommended for the experiment by the headmaster. The observed teaching is rated as ‘outstanding’ in the school. The

Novotná & Hošpesová
PME31―2007 4-29
teacher is very experienced and respected by parents, colleagues and educators as one of the best teachers in the town. The fact that she agreed with being recorded reveals that she is confident in her professional skills.
Classification of Topaze effect types in our experiments
It is our belief that types of Topaze effect considerably differ in being either explicitly stated or only implicitly suggested. Let us recall here that Topaze effect can only be considered when a previously explained subject matter is discussed. It is not connected to the process of explanation. The following types can be observed in our experiment:
Explicit prompting (overt) can be of the following nature: (a) description of steps which students are expected to follow, (b) questions related to the following solving procedure, (c) warning on possible mistake, (d) pointing out analogy, either with a problem type or with a previously solved problem, (e) recollection of previous experience or knowledge.
Covert, indirect, implicit prompting can be of the following nature: (a) rephrasing, (b) use of signal word, (c) prompting of beginning of words, (d) asking questions that lead to simplification of the solving process, (e) doubting correctness, usually in situations where the student’s answer is not correct, (f) comeback to previous knowledge or experience.
Let us now illustrate the specific types by examples from our experiment and let us look for answers why the teacher is doing that.
Description of steps which students are expected to follow was used by the teacher in our experiment whenever she wanted to ensure that each step of the solving process is clear to her students: (Lesson 2, 12:28) “Somebody may have used brackets, so I will wait for your next step in which you will get rid of the brackets and then we will check it together … OK. If you use them they are all right, there is no haste …” It seems that the teacher is trying to prevent occurrence of mistakes in this way. For that matter, she explicitly states it in (Lesson 9, 6:16): “Some of you feel to be experts in how you do it and start using shortcuts by heart. Please, be so kind and don’t do it. Be patient, we will get to that and then you will be asked to use a more economic record. But don’t do that until you are 100% sure that you can handle it.” (Lesson 9, 37:24): “Let’s now multiply out the brackets … To make sure that you don’t make any mistake, you should multiply out each side of the equation separately.” (Lesson 5, 5:50)
T: What did we always say that was the best way of adjusting the sides of the equation? Vítek … All variables (gesturing) … out loud …
Vítek: All variables on one side. T: ... and real numbers on the other side. Then it is easiest to select the
method.

Novotná & Hošpesová
PME31―2007 4-30
Sometimes the students were asked to state how the solving would proceed; in some cases she suggested the progression herself. A good illustration of this point is step 612 in the initial episode. Similar stimuli, however, can be found in many other places (Lesson 2, 14:13): “Well, and now comes another equivalent adjustment … which, Aneta …. (Aneta does not react.) To take two steps at once. What do you have to do?” In some cases the teacher directly warned on a mistake that could happen. She was guided here by her long-time teaching experience (Lesson 2, 25:43): “Watch out, watch out, don’t forget to multiply everything, yes?…”
Pointing out to analogy was of various nature: recollection of problem type, recollection of previously solved similar problem, comeback to previous knowledge or experience: (Lesson 3, 11:40): “OK, now you will do more work, because it is something similar.” (Lesson 2, 29:02): “There is one thing that you forgot … How I did it here, see (She points at record on the blackboard). I did something similar here …”.
Covert, indirect prompting was in our experiment often of the nature of appeal to reformulate: “How could you put this in different words?” This was used by the teacher whenever the students’ explanations were essentially correct but inaccurately formulated. It may be that these reformulations were not necessary for the other students because they joined in the dialogue with the teacher easily. This can be observed in the above presented transcript – steps 614 – 622.
The teacher often directed the solving process with the help of signal words which she used in her questions and instructions. For example in analysis of a word problem (Lesson 10, 26:15):
Teacher: So we know what? Student: That there were 52 bicycles. Teacher: That the sale lasted in total ... Student: 4 months ...
This is even more striking when the teacher prompts the beginning of the word that she wants to hear from the student (see step 608 in the above presented transcript). This type of prompting was used by the teacher whenever she was not able to find a suitable question.
Simplification of the situation by focusing on sub steps often resulted in disintegration of the solving process and students’ loss of overview. See e.g. steps 613 – 622 in the above presented transcript.
In other places, the teacher doubted correctness of answers. This was usually used when the answer was wrong (Lesson 3, 35:09): “This sounds really strange, doesn’t it? … Really? … Are you sure?“
(Lesson 10, 31:21 – 33:30): The teacher records the word problem on her own and uses simplified formulations which make the record much easier. Later this method

Novotná & Hošpesová
PME31―2007 4-31
leads the students directly to the solution. Even if the students suggest an “intellectually higher” answer, the teacher keeps coming back to the procedure:
T: Why do we use arrows? Student: To know whether it is direct or inverse proportion. T: Well, to be able to record it.
DISCUSSION AND SOME CONCLUSIONS
The main reason for the frequent use of Topaze effect in our experiment is the teacher’s belief that students’ success in mathematics can be reached by repeated execution of a series of similar procedures and that her students need this type of support for successful completion of the assigned tasks. For example in post lesson interview of Lesson 5 the teacher, when asked by the experimenter whether her students would not have problems when having to solve similar problems on their own, expressed her belief that her students are not able to work individually without being prompted: “Even if we do it with older students, almost nobody is able to solve it on their own the second time. Well, as long as it is stereotypical, you see, the algorithm is always the same, there is no exception, then perhaps the students would be able to solve it on their own.”
Our hypothesis is that frequent use of Topaze effect decreases students’ responsibility for successful completion of the assigned mathematical problems. Students do not work on their own, they do not discover, experiment. They wait for directions of the teacher whom they trust and imitate his/her procedure instead of individual activity. (Post-lesson interview 6)
Interviewer: And here, when solving the task, did you solve it with them, or on your own or …
Student: Well, the beginning, the multiplication on my own, and then I preferred to wait for the rest and continue with them.
Interviewer: And now, if you were to solve the problem today, is it better? Or a similar one?
Student: Well, may be a similar one, but if it were somehow different, I would probably not solve it.
What we proved in our experiment is that the price of Topaze effect is high: At the first glance everything in the lesson seems to be running smoothly. However, students lose self-confidence and are only seemingly active. They rely on the teacher’s help, mistake is understood as transgression. Students routinely repeat the learned process, often without understanding. They do not attempt to find their own suitable solving strategies. The learning process fails to work with one of the key elements – mistake, its recognition and elimination.
Acknowledgement: This research was partially supported by the grant GACR 406/05/2444.

Novotná & Hošpesová
PME31―2007 4-32
REFERENCES
Binterová, H., Hošpesová, A., Novotná, J. (2006). Constitution of the Classroom Environment: A Case Study. In D. Clarke, Ch. Keitel, Y. Shimizu (Eds.), Mathematics
Classrooms in Twelve Countries. The Insider’s Perspective. Rotterdam/Taipei: Sense Publishers, s. 275-288.
Brousseau, G. (1987). Theory of Didactical situations in mathematics 1970-1990. Translation from French M. Cooper, N. Balacheff, R. Sutherland & V. Warfield. Kluwer Academic Publishers, 304 p.
Clarke, D. (2001). Complementary accounts methodology. In D. Clarke (Ed.), Perspectives on Practice and meaning in mathematics and science classrooms. Dordrecht: Kluwer.
Clarke, D., Keitel, C. & Shimizu, Y. (2006). Mathematics classrooms in twelve countries. Rotterdam/Taipei: Sense publishers.
Forman, E. (1996). Learning mathematics as participation in classroom practice: Implications of sociocultural theory for educational reform. In L. Steffe, P. Nesher, P. Cobb, G. Goldin, & B. Greer (Eds.), Theories of mathematical learning (pp. 115-130). Mahwah, NJ: Lawrence Erlbaum Associates.
Levenson, E., Tirosh, D, & Tsamir, P. (2006). Mathematically and practically-based explanations: Individual preferences and sociomathematical norms. International journal of science and mathematics education, 4, 319-344.
Novotná J. (2000). Analýza řešení slovních úloh. Praha, UK–PedF. 126 p. [Analysis of word problem solution]
Odvárko O. et al. (1990). Metody řešení úloh. Praha, SPN. [Problem solving methods] Sarrazy, B. (2002). Effects of variability on responsiveness to the didactic contract in
problem-solving among pupils of 9-10 years. European Journal of Psychology of Education. Vol. XVII. n° 4, 321-341.
Voigt, J. (1985). Patterns and routines in classroom interaction. Recherches en Didactique des Mathématiques, 6(1), 69-118.

2007. In Woo, J. H., Lew, H. C., Park, K. S. & Seo, D. Y. (Eds.). Proceedings of the 31st Conference of
the International Group for the Psychology of Mathematics Education, Vol. 4, pp. 33-40. Seoul: PME. 4-33
DESIGNING UNIT FOR TEACHING PROPORTION BASED ON
CULTURAL-HISTORICAL ACTIVITY THEORY: PROCESS OF
SYMBOLIZING THROUGH COLLECTIVE DISCOURSE
Minoru OHTANI
Faculty of Education, Kanazawa University
The purpose of this study is to design teaching unit of proportion in a sixth-grade
Japanese mathematics classroom which has theoretical underpinnings of the
Cultural-Historical Activity Theory. The following discussion consists of two parts.
First part involves an indication of the theoretical framework and the justification for
the methodology used. In the framework, cultural tools such as numerical table, graph
and formula become symbol of proportion in which collective discourse plays
supportive role. The second part involves description of hypothetical trajectory of
appropriation of cultural tools in which table and line graph mediates interpersonal
functions then become intrapersonal symbols of proportion through collective
discourse. Data from actual teaching experiment buck up for legitimacy of the design.
INTRODUCTION
The purpose of this study is to design a unit for teaching proportion in a sixth-grade
Japanese elementary mathematics classroom which has theoretical underpinnings of
the “Cultural-Historical Activity Theory” (Leont’ev, 1975; Vygotsikii, 1984). The
following discussion consists of two parts. First part involves a discussion of the
theoretical framework for analysizg mathematical activity. In the framework, we will
coordinate a theory of mathematical activity in the “Realistic Mathematics Education
(RME)” (Gravemrijer et al., 2000) with sociocultural activity theory. There we will
incorporate the concept of “cultural tools” (Vygotsikii, 1984) and “discourse”
(O’Connor & Michaels, 1996) into RME theory in order for designing teaching unit of
proportion. The second part involves description of hypothetical learning teaching
trajectory (van den Heuvel-Panhuizen, 2001) where cultural tools such as numerical
tables, graph and algebraic formula become symbol of proportion in which collective
discourse plays supportive and generalizing role. Then data of teaching experiment are
presented and analyzed in the light of the framework to generate a description of the
process of symbolizing of numerical table. Results from the interpretation of the data
reveal that the process of symbolizing consists of four phases in which cultural tools
change its function form intermental to intramental one through collective discourse.
THEORETICAL FRAMEWORK
Mathematical activity in RME and Possible Coordination with Activity Theory
As mathematical activity, this paper verifies a discussion in Freudenthal Institute.
Freudenthal (1991) considered an activity that organizes a phenomenon by abstract
mathematical means and named it “mathematization”. Treffers (1987) categorized

Ohtani
4-34 PME31―2007
mathematization into two types (horizontal and vertical) and logically typified
mathematical education into four types according to with/without matthematization.
The institute recommends the perspective that has both two types of mathematization
and calls it “Realistic Mathematical Education”. RME theory is build on the basis of
“levels of thinking”(van Hiele, 1986) which describe development of thinking during
long-term span. In the early stage of RME, transition to a higher level of thinking was
made by establishing a micro level of “progressive mathematizing” (Treffers, 1987:
247). After that, RME presented a new development which has three points
(Gravemrijer et al., 2000). First is to set up four levels for move up the level of thinking.
These levels are: a situation that has a sense of reality (level 1); a model construction
underlying the pupils’ informal procedures (level 2); the model itself becomes targeted
and tools for inference (level 3); and formal mathematical knowledge (level 4). Second
is to expect the process that pupils make the model develop by themselves from level 2
to level 3. Third is to focus on symbolizing and communication, and think them as a
vehicles to construct a formal knowledge.
The RME’s theoretical standpoint supporting a contemporary development is a “social
constructivism” (Gravemrijer et al., 2000). This standpoint combines a sociological
perspective that analyzes practice at classroom level with a psychological perspective
that analyzes action at an individual level. This standpoint has, however, a criticism
that the theory can be said as interdisciplinary but cannot be said as consistent. The
major problem is that we only return the mathematical activity in the classroom to the
two elements of sociology and psychology, but we do not mention the link between
them (Waschescio, 1998). In fact, RME “describes” activity but does not “explain”
how a personal informal knowledge combines with a formal knowledge, or how
symbolizing and communication play a role then. As compensation to it,
cultural-historical theory tries to explain the link between social practice and
individual action. Originally, RME took a cultural-historical approach. Actually, the
van Hiele (1986) emphasized role of language and guided orientation for explicating
the structure. Treffers suggested that “cultural amplifier” (Treffers, 1987: 251) such as
schemas, models, and symbols should positively be offered in order to consciously
aiming at higher levels of thought. Thus, the problem of RME is not in itself, but it is
assumed to be caused by excessive devotion to social constructivism. Therefore,
reviewing symbolization and discourse from the cultural-historical theory will be our
theme.
Cultural-Historical Perspective on Activity
The “Cultural-Historical Theory” today is called as “Activity Theory” (Leont’ev,
1975) and is useful to consider character of mathematical activities. There are three
characters of activities in the theory. Firstly, when the word “activity” is used, it means
a qualitative aspect. Namely, it is not quantitative strength, but is quality, especially
“motive” is an index of activity. Secondly, activity is a cultural practice. Expressly,
unique cultural tools are used in the practice. Thirdly, participation in activities is

Ohtani
PME31―2007 4-35
socially organized. This is a process that a novice becomes proficient for the use of
cultural tools while participating in the cultural practice under the guidance of expert.
The third process is explained by the thought of Vygotsky’s “psychological tool”
(Vygotsky, 1984). The thought means that people do not react directly when they react
a stimulus, but people intentionally create an artificial and auxiliary stimulus to react
indirectly. As an example of psychological tool, languages, algebraic symbols, graphs,
diagrams, and so on are followed. People can analyze problems and make future plans
by using mediating stimulus that is not in the direct vision or territory of action. This
paper interprets these functions of psychological tool as symbolizing. In other words,
“a creation of a space in which the absent is made present and ready at hand”
(Nemirovsky & Monk, 2000: 177). In this paper, we will adopt this definition.
In the cultural-historical theory, the process that people appropriate psychological tool
is explained as follows. A tool (stimulus-object) exists outside, structures interpersonal
connection, and then becomes individual psychological instrument. Vygotsky (1984)
designed the settings where a person acquires his own stimulus-means by using a
stimulus-object given by others. This paper stands in this point. Teacher provides
pupils with stimulus-object that can be shared between teacher and pupils, then the
teacher promotes so that the stimulus-object can be pupils’ stimulus-mean.
DESIGN OF TEACHING UNIT
To consider proportion from the viewpoint of cultural-historical theory is to clarify (a)
motive, (b) cultural tool, and (c) process that the teacher guides pupils.
Motive for Using Proportion
Proportion, generally, function is a mathematical way of knowing that is supported by
the following motive. This is, “When there is a phenomenon we would like to control,
but it is difficult for us to directly approach. If we can find related and approachable
phenomenon, then we can control the more difficult one as well.” (Shimada, 1990: 30).
In this regard, Miwa (1974) suggests the following two points are essential. One is
“projection”, that is, observing a phenomenon from a different phenomenon makes the
consideration of target easier. The other is “function”, that is, considering what sort of
characteristic and structure that the function conserves. This means to find regularity of
correspondence and change, namely, to discover invariant or constant in quantity
changing by the change of another value and to utilize them in problem solving.
Cultural Tools: Numerical Table, Graph, and Formula
When solving a realistic problem from the viewpoint of function, we systematically
analyze data gained from experiment. The cultural tools to deal with the data are
numerical table, formula, and graph. Numerical table is a tool regularly arraying the set
of dependent variables when independent variables are changed systematically. If a
table becomes a symbol, it is possible to acquire data that are not in the hand or to
predict unknown values by using the table. A graph is a visual symbol that
geometrically presents quantities that are not originally spatial or figural as a position

Ohtani
4-36 PME31―2007
or curve line (Sfard & Kieran, 2001). It visually represents the quantitative tendency,
especially in the continuous quantity that comes into effect in the whole system. When
the graph is made, the complicated relationship of proportion is demonstrated as a
straight line, the simplest figure. When the graph is symbolized, it makes an effect to
deduce the parameter by applying the relationship of proportion to the plotted data, and
to reason or predict the phenomenon. The formula y = a x compresses all the data and
shows explicitly the way dependent variables are directly determined by the
independent variables. This also fully comforts to the etymology of symbol
“sum-ballen” that is “to combine”. When a formula is dealt with as a symbol, an
essential aspect underlying the problem situation can be recognized. In addition, we
can determine that the phenomenon represents proportion judging from the
manipulated formula, or describe the phenomenon based on the character of
proportion.
Process that the Teacher Guides Pupils and Crucial Role of Discourse
In the early stage of unit, we use tables, graphs, and formulas as a social function
between the teacher and pupils, namely as a notation for others. Tables, graphs, and
formulas are not psychological tools of proportion. Actually, these are rather statistical
than functional in quality, and are social means so as to record or present results for
others. In the lesson, the teacher uses them as a social function and require pupils a
higher theme. For example, in numerical table, pupil should search the data not from
left to right, but see by jumping the space or interpolating the space. In a graph, pupil
should not line the points and make a line graph, but line the space with understanding
the all the points are lined in straight.
In the symbolization of notation, structuring discourse in the classroom by the teacher
becomes more important. Firstly, description of character of proportion “when x-value
becomes double, triple…, y-value also becomes double, triple…with the variation of
x” is rather long and logically complicated in sixth graders. This also contains omitted
expressions and terminologies. Therefore, the teacher must help pupils so that they can
learn the officially used descriptions and expressions in mathematics and use them.
Secondly, to understand the concept of function is to conceive phenomenon as a
system. In other words, pupils must recognize the variation not as separate, but as a
whole. However, the pupils’ explanations are based on individual and concrete context
which are only understood well by them. It means that the explanations lack generality.
For this reason, the teacher must organize the discourse that explains an
understandable and general system in the whole classroom. From the above viewpoint,
we think that building up the foundation of social interaction between teacher and
pupils, leading concrete meanings to generalization through discourse, and turning
statistical expressions into functional symbols are key points for designing unit plan.

Ohtani
PME31―2007 4-37
UNIT PLAN
We developed a teaching unit that consists of 5 subunit (A to E), 12 hours (①-⑫) in
total (Fig.1). The lessons have been conducted in the two classes in a public elementary
school from the September 28th in 2000.
Fig.1 Teaching Unit Plan
Fig.2 Attainment Levels in the Unit Plan
A feature of this teaching experiment is to adopt a motivation (projection and function)
that supports an idea of function throughout the unit. When pupils think about a table,
“sideways relation” tends to be strong and “longitudinal relation” tends to be weak.
This teaching experiment researches a possibility to reduce the pupils’ tendency to
avoid the use of external ratio by keeping a motivation of projection.
The structure of the units consists of 4 attainment levels in accordance with RME. The
first two levels are same as the RME’s, but in the level 3, notation as a social function
gradually turns into a symbol as a thinking function. Regarding this, we design a
teaching plan so that a table at the second subunit (B), a graph at the third subunit (C),
and a formula at the fourth subunit (D) can turn into a symbol. Especially, the second
stage is not only a symbolization of a table, but a base of symbolization of a graph and
formula in the third and fourth subunit, and we expect to induce a development of
“meta representational knowledge” (Gravemeijer et al., 2000: 233) with regard to each
feature and difference. In the subunit (E), we expect pupils to utilize a table, a graph,
and a formula as a symbol. More specifically, we expect that the pupils detect the
structure of proportion from a subtle character in a concrete situation and apply it, or
assume proportion and solve the problem. Level structure of the unit is shown in Fig.2.
SYMBOLIZATION AND THE ROLE OF DISCOURSE
We will discuss the process that notations and expressions become a symbol with
regard to discourse. We use here a table as an example. It is because that a table itself
does not represent properties of proportion comparing to a graph or a formula.
Therefore, to expose the property of proportion, we have to use language and pictorial
arrow expression. We think there are two major roles of discourse about a table. One is
to conceiving data sets as a system and the other is for linguistic formulation. We will
Subunit Class Hours Topics Covered
A ①② Motivation
B ③④⑤⑥ Symbolizing table
C ⑦⑧⑨ Symbolizing graph
D ⑩⑪ Symbolizing formula.
E ⑫ Summarize
Level 1 2 3 4
①②
③④
⑤⑥
⑦⑧⑨
⑩⑪
⑫

Ohtani
4-38 PME31―2007
discuss the former one below. Conceiving data set as a system needs an explanation not
about a specified pair of values in a table, but in a general structure in whole the table.
Sort the data in Statistical table
In general, we often deal with a table in which data are sorted from the beginning in the
study of proportion. At the third hour of class (③), the depth of water (y cm) is asked as
a problem when water (x dl) was poured into the (a) cylindrical-shaped vase and (b)
pot-shaped vase with a cup and the data were given randomly. The question “Is the
condition of water different” worked as a trigger for pupils, they begun to sort the data
to recognize easily and tried to find the tendency (Pic.1).
As a result, they concluded that “(a) may have a
rule”. Then the teacher asked y-value when x = 8
by using the table in which 1 to 5 of x-values
were given. This question indirectly required to
consider the solution by applying a rule of given
table. 13 out of 35 pupils immediately raised
their hand, but later almost all the pupils could
say right answer. This result implies that for
pupils the table was a matter that consists of
given data at first, but later it became a tool to
consider unknown values based on the rule. Pic.1 Sorted Data
Explain calculation procedure with fragmentary rule
The pupils said together “32 cm” to the question of the unknown data of 8 dl. Most of
explanation was incomplete even if the rule appeared or disappeared in their
description. For example, a pupil said that the depth would be a multiple of 4 and the
x-value would be 8, but he did not say the relationship between x and y. Another
explanation was “sum would correspond to
sum”, but the other pupils did not seem to
understand. Also the explanations of external
ratio and of internal ratio were made. Thus, the
calculation procedure of pupils was brought to
the fore to acquire the answer 32 by using an
individual number, but they did not explain
the general rule. They replied only the
calculation procedure or fragmentary rule
using a specified pair of values and lacked
generality. Pic.2 Semi-general Rule
When we exposed the fragmental rules for the explanation based on the concrete
relationship between values, the teacher considered that the explanation by word
would be difficult, so he required pupils to show their thought on the table with an
arrow sign. The arrow sign represented the rule of table and became an important tool
in order to target the rule. The pupils were gradually detecting simple semi-general rule

Ohtani
PME31―2007 4-39
with teacher’s guidance. By “semi-general”, we mean the rule was based on “a number
per 1” (unitary method). At the moment, the following property: “when x-value
becomes double, triple…, y-value also becomes double, triple…with the variation of
x” meant all the allow started from “a number per 1”(Pic. 2).
Detect general relations in the table
At the fourth hour, the teacher provided a higher level question than acquiring a y value
from a pair of data. The problem was, “when a value is 3 dl, the other value is 4.5 cm,
then when a value is 15 dl, what cm is the other value? (Pic.3 above)
“A number per 1” (unitary method) came up in
the discourse when we focused on this solution
(Pic.3 below). Some pupils elaborated “zigzag”
method which was transitional one and mixture
of inner and external ratio. The meaning of “a
number per 1” for pupils was the y-value when
x = 1, but for the teacher, the value was a
proportional constant. The fact that same
wording has many meanings constitutes so
called “Zone of Proximal Development”
(Vygotsikii, 1984) in social interaction. The
teacher made the term “a number per 1” for a
target of discourse, and the pupils considered
where the number can be seen in the table. The
constant value begun to work as a symbol of
proportion when “a number per 1” could be
seen in whole the table. Thus, the teacher
established a base of interaction with pupils
while showing a higher level of problem and
designed discourse so that the pupils could pay
attention to the general rule behind the table. Pic.3 Problem and Solutions
Symbolized table become operational
Pupils also found the defining character of
proportion: conservation of sum. At the sixth
hour, the teacher posed more difficult problem.
The problem was, “when a value is 2.5dl, the
other value is 3cm, and when a value is 6.5dl,
the other value is 7.8cm, then when a value is
9dl, what cm is the other value?”. When a table
became a symbol, it was possible to detect
properties here and there, and acquired data that
were not in the hand (Pic. 4). Pic. 4 Symbolized Table

Ohtani
4-40 PME31―2007
CONCLUDING REMAKS
We proposed a unit design for teaching proportion in a sixth-grade of Japanese
elementary mathematics classroom based on cultural-historical theory in which
cultural tools such as table, graph and formula become symbol of proportion in
collective discourse. In this report, we described a hypothetical learning teaching
trajectory only for numerical table. Results from the interpretation of the data reveal
that the process of symbolizing consists of four phases. This hypothetical trajectory
could be applied for of symbolizing graph and formula as well. Teaching experiment
reveal that classroom collective discourse functions as social resources for promoting
process of symbolization. Through collective discourse, the cultural tools are gradually
appropriated by the pupils as cognitive means for regulating their personal
mathematical activity. Thus, process of symbolizing of cultural tools is characterized
by changes of their function form collective use to private one.
References
Freudenthal, H. (1991). Revisiting mathematics education. Dordrecht: Kluwer
Gravemeier, K. & Cobb, P. (2000). Symbolizing, modeling, and instructional design. In P.
Cobb et al. (eds.). Symbolizing and communicating in mathematics classrooms
(pp.225-273). NJ: LEA.
Leont’ev, A. A. (1975). Dieyatelinocti, soznaine, i lichynosti (Activity, consciousness, ans
personality). Moskva: Politizdat.
Miwa, T. (1974). Kannsuuteki shikou (Functional tinkong). In Nakajima & Ohno (eds).
Suugaku to shikou (Mathematics and thinking), (pp. 210-225). Tokyo: Daiich Houki
Nemirovsky, R., Monk, S. (2000). “If you look at it the other way…”. In P. Cobb et al. (Eds.).
Symbolizing and communicating in mathematics classrooms (pp. 177-221). NJ: LEA.
O’Connor, M. & Michaels, S (1996). Shifting participant framework. In D. Hicks (Ed.),
Discourse, learning, and schooling (pp. 63-103). MA: Cambridge University Press.
Sfard, A., Kieran, C. (2001). Cognition as communication. Mind, Culture, and Activity, 8 (1),
42-76.
Shimada, S. (1990). Kyoushino tameno monndaisyuu (Problems for the teacher). Tokyo:
Kyouritsu. [In Japanese]
Treffers, A. (1987). Three dimensions. Dordrecht: D. Reidel.
van den Heuvel-Panhuizen, M. (ed), (2000). Children leaning mathematics. Utrecht:
Freudental Institute.
van Hiele, P. M. (1986). Structure and insight. Orland, FL: Academic Press
Vygotskii, L. S. (1984). Orudie i znak v razvitii rebenka. Porblemy obshchei pshikhologii
(Tool and symbol in the development of children. Promlem of general psychology)
(c.5-90). Moscow: Izdatel’stvo Pedagogika.
Waschescio, U. (1998). The missing link. In F. Seeger et al. (Eds.), The culture of the
mathematics classroom (pp. 221-241). MA: Cambridge University Press.

2007. In Woo, J. H., Lew, H. C., Park, K. S. & Seo, D. Y. (Eds.). Proceedings of the 31st Conference of
the International Group for the Psychology of Mathematics Education, Vol. 4, pp. 41-48. Seoul: PME. 4-41
PROTOTYPE PHENOMENA AND COMMON COGNITIVE PATHS
IN THE UNDERSTANDING OF THE INCLUSION RELATIONS
BETWEEN QUADRILATERALS IN JAPAN AND SCOTLAND
Masakazu Okazaki and Taro Fujita
Joetsu University of Education, Japan / University of Plymouth, UK
This study explores the status and the process of understanding of ‘the inclusion
relations between quadrilaterals’, which are known to be difficult to understand, in
terms of the prototype phenomena and the common cognitive paths. As a result of our
analysis of data gathered in Japan and Scotland, we found that the students’
understanding was significantly different for each inclusion relation, and that there
were strong prototype phenomena related to the shapes of the square and rectangle in
Japan, and related to angles in Scotland, the factors which prevent students from fully
grasping inclusion relations. We also confirmed the existence of common cognitive
paths in Japan and Scotland, and based on these paths discussed a possible route to
teach the inclusion relations between quadrilaterals by analogy.
INTRODUCTION
The learning of the inclusion relations between quadrilaterals provides students with
an opportunity to develop logical reasoning skills, and is regarded as an introductory
process into deductive geometry (Crowley, 1987, van Hiele, 1986, 1999). In terms of
van Hiele’s model, at level 3 students are expected to be able to deduce that a rectangle
is a special type of parallelogram, based on the definition and the properties of each
quadrilateral, while at level 2 they simply recognize the properties of each separate
shape (We are using the 1-5 numeration of van Hiele’s model). However, research
evidence suggests that the rate of progress from level 2 to level 3 is slow, and that many
students remain at level 2 even at the end of secondary schools (e.g., Senk, 1989). Thus,
the classification of quadrilaterals by inclusion has been shown to be a difficult task (de
Villiers, 1990, 1994).
However, it has also been suggested that some inclusion relations between
quadrilaterals are easier to grasp than others (Okazaki, 1995). For example, Japanese
6th grade students are more likely to recognize a rhombus as a special type of
parallelogram than to see a square or a rectangle as a parallelogram. In this paper we
shall first investigate whether this phenomenon can be recognized at an international
level by comparing data from Japan and the UK (Scotland). If indeed evidence of this
is found, we shall then explore the common cognitive paths (Vinner and Hershkowitz,
1980) that suggest the process students commonly follow in understanding the links
between different shapes, starting from the easier and progressing to more difficult
conceptual links. Such information will suggest routes by which we may enable
students to understand the inclusion relations between quadrilaterals more effectively.

Okazaki & Fujita
PME31―2007 4-42
THEORETICAL BACKGROUNDS
Prototype examples as implicit models in the geometrical thinking
A geometrical figure is a ‘figural concept’ that has aspects, which are both conceptual
(ideality, abstractness, generality and perfection), and figural (shape, position, and
magnitude) (Fischbein, 1993). However, Fischbein indicated that “the fusion between
concept and figure in geometrical reasoning expresses only an ideal, extreme situation
usually not reached absolutely because of psychological constraints” and that “the
figural structure may dominate the dynamics of reasoning” for many students. This has
also been observed in primary trainee teachers. For example, Fujita and Jones (2006)
found that among primary trainee teachers in Scotland prototype images in their
personal figural concepts have a strong influence over how they define/classify figures.
This tendency to rely on figural aspects is known as the ‘prototype phenomenon’
(Hershkowitz, 1990). The key factor is the prototype example, which is “the subset of
examples that is the ‘longest’ list of attributes – all the critical attributes of the concept
and those specific (noncritical) attributes that had strong visual characteristics” (ibid.,
p. 82). Students often see figures in a static way rather than in the dynamic way that
would be necessary to understand the inclusion relations of the geometrical figures (de
Villiers, 1994). As a result of this static visualisation, some students are likely to
implicitly add certain properties such as ‘in parallelograms, the adjacent angles are not
equal’ and ‘in parallelograms, the adjacent sides are not equal’ besides the true
definition (Okazaki, 1995), which are likely to be a result of the prototypical
phenomenon of parallelograms. We assume that figural concepts, including tacit
(falsely assumed) properties, act as ‘implicit models’ (Fischbein et al, 1985) in
geometrical thinking. This hypothesis will later be used to analyse the difficulties in
understanding the classification of quadrilaterals by inclusion relations.
Common cognitive paths
The ‘common cognitive path’ refers literally to a statistical method for identifying a
path that many students follow to recognize similar concepts (Vinner and Hershkowitz,
1980). The basic idea is as follows (pp. 182-183):
Denote by a, b, c, d respectively the subgroups of people that answered correctly the
items that test aspects A, B, C, D. Suppose, finally, that it was found that a⊃ b⊃ c⊃ d.
We may claim then that A→B→C→D is a common cognitive path for this group (in the
sense that nobody in the group can know D without knowing also A, B, C and so on).
This view is of course idealistic. It may be found for example that there are students
who answer A incorrectly and B correctly. Thus Vinner and Hershkowitz proposed
that the existence of a common cognitive path from A to B be recognized where a
significant difference between m(a)/N and m(a and b)/m(b) exists through the
chi-square test (Vinner and Hershkowitz, 1980). Several researchers have already
found some common cognitive paths. For example, Vinner and Hershkowitz (ibid.)
investigated them for obtuse and straight angles, right-angled triangles, and the altitude

Okazaki & Fujita
PME31―2007 4-43
in a triangle. Nakahara (1995) also found for basic quadrilaterals that parallelogram→
rhombus → trapezium is a common cognitive path among Japanese primary school
children.
METHODOLOGICAL CONSIDERATION
Subjects
We collected data from 234 9th graders from Japanese public junior high school in
1996 and Scottish 111 trainee primary teachers in their first year of university study in
2006 (aged about 15 and 18 respectively). Although there is an age difference between
the subjects in the two counties, we consider this comparison to be worthwhile for the
following reasons: Under their respective geometry curricula, both of the subject
groups have finished studying the classification of, and relations between,
quadrilaterals. In the Japanese case, where the students were still in school, no revision
of this topic is specified in the curriculum for their remaining years of high school
education. The two subject groups were given exactly the same questionnaire in their
own languages. If we could find evidence of common mathematical behaviour, we
believe this could indicate more general, global findings, which override local factors.
Questionnaire and analysis
A questionnaire, as shown in Table 1 (Okazaki, 1999), was designed based on
Nakahara’s study (1995). It consists of five main questions, each with sub-questions,
giving in total 40 questions. Questions 1, 2 and 3 ask students to choose images of
parallelograms, rectangles and rhombuses from various quadrilaterals. These questions
are used to check what mental/personal images of quadrilaterals students have.
Question 4 asks whether mathematical statements concerning parallelograms,
rectangles and rhombuses are true or false, which is used to judge what implicit
properties our students have developed in terms of the inclusion relations. For example,
they were requested to judge whether the following statement is true or false, ‘There is
a parallelogram which has all its sides equal’. The fifth and last question asks students
to judge directly the inclusion relations between rhombuses/parallelograms,
rectangles/parallelograms, squares/rhombuses and squares/rectangles. While questions
1-3 reveal what mental/personal images of quadrilaterals students have, this is not
enough to judge at what level of van Hiele’s model they may be assessed. As we have
discussed, geometrical figures are fundamentally ‘figural concepts’, and the
performance of students in questions 4 and 5 will provide us with more information
about how students understand the relations between quadrilaterals.
Next, common cognitive paths will be examined based on the students’ overall
performance in the questionnaire’s problems related to the inclusion relations between
quadrilaterals. To do this, we first identify the students who are considered to have
more or less sound understanding of each inclusion relation. As a standard for
choosing the students, we adopt more than 70 % correct answers to all of the questions
in line with Nakahara’s approach (1995). Next, we produce 2 by 2 cross tables to

Okazaki & Fujita
PME31―2007 4-44
examine whether a common cognitive path may exist between each relation by using
the chi-square test.
Table 1. Questionnaire.
Q1. In the following quadrilaterals (the shapes with the
thick black lines), next to each one, put ( / ) for those
you think are in the parallelogram family, ( X ) for
those you think do not belong to the parallelogram
family, or if you are not sure, put ( ? )
Q2. In the following quadrilaterals (the shapes with the
thick black lines), put ( /) for those you think are in the
rectangle family, ( X ) for those you think do not belong
to the rectangle family , or if you are not sure, put ( ? )
Q3. In the following quadrilaterals (thick lines), put ( / )
for those you think are in the rhombus family, ( X ) for
those not in the rhombus family, or if you are not sure,
put ( ? )
Q4. Read the following sentences carefully, and put ( / ) for those
you think are correct, ( X ) for those that are incorrect, and if you
are not sure, put ( ? )
Questions about Parallelograms
(a) ( ) The lengths of the opposite sides of parallelograms are equal.
(b) ( ) There are no parallelograms which have equal adjacent sides.
(c) ( ) The opposite angles of parallelograms are equal.
(d) ( ) There are no parallelograms which have equal adjacent angles.
(e) ( ) There is a parallelogram which has all its sides equal.
(f) ( ) There is a parallelogram which has all equal angles.
Questions about Rectangles
(a) ( ) The lengths of the opposite sides of rectangles are equal.
(b) ( ) There are no rectangles which have equal adjacent sides.
(c) ( ) The adjacent angles of rectangles are equal.
(d) ( ) The opposite angles of rectangles are equal.
(e) ( ) There is a rectangle which has all equal sides.
Questions about Rhombuses
(a) ( ) The lengths of the opposite sides of rhombuses are equal.
(b) ( ) The adjacent sides of rhombuses are equal.
(c) ( ) There are no rhombuses which have equal adjacent angles.
(d) ( ) The opposite angles of rhombuses are equal.
(e) ( ) There is a rhombus which has all equal angles.
Q5. Read the following sentences carefully, and put ( / ) for those
you think are correct, ( X ) for those which are incorrect, or if you
are not sure, put ( ? ).
1. About parallelograms and rhombuses
(a) ( ) It is possible to say that parallelograms are special types of
rhombuses.
(b) ( ) It is possible to say that rhombuses are special types of
parallelograms.
2. About parallelograms and rectangles
(a) ( ) It is possible to say that parallelograms are special types of
rectangles.
(b) ( ) It is possible to say that rectangles are special types of
parallelograms.
3. About squares and rhombuses
(a) ( ) It is possible to say that squares are special types of rhombuses.
(b) ( ) It is possible to say that rhombuses are special types of squares.
4. About squares and rectangles
(a) ( ) It is possible to say that rectangles are special types of squares.
(b) ( ) It is possible to say that squares are special types of rectangles.
RESULT AND DISCUSSION
Does the prototype phenomenon happen in students’ understanding of inclusion
relations?
Table 2 summarises the results (the percentages of correct answers) to the parts of
questions (Q) 1-4 which relate to inclusion relations. Through analysis of these results
we can observe some interesting mathematical behaviours among our subjects.

Okazaki & Fujita
PME31―2007 4-45
Let us examine the answers to Q1~3 (images). Firstly, both Japanese and Scottish
students gave very similar responses to Q1. That is, while over 74% students
recognized rhombuses as parallelograms (Q1 d and f), many failed to see rectangles as
a special type of parallelogram, as their scores dropped by over 15% (Q1c and e).
Table 2: The correct answers (%) for the questions on images and properties.
Parallelogram (%) Rectangle (%) Rhombus (%)
No. J S No. J S No. J S
Images Q1 d (Rho.) 78.6 75.7 Q2 c (Squ.) 29.5 45.1 Q3 b (Squ.) 43.6 14.4
Q1 f (Rho.) 78.2 74.8 Q2 e (Squ.) 28.6 41.4 Q3 d (Squ.) 73.5 37.8
Q1 c (Rec.) 51.3 60.4
Q1 e (Rec.) 49.6 58.6
Properties Q4PA b (Rho.) 62.8 55.9 Q4RE b (Squ.) 38 55.9 Q4RH c (Squ.) 46.2 45
Q4PA e (Rho.) 59 49.5 Q4RE e (Squ.) 25.2 38.7 Q4RH e (Squ.) 52.6 33.3
Q4PA d (Rec.) 40.6 50.5
Q4PA f (Rec.) 41 36.9
J: Japan S: Scotland
Secondly, we can observe that many students failed to see a square as a special type of
a rectangle and a rhombus. However, the two groups’ performance in this question was
different; for Japanese students the most difficult was to see a square as a rectangle,
and for Scottish trainees the main problem was to recognize a square as a rhombus.
Thirdly, there is a significant difference between the scores for two questions relating
to two identical inclusion relations. While the rhombus/parallelogram relation is
related to the ‘length of sides’ and corresponds with the square/rectangle relation by
analogy, the scores for Q1 d (rhombus/parallelogram) were 78% in Japan and 75% in
Scotland while for Q2 c (square/rectangle) they were 30% and 45% respectively.
Similarly, the inclusion relations between rectangle/parallelogram and square/rhombus
are both related to angles, but we can observe a similar tendency: in particular, the
percentage of correct answers by Scottish students dropped by over 25%. We consider
these tendencies suggest that both Japanese and Scottish students’ reasoning is not
governed conceptually, but rather is influenced by the prototype images of
quadrilaterals, i.e. that the prototype phenomenon occurs.
Now, let us examine students’ performance in Q4 (properties). While the scores are
slightly worse than for Q1~3, we can observe similar tendencies in the answers. These
results suggest that our subjects did not only judge based on their own images, but they
at least implicitly create and utilise ‘additional’ properties, such as ‘parallelograms do
not have equal adjacent angles’. For the true properties of quadrilaterals such as ‘the
opposite angles of parallelograms are equal’, our subjects in both countries showed a
good understanding. The score for questions with a ‘True’ correct answer was
generally over 85%, with the following exceptions: 74% of Japanese students
answered correctly Q4RHb (adjacent sides of rhombuses), and 69%, 77%, 55% and
70% of Scottish trainees answered correctly Q4REc (adjacent angles of rectangles),
Q4RHa (opposite sides of rhombuses), Q4RHb (adjacent angles of rhombuses), and

Okazaki & Fujita
PME31―2007 4-46
Q4RHd (opposite angles of rhombuses), respectively. As we have seen in Q1~3,
Scottish trainees showed particularly weak knowledge in rhombuses.
Finally, let us examine Q5, shown in table 3 below.
Table 3: The correct answers (%) for the direct questions.
Rhom/Parall Rect/Parall Sq/Rect Sq/Rhom
J S J S J S J S
Direct (Q5) 69% 41% 50% 40% 59% 37% 40% 25%
Data from Japan again showed a similar tendency to Scottish students, and these
results are consistent with those from Q1~4. Japanese students’ performance is better
than the Scottish group. On the one hand, we speculate that our Scottish trainees might
not be familiar with the type of question posed for Q5 and that is why they performed
relatively poorly for Q5. On the other hand, this poor performance also suggests that
the prototype phenomenon appears more strongly among Scottish trainees than
Japanese students.
In summary, considering all answers to Q1~4, we suggest that students’ personal
figural concepts of all quadrilaterals are likely to consist of ‘Prototype image + true
properties + implicit properties caused by prototype images’.
Common cognitive paths
Table 3 above suggests that an order of difficulty exists within the understanding of the
relations between quadrilaterals, e.g. the rhombus/parallelogram relationship might be
grasped more easily than the square/rhombus relation, which suggests the existence of
common cognitive paths. We first examined the number of nearly achieving subjects
by the criteria described in the methodology section (using a standard of more than
70%). However, as we have seen in table 3, Scottish trainees showed particularly low
scores for question 5, and hence the number of such subjects significantly dropped.
Thus, in this paper we judge evidence of good understanding to be correct answers in 3
out of the first 4 questions (Q1~4, images and properties), as summarised in table 4.
We then produce a 2 by 2 table and examine by using the chi-square test whether a
common cognitive path may exist between each relation.
Table 4: Nearly achieving subjects on the images and the properties (%).
Rhom/Parall Rect/Parall Sq/Rect Sq/Rhom
J S J S J S J S
62% 52% 35% 41% 19% 37% 44% 17%
As we can see in figures 1 and 2, common cognitive paths are identified among our
subjects. The subjects firstly understand the relation between rhombus/parallelogram
in both countries. If we look at the paths more simply, the Japanese students’ path is
square/rhombus, rectangle/parallelogram and finally square/rectangle, while the
Scottish path is rectangle/parallelogram, square/rectangle and square/rhombus.

Okazaki & Fujita
PME31―2007 4-47
Implication for teaching of inclusion relations between quadrilaterals
Finally, we shall consider the implications for the learning and teaching of inclusion
relations between quadrilaterals. Both Japanese and Scottish students are likely to first
of all grasp the rhombus/parallelogram relation. We should make sure that they have
fully appreciated this relationship, and then by using this relation as a starting point,
consider teaching sequences based on the cognitive paths identified above. We
speculate that if we taught them in the opposite order of the common cognitive path,
students might not recognize all the relations. We may then consider the pedagogical
approach by analogy in which we may use an easier relation in teaching more difficult
relations.
For Japanese students, it is obvious that the prototype phenomenon appears strongly in
squares and rectangles, and such prototype images and implicit properties are obstacles
for the correct understanding of the rectangle/parallelogram and square/rectangle
relations. The curriculum design in Japan might influence these tendencies: in Japan
children learn these quadrilaterals first in the 2nd
grade in primary schools, and in so
doing they also informally learn them as ‘regular quadrangle’ and ‘oblong’. To tackle
this problem, considering the common cognitive paths of Japanese students, it is
suggested that, as a teaching strategy we use rhombus/parallelogram relation as
analogy for square/rectangles (sides) and square/rhombus for rectangle/parallelogram
(angles).
For Scottish trainees, while they have relatively flexible images of parallelograms, the
strongest prototype phenomenon appears in squares. Also, considering their answers
regarding rectangle/parallelogram relation (41%), it seems that the common cognitive
barrier for them is ‘the size of angles’, i.e. for both cases it is very difficult for them to
recognize that parallelograms or rhombuses can have all equal angles. In fact, a similar
behaviour is observed in our pilot study, i.e. trainees in Scotland tend to define squares
and rectangles by mentioning only ‘sides’ but not ‘angles’ (Fujita and Jones, 2006).
Thus, for Scottish trainees, it might be effective to use the rhombus/parallelogram as
analogy for square/rectangle, i.e. we could agitate their prototype images and implicit
properties by asking them ‘Is it possible to have a parallelogram which has all equal
angles if it is possible to have a parallelogram whose ‘sides’ are all equal?’
Rect/Paral Sq/Rhom
Rhom/Paral
Rect/Paral Sq/Rhom
Sq/Rect
Figure 1. Common cognitive paths
in Japanese 9th graders. (p < 0.01)
Rhom/Paral
Rect/Paral Sq/Rhom
Sq/Rect
Figure 2. Common cognitive paths in
Scottish trainee teachers. (p < 0.05)

Okazaki & Fujita
PME31―2007 4-48
As a concluding remark, in this paper we have identified prototype phenomenon and
common cognitive paths by quantitative approaches, and our next task is to examine
qualitatively teaching sequences and approaches suggested by the identified cognitive
paths (e.g. by conducting clinical interview etc.).
References
Crowley, M.L. (1987). The van Hiele model of the development of geometric thought. M.M.
Lindquist (ed.), Learning and Teaching Geometry, K-12 (pp. 1-16). Reston, VA: NCTM.
De Villiers, M. (1990). The role and function of proofs in mathematics. Pythagoras, 24,
17-24.
De Villiers, M. (1994). The role and function of a hierarchical classification of quadrilaterals.
For the learning of mathematics, 14, 11-18.
Fischbein, E. et al. (1985). The role of implicit models in solving verbal problems in
multiplication and division. Journal for Research in Mathematics Education, 16 (1), 3-17.
Fischbein, E. (1993). The theory of figural concepts. Educational Studies in Mathematics, 24,
139-162.
Fujita, T. and Jones, K. (2006). Primary trainee teachers’ understanding of basic geometrical
figures in Scotland. Proceedings of the 30th PME Conference, 3, 14-21.
Hershkowitz, R. (1990). Psychological aspects of learning geometry. P. Nesher and J.
Kilpatrick (eds.), Mathematics and Cognition (pp. 70-95). Cambridge University Press.
Nakahara, T. (1995). Children’s construction process of the concepts of basic quadrilaterals
in Japan. Proceedings of the 19th PME Conference, 3, 27-34.
Okazaki, M. (1995). A study on growth of mathematical understanding based on the
equilibration theory –an analysis of interviews on understanding “inclusion relations
between geometrical figures. Research in Mathematics Education, 1, 45-54.
Okazaki, M. (1999). Basic study on activities of defining geometrical figures –referring to an
investigation on the understanding of inclusion relations between geometrical figures-.
Research in Mathematics Education, 5, 101-110.
Senk, S. L. (1989). Van Hiele levels and achievement in writing geometry proofs. Journal for
Research in Mathematics Education, 20, 309-321.
van Hiele, P. M. (1999). Developing geometric thinking through activities that begin with
play. Teaching Children Mathematics, 5 (6), 310-316.
van Hiele, P.M. (1986). Structure and Insight: A Theory of Mathematics Education.
Academic Press.
Vinner S. and Hershkowitz R. (1980). Concept images and some common cognitive paths in
the development of some simple geometric concepts. Proceedings of the fourth PME
Conference, 177-184.

2007. In Woo, J. H., Lew, H. C., Park, K. S. & Seo, D. Y. (Eds.). Proceedings of the 31st Conference of
the International Group for the Psychology of Mathematics Education, Vol. 4, pp. 49-56. Seoul: PME. 4-49
A STUDY OF GENDER DIFFERENCES IN LANGUAGE USED
BY PARENTS AND CHILDREN WORKING ON
MATHEMATICAL TASKS
Melfried Olson, Judith Olson and Claire Okazaki
University of Hawai‘i / University of Hawai‘i / University of Hawai‘i
This research report examines communication patterns between parents and children
as they work together on three different mathematical tasks. The paper discusses the
theoretical foundations of the project, pilot efforts involved in the construction of
mathematical tasks and videotaping, development and validation of survey
instruments, and techniques examined and used to analyze the communication
between parents and children and to categorize the dialog into low to high
cognitively demanding language on the part of parents. Sample transcripts are
provided.
This paper will focus on the preliminary analysis of data collected as part of a three-
year project funded by the National Science Foundation entitled The Role of Gender
in Language Used by Children and Parents Working on Mathematical Tasks. The
following three research questions guided the development of the project:
1. To what extent are there differences in the use of cognitively demanding
language among four types of child-parent dyads (daughter-mother, son-
mother, daughter-father, son-father) working together on mathematical tasks
in number, algebra, and geometry?
2. To what extent are there gender-related differences in children’s self-
efficacy in mathematics and parents’ competence beliefs for their children’s
success in mathematics?
3. What are the relationships among (a) parents’ competence beliefs for their
children’s success in mathematics, (b) children’s self-efficacy and interest in
mathematics, and (c) cognitively demanding language used by children and
parents when working together on mathematical tasks?
The research questions are based on theories of the role of gender on children’s self-
efficacy (Bandura, 1977, 1993, 1997; Zimmerman 1994, 2000; Pajares, 2002),
parents’ competence beliefs for children, (Eccles, et al., 2000), and ways in which
these affect cognitively demanding language (Tenenbaum and Leaper, 2003). Based
on prior research that has shown gender differences in mathematics performance
within different content areas (Casey et al., 2001), (OECD, 2004) it is hypothesized
that the types of mathematics tasks will also affect cognitively demanding language
used by children and parents.

Olson, Olson & Okazaki
PME31―2007 4-50
BACKGROUND
The Role of Gender in Language Used by Children and Parents Working on
Mathematical Tasks is a three-year project to investigate gender-related differences in
language and actions used by children and parents working on mathematical tasks in
number, algebra, and geometry. During the study data will be collected from 100
child-parent dyads balanced by gender of the parent and of the child (daughter-
mother, son-mother, daughter-father, son-father), with children selected from third
and fourth grade classrooms from schools in Hawai‘i. To initiate a high level of
interaction, the mathematical tasks created by the research team allowed for multiple
solutions or solution methods. Each participating dyad works on three tasks, one
representing each of strands, Number and Operation, Algebra and Geometry (NCTM,
2000). The first year of the study consisted of pilot work with parents and children.
This work included the development of mathematical tasks and parent and child
surveys, creating protocols for conducting the videotaping sessions for the parent-
child dyads, development of coding procedures for the video data analysis,
qualitative software selection and use as well as the analysis of the pilot videotaped
sessions. The actual data collection began in year 2 of the project during the fall of
2006.
THEORETICAL FRAMEWORK
The intent of the research is to extend the knowledge base for gender issues in the
role parents play in children’s mathematics learning. Most prior research on parental
gender typing in academic domains used self-reports (Eccles et al., 2000). This
project goes beyond the use of self-reports and documents language and action of
parents and children as they work on tasks. The academic content, using three
different mathematical content tasks, builds on earlier work in science (Tenenbaum
and Leaper, 2003).
When Crowley et al. (2001) videotaped parent-child conversations while using
interactive science exhibits in a museum, they found that regardless of gender,
children took an active role in choosing and using the interactive science exhibits.
That is, boys and girls were not significantly different in whether they initiated
engagement. However, girls were one-third as likely to hear explanations from their
parents. Even more significant was the type of explanations given: 22% of the
explanations given boys were causal connections, while for girls only 4% were of this
type. This difference was not explained because boys asked more questions, since
children who heard explanations rarely asked questions of any kind.
Tenenbaum and Leaper (2003) investigated parents’ teaching language during
science and nonscience tasks among families recruited from public school, summer
camps, and after-school activities. Parents in their sample were approximately 80%
European American, on average had university degrees, and 25% of fathers were
classified primarily as higher executives and major professionals. Their findings
indicated fathers used more cognitively demanding speech with sons than daughters

Olson, Olson & Okazaki
PME31―2007 4-51
when working with their children on a physics task, but not on a biology task. The
researchers noted that biology is generally viewed as a more gender-neutral field of
study. Our research extends prior research by including child-parent groups from
ethnically diverse schools with 50% to 80% low socio-economic status.
Extending into mathematics, the project is studying language used by children and
parents as they work on tasks in three content areas: number and operations,
reasoning and algebraic thinking and spatial sense and geometry. Number and
operations is one of the first topics introduced into most mathematics curriculum and
is generally seen as a more gender-neutral topic children and parents are comfortable
discussing. Will there be gender differences when children and parents work on a
spatial sense and geometry task? The relationship between spatial sense, the ability
to think and reason through the transformation of mental pictures, and geometry has
been clearly delineated through the Principles and Standards in School Mathematics
(NCTM, 2000). Spatial skills serve as mediators of gender-based mathematics
differences (Burnett, et al.,1979; Casey, et al. 1995; Casey, et al., 1997). Male
students’ advantage on the TIMSS-Male subtest as reported by Casey (2001) was an
indirect effect of two factors: (a) the better spatial-mechanical skills of males, on
average, compared with females and (b) the increased self-confidence that males
have when doing these mathematics problems. Learning for Tomorrow’s World: First
Results from PISA 2003 (Programme for International Student Assessment),
conducted by the Organisation for Economic Co-operation and Development (OECD,
2004) reported performance of 15-year-old males was significantly better than
females on mathematics/space and shape scales than on the three other scales: change
and relationships, quantity, and uncertainty. Prior research showing gender
differences on spatial skills and geometry along with research by Baenninger &
Newcombe (1995) reporting that girls have fewer out-of-school spatial experiences,
gives reason to anticipate there will be gender differences for children and parents
working on the spatial and geometry task.
Based on the longitudinal study by Fennema et al., (1998), it is anticipated some
gender differences on the reasoning and algebraic thinking tasks will occur. Their
longitudinal study found that girls in first and second grades were more likely to use
concrete solution strategies, modeling and counting, while boys tended to use more
abstract solution strategies reflecting conceptual understanding. Third grade boys
were better at applying their knowledge to extension problems.
The importance of parent involvement in mathematics learning of their children has
been described (Burrill, 1996; Perissini, 1998; Civil, 2001). Defining the nature of the
parents’ role remains a question for leaders in mathematics education (Perissini,
1998). How parents and children work together in different mathematics content
areas will provide needed information for all stake holders in children’s mathematics
learning. By building on previous research findings and extending the work into
specific mathematics content this research will contribute new insights in gender-
related research.

Olson, Olson & Okazaki
PME31―2007 4-52
METHODOLOGY
One hundred child-parent dyads balanced by gender of the parent and of the child
(daughter-mother, son-mother, daughter-father, son-father) from third and fourth
grade classrooms from public schools in Hawai‘i were recruited. The participating
schools serve ethnically diverse populations with 50% to 80% low socio-economic
status. During the one-hour videotaped session, a child-parent dyad worked on the
three mathematical tasks, each task has multiple solutions and/or multiple methods of
solution and was designed to provide an opportunity for a high level of interaction
between the parent and child. Prior to working the mathematical tasks, both parents
and children completed a 14-item survey.
Instrument Development
Parent and Child surveys were developed using the extensive data from the
Childhood and Beyond Study (GARP, 2006) conducted at the University of Michigan
by Jacqueline Eccles and other researchers. Childhood and Beyond is a large-scale,
cross-sequential, longitudinal study of development in four primarily white, lower-
middle- to middle-class school districts in Midwestern urban/suburban communities
and included groups of children in kindergarten, first, and third grade. Children's
achievement self-perceptions in various domains and the roles that parents and
teachers play on socializing these beliefs were studied.
Constructs identified by Eccles, such as “personal efficacy, interest and utility value,
and ability” were adapted for our study, resulting in the selection of three domains
being identified: (1) self-efficacy; (2) value/usefulness, and (3) competency beliefs.
Using a five-point Likert scale, parallel surveys were created for parents and children.
The intent of the survey was to collect specific information directly from parents and
students and to compare these data with observational data.
Over the course of five months, surveys were collected from 66 students and 44
parents, from three different public elementary schools in Hawai‘i. Reliability
(Cronchbach’s Alpha) tests were employed to examine the internal consistency of the
survey items. Initially, a nineteen-item survey with six constructs (ability, values,
usefulness, interest, parent involvement, and effort) was proposed. However,
reliability results indicated that only two of the six constructs were reliable (α > .70).
After reducing the number (N = 14) and regrouping some of the survey items, the
reliability of all three constructs improved considerably (α > .84).
Videotape Coding Instrument
The videotapes were transcribed and a coding instrument was developed using six
pilot videos. The coding instrument consisted of three main categories: Getting
started, discussion mode, and vocabulary usage. The getting started section focused
on reading and discussing the task. The discussion mode involved questioning,
directing, and correcting by the parents along with follow-up questions and
statements. The child’s reasoning as prompted by parent’s statements or questions as
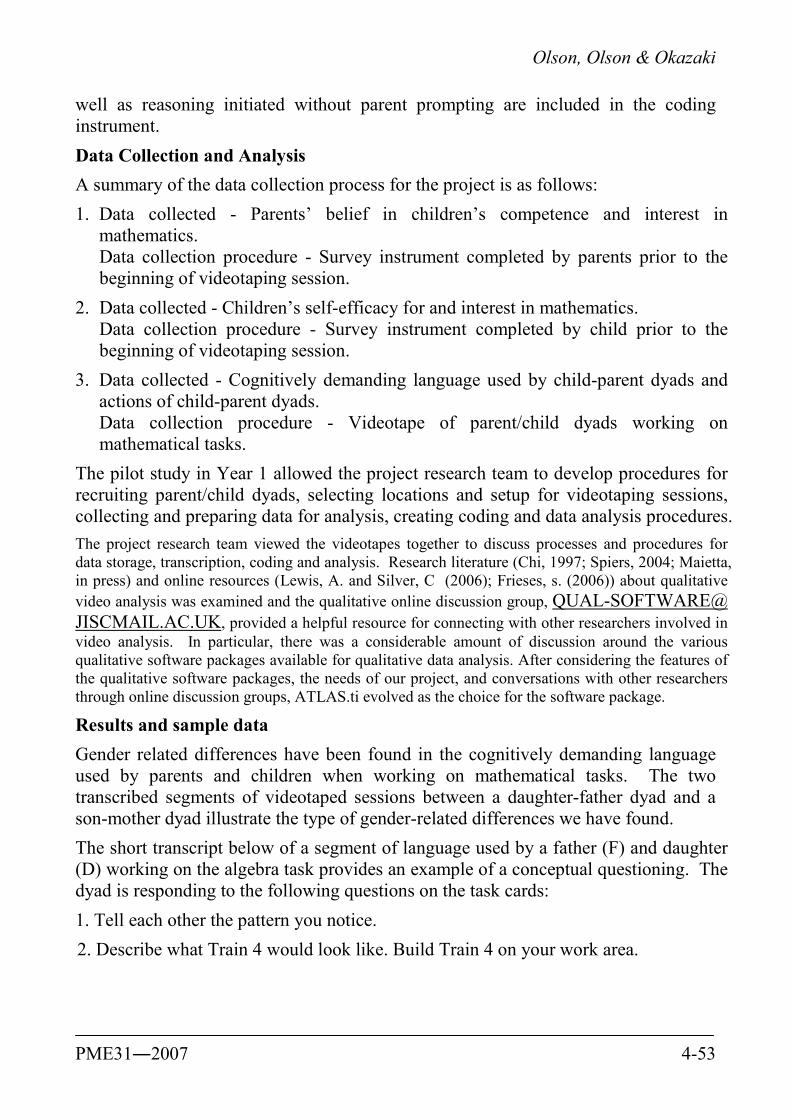
Olson, Olson & Okazaki
PME31―2007 4-53
well as reasoning initiated without parent prompting are included in the coding
instrument.
Data Collection and Analysis
A summary of the data collection process for the project is as follows:
1. Data collected - Parents’ belief in children’s competence and interest in
mathematics.
Data collection procedure - Survey instrument completed by parents prior to the
beginning of videotaping session.
2. Data collected - Children’s self-efficacy for and interest in mathematics.
Data collection procedure - Survey instrument completed by child prior to the
beginning of videotaping session.
3. Data collected - Cognitively demanding language used by child-parent dyads and
actions of child-parent dyads.
Data collection procedure - Videotape of parent/child dyads working on
mathematical tasks.
The pilot study in Year 1 allowed the project research team to develop procedures for
recruiting parent/child dyads, selecting locations and setup for videotaping sessions,
collecting and preparing data for analysis, creating coding and data analysis procedures.
The project research team viewed the videotapes together to discuss processes and procedures for
data storage, transcription, coding and analysis. Research literature (Chi, 1997; Spiers, 2004; Maietta,
in press) and online resources (Lewis, A. and Silver, C (2006); Frieses, s. (2006)) about qualitative
video analysis was examined and the qualitative online discussion group, QUAL-SOFTWARE@
JISCMAIL.AC.UK, provided a helpful resource for connecting with other researchers involved in
video analysis. In particular, there was a considerable amount of discussion around the various
qualitative software packages available for qualitative data analysis. After considering the features of
the qualitative software packages, the needs of our project, and conversations with other researchers
through online discussion groups, ATLAS.ti evolved as the choice for the software package.
Results and sample data
Gender related differences have been found in the cognitively demanding language
used by parents and children when working on mathematical tasks. The two
transcribed segments of videotaped sessions between a daughter-father dyad and a
son-mother dyad illustrate the type of gender-related differences we have found.
The short transcript below of a segment of language used by a father (F) and daughter
(D) working on the algebra task provides an example of a conceptual questioning. The
dyad is responding to the following questions on the task cards:
1. Tell each other the pattern you notice.
2. Describe what Train 4 would look like. Build Train 4 on your work area.

Olson, Olson & Okazaki
PME31―2007 4-54
F: Oh, cool, ok, so, we have to look at the different patterns we see and then
we have to make what we think train 4 would look like. Do you see a pattern? Do
you see anything between train 1 and train 2 that looks kinda similar? Or…
D: Yep.
F: What?
D: How you make this. They are all the same and how you make train 4 is
like…
F: But, before you make train 4, try and explain to me what is the pattern that
you see? Right? What’s the difference between train 1 and train 2?
D: This is just going the same way, it’s the same pattern but it has one extra.
F: Right. Ok, and then train 3…
D: Has…
F: how is it different from train 2?
D: It just has one extra like this one has.
The mother (M) and son (S) in the transcript below are also responding to the same
questions on the task card.
M: What pattern do you notice?
S: The…..I only notice it has, each train has 2 squares and 1 triangle and it
multiplies 1 by 1, 1, 2, 3.
M: OK Mmm
M: Let’s do the task number two.
M: OK and task number 3.
M: So what would the train number be?
S: It would be six and.
M: How many squares would be in that train?
From the above transcription it is observed that the mother asked more perceptual
questions that basically require one-word responses whereas the father asked more
conceptual questions that focused on relationships and more abstract ideas.
References
Baenninger, M., & Newcombe, N. (1995). Environmental input to the development of sex-
related differences in spatial and mathematical ability. Learning & Individual Differences,
7, 363-379.
Bandura, A. (1977). Social Learning Theory. Englewood Cliffs, NJ: Prentice-Hall, Inc.
Bandura, A. (1993). Perceived self-efficacy in cognitive development and functioning.
Educational Psychologist, 28, 117-148.

Olson, Olson & Okazaki
PME31―2007 4-55
Bandura, A. (1997). Self-efficacy : the exercise of control. New York: W.H. Freeman.
Burnett, S. A., Lane, D. L., & Dratt, L. M. (1979). Spatial visualization and sex differences
in quantitative ability. Intelligence, 3, 345-354.
Burrill, G. (1996). President's message: We are making progress. National Council of
Teachers of Mathematics News Bulletin, 3.
Casey, M. B., Nuttall, R. L., & Pezaris, E. (1997). Mediators of gender differences in
mathematics college entrance test scores: A comparison of spatial skills with internalized
beliefs and anxieties. Developmental Psychology, 33, 669-680.
Casey, M. B., Nuttall, R. L., & Pezaris, E. (2001). Spatial-mechanical reasoning skills
versus mathematics self-confidence as mediators of gender differences on mathematics
subtests using cross-national gender-based items. Journal for Research in Mathematics
Education, 32(1), 28-57.
Casey, M. B., Nuttall, R. L., Pezaris, E., & Benbow, C. P. (1995). The influence of spatial
ability on gender differences in mathematics college entrance test scores across diverse
samples. Developmental Psychology, 31, 697-705.
Chi, M.T.H. (1997) Quantifying qualitative analyses of verbal data: A practical guide, The
Journal of the Learning Sciences, 6(3), 271-315.
Civil, M. (2001). Redefining parental involvement: Parents as learners of mathematics.
Paper presented at the NCTM research presession, Orlando, FL.
Crowley, K., Callanan, M. A., Tenenbaum, H. R., & Allen, E. (2001). Parents explain more
often to boys than to girls during shared scientific thinking. Psychology of Mathematics
Education PME – XI, 12(3), 258-261.
Eccles, J. S., Frome, P., Yoon, K. S., Freedman-Doan, C., & Jacobs, J. (2000). Gender-role
socialization in the family: A longitudinal approach. In T. Eckes & H. M. Trautner (Eds.),
The developmental social psychology of gender (pp. 333-360). Mahwah, NJ: Lawrence
Erlbaum Associates, Inc., Publishers.
Fennema, E., Carpenter, T. P., Jacobs, V. R., Franke, M. L., & Levi, L. W. (1998). A
longitudinal study of gender differences in young children's mathematical thinking.
Educational Researcher, 27, 6-11.
Frieses, S. Computer-aided qualitative data analysis of multimedia data. Retrieved July,
2006, from http://teams.gemstone.umd.edu/calimo/friesmultimedia.pdf.
Gender and Achievement Research Program (GARP), Childhood and Beyond Study (CAB),
retrieved from http://www.rcgd.isr.umich.edu/cab/ January, 2006.
Lewis, A and Silver, C (2006) Choosing a CAQDAS Package, CAQDAS Networking
Project, Retrieved August, 2006 from http://caqdas.soc.surrey.ac.uk/
Maietta, R. (in press) State of the Art: Integrating software with qualitative analysis. In
Leslie Curry, Renee Shield and Terrie Wetle, (Eds) Applying Qualitative and Mixed
Methods in Aging and Public Health Research. Washington, D.C.: American Public
Heath Association and the Gerentological Society of America.

Olson, Olson & Okazaki
PME31―2007 4-56
National Council of Teachers of Mathematics. (2000). Principles and standards for school
mathematics. Reston, VA: National Council of Teachers of Mathematics.
OECD. (2004). Learning for tomorrow's world: First results from PISA 2003: Organisation
for Economic Co-operation and Development.
Pajares, F. (2002). Gender and perceived self-efficacy in self-regulated learning.
Peressini, D. D. (1998). The portrayal of parents in the school mathematics reform
literature: Locating the context for parental involvement. Journal for Research in
Mathematics Education, 29(5), 555-582.
Spiers, J. A. (2004). Tech Tips: Using Video Management/ Analysis Technology in
Qualitative Research. International Journal of Qualitative Methods 3 (1) April, 2004.
Tenenbaum, H. R., & Leaper, C. (2003). Parent-child conversations about science: The
socialization of gender inequities? Developmental Psychology, 39(1), 34-47.
Zimmerman, B. J. (1994). Dimensions of academic self-regulation: A conceptual
framework for education. In D. H. Schunk & B. J. Zimmerman (Eds.), Self-regulation of
learning and performance: Issues and educational implications (pp. 3-21). Hillsdale, NJ:
Erlbaum.
Zimmerman, B. J. (2000). Self-efficacy: An essential motive to learn. Contemporary
Educational Psychology, 25, 82-91.

2007. In Woo, J. H., Lew, H. C., Park, K. S. & Seo, D. Y. (Eds.). Proceedings of the 31st Conference of
the International Group for the Psychology of Mathematics Education, Vol. 4, pp. 57-64. Seoul: PME. 4-57
-25
STUDENTS’ MOTIVATION AND ACHIEVEMENT AND
TEACHERS’ PRACTICES IN THE CLASSROOM
Marilena Pantziara and George Philippou
Department of Education, University of Cyprus
This paper presents some preliminary results of a larger study that investigates the
relationship between teachers’ practices in the mathematics classroom and students’
motivation and their achievement in mathematics. Data were collected from 321 sixth
grade students through a questionnaire comprised of three Likert-type scales
measuring motives, goals and interest, a test measuring students’ understanding of
fraction concept and an observation protocol observing teachers behaviour in the
classroom. Findings revealed that the instructional practices suggested by
achievement goal theory and mathematics education research promote both students’
motivation and achievement in mathematics.
BACKGROUND AND AIM OF THE STUDY
According to Bandura’s sociocognitive theory (1997), student’s motivation is a
construct that is built out of individual learning activities and experiences, and it varies
from one situation or context to another. In line with this respect, the mathematics
reform literature promotes practices presumed to enhance motivation, because high
motivation is considered both a desirable outcome itself and a means to enhance
learning (Stipek et. al., 1998).
Four basic theories of social-cognitive constructs regarding student’s motivation have
so far been identified: achievement goal orientation, self-efficacy, personal interest in
the task, and task value beliefs (Pintrich, 1993). In this study we conceptualise
motivation according to achievement goal theory because it has been developed within
a social-cognitive framework and it has studied in depth many variables which are
considered as antecedents of student motivation constructs. Some of these variables are
students’ inner characteristics concerning motivation (e.g. fear of failure and self
efficacy), teacher practices in the classroom that are associated with students’ adoption
of different achievement goals and demographic variables (e.g. gender) (Elliot, 1999).
Achievement goal theory is concerned with the purposes students perceive for
engaging in an achievement-related behaviour and the meaning they ascribe to that
behaviour. A mastery goal orientation refers to one’s will to gain understanding, or
skill, whereby learning is valued as an end itself. In contrast, a performance goal
orientation refers to wanting to be seen as being able, whereby ability is demonstrated
by outperforming others or by achieving success with little effort (Elliot, 1999).
These goals have been related consistently to different patterns of achievement-related
affect, cognition and behaviour. Being mastery focused has been related to adaptive
perceptions including feelings of efficacy, achievement, and interest. Although the
research on performance goals is less consistent, this orientation has been associated

Pantziara & Philippou
PME31―2007 4-58
with maladaptive achievements beliefs and behaviours like low achievement and fear
of failure (Patrick et. al., 2001).
Environmental factors are presumed to play an important role in the goal adoption
process. If the achievement setting is strong enough it alone can establish
situation-specific concerns that lead to goal preferences for the individual, either in the
absence of a priori propensities or by overwhelming such propensities (Elliot, 1999).
Goal orientation theorists (Ames, 1992) emphasize at least six structures of teacher
practices that contribute to the classroom learning environment, namely Task,
Authority, Recognition, Grouping, Evaluation, and Time (TARGET). Task refers to
specific activities, such as problem solving or routine algorithm, open questions or
closed questions in which students are engaged in; Authority refers to the existence of
students’ autonomy in the classroom; Recognition refers to whether the teacher
recognizes the progress or the final outcome of students’ performance and whether
students’ mistakes are treated as natural parts of the learning process by the teacher;
Grouping refers to whether students work with different or similar ability peers.
Evaluation refers to whether grades and test scores are emphasized by the teacher and
made in public or whether feedback is substantive and focuses on improvement and
mastery; Time refers to whether the schedule of the activities is rigid.
These instructional practices are similar to ones promoted by mathematics education
reformers to achieve both motivational and mathematics learning objectives (Stipek et.
al., 1998). Specifically, mathematics reformers have recommended that efficient
mathematics teachers emphasize focusing on process and seeking alternative solutions
rather than on following a set solution path. Moreover, efficient teachers press students
for understanding, they treat students’ misconceptions in mathematics and they use
different visual aids in order to make mathematical learning more interesting and
meaningful. Additionally, they give students opportunities to engage in mathematical
conversations, incorporating students’ erroneous solutions into instruction and giving
substantive feedback rather than scores on assignments.
Moreover, there is some evidence that teachers’ affect, like enthusiasm for
mathematics and their sensitivity concerning students’ treatment might affect students’
emotions related to mathematics objectives (Stipek et. al., 1998). Yet, despite the
evidence of association between students’ motivation and important
achievement-related outcomes (Stipek et. al., 1998), there is scarcity of research that
studies in details how teachers influence their students’ perception of the goals
focusing on class work and on instructional practices that promote students’ interest,
self-efficacy, or students’ fear of failure and all these vis-à-vis students’ achievement.
In this respect the aims of the study were:, as their personal interest in the task.
• To confirm the validity of the measures for the five factors: fear of failure,
self-efficacy, mastery goals, performance approach goals, and interest, in a
specific social context, and also to confirm the validity of a test measuring
students’ achievement in fraction concept.

Pantziara & Philippou
PME31―2007 4-59
• To identify differences among classrooms in students’ motivation and
achievement and examine teachers´ practices to which these differences might
be attributable.
METHOD
Participants were 321 sixth grade students, 136 males and 185 females from 15 intact
classes. All students-participants completed a questionnaire concerning their
motivation in mathematics and a test for achievement in the mid of the second semester
of the school year.
The questionnaire for motivation comprised of five scales measuring: a) achievement
goals (mastery goals) b) performance goals, c) self-efficacy, d) fear of failure, and e)
interest. Specifically, the questionnaire comprised of 31 Likert-type 5-point items (1-
strongly disagree, and 5 strongly agree). The five-item subscale measuring mastery
goals, as well as the five-item measuring performance goals were adopted from PALS;
respective specimen items in each of the two subscales were, “one of my goals in
mathematics is to learn as much as I can” (Mastery goal) and “one of my goals is to show
other students that I’m good at mathematics” (Performance goal). The five items
measuring Self–efficacy were adopted from the Patterns of Adaptive Learning Scales
(PALS) (Midgley et. al., 2000); a specimen item was “I’m certain I can master the skills
taught in mathematics this year”. Students’ fear of failure was assessed using nine items
adopted from the Herman’s fear of failure measure (Elliot and Church, 1997); a
specimen item was “I often avoid a task because I am afraid that I will make mistakes”.
Finally, we used Elliot and Church (1997) seven-item scale to measure students’
interest in achievement tasks; a specimen item was, “I found mathematics interesting”.
These 31 items were randomly spread through out the questionnaire, to avoid the
formation of possible reaction patterns.
For students’ achievement we developed a three-dimensional test measuring students´
understanding of fractions, each dimension corresponding to three levels of conceptual
understanding (Sfard, 1991). The tasks comprising the test were adopted from
published research and specifically concerned the measurement of students’
understanding of fraction as part of a whole, as measurement, equivalent fractions,
fraction comparison (Hanulla, 2003; Lamon, 1999) and addition of fractions with
common and non common denominators (Lamon, 1999).
For the analysis of teachers’ instructional practices we developed an observational
protocol for the observation of teachers’ mathematics instruction in the 15 classes
during two 40-minutes periods. The observational protocol was based on the
convergence between instructional practices described by Achievement Goal Theory
and the Mathematics education reform literature. Specifically, we developed a list of
codes around six structures, based on previous literature (Stipek et. al., 1998; Patrick et.
a., 2001), which influence students’ motivation and achievement. These structures
were: task, instructional aids, practices towards the task, affective sensitivity,
messages to students, and recognition. During classroom observations, we identified
Pantziara & Philippou
PME31―2007 4-60
the occurrence of each code in each structure. The next step of the analysis involved
estimating the mean score of each code using the SPSS and creating a matrix display of
all the frequencies of the coded data from each classroom. Each cell of data
corresponded to a coding structure.
FINDINGS
With respect to the first aim of the study, confirmatory factor analysis was conducted
using EQS (Hu & Bentler, 1999) in order to examine whether the factor structure
yields the five motivational constructs expected by the theory. By maximum likelihood
estimation method, three types of fit indices were used to assess the overall fit of the
model: the chi-square index, the comparative fit index (CFI), and the root mean square
error of approximation (RMSEA). The chi square index provides an asymptotically
valid significance test of model fit. The CFI estimates the relative fit of the target
model in comparison to a baseline model where all of the variable in the model are
uncorrelated (Hu & Bentler, 1999). The values of the CFI range from 0 to 1, with
values greater than .95 indicating an acceptable model fit. Finally, the RMSEA is an
index that takes the model complexity into account; an RMSEA of .05 or less is
considered to be as acceptable fit (Hu & Bentler, 1999). A process followed for the
identification of the five factors including the reduction of raw scores to a limited
number of representative scores, an approach suggested by proponents of SEM.
Particularly, some items were deleted because their loadings on factors were very low
(e.g. 1.3.18. and f.5.28). In addition some items were grouped together because they
had high correlation (e.g. f.1.5 and f.3.17). Then in line with the motivation theory, a
five-factor model was tested (fig. 1). Items from each scale are hypothesized to load
only on their respective latent variables. The fit of this model was (x2 =691.104, df=
208, p<0.000; CFI=0.770 and RMSEA=0.086). With the addition of correlations
among the five factors the measuring model has been improved (x2 =343.487, df= 198,
p<0.000; CFI=0.931 and RMSEA=0.049).
Figure 1 shows that factor loadings range from 0.399 to 0.862. Students’ interest is
positively correlated with self-efficacy and negatively correlated with fear of failure. In
addition, self-efficacy is negatively correlated with fear of failure. In conclusion, the
existence of the five factors and their correlations has been verified in a different social
context and supports the results of other studies (Elliot & Church, 1997; Elliot 1999).
To test the validity of the measure of students’ achievement on the fraction test, we
employed Rasch analysis for the entire sample so as to create a hierarchy of the items
difficulty. The Rasch model is appropriate for the specification of this scale because it
enables the researcher to test the extent to which the data meets the requirement that
both students’ performance on the items of the fraction test and the difficulties of the
items form a stable sequence (within probabilistic constraints) along a continuum
(Bond & Fox, 2001).

Pantziara & Philippou
PME31―2007 4-61
Fig.1. The factor model of students’ motivation with factor parameter estimates.
We found that almost all students correctly answered three items at the easy end of the
scale which involved tasks belonging to the interiorization level (94,4%, 89,7%, and
86,3%, respectively), and referred equivalence of fractions, comparison and addition
of fractions with common denominators. On the other hand, only a small proportion of
high achievers were able to get through the three items at the hard end of the scale,
which involved tasks of the reification level (14,6%, 16,8%, and 18,1%, respectively).
Specifically, these items addressed competence in fraction equivalence using the
variable X, representing the addition of fractions with non common denominators and
the comparison of fractions (all scales and the fraction test are available on request).
To examine the second aim of the study we used ANOVA, using LSD (Least
significant difference) on the scores of each of the motivational constructs and the
achievement test, to search for differences between the 15 classrooms. Significant

Pantziara & Philippou
PME31―2007 4-62
differences between classrooms were found in all five motivational constructs, namely
in terms of mastery goals (F=3,274 p<0,000), performance goals (F=6,018, p=0,000),
self efficacy beliefs (F=3,368, p<0,000), fear of failure (F=2,545 p=0,002), interest on
mathematics (F=4,377 p<0,000) and achievement (F=3,111 p<0,000). The LSD
method showed that students in class 14 declared the highest interest on mathematics
and the highest self-efficacy beliefs. Students in class 3 were characterized by the
highest performance goals, students in class 10 by the highest mastery goals and
students in class 11 by the highest fear of failure. Table 1 presents the classes with the
extreme means in each of the five motivational constructs.
Interest Performance goals Mastery goals Self-efficacy Fear of failure
High
Mean
Low
Mean
High
Mean
Low
Mean
High
Mean
Low
Mean
High
Mean
Low
Mean
High
Mean
Low
Mean
Class
14
Class
6
Class
3
Class
12
Class
10
Class
9
Class
14
Class
4
Class
11
Class
13
4,55 2,96 4 2,03 4,85 4,23 4,45 3,5 2,94 2,06
Table 1. Classes with the highest and lowest means in motivational measures
A first analysis of the observational data involved isolating the two classes at the
highest and lowest extremes of specified motivational construct and comparing the
means of each code in the six factors to identify commonalities and differences in
teacher behaviours and instructional practices of the two classes. This approach is
similar to the one used by Patrick et., al. (2001). In this study, we compare the
instructional practices used by the teachers in classes 14, 6 and 3, 12 with respect to
interest and performance goals, because these couples of classes exhibit the greatest
difference between the highest and the lowest means.
The teacher in class 14 (highest student’s interest in mathematics) had 14 years of
experience, a strong background in mathematics and a master’s degree, not in
mathematics education. The teacher in class 6 (lowest student’s interest in
mathematics) had 29 years of experience, and a low background in mathematics. As far
as it concerns the task, both teachers used problem solving activities, open and closed
questions, as well as drill and practice activities; One difference in instructional
procedures was that teacher 14 tried to lead students to connect the new knowledge to
existing, while teacher 6 used to do nothing about that, as well as to make connections
between different mathematical ideas. Teacher 14 further made extensive use of
various visual aids in the mathematics lesson, while teacher 6 avoided using any.
Concerning practices towards the task, teacher 14 frequently asked students to provide
reason for their choices and solution plans while teacher 6 focused on getting the
correct answer without bothering about reasoning. Teacher 14 was also concerned
about student’s understanding, something that was not at all observed in teacher 6
teaching. As far as it concerns affect both teachers were quite sensitive and respected
students´ personality. With respect to messages sent to students, teacher 14 was clear to
students that erroneous answers were part of the lesson while teacher 6 did not.

Pantziara & Philippou
PME31―2007 4-63
Concerning recognition, teacher 14 openly recognized students’ efforts, e.g., making
positive comments, while teacher 6 did not.
The teacher in class 3 (highest student’s performance goals) had 18 years of experience
and a strong background in mathematics while teacher 12 (lowest student’s
performance goals) had 29 years of experience and also a strong background in
mathematics too. As far as it concerns task, both teachers used mostly problem solving
activities, as well as open questions. Their difference in this respect was that teacher 12
tried to lead students to connect the new knowledge to existing and make connections
between different mathematical ideas while teacher 3 failed to do that; instead he used
more closed questions. Further, teacher 3 made use of visual aids in some extend, while
teacher 12 did not use any. With respect to practices, teacher 12 frequently asked
students to justify their answers while teacher 3 did not asked students for any
justification. As far as it concerns affect teacher 12 was relatively more sensitive with
students while teacher 3 was strict. In the category message, both teachers made clear
to students that erroneous answers were part of the lesson. Finally, both teachers gave
evidence that they recognize students’ efforts.
As far as it concerns achievement, class 5 had the highest mean score (.881 out of 1)
and class 13 the lowest (-.404 out of 1). Teacher in class 5 had 5 years of experience, a
strong background in mathematics and a master’s degree in educational psychology
while teacher 13 had 32 years of experience and a low background in mathematics. As
far as it concerns task, teacher in class 5 used mostly open questions while teacher 13
used closed questions; teacher 5 used plenty of visual aids while teacher 13 did not use
any. In the structure teachers’ practices, teacher 5 was pressing students for
understanding and tried to clear students’ misconceptions while teacher 13 did not
made use of these practices. With regard to affect, the teacher in class 5 was more
sensitive to students than teacher 13. As regards the messages sent to students, teacher
5 was clear to students that errors were part of the instruction while teacher 13 could
hardly hide his rejection of errors. In respect to recognition teacher 5 frequently praised
students’ behaviour and built on their thinking.
DISCUSSION
In the present study we tried to shed some more light on students motivational
environments by analysing questionnaire data and observations as a means towards
identifying teachers’ practices associated with the students’ highest and lowest
motivational constructs and achievement. The model found in this study that correlates
the five motivational constructs is in line with other studies (Elliot & Church, 1997).
The higher correlations identified in this study were between self-efficacy and fear of
failure, and between interest and fear of failure. As it was expected, correlation
between mastery and performance goals was small.
It emerged from the observations that there are certain teachers' practices, such as
problem solving activities, the use of open questions, and the use of visual aids in the
mathematics classroom, that seem to be positively associated with both students’

Pantziara & Philippou
PME31―2007 4-64
motivation and achievement. These findings confirm earlier findings by Partick et. al.,
(2001). Some important practices associated with high interest and achievement and
low performance goals identified by this study were the connection of the new
mathematical ideas with students’ existing knowledge, pressing students for
understanding and dealing with students’ misconceptions. In addition the findings of
the study suggest that a warm environment in which the teacher genuinely cares and
respect students is associated with students’ high interest, high achievement and low
performance. The connection of affect to motivation and performance has been
underlined by Stipek, et. al. (1998). Further investigation of teacher’s practices in the
classroom that are associated with students’ motivation and achievement and the way
these findings can be implemented in schools will take place in this on-going study.
References
Ames, C. (1992). Classrooms: Goals, structures, and student motivation. Journal of
educational Psychology, 84, 261–271.
Bandura, A. (1997). Self-efficacy: The exercise of control. New York: Freeman.
Bond, T.G., & Fox, C.M. (2001). Applying the Rasch model: Fundamental measurement in
the human sciences. Mahwah, NJ: Erlbaum.
Elliot, E & Church, M. (1997). A hierarchical model of approach and avoidance
achiemevment motivation. Journal of Personality and Social Psychology, 72, 218-232.
Elliot, A. (1999). Approach and avoidance motivation and achievement goals. Journal of
Educational Psychology, 80, 260-267.
Lamon, S. (1999). Teaching fractions and ratios for understanding. Essential content
knowledge and instructional strategies for teachers. London: Lawrence Erlbaum
Associates.
Midgley, C., et al., (2000). Manual for the Patterns of Adaptive Learning Scales. Retrieved
November 2nd 2004, from http://www.umich.edu/~pals/manuals.html
Hannula, M., (2003). Locating fraction on a number line. In N. A. Pateman, B. J. Doherty, &
J. Zilliox (Eds.), Proc. 27th Conf. of the Int. Group for the Psychology of Mathematics
Education (Vol. 3, pp. 17-24). Honolulu, USA: PME.
Hu, L., & Bentler, P.M. (1999). Cutoff criteria in fix indexes in covariance structure analysis:
Conventional criteria versus new alternatives. Structural Equation Modelling, 6 (1), 1-55.
Pintrich, P. (2003). A motivational science perspective on the role of student motivation in
learning and teaching contexts. Journal of educational Psychology, 95 (4), 667–686.
Sfard, A., (1991). Dual nature of mathematical conception. Educational Studies in
Mathematics, 22 (1), 1-36.

2007. In Woo, J. H., Lew, H. C., Park, K. S. & Seo, D. Y. (Eds.). Proceedings of the 31st
Conference of
the International Group for the Psychology of Mathematics Education, Vol. 4, pp. 65-72. Seoul: PME. 4-65
USING A MULTIPLICATIVE APPROACH TO CONSTRUCT
DECIMAL STRUCTURE
Irit Peled*, Ruth Meron** and Shelly Rota**
*University of Haifa / **Center for Educational Technology, Israel
This study suggests an alternative instructional sequence intended to promote
children's construction and understanding of decimal structure through a
multiplicative perspective. Using a constructivist approach 3rd
grade children are
engaged in tasks that call for challenging investigations to determine what orders can
be met in a Cookie Factory where cookies come in a limited number of box types. In the
article we demonstrate the power of this didactical model in eliciting rich strategies
and in facilitating the emergence of decimal structure understanding through
reasoning with number multiples.
INTRODUCTION
In this study we present an alternative instructional trajectory to introducing decimal
structure that takes a constructivist view of learning. This alternative approach is based
on children's earlier knowledge of multiplication, introducing the new structure as a
special case of multiplicative structures. This study describes the teaching trajectory,
demonstrating how the planned sequence enables conceptual change while still leaving
room for children's own knowledge construction.
THEORETICAL BACKGROUND
Place value and decimal system instruction
Children have a lot of trouble in constructing their decimal system and place value
number concepts, carrying these difficulties further on into their learning of multidigit
operations. Kamii (1986) analyses the complexity of place value knowledge and Ross
(1989) shows that even fourth and fifth graders lack good understanding of place
value.
Hiebert and Wearne (1992) and Wearne and Hiebert (1994) demonstrate the
importance of learning mathematics with understanding, claiming that learning
numbers with an emphasis on place value meaning rather than on symbol
manipulations, has a positive effect and proves to be beneficiary in the long run. While
their suggestion emphasizes the importance of teaching multi-digit operations with
understanding right from the start, Segalis and Peled (2000) show that it is not too late
to develop conceptual understanding of multidigit procedures at a later point by
making the right connections.
The extent of the problem and topic importance are self evident in an international
study detailed by Fuson et al. (1997), comparing four different projects on teaching and
learning multidigit number concepts and multidigit number operations. All four

Peled, Meron & Rota
PME31―2007 4-66
projects support learning number concept and operations with understanding. In some
of the projects children learn place value concepts using base-ten blocks, in others they
use different kinds of base-ten materials such as Montessori Cards, number charts, or
frames with many rows of moveable beads (ten in a row). In one of the projects (CBI),
children are given word problem situations involving packaging in tens with the
intention to assist them in constructing meaning for the written symbol. In this project,
and in the other projects as well, children are given word problems and are encouraged
to invent procedures for multidigit addition and subtraction. One of the projects
(STST) involves urban Latino children. These children learn to represent tens and
hundreds as new units with special symbols and apply their symbolic representations
in real-world problems involving grouping activities.
The acts of grouping units into groups of tens and tens into groups of hundreds have
often been supported and constructed by various packaging activities and regrouping
of physical objects. The STST project uses contexts such as a doughnut store or money
expenditures. The store context has single doughnuts, boxes of ten doughnuts, and
baking trays of 100 doughnuts (or 10 boxes of ten).
In a computer based project Champagne and Rogalska-Saz (1984) let children pack
and unpack bundles of sticks or use a special version of “messy” Dienes Blocks. In this
messy version a long box holds ten unit cubes and a square box hold ten long boxes or
100 unit cubes. This modification replaces the act of trading (using "the bank") with
acts of grouping and regrouping with no need of “external” help. The computer
environment enables children to use these acts in mapping between number operations
and physical representations.
A constructivist perspective
While the computer assisted instruction was structured, aiming towards a specific
traditional algorithm, other projects (including the abovementioned four projects) give
children more room for invention. With a constructivist view on learning, Cobb et al.
(Cobb, Yackel, & Wood, 1992; McClain, Cobb, & Bowers, 1998) conducted a nine
week teaching experiment with third graders, during which the researchers designed a
sequence of instructional activities in collaboration with Gravemeijer in the spirit of
Realistic Mathematics Education (RME) as described by Gravemeijer (1997).
The sequence is built around yet another packaging situation called “The Candy
Factory” and was designed “to support third graders’ construction of increasingly
sophisticated conceptions of place value numeration and increasingly efficient
algorithms for adding and subtracting three-digit numbers”. The researchers
emphasize that “the goal was not to ensure that all the students would eventually use
the traditional algorithm.” According to McClain (who was also the teacher) et al.
(1998), initial whole-class discussions started with the students and teacher negotiating
“the convention that single pieces of candy were packed into rolls of ten and ten rolls
were packed into boxes of one hundred.” Following this initial agreement, children
were engaged in estimations involving looking at drawings of rolls and pieces of candy.

Peled, Meron & Rota
PME31―2007 4-67
Further activities involved packing and unpacking activities using Unifix blocks and
developing a coding system to record the actions. An important part of the activity
involved the symbolic description with pictures or tally marks or numerals. The final
phase consisted of using an “inventory form” to record addition and subtraction
operations corresponding to acts of filling orders or increasing inventory.
The construction of new units and its connection to multiplication
Understanding decimal structure is a process that involves the construction of new
units. Fuson (1990) details difficulties involved with this process and investigates
conditions that affect it. She demonstrates the positive effect of instructional models
that use a representation of tens and hundreds as units (e.g. Dienes blocks) and,
similarly, the effect of having a language that uses tens and hundreds as units in
number names, on developing new decimal unit conceptions.
The conception of a three digit number as consisting of three different types of units
(e.g. view a number such as 432 as 4 of a new unit called hundred, 3 of a new unit
called ten and 2 of the unit one) involves a combination of multiplicative
understanding, with place value knowledge. While the amount taken of each unit is
shown, the unit itself is hidden and coded by place value. Obviously this is not a simple
extension of multiplicative structure. However, as we will show, through this partial
similarity, multiplicative structure can offer a bridging trajectory to the further
construction of decimal structure.
In developing their multiplicative conceptions children have to undergo some
transitions from counting by ones to counting by an emerging new counting unit, a
complex process which is thoroughly investigated and described by Steffe (1988). The
operations of multiplication and division involve coordination between creating
groups or measuring with the new unit, while at the same time keeping a count of the
number of groups using a different counting unit (the original ones). By the time
children start third grade, which is when our curriculum extends decimal structure
knowledge beyond 2-digit numbers, they have been introduced to multiplication.
Thus, the instructional unit that we have designed has, in fact, a double purpose. It is
aimed at strengthening the understanding of multiplicative structure while at the same
time using these structures to create new insights of decimal structure.
THE INSTRUCTIONAL SEQUENCE
In the present study we use a context and a constructivist view similar to those used in
the Candy Factory. However, our approach to introducing the decimal structure is very
different. We start with a long process of investigations, focusing on multiplicative
structures. We attribute more importance to the process of re-inventing the base ten
grouping, and to perceiving the base-ten grouping as a special case of other possible
multiplicative groupings. The purpose of this study is to investigate whether children
manage to make relevant and meaningful discoveries in this designed instructional
trajectory. In our broader study we have conducted teacher workshops to explore

Peled, Meron & Rota
PME31―2007 4-68
whether teachers are able to comprehend this didactical model and appreciate its
potential effect on children. This part will not be reported here.
The context: The Cookie Factory. The factory has cookie boxes that can hold a certain
fixed amount of cookies. At some point the factory only has 2 types of boxes, at a later
point it might have 3 types of boxes. People come to the factory to buy cookies. The
constraints: They can only buy a quantity that can be supplied using the current factory
boxes. For example, if the factory uses only boxes containing 15 or 6 cookies, the
sellers would be able to give 36 cookies (they might deliberate on whether to use 2
boxes of 15 and 1 box of 6 or 6 boxes of 6, an efficiency criterion of using a smaller
number of ready-made boxes can be discussed). They would have to investigate if and
how they can give 33 cookies, and would find out that they are unable to supply an
order for 25 cookies.
Figure 1: An example of available box types (cardboard cut-outs).
Children are given the current factory constraints and told that the workers are
interested in investigating which quantities can be supplied. That is, what quantities
can be generated by current box types. Figure 1 shows the boxes available in one such
case, where the box types are 25 and 10.
Following several class sessions with investigations of this kind, children are told that
the factory engineers need help in deciding which 3 box types to use. The children's
task is to come up with suggestions that would have the following features: Cover as
many orders as possible, supply the order using as little boxes as conditions allow, and
decide quickly how the order should be supplied.
It is expected that class discussion will lead to the idea that the choice of boxes with
100, 10, 1, has many advantages, although with some numbers it is not ideal. Even if
some children will not agree on making it their own choice, they will be able to get the
feel of the nature of using this choice.
The discovery of the power and meaning of the 100,10,1 option is expected to come as
a surprise involving an “aha” reaction. In the following section we describe some
episodes from our grade 3 implementation of the instructional trajectory, paying
special attention to identifying the moment of discovery.

Peled, Meron & Rota
PME31―2007 4-69
IMPLEMENTATION OF THE INSTRUCTIONAL TRAJECTORY
The initial activities were expected to engage children in finding linear combinations
of multiples of given quantities. They were meant to promote reasoning about efficient
investigations, about data recording and about data representation. As expected,
children found several different ways to generate what orders can be supplied, and
record how the orders can be supplied.
Two main ways to generate possible orders involved the use of a hundreds table and
the use of a linear combinations table. The first table depicted the number sequence,
where children circled amounts that could be supplied, the second table had multiples
of one box type on one dimension, and another box type on the other dimension, as
depicted in Figure 2 for the case of boxes with 6 or 10 cookies.
Figure 2: Ido's generation of some of the possible orders for 6 and 10.
In a reflection on his work, Ido wrote in his notebook: When I got to task number 14, I
wanted to know what quantities can be supplied not just between 60 and 75 but beyond
that. So I decided to make a table like a multiplication table only one side has 6 and the
other 10 according to the quantities. So if I will take the number 38, for example, it is 3
boxes of 3 (he meant to say 6) and 2 boxes of 10 according to the table. This way I
could tell what amounts can be generated and supplied. (Ido added a comment
underneath the table depicted in Fig. 2 saying that: I did more. Meaning he actually
generated a bigger table and only gave a partial example in his notebook.)
The investigations had benefits beyond their intended aim in the decimal instruction
sequence to promote decimal system understanding. The use of number multiples in a
rich variety of tasks resulted in emergent fluency of number multiples. We even started
hearing comments from parents who expressed their surprise in children’s fluency with
multiples such as 25 and 20. The time “investment” in these activities also paid off
later when children got to another topic studied in third grade dealing with divisibility
criteria. Once they realized that the question “Is this number divisible by 6?” is
equivalent to the more familiar question “Can this number order of cookies be supplied
using only boxes of 6 cookies?” the task became clear.

Peled, Meron & Rota
PME31―2007 4-70
The investigation on the choice of 3 new box types was a crucial point, where children
were expected to discover the power of the decimal expression. As it turned out, this
activity achieved its goal. The following section details the events leading to this
discovery.
Children were working in groups. Each group had a list of orders as examples and
could choose to consider any additional orders. When they were done, each group
presented and explained its choice. It is interesting to note that one of the groups had
chosen 1,10,100, but at the point of presenting the different suggestions no one saw
anything special with their offer. In the following excerpt two of the groups present
their choices and then the teacher asks the whole class to select the best choice.
Orit (presents the choice of her group): We decided on 1, 2, 100.
Teacher: Why 100?
Orit: Because if they order 200, you can take 2 boxes of a 100.
Teacher: Why 2?
Orit: With 2 we can do many numbers 2+2=4, 2+2+2=6, we can supply orders of even numbers.
Teacher: Why 1?
Orit: With 1 we can build all the numbers. If we need an odd number, we can add 1 to the even number.
Benny (presents the choice of his group): We suggest 1, 25, 10.
Teacher: Why 10?
Benny: With 10 we can supply tens and hundreds.
Teacher: Why 25?
Benny: With 25 we can supply hundreds using less boxes than we need with 10.
Teacher: Why 1?
Benny: To be able to supply the units.
Teacher: Is there an order you could not supply?
Benny: No.
Teacher (turning to the whole class and starting a discussion): What, in your opinion, is the best suggestion?
Matan (voting for a choice made by another group): 1, 10, 25, because it has 1 with which you can supply both even and odd numbers.
Teacher: What would happen if I will have to supply an order for 124?
Matan: I will take 4 boxes of 25 for the 100, 2 boxes of 10 and 4 boxes of 1.
Shahar (at this point only realizing that instead of taking 4 boxes of 25, they might take 1 box of 100): So then the suggestion of 1, 10, 100 is better because I can take 1 box of 100, 2 of 10 and 4 of 1, and it's less boxes.
Aviv (suddenly noting the power of Shahar's suggestion, while Shahar herself was not aware of it): With 1, 10, 100 you can make anything! Any number you give,

Peled, Meron & Rota
PME31―2007 4-71
it (the number itself) immediately tells you how many boxes of each type you need! For example – give me a number.
Oren: 973.
Aviv: So it's 9 boxes of 100, 7 boxes of 10, and 3 boxes of 1.
Shahar: There is another advantage to 1, 10 and 100 - the boxes can be [well] organized.
As can be seen in Orit's and Benny's presentations, each of these groups had very good
argumentations to support their choice of box sizes. Similarly good arguments were
presented by the other groups as well.
The discussion that followed these presentations demonstrated how the realization of
the power of the decimal expression can emerge in the course of a whole class
discussion following investigations that make such a discovery possible. It is also clear
from this excerpt that the discovery is not a product of one mind but a result of the
accumulation of many ideas. In this specific example it started with the fact that
Benny's group suggested a certain choice, which was appreciated by Mathan. Then
came Shahar with her idea of exchanging 4 of 25 with 1 box of hundred, triggering
Aviv's final realization of the more complete and powerful picture.
DISCUSSION
This study investigates a new approach to learning the meaning of the decimal
structure. Specifically, it uses a multiplicative approach that is based on viewing the
decimal expression of a number as a special combination of multiples.
This approach was realized through the design of a Cookie Factory story context. The
sequence of activities was constructed in the spirit of the Realistic Mathematics
Education approach with a constructivist view on learning and was tried with 3rd
graders.
The data we presented from this implementation showed that the instructional
sequence was successful from several perspectives. As seen in the class excerpt,
children were able to discover a meaningful connection between their investigations
with boxes of cookies and the decimal representation of a number.
In addition to that, the tasks elicited investigations that were characterized by deep
mathematical thinking, good argumentation, development of strategies for recording
data, and development of search strategies.
The focus on multiplicative structures created a connection to previous knowledge of
multiplication and further expanded this knowledge, creating computational fluency. It
also enabled connections and transfer to subsequent topics in a way that made them
more meaningful.
We started this article by mentioning another teaching approach that was rejected by
teachers. We can end it by saying that our experience with teachers has shown that they
can appreciate the benefits of this instruction. Teachers who participate in a workshop

Peled, Meron & Rota
PME31―2007 4-72
and perform the Cookie Factory tasks undergo a similar discovery experience as that
encountered by children and thus "feel" what children go through.
References
Champagne, A. B., & Rogalska-Saz, J. (1984). Computer-based numeration instruction. In V.
P. Hansen (Ed.) NCTM Yearbook, Computers in mathematics Education. Reston, Va.:
National Council of Teachers of Mathematics.
Cobb, P., Yackel, E., & Wood, T. (1992). A constructivist alternative to the representational
view of mind in mathematics education. Journal for Research in Mathematics Education,
23(1), 2-33.
Fuson, C. K. (1990). Conceptual structures for multiunit numbers: Implications for learning
and teaching multidigit addition, subtraction, and place value. Cognition and Instruction,
7(4), 343-403.
Fuson, C. K., Wearne, D., Hiebert, J. C., Murray, H. G., Human, P. G., Olivier, A. I.,
Carpenter, T. P., Fennema, E. (1997). Children's conceptual structures for multidigit
numbers and methods of multidigit addition and subtraction. Journal for Research in
Mathematics Education, 28(2), 130-162.
Gravemeijer, K. (1997). Mediating between concrete and abstract. In T. Nunes & P. Bryant
(Eds.), Learning and Teaching Mathematics: An International Perspective, (pp. 315-345).
Hove, England: Psychology Press.
Hiebert, J., & Wearne, D. (1992). Links between teaching and learning place value with
understanding in first grade. Journal for Research in Mathematics Education, 23(2),
98-122.
Kamii, C. (1986). Place value: An explanation of its difficulty and implications for the
primary grades. Journal for Research in Childhood Education, 1,75-86.
McClain, K., Cobb, P., & Bowers, J. (1998). A contextual investigation of three-digit addition
and subtraction. In L. J. Morrow (Ed.) NCTM Yearbook, The teaching and learning of
algorithms in school mathematics. Reston, Va.: National Council of Teachers of
Mathematics.
Ross, S. H. (1989). Parts, wholes, and place value: A developmental view. Arithmetic
Teacher, 36(6), 47-51.
Segalis, B., & Peled, I. (2000). The effect of mapping analogical subtraction procedures on
conceptual and procedural knowledge. In T. Nakahara & M. Koyama (Eds.), Proc. 24th
Conf. of the Int. Group for the Psychology of Mathematics Education (Vol .4, pp.121-128).
Hiroshima, Japan: PME.
Steffe, L. P. (1988). Children's construction of number sequences and multiplying schemes.
In J. Hiebert & M. Behr (Eds.), Number concepts and operations in middle grades (pp.
119-141). Hillsdale, NJ: Erlbaum.
Wearne, D., & Hiebert, J. (1994). Place value and addition and subtraction. Arithmetic
Teacher, 41(5), 272-274.

2007. In Woo, J. H., Lew, H. C., Park, K. S. & Seo, D. Y. (Eds.). Proceedings of the 31st Conference of
the International Group for the Psychology of Mathematics Education, Vol. 4, pp. 73-80. Seoul: PME. 4-73
IF YOU DON’T LISTEN TO THE TEACHER, YOU WON’T KNOW
WHAT TO DO: VOICES OF PASIFIKA LEARNERS
Pamela Perger
The University of Auckland
This paper reports on one aspect of a study that explored Pasifika students’ ideas
about learning mathematics at Year 7. Students were asked to name key practices for
learning mathematics (espoused theory) and were then observed working during a
regular mathematical class to identify the practices they used (theory-in-use). Further
discussion enabled the differences between students’ espoused theory and their
theory-in-use to be explored and evaluated. What it is these students consider ‘best
practice’ in learning mathematics? Do they practice what they preach?
INTRODUCTION
In July 2005 enrolments in Auckland schools (New Zealand) reached 50% non-
European. With the changing composition of the New Zealand school population the
underachievement of Pasifika students in mathematics has become apparent. Pasifika
students make up 21% of those attending primary and intermediate schools in the
wider Auckland region. Pasifika people are those who identify themselves with, or
were born in, the island nations of the Cook Islands, Fiji, Niue, Samoa, Tokelau and
Tonga. Today 58% of the New Zealand Pasifika population is New Zealand born
(Statistics New Zealand, 2005). Although the number of Pasifika students in New
Zealand schools is growing, research relating to Pasifika educational issues is sparse
with a significant gap concerning Pasifika students’ experiences at the Year 7 / 8 level
(Coxon, Anae, Mara, Wendt-Samu & Finau, 2002).
The New Zealand Numeracy Project introduced in 2001 is one initiative that attempts
to address the imbalance of achievement for Pasifika students in mathematics. While
Ministry of Education evaluations have shown that the Project has been effective in
raising mathematical achievement for all students (Higgins, 2003; Thomas, Tagg &
Ward, 2003), Young-Loveridge (2004) found that not all students involved in the
project have achieved at the same rate, with Pasifika students making the smallest
gains of all ethnic groups. The underachievement of Pasifika students is a cause for
concern. What is it that Pasifika students see as important in helping them learn
mathematics? This paper presents the ideas about best practice in learning mathematics
of a group of Year 7 Pasifika students (11-12 Year olds).
BACKGROUND
Existing research has focused on either what students say is best practice (espoused
theory, identified through interviews with students) or what they actually do
(theory-in-use, identified through observations of students involved in normal work

Perger
PME31―2007 4-74
routines). The accuracy with which a students’ espoused theory matches their
theory-in-use may vary due to a number of constraints (Argyris & Schon, 1974;
Robinson, 1993). New Zealand research identifying what students consider best
practice has been focused at the secondary school level although overseas studies have
given us some insight into younger students ideas. So what has research shown
students consider best practice in learning mathematics?
Research that has looked at students espoused theory has documented some common
ideas about best practice in learning mathematics, including listening to the teacher and
asking the teacher questions. Listening to the teacher was recognised as a key practice
by students in both primary and secondary schools (Clark, 2001; Jones, 1991;
McCullun, Hargreaves, & Gipps, 2000). The primary school aged students in a British
study (McCullum et al., 2000) recognised that listening to the teacher was not all that
was required if they were to learn, but was seen as important when the teacher was
introducing a new topic, explaining something difficult or giving instructions about a
set task. The Pasifika students attending secondary school in Jones’ study (1991)
identified listening to the teacher as the only appropriate way to learn, as it was the
teacher who held the knowledge they required to pass the exams.
Asking the teacher questions was also an important ‘practice’ in learning noted by the
primary school students in McCullum et al’s (2000) study. These students believed that
through asking questions they were able to find out something new, confirm their own
thinking or clarify an idea, as well as receive feedback on their progress. Secondary
school Pasifika students, however, saw asking the teacher questions as disrespectful
(Clark, 2001; Jones, 1991). As the teacher had already ‘taught’ them it was their fault
they did not understand.
The research that has developed alongside the implementation of the New Zealand
Numeracy Project has provided some insight into primary and intermediate aged
students’ ideas about best practice in learning mathematics. As part of the project
students have been encouraged to share strategies used in solving numerical problems.
Students noted that listening to how peers solved a problem allowed them to learn
other strategies, but even though they saw listening to others as important they placed a
higher level of importance on being able to explain their strategy (Young-Loveridge,
2005).
None of the studies above compared students espoused theory with their theory-in-use.
They focused either on what students said or what they did. To build a complete picture
of what students believe is ‘best practice’ in learning mathematics both their espoused
theory and their theory-in-use needs to be explored (Argyris & Schon, 1974; Robinson,
1993).
METHOD
The students involved in this study attended a large co-educational intermediate school
(11 – 13 year olds) located in a low socio-economic area of South Auckland, New

Perger
PME31―2007 4-75
Zealand. The school was located in a low socio-economic area with the school
population was representative of twenty-two different ethnic groups with Pasifika
students making up 31% of the school roll. The school employed a mathematics
specialist teacher who worked with both teachers and students to improve
mathematical skills across the school. Students requiring extension (higher achievers)
and those needing extra help (lower achievers) were identified at the beginning of the
school year through the use of the New Zealand Performance Achievement Test (PAT).
Students identified as requiring extension or extra support in learning mathematics
attended either a class for higher achievers or lower achievers with the mathematics
specialist teacher. These sessions were timetabled during their regular class
mathematics periods for two of the four school terms (mathematics was learnt in their
home room for the terms they were not timetabled into the specialist class). Eighteen
Year 7 Pasifika students participated in the study. The higher achieving group
comprised five Samoans, two Tongans, one Fijian and one Cook Island student (four
males and five females). The lower achieving group included six Samoans, two
Tongans and one Cook Island student (four males and five females). Two students in
each group had been born outside New Zealand, but all had completed all their
schooling in New Zealand.
Procedure
Individual semi-structured interviews were conducted with each participant. During
these interviews students’ espoused theory (about what is ‘best practice’ in learning
mathematics) was identified. Students had the experiences of past schooling as well as
two class environments from their current schooling on which to base their decisions
about ‘best practice’. The two environments in their current school were those of their
homeroom (the more formal environment where often lessons were teacher directed
and textbook based) and that of the mathematics specialist class (a constructively
aligned environment where they were encouraged to work together to solve problems).
Observations of the students participating in mathematics in the mathematics specialist
class were then made to note whether or not they engaged in the practices they had
recognised as important for learning mathematics (espoused theory). The criteria used
for the class observations was developed from data collected during the individual
interviews. Two group interviews were then conducted; one interview with students
from the higher achieving group and one with students from the lower achieving group.
During the group interviews the data collected during both the individual interviews
and the observations sessions, in relation to ‘best practice,’ was presented. This
provided an opportunity for the researcher to check the students’ interpretations of
espoused theory and theory-in-use and explore some aspects further. The differences
between students’ espoused theory (what they said they did) and theory-in-use (what
they actually did) were acknowledged and discussed. Students then had the
opportunity to consider what this study had identified in regard to their learning, and
set goals for their future learning.

Perger
PME31―2007 4-76
RESULTS
Espoused Theory
During the individual interviews the students were asked to identify the important
classroom practices or actions that enabled them to learn mathematics successfully.
Observed practices in the mathematics specialist class, prior to the interview sessions
gave ideas for prompts about best practice. Both the higher and lower achieving groups
noted the same range of practices. The most commonly identified practice by both
groups was that of listening to the teacher explain something. Table 1 shows the
number of students identifying each practice.
Behaviour / Action 1 2 3 4 5 6 7 8 9 10
Listening to the teacher
explain something
Having time to think about
the problem
Working with others to
solve problems
Listening to how other
children solved the problem
Asking the teacher for clues
Asking other children about
the problem
Getting the answer yourself
or in your group
Using equipment to solve
problems
Explaining how you solved
the problem to others
Key: Higher achievers Lower achievers
Table 1: Most important classroom practices
The practices students listed during the individual interviews were practices valued
and promoted by the mathematics specialist teacher during class session. The teacher
was observed waiting for all students to listen before she gave the instructions for the
days work. She would remind students that the equipment was there for their use and

Perger
PME31―2007 4-77
encouraged them to collect it as they needed it. She would often use the term ‘in your
groups’ when setting tasks and ask students to share their ideas or solution paths with
others. These teacher practices were observed during both the higher and lower
achievers sessions with the mathematics specialist teacher.
Theory-in-use
Observation of students during a regular mathematics session allowed for their
theory-in-use to be compared with their espoused theory. The criteria for these
observations sessions was based on the practices identified by students during the
individual interviews. As the students were in two classes (extension class - higher
achievers and support class – lower achievers) the tasks chosen for observation were of
a similar type although at different levels of difficulty. Practices observed that matched
the students espoused theory are noted in Table 2.
Higher Achievers Lower Achievers
Problem
Solving
Task
The school grounds are to be
used for parking at an upcoming
event. What is the best parking
arrangement that can be used to
make the most money?
Containers have arrived at the
wharf holding a combination of
vans, trucks and cars. Using the
information provided, find all
the possible combinations of
vehicles in each container.
Espoused
Theory
Observed
Listening to the teacher explain
something
Listening to how other children
solved the problem
Working with others to solve
problems
Getting the answer yourself or
in your group
Explaining how you solved the
problem to others
Listening to the teacher explain
something
Listening to how other children
solved the problem
Getting the answer yourself or
in your group
Having time to think about the
problem
Explaining how you solved the
problem to others
Table 2: Observed practices
Feedback Sessions – Group Interviews
During the group discussion following the observation sessions the information
gathered from both the individual interviews and the observations was shared with the
students and discrepancies discussed.

Perger
PME31―2007 4-78
WHAT HAVE WE LEARNT BY LISTENING TO PASIFIKA STUDENTS?
Pasifika students in this study did not demonstrate the traditional behaviours linked to
teacher / student interactions identified by Jones (1991) and Clark (2001). They saw
listening to the teacher as important but not because the teacher held the knowledge
they needed to learn. The Year 7 Pasifika students claimed listening to the teacher
meant listening to an explanation of a new concept or listening for instructions about
the set task: “If you don’t listen to the teacher you won’t know what to do”. They also
held the belief that if you only listened to the teacher you would not learn. As in the
McCullum et al. (2000) study they recognised the importance of being involved in the
learning, so listening to the teacher was only a starting point: “You have to do things as
well as listen to the teacher, that’s how you learn”.
Students also saw asking the teacher questions as an appropriate action if you did not
understand what you were being taught. In contrast to students in Clark’s (2001) and
Jones’ (1991) studies the Year 7 students believed you could ask the teacher for clues,
but not answers: “Ask for clues on how to do the question – clues not answers”. The
lower achieving group considered this practice to have a higher level of importance
than did the higher achieving group. This rating may be linked to students’
identification of sources of support. The lower achieving group identified the teacher
as their second choice for support if having difficulty with mathematics, with parents
being their first choice. The higher achieving group placed the teacher third, with
parents and peers recognised as first choices for help when they required it.
Another behaviour noted as ‘best practice’ was that of listening to others. Students
recognised that listening to how other students solved the problem was a way to hear
different strategies. The importance of listening to others was justified by linking to the
idea of building on one’s own list of strategies or by being able to help others,
advantages also noted by the participants in Young-Loveridges’ (2005) study.
Although both groups could justify the importance of listening to others, when this
idea was explored further two other aspects were identified. The higher achieving
group viewed the sharing of ideas (both listening to others and explaining your own
strategy) as a way to clarify ones thinking through having to justify your answer, “It’s
important to share your ideas and prove your answer”. They saw it as a time to compare
ideas, and if ideas differed, a time for sharing their thoughts, thus clarifying their
thinking. The lower achieving group also expressed the belief that listening to others
allowed you to hear other solutions. They agreed that this might let them hear ‘better’
strategies than the one they were using, but they also claimed that by listening to others
they were able to “check your answers” at the end of a session.
Year 7 students not only saw listening to others as ‘best practice’ but also claimed that
working with others was important. Both higher and lower achieving students placed
the same level of importance on this behaviour, but once these claims were
investigated further a differing understanding of the ‘practice’ became evident. The
higher achieving students believed that working together was an everyday practice
where you bounced ideas off each other to understand and solve problems: “You need

Perger
PME31―2007 4-79
to talk to others cause talking helps you work through understanding”. In contrast the
lower achieving group saw this practice as one to use when you were having difficulty:
“Like when you get stuck you can like co operate to get the answer”. Although the
lower achieving group expressed a belief in the importance of working together, even
if only when having difficulty, there was no evidence of them using this strategy when
observed working in the mathematics class. When this discrepancy was discussed the
lower achievers stated that they could not interrupt another person when they were
working because they might stop them trying to remember something they needed to
solve the problem.
Both groups had identified having time to think as ‘best practice’ although the higher
achievers placed more importance on this behaviour than the lower achievers. Further
exploration showed this was a practice also interpreted differently by the two groups.
The higher achieving group believed that having time to think was important so that
when you worked with other members of your group you had ideas to contribute to the
group discussion: “Thinking about the question, like the one the teacher gives you, you
need to think about it to be able to talk properly about it in your group”. The lower
achievers saw it as a time to remember the mathematics (basic facts) or process (rules)
that were needed to solve the problem: “You can’t remember things quickly, so you
have to think”. They recognised that the higher achieving group did not have to do this
(think of the mathematics) and therefore would be able to ‘talk’ more.
Although the original interviews provided a list of best practices that appeared to
mirror that of the teacher, once further clarification was sought different
understandings became apparent. Both groups of students believed they were using the
practices valued and promoted by their teacher. This was shown to be true for the
higher achieving group, but the lower achievers were found to have developed a very
different understanding about what these practices entailed.
CONCLUSION
Everyone has beliefs about how learning should take place and what the best practices
are to enable this to happen. The students in this study demonstrated that they had an
understanding of practices that enabled them to learn mathematics. These practices
included listening to the teacher, listening to others, having time to think, working with
others and asking the teacher for clues; ‘best practices’ that on the surface mirrored
those of the mathematics specialist teacher. Both higher and lower achieving students
identified the same practices, but by exploring their beliefs further a different picture of
what students in each group perceived as ‘best practice’ emerged. Through comparing
espoused theory with theory-in-use and then allowing students to justify the
differences, a better understanding of how these students saw learning was able to be
built. If we really want to understand our students as learners we need to look at both
what they say and what they do, then work with them to identify the reasons for any
differences.

Perger
PME31―2007 4-80
References
Argyris, C., & Schon, D. (1974). Theory in practice: Increasing professional effectiveness.
San Francisco: Jossey-Bass.
Clark, M. (2001). Cross-cultural issues with students from the South Pacific. Australian
Mathematics Teacher 57(1), 17 – 20.
Coxon, E., Anae, M., Mara, D., Wendt-Samu, T., & Finau, C. (2002). Literature review on
Pacific education issues, Final report. Wellington: Auckland Uniservices.
Higgins, J. (2004). An evaluation of the Advanced Numeracy Project 200. Exploring issues in
mathematics education. Wellington: Ministry of Education.
Higgins, J. (2003). An evaluation of the Advanced Numeracy Project 2002. Exploring issues
in mathematics education. Wellington: Ministry of Education.
Jones, A. (1991). At school I’ve got a chance. Culture / privilege: Pacific Island and Pakeha
girls at school. Palmerston North: Dunmore Press.
McCullun, B., Hargreaves, E., & Gipps, C. (2000). Learning: The pupils’ voice. Cambridge
Journal of Education 30(2), 275-289.
Robinson, V. (1993). Problem based methodology: Research for the improvement of practice.
Oxford: Pergamon.
Statistics New Zealand. (2005). Retrieved on December 1, 2005 from Statistics New Zealand
Website http://www.stats.govt.nz/people/communities/pacificpeoples.htm
Thomas, G., Tagg, A., & Ward, J. (2003). An evaluation of the Early Numeracy Project 2002.
Exploring Issues in Mathematics Education. Wellington: Ministry of Education.
Young-Loveridge, J. (2005). Patterns of performance: Anaysis of 2004 data. In J. Higgins, K.
C. Irwin, G. Thomas, T. Trinck, J. Young-Loveridge (Eds.), Findings from the New
Zealand Numeracy Development Project 2004 (pp. 5-20). Wellington: Ministry of
Education.
Young-Loveridge, J. (2004). Patterns of performance and progress on the numeracy projects
2001 – 2003: Further analysis of the numeracy project data. Exploring Issues in
Mathematics Education. Wellington: Ministry of Education.

2007. In Woo, J. H., Lew, H. C., Park, K. S. & Seo, D. Y. (Eds.). Proceedings of the 31st Conference of
the International Group for the Psychology of Mathematics Education, Vol. 4, pp. 81-88. Seoul: PME. 4-81
FOSTERING GENERALIZATION IN CONNECTING REGISTERS
OF DYNAMIC GEOMETRY AND EUCLIDEAN
CONSTRUCTIONS
Norma Presmeg, Jeff Barrett and Sharon McCrone
Illinois State University
In spring of 2006, we investigated the ways that prospective elementary school
teachers progressively construct generalizations in a course called Geometric
Reasoning: Geometry as Earth Measures. Dynamic geometric constructions using
Geometer’s Sketchpad and Euclidean constructions using traditional tools were an
integral part of the course. We focused on students’ reasoning, argumentation, and
generalization in making sense of geometric concepts, as they moved back and forth
between these two worlds. Results indicated that the construction of social norms that
included the use of collaborative discussion and of shared metaphors (used in both
environments) was a significant factor in fostering students’ generalizations.
THE COURSE AND THE INVESTIGATION
Topics addressed in the geometry course included class membership and categorical
reasoning regarding two-dimensional objects, logical inference and deduction within
an axiomatic system, quantifying space along one, two, and three dimensions to build
models of realistic objects or systems, and the specification and analysis of operations
and motions of geometric objects in two- or three-dimensional space. Because the
methodology of our investigation could be characterized as design research, pedagogy
and tasks for teaching these topics were the focus of several “loops” in a teaching
experiment in which the instructor of the course (the second author) collaborated with
two colleagues to plan, teach, and reflect on the outcomes of each cycle before starting
the planning of the next cycle. The three researchers had different but resonating
research foci, and brought their expertise from three related theoretical backgrounds,
which resulted in the potential for theoretical triangulation as well as the empirical
triangulation ensuing from several data sources. Students’ construction of generalized
argumentation in this context was relevant to the interests of all three researchers.
Research questions
In this paper we report on the ways that students constructed generalized knowledge of
geometrical concepts in the course with regard to the following research questions.
1. How do classroom discussions influence students’ developing ability to provide
justifications for generalized statements?
2. In what ways do students connect, or fail to connect, different modes of
representation in moving amongst the registers of dynamic geometric

Presmeg, Barrett & McCrone
PME31―2007 4-82
representations and those of traditional Euclidean compasses and straightedge
constructions?
THEORETICAL LENSES
Generalization helps us establish patterns and relations that we can use to build up our
understanding and knowledge of geometry. Yet, generalization can be a source of
difficulty for students (e.g., Presmeg, 1997). As students learn to generalize in
geometric contexts, they must grapple with the implicit and perhaps unintended
meanings that accompany geometric figures in diagrams or drawings. It is possible to
under-generalize the geometric ideas in a drawing by assuming that certain aspects of
the drawn figure are invariant, when they are intended to vary. It is also possible to
over-generalize if one assumes that certain aspects of a figure are varying whereas they
are intended as invariant elements in the figure. Using dynamic geometry software to
construct figures allows teacher and student to engage directly in the interpretation of
figures and address subtle yet critical issues related to generalization (Mariotti, 2002).
Dynamic geometry software such as Geometer’s Sketchpad (GSP) enables a teacher to
develop examples, manage representations and examine student explanations of plane
geometry topics (Ball, Bass, Hoover, & Sleep, 2004; Simon, 1995). But researchers
have noted several challenges and limitations to using technology this way. Mariotti
(2002) cautions that using technological tools for teaching mathematics meaningfully
depends heavily on the interpretive lens of the learners’ own knowledge and actions, as
illustrated by the range of students’ interpretations for dragging parts of a dynamic
sketch (Arzarello, Olivero, Paola, & Robutti, 2002). Thus, a teacher works to
coordinate the overarching instructional goal of a mathematical concept with learners’
interpretations of their activity in the environment (Jones, 2000). Furthermore, Heid
(2005) recommends a purposeful balance between manual techniques and
computer-based techniques for studying mathematics. A theoretical tenet of the course
was that students need to move back and forth between constructions in dynamic
geometry software and construction with hand tools, clarifying what claims they intend
to represent by sketches in both worlds (Arshavsky & Goldenberg, 2005). Thus, we
prompted students to reflect on common traits or patterns between the two worlds.
The emergent perspective as described by Cobb and Yackel (1996) is useful for
investigating classroom discussions and the development of taken-as-shared
mathematical understanding. This perspective attempts to describe individual and
collective learning in the social context of the classroom. In this study, the emergent
perspective lens allows us to focus on classroom activity related to student ability to
understand and construct valid arguments. The work of Johnston-Wilder and Mason
(2005) on the discipline of noticing and that of Herbst and Brach (2006) on the
situation of proving in the geometry classroom also informed our analysis. These
researchers suggest that students’ developing sense of justification is influenced by
information provided in the classroom, as well as their beliefs and expectations, and by
the logical cues or connections they make.

Presmeg, Barrett & McCrone
PME31―2007 4-83
With regard to the second research question, the notion of register as a mode of
representation was adopted from Duval’s (1999) theoretical framework, in which
conversions both within and amongst registers are essential features of the robust
construction of mathematical knowledge. We were aware that conversions amongst
registers should not be inferred from the mere ability to use different forms of
representation. Presmeg and Nenduradu (2005) described the case of Mike, a
prospective elementary school teacher, who used several registers in his attempts to
solve a problem involving exponential relationships, without making the connections
amongst these registers that would have resulted in conceptual understanding. Because
the role of metaphor in learning is to connect domains of conceptual experience (Leino
& Drakenberg, 1993), we were aware that this form of analogy might be important in
synchronizing the registers of dynamic geometry and Euclidean constructions.
In addressing the research questions, these theoretical perspectives were blended in a
conceptual model that guided the analysis of our data (figure 1).
Social norms
Sharing ideas
Defending ideas
Evaluating ideas
collaborative discussions
Development of
shared metaphors
contributing to
Student understanding
Reasoning
Argumentation
Generalization
Figure 1. Conceptual model: fostering geometric generalization.
METHODOLOGY
This investigation adapted the methodology of a teacher development experiment
(Simon, 2000), focusing on an emerging sequence of tasks addressing geometric
reasoning through a coordinated set of tools. The three researchers met regularly
through the semester of the course, planning each new cycle of the teaching
experiment informed by reflections on the teaching and learning that occurred in the

Presmeg, Barrett & McCrone
PME31―2007 4-84
previous cycle. Apart from the instructor, at least one of the researchers was present
and took notes during the teaching of most of the sessions, both in the computer
laboratory and in the traditional classroom. Based on a variety of styles and abilities as
evidenced in class participation, five students were selected from the class participants
for more detailed investigation of their thinking during interviews including tasks
relevant to the course. Three students each were interviewed by the two non-teaching
researchers, with one student common to both sets of interviews to facilitate
comparison. These five students were interviewed twice each, once near the beginning
of the course and again near the end of the semester. Interviews typically lasted
between 45 minutes and one hour.
Data sources
Data were collected both within the teaching cycles carried out in the class, and in the
task-based interviews conducted by the two observing researchers with the five
selected students in the class. In class, student explanations, questions, and discussion
were captured by digital videotaping, and the observers wrote observation notes.
Student artifacts such as written responses to tasks and projects and
computer-generated sketches were collected. The instructor wrote regular reflections
regarding ongoing task development and assessment, elaboration of learning activities,
and trajectories for student thinking and strategy growth. During the sessions in the
computer laboratory, the on-screen work of one student, Mary (the student who
participated in interviews with both observing researchers) was captured by digital
video. All of the task-based interviews were audio-recorded.
PRELIMINARY RESULTS AND DISCUSSION
Students in the course were typically expected to relate multiple representations of
geometric ideas, including hand-tool constructions, GSP constructions, and verbal
explanations along with board drawings. The robustness of these connections is an
aspect of the second research question: this analysis is ongoing. In addressing the first
research question concerning the influence of classroom discussions, our conceptual
framework suggested that social norms that included sharing, defending, and assessing
ideas would foster geometric reasoning, argumentation and generalization through the
development of shared metaphors. Preliminary analysis suggested that there was
indeed one shared metaphor, that of breakability, which played a crucial
role—concerning both research questions—in this process.
By addressing students’ actions and discussions across sequences of tasks, across both
hand and computer construction settings, and by moving our meetings between a
computer lab and a classroom with traditional blackboards for discussion and drawings,
we tested the viability of our conceptual framework in fostering students’ robust
concepts of generalization. This process depended on two related concepts, namely,
the unbreakability of sketches, and the distinction between variant and invariant
properties. During the third week of the semester the instructor introduced dynamic

Presmeg, Barrett & McCrone
PME31―2007 4-85
geometry software (GSP) as a construction tool by asking students to build
unbreakable equilateral triangles.
Instructor: Is your equilateral sketch breakable? Or, is your sketch unbreakable?
Student1: What do you mean?
Instructor: I mean, if you let your neighbor use your mouse to move points and lines, would the sketch stay together, or would it come apart? Would it break?
Student1: I think it would be fine. I don’t know!
Instructor: Switch computer stations with your neighbor. Try to pull the sketches apart. What happens? [After pulling at several points of intersection, the sketches of the equilateral triangles degenerate into scalene triangles, and some even come apart into three unconnected segments.]
This short episode was the genesis of classroom social norms that included the
metaphor of a breakable sketch, as students picked up the metaphor and used it both in
the laboratory and in the regular classroom when classical hand tools were used. The
distinction between an unbreakable sketch and a general sketch was increasingly
clarified in the discussions as the teaching experiment progressed. For instance, a
sketch of a rhombus made from two equilateral triangles may be unbreakable, but it is
not general because the 60 degree angle is invariant.
As an illustration of the dynamics of the generalization process as observed in our data,
the following account is a discussion of a student’s sketch for trapezoids that took
place during a lesson in the sixth week of our teaching experiment. Initial short tasks to
construct the trapezoid and other quadrilaterals using hand tools during previous
lessons were linked to this lesson as students were asked to work to build a trapezoid
sketch with GSP that would be most general. On this day, students worked with
partners or groups to investigate methods for constructing general trapezoids. One
student, Lisa, shared a sketch created with Geometer’s Sketchpad of an isosceles
trapezoid with 60-degree base angles, suggesting that it was a generalized sketch of a
trapezoid. Discussion followed in which some students challenged the fact that the
sketch was a general trapezoid. In fact, one student wondered whether it was necessary
(or even possible) for one sketch to show the entire range of possible trapezoids. To
“fix” Lisa’s construction, another student created a trapezoid that was not isosceles but
was likewise constrained, with constant angle sizes, as in trapezoid FCDE (figure 2).

Presmeg, Barrett & McCrone
PME31―2007 4-86
Figure 2. A non-isosceles trapezoid that is nevertheless constrained.
Students returned to their groups to continue work to construct the most general
trapezoid using GSP and to evaluate the sketches that had been shared.
The instructor focused on students’ efforts to justify their claims about a sketch, and
ultimately to build a defensible account of the relations among the parts of a sketch. A
student asked for a way of constructing an unbreakable trapezoid. As noted, the
students had been taught that unbreakable meant a sketch would keep the necessary
characteristics even if some other characteristics changed under dragging. Noreen
offered her construction using GSP on a large projection screen (see figure 3). Noreen
showed how point J could be dragged to produce various cases of trapezoids.
But Missy challenged Noreen’s sketch, explaining that it only portrayed a finite
collection of cases, degenerating into a triangle at the top, and vanishing when moved
down to point E. The other students agreed that Noreen’s sketch could not show an
infinite collection of cases. But eventually, when reminded by the researcher-observer
that there are infinitely many points along a number line between the points
Figure 3. Noreen's unbreakable trapezoid in sketchpad
H G F
E
D
C
A B
J
F A B E
C D

Presmeg, Barrett & McCrone
PME31―2007 4-87
representing the numbers zero and one, most students concurred that the sketch
represents infinitely many cases of trapezoids. Still, Sandra argued that it would not be
an infinite collection since it did not include other shapes, like squares. The instructor
concluded by suggesting that students continue the search for a general construction
since this sketch always produced isosceles trapezoids, a sub-class of all trapezoids.
The students themselves had recognized that sketches that produced only isosceles
trapezoids did not represent a general trapezoid. However, the introduction of the
notion of an infinite collection revealed another level of complexity. Noreen’s sketch
represented an infinite collection of trapezoids, but it was not general. Sandra’s claim
that the collection was not infinite seems to hinge on a belief that an infinite collection
should not refer only to one class of shapes, e.g., trapezoids: thus a level of scale in the
hierarchy of polygons is also relevant in the students’ attempts to apprehend what it
means to create a sketch of a general trapezoid.
In this episode, still within the GSP environment, the switch from thinking about the
number of cases represented by the isosceles trapezoid sketch, to the context of the
number of points between zero and one on the number line, is a conversion between
registers that helped most students to identify an infinite collection of trapezoids.
However, the collection was still not complete, thus the sketch was not general. The
question of what it means to have a complete collection was not pursued further.
It is noteworthy that there were also conversions between the broader registers of the
GSP and hand tools environments. In the latter, away from the computer laboratory,
students drew full circles where arcs would have sufficed, in the constructions they
demonstrated on the board. And the metaphor of breakable was still applied to these
static sketches, although there was no possibility of dragging points, providing
evidence on the influence of GSP registers in this hand tools environment.
After the 6th week, the instructor introduced the terms “variant” and “invariant” into
the class discussions to deepen students’ analysis of properties that guarantee a general
construction of a polygon. Thus the breakability metaphor gradually gave way to terms
more associated with generalization in the ensuing discourse. However, the role of this
metaphor was an important aspect in the initial processes, both in the classroom
discussions (research question 1), and in thinking that related the registers of a GSP
environment with those of a Euclidean hand tools environment (research question 2),
as suggested by our preliminary data analysis.
References
Arshavsky, N. & Goldenberg, E. P. (2005). Perceptions of a quadrilateral in a dynamic
environment. Journal for Research in Mathematics Education Monograph XIII: Medium
and meaning: Video papers in mathematics education research, XIII.
Arzarello, F., Olivero, F., Paola, D., & Robutti, O. (2002). A cognitive analysis of dragging
practices in Cabri environments. Zentralblatt für Didaktik der Mathematik, 34(3), 66-72.

Presmeg, Barrett & McCrone
PME31―2007 4-88
Ball, D. L., Bass, H., Hoover, M., & Sleep, L. (2004). Knowing mathematics for teaching:
Seeing teaching as mathematical work. Invited presentation, California State University,
Northridge.
Cobb, P. & Yackel, E. (1996). Constructivist, emergent, and sociocultural perspectives in the
context of developmental res. Educational Psychologist, 31(3/4), 175-190.
Duval, R. (1999). Representation, vision and visualization. Cognitive functions in
mathematical thinking. Basic issues for learning. In F. Hitt & M. Santos (Eds.), Proc. 21st
Conf. of the North American Chapter of the Int. Group for the Psychology of Mathematics
Education (Vol. 1, pp. 3-26). Cuernavaca, Mexico: PME-NA.
Heid, M. K. (2005). Technology in mathematics education: Tapping into visions of the future.
In W. Masalski (Ed.), Technology-supported mathematics learning environments, 2005
Yearbook of the National Council of Teachers of Mathematics. Reston, VA: NCTM.
Herbst, P. & Brach, C. (2006). Proving and doing proofs in high school geometry class: What
is it that is going on for students? Cognition and Instruction, 24(1), 73-122.
Jones K. (2000). Providing a foundation for deductive reasoning: Students’ interpretations
when using dynamic geometry software and their evolving mathematical explanations.
Educational Studies in Mathematics, 44(1-2), 55-85.
Johnston-Wilder, S. & Mason, J. (2005). Developing thinking in geometry. London: Open
University Press.
Leino, A.-L. & Drakenberg, M. (1993). Metaphor: An educational perspective. University of
Helsinki, Department of Education, Research Bulletin number 34.
Mariotti, M. A. (2002). Influences of technologies’ advances on students’ mathematics
learning. In L. D. English (Ed.), Handbook of international research in mathematics
education (Vol. 1, pp. 695-723). Mahwah, New Jersey: Lawrence Erlbaum Associates.
Presmeg, N. C. (1997). Generalization using imagery in mathematics. In L. D. English (Ed.),
Mathematical reasoning: Analogies, metaphors and images (pp.299-312). Mahwah, New
Jersey: Lawrence Erlbaum Associates.
Presmeg, N. C. & Nenduradu, R. (2005). An investigation of a preservice teacher’s use of
representations in solving algebraic problems involving exponential relationships. In H.
Chick & J. Vincent (Eds.), Proc. 29th Conf. of the Int. Group for the Psychology of
Mathematics Education (Vol. 4, pp. 105-112). Melbourne, Australia: PME.
Simon, M. A. (1995). Reconstructing mathematics pedagogy from a constructivist
perspective. Journal for Research in Mathematics Education, 26(2), 114-145.
Simon, M. A. (2000). Research on mathematics teacher development: The teacher
development experiment. In A. E. Kelly and R. Lesh (Eds.), Handbook of research design
in mathematics and science education (pp. 335-360). Mahwah, New Jersey: Lawrence
Erlbaum Associates.

2007. In Woo, J. H., Lew, H. C., Park, K. S. & Seo, D. Y. (Eds.). Proceedings of the 31st Conference of
the International Group for the Psychology of Mathematics Education, Vol. 4, pp. 89-96. Seoul: PME. 4-89
ADDRESSING THE ISSUE OF THE MATHEMATICAL
KNOWLEDGE OF SECONDARY MATHEMATICS TEACHERS
Jérôme Proulx
University of Ottawa, Canada
This paper reports on a professional development intervention focused on offering
secondary mathematics teachers learning opportunities to experience and explore
school mathematics at a conceptual level. One typical illustration of how teachers
engaged in a task involving mathematical conventions is presented and analysed. The
analysis provides insights into how teachers developed enriched comprehensions of
the mathematical concepts they teach. In addition the data hinted to how the teachers’
knowledge of school mathematics and their ways of working these concepts in their
teaching were intertwined, showing therefore the relevance of paying attention to and
addressing teachers’ mathematical knowledge in teacher education.
This paper reports on a study of professional development of secondary-level
mathematics teachers. As the teacher educator and researcher, I was confronted right at
the beginning of the project with something I had not anticipated, which oriented the
intentions of the research. The secondary teachers with whom I was working were
competent mathematically: that is, from what I observed in individual and group
meetings, and classroom visits, they did not make mistakes or experience difficulties
when solving problems in mathematics or teaching about them. However, their
knowledge of mathematics was procedural, where mathematics was understood as a
set of procedures to apply and facts to know. The procedural nature of their knowledge
was also something they were themselves aware of, which they explained to me
roughly in these terms: “I have never been asked to reason in mathematics and explain
the meaning behind it.” This had significant repercussions on their teaching, as I
observed, as teachers focused strongly on knowing procedures in their teaching.
LITERATURE, RECOMMENDATIONS AND APPROACH TAKEN
This situation should not be seen as an exceptional one (at least in North America), as
literature points to the fact that the prominent orientation driving mathematics teaching
in today’s classrooms is still memorization of procedures and facts and their
application (Cooney & Wiegel, 2003; Hiebert et al., 2003). In addition, what stems
from some of the research evidence on secondary teachers’ knowledge is precisely
teachers’ strength in procedures and calculations, and their difficulties to provide
meaning for these same procedures (e.g., Ball, 1990; Bryan, 1999, Lucus, 2006).
The knowledge of these teachers should, however, not be seen negatively, since
procedural knowledge does represent an important dimension of mathematical
knowledge. Therefore, it is probably more appropriate to say that these secondary
teachers’ knowledge is, as Ball (1990) hinted at, too narrow; teachers’ knowledge of

Proulx
PME31―2007 4-90
mathematics is not to be changed, but needs to continue to develop. The main
recommendation throughout the literature concerning teachers’ narrow knowledge of
mathematics is that teachers should receive more mathematics and that this
mathematics should be at a deep and conceptual level (e.g., Bryan, 1999; Cooney and
Wiegel, 2003; Even, 1993). And what is meant here by conceptual experiences in
mathematics is not about university-level mathematics, but about the very
mathematical concepts that secondary teachers teach in their everyday practices: that is,
school mathematics. Hence, the secondary teachers in these studies, and in mine, are
often in need of deepening their knowledge of (school) mathematics so that it
encompasses experiences at a deeper level than knowledge and application of
procedures. This “need” leads the way for professional development practices that
build on and enlarge teachers’ current knowledge of mathematics.
Teacher education often focuses on teachers’ growth in pedagogical knowledge,
frequently ignoring or neglecting the growth in mathematical knowledge (Slaten,
2006). Based on the context of my research site, I felt compelled to address the issue of
teachers’ knowledge of (school) mathematics. The goal of the study became to better
understand the type of learning opportunities that a professional development
intervention focused on exploring school mathematics concepts can create and offer to
secondary teachers (about their mathematical knowledge). Additionally, another
interest became to pay attention to the ways in which these learning opportunities
could have potential to play a role and impact teachers’ possibilities for teaching.
THEORETICAL FRAMEWORK
Theorizing conceptual experiences in mathematics
What does it mean to work at a deeper and conceptual level? As procedures take an
important place in the teachers’ knowledge, and since one intention is to build on
teachers’ knowledge in order to enlarge it, one aspect to look into appears to be the
meaning underpinning mathematical procedures. I have used Skemp’s (1978) theory
of instrumental and relational understanding to theorize these issues. Instrumental
understanding represents knowledge of “how” things work. This is contrasted with
relational understanding, representing not only the knowledge of “how” things work,
but also of “why” they work. I have combined this theory with Adler and Davis’s
(2006) idea of unpacking mathematical concepts (based on Ball & Bass’s work),
intended to draw out the relations between and intricacies within the mathematical
concepts and unearth concepts hidden behind the “structure” of mathematics. The
conceptual mathematical experiences would therefore revolve around developing
relational understandings and exploring the intricacies of mathematical concepts.
Framework for professional development and lens of analysis
Building on Cooney’s (1994) theoretical constructs of developing mathematical and
pedagogical powers of teachers, the idea was to have teachers explore deeply some
mathematical ideas and concepts of the curriculum and develop meaning out of them.

Proulx
PME31―2007 4-91
In addition, since these mathematical ideas may represent something new and
unfamiliar for the teachers (being about more than procedures and applications), the
need to inquire and make sense of what these (new) mathematical ideas can “mean” for
teaching has the potential to emerge in discussions. This can possibly contribute to
teachers’ pedagogical powers. In sum, the approach aimed at offering teachers the
chance to see and explore mathematics (and its teaching) with a different eye. I have
called this approach “deep conceptual probes into the mathematics to teach,” which
aims at exploring in depth school mathematics concepts and topics with the intention
(1) to learn more about the school mathematics, and (2) to have teaching issues linked
to these (new) mathematical concepts emerge in the exploration.
In addition to guiding the approach, this frame is used as a lens of analysis to look into
the data by paying attention to aspects that concern the development of mathematical
and pedagogical knowledge (or powers). However, in this research report, because of
space constraints, I will focus only on the “mathematical” part.
METHODOLOGY
The six teachers taking part in the study were from a large urban area in Western
Canada (Carole, Carl, Eric, Lana, Linda, Gina). There were ten 3-hour sessions during
the school year, compiling 30 hours of professional development. The sessions, about
diverse mathematical topics, were videotaped with the camera placed at the back of the
room to capture the interactions. As the teacher educator, I acted as an active
participant, by interacting with teachers and taking part in the discussions.
The sessions revolved around offering particular tasks and situations for teachers to
engage in. The tasks were chosen/designed on the basis of their potential to raise
questions and issues about the meaning of (behind) procedures – in line with relational
understanding. It was not the form of the tasks offered to teachers that was important
(e.g., a mathematical problem to analyse, a student solution to a problem, a
presentation on a piece of content, a teaching approach to a piece of content) rather
than the mathematics present in it. These tasks were offered in the sessions as starting
points to launch the explorations and the discussions. One type of task used in the
sessions was that of tasks involving mathematical conventions, more precisely, tasks
that intended to pull procedures apart concerning their built-in conventions.
In order to use some procedures adequately, some conventions have to be respected.
For example, Brown (1981) notes that the division algorithm respects some
conventions – given by its definition – since the remainder ( r ) is defined as, and needs
to be, between zero and its dividend. Therefore, 18 ÷ 4 gives 4 r 2 and not 3 r 6, even
though both are conceptually acceptable. The issue of convention and definition play a
significant role here in the answer, leading one to appreciate the distinction between
understanding the concept and knowing the conventional way of reporting on it. This
interplay is often hidden within the procedure used, or even taken for granted as part of
conceptual understanding of it. This raises an interest in pulling these notions apart and
exploring them (unpack).

Proulx
PME31―2007 4-92
RESULTS AND ANALYSIS
In order to illustrate an example of typical work/explorations done in the sessions, I
report on events surrounding a task about rate of change and its built-in conventional
order of placing the variation of y at the numerator and the one in x at the denominator.
In addition to being typical, I also have chosen to report on this excerpt because it
illustrates well how teachers, specifically here Lana, learned and experienced new
mathematical ideas in these explorations, and therefore started to change their
perspectives toward the mathematical concepts.
Teachers were offered a fictitious student response to a typical problem about rate of
change, to analyse and grade. The mathematical worth of the task resided in the
mistake committed, where the student reversed both variations (figure 1).
Figure 1: (Reversed) rate of change problem
Lana, who teaches this topic regularly, was the first one to react to this problem. She
said that this student did not understand anything and should receive zero points,
because he or she reversed the variations and arrived at the answer only by chance.
Lana: But in fact, this student deserves zero points.
Jérôme: Why do you say that this student deserves zero points?
Lana: He does not understand anything.
Jérôme: What do you mean?
y
x
.P1 (5,–8)
.P2 (–6,3)
In the following graph:
Find the rate of change of the line that passes through the points P1 and
P2. Show how you solved it.
111
11
38
65 −
−−
−
==−
−=
∆
∆
y
x

Proulx
PME31―2007 4-93
Lana: He does not understand because for him the rate of change he says that it is the variation in x divided by the variation in y. It is the opposite, he arrived by chance at the right answer.
This brought me to raise the point that “the order” is a convention and that the student
had only reversed both variations. This provoked a reaction of discomfort in Lana, as
she agreed about the issue but looked perplexed and hesitated.
Jérôme: But why do you say that this student does not understand a thing? Because all this student did was to reverse x and y.
Lana: Yes.
Jérôme: But this, in fact, is only a mathematical convention.
Lana: The rate of change is always vertical on horizontal.
Jérôme: But this is a math convention; it could have been horizontal over vertical.
Lana: [nervous laugh, hesitating] Yeah I agree with you [pulling her chair away]
Nonetheless, this discussion had some influence on Lana’s understanding of the issue.
She started to discuss the example in terms of mathematical conventions and in that
sense started to change her way of speaking about it.
Lana: If the convention had been the other way around, I agree, but the convention is y over x and not x over y.
Nevertheless, Lana was still trying to find ways to convince and demonstrate the fact
that it “had to be” ∆y over ∆x, and offered arguments to demonstrate it. For example,
she discussed the meanings of positive and negative slopes, where a positive slope
goes from left to right going up, which would not work or would have to be reversed if
the rate of change was reversed. I explained to her that the names and definitions would
simply have to be changed the other way around in that case.
As Lana raised these points, it led the group to discuss and realize the broader
coherence of the body of mathematical knowledge, where aspects and notions follow
each other in a coherence and build on the decisions (conventions) made. Hence, a
change in the order of the rate of change would result in many other important changes.
(One example highlighted was in the study of linear functions, in the equation
“y=mx+b” itself.) This made the issue complex because there was no reason why the
order was so, making it an arbitrary decision to use Hewitt’s (1999) term, except that
the coherence of the body of mathematical knowledge was built on these decisions and
many things would have to change if it was reversed.
The issue then became that it is possible for one to understand what a rate of change
means, but at the same time not be able to represent it “conventionally.” This led Lana
to conceive of other mathematical concepts differently, as she herself was now
flagging instances where there was the presence of conventions. For example, Carl
explained that if everything were reversed in order, then the “y=mx+b” would simply
be changed to something like “x=my+b.” Lana reacted by saying that something else
would not work in regard to dependent and independent variables, but immediately
realized that this was also a convention.

Proulx
PME31―2007 4-94
Lana: [answering to Carl] It would be good, however, when he writes x=2y+b, it is good because he has it right, but he does not understand the idea of the dependent variable and independent … that we have supposed ... This is still a convention!
This is an illustration of how Lana started to become more aware of the presence of
conventions in mathematics, something, based on her reactions, she did not seem to be
that familiar with prior to these explorations. The rate of change example made the
issue of the use of conventions in mathematics more present for her in her
mathematical understanding. It changed her understanding of mathematics to the point
that she was able to convince others about the presence of conventions in mathematics.
This happened as the discussion turned to the Cartesian plane, as Gina and Carl
asserted that there were no conventions in the order of coordinates and that reversing
them demonstrated a lack of understanding. This led Lana to (once again) engage in a
conversation about conventions.
Jérôme: You do have to work with the Cartesian plane [in your teaching]?
Gina: Yes, yes.
Jérôme: So, if a student for this specific point tells you, for the point (3,-1), tells you (-1,3). Does this student receive a “0”? (see figure 2)
Figure 2: An example of inversing the coordinates in the Cartesian plane
Carl: Yes.
Gina: Yes.
Jérôme: Why?
Gina: [Hesitating] Because he is not in the right quadrant.
Lana: No! It is still a convention.
Jérôme: It is still a convention.
Lana: We again said that we would place the x first and then the y in second.
In this excerpt, Lana demonstrated interesting instances of changes in her
understanding of mathematics, and consequently in how she could make sense of
(students) mathematical understandings in regard to the use of conventions. She was
more able to separate the proper use of conventions from the idea of understanding the
concept, she could appreciate the presence of “understandings” in the student’s answer
even if that student lacked some knowledge of the conventional aspects.
y
x
.(–1,3)

Proulx
PME31―2007 4-95
DISCUSSION AND CONCLUDING REMARKS
This short excerpt aimed at illustrating how a focus on exploring and making sense
conceptually of (school) mathematics concepts can offer learning opportunities to
teachers for them to continue developing their mathematical powers (and to some
extent some pedagogical ones). In the case of Lana, it brought her to change her views
about these concepts and in so doing she (re-?)learned important aspects of
mathematics (conventions, rate of change, Cartesian plane, etc.). The same could be
said of other teachers, where the change in their ways of talking about the issues (for
example, the distinction between “understanding concepts” and “using the convention
properly” and discussions about the coherence of the body of mathematical
knowledge) appears to be an important illustration of their mathematical learning.
Another element worth noticing was Lana’s way of re-interpreting other concepts, as
she attempted to make sense of linear equations, independent and dependant variables,
Cartesian plane, and so on, along lines of possible arbitrary choices made in
mathematics. This type of work could be said to have initiated a movement in her
thoughts, something that Skemp (1978) had previously highlighted concerning
relational understanding:
[I]f people get satisfaction from relational understanding, they may not only try to
understand relationally new material which is put before them, but also actively seek out
new material and explore new areas, very much like a tree extending its roots or an animal
exploring new territory in search of nourishment. (p.13)
And this was not an isolated fact, as other teachers demonstrated the same attitude for
other topics in other sessions. This new attitude, so to say, can be seen to have the
potential to unravel other explorations that teachers would do on their own for other
concepts, widening the potential impact of this localized intervention on teachers’
knowledge of the mathematical concepts they teach. All these represent significant
illustrations of teachers developing their mathematical powers.
Beyond the mathematical powers that teachers developed, a striking aspect from this
excerpt appears to be the intertwining of teachers’ mathematical knowledge and their
possibilities for teaching. As Lana, Gina and Carl explained, they would have given
poor marks to students that had reversed the order of rate of change or of coordinates.
For these teachers, knowing the convention was equivalent to understanding the
concept. In this excerpt, it was possible to see teachers, particularly Lana, starting to
develop new views and appreciating the distinction between knowing the convention
and understanding the concept, leading them to a much more nuanced appreciation of
students’ answers and understandings (enabling them to see more than “this student
deserves zero because he does not understand anything”), and potentially impacting
their ways of offering this concept or procedure in their teaching.
Even if this excerpt reports only on one illustration (however typical) about unpacking
procedures, it nevertheless underscores some value in addressing teachers’ knowledge
of school mathematics within teacher education. By developing some relational

Proulx
PME31―2007 4-96
understandings about mathematical concepts, teachers were now in a position, they
had possibilities for teaching about relational aspects in mathematics – something they
had expressed to know little about at the beginning of the year. Simply put, exploring
school mathematics concepts and learning about them offered teachers new
possibilities that they did not had before. This is no small point, and one that we, as
mathematics educators, would be well advised to take into consideration in our teacher
education practices.
References
Adler, J., & Davis, Z. (2006). Opening another black box: Researching mathematics for
teaching in mathematics teacher education. Journal for Research in Mathematics
Education, 37(4), 270-296.
Ball, D. L. (1990). Prospective elementary and secondary teachers’ understanding of division.
Journal for Research in Mathematics Education, 21(2), 132-144.
Brown, S. I. (1981). Sharon’s ‘Kye’. Mathematics Teaching, 94, 11-17.
Bryan, T. J. (1999). The conceptual knowledge of preservice secondary mathematics
teachers: How well do they know the subject matter they will teach? Issues in the
Undergraduate Mathematics Preparation of School Teachers: The Journal. Volume 1:
Content Knowledge. http://www.k-12prep.math.ttu.edu/journal/journal.shtml
Cooney, T. J. (1994). Teacher education as an exercise in adaptation. In D. B. Aichele & A. F.
Coxford (Eds.), Professional development for teachers of mathematics: NCTM 1994
Yearbook (pp. 9-22). Reston, VA: NCTM.
Cooney, T. J., & Wiegel, H. G. (2003). Examining the mathematics in mathematics teacher
education. In A. J. Bishop et al. (Eds.), Second international handbook of mathematics
education (Vol. 2, pp. 795-828). Great Britain: Kluwer.
Even, R. (1993). Subject-matter knowledge and pedagogical content knowledge: Prospective
secondary teachers and the function concept. Journal for Research in Mathematics
Education, 24(2), 94-116.
Hewitt, D. (1999). Arbitrary and necessary: A way of viewing the mathematics curriculum.
For the Learning of Mathematics, 19(3), 2-9.
Hiebert, J., Morris, A. K., & Glass, B. (2003). Learning to learn to teach: An “experiment”
model for teaching and teacher preparation in mathematics. Journal of Mathematics
Teacher Education, 6(3), 201-222.
Lucus, C. A. (2006). Is subject matter knowledge affected by experience? The case of
composition of functions. In J. Novotná et al. (Eds.), Proc. 30th Conf. of the Int. Group for
the Psychology of Mathematics Education (Vol. 4, pp. 97-104). Prague: PME.
Skemp, R. R. (1978). Relational understanding and instrumental understanding. The
Arithmetic Teacher, 26(3), 9-15.
Slaten, K. M. (2006). A preservice teachers’ growth in subject matter knowledge while
planning a trigonometry lesson. Proc. 30th Conf. of the Int. Group for the Psychology of
Mathematics Education (Vol. 1, p. 332). Prague: PME.

2007. In Woo, J. H., Lew, H. C., Park, K. S. & Seo, D. Y. (Eds.). Proceedings of the 31st Conference of
the International Group for the Psychology of Mathematics Education, Vol. 4, pp. 97-104. Seoul: PME. 4-97
ABDUCTION IN PATTERN GENERALIZATION
F. D. Rivera and Joanne Rossi Becker
San José State University / San José State University
In this paper we explain generalization of patterns in algebra in terms of a combined
abduction-induction process. We theorize and provide evidence of the role abduction
plays in pattern formation and generalization and distinguish it from induction.
INTRODUCTION
The focus of this theoretical paper is to extrapolate the role of abduction in
generalization with examples drawn from our recent research on patterning in algebra
among sixth-grade students (Becker & Rivera, 2006a, 2006b). We utilize a question-
and-answer format in order to surface important issues that pertain to abduction as it
is explored in the context of elementary algebraic thinking and learning.
WHAT IS ABDUCTION?
Peirce introduced the notion of abduction in the 19th century in relation to induction
and deduction. For him, an inferential act takes at least three forms and the choice of
which form to pursue ultimately depends on the available knowledge base. He argues
that while deductive inferences will always be valid, however, their validity rests on
having a complete knowledge base. Further, he points out that the fundamental task
of abduction and induction involves the production of generalizations from an
always-already incomplete knowledge base. Hence, they are both deductively invalid.
Figure 1 provides an illustrative summary of the three inferential modes. Following
Peirce, Deutscher (2002) foregrounds how inferences are either deductive or
ampliative. While deductive inferences always yield valid and necessary conclusions,
ampliative inferences tend to produce generous and, consequently, fallible,
conclusions that have not necessarily been drawn from the premises. For example,
James’s general formula (C = 2n – 1) and general description (“doubling a row and
minusing a chip”) and Jane’s diagrammatic description (Figure 3) for the circle
pattern in Figure 2 assume the additional information that it is increasing. Thus, it is
possible for learners to perceive the same sequence in different ways.
IS ABDUCTION THE SAME AS OR DIFFERENT FROM INDUCTION?
Deutscher (2002) distinguishes abduction and induction in terms of conceptual leap
and generalization, respectively. That is, while induction involves generalizing an
attribute or a relationship from at least two particular instances to a presumed entire
class of objects with some additional assumptions, abduction necessitates a
conceptual leap from the given instances to an explanatory hypothesis. Further, while
induction constructs obvious generalizations, abduction produces an entirely different
level of abstraction (p. 471). For Abe (2003), Peircean abduction is another form of
discovery or suggestive reasoning that “discovers new events” (p. 234) and yields

Rivera & Rossi Becker
PME31―2007 4-98
Reasoning Types Nature of Knowledge
Deduction Predict Valid and necessary inference;
Inference conclusions are not generalizat-
ions; could only be performed
Abduction with a complete knowledge base
Induction Confirm Conclusions are generalizations
Generates a Inference and ampliative; relies on an
viable inference incomplete knowledge base
from an incomplete
knowledge base;
inference is ampliative
Figure 1: Taxonomy of the inferential trivium
Step 1 Step 2 Step 3 Step 4
Figure 2: Dot Pattern
Step 5 Step 6 Step 7 Step 8
Figure 3: Jane’s Diagrammatic Description of the Succeeding Steps in the Dot Pattern
Abduction Induction Generalization
Repeated Testing and Conclusion
Confirming of R (Acceptance of F)
Discovery and Development Viable General Form F Outcome of a Combined
of a Regularity R Abduction-Induction
Is F the best form (under current assumptions)?
Figure 4: Pattern Generalization Scheme

Rivera & Rossi Becker
PME31―2007 4-99
explanations rather than predictions because they are not directly knowable. It is
similar to induction insofar as both are concerned with discovery. However, it is
distinguished from induction in that the latter “discovers tendencies that are not new
events” (p. 234). Induction tests an abduced hypothesis through extensive
experimentation and increased success on trials means increased confidence in the
hypothesis. For example, James’s inductive success in calculating several far
generalization tasks for the circle pattern in Figure 2 (such as obtaining the total
number of circles in steps 10 and 100) has increased the confidence he has in his
abduced formula. Seeing consistency in the calculated values, the formula, and the
figures, the combined abduction-induction process enabled him to finally state a
generalization. Figure 4 illustrates how the combined process materializes in a
generalization activity from the beginning phase of noticing a regularity R in a few
specific cases to the establishment of a general form F as a result of confirming it in
several extensions of the pattern and then finally to the statement of a generalization.
IF AN ABDUCTION IS INFERRED FOR A PATTERN, IS IT THE BEST?
Nothing so far has been said about how to decide which abduction makes the most
sense. In fact, what we can assume to be a consequence of theory or concept
generation in abduction is that the process cannot be taken lightly in the form of
“happy guesses.” Thus, it makes sense to add an evaluation component to abduction
by ascertaining if it is the inference or reasoning that yields the best explanation. J.
Josephson and S. Josephson (1994) summarize this broader version of abduction in
the following manner:
D is a collection of data (facts, observations, givens). (1)
H explains D (would, if true, explain D). (2)
No other hypothesis can explain D as well as H does. (3)
Therefore, H is probably true. (4)
(Josephson & Josephson, 1994, p. 5)
Thus, while Peirce’s version recommends steps (1), (2), and (4), J. Josephson and S.
Josephson point out the necessity of step (3). Further, J. Josephson (1996) lists the
following “normative considerations” in assessing the “strength of an abductive
conclusion:” (1) How good H is by itself, independently of considering the
alternatives; (2) How decisively H surpasses the alternatives, and; (3) How thorough
the search was for alternative explanations (p. 1). This reconceptualized version of
abduction enables us to further distinguish between an abductive reasoning process
and an abductive justification, with the former focusing on satisfaction and the latter
confidence in accepting a stated abduction. Further, J. Josephson (1996) argues that
while generalization assists in explaining a perceived characteristic of or a
commonality among a given sequence, “it does not explain the instances themselves”
(p. 2). The warrant in an explanation lies in its capacity to “give causes” and it

Rivera & Rossi Becker
PME31―2007 4-100
certainly does not make sense to think that a generalization can provide an
explanation that causes the instances. For example, while the general form C = 2n – 1
explains the relationship between elements in the class {1, 3, 5, 7, …} in Figure 2, it
does not cause them. That is, the nature of “explanation” in this type of generalization
is determined not by an observed fact but by the observed “frequency of [a]
characteristic” in both the small and extended samples (p. 3). Thus, what needs to be
explained or be given a “causal story” deals with the nature in which frequencies in a
class are produced and justified. In particular, in a pattern sequence that consists of
figural cues, a generalization may be explained in terms of how it is reflected in the
cues themselves that produce them. For example, Dung articulated his explanation of
the general formula C = 2n – 1 in Figure 2 under item E in Figure 5. His explanation
justifies why his calculated frequencies were the way they were, including the
inductive projection (i.e., observations � All A’s are B’s � The next A will be a B)
which he employed in dealing with all far generalization tasks.
Figure 5: Dung’s explanation of the generalization C = 2n – 1 in Figure 2
HOW CAN TEACHERS ASSIST THEIR STUDENTS TO ASSESS THE
REASONABLENESS OF AN ABDUCTION?
How do we justify the logic of reason behind abductive inferences involving patterns
especially if we consider the fact that there might be several available plausible
alternatives to choose from? Resolving this issue will in some way address the
practical concern of mathematics teachers who need to assist their students to develop
reasoned judgments about ampliative inferences made in relation to a generalizing
task, including ways to evaluate and reconcile students’ generalizations with the
intended ones. Psillos (1996) advances the following conditions that an ampliative
inference must fulfill: (1) It must be non-monotonic, i.e,, it must allow that a certain
conclusion be defeated by the inclusion of extra information in the premises; (2) It
must deal with the “cut-off point” problem, i.e., it must show how and why
generalizations from samples to populations as a whole are warranted; (3) It must
allow for vertical extrapolation, i.e., it must support conclusions that involve
reference to types of entity (or, more generally, vocabulary) that are not already
referred to in the premises, e.g., positing scientific unobservables, and; (4) It must
accommodate the eliminative dimension of ampliative reasoning, i.e., the fact that in
typical cases of ampliative reasoning, more than one hypotheses consistent with the

Rivera & Rossi Becker
PME31―2007 4-101
premises are considered and attempt is being made to find grounds to eliminate
(ideally) all but one of them (pp. 1-2). If we assume that any abductive generalization
made about a pattern sequence of objects should meet the extended requirement of
being an inference to the best explanation, then we fulfill the above conditions in the
following manner:
1. Non-monotonicity is satisfied. An abductive generalization of a pattern that offers
the best explanation can still be shown false if additional or different assumptions are
made which would then necessitate developing a different generalization. For
example, the best general formula for the pattern sequence in Figure 2 is C = 2n – 1 if
we agree with James’s assumptions. However, if we add the premise that the pattern
is, say, oscillating after every four terms given the available cues as the original
premises, James’s rule would no longer hold to be true.
2. The cut-off point problem is solved. Mere abduction develops generalizations out
of a few instances and inducing a general form out of repeated abduction of the same
form for several more instances might still not provide the best explanation. However,
an abduced generalization that offers the best explanation provides the cut-off point
in that it can explain why the stated generalization that depends only on a few
instances (sample) actually holds for the entire class (population). For example,
James and Dung provided the best visual-based explanations that warrant the form C
= 2n – 1 for the sequence in Figure 2. There were other students who provided
abductions that were not warranted such as Cherrie who hypothesized that since step
10 has 19 circles (after listing the number of circles per step from step 1 to 9), then
step 20 has 29 circles, step 30 has 39 circles, and so on based on a numerical
relationship that she perceived among the digits in both dependent and independent
terms.
3. Vertical extrapolation is achieved. An abductive generalization of a pattern that
provides the best explanation oftentimes draws on the deep structure of the available
and unavailable cues. For example, Demetrio’s additive generalization “just add two
for every figure” for the sequence in Figure 2 is a superficial observation and could
not be easily employed when confronted with a far generalization task. The ones
offered by James and Dung relied on an hypothesis that was based on an
unobservable perceptual knowledge which enabled them to see a relationship
between two sets of circles.
4. The eliminative dimension is accommodated. An abductive generalization of a
pattern that offers the best explanation has been chosen from several plausible ones
and judged most tenable on the basis that it provides a maximal understanding of the
pattern beyond what is superficially evident. For example, the strength and unifying
power of Dung’s abductive generalization eliminated Demetrio’s version despite the
fact that both students saw an additive relationship among the cues.
Teachers who are aware of the above conditions in relation to the formation of a
generalization about a pattern sequence of objects will be capable of exercising

Rivera & Rossi Becker
PME31―2007 4-102
judgment about which abduction will offer the best explanation; it will also enable
them to “separate good from bad potential explanations” (Psillos, 1996, p. 6). Further,
students will not be misled into thinking that anything goes in abducing a
generalization. The requirement of non-monotonicity foregrounds the necessity of
stating assumptions about a pattern undergoing generalization; it assists in
confronting biases and in resolving situations of conflict between several viable
claims of generalization for the same pattern. The requirement of a cut-off point
surfaces the need to provide a justification for a global-type of generalization (versus
a local one) that holds in both specific cases and the entire class of cases. The
requirement of vertical extrapolation focuses on providing a generalization that can
be explained in a deeper way by using perceptual knowledge or other relevant
mathematical idea or concept that bears on the class. Finally, the requirement of
eliminative dimension makes it possible to consider several possible generalizations
for a pattern, however, it also necessitates making a judgment about which one(s) will
make the most sense.
WHAT ARE SOME IMPLICATIONS FOR THEORY AND RESEARCH?
Abduction plays a significant role in the logic of discovering and establishing a
generalization of a pattern sequence. Expressing generalities about patterns cannot
simply be reduced to, and equated with, training for it is abductive which can be
approached in several different ways (leading to different hypotheses) and is always-
already complicated by the fact that it is mediated by signs. Following Peirce,
induction takes the position of verifying an already established generalization which
has been initially drawn and captured through abduction. Psillos’s (1996) four
general conditions above can assist teachers and learners to develop an abductive
generalization that provides the best explanation. Hence, it goes without saying that
not all abductions are equally valuable and tenable despite the fact that all are equally
viable. A more pressing issue deals with how to decide the goodness of an abduction
in relation to pattern construction and generalization. Aside from Psillos, we acquire
three more conditions from Peirce, as follows: (1) A good abductive generalization
made about a pattern should be able to explain the facts, i.e., there is a reliable and
justifiable causal story behind why the known, including and especially the unknown,
instances are the way they are; (2) The generalization should not surprise us, i.e., we
expect that it will hold in the largest domain possible. We do not want to frustrate
ourselves with a generalization that seems to always fail in situations when new cases
are introduced for verification; (3) The generalization should stand experimental
verification, i.e., in Psillos’s (1996) terms, it is non-monotonic with a well-justified
cut-off point and has been vertically extrapolated (Peirce, 1958, vol. 5, par. 197).
In the context of a pattern sequence that consists of figural cues, Radford (2006)
distinguishes between naïve induction and generalization as follows: naïve induction
is when a student primarily employs a numerical heuristic such as trial and error and
exhibits probable reasoning in order to guess a formula for the pattern; generalization
is when a student searches for a commonality among the available figural cues in the

Rivera & Rossi Becker
PME31―2007 4-103
pattern, notices one or several common features or relationships and then establishes
a generalization in the sense that a general property has been noticed in the particular.
The theoretical distinction has allowed Radford to define algebraic generalization
more precisely as follows: “Generalizing a pattern algebraically rests on the
capability of grasping a commonality noticed on some elements of a sequence S,
being aware that this commonality applies to all the terms of S [i.e., the formation of
a genus] and being able to use it to provide a direct expression [i.e., elaborated in the
form of a schema] of whatever terms of S” (p. 5). Two issues are worth clarifying
from the point of view of abduction as it has been explored in this paper. First,
Radford’s distinction between naïve induction and algebraic generalization can
actually be collapsed under abductive reasoning since both exhibit probable
reasoning in an apparent, purposeful search to discover and establish a generalization
from an incomplete knowledge base S. The statement of a rule in Radford’s naïve
induction, even if it has been obtained “by accident,” can be shown to involve all the
three elements which for him constitutes an algebraic generalization: there is a
commonality that is noticed from one term to the next; an assumption has been
imposed in which the rule applies to all the terms, and; there is the presence of a
direct expression despite the use of a cumbersome method such as trial and error. If a
sequence S consists of only numerical cues, most students will have no other recourse
to generalizing except through trial and error, systematically acquired or otherwise
(Becker & Rivera, 2005). A more theoretically tenable and useful distinction in
relation to pattern generalization involves acts of abduction and induction. That is,
does an act constitute developing and discovering a perceived commonality
(abduction), or is it verifying the commonality (induction) leading to a
generalization? Second, Radford is right in claiming that the construction of a direct
expression depends on the algebraic capacity of a student making the generalization.
That is, the different layers of expressing generality (factual, contextual, and
symbolic) rely at the very least on the student’s facility and fluency in representing
with variables. However, what is not clearly articulated in his characterization of
algebraic generalization deals with how to assess if it is the best generalization
possible for S. Generalizing a pattern algebraically rests on all three elements that
Radford stated as important and necessary with the additional condition that it
addresses the criteria that have been identified as important by Peirce, Josephson, and
Psillos above. Other useful criteria perhaps need to be further explored.
Acknowledgment: Support for this research was funded by the National Science
Foundation (REC-0448649). The opinions expressed do not necessarily reflect the
views of the foundation.
REFERENCES
Abe, A. (2003). Abduction and analogy in chance discovery. In Y. Ohsawa & P.
McBurney (Eds.), Chance Discovery (pp. 231-248). New York: Springer.

Rivera & Rossi Becker
PME31―2007 4-104
Becker, J. R. & Rivera, F. (2006a). Establishing and Justifying Algebraic
Generalization at the Sixth Grade Level. In J. Novotna, H. Moraova, M. Kratka, &
N. Stehlikova (Eds.), Proceedings of the 30th Conference of the International
Group for the Psychology of Math Education (Vol.4, pp. 465-472). Prague:
Charles University.
Becker, J. R. & Rivera, F. (2006b). Sixth graders' figural and numerical strategies for
generalizing patterns in algebra. In S. Alatorre, J. Cortina, M. Sáiz, & A. Méndez
(Eds.), Proceedings of the 28th Annual Meeting of the North American Chapter of
the International Group for the Psychology of Math Education (Vol.2, pp. 95-101).
Mérida, México: Universidad Pedagógica Nacional.
Becker, J. R. & Rivera, F. (2005). Generalization schemes in algebra of beginning
high school students. In H. Chick & J. Vincent (Eds.), Proceedings of the 29th
Conference of the International Group for the Psychology of Math Education (pp.
4-121 – 4-128). Melbourne, Australia: University of Melbourne.
Deutscher, G. (2002). On the misuse of the notion of abduction in linguistics. J.
Linguistics, 38, 469-485.
Josephson, J. (1996). Inductive generalizations are abductions. In P. Flach & A.
Kakas (Eds.), Contributing Paper to the ECAI ’96 Workshop on Abductive and
Inductive Reasoning. Budapest, Hungary.
Josephson, J. & Josephson, S. (1994). Abductive Inference: Computation,
Philosophy,Technology. New York: Cambridge University Press.
Peirce, C. S. (1931-1958). Collected Papers of Charles Sanders Peirce: Vols. 1-6 (C.
Hartshorne & P. Weiss, eds.). Cambridge, MA: Harvard University Press.
Psillos, P. (1996). Ampliative reasoning: Induction or abduction? In P. Flach & A.
Kakas (Eds.), Contributing Paper to the ECAI ’96 Workshop on Abductive and
Inductive Reasoning. Budapest, Hungary.
Radford, L. (2006). Algebraic thinking and the generalization of patterns: A semiotic
perspective. In S. Alatorre, J. Cortina, M. Sáiz, & A. Méndez (Eds.), Proceedings
of the 28th Annual Meeting of the North American Chapter of the International
Group for the Psychology of Mathematics Education (Vol.1, pp. 2-21). Mérida,
México: Universidad Pedagógica Nacional.

2007. In Woo, J. H., Lew, H. C., Park, K. S. & Seo, D. Y. (Eds.). Proceedings of the 31st Conference of
the International Group for the Psychology of Mathematics Education, Vol. 4, pp. 105-112. Seoul: PME. 4-105
AN ACTIVITY FOR DEVELOPMENT OF THE UNDERSTANDING
OF THE CONCEPT OF LIMIT
Kyeong Hah Roh
Arizona State University
This study examines how college calculus students develop and accommodate their
conceptual understanding of the limit of a sequence. The ε−strip activity was specially
designed to examine students’ understanding of the formal definition of the limit of a
sequence. This study focuses on a student’s conception of limit and her understanding
of the relation between error bounds and indices in the formal definition of limit. The
results show that the student improved her understanding of the concept of limit as well
as her understanding of the formal definition of the limit of a sequence since engaging
in the ε−strip activity.
INTRODUCTION
Teaching and learning the concept of limit has long been an important and interesting
research topic in mathematics education. Unfortunately, studies about students’
understanding of the concept of limit indicate that students have weak concept images
about limit (Davis & Vinner, 1986; Tall & Vinner, 1981; Williams, 1991). Weak
concept images hinder students in understanding the concept of limit distinctively from
other mathematical concepts such as asymptotes or cluster points (Roh, 2005). It is not
easy for most students to move their intuitive conception of limit toward a more formal
one (Burn, 2005; Davis & Vinner, 1986; Williams, 1991). Many calculus students do
not understand the formal definition of limit as a statement which is equivalent to what
they have been taught by reading the limit symbol (Roh, 2005).
Considering the known difficulty in understanding the formal definition of limit, this
study explored college calculus students’ understanding of limits of sequence through
a specially designed activity, named the ε−strip activity. The subjects of this study
were students who had no experience with any mathematically rigorous processes
using the following formal definition of limit:
A sequence 1{ }n na ∞
= converges to L if for any 0ε > , there exists N∈ such that for all
n N> , | |na L ε− < .
The study focused on college students’ conceptions of limit and their understanding of
the relation between ε and N in the formal definition of the limit of a sequence while
they were engaged in the ε−strip activity. As a part of the study, this paper reports how
a college calculus student BRIGID successfully developed her understanding of the
formal definition of the limit of a sequence through the ε−strip activity.

Roh
PME31―2007 4-106
THEORETICAL FRAMEWORK
Students’ Conceptions of Limit
Students’ conceptions of limit are classified into three major categories reported in
Roh (2005): (1) Regarding asymptotes as limits; (2) regarding cluster points as limits;
and (3) regarding limit points as limits.
The category of regarding asymptotes as limits Students who regard asymptotes as
limits are those who consider a limit as a straight line that the graph of a sequence
approaches arbitrarily closely, but not surpasses or crosses. Students in this category
examine if the given sequence is getting close to but not equal to a certain value
expected as its limit. Accordingly, these students properly determine the convergence
of monotone sequences. However, in non-monotone types of sequences such as
oscillating sequences, they fail to find proper asymptotic lines, and consequently, come
to the conclusion that such sequences are divergent.
The category of regarding cluster points as limits Students who regard cluster points as
limits consider a limit as a value that infinitely many terms of a sequence are clustered
around. Students in this category examine if the given sequence is getting close to or
equal to a certain value, expected as its limit. The value that these students are looking
for is actually a cluster point. Indeed, the limit of a sequence is also a cluster point. But
cluster points of an oscillating divergent sequence need not be a limit of the sequence.
Accordingly, students in this category properly determine convergence of not only
monotone sequences but also constant sequence and oscillating convergent sequences.
However, these students determine oscillating divergent sequences to be convergent
with multiple limits.
The category of regarding limit points as limits Contrasting to the above two categories,
students who regard limit points as limits consider a limit as a unique value that the
given sequence is getting close to or equal to. In fact, students in this category properly
determine the convergence of various types of sequences.
Reversibility in the Context of Limit
When students start to learn the limit of a sequence, their thinking process corresponds
identically to read the limit symbol, lim nn
a L→∞
= . In fact, most students first consider an
index and then focus on the term corresponding to the considered index. Finally, they
examine whether the difference between the limit and each term decreases to 0 as the
index increases to infinity. On the other hand, the thinking process needed in the
formal definition requires that students first choose any error bound and then find a
proper index corresponding to the error bound. Compared to the thinking process
needed in reading the limit symbol, the thinking process needed in the formal
definition is reversed. In line with this viewpoint, in this paper, the process of thinking
implied in the formal definition of limit is called the reverse thinking process. In
addition, the reversibility in this paper means the ability to understand such a relation
between ε and N in the formal definition of limit.

Roh
PME31―2007 4-107
In the paper, students’ reversibility is classified into five major levels (See Table 1). In
fact, these levels of reversibility implicitly reflect hierarchical structure in
conceptualization of the definition of the limit of a sequence (Roh, 2005).
Table 1Levels of the reversibility in the context of the limit of a sequence
Level of Reversibility Description
Reversibility Level 0 No reversibility
Reversibility Level 1 Completing the ε process
Reversibility Level 2 For some fixed 0ε > , finding N
Reversibility Level 3 For any fixed 0ε > , finding N (Static)
Reversibility Level 4 For any fixed 0ε > , hereafter as 0ε → , find N (Dynamic)
Reversibility level 4 includes the case where students conceptualize the following three
ideas: (1) the dependency of N on ε, (2) the arbitrary choice of ε, and (3) the dynamic
feature of ε to decrease to 0. Students at this level are therefore regarded as properly
understanding the relation between ε and N in the formal definition of limit.
Reversibility level 3, on the other hand, includes the case where students conceptualize
the first two ideas, “the dependency of N on ε” and “the arbitrary choice of ε,” but not
the third one, “such chosen values of ε can be rearranged to decrease to 0”. In this sense,
it is valid to regard reversibility level 4 as higher than reversibility level 3.
Reversibility level 2 describes the case where students conceptualize that “N can be
dependent on ε”, but improperly perceive the second notion “the arbitrary choice of ε ”.
To be precise, students in this level can perceive only some positive values for ε .
Using only “some values” for ε in the formal definition of limit is a misconception
which has been found in other literature as well (Pinto & Tall, 2002). Due to such a
misconception about “any ε”, it becomes impossible for these students to
conceptualize the third idea “such chosen values of ε can be rearranged to decrease to
0”. Therefore, reversibility level 3 is regarded as higher than reversibility level 2.
At reversibility level 1, students tend to complete the ε − process preferentially so as to
fix the value of ε at 0 or infinity. These students assume that any positive value of ε
can be ultimately substituted to 0 or infinity, and as a consequence, limit values of a
sequence are found by replacing 0 or infinity forε . Considering the fact that, from
reversibility level 2 to 4, the relation between ε and N is explored before completing
the ε − process, reversibility level 1 can be regarded as lower than reversibility levels 2,
3 and 4.
Reversibility level 0, finally, describes the case of no recognition of the relation
between ε and N . Therefore, reversibility level 0 should be regarded as the lowest
level in reversibility. Students at level 0 of reversibility tend to select a value of N first
and then determine the value of ε . Such a misconception about the relation between ε
and N in the formal definition of limit has been shown in other research as well
(Kidron & Zehavi, 2002; Pinto & Tall, 2002).

Roh
PME31―2007 4-108
RESEARCH METHODOLOGY
The research design of this study is in the category of a Soviet-style teaching
experiment (Kruteskii, 1976), in which the investigator engages students in
instructional activities that also serve as tasks to gauge their conceptual understanding.
The ε–strip activity was specially designed to foster an environment for students to
develop and accommodate their conceptual understanding of limit.
ε−strip Activity
Each ε–strip is a strip made of translucent paper so that students could observe the
graph of a sequence through it. In addition, its center is marked with a red line so as to
examine the limit of a sequence with a graphical version of the formal definition.
Figure 1 illustrates an ε–strip which is centered at the x-axis and lying on the top of the
graph of the sequence 1{1/ }nn ∞
=.
10 20 30 40 50
0.05
0.1
0.15
0.2
Figure 1 A graph of the sequence 1{1/ }nn ∞
=with anε − strip
After providing students enough chances to work with ε–strips, the following two
statements, called ε–strip definition A and B, were introduced to students:
ε−strip definition A: A certain value L is a limit of a sequence when infinitely many points
on the graph of the sequence are covered by any epsilon strip as long
as the epsilon strip covers L.
ε−strip definition B: A certain value L is a limit of a sequence when only finitely many
points on the graph of the sequence are NOT covered by any epsilon
strip as long as the epsilon strip covers L.
Students were then asked to determine which of the ε–strip definitions could serve as a
proper definition of the limit of a sequence. Students who precisely conceptualize the
limit of a sequence are expected to recognize the ε–strip definition B as the correct
interpretation of the limit of a sequence. On the other hand, those who do not properly
conceptualize limit might not recognize the difference between ε–strip definition A
and ε–strip definition B, or even choose ε–strip definition A as the only correct
interpretation of limits.
RESULTS
This study was conducted in a Midwestern university in the United States. Thirty three
students from three calculus classes voluntarily took a survey. Among them, 12

Roh
PME31―2007 4-109
students were selected for a series of 1-hour interviews once a week for 5 weeks.
Monotone bounded, unbounded, constant, oscillating convergent, and oscillating
divergent sequences were suggested to students during the interviews. In addition,
ε–strips were introduced to the students during Task 2 for the first time, and all tasks
from Task 2 on, students had opportunities to explore the relation between ε and N
through the ε–strip activity.
This paper presents a student BRIGID’s conceptions of limit and her reversibility
levels before (pretest), during (task 2 to task 6), and after (posttest) experiencing the
ε–strip activity. The following subsections show how BRIGID has developed and
accommodated her understanding of the concept of limit as well as her reversibility.
BRIGID on Pretest
During Pretest, BRIGID applied several conflicting criteria to sequences. For instance,
she determined the sequence 2{1/(1 )}nn ∞
=− to be convergent because this sequence is
getting close to but not equal to 0; also, she responded that the sequence 2{1/(1 )}nn ∞
=−
would diverge to infinity because the indexing process cannot be complete so that there
is no value that the sequence can attain. As a result, BRIGID experienced cognitive
obstacles in determining convergence of the sequence.
BRIGID on Task 2
At the beginning of Task 2, BRIGID repeated to change her answer to the limit of a
sequence 1{1/ }nn ∞
=between 0 and infinity.
BRIGID on Task 2: 1/na n=
BRIGID: It is going on forever, so you can say that the limit is infinity. Then I am thinking limits as when a sequence approaches a number L but never, never reaches it, L is the limit. So we can say that the limit when it is approaching but never reaches zero, so 0 is the limit. But when you graph, it is going on forever. So, I mean, it would never be. So, I guess, in my head the limit is infinity, but when I am thinking of the definition, then I am thinking it would be zero.
However, later on Task 2, BRIGID examined if a sequence is getting close to but not
equal to a certain value as do those in the category regarding asymptotes as limits.
On the other hand, for BRIGID, neither ε–strip definition A nor ε–strip definition B
sounded a proper description of the limit of a sequence.
BRIGID on Task 2: 1/na n=
BRIGID: Umm I don’t think they [ε−strip definitions] are correct, because after while, I mean, your strip, if we look at very small strip, your strip would be really small so the points that are not covered by strip is infinity. Finitely is going to be infinity. I mean, you can go way way way down, like small, small strip.
The above excerpt shows that BRIGID considered the case as ε is getting infinitely
small and then eventually becomes 0. When ε is 0, it would not be possible for any term
of the sequence to get within the error bound 0 of the limit. Therefore, according to

Roh
PME31―2007 4-110
ε–strip definitions, the limit of this sequence should not exist. BRIGID thought that this
was what ε–strip definitions would imply. However, she believed that the limit of the
sequence ε–strip is 0. Therefore, BRIGID concluded that neither ε–strip definition A
nor ε–strip definition B would properly represent the limit of a sequence.
BRIGID on Task 3
On Task 3, BRIGID described that a sequence converges if the sequence is
approaching a certain value. BRIGID also believed that ε–strip definition A sounded
correct to her but ε–strip definition B did not. This is, in fact, the conception of limit for
students in the category regarding cluster points as limits. The following excerpt
reveals her viewpoint.
BRIGID on Task 3:
BRIGID: Umm this [A] is just talking about when you look at the graph if the numbers are, I mean, you can look on the epsilon strip if they’re staying in the epsilon strip, then you can umm tell that they are slowly approaching a number. Umm, this one [B] I just umm I don’t know I guess I just, I just don’t like this [B]. [laugh] I guess when I read it [B], it [B] just doesn’t make any sense to me.
It is noted that, on Task 3, BRIGID started to imagine putting some ε–strips on the
graph of a sequence which means that her reversibility was shifted from level 1 to level
2 on Task 3.
BRIGID on Task 4 & on Task 5
As did she on Task 3, BRIGID continued to apply the criterion of “getting close to or
equal to” to determine convergence of sequence. BRIGID also became to consider not
only ε–strip definition A but also ε–strip definition B as valid interpretations for limit.
Her response is actually is a typical response to students who confuse the concept of
limit with the concept of cluster point.
BRIGID on Task 5: ( 1) /n
na n= −
BRIGID: If you are looking at the red line of the epsilon, it gets smaller and smaller. And you look outside the strip, there are going to be only, if you look down here and it is this size, then you know there is only going to be finitely many points compared to infinity. And so no matter how small this gets and how far down this starts, there are still going to be that many points and infinite amount of points inside the strip.
On the other hand, her reversibility was shifted from level 2 to level 4 on Task 4. It is
also remarkable that BRIGID started to imagine any ε–strip in evaluating the validity
of ε–strip definitions.
As did she on Task 3, BRIGID continued to apply the criterion of “getting close to or
equal to” to determine convergence of sequence. BRIGID also became to consider not
only ε–strip definition A but also ε–strip definition B as valid interpretations for limit.
Her response is actually is a typical response to students who confuse the concept of
limit with the concept of cluster point.

Roh
PME31―2007 4-111
BRIGID on Task 5: ( 1) /n
na n= −
BRIGID: If you are looking at the red line of the epsilon, it gets smaller and smaller. And you look outside the strip, there are going to be only, if you look down here and it is this size, then you know there is only going to be finitely many points compared to infinity. And so no matter how small this gets and how far down this starts, there are still going to be that many points and infinite amount of points inside the strip.
On the other hand, her reversibility was shifted from level 2 to level 4 on Task 4. It is
also remarkable that BRIGID started to imagine any ε–strip in evaluating the validity
of ε–strip definitions.
BRIGID on Task 6 and on Posttest:
From Task 6 to Posttest, BRIGID became to properly understand the limit of a
sequence without confusing it with cluster points. Furthermore, she asserted that the
infiniteness of the number of terms inside an ε − strip does not guarantee the finiteness
of the number of terms outside the ε − strip, hence ε − strip definition A does not imply
an appropriate statement for the limit of a sequence.
BRIGID on Task 6: ( 1) (1 1/ )n
na n= − +
BRIGID: I think that this one [B] works here because this one [B] shows that um you can’t have infinite amount of points outside the strip, and in this case [this sequence] that one does so, if you are thinking that 1 is the limit, it wouldn’t be the limit looking at this definition [B]. But by looking at this definition [A], you can’t really tell because there are infinitely many points inside the strip, but here are also infinitely many outside.
Even though BRIGID could imagine any ε–strip in evaluating the validity of ε–strip
definitions, she did not consider ε − strip definition B as describing the dynamic feature
of the value of ε which can be decreasing to 0. BRIGID therefore wanted to add a
condition to ε − strip definition B so as to specify the value of ε to move towards 0.
BRIGID on Task 6: ( 1) (1 1/ )n
na n= − +
BRIGID: I don’t, I mean it [B] works for some cases, but not when the epsilon strip is that big. Maybe if it [B] said something about no matter how small the strip gets there are still going to be a finite amount of points.
CONCLUDING REMARKS
It is noteworthy that as BRIGID was engaged in the ε − strip activity, she developed
not only her conception of the limit of a sequence but also her reversibility level. As
seen in Table 2, BRIGID’s conception of limit was developed from regarding an
asymptote as a limit (on Task 2) to regarding a cluster point as a limit (on Task 3), and
eventually she came to properly conceptualize the limit of a sequence (from Task 6).
Furthermore, her reversibility has been improved from level 1 (on Task 2) to level 4
(on Task 4). This result is remarkable since there was no procedure for indicating
BRIGID’s errors, correcting her misconceptions about limit, or confirming the
propriety of ε − strip definition B during the task-based interviews. Therefore, this

Roh
PME31―2007 4-112
study implies that the ε − strip activity can be regarded as an effective instructional
method in teaching the limit of a sequence.
Table 2 BRIGID’s development of understanding of the limit of a sequence
Regarding
asymptotes as
limits
Regarding
cluster points as
limits
No distinction between
cluster points and limits
Regarding limit
points as limits
Reversibility 0
Reversibility 1 On Task 2
Reversibility 2 On Task 3
Reversibility 3 On Task 6,
On Posttest
Reversibility 4
On Task 4
On Task 5
References
Burn, B. (2005). The vice: Some historically inspired and proof-generated steps to limits of
sequences. Educational Studies in Mathematics, 60, 269-295.
Courant, R., & Robbins, H. (1963). What is mathematics? An elementary approach to ideas
and methods. Oxford: Oxford University Press.
Davis, R. B., & Vinner, S. (1986). The notion of limit: Some seemingly unavoidable
misconception stages. Journal of Mathematical Behavior, 5, 281-303.
Fischbein, E. (1994). The interaction between the formal, the algorithmic, and the intuitive
components in a mathematical activity. In R. Biehler, R. W. Scholz, R. Sträßer, & B.
Winkelmann (Eds.), Didactics of mathematics as a scientific discipline (pp.231-245).
Dordrecht, The Netherlands: Kluwer Academic.
Kidron, I., & Zehavi, N. (2002). The role of animation in teaching the limit concept. The
International Journal of Computer Algebra in Mathematics Education, 9, 205−227.
Krutetskii, V. A. (1976). The psychology of mathematical ability in schoolchildren (J. Teller,
Trans.). Chicago, IL: University of Chicago Press.
Pinto, M. & Tall, D. (2002). Building formal mathematics on visual imagery: A case study
and a theory. For the Learning of Mathematics, 22(1), 2-10.
Roh, K. (2005). College students’ intuitive understanding of the limit of a sequence and their
levels of reverse thinking, Unpublished doctoral dissertation, The Ohio State University,
Columbus, OH.
Tall, D., & Vinner, S. (1981). Concept image and concept definition in mathematics, with
particular reference to limits and continuity. Educational Studies in Mathematics, 12,
151-169.
Williams, S. (1991). Models of limit held by college calculus students. Journal for Research
in Mathematics Education, 22, 219-236.

2007. In Woo, J. H., Lew, H. C., Park, K. S. & Seo, D. Y. (Eds.). Proceedings of the 31st Conference of
the International Group for the Psychology of Mathematics Education, Vol. 4, pp. 113-120. Seoul: PME. 4-113
EARLY ACCESS TO ALGEBRAIC IDEAS: THE ROLE OF
REPRESENTATIONS AND OF THE MATHEMATICS OF
VARIATION
Teresa Rojano Ceballos and Elvia Perrusquía Máximo
Cinvestav / ILCE
This article reports on the findings of a study undertaken of six 10 to 12 year old children,
who work with activities that involve mathematical registers (graphic or tabular) and
movement phenomena generated by a simulator (MathWorlds) for the purpose of
introducing the idea of functional relations by way of exploring the phenomenon of speed.
Some of the findings indicate that the representation registers and the simulation helped
students who had already begun to build the notion of speed to express it as a relationship
of dependence between the time and distance variables. Whereas in other cases, the
representation registers are used for the purpose of obtaining information and to begin
building that notion.
Introduction:
Research undertaken in recent decades report on a series of difficulties faced by
students in their algebra learning’s. Based on some of that research, the question of
whether or not algebra learning should be initiated earlier in curricular contents has
arisen. The work reported on here attempts to contribute to answering that question.
Background:
Early initiation to algebra has been researched from varying standpoints. Some take
knowledge of mathematics as their point of departure to extract the algebraic nature
of that knowledge (for instance: Carraher, D. et al. 2000). Others adopt a functional
approach (Warren and Cooper, 2005; Yerushalm, 2000). Still others use different
representations to develop algebraic language (Van Amerom, 2003); and along that
same line, there are some who use computer environments in which to generate more
than one mathematical representation of algebraic ideas (for example Blanton and
Kaput, 2001; Kieran, 1996).
Among the gamut of studies on early introduction to algebra, our research stands
amidst those that resort to technological learning environments in order to lay bridges
between intuitive notions in algebra and mastery of the symbolic language of algebra.
Usage of computer environments enables production of diverse representations of
mathematical concepts, with which formal knowledge can become more meaningful,
since students can directly manipulate those representations. In the particular case of
movement phenomena, the possibility of imbuing mathematical concepts with
meaning is favored by working in computer environments that include phenomena
simulators, as well as the corresponding graphic and tabular representations of those
phenomena.

Rojano & Perrusquía
PME31―2007 4-114
Taking the foregoing into consideration, our research seeks to: i) explore the
possibility of taking advantage of movement phenomena to introduce algebraic ideas
as of the mathematics of variation; ii) initiate young student who have had no formal
algebra instruction to the idea of a relationship between variations by resorting to
simulations generated by the MathWorlds computer program; and iii) the algebraic
idea explored is that of functional relationship as speed, as of reading position and
speed charts, added to construction of numerical variation tables.
Theoretical Elements:
The theoretical reference dealing with representation registers that was used was that
of the work of R. Duval (1998). According to the latter author, semiotic
representation registers provide an effective means of materializing knowledge and of
dealing with mathematical objects. Learning activities that integrate and coordinate
several representation registers can help students avoid confusing the mathematical
object with its semiotic representation, and relate the mathematical object with more
than one representation. In this type of learning, Duval says, three cognitive activities
must be fostered: formationi, treatment
ii and conversion
iii, between different
representation registersiv of one and the same concept.
Research Design:
A study was developed for cases differentiated by levels in the following stages:
1) Designing twelve learning activities aimed at promoting the cognitive activities of
formation, treatment and conversion of registers (Duval, R. 1998). These cognitive
activities served as indicators of the progress of participating students. The learning
activities sought to deal with: i) use of more than one representation register: a)
reading position charts, b) building position tables and charts, and c) reading speed
charts; ii) the notion of constant speed (functional relationship); and iii) resolution of
proportional problems in movement situations.
Data Collection: a) Diagnostic questionnaire on arithmetic knowledge, obtaining
information from tables and charts and on the notion of speed; b) semi-structured
interviews; c) student productions as of the teaching activities with MathWorlds; d)
video-tapes of the work sessions with each of the subjects.
2) Preliminary study: both the diagnostic instrument and the sequence of learning
activities were put to the test. Based on the responses provided in the diagnostic
instrument, the students were classified into the following levels:
LEVEL III. LEVEL II LEVEL I.
Limited arithmetic knowledge. Basic arithmetic knowledge. Sound arithmetic knowledge.
Limited ability to read table and
chart.
Basic ability to read tables and charts. Ability to read tables and charts.
Notion of speed: Not consistent in
identifying faster or slower speed
when asked to compare distance or
duration of a run, or when having to
compare the two variables.
Notion of speed: Does not identify
faster or slower speed when asked to
use the distance covered or the
duration of the run.
Notion of speed: Compares the two
variables involved (distance and
time) when identifying a faster or
slower moving object.

Rojano & Perrusquía
PME31―2007 4-115
Selection of subjects: Three grade five children and three grade six children were
chosen from a public elementary school in Mexico City. The children selected were
3) Main study: six 10 to 12 year old students were chosen, classified in three levels,
based on the responses provided to the diagnostic instrument (table above). The
twelve learning activity sequences were undertaken in sessions of approximately one
hour. The foregoing period of time also included two interviews, one at the half way
point and one at the end of the teaching sequence.
Data analysis:
Analysis criteria: a) Treatment with registers and conversion between registers
while completing the tables, drawing charts, solving simple problems and solving
problems of the types d)v=d/t; e) d=v×t; f) t=d/v. b) Problem solving strategies
according to the representation registers used, problems of the type: v=d/t ; d=v×t;
and t=d/v. c) Notion of speed as a relation of dependence between two variables. In
other words, explanations given regarding the movement of simulator characters,
based on the different representation registers available.
Results from main study:
a) Treatment and conversion of registers
Level I
Erick: Very quickly leaves use of simulator registers aside, instead carries out
operations with numerical data when solving the different types of problems that
were presented to him. He obtains information from each of the registers, in addition
to having no trouble discreetly building charts and tables.
Eduardo: To provide responses, indistinctly uses data from the charts or the tables.
Builds charts discreetly; at the end of the activities draws charts continuously.
Frequently uses the simulator in order to obtain information that enables him to check
his results. Use of the simulator became less frequent in the final activities, resorting
to the simulator to analyze the situation but not as much to obtain information in
order to provide a response.
Level II.
Ana Karen: Shows a marked need to manipulate the simulator’s different registers.
For instance, to discretely run the simulation so as to observe the gradual construction
of a position chart or movement of the simulator’s characters, and issues her
responses based on the data obtained. Obtains information and checks her answers
based on her observations of the simulator’s gradual construction of the position chart
or by changing that register on the computer screen and at times the tabular
representation built. She finds it difficult to solve problems for which she is not
allowed to use the simulator. Builds charts discreetly.
Clara: Expresses a notable preference for obtaining information from the charts to
provide her answers. Builds charts continuously right from the first activity. At times

Rojano & Perrusquía
PME31―2007 4-116
she spontaneously draws charts on paper to solve problems, when she was not
allowed to change the simulator’s chart. Resorts to the simulator less frequently
during the final activities, using the computer program information to examine the
problem raised in order to provide a result.
Level III
Rodrigo: A marked preference for obtaining information from the simulator chart is
detected, expressing complete resistance to providing responses when given the
opportunity to only obtain information from the tables. When drawing charts, he does
so discreetly. At the beginning uses the simulator to obtain information and
afterwards to check that his answers are correct.
Rafael: Draws his first charts discreetly; at the end of the activities he draws charts
continuously. Does not show any preference for a particular representation register.
Frequently resorts to obtaining information from the simulator in order to check his
answers. In the last activities, he resorted to analyzing the problem presented based
on observing simulator registers, and in this way issued his answers.
b) Strategies while solving problems:
Level I
Erick: Carries out the operations with the data provided in the wording of the
problem. Only when he is completely unfamiliar with the problem type (t=d/v) that is
presented to him does he resort to observing or changing the simulator chart. On
subsequent occasions that he is faced with that type of problem, he works it out using
the numerical data provided in the wording once again.
Eduardo: When faced with simple problems, he runs the simulation and observes the
chart included in the simulator. He changes the simulator chart when solving
problems of the v=d/t type, afterwards he just uses that register as support to obtain
information and carry out operations such as multiplications and divisions. In
problems of the d=v×t type, the resorts to doing the multiplications. To solve
problems of the type v=d/t and of the type t=d/v, he uses a multiplicative strategy.
Level II
Ana Karen: When solving simple problems, she does repeated additions or runs the
simulator. When faced with problems of the v=d/t type, she resorts to doing repeated
additions, alternates the strategy of repeated sums with a multiplicative strategy,
always with the support of running the simulation to observe the gradual construction
of the position chart. When presented with problems of the type d=v×t, she changes
the simulator chart. With problems of the t=d/v type, she builds a table to issue her
answer, then resorts to doing divisions with the problem data.
Clara: With simple problems, she obtains information from the axes of the chart
included in the simulator. For problems of the type v=d/t, she frequently resorts to
running the simulator; another strategy she uses is repeated additions by trial and

Rojano & Perrusquía
PME31―2007 4-117
error, followed by a multiplicative strategy. When solving problems of the v=d/t type
and d=v×t type, she does repeated additions and multiplications by trial and error. She
combines that strategy with drawing position charts on paper to solve problems of the
v=d/t type. At the end of the activities, she solves problems of the type d=v×t and the
type t=d/v by doing operations with the data obtained in the wording of the problem.
Level III
Rodrigo: Solves the initial problems by obtaining information from repeatedly
running the simulator in order to observe the movement of the characters and how the
corresponding charts are built. He solves problems of the type v=d/t based on changes
he makes to the simulator chart and using a multiplicative strategy. During the last
portion of the activities he combines his strategies, first dividing the data in the
wording of the problem, then multiplying the result of the division by time in order to
check his answer. For problems of the d=v×t type, he resorts to repeated additions,
and checks his answer by multiplying the result by time so that the result will give
him total distance. Problems of the type t=d/v are difficult for him to solve and he
resorts to changing the simulator chart.
Rafael: Solves simple problems by operating with data obtained from the wording of
the problem. He solves the first problems of the type v=d/t and d=v×t by changing the
simulator chart; the next strategy he uses to solve this type of problem is a
multiplicative-type strategy. For problems of the type t=d/v, he obtains information
by counting the squares on the x axes of the simulator chart; then on the next
problems of this type he changes the simulator chart.
c) Notion of speed
Level 1
Erick: From his very first descriptions of the characters’ movements, he identifies a
dependence relationship between the distance and time variables. He says things like:
“the frog moves four meters every second and the clown advances two meters.” The
first notion of speed that he externalizes is: “that speed is what is run in one second,
in two, like that.” Upon completion of the work sessions with the activities and when
asked to verbalize a definition of speed, he is unable to give a generalization and is
only able to express his notion based on particular examples: “speed is what moves
the clown, it is slower than what moves the frog (based on the last example that he
was shown on the simulator)”.
Eduardo: In his very first explanation takes the two variables involved in the notion
of speed into consideration: “in one second clown 1 goes six meters and 2 goes eight
meters.” He finds it difficult to give an initial explanation of speed, and limits himself
to explaining that through the numerical values he is able to identify a faster or
slower speed: ”that sixty is more than thirty-five”. Upon conclusion of the activities,
the notion of speed that he externalizes may be indicative of having consolidated his

Rojano & Perrusquía
PME31―2007 4-118
previous knowledge of speed: “You could say that it is the quickness that there is
between two people or two objects.”
Level II
Ana Karen: At the beginning of the activities, she gave explanations in which she
considered the distance variable as the main element involved in a faster or slower
speed. The notion of speed that she possesses at the beginning of the work focuses
only on taking the distance variable into consideration: “it is the kilometres that a car
or another thing advances”. Upon completion of the activities, she takes both
variables into account, albeit without making the functional relationship that exists
between them explicit “it may be the time it takes for the run.”
Clara: Her first explanations of the characters’ movements indicate that she is
focusing on the physical conditions of the phenomenon “the way he is walking is
slower”. During the first activities, she attributes faster or slower speed to a greater or
smaller distance covered. Her first explanation of speed includes information dealing
with both variables involved in the notion: “the floors per second covered, the
distance covered by hours”. The last definition of speed that she expresses indicates
that she is generalizing one of the variables: “the distance covered by an object every
second.” The latter explanation may be indicative that this notion is in the process of
being consolidated.
Level III
Rodrigo: At the beginning, he feels that the main factor influencing movements are
the physical characteristics of the character: “the clown is small and that is why his
legs go slowly.” As he progresses in his work with the activities, he attributes a higher
speed to the moving object that takes less time to cover the distance and vice versa. In
other words, he feels that only one variable is involved in the movement of the
characters. After having completed the first activities, his explanations include
elements related to both variables: “it advances a third every second and the red one
two floors every second.” He uses a particular example in order to externalize his first
notion of speed: “that it is two floors, that it advanced one floor per second.” In his
last explanations, he indicates that he recognizes a dependence relationship between
the variables of distance and time, but only generalizes the first variable and resorts to
a particular example when referring to the second: “it is the distance, it is what he
covers in each second ”.
Rafael: In his first descriptions of the characters’ movement, the distance covered is
the main element of comparison for him: “it goes two by two and it is slower”. Then
he considers time, duration of the run, as an indicator of slower or faster speed. The
first definition that he gives of speed indicates that he is taking both variables into
consideration: “what he covers over time”. At the end of his work with the activities,
his notion of speed includes the two variables expressed in general terms: “the time it
takes to cover it; the time and the distance”.

Rojano & Perrusquía
PME31―2007 4-119
Conclusions:
Treatment and conversion: Students in level I quickly detach themselves from the
simulator, using more abstract registers and showing fluency as they move from one
register to another (conversion), added to being able to draw position charts
continuously. Students in level II take much longer to detach themselves from using
the simulator. Students in level III resorted to intuitive processes while solving the
problems, such as repeated additions, using the simulator as a means of support and,
at times, using more abstract registers. They had some trouble moving from one
register to another because they needed the support of an intermediate register, such
as the simulator.
Strategies used to solve problems: The additive strategy is used quite frequently by
students in levels II and III. Insofar as they progress in performance of the activities,
they leave that strategy behind and resort to using the multiplicative strategy.
Students in level I did not use additive strategies (repeated additions) when solving
problems of the v=d/t and d=v×t types. When they were not allowed to use the
simulator, students in levels I and II had no trouble solving problems of the v=d/t and
d=v×t types. When faced with the latter same problems, students in level III required
use of the simulator registers. All six students found it difficult to solve problems of
the type t=d/v.
Description of movement: The first explanations of movement provided by the two
cases in level II identified the physical traits of the characters as the main element
influencing faster or slower speed. This could be interpreted, in view of Duval’s
theory, as the students confusing the representation with the mathematical object. The
situation is nonetheless overcome as the subjects move forward with their activities
work and the transition between various representation registers is promoted. Level I
students quickly relate the two variables. Those in level II are able to recognize a
relationship between distance and time, but after a longer amount of time working
(treatment) and of travelling between two registers (conversion). Level III students
established a relationship of dependence between variables, resorting to particular
examples. Identifying the latter relationship took them longer to achieve.
The notion of speed: The six cases identified that two elements are involved in speed,
distance and time, and that they have a relationship of dependence. The foregoing
statement can be made because the six cases include elements that refer to distance
and time in their explanations of speed. Evolution of the notion of speed is much
more evident in Level II and III cases, but without reaching what could be considered
a consolidated notion of speed, rather one that is still in the process of being built. We
detected that in order for the subjects to be able to externalize an explanation of speed,
those in grade five needed to use particular examples, while one could say that the
definitions of those in grade six showed signs of generalization of the notion of speed
and the functional relationship underlying that notion.

Rojano & Perrusquía
PME31―2007 4-120
Final Remarks:
We were able to observe that the variety of representations played a determining role
in the explanations that the students provided on the notion of functional relation in
the specific case of speed. The specific design of the activities used in this research
attempts to help lay a bridge between students’ intuitive notions dealing with the
relations between variables and learning symbolic algebra. The foregoing is clearer in
students who have more solid prior knowledge. In this regard, one can state that
representation registers bolster processes for conceptualizing algebraic ideas based on
application situations derived from the mathematics of variation (in this case, the
phenomena of movement).
References:
Blanton, M., and Kaput, J. (2001). Algebrafying the elementary mathematics experience.
Part II: Transforming practice on a district-wide scale. In H. Chick, K. Stacey, J. Vincent,
and J. Vincent (Eds.), The future of the teaching and learning of algebra (Proceedings of
the 12th ICMI Study Conference, pp. 87-95). Melbourne, Australia: The University of
Melbourne.
Carraher, D., Schliemann, A. and Brizuela, B. (2000). Early Algebra, Early Arithmetic. In:
Proceedings of 22th Annual Meeting of the American Educational Research Association,
Tucson, Arizona- Available at: www.earlyalgebra.terc.edu.
Duval, R. (1998). Registros de Representación Semiótica y Funcionamiento Cognitivo del
Pensamiento. En: Hitt, F. (Ed.). Investigaciones en Matemática Educativa II. Grupo
Editorial Iberoamérica, México.
Kieran, C., Boileau, A. and Garançon, M. (1996). Introducing Algebra by Means of a
Technology Supported, Functional Approach. In Bednarz, N., Kieran, C. and Lee, L.
(Eds.). Approaches to Algebra. Perspectives for research and teaching. pp. 257-293.
Kluwer Academic Publishers, Netherlands.
Van Amerom, B. (2003). Focusing on informal Strategies when Linking Arithmetic to Early
Algebra. In Educational Studies in Mathematics 54: 63-75. Kluwer Academic Publishers.
Netherlands.
Warren, E., and Cooper, T. (2005). Introducing Functional Thinking in Year 2: a case study
of early algebra teaching. In Contemporary Issues in Early Childhood, Vol. 6, No.2 pp.
150- 162.
Yerushalmy, M. (2000). Problem solving strategies and mathematical resources: A
longitudinal view on problem solving in a function based approach to algebra. In:
Educational Studies in Mathematics, vol. 43, num. 2, 125-147 Kluwer Academic
Publishers, Netherlands.
i Formation: creating a representation register. ii Treatment: internally transforming the representation. iii Conversion: transforming the original representation into another representation. iv Representation register: symbols, notes, writing through which one can represent mathematical objects that are
essential for conceptual apprehension

2007. In Woo, J. H., Lew, H. C., Park, K. S. & Seo, D. Y. (Eds.). Proceedings of the 31st Conference of the International Group for the Psychology of Mathematics Education, Vol. 4, pp. 121-128. Seoul: PME. 4-121
THE ROLE OF COGNITIVE CONFLICT IN BELIEF CHANGES
Katrin Rolka, Bettina Rösken and Peter Liljedahl University of Dortmund, Germany / University of Duisburg-Essen, Germany /
Simon Fraser University Canada
In this paper, we analyze changes in students’ beliefs against the background of
conceptual change. The theory of conceptual change has its origin in the well-known
work of Kuhn and Piaget and is based on a constructivist view of learning. A more
elaborated analysis of conceptual change is given by a model of Appleton (1997),
which describes different possibilities of what takes place when students are
confronted with new information and experiences. We analyze our data according to
these possibilities in order to explain the changes in beliefs. Participants of this study
were preservice elementary school teachers enrolled in a course taught with the
implicit goal of initiating cognitive conflict regarding their existing beliefs about
mathematics and its teaching and learning.
INTRODUCTION
Within the last few years, much research has focused on beliefs as decisive regulators for mathematics teachers’ professional behavior in the classroom (Chapman, 2002; Ernest, 1989). This research has focused primarily on the misconceived beliefs about the teaching and learning of mathematics that are formed over teachers’ lengthy experiences as students (Ball, 1988; Skott, 2001). These beliefs are complex and often robust constructs and consequently difficult to change (Schommer-Aikins, 2004).
Much effort has been done in this research field but, as of yet, little is known about the explicit processes of change in teachers’ beliefs (Thompson, 1992). Our own research in this area does not escape this criticism. Through our work we have shown how interventions produced changes in preservice teachers’ beliefs about mathematics and its teaching and learning of mathematics (Rolka, Rösken & Liljedahl, 2006). What this research has failed to show, however, is how and why these changes are occurring. In order to explain the mechanisms behind this change we analyzed the observed phenomena from a perspective of conceptual change (Liljedahl, Rolka & Rösken, in press). The theory of conceptual change (Posner, Strike, Hewson & Gertzog, 1982; Vosniadou & Lieven, 2004) goes back to Kuhn’s (1970) structure of scientific revolution as well as Piaget’s (1985) basic notions of disequilibration and cognitive conflict. Further development of this theory is given by Appleton (1997) who elaborated on a constructivist-based model for describing and analyzing students’ learning during science lessons.
Although conceptual change theory has been applied to explain phenomena in mathematics teaching and learning in general (Tirosh & Tsamir, 2006) this approach has hardly been used to understand changes in beliefs. Nevertheless, Pehkonen

Rolka, Rösken & Liljedahl
PME31―2007 4-122
(2006) suggests that the theory of conceptual change could explain the difficulties regarding teacher change in beliefs. He points to the complex situation of a teacher who possesses new pedagogical knowledge but at the same time does not change his or her beliefs about teaching. In this paper, we provide a detailed analysis of change in beliefs as conceptual change.
THEORETICAL FRAMEWORK
On beliefs and belief systems
Beliefs are complex constructs, and belief systems are even more so. Although beliefs have often been referred to as “messy constructs” (Furinghetti & Pehkonen, 2002; Pajares, 1992) there is at least some consensus that beliefs are considered as personal philosophies about mathematics and its teaching and learning. According to Green (1971), belief systems can be characterized by three factors: quasi-logicalness, psychological centrality and cluster structure. The quasi-logical order refers to primary or derivative beliefs. Psychological centrality considers the strength by which beliefs are held, whether they are central or peripheral. Cluster structure points to the fact that beliefs are always held in dependency to other beliefs and that they are organized into different clusters. Similarly, Aguirre and Speer (2000) describe this phenomenon by the term belief bundle, which “connects particular beliefs from various aspects of the teacher’s entire belief system” (p. 333). The aforementioned factors are also important regarding change in beliefs:
Teaching is an activity which has to do, among other things, with the modification and formation of belief systems. […] Each of these factors will influence strongly the capacity of a student to absorb new information, assimilate new ideas and relate new experiences to old and familiar ideas. (Green, 1971, p. 48).
Therefore, we use the theory of conceptual change to deeper understand the process of change in beliefs.
On conceptual change
In what follows, we consider learning as a constructivist process in which a person develops not only knowledge but also relatively stable beliefs. According to Llinares and Krainer (2006) conceptual change can be defined as learning that changes existing beliefs and knowledge:
Constructivist views of learning are the basis of much of the research on learning to teach; however, they remain in many cases implicit. From this perspective, student teachers’ learning can be evidenced by changes in their beliefs and knowledge and conceptualized as a dynamic process of constructing beliefs supported by student teachers’ reflections during practice (p. 437).
More precisely, the theory of conceptual change describes “the kind of learning required when the new information to be learned comes in conflict with the learners’ prior knowledge usually acquired on the basis of everyday experiences” (Vosnadiou & Lieven, 2004, p. 445). Basic assumptions are that in some cases students form

Rolka, Rösken & Liljedahl
PME31―2007 4-123
misconceptions about phenomena, that these misconceptions stand in stark contrast to the accepted theories explaining these phenomena, and that these misconceptions are robust. This theory has four main criteria for relevance, which are here adapted to beliefs: lived experience, belief rejection, belief replacement, and synthetic model. This model describes primarily the conditions which decide whether cognitive change in students can occur (Posner et al., 1982). In a recent paper (Liljedahl, Rolka & Rösken, in press) we analyzed preservice teachers’ beliefs with regard to the cognitive change conditions outlined above.
A more detailed analysis for conceptual change is given by Appleton (1997) who elaborated on a model for describing and analyzing students’ learning especially during science lessons. This model provides, in relation to Piaget’s terms of assimilation and accommodation, different possibilities of what happens when students are confronted with new information and experiences. When this new information is processed the situation evolving can be described by three possibilities:
• Identical fit: The new information may form an apparent identical fit with an existing idea. This means that the students are able to make sense of the new information on the basis of their existing knowledge. This does not imply the correctness of the students’ explanations.
• Approximate fit: The new information form an approximate fit with an existing idea in which aspects are seen to be related, but details may be unclear. These students encounter new ideas but do not give up old ones. However, even if contradictory, they do not reach a situation where a cognitive conflict could take place. Hence, new information is assimilated but not accommodated.
• Incomplete fit: The new information is acknowledged as not being explained by the ideas tried so far. This incomplete fit of information results in a cognitive conflict. When students experience an incomplete fit they try to reduce the conflict by seeking information which might provide a solution.
The main mechanism for change in Appleton’s model is cognitive conflict. Although originally conceived in the context of knowledge change this mechanism is equally applicable in the context of belief change.
METHODOLOGY
The data for this paper comes from a research study that looked more broadly at initiating changes in preservice teachers’ beliefs (Rolka, Rösken & Liljedahl, 2006). Participants in this study were 39 preservice elementary school teachers enrolled in a Designs for Learning Elementary Mathematics course for which the third author was the instructor. The course was taught with the implicit goal of teaching for conceptual change in beliefs. This constructivist approach is characterized by the fact that the students were immersed into a problem solving environment for initiating metacognitive discourse about their mathematics-related beliefs. Further, students

Rolka, Rösken & Liljedahl
PME31―2007 4-124
encountered different instructional strategies so that they were encouraged to change their conception about the meaning of teaching and learning. Throughout the course the participants kept a reflective journal in which they documented their beliefs. In the first and final week of the course, they were asked to respond to the following questions:
• What is mathematics?
• What does it mean to learn mathematics?
• What does it mean to teach mathematics?
RESULTS
In recent papers, we focused on a holistic and aggregated picture of evolving beliefs of preservice elementary school teachers while undertaking a method course (Rolka, Rösken & Liljedahl, 2006; Liljedahl, Rösken & Rolka, 2006). In what follows we analyze changes in beliefs according to the aforementioned model proposed by Appleton (1997) and illustrate the three possibilities by student quotations. As the most impressive changes become obvious in the incomplete fit, we give several examples there.
Identical fit
In her first journal entry, Jacqueline writes the following:
To teach mathematics, is to guide the learner through the process. It is not the job of the teacher to supply the answer, but to scaffold the process in order for the learners to be successful problem solvers. Guiding the students through the process also allows the learners to discover at their own pace and be at the centre of their learning.
Jacqueline focuses on the role of the teacher as a guide. In her last entry she still remains in this position.
Finally to teach mathematics is to teach through facilitation. The teacher is there to guide students’ through the process and supply them with the most efficient tools to solve a problem. It is ultimately up to the student to discover for themselves. […] It is also the role of the teacher not to provide the answer but put this on the students to solve in the way that best suits them.
This example shows that the ideas offered by the course seem to fit perfectly with what Jacqueline has experienced so far. There is no apparent need for her to change her beliefs.
Approximate fit
Aleksandra writes in her first journal entry the following:
I think mathematics is something more than just the use of numbers. It is a way of thinking, a way of knowing things and figuring things out. I believe that it is one of the many ways that some people understand life, connected to multiple intelligences. What I mean is that it is beyond just looking at the world “numerically” and calculating things –

Rolka, Rösken & Liljedahl
PME31―2007 4-125
it is logical reasoning. Mathematics is a belief that everything has a rational explanation. It is an abstract and conceptual way of thinking about the world around us and solving logical problems.
In few words, Aleksandra views mathematics as a way of thinking. In her last entry, she states:
I now realize that my understanding of what mathematics is has not really changed but expanded through the course of this class. I would add to this definition [that she used in her first entry] that it is also the way we examine information and analyze it. It is the use of mathematical concepts in real life situations and the flexible way of thinking about numbers, algorithms, patterns, etc. that apply to life. It is an abstract way of looking at the world, through the visualization of number and spatial concepts. It is also using logical and deductive reasoning and making inferences, evaluation problems and situations and making judgments and decisions in given situations. It is the ability to predict and plan and visualize things that are not necessarily presented to us visually.
Aleksandra articulates that her understanding of what mathematics is has not really changed but she emphasizes that she added some beliefs to her already existing ones. Hence, the course did not succeed in producing a fundamental change in her beliefs.
Incomplete fit
Jordan writes in her first entry:
We teach math so that we can help develop in our students their ability to think logically. […] Therefore, by learning mathematics you become better equipped to reason and logically justify your answers.
In her last entry, however, she states in an impressive way what the course offered to her:
As for teaching it [mathematics], now I see my role as someone who needs to lead students to discover the why rather than simply explaining it. I love the insight you gave regarding “You always find something the last place you look”. This related to teaching was a bit “earth shattering” for me.
By using the term “earth shattering”, Jordan describes the cognitive conflict that occurred during the course. This strongly emphasizes what happened in her.
Another example for an incomplete fit is Kalpna:
What I can say about my understanding of mathematics, at this point, is that it is about numbers and how they relate to one another.
At the beginning of the course, Kalpnas remarks are very short and succinct. However, in her last entry, she nicely describes the process that she went through during the course:
Writing this reflective journal on math has been a helpful, meaningful, and valuable experience. I didn’t realize until I began writing how much I had to say about math. I have developed a totally new way of looking at math. I have had a life changing

Rolka, Rösken & Liljedahl
PME31―2007 4-126
experience with this class. […] My understanding of the term mathematics has evolved considerably. I started with a definition that was short and vague, like my understanding in math. But as the weeks progressed, my thinking about math began to transform. […] My understanding of math now, is so much deeper and it is not something I want to avoid, but rather deal with head on.
Here it is the term “life changing experience” that illustrates the cognitive conflict. Experiencing this conflict led her to develop a more elaborated understanding of what mathematics is.
Also an example for an incomplete fit is Catherine:
Mathematics is a subject area that is most commonly seen as the subject of logic, calculations and one answer. […] It is a language that can be understood by all because the symbols are universal. […] It is an intricate system of numbers, correlations, patterns and values that is used to better understand the world around us.
In her last entry, she writes the following:
After reading over my journal, I realize how much my thinking has evolved. When I entered the class I thought that math was all about logic and getting the right answer. Now I realize it is so much more than that. […] I began thinking that teaching math is more like gardening. The teacher receives these little seeds and she gives them the nutrients they need in order to grow.
Catherine also reports an essential change in her beliefs about mathematics and what it means to teach mathematics.
Finally, we quote from Lorynne’s journal who states at the end of the course the following:
Throughout the journey in this course, my thinking towards mathematics has changed. […] There is so much to mathematics that I never realized before taking this course. […] my approach towards math was very teacher-centered because that was all I knew. Now, I see the many ways that mathematics can be taught and used effectively in the classroom. […] We need to move away from the teacher lecturing information to the teacher being a facilitator in the child’s learning. […] Mathematics is not simply about just getting the answer, it is the process and journey of getting there and all the problem solving that falls between.
Lorynne confesses that, at the beginning of the course, her approach towards mathematics was teacher-centered, while at the end of the course, she sees the teacher more as a facilitator.
CONCLUSION
Our findings impressively indicate the fruitfulness of applying conceptual change theory to deeper understand changes in beliefs. In former papers, we were only able to describe these changes. Now, we can explain why these changes occur or not. The theory of Appleton (1997) enables categorizing the different reactions of students when confronted with new ideas. The main difference between identical, approximate

Rolka, Rösken & Liljedahl
PME31―2007 4-127
and incomplete fit is the presence of cognitive conflict, which proves to be also the decisive tool for change in beliefs. What becomes obvious is that effective teaching and learning emerges only when there is a significant change in students’ existing ideas and beliefs. Throughout the course the students encountered challenging ideas and the majority of them became dissatisfied with their current conceptions and beliefs. This observation can be underlined by student quotations like, I didn’t realize until I began writing how much I had to say about math and there is so much to mathematics that I never realized before taking this course, or when they express their experiences in terms like earth shattering and life changing.
In general, we conclude that teaching for conceptual change in beliefs requires on the one hand, uncovering students preconceptions and beliefs about mathematics and its teaching and learning and on the other hand, using reflection to help students change their beliefs and belief systems. A valuable approach has been using challenging mathematics problems and involving the participants as learners of mathematics. They were not predominantly confronted with new mathematical knowledge but with new insight in mathematical problems. What we infer so far is that, according to Davis (2001), “this change implies conceiving of teaching as facilitating, rather than managing learning and changing roles from the sage on the stage to a guide on the side”.
REFERENCES
Aguirre, J.M., & Speer, N.M. (2000) Examining the relationship between beliefs and goals in teacher practice. Journal of Mathematical Behavior, 18(3), 327-356.
Appleton, K. (1997). Analysis and description of students’ learning during science classes using a constructivist-based model. Journal of Research in Science Teaching 34(3), 303-318.
Ball, D. (1988). Unlearning to teach mathematics. For the Learning of Mathematics, 8(1), 40-48.
Chapman, O. (2002). Belief structures and inservice high school mathematics teacher growth. In G. Leder, E. Pehkonen, & G. Törner (Eds.), Beliefs: A Hidden Variable in Mathematics Education (pp. 177-194). Dordrecht, The Netherlands: Kluwer Academic Publishing.
Davis, J. (2001). Conceptual change. In M. Orey (Ed.), Emerging perspectives on learning, teaching, and technology.
Available Website: http://www.coe.uga.edu/epltt/tableofcontents.htm [11.01.2007].
Ernest, P. (1989). The knowledge, beliefs and attitudes of the mathematics teacher: a model. Journal of Education for Teaching, 15(1), 13-33.
Furinghetti, F. & Pehkonen, E. (2002). Rethinking characterizations of beliefs. In G.C. Leder, E. Pehkonen & G. Törner (Eds.), Beliefs: A hidden variable in mathematics education? (pp. 39-57). Dordrecht, The Netherlands: Kluwer Academic Publishers.
Green, T. (1971). The activities of teaching. New York, NY: McGraw-Hill.

Rolka, Rösken & Liljedahl
PME31―2007 4-128
Kuhn, T. S. (1970). The Structure of Scientific Revolutions (2nd enlarged ed.). Chicago: The University of Chicago Press. (1962)
Liljedahl, P., Rolka, K., Rösken, B. (in press). Affecting affect: The re-education of preservice teachers' beliefs about mathematics and mathematics learning and teaching. In M. Strutchens & W. Martin (Eds.) 69th NCTM Yearbook.
Llinares, S. & Krainer, K. (2006). Mathematics (Student) Teachers and Teacher Educators as Learners. In A. Gutiérrez & P. Boero (Eds.) Handbook of Research on the Psychology of Mathematics Education. Past, Present and Future. (pp. 429-459) Rotterdam: Sense Publishers.
Pajares, F. (1992). Teachers’ beliefs and educational research: Cleaning up a messy construct. Review of Educational Research, 62(3), 307-332.
Pehkonen, E. (2006). What Do We Know about Teacher Change in Mathematics? In L. Häggblom, L. Burman & A.-S. Röj-Lindberg (Eds.). Kunskapens och lärandets villkor. Festskrift tillägnad professor Ole Björkqvist. (pp. 77-87). Åbo Akademi, Pedagogiska fakulteten, Specialutgåva Nr 1/2006. Vasa.
Piaget, J. (1985). The Equilibration of Cognitive Structures: The Central Problem of Intellectual Development. Chicago: University of Chicago Press.
Posner, G., Strike, K., Hewson, P., & Gertzog, W. (1982). Accomodation of a scientific conception: Towards a theory of conceptual change. Science Education, 66, 211-227.
Rolka, K., Rösken, B., Liljedahl, P. (2006). Challenging the mathematical beliefs of preservice elementary school teachers. In J. Novotná, H. Moraová, M. Krátká & N. Stehlíková (Eds.), Proceedings of the 30th Conference of the International Group for the Psychology of Mathematics Education (Vol. 4, pp. 441-448). Prague, Czech Republic: PME.
Schommer-Aikins, M. (2004). Explaining the epistemological belief system: Introducing the embedded systemic model and coordinated research approach. Educational Psychologist, 39(1), 19-29.
Skott, J. (2001). The emerging practices of novice teachers: The roles of his school mathematics images. Journal of Mathematics Teacher Education, 4(1), 3-28.
Thompson, A.G. (1992). Teachers' beliefs and conceptions: A synthesis of the research. In D.A. Grouws (Ed.), Handbook of research on mathematics learning and teaching. (pp. 127-146). New York: Macmillan.
Tirosh, D. & Tsamir, P. (2006). Conceptual Change in mathematics learning: The case of infinite sets. In J. Novotná, H. Moraová, M. Krátká & N. Stehlíková (Eds.), Proceedings of the 30th Conference of the International Group for the Psychology of Mathematics
Education (Vol. 1, pp. 159-161). Prague, Czech Republic: PME.
Vosniadou, S. & Lieven, V. (2004). Extending the conceptual change approach to mathematics learning and teaching. Learning and Instruction, 14(5), 445-451.

2007. In Woo, J. H., Lew, H. C., Park, K. S. & Seo, D. Y. (Eds.). Proceedings of the 31st Conference of
the International Group for the Psychology of Mathematics Education, Vol. 4, pp. 129-136. Seoul: PME. 4-129
FACTORS AFFECTING SEVENTH GRADERS’ COGNITIVE
PERCEPTIONS OF PATTERNS INVOLVING CONSTRUCTIVE
AND DECONSTRUCTIVE GENERALIZATIONS
Joanne Rossi Becker and F.D. Rivera
San José State University, U.S.A.
This Year Two study from a three Rivera-year longitudinal research project involves
eight 7th graders’ ability to develop and justify constructive and deconstructive
generalization involving pattern in algebra. Utilizing qualitative methodology, we
address the following research questions: What is the nature of students’ constructive
generalizations? How stable are their generalizing processes over an academic
year? What factors influence their ability to develop and justify constructive and
deconstructive formulas? Results indicate that while students’ use of numerical
strategies to develop an algebraic generalization remained strong, they lost some
ground in being able to interpret their formulas visually. We discuss problems
students have in recognizing invariance and the representational forms that are
associated with variable-based generalizations.
BACKGROUND AND RESEARCH QUESTIONS
This Year 2 study from a three-year longitudinal research project builds on previous
investigations we have conducted in relation to patterns and the development of
generalization in algebra at the middle school level. Consistent with findings we have
obtained from pre-service elementary teachers (Rivera & Becker, 2003) and 9th grade
students (Becker & Rivera, 2005), the twenty-nine 6th graders in Year 1 of the study
tend to exhibit at least two modes for expressing generality on tasks involving linear
patterns: numerical and figural (Becker & Rivera, 2006). They were classified as
being either predominantly figural or numerical depending on whether they employed
figural or numerical strategies, respectively, in attempting to generalize five tasks on
each of two interviews, with an intervening teaching experiment. Those with a figural
ability were more apt to be able to develop “algebraic generalizations” (Radford,
2006) and justify them. We also found that success in developing and justifying full
algebraic generalizations involving figural-based patterns necessitates both figural
ability and variable facility. Further, while all the 6th-graders in the class developed
the ability to build constructive generalizations, none of them were able to correctly
justify formulas that represented deconstructive generalizations. Constructive
generalizations such as those that take the linear form y = mx + b are closed formulas
which can be easily derived and directly drawn from the figural cues without
performing the effort of accounting for possible overlaps of sides or vertices.
Deconstructive generalizations (e.g., item d in Figure 1) are also direct formulas,
however, they are more complex and necessitate the recognition of overlaps in the
figural cues to completely establish their validity. At the end of the Year 1 study, we
concluded that we needed to probe further their capacity for developing and

Rossi Becker & Rivera
PME31―2007 4-130
justifying more complex generalizations (deconstructive, nonlinear, nontransparent,
etc.) in Year 2 of the study. The above findings led to the development of an
appropriate teaching experiment, and part of our investigation for the Year 2 study
that is discussed in this paper addresses the following research questions: (1) What is
the nature of students’ constructive generalizations? How stable are their generalizing
processes over an academic year? (2) What factors influence their ability to develop
and justify constructive and deconstructive formulas?
THEORETICAL FRAMEWORK
Perception is a “way of coming to know” an object or something (e.g., property or
fact) about the object (Dretske, 1990). Visual perception involves the act of coming
to see and is further characterized to be of two types, namely, sensory perception and
cognitive perception. Sensory (or object) perception is when individuals see an object
as being a mere object-in-itself, while cognitive perception goes beyond the sensory
when they see or recognize a fact or a property in relation to the object. For example,
young children who see consecutive groups of figural cues such as the W-dot squares
in Figure 1 as mere sets of objects exhibit sensory perception. However, when they
recognize that the groups taken together form a pattern sequence of objects, they
demonstrate cognitive perception. Cognitive perception necessitates the use of
conceptual and other cognitive-related processes that enable learners to articulate
what they choose to recognize as being a fact or a property of the target object. It is
also mediated in some way through other types of visual knowledge that bear on the
object, and that the types are either cognitive or sensory in nature. In the rest of this
paper, we address issues relevant to 7th-graders’ cognitive perception of figural-based
patterns such as the sequence in Figure 1. Foregrounding the cognitive perception of
patterns permits us to investigate facts they see about the patterns that are relevant to
them which consequently influence the generalizations they produce, including
elements that constitutes the structure of their cognitive perception in relation to these
particular types of objects.
When Duval (1998) claims that “there are various ways of seeing a figure” (p. 39), he
is, in fact, referring to a cognitive perception of the figure. Duval identifies at least
two ways in which learners manifest their recognition of the figure, that is, perceptual
and discursive. Perceptual apprehension involves seeing the figure as a single gestalt.
For example, a student might see a quadrilateral in the representational context of a
roof or the top part of a table. Discursive apprehension involves seeing the figure as a
configuration of several constituent gestalts or as subconfigurations. For example,
another student might see a quadrilateral to be consisting of sides that are represented
by line segments. The shift from the perceptual (seeing objects as a whole) to the
discursive (seeing objects by the parts) is indicative of a dimensional change in the
cognitive perception of the figure. In relation to figural-based patterns, students who,
on the one hand, perceptually apprehend, say, the cues in Figure 1 might see W dots
that grow by the stage (stage 1 is a W dot with two on a side, stage 2 is a W dot with
three on a side, etc.). On the other hand, those who discursively apprehend the same

Rossi Becker & Rivera
PME31―2007 4-131
cues might see W dots that are produced either by repeatedly adding a dot on each of
the four sides of W (a constructive generalization) or by first constructing the
appropriate number of circles on a side, multiplying it by 4 since there are four sides,
and finally seeing overlaps (for e.g., pattern 2 has four groups of 3 circles with three
overlapping “interior” vertices, pattern 3 has four groups of 4 circles with three
overlapping “interior” vertices, a deconstructive generalization). Duval (2006)
foregrounds the cognitively complex requirements of semiotic representations in both
perceptual and discursive domains. Especially in the case of patterning in algebra,
because there are many different ways of expressing a generalization for the same
pattern, the primary resolve is to assist learners to recognize the viability and
equivalence of several generalizations resulting from several “semiotic
representations that are produced within different representation systems” (p. 108).
METHODS
Eight 7th-grade students (mean age of 12; three boys and five consisting of 6 Asian
Americans, 1 African American, and 1 Caucasian) in an urban school in Northern
California participated in the pre- and post-interviews. They were the same students
whose generalizing processes were investigated in detail in the Year 1 study. The
classroom teaching experiment used two algebra units of the Mathematics in Context
(MiC) curriculum (Wisconsin Center for Education Research & Freudenthal Institute,
2003). The Operations unit was used to enable the students to develop competence in
integer operations. Additional activities under this unit involved constructive and
deconstructive patterning tasks that were either increasing or decreasing. The
Graphing Equations unit was used to provide them with a different way of exploring
linear patterns, that is, through slopes and lines. They were given five tasks involving
linear patterns, with analogous tasks in a pre-interview and post-interview, separated
by ten weeks of instruction on the MiC units. Both interviews were videotaped and
lasted about one hour. They were asked to read a problem and to think aloud as they
solved the problem. The interviews were then analyzed by both authors. Initially, the
authors independently viewed all the pre- and post-interviews to identify patterns in
strategies used for each of the five questions. Several follow-up discussions and
crosschecking ensued. Here we report on the results of the W dot task (Figure 1).
RESULTS
Students’ Constructive Generalizations. When all eight students were post-
interviewed towards the end of the Year 1 study, they were able to establish direct
formulas for all linear patterns, although none had been able to do so at the time of
the pre-interview. The nature of their constructive generalizations at the pre-interview
in Year 1 could be classified into three types: (1) figural additive and, thus, recursive
(“keep adding” the common difference); (2) analogical (seeing an invariant structure
from one stage to the next), and: (3) figural multiplicative (in a manner reflective of
the linear form “mx + b”). Also, none of them could use variables, hence, their
generalizations were mostly “factual” and “contextual or situated” (Radford, 2006).

Rossi Becker & Rivera
PME31―2007 4-132
W-Dot Sequence Problem. Consider the following sequence of W-patterns
below.
Pattern 1 Pattern 2 Pattern 3
(A) How many dots are there in pattern 6? Explain. (B) How many dots are there
in pattern 37? Explain. (C) Find a direct formula for the total number of dots D in
pattern n. Explain how you obtained your answer. If you obtained your formula
numerically, explain it in terms of the pattern of dots above. (D) Zaccheus’s direct
formula is as follows: D = 4(n + 1) – 3. Is his formula correct? Why or why not?
If his formula is correct, how might he be thinking about it? Which formula is
correct: your formula or his formula? Explain. (E) A certain W-pattern has 73 dots
altogether. Which pattern number is it? Explain.
Figure 1: W-Dot Pattern Task in Compressed Form
Despite that, six of the eight could successfully deal with far generalization tasks (for
e.g, item b on Figure 1) in the absence of a variable-based algebraic generalization. In
the post-interview in Year 1, all eight students were fully capable of developing an
algebraic generalization for all the linear patterns with no apparent difficulty in
assigning the appropriate dependent and independent variables following the form y
= ax + b. The linear form was established numerically using the method of finite
differences which emerged as a classroom practice during the teaching experiment on
generalization (Rivera, in preparation). Finally, all of them could justify their
generalizations during the post-interviews; some did this figurally, i.e., by
interpreting their formula in the given figures, while others fit the formula to the table
of values that they had made.
In both pre- and post-interviews in Year 2 of the study, all eight students were able to
establish an algebraic generalization for linear patterns. Very few of them initiated a
figural approach and instead most preferred to develop a formula numerically first by
setting up a table of values and then obtaining a formula using finite differences. In
justifying an algebraic generalization figurally, most of them tried to fit the formula
onto the available cues. For example, in explaining her direct formula D = n x 4 + 1
for the sequence in Figure 1, Anastacia circled 1 group of 4 circles, 2 groups of 4
circles, and three groups of 4 circles in patterns 1, 2, and 3, respectively, beginning
on the left and then referred to the last circle as the y-intercept (see Figure 2). In the
post-interview, only three of them saw the sequence in Figure 1 in the manner Dung
saw it (Figure 3).
Stability of the Students’ Generalizing Processes Over an Academic Year. On the
basis of the narrative provided in the preceding section, we noticed a shift from
figural to numerical strategies in establishing an algebraic generalization. Students

Rossi Becker & Rivera
PME31―2007 4-133
+1 +1 +1
Figure 2. Anastacia’s figural justification of the sequence in Figure 1
+1 +1 +1
Figure 3. Dung’s figural justification of the sequence in Figure 1
who favored a figural strategy at the beginning of Year 1 shifted to a numerical
strategy towards the end of Year 1 which they carried through in Year 2. Those who
favored numerical strategies at the beginning of Year 1 were consistently numerical
throughout Year 2. In other words, numerical strategies solidified as the favored
generalizing strategy after two semesters of teaching experiments on generalization
that focused on both figural and numerical strategies. To illustrate, the numerical
approach of finite differences that they used to deal with the pattern in Figure 1
involved first counting the number of dots in the first three figures shown and then
looking for a common difference. Some, like Dung, actually made a table of values,
labeling each column. Dung used these values to obtain the formula D = P x 4 +1,
checking it for the first three values, then used the formula to find the number of dots
for patterns 6 and 37. Based on previous work, we classified these strategies as
figural additive transitioning to numerical additive and then to numerical
multiplicative, thus, allowing them to get to an algebraic generalization.
Factors Influencing Students’ Ability to Develop and Justify Deconstructive
Generalizations. The task of deconstruction (for e.g., item d in Figure 1) proved to
be difficult for all students. In fact, in the post-interview in Year 1, no students, and
in the pre-interview in Year 2, only one student, could construct and/or sufficiently
justify visually such alternate formulas, although all could verify the correctness of
such formulas by checking them against one or two particular instances. In the post-
interview in Year 2, none of them could still construct such forms and only six of the
eight could see the overlapping of “interior” vertices in the case of Figure 1 which
justified for them the necessity of subtracting 3. Further, seeing the overlap was not
immediate; it became evident only after the students tested the formulas in specific
cases and then began to “fit” the numerical terms onto the available figural cues. Two
students provided the same justification for the subtractive term 3 in Zaccheus’s
deconstructive generalization (item D in Figure 2) in the following manner:

Rossi Becker & Rivera
PME31―2007 4-134
FDR: So if you look at this [referring to the formula (item d, figure 1) in which
Jana substituted the value of 2 for n], this one’s four times two plus one,
right? And then minus 3. So how might he be looking at 4 times 2 plus 1
and then minus 3?
Jana: Uhum, the 2 is for the pattern number.
FDR: Uhum. Because when Zaccheus was thinking about it, he said multiply 4
by n + 1 and then take away 3. So how might he be thinking about it?
Jana: Like it’s gonna be 3 [referring to 2 + 1] and then it’s gonna be 12
[referring to 4 x 3]. But I counted there’s only 9, so he has to subtract 3.
FDR: So how might he be doing that? Suppose I do this? [FDR builds pattern
2 with circle chips in which the three overlapping “interior” vertices are
colored differently.]
Jana: Hmm, like he has this group of 4 [Jana sees only two sides in W in
pattern 2 with the top middle interior dot connecting the two sides.
Hence, one side has 4 dots.].
FDR: Is there a way to see these 4 groups of 3 here [referring to pattern 2]?
Jana: Like he imagines there’s 3 and he has to subtract 3.
FDR: So can you try it for other patterns? [Jana builds pattern 4.]
Jana: He has 1 group of 4. So there’s 3 groups of 4 and he imagines 3 more [to
form 4 groups of 4] and then he subtracts them [the three circles added].
FDR: So he imagines there’s three more. But why do you think he would add
and then take away?
Jana: Because there’s supposed to be 4 groups of 4 and then you don’t have
enough of these ones [circles] so he adds 3. You add these ones.
DISCUSSION AND CONCLUSION
Is Invariance Learned? Or, is it relative? Dretske (1990) notes that cognitive
perception is “certainly relative to many things – everything, in fact, [that is] capable
of influencing what one comes to believe” (p. 145). Radford’s (2006) characterization
of the process of algebraic generalization involves, first and foremost, cognitively
perceiving a commonality among the available cues in a sequence, then extending it
to all cues, seen and otherwise, and finally incorporating it in a justifiable direct
expression. The numerical strategy of finite differences which all the students
employed in establishing an algebraic generalization satisfies all the requirements
stipulated by Radford: a commonality is grasped (same difference) and the
construction of a direct expression incorporates the commonality (m) in the formula y
= mx + b which is then assumed to apply to all the cues in the sequence. However,
the commonality factor is problematic in the case of figural-based patterns. For
example, while both Anastacia and Dung were able to construct an algebraic

Rossi Becker & Rivera
PME31―2007 4-135
generalization for the sequence in Figure 1, both saw the same commonality (i.e., the
constant addition of 4 circles from one pattern to the next) numerically but not
figurally (see Figures 2 and 3). In other terms, what is the structure of facts relevant
to invariance so that learners such as Anastacia and Jana can cognitively perceive “it”
in the same expertly manner that Dung could (easily) recognize it? Merely fitting an
invariant property that has been established numerically (say, the common difference)
onto a sequence of figural cues does not justify the validity of the corresponding
algebraic generalization. There is a need for research that addresses the issue of
recognizing mathematically-valid invariant structures or properties.
Is Deconstructive Generalization a Domain of Adult Cognition? In the post-
interview in the Year 2 study none of the students could develop a deconstructive
generalization on their own without a prompt. However, they were able to verify its
validity by first testing values and then projecting them onto the figural cues. We
note in the case of pre-service elementary teachers how some of them produced
deconstructive generalizations (Rivera & Becker, 2003) easily using various
numerical and figural strategies without formally being trained to do so. Research is
needed to ascertain whether deconstructive generalizing at the middle school level
could be acquired through instruction and experience.
Cognitive Conflicts Arising From an (Mis)Understanding of the Algebraic Form
of the Direct Expression. In cognitively perceiving figural cues, students need to
understand at least two semiotic representations such as the figures themselves and
the algebraic form that conveys a relationship among the figures. The problem is
complicated by the fact that both systems can be difficult for learners. With respect to
the figures, they would need to see beyond the perceptual form and to focus on the
discursive aspect. In the case of the algebraic form, establishing an algebraic
generalization for a figural-based sequence would require them to transition from one
semiotic system to another, say, from the use of words in the factual or contextual
stage of generalizing to the use of variables and relevant operations in the algebraic
stage. Duval (2006) notes how “some processes are easier in one semiotic system
than in another one” (p. 108) and here we raise the issue of the complexity of the
direct form y = mx + b that is used to express an algebraic generalization for all linear
patterns. In the Year 1 study, the students would oftentimes express their algebraic
generalization in the form y = n x m + b such as D = n x 4 + 1 in the case of Figure 1
which they then easily justified by locating n groups of 4 circles respecting invariance
along the way. However, in the Year 2 study, they became confused because the
expressions m x n and n x m conveyed for them the same grouping of objects. For
example, some of those who wrote the form D = 4n + 1 for the sequence in Figure 1
justified its validity by looking for 4 groups of, say, 2 circles in pattern 2 when, in
fact, they should have been looking for 2 groups of 4 circles. In the case of
deconstructive formulas such as D = 4(n + 1) – 3, the coefficient 4, while
corresponding to slope, has a meaning (i.e., number of sides in a W-dot formation)
that is different from the coefficient 4 in the constructive form D = 4n + 1 (i.e., the

Rossi Becker & Rivera
PME31―2007 4-136
constant addition of 4 dots by the pattern). Thus, the algebraic representation proved
to be difficult for most of the students in Year 2 because some of the mathematical
concepts they have acquired (such as the commutative law for multiplication) did
little than hinder in their generalizing processes, in particular, in the justification of
generalization.
Acknowledgment. This research was supported by a grant from the National Science
Foundation, grant # REC-0448649. The opinions expressed are those of the authors
and do not represent those of the NSF.
References
Becker, J.R. & Rivera, F. (2006). Establishing and justifying algebraic
generalization at the sixth grade level. In J. Novotná, H. Moraová, M. Krátká, &
N. Stehlíková (Eds.), Proceedings of the 30th conferences of the International
Group for the Psychology of Mathematics Education (Vol. 4, 465-472). Prague:
Charles University.
Becker, J.R. & Rivera, F. (2005). Generalization strategies of beginning high school
algebra students. In H. Chick & J.L. Vincent (Eds.), Proceedings of the 29th
Conference of the International Group for the Psychology of Mathematics
Education (Vol. 4, 121-128). Melbourne, Australia: University of Melbourne.
Dretske, F. (1990). Seeing, believing, and knowing. In D. Osherson, S.M. Kosslyn, &
J. Hollerback (Eds.), Visual Cognition and Action: An Invitation to Cognitive
Science (pp. 129-148). Cambridge, Massachusetts: MIT Press.
Duval, R. (2006). A cognitive analysis of problems of comprehension in a learning of
mathematics. Educational Studies in Mathematics, 61(1-2), 103-131.
Duval, R. (1998). Geometry from a cognitive point of view. In C. Mammana & V.
Villani (Eds.), Perspectives in the Teaching of Geometry for the 21st Century (pp.
29-83). Boston: Kluwer.
Radford, L. (2006). Algebraic thinking and the generalization of patterns: A semiotic
perspective. In S. Alatorre, J. Cortina, M. Sáiz, & A. Méndez (Eds.), Proceedings
of the 28th Annual Meeting of the North American Chapter of the International
Group for the Psychology of Mathematics Education (Vol.1, pp. 2-21). México:
UPN.
Rivera, F. & Becker, J.R. (2003). The effects of figural and numerical cues on the
induction processes of preservice elementary teachers. In N. Pateman, B.
Dougherty, and J. Zilliox (Eds.), Proceedings of the Joint Meeting PME and
PMENA (Vol. 4, 63 -70). Honolulu, HA: University of Hawaii.
Wisconsin Center for Education Research and Freudenthal Institute (Eds.) (2003).
Mathematics in Context. Chicago: Encyclopedia Britannica, Inc.

2007. In Woo, J. H., Lew, H. C., Park, K. S. & Seo, D. Y. (Eds.). Proceedings of the 31st Conference of
the International Group for the Psychology of Mathematics Education, Vol. 4, pp. 137-144. Seoul: PME. 4-137
MATHEMATICALLY GIFTED STUDENTS’ SPATIAL VISUALIZATION ABILITY OF SOLID FIGURES1
HyunAh Ryu*, YeongOk Chong** and SangHun Song**
*Konkuk University / **Gyeongin National University of Education
This research, with 7 mathematically gifted students as subjects, looked into their
spatial visualization ability of solid figures by suggesting geometric tasks that require
distinction of the constituents of a solid figure. As a result of analysis, which was
made based on McGee (1979)’s spatial visualization ability, the ability to imagine the
rotation of a represented object, to visualize the configuration, to transform a
represented object into other shape, and to manipulate an object in the mind were
found in some of the mathematically gifted subjects, which are similar to the spatial
visualization ability theorized by McGee. On the other hand, it was found that some
students had difficulty in imagining a 3-dimensional object in space from its 2-
dimensional representation in a plane.
INTRODUCTION
According to Freudenthal (1973), geometry is grasping space in which the child lives,
breathes and moves and that they have to know, explore and conquer in order to live,
breathe and move better in it. With regard to spatial ability, many researches have
been made, including those by Thurstone (1983), French (1975), McGee (1979),
Lohman (1979), Bishop (1980), Del Grande (1987), etc. Soviet mathematicians, in
the past, emphasized spatial thinking in geometry, particularly the spatial
visualization ability, arguing that “visualizations are used as a basis for assimilating
abstract geometric knowledge and individual concepts (Yakimanskaya, 1971,
p.145).” Presmeg (1986), also, made researches into visualization in mathematics,
which includes the visualization ability of mathematically gifted students.
Nevertheless, specific researches into the spatial visualization ability of
mathematically gifted elementary school students are insufficient.
Therefore, the purpose of this research is to analyse the spatial visualization ability of
mathematically gifted elementary school students using tasks that require them to
distinguish relevant constituents of a three-dimensional object from its two -
dimensional representation by mentally manipulating or rotating it.
SPATIAL VISUALIZATION
Gutiérrez (1996) regarded visualization, visual imagery, spatial thinking defined by
Yakimanskaya, Dreyfus and Presmeg as equivalents and defined “visualization” in
mathematics, either mental or physical, as a kind of reasoning activity based on the
1 This work was supported by Korea Research Foundation Grant funded by Korea
Government(MOEHRD, Basic Research Promotion Fund) (KRF-2005-079-BS0123)

Ryu, Chong & Song
PME31―2007 4-138
use of visual or spatial elements. According to the analysis of Gutiérrez (1996), the
“spatial thinking” that Yakimanskaya (1991) mentioned possible to create spatial
images is a form of mental activity that can manipulate them in the course of solving
various practical and theoretical problems. Spatial image, here, is created from
perceptive cognition of spatial relations, which can be expressed in diverse graphic
forms including diagrams, pictures, drawings, outline, etc. Therefore, in spatial
visualization, the interaction between creation of spatial images and external
representation is important.
On the other hand according to Lohman (1979), spatial ability can be defined as the
ability to create, maintain, and manipulate abstract spatial images (Clements, 1981, p.
35). McGee (1979) divided the elements that compose spatial ability into spatial
visualization and spatial orientation; and Lohman (1979) divided them into spatial
relation, spatial visualization and spatial orientation (Clements, 1983). Later, Linn
and Peterson (1985) divided spatial sense into the spatial perception, spatial rotation
and spatial visualization. As have been mentioned, elements that compose spatial
ability differ by researcher, but that spatial visualization functions as an important
factor in spatial ability is agreed by them all.
McGee’s spatial visualization ability refers to the ability to manipulate, rotate, change
the position in mind of an object depicted as a picture, in other words the ability,
using mental image, to rotate, arrange, or manipulate a depicted object. Lohman’s
spatial visualization ability means the ability of arranging the pieces of an object to
complete paper folding or overall shape. And, that of by Linn and Peterson means the
ability to make given spatial information visible and draw it in one’s mind.
The meaning of spatial visualization can also be interpreted differently in accordance
with the viewpoint of each researcher; and, the same applies to sub-abilities that
compose thereof. Of all the different classifications, McGee classified spatial
visualization abilities as follows (Gutiérrez, 1996):
-Ability to visualize a configuration in which there is movement among its parts
-Ability to comprehend imaginary movements in three dimensions, and the manipulate
objects in the imagination
-Ability to imagine the rotation of a depicted object, the (un)folding of a solid, and the
relative changes of position of objects in space
-Ability to manipulate or transform the image of a spatial pattern into other arrangement
The task suggested in this research is possible to be solved by mentally manipulating,
rotating or changing the direction of depicted objects; and is deemed to require the
spatial visualization ability McGee suggested.
RESEARCH METHODS
Tasks
The geometry task used in this research –the one suggested in the doctoral thesis of

Ryu, Chong & Song
PME31―2007 4-139
C
D
A
BC
EF
D
A
B
A
B
C
D
E
G
D
C
F
E
Raquel(2001) with a view to explore the role of Geometer’s Sketch Pad(GSP) in
improving students’ geometric thinking and spatial ability– is the problem that
compares the side lengths and the angle sizes in each picture that depicts a regular
icosahedron without the dotted line (Figure 1). It is descriptive of a regular
icosahedron in the plane.
Figure 1: The task for the spatial visualization
The identification of a plane in a 3D/2D representation is a very important problem
which also concerns the first steps in the geometrical representation of space
(Rommevaux, 1997). In other words, the first thing required in distinguishing the
relevant parts of a solid figure in spatial geometry is to distinguish the different plane
parts. This task is judged to be useful to observe the characteristics of spatial
visualization that requires such ‘change of dimensions’ (Duval, 1998).
Participants
There are 6 students (aged 11~12; T, U, V, W, X, Y) in the 6th grade and 1 student
(aged 13; Z) in the 7th grade receiving gifted education in the institute attached A-
University supported by Korean government. They belong to the upper 0.1% group in
their respective school years.
Procedures
In preliminary experiment, we met 7 students (1 mathematically gifted 6th grade, 1
mathematically gifted 7th grade and 5 ordinary 7
th grade) with a view to design the
method of analysing the understanding of the task, approach to the given task and
visualization ability needed to solve the problem.
Data collection and analysis for this research were done from Nov. to Dec. of 2006.
The participants were asked to solve the task for 60 minutes, individually, without
using a ruler or a compass. After that, interviews on the problem-solving process
were conducted and videotaped; and the activity sheets of students were collected.
Problem 1 problem 2 problem 3 problem 4
Compare two real lengths indicated
bold and explain the reason.
Compare two real angles indicated
bold and explain the reason

Ryu, Chong & Song
PME31―2007 4-140
We analysed the data based on McGee’s spatial visualization ability and found a
relation from Duval and Del Grand theories.
RESULTS AND DISCUSSION
Spatial visualization ability displayed in problem solving
The spatial visualization abilities mainly found in the students’ problem solving
process are the ability to imagine the rotation of a depicted object, to visualize its
configuration, to transform it into a different form and to manipulate it in ones
imagination.
Ability to visualize configuration
The visualization ability that was found most in the problem solving process of this
research were ability to visualize a configuration in which there is movement among
its parts explained by Mc Gee. This is the ability to clearly see a partial configuration
out of an overall configuration that is useful in solving the problem. An example is
that from the figure of problem 3, all the students visualized each regular pentagon
that includes angle ABC and angle DEF; and another example is that Student Y,
while solving problem 1, clearly visualized spatial figure from a plane figure. He
explained this as follows:
Student Y: When you see a regular icosahedron, there are
vertexes, one at the top and the other at the bottom. And
there are two pentagonal pyramids of which, the vertex is
the former and the latter, respectively. And if they are
linked when they do not meet, that makes the longest line
segment.
Interviewer: Did you know it from the beginning?
Student Y: Yes. In the figure there are two of them here
(Figure 2a) and here (Figure 2b). And there is no shared part
between them, and accordingly CD becomes the diameter
and the longest line.
Interviewer: What does it mean that they do not have a shared
part? Do you mean the two pentagons do not meet?
Student Y: No. What I mean is that when viewed three-
dimensionally, the two pentagonal pyramids share no part.
And AB is not the diameter.
Interviewer: Then what line is it?
Student Y: It is just a line. Since the two pentagonal pyramids, of which the vertex is A
and B, respectively, have a common part, AB is not a diameter.
According to Duval (1999), the operative apprehension is carried out by transforming
a visual operation in looking a figure. Here, various operations caused figural
C
D
A
B
Fig. 2a
C
D
A
B
Fig. 2b

Ryu, Chong & Song
PME31―2007 4-141
Fig. 4
F G
C
DE
A
B
changes that can play a heuristic function and provide the
insight necessary to solve a problem. It can be said that this
visualization ability also visualizes spatial figures, which in
turn play a heuristic function that is necessary for problem
solving in spatial geometry, and provides insight necessary
for problem solving. In this viewpoint, the ability to visualize
a configuration of spatial figure depicted in plane played a
heuristic function that is necessary for insight for problem
solving
On the other while, Student Z, in problem 4, could distinguish a regular pentagon
from the figure in the question that includes angle DEG as shown in Figure 3. This
means he perceived a figure in a difficult and complex background where the two
lines overlap one another and dots were hard to be distinguished from line, which can
be classified as Figure-ground perception ability suggested by Frostig and Horne of
the 7 sub-categories of space perception theorized by Del Grande (1987).
Ability to manipulate an object in imagination
The students were able to mentally arrange or manipulate a 3-dimensional object
which is depicted in 2-dimensional plane. This is included in the ability to
comprehend imaginary movements in three dimensions, and the manipulate objects in
the imagination mentioned by Mc Gee. An example of this is the case where Student
Z, in problem 2, cut off each pentagonal pyramid of which the vertex is E and F,
respectively, made a solid figure of which the base plane is
a regular pentagon and the side faces are regular triangles
standing straight and headlong alternately, assumed the
height of the pentagonal pyramids to be a and that of the
rest prism to be b and explained EF equals a+2b and CD
also equals a+2b. In another case, Student U, while solving
problem 1, explained the section that includes CD has
hexagonal shape by manipulating the object in mind and
marked the vertexes of the hexagon A, C, F, G, D, E as
shown in Figure 4.
Ability to imagine the rotation of a depicted object
The students were able to mentally rotate a 3-dimensional figure depicted in 2-
dimensional plane and change the positions of its constituents. For an instance,
Student V said if the figure depicted in problem 2 is revolved, the positions of CD
and EF look changed and in the end the lengths of the two lines are the same. This is
included in the ability to imagine the rotation of a depicted object, the (un)folding of
a solid, and the relative changes of position of objects in space classified by Mc Gee.
Ability to transform a depicted object into a different form
The students were able to change the form of a depicted object by mentally cutting it
or adding to it. For instance, Student Z changed the figure in problem 2 by cutting off
Fig. 3

Ryu, Chong & Song
PME31―2007 4-142
pentagonal pyramids of which the vertexes are E, F, respectively into a solid figure of
which the base plane is a regular pentagon and side faces are regular triangles
standing straight and headlong alternately. After that, he imagined the length of EF
by separating the length in the two pentagonal pyramids from that in the newly
formed solid figure. This is included in the ability to manipulate or transform the
image of a spatial pattern into other arrangement mentioned by Mc Gee.
Errors that occur in the spatial visualization process
Dependence on visual facts
Despite a figure given in a problem depicts a solid figure, one fails to imagine it as a
spatial object and depends on the visual facts of the plane
figure.
For example, while solving problem 2, Student X thought
FE>CD since FE=AB and AB>CD; while Student W thought
EF is longer than CD by GF and HE since CD=GH (Figure 5).
This is the phenomenon found among students who are
accustomed to pictures that express a three-dimensional object
in two dimensions using dotted lines: they cannot see the
object in perspective when all the lines are solid lines as in the
given questions.
Confusion in distinction of edges
Though a number of students knew that all the facets of a regular icosahedron in the
task of this research are regular triangles and the lengths of all edges are the same,
they were confused about which lines in the depicted figure becomes edges of the
polyhedron and misunderstood that all the lines marked in the question are edges.
For example, Student X, while solving problem 1, said
AB>CD, citing the reason that the lengths of CD and CB
are the same because both of them are sides of a regular
triangle. Student W, in problem 4, said angle DEG=60°, citing the reason that DGEH in Figure 6 is a regular
tetrahedron where all the lengths of sides are the same. In
the case of Student W, though he created a spatial image by
visualizing partial configuration, he got confused a little in
distinguishing edges.
Difficulty in imagining the section of a solid figure
It can be said that the main idea required to solve the task of this research is how to
distinguish, from a solid figure represented in a plane, relevant line segments and
planes. Actually, several difficulties were found in imagining spatial planes from a
picture in a plane. A number of students marked a part that cannot be a section of a
solid figure and argued that it was a plane.
Fig. 5
DG
B
C
F
A
H
E
G
E
HD
C
B
A
Fig. 6

Ryu, Chong & Song
PME31―2007 4-143
For example, Student U, while solving problem 1, with a view to compare ED and
CD the length of which is the same as that of AB, marked the plane that includes the
two line segments as shown in Figure 7a. In problem 4, he also marked the plane that
includes the angle DEG as shown in Figure 7b. And Student T, in problem 4, marked
a section inside a regular icosahedron as a plane that includes the angle DEG as
shown in Figure 7c.
CONCLUSION
This research, with 7 mathematically gifted students as subjects, looked into how
they mentally manipulate or rotate a solid figure represented in a plane and
distinguish relevant constituents – their spatial visualization ability.
Though 2 out of the 7 subjects displayed characteristic spatial visualization ability
carrying out all the tasks in this research, most of the other 5 students had some
difficulty in mentally manipulating an object depicted in a plane as a spatial object.
The spatial visualization abilities mainly found in the students’ problem-solving
process are the ability to mentally rotate a 3-dimensional solid figure depicted in 2-
dimensional representation and thus change the positions of its constituents, to
transform a depicted object into a different form by mentally cutting it or adding to it,
to see a partial configuration of the whole that is useful to solve the problem, and to
mentally arrange or manipulate a 3-dimensional object depicted in 2-dimensions.
These abilities are similar to that of McGee (1979). Of these abilities, all the students
displayed the ability to visualize partial configuration that is useful for solving the
problem with easier pictures that have no overlapping lines or dots; however, only
one Student V is played the ability to discover a partial configuration with complex
pictures that have overlapping lines or dots. This can be classified as Figure-ground
perception suggested by Frostig and Horne of the 7 sub-categories of space
perception as theorized by Del Grande (1987).
On the other hand, with compared to the ordinary students, it was found that some
students who display excellent characteristics in algebra or other fields of geometry
had, to some extent, difficulty in the spatial visualization process. In the case where
one depends upon the visual facts as represented in a plane picture, he get confused in
distinguishing the edges of a spatial object from the depicted picture and has
difficulty in distinguishing planes in 3-dimensional object from its 2-dimensional
representation.
E
C
D
A
B
G
E
D
C
B
A A
B
C
D
E
G
Figure 7a Figure 7b Figure 7c

Ryu, Chong & Song
PME31―2007 4-144
References
Clements, K. (1981) Visual imagery and school mathematics (2nd
part). For the learning of
mathematics 2(2), 33-39.
Clements, M. A. (1983). The question of how spatial ability is defined and its relevance to
mathematics education. Zentralblatt für Didaktik der Mathematik 15, 8-20.
Clements, D. H. & Michael T. B. (1992). Geometry and spatial reasoning. In A. G. Douglas
(Ed.), Handbook of research on mathematics teaching and learning(pp. 420-464),. New
York: Macmillan Publishing Company.
Del Grande, J. J. (1987). Spatial perception and primary geometry. In M. M. Lindquist &
A. P. Shults (Eds.), Learning and teaching geometry K-12(1987 yearbook, pp. 126-135).
Reston, VA: NCTM.
Duval, R. (1998). Geometry form a cognitive point a view. In C. Mammana and V.
Villani(Eds.), Perspectives on the teaching of geometry for the 21st Century (pp. 37-52).
Dordrecht: Kluwer Academic Publishers.
Duval, R. (1999). Representation, vision and visualization: cognitive functions in
mathematical thinking. Basic issues for learning. Proceedings of the Annual Meeting of
the North American Chapter of the international Group for the Psychology of
Mathematics Education 21st.
Freudental, H. (1973). Mathematics as an educational task. Dordercht: D. Reidel Publishing
Company.
Gutiérrez, A. (1996). Visualization in 3-dimensional geometry. Proceedings of the 20th
Conference of the International Group for the Psychology of Mathematics Education 1,
3-20.
Linn, M. C. & Petersen, A. C. (1985). Emergence and characterization of sex differences in
spatial ability: A meta-analysis. Child Development 56(6), 1479-1498.
McGee, M. G. (1979). Human spatial abilities: Psychometric studies and environmental,
genetic, hormonal, and neurological influences. Psychological Bulletin 86(5), 889-918.
Presmeg, N. C. (1986). Visualisation and mathematical giftedness. Educational Studies in
Mathematics 17, 297-311.
Raquel A. J. (2001). Thinking in three dimensions: Exploring students' geometric thinking
and spatial ability with the Geometer's Sketchpad. Unpublished doctoral dissertation.
Florida International University, Miami.
Rommevaux, M. P. (1997). Le discernment des plans: un seuil décisif dans l'apprentissage
de la géométrie tridimensinnelle, Thèse U.L.P.: Strasbourg.
Yakimanskays, I. S. (1971). The development of spatial concepts and their role in the
mastery of elementary geometric knowledge. In J. Kilpatrick & I. Wirszup (Ed.), Soviet
Studies in the Psychology of Learning and Teaching Mathematics (Vol5, pp. 145-168).
Chicago, IL: University of Chicago Press.

2007. In Woo, J. H., Lew, H. C., Park, K. S. & Seo, D. Y. (Eds.). Proceedings of the 31st Conference of
the International Group for the Psychology of Mathematics Education, Vol. 4, pp. 145-152. Seoul: PME. 4-145
GENETIC APPROACH TO TEACHING GEOMETRY
Ildar S. Safuanov
Pedagogical Institute of Naberezhnye Chelny
In this theoretical essay the genetic approach to teaching geometry is discussed. We
offer the "genetic" techniques of geometry teaching connected with the genetic
elaboration of important geometrical concepts including the analysis of the subject
from historical, logical and epistemological, psychological and socio-cultural points
of view, with revealing logical genealogies of concepts and theorems.
INTRODUCTION.
The aim of this paper is to offer some hints in order to contribute to methods of
geometry teaching at modern stage. Since 1924 when N.Izvolky's "The didactics of
geometry" was published, the genetic approach has been considered as appropriate for
geometry teaching (Beskin, 1947, Bradis, 1949). However, there is no well-elaborated
system of genetic teaching to geometry yet.
Three Heading styles should suffice to structure your paper: PME Heading 1 for the
title, PME Heading 2 for main sections, and PME Heading 3 for subsections. Please do
not number sections or sub-sections (as opposed to lists and footnotes).
PRINCIPLE OF GENETIC APPROACH
The framework of this article is genetic approach to teaching mathematics (Safuanov,
1999, 2005) which, in turn, integrates educational and philosophical ideas of
G.W.Leibnitz (1880), F.A.W. Diesterweg (1962), H. Poincare (1990) a.o.,
psychological discoveries of Piagetian and Vygotskian schools as well as rich
experience of practice of mathematical education
The principle of genetic approach in teaching mathematics requires that the method of
teaching a subject should be based, as far as possible, on natural ways and methods of
knowledge inherent in the science. The teaching should follow ways of the
development of knowledge. That is why we say: «genetic principle», «genetic
method».
In history and modern state of genetic approach a significant variety of interpretations
of the terms “genetic principle”, “genetic method”, “genetic approach to teaching
mathematics” is observed... It is clear that today, as noted by Wittenberg (1968, p.127),
nobody understands genetic approach as historical, and more appropriate is idea that
genetic approach is connected to relevance, which here should be understood as
conformity of a method of teaching (and learning) to the most expedient and natural
ways of cognition inherent in the given subject (or topic). Wittenberg is certainly right
also in that genetic approach is connected to epistemology, psychology and logic.

Safuanov
PME31―2007 4-146
Analysing various interpretations of genetic approach to teaching mathematics in
theory and history of mathematics education and taking into account today's
experience of teaching undergraduate mathematics and latest achievements of
psychology and methods of teaching mathematics, we can reveal the contents and
features of genetic approach to teaching geometry.
We will call the teaching of mathematical discipline genetic if it follows natural ways
of the origination and application of the mathematical theory. Genetic teaching gives
the answer to a question: how the development of the contents of the mathematical
theory can be explained?
Taking into account numerous descriptions of genetic approach in the literature on
mathematics education, results of theories of cognition and also of the theory, practice
and psychology of mathematics education, we can conclude that genetic teaching of
mathematics should have the following properties:
Genetic teaching is based on previously acquired knowledge, experience and level of
thinking of students;
For the study of new themes and concepts the problem situations and wide contexts
(matching the experience of students) of non-mathematical or mathematical contents
are used;
In teaching, various problems and naturally arising questions are widely used, which
should be answered by students independently with minimal necessary effective help
of the teacher;
Strict and abstract reasonings should be preceded by intuitive or heuristic
considerations; construction of theories and concepts of a high level of abstraction can
be properly carried out only after accumulation of sufficient (determined by thorough
analysis) supply of examples, facts and statements at a lower level of abstraction;
The gradual enrichment of studied mathematical objects by interrelations with other
objects, consideration of the studied objects and results from new angles, in new
contexts should be carried out.
One of major aspects of genetic approach to teaching mathematics is psychological
aspect. As indicated by E.Ch.Wittmann (1992, p. 278), genetic principle should use
results of both genetic epistemology of J. Piaget and Soviet psychology based on the
concept of activity. Synthesising not contradicting each other results of two theories
concerning construction and development of concepts in the learning process, it is
possible to take as a psychological basis of genetic approach to teaching mathematics
the following principles of psychology of education:
1) Principle of problem-oriented teaching. S.L.Rubinshtein (1989, p. 369) wrote:
«The thinking usually starts from a problem or question, from surprise or
bewilderment, from a contradiction». It is similar to Piagetian phenomenon of the
violation of balance between assimilation and accommodation. L.S.Vygotsky (1996, p.
168) indicated in 1926 that it is necessary to establish obstacles and difficulties in

Safuanov
PME31―2007 4-147
teaching, at the same time providing students with ways and means for the solution of
the tasks posed.
2) Principle of continuity and visual representations: introducing new contents, it
is necessary to maximally use previously generated cognitive structures and visual
representations of pupils, familiar contexts. This principle is connected to the
Vygotsky's theory of development of scientific concepts (see, e.g., Vygotsky, 1996, p.
86 and 146), and also with his concept of «zone of proximal development».
3) Principle of integrity and system approach: the teaching should aim at the
accumulation of integral systems of cognitive structures by the pupil (Itelson, 1972, p.
132). This principle also follows both from the activity approach (Vygotsky, 1996, p.
178-179 and 270; Davydov, 2000, p. 327-328, 400) and from the theory of operator
structures of J.Piaget (1994, p. 89-91).
4) Principle of «enrichment»: «Accumulation and differentiation of experience of
operating by an introduced concept, expansion of possible aspects of understanding of
its contents (by inclusion of its various interpretations, increase of number of variables
of different degree of essentiality, expanding interconceptual connections, use of
alternative contexts of its analysis etc.)» (Kholodnaya, 1996, p. 332).
5) Principle of «transformation»: for revealing essential properties of an object, its
essence, «genetically initial general relation» (Davydov, 2000), it is necessary to
subject this object to mental transformations, to perform mental experiments, asking
questions of the type: «What will happen with the object if? … ».
All of these principles of genetic teaching of mathematics may be applied in geometry
teaching.
GENETIC APPROACH TO TEACHING GEOMETRY IN SOVIET AND
WESTERN MATHEMATICAL EDUCATION.
Many years ago the original and deep understanding of the genetic approach (not
reduced to the historical approach) to geometry teaching had been shown by N. A.
Izvolsky (1924):
“In the usual course of teaching neither the text-book, nor the teacher do not make
anything in order to answer (in some form) the question about the origin of the
theorems. Only in rare instances we see exceptions: some teachers in this or that form
pay their attention to the origin of the theorems; for the pupils of this teacher the
geometry course accepts other character and ceases to be the mere set of the theorems.
Moreover, sometimes some of the pupils, independently of both a text-book and the
teacher, half-consciously come to the idea that a theorem has appeared not because of
the wish of the author of a text-book or the teacher, but rather because it gives the
answer to the problem that has naturally arisen during the previous work... Perhaps this
idea of the development of the content of geometry does not reflect to a great extent the
historical path of this development, but this view is the answer to the naturally arising
question: how the development of the content of geometry could be explained? For the

Safuanov
PME31―2007 4-148
teaching of geometry to have such view of the subject-matter is extremely valuable...”
(p. 8).
Izvolsky expresses the essence of the genetic approach by the following sentence: “A
view of geometry as a system of investigations aiming at finding answers to the
consequently arising questions” (p. 9).
Such prominent mathematics educators of the post-war period as V.M.Bradis and N.M.
Beskin also applied the genetic approach in methods of teaching geometry.
V.M.Bradis, considering principle of a genetic character of an account by a basic
principle of teaching mathematician, wrote:
“The experience of teaching definitely shows that the quality of mastering of a
mathematical subject matter will essentially win if each new concept, each new
proposition is introduced so that its connection with things already familiar to the pupil
is clear and the expediency of its study is visible. For pupil, most convincing
justification of each new concept and proposition is a practical activity close, whenever
possible, to their experience” (Bradis, 1949, p. 44-45).
N.M.Beskin (1947) wrote: “... It is necessary to show geometry to the pupils not in a
complete, crystallised but in the process of development. The method, which we
recommend, is called genetic. This method makes each pupil the active creator of
geometry: we put before her/him a problem, the process of its solving gives rise to
separate theorems and entire sections of geometry”.
One can find interesting examples of genetic approach in the article of T.J. Fletcher
(1974) on geometry teaching: “The sequence of technique-followed-by-applications is
being rejected for a teaching approach which is more subtle and certainly more
difficult to carry out - a contextual approach which gives more recognition to the
character and needs of human beings. This involves devising learning situations my
which students generalise from the experience. Abstractions are too important to be
told to the student, he must come to see them himself. In other words the pupil
develops understanding not so much by following a logical exposition as by making
for himself a sequence of conceptual reorientations. The problem of teaching is to set
up learning situations from which the pupil acquires the experience which compels the
reorientation…” (p. 23). And further: “…The guiding principle at this stage is for the
student first to do something and then to consider how he did it; to ask what principles
he was applying, and to ask how explicit recognition of the principles gives power to
do more” (p. 27).
GENETIC APPROACH IN LEARNING GEOMETRICAL CONCEPTS AND
THEOREMS.
We offer the following ways of developing problem situations (Safuanov, 2005, p.
262):

Safuanov
PME31―2007 4-149
1) Based on historical analysis of the subject matter, the teacher reconstructs the
development of the concept, shows the origin of the problem, puts forward the
hypothesis, shows various ancient and modern solutions and assesses the results;
2) Based on the logical and epistemological analysis of the development of a
mathematical idea, the teacher himself constructs a problem situation, and pupils solve
that problem under the guidance and control of the teacher;
3) The teacher constructs a problem situation, but pupils themselves independently put
forward hypotheses, find solutions and carefully check them;
4) Based on previously acquired knowledge and on the theme studied, pupils
themselves state new problems, naturally arising questions and the ways of their
solutions. In this case the teacher accomplishes the co-ordinating function.
We consider the genetic approach in two types of the theoretical learning: in learning
concepts and in learning theorems and their proofs.
In learning concepts, one may apply the technique of the design of the system of the
teaching of the concepts described in (Safuanov, 2005) which must be preceded by the
analysis consisting of two stages: 1) genetic elaborating of a subject matter and 2)
analysis of arrangement of a material and possibilities of using various ways of
representation and effect on students. The genetic elaborating of a subject matter, in
turn, consists of the analysis of the subject from four points of view: a) historical; b)
logical; c) psychological; d) socio-cultural. In designing of the system of genetic
teaching very important is to develop problem situations on the basis of historical and
epistemological analysis of a theme.
As the history, epistemology and socio-cultural aspects of most geometric school
material is well-studied in literature, the mathematics educators can easily construct
systems of the teaching of geometric concepts similar to those for algebraic concepts
described in (Safuanov, 2005).
For example, when learning the theme “Quadrangles”, the teacher may offer: "Choose
superfluous quadrangles among those described on the sheet of paper (a square, a
trapezoid, a rectangle, several parallelograms)". The superfluous figure is the trapezoid
because each of other quadrangles has two pairs of parallel sides. Thus, the essential
property of a parallelogram would be extracted. Further, pupils can reconstruct logical
genealogies of such concepts as a rectangle, square etc.
In the next example, when learning geometrical transformations, say, symmetries, it
would be appropriate to begin with the work with geometrical models representing
geometrical figures. Manipulating them and finding their axes and centres of symmetry,
pupils can easily can to the concept of symmetry. Similar activities had been proposed
(in elementary school) by V.V.Davydov (1996) and his disciples.
When learning theorems, genetic approach demands the use of analytic proofs as
described by Beskin (1947, p. 78).

Safuanov
PME31―2007 4-150
“... Studying a theorem by genetic method we should not introduce the statement to
pupils immediately.
We offer to pupils a specific problem the solution of which is the theorem.
... Prominent geometer discovered new theorem because he better knew this area than
ordinary people did. We can understand this theorem, when it is already formulated,
but we encounter difficulties attempting to reproduce the path by which the author has
come to this theorem. In such case we should try only to facilitate, as far as possible,
the understanding of that path. The genetic method can not be reduced to studying all
the theorems by a completely uniform scheme.
Trying to come, whenever possible, to the theorems by a natural way, we not always
can attain it.
The last observation concern not only complicated theorems, but also many rather
simple theorems at the very beginning of geometry. The difficulty is sometimes
explained by the fact that the theorem will be necessary in one of the further sections of
geometry, and before the learning of that further section it is difficult to explain, why
we have introduced the theorem” (pp. 67-70).
“It is worthwhile, as far as possible, to raise before the pupils a veil, behind which the
course of thought having brought for the first time to the discovery of new proofs is
concealed.
...Using analytical method of a proof we first of all try to prove what is required
immediately (by single logic step). If that fails, we find out the positions which do not
suffice for a proof of this theorem, and try to prove those positions... and so on from
unproved to known positions. The course of reasoning in an analytical proof is just
inverse with respect to the corresponding synthetic proof.... Usually the proof contains
both synthetic and analytical elements” (pp. 75-78).
Consider an example of studying a geometrical result at school.
Studying a formula for the area of a regular polygon, after the construction of a regular
polygon, pupils come to the idea of necessity of the partition of a polygon into triangles.
Properties of regular polygons imply the conjecture about the equality of the
constructed triangles. The pupils check the conjecture, find the area of one of triangles
and, executing appropriate operations, independently formulate a conclusion.
It is important not only to teach pupils how to prove, but also to shape in their minds
the need for proofs and the aspiration to discover them independently. It is necessary to
try to organise teaching so that the child would ask himself why an assertion is correct
would try to get to the bottom of the reasons of its correctness.
Analytic activities and, in particular, analytic proofs, had been described in (Gusev and
Safuanov, 2001) where also the example of analytic proof was presented.

Safuanov
PME31―2007 4-151
CONCLUSION
In this paper we outlined some ideas and methods of teaching school geometry by
genetic approach. We think that the further development of “genetic” techniques of
geometry teaching may be connected with the genetic elaboration of important
concepts including the analysis of the subject from historical, logical and
epistemological, psychological and socio-cultural points of view, with revealing
logical genealogies of concepts and theorems. Also, practical manipulations with
geometrical objects using, in particular, dynamic geometry systems such as Cabri
would be useful, too.
References
Beskin, N.M. (1947). Didactics of Geometry. Бескин, Н.М. Методика геометрии.
М.-Л.: Учпедгиз.
Bradis, V.M. (1949). Methods of teaching mathematics at secondary school. Брадис,
В.М. Методика преподавания математики в средней школе. М.: Учпедгиз.
Davydov, V.V. (1996) Theory of developing instruction. Давыдов, В.В. Теория
развивающего обучения. М.: ИНТОР.
Davydov, V.V. (2000). Types of generalization in teaching. Давыдов, В.В.. Виды
обобщения в обучении. М.: Педагогическое общество России.
Diesterweg, F.A.W. (1962). Wegweiser zur Bildung fuer deutsche Lehrer und andere
didactische Schriften. Berlin.
Gusev, V.A., & Safuanov, I.S. (2001). Analytic-synthetic activities in the learning of
mathematics. In M. van den Heuvel-Panhuizen (Ed.): Proceedings of the 25rd
Conference of the International Group for the Psychology of Mathematics Educa-
tion, v. 3. Utrecht, Netherlands, pp. 73-80.
Itelson, L.B. (1972). Lectures on modern problems of psychology. Ительсон, Л. Б.
Лекции по современным проблемам психологии обучения. Владимир.
Kholodnaya, M. A. (1996). The Psychology of the Intelligence: Paradoxes of the
Research. Холодная, М. А. Психология интеллекта: парадоксы исследования.
М.: Барс.
Leibnitz, G.W. (1880). Mathematische Schriften. Berlin.
Leontyev, A.N. (1977). General concept of activity. Леонтьев, А. Н. Общее понятие
о деятельности // Мироненко, В. В. (сост.). Хрестоматия по психологии. М.:
Просвещение, с. 206-214.
Leontyev, A. N. (1981). Problems of the development of mind. Леонтьев, А. Н.
Проблемы развития психики. М.: Изд-во Московского университета.

Safuanov
PME31―2007 4-152
Piaget, Jean, & Garcia, Rolando. (1989). Psychogenesis and the history of science. N.
Y.: Columbia University Press.
Poincare, H. (1990). On the science. Пуанкаре, А. О науке. М.: Наука.
Polya, G. Mathematical discovery, v.2. New York - London: Wiley, 1965.
Rubinshtein, S. L. (1958). On thinking and ways of its research. Рубинштейн, С. Л. О
мышлении и путях его исследования. М.: Изд-во АН СССР.
Rubinshtein, S. L. (1989). Fundamentals of general psychology, v. 1,2. Рубинштейн,
С.Л. Основы общей психологии, т. 1,2. М.: Педагогика
Safuanov, I. (1999). On some under-estimated principles of teaching undergraduate
mathematics. – In O. Zaslavsky (Ed.): Proceedings of the 23rd Conference of the
International Group for the Psychology of Mathematics Education, v. 3. Haifa,
Israel: Technion, pp. 153-160.
Safuanov, I. (2005). The genetic approach to the teaching of algebra at universities.
International Journal of Mathematical Education in Science and Technology, 36
(2-3), pp. 257-270.
Vygotsky, L.S. (1996). Pedagogical psychology. Выготский, Л.С. Педагогическая
психология. М.: Педагогика-Пресс.
Wittenberg, A.I. (1968). The prime imperatives. Toronto, Vancouver: Clarke, Irwin &
Co.
Wittmann, E.Ch. (1992). The mathematical training of teachers from the point of view
of education. Zentralblatt fuer Didaktik der Mathematik, No. 7, 274-279.

2007. In Woo, J. H., Lew, H. C., Park, K. S. & Seo, D. Y. (Eds.). Proceedings of the 31st
Conference of
the International Group for the Psychology of Mathematics Education, Vol. 4, pp. 153-160. Seoul: PME. 4-153
ON PRIMARY TEACHERS’ ASSESSMENT OF PUPILS’ WRITTEN WORK IN MATHEMATICS
H. Sakonidis and A. Klothou
Department of Primary Education, Democritus University of Thrace, Greece
The study reported here aims at examining the resources which Greek primary
teachers draw on and the positions they adopt within the pedagogical discourse of
assessment. 553 primary school teachers were asked to assign a grade to four
authentic solutions to a word problem and to justify their grades in writing. The results
indicate that in assessing students’ written work, teachers tended to resort to a rather
limited variety of resources, mainly from an unofficial, personally constructed and
rather traditional pedagogic discourse, while the way they were positioned within this
discourse did not allow them to offer varied evaluations.
INTRODUCTION
Assessment in mathematics is often seen to be equivalent to an evaluation of the level
of understanding achieved by pupils. This approach to assessment is based on the
assumption that pupils have certain characteristics such as skills, abilities and
knowledge, which can be measured. However, this emphasis on the measurement of
children’s achievements is very limited, as it does not allow for the complexity of the
assessment process to be acknowledged. That is, it does not allow for their work to
be understood in relation to power structures developed in the classroom, the school
and the wider society. This suggests that, in looking at how pupils’ work is judged
by teachers, the social nature of mathematical behavior, theories of pedagogical
discourse and communication, as well as a sociological analysis of the role of
education, mathematics and assessment all need to be taken into account (Morgan,
2000).
Teachers’ assessment practices in mathematics are shaped by a number of factors,
internal (e.g., their conception of mathematics, its learning and teaching, their feeling
and expectations of students) and external (e.g., parents, examining boards) to them.
Thus, there can be important differences in both the assessments teachers make and
the approach they adopt in assessing. These differences can be interpreted on the
basis of an epistemology according to which there is not necessarily a relation
between a student’s ‘text’ and the meanings the teacher, as a reader of the text,
constructs (Kress, 1989). On the contrary, these meanings depend on the features that
the reader identifies in the text. These features vary according to the pedagogical
discourse utilized, and the positionings adopted by the teacher-reader within it along
with his/her previous experience (Morgan, 1998).
In the light of the above considerations, it becomes apparent that teachers proceed to
assessments subjectively. Moreover, they do not have the same subjective judgement
in all cases and in all school subjects. As a result, assessment seems at times to be an

Sakonidis & Klothou
PME31―2007 4-154
informal function and at others a formal, well-defined operation, which has been
probably pointed out (Morgan, 2002).
Recognizing the interpretive nature of assessment, the relevant research in
mathematics education has turned its attention to the processes adopted by teachers
when interpreting students’ performance. The still limited work towards this
direction indicates that when judging students’ mathematical attainments, teachers
read their texts in an interpretative and contextualized way, relying not only on “their
knowledge of the current circumstances but also on the resources they bring to bear
as they ‘read’ the students’ mathematical performance from these texts. These
(resources) … arise from the teachers’ personal, social, and cultural history and from
their current positioning within a particular discourse” (Morgan & Watson, 2002). In
a series of studies, Morgan and her colleagues, attempting to identify resources
utilized and positions adopted by teachers when assessing pupils’ texts, came to
suggesting the following categories: (a) Resources: ‘teachers’ personal knowledge of
mathematics’, ‘their beliefs about the nature of the subject matter’, ‘their expectations
of how mathematical knowledge can be communicated’, ‘their experience and
expectations of students and classrooms in general and of individual students in
particular’, ‘their linguistic skills and cultural background’ (Morgan & Watson, 2002)
and (b) Positions: ‘teacher-examiner, using externally determined criteria’, teacher-
examiner, using own criteria’, ‘teacher- advocate, seeking opportunities to give
credits to students’, ‘teacher-adviser, suggesting ways of meeting the criteria’. The
positions adopted by teachers-assessors and the resources available to these positions
signal “different relationships to students and to external authorities as well as
different orientations towards the texts and the task of assessment” (Morgan et al,
2002).
A rather small number of studies attempted to study teachers’ assessment practices in
mathematics within the perspective described above, revealing certain interesting and
important aspects of these practices, some of which are summarized below:
• Teachers can easily identify and value the ‘correct’ elements in their students’
productions in mathematics texts, but they find it difficult to coherently
describe the features of these productions, which influence their assessment
practices.
• In assessing, teachers exploit either individual or collective resources, which
might come from different and even contradictory discourses. The way
teachers are positioned within them may lead to different assessment of a
student by a particular teacher in different times and contexts (Evans, 2000,
Morgan et al, 2002).
• Teachers’ knowledge and beliefs about mathematics and its teaching and
learning are among the central resources teachers draw on to assess pupils, and
are mainly located in the pedagogical discourse. This is because these
conceptions contribute to and predetermine how mathematics is taught, play a

Sakonidis & Klothou
PME31―2007 4-155
part in definitions of achievement and inform criteria of attainment (Thomson,
1992). Thus, despite the limited research in this area, there is some recognition
that teachers’ judgements about pupils’ achievements are influenced by
teachers’ values of mathematics. For example, problem-solving skills,
memory for rules and ability to adapt skills may be valued differently by
different teachers or even by teachers with similar views of mathematics,
because of their idea of how mathematics should be represented. Believing in
a transmission model of teaching or in a constructivist model of learning in
mathematics is likely to mean valuing different assessment tasks and outcomes
and interpreting pupils’ achievements differently compared to favouring other
models of teaching and learning (see, for example, Kahn, 2000). A teacher
with a utilitarian view of mathematics may see successful use as indicative of
understanding, whereas one with a logistic view might demand a full
explanation of meaning (Ernest, 1990). Or, favouring a particular teaching or
learning approach, for example, considering application as the ultimate
demonstration of understanding, or valuing and encouraging investigative or
practical work, is likely to affect teachers’ assessment conceptions as well as
their assessing practices, and hence to possibly disadvantage certain groups of
students (Walkerdine, 1988).
The argumentation developed above indicates the importance of examining the
features that characterize teachers’ practices when assessing their students’
productions in conjunction with the differentiated answers provided by the latter in
given contexts. The research described in the following is an effort to contribute to
this direction.
THE STUDY
The study reported here was carried out in the context of a larger research project,
which aimed at examining the resources which Greek primary teachers draw on and
the positions they adopt within the pedagogical discourse of assessment. In the
present paper, the focus is narrowed down to an examination of the pedagogical
discourse of assessment employed by primary teachers, when reading pupils’ written
answers to a word problem requiring operations with whole numbers. In particular,
an attempt is made to address the following research questions: (a) What are the main
features of these pupils’ texts that teachers value and how do they affect the grade
they assign to the students? (b) What are the resources teachers draw on and the
positions they adopt in assessing these texts?
The data exploited here come from 553 Greek primary teachers (328 female and 225
male) with 6 to 20 years of teaching experience. The teachers were asked to assign a
grade to the authentic solutions to the above mentioned word problem provided by
four 10 years old students and also justify in writing their grades. Students’ answers
differed with respect to the linguistic and the symbolic features of the mathematical
text produced (all the solutions were correct). More specifically, the answers
provided by the four students were as follows:

Sakonidis & Klothou
PME31―2007 4-156
Student A: the necessary operations are correctly performed and the series of
operations is simply described in words.
Student B: the necessary operations are correctly performed and a written answer for
each of the questions set is provided.
Student C: the necessary operations are analytically and correctly performed and a
written answer for each of the questions set is provided.
Student D: the necessary operations are correctly carried out.
DATA ANALYSIS AND RESULTS
The analysis of the data predominately aimed at identifying the resources which the
teachers of the sample draw on and the positions they adopt in the context of the
discourse they develop in trying to justify the grades they allocated to each of the four
answers. To this purpose, the categories suggested by Morgan and her colleagues
were exploited, following an interpretive process: for each category, identifying and
coding of the relevant content of the teachers’ written answers; enrichment of the
exemplification as more answers were read; noticing compatibility and dominant
orientation(s) in the data.
Before launching into presenting the results of the above analysis, we discuss the way
the teachers of the sample graded the four answers.
Table 1. The grades allocated by the teachers to the four students’ answers.
Grade Student A Student B Student C Student D
10 (75,9%) (48,3%) (32,7%) (12,1%)
9,5 (1,3%) (4,7%) (3,6%) (2,4%)
9 (8,7%) (30,2%) (26,9%) (22,4%)
8,5 (0,2%) (0,7%) 1,3%) (2,7%)
8 (5,1%) (7,4%) (17,9%) (28%)
Lower than 8 (8,8%) (8,7%) (17,6%) (67,6%) Note: Students’ work in Greek primary schools is graded from 0 – 10.
The results in the above table show that the teachers of the sample valued fairly
highly all four answers, their grades being more unanimous for students’ A and D
answers than for the remaining two. About three quarters of the teachers graded
student A’s answer as excellent and almost two thirds of them student’s D response
as the least satisfactory. For students’ B and C, about 83% and 63% of the sample’s
grades respectively are split between 10 and 9, with the former grade being a little
more popular. These results indicate that, despite the fact that none of the four
answers incorporated any serious attempt to provide any justification for the
operations chosen, teachers tended to value them highly. This was particularly the
case when the answer included operations performed in the commonly taught way
and some writing, especially if this writing was related to operations, even if it was
simply naming them.

Sakonidis & Klothou
PME31―2007 4-157
Tables 2 and 3 below present the resources utilized by the teachers of the sample and
the positions adopted by them respectively, as identified in the written discourse they
developed in justifying their grading of the four students’ answers, following the
categorization of Morgan and her colleagues.
Table 2. Resources exploited by teachers in assessing the four students’ responses
Resources Student A Student B Student C Student D
PK 0 (0%) 0 (0%) 0 (0%) 0 (0%)
BM 18 (3,2%) 29 (5,3%) 15 (2,7%) 17 (3,1%)
EMC 243 (43,94%) 211 (38,1%) 256 (46,3%) 270 (48,8%)
BM+EMC 167 (30,2%) 165 (29,8%) 136 (24,6%) 126 (22,8%)
O/I 21 (3,8%) 16 (2,9%) 9 (1,6%) 12 (2,1%)
N/A 104 (18,9%) 132 (23,9%) 137 (24,8%) 128 (23,2%) Note: PK: Teachers personal knowledge & experiences of mathematics, BM: Teacher’s beliefs about the
nature of mathematics, EMC: Teacher’s expectations of how mathematical knowledge is communicated,
O/I: Other or impossible to identify, N/A: No answer.
From this table, it becomes obvious that in all cases, the teachers of the sample
resorted predominately to resources related to their expectations of how mathematical
knowledge should be communicated and secondarily to also resources concerning
their beliefs about the nature of mathematics. These results highlight a) the
dominance of the individually constructed rather than of the officially determined
resources of assessment in mathematics, b) the overwhelming predominance of
resources related to the way mathematics should be communicated (almost 7 in 10
teachers exploited somehow this type of resource) and c) the relatively high degree of
stability of the resources utilized by the teachers across the four students answers.
Furthermore, the fact that almost 1 in 4 to 5 teachers refused to justify their grades
can be taken as an indication of the difficulty or uneasiness these teachers experience
when having to specify their assessment criteria.
Below, some examples of teachers’ grade justifications are presented, in order to help
the reader formulate a sense of the way in which the data were analyzed.
Teachers’ beliefs about the nature of mathematics: “Correct result, mathematics is
the route to the result”, “the student’s thought is mathematically logical”, “the
student solves the problem with a slightly more complicated manner, cannot think of
the easiest/shortest route”, “mathematics is being economical”, “the student uses the
shortest route and this shows intelligence and correct mathematical thinking”.
Teachers’ expectations of how mathematical knowledge is communicated: “the
sequence of the ideas and operations is apparent”, “he explains the solving
procedure step-by-step…however, he does not provide an answer to the questions
asked”, “its disadvantage is that there is no thinking expressed”, “lengthy answers
are not necessary… because they constitute an obstacle for students who are not

Sakonidis & Klothou
PME31―2007 4-158
good at language and take more time to think of how they should express their
thoughts rather than of how to solve the problem”, “she formulated coherently her
answer, so that anyone who reads it, can understand the problem… I think that this is
important”.
In order to acquire a better understanding of the above results, we proceeded to a
detailed analysis of the sub-categories constituting each of the resource categories.
This analysis led to the identification of four sub-categories for the most frequent
resource utilized (EMC): (a) ‘thinking carried out analyzed’, (b) ‘actions taken
justified’, (c) ‘actions taken explained’ and (d) ‘work presented clearly/in
detail/precisely or not’. Among them, sub-category (d), particularly for students’ C
and D answers, and then category (a), specifically for students’ A response, were
located in far more than 60% of the relevant teachers’ responses to all four cases.
Thus, it appears that for the majority of the teachers of the sample who drew on this
particular resource, the conventionally and correctly performed mathematical
manipulations (mainly of symbolic character) are good enough indicators of pupils’
attainments in mathematics (given that the verbal part of the four students’ answers
hardly described any genuine thinking). That is, these teachers drew mainly on an
unofficial discourse (calculations are seen as explanations or justifications,
communication is taken to simply mean transmission of meaning) and not on any
official one (where the terms ‘communication’, ‘explanation’, ‘justification’ in
mathematics are fairly well-defined features).
Table 3. Positions adopted by the teachers in assessing the four students’ answers
Positioning Student A Student B Student C Student D
EEC 23 (4,2%) 41 (7,4%) 21 (3,8%) 14 (2,5%)
EOC 250 (45,2%) 234 (42,4%) 261 (47,2%) 271 (49%)
EEC+EOC 138 (24,9%) 127(22,9%) 121 (21,8%) 114 (20,7%)
ADVO 21 (3,8 %) 9 (1,6%) 2 (0,4%) 9 (1,6%)
ADVI 14 (2,5%) 4 (0,7%) 2 (0,4%) 5 (1%)
O 3 (0,5%) 6 (1,1%) 9 (1,6%) 12 (2%)
N/A 104 (18,9%) 132 (23,9%) 137 (24,8%) 128 (23,2%) Note: EEC: Examiner (externally determined criteria), EOC: Examiner (own citeria), ADVO: Advocate,
ADVI: Adviser, O: Other, N/A: Not answered.
The results recorded in Table 3 show that the dominant positioning adopted by the
teachers of the sample in their discourse of assessment is that of an examiner using
his/her own criteria and, in some cases, in addition, that of an examiner using
externally determined criteria of assessment. The fact that this picture remains stable
across the four cases underlines the prevalence of this type of positioning. This
indicates that these teachers tended to ignore, reject or resist to official discourses
(e.g., evaluation discourse, professional discourse, academic discourse), resorting to

Sakonidis & Klothou
PME31―2007 4-159
their own professional values or even to common sense notions concerning
assessment (see also examples below).
Some examples, which exemplify the two main position categories are as follows: (a)
Teacher-assessor as an examiner, using his/her own criteria: “this student thinks like
an adult, in a mature and carefully way”, “I think that this child has understood
better the way of solving a problem…It might be that my opinion is wrong, because
the child solved the problem in the way I would solve it”, “for me personally, his
answer is satisfactory”, “he either does not externalize his thought or he is very
secure”.
(b) Teacher-assessor as an examiner, using external criteria: “each problem requires
not only lining up of the mathematical operations, but also the formulation of the
answers”, “In mathematics, only accurate answers are acceptable”, “Each problem
requires a specific answer expressed in certain units”.
CONCLUDING REMARKS
The preceding analysis allows for a number of points concerning the participating
teachers’ assessment practices of pupils’ written productions to be raised. To start
with, these teachers could easily identify what was ‘correct’ in the four students’
answers, but found it difficult to differentiate between them (hence the high grading).
This might be due to the fact that these answers are similar with respect to the
correctness of the solution and the performance of the operations. However, they
differ in relation to the number of operations carried out (student C) and the content
of their verbal component and / or the familiarity of the teachers with it. In particular,
with reference to the latter, student’s A linguistic part of the response adds nothing to
its value, but is often seen in Greek students’ work and is not discouraged by
teachers; in students’ B and C answers, the solution is simply spelt out, also a
common practice in Greek mathematics classrooms, whereas there is no verbal part in
student’s D response. This might also explain the moderate diffusion noticed for
students’ B, C and D answers in the first two tables above, agreeing with Morgan and
Watson (2002), who argue that “when a student text diverges from the usual to the
extent that it is not covered by the established common expectations, each teacher
must resort to his or her personal resources, thus creating the possibility of
divergence in the narratives they compose”.
With respect to the resources utilized and the positions adopted, the above analysis
reveals that these teachers tended to draw on a rather limited variety of resources,
more or less the same for all four cases, mainly from an unofficial, personally
constructed discourse. This is compatible with the positions they adopted within this
discourse. Both these resources and positionings underpin performance oriented
assessment practices which predominately value procedural than relational aspects of
mathematics and lead to similar evaluations of students’ texts. An explanation of this
could be sought in these teachers’ limited mathematics education, which makes
problematic their access to official discourses related to it. This is reinforced by an
educational system, still very centralised and conservative, which offers very limited

Sakonidis & Klothou
PME31―2007 4-160
opportunities for genuine in-service training, innovative initiatives and
experimentation. Primary mathematics teaching is almost solely based on textbooks
distributed to every single student of the country free of charge by the Ministry of
Education. Thus, the teachers of the sample, being educated and functioning within a
downgraded educational environment, with a conservative mathematics education
policy in force, were gradually led to develop and consolidate discourses which were
compatible to this retrogressive reality and personal in character.
The above findings underline the importance of this particular way of looking at
teachers’ functioning as assessors and points out to the need for further research in
this direction, which will permit the identification of the resources teachers draw on
and the various ways they are positioned in the relevant discourse when judging
students’ work in various context.
REFERENCES
Ernest, P. (1990). The philosophy of mathematics education. London: Falmer Press.
Evans, J. (2000). Adults’ mathematical thinking and emotions: a study of numerate
practices. London: Routledge.
Kahn, E.A. (2000). A case study of assessment in a grade 10 English course. The
Journal of Educational Research, 93, 276 – 286.
Kress, G. (1989), Linguistic processes in sociocultural practice. UK: Oxford Univ.
Press.
Morgan, C. (1998). Writing mathematically: the discourse of investigation. London:
Falmer Press.
Morgan, C. (2000). Better assessment in mathematics education? A social perspective.
Ιn J. Boaler (Εd.), Multiple perspectives on mathematics education and learning,
226-227, London: Ablex Publications.
Morgan, C. and Watson, A. (2002). The interpretative Nature of Teachers’
Assessment of Students’ Mathematics: Issues for Equity, Journal for Research in
Mathematics Education, 33(2), 78-110.
Morgan, C. & Tsatsaroni, A. & Lerman, S. (2002). Mathematics Teachers’ positions
and practices in Discourses of Assessment, British Journal of Sociology of
Education, 23(3), 445-461.
Thompson, A. (1992). Teachers’ beliefs and conceptions: a synthesis of research. Ιn
D.A. Grows (Εd.), Handbook of research on mathematics teaching and learning,
New York: Macmillan.
Walkerdine, V. (1988). The mastery of reason. London: Routledge.

2007. In Woo, J. H., Lew, H. C., Park, K. S. & Seo, D. Y. (Eds.). Proceedings of the 31st Conference of
the International Group for the Psychology of Mathematics Education, Vol. 4, pp. 161-168. Seoul: PME. 4-161
QUALITIES CO-VALUED IN EFFECTIVE MATHEMATICS
LESSONS IN AUSTRALIA: PRELIMINARY FINDINGS
Wee Tiong Seah
Monash University, Australia
This report is part of a study being conducted with Grades 5 and 6 students in primary
schools in Victoria, Australia, exploring the qualities that are co-valued by teachers
and their students in particularly effective mathematics lessons. Effective mathematics
lessons is a function of productive interactions between students and their teachers in
their respective sociocultural settings. That such interactions involve the mediation of
choices and negotiation of decisions imply that aspects of mathematics lessons are
co-valued by lesson participants. The data show that the co-valuing of mathematics
educational and institutional qualities in effective mathematics lessons is more
significant than the co-valuing of other qualities. Differential perceptions between
male and female students were also interpreted.
INTRODUCTION
Effective (mathematics) teaching is undoubtedly an important − if not the most
important − objective in school mathematics education. This paper recognises that
effective mathematics lessons/teaching/learning may be labelled differently, such as
excellent teaching (AAMT, 2002) and successful lessons (Sullivan, Mousley, &
Zevenbergen, 2006). Much − if not all − of what constitute pre- and in-service
teacher education courses is aimed at facilitating more effective pedagogical practices
amongst teachers-to-be and teachers respectively. Teacher professional accreditation
(and promotion) exercises in different countries are also structured based on teacher
demonstrated professional practice. For example, in Australia, the ‘Standards for
Excellence in Teaching Mathematics in Australian Schools’ (Australian Association of
Mathematics Teachers, 2002) “describes what teachers who are doing their job well
should know and do” (AAMT, 2002, p.1). In the USA, the NCTM Standards advocates
for effective curriculum, teaching and learning.
This paper presents a small part of a study being conducted in Victoria, Australia
which explores the qualities (pedagogical or otherwise) that are co-valued by teachers
and their students in effective mathematics lessons. Instead of focussing on the values
that teachers of mathematics and their students subscribe to individually, the study
looks at what are being co-valued in lessons that optimise mathematics learning in the
primary schools, and it also aims to unpack the implications of key similarities and
differences between perspectives of teachers and students.

Seah
PME31―2007 4-162
EFFECTIVE LEARNING / TEACHING OF MATHEMATICS
Despite the many different ways of defining and ‘measuring’ effective mathematics
teaching (through, for examples, test scores, growth in student understanding), the very
notion of ‘effectiveness’ remains to be an elusive concept. Effective teachers need not
be equally effective with different grade levels or different cohorts of students. Indeed,
effective teachers might be good at adopting different pedagogical actions to different
learners in the same classroom. Also, the extent to which teaching/learning
effectiveness can be measured validly through achievement outcomes alone (e.g. due
to examination anxiety) is debatable, though, paradoxically, one might even expect
assessment to be reflective of effective learning!
Thus, not only is teaching/learning an interaction, but effective teaching/learning
might be a function of such interactions between teachers and their students, between
and amongst students, and between the class and its environment. Waldrip, Timothy
and Wilikai (2007) highlighted “that relationships in teaching are of prime importance.
As the teacher works to establish rich communicative relationships with students …
more is revealed to them about one’s teaching and the more credible to the students
becomes the teaching” (p. 118). This view to effective teaching implies that any
attempt by a teacher to enact any ‘list of attributes of effective mathematics teaching’
needs not make the teacher more effective; the compatibility of the sociocultural
environments concerned is likely going to be an important factor instead. Yet, much
(mathematics) research advocates teaching ideas which assume learners as being
equally ready cognitively, and/or assume that the learning contexts are similar or
unproblematic, when “students will respond differently ….[Thus], while teachers can
anticipate variable responses to the tasks from the students in their planning, there is
also an explicit requirement that the teaching itself be both dynamic and interactive”
(Sullivan, Mousley and Zevenbergen, 2006, pp. 119-120).
Just as it has been productive for us to think about teacher interacting rather than
teacher teaching, the same applies to thinking about how/why a teacher does what
he/she does, rather than what the teacher does; from thinking about effective
mathematics lessons rather than effective teachers.
This view of mathematics pedagogy is embodied in curriculum statements like the
aforementioned Australian Standards. Instead of identifying specific attributes
associated with excellent teaching, the Standards point to broad characteristics
demonstrated by such teachers. For example, statement 3.1 advocates that “in an
inclusive and caring atmosphere of trust and belonging, active engagement with
mathematics is valued, communication skills fostered, and co-operative and
collaborative efforts encouraged” (AAMT, 2002, p.4). While key qualities that are
valued in effective teaching are identified; there is no attempt at dictating how, say,
communication skills are to be fostered. In this way, it recognises that the professional
workplaces of different teachers necessitate the use of different strategies to foster such
skills amongst the learners. It also acknowledges that communication is valued in

Seah
PME31―2007 4-163
effective classrooms, along with inclusion, care, trust, belonging, engagement, and
co-operation.
VALUES RELATED TO MATHEMATICS EDUCATION
Values like those above are context-free (Seah, 2005). These values guide the adoption
of context-dependent beliefs, which in turn determine teacher actions to realise the
values. Thus, in valuing communication, say, a teacher may subscribe to the belief that
‘learners need to explain their problem-solving strategies in written solutions’, while
another teacher may hold the belief that ‘learners should discuss their responses to
problems with peers’. That is, a teacher is effective not because certain beliefs are
subscribed to; the same belief applied in another learning setting may not be successful.
Rather, it is likely that a teacher facilitates an effective lesson by guiding the
negotiation, mediation and co-valuing of enabling qualities with their students.
In conceptualising effective mathematics lessons as a function of interactions between
and amongst participants of the learning/teaching process, there is a recognition that
the negotiations conducted by teachers with their students (and vice versa) in
structuring effective learning environments are involved with the weighing of
available choices and mediating of decisions. Both choosing and decision-making are
key to valuing (Bishop & Clarke, 2005; Raths, Harmin & Simon, 1987). Thus, what get
co-valued by a teacher and the students in any mathematics lesson (rather than what
each of them values) play a significant role in helping us understand better the extent to
which the lesson is effective.
Seah (2005) had identified the relevance of organisational or institutional values (e.g.
professional development, numeracy) in school mathematics learning/teaching, adding
on to Bishop’s (1996) categories of mathematical (e.g. control, progress), mathematics
educational (e.g. practice, multiple representations) and educational values (e.g.
respect, honesty). Certainly, there are values which belong to multiple categories. For
example, creativity may be embraced within all the four categories of values operating
in mathematics lessons.
The significance of values and valuing in mathematics education research should be
understood from two different perspectives. In one, values in mathematics lessons may
be seen as a means of realising broader educational goals. Mathematics lessons are
regarded as vehicles for students’ learning of civics and moral knowledge, citizenship
and other pedagogical aims. In fact, this is one of two emerging forces challenging the
generally-held view of mathematics as being culture- and value-free (Wong, 2005).
Incidentally, this aspect of values research in mathematics education was also
acknowledged in the 2007 Psychology of Mathematics Education’s annual conference,
through its theme of ‘school mathematics for humanity education’.
In the other perspective, the concept of values is explored in the context of optimising
learners’ outcomes through teacher/student valuing of particular values (as in this

Seah
PME31―2007 4-164
study). Here, the various categories of values are seen to be vehicles for mathematics
learning, understanding, attainment or achievement.
If effective mathematics lessons are a function of interactions as described above, and
given that constructivism (in its various forms) acknowledges the co-construction of
knowledge between teacher and learners, then it is instructive to hear from both these
groups of participants with regards to what get valued in effective mathematics lessons.
Yet, what we know about effective mathematics lessons appears to be overwhelmingly
based on the perspectives of teachers (see, for example, Hayes, 2006) and/or educators
(e.g. Crawford & Snider, 2000). This research has been designed to also tap into
students’ perceptions to complement interaction techniques.
METHODOLOGY
This paper reports on a part of the quantitative component of the mixed-methods study
outlined above. In particular, the data source for this component was constituted by
5-page questionnaires each of which consists of 9 open-ended items, the analysis of
which is expected to shed light on the opinion of upper-primary (Grades 5/6) students
in relation to what are the qualities that are co-valued by participants of effective
mathematics lessons.
All but one of the items ask for students’ written responses in the spaces provided in
the questionnaire. The one item invites the student respondent to reflect on a
particularly effective mathematics lesson he/she had experienced over the past few
years, and to draw in the space given what that particularly effective mathematics
lesson looked like. Prior to responding to the questionnaire, a whole-class discussion
of what the term ‘effectiveness’ means in the context of (mathematics) lessons was
facilitated in each class.
Children’s drawings as a data source have been utilised in psychology and sociology
research (Yuen, 2004), but relatively seldom in education research. Yuen (2004) lists
several advantages in using children drawings as data source, amongst which include
the provision of a relaxed atmosphere, a greater insight into the perspectives of
children, the avoidance of groupthink, and working round the language barriers faced
by some student respondents. The limitations of this data source as identified by Yuen
(2004) were addressed in the design of this research. For example, the threat to
research validity due to children’s dislike of or perceived inability to draw was reduced
by telling the student respondents that each of them had the choice to skip any
questionnaire item, including the first item. This research also acknowledges the
difficulty for anyone to draw emotions and/or multi-sensory experiences, through the
inclusion in the questionnaire of other items that allow for cross-referencing of student
responses.
A total of 118 Grades 5/6 students from 5 classes in 2 suburban primary schools in
Melbourne completed the questionnaire survey. The students generally experienced no
problem in responding to the items, except for the observed difficulty amongst many

Seah
PME31―2007 4-165
students in spelling. Students were then assured that they could raise their hands to ask
for assistance in spelling individual words.
The first twenty questionnaires were jointly analysed by me and a colleague so that the
subsequent discussion of our inevitably value-laden interpretations could lead to a
socially-negotiated analysis framework. It is also noted that cross-referencing the
content of the questionnaire items further validated the interpretations.
WHAT EFFECTIVE MATHEMATICS LESSONS VALUE
Students’ perceptions of the values that operate in effective mathematics lessons were
elicited from an analysis of their drawings and textual responses. Table 1 is a list of 5
qualities most identified or inferred (by students) as being valued in effective
mathematics lessons in the primary school. In order of proportion of student
nomination, these qualities are fun (66.7% of the students surveyed), teacher
experience (58.5%), boardwork (50%), instruction/explanation (50%), and
interestingness (33.1%).
It is worthy to note that amongst the categories of values discussed earlier, effective
mathematics lessons in the Australian primary school classroom appear to value highly
qualities that are either mathematics educational or institutional in nature. One of these
institutional values (i.e. experience) also relates to teacher attributes. In fact, all the
three institutional values relate more to the teacher than to the other institutional factors
(such as school or education boards), thus highlighting the significance of
teacher-student relationships in fostering effective (mathematics) lessons (see, for
example, Waldrip, Timothy and Wilikai, 2007).
Valuing of … Value category n (%)
fun institutional 79 (66.7%)
experience institutional 69 (58.5%)
boardwork mathematics educational 59 (50%)
instruction / explanation mathematics educational 59 (50%)
interestingness institutional 39 (33.1%)
Table 1: Primary students’ perspectives of qualities that are highly co-valued.
This is not to say that educational and mathematical values are not emphasised at all in
effective mathematics lessons. However, it does imply that mathematics lessons that
are particularly effective value the pedagogy of the subject and the structuring of the
learning environment more than emphasising the more general educational values or
those characteristic of the mathematics discipline. Does this imply that effectiveness is
associated with more instrumental values (i.e. mathematics educational and
institutional) at the expense of less instrumental − and more realistic perhaps − ones
(i.e. mathematical and educational values)? Does this mean that the attained

Seah
PME31―2007 4-166
curriculum or measures of (effective) teaching value the utilitarian quality of lessons,
rather than the more aesthetic ones? Is the relatively less important roles played by
mathematical values a reflection of the level of content knowledge of primary school
teachers of mathematics)? Similarly, does the relatively less important roles played by
educational values add to the findings in Clarkson, Bishop, FitzSimons and Seah
(2000) that teachers need greater support in integrating values teaching / education in
mathematics lessons?
It is also important to remind ourselves that the qualities that are perceived by the
students as being valued were valued in the interactions that took place as the lessons
unfolded, rather than being valued by these students individually. In acknowledging
students’ perceptions of what counts as an effective mathematics lesson in this study,
the data was also interpreted by student gender to shed light on whether male and
female students perceived effective mathematics lessons to be valuing different
qualities, and if so, how this difference looks like. The 69 female students associate
effective mathematics lessons with 70 different values, while their 49 male peers see
these lessons as being associated with 60 different values. Similar to the whole-group
analysis, effective learning / teaching in these two data sets seem to value the
mathematics pedagogical, educational, and institutional aspects of lessons, while no
student related effective mathematics lessons with the mathematical nature of the
discipline (i.e. the mathematical values).
Some qualities that female students associate with effective mathematics lessons are
not regarded in the same way by the male students, and vice versa. Most significantly,
only female students (49 of them) see effectiveness as being related to interacting with
others, whether it being pair-work, group-work or whole-class settings. Also, the 25
students who value the teacher attribute of humour in effective mathematics lessons are
all girls.
Valuing of … Value category n (%)
fun institutional 45 (65.2%)
boardwork mathematics educational 39 (56.5%)
whole-class interactions mathematics educational 30 (43.5%)
experience institutional 25 (36.2%)
interestingness institutional 25 (36.2%)
Table 2: Primary female students’ perspectives of qualities that are highly co-valued.
Tables 2 and 3 list the qualities that are highly valued in effective mathematics lessons
as perceived by female and male students respectively. The valuing of fun, boardwork,
and (teacher) experience in effective mathematics lessons is not only very often
identified by the student respondents as a group, but also appears to be very significant
for male and female students alike. On the other hand, the differences of the values in
effective mathematics lessons between the male and female students are in line with

Seah
PME31―2007 4-167
prior observations that the former group tends to be more task-oriented, and the latter,
social-oriented (e.g. Seegers & Boekaerts, 1996). In fact, the female students’
association of effective teaching/learning with whole-class interactions is not only
unique to them, but a significant one for the group as well.
Valuing of … Value category n (%)
experience institutional 44 (89.8%)
instruction / explanation mathematics educational 39 (79.6%)
fun institutional 34 (69.4%)
boardwork mathematics educational 20 (40.8%)
symbolic representation mathematics educational 20 (40.8%)
Table 3: Primary male students’ perspectives of qualities that are highly co-valued.
The data presented here adds to prior knowledge about the task-orientedness /
social-orientedness gender difference in two different ways. Firstly, qualities that are
perceived by both gender as being highly valued in effective mathematics lessons may
also be categorised as task- or social-oriented, and the fact that they are so perceived by
both gender indicates that some features of task and social-orientations are
independent key ingredients of effectiveness in mathematics teaching / learning. After
all, and secondly, the qualities identified are valued in ways which are co-constructed
and negotiated by participants in the mathematics classroom, rather than being what
the individual male/female student values.
CONCLUDING REMARKS
A small part of a bigger study has been presented in this paper to allow for a focussed
examination of what students perceived as being valued by teachers and students in
effective mathematics lessons. While curriculum statements and teacher accreditation
documents emphasise the importance of both pedagogical understanding and positive
learning environment in the provision of effective mathematics teaching, the students’
perceptions as identified in this study further reinforce these aims, since relatively
more instrumental qualities (institutional and mathematics educational) are valued
more significantly in effective mathematics lessons. In revealing what exactly some of
these might be as valued by both teachers and learners in particularly effective
mathematics lessons, three of these qualities (i.e. fun, boardwork, experience) appear
to be highly valued across diverse classroom situations, but there are also observed
differences along gender lines. The implications of this for gender-based pedagogical
considerations are even more significant now given that the data presented here reflect
students’ views. Ongoing research in the other phases of this study, especially data
obtained from teachers commonly associated with effective mathematics lessons,
promises to help us understand better the notion of effectiveness in mathematics
learning / teaching as a function of classroom interactions between teachers and

Seah
PME31―2007 4-168
students, and amongst students, as well as the specific qualities that are valued in such
interactions as they are negotiated by participants involved.
References
Australian Association of Mathematics Teachers (2002). Standards for excellence in teaching
mathematics in Australian schools. Adelaide, Australia: AAMT.
Bishop, A. J. (1996, June 3-7). How should mathematics teaching in modern societies relate
to cultural values --- some preliminary questions. Paper presented at the Seventh Southeast
Asian Conference on Mathematics Education, Hanoi, Vietnam.
Bishop, A., & Clarke, B. (2005). Values in maths and science: What can we learn from
children's drawings? In J. Mousley, L. Bragg, C. Campbell, B. Doig, J. Gough, S. Groves,
P. Hubber, H. Mays & G. Williams (Eds.), Mathematics: Celebrating achievement (pp.
35-41). Victoria: Mathematical Association of Victoria.
Clarkson, P., Bishop, A. J., FitzSimons, G. E., & Seah, W. T. (2000). Challenges and
constraints in researching values. In J. Bana & A. Chapman (Eds.), Mathematics education
beyond 2000: Proceedings of the twenty-third annual conference of MERGA. (Vol. 1, pp.
188-195). Perth, Australia: MERGA.
Crawford, D. B., & Snider, V. E. (2000). Effective mathematics instruction: The importance
of curriculum. Education and Treatment of Children, 23(2), 122-142.
Hayes, D.(2006). Effective teaching: An elusive concept. Teacher Development, 10(1),
43-54.
Raths, L. E., Harmin, M., & Simon, S. B. (1987). Selections from 'values and teaching'. In J.
P.F. Carbone (Ed.), Value theory and education (pp. 198-214). Malabar, FL: Robert E.
Krieger.
Seah, W. T. (2005). Negotiating about perceived value differences in mathematics teaching:
The case of immigrant teachers in Australia. In H. Chick & J. L. Vincent (Eds.),
Proceedings of the 29th conference of the International Group for the Psychology of
Mathematics Education (Vol. 4, pp. 145-152). Melbourne: PME.
Seegers, G., & Boekaerts, M. (1996). Gender-related differences in self-referenced
cognitions in relation to mathematics. Journal for Research in Mathematics Education,
27(2), 215-240.
Sullivan, P., Mousley, J., & Zevenbergen, R. (2006). Teacher actions to maximize
mathematics learning opportunities in heterogeneous classrooms. International Journal of
Science and Mathematics Education, 4, 117-143.
Waldrip, B. G., Timothy, J. T., & Wilikai, W. (2007). Pedagogic principles in negotiating
cultural conflict: A Melanesian example. International Journal of Science Education,
29(1), 101-122.
Wong, K. Y. (2005). Add cultural values to mathematics instruction: A Singapore initiative.
Paper presented at the 4th Asian Mathematical Conference Singapore.
Yuen, F. C. (2004). "It was fun ... I liked drawing my thoughts": Using drawings as part of the
focus group process with children. Journal of Leisure Research, 36(4), 461-482.

2007. In Woo, J. H., Lew, H. C., Park, K. S. & Seo, D. Y. (Eds.). Proceedings of the 31st Conference of
the International Group for the Psychology of Mathematics Education, Vol. 4, pp. 169-176. Seoul: PME. 4-169
RESOLVING COGNITIVE CONFLICT WITH PEERS – IS THERE
A DIFFERENCE BETWEEN TWO AND FOUR?
Hagit Sela and Orit Zaslavsky
Technion – Israel Institute of Technology
This paper focuses on both inhibiting and enhancing social aspects of cognitive
conflict. Our research examined cognitive conflict situations that occurred while
students dealt with mathematical contradictions in two social settings: peer groups of
two or four students. We identified different types of on-task social interactions
between groups of the different sizes. These differences were perceived by the students
as contributing to or obstructing the conflict resolution and learning outcomes.
WHY DEAL WITH COGNITIVE CONFLICT?
Evoking cognitive conflict is often treated as a teaching strategy which may contribute
to learning. Thus, several researchers treat the conflict teaching approach as a means of
helping learners reconstruct their knowledge (Tirosh & Graeber, 1990; Niaz, 1995;
Swan, 1983; Behr & Harel, 1990; Movshovitz-Hadar, 1990).
Cognitive conflict results in a state of disequilibrium - a Piagetian term meaning lack
of mental balance. It is essential to the occurrence of what Piaget termed 'true learning',
that is the acquisition and modification of cognitive structures. A conflict can lead to
dissatisfaction with existing concepts, which is a crucial phase of conceptual change
(Posner et al., 1982). Cognitive conflict is usually a tense state (Zaslavsky et al, 2002).
Berlyne (1960) claims it plays a major role in arousing – a strong incentive to relieve
the conflict as soon as possible. Relating to its tensed character, researchers point to
situations where cognitive conflict could cause difficulties, problems, and even
dangers to the learning process. For example, if the conflict is excessive, it could lead
to withdrawal, anxiety or frustration (Dreyfus et al., 1990; Movshovitz-Hadar &
Hadass, 1991; Behr & Harel, 1990). Some researchers claim it can even break down
the learners current internal structures (Duffin & Simpson, 1993). Being aware of these
two contrasting sides of the conflict strategy, we felt challenged and fully motivated to
search for characteristics of the conflict resolution process which enhance or inhibit
learning.
Most of the research in mathematics education uses cognitive conflict as a strategy to
develop students' awareness to their misconceptions. The understanding state of
students is documented as a starting point A, and the conflict situation aims to transfer
the student to another target point B. The students' responses to mathematical questions
before and after the conflict experience are the main milestones of these studies (E.g.,
Swan, 1983; Movshovitz-Hadar, 1990; Tirosh & Graeber, 1990). As a result, little is
known about the characteristics of conflict resolution process. This study examined the

Sela & Zaslavsky
PME31―2007 4-170
processes involved in students' attempts to resolve mathematical cognitive conflict
situations.
WHY WORK IN SMALL GROUPS?
Many studies support learning in small groups (e.g., Leikin & Zaslavsky). Researchers
argue that interaction among students on learning tasks could lead to improved
achievement. The interaction brings students to learn from one another because in their
discussions of the content, cognitive conflicts are aroused, inadequate reasoning is
exposed, and higher quality understanding could emerge. Through mutual feedback
and debate peers motivate one another to abandon misconceptions for better solutions
(Slavin, 1995; Mugny & Doise, 1978).
However, there are researchers who point out to some aspects that are worthwhile
considering before planning working in small groups. A basic character of the situation
of working on mathematical tasks in a group is that students have to face two kinds of
problems: a mathematical one and a social one (Laborde, 1994). Therefore, we should
expect social behaviors which affect the learning process. For example, because of
self-esteem, students might refuse to recognize that they are wrong, or others might
refuse to accept the validity of their mates' arguments because they contradict theirs
(Balacheff, 1991). Attention to these aspects brought us to inquire the connections
between group work and learning; particularly, does it support learning through
cognitive conflict? In addition, Findings from a pilot study raised our attention to
different characteristics of group work processes which seem to depend on the group
size.
RESEARCH GOAL
Stemming from the questions above, we wanted to find whether there are differences
between two group sizes dealing with mathematics contradictions. Thus, the goal of
the study was to point to main differences and commonalities between cognitive
conflict-resolution processes of pairs vs. groups of four.
RESEARCH DESIGN AND METHODOLOGY
In order to create genuine cognitive conflict situations we selected 4 tasks with the
potential of evoking conflict, Tasks 1 & 3 were of familiar content, while Tasks 2 & 4
were of unfamiliar content (the number of the tasks indicates its order of appearance
for the students). In our paper we focus on findings from Tasks 1 & 3. These tasks, in
addition to several others, were tried out with other groups of students at an earlier
stage in order to support this claim. Once the tasks were determined, eight 17 years old
top-level secondary school students were invited to take part in the main study. All
students worked on all four tasks in the same order. Each experienced both settings –
on two of the tasks working in pairs and on the other two – working in groups of four.
In this paper, we focus on findings from Tasks 1 & 3, for all students. Half the students

Sela & Zaslavsky
PME31―2007 4-171
worked on Task 1 in pairs and on Task 3 in groups of four, and the other half worked on
Task 1 in groups of four and on Task 3 in pairs.
Each task began with an individual assignment, in which each student was asked to
solve a mathematical problem on his or her own, in writing. After solving the problem
alone, the members of the group were asked to discuss their solutions and reach an
agreement. When an agreement was reached, the group was confronted with an
alternative contradicting approach. They were then asked to resolve the contradiction
as a group.
Each student was interviewed 3 times throughout the study. In these interviews the
students were invited to share with the researcher their experiences and feelings
regarding the conflict resolution processes. In addition, a final meeting with all 8
students was held after completion of all tasks. In this meeting, the researcher
discussed with the students the underlying mathematics associated with the
contradictions with which they were presented.
All sessions were videotaped and transcribed. Students' interviews were audiotaped
and transcribed. Students' written solutions to the core parts of the tasks were collected
and analysed.
Research instruments
The central research instrument consisted of the tasks presented to the students.
The Tasks:
Each task had a core part, given at the initial stage. Then, according to the group's
progress, an alternative approach to the problem was introduced, the aim of which was
to evoke conflict when conflict was not encountered spontaneously. In general,
different approaches could arise naturally by group members which could lead to
contradiction. As researchers, we wanted to make sure that if the contradicting
solutions do not appear naturally, we would interfere in this direction.
Task 1:
Core Problem:
Anticipated student solution: Being familiar with students' common errors, we
assumed most of them would raise the two sides of the inequality to the power of 2
without taking into account the signs of the terms, so their solution would probably be
as followed:
Solve the following inequation: xx −≥− 42
63
0)6)(3(
0189
8162
42
2
2
≤≤
≤−−
≤+−
+−≥−
−≥−
x
xx
xx
xxx
xx

Sela & Zaslavsky
PME31―2007 4-172
An alternative (contradicting) Approach: We used the following graphical
representation, which emphasized the fact that the solution is an open range, contrary
to the group's anticipated solution.
Task 3:
Core Problem:
Anticipated Student Solution:
Alternative (contradicting) Approach:
Data analysis
The research follows a qualitative paradigm. Accordingly, the data was analysed
inductively and the categories stemmed from content analysis. First, the group decision
was coded according to correctness of the resolution outcome. Then, the first group
Nurit's solution: 3≥x
Reasoning:
Drawing the graphs of 2,4 −=−= xyxy
indicates the two graphs have one
interception point at 3=x .
For all values of x bigger than 3, the graph of
2−= xy is above the graph of xy −= 4 .
2−= xy
xy −= 4
3
Solve the following equation: 39644 22 =++−+− xxxx
solutionrealNo
xx
xx
xxxx
35
332
3)3()2(
39644
22
22
=−
=−−−
=+−−
=++−+−
Ran's solution: 2−=x
Reasoning:
We have to take into account that 22 )2()2( xx −=− and that 22 )3()3( −−=+ xx .
Though, we have to consider 4 possible cases:
Either 3)3()2( =+−− xx , or 3)3()2( =−−−− xx , or 3)3()2( =+−− xx , or 3)3()2( =−−−− xx
Solving any of these equations and checking whether their solutions solve the original one,
yields that only 3)3()2( =+−− xx fulfils this condition. Its solution is 2−=x , so this is the
solution of the original equation.

Sela & Zaslavsky
PME31―2007 4-173
reaction to the alternative approach was coded. Afterwards we coded the type of group
work, frequency of participation, and finally the point of ending the group session.
FINDINGS
As we assumed, all the students solved Task 1 the same as the anticipated student
solution detailed above, while in Task 3 most of the students solved it as the anticipated
solution. There was one pair who solved it differently. For this pair the researcher
presented first the anticipated solution, and after they agreed with it, she presented the
alternative contradicting approach.
With respect to the group dynamics, for each type of group we identified four main
characteristics in the process of reaching a conflict resolution: three specific to it and
one common to both.
The main characteristics of the dynamics of groups of four:
• The first reaction of the group to the alternative contradicting approach was
denying or rejecting it
Dorit (reacts to the alternative solution of Task 1): It simply looks longer because you have first to look for the slope of each graph, and then the intersection points and then to sketch it, and then [to find] when they are equal…it looks very long.
Alon (reacts to the alternative solution of Task 3): What?! It's not right! It's wrong!
• The group work was characterised by "throwing in the air" suggestions
sporadically by the group members
• One member of the group participated in the group work to a larger extent
than the others. S/he seemed to be the 'leader' of the group: raised more ideas
and was asked mathematical questions by the other members
Main characteristics of the dynamics of groups of two:
• The first reaction of the group to the alternative contradicting approach was
accepting it / justifying it / checking why it is true
Hila (reacts to the alternative solution Task 1): It looks as if the 6 doesn't matter.
Alon (to Hila): So there is a mistake at our solution.
Ido (during the interview): In four, the pressure of the group is more powerful than the contradicting statement.
• The work was characterised by engagement in a meaningful dialog between
the two students. The conversation dealt with broad mathematical concepts
and ideas
• Both students had a similar rate of participation in the dialog
The common characteristic that was identified for both types of groups is connected to
the end of the session. The groups decided to end their work right after one of the
members agreed with the alternative solution. Although it seemed that there were
explanations to be offered and questions to be asked, all of the group members agreed

Sela & Zaslavsky
PME31―2007 4-174
that at this stage the session should end. It seemed that some of them did not
understand the reason for the fault in their solution.
With respect to individual processes, the interviews with the students revealed four
main reflections they shared with the researcher:
• Students had much to say about the difference between working in a pair and
working in a group of four:
o Working in pair was much more demanding for them - they felt more
active and responsible for the process. In a group of four most of them
felt passive and relied on others.
o Working in a pair involved deep thinking, while in a group of four it
seemed superficial work.
o Within a pair they felt the process was more fruitful for them.
Following are excerpts from the interviews which point to the above differences:
Benny: In group of four the work is more social, that's why the work was less deep and demanded less thinking. You have to activate less thinking, because you know there are other active people who think on the same problem. In four there are more people, so I felt I can count on them. In pairs – either she is right or me. In pairs you have to make bigger efforts. I worked with one mate, that's why it demanded more thinking - there is what she says and what I say, so you know that if she says the opposite, one of us is wrong.
Dorit: In pairs everyone thought more deeply. You have to handle the problem more by yourself. There is much work on the individual. There is much more responsibility on every one.
Nili: In four you reach an agreement faster. In pairs it is much harder, because there is none who understands me, and it is slower then in four.
• The students seemed to be bothered by the contradiction. They expressed their
willingness to ask mathematical questions regarding the tasks.
Researcher (to Alon): Do you have questions?
Alon: Yes. Why is our solution wrong?
Researcher (to Hila): Are you satisfied with the resolution you suggested?
Hila: I don't feel totally satisfied with it, because I don't know how it is organized. I don't understand how my way goes with the way you showed us.
• In most cases, regardless of the group size, the students agreed that the
alternative/contradicting approach was the correct one. They were even able
to explain why. However, 7 of the 8 students were not able to find the flaw in
their initial solution.
• Regardless of the group size in which the students worked, at the end of the
study they all expressed scepticism regarding general mathematics tools.
Their confidence in mathematics was weakened.

Sela & Zaslavsky
PME31―2007 4-175
DISCUSSION
As seen by the group dynamics and by the interviews, there are some differences
between the processes of groups of four and pairs.
A decision of a group of four seems to be more powerful than a decision of a pair.
Students in a group of four felt empowered by the group decision, and therefore
rejected the alternative approach, despite its correctness. The same students reacted
differently while working in pairs – they hesitated and checked the alternative
approach carefully.
Another difference concerns the rate of participation of the students. In pairs the rate of
participation was similar to both members, while in groups of four one member took
the 'leadership', and the other members counted on him/her. This could be explained by
the tendency of individuals to reduce their work effort as groups increase in size, a
phenomenon called Social loafing (North, Linley & Hargreaves, 2000; Latane,
Williams & Harkins, 1979).
A third difference concerns the type of group work. While pairs conducted a dialog,
groups of four did not demonstrate an efficient group conversation. We attribute this
finding also to the above tendency of social loafing in big groups. Being one of a pair
forces the individual to take more responsibility than being one of four, and therefore
to react to her/his mate's questions. While in four a question did not address a particular
member, in a pair it did. Ido articulated this idea nicely: “In contrary to the group, in a
pair there is what she says and what I say”.
The common characteristic of group dynamics relates to the end point of the session. In
both group sizes the students ended the session as soon as one of them recognized s/he
understands the alternative solution. This finding supports the claim that experiencing
a cognitive conflict is not enough for constructing new knowledge structures. The
students ended up the group work without fully understanding the mathematical ideas
beyond the task. A direct teaching session is needed in order to complete the learning
process. We indeed conducted a meeting with the 8 students, by which we focused on
the roots of the faults in the students solutions. This lesson was meaningful for the
students and helped them to resolve the conflict they had regarding these two tasks.
References
Balacheff, N. (1991). The Benefits and Limits of Social Interaction: The Case of
Mathematical Proof. In: Alan J. Bishop, Stieg M. & Van Dormolen, J. (Eds.),
Mathematical Knowledge: Its Growth through Teaching (pp. 175-192).
Dordrecht: Kluwer Academic Publishers.
Behr, M. & Harel, G. (1990). Students’ Errors, Misconceptions, and Cognitive Conflict in
Application of Procedures. Focus on Learning Problems in Mathematics, 12, 3 & 4, 75-84.
Berlyne, D. N. (1960). Conflict, arousal, and curiosity. New York : McGraw-Hill.

Sela & Zaslavsky
PME31―2007 4-176
Dreyfus, A., Jungwirth, E. & Eliovitch, R. (1990). Applying the “Cognitive Conflict”
Strategy for Conceptual Change – Some Implications, Difficulties, and Problems. Science
Education, 74, 5, 555-569.
Duffin, J. M. & Simpson, A. D. (1993). Natural, conflicting and alien. Journal of
Mathematical Behavior, 12, 313-328.
Laborde C. (1994). Working in small groups: A learning situation? In: R. Biehler, R. W.
Scholz, R. Straβer, B. Winkelmann (Eds.), Didactics of Mathematics as a Scientific
Discipline (pp. 147-158). Dordrecht: Kluwer Academic Publishers, The Netherlands.
Latane, B., Williams, K., & Harkins, S. (1979). Many hands Make Light the Work: The
Causes and Consequences of Social Loafing. Journal of Personality and Social
Psychology, 37, 6, 822-832.
Leikin, R. & Zaslavsky, O. (1997). Facilitating students’ interactions in mathematics in a
cooperative learning setting. Journal for Research in Mathematics Education, 28(3),
331-354
Movshovitz-Hadar, N. & Hadass, R. (1990). Preservice Education of Math Teachers Using
Paradoxes. Educational Studies in Mathematics, 21, 265-287.
Movshovitz-Hadar, N. & Hadass, R. (1991). More about Mathematical Paradoxes in
Preservice Teacher Education. Teaching & Teacher Education, 7, 1, 79-92.
Mugny, G. & Doise, W. (1978). Socio-cognitive conflict and structure of individual and
collective performances. European Journal of Social Psychology, 8, 181-192.
Niaz, M. (1995). Cognitive Conflict as a Teaching Strategy in Solving Chemistry Problems:
A Dialectic – Constructivist Perspective. Journal of Research in Science Teaching, 32, 9,
959-970.
North, Adrian C., Linley, P. Alex & Hargreaves, David J. (2000). Social Loafing in a
Co-operative Classroom Task. Educational Psychology: An International Journal of
Experimental Educational Psychology, 20, 4, 389-392.
Posner, G. J., Strike, K. A., Hewson, P. W. & Gertzog, W. A. (1982). Accomodation of a
Scientific Conception: Toward a Theory of Conceptual Change. Science Education, 66, 2,
211-227.
Slavin, R. (1995). Research on Cooperative Learning and Achievement: What We Know,
What We Need to Know. Center for Research on the Education of Students Placed at Risk,
Johns Hopkins University.
Swan, M. (1983). Teaching decimal place value - a comparative study of "conflict" and
"positive only" approaches. Shell Centre for Mathematical Education. Nottingham
University.
Tirosh, D. & Graeber, A. (1990). Evoking Cognitive Conflict to Explore Preservice Teachers’
Thinking About Division. Journal for Research in Mathematics Education, 21, 2, 98-108.
Zaslavsky, O., Sela H., & Leron, U. (2002). Being sloppy about slope: The effect of changing
the scale. Educational Studies in Mathematics, 49(1), 119-140.

2007. In Woo, J. H., Lew, H. C., Park, K. S. & Seo, D. Y. (Eds.). Proceedings of the 31st Conference of
the International Group for the Psychology of Mathematics Education, Vol. 4, pp. 177-184. Seoul: PME. 4-177
EXPLICIT LINKING IN THE SEQUENCE OF CONSECUTIVE
LESSONS IN MATHEMATICS CLASSROOMS IN JAPAN
Yoshinori Shimizu
Graduate School of Comprehensive Human Sciences, University of Tsukuba, Japan
The research reported in this paper examined the structure of Japanese mathematics
lessons by analysing the videotaped sequence of ten consecutive lessons in three eighth
grade classrooms participated in the Learners’ Perspective Study. Particular attention
is given to explicit linking within a single lesson and across lessons. The analysis
reveals that multiple lessons are interrelated in the way that mathematical ideas that
appear in the current lesson are connected to students’ experience in the previous or
forthcoming lessons as well as part of the same lesson. The analysis suggests that
mathematics teaching and learning in Japan cannot be adequately represented by the
analysis of a set of distinct lessons and that units of data collection and data analysis
for the study of lessons are crucial for international comparisons.
INTRODUCTION
The Learner’s Perspective Study (LPS) is an international study of the practices and
associated meanings in ‘well-taught’ eighth-grade mathematics in participating
countries (Clarke, Keitel & Shimizu, 2006). The research design in LPS includes
collecting data of a sequence of at least ten consecutive lessons followed by
video-stimulated recall interviews with the teacher andstudents. One of the goals of
LPS is to complement the findings of other international studies such as TIMSS Video
Study (Hiebert et al., 2003, Stigler, Gonzales, Kawanaka, Knoll & Serrano, 1999 )
among others, of classroom practices in mathematics.
In the TIMSS 1995 Video Study, explicit linking in mathematics lessons in Germany,
Japan and the United States was analysed using subsample of 90 lessons. The analysis
showed that the highest incidence of linking, both across lessons and within lessons,
was found in Japanese lessons. Teachers of Japanese lessons linked across lessons
significantly more than did teachers of German lessons, and linked within lessons
significantly more than teachers of both German and U.S lessons (Stigler, Gonzales,
Kawanaka, Knoll & Serrano, 1999).
On the other hand, Stigler and Perry (1988) found reflectivity and coherence in
Japanese mathematics classroom as its distinct characteristics. The meaning they
attached to coherence is similar to that used in the literature on story comprehension.
Explicit reference to the relations among events in lessons is expected to strengthen
coherence of them. As for reflectivity, Japanese teachers stress the process by which a
problem is worked and exhort students to carry out procedure patiently, with care and
precision. The reflection of what has been going on in the classroom is promoted by
explicit linking among experience in lessons.

Shimizu
PME31―2007 4-178
It seems natural for exploring characteristics of Japanese lessons further to examine
occurrences of explicit linking both within and across lessons, for any lessons to be
reflective and coherent the teacher needs to connect or link between students ideas and
experience. Sekiguchi (2006), for example, proposed the framework for analysing
coherence in lessons in which connections among lessons by teacher seems to serve for
maintaining coherence across lessons. Also, examining explicit linking enable us to
understand more about the function of the situation of institutionalisation (Brousseau,
1997) which reveals itself by the passage of a piece of knowledge from its role as a
means of resolving a situation of action, formulation or proof to a new role, that of
reference for future personal or collective uses.
The research reported in this paper examined the structure of Japanese mathematics
lessons by analysing explicit linking in the videotaped sequence of ten consecutive
lessons in three eighth grade classrooms participated in the Learners’ Perspective
Study.
DATA AND METHODOLOGY
Data Collection
The Learner’s Perspective Study (LPS) is a classroom study of videotaped lessons,
specified that the collection of data involved videotaping a considerable number of
consecutive lessons in each school (Clarke, 2006). The technique for undertaking this
research involved the development of complex “integrated data sets” that combined
split-screen video records of teacher and students with transcripts of post-lesson
interviews and copies of relevant printed or written material. The data of this study
includes videotaped classroom data for ten consecutive mathematics lessons and
post-lesson video-stimulated interviews with the teacher and students in each of three
participating eighth grade classes.
Data collection for the current paper included videotaping ten consecutive single
lessons, each ranging in length from between 40 and 50 minutes in three public junior
high schools in Tokyo. The teachers, one female and two males, roughly represented
the population balance of mathematics teachers of the school level. The topic taught in
each school corresponded to the three different content areas prescribed in the National
Curriculum Guidelines; linear functions, plane geometry, and simultaneous linear
equations.
The data from the LPS allowed for analysis of lesson structure of the single lesson as
well as across a number of consecutive lessons. Indeed, design of the LPS, including
the initial choice of participating countries, anticipated the comparison of the LPS
analyses of videos of lesson sequences supplemented by the post-lesson reconstructive
accounts of teachers and students with Stigler and Hiebert’s analyses of the videotapes
of single lessons.

Shimizu
PME31―2007 4-179
Method for analysis
As suggested by the finding of TIMSS Video Study, in Japanese mathematics
classrooms, the teacher may try to explicitly link together ideas and experiences that
she wants her students to understand in relation to each other. This linking can include
current topics to the experience in previous lessons as well as those in the same lesson.
We define explicit linking as an utterance by the teacher (or students) to ideas or events
from another lesson or part of the same lesson Three coders coded a total of thirty
transcriptions from videotaped lessons independently. When discrepancies in coding
among coders appeared, they were resolved by discussions.
RESULTS
Table 1 shows the result of the coding of explicit linking within and across lessons at
each school (J1, J2 and J3 stand for the schools participated). As Table 1 shows, all the
lessons were explicitly linked to other lessons in all schools and most lessons (28
lessons out of 30) were linked to some parts of the same lesson. These results are
consistent with the result of TIMSS Video Study.
School J1 J2 J3
Within lessons 10 9 9
Across the lessons 10 10 10
Table 1: Numbers of lessons that included explicit linking within and across lessons
Explicit linking within lessons
Table 2 shows the result of coding of explicit linking within each lesson in each school
(L1 to L10 stand for the lessons videotaped). More linking were found in some lessons
(e.g., J2-L1 and J3-L2) than others.
Lesson L1 L2 L3 L4 L5 L6 L7 L8 L9 L10 Total
J1 4 5 1 1 5 6 2 2 1 2 29
J2 14 3 4 6 3 0 2 1 5 2 40
J3 2 8 3 4 1 1 2 0 2 1 24
Table 2: Numbers of explicit linking within each lesson
The following example (J3-L3) describes how the teacher at the end of the lesson
emphasizes the importance of what they had done during the lesson.
00:43:08:15 T: Yes, um, today, we will end here but we did something extremely important today. Um, it will have to be next week, solving the equation from KINO's question will have to be next week.

Shimizu
PME31―2007 4-180
00:43:22:13 T: But if we finish up to here, I think you'll be able to solve tons of equation. Check the calculation when you need to and I'll ask you sometimes. I'll ask you to show me how much you can do but is that ok?
00:43:35:18 T: I think we were able to finish just about everything, up to the important ways of thinking of equations. You should be able to solve everything. Ok? Now, I'll give you the rest of the time to jot things down.
In the excerpt of transcription from the J3-L03, in which the students were learning to
solve simultaneous linear equations, the teacher summarized and highlighted what
they had done in the form of general comments. The comments were made at the final
minutes of the lesson. He noted that the class had done “something extremely
important”(00:43:08:15), emphasizing that the students “would be able to solve tons
of equation”(00:43:22:13) and they “should be able to solve everything”
(00:43:35:18). Also, he encouraged the students to “check the calculation when you
need to.”
At the end of the lesson, after some discussions on two alternative ways of check the
solution to the simultaneous linear equations, the teacher strongly emphasized that
what they had done was extremely important. He then asked the students to jot things
down on their notebook. In this case, the teacher appeared to promote students’
reflection on what they had done and on the importance of checking the results. The
teacher pointed out the part of blackboard on which an important idea was described.
Explicit linking across lessons
Table 3 shows the result of coding of explicit linking across lessons in each school.
Several lessons included such an explicit linking between the current lesson and a
lesson outside the sequence. It was similar to the case of linking within lessons, more
linking were found in some particular lessons (e.g., J1-L2, L3 and L7; J2L5, L6 and
L7; J3-L2, L3 and L4) than others.
Lesson L1 L2 L3 L4 L5 L6 L7 L8 L9 L10 Total
J1 3 9 10 2 5 3 11 7 3 3 56
J2 4 2 4 9 14 11 19 5 3 6 77
J3 7 25 18 13 3 2 6 3 2 6 85
Table 3: Numbers of explicit linking across lessons
Lessons often started with teacher’s comment on what they have done in the previous
lesson. Typically, as the following excerpt from J1-L3 shows, the teacher tries to recall
students’ memories on related topics they just finished.
00:01:02:13 T Yesterday, // We had so much work to do in just one class, and rushed through a bit fast.

Shimizu
PME31―2007 4-181
00:01:09:03 T So, let's take a look and try to remember what we did last time, and go over it before we go on.
00:01:06:17 S //I cannot find it. Oh, here it is.
00:01:21:01 T Um, do you all remember the equations, those we talked about in class yesterday, um./
In some cases, the teacher makes explicit linking to the topics taught in the previous
year. The teacher at J3, for example, mentioned to the topic taught in the previous
grade. The topic of lesson (J3-L3) was solving simultaneous linear equations by using
the “method of subtraction”. The teacher mentioned to the students’ experience of
checking the solution of (a single) linear equation with one variable, which was taught
in seven grade.
00:03:11:23 T Well, good morning. Ok, can we start? We're running a bit late because of homeroom. Well, let's go into today's lesson.
00:03:30:28 T [While writing on the blackboard]What I'm going to write now is the number two under the question two that we did yesterday and we're only going to do that now.
00:03:34:29 T I'm only going to write number one, saying, solve the following system of equations. We solved this system of equations yesterday, right?
00:03:51:23 T We were able to get the answer by subtracting from both sides and continuing to solve. And, the answer to this was x is three and y is seven, right? No problems, right?
00:04:13:23 T Compare this with what's written in your notebooks. Ok? And, today, uh, well, let's check to see if these are correct. How should we check these?
00:04:25:18 T Well, the results of your knowledge of equations from first year of junior high will be tested here, the results of your hard studying. I would like to test your memories.
Also, linking between two consecutive lessons was done in another particular way.
Homework was used as the place where the students were supposed to link two
consecutive lessons. Namely, the homework assigned at the end of lessons mostly was
used not just for practicing and reviewing what the students learned, but also the topic
to be discussed at the very beginning of the next lesson. The following excerpt was
from J2-L2.
00:00:31:04 T You all had homework to do last night.
00:00:38:06 T No one could finish it during class time.
00:00:44:02 T So how did you go with that?
00:00:49:04 T Is there anyone who came up with an answer that would like to share it the class? Any volunteers?
00:00:58:20 T So did you give it a try?
00:01:00:17 T Did you manage to figure out which triangle square matches with triangle ABE?
00:01:10:22 T Anyone?

Shimizu
PME31―2007 4-182
00:01:16:00 T Don't be shy!
00:01:21:10 T I'm sure there is someone who got an idea.
00:01:30:04 T [To KAWA] You have something written in your notebook. Can you share it with the class?
00:01:34:19 T Come on!
Thus, explicit linking across lessons was found in several ways. Another important
thing to be noted is about modes of linking. In all three classrooms explicit linking
happened in two ways. One is in “looking back” mode and another is in “preview”
mode. In sum, explicit linking was done in multiple ways.
DISCUSSION
Explicit linking and lesson event
In the TIMSS 1995 Videotape Classroom Study, certain recurring features that typified
many of the lessons within a country, Germany, Japan, or the United States, and
distinguished the lessons among three countries were identified as “lesson patterns”
(Stigler & Hiebert, 1999). The following sequence of five activities was described as
the Japanese pattern: reviewing the previous lesson; presenting the problems for the
day; students working individually or in groups; discussing solution methods; and
highlighting and summarizing the main point.
The analysis of explicit linking serves for understanding the lesson evnts. For example,
Shimizu (2006) identified “Matome”, which means “sum up one’s main point in
conclusion” or “pulling together”, as the specific lesson event type for characterizing
classroom practices. Japanese teachers often organize an entire lesson around just a
few problems with a focus on the students' various solutions to them and they think that
“summing up” is indispensable to any successful lesson in which students’ solutions
are shared and pulled together in light of the goals of the lesson (Shimizu, 1999). Since
the teachers place an emphasis on finding alternative ways to solve a problem,
Japanese classes often consider several strategies. It would be natural for the classes to
discuss the relationships among different strategies proposed from various viewpoints
such as mathematical correctness, brevity, efficiency and so on. The teaching style
with an emphasis on finding many ways to solve a problem naturally invites certain
teacher’s behavior for explicit linking for summarizing purpose.
Explicit linking also seems to correspond to the function of the situation of
institutionalisation (Brousseau, 1997). In the classroom, the solution of a problem, if it
is declared typical, can become a method or a theorem. Before institutionalization, a
student can't make reference to this problem that she knows how to solve. Faced with a
similar problem, she must once again produce the proof. On the other hand, after
institutionalization she can use the theorem without giving its proof again or the
method without justifying it. Institutionalization thus consists of a change of
convention among the actors, a recognition (justified or not) of the validity and utility
of a piece of knowledge, a modification of this knowledge -- which is “encapsulated”

Shimizu
PME31―2007 4-183
and designated -- and a modification of its functioning. Thus to the institutionalization
there corresponds a certain transformation of the common repertoire accepted and
explicitly referenced.
The issue of units of data collection and data analysis
As was the case in the TIMSS Videotape Classroom Study, a research design of the
international comparative study of mathematics lessons may use “lesson” as the unit of
both data collection and data analysis. It is natural that we consider a lesson as a basic
element of practice of teaching and learning. However, a single lesson as a
administrative and organizational unit may not be a meaningful unit from the
participants’ perspectives. For the teacher who plans and controls the teaching unit, in
particular, a single lesson may not be enough for teaching particular topic from a
mathematical point of view or in her educational intentions. The analysis of LPS data
reveals that there are several variations of the pattern in relation to the place of each
lesson in the entire teaching unit.
The analysis described in this paper suggests that process of mathematics teaching and
learning in Japanese classroom cannot be adequately represented by a single lesson
pattern. Elements in the pattern themselves can have different function in the sequence
of lessons. Needless to say, it is an important aspect of teacher’s work not only to
implement a single lesson but also to weave multiple lessons that can stretch out over
several days into a coherent body of unit. Then, if each lesson is analysed as “stand
alone”, it is not possible to capture the dynamics of teaching and learning process.
CONCLUDING REMARKS
The analysis reveals that multiple lessons are interrelated and that the pattern of each
single lesson looks differently when we locate it in the entire teaching unit. The
analysis reported in this paper suggests that mathematics teaching and learning in
Japan cannot be adequately represented by the analysis of a set of distinct lessons. The
result suggests that the units of data collection and data analysis for the study of lessons
are crucial for the international comparisons.
The analysis in this paper demonstrated the richness and potentials of the collected data
as well as strength of the methodology in the Learner’s Perspective Study. A further
study of is needed which explains the influences of linking on students understanding
of mathematical concepts and procedures.
Acknowledgements
The author would like to express his thanks to Taeko Hirai, Yuki Masuda and Kaoru
Matsuda for their work on the analyses reported in this paper.
Footnotes
The research reported in this paper was supported by the research grant (grant ID:
13680195) by the Japan Society for the Promotion of Science.

Shimizu
PME31―2007 4-184
References
Brousseau, G. (1997). Theory of Didactical Situations in Mathematics. Dordrecht: Kluwer
Academic Publisher.
Clarke, D., (2006) The LPS research design. In D. Clarke, C. Keitel &Y. Shimizu (eds.)
Mathematics Classrooms in Twelve Countries: The Insider’s Perspective. Rotterdam:
Sense Publishers.
Clarke, D., Keitel, C. & Shimizu, Y. (2006). The Learners’ Perspective Study. In D. Clarke,
C. Keitel &Y. Shimizu (eds.) Mathematics Classrooms in Twelve Countries: The Insider’s
Perspective. Rotterdam: Sense Publishers.
Clarke, D., Mesiti, C., Jablonka, E. & Shimizu, Y. (2006). Addressing the challenge of
legitimate international comparisons: Lesson structure in Germany, Japan and the USA. In
D. Clarke, J. Emanuelsson, E. Jablonka & I. Ah Chee Mok (eds.) Making Connections:
Comparing Mathematics Classrooms Around the World. Rotterdam: Sense Publishers.
Hiebert, J., Gallimore, R., Garnier, H., Givvin, K.B., Hollingsworth, H., Jacobs, J., Chiu,
A.M.-Y., Wearne, D., Smith, M., Kersting, N., Manaster, A., Tseng, E., Etterbeek, W.,
Manaster, C., Gonzales, P., and Stigler, J. (2003). Teaching Mathematics in Seven
Countries: Results From the TIMSS 1999 Video Study. U.S. Department of Education.
Washington, DC: National Center for Education Statistics.
Sekiguchi, Y. (2006) Coherence of mathematics lessons in Japanese eighth-grade classrooms.
In Novotona, J., Moraova, H., Kratika, M. & Stehlikova, N. (eds.) Proc. of 30th Conf. of
the Int. Group for the Psychology of Mathematics Education, Vol.5, pp. 81-88. Prague:
PME.
Shimizu, Y. (1999) Aspects of mathematics teacher education in Japan: Focusing on
teachers‘ roles. Journal of Mathematics Teacher Education, 2 (1):107-116.
Shimizu, Y. (2006) How do you conclude today’s lesson?: The form and functions of
"Matome" in mathematics lessons. In D. Clarke, J. Emanuelsson, E. Jablonka & I. Ah
Chee Mok (eds.) Making Connections: Comparing Mathematics Classrooms Around the
World. Rotterdam: Sense Publishers.
Stigler, J.W., Patrick Gonzales, Takako Kawanaka, Steffen Knoll, and Ana Serrano (1999)
The TIMSS Videotape Classroom Study: Methods and Findings from an Exploratory
Research Project on Eighth-Grade Mathematics Instruction in Germany, Japan, and the
United States. Washington, DC: U.S. Government Printing Office.
Stigler, J.W. & Hiebert, J. (1999) The Teaching Gap. New York: NY, Free Press.
Stigler, J. W. & Perry, M. (1988). Cross Cultural Studies of Mathematics Teaching and
Learning: Recent Findings and New Directions. In D.A. Grouws & T. J. Cooney (eds.)
Perspectives on Research on Effective Mathematics Teaching. Mahwah, NJ.:Lawrence
Erlbaum Associates & Reston, VA: National Council of Teachers of Mathematics

2007. In Woo, J. H., Lew, H. C., Park, K. S. & Seo, D. Y. (Eds.). Proceedings of the 31st
Conference of
the International Group for the Psychology of Mathematics Education, Vol. 4, pp. 185-192. Seoul: PME. 4-185
ON THE TEACHING SITUATION OF CONCEPTUAL CHANGE:
EPISTEMOLOGICAL CONSIDERATIONS OF IRRATIONAL
NUMBERS
Yusuke Shinno
Graduate School of Education, Hiroshima University
Generally we can point out two different ways in introducing new kinds of numbers as
follows (e.g., Courant & Robbins, 1941/ 1996). The first is to represent a result of
measurement. The second is to solve algebraic equations. However the relation
between the two ways does not still seem to be clear. Although this issue might have
been overlooked in any teaching situations, this can be didactically explicit in the
teaching situation of irrational numbers from the conceptual change perspective. The
purpose of this paper is to derive some didactical implications for a conceptual change
situation by focusing on a knowing of “incommensurability” that can be an essential
aspect of irrationals. For attaining this purpose, the epistemological considerations
take place in three contexts: curricular contents, history and teaching experiment.
CONCEPTUAL CHANGE: A THEORITICAL PERSPECTIVE
Conceptual change theory has been widely used to explain students’ understanding in a series of developmental studies referring to science education (e.g. Posner et al., 1982; Carey, 1985; Hashweh, 1986). This theory was developed by drawing on the philosophy and history of science, in particular Thomas Kuhn’s account of theory change and Imre Lakatos’s work of the scientific research programme. And it mainly used to explain knowledge acquisition in specific domain, with characterizing role of reorganization of existing knowledge in processes of learning. Vosniadou et al. (2001) argued that scientific explanation of the physical world often run counter to fundamental principles of intuitive knowledge, which are confirmed by our everyday experience. Consequently, in the process of learning, new information interferes with prior knowledge, resulting in the construction of synthetic model (or misconception). Similarly, when studying mathematics, in the course of accumulating mathematical knowledge, the students go through successive processes of generalization, while also experiencing the extension of various mathematical systems (Tirosh & Tsamir, 2006, p. 160); the most typical case of such kind of generalization or extension is the number concept (see, e.g., Merenluoto & Lehtinen, 2004). But, on the other hand, there is a general reluctance in philosophy and history of science circles to apply the conceptual change approach to mathematics (Vosniadou & Verschaffel, 2004). As has been discussed in mathematics education domain, we need to take the specificity of
mathematical knowledge into account with a deep epistemological analysis of what the concepts considered consist of as mathematical concepts (Balacheff, 1990, p. 136).

Shinno
PME31―2007 4-186
Generally speaking, ‘the term “conceptual change” embodies a first approximation of what constitutes the primary difficulty. … Hence, there is the emphasis on “change” rather than on simple acquisition. … The “conceptual” part of the conceptual change label must be treated less literally. Various theories locate the difficulty in such entities as “beliefs”, “theories” or “ontologies,” in addition to “concepts.” ’(diSessa, 2006, p. 265). Therefore we may need to identify what is special about the learning and teaching of mathematics in the conceptual change situation, analysing from the different dimensions of mathematical concepts/ knowledge.
The aim of this paper is to present didactical implications for designing the teaching situation of conceptual change by focusing on the irrational numbers as content. In fact, only a few researches on irrational numbers have been reported (Fischbein et al., 1994; Zazkis & Sirotic, 2004). On such background we argue the relation between two different ways in introducing new kinds of numbers: the first is to represent a result of measurement; the second is to solve algebraic equations. As will see later, a knowing of the incommensurability (no common unit between two magnitudes) can be crucial to bridge the two different ways. This issue will be considered or interpreted from the epistemological points of view, discussing three contexts: the curricular contents, history and teaching experiment. Then, in the final place, three items are derived as didactical implications with the help of such considerations.
EPISTEMOLOGICAL CONSIDERATIONS
Issues in the mathematics curricular contents relating to irrational numbers
The significance of irrational numbers as a subject matter can be described as follows: the existence of incommensurable quantity; its admittance and symbolism; curiosity about that the computational rules with infinite non-repeating decimals are available same as with rational numbers; and the rationale of the new number system, so on. Irrational numbers are introduced in the forms of “square root numbers” at lower secondary level (15-year-old students in the case of Japan). In the teaching situation of the square root, it is usually introduced in light of the practical need to express the concrete quantity (magnitude) as well as the teaching situations at the primary school level. For examples, it has been often taken the instructional way for finding out the length of the diagonal of the square, or the side of square having the double area of a given square. Indeed “quantity” is an object of measurement. However a naïve practical conception cannot reach to the essential understanding of the square root because here we deal with “incommensurable quantity” in question. In addition, the teaching situation of irrational numbers can distinguish the situation dealing with the concrete quantity and the situation dealing with the computational rules following introduction of the symbol√. In doing so, it is not just the transition between situations but it is required to prepare mediated activities shifting from concrete/ practical conception to more theoretical/ formal one.
Students come to learn new kinds of numbers as school year advances. The introduction of new numbers must be a purposeful activity to respond to some

Shinno
PME31―2007 4-187
necessities or overcome some limitations. For example, it is explained “the generalization from the natural to the rational numbers satisfies both the theoretical need for removing the restrictions on subtraction and division, and the practical need for numbers to express the results of measurement. It is the fact that the rational numbers fill this two-fold need that gives them their true significance” (my own emphasis) (Courant & Robbins, 1941/ 1996, p. 56). Since primary school year, new numbers emerge from some actions on quantities, that is, the practical need for numbers to represent the results of measurement. Although the need for introducing irrationals can also emerge from some actions on quantities, the object of the actions is “the length of a segment incommensurable with the unit” and its approach comes from responding to the situation that it cannot represent by sub-dividing the original unit. Here we can see the limitation on the measuring approach. Since the awareness of such kind of limitation can lead to the conception of incommensurability, it is necessary as its didactical orientation to prepare some effective activities.
Issues in a historical section
One of the most important dimension of epistemological considerations is to examine why the question of incommensurability arise in the course of history. In this paper the historical examination is to see “the history of mathematics as a kind of epistemological laboratory in which to explore the development of mathematical knowledge”(Radford, 1997, p. 26). This requires us to investigate status of human cognition in confronting with the question in a historical section.
The number theory in ancient Greek is concerning with the mathematics for handling discrete numbers world, such as “figural numbers”. In such a primitive status it is no doubt to see that two segments are commensurable each other. The following statements are described in the modern manner about that (See, more details in Courant & Robbins (1941/1996, pp. 58-59)): In comparing the magnitudes of two line segments a and b, it may that while no integral multiple of a equals b, we can divide a into, say, n equal segments each of length a/n, such that some integral multiple m of the segment a/n is equal to b:
(1) b =m
na
When an equation of the form (1) holds we say that the two segments a and b are commensurable, since they have as a common measure the segment a/n which goes n times into a and m times into b. The totality of all segments commensurable with a will be those length can be expressed in the form (1) for some choice of integers m and n (n≠0).
The situation is, however, by no means so simple. It was getting to be doubtful to the existence of a kind of the segment, according to Boyer (1968), the Pythagorean's successors raised the question of incommensurability in earlier than B.C.410. The Euclid's Elements Book X Def. 1 states that “Those magnitude are said to be
commensurable which are measured by the same measure, and those
incommensurable which cannot have any common measure”(Heath, 1956, p.10). The

Shinno
PME31―2007 4-188
discovery of the incommensurability is one of the most remarkable problems of history of mathematics regarding the disintegration of parallel between the (figural) number and quantity (magnitude) theories (cf. Eudoxus’s theory). We human beings became aware of the world where we can reach only by thought purely (Szabó, 1969/ 1978), but it may be said that this was a product of the Greek intrinsic viewpoint of the academism towards mathematics. Thus it is pointed out that the concept of incommensurability did originate not from the practical source but from the theoretical one (Szabó, 1969/ 1978).
The following statement quoted from Euclid’s Elements Book X Prop. 2 forms a criterion of incommensurable relation: “If, when the less of two unequal magnitudes is
continually subtracted in turn from the greater, that which is left never measures the
one before it, the magnitudes will be incommensurable” (Heath, 1956, p. 17). It has to take into consideration that since the infinite continuable algorithm (so-called Euclidean algorithm) has a purely theoretical characteristic, it cannot be applied to two magnitudes as a practical criterion. Therefore the criterion had never used in any ancient literatures (Szabó, 1969/ 1978). In this context human cognition confronts the discontinuity that, in the case of two incommensurable magnitudes, the magnitudes must exist in theoretical, but they are never realized in practical because of the events only for thought. And it is also pointed out that the internal inspiration looking for a more rigorous mode of thinking arises (Wilder, 1968/ 1987). The new proof technique, namely reductio ad absurdum, was established in this context. Árpad Szabó refers to the proof of the incommensurability between a side of a square and the diagonal, and he emphasizes the connection between the establishment of the new proof technique and the shift to “anti-empirical and anti-intuitive tendency that underlying ancient Greek mathematics” (Szabó, 1969/ 1978).
Issues in teaching-experiment designed for the awareness of incommensurability
The teaching experiment was performed with 9 ninth grade students (15-year-old) in a classroom of a lower secondary school attached to national university in Japan in October 2005. The main question of this teaching experiment is to identify how students can become aware of incommensurability. In relation to such aim the teaching experiment consists of three phases: (i) introducing Euclidean algorithm; (ii) dealing with existence of common measure; (iii) justifying recursive or infinite process of operations. In this report we focus on the phase (iii) because it is the most crucial situation in terms of becoming aware of incommensurability.
The following tasks used in this experiment are relied on the earlier developmental research (Iwasaki, 2004).
Task1: There is a rectangle board 30cm by 42cm. You want to cover it with square tiles,
the size of which must be same and lager as possible as you can. Find the size of
square tiles. Task2: There is a sheet of the A3 standard here. Consider whether you can find the
squares that tessellate the sheet.

Shinno
PME31―2007 4-189
In the phase (i) and (ii), students worked on the task 1 and some extra tasks. They came to know a conception of Euclidean algorithm under a concrete situation of finding the GCD (greatest common divisor) of given two positive integers by folding a sheet and by showing algebraic expressions. In the phase (ii), students recognized the fact that if one finds a remainder then measure the previous measure by the remainder as a new measure, and if one finds no remainder then the algorithm terminates; common measure is found.
In the phase (iii), students worked on the task 2 by applying Euclidean algorithm to a side of square and the diagonal (i.e. in the A3 standard sheet, the larger side is equal to the diagonal of the square with the smaller side). Students developed gradually their activities with the help of some geometrical relationship, which can be illustrated as follows (Fig.1). In doing so, such operative activities could undergo a kind of thought
experiment.
A B
D C
E
F
G
H
1
1
r1
r1
r1
r
1r1
r2
r2
E
F
G
C
Ir2
J
Fig 1: Measuring the diagonal of the square with the side
Consequently, we only need to remark the first three steps of the operative activity. Because, as we can see Fig.1, you start measuring the diagonal of the square (=AC) with its side (=AB), and repeat twice the procedure of subtracting small one from large one, then another smaller square and its diagonal (=IC) will appear. Under the thought experiment, it implies that the procedural can be recursive or infinite process.
1 T (teacher): How much is size of your finding square next?
2 S1 (a student): …[pointed the small square (right isosceles triangle)]
3 T: A side of the square may be ‘c’ following S4’ expressions [See the Appendix]. So, now we found a small square, its side is ‘c’. We don’t prepare smaller sheet for folding anymore, but what does it imply?
4 SS (students): it continues endlessly.
5 T: Endlessly?
6 S2: …Surprising.
7 T: OK, let us reflect why you say it is endless. Explain in your own word.
8 S3: Because the remainders are always made in the constant proportion.
9 T: Anything else?

Shinno
PME31―2007 4-190
10 S4: The square…because if squares are found, then we can always find the right isosceles triangle.
All participating students became aware of the constancy of the procedure though above conversations. At the end, teacher suggested that the continued fraction might be useful for formalizing the operative processes. As a result, we obtained the development of the diagonal (=x) in the general form: (r: remainder)
x =1+ r1 =1+11
r1
=1+1
2+r2
r1
=
…=1+
1
2+1
2+
O 2+rn+1
rn
It is well known that we can obtain an approximate value of the square root of 2 successively using the form above.
DIDACTICAL IMPLICATIONS
Let me summarize the main points that have made. Firstly the curricular contents show that new numbers have been introducing from the practical need in the course of learning, while irrationals tend to be introduced from theoretical need. But there are no didactical opportunities to relate two different ways. Secondly the historical context shows that the discovery of the incommensurability can lead to the theoretical nature of mathematics by establishing the reductio ad absurdum. Thirdly the teaching experiment shows that students can be minimally understood the conception of the incommensurability under the thought experiment. As a result of such consideration, it can be pointed out that as implications for designing the teaching in the conceptual change situation, at least the following three items have to be taken into account.
(1) Questioning, say, is it possible to represent a result of measurement of
incommensurable magnitudes? The numbers that students have already learned can be represented as a ratio of integers, but students may not always be aware of this explicitly. Paradoxically say, the “incommensurable” situation only enables them to be aware of “commensurability”. There is no situation for appreciating the idea of dividing of unit, except for the situation of introducing square root.
(2) Eliminating the tendency to cling to the “concrete”. A conception of numbers clinging to the concrete has been well acting on the old numbers (rationals) in taking into consideration of its existence, and these numbers can become intuitive on the number line. However we should not overlook the following remarks: ‘Nothing in our “intuition” can help us to “see” the irrational points as distinct from the rational ones’ (Courant & Robbins, 1941/1996, p. 60). A practical conception of quantities (magnitudes) involving the concrete cannot be a position to make the incommensurability sense. It will be important to eliminate such a tendency ontologically (it is also discussed in the case of negative numbers in
...

Shinno
PME31―2007 4-191
Hefendehl-Hebeker (1991)). It does not only suggest the instruction of square root numbers by approaching to the existence of solution of x 2
= 2 . As a didactical implication, the tasks used in the teaching experiment can be effective settings for becoming aware of incommensurability. In short, context of justification in the history could be recontextualized into the context of discovery in the classroom.
(3) Shifting on value judgments toward the mathematical knowledge More important point to note is, belonging to ‘meta-mathematical layer’ in Sierpinska & Lerman (1996)’ sense, what we aim at by developing Euclidean algorithm as a learning activity. The interactive activities of operating with folding a sheet and expressing its process have to lead to the activities by the thought-experiment. In doing so, Euclidean algorithm is primitively regarded as a practical method, for applying it to the material (real) objects, measuring the diagonal of square with its side. The view on the method can undergo changes though students’ applying the method and then deriving the theoretical conclusion from its infinite process. This implies students’ seeing as the ideal object. Under the thought-experiment it is expected or required for students to shift their value judgments toward the mathematical knowledge underlying item (1) and (2).
Appendix
The picture shows a student’s writing on the blackboard (T: the diagonal of the square; S: the side of the square; a, b, c, d, e: remainders)
References
Balacheff, N. (1990). Future perspective for research in the psychology of mathematics education. In Nesher, P. & Kilpatrick, J. (eds.), Mathematics and cognition: a research
synthesis by the International Group for the Psychology of Mathematics Education. (pp. 135-148). Cambridge University Press.
Boyer, C. B. (1968). A history of mathematics. John Wiley & Sons, Inc.
Carey, S. (1985). Conceptual change in childhood. Cambridge. MA: MIT Press.
Courant, R. & Robbins, H. (1941/1996). What is mathematics?. Oxford University Press.
diSessa, A. A. (2006). A history of conceptual change research. In Sawyer, R. K. (ed). The
Cambridge Handbook of the Learning Sciences.(pp.265-281) Cambridge University Press.

Shinno
PME31―2007 4-192
Fischbein, E., Jehiam, R., Cohen, C. (1994). The irrational numbers and the corresponding epistemological obstacles. In da Ponte, J. P. & Matos, J. F. (eds.), Proc. 18
th Conf. of the Int.
Group for the Psychology of Mathematics Education, (Vol. 2, pp. 352-359). Lisbon.
Hashweh, M. Z. (1986). Toward an explanation of conceptual change. European Journal of
science education, 8(3), 229-249.
Heath, T. L. (1956). The Thirteen Books of Euclid's Elements. Dover Publications, Inc.
Hefendehl-Hebeker, L. (1991). Negative numbers: obstacles in their evolution from intuitive to intellectual constructs. For the Learning of Mathematics, 11(1), 26-32
Iwasaki, H. (2004). Developing mathematics lessons that encourage students’ awareness of incommensurability: what a student Ta’s activities suggest us for improving our teaching methods, An occasional paper for International Mathematics Education Workshop with
Prof. Dr. E. Ch. Wittmann, Nara University of Education.
Merenluoto, K. & Lehtinen, E. (2004). Number concept and conceptual change: towards a systemic model of the processes of change. Learning and Instruction, 14, 519-539.
Posner, G. J., Strike, K. A., Hewson, P. W., Gertzog, W. A.(1982).Accommodation of a scientific conception: toward a theory of conceptual change. Science Education, 66(2), 211-227.
Radford, L. (1997). On psychology, historical epistemology, and the teaching of mathematics: towards a socio-cultural history of mathematics. For the Learning of
Mathematics, 17(1), 26-33.
Sierpinska, A. & Lerman, S. (1996). Epistemologies of mathematics and of mathematics education. In Bishop, A. et al.(eds.), International Handbook of Mathematics Education, (Part 2, pp. 827-876). Kluwer Academic Publishers.
Szabó, Á. (1969/ 1978). Anfänge der griechischen Mathematik. Budapest: Akademiai Kiado. (Japanese translation in 1978 by Tamagawa University Press)
Tirosh, D. & Tsamir, P. (2006). Conceptual change in mathematics learning: the case of infinite sets (Research Forum), In Novotná, J., Moraová, H., Krátká, M.. & Stehlíková, N. (eds.), Proc. 30
th Conf. of the Int. Group for the Psychology of Mathematics Education,
(Vol. 1, pp. 155-184). Prague.
Vosniadou, S., Ioannides, C., Dimitrakopoulou, A., & Papademetriou, E. (2001). Designing learning environments to promote conceptual change in science. Learning and Instruction, 11, 381-419.
Vosniadou, S. & Verschaffel, L.(2004). Extending the conceptual change approach to mathematics learning and teaching. Learning and Instruction, 14, 445-451.
Wilder, R. L. (1968/ 1987). Relativity of standards of mathematical rigor. In Wiener, P. P. (ed.). Dictionary of the History of Ideas. (Japanese translation in 1987 by Heibonsya)
Zazkis, R. & Sirotic, N. (2004). Making sense of irrational numbers: focusing on representation. In Høines, M. J. & Fuglestad, A. B. (eds), Proc. 28
th Conf. of the Int. Group
for the Psychology of Mathematics Education, (Vol. 4, pp. 497-504). Bergen.

2007. In Woo, J. H., Lew, H. C., Park, K. S. & Seo, D. Y. (Eds.). Proceedings of the 31st Conference of
the International Group for the Psychology of Mathematics Education, Vol. 4, pp. 193-200. Seoul: PME. 4-193
POSING PROBLEMS WITH USE THE ‘WHAT IF NOT?’ STRATEGY IN NIM GAME1
SangHun Song*, JaeHoon Yim*, EunJu Shin*and HyangHoon Lee**
*Gyeongin National University of Education / **Surkchun Elementary School
The purpose of this study is to analyze how promising students in mathematics
change structures or data to pose new problems while they are playing a NIM game.
The findings of this study have led to the conclusions as follows: Some promising
students in the higher level were changing each data component of a problem in a
consistent way and restructuring the problems while controlling their cognitive
process. But students in a relatively lower level tend to modify one or two data
components intuitively without trying to look at the whole structure. We gave 2
suggestions about how to teach problem posing for the promising students.
INTRODUCTION
Problem posing has been noted as meaningful not only because it helps students
better able to solve problems but also it is meaningful by itself (Brown & Walter.
1990, 1993; Kilpatrick, 1987; Polya, 1981; Silver, 1994; NCTM, 2000). Problem
posing usually enable students to reduce the level of anxiety about learning math,
while it also help them foster a greater level of creativity (Brown & Walter, 1990;
English, 1998; Silver, 1994). Generally, there are some strategies necessary to help
students pose new problems: posing of new auxiliary problems, changing of
conditions, or combination and disassembly. Among these strategies, the so-
called ‘What if not?’ strategy suggested by Brown & Walter (1990) is one of the most
widely used strategies. Considering the perceived value of the problem posing, the
purpose of this study is to analyze how to change structures or data on the given set
of problems by using of the ‘What if not?’ strategies when the selected groups of
promising students in math of elementary schools are assigned with a special task in a
NIM game. The analysis is thus designed to help develop the teaching method on
how to effectively lead students to pose new problems by using the ‘What if not?’
strategy. It is also expected to help in drawing out major points of suggestions about
the way to develop teaching and learning materials for the promising students.
THE THEORETICAL BACKGROUND
Meanings of problem posing
Posing problems have been defined in various different ways but with all of them
referring to the same meaning. Kilpatrick (1987) put it as ‘problem formulation’, and
Silver (1994) described it as ‘problem generation’, while Brown & Walter (1990)
referred to it as ‘problem posing’. Kilpatrick (1987) saw it as the strategy for
1 This work was supported by Korea Research Foundation Grant funded by Korea
Government(MOEHRD, Basic Research Promotion Fund) (KRF-2005-079-BS0123)

Song, Yim, Shin & Lee
PME31―2007 4-194
formulating problems. He paid attention that when parts of conditions or the whole
conditions for the given problems is changed, or when problems are revised in
diverse ways, after these problems are formulated, how these changes would impact
the solutions to these problems. Polya (1981) explained the concept of the problem
posing in two different aspects: One is as a means of problem solution, and the other
is to formulate new problems after solving problems. Brown & Walter (1990) said
that by posing new problems in the process of solving problems, students will be able
to re-interpret the original problems, and they will also be able to get a clue on
solving these problems.
It has been found that problem posing would positively impact the development of
children’s creativity for the education of promising students. Two groups of students
with different level of mathematical ability are selected to compare how differently
each group is able to pose the new problems under the ‘research on the promising
students in math’ (Ellerton, 1986; Krutetskii, 1969). Also, problem posing is included
into the test paper (Silver, 1994) that is designed to verify creativity for individuals.
Silver (1994) evaluates fluency according to the number of generalized problems, and
identifies flexibility according to the number of different categories of the newly
posed problems. He, then, interprets the degree of originality according to the degree
of the newness of the proposed solution. This study identified relationship that exists
between the problem posing ability and the degree of students’ creativity, although it
did not elaborate what is the essential nature of the relationship. A study (Ellerton,
1986) finds that the more talented in math a student is, the more likely he is good at
posing new problems. Given these studies, it is assumed that there is a relationship
between the students' ability for posing new problems and the degree of their
creativity and their talent for mathematics.
Stages of posing problems and the ‘What if not?’ strategy
The proposed process of formulating problems by Kilpatrick (1987) consists of
association, analogy, generalization and contradiction. Brown & Walter (1990)
classifies the problem posing stages into two stages of ‘accepting the given problems’
and ‘challenging the given problems’. At the stage of ‘challenging the given
problems’, new questions can be raised by challenging the given problems. Brown &
Walter name such a strategy for posing problems by challenging the given problems
as the ‘What if not?’ strategy. Schoenfeld (1985) and Moses, Bjork, & Golenberg
(1993) suggested how to pose new problems. What all of these proposed strategies
have in common is that they all seek a useful way of discovering solutions to the
problems by changing the scope, their assigned conditions, concerned variables, and
structures of the suggested problems. Brown & Walter use such a strategy to design a
method for posing new problems in a systematic way; Its process is presented as
follows: Choosing a starting point, listing attributes, ‘What-if-not?’ strategy, question
asking of problem posing, analyzing the problem.
There has been a series of precedent studies to discuss problem posing by using
‘What if not?’ strategies. A study (English, 1998) presents an analysis on which

Song, Yim, Shin & Lee
PME31―2007 4-195
processes eight-year-old children undergo when they are assigned to pose problem by
using the ‘What if not’ strategies under the circumstances, which could be either
formal or non-formal context. It raises a diversity of problems by varying conditions
of non-formal questions like space puzzle problem. Lavy & Bershadsky (2003) also
used ‘What if not?’ strategy to study a lot of problems that are generated by
prospective teachers on the basis of the complicated task of space geometry
In this study, the categories of the problems that could be presented through such a
problem posing process are categorized into the data change and question change. It
provides a set of components and hierarchy for the suggested problems category so
that researcher can use them as the basis for analysis on the categories of problems
that are posed by students.
METHODOLOGY
Research Tasks
[Activity 1-1] Seeking strategies for winning the cube-taking game
(Understand the game) Let's make pairs and let's try to find ways to win the game 1.
Game 1: Twenty units of yellow-
coloured tubes are connected
with one unit of black tube. Two students on the rock-scissors-paper method determine
order. Then, students take turns to take from one to three cubes. The student who takes the
last cube is the winner.
Figure 1: Basic task-Problem Level 1 for Nim game
[Activity 2-1](Problem posing) Let's change games in whatever way you'd like to
(example: to modify the game after seeing the original game). Students are assigned to
change the game by changing or adding some conditions for the rule of the game.
Figure 2: Task to pose modified problems for NIM game-Problem Level 1
[Activity 2-2] Creating new rules of the game or posing new problems by modelling
on the demonstrated example of changing problems:
1. (Presented example) Present an example of a new game modified by one student.
(1) Place a black-coloured cube
at the center with 7 yellow cubes
connected on its left side, and 13 red cubes on its right side. (2) Two students will take turn
to take at least one and up to three cube of he same colours. They take cubes from either
right or left side; (3) The student who takes the black cube will be the loser.
2. (Look at the demonstrated case, make their versions of modified game)
Students will get a clue from the demonstrated case of making new games and game
problems. Then they will be suggested to make their versions of modified games.
Figure 3: Task to make modified problems for NIM game- Problem Level 2

Song, Yim, Shin & Lee
PME31―2007 4-196
Tasks were given as Figure 1, Figure 2, and Figure 3. The data components of the
basic task (Fig. 1) are in Table 1, and new games can be made by changing some
components of the given basic task. Other tasks will be imposed on a stage-by-stage
basis at each of the four problem levels as shown in Table 2.
Data components Example in basic task
1. Number of game players 2 persons
2. Number of the given cubes 21 cubes (20 + 1)
3. Number of cubes to take for each turn 1~3 cubes
4. Rule of the game in taking the cube(s) Take turns by rock-scissors-paper
5. Winner of the game Who takes the last cube
6. The shape of arranging cubes Linear
Table 1: Data components to fulfil the basic task
Problem natures Problem
levels Types Direction Number of
given cubes
Number of
taken cubes
Generalization
type
Related
Activity
Task
Number
Concrete One Concrete
(20 units)
Concrete
(1~3 units) Implicit 1-1
Level 1
General One n unit k unit Formal 1-2
Concrete Bi Concrete
(10,10 units)
Concrete
(1~3 units) Implicit 3-1
Level 2
General Bi m, n units k unit Formal 3-2
Concrete Tri-or-
more
Concrete
(3,4,5 units)
Concrete
(1~2 units) Implicit 4-1
Level 3
General Tri-or-
more
l, m, n …
units k units Formal 4-2
Concrete Tri Concrete
(3,4,5 units) Unlimited Implicit 5-1
Level 4
General Tri L, m, n units Unlimited Formal 5-2, 5-3, 6
Table 2: Classification of the problem stages
Research subjects
The information about research subjects is shown in Table 3. They are all elementary
school students (aged 11~12) who receive special education for the mathematically

Song, Yim, Shin & Lee
PME31―2007 4-197
gifted students as supported by the Korean government. They belong to the upper 1%
group in their respective school years.
Collection and analysis of data
In order to analyze the process of how students pose game problems and the results
from them, there is a collection of data that consists of monitoring record, interview
data, video clips (in small group, individuals and entire group), activity data,
dictionary or post-project online assignment material. In order to analyze the newly-
modified problems by students, it uses the Lavy & Bershadsky(2003)'s model that
put the newly-posed game problems into the visualized data codes.
Analysis on hypothesized reaction for codification
DN1 Changing of the numerical value of data: Change the total number of cubes to play
DN2 Changing of the data scope: Change the number of cubes to take for each round (2-3),
in odd numbers or even numbers
DN3 Negating of the numerical value of data: Denial of the rule on the number of players
who can play the game, the number of cubes that are left until the end of the game.
DT1 Changing of the data kind: Change the shape of arranging cubes (in a linear or in a tri-
dimensional form)
DT2 Negating of the data kind: Change in methods of deciding losers, of taking cubes, of
being winner, etc.
DE
Eliminating of one of the data: Remove data components, e.g., remove the rule about
the last cube to take, remove the rule about the order of taking cubes (at random or
adding cubes).
QP Inverting of the given problem into proof problem: Inverting of given problem into
proof problem
QS Changing of another specific question: Change to different game problems (like game
of probability, let's take as many cubes as possible, point-awarding-by-each-cube, etc.
Table 4: Codification of ‘What if not' for basic problems
RESULTS AND DISCUSSION
There is a difference between the Group A/B and Group C. Most of the Group A/B
tend to pay attention to and are interested in the numerical conditions, while the
Group C students tend to take data component-based approach to the problem.
Group Subject students No. Student ID Level
A 5
th or 6
th grade children at the AS Education Office-
affiliated educational institution for gifted children
16
students AS1~AS16 Top 1%
B 5
th or 6
th grade children at the KY Education Office-
affiliated educational institution for gifted children
14
students KY1~KY14
Top 1%
better
C Upper math elementary class in the AJ University
Science Institute for the gifted
9
students AJ1~AJ9
Top
0.01%
Table 3: Research subjects

Song, Yim, Shin & Lee
PME31―2007 4-198
○ related component ● main component
Table 5: Responds by each student in Group C
The Table 5 shows the each student in Group C formulates problems after they are
assigned with the basic task of level 1. Unlike their peers in Group A/B, these
students successfully come up with their version of new games on the level 2 or level
3 categories of problems despite not being presented with an example of the level 2.
Some students(AJ1, AJ2, AJ4) in group C also tend to use switches of certain
numbers or scope of numerical values to fulfil the task of generating new problems,
an elite student(AJ8) is changing one component after another. Even though this way
does not lead them to generate many new problems, it is efficient to formulate
different types. In this case, he said that he would like to pay attention to the data
components intensively. It might be considered the structure of the given task.
Four students(AJ5, AJ6, AJ7, AJ9) generated new problems at the level 2 or level 3
categories of the games by changing both data and structures. They show a diversity
of posing(e.g., changing of numerical value of data, eliminating of one of the data,
changing of the data kind, inverting of given problem into proof problem, and
changing of the specific question) by not only accepting but also challenging the
given components. They also suggest mixed problem several components are related.

Song, Yim, Shin & Lee
PME31―2007 4-199
Figure 4: Changing of
data to a particular data
kind (AJ6, P4)
Figure 5: Inverting the given
problem into proof problem
(AJ6, P1)
Figure 6: Reshaping the
cube's direction into a
four-directional structure
(AJ9, P3)
For examples, the Figure 4 shows a case in which there is a change of data to a
particular data kind. Also it is a case that involves simultaneous changes of diverse
data components from one problem. The most commonly modified data components
after changing of the numerical data value is negation of the data. This is to negate a
particular data kind. From time to time, some students chose to eliminate part of the
data, invert the given problem into proof problem, and change the problem into a
whole new one. Eliminating part of the data is to remove some data components like
the rule about ‘the last cube to take’; or to remove the rule about the order of taking
the cube. The Figure 5 shows an example of inverting of the given problem into proof
problem, which represents a high level of posing problem. An example of changing
structures appears as frequently as the changing of information. The Figure 6 shows
an example of reshaping the cube's direction into a four-directional structure.
CONCLUSIONS AND SUGGESTIONS
Prominent in problem solving is not always guarantees prominent in problem posing.
It is necessary to catch the whole structures and components of the given problems to
pose a new problem. We’ve got 3 findings: (1) Almost promising students got an
accurate grasp of data components of the given problem, and modified one
component after another so that they could produce their own problems that come in
a greater diversity and in an extended scope. (2) A relatively lower level of promising
students tended to modify one or two data components intuitively without trying to
look at the whole structure. This way, they would turn to switchover of numerical
data value like changing numbers or scope of numerical values. (3) The more
promised in posing problem, the more used self-control in the process of problem
posing. This way, they were producing a high level of new problems that near
perfection, even though they did not pose so many problems.
These findings have led to 2 suggestions on the ‘how to teach problem posing' as
follows: (1) It is more desirable to start with an open-ended problem and encourage
to pose problem by generalizing and abstracting mathematical structure, relationship
and patterns, rather than trying to let them solve a higher level of the given problems.
(2) Students need to be encouraged on how to solve their own-posed problems by

Song, Yim, Shin & Lee
PME31―2007 4-200
using not only strategies to solve problem but also their self-control. Even though
there are some cases in which students pose the problems unable to find solutions to
the given problems. Then, they will be able to remodify structure or data component
for their own-posed problems, and will be able to reshape these problems into
mathematically formulated problems that can be solved.
REFERENCE
Brown, S. I. & Walter, I. (1990). The art of problem posing(2nd ED). Hillsdale, NJ:
Lawrence Erlbaum Associates, Publisher.
Brown, S. I., & Walter, M. I. (1993). Problem posing in mathematics education. In S. I.
Brown & M. I. Walter (Eds.), Problem posing: Reflections and application (pp. 16-27).
Hillsdale, NJ: Lawrence Erlbaum Associates, Publisher.
Ellerton, N. F. (1986). Children's made-up mathematics problems: A new perspective on
talented mathematicians. Educational Studies in Mathematics Education, 17, 261-271.
English, L. N. (1998). Children’s problem posing within formal and informal contexts.
Journal for Research in Mathematics Education, 29(1), 83-107.
Kilpatrick, J. (1987). Problem formulating: Where do good problem come from? In A.
Schoenfeld, Mathematical problem solving(pp.123-148). New York: Academic Press.
Krutetskii, V. A. (1969). The structure of mathematical abilities. Vol 2 of Soviet Studies in
the Psychology of Learning and Teaching Mathematics. In J. Kilpatrick & I.
Wirszup(Eds.), Chicago: University of Chicago Press.
Lavy & Bershadsky (2003). Problem posing via “What if not?” strategy in solid geometry:
A case study. Journal of Mathematical Behavior, 22, 369-387.
Moses, B., Bjork, E., & Golenberg, E. P. (1993). Beyond problem solving: problem posing
In S. I. Brown & M. I. Walter (Eds.), Problem posing: Reflections and application(pp.
178-188). Hillsdale, NJ: Lawrence Erlbaum Associates, Publisher.
Polya. G. (1981). Mathematical discovery. John Wiley & Sons, Inc.
Schoenfeld, A. (1985). Mathematical problem solving. New York: Academic Press.
Silver, E. A. (1994). On mathematical problem posing. For the Learning of Mathematics,
14(1), 19-28.
Song, S. H. et al. (2006). A study on the cases of the problem posings which the
mathematically gifted students are made in the NIM game. Journal of Educational
Research in Mathematics, 17(1), 61-76. Seoul Korea: KSESM.

2007. In Woo, J. H., Lew, H. C., Park, K. S. & Seo, D. Y. (Eds.). Proceedings of the 31st
Conference of
the International Group for the Psychology of Mathematics Education, Vol. 4, pp. 201-208. Seoul: PME. 4-201
EMBODIED, SYMBOLIC AND FORMAL ASPECTS OF BASIC
LINEAR ALGEBRA CONCEPTS
Sepideh Stewart & Michael O. J. Thomas
The University of Auckland
Many students find their first experience with linear algebra at university very
challenging. They may cope with the procedural aspects of the subject, solving
linear systems and manipulating matrices, but struggle to understand the crucial
conceptual ideas underpinning them. This makes it very difficult to make progress in
more advanced courses. In this research we have sought to apply APOS theory, in
the context of Tall’s three worlds of mathematics, to the learning of the linear
algebra concepts of linear combination, span, and subspace by a group of second
year university students. The results suggest that the students struggled to
understand the concepts through mainly process conceptions, but embodied, visual
ideas proved valuable for them.
BACKGROUND
The motivation for considering student understanding of linear algebra is well
summed up by Carlson (1993, p. 39),
My students first learn how to solve systems of linear equations, and how to calculate
products of matrices. These are easy for them. But when we get to subspaces, spanning,
and linear independence, my students become confused and disoriented.
Many university teachers will have had a similar experience. Students start well and
cope with the procedural aspects of first courses, solving linear systems and
manipulating matrices, but struggle to understand some of the crucial conceptual
ideas underpinning the material, such as subspace, span, and linear independence,
mentioned by Carlson. The action-process-object-schema (APOS) development in
learning proposed by Dubinsky and others (Dubinsky & McDonald, 2001) suggests
an approach different from the definition-theorem-proof that often characterises
university courses. Instead mathematical concepts are described in terms of a genetic
decomposition into their constituent actions, process and objects in the order these
should be experienced by the learner. For example, there is little point presenting
students with the concept of span if they do not understand linear combination, since
span is an object constructed from the objects of scalar multiple and linear
combination, each of which must be encapsulated from mathematical processes.
Tall and others (Gray & Tall, 1994) have extended these ideas to talk about procepts,
the symbolisation of both a process and an object, so that symbols such as
3v, a1u1 + a2u2 + ...+ anun etc. may be viewed from either perspective. In more recent
developments of the theory Tall has introduced the idea of three worlds of
mathematics, the embodied, symbolic and formal (Tall, 2004). The worlds describe a
hierarchy of qualitatively different ways of thinking that individuals develop as new

Stewart & Thomas
PME31―2007 4-202
conceptions are compressed into more thinkable concepts (Tall & Mejia-Ramos,
2006). The embodied world, containing embodied objects (Gray & Tall, 2001), is
where we think about the things around us in the physical world, and it “includes not
only our mental perceptions of real-world objects, but also our internal conceptions
that involve visuo-spatial imagery.” (Tall, 2004, p. 30). The symbolic world is the
world of procepts, where actions, processes and their corresponding objects are
realized and symbolized. The formal world of thinking comprises defined objects
(Tall, Thomas, Davis, Gray, & Simpson, 2000), presented in terms of their properties,
with new properties deduced from objects by formal proof. This theoretical stance
implies that students can benefit from constructing embodied notions underpinning
concepts by performing actions that have physical manifestations, condensing these
to processes and encapsulating these as objects in the embodied world, alongside
working in the symbolic world and, finally, the formal world. Many linear algebra
concepts have embodied and symbolic representations; in fact several
representations (Hillel, 2000). Thus a linear combination of two vectors may be
experienced as a triangle of vector lines, symbolized as au + bv , a u1,u2,u3( )+ b v1,v2,v3( ),
or otherwise. In linear algebra few students are given time and opportunities to
develop embodied notions of basic ideas that may be considered trivial by the
teacher. The research presented here used a framework (Figure 1) based on genetic
decompositions of linear combination, span and subspace to investigate student
understanding of these concepts and whether embodied constructs are useful. Symbolic World
APOS Embodied World Algebra Matrix
Formal World
Action
Can add multiples of two
given vectors
Can create a new vector
w by, say addition, e.g.
w = 3u + 5u = 8u
Can calculate with linear
combinations, e.g.
Can determine whether a
vector w is a linear
combination of u and v
using row reduction
Process
Can generalise addition of
multiples of vectors
Can think of linear
combinations of vectors
e.g. w = 3u + 5u
without having to
perform operations
Can consider operations on
vectors without performing
them e.g.
Object
Sees resultant as new vector
object and can operate on it
Can operate on a linear
combination e.g.
T(3u + 5v)
Can operate on a linear
combination e.g.
Sees a general linear
combination as an element
of a vector space V
Figure 1. Part of a framework for linear algebra concepts.
METHOD
This research comprised a case study of a small group of 2nd
year 2006
undergraduates at the University of Auckland studying their second general
mathematics course: 40% linear algebra and 60% calculus. The students were offered
M.

Stewart & Thomas
PME31―2007 4-203
two supplementary linear algebra tutorials at the end of the course, 4 days prior to
the examination, taught by the first-named researcher, and attended by ten students.
Prior to the first they were given linear algebra questions to assess their existing
conceptual thinking (see Figure 2 for questions). The tutorials covered the concepts
of linear combination, span, linear independence, subspace, and basis. The aim was
to give students an explanation of these topics including elements of embodied,
symbolic, and formal worlds. For example, linear combinations were presented by
showing embodied, visual aspects of the addition of scalar multiples of directed line
segments, along with algebraic and matrix symbolisations. This was generalised to
describe the notion of span and the two concepts were linked using a variety of
diagrams. In each case the formal definition was given after the symbolic and visual
aspects were addressed. Following the course examination three of the ten students
returned and did a second, parallel test, although a controlled experiment was not
intended, and two of them, students J and Y, were also interviewed. A post-doctoral
mathematics student did the final test for comparison purposes.
RESULTS
Linear algebra is a large subject and we identified the sequence of concepts: vector,
scalar multiple, linear combination, span, subspace, as the initial focus of attention
for the research. Only the last three of these received attention in the course.
Some formatting has been changed.
Figure 2. A selection from the first and second test questions.

Stewart & Thomas
PME31―2007 4-204
Scalar multiple
Question 1 on the test asked the students, given a vector v, to show how to construct
scalar multiples. On the first test, Figure 3 shows that student F has a wrong
embodied conception of scalar multiple, not appreciating that kv is parallel to v for
all k. However, by the second test this has improved and he displays an action
conception of scalar multiple in the embodied world. While only two of his vectors
are shown here (he also drew 2v) he constructed each of them as a separate entity,
each with their own distinct action. In contrast student Y has combined all three
multiples into the same straight line. This gives evidence of the generalization of the
scalar multiple kv of the vector v, and may be described as the embodiment of the
process of scalar multiplication. The straight line itself can be seen as the
encapsulation of this process into an object-like ‘kv’. Each of the students was able
to use the symbolic world to represent the vectors as 3v, 1/3v, and –3/2v, etc.
Student F (Pre) Student F (Post) Student Y (Post)
Figure 3. Action and process embodied perceptions of scalar multiple.
Linear combination
In question 3 the students were asked to describe in their own words what they
thought a linear combination is. Student J is unsure and describes it (first test) as “A
vector can be present as a relationship between other 1 or more vectors”, and in the
second test the ‘relationship’ is expounded as “One vector is the combination of the
others”. In her interview she also seemed confused, and when asked what a linear
combination is, she said “Ok, linear combination, for example, ah, eh.. is a hmm, it’s
kind of vector equation and I think the linear combination is like that. Is one or two
vectors are independent, they are form a plane or space”. When asked for an example
she gave two vectors (1, 0, 1) and (–1, 0, –1) with the second a multiple, –1, of the
first. Student F also had problems. Unable to answer in the first test he resorts to a
procedural, or action, explanation in the second test, “Linear combination is looking
for whether the last column is composed by another two columns after reduction
raw.” In contrast, Student Y uses the symbolic world for his first test answer, in a
structural, proceptual form xv + yu (Figure 4a), and in the second test gives the only
glimpse of an embodied view, saying that “several linearly independent vectors
combined together form a line, plane”. In his interview he struggled to try and recall
both a symbolic form and a learned definition:
Y: I can’t quite remember the definition, I can just remember those forms something like
b = x1v1+ x2v2… Linear combination is an object class in a space formed by the two
vectors and x, y are scalars, this is my understanding of linear combination.

Stewart & Thomas
PME31―2007 4-205
The post-doctoral respondent was clearly thinking in the formal world and gives a
‘standard’ kind of definition (Figure 4b).
Figure 4. Symbolic and formal descriptions of linear combination.
Asked to construct a diagram to represent a linear combination in question 4,
students J and Y had no problem, showing the parallelogram and construction lines
(Y’s in Figure 5a). This is at least an action conception in the embodied world, and
suggests a process view. Student F on the other hand has some idea of what to do but
has apparently focussed on a recalled embodied relationship rather than the
construction. In the first test (Figure 5b) he didn’t keep the vectors in the same
direction as those given, but this was corrected in the second test (Figure 5c),
although his vectors don’t form a parallelogram with c, and it seems this information
is not part of his embodied schema for linear combination.
a b c
Figure 5. Symbolic and formal descriptions of linear combination.
Question 11 was designed to see whether the students could link a concept across the
visual and symbolic representations. A process perspective on linear combination in
the symbolic world should enable one to take the generalised symbolic form of linear
combination c1v1+ c2v2 given in this question and reason on its possible embodied
implications. This proved too difficult for student F, who we have already seen is
mostly at an action-process conception of linear combination. Student J also failed to
answer the question, but did try to link the information to the matrix representation
that she presumably felt more comfortable with (Figure 6a). Student Y was able to
link to the embodied, visual representation (see Figure 6b). In the first test he
explained that the ‘space’ formed by v1 and v2 has to contain the z-axis.
a b
Figure 6. Symbolic and embodied perspectives for linear combination.
The three cases in the diagrams show an embodied understanding of what is required
even though precise ideas of span or subspace are not used, and no line or plane is

Stewart & Thomas
PME31―2007 4-206
mentioned. This approach contrasts with that of the post-doc, who used the higher
level concept of span to write that “Non-trivially if Span(v1, v2) contains the z-axis”.
A key identifying characteristic of an object view of a symbolism (procept) is
whether one can operate on the object, as symbolised. In question 13 both J and Y
tackled k(c1v1+c2v2)+m(c3v1+c4v2) using process knowledge in the symbolic world,
multiplying out the brackets and collecting terms (J’s in Figure 7). However, in the
post-test, Y stated that the result was “Still a linear combination of v1 and v2.”, seeing
the structure of the result of his symbolic manipulations.
Figure 7. Process working in the symbolic world for linear combination.
Span and subspace
Student F struggled to describe the concepts, writing nothing in the first test and for
span in the second test he wrote “Span is used to collect vectors that those vectors
have taken E-value.” J similarly did not write anything the first time but in the
second test she displayed an embodied notion of span, saying “the plane that vectors
form.” Y wrote “Span is some vectors form a basis. i.e. {v, u}”, but then wrote
nothing for basis, and this was added to slightly in the post-test with “span: several
linearly independent vectors form the basis.” In the interviews J was unclear, saying
“Span, ..hmm…I think if there are independent vectors formed a plane, it’s uh..
infinite, like if there are 3 or 4 more two vectors form a basis yeah, yeah.” but Y
seemed to have a better understanding of span, not based on a definition, but an
embodied view:
Y: I forgot the definition but my understanding of span is…it’s like little module of that
space, subspace, 3-D like this, and the two vectors form a little plane, and those two
vectors in this plane. This plane is a subspace of R3, …Span is a little module of the
subspace. The general form, something like linear combination.
It was clear that the concept of span was not well understood, and only the post-doc
was able to link span to linear combination, and to generalise, stating that it “…is the
set of all linear combinations of v1…vn”. This shows the power of his formal world
thinking, which was linked to a symbolic form. Only Y and the post-doc attempted
subspace, with Y giving some embodied ideas, “Subspace is something like, if in a
3-d space, a plane, a line, 0, or itself, all can be a subspace”, but did not mention the
need for the lines or planes to pass through the origin.
Question 7 was directed at identification of a subspace in R3, although interpretation
of the third picture proved problematic. Student F wrote nothing in the first test for
this question, but in the second gave the second picture as a subspace since “Those
vectors being contained by same plane.” J described both of the planes as subspaces
in the first test but changed this in the second to say, correctly, that the second was

Stewart & Thomas
PME31―2007 4-207
not a subspace; no reason was given in the test, but in the interview this was clarified
“And this one before the tutorial I think is a subspace after the tutorial I think is not a
subspace… because it looks like this plane is not like this one [referred to the first
picture] from the origin.” Y chose only the first plane as a subspace in both tests,
saying “Those vectors form a plane in a 3-D space. A plane is a subspace of 3-D
space.”, and “this is a subspace. It is a plane in a 3-D space.” It is not clear whether
this confirms his idea above that any line or plane could be a subspace, since he
rejected the second plane without reasons. When asked about the question in the
interview his reply showed confusion over vectors not from the origin “Subspace is
from the.. It’s formed by those two vectors. And the second graph.. this looks odd,
because they are not from the origin. Only the post-doc correctly identified the
answers, with reasons in the test: “Subspace, since it is a plane containing the origin”
and “Not a subspace – since it does not contain the point (0, 0, 0)”, but it seems that J
had the embodied idea after the tutorials. The purpose of question 10 was to
ascertain if links between concepts were being made. Students F and J wrote nothing
in either test for this, although when pressed in the interview J showed she is moving
towards some embodied understanding “Linear.. it means the two vectors are linearly
independent, if you look at span like a subspace and the set of all linear combinations
lies on the span and also lies on the subspace, or they form”.
Figure 8 shows Y’s answers in both tests. In the first test (top) he still links span to
basis, and has an embodied view of both subspace and the set of linear combinations,
but in the second test he is much more able to link these concepts together, although
not as succinctly as the post-doc who wrote “(a) and (c) are obviously the same since
they both describe the plane generated by v1, v2.” In his interview Y was able to
express the problem he was having with relating the three concepts:
Y: Span and subspace…those two are related together, and if we call subspace W…and
those vectors are the span, because those vectors formed that subspace…Linear
combination, yeah, this question confuses me. How do we distinguish between linear
combination and subspace?
Figure 8. Y’s improving links between span, subspace and linear combination.
He sees the span of three vectors in R3 as always forming a subspace, since position
vectors always go through the origin, but can’t link to linear combination.

Stewart & Thomas
PME31―2007 4-208
CONCLUSIONS
This research confirms the idea that some students struggle with basic linear algebra
concepts such as linear combination, span and subspace. It seems to us, on the basis
of limited data, that the use of embodied notions in the tutorials helped. We asked
the students if this was the case and how they would explain some of the ideas to
others. J was very clear that a visual, embodied approach had greater value for her
than beginning with definitions: J: Basically when I was in lecture I mixed up. All the relationship between definitions of
subspace linear comb….But when I came to your tutorial there was some graphs and also
very clear explanation that helped me to understand…And if I become a tutor I teach as
your way, first I...graph them, not the definition, I think its too difficult to understand,
makes them confused.
Y agreed “First give them a picture and start from something in the real life, not from
the maths because students are just started studying maths, they couldn’t understand
definitions.” Commenting on appreciation of the tutorials F and J wrote “F: It was
really helpful to understand the basic of concept. When I began reviewing without
tutorials, I could do any question about that part.”, “J: It’s quite helpful. It clarifies
my confusion of theories…such as basis, subspace, span-- which I confused through
the semester.” We continue to construct the framework, based on APOS theory and
the three worlds of thinking, which presents embodied, symbolic and formal
experiences that students could have with linear algebra concepts. Further research is
under way to examine the value of the framework in learning.
REFERENCES Carlson, D. (1993). Teaching linear algebra: Must the fog always roll in? In D. Carlson, et al.
(Eds.), Resources for teaching linear algebra, (Vol. 42, pp. 39-51). MAA Notes.
Dubinsky, E. & McDonald, M. (2001). APOS: A constructivist theory of learning. In D.
Holton (Ed.) The Teaching and Learning of Mathematics at University Level: An ICMI
Study (pp. 275–282). Dordrecht: Kluwer.
Gray, E. & Tall, D. O. (1994). Duality, ambiguity & flexibility: A proceptual view of simple
arithmetic, Journal for Research in Mathematics Education, 26, 115–141.
Gray, E. & Tall, D. O. (2001). Relationships between embodied objects and symbolic
procepts: An explanatory theory of success and failure in mathematics, In M. van den
Heuvel-Panhuizen (Ed.) Proceedings of the 25th Conference of the International Group
for the Psychology of Mathematics Education, Utrecht, Netherlands, 3, 65–72.
Hillel, J. (2000). Modes of description and the problem of representation in linear algebra,
In J.-L. Dorier (Ed.) The Teaching of Linear Algebra in Question (pp. 191–207),
Dordrecht, Netherlands: Kluwer Academic Publishers.
Tall, D. O. (2004). Building theories: The three worlds of mathematics. For the Learning of
Mathematics, 24(1), 29–32.
Tall, D. O. & Mejia-Ramos, J. P. (2006). The long-term cognitive development of different
types of reasoning and proof, Conference on Explanation and Proof in Mathematics:
Philosophical and Educational Perspectives, Essen, Germany.
Tall, D., Thomas, M. O. J., Davis, G., Gray, E. & Simpson, A. (2000). What is the object of
the encapsulation of a process? Journal of Mathematical Behavior, 18(2), 223–241.

2007. In Woo, J. H., Lew, H. C., Park, K. S. & Seo, D. Y. (Eds.). Proceedings of the 31st Conference of
the International Group for the Psychology of Mathematics Education, Vol. 4, pp. 209-216. Seoul: PME. 4-209
THE APPLICATION OF DUAL CODING THEORY IN
MULTI-REPRESENTATIONAL VIRTUAL MATHEMATICS
ENVIRONMENTS
Jennifer M. Suh and Patricia S. Moyer-Packenham
George Mason University
This mixed method study compared mathematics achievement in two third-grade
classrooms using two different representations, virtual and physical manipulatives, in
the study of rational numbers and algebraic concepts. The research employed a
within-subjects crossover repeated measures design, and included the examination of
quantitative and qualitative data. Results showed statistically significant differences in
student achievement in favor of the virtual manipulative treatment for fraction
concepts. An analysis of students’ representations showed evidence of pictorial and
numeric connections among the student work, indicating that the
multi-representational presentation of the fraction addition process activated
interconnected systems of coding information.
The use of and ability to translate among multiple representational systems has been
shown to influence students’ abilities to model and understand mathematical
constructs (Cifarelli, 1998; Fennell & Rowan, 2001; Goldin & Shteingold, 2001;
Lamon, 2001; Perry & Atkins, 2002). This ability requires the learner to use various
cognitive structures for processing a variety of inputs during learning. The purpose of
this paper is to examine the application of Dual Coding Theory (Clark & Paivio, 1991)
in multi-representational virtual mathematics environments. In particular, the present
study investigated the nature of learners’ algorithmic thinking processes as they
explored mathematical tasks with dynamic electronic objects, or virtual manipulatives
(Moyer, Bolyard & Spikell, 2002).
THEORETICAL FRAMEWORK
Cognitive science has influenced educational research by proposing theoretical models
that explain the encoding of information among representational systems. Dual Coding
Theory (DCT), proposed by researchers in the field of educational psychology and
based on Cognitive Information Processing Theory, is the assumption that information
for memory is processed and stored by two interconnected systems and sets of codes
(Clark & Paivio, 1991). These sets of codes include visual codes and verbal codes,
sometimes referred to as symbolic codes, which can represent letters, numbers or
words. According to the theory of Dual Coding, when learners are presented with both
visual and verbal codes, which are functionally independent, this has additive effects
on their recall. Rieber (1994) reports that it is easier to recall information from visual
processing codes than verbal codes because visual information is accessed using
synchronous processing, rather than sequential processing. Due to these processes

Suh & Moyer-Packenham
PME31―2007 4-210
effects, researchers have applied DCT to literacy and multimedia. Rieber notes,
“adding pictures (external or internal) to prose learning facilitates learning, assuming
that the pictures are congruent to the learning task,” and, “children do not
automatically or spontaneously form mental images when reading” (1994, p.141).
Based on premise of DCT, Mayer (1992) described an instructional design principle
called the contiguity principle. This principle purports that the effectiveness of
multimedia instruction increases when verbal codes (i.e., letters, numbers, and words)
and visual codes (i.e., pictures) are presented simultaneously. In the field of
mathematics, Clark and Campbell (1991) employed DCT to develop a general theory
of number processing. The theory emphasizes the concrete basis of number concepts
and the role of associative imagery in performing numeric operations. The most basic
application of DCT is used when teaching children the names of numerals and their
meanings by associating the numerals with groups or pictures of objects. Pyke’s (2003)
use of DCT to study the effects of symbols, words and diagram on eighth grade
students, engaged in a problem solving tasks, showed that students’ use of different
representations contributed to the variety of strategies used to solve the task and
revealed different kinds of cognitive processes.
When we consider the physical and mental operations involved in using a virtual or
physical manipulative, we must be mindful of the cognitive load imposed on the
learner. Ball (1992) expressed this caution when she wrote that students do not
automatically make connections between actions with physical manipulatives and
manipulations with the symbolic notation system. Kaput’s (1989) explanation for this
disconnect was that the cognitive load imposed during physical operations was too
great for learners. In essence, learners are unable to track their actions during physical
operations and connect these actions to the manipulation of symbols. The application
of DCT to the use of virtual and physical manipulatives was the focus of the present
study. In particular, we examined the representational connections between visual and
verbal/symbolic codes and its effect on the learners’ understanding of mathematical
concepts and demonstration of the algorithmic process.
METHODOLOGY
Procedures
The present study employed a within-subjects crossover repeated measures design to
examine the research questions (Campbell & Stanley, 1963). All subjects participated
in both treatments using virtual and physical manipulatives, which allowed each
student to serve as his or her own comparison during the analysis. To avoid any
residual effects, researchers introduced two different mathematics units, fractions and
algebra, as the topics of study. Researchers chose concepts traditionally taught using
algorithms (i.e., adding fractions with unlike denominators and balancing equations) to
examine the ways in which the manipulative representations served as conceptual
supports for learners in understanding how and why algorithmic procedures work.

Suh & Moyer-Packenham
PME31―2007 4-211
The participants in this study were 36 third grade students in two classes at the same
elementary school. The student demographics included 83% White, 11% Asian, 3%
African American, and 3% Hispanic. There were 22 males and 14 females. Students at
this school were placed in mathematics achievement groups through standardized
testing methods. The students selected for this study were in the middle achievement
group working on a third-grade level in mathematics. Intact classes were randomly
assigned to two treatment groups.
In the first phase of the study, Group One participated in fraction lessons using
physical manipulatives, while Group Two participated in fraction lessons using virtual
manipulatives. In the second phase, each group received the opposite treatment
condition. That is, Group One received algebra instruction using virtual manipulatives,
and Group Two received algebra instruction using physical manipulatives. A pretest on
fraction and algebra concepts was administered at the beginning of the study. Students
learned fraction content using virtual or physical manipulatives during the first unit.
During the second unit on algebra, students switched treatment conditions and learned
algebra content. Researchers administered posttests on fraction and algebra content at
the end of each unit.
The data sources used in this study were both quantitative and qualitative. The
quantitative data included the pre- and post- content test scores. The
researcher-designed tests contained three sections with a total of 20 items. The first
section included dual-coded items which were presented using pictorial and numeric
representations (See figure 1, item 1 and 2). The second section contained single-coded
items with numeric representations only (See figure 1, item 3 and 4). The third section
included two word problems which asked students to draw a picture, represent the
problem with a number sentence, and explain solution strategies using words.
3) 2/4+3/8=
4) 2/5+3/10=
Figure 1. Examples of dual-coded (pictorial and numeric) and single-coded (numeric
only) test items.
The qualitative data included field notes, students’ written work, student interviews,
and classroom videotapes. Students’ written work contained drawings, solution
procedures, and numeric notations. These qualitative data were examined and
categorized along dimensions of students’ solution strategies. Student interviews, field
notes, and classroom videotapes were used to examine the representations that students

Suh & Moyer-Packenham
PME31―2007 4-212
used to solve problems in both treatment environments. The qualitative results allowed
researchers to further examine and interpret the results of the quantitative findings.
RESULTS
The results of all tests were entered into SPSS and descriptive statistics for each
treatment group are presented in Table 1.
Group 1:
Pretest
Group 1:
Posttest
Group 2:
Pretest
Group 2:
Posttest
Physical Virtual
Fraction 12.50
(SD=15.00)
45.55
(SD=17.05)
13.00
(SD=14.50)
75.55
(SD = 19.91)
Virtual
Physical
Algebra 30.00
(SD=12.00)
83.33
(SD = 14.34)
22.00
(SD=14.00)
80.00
(SD = 20.16)
Table 1. Pretest and Posttest Means by Treatment Type and Mathematics Content
(N=36)
The results showed that students from both conditions had very little prior knowledge
on either topic (fractions or algebra), with no significant differences between the two
groups in terms of achievement at the beginning of the study. Posttest scores indicated
differences among the groups and an ANOVA was performed for further analysis.
Results from the ANOVA produced a significant main effect for manipulative types,
F(3,68) = 15.03, p < .001, indicating that students’ scores depended on the
manipulative type they used. Results from the ANOVA also produced a significant
main effect for mathematics concept, F(3,68) = 24.11, p < .001, indicating that students
performed significantly better on the algebra posttests than the fraction posttests. There
was a significant interaction effect, F(3,68) = 9.62, p< .01, indicating that the effect of
the manipulative treatment on the dependent variable was different depending on the
mathematics content. The Bonferroni multiple comparison test indicated that
significant results existed between Group One when they used the physical fraction
treatment compared to the other three treatments.
To further understand the physical fraction treatment results, researchers analyzed
learners’ performance on the individual test items. For this investigation, we applied
the framework of Dual Coding Theory to examine the single-coded and dual-coded
representational test items focusing on fractions only. Results of this analysis are
presented in Table 2.

Suh & Moyer-Packenham
PME31―2007 4-213
Performance on the
Representational
Test Items (I)
Performance on the
Representational Test
Items (J)
Mean
Difference
(I-J)
p
PM Dual Coded PM Single Coded 36.11 .001***
VM Dual Coded -27.77 .033*
VM Single Coded -12.50 1.00
PM Single Coded PM Dual Coded -36.11 .001***
VM Dual Coded -63.88 .000***
VM Single Coded -48.61 .001***
Note. PM = Physical Manipulative; VM = Virtual Manipulative
* p <.05. **p<.01. p<.001***
Table 2: Bonferroni Post Hoc by Fraction Treatments and Coding of Test Items
Results showed several significant differences among the dual- and single-coded test
items in the two treatment environments. Participants in the physical manipulatives
(PM) treatment group scored higher on the dual-coded test items (which included both
visual and numeric information) than on the single-coded test items (which included
only numeric information). The second row of the table shows that the PM group
performed significantly lower on the single coded numeric items compared to all other
fraction test items in both groups. Although, the PM group performed better, overall,
on the dual-coded items than the single-coded items, the virtual manipulatives (VM)
treatment group performed significantly better on all test items than the PM group.
Based on these statistical results, we further examined the qualitative data to determine
the possible sources of these differences. On the fraction posttest, Group One (PM
treatment) relied more on pictures to solve the single-coded items, but found this
strategy limiting when they encountered more complex fraction test items that were
difficult to illustrate. For example, in the problem ¼ + 1/5, where both fractions are
renamed before being added, drawing these two fractions as common fractions was not
intuitive.
In contrast with Group One, students in Group Two (VM treatment), showed an
algorithmic approach in their written work when presented with complex fraction test
items. Group Two demonstrated an understanding of the algorithmic process of
renaming and combining like fraction denominators. In fact, this was a process that
was modelled on the virtual fraction applet using the linked representation feature of
the applet. Most students who successfully answered the numeric fraction test items in
the VM treatment changed the unlike fractions as in the following example (e.g. 3/4+
1/8= 6/8 + 1/8= 7/8). In addition, there was a marked difference in students’
explanations of their solutions on the word problems. Most students in Group One
(PM) explained their process using a picture to illustrate the problem. One student
explained, “I drew a picture and took the half and I put it in the third.” Although, the

Suh & Moyer-Packenham
PME31―2007 4-214
student obtained the correct answer, there was no evidence of the renaming process in
the student’s work. In contrast, most students in Group Two (VM) drew pictures, wrote
the correct number sentence, and used a formal algorithmic approach to solve the
problems. Some examples of their explanations are shown in Figure 2.
• “I said to myself 2, 4, 6 and 3, 6, 9 and got my common denominator.”
• “I found a multiple of 2 and 3.”
• “I multiplied the [number of divided parts] by 2 for 1/3 which equals 2/6 and I
divided 6 in half which is 3/6 and then I added 2/6 and 3/6 which equals 5/6.”
Figure 2. Examples of solution strategies from students in the VM treatment group.
Results from the test items suggest that students performed better when test items were
presented using dual codes. The visual imagery combined with the symbolic notations
may activate and provided access to knowledge for the learner that was stored in the
brain in an interconnected system. Providing test items that use both types of codes
may have supported the learners’ ability to access this information.
CONCLUSIONS
Kaput(1992) stated that constraint-support structures built into computer-based
learning environments “frees the student to focus on the connections between the
actions on the two systems [notation and visuals], actions which otherwise have a
tendency to consume all of the student’s cognitive resources even before translation
can be carried out”(p.529). In the present study, the multi-representational
environment of the virtual fraction applet was designed in such a way that it allowed
learners to focus on these connections. The dual-coded virtual fraction environment
offered many meta-cognitive supports, such as recording users’ actions and
transforming numeric notations. This enabled learners to reallocate their cognitive
resources to activity focused on observation, reflection, and connection. In the physical
fraction environment, learners’ cognitive resources were expended by keeping track of
fraction pieces, finding equivalent fraction denominators using an equivalence mat,
and recording notations on paper, thereby reducing their cognitive efficiency. This may
have led to cognitive overload for the students in the physical environment.

Suh & Moyer-Packenham
PME31―2007 4-215
The virtual fraction applet environment also included a feature that presented pictures
and numeric representations contiguously on the computer screen, a feature not
available during the presentations in the physical fraction environment. This variety of
representations and learners’ opportunities to translate among them may have
contributed to their learning in the virtual environment. For example, the Translation
Model (Lesh, Landau, & Hamilton, 1983) suggests that experience in different modes
is important for understanding mathematical ideas, because when learners reinterpret
ideas from one mode of representation to another, they make conceptual connections.
This study suggests that dual-coded representations in virtual manipulative
environments, that combine visual images with symbolic notation systems, have the
potential to be effective in teaching mathematical processes. In particular, the method
of using dual-coded representations may aid in the learning of complex algorithmic
processes by assisting the learner in interpreting and storing the information presented
through both visual and verbal codes.
References
Ball, D. L. (1992). Magical hopes: Manipulatives and the reform of math education.
American Educator, 16(2), 14-18, 46-47.
Borenson, H. (1997). Hands-On Equations® Learning System. Borenson and Associates.
Campbell, D. T. & Stanley, J. C. (1963). Experimental and quasi- experimental designs for
research. New York: Houghton Mifflin Company.
Cifarelli, V.V. (1998). The development of mental representations as a problem solving
activity. Journal for the middle grades-Level 1.Dubuque, Iowa: Kendall/Hunt.
Clark, J.m. & Campbell, J. I. (1991). Integrated versus modular theories of number skills and
acalculia. Brain and Cognition, 7, 204-239.
Clark, J.M. & Paivio, A. (1991) Dual coding theory and education. Educational Psychology
Review, 71, 64-73.
Fennell, F., &Rowan, T. (2001). Representation: An important process for teaching and
learning mathematics. Teaching Children Mathematics, 7(5), 288-292.
Goldin, G., &Shteingold, N. (2001). Systems of representations and the development of
mathematical concepts. In A. A. Cuoco & F.R. Curcio (Eds.), The roles of representations
in school mathematics (pp.1-23). Reston, VA: National Council of Teachers of
Mathematics.
Kaput, J. (1989). Linking representations in the symbol system of algebra. In C. Kieran &
S.Wagner (Eds.), A Research Agenda for the Learning and Teaching of Algebra. Hillsdale,
NJ: Lawrence Erlbaum.
Kaput, J. (1992). Technology and mathematics education. In D. A. Grouws (Ed.), Handbook
of research on mathematics teaching and learning (pp. 515-556). Reston, VA: National
Council of Teachers of Mathematics.

Suh & Moyer-Packenham
PME31―2007 4-216
Lamon, S. (2001). Presenting and representating from fractions to rational numbers. In A. A.
Cuoco & F. R. Curcio (Eds.), The Roles of Representation in School Mathematics, 2001
Yearbook (pp. 146-165). Reston, VA: National Council of Teachers of Mathematics.
Lesh, R., Landau, M. & Hamilton, E. (1983). Conceptual models in applied mathematical
problem solving research. In R. Lesh & M. Landau (Eds.), Acquisition of Mathematics
Concepts & Processes (pp. 263-343). NY: Academic Press.
Mayer, R.E. (1999). Research –based principles for the design of instructional messages: the
case of multimedia explanations. Document Design, 1, 7-20.
Moyer, P. S., Bolyard, J. J., & Spikell, M. A. (2002). What are virtual manipulatives?
Teaching Children Mathematics, 8(6), 372-377.
Perry, J.A., & Atkins, S.L.(2002). It’s not just notations: Valuing children’s representations.
Teaching Children Mathematics, 9(4), 196-201.
Pyke, C. L. (2003). The use of symbols, words, and diagrams as indicators of mathematical
cognition: A causal model. Journal of Research in Mathematics Education, 34(5),
406-432.
Rieber, L.P. (1994) Computers, Graphics and Learning. Madison, WI: WCB Brown &
Benchmark.

2007. In Woo, J. H., Lew, H. C., Park, K. S. & Seo, D. Y. (Eds.). Proceedings of the 31st
Conference of
the International Group for the Psychology of Mathematics Education, Vol. 4, pp. 217-224. Seoul: PME. 4-217
INTERACTIONS BETWEEN TEACHING NORMS OF
TEACHER’S PROFESSIONAL COMMUNITY AND LEARNING
NORMS OF CLASSROOM COMMUNITIES Wen-Huan Tsai
National Hsinchu University of Education, Taiwan
This study was designed to cooperate with teachers’ professional community to
develop students’ learning norms in classroom communities in which students were
willing to engage in discourse. A collaborative team consisted of two researchers and
four elementary teachers. The professional community intended to generate
normative aspects of acceptable and appropriate teaching based on discussing
teachers’ observations about their students’ learning mathematic in each classroom
community. Classroom observations and routine meetings were used to collect data
for the study. This paper just referred two teaching norms including students’ social
autonomy and students’ questioning in the professional community and its effect on
learning norms in classroom communities were the foci of this paper.
INTRODUCTION
Professional development activities that are externally mandated or coerced by a
power hierarchy are ineffective because they do not result in development as a
qualitative change (Castle & Aichele, 1994). Professional knowledge cannot be
transferred. Rather, it is constructed by each individual teacher bringing his or her
“lived experiences” as a learner and bringing the individual to an educational setting.
Teachers move toward professional autonomy as they continue to construct their
ideas about mathematics and how the autonomy is best taught to their students.
Professional teaching autonomy is developed when teachers have opportunities to
share their views with others and to hear and debate the views of others. One way of
exchanging various perspectives would be the teachers participating in a professional
teaching community. Therefore, establishing a professional community for teachers
to mutually share their teaching experiences is the focus of this study.
Cobb & McClain (2001) argued that it is not possible to adequately account for
individual students’ mathematical learning as it occurs in the classroom without also
analyzing the developing mathematics practice of the classroom. They also argued
that it is not possible to adequately account for the process of teachers’ development
without also analyzing the pedagogical community in which they participate.
Therefore, the goal of the study was to help teachers develop instructional practices
in which they induct their students into the ways of reasoning by developing the

Tsai
PME31―2007 4-218
norms of classroom discourse. This study was intended to describe and interpret how
normative aspects of teaching constructed by the professional community interacted
with the learning norms constructed by the classroom communities and how it
affected teachers’ professional development and their students’ learning.
THEORETICAL PERSPECTIVES
The study was based on Cobb & Yackel’s (1996) theoretical perspectives of the
relations between the psychological constructivist, sociocultural, and emergent
perspectives in order to examine both teaching and learning in professional
community and classroom communities. Constructivists’ perspective of learning
claims that learners construct knowledge through the interactions between them and
social worlds. Individual knowledge might be seen as a personal construction of the
processes of learning relative to their ongoing experiences in the community
involving reflection and adaptation (Piaget, 1971). The psychological perspective is
view of individual’s activity as they participate in and contribute to the development
of these communal processes. Sociologists are interested in the human need to adapt
to social existence and to develop a system of shared meanings. Sociocultural
perspective is an interactionist’s view of communal or collective community process.
Cobb & Yackel defined the emergent perspective (social constructivism) as the
coordination of interactionism and psychological constructivism. The emergent
approach attempts to coordinate these two perspectives of analyzing classroom
activity and treat them complementary. In this joint perspective, social norms and
sociomathematical norms are seen to evolve as students reorganize their beliefs and
values, and, conversely, the reorganizing of these beliefs and values is seen to be
enable and constrained by evolving those two norms.
Yackle & Cobb (1996) claimed that the social structure in everyday life consist of
normative patterns of interaction and discourse. From Yackle and Cobb’s analysis,
one of their primary claims was that in guiding the negotiation of social norms and
sociomathematical norms, teachers are simultaneously supporting their students’
development both of what might be termed a mathematical disposition and of social
autonomy and intellectual autonomy. In a similar way to develop teachers’
professional knowledge was when teachers have opportunities to share the view with
others and to hear and debate the view of others. Through exchange points of view,
teachers develop an appreciation for diversity of thought. They become better at
seeing another’s perspective, which leads to better pedagogical reasoning. In this
study, the activities were structured to ensure that knowledge was not only actively
developed by teachers but also involved in creating a safe environment for discussing,
negotiating, and sharing the meanings of teaching based on classroom observations.

Tsai
PME31―2007 4-219
This perspective was based on Yackle and Cobb’s suggestions that there are some
normative patters of interaction and discourse found in this teachers professional
community but not generated from classroom community. Teaching issues considered
to be acceptable or appropriate are drawn to constructive discussions in such a sense
of taken-as-shared. The norms of teaching involving in the study were developed in
the professional teaching community, while the norms of learning were developed in
the classroom community. The analyses of teaching norms and learning norms (social
norms, sociomathematical norms, or the norms of reasoning etc.) and interactions
between them were proved to be pragmatically significant because it helped us to
understand the process that the teachers collaborating with their students to foster the
development of autonomy in their teaching and learning.
METHOD
The study was the 3rd year of a three-year research project that was designed to
support elementary teachers in implementing the recommendations suggested in the
innovative curriculum into classroom practices. To achieve the goal, a collaborative
team consisting of two researchers and four elementary school teachers were set up.
The years of teaching for the four female teachers, Fey, Yin, Shay, and Lin, were
ranged from 4 to 12. The researcher was expected to provide the teachers with
theory-driven explanations, while the teachers were expected to share classroom
experiences. The researcher created the opportunities for teachers to discuss and
exchange their perspectives for the purpose of developing acceptable learning norms
in their classroom communities.
To create the opportunities of learning from others’ concerns, routine meetings were
scheduled once every other week. The teachers were invited to report their concerns
relevant with the learning norms in the routine meetings after they observed one
teacher’s teaching. The lessons of the four teachers were scheduled in turn to be
observed on Friday morning and were immediately followed by a routine meeting in
the afternoon to address what they were concerns with the learning norms. After the
meeting, the teacher who conducted the teaching lesson was asked to watch her own
teaching taped in the video, to identify the learning norms addressed in the meeting,
and be encouraged to write the reflection journal. The teachers were given the
opportunity in the study to conceptualize their pedagogical knowledge through the
four processes: formulating or identifying the problems generated from mathematical
classroom, discussing the problems and framing their pedagogical meanings in the
routine meetings, adjusting and implementing the meaning they learned from one
classroom into other classrooms, and revising the teaching practice and bringing it to
the next meeting. Through interactions between the teachers and the researchers, the

Tsai
PME31―2007 4-220
teachers were expected to reconstruct the pedagogical reasoning needed for a
professional teacher.
The routine meetings and classroom observations were audiotaped and videotaped
throughout the entire year. The audiotapes and videotapes were transcribed for
analysis. In the data analysis, the transcriptions of audio and video were read
repeatedly. The theme emerged focused on teaching norms to be acceptable in the
professional community and learning norms to be acceptable in the classroom
communities and how the two norms were mutually interactive.
RESULTS
The development of the teachers’ ability to explain what and why they did so in the
classrooms to the professional teaching community and the improvement of their
students ability to explain and justify their own thinking to classroom communities
oriented the process of development of learning communities involved in the study.
In the professional teaching community, a good teaching aiming at helping students
work together to make sense of mathematics was not dominated by a criteria but it
was through the negotiation between the teachers and the researcher. The interactions
enhancing the establishment of normative aspects of teaching and learning were built
on teaching practice of each individual teacher’s classroom community. The teaching
norms and the learning norms continually moved toward the improvement of
mathematical thinking through the reciprocal interactions between the teaching
community and classroom communities.
There was several teaching norms found in this study. However, this paper just listed
two teaching norms as examples to elaborate the interactions between the teaching
norms of teachers’ professional community and learning norms of classroom
communities.
Developing the Norm of Students’ Social Autonomy
It is found that the mathematical tasks the teachers designed for creating the
opportunities of group discussion or whole-class discussion were getting more
thoughtful. Initially, the teachers were not comfortable with dealing with group
discussion since the discussion made classroom noisy and interrupted. To make group
discussion effectively, the teachers were intended to set up the rules for students to
obey. However, they realized that external incentives were not functioned since they
did not result in the development of students’ social autonomy. In the very early
period of the study, the issue around teachers’ discussion in weekly meetings
commonly was relevant to discipline. For instance, Fey said that

Tsai
PME31―2007 4-221
“…Group work becomes a common strategy in my instruction but I feel it is difficult to
carry out. I saw the teacher, Yin, used a good strategy in her classroom. Each student
in one group was assigned a job. The coordinator deals with the process of group work.
The recorder records and tracks what they discussed. The monitor takes the
responsibility to check if the answer is correct or reasonable. The reporter makes a
presentation to the whole class. The role of each student within a group takes turn by
the next lessons. I also adopted this strategy that assigned the role of each student in
my classroom of group discussion but it didn’t work very well. I don’t know why.”
After the discussion, we realized that the effect of group discussion on Yin’s and
Fey’s instructions made a distinction. Although Fey adopted Yin’s strategy in
assigning each job to each student, her students did not know the obligation and the
expectation of each job. Yin explained with encouragement to the teachers in the
professional community that the difficulty with handling in-group discussion. To
overcome the difficulty, Yin always raised this issue to whole class discussion
publicly, and then the obligations and expectations of each job in a group discussion
became the focus of classroom community in Yin’s classroom. Accordingly, the norm
of group discussion was established and improved gradually in Yin’s teaching.
Yin’s norm of group discussion was not acceptable and not appreciated by the
professional community until April 2002. It means that the process of developing the
norm of group discussion in Yin’s classroom community first became the issue of the
dialogue between the teachers in the professional community, and then the
professional community assisted in developing the norm of group discussion in each
teacher’s class community. Several issues were addressed by teachers and several
normative aspects of group discussion were established. A norm of listening includes:
(1) accepting a solution if presenter has a reasonable explaining, (2) listening
carefully the presenter’s explaining, and (3) asking questions if the explanation was
unreasonable. The other norm was related to reporter presenting his or her solution to
his or her group or whole class. Reporter needs to explain or justify his or her
solution. If reporter explains superficially what it has been done, then he or she would
not be accepted. Reporter also requires responding the questions that her or his
classmates raised.
Therefore, raising classroom events to discuss and negotiate for students so that
students know their obligations, expectations, and responsibilities became the
normative aspect of acceptable teaching strategies in the professional teaching
community. Until October 2002, the norm of group-discussion in each teacher’s
classroom community was well developed. For example, Fey posed the following
problem to students. “There are 6 chocolates in a box. Jenny bought 3 boxes. How
many chocolates did Jenny have?” After students solved the problem individually,

Tsai
PME31―2007 4-222
Fey asked them to share their solutions within a group in turn. The following episode
was excerpted from the group 4 discussions.
(Group 4 consists of five students S1, S2, S3, S4, and S5. S5 acted as the coordinator
and conducted the discussion)
S5: Ok! S1 first!
S1: 6 plus 6 plus 6 equal to 18, because 6 plus 6 equal to 12.
12 plus 6 equal to 18, so that the answer is 18. (the right picture)
S5: Any questions? [S2 and S3 raised their hands]
S1: Ok! S3!
S3: what is the meaning of 6, why did you add three 6s rather than two 6s?
S1: 6 means a box has six chocolates and Jenny bought three boxes, so I added three 6s.
S5: Any question?
S2: what is meaning of 6?
S5: This question was already asked. You didn’t pay attention to! (S5 look at S2 with unpleasant
and S2 feel a little embarrassment)
S5: Any more questions? [No one raised her or his hand.]
S5: Ok! S4 is your turn now. (November 11, 2002)
This episode suggested that the group discussion not only went smoothly but also
involved in students’ mathematical thinking. S5 as the coordinator knew how to
conduct a discussion. In the beginning of the study, the presenter did not explain
where 6 came from so the explanation was not acceptable in this group. S3 asked
“what does mean by 6”. S1 as the presenter knew to present her idea clearly and
knew her responsibility to answer S3’s questions. Listeners required to pay attention
to the presenter’s presentation and also were encouraged to raise their questions or
provided the suggestions to the presenter’s solution. S2 was criticized by S5 without
attending to S1’s explanation.
The above episode indicates that developing teaching norm based on developing
learning norm not only affected teachers’ teaching but also affected students’
thinking.
Developing the Norm of Students’ Questioning
Through developing the norm of group discussion, the norm of whole-class
discussion were constructed in classroom teaching and interactively constituted in the
professional teaching community. The norm of whole-class discussion constructed by
professional community included four stages: posing the problems by teacher,
solving the problem by students individually or collaboratively, discussing and
sharing their solutions within a group, and each group selected an acceptable solution
and reported it in public to the whole class. The four stages created the opportunities

Tsai
PME31―2007 4-223
for students to communicate their thinking within a group but also in the whole class.
In the four stages, developing the norm of classroom social autonomy and developing
the norm of students’ intelligent autonomy based on developing sociomathematical
norms were included. Several teaching norms of developing sociomathematical
norms were identified in this study, but only the teaching norm of developing
students’ questioning skill is reported here.
Regarding the normative aspect of how to help students to ask a good question in this
professional teaching community, the presenter presented the solution within a group
or whole class. Afterwards, the teachers encouraged other students to questioning if
they felt the explanation is not clear enough. In the beginning of the study, students
did not realize how to ask a good question. Students always asked the questions
irrelevant to the mathematical meaning. For example, they asked: you forgot to write
the “Ans: ”; the words you wrote were too small to seeing; why don’t you use the
addition instead of subtraction; …etc. Therefore, how to help listeners to ask a good
question to help the reporter to make her or his solutions clearly became the
important issue of discussion within the professional teaching community.
Based on the developing process of the classroom social norm, the teachers
developed the norm of questioning through their discussions and negotiations about
how to ask a good question. For instance, Shay raised the following question for her
students to answer and asked them to justify. The question raised by Shay to whole
class was that “What is a good question or suggestion you want to ask or give it to
group discussion or whole class discussion?” The good questions Shay’s students
raised included: Ask him to explain his solution according to the situation of word
problem; Help him explain when he stock there; let him or her explains slowly if she
or he explain not clearly; ask the questions relevant to mathematics; Ask him to use
the chips to explain the solution if he stock there…etc. After discussing how to ask a
good question over several times, students gradually were able to ask helpful and
suggestive questions to the presenter.
Other teachers learned and appreciated the developing process of asking questions in
their own classroom communities from Shay’s sharing her improvement of
questioning through the whole-class discussion in her classroom community to the
professional community. As a consequence, students gradually skilled in asking good
questions and offering constructive suggestions after their classmates shared their
solutions. In Yin’s class, the questions students asked were irrelevant to the
presenter’s solution were not accepted, because students need to examine if the
presenter’s solution is reasonable or not. They would give comments to the presenter
if necessary. Another normative aspect of asking question was necessary to connect to
the mathematical meaning.

Tsai
PME31―2007 4-224
DISCUSSION
Fostering students’ development of intellectual and social autonomy oriented the goal
of mathematics teaching involving in this study. Teachers with intellectual autonomy
promoted their students becoming as self-directed learners who were used to question,
inquire, and figure out the answer in their classroom communities. The teachers’
autonomy referring to the study was identified as teachers’ willing to participate in
the professional community and students’ autonomy was clarified as students’ willing
to participate in the classroom community. It is found that the process of fostering
students’ intellectual and social autonomy was consistent with that of enhancing
teachers’ teaching autonomy. The teaching norms promoted the teachers’ autonomy in
their teaching practice through the dialogues of the professional community and
developed the learning norms that promoted students’ autonomy in the classroom
communities.
Project teachers performed the development of classroom learning norms with
different paces in different classroom communities. The norm of developing students’
learning norms that were evolving and renegotiating within the dialogues of
professional community was developed with some acceptable criteria. Then, each
teacher taken and shared the norms of students learning, implemented them into her
own classroom community, and then improved her teaching autonomy and her
students’ social and intelligent autonomy in teaching practices. The evidence of two
kinds of autonomy affecting mutually between teaching norms and learning norms
was shown in above results.
REFERENCE
Castle, K. & Aichele, D. B. (1994). Professional development and teacher autonomy. In D. B.
Aichele & A. F. Coxford (Eds), Professional development for teachers of mathematics.
Reston, VA: National Council of Teachers of Mathematics.
Cobb, P. & McClain, K. (2001). An approach supporting teachers’ leaning in social context.
F. L. Lin & T. J. Cooney (Eds.), Making sense of mathematics teacher Education,
207-231. Kluwer Academic Publisher. Printed in the Netherland.
Cobb, P. & Yackel, E. (1996). Constructivist, emergent, and sociocultural perspectives in
the context of development research. Educational psychologist. 31(3/4), 175-190.
Piaget, J. (1971). Biology and knowledge. The University of Chicago Press: Chicago.
Yackel, E. & Cobb, P. (1996). Sociomathematical norms, argumentation, and autonomy in
mathematics. Journal for Research in Mathematics Education, 27, 458-477.

2007. In Woo, J. H., Lew, H. C., Park, K. S. & Seo, D. Y. (Eds.). Proceedings of the 31st Conference of
the International Group for the Psychology of Mathematics Education, Vol. 4, pp. 225-232. Seoul: PME. 4-225
ANALYSIS OF A LEARNING CASE: JASMINE
Zelha Tunç-Pekkan
The University of Georgia, Department of Mathematics and Science Education
Athens, GA. USA.
In this paper I will discuss how we can consider an observation as a case of learning.
Learning is a complex phenomenon that includes the history of learners’ actions and
operations in similar and different contexts, and the interactions with teachers and
peers not as a cause but as a driving force. While student learning is an autonomous
and individually experienced phenomenon, it must be observed by an observer for it to
be called learning. Therefore, a teacher has to take two important roles, she needs to
be involved in occasioning student learning and she needs to be an astute observer
who recognizes learning when it does occur. In this paper, I discuss a case of learning
by Jasmine, who was a participant in a semester-long teaching experiment. I will try to
distinguish the important characteristics of learning using Piaget’s scheme theory and
Steffe and Thompson’s idea of learning as spontaneous, and will discuss how these can
be used as a framework for analysing learning.
INTRODUCTION
The US National Council of Teachers of Mathematics envisions one of the important
responsibilities of teachers as: “Analysing student learning, the mathematical tasks,
and the environment in order to make ongoing instructional decisions” (Professional
Standards, 1991, p. 5). Observing and claiming that a student’s actions are also cases of
learning is challenging even for researchers when the recorded interactions are
analysed without time pressure. By taking ourselves out of the situations and spending
time on the videotapes of semester-long or longer interactions with a student, we
realize many things at the micro-level about the student and have the opportunity to
make models of the student’s mathematical thinking over time. For example, Steffe,
Cobb, and von Glasersfeld (1988) conducted a two-year teaching experiment with
64-videotaped sessions for each of six children they taught for the purpose of building
a theory of arithmetical learning. They learned a great deal during the course of the
teaching experiment and they documented points of progress; however, they said that,
“While these [documents of points of progress] proved invaluable, our interpretations
often changed dramatically in the retrospective analysis” (p. x). We researchers learn
by analysing interactions at a later time. We realize that we missed opportunities as a
teacher for advancing students’ mathematical activities while interacting face-to-face.
This is the dilemma I see for myself and for many other colleagues who do research
within a teaching experiment methodology. It is also a dilemma for teachers who teach
without analysing their students’ learning.
Teaching, researching, and being concerned about learning
With a teaching experiment methodology (Steffe & Thompson, 2000), even though we
later become aware of missed teaching opportunities for particular students, we are

Tunç-Pekkan
PME31―2007 4-226
informed about our general model of students’ learning in the same or similar
mathematical topics. Being able to make cognitive models of students’ mathematics
requires many resources, such as being familiar with the related literature, planning,
videotaping, analysing time, and collaborating with other researchers/teachers.
Unfortunately, teachers have to teach everyday over many years without these
resources being available. Most of them don’t have the opportunity to look back at
recorded interactions, students’ actions, language, and gestures that are essential for
making inferences about learning. Because of this, teachers may not realize how
complex it is to claim something is or is not a case of learning. When teaching, teachers
are often responsive and intuitive. Then how can a teacher be intuitive and at the same
time an observer of a child’s mathematical activities to make inferences that will
inform her proceeding actions while teaching?
Framing Essential Teaching Actions With A Theory: Observations, Explanations,
Inferences And Being Intuitive
While it might be hard to differentiate observations from inferences (Saunders &
Bingham-Newman, 1984), observations are behaviours of students that indicate their
mental operations. Inferences, on the other hand, concern the non-observable mental
operations and/or changes in those mental operations that constitute a case of learning.
They also concern what prevents the student from learning what a teacher thought the
student could learn.
While Piagetian scheme theory is useful when making inferences about learning cases,
it is challenging for a new researcher who chose teaching as the scientific method of
investigation. Simon, Tzur, Heinz, and Kinzel (2004) elaborated how Piaget’s
reflective abstraction can be used for designing mathematical lessons. In their work,
student’s learning is viewed as students’ reflection on the effects of their activities.
Simon et al. listed four steps for designing lessons: specifying students’ current
knowledge, specifying the pedagogical goal, identifying an activity sequence, and
selecting a task. While they said that the activity-effect relationship is the underlying
principle for the last two steps of designing a lesson, they suggested that a lesson
designer should also be concerned about specifying learning goals for students in the
second step; the focus of the learning goal should not be “on the mathematics as seen
by the one [teacher or the student] who understands it” but “on distinctions in the
learner’s understanding of the mathematics” (Simon, 2002, p. 996). However,
specifying learning goals is not an easy task since the designer needs to know “at least
two states of student understanding, a current state and a goal state, and the differences
between them” (Simon et al, p. 322). This is exactly the concern of this paper, how can
a teacher or researcher become aware of those levels of understanding, and the
differences between them not only for design purposes but also for specifying learning
goals in the on-going teaching interactions? This question is very much related to how
a teacher defines learning, and uses a theory of learning for her observations,
explanations, and inferences.

Tunç-Pekkan
PME31―2007 4-227
Piaget’s learning theory, and every other theory, does not tell the researcher what to
look for specifically while teaching or when making a retrospective analysis of
students’ learning; because of this, using a theory and its conceptual tools is also a
learning experience for the researcher. Most of the time, we observe certain things that
we think intuitively are important. During the act of teaching, we may not know why
those observations are important and even may not know how to proceed, but we can
later try to explain those observations when making cognitive models of students’
thinking. As Steffe (1994) said, “Having something to explain is an essential part of
building cognitive models—one must construct something like primary
intuitions—and that is why theory and observation are mutually supporting” (p. 165).
This effort of explaining is important for a new researcher or teacher to gain
experiences about how to make inferences when analysing those observations. To
discuss how I, as a new researcher, gained some reasoning and insights about a
student’s learning, I will present one complex example from a semester long teaching
experiment. Seventeen 30-50 minutes long-sessions were conducted with a pair of 8th
grade US students.
SCHEME THEORY AS A CONCEPTUAL TOOL FOR LEARNING
We should keep in mind that learning is spontaneous, which means our (teaching)
actions cannot cause learning but they are important to provide possible occasions for
it to happen. I am in agreement with Steffe and Thompson’s (2000) explanation of
four important aspects of learning with their rationalization of spontaneity:
We do not use “spontaneous” in the context of learning to indicate the absence of elements
with which the students interact. Rather, we use the term to refer to the noncausality of
teaching actions, to the self-regulation of the students when interacting, to a lack of
awareness of the learning process, and to its unpredictability. Because of these factors, we
regard learning as a spontaneous process from the students’ frame of reference. (p. 288)
While this view of learning is in harmony with a constructivist view of knowledge, I
think it is the biggest challenge of a teaching philosophy that might be in accord with
constructivism.
When interpreting Piaget’s learning theory von Glasersfeld (1995) posits, “cognitive
change and learning in a specific direction take place when a scheme, instead of
producing the expected result, leads to perturbation, and perturbation, in turn, to an
accommodation that maintains or reestablishes equilibrium”(p. 68). The accommodation
is an operation that produces the change. So, to understand learning, we need to
understand the operations that produce change. The idea of scheme is vital in
understanding learning in the Piagetian framework. According to von Glasersfeld
(1995), schemes are comprised of three parts, regardless of whether they are
implemented in reflex or in more sophisticated cognitive structures. Every scheme has
a situation part; “a specific activity associated with the situation; and the expectation
that the activity produces a certain previously experienced result” (von Glasersfeld,
1995, p. 65).

Tunç-Pekkan
PME31―2007 4-228
I will discuss how we can use scheme theory in observing students’ mathematical
activities, explaining their actions, and making inferences about those observations for
the purpose of claiming whether a student learned something. In protocol 1, I will
discuss how Jasmine made a possible functional accommodation (Steffe & Thompson,
2000) in the context of teaching. As a teacher, I could observe which of her actions and
my interventions made this accommodation possible, but I was not able to claim what
that accommodation was or the details of that accommodation at the time of teaching.
In addition, even today with an experienced researcher, we are debating whether that
situation is a “generalizing assimilation” or “functional accommodation” that lead to
Jasmine’s learning. With an analysis of the protocol 2, I suggested that Jasmine’s
independent actions in protocol 2 warranted her permanent learning she made in
protocol 1, even though labelling the situations with a theoretical construct that lead to
learning is under my construction.
Jasmine’s whole-part-part scheme
Jasmine with her partner, Beth, had solved the following problem in one of the
previous sessions: “A fifty-two inches string is cut into two parts, find the length of the
parts if one part is three times as long as the other part” (Problem 1). Jasmine always
started with the smaller part and assigned it as a unit of one, and then used the unit of
one three times to produce the longer part. Because of her saying “three times more”,
in my analysis, I inferred that she viewed those two sub-quantities as multiplicatively
related. Furthermore, she added units of one and three and produced a unit of four for
the whole known quantity of fifty-two inches. She then divided 52 by four to find the
measure of a unit of one and used the result, 13 inches, as the measure of smaller unit.
She multiplied 13 by three, because of the three units, to find the measure of the bigger
part.
Jasmine’s accommodation of her whole-part-part scheme for solving problems
with proper fractions as multiplicative relationship between the parts
I posed a problem to the students: “a forty-inch string is cut into two parts, and one part
is one-third times as long as the other part. How long are the parts? ” (Problem 2) I
inferred from Beth’s solution and Jasmine’s agreement with her solution to this
problem that they could easily solve them when unit fractions were given as the
multiplicative relationship between the two sub-quantities. Therefore, I presented the
problem with a proper fraction: A fifty-inch long string is cut into two parts. Find the
parts, if one part is 2/3 as long as the other part (Problem 3)
Protocol 1: After I posed the problem, Jasmine spent a minute and then talked to
herself quietly.
Jasmine: Oh. I divided and got sixteen and two thirds, I think.
Z: Sixteen and two thirds?
Jasmine: Hmm. (Indicating agreement), and I multiplied... the small one. (Beth said something but it was inaudible).
Z: (to Beth) say it again?

Tunç-Pekkan
PME31―2007 4-229
Beth: I don’t know.
Jasmine: I think that is right. I divided fifty, is it sixteen and two thirds?
As a teacher, I realized her results were not right, since she was dividing 50 by three
instead of 50 by five. However, I did not know why she did it that way. I asked her to
rephrase the problem. I, as a teacher, hoped she would be able to solve the problem by
only thinking that the problem structure was the same as problem 1 and 2.
Z: Rephrase the problem for me, restate the problem. What was it?
Jasmine: Whole string is fifty, and you have two pieces, one piece is two thirds, is it two thirds of or two thirds bigger than the first one?
Z: Two thirds as much as the other part. (Jasmine talks to herself quietly)... How would you interpret it Beth?
Beth: Two thirds of... It is not two thirds of the string; it is two thirds more than one part?
Jasmine: Thirty three one third?
Z: Thirty three one third?
Jasmine: I think.
Jasmine indicated that she was not certain how to interpret “2/3 as much as the other
part” by asking whether it was “2/3 of or 2/3 bigger than the first one”. Jasmine’s
comment that “2/3 bigger than the first one” can be explained that she is thinking how
to complete the whole using 2/3, but not necessarily using 2/3 for establishing a
relationship between the parts. That she said, “2/3 of ” indicates that she was aware of
another type of relationship, a possible multiplicative relationship, but she didn’t know
how to establish it. So, I asked Beth how she would have interpreted it. Not only did I
want to check Beth’s conceptualisation of the situation, but also if her contribution
would be helpful to Jasmine. Beth said, “It is not two thirds of the string”. However,
she did not know how to interpret it as a multiplicative relationship between the parts
either.
Z: Let’s draw it. Or whatever will be helpful to you. (Jasmine divides 50 by 3 on her paper) So why are you dividing it by three?
Jasmine: I have three pieces, not three pieces but you have one third and then you have the one; that is two thirds.
Z: Ok. One piece is two thirds of the other piece.
Beth: So one is two thirds of one piece, so…
Z: So which piece is bigger?
Beth: The one, that is “of ”.
Z: Let’s say the white part is the two thirds of the green part, ok? So is the white part longer or the green part?
Beth: The green. The white is two thirds of the green. Green is longer.
Z: Yes.
Jasmine: So you don’t divide it by three?

Tunç-Pekkan
PME31―2007 4-230
Jasmine’s dividing 50 by three indicated that she thought that the whole string was cut
into three thirds, where one part was one third of the string, and the other part was two
thirds of the string. Jasmine established an additive relationship between the two
sub-quantities as one of them being two thirds, and the other one being the complement
of two thirds when the whole quantity was three thirds. They were implicit thirds of the
whole string.
Discussing what “2/3 of ” means instead of “2/3 as much as the other part” and adding
“the white part is two thirds of the green part” to the problem situation possibly opened
new paths for the students. Beth became aware of the (multiplicative) relationship of
the two sub-quantities; she said, “The green is longer, the white is 2/3 of the green”.
However, Jasmine’s conception of the problem situation did not change, but it was
disturbed because she asked, “So you don’t divide it by three?” I did not know how
important this question was when she asked it.
I suggested to Jasmine that she draw the situation because I did not know how else to
help her at the time. Now, as an analyst, I think drawing is a different context to
explore how Jasmine thought in her perturbed state.
Z: Can you draw the whole string? (Jasmine draws a line segment) ok that is fifty inches; we have two parts, green and white. The white part is two thirds as much as the green one, right? (Jasmine partitions the segment into two parts and puts “G” under the bigger part, “w” and “2/3” under the smaller part). Two thirds of what?
Beth: Of the green.
Z: Of this green (pointing to the “G” part, Jasmine wrote “2/3 of G ” ).
Jasmine: So I divide it by two…well I divide by two and multiply by three?
Z: Why would you do that?
Jasmine: I don't know.
When I asked “two thirds of what?” and Beth answered “of green”, at that moment
Jasmine added “of G ”. However, “2/3 of G ” did not refer to a relation between the two
parts because she did not know how to produce neither the longer part nor the number
of equal parts, five. Not knowing how to produce the number of parts constituted a
perturbation for her because up to this point, she had successfully produced the number
of equal parts for every situation. Even though she did not produce the three thirds
quantity for the greater part using two thirds of the quantity, she was at a better place
than at the start when she conceptualised the situation as “I have three pieces, not three
pieces but you have one third and then you have the one, that is two thirds” because she
was in a state of perturbation.
Seeing that Jasmine was unable to continue, I shifted our focus to a similar situation in
Problem 2. As a teacher, I thought her engagement with Problem 4 would help her to
assimilate the situation in Problem 3 when we revisited it. However, at the time as a
teacher, I was not aware that, given Jasmine’s available schemes at the beginning of

Tunç-Pekkan
PME31―2007 4-231
Protocol 1, she would not be able to solve the problem without making a change in her
scheme’s situation.
Z: Let's go to the previous situation, we have still fifty inches, and the white part is four times as much as the--no, the white part is one fourth times as much as the green one. How are you gonna draw that? You have fifty inches (Jasmine draws a line segment). We have still two parts, white and green (puts a partition mark). White part is one fourth times as much as the green one (Jasmine writes “1/4” under the small part, she then immediately divides 50 by five using a long division algorithm). Uhm. So why do you divide by five? (PROBLEM 4)
Jasmine: Because this is five. This is four fourths and that is one fourth.
Z: Good... Right? (Beth nods her head). So can you show the four fourths here (asking Jasmine, pointing to the line segment)? And mark the each fourth? (Jasmine puts three marks for the 4/4 part,) So how many parts do you have all together in the fifty inches?
Jasmine: Five.
Jasmine used the operations that she had been using for generating the greater
sub-quantity using the smaller quantity as a unit. She used one-fourth as an iterable unit
to produce the four-fourths quantity by multiplying it four times, we can make this
explanation because of her actions in Problem 1. That is why she divided 50 by five,
because there were five equal partitions comprising the whole. This was the first time
she independently reasoned reciprocally to produce the fractional whole given a part of
it and then operated with these fractional quantities to specify their length. Right after
Problem 4, I asked Jasmine whether she could use her idea of finding the number of
equal parts and lengths of those parts to solve Problem 3. I was not sure how she would
proceed. Jasmine said “three thirds, two thirds, so I still divide by five”. She notated 50
divided by five using the traditional paper and pencil algorithm on her paper.
Producing the greater part as 4/4, when the smaller part was given as 1/4 in the
previous problem enabled Jasmine to use this result in assimilating the problem where
the smaller part was 2/3 of the larger part. But the assimilation was generalizing in that
the “2/3 problem” contained an element that was not present in the “1/4 problem” (L.
Steffe, personal communication). Of course, she knew that two out of three parts was
2/3 of three parts, and this meaning of fractions served a post-hoc justification. She
definitely modified the scheme she had been using to solve problems when a string had
two sub-parts, one part was twice, three times, one fourth, etc., of the other part to solve
problems when the fractional part was non-unit proper fraction. In addition, since
Jasmine was already in a state of perturbation before she solved Problem 4 and there
was a change in her perceiving of the Problem 3 situation, we can talk about an
accommodation.
A Possible Functional Accommodation: Before solving the problem including one
fourth, Jasmine did not know the green part was 3/3 if the white part was 2/3 of the
green part. With the one-fourth problem, she became aware that four-fourths can be
generated using one-fourth four times and, reciprocally, one fourth can be produced by

Tunç-Pekkan
PME31―2007 4-232
disembedding one of the four equal parts of the four-fourths quantity. For this
disembedding operation, she needed to take four-fourths as given or as the result of her
previous activities. I did not observe Jasmine talking about her reciprocal reasoning,
but I do infer that reciprocal reasoning for the case of 1/4, because it is a unit fraction
multiplicative relationship. Had she engaged in reciprocal reasoning in the case of the
“2/3 problem”, I would have inferred that she made a functional accommodation in the
scheme that she used to solve the simpler problems. If Jasmine abstracted the result of
this relationship of four-fourths is four times as much as one fourth, and used it in the
2/3 problem that way, she would have thought about a quantity when two out of three
parts of it was used to make two thirds of it: That quantity would be three thirds of the
green part. In that case, there would be a change in the operations that is necessary for
the functional accommodation (Steffe&Thompson, 2000).
Jasmine’s comment in Protocol 2 warrants that this learning is permanent. Because of
the limited writing space, I will present Protocol 2 and the discussions during oral
presentation.
References
Saunders, R., & Bingham-Newman, A. (1984). Piagetian Perspective for preschools: A
thinking book for teachers. New Jersey: Prentice-Hall.
Simon, M. (2002). Focusing on key developmental understanding in mathematics. Paper
presented at the Twenty-fourth Annual Meeting of North American Chapter of the
International Group for the Psychology of Mathematics Education, Athens, Ga.
Simon, M., Tzur, R., Heinz, K., & Kinzel, M. (2004). Explicating a mechanism for
conceptual learning: Elaborating the construct of reflective abstraction. Journal for
Research in Mathematics Education, 35(5), 305-329.
Steffe, L. ( 1994 ). Children's construction of meanings for arithmetical words. In D. Tirosh
(Ed.), Implicit and explicit knowledge: An educational approach (pp. 131-169). Ablex:
New Jersey.
Steffe, L. P., Cobb, P., & Glasersfeld, E. v. (1988). Construction of arithmetical meanings
and strategies. New York: Springer-Verlag.
Steffe, L. P., & Thompson, P. W. (2000). Teaching experiment methodology: Underlying
principles and essential elements. In R. Lesh & A. E. Kelly (Eds.), Research design in
mathematics and science education (pp. 267-307). Hillsdale, NJ: Erlbaum.
von Glasersfeld, E. (1995). Radical constructivism: A way of knowing and learning. London:
Falmer Press.

2007. In Woo, J. H., Lew, H. C., Park, K. S. & Seo, D. Y. (Eds.). Proceedings of the 31st Conference of
the International Group for the Psychology of Mathematics Education, Vol. 4, pp. 233-240. Seoul: PME. 4-233
ELEMENTARY TEACHERS’ LINGUISTIC INVENTIONS AND
SEMANTIC WARRANTS FOR MATHEMATICAL INFERENCES
Janet G. Walter and Christine Johnson
Brigham Young University / Brigham Young University
Elementary teachers, engaged in learning challenging mathematics, used linguistic
invention when they related personal experiences, such as filling a bathtub, to the
graphical representation of the rate at which water was entering or leaving a reservoir,
in the production of semantic warrants to support mathematical inferences.
INTRODUCTION
Many practicing elementary teachers engage with their students in linguistic invention
and semantic warrant production as they attempt to build connections between abstract
mathematics and personal experience. Linguistic invention, the practice of describing a
mathematical situation in relation to oneself (Brown, 2001) could support learners’
development of meaning for conventional language. Here, we introduce the notion of
semantic warrant production—the purposeful choice to offer personally meaningful
instantiations and reasoning that support mathematical inferences. In particular, we
focus on aspects of linguistic invention and semantic warrant production in
communication of mathematical ideas between practicing elementary teachers
participating in professional development in mathematics through inquiry-based
learning.
RESEARCH QUESTIONS
We use qualitative methods to address two questions: (a) how do the participants use
linguistic invention in mathematical discourse, and (b) how do the participants develop
semantic warrants to justify mathematical inferences?
RELATED LITERATURE
Recent studies in professional development encourage teachers to focus on their own
mathematics learning “through long-term collaborative inquiry centered on the
building of meaning in order to embrace a richer conception of mathematics and to
acquire a sensitivity to the ways their own students build up ideas” (First Author, in
press; Loucks-Horsley, Love, Stiles, Mundry, & Hewson, 2003).
Toulmin (1969) describes conclusion, data, warrant, and backing as four elements of
argument. Using the notion of warrant (Forman, Larreamendy-Joerns, Stein & Brown,
1998; Rodd, 2000; Toulmin, 1969; Yackel 2002) and the idea of semantic proof
production (Weber and Alcock, 2004), we suggest that teacher-learners purposefully
choose to engage in semantic warrant production to convince themselves and others of
the truthfulness of personally constructed mathematics. Hoyles’ (1997) addition of a
social dimension to explanatory proofs (Hanna, 1990) by students may be viewed by
some as an alternative to our notion of semantic warrant production. However, in

Walter & Johnson
4-234 PME31―2007
semantic warrant production, the producer is intrinsically compelled and purposefully
chooses to offer the instantiations and reasoning that support mathematical inferences.
Conventional language of mathematics includes technical terms and usages that are
unique to and support the study of mathematics in society (Brown, 2001; Moschkovich,
2003; Pirie, 1998). Linguistic invention involves the use of “ordinary language” (Pirie,
1998, p. 8) or everyday vocabulary that is familiar enough to represent one’s own
memory and experience elicited in mathematical problem solving. Learners use
“linguistic invention towards producing structures and meaning ... describing
situations of which they are part; understanding their relation to the things they
describe” ( Brown, 2001, p. 76). Roth (2002) reports that “transparently” reading a
graph requires “(1) familiarity with reading graphs, (2) familiarity with the
conventions and signs used in the graph, and (3) familiarity with the natural or
hypothetical phenomena that such graphs may express” (p. 8). However, a learner’s
level of personal experience with a problem situation may sometimes inhibit accurate
interpretation of graphs (Janvier, 1981; Leinhardt, Zaslavsky, & Stein, 1990).
METHOD
This study is part of a larger, 5-semester professional development in mathematics
project which included opportunities for twenty-five elementary teachers to engage in
extended collaborative exploration and problem-solving in learning mathematics, and
an emphasis on understanding others’ ways of knowing. The teaching and learning
backgrounds of the participants varied. In this paper, we examine the discourse of
seven teachers as they begin to study calculus in the fourth semester. Participants were
given a graph representing the rates at which water entered or left a reservoir over time
(Figure 1).
Figure 1: Reservoir Task (Connally, et al., 1998, p. 53)
Class sessions were videotaped. Video data was transcribed and verified by other
researchers. Instances in the transcript of conventional language or personal language,

Walter & Johnson
PME31―2007 4-235
and references to units, numerical values, or visual features were identified and coded
as shown in Table 1.
Code Name and Description Examples
S Conventional Language: A
collection of abstract terms used
by the participants that are found
in standard mathematical
literature.
Rate/Rate of Change;
Volume;
Increasing; Decreasing;
Slope; Constant
U References to Units: Gallons per minute; Miles per hour
N Numerical Values: One-half; Negative one
P Personal Language: References
to personal experience that extend
beyond the reservoir context.
The cows have had a drink and it's
gonna’ stay...
I want to fill up the bathtub
V Visual Features: References to
specific points or physical features
of the graph in the Reservoir Task.
Interval A to B.
What’s happening here? [point F]
Why does it have to go below?
Table 1: Language Codes and Examples.
DATA AND ANALYSIS
At the end of a three-hour class session, participants are asked to work on the reservoir
task for homework. At least seven participants stay after class to discuss the task. At
one table, Linda, Bill, Matt, and Michelle begin their discourse using primarily
conventional language (59-64). However, when Linda suggests that they change the
context to a bathtub (66), others begin to use personal language reflecting their own
experiences with filling or draining a bathtub (66-73).
59 Linda: The volume is increasing—does this work? It’s like the
volume is increasing, the volume stays the same, the
volume is increasing, the volume stays the same.
S
62 Bill: No, the rate is increasing, the rate’s staying the same, the
rate’s—
S
64 Bill: increasing, the rate’s staying the same S
66 Linda: Instead of, instead of the reservoir it’s the bathtub. P
67 Bill: Ok, bathtub. P
68 Linda: The bathtub. I’ve turned on the water and it’s coming
out—
P
69 Bill: Coming out lots— P

Walter & Johnson
4-236 PME31―2007
70 Linda: and then I need to get, yeah, a lot, and then it— [interval A
to B]
P V
72 Linda: my hot and my cold, ok, it’s just like perfect heat and then
it’s like getting—
P
73 Bill: No, no, no, nope, nope, that’s the time when you’re
actually turning it with your hand.
P V
The following week, four participants use linguistic invention to present to the entire
class their solutions. Language use in each presentation is summarized in Table 2.
Interval Linda Mike Connie Matt
O to A PV PSV PV PSUNV
A to B PV PSV PV PSUV
B to C PV PV PSUNV PSUNV
C to D PV PV PV PSUV
D to E PV PV PSV PSUNV
E to F PV PV PV PSUNV
F to G PV PV PV PSV
G to H PV PSV PSV PSUNV
H to I PV PV PV PSV
Table 2: Language Use in Presentations
Matt uses combinations of language in an interesting pattern as he shares the bathtub
story with the class. Only Matt used conventional language (S) in conjunction with
linguistic invention (P and V) and used units (U) and numerical values (N) to describe
more than one interval. Although the other participants did participate in linguistic
invention by using personal language in reference to the Reservoir graph, unlike Matt,
they did not consistently provide warrants explaining why they believed that their
stories were accurate. We found Matt’s presentation compelling for three reasons: (1)
the favourable manner in which his explanation is accepted by the other participants,
(2) the mathematical soundness of his interpretation, and (3) the strong personal nature
of his linguistic invention in semantic warrant production.
In Matt’s linguistic invention to explain the interval from A to B, he uses personal
language (870-872) and refers to a specific portion of the graph (871) before he uses
the conventional term “increasing” or introduces units “gallons per minute” (872) in
order to explicitly connect “turn that knob on” and the line segment from A to B on the
graph.
867 Matt: and I’m gonna to say we’re just getting into the bathtub at
this point, we’re thinking about taking a bath—
P
869 Matt: at that period of time, there’s no water going in, because
we say it’s zero gallons per minute,[O to A] kay?
P S N
U
870 Matt: Then, we decide I want to fill up the bathtub and so we P

Walter & Johnson
PME31―2007 4-237
start to turn that knob on [turns hand as though turning a
knob].
871 Matt: And as we’re turning it, that’s the period between here
and here [A to B].
P V
872 Matt: Because as we’re turning it, we’re increasing the gallons
per minute of water coming in.
P S U
873 Michelle
:
Increasing the rate. S
874 Matt: We’re increasing the rate of water coming in . . . S
Immediately, Michelle offers, “increasing the rate” (873). Matt accepts this change in
language, but refines it, modifying “increasing the rate” by saying, “increasing the rate
of water coming in” (874). The use of the conventional term “increasing” may be
viewed as a warrant for Matt’s linguistic invention because it explains why his data
(the bathtub story and the Reservoir graph) support his conclusions. Matt purposefully
chooses to refer to rate without mentioning “rate” or “volume” by saying “the gallons
per minute.” “Gallons per minute” is a backing instantiation for “rate.” Consequently,
when Matt says “increasing the gallons per minute,” he supplies a connection between
the experience of “start to turn that knob on” and the meaning of the graph on the
interval from A to B because “increasing the gallons per minute” clearly indicates the
concept of “increasing rate.”
Similarly, Matt uses numerical values as backing to demonstrate what he means by
increasing or decreasing. In Matt’s explanation of the interval from E to F (896-905),
Matt backs “the rate” (901) with “the gallons a minute” (902) and he backs
“decreasing” (900) with “from one and a half . . . to one . . . to zero” (903).
896 Matt: Then we think, [E] ‘you know what, I’ve got enough water,’
so we start turning the knob off—
P V
898 Matt: at this point we start to turn it off [E]— P V
899 Matt: this is the point at which we, we’re fully off— P V
900 Matt: but as we’re turning we’re decreasing— P S
901 Kim: The rate. S
902 Matt: the gallons a minute U
903 Matt: from one and half gallons per minute to one gallon per
minute to zero gallons per minute—
N U
905 Matt: right here [F]. V
Matt repeats his pattern of warranting his linguistic invention for each portion of the
reservoir graph. This pattern includes first presenting the linguistic invention by
associating an event in the bathtub story to a portion of the graph and then warranting
the linguistic invention by using conventional language, and backing that language

Walter & Johnson
4-238 PME31―2007
with units and numerical values to identify concepts of increasing, decreasing and
constant rates that his narrative shares with the specific interval on the reservoir graph.
Matt concludes that the volume of water is increasing on the interval from A to F,
constant on 0 to A, increasing fastest on D to E, and decreasing on F to I.
Michelle adapts Matt’s pattern of linguistic invention as she rehearses the bathtub
story. Michelle begins by referring to the interval from H to I (992) on the reservoir
graph.
992 Michelle
:
Ok, so from H to I, what are we doing, what’s happening? V P
993 Matt: Turning the drain off. P
994 Michelle
:
Ok, so we turn the drain off, and thereby increase the rate? P S
Matt supplies the personal interpretation of “turning the drain off,” (993) completing
the linguistic invention. Michelle engages in semantic warrant production as she
appropriates Matt’s personal language and uses the word “thereby” to make explicit
the linguistic invention that connects personal language, the graph, and conventional
language (994).
DISCUSSION
In this study, participants were asked to interpret a graph in terms of a given context.
Some participants chose to interpret the graph in different contexts: watering cattle,
driving a car, or filling a bathtub. We infer that each context of choice was more
familiar than the given reservoir context. This inference is supported by participants’
transitions from third person to first and second person in the interpretation narratives
during presentations in class. Participants engaged in linguistic invention when they
related personal experiences, such as filling a bathtub, to the graphical representation
of the rate at which water was entering or leaving a reservoir. Recognition of learners’
purposeful choices (First Author, in press) to consider more familiar contexts, extends
Roth’s (2002) findings on the importance of familiarity with phenomena in
transparently reading graphs.
Matt’s decision to interpret the Reservoir Graph in the context of a bathtub may also
reflect an awareness of his audience. Matt may have considered the experience of his
peers as he produced various semantic warrants. According to Harel and Sowder (in
press), “teachers must take into account what constitutes ascertainment and persuasion
for their students and offer, accordingly, instructional activities that can help them
gradually refine and modify their proof schemes into desirable ones.” Matt’s
presentation also reflects Brown’s (2001) suggestion that mathematical understanding
may be “checked through the ability of the learner to tell convincing stories generated
by himself or borrowed from the teacher” (p. 55). “Further,” Brown continues, “this
understanding is only demonstrated if the learner can make use of conventional forms
of communication” (p. 55). Michelle progresses from assisting Matt in his presentation

Walter & Johnson
PME31―2007 4-239
and explanations, to supplying her own conventional language that connects what she
sees on the graph to the bathtub story. Michelle begins to demonstrate understanding of
the graph when she is able to use conventional language in semantic warrant
production.
IMPLICATIONS
We see evidence that elementary teachers engaged in learning challenging
mathematics used linguistic invention in the production of semantic warrants to
support mathematical inferences. Semantic warrant production occurs when learners’
goals are not toward the production of formal mathematical proof, but toward the
production of convincing, mathematical inference through linguistic invention.
Practicing teachers engaged in semantic warrant production to convince their peers of
mathematical inferences by articulating personally meaningful instantiations.
Instantiations, or data and backing, comprised personal experience contexts, which, for
these participants, represented the reservoir context of the task. In order for learners to
connect personal experience to mathematical situations in meaningful ways, key
mathematical concepts common to both contexts must be identified. This is the process
of abstraction identified by Dienes (1963/1977) as “the drawing out of some common
property from a number of different events, and thereby classifying these events as
somehow belonging together: they form a class” (p. 224). Therefore, a semantic
warrant is found in the use of conventional language to identify an abstract
mathematical class that unites the mathematical and personal situation.
Linguistic invention may relate mathematical concepts more effectively than
conventional mathematical vocabulary. If learners are not familiar with conventional
terms, their attempts to describe mathematical concepts using ordinary language may
provide a context for meaningful introduction of conventional language. If personal
stories are accompanied by the identification of correct concepts through conventional
language, learners’ understanding of general mathematical concepts within a given
context may increase.
References
Brown, T. (2001). Mathematics education and language: Interpreting hermeneutics and
post-structuralism (Rev. 2nd ed.). Dordrecht, Netherlands: Kluwer Academic Publishers.
Connally, E., Hughes-Hallett, D., Gleason, A. M., Cheifetz, P., Flath, D. E., Lock, P. F., et al.
(1998). Functions modeling change: A preparation for calculus (preliminary ed.). New
York, NY: John Wiley & Sons, Inc.
Dienes, Z. P. (1977). Dienes on the learning of mathematics. In R. E. Reys (Ed.), Readings in
Secondary School Mathematics (pp. 222-237). Boston: Prindle, Weber & Schmidt.
(Original work published 1963).
First Author. (in press).

Walter & Johnson
4-240 PME31―2007
Forman, E. A., Larraeamendy-Joerns, J., Stein, M. K., & Brown, C.A. (1998). ”You’re going
to want to find which and prove it”: collective argumentation in a mathematics classroom.
Learning and Instruction, 8(6), 527-548.
Hanna, G. (1990). Some pedagogical aspects of proof. Interchange 21(1), 6-13.
Harel, G., & Sowder, L (in press). Toward a comprehensive perspective on proof, In F. Lester
(Ed.), Second Handbook of Research on Mathematics Teaching and Learning. Reston,
VA: National Council of Teachers of Mathematics.
Hoyles, C. (1997). The curricular shaping of students’ approaches to proof. For the Learning
of Mathematics. 17(1), 7-16.
Janvier, C. (1981). Use of situations in mathematics education [Electronic version].
Educational Studies in Mathematics. 12, 113-122.
Leinhardt, G., Zaslavsky, O. & Stein M. K. (1990). Functions, graphs, and graphing; tasks,
learning, and teaching [Electronic version]. Review of Educational Research, 60(1), 1-64.
Loucks-Horsley, S., Love, N., Stiles, K. E., Mundry, S. & Hewson, P. W. (2003). Designing
professional development for teachers of science and mathematics (2nd
ed.). Thousand
Oaks: Corwin.
Moschkovich, J. (2003). What counts as mathematical discourse? In N.A. Pateman, B. J.
Dougherty, & J. Zilliox (Eds.), Proceedings of the 2003 Joint Meeting of the Group for
Psychology of Mathematics Education and the North American Chapter of the Group for
Psychology of Mathematics Education, (Vol. 3, pp. 325-331). Honolulu, HI: University of
Hawaii.
Pirie, S. E. B. (1998). Crossing the gulf between thought and symbol: Language as (slippery)
stepping-stones. In H. Steinbring, M. G. B. Bussi & A. Sierpinska (Eds.), Language and
communication in the mathematics classroom (pp. 7-29). Reston: NCTM.
Rodd, M. M. (2000). On mathematical warrants: Proof does not always warrant, and a
warrant may be other than a proof. Mathematical Thinking and Learning 2(3), 221-244.
Roth, W.-M. (2002). Reading graphs: contributions to an integrative concept of literacy
[Electronic version]. Journal of Curriculum Studies, 34(1), 1—24.
Toulmin, S. (1969). The uses of argument. Cambridge, UK: Cambridge University Press.
Weber, K., & Alcock, L.J. (2004). Semantic and syntactic proof productions. Educational
Studies in Mathematics 56, 209-234.
Yackel, E. (2002). What we can learn from analyzing the teacher’s role in collective
argumentation. Journal of Mathematical Behavior 21, 423-440.

2007. In Woo, J. H., Lew, H. C., Park, K. S. & Seo, D. Y. (Eds.). Proceedings of the 31st Conference of
the International Group for the Psychology of Mathematics Education, Vol. 4, pp. 241-248. Seoul: PME. 4-241
HOW DO MENTORS DECIDE: INTERVENING IN PRACTICE
TEACHERS’ TEACHING OF MATHEMATICS OR NOT
Chih-Yeuan Wang and Chien Chin
General Education Centre, Lan Yang Institute of Technology /
Department of Mathematics, National Taiwan Normal University
In this paper, we mainly investigate, through the teaching Critical Incident of Practice
(CIP), the ways mentors intervene in the mathematics teaching of practice teachers,
and the principles and underlying values for their interventions, based on case studies
of a group of 8 mentor-practice teachers and their students in secondary schools from
the first-year data of a 3-year longitudinal study. The preliminary results show that the
principles and ways of mentors’ interventions were varied, and they developed
frameworks of decision-making in mentoring closely related to the specific modes of
intervention that they chose. We expect that both mentors and practice teachers are
learning-to-see in mentoring, and developing their professional powers through the
co-learning cycle of teaching and mentoring.
INTRODUCTION
Student teachers of secondary mathematics in Taiwan study both mathematical and
educational courses in the university, followed by a paid placement of teaching
practice at a junior or senior high school as practice teachers. Some experienced school
teachers are assigned to be their mentor teachers. This new internship of addressing
in-school teaching practice and mentoring plays an important role in Taiwanese
teacher preparation programmes. It was reported that a novice mathematics mentor
switched his role in the one-year mentoring process from ‘mentor’ to ‘co-mentor’ and
then to ‘inner-mentor’ (Huang & Chin, 2003). Mentor teachers thus may play different
roles to foster the professional development of practice teachers in different periods,
for example model, coach, supervisor, helper, guide, supporter, facilitator, observer,
evaluator, critical friend, etc. (Furlong & Maynard, 1995; Jaworski & Watson, 1994;
Tomlinson, 1995). They may offer practice teachers every opportunity to learn,
including designing material, planning lesson, grading, observing mentors or other
teachers’ teaching, teaching in the mentors’ classes, to improve their “mathematical
power” and “pedagogical power” (Cooney, 1994). Thus the pedagogy of teachers
should be at the heart of promoting the professional growth of teachers (Clarke &
Hollingsworth, 2002). What most mentors usually do is to organise and offer practice
teachers opportunities to teach in a few pre-selected topics, and to discuss the collected
CIPs with them later. We are then interested in understanding the ways and principles
of mentors’ decisions on intervening in such CIPs.
Shulman (1986) distinguished teachers’ professional knowledge into three major
categories: subject matter content knowledge (MK), pedagogical content knowledge
(PCK), and curricular knowledge. Wilson, Cooney & Stinson (2005) suggested that
teachers’ perspectives on good teaching includes requiring prerequisite knowledge,

Wang & Chin
PME31―2007 4-242
promoting mathematical understanding, engaging and motivating students, and
organising effective classroom. Bishop & Whitfield (1972) also suggested that good or
effective teachers are those who are aware of the variables they can control, aware of
the likely effects of manipulating these variables in different ways, and able to
manipulate them so that they can achieve what they regards as effective learning. As
novices in the profession, the practice teachers might be unable to understand fully
what and how students think, to represent accurately what subject content they know,
to manage the classroom situations effectively, as Ponte, Oliveira & Varandas (2002)
observed that “it is not enough for pre-service mathematics teachers to have
knowledge of mathematics, educational theories, and mathematics education” (p. 96).
As can be foreseen that the majority of practice teachers are deficient in the
professional knowledge required and they are not yet good or effective enough in
teaching, so school mentors are mainly responsible for this. Nilssen (2003) also agreed
that mentors should endeavour to develop student teachers’ understandings of
child-centred approaches to teaching and pupil learning in the subject.
In general, school mentors possess two different identities. On the one hand, they are
mentors of teaching for the practice teachers; on the other hand, they still are teachers
for the students. Although they offer the practice teachers opportunities to teach in
their classrooms, but at the same time, they must consider the learning of his or her
students. When watching practice teachers’ teaching, due to lack of professional
knowledge and experiences, mentors might get the feeling that the students are
confused about or ignorant of what the teaching is going on, or classroom situations are
not under teacher’s control, so that they must deal with the situations at the critical
moment. Bishop (1976) considered CIs as the teaching events where the pupil(s)
indicated that “they don’t understand something, by making an error in their work or in
their discussion with the teacher, or by not being able to answer a teacher’s question, or
by asking a question themselves” (p. 42). Lerman (1994) described CIs as “ones that
can provide insight into classroom learning and the role of the teacher, ones that in fact
challenge our opinions and beliefs and our notions of what learning and teaching
mathematics are about” (p. 53), and “critical incidents are those that offer a kind of
shock or surprise to the observer or participant” (p. 55). Skott (2001) further addressed
that CIP possesses the feathers of offering potential challenges, requiring decision
making, and revealing conflicts. In the light of this, CIPs can be conceived from both
teaching and mentoring aspects, because the incidents invoke the conflicts and
challenges of mentors’ beliefs and values, as well as thinking about their roles or
identities from both a teacher and a mentor’s stand for making the best on-the-spot
decisions on the teaching-mentoring process.
It is likely that when teachers become more experienced in their teaching, then a kind
of decision schema or criteria develops (Bishop, 1976). The teacher’s value structure
also monitors and mediates the on-going teaching situation, connecting choices with
criteria for evaluating them, and then they carry out the decisions in a consistent
manner (Bishop, 2001). Gudmundsdöttir’s (1990) research indicated that teachers’

Wang & Chin
PME31―2007 4-243
PCK has been reorganized to take into considering students, classrooms and
curriculum revolving around their personal values, in other words, the values decided
what teaching methods are important for students’ learning the teachers believe.
Decision-making is therefore an activity at the heart of the teaching process (Bishop,
1976). We then consider mentors as decision makers in mentoring, paralleled to the
view of teachers as decision makers in teaching, in this case, a decision-making system
of mathematics teaching both informs and is informed by a decision-making system of
mentoring (as Figure 1). When mentoring CIPs occur and mentors encounter the
conflicts and challenges of their beliefs and values, whether the factors underlying
these incidents occur are due to lack of practice teachers’ professional knowledge or
capacity of managing classrooms, the value judgments must be activated (Goldthwait,
1996) and decide how they should do at the moment. One general technique a mentor
might use is to “intervene-in-action” of practice teachers when such CIPs appear. Our
interest is to describe the values underlying decision-making for mentoring.
Figure 1: A decision-making system for mathematics teachers’ teaching and mentoring
RESEARCH METHODS
The case study method, including classroom observations, pre and post-lesson
interviews, and mentor-tutor conferences, was used as the major approach of inquiry to
investigate the values of mathematics mentors. The systematic induction process and
the constant comparisons method based on the grounded theory (Strauss & Corbin,
1998) were used to processing data and confirming evidence characterized the method
of our study. Eight mentors (Mi, i=1~8) and their practice teachers (Ai, i=1~8) and
students (S) were participated in the 2005 academic year as the first of this 3-year
longitudinal case studies on the development of mentors’ “educative power” (Jaworski,
2001). Mi are all mathematics teachers with at least 4 years of teaching experiences,
but most of them might have insufficient experiences in mentoring Ai. We as both the
researchers and tutors visited every Ai twice during the academic year, one in the first
semester and the other in the second semester, observed Ai’s classroom teaching with
Mi and interviewed Mi in the later mentor-tutor conferences. The classroom
observations were focused on collecting CIPs of teaching and how Mi would react
when the CIPs occurred, and what ways Ai interact with Mi and S. The post-lesson
interviews helped us clarify and consolidate our observations, and we could explore
Teacher’s knowledge,
beliefs and experience
about teaching
Value structure on
PCK Teaching
decision-making
Value structure on
mentoring knowledge
Mentoring
decision-making
Teacher’s knowledge,
beliefs and experience
about mentoring

Wang & Chin
PME31―2007 4-244
the principles and underlying values of the Mi’ decision-making. And all classroom
observations and post-lesson interviews were tape recorded and later transcribed.
RESEARCH RESULTS AND DISCUSSIONS
According to the data collected through classroom observations and interviews in
mentor-tutor conferences, we distinguish initially the manners of mentors’ on-the-spot
teaching interventions into three major categories: active intervention, passive
intervention, and no intervention. Two subcategories direct intervention and indirect
intervention are also salient within active intervention category. It is not possible for us
to report all CIPs of the 8 cases, but an outline of our categories for the interventions is
given in table 1.We will describe in detail the transcripts and interpretations of two
major CIPs and mentor interviews related to the active and passive interventions.
Active intervention Category
Direct Indirect Passive intervention No intervention
Case M3,M5 M5 M6 M1,M2,M4,M7,M8
Values
(underlying principle
of intervention)
Caring about
students
Concerning teacher
self-esteem
Supporting teacher
authority
Caring about students
Caring about students
Considering
professional identity
Concerning teacher
self-esteem
Supporting teacher
authority
Table 1: Categories of mentor teachers’ on-the-spot interventions observed
CIP1
After introducing the concept of ‘the equation of circle’, A3 asked students to do the
exercise: ‘Find out the shortest and longest distance between point P(-3,5) and circle:
x2+y
2-2x-4y-4=0, and the coordinates of these points’. A series of teacher-student
dialogues were then developed as follows:
A3: Given an equation of circle and a coordinate of point, what is the shortest and longest
distance between point P(-3,5) and circle: x2+y
2-2x-4y-4=0, and the coordinates of these
points? (A3 drew a circle on the blackboard)
A3: Where can we find the nearest point? (A3 drew the point P outside the circle)
S1: (The first student’s response) Teacher, why the point P is outside the circle?
A3: It must be outside the circle according to the meaning of the question.
S2: Teacher, if the point P is inside the circle, how would it be?
A3: We can’t do it if the point P is inside the circle.
S3: Why not?
A3: Maybe we can do it, but… (A3 was thinking)
M3: We can do it either the point P is outside or inside the circle, but just the answers will be
different.
A3: Right, we can do it regardless where point P is. (A3 continued the lesson)
In CIP1, we found that A3 was too urgent in solving the problem through the action of
“drawing the point P outside the circle”. He didn’t consider that students might trouble in
seeing the exact position. Consequently, one student came up with “why the point P is
outside the circle?” and the other was then asking “if the point P is inside the circle, how would
it be?” We think that he was lack of understanding students’ mathematical experiences

Wang & Chin
PME31―2007 4-245
while learning the topic. His MK was also questionable of saying “we can’t do it if the
point P is inside the circle” and “maybe we can do it, but…”. When A3 was thinking the
students’ questionings, M3 stated directly that “we can do it either the point P is outside or
inside the circle, but just the answers will be different”. M3 considered the content A3 taught
might let the students confuse or misunderstand, even influence their future learning,
so he had to clarify it immediately. We viewed CIP1 as a teaching CIP, because it
resulted in challenging A3’s teaching and leading M3’s active intervention.
In the post-lesson interview, we asked M3 what problems there were in the CIP1? He
said that “A3’ trouble was that he sometimes thinks students all understand the contents; so, he drew
point P outside the circle directly today. And his MK was more or less problematic; it might then have
embarrassed the students”. When we asked the principles of his sudden intervention, he
indicated that “if practice teachers let students confuse due to their faults or misleading, and then
might further influence the learning of students, I will intervene in their teaching immediately”. In
the interview, he described his underlying belief for this intervention as “the most
important thing what teachers must consider in teaching is the learning of students”. We asked
why he had to intervene in A3’ teaching actively and immediately, and whether it
would attack A3 self-esteem, teaching authority and the students’ feelings about him.
He mentioned that “when students having the reflection and question, if I didn’t deal with and
clarified it at the moment, maybe they would forget it after some days and the misunderstanding
would still remain in the mind of students” and “the students’ feelings about him were not so bad, I
was just addressing problem and I didn’t intend to take the lead”. In tis case, when mentors think
that the MK of practice teachers was problematic and it could let the students confuse,
then they may actively intervene in the teaching directly; and the most important focus
for them is on student’s learning.
CIP2
A6 was lecturing the topic of ‘the formulary solution of the system of linear equations’.
She illustrated the operation of determinantal expansion in ‘Cramer’s rule’. When she
introduced ‘normal vector’ and ‘vector product’ with determinantal expansion and
suddenly got a feeling that the content of teaching was out of her control. A series of
mentor-practice teacher dialogues were then developed as follows:
A6: Mentor, do I speak far away from the topic? I connect it with the meaning of geometry. (A6
was looking at M6)
M6: You can’t go back to the beginning now. (The whole class was laughing) You can ask them,
and then you would perhaps understand their problem through their facial expressions.
A6: I need help (from M6).
M6: Let me take it over. (The whole class was laughing and clapping again)
M6: (To the whole class) A6 is lack of teaching experience that you all understand, isn’t it? (M6
took over the teaching and finished the lesson)
In CIP2, we found that A6’s MK was alright, but she was just unable to adopt a more
accessible way of introducing the concept. We though that A6 and M6 were aware of
the condition by “Do I speak far away from the topic? I connect it with the meaning of geometry”
and “You can’t go back to the beginning now”. Although M6 was aware of some students’

Wang & Chin
PME31―2007 4-246
confusions, but he didn’t intend to intervene in A6’s teaching in the beginning; he
intervened until A6 asking for help. M6 conceived that A6’s problem was about PCK
and teaching experience rather MK, so that he was just observing how A6 would do
with the situation till A6 conveying the signal for help, so he was forced to intervene in
A6’s teaching. We considered CIP2 as a teaching CIP, because it just challenged A6’s
teaching and led M6 to passive intervention.
In mentor-tutor conference, M6 confessed that he would not have taken A6’s teaching if
she did not ask for immediate help by saying that “no, I just observe how she deals with the
condition; I play the role of an observer”. We asked if A6 encountered difficulties in teaching
but didn’t ask for help, then whether he would help her or not? He answered that “I
would certainly not intervene in her teaching, since my roles are observer and mentor, not a teacher,
at the moment, and I have no reason to intervene instantly when time is sufficient for me to lead the
students to re-visit the concept later”. We then asked M6 “if you consider the students’ learning at
that moment”. He then indicated that “she is just a bit lack of PCK and teaching experiences, her
MK is alright” and “she just uses a more complicated method to illustrate the subject, if she is
unaware of using a simpler method then I will correct it next lesson”. But M6 took the lead to
lecture the content finally, he said to us “in such situation, the teaching process couldn’t be
gone on well, so I was forced to intervene in her teaching at that critical moment”. Therefore, if
mentors think that the MK of practice teachers is unproblematic and is just lack of
general teaching experiences, they are not necessarily intervening in teaching on the
spot, and may just talk to practice teachers in after lesson or correct later by themselves.
Sometimes the mentors are forced to intervene in the teaching of practice teachers due
to their expectations and invitations (for help).
From the above two exemplary CIPs, we find the teaching CIPs of practice teachers
appear when their professional knowledge is not properly used or their teaching
decisions are moving toward an inappropriate direction. Mentors view these CIPs as
mentoring CIPs and using them as the opportunities to guide mentees’ professional
development. We find also that the decision-making system in teaching for practice
teachers will arouse the mentor’s system of decision-making in mentoring. Therefore,
mentors may adopt a variety of ways and strategies based on their value priorities to
intervene in practice teachers’ teaching.
RESEARCH CONCLUSIONS AND IMPLICATIONS
Understanding the varied principles for and ways of teaching intervention
The principles and ways of mentors’ interventions in teaching are varied depending on
the values upheld. We find that what the mentors indicate most frequently is about the
shortage of practice teachers’ professional knowledge, teaching experiences and
management capabilities; and what they concern most is the learning of students. But
there were mentors who did not intervene in the CIPs where practice teachers were
teaching, even if the occasions that they had professed were appeared eventually. We
also find that some mentors’ mentoring strategies were changing in the format of
intervention at different tutoring periods in terms of their own reflection-on-mentoring.

Wang & Chin
PME31―2007 4-247
So, we think that the affective dimension should also be viewed as the principles
influencing mentor teachers’ teaching interventions. At the same time, our previous
proposal of ‘distinguishing the manners of on-the-spot intervention into active
intervention including direct and indirect intervention, passive intervention and no
intervention’ is perhaps oversimplified and needs to be further examined.
Developing the framework of decision-making for mentoring
When mentors decide whether they intervene in the teaching of practice teachers or not,
as if they make decisions about mentoring, their underlying values and beliefs about
mentoring are likely to be revealed at that moment. Mentors enact their value
structures about mentoring through the relevant knowledge, beliefs and experiences,
the structures monitor and mediate the on-going teaching-mentoring situations. When
the teaching CIPs appear, they make choices in terms of certain intervention criteria for
evaluating them, and then they carry out the resulting decisions in mentoring; and the
criteria and choices may reorganize mentor’s value structure, it will reveal other
priority in the next intervention (see Figure 2). We could further explore whether there
were other values and principles about mentors’ teaching interventions except those
we have discovered.
Figure 2: A framework for decision-making on intervention in mentoring
Learning-to-see through teaching CIPs
The meaning of mentors’ teaching interventions is not only for correcting the practices
teachers’ faults and caring the students learning; the major purpose for the
interventions is for education which means to foster the practice teachers’
mathematical and pedagogical powers through teaching interventions while mentoring.
At the same time, we can view CIPs of teaching interventions as the catalysts to
advance mentors’ educative power. But most of the mentors we studied were still
beginners in mentoring, so, ‘how to discover and effectively use these CIPs of
mentoring?’ is a question worthy to be re-examined. We expect that practice teachers
learn to develop their mathematical and pedagogical powers, and meanwhile mentors
learn to develop their educative power through their own CIPs; that is, mentors and
practice teachers can both learn-to-see in mentoring together (Furlong & Maynard,
1995), and empower their own professional growth through the co-learning cycle of
teaching and mentoring (Huang & Chin, 2003).
References
Bishop, A. J. (1976). Decision-making, the intervening variable. Educational Studies in
Mathematics, 7, 41-47.
Mentor’s
knowledge,
beliefs and
experiences
Mentor’s value
structure
Intervention
criteria and choices Intervention
decisions implement
Teaching CIP

Wang & Chin
PME31―2007 4-248
Bishop, A. J. (2001). Educating student teachers about values in mathematics education. In F.
L. Lin, & T. J. Cooney (Eds.), Making sense of mathematics teacher education (pp.
233-246). Dordrecht: Kluwer Academic.
Bishop, A. J., & Whitfield, R. C. (1972). Situations in teaching, Maidenhead: McGraw-Hill.
Clarke, D., & Hollingsworth, H. (2002). Elaborating a model of teacher professional growth.
Teaching and Teacher Education, 18, 947-967.
Cooney, T.J. (1994). Teacher education as an exercise in adaptation. In D. B. Aichele & A. F.
Coxford (Eds.), Professional development for teachers of mathematics: 1994 year book
(pp. 9-22). Reston: NCTM.
Furlong, J., & Maynard, T. (1995). Mentoring student teachers. London: Routledge.
Goldthwait, J. T. (1996). Values and education: Helping history along. The Journal of Value
Inquiry, 30, 51-62.
Gudmundsdöttir, S. (1990). Values in pedagogical content knowledge. Journal of Teacher
Education, 41(3), 44-52.
Huang, K. M., & Chin, C. (2003). The effect of mentoring on the development of a secondary
mathematics probationary teacher’s conception(s) of mathematics teaching: An action
research. Journal of Taiwan Normal University: Mathematics & Science Education, 48(1),
21-44. (In Chinese)
Jaworski, B. (2001). Developing mathematics teaching: Teachers, teacher educators, and
researchers as co-learners. In F. L. Lin & T. J. Cooney (Eds.). Making sense of
mathematics teacher education (pp. 295-320). Dordrecht: Kluwer Academic.
Jaworski, B., & Watson, A. (1994). Mentoring, co-mentoring and the inner mentor. In B.
Jaworski, & A. Watson (Eds.), Mentoring in mathematics teaching (pp. 124-138). London:
The Falmer Press.
Lerman, S. (1994). Reflective practice. In B. Jaworski, & A. Watson (Eds.), Mentoring in
mathematics teaching (pp. 52-64). London: The Falmer Press.
Nilssen, V. (2003). Mentoring teaching of mathematics in teacher education. Proceedings of
the 27th Conference of the International Group for the Psychology of Mathematics
Education (Vol. 3, pp. 381-388). Honolulu, Hawaii: University of Hawaii.
Ponte, J. P., Oliveira, H., & Varandas, J. M. (2002). Development of pre-service mathematics
teachers’ professional knowledge and identity in working with information and
communication technology. Journal of Mathematics Teacher Education, 5(2), 93-115.
Shulman, L. S. (1986). Those who understand: Knowledge growth in teaching. Educational
Researcher, 15(2), 4-14.
Skott, J. (2001). The emerging practices of a novice teacher: The roles of his school
mathematics images. Journal of Mathematics Teacher Education, 4(1), 3-28.
Strauss, A., & Corbin, J. (1998). Basis of qualitative research: Techniques and procedures
for developing grounded theory (2nd
ed.). Thousand Oaks: Sage Publications.
Tomlinson, P. (1995). Understanding mentoring: Reflective strategies for school-based
teacher preparation. Buckingham: Open University Press.
Wilson, P. S., Cooney, T. J., & Stinson, D. W. (2005). What constitutes good mathematics
teaching and how it develops: Nine high school teachers’ perspectives. Journal of
Mathematics Teacher Education, 8(2), 83-111.

2007. In Woo, J. H., Lew, H. C., Park, K. S. & Seo, D. Y. (Eds.). Proceedings of the 31st Conference of
the International Group for the Psychology of Mathematics Education, Vol. 4, pp. 249-256. Seoul: PME. 4-249
EXPLORING AN UNDERSTANDING OF EQUALS AS
QUANTITATIVE SAMENESS WITH 5 YEAR OLD STUDENTS
Elizabeth Warren
Australian Catholic University.
Many students persistently experience difficulties in their understanding of the equal
sign with the common misconception of equal signifying a place to put the answer
being prevalent at all levels of schooling. It is conjectured that one reason for this is
the types of activities that occur in the early years. This paper reports on the results of
a teaching experiment conducted with forty 5 year olds. A purposeful sample of 4
students participated in two clinical interviews. The results of these interviews
indicated that not only are young students capable of understanding equal as
quantitative sameness but they can represent this using real world contexts and in
symbolic form.
INTRODUCTION
The question that persists in the algebraic domain is: why do so many adolescents face
difficulties with algebra? Is it an issue of readiness and/or that the teaching or
curriculum to which students have been exposed has been preventing them from
developing foundational mathematical ideas and representations? There is a wealth of
evidence emerging? that is beginning to support the later (e.g., Carraher, Schlieman,
Brizuela & Earnest, 2006). Research has shown that students are not only capable of
engaging in functional thinking at a young age but also that carefully chosen tasks,
materials and conversations support them in these discussions. One area that has been
given little attention is the area of equivalence, and in particular the meaning of equals.
While much has been written about students’ misconceptions with regard to the equal
sign, there has been little research on young students’ understanding of equivalence
and in particular identifying teaching and tasks that begin to support this
understanding.
In mathematics, the use of the equal sign appears to fall into four main categories.
These are (a) the result of a sum (e.g., 3+4=7), (b) quantitative sameness (e.g.,
1+3=2+2), (c) a statement that something is true for all values of the variable (e.g.,
x+y=y+x), and (d) a statement that assigns a value to a new variable (e.g., x+y=z)
( Freudenthal, 1983). With regard to quantitative sameness, "equals" means that both
sides of an equation are the same and that information can be from either direction in a
symmetrical fashion (Kieran & Chalouh, 1992). Most adolescent students do not have
this understanding; rather they have a persistent idea that the equals sign is either a
syntactic indicator (i.e., a symbol indicating where the answer should be written) or an
operator sign (i.e., a stimulus to action or “to do something”) (Behr, Erlwanger &
Nichols, 1980; Filloy & Rojano, 1989). Carpenter and Levi (2000) claim that many
students complete elementary school with a very narrow view of ‘equal’ and with an
emphasis on finding the answer. Given that in the elementary classroom,

Warren
PME31―2007 4-250
misunderstandings regarding the equal sign develop at an early age and remain
entrenched as students’ progress through school (Warren, 2006). The question is are
young children capable of equivalence thinking and if so what types of activities begin
to support the development of this thinking?
In the early years the equal sign is closely linked to the development of the concepts of
addition and subtraction. There has been a vast amount of research relating to this area
of mathematics (e.g., Nesher, Greeno, & Riley, 1978; Verngaud, 1982; Verschaffel &
De Corte, 1996). Each has classified addition and subtraction problems into various
categories. For example, Nesher et al. (1978) identified 14 types of addition and
subtraction word problems, each falling under the major categories of change, combine
or compare. Change problems refer to dynamic situations in which some event changes
the value of the quantity. Combine problems relate to static situations where there are
two amounts that are considered either separately or in combination. Compare
problems involve two amounts that are compared and the difference between them
ascertained. Further distinctions were made depending on the identity of the unknown
quantity. Other groups identified different classification systems (e.g., composition of
two measures, transformations linking two measures, and static relationships between
two measures, Verngaud, 1982). In all of these instances the focus was on first
interpreting the problem, second ascertaining the appropriate representation for the
problem, and third finding the answer. Textbooks and classrooms tend to be permeated
with these types of problems, particularly rudimentary change and compare problems.
While these problem types support the development of computational understanding
and give insights into the interpretation of word problems, their primary focus is on
computation. Little research has occurred on what types of problems support the
development of equivalence and particularly the notion of quantitative sameness. The
focus of the research reported in this paper was developing an understanding of equal
as quantitative sameness, hence the choice of using compare type problems involving
two quantities of the same value as the basis for classroom activity.
This research project investigates young children’s development of algebraic thinking
utilising unmeasured quantities (i.e., length, volume, and area) in conjunction with
number and the operations. The advantage of unmeasured quantities is that numbers
are not required to investigate ideas such as equivalence and non-equivalence or
generalisations such as a=c+d then c+d=a (Davydov, 1982).These can be explored by
using concrete models such as streamers of differing lengths. Thus young children can
investigate and conjecture about the ‘big’ ideas of mathematics, focus on processes
rather than products, and develop relevant language and representations before they
even formally begin number.
The particular aims were to (a) use unmeasured quantities to develop a language base
to describe equal situations, and (b) transfer this language to create compare stories
with a focus on quantitative sameness. The conjecture was that a focus on these two
aspects in the early years assists students to broaden their understanding of equals
beyond ‘the result of a sum’.

Warren
PME31―2007 4-251
METHODS
Three schools volunteered to participate in the Professional learning. Each school was
requested to select two Year 1 teachers on the understanding that they would be
working together to collaboratively develop learning experiences for implementation
in their classrooms. Thus a total of six teachers participated in the project, two from
each site. The teachers were also aware that their learning would be fully supported by
the researcher. The focus of this paper is on one aspect of the larger project, the
students who participated in the classrooms where the focus was on equivalence. The
average age of the participating students was 5 years.
The teaching cycle consisted of four dimensions, collaborating planning 4 lessons,
with the researcher critically reflecting on the lessons, implementing the adjusted
lessons in their classroom, and, sharing the outcomes with the whole group. This cycle
was repeated twice. During the teaching phase electronic contact was maintained
between the pair of teachers and the researcher. All lessons were video taped. In the
equivalence classrooms, the teaching experiment consisted of two phases. Phase 1
focused on developing the language of equals (e.g., same as, different from, equal)
using unmeasured quantities in comparative situations such as comparing the amount
of liquid in two containers, the height of two children, the weight of two objects. Each
situation involved comparing two quantities with one attribute difference, for example
colour or height, introducing the language of different from and comparing two
quantities and in situations where one attribute was the same, introducing the language
of same as and equal. Physical balance scales were used to compare the masses of
various objects. Phase 2 aimed to transfer these contexts and understandings to number
situations with a focus on the attribute of number (e.g., 2 parrots add 3 galahs is the
same as 3 parrots add 2 galahs 2+3=3+2).
To ascertain students’ learning four students were purposefully selected by the
teachers as representing the spread of ability of the participating students. At the end of
each cycle these students participated in a clinical interview. Because of the age of the
students the data gathering was based on Piaget’s Clinical Interview, where inferences
are drawn from young student’s behaviour in activities as much as from what they say.
All interviews were audio-taped and detailed notes were kept. Interview 1 focused on
ascertaining the students’ understanding of equality, and their ability to apply this
understanding to a situation involving numbers. Interview 2 moved to seeing if
students could transfer this understanding to addition situations. There was
approximately a two month period between each interview.
RESULTS
In the first interview students were asked what they thought the words equal, same,
different, and balance meant and to give examples of each of these. They were then
asked to look at the two diagrams (see Table 2) and state whether they were true or
false giving a reason for their answer. Table 1 summarises their explanations for the
meaning of the words. The order in which the students appear in the result is according

Warren
PME31―2007 4-252
to their perceived ability. Brianna represented the weaker students in the class and
Olivia represented the more able students.
Table 1.
Student’s explanations of the words equal, same and different.
Student Equal Same Different
Abby Same as each other. Two blue teddies and
everything the same are equal.
Two people with different
coloured eyes would not be
equal.
Brianna If something is the same. If something is wood and
something else is wood they
are the same as.
If something is blue and
something is yellow they are
not the same as.
Ethan Equal means the same
height, the same number.
Same height as each other. Different height and different
number.
Olivia Equal means the same as
like that.
The same as sought of means
the same as equals.
Like one is red and one is
blue.
The students were given a selection of coloured bears and were asked to use the bears
to show what each of these words meant. Nearly all of them focused on the attribute of
colour to demonstrate their understanding of equal, same and different. The students
were also asked to explain the word balanced. In each instance the students used
gestures to represent balance. Abby put her arms out horizontally and said If you were
walking along a bridge and in that hand had three cans and the other hand you had
three cans you would be balanced. The other three children used their hands to show
balance. In each instance they put their hands at the same height. Olivia added you
could have two bananas in each. They would balance. Ethan said If you weren’t
balanced one would be up and one would be down. They are not equal. For the two
diagrams in Table 2, they were asked if they were balanced or not balanced and to
explain how they knew.
Table 2
Student’s explanation of the two diagrams.
Student Problem 1
Problem 2
Abby Because that one has 1, 2, 3, 4, 5 and that
one has 1, 2, 3, 4, 5. They both have 5.
1 2 3 4 5 and 1 2 3 4 5 6 8. That it not
equal because one has 5 and one has 8.
Brianna Balanced. You can easily tell by the
numbers, 5 and 5.
Not balanced because 5 and 8 they are
not balanced.
Ethan Because they both have the same amount
of balls. But when you look far away they
That has more than that one so that is the
heaviest and that is the lightest. That one

Warren
PME31―2007 4-253
look not balanced. A triangle can’t
balance things. A triangle wobbles.
should be down [gesturing to the LH
pan] and that should be up.
Olivia They look equal. They are the same
height, the same level [ignoring the
number of balls in each pan].
I just went like that with my finger
[holding her finger in the air] and it goes
down so it is not equal.
Interestingly the picture of the balance scale both assisted and detracted from reaching
an understanding of equivalence. For Abby and Brianna it appeared to act as an
effective analogue for equivalence, assisting them in identifying and comparing the
two differing sides of the equations, and ascertaining if they were the same or different.
By contrast, for Ethan and Olivia their attention turned to the icon itself and decisions
were made according to if the icon looked as if it was horizontal/level rather than if the
number of balls in each were the same. Even the triangular shape came into play, with
Ethan commenting that a triangle wobbles so it cannot be balanced.
In the second interview they were again asked to explain the words equal, same and
different. Their responses were similar to those offered in Interview 1. They all
proffered examples utilising same and equal to describe situations where the attribute
was the same and different from for situations where the attribute was different. They
were then asked to examine two situations (the boxes and Christmas trees) and (a)
write an equation, and (b) make up a story for each.
Table 3
Student’s equations for the toy boxes and Christmas trees.
Completion of Phase 2.
Student Problem 1
Problem 2
Students seemed to have more success in representing the Christmas trees as an
equation as compared with the two toy boxes. Abby still persisted in finding an answer,
tallying all the pears and bananas in both trees. Brianna and Ethan both exhibited
aspects of ‘fruit salad’ algebra where their notation systems were short hand for objects
(e.g., p for pears or a drawing of a pear). Their stories give further insights into their
understandings of the two contexts. For the toy boxes,
Abby
Brianna
Ethan
Olivia

Warren
PME31―2007 4-254
Abby’s story: Once upon a time there was two toy boxes and there were three dots in that
one and four dots in that one and they had three triangles in that one and two ones in that
one, two triangles in that one. There were twelve toys in each box and there was six toys
and six toys in that one and then they had an equal number in each box.
Briana’s story: In that box there are three dots and three triangles and in that box there are
four dots and two triangles.
Ethan’s story: I have never done that before.
Olivia’s story: Once upon a time there were two toy boxes and in one toy box there was
three circles and three triangles and in the other toy box there was four circles and two
triangles and then there was an equal amount of toys in the boxes was different
from…..What do you mean by that? The boxes look different.
Each response showed varying understandings of equals. Abby’s story seemed to
exhibit components of computational thinking, there were 12 toys altogether (finding
an answer – the result of a sum) and components of equivalence thinking as
quantitative sameness, each box had 6 toys. Even though Briana resisted finding an
answer to the toy box activities she experienced difficulties in including equal in her
explanation. Ethan could write equations for each of the situations exhibiting a
symbolic understanding of equals as quantitative sameness, though he failed to create a
story for each. By contrast, Olivia could not only write correct equations for each
situation but also explain each using appropriate language. She also endeavoured to
include the language of different from by focussing on the attribute of the appearance
of the boxes.
DISCUSSION AND CONCLUSION
This research suggests that young students can engage in conversations about equal as
quantitative sameness, each giving comparative examples such as the same height as
each other then they are equal. Embedding their initial explorations in a numberless
world allowed them to develop some understanding of the language commonly used to
describe equivalent situations. As Davydov suggested, it also appeared to assist them
in focusing on the important mathematics in this situation, that is, quantitative
sameness incorporates comparing two quantities that are the same. The physical
context in a numberless world appeared to assist them in developing the language of
equivalence and they were capable of transferring this language to situations involving
number, although success appeared to be closely related to context. For example, the
students exhibited greater success when comparing the two Christmas trees than
comparing the shapes in the box. Phase 2 interviews occurred just before the Christmas
break where many of the students were engaged with placing ornaments on their
Christmas tree. They certainly found both of these contexts simpler than the context
with the balance scales.
During Phase 1 students were introduced to the notion of balance and explored whether
the scales were even/level. They also engaged in whole body experiences where
various objects were placed in either of their hands and they were asked to model using

Warren
PME31―2007 4-255
their arms if they were balanced or not. Initially the attribute on which they focussed
was mass of different sized objects, with decisions being made on whether the pans or
their arms were level or not. This resulted in some confusion especially when
considering situations where there were a different number of objects in the pan with
each having the same mass. Most seemed incapable of separating the attribute of
number from the icon of the scales themselves. Past research has evidenced the
advantages of balance scales in exploring equivalent situations as they are not
directional in any way and can cope with the need to consider the equations as an entity
rather than an instruction to act and achieve a result. While balance scales can act as a
useful metaphor for equivalence, physical representations of the concept can in fact
interfere with transfer to number situations. For these young students equivalence was
judged not only on the number of objects in each scale but also as to whether the scales
appeared level, a consideration that for three students took precedence. The sequence
in which balance scales are presented to young students needs further research.
The results also begin to exhibit the development stages of students’ own notation
systems. This is especially applicable to the toy boxes in Table 3. Abby not only
miscounted the number of shapes drawn on the box but was still writing the numerals
as mirror images. Brianna began to incorporate the addition sign in her response. Ethan
had begun to use the equal sign. All of these three students included a drawing of a
triangle and circles in their equations. Their verbal response mirrored their notation
system, for example, 3 triangles equals 3 circles. By contrast, Olivia could not only
separate the number notation from a representation of the object but could incorporate
both the addition sign and equal sign in her response. She also expressed this as 3 add 3
equals 4 + 2. Past research in the domain of patterning has evidenced that there is a
strong relationship between describing a pattern and writing the rule for the pattern
(e.g., Warren, 2006). This research indicates that there also appears to be strong links
with verbalising an equation and writing the equation in symbolic form. The responses
to the Christmas tree story also evidence the use of letters as short hand for objects, a
common error that occurs with adolescent students as they transition into algebraic
thinking.
Past research has presented many examples of how adolescent students hold a
persistent belief that the equal sign is a syntactic indicator for a place to put the answer.
Our conjecture is that this is due to the type of arithmetic activities that occur in the
elementary years, especially experiences of arithmetic as a computation tool. The
results of this research begin to indicate that young students can come to some
understanding of equal as quantitative sameness. Whether they can continue to
negotiate two different meanings of equals as they begin to experience arithmetic as a
computational tool needs further investigation. Algebraic activity can occur at an
earlier age than we had ever thought possible and these experiences with appropriate
teacher actions may assist more students join the conversation in their adolescent years.
The expansion of compare stories to include comparisons that are the same, as well as

Warren
PME31―2007 4-256
different proved to be a productive means for introducing young students to equal as
quantitative sameness.
References
Behr, M., Erlwanger, S., & Nichols, E. (1980). ‘How children view the equals sign’, Mathematics
Teaching 92, 13-18.
Carpenter, T. P., & Levi, L. W. (2000). Developing Conceptions of Algebraic Reasoning in the
primary grades. (No. 00-2). Wisconsin, Madison: National Center for improving student learning
and achievement in mathematics and science.
Carraher, D., Schliemann, A. D., Brizuela, B. M., & Earnest, D. (2006). Arithmetic and algebra in
early mathematics education. Journal of Research in Mathematics Education, 37(2), 87-115.
Davydov, V. V. (1982). The psychological characteristics of the formation of elementary
mathematical operations in children. In T. P. Carpenter, J. Moser, M. & T. Romberg, A. (Eds.),
Addition and subtraction: A cognitive perspective. (pp. 224 - 239). Hillsdale, NJ: Lawrenece
Erlbaum Associates.
Filloy, E., & Rojano, T. (1989). ‘Solving equations: The transition from arithmetic to algebra’, For
the Learning of Mathematics, 9(2), 19-25.
Freudenthal, H. (1983), Didactical phenomenology of mathematical structures. Mathematics
Education Library: Reidel Publication.
Kieran, K., & Chalouh, L. (1992). Prealgebra: The transition from arithmetic to algebra. In T. D.
Owens (Ed.), Research ideas for the classroom: Middle grades mathematics. (pp. 179-198).
Macmillan Publishing Company, New York.
Nesher, P., Greeno, G., & Riley, M. (1978). The development of semantic categories for addition and
subtraction. Education Studies in Mathematics, 13(4), 373-394.
Vergnaud, G. (1982). A classification of cognitive tasks and operations of thought involved in
addition and subtraction problems. In T. P. Carpenter, J. Moser, M. & T. Romberg, A. (Eds.),
Addition and subtraction: A cognitive perspective (pp. 39-57). Hillsdale, New Jersey: Lawrence
Erlbaum Associations.
Verschaffel, L., & De Corte, E. (1996). Number and Arithmetic. In A. Bishop, K. Clements, C. Keitel,
J. Kilpatrick & C. Laborde (Eds.), International handbook of mathematics education (Vol. 1, pp.
99 - 137). Dordrecht: Kluwer Academic Publishers.
Warren E. (2006). Learning comparative mathematical language in the elementary school: A
longitudinal study. Education Studies in Mathematics, 62(2), 169-189.
Warren, E., (2006). Teacher actions that assist young students write generalizations in words and in
symbols. J. Novotna, H. Moraova, M. Kratka, & N. Stehlikova, (Eds.), Proceedings of the 30th
Conference of the International Group for thePsychology of Mathematics Education, 5, 377-384.
PME: Prague.

2007. In Woo, J. H., Lew, H. C., Park, K. S. & Seo, D. Y. (Eds.). Proceedings of the 31st Conference of
the International Group for the Psychology of Mathematics Education, Vol. 4, pp. 257-264. Seoul: PME. 4-257
CLASSROOM TEACHING EXPERIMENT: ELICITING
CREATIVE MATHEMATICAL THINKING
Gaye Williams
Deakin University
A classroom teaching experiment intended to elicit a high frequency of creative
mathematical thinking is reported. It was designed to operationalise pedagogy
enabling spontaneous creation of concepts through progressive increases in
complexity of thought processes. A recent study of creative thinking in classrooms
informed the design. Data was collected using a modification of the video/interview
techniques from the Learners’ Perspective Study. Cameras were positioned to capture
the activity of multiple student groups and their interim reports to the class. Four
students were interviewed after each lesson. By providing insights into links between
pedagogical moves, the quality of student thinking, and the creation of new knowledge,
this study informs pedagogy intended to optimise student learning.
INTRODUCTION
Cobb and Steffe (1983, p. 83) defined a ‘teaching experiment’ as “a series of teaching
episodes and individual interviews that covers an extended period of time”. This study
extends the conception of a teaching experiment from researchers working with
individuals or pairs outside, or within the classroom to a researcher as teacher (RT)
working with the classroom teacher (T) and the whole class. The teaching experiment
is part of a broader study of the role of optimism in collaborative problem solving. To
gain insights into group ‘collaboration’ in class, access to collaborative activity was
required. ‘Collaboration’, for the purposes of this study involves groups working
together beyond their present conceptual level to explore questions they spontaneously
set themselves as a result of identifying unfamiliar complexities and deciding to
unravel them. The teaching experiment design was informed by a recent study of
creative thinking in classrooms (Williams, 2005). The activities undertaken by these
students who managed to manoeuvre their own ‘spaces to think’ in classrooms where
this was not the explicit intention of the teacher provided insights into how the teacher
could set up a classroom environment that increases opportunities for ‘creative
thinking’ (‘spontaneous complex thinking’ called ‘complex thinking’ in this paper).
Most of the theory upon which this paper relies is integrated into the design and
analysis process. Complex thinking is analysed using Dreyfus, Hershkowitz, and
Schwarz’s (2001) RBC model integrated with Krutetskii’s (1976) mental activities
(Williams, 2005). The thinking of students becomes progressively more complex from
‘analysis’, ‘synthetic-analysis’, and ‘evaluative-analysis’ (Novel B) to ‘synthesising’
and ‘evaluating’ (Novel C). These terms are elaborated later.

Williams
PME31―2007 4-258
SITES AND SUBJECTS
This study was undertaken in a Grade 5/6 class of 22 students in a government primary
school in Australia. Students were from families that had been in Australia for more
than one generation and families that had recently arrived in Australia. The students
worked in six groups of three or four selected by the T and RT. The group of four
students selected to illustrate frequent complex thinking were Patrick, Eliza, Gina, and
Eriz (Group 1). They were selected because they worked well together and elaborated
their thinking clearly in their interviews. The teacher (T) had worked previously with
this researcher (RT), was aware of the pedagogical approach, had experimented with it,
and considered that participation in this research could improve her expertise in this
area. The task under study in this paper was the first task undertaken with the RT. It
extended over three eighty-minute lessons.
TEACHING EXPERIMENT DESIGN
The six activities in the Space to Think found common to the creative development of
novel ideas and concepts by five students in four classrooms in Williams’ (2005) study
of ‘creative thinking’ were: a) exploring optimistically; b) identifying complexities
within, beyond, or peripheral to the teachers’ task; c) manoeuvring cognitive
autonomy; d) accessing mathematics through cognitive artefacts, or by focusing
idiosyncratically on dynamic visual displays; e) spontaneously pursuing self-focused
exploration; and f) asking questions to structure future exploration. Each of these six
activities informed the pedagogy in the teaching experiment. Illustrations of
pedagogical moves associated with each of these six activities are now described:
Enacting optimism was valued by the RT (1Table 1, L1, 5:19): “we are always going
to do- change … [our] mind whenever … [we] want to- because that’s how people
learn- by having a try”. This was intended to encourage thinking about situations
where students were not yet successful to find what they could change to improve the
situation. Such activity is a characteristic of optimistic children.
Identifying Complexity: Task 1 (see Figure 1) provides many opportunities to
explore mathematical complexities associated with it. Students can employ complex
thinking through experimentation, and generation of specific examples (analysis, B),
simultaneous analysis of the examples generated (synthetic-analysis, Novel B) for the
purpose of making a judgment (evaluative-analysis, Novel B), and / or through finding
patterns (analysis), and considering the relevance of patterns (evaluative-analysis or
synthesis, Novel C if a logical mathematical argument given).
Initially, students were encouraged to use whatever language they were comfortable
with: RT: “you don’t have to use maths words … use any words you like for a start”
(Table 1, L1, 0:55). The small size of the blocks increased the likelihood that students
1 T1L1, 5:19 Interactions captured 5 minutes and 19 seconds into Task 1 Lesson 1

Williams
PME31―2007 4-259
would need to find language to describe boxes. Terms such as length, width, height,
cube and cuboid were expected to emerge through the lessons. Because students could
start working with specific examples, it was expected that all groups would have
access to experimentation. By asking for a mathematical argument for why there were
no more boxes (rectangular prisms) toward the end of Lesson 1, the mathematical
structure associated with volumes of these boxes was expected to emerge. Reduction in
the number of cubes per group (83, L1; 24, L2; 0, L3) and increase in the sizes of
volume students considered (to a number beyond 24 in Lesson 2) was intended to shift
students from counting to analysing the underlying structure.
Figure 1. Brief summary of the first task undertaken
The purpose of the task was to develop an informal understanding of volumes of
prisms, and to raise awareness of the meaning of factors and their relevance to this. It
was anticipated that a students would become better at thinking mathematically if the
RT drew attention to such thinking. E.g., RT: “Donald just made a mathematical
argument for why he thinks there are twelve.” (L1, 5:19).
Cognitive autonomy was addressed in two ways. During group work, groups
identified and pursued their own focus of exploration. Groups were composed so
students who were likely to think at a similar pace were together. This criterion is not
necessarily related to mathematical performance but rather related to the ability to
think about new ideas. In an attempt to compose groups where students would work
well together and think at similar paces, the RT used her prior experience in group
composition to assist the T to form groups.
Task 1
Part 1: Make boxes with 24 of these cubes. How many can you make? How do you know that
you have got them all? Can you make a mathematical argument for how you know you have got
them all? [Intention: elicit novel building-with and recognizing to support constructing]
Part 2: Late in Lesson 2, introduce a game for group competition. A ‘box’ with a volume of 36
little cubic blocks had been hidden in a big coloured container. Groups had 5 minutes to
develop strategies. The aim is to be the first group to find the ‘box’ dimensions. Each group can
ask a question that all class members could hear. RT and T will give Yes / No answers. Each
group can state what they think the dimensions are when they are sufficiently sure. They cannot
have a second turn at stating this until all groups have had a first turn. [Intention: to elicit
consolidating and increased elegance to support constructing]
Note: Two terms were introduced at the start of the task.
Box: was elaborated by the students identifying the features of a large cuboid prior to the task.
The RT drew attention to both cubic and non-cubic examples during this discussion.
Volume: was defined as the amount of 3D space taken up by the box and measured in cubic
centimetre blocks for this task.

Williams
PME31―2007 4-260
Autonomous access to mathematics was assisted by the minimal mathematical
background required in the task, the use common language, and intermittent reports
including visual displays in the form of concrete, written, and diagrammatic
representations that often progressively changed as groups discussed their thinking. As
the RT and T did not judge the correctness of the reports, groups made their own
decisions about what might be relevant to their idiosyncratic explorations.
Spontaneous Pursuit. Spontaneity is crucial to creative activity (Williams, 2005).
Steffe and Thompson (2000) called “‘spontaneous development’ development and
learning not caused by the teacher” (Steffe & Thompson, 2000, p. 289). This teaching
experiment was designed in the expectation that actions of the RT and T would
influence but not cause creative thinking in this class.
We do not use spontaneous in the context of learning to indicate the absence of elements
with which the student interacts. Rather we … refer to the non-causality of teaching
actions… we regard learning as a spontaneous process in the student's frame of reference.
(Steffe & Thompson, 2000, p. 291)
Williams (2004) operationalised spontaneity by subcategorising the social elements
identified by Dreyfus, Hershkowitz, and Schwarz (2001) to identifying what can
eliminate it. Spontaneity can be eliminated when there is lack of opportunity for a
group to follow their own direction (External Control), explanations are provided by an
external source (External Explanation), mathematical ideas are extended by an
external source (External Elaboration), external sources dispute findings (External
Query), external sources affirm the validity, correctness, or attainment of closure
(External Agreement), and / or external sources focus attention on an aspect of student
exploration and expect them to pursue it [External Attention/Control]. The RT and T
did not provide mathematical input related to spontaneous explorations but did draw
attention to aspects of findings and reports without judging the correctness of these
aspects and without expecting students to explore them.
Structuring Questions asked by the RT to elicit complex thinking were based on
questions students asked themselves and questions the RT had asked whilst a teacher
(see Williams, 2005, see p. 384). Some of these questions are illustrated herein.
RESEARCH DESIGN
The research question is: Does this teaching experiment elicit a high frequency of
complex mathematical thinking associated with developing new mathematical
knowledge, and if so, does the pedagogy influence this process? To study this question,
classroom pedagogy, student responses, and new understandings were captured
through classroom video and video-stimulated interviews. The Learners’ Perspective
Study methodology (Clarke, Keitel, & Shimizu, 2006) was modified to capture the
private talk of three groups, the physical activity of the remaining groups, interim
reporting sessions, and student reconstruction of their classroom thinking. Four
cameras were used, group written work was collected, and post-lesson
video-stimulated individual interviews were undertaken with four students after each

Williams
PME31―2007 4-261
lesson. Students were selected from at least two groups each lesson. Selection was
based on the positioning of video cameras, and the activity that occurred. In Group 1,
Eliza was interviewed after Lesson 2, and Patrick and Eriz after Lesson 3. Gina was not
interviewed during Task 1.
RESULTS AND ANALYSIS
Some of complexities groups discovered were: Would division help? (Group 2, Lesson
2). Could a cube be made with 24 blocks? (Group 3, Lesson 1). Would four always be
a frequent dimension for boxes of any volume (as in boxes of volume 24)? (Group 4,
Lesson 2). Why do some boxes need three numbers to represent them and other boxes
need only two (Group 4, Lesson 2)? And how can we find how many cubic centimetres
there are in a box when we do not have sufficient blocks to build it? (Group 1, Lesson
2). These diverse foci illustrate the potential for Task 1 to elicit spontaneous
exploration.
Table 1 shows the common structure to the three lessons [Column 1] and the
differences in foci between them [Columns 2, 3, 4]. It also shows parts of the lessons
where complex thinking was elicited and illustrates this thinking. There were intervals
in each lesson where complex mathematical thinking beyond that normally occurring
in classrooms was identified (beyond analysis, Williams, 2005). Some of this thinking
and the situations that influenced it are now elaborated. Student thinking tended to
become more complex when the RT asked questions about patterns, reasons why
patterns occurred, and whether there was a mathematical argument for why there were
no more boxes.
Eliza, in her interview identified what had led to her understanding of boxes as layers
of cubes. In Lesson 2, the group had only 24 cubes yet wanted to construct a 32 cubic
cm box. The group made a box with six layers of four and then drew the last two layers
of four on paper before counting all the cubic centimetres in groups of four. Eliza
explained what had happened in her interview after Lesson 2:
“ we had [sketching] six [lots of 4] stacked up like that … then we had … a drawing on
a piece of paper … we needed that to pretend there was another bit of eight”
The quality of Eliza’s understanding that boxes contained layers, and her elegant use
four layers of eight later was evident in her report in Lesson 2 [50:30] when she
explained how the group counted the number of cubes in a 32 cubic centimetre box:
“start by making … some- four (pause) flat boxes (pause) out of eight (pause) one
centimetre cubes (pause) … stack the four (pause) to make 32 (pause) … (pause) count
them- there should be (pause) four (pause) in (pause) the height and (pause) eight in the
length so you count- you use four times eight which is thir- so you have 32 in the box”.
Although Eliza used the term ‘length’ incorrectly in this instance, she had developed a
language to explain what she is doing and by the end of Lesson 3 was using this term
correctly. The hesitations in her communication could be due to her selection of new
words, or to the fragility of her conceptual understanding or both.

Williams
PME31―2007 4-262
Table 1 Overview of lesson structure/ RT questions/ Group 1 student responses
Lesson No./
Interval 1 2 3
Introduction 0-20:33 Task Part 1,
Classroom Culture
1:12-9:42 RT:
Introduced Part 2.
10:26-15:54 Think about 12,
27, 42 cubic cm boxes.
Group Work 23:21-31:30
Experimentation
(Analysis, B).
Recognized layers,
simultaneously
considered numeric and
physical strategies,
(Synthetic-analysis,
Novel B); Changed
orientation of box, Are
they the same?
(Synthetic-analysis)
9:42-34:07 Group 1
Designed a way to count
cubes 32 cubes when
they had 24.
Eliza: [Elegant method]
Found second easier way
to make same box.
(Evaluative-analysis, B,
synthetic-analysis for the
purpose of judgement]
15:54-35:30 Patrick began to
focus on numbers and gave a
tentative reasons for the
numbers he found.
(Evaluative-analysis, Novel
B; synthetic-analysis with
judgement)
Focus of
Reporting,
How to Prime
Reporter
31:30-33:34 RT: “ [the
reporter will] tell you
what they're going to
say... and you are going
to [make it] match[es]
what your group wants”
RT “[don’t] comment on
… whether you agree or
disagree … when …
person’s talking”
15:54-29:36
RT “Look … at those
numbers- what are they like?
Why?’
Priming
Reporters
31:30-33:34 Patrick:
“We made this one
because we divided six
into twenty four and we
got four [moves hand in
layers]”
(evaluative-analysis,
Novel B)
34:07-35:15 RT: “listen
carefully … we don’t
want you to repeat it- we
want to be able to say …
‘we agree with such and
such a group on this [and
maybe] but we do not
agree on that and this is
the reason why“
G 1 developed method to
find no. of cubes in a box
when insufficient blocks
to build.
(Synthetic-analysis,
Novel B, towards
Synthesis, Novel C
structure recognised).
29:36-35:13 G1 discussed
one coming up a lot and the
main number (12, 27, 42)
coming up only once unless
orientation of box changed.
Initial thinking about why
(Evaluative-analysis)
Reporting 37:11-1:08:27 Patrick
wondered whether the
same cube in a different
orientation counted.
35:15-1:16:21 G1:
Showed understood box
structure. (Synthesis,
Novel C)
35:13-1:10:09 RT: “What
mathematicians do is think
about why … are these the
patterns that are working?”
Summarising How will you know
when you have them all?
Give an argument.
Consider last report (the
term factors was used).
Will think further in L3.
Try to make a sentence for
the role of factors in making
boxes

Williams
PME31―2007 4-263
Having insufficient cubes to make a 32-cube box extended the thinking of Group 1.
The layered structure was made transparent and the ability to find answers by
multiplication slowly became apparent. This was simultaneous consideration of the
numerical and physical representation (synthetic-analysis, Novel B).
Synthetic-analysis occurs when two possibilities (e.g., solution pathways, or
representations) are considered simultaneously. Eliza also demonstrated
evaluative-analysis when she decided it would be easier to make four layers of eight
than eight layers of four for the 32-cube box. Evaluative-analysis (more complex
Novel B) is synthetic-analysis for the purpose of making a judgement. Eliza judged the
relative elegance.
Eriz reported finding difficulty keeping up with the thinking of the other group
members and identified the time when the group primed him to report in Lesson 3 as
useful for consolidating his thinking. The depth of his understanding was demonstrated
by his confident explanation to the class of the number of cubes in the box that was
“two long, two wide, and six high”. He calculated the number in a layer (two by two),
then multiplied by the number of layers. His use of this numerical form including all
three dimensions (before its meaning was reported by others) showed he did create
new understanding.
Patrick reported in his interview that incorrect reports of other groups had assisted his
thinking. In Lesson 3, Group 2 made a box containing 24 cubic centimetres when they
had meant to make one with 12. The Group 2 reporter stated: “the length was two- the
width was two and the height was six”. Patrick in his interview stated:
“You know how they got it wrong- it made me think about (pause) how they could get it
right (pause) um (pause) thinking that- it was 2 2 (pause) 2 2 6 (pause) and (pause). If it
was 24- they got 24 and they have to get 12 what if they changed the 6 to 3 and that would
just halve it and instead of 24 they would have 12.”
Although not stated explicitly, Patrick appeared to have halved the number of stacks in
the height. He thought deeply about many ideas during Task 1 and was close to finding
the role of factors in making these boxes. In his interview after L3 he stated:
“Mm … um … it was … when we were talking about the pattern it was … strange- four
only came up once but when we were working with the 24 it came up a lot more. I think- it
only come up in the 12s one … because 42 and 27 um four couldn’t fit into it.”
By simultaneously considering the findings for the boxes of different volumes, Patrick
undertook synthetic-analysis (Novel B). By making a tentative judgement about what
he found “because 42 and 27 um four couldn’t fit into it.” He had commenced
evaluative-analysis (a more complex Novel B). By testing these ideas further using
specific examples, he would continue to undertake evaluative-analysis as part of novel
building-with (Novel B). If Patrick had begun to think about why these numbers
mattered, he would have commenced synthesis as part of constructing (C). It is
possible he was doing so but not verbalising this.

Williams
PME31―2007 4-264
DISCUSSION AND CONCLUSIONS
In these three lessons, more instances of creative thinking were identified than in sixty
single lessons in the Learners’ Perspective Study (Williams, 2005). This might be
partly accounted for by changes in data collection processes leading to the capture
multiple groups rather than one student pair per lesson. The close links found between
the lesson structure in the teaching experiment and the complex thinking elicited
provide convincing evidence that the teaching experiment was successful. Complexity
of thinking increased as students: experimented, developed language to think about
and communicate ideas, considered the RT’s questions prior to reporting, developed
mathematical arguments to support their ideas, clarified what they wanted to
communicate during their reports (priming the reporter), and thought further about
ideas presented by other groups. The new knowledge by various students included
awareness of boxes as layers of cubes, ability to calculate the number of cubes using
layers, and some understanding of factors as relevant to constructing boxes of given
numbers of cubes. Further research is required to test the potential for this teaching
experiment to elicit creative thinking in other contexts. An area for further study is the
role of synthetic-analysis and evaluative-analysis in supporting constructing.
REFERENCES
Clarke, D., Keitel, C., Shimizu, Y. (Eds). (2006) Mathematics classrooms in twelve
countries: the insider's perspective. Sense Publications.
Cobb, P., & Steffe, L. (1983) The constructivist researcher as teacher and model builder,
Journal for Research in Mathematics Education, 14(2), 83-94.
Dreyfus, T., Hershkowitz, R., & Schwarz, B. (2001). The construction of abstract knowledge
in interaction. In M. van den Heuvel-Panhuizen (Ed.), Proceedings of the 25th conference
of the International Group for the Psychology of Mathematics Education (Vol. 2, pp.
377-384). Utrecht, The Netherlands: PME.
Krutetskii, V. (1976). Psychology of mathematical abilities in schoolchildren. (J. Kilpatrick,
& I. Wirzup (Eds.), J. Teller, Trans.). Chicago: University of Chicago Press. (Original
work published in 1968).
Steffe, L., & Thompson, P. (2000). Teaching experiments methodology: Underlying
principles and essential elements. In A. Kelly & R. Lesh (Eds.), Handbook of Research
Design in Mathematics and Science Education (pp. 267-306). Mahwah, NJ: Lawrence
Erlbaum.
Williams, G. (2005). Improving intellectual and affective quality in mathematics lessons:
How autonomy and spontaneity enable creative and insightful thinking. Unpublished
doctoral dissertation, University of Melbourne, Melbourne, Australia. Accessed at
http://eprints.infodiv.unimelb.edu.au/archive/00002533/
Williams, G. (2004). The nature of spontaneity in high quality learning situations. In M.
Hoines & A. Berit Fuglestad (Eds.), Proceedings of the 28th conference of the
International Group for the Psychology of Mathematics Education (Vol. 4, pp. 433-440). Bergen, Norway: PME.

2007. In Woo, J. H., Lew, H. C., Park, K. S. & Seo, D. Y. (Eds.). Proceedings of the 31st
Conference of
the International Group for the Psychology of Mathematics Education, Vol. 4, pp. 265-272. Seoul: PME. 4-265
IS A VISUAL EXAMPLE IN GEOMETRY ALWAYS HELPFUL?
Iris Zodik and Orit Zaslavsky
Technion – Israel Institute of Technology, Haifa
The main goal of the study1 reported in our paper is to characterize teachers' choice
and use of examples in the mathematics classroom. The focus of this paper is on
teachers' considerations and dilemmas underlying their choices of examples in
geometry. Geometric problems are often accompanied by figures/diagrams that
represent specific mathematical cases. A diagram can be accurate, sketchy or even
misleading. The paper presents examples of diagrams used in geometry lessons and
points to importance of teachers' awareness to their potential impact on students'
learning.
EXAMPLES IN MATHEMATICS LEARNING AND TEACHING
Examples are an integral part of mathematics and a significant element of expert
knowledge (Michener, 1978). In mathematics learning, examples are essential for
generalization, abstraction and analogical reasoning. The choice and use of examples
presents the teacher with a challenge, entailing many considerations that should be
weighed, especially since the specific choice of examples may facilitate or impede
students' learning. However, studies focusing on teachers’ choice and treatment of
examples are scarce. In our study we focus on teachers' choice and use of examples in
geometry lessons.
VISUALIZATION AND EXAMPLES IN GEOMETRY
Examples in geometry rely heavily on visualization. “Mathematical visualization is the
process of forming images (mentally, or with pencil and paper, or with the aid of
technology) and using such images effectively for mathematical discovery and
understanding” (p. 3 Zimmermann and Cunningham, 1991). Arcavi (2003) discusses
mathematical visualization in a more figurative sense, as 'seeing the unseen'. By this he
considers mathematics as a more ‘abstract’ world, dealing with objects and entities
quite different from physical phenomena, which raise the need to rely heavily on
visualization in its different forms and at different levels.
The potential and limitations of visual media are recognized as part of the mathematics
classroom culture. Teachers often use graphs and diagrams in order to enhance
students' mathematical thinking, however, sometimes students attendance to the
particularity of these visual aids might narrow their images and lead to prototypical
thinking (Yerushalmy, 2005). Yerushalmy and Chazan (1990) grouped visualization
obstacles according to (1) the particularity of diagrams, (2) the perception of standard
diagrams as models (as described by Hershkowitz, 1989), and (3) the inability to ‘see’
1 This study was funded by the Israel Science Foundation (grant 834/04, O. Zaslavsky PI).

Zodik & Zaslavsky
PME31―2007 4-266
a diagram in different ways. Students find it difficult to intentionally and alternately
move their attention from different parts of a diagram to the diagram as a whole.
“…What we see is not only determined by the amount of previous knowledge which
directs our eyes, but in many cases it is also determined by the context within which
the observation is made. In different contexts, the “same” visual objects may have
different meaning even for experts” (Arcavi , 2003, p. 232). Diagrams need to be
“read”. Cognitive processes are needed in order to make sense and understand
diagrams (Eisenberg & Dreyfus, 1991).
Secondary school geometry deals to a large extent with what Fischbein refers to as
figural concepts (Fischbein, 1993). Figural concepts have a dual nature – both
conceptual and figurative. According to Fischbein, figural concepts include a “mental
representation of space property” (ibid). In geometry textbooks and classrooms, figural
concepts are often defined or described verbally, with a set of givens that determine a
range of possible instances. Mostly, a geometric example is represented (e.g., in a
problem) – by some visual tool, like a sketch, a seemingly accurate diagram, or an
actual construction in a DGE (or less frequently a compass and ruler construction). We
refer to such representations as visual examples. We focus on the roles of visual
examples in geometry, and particularly on visual sketches textbooks, teachers and
students use in the course of learning geometry.
In a way, what we consider a visual example is a rough representation of one case of a
larger class of possible cases. However, in this context it is particularly difficult to
represent a general/generic example. How would a general triangle look? Once we
sketch it, it has several specific non relevant features. The work of Hershkowitz (1989)
and Vinner (1983) suggests that one example is not sufficient to form a complete and
rich concept image. Thus, when learning a geometric/figural concept, it is
recommended to encounter several different examples (not only proto-typical),
differing along their irrelevant/non-critical features.
However, in the context of solving or proving geometric problems, the use of a figure
is rather different. It serves mainly as a tool for analysing the problem and
communicating its proof, and usually there is no point in presenting or working with
more than one figure. Then the question becomes what would be a good/useful
geometric example, i.e., a diagram representing the situation. Should it accurately
describe the situation, possibly disclosing “hidden information” that is not known at
the initial stage to the student, or should it only clearly depict the explicit givens,
possibly concealing or even distorting the full “picture”. Dvora and Dreyfus (2004)
found that an appropriate diagram, whether accurate or sketchy, reduces unjustified
assumptions students tend to make. Our study points to the complexity of
considerations that are involved in choices of the specifics of a diagram, and gives a
glimpse to how teachers address this issue.

Zodik & Zaslavsky
PME31―2007 4-267
CONSIDERATIONS IN CHOOSING EXAMPLES IN GEOMETRY
Conventions regarding geometric examples refer to what can or cannot be derived
from a specific sketch, or in other words, what information is understood to be
disclosed by a specific sketch and what is not. For example, co-linearity of points is
usually considered information that is clearly conveyed by a sketch. However, the
relative magnitude of two sides of a polygon may be irrelevant and not the kind of
information one is supposed to derive from a sketch. Consider the following textbook
problem:
Problem 1: A rhombus ▱BDEFY is inscribed in a triangle △ABCV . Its diagonal, BE, is
perpendicular to the side of the triangle, i.e., BE AC⊥ .
Prove that: △ABCV is an isosceles triangle;
Note that the formulation of the problem does not indicate which pair of sides of △ABCV
is equal. Thus, it may not be clear to the student what the specific goal of the problem is
– to prove that BA BC= , CA CB= , or AB AC= ? A capable student could analyse the
problem and reach the conclusion that an attempt to prove that BA BC= makes more
sense than the other options (e.g., for symmetrical considerations). However, most
students do not approach this problem in such a way. Moreover, they tend to rely to a
large extent on the accompanying diagram. If no diagram is provided, students are
likely to act in a prototypical manner by sketching the problem situation as in Figure 4,
and attempting to prove that AB AC= , since many students think of an isosceles
triangle with a horizontal basis (Vinner, 1983).
Figures 1-4 represent possible examples illustrating the givens of the problem:
Figure 1 is a rather accurate illustration of the given case. It conveys the two sides of
the triangle that are equal ( BA BC= ), making it easier for the student to decide how to
proceed. Figure 2 is a special case of the given in which △ABCV appears to be an
equilateral triangle. Thus, it conceals the direct outcome of the given (i.e., that BA BC= ),
and may leave the student helpless regarding where to focus and what to prove. Figures
3 & 4 are distortions of the possible cases, as they convey impossibilities: In Figure 3 it
appears that △ABCV is a ‘generic’ triangle, not an isosceles one (all sides are of different
length). This can be perceived as a ‘general case’ that does not disclose any hints
regarding which two sides are equal. Figure 4 can be seen as a misleading sketch,
conveying an impossibility that contradicts the given and may lead the student to an
attempt to prove that AB AC= , which in fact cannot be inferred from the given.
Figure 1
A
B C
E F
D
Figure 2
A
E
C
D
F
B
Figure 3
A
E
C
D
F
B
Figure 4
A
E
C D
F
B

Zodik & Zaslavsky
PME31―2007 4-268
As seen above, the specific sketch accompanying the geometric problem may
influence the way a student approaches the problem and the extent to which the student
is successful in proving it. One may argue that the more accurate the figure is the better.
However, a counter-argument could be that by disclosing the full picture (as in Figure
1), the task for the student changes. He or she no longer needs to analyse the situation
and make a choice what to prove. For a student who relies on the visual example, it
becomes straightforward that s/he should focus on proving that BA BC= .
THE STUDY
Goal: The main goal of the study is to characterize teachers' choice and use of
examples in the mathematics classroom.
The research is an interpretative study of teaching that follows a qualitative research
paradigm, based on thorough observational fieldwork, aiming at making sense and
creating meaning of teachers' practice.
Data Sources: Fifty four lesson observations of 5 different teachers were conducted.
Altogether 15 groups of students were observed, 3 seventh grade, 6 eighth grade, and 6
ninth grade classes. The classes varied according to their level – 7 classes of top level
students and 6 classes of average and low level students. The participants were
secondary mathematics teachers (with at least 10 years of mathematics teaching
experience). The observations were of both randomly and carefully selected
mathematics lessons. By ‘carefully selected’ classroom observations we refer to
observations of ‘best cases’, that is, lessons which the teacher considered to illustrate a
particularly good way of example use in his or her classroom.
Pre and post lesson interviews were conducted with every teacher for each selected
lesson. In addition, we collected relevant documents and the researcher managed a
research journal.
FINDINGS
Our findings point to the complexity of teachers’ considerations and dilemmas
underlying their choices of examples in geometry. In this paper we focus on visual
examples accompanying geometric problems. We present 3 examples of classroom
situations, each illustrating a problematic aspect of choosing an appropriate visual
representation. Further, the findings point to some connections between teachers'
choices and students understandings.
Should a diagram be accurate or not?
As mentioned above, in geometry problem solving it is not always clear in advance
what, in fact, will be proved. Thus, it is possible to draw a diagram that at first seems to
represent the given situation, and only at the end turns to be an inaccurate illustration of
the given case. This presents teachers with dilemmas regarding choice of visual
illustration.

Zodik & Zaslavsky
PME31―2007 4-269
In the context of examining the conditions of SAS congruence theorem, teachers gave
students several tasks of the form: “What can you infer from the givens in the
following two triangles – can you infer that the triangles are congruent? Can you infer
that the triangles are not congruent?” More specifically, the main problem was
formulated as follows:
Problem 2: For each pair of triangles, determine whether the two triangles are
congruent according to SAS congruence theorem.
Apparently, the way the two triangles are sketched makes a considerable difference.
We identified two main strategies teachers employed: 1. Sketching the pair of triangles
according to the givens, that is, similar to the actual situation (e.g., in Figure 5a); 2.
Always sketching such pairs of triangles as if they are congruent even when they are
not (e.g., Figure 6).
Figure 5: Pairs of triangles that are sketched quite accurately:
5(a) A pair of triangles that do not appear to satisfy the SAS conditions;
5(b) A pair of triangles that satisfy the SAS conditions
Figure 6: A pair of triangles that are sketched as if they are congruent although they do
not appear to satisfy the SAS conditions
The problem with the first strategy that teachers use is that many students learn very
fast to attend to the visual ‘clues’, even when these clues are irrelevant or non-reliable;
they tend to base their inferences regarding whether the two triangles are congruent on
how the triangles look, instead of relying on logical inferences. However, using the
second strategy of always drawing triangles that seem congruent (even when the
givens do not concur) is almost equally problematic. Many students find the drawing
compelling, and are not convinced by the logical inference when the diagram transmits
contradicting information.
Should a diagram conceal what needs to be proved?
Returning to Problem 1 (earlier) we present a teacher’s choice associated with an
accompanying diagram for this problem. It should be noted that in the original problem
there were 2 additional parts:
Prove that: (ii) DF∥AC ; (iii) BF AF= .
E
K
F
12 5
300
M
L
N
12
5
300
5(b) 5(a)
270 8 cm
6 cm
6 cm 520
9 cm 520
6 cm 9 cm
270
6 cm
8 cm

Zodik & Zaslavsky
PME31―2007 4-270
This problem appears in a textbook the teacher used (the students did not have it). In
the textbook the diagram that appeared was similar to Figure 1, that is, a rather accurate
illustration of the given case that conveys the two sides of the triangle that are equal
( BA BC= ), making it easier to decide how to proceed. The teacher deliberately chose to
represent the case on the blackboard with a slight difference - the diagram she sketched
was more like Figure 2. This was done on purpose, as we can learn from her guidance
to her students: “Try to draw the triangle so that it will look like an equilateral triangle,
otherwise it won’t work well”.
This is a case in which the teacher had an agenda to emphasize to her students that they
should infer which sides are equal from the given and not from the diagram. The
teacher maintains that they must examine the situation before they start to prove
something. We can learn about her goal and knowledge of students' epistemology,
from her explanation to the class:
Teacher: Which isosceles triangle did we get? BCBA = ; and what happened to us? … Pay attention! This happens to us lots of times. Even in earlier stages, in the eighth grade, when most of the isosceles triangles in the textbooks are horizontal and with A opposite the base. When the isosceles triangle is not horizontal, many students can’t “see” it. Maybe some of you were trying really hard to solve the problem, and to prove that ACAB = , which we can’t prove. I especially recommended that you draw the triangle as an equilateral triangle, otherwise it does not come out accurate, and you can’t see it at all. For students that drew the triangle like a horizontal isosceles triangle, it was really hard to see that B is opposite the base and that BCBA = . For that reason I suggested to draw an equilateral triangle and even then it isn’t easy.
We can learn more about the teacher's awareness of the specific choice of examples
from her post-lesson interview, in which she says explicitly that she would not include
this problem in a test, because of its visual entailments that may impede students'
success.
Should a misleading diagram be avoided?
The following example is from a geometry lesson dealing with parallel lines. The
students asked the teacher to help them solve the Problem 3 (below) which appeared in
their textbook accompanied by a diagram (like Figure 7(a)).
Problem 3: Look at the given and determine whether the lines are parallel; If not,
then determine on which side the lines will intersect; Check for the
following givens: 042β = and ∡ 02 43=R .
Figure 7: (a) The textbook diagram; (b) The teacher's diagram
β α
δ γ
2 1
3 4 7(a) 7(b)
1380
430
430
420

Zodik & Zaslavsky
PME31―2007 4-271
After the students proved with the help of the teacher that the lines were not parallel,
one of the students said: “But in the textbook the two lines are completely parallel, so how
can it be?” The teacher responded: “Of course it can be. Our eyes are not good as we think
or maybe they [textbook authors] do it on purpose to mislead us. I told you to ignore drawings,
you should not rely on drawings just on data”. Later on in the same lesson it became more
complicated. The teacher drew the lines intersecting in the opposite direction (as in
Figure 7 (b)).
Teacher: Now, how do we know on which side the lines intersect? If this angle [∡ 2R ] is 43
0, what is the measure of the other one [∡ 3R ]?
Student: 430 (they are vertically opposite angles)
Teacher: Now, how do we know on which side the lines intersect? If this angle [ β ] is 42
0 , what is the measure of the other one [γ ]?
Student: 1380
Teacher: If the lines intersect, we will get a triangle. What is the sum of angles in a triangle?
Student: 1800
Teacher: 43 + 138, is?
Student: 1810
Teacher: This means that for sure we will not get a triangle at the other side. The triangle will be at this side. That means that on this side the lines will get away from each other, and they will meet only somewhere here… My drawing (Figure 7(b)) was not accurate. It should be on the other side. How much is 137+42? Here we can get a triangle, and the third angle will be 1
0.
The above case relates to necessary and sufficient conditions for parallel lines. In
particular, it addresses what happens when the necessary conditions are not met.
Interestingly, the teacher turned a potentially misleading diagram that does not concur
with the specific givens, into a meaningful learning opportunity for her students.
CONCLUSIONS AND IMPLICATIONS FOR TEACHING
A geometry problem can be presented to students with or without an accompanying
diagram. Our study points to the complexity and subtle considerations involved in
choosing an appropriate diagram to accompany a problem. Some choices lead to
diagrams that are helpful, to the extent that they may actually reduce considerably the
cognitive demand of the problem, while others may raise its level of difficulty. The
specific choices a teacher makes could reflect a pedagogical goal, such as maintaining
the need to rely on the givens of the problem and not on the particularities of a specific
visual representation. Some choices are made in advance while others are made
spontaneously in response to classroom interactions.
Whatever choices teachers make, there is a danger of transmitting some contradicting
messages to the students: on the one hand a diagram is provided in order to convey
some useful information regarding the problem situation; on the other hand, students

Zodik & Zaslavsky
PME31―2007 4-272
are taught to ignore some parts and not to rely on everything they see in a diagram. It is
not clear where to draw the line.
Our findings suggest that choice of examples is a significant aspect of teacher
knowledge and should be part of teacher education programs. Raising teachers'
awareness to the range of possible choices and their implications on student learning is
a critical issue.
REFERENCES
Arcavi A. (2003). The Role of Visual Representations in the Learning of Mathematics.
Educational Studies in Mathematics, 52, 215-241.
Dvora, T. & Dreyfus, T. (2004). Unjustified assumptions based on diagrams in geometry. In
M. J. Høines & A. B. Fuglestad (Eds.), Proceedings of the 28th
Conference of the
International Group for the Psychology of Mathematics Education, v.2, 311-318.
Eisenberg T. and Dreyfus, T. (1991). On the Reluctance to Visualize in Mathematics. In
Zimmermann W. and Cunningham S. (Eds.), Visualization in teaching and learning
mathematics, (pp. 25-37). Washington, DC: Mathematical Association of America.
Fischbein, E. (1993). The theory of figural concepts. Educational Studies in Mathematics, 24,
139-162.
Hershkowitz, R. (1989). Visualization in geometry – two sides of the coin. Focus on Learning
Problems in Mathematics, 11, 61-76.
Michener, E. R. (1978). Understanding Understanding Mathematics. Cognitive Science, 2,
361-383.
Vinner S. (1983). Concept Definition, concept image and the notion of function.
International Journal of Mathematical Education in Science and Technology, 14,
293-305.
Wilson, S. P. (1986). Feature frequency and the use of negative instances in a geometric task.
Journal for Research in Mathematics Education, 17 (2), 130-139.
Yerushalmy, M. (2005). Function of interactive visual representations in interactive
mathematical textbooks. International Journal of Computers for Mathematical Learning,
10(3), 217-249
Yerushalmy, M. & Chazan, D. (1990). Overcoming visual obstacles with the aid of the
supposer. Educational Studies in Mathematics, 21, 199-219
Zimmermann W. & Cunningham S. (1991). Editors’ Introduction: What is Mathematical
Visualization?. In Zimmermann W. and Cunningham S. (Eds.), Visualization in Teaching
and Learning Mathematics (pp. 1-8). Washington, DC: Mathematical Association of
America.