The Antibacterial Activity of Humulus lupulus against ... - -ORCA
251
The Antibacterial Activity of Humulus lupulus against Mycobacteria A thesis submitted for the degree of Doctor of Philosophy (Ph.D) By James Arthur Blaxland School of Pharmacy and Pharmaceutical Sciences Cardiff University
-
Upload
khangminh22 -
Category
Documents
-
view
0 -
download
0
Transcript of The Antibacterial Activity of Humulus lupulus against ... - -ORCA

The Antibacterial Activity of
Humulus lupulus against
Mycobacteria
A thesis submitted for the degree of
Doctor of Philosophy (Ph.D)
By
James Arthur Blaxland
School of Pharmacy and Pharmaceutical Sciences
Cardiff University

i

ii
Acknowledgements
I would like to give thanks to my supervisors Professor Les Baillie and Dr. Alex White
for their encouragement and guidance during my PhD. I would like to particularly
thank Les for getting me off the streets and into lab and for his friendship over the last
4 years.
Particular thanks go to Dr. Jon Salvage (Brighton University) for his expert assistance
and patience with the electron microscopy.
Thank you to Aleksandra, Andre, Joachim and Aniela Leistner for UPLC-MS in Berlin
and for giving me a home from home for 2 months.
I would also like to thank all past and present members of the microbiology research
group for their support, advice, guidance and friendship over the last 4 years.
For their proofreading ability, patience and support I would like to thank Dr. David
Houston, Miss Natalie Hancock, Miss Amrit Takhar and Dr. Tina Joshi.
Finally, I would like to thank my parents Liz and Jim Blaxland and the rest of my family
for their unquestionable support and encouragement throughout my life. Without you
I would never have got this far.

iii
Table of Contents Declaration ................................................................................................................................ i
Acknowledgements ............................................................................................................... ii
List of abbreviations ............................................................................................................ xi
List of Figures .......................................................................................................................xvi
List of Tables ....................................................................................................................... xxii
Abstract ................................................................................................................................. xxv
Chapter One General Introduction, Aims and Objectives ........................................ 0
1.1 Summary ........................................................................................................................ 1
1.2 The history of medicinal plants ................................................................................. 2
1.3 Humulus lupulus .............................................................................................................. 4
1.3.1 Hop cultivation ......................................................................................................... 6
1.3.2 The hop ....................................................................................................................... 7
1.3.3 Chemical components of hops ............................................................................ 8
1.3.4 Hop harvesting and storage ............................................................................. 11
1.3.5 The brewing of beer ............................................................................................ 12
1.3.6 The medicinal qualities of hops ...................................................................... 14
1.4 Mycobacterium .............................................................................................................. 16
1.4.1 Mycobacterium tuberculosis ........................................................................... 17
1.4.2 Human infection ................................................................................................... 20
1.4.3 Evasion of host immune defences .................................................................. 20
1.4.4 Non tuberculosis mycobacterium .................................................................. 22
1.4.5 Mycobacterium smegmatis ............................................................................... 23
1.4.6 Mycobacterium abscessus ................................................................................ 23
1.4.7 Mycobacterial cell wall ....................................................................................... 26
1.4.8 HIV Co-Infection .................................................................................................... 28
1.4.9 Testing for tuberculosis ..................................................................................... 29

iv
1.5 Treatment of tuberculosis ........................................................................................ 32
1.6 The burden of drug resistance ................................................................................ 35
1.7 Using natural products to potentiate the activity of antibiotics ................. 38
1.8 Aim and objectives of this study ............................................................................. 41
1.8.1 Thesis Aim .............................................................................................................. 41
1.8.2 Thesis objectives .................................................................................................. 41
2.0 Chapter 2 General Materials and Methods .......................................................... 43
2.1 General Materials ......................................................................................................... 43
2.1.1 Sources of chemicals and reagents ................................................................ 43
2.1.2 Biological culture media .................................................................................... 43
2.1.3 Diluents.................................................................................................................... 43
2.2 General Methods .......................................................................................................... 44
2.2.1 Revival of bacterial cultures from Microbank™ Cryo-protective beads
............................................................................................................................................... 44
2.2.2 Production of a bacterial suspension ........................................................... 44
2.2.3 Determination of the concentration of bacterial suspensions ............ 44
2.2.4 Preparation of a working culture ................................................................... 45
2.2.5 Production of a bacterial slope culture ........................................................ 45
2.2.6 Streak plate method for determination of culture purity ..................... 46
2.2.7 Staining methods to determine purity and identity of micro-
organisms .......................................................................................................................... 46
2.2.8 Preparation of bacterial cultures for both Gram stain and Ziehl-
Neelson stain .................................................................................................................... 47
2.2.8.1 The Gram Stain .................................................................................... 47
2.2.8.2 Ziehl-Neelson Stain for Mycobacterium ................................................ 48
2.3 Statistical Analysis ....................................................................................................... 49
2.3.1 Independent samples t-test .............................................................................. 49
2.3.2 One Way Analysis of Variance (ANOVA) ...................................................... 50

v
2.3.3 Pearson’s Correlation ......................................................................................... 50
3.0 Chapter 3 Determination of the antibacterial effects of hops against
clinically relevant bacteria .............................................................................................. 52
3.1 Introduction .............................................................................................................. 52
3.2 Materials ......................................................................................................................... 56
3.2.1 Bacterial cultures ................................................................................................. 56
3.2.2 Mycobacterium smegmatis NCTC 8159 T ................................................. 56
3.2.3 Mycobacterium bovis Var. BCG NCTC 5692 .............................................. 56
3.2.4 Escherichia coli NCTC 1093 ...................................................................... 57
3.3.5 Bacillus subtilis NCTC 10315 .................................................................... 57
3.3.6 Staphylococcus aureus (MSSA) NCTC 13277 ............................................. 57
3.3.7 Methicillin resistant Staphylococcus aureus (MRSA) NCTC 10442 ............. 58
3.4 Hop varieties .................................................................................................................. 59
3.5 Methods ........................................................................................................................... 60
3.5.1 Maceration of hop material .............................................................................. 60
3.5.2 Aqueous hop extraction method .................................................................... 60
3.6 Antibacterial Assay Methods ................................................................................... 61
3.6.1 Agar Well Diffusion Assay ................................................................................. 61
3.6.2 Agar Incorporation Assay to determine the Minimum Inhibitory
concentration of hop extracts .................................................................................... 62
3.7 Results .............................................................................................................................. 64
3.7.1 Optimisation assays for the extraction of antibacterial compounds
from hops ........................................................................................................................... 64
3.7.2 The effect of maceration on the release of water soluble antibacterial
compounds from hops .................................................................................................. 65
3.7.3 The effect of temperature on the release of water soluble
antibacterial compounds from hops ........................................................................ 67
3.7.4 The effect of extraction time on the release of polar antibacterial
factors from hops ............................................................................................................ 69

vi
3.7.5 Identification of a common commercial agar based culture media
with which to determine the sensitivity of MSSA, MRSA, E. coli and B.
subtilis against aqueous hop extracts ...................................................................... 71
3.8 Comparison of the antibacterial activity of aqueous hop extracts with
their average alpha and beta acid concentration .................................................... 73
3.8.1 A comparison of the antibacterial activity of hop extracts against M.
smegmatis and their average alpha acid concentration using a zone of
inhibition assay ............................................................................................................... 73
3.8.2 A comparison of the antibacterial activity of aqueous hop extracts
against M. bovis BCG and other non-Mycobacterial species with their stated
alpha acid content using a zone of inhibition assay ........................................... 75
3.8.2. A comparison of the antibacterial activity of aqueous hop extracts
against M. smegmatis with their stated beta acid content using a zone of
inhibition assay ............................................................................................................... 77
3.8.3 A comparison of the antibacterial activity of aqueous hop extracts
against M. bovis BCG and other non-Mycobacterial species with their stated
beta acid content using a zone of inhibition assay .............................................. 78
3.8.4 Comparison of the antibacterial activity of aqueous hop extracts with
their average alpha and beta acid concentration against M. smegmatis
using an agar well incorporation assay .................................................................. 80
3.8.5 A comparison of the antibacterial activity (MIC) of hops extracts
against M. smegmatis and average alpha acid concentration determined
using an agar incorporation assay ............................................................................ 83
3.8.6 A comparison of the antibacterial activity (MBC) of hops extracts
against M. smegmatis and average alpha acid concentration determined
using an agar incorporation assay ............................................................................ 84
3.8.7 A comparison of the antibacterial activity (MIC) of hop extracts
against M. smegmatis and the average beta acid concentration determined
using an agar incorporation assay ............................................................................ 85
3.8.8 A comparison of the antibacterial activity (MBC) of hop extracts
against M. smegmatis and the average beta acid concentration determined
using an agar incorporation assay ............................................................................ 86

vii
3.8.9 A comparison of the antibacterial activity (MIC and MBC) of aqueous
hop extracts against M. bovis BCG and non-Mycobacterial species with their
stated alpha acid content using an agar incorporation assay ......................... 87
3.8.10 Comparison of the antibacterial activity (MIC and MBC) of aqueous
hop extracts against M. bovis BCG and non-Mycobacterial species with their
stated beta acid content using an agar incorporation assay ........................... 88
3.9 Discussion ....................................................................................................................... 89
4.0 Chapter 4 Quantification of the antimicrobial compounds of hops ........... 94
4.1 Chapter introduction .................................................................................................. 94
4.2 Materials ......................................................................................................................... 98
4.2.1 Sources of chemicals and reagents ................................................................ 98
4.2.2 Diluents.................................................................................................................... 98
4.2.3 Bacterial cultures ................................................................................................. 98
4.3 Methods ........................................................................................................................... 99
4.3.1 Organic solvent extraction of hop material ................................................ 99
4.3.2 Hop solution evaporation ................................................................................. 99
4.3.3 Thin Layer chromatography separation of hop extracts ..................... 100
4.3.4 Bacterial overlay assay .................................................................................... 101
4.3.5 Column chromatography ................................................................................. 102
4.3.6 Silica gel column chromatography............................................................... 102
4.3.7 Sephadex® LH-20 Column chromatography ............................................ 103
4.3.8 Mass spectrometry ................................................................................................. 104
4.3.8.1 Sample preparation for mass spectrometry ......................................... 104
4.3.8.2 Sample analysis using mass spectrometry ............................................ 105
4.3.9 High resolution mass spectrometry (HRMS) ................................................ 106
4.3.10 HPLC ......................................................................................................................... 107
4.4 Results ............................................................................................................................ 108
4.4.1 Identification of optimum polar organic solvent for the extraction of
hop components. ........................................................................................................... 108

viii
4.4.2 Optimisation of a solvent system for the separation of organic solvent
extracts of hops ............................................................................................................. 110
4.4.3 Thin layer chromatography separation of hop extracts ...................... 112
4.4.4 The bacterial overlay assay ............................................................................ 114
4.4.5 Separation of antimicrobial hop components using silica gel column
chromatography ............................................................................................................ 118
4.4.6 Sephadex® LH-20 Column chromatography ................................................ 120
4.5 Mass spectrometry .................................................................................................... 121
4.5.1 Mass spectrum analysis of components isolated from Rf 6 ................ 122
4.5.2 Mass spectrum analysis of components isolated from Rf 5 ................ 124
4.5.3 Mass spectrum analysis of components isolated from Rf 4 ................ 126
4.5.4 Mass spectrum analysis of components isolated from Rf 3 ................ 128
4.5.5 Mass spectrum analysis of components isolated from Rf 2 ................ 130
4.5.6 Mass spectrum analysis of components isolated from Rf 1 ................ 132
4.6 High Resolution Mass Spectrometry (HRMS) ................................................... 134
4.7 UPLC-HR-MS determination of compounds isolated from the Citra crude
hop extract ........................................................................................................................... 137
4.7.1 UPLC separation of crude Citra hop extract ............................................. 137
4.7.2 Elemental composition of m/z 361 .............................................................. 138
4.7.3 Elemental composition of m/z 414 .............................................................. 139
4.8 Discussion ..................................................................................................................... 141
Chapter 5 Synergistic activity between hop extracts and antibiotics and their
mode of action .................................................................................................................... 150
5.1 Introduction ................................................................................................................. 151
5.2 Materials and Methods ............................................................................................. 157
5.2.1 Clinical isolates of Mycobacterium abscessus ........................................... 157
5.2.2 Growth media ...................................................................................................... 158
5.2.3 Antibiotics ............................................................................................................. 158

ix
5.2.4 Crude hop extract ............................................................................................... 158
5.2.5 Purified hop extracts ........................................................................................ 159
5.2.6 Characterisation of bacterial structure following exposure to
antibacterial compounds using scanning electron microscopy ................... 160
5.2.6.1 Sample preparation and imaging ............................................................. 160
5.3 Methods to characterise the combined antibacterial activity of hops and
antibiotics ............................................................................................................................ 161
5.3.1 Modified zone of inhibition assay ................................................................ 161
5.3.2 Modified agar incorporation assay .............................................................. 162
5.3.3 Identification of synergy using a checkerboard method ..................... 163
5.4 Results ............................................................................................................................ 165
5.4.1. Determination of the antibiotic sensitivity of clinical isolates of M.
abscessus .......................................................................................................................... 165
5.4.2. Determination of the sensitivity of clinical isolates of M. abscessus to
Citra hop extract ............................................................................................................ 166
5.4.3 Characterisation of the combined antibacterial activity of hops and
antibiotics against clinical isolates of M. abscessus .......................................... 167
5.4.4. Determination of the sensitivity of clinical isolates of M. abscessus to
individual compounds isolated from the Citra hop extract ........................... 170
5.4.5. Determination of synergy between hop derived compounds and
antibiotics using an agar based zone of inhibition assay ............................... 171
5.4.6 Determination of the MIC of Citra hop extract against clinical isolates
of M. abscessus using an agar incorporation assay ........................................... 172
5.4.7 Determination of the MIC of antibiotics against clinical isolates of M.
abscessus using the E-strip test. ............................................................................... 173
5.4.8 Checkerboard method for determining synergy between imipenem,
ciprofloxacin and hop extracts against M. abscessus 9568, 10332 and
11490 ................................................................................................................................ 177
5.5 Scanning Electron Microscopy (SEM) imaging of antibiotic and hop
combinations ...................................................................................................................... 180

x
5.5.1 Characterisation of bacterial structure following exposure to Citra
hop extract using SEM ................................................................................................. 182
5.5.2 Characterisation of bacterial structure following exposure to
Ciprofloxacin using SEM ............................................................................................. 183
5.5.3 Characterisation of bacterial structure following exposure to
imipenem using SEM .................................................................................................... 184
5.5.4 Characterisation of bacterial structure following exposure to Citra
hop extract and ciprofloxacin using SEM ............................................................. 185
5.55 Characterisation of bacterial structure following exposure to Citra
hop extract and imipenem using SEM ................................................................... 186
5.6 Discussion ..................................................................................................................... 188
6.0 Chapter 6 General Discussion ................................................................................ 197
6.1 Conclusions .................................................................................................................. 205
6.2 Future work ................................................................................................................. 206
7.0 References .................................................................................................................... 207
8.0 Appendices ................................................................................................................... 223

xi
List of abbreviations Commonly used abbreviations within this study are listed in alphabetical order below:
ANOVA Analysis of variance
atm Atmospheres
bTB Bovine tuberculosis
C Catechin
CCC Counter current chromatography
CFU Colony forming units
cfu/mL-1 Colony Forming Units per millilitre
CO₂ Carbon dioxide
diH₂O Deionised water
DNA Deoxyribonucleic acid
EC Epicatechin
ECG Epicatechin gallate
EGCG Epigallocatechin gallate
FDA Food and Drug Administration
Fe Iron
FIC Fractional Inhibitory Concentration
g gram
h hour
H₂ Hydrogen
H₂O₂ Hydrogen peroxide
HCl Hydrochloric acid

xii
HPA Health Protection Agency
HPLC High performance liquid chromatography
L litre
LB Lysogeny broth
LC-MS Liquid chromatography – Mass Spectrometry
M Molar
MDR-TB Multidrug Resistant Tuberculosis
mg Miligrams
MIC Minimum inhibitory concentration
min minute
mL millilitre
MRSA Methicillin-resistant Staphylococcus aureus
MS Mass Spectrometry
MTB Mycobacterium tuberculosis
MTC Mycobacterium tuberculosis complex
N/A Not available
n Number of replicates
N₂ Nitrogen
NaOH Sodium hydroxide
NB Nutrient Broth
NCIMB National Collection of Industrial, Food and Marine Bacteria
NCTC National Collection of Type Cultures
nm nanometre

xiii
NMR Nuclear magnetic resonance
NP Not Present
NTM Non tuberculosis mycobacteria
O₂ Oxygen
OD Optical density
p Value of significance
PBS Phosphate buffered saline
PCR Polymerase chain reaction
ppb Parts per billion
ppm parts per million
PSI Pounds per Square Inch
r r-value (Pearson product-moment correlation coefficient)
r2 Coefficient of determination
RF Retardation Factor
RNA Ribonucleic acid
SD Standard deviation
SDW Sterile Distilled Water
SE Standard error of the mean
sec second
SEM Scanning electron microscope
SF Supercritical Fluid
SFE Supercritical Fluid Extraction
TB Tuberculosis

xiv
TEM Transmission electron microscope
TLC Thin layer chromatography
TPTZ 2,4,6-tris(2-pyridyl)-1,3,5-triazine
TSA Tryptone soya agar
TSB Tryptone soya broth
UHW University Hospital of Wales
UK United Kingdom
USA United States of America
UV Ultraviolet
Vis Visible
v/v Volume per volume
w/v Weight per volume
w/w Weight per weight
WHO World Health Organisation
× g Gravitational force (Relative centrifugal force)
°C Degrees Celsius
µg Micrograms

xv

xvi
List of Figures
Figure 1. 1 Engraving of a central London hop market from 1779 .............................................................. 5
Figure 1. 2 The hop plant grown traditionally on supporting twines (top) and detailing of the individual
hop cones (left) with a cross section (right) – adapted from (Hieronymus, 2012) ...................................... 7
Figure 1. 3 The difference between whole unprocessed hops (left) and those which have undergone
pelleting (right). Taken from (Brewmaster, 2014) ..................................................................................... 11
Figure 1. 4 Schematic of the traditional brewing process detailing the addition of hops. Adapted from
(Poston, 2006) ............................................................................................................................................ 12
Figure 1. 5 Acid fast/ Ziehl Neelson stain of M. smegmatis 8159 .............................................................. 16
Figure 1. 6 Common lineage of the Mycobacterium tuberculosis complex (MTC) showing differences in
the RD genes from one common ancestor and the subsequent development of different species. Source:
(Brosch et al., 2002) ................................................................................................................................... 18
Figure 1. 7 Lineage of other non-tuberculosis mycobacteria (NTM) in comparison with MTB, detailing the
range of hosts. Source: (Galagan, 2014) .................................................................................................... 19
Figure 1. 8 Differences in Bacterial Cell Wall Morphology. Adapated from (Akira et al., 2006) (Akira,
2006) .......................................................................................................................................................... 26
Figure 1. 9 Timeline of antibiotic deployment and subsequent antibacterial resistance. Adapted from
(Meziane-Cherif and Courvalin, 2014) ....................................................................................................... 35
Figure 1. 10 Predicted mortality rates due to antibiotic resistant bacterial infection by 2050 (O’Neil,
2014) .......................................................................................................................................................... 37
Figure 2. 1 Demonstration of a Ziehl-Neelson (acid fast) stain of mycobacterium .................................... 48
Figure 3. 1 The effectiveness of hand and mechanical maceration on the release of polar antimicrobial
compounds from hops following aqueous extraction. Activity was determined using a zone of inhibition
assay against M. smegmatis, positive controls and negative controls consisted of oleic acid (8 µg mL-1
)
and SDW. Each assay was repeated 3 times; results presented are the mean, error bars represent
standard deviation ( ±SD)………………………………………………………………………………………………………………………65

xvii
Figure 3. 2 The effect of extraction temperature on the release of antibacterial compounds from
different varieties of hops. Pelleted hop variants were suspended in SDW at 25, 50 , 75 and 100 °C for
60 mins. Antibacterial activity was determined using a zone of inhibition assay against M. smegmatis.
Each assay was repeated 3 times; results presented are the mean, error bars represent standard
deviation ( ±SD). ......................................................................................................................................... 67
Figure 3. 3 The effect of extraction time of hop extracts at 100 °C and the level of antibacterial activity.
Macerated hop material was heated at 100 °C for 30, 60, 120 and 180 minutes and after cooling to room
temperature, were tested in a zone of inhibition assay against M. smegmatis on three separate
occasions. Results represent the mean ZOI, error bars ± SD, positive control (oleic acid) and negative
(SDW). ........................................................................................................................................................ 69
Figure 3. 4 A comparision of the antibacterial sensitivity of MRSA, MSSA, E. coli and B. subtilis to an
aqueous extract of Green bullet using an aqueous extract of Green Bullet hops using different culture
media. Antibacterial activity was determined using a zone of inhibition assay. Each assay was repeated 3
times; results presented are the mean, error bars represent standard deviation (± SD). ......................... 71
Figure 3. 5 Correlation of the stated alpha acid content of hop variants with the zone of inhibition
against M. smegmatis using a zone of inhibition assay. Each assay was repeated 3 times; results
presented are the mean, error bars represent standard deviation (± SD). ............................................... 74
Figure 3. 6 The correlation of the stated beta acid content of hop variants (n=21) and the mean zone of
inhibition against M. smegmatis using a zone of inhibition assay. Each assay was repeated 3 times;
results presented are the mean, error bars represent standard deviation (± SD). .................................... 77
Figure 3. 7 A comparison of the antibacterial activity (MIC) of aqueous hop extracts with their stated
alpha acid content. Antibacterial activity was determined using an agar incorporation assay against M.
smegmatis grown on Middlebrook 7H10 agar Each assay was repeated 3 times; results presented are
the mean. 83
Figure 3. 8 A comparison of the antibacterial activity (MBC) of aqueous hop extracts with their alpha
acid content. Antibacterial activity was determined using an agar incorporation assay against M.
smegmatis grown on Middlebrook 7H10 agar Each assay was repeated 3 times; results presented are
the mean .................................................................................................................................................... 84
Figure 3. 9 A comparison of the antibacterial activity (MIC) of aqueous hop extracts with their beta acid
content. Antibacterial activity was determined using an agar incorporation assay against M. smegmatis
grown on Middlebrook 7H10 agar Each assay was repeated 3 times; results presented are the mean. .. 85
xviii
Figure 3. 10 A comparison of the antibacterial activity (MBC) of aqueous hop extracts with their beta
acid content. Antibacterial activity was determined using an agar incorporation assay against M.
smegmatis grown on Middlebrook 7H10 agar. Each assay was repeated 3 times; results presented are
the mean. ................................................................................................................................................... 86
Figure 4. 1 Comparison of the total yield (g) of hop varieties Citra, Galena, Northdown, Cascade and
Fuggles following organic solvent extraction (72h) of 20 g of hop material in 1 litre (L) of methanol,
acetone and ethyl acetate (n=3; ±SD) ...................................................................................................... 108
Figure 4. 2 Comparison of Citra crude hop extract (0.1 mg/ml) after separation using TLC and the solvent
system methanol : ethyl acetate (1:1) (left) and using hexane : ethyl acetate (8:2) (right).................... 111
Figure 4. 3 The separation of hops 1 -14 using the TLC assay and calculation of Rf values of separated
hop analytes (representative of 3 separate repeats) ............................................................................... 112
Figure 4. 4 The bacterial overlay assay using M. smegmatis against methanol hop extracts of hops 1-18
(Table 2.2). Inhibition is highlighted by unstained white spots in contrast to the stained (red) background
indicating growth of the bacteria. Rf values refer to the Rf of separated spots. Figure representative of 3
separate repeats. Positive control Streptomycin (6 µg/ml-1
) ................................................................... 114
Figure 4. 5 Mass spectrum of Rf 0.99 extracted from the Citra hop variant using column
chromatography ....................................................................................................................................... 122
Figure 4. 6 Mass spectrum of Rf 0.99 extracted from the Galena hop variant using column
chromatography ....................................................................................................................................... 123
Figure 4. 7 Mass spectrum of Rf value 0.62 extracted from Citra hop variant using column
chromatography and analysed using mass spectrometry (representative of 2 repeats) ........................ 124
Figure 4. 8. Mass spectrum of Rf 0.62 extracted from galena hop variant using column chromatography
and analysed using mass spectrometry (representative of 2 repeats) .................................................... 125
Figure 4. 9 Mass spectrum of Rf value 0.38 extracted from Citra hop variant using column
chromatography ....................................................................................................................................... 126
Figure 4. 10 Mass spectrum of Rf value 0.38 extracted from Galena hop variant using column
chromatography ....................................................................................................................................... 127

xix
Figure 4. 11 Mass spectrum of Rf value 0.32 extracted from the Citra hop variant using column
chromatography ....................................................................................................................................... 128
Figure 4. 12 Mass spectrum of Rf value 0.32 extracted from the galena hop variant using column
chromatography ....................................................................................................................................... 129
Figure 4. 13 Mass spectrum of Rf value 0.23 extracted from the Citra hop variant using column
chromatography ....................................................................................................................................... 130
Figure 4. 14 Mass spectrum of Rf value 0.23 extracted from the Galena hop variant using column
chromatography ....................................................................................................................................... 131
Figure 4. 15 Mass spectrum of Rf value 0.02 extracted from the Citra hop variant using column
chromatography ....................................................................................................................................... 132
Figure 4. 16 Mass spectrum of Rf value 0.02 extracted from the galena hop variant using column
chromatography ....................................................................................................................................... 133
Figure 4. 17 High resolution mass spectra of the crude Citra hop extract ............................................... 134
Figure 4. 18 High Resolution Mass Spectra of compound m/z 463.1719 isolated from the antibacterial
Citra crude hop extract ............................................................................................................................ 135
Figure 4. 19 Estimated elemental composition report (± 3 ppm) of m/z 463.1719 isolated from the Citra
crude hop extract provided by the high resolution mass spectrum. Red arrow indicates most likely
compound composition ........................................................................................................................... 136
Figure 4. 20 UPLC chromatogram of Citra crude hop extract with selected peaks circled in red; image is
representative of two separate repeats .................................................................................................. 137
Figure 4. 21 UPLC HR-MS chromatogram and elemental composition report of m/z 361.200 isolated
from the crude Citra hop extract ............................................................................................................. 138
Figure 4. 22 UPLC HR-MS chromatogram and elemental composition report of m/z 414.981 isolated
from the crude Citra hop extract ............................................................................................................. 139
Figure 4. 23 UPLC HR-MS chromatogram and elemental composition report of m/z 353.1389 isolated
from the crude Citra hop extract ............................................................................................................. 140
Figure 4. 24 the structure of epicatechin isolated from component 3 present in both Citra and Galena
hop extracts ............................................................................................................................................. 145

xx
Figure 5. 1 The possible types of interaction between two antibacterial agents. Depending on the
appearance of the interaction it is classified antagonistic, no effect or Co-active. Adapted from Piddock,
(1990). 161
Figure 5. 2 Determination of the MIC value of Gentamicin against E.coli using an Etest strip. The clear
zone represents the area of inhibition and the point at which the edge of the zone meets the scale on
the strip represents the MIC. ................................................................................................................... 162
Figure 5. 3 The average zone of inhibition (mm) of Citra crude hop extracts against clinical isolates of M.
abscessus. Results shown are the mean of 3 separate repeats, error bars represent ± Standard deviation
(SD) ........................................................................................................................................................... 166
Figure 5. 4 Synergistic interaction between the antibiotic imipenem (10 µg/mL-1
) and crude Citra hop
extract against the clinical isolate Mycobacterium abscessus 9495. Zones of inhibition shown in black
indicate normal inhibition whilst zones in red indicate synergism. Figure shown is representative of 3
separate repeats. ..................................................................................................................................... 167
Figure 5. 5 An example of the zone of inhibition assay detailing no effect between the antibiotic
ciprofloxacin (10 µg/mL-1
) and the crude Citra hop extract against the clinical isolate Mycobacterium
abscessus 9568. Figure shown is representative of 3 separate repeats ................................................. 168
Figure 5. 6 The effect of imipenem 0-256 µg on the left and with the incorporation of a sub-inhibitory
concentration (0.3125 % (v/v)) of Citra crude hop extract on the right. Figure representative of 3
separate repeats. ..................................................................................................................................... 173
Figure 5. 7 The Etest of ciprofloxacin (256 – 0 µg) against M. abscessus 10332 without the incorporation
of Citra hop extract (0.0625 % v/v) (left) and with the incorporation of extract. .................................... 174
Figure 5. 8 SEM image of Mycobacterium smegmatis 8159 at 100 k magnification. .............................. 180
Figure 5. 9 SEM image of Mycobacterium abscessus 10332 at 50, 000 x magnification representative of
25 separate images. ................................................................................................................................. 181
Figure 5. 10 SEM image of M. abscessus 10332 (50k magnification) after 10 h incubation with 0.3125 %
(v/v) Citra crude hop extract- representative of 25 separate images ...................................................... 182
Figure 5. 11 SEM image of M. abscessus 10332 at 50k magnification after incubation with ciprofloxacin
(6 µg/mL-1
) for 10 hours. representative of 25 separate images ............................................................. 183

xxi
Figure 5. 12 SEM image of M. abscessus 10332 at 50 k magnification after incubation with imipenem (6
µg/mL-1
) for 10 hours. Figure representative of 25 separate images ...................................................... 184
Figure 5. 13 SEM image of M. abscessus 10332 after incubation with ciprofloxacin (0.06 µg/mL-1
) and
Citra crude hop extract (0.312 % v/v) for 10 h. Representative of 25 separate images ......................... 185
Figure 5. 14 SEM image of M. abscessus 10332 after incubation with imipenem (0.03 µg/mL-1
) and Citra
crude hop extract (0.156 % v/v) for 10 h. Representative of 25 separate images ................................... 186
Figure 5. 15 SEM image of M. abscessus 10332 at a magnification of 10 k after incubation with
Imipenem (0.03 µg/ml) and Citra crude hop extract (0.156 % v/v) for 10 h detailing the lack of visible
cells representative of 25 separate images .............................................................................................. 187

xxii
List of Tables
Table 1. 1 The average chemical composition of dried hops. ...................................................................... 8
Table 1. 2 Standard treatments for TB ....................................................................................................... 32
Table 2. 1 Interpretation of effect size of N2 between two statistically different groups (Cohen, 1988).. 50
Table 3. 1The hop varieties used in this study including country of origin, year of harvest and stated
alpha and beta acid content (% w/w) ........................................................................................................ 59
Table 3. 2 The volumes of double concentrated agar, SDW, and aqueous hop extract used to generate a
range of hop concentrations within the agar incorporation assay ............................................................ 62
Table 3. 3 Statistical analysis of the correlation of the stated alpha acid content of hop variants (n=50)
and the mean zone of inhibition against MRSA, MSSA, E. coli, B. subtilis and M. bovis BCG using a zone of
inhibition assay (n=3). Table shows the linear regression analysis ( R2 value) as well as Pearon’s R values.
.................................................................................................................................................................... 75
Table 3. 4 Statistical analysis of the correlation of the stated beta acid content of hop variants (n=21)
and the mean zone of inhibition against MRSA, MSSA, E. coli, B. subtilis and M. bovis BCG using a zone of
inhibition assay (N=3). Table shows the linear regression analysis (R2 value) as well as Pearson’s R values.
.................................................................................................................................................................... 78
Table 3. 5 The antibacterial activity (ZOI, MIC and MBC) of aqueous hop extracts against M. smegmatis
determined using a zone of inhibition and agar incorporation assay. (Results represent n=3) ................ 81
Table 3. 6 Statistical analysis (linear regression and Pearson’s two tailed correlation) of the MIC and MBC
of aqueous hop extracts against MSSA, MRSA, M. bovis BCG and B. subtilis with stated alpha acid
content. ...................................................................................................................................................... 87
Table 3. 7 The MIC and MBC of organisms MSSA, MRSA, M. bovis BCG and B. subtilis against aqueous
hop extracts were correlated with the average beta acid concentration and the calculated R2 values are
displayed. ................................................................................................................................................... 88

xxiii
Table 4. 1 An example of different empirical formulas of compounds separated using HRMS with similar
molecular masses Adapted from (Reusch, 2013) .................................................................................... 106
Table 4. 2 Composition of the mobile phase in the gradient elution system between 0 and 30 min.
Mobile phase A consists of 0.1% ortho-phosphoric acid in ultra-purified water and mobile phase B 0.1
%(v/v) ortho-phosphoric acid in methanol (eluent B). All gradients were linear. ................................... 107
Table 4. 3 The ratios of organic solvents used for the determination of an optimum solvent system for
hop extract separation using thin layer chromatography. Each ratio is defined as a number (e.g. 1:1:1:1
where each solvent would be in an equal volume) Adapted from (Bhandari, 1964; Hamburger and
Cordell, 1987; Hostettmann et al., 1998) ................................................................................................. 110
Table 4. 4 Hop variants (n=50) were separated using the TLC assay and the Rf values separated spots
(analytes) were recorded. Values are representative of 3 repeats; ± SD as described............................ 113
Table 4. 5 The Rf values of separated hop components in which inhibitory activity in the bacterial overlay
assay against M. smegmatis 8159 was observed. Rf values are a result of 3 separate repeats (± SD).... 115
Table 4. 6 A summary of the total number of hop varieties that analytes are present and antibacterial
against M. smegmatis as identified using the bacterial overlay assay (n=3) ........................................... 116
Table 4. 7 The recovered weight (g) of hop components from the Galena and Citra hop variants
separated using silica gel column chromatography. Bold text highlights recovered antibacterial
components as a result of 3 separate repeats ......................................................................................... 118
Table 4. 8 The total weight of recovered hop extracts and the weight of antibacterial hop components as
determined by the bacterial overlay assay against M. smegmatis following separation using Sephadex®
LH-20 column chromatography ............................................................................................................... 120
Table 4. 9 molecular weight (MW; MW+H₂; MW+Na; 2MW+Na) and chemical formula of known
compounds from hops ............................................................................................................................. 121

xxiv
Table 5. 1 The UHW unique clinical isolate strain number, known antibiotic resistance (determined by an
MIC > 128 µg/mL-1
), and isolation date of Mycobacterium abscessus strains ......................................... 157
Table 5. 2 Extracted hop compounds used in the synergy assays. Compounds were separated from
preparative thin layer chromatography based on their antibacterial activity and the predominant
compound identified using mass spectrometry. ...................................................................................... 159
Table 5. 3 Interpretation of the FIC to identify synergy, additive, indifference or antagonism between
antibiotics and crude hop extract ............................................................................................................ 164
Table 5. 4 The zone of inhibition (mm) of 5 and 10 µg antibiotic sensitivity discs (imipenem;
ciprofloxacin; pyrazinamide; rifampicin and ethambutol) against clinical isolates of M. abscessus as a
result of 3 separate repeats (NI= no inhibition). Controls consisted of +ve Gentamicin at 10 µg/mL-1
and
–ve an inoculated filter disc with 50 µL of SDW ....................................................................................... 165
Table 5. 5 A summary of the activity of crude hop extract and antibiotics against clinical isolates of M.
abscessus determined using an agar diffusion assay. (Key – CO = Co-active; NE = No effect; A =
antagonism. Results determined on three separate occasions ............................................................... 168
Table 5. 6 The antibacterial activity of Citra hop sub-fractions (2737G; 2737Y and 1426G) against clinical
isolates of M. abscessus determined using a zone of inhibition assay. Each value is a mean ZOI ± SE
(mm) based on three separate repeats ................................................................................................... 170
Table 5. 7 The MIC of crude Citra hop extract against clinical isolates of M. abscessus determined using
an agar incorporation assay. Results represent the mean of three separate assays ............................... 172
Table 5. 8 The effect of Citra hop extract on the antibiotic sensitivity of clinical isolates of M. abscessus.
The MIC of imipenem; ciprofloxacin; pyrazinamide; rifampicin and ethambutol was determined using
the Etest before and after the incorporation of Citra hop extract (0.312 % v/v). The numerals in red
denote a reduction in the MIC, suggesting coactivity. Results are representative of 3 separate repeats.
.................................................................................................................................................................. 175
Table 5. 9 Results of the checkerboard assay determining the MIC of imipenem and Citra crude hop
extract alone and in combination with subsequent interpretation of the FIC index. Values of 3 separate
repeats ±SD 0.00 ...................................................................................................................................... 177
Table 5. 10 Results of the checkerboard assay determining the MIC of ciprofloxacin (CIP) and Citra crude
hop extract alone and in combination with subsequent interpretation of the FIC index. Values of 3
separate repeats ±SD 0.00 ....................................................................................................................... 177
xxv
Abstract
One third of the world’s population is estimated to be infected with M. tuberculosis, a pathogen which causes more human death and misery than any other bacterial disease. Whilst treatment is available, resistance to commonly used antimicrobials is a growing problem. Thus there is an urgent need to identify new compounds that can kill drug resistant isolates and are able to potentiate the activity of currently available antibiotics. The plant kingdom is a rich source of antibacterial compounds and a plant which has attracted particular interest is Humulus lupulus, more commonly known as the hop, which has been used as an antibacterial in beer for hundreds of years. Its antibacterial properties are thought to be due to the combined action of alpha and beta acids and polyphenols such as xanthohumol although the precise nature of their interactions and relative importance has yet to be determined. An optimised agar antimicrobial assay was developed and employed based on Mycobacterium smegmatis, to characterize the antibacterial activity of fifty commercially available hop varieties with a view to identifying novel antibacterial compounds. Surprisingly, no correlation was found between alpha and beta acid content and antibacterial activity. Chemical analysis of the most (Citra) and least (Galena) active hop variants using a combination of bioactivity based thin layer chromatography, mass spectrometry and HPLC revealed differences in the relative amounts of antimicrobial compounds such as humulone (alpha acid), lupulone (beta acid) and xanthohumol but failed to identify the presence of novel antibacterial compounds. Whilst no new antimicrobial compounds were identified, the Citra hop extract was able to potentiate the activity of the antibiotics imipenem and ciprofloxacin against clinical isolates of M. abscessus, a fast growing member of the mycobacterium family which infects individuals suffering from cystic fibrosis. The Citra hop extract also inhibited the growth drug resistant isolates of M. abscessus suggesting that it may have activity against other antibiotic resistant mycobacteria such as M. tuberculosis With regards to the mode of action, scanning electron microscopy revealed distinct changes to the outer cell structure of the bacteria, suggesting that hops contain compounds that interact with the bacterial cell membrane and/or cell wall. These changes were more profound in the presence of sub-inhibitory concentrations of imipenem, a compound which also targets the cell wall. Overall hops were shown to contain compounds which inhibited the growth of mycobacterium and were able to potentate the activity of antibiotics currently used to treat these pathogens. These findings suggest hops may be a fruitful source from which to isolate next generation compounds with which to treat increasingly drug resistant strains of mycobacteria.

xxvi
“In wine there is wisdom, in beer there is
strength, in water there is bacteria”
- German Proverb

Chapter One
General Introduction, Aims and Objectives

1
1.0 General Introduction
1.1 Summary
Primarily a self-funded studentship, this thesis explored the potential of hops
(Humulus lupulus) as an antimicrobial against clinically relevant Gram positive, Gram
negative and Mycobacterial organisms. Hops are primarily used in the brewing of beer
and influence the final flavour and aroma of beer as well as having an inhibitory effect
on beer spoilage bacteria.
To determine if the hop plant did possess antibacterial activity, agar based methods
were used to determine the minimum inhibitory and bactericidal concentrations of 50
commercially available hop variants. Previous research has suggested that the hop
alpha and beta acids were directly responsible for the levels of antibacterial activity,
however no correlation was observed. Chemical evaluation of the most active and
least active hop extracts revealed differences in the known antimicrobial components,
although not directly antimicrobial a novel compound was isolated.
Some plant species and their extracts are known to potentiate the activity of
antibiotics and in this thesis several methods of determining antibacterial synergy are
investigated. Furthermore, the potential mode of action of both the hop extracts and
antibiotics alone and in combination was investigated using scanning electron
microscopy.

2
1.2 The history of medicinal plants
The pharmacological properties of plants and plant extracts have been documented
since ancient times. A Sumerian clay tablet dated over 4000 years old from Nagpur,
India listed 12 herbal medicines and remedies for drug preparation which were derived
from over 250 various plant species (Rooney, 2009).
It is estimated that the ancient Egyptians used over 700 different formulas of plant
extracts and honey in a systematic and controlled way (Gurib-Fakim, 2006). There is
also evidence that plants have been used for their medicinal qualities in China since
5000 B.C, indeed the Pen T’Sao the Chinese book on roots and grasses written around
2500 B.C describes over 365 plant derived preparations for medicinal use (Petrovska,
2012; Wang, 2000).
The Greeks and Romans further utilised the plants around them, Hippocrates (460-370
B.C) who is considered the father of medicine, described the importance of preventive
medicine and is often regarded as the author of the following quote:
“Let food be thy medicine and medicine be thy food” (Kagan-Zur, 2014)
In the first century (circa 77 A.D) Discorides studied the properties of over 1000 plants
and produced a synopsis of their chemical properties within the Materia Medica, a
medicinal plant catalogue, which became the prototype for early pharmacopoeias
(Cowan, 1999). The Materia Medica gave descriptions of the plant locations, their
appearance and perhaps most importantly the recipes of medicinal preparations with
potential therapeutic effects (Petrovska, 2012). Moving forward to around 1200 –
1500 AD the international trade in herbs, spices and plants from Asia, and the
discovery of America in 1498, prompted an exponential increase in the availability of
medical plant preparations (O’Hara et al., 1998).

3
It was not until the 18th and 19th centuries that that development of pharmacologically
active pure natural products increased. One of the first of these was the opium poppy
(Papaver somnifernum); originally used for its psychoactive and anaesthetising
properties since Neolithic and Bronze ages, by extraction of the dried sap from the un-
ripened seed pods. It was from this plant only 200 years ago that the compound
morphine was isolated and is still in use today (Rauter et al., 2002; Sumner, 2000).
This was one of many discoveries that began an era in which potential bioactive
compounds from plants could be purified, studied and administered in precise
dosages. As such natural products provided a foundation for the discovery of many of
today’s longstanding medicinal treatments (Newton et al., 2000). As a consequence,
over the last 20 years natural products or analogues inspired by them form the basis of
90% of therapeutics, approximately two thirds of the world’s population relying on
plants as their primary source of medicine (Cragg and Newman, 2013; McChesney et
al., 2007; Newman and Cragg, 2007; Newton et al., 2000)
The use of plants is not restricted solely to developing medicines however, over the
last 30 years there has been a growth of nutraceuticals (foods that aid health) and the
use of natural compounds in food and drink preservation. This market is estimated to
surpass revenues of $220 billion worldwide in 2014. (King, 2014; Hammer et al., 1999;
Martindale et al., 1996).
It is estimated that there are at least half a million species of flowering plants in the
world. Of these, fewer than 5 % have been investigated for their medicinal potential.
However, over the last 25 years there has been a surge in the research of natural
products and as such modern medicine is becoming increasingly receptive to the
identification of novel compounds such as antimicrobials, from plants. This rise in the
interest of natural products has coincided with an increase of drug resistant strains of
bacteria and a rapid extinction of plant species (Borris, 1996; Lewis and Elvin-Lewis,
1995; Moerman, 1996). This interest has seen extracts of plants such as garlic, ginseng,
valerian and soy, exceed sales of over $500 million in the US alone (Lewis and Elvin-
Lewis, 1995).

4
1.3 Humulus lupulus
With the discovery of antibiotics came the announcement from the US secretary
general that ‘now the golden age of antibiotics is upon us, the war against bacterial
infections is over’ (Rooney, 2009). Their effectiveness and hence popularity among the
world’s population has led to years of over use and misuse which has left a vast array
of drug resistant micro-organisms and antibiotics which are no longer effective (Gould,
2009). The cost of developing a new antimicrobial combined with the likelihood of
bacterial resistance means that here are no new antibiotics in the developmental
pipeline; in fact, no new classes of antibiotics have been developed since the 1980’s
(Alanis, 2005).
Plants and their derivatives represent a diverse resource from which discovering new,
efficient and safe antibiotics is a priority. Increasingly, research is looking into early
pharmacopeia’s for plants or extracts which were once effective but fell out of favour
with the introduction of antibiotics (Borris, 1996). The plant Humulus lupulus, known
as the hop, is one such plant. The hop plant has been utilised throughout history for its
flavouring, aroma and antibacterial qualities, primarily in the process of brewing beer
(Hieronymus, 2012).
The genus Humulus is part of the Cannabacae family of plants, including hemp and
cannabis. Three species of the hop exist; Humulus lupulus, Humulus scandens, and
Humulus yunnanensis; the latter two of these do not produce resinous cones and
therefore are of no use in brewing (Hieronymus, 2012; Stavri et al., 2004).
The first usage of the hop plant is difficult to accurately determine; workers widening a
drainage ditch in Kent during 1970, found an Anglo-Saxon boat abandoned circa 949
A.D. Upon inspection, the cargo contained huge quantities of hops. This is believed to
be the earliest record of hop growing and trade (Hieronymus, 2012; Wilson, 1975).
Whilst this predates any previous mention of hops used in the brewing of beer it is
presumed that the transport of such large quantities was destined for the brew kettle
(Hieronymus, 2012).

5
Widely recognised as the first recorded history of the use of hops in brewing, is the
writings of Abbess Hildegard of St. Rupertsberg in Physia (circa 1150-1160). She wrote:
“If thou desirest to make a beer from oats and hops boil it also … as such a beer purges
the stomach of the drinker and easest his chest, its bitterness prevents in the latter
putrefecation and gives a longer durability” – Adapted from (Arnold, 2005)
This early recording not only mentions the use of hops in beer, but recognises its
importance as an antibacterial, increasing the longevity of the final brew. By the 18th
century the use of hops as a household remedy as well as its addition in beer, was
clear to the general public. Markets where hops were imported and sold from different
regions were popular places (Figure 1.1) (Neve, 1991).
Figure 1. 1 Engraving of a central London hop market from 1779
Reproduced with permission from (Neve, 1991)
6
1.3.1 Hop cultivation
The origins of the hop plant and the growth of the original plants is a matter of
speculation. It is assumed that the plants were originally isolated from the wild and
were grown in private gardens. The original gardens would have contained a mixture
of several genotypes and the plants which had the highest yield would have been
selected as a source for new plants. This selection process favoured different hop
variants in different parts of the respective country; therefore each garden eventually
had different hop variants with a diverse range of bitterness and aroma properties.
Head brewers therefore were able to identify differences in the hops based on the
taste of the beer; this lead to the selection of hops based on their suitability for the
brew (Arnold, 2005; Barth et al., 1994; Hieronymus, 2012; Neve, 1991).
Although this selection process led to around 60 different hop varieties being available
around Europe circa 1900, there was a demand for bitterer, higher aroma hop
varieties. Diseases were also becoming a problem and causing destruction to hop
cultivars; indeed diseases such as downy mildew, hop mosaic virus, hop stunt viroid,
powdery mildew and verticulum wilt were leading to a shortage of hops (Barth et al.,
1994).
The risk of losing the hop plant in Europe to disease inspired several hop breading
programmes. The first of these began in 1904 at Wye College in Kent and focused on
improving hops by hybridizing several cultivars (Moir, 2000). Selecting hop varieties
based on disease resistance and hybridizing existing German and English varieties led
to twenty three sets of different seeds being obtained in the first year (Moir, 2000).
This research is ongoing; based around Hüll, Germany, the hop research laboratory is
provided with €1.8 million annually from the German government. This meant that
between 2001 and 2007 over 15,000 hops were screened for resistance to disease
(Hieronymus, 2012). Hop varieties which exhibited disease resistance were examined
for the chemical constituents; varieties which had different levels of bitter acids
differed in their ability to resist disease (Bajaj, 1989).

7
1.3.2 The hop
One of the advantages of growing hops is the quick development of oil and polyphenol
rich resinous cones (Ceh et al., 2007). The plant is a perennial on a permanent
rootstock, consisting of an underground structure of both rhizomes (with buds) and
true roots (without buds). The roots penetrate the soil to a depth of 15 feet or more
and in the first year of growth the hop plant concentrates on building an extensive root
system and few flowers are produced. In the second year prolific growth is usually
expected (Hieronymus, 2012; Simmonds, 1897; Stavri et al., 2004).
When supported with poles, the hop plant naturally twines to a height of six metres or
more (Figure 1.2). The hop plant is dioecious and thus has separate male and female
plants; only the females produce the cone shaped ‘hops’ used in brewing (Figure 1.2).
The male plant serves as a polliniser, but is not essential for the female plant to
produce the hop cones (Neve, 1991).
Figure 1. 2 The hop plant grown traditionally on supporting twines (top) and detailing of the individual hop cones (left) with a cross section (right) – adapted from (Hieronymus, 2012)

8
The hop cones of the female plant are the only part of the plant which is utilised in the
brewing industry and this is the focus of the brewer. The cone or strobili develops from
inflorescences (cluster of flowers). A strig extends through the centre of the strobili
and bears a pair of bracts (outer leaves) and four bracteoles (inner petals) at each
node (Neve, 1991). Lupulin glands develop at the base of the bracteoles. The lupulin
glands contain hard and soft resins, hop oils and polyphenols. The soft resins include
the alpha and beta acids, both of which contribute to the bitterness of beer (Neve,
1991).
1.3.3 Chemical components of hops
Research has been focused on identifying the bioactive ingredients of hops and to
elucidate the underlying molecular mechanisms by which they exert the bioactive
properties (Van Cleemput, 2009a). Much of this research has concentrated on the
polyphenolic components of hops, such as xanthohumol and 8-prenylnaringenin,
which have been shown to have multiple bioactive properties (Chadwick et al., 2006;
Gerhäuser, 2005; Stevens and Page, 2004). Moreover, increasing evidence has shown
that the hop bitter acids, namely the alpha and beta acids, also exhibit several
bioactive properties (Acworth, 2012; Everard, 2012; Van Cleemput, 2009).
The following Table (2.1) details the average composition of lupulin glands of air dried
hops.
Components % m/m
α - acids 2 – 17
β – acids 2 – 10
amino acids 0.1
Ash/Salts 10
Cellulose - lignin 40 -50
Monosaccharides 2
Oils and fatty acids 1 -5
Pectins 2
Polyphenols and tannins 3 -6
Proteins 15
Volatile oil 0.5 – 3 (v/m)
Water 8 -12 Table 1. 1 The average chemical composition of dried hops.
Sources: (Acworth et al., 2012; Cornelison, 2008)

9
From a brewer’s point of view, the hop acids, the alpha (humulones) and beta
(lupulones), are the most important class of hop compounds (Gerhäuser, 2005). The
relative amounts of the alpha and beta acids depend entirely on both the hop variety
and the conditions of growth. Therefore, even hops of the same variety can have
widely different levels of bitter acids if grown in different regions (Van Cleemput et al.,
2009a).
The term alpha acid is used as a single product, but it in fact refers to a number of
compounds which are structurally similar but are significantly different. The alpha
acids are a mixture of the analogues humulone, cohumulone and adhumulone that
differ only in the nature of the acyl side chain (R). The beta acids are a similar mixture
of analogues lupulone, colupulone and adlupulone. Both the alpha and beta acids can
exhibit tautomerism and exist as a mixture of readily interconvertible structures
(Almaguer et al., 2014; Baker et al., 2008)
Isomerisation, the changing of the arrangement of molecules of both the alpha and
beta acids occurs during exposure to heat or light. The analogue therefore, is a
precursor to its isomerisation products; in the case of humulone it is transformed to cis
and trans isohumulone (Jaskula et al., 2008). The process of isomerisation involves
contraction of the six-membered alpha acid ring (through acyloin rearrangement) to
form the five-membered iso-alpha-acid ring with two chiral centres, resulting in cis and
trans diastereomers (Acworth et al., 2012; Jaskula et al., 2008) .
Recent research suggests that it is the hop bitter acids which account for the
antibacterial qualities of hops (Cornelison, 2008; Larson et al., 1996; Van Cleemput et
al., 2009a). This action has been attributed to the interference of the prenyl group,
characteristic of the side chains of the hop acids. This bioactivity is of importance for
killing micro-organisms during wort boiling, which ultimately leads to sterile beer
(Arnold, 2005; Stevens and Page, 2004)

10
Prior to the development of successful breeding programmes, the average alpha acid
content of UK sourced hops rarely exceeded 4%. With the need for more successful
preservatives and bittering agents that figure has been increased. A variety of hop
named Northern Brewer, a seedling of the Golding variety derived from the USA, was
the first to combine high alpha acid content (>8% w/w on average) with a good
European aroma (Hieronymus, 2012; Neve, 1991; Woodske, 2012).
The development of breeding programmes has allowed higher alpha acid (AA) varieties
to be developed such as Target (the most commonly used hop in the UK), Chinook
(12.7 % AA), Simcoe (12.2 % AA) and Magnum (14.5 % AA). This increase and need for
alpha acids led to the development of alpha acid oil which eliminated the need for hop
processing altogether and now over 85 % of the world’s hops are now processed into
pellets, extracts or other products; improving delivery, packaging, ease of use and
storage (Simpson and Smith, 1992; Woodske, 2012).
The analogues of the alpha acids humulone, cohumulone and adhumulone represent
35−70 %, 20−65 %, and 10−15 % (w/w), of the total levels found within hops
respectively. The relative amount of humulone is dependent on hop variety, while the
amount of cohumulone and adhumulone is fairly constant throughout all varieties,
even when there are changes in the environment. High levels of cohumulone and
adhumulone are associated with lower quality hops and are not favoured by the
brewer (Haseleu et al., 2009; Moir, 2000).
In contrast, the hop beta acids are considered of lower importance to the brewer as
they have been shown to contribute less to the flavour of the final product (De
Keukeleire, 2000). It has been recognised that most hop varieties contain
approximately equal levels of lupulone and colupulone, which are extremely sensitive
to oxidation (Zanoli and Zavatti, 2008). These compounds differ from the other beta
acids in that they are very bitter and are usually present in quantities of a few mg L-1.
Beta acids are of little interest to the brewer as far as the flavouring and aroma
characteristics are concerned. The alpha acids are more important for beer bittering
than the beta acids. However, neither class remains unchanged in the finished product
(De Keukeleire, 2000; Simpson and Smith, 1992).

11
1.3.4 Hop harvesting and storage
Hops in the northern hemisphere are usually harvested in August and September and
are immediately dried to a water content below 10 %, vacuum packed and kept
between 2-3 °C to increase longevity (De Keukeleire, 2000). It has been shown that if
the hop material is not stored under these conditions the alpha acid concentration can
breakdown rapidly during storage by as much as 70 % within 6 months (Baker et al.,
2008; Malowicki and Shellhammer, 2005a; Neve, 1991).
The degradation of hop compounds is not only related to the storage conditions but
also differs by variant and the environmental conditions that the plant was exposed to
during growth. Despite the limited stability of dried hops, they are non-homogenous
and have a low bulk density. However, only about 5% of the total annual harvest is
used without further processing with around 60% converted into pellets (Hieronymus,
2012; Malowicki and Shellhammer, 2005a).
The process of pelleting the hops involves the inflorescences being cut, milled,
homogenised and pressed into granules. The density of the granules, when tightly
pressed and stored in correct conditions, increases their stability significantly (Nance
and Setzer, 2011). For this reason pelleted versions of hops (1.3 right) are commonly
used over their unaltered counterparts (Figure 1.3 left) in the brewing process
(Hieronymus, 2012)
Figure 1. 3 The difference between whole unprocessed hops (left) and those which have undergone pelleting (right). Taken from (Brewmaster, 2014)

12
1.3.5 The brewing of beer
The primary use of hops is in the brewing of beer. Beer is a fermented aqueous drink
based on four main ingredients; water, malted barley (grains), hops and yeast. Its
production, known as brewing, has been understood since antiquity. Indeed, the
Mesopotamians are famous for recognising the nutritional benefits of beer and also
for noticing the side effects of an ‘exhilarated, wonderful and blissful feeling’
(Hieronymus, 2012). In the following Figure (Figure 1.4) the traditional brewing process
is summarised.
Figure 1. 4 Schematic of the traditional brewing process detailing the addition of hops. Adapted from (Poston, 2006)
The steps involved in the brewing of beer include; malting, milling, mashing, brewing,
cooling, fermentation and maturation. The first, malting, is the preparation of barley
and it is used as a starch base for the wort. It is the addition of wort and its subsequent
germination during heating which leads to the beer having a pale or dark colouring.

13
The second stage, milling, mills the various grains (of which barley comprises around
40%). This ensures that the grains and their subsequent sugars will be more easily
absorbed into the water of the mash tun. (Arnold, 2005; Jackson, 1998)
The next stage, mashing, turns the malt into a sweet liquid by converting starches to
sugars that can be fermented. The previously milled grain is added to the brew and
heated to around 75 °C in the mash tun. It is at this point that the grain and water
create a cereal mash to dissolve the starch into water, transforming it into sugar. The
water itself is then strained through the bottom of the mash and is now termed, “the
wort” (Arnold, 2005; Jackson, 1998).
The next step, brewing, is the most important process. The simplest brew house layout
has two principal vessels. The first, the mash tun for mashing, and the second, the
brew kettle is where the infusion is boiled with hops. On average this process takes
between 60 and 90 minutes; strong beers can require longer (Jackson, 1998). The main
function of this step is to introduce the aroma and bitterness properties of the hops to
the brew. Some beers are only made with the addition of only one hop variant, others
multiple. The hops don’t contribute alcohol, however, the aromas and flavours are
powerful. As such, even in large breweries the hops are usually often added by hand
and in relatively small amounts (kilos) compared to the malt (tonnes). Hop variants
intended to impart dryness or bitterness are added early in the boil, with some having
a second addition mid boil to impart a stronger flavor (Jackson, 1998; Stevens and
Page, 2004).
When the brewing is completed the hop leaves and sediment are removed. This is
either done through centrifugal force or through a strainer. In some cases the wort is
filtered through layers of hops, imparting further hop aromas and oils. Commonly,
aroma hops are added in the maturation vessel. In the UK, this is known as dry hopping
and hops within a muslin sack are added to the cask in which the beer matures
(Jackson, 1998)
Finally, the beer is fermented, allowing for the sugar to be converted into alcohol.
Once fermented, the beer is transferred to a conditioning tank where the taste ripens
and the liquid clarifies which is usually completed within a few days. The beer, almost
ready is filtered and bottled (Hornsey, 2003).

14
1.3.6 The medicinal qualities of hops
Although hops main use is in beer, whole hops and their extracts have been developed
into a diverse range of products around the world. These products include non-
alcoholic beverages, sleeping aids, aphrodisiacs and as treatments for a variety of
maladies (Woodske, 2012). The traditional use of hops as a mild sedative stems from
the observation of sleepiness and fatigue in hop pickers apparently due to the transfer
of hop resin from their hands to their mouths (Foster and Tyler, 2000). In 1998 the
German commission approved hops for the treatment of mood disturbances, such as
restlessness and anxiety (Bundesinstitut fur Arzneimittel und Medizinprodukte
(Germany), 1998). Hops are also known to possess estrogenic activity, first recognised
when female hop pickers had frequent menstrual disturbances during the early days of
hop cone harvesting. In Germany, hop baths were frequently used as a treatment for
gynaecological disorders (Chadwick et al., 2006; Milligan et al., 2000).
Beer was originally produced without the addition of hops, however it is thought that
during the summer months ‘unhopped’ beer was seen to spoil much faster than its
‘hopped’ counterpart (Filmer, 1982). Due to this, hops were added to many beers.
Circa mid-19th century drinking water was heavily contaminated and unsanitary due to
the lack of sterilisation techniques and understanding. During this time beer was
considered a safer alternative to water; due to the facts that the wort is boiled, thus
destroying the bacteria, combined with the antibacterial effects of the hops during the
brewing process and subsequent storage. The alcohol level of beer at this time was
typically between 2-6% (v/v) and it has been shown that an alcohol concentration of
this level would have no effect on the majority of pathogenic bacteria (Jackson, 1998;
Rooney, 2009)
For the brewing industry beer spoilage bacteria have been problematic for centuries
(Sakamoto 2003). Beer is generally a poor and hostile environment for most
microorganisms as the typical pH (3.8-4.7) is unfavourable for bacterial growth.
However this allows for the growth of specific organisms such as Lactobacillus and
yeasts (Langezaal et al., 1992; Sakamoto and Konings, 2003a).

15
Haas and colleagues (1994) investigated the antibacterial role of isomerised alpha and
beta hop resins against Streptococcus salivarius, Staphylococcus aureus, Bacillus
megaterium, Escherichia coli B, and Bacillus subtilis. The study showed that the
isomerised alpha and beta acid resins inhibited the growth of all of the organisms at
concentrations from 0.01% to 0.03% (w/v). The inhibition of growth is generally
thought to be due to primary membrane leakage by the interaction between the
hydrophobic areas of alpha and beta acid molecules with the bacterial cell wall (Haas
and Barsoumian, 1994; Teuber and Schmalreck, 1973).
A further study by Stavri et al (2004) investigated the anti-mycobacterial effectiveness
of hop extracts and hypothesised that activity was associated with the alpha and beta
acids. After a non-polar extraction process and preparative thin layer chromatography
(TLC) on silica gel, several bands were isolated, all of which had activity against
Mycobacterium tuberculosis at concentrations ranging from 8 to 16 µg mL-1 (Stavri et
al., 2004). Originally, it was hypothesised that each separation on TLC resulted in a
singular molecular species. However, nuclear magnetic resonance (NMR) indicated
that in fact the separated fractions were a mixture of different components. As these
components were difficult to separate using conventional techniques, individual
components could not be identified as having inhibitory activity against mycobacteria
(Stavri et al., 2004).
A study by Serkani and colleagues investigated the antibacterial effect of polar hop
extracts against 37 drug resistant and susceptible isolates of Mycobacterium
tuberculosis. The research found that both drug sensitive and resistant strains of the
bacterium were inhibited by the presence of the hop extract (Serkani et al., 2012),
further establishing that the hop plant is potentially a useful resource for undiscovered
novel antimicrobials.
Formatted: Space After: 10 pt

16
1.4 Mycobacterium
Mycobacteria are members of the genus Mycobacterium which are slow growing,
aerobic, rod shaped bacteria. The organism is made distinctive by a staining property
known as acid-fastness. This property is due to the presence on the mycobacterial cell
wall of unique lipids called mycolic acids, found only within this genus. It was first
discovered by Robert Koch during his investigations into tuberculosis and acid fast
staining allowed for the identification of the organisms within tuberculosis lesions
(Black, 2004; Mims and Goering, 2013).
Figure 1. 5 Acid fast/ Ziehl Neelson stain of M. smegmatis 8159
as first demonstrated by Robert Koch
Mycobacteria are also categorised by other factors such as the production of specific
pigments. For example, species such as M. tuberculosis and M. smegmatis do not
produce a pigment, whereas, photo chromogenic species such as M. kansasii form a
pigment only when cultured in light. Scotochromogenic species such as M. gordonae
can form pigments when cultured in the dark (Mims and Goering, 2013).

17
Mycobacteria are pleomorphic and may undergo branching or filamentous growth. In
general, Mycobacteria can be separated into two major groups, slow growers and fast
growers. The difficulty in culturing slow growing bacteria in the laboratory has been a
problem since their discovery. Mycobacteria do not grow readily on standard agar and
due to the slow growth of the organism media can become contaminated (Madigan,
2003).
Slow growing species such as Mycobacterium tuberculosis have a doubling time of
twenty hours and others can take up to ten weeks for cultures to become visible.
Whereas faster growing species such as Mycobacterium smegmatis have a doubling
time of 2 hours and colonies are visible within 72 hours. This shorter growth time and
the advantage of being non-pathogenic allow for M. smegmatis being a useful tool
within the laboratory as a simulant for Mycobacterium tuberculosis (Chaturvedi et al.,
2007a; Madigan, 2003)
1.4.1 Mycobacterium tuberculosis
It is currently estimated that one third of the world’s population is infected with the
bacterium M. tuberculosis (Dooley et al., 2013). Tuberculosis (TB) on average is
responsible for over 2 million deaths worldwide per annum, more than any other
bacterial infection (WHO, 2010). The bacterium is successful as it is able to reside
dormant within its hosts immune cells undetected; only causing symptoms when the
patient is immunocompromised. As such, co-infection within HIV positive patients is
increasing (Murray et al., 2014).
If left untreated, each person with an active TB infection will, on average, infect 10-15
other people per year (Murray et al., 2014; Pauli et al., 2005). The Health Protection
Agency (HPA) has found that over the last 5 years there has been a 5% rise in the
number of new cases of TB in the UK, with the majority of cases in London presenting
6,000 new cases of TB in 2011 (HPA, 2012).

18
Mycobacterium tuberculosis is only one of many similar organisms within the
Mycobacterium tuberculosis complex (MTC). The group comprises of closely related
organisms such as M. africanum, M. microti, M. caprae, M. pinnipedi, M. bovis along
with the widely used vaccine strain M. bovis bacillus Calmette-Guerin (BCG) (Brosch et
al., 2002; Cole et al., 1998).
The genetic similarities between the members of the MTC complex group of bacteria
show an unusually high degree of conservation of housekeeping genes. It has been
shown that members of the MTC group share around 85-100 % of their DNA
(Frothingham et al., 1994). Paleopathogenic evidence suggests that tuberculosis
afflicted humans as early as 3700 BC in Egypt and 2000 BC in Europe. The mutation
frequency of M. tuberculosis, which is similar to that of other bacteria, has led to the
speculation that MTC isolates may have diverged from a common ancestor 15,000
years ago, as demonstrated in the following Figure (2.5) (Raviglione et al., 2006).
Figure 1. 6 Common lineage of the Mycobacterium tuberculosis complex (MTC) showing differences in the RD genes from one common ancestor and the subsequent development of
different species. Source: (Brosch et al., 2002)

19
Polymorphism in M. tuberculosis complex bacteria has been found to be associated
with repetitive DNA, such as transposable elements and short perfect or imperfect
repeats. The direct repeat locus (DR locus) is currently the only well studied single
locus in the MTC (Cole, 2002; Cole et al., 1998). The DR locus is composed of 36 bp DR
copies which are interspersed by non-repetitive short sequences of about equal length
known as spacers. The absence or presence of one or more of the spacers form the
main differences in M. tuberculosis and M. bovis and this property has been exploited
for identification of the bacteria within the MTC group (Fang et al., 1999; van Embden
et al., 2000).
Due to the relationship between the genomics of M. bovis and M. tuberculosis, it was
thought that human tuberculosis evolved from the bovine disease by adaption of an
animal pathogen to a human host (Stead et al., 1995). However work carried out by
Brosch et al, (2002) shows that M. bovis has undergone numerous deletions relative to
MTB through its evolution. It has been speculated that the successive loss of DNA may
have contributed to clonal expansion and the appearance of more successful
pathogens in certain new hosts as shown in Figure 2.6 (Brosch et al., 2002).
Figure 1. 7 Lineage of other non-tuberculosis mycobacteria (NTM) in comparison with MTB, detailing the range of hosts. Source: (Galagan, 2014)

20
1.4.2 Human infection
In primary infection, the mycobacteria, unlike other bacteria, do not avoid uptake by
macrophages, instead they survive within the macrophage by blocking fusion of the
phagosome with late endosomes and lysosomes. This is crucial for pathogenic
mycobacteria as they can survive for long periods within these host cells (Armstrong
1971). Uptake of mycobacteria by macrophages requires recognition of the bacteria
through receptor molecules such as complement receptors, (CR’s), mannose receptor,
scavenger receptors and immunoglobulin (Fc) receptors. Whilst precise uptake of the
bacteria via receptors in vivo remains to be established, one of the most important
receptors in vitro is CR3 (Ferguson et al., 2006; Velasco-Velázquez et al., 2003).
Phagocytosis of mycobacteria by CR3 requires the accumulation of cholesterol at the
site of entry; the CR3-mediated uptake is specific for mycobacteria because cholesterol
depleted macrophages can still internalise other microorganisms. The role of
cholesterol remains unknown, but it has been suggested that it may aid in the
rearrangement of the membrane-cytoskeletal network during phagocytosis or be
involved in signal-transduction reactions following the engagement of CR3 (Peyron et
al., 2000; Velasco-Velázquez et al., 2003).
1.4.3 Evasion of host immune defences
To prevent destruction within the macrophage, mycobacteria have developed several
methods to prevent phagosome maturation utilising both the host and mycobacterial
molecules (Pieters and McKinney, 2013). One such host molecule is coronin 1 (P57),
which is expressed exclusively within the leucocytes and utilises cholesterol within the
cell to associate with mycobacterial phagosomes. P57 has been shown to function in
actin-cytoskeleton remodelling, phagocytosis, cell division and polarity and vesicular
trafficking from the endoplasmic reticulum to the golgi apparatus (Pieters and
McKinney, 2013). P57 is retained exclusively on phagosomes of macrophages infected
with live mycobacteria, whereas in cells with dead mycobacteria, P57 rapidly
dissociates from phagosomes leading to fusion of phagosomes to lysosomes and
destruction of the bacteria. This suggests an essential role of P57 in the protection of
the mycobacteria within the cell (Ferrari et al., 1999; Tailleux et al., 2003).

21
Another important defence mechanism is the inhibition of phosphatidylinositol 3-
phosphate (PI3P). Biosynthesis of PI3P is required for phagosome maturation, and is a
membrane trafficking regulatory lipid essential for phagolysosome biosynthesis. PI3P is
synthesised by PI3-Kinase on endosomal and phagosomal membranes, and has been
observed to move on the phagosomal membrane in temporally scheduled waves
(Roth, 2004; Vergne et al., 2003; Wurmser et al., 1999). PI3P functions as a ligand for
many proteins that may be involved in phagosome maturation such as hepatocyte
growth factor (HGF) regulated tyrosine kinase substrate (Hrs), which has a key role in
the regulation of traffic in the endosomal pathway (Raiborg et al., 2002; Chin et al.,
2001; Komada and Soriano, 1999).
Mycobacteria are able to cause a reduction in the waves of PIP3 which results in the
depletion of Hrs, and in turn halts phagosome maturation. This eventually leads to
dissociation of Hrs with phagosomes preventing the mycobacteria being destroyed
(Vieira et al., 2004)

22
1.4.4 Non-tuberculosis mycobacterium
There are other pathogens within the mycobacterial community which are not part of
the MTC group. Non tuberculosis mycobacterial disease (NTM) was first recognised in
a small minority of patients with TB in the 1950’s (Cook, 2010). But it was not until
disseminated Mycobacterium avium complex (MAC) was recognised as the most
common opportunistic bacterial infection in AIDS patients that the low prevalence
problem of pulmonary NTM disease attracted attention. Opportunistic NTM infections
are acquired from environmental (water, soil) reservoirs and are not transmitted
between humans or animals and humans. They notably cause disease in patients who
are immunosuppressed and/or have pre-existing lung abnormalities (Al Jarad et al.,
1996; Mims and Goering, 2013; Thomson and Yew, 2009).
Bacteria that fall within this group are MAC, M. kansasii, M. xenopi, M. malmoense, M.
simiae, M. abscessus, M. chelonae and M. fortuitum. NTM that cause pulmonary
disease have been shown to vary greatly between geographic regions (Cook, 2010).
MAC is the predominant pathogen in most regions worldwide. M. kansasii disease is
relatively more common in the USA and the UK. M. xenopi is more common in the
USA, Canada, the UK and some regions of Europe. Mycobacterium malmoense disease
is common in the UK and northern Europe but is uncommon in the USA. It has been
suggested that the differences in these geographical regions has been associated with
variations in environmental conditions which favour the predominant NTM
populations (Tan et al., 2013; Thomson and Yew, 2009).
Infection with NTM can vary between regions but it has been shown that NTM
commonly contaminate domestic water supplies, swimming pools and hospitals.
Hospitals particularly suffer from nosocomial infections with NTM namely M. absessus,
M. fortuitum and M. gordonae. Infections associated with these bacteria are
associated with the skin and soft tissue acquired during surgical procedures; there are
even reports of NTM infection from bronchoscopes (Wallace et al., 1992).

23
1.4.5 Mycobacterium smegmatis
Mycobacterium smegmatis was first identified in 1884 from syphilitic chancres and
was originally thought to be the agent that caused syphilis, but was eventually
identified as a common environmental mycobacterium. M. smegmatis rarely causes
disease in humans, with less than 30 infections ever recorded. Infection, if caused, is
via skin or soft tissue infections following traumatic surgery (Best and Best, 2009). Its
common use is within research facilities as a simulant organism of M. tuberculosis. The
organism is successful as it can be handled within a category II laboratory and grows at
a much faster rate than that of M. tuberculosis. A recent study also found that
antibiotic sensitivities were similar between M. smegmatis and M. tuberculosis
(Chaturvedi et al., 2007a).
1.4.6 Mycobacterium abscessus
M. abscessus is a rapid growing mycobacteria (RGM), which was first described in
1953. It was not until the 1990’s however, that M. abscessus was recognised as an
important human pathogen responsible for a wide spectrum of soft tissue infections
and disseminated infection in immuo-compromised patients (Griffith et al., 2007;
Moore and Frerichs, 1953; Nessar et al., 2012). Importantly M. abscessus is considered
the prominent Mycobacterium, along with Mycobacterium avium, involved in
infections with cystic fibrosis patients. The major concern of M. abscessus infection is
its increasing drug resistance to first and second line antimicrobials, which has led to
an increased mortality rate (Cullen et al., 2000; Jeon et al., 2009; Sanguinetti et al.,
2001).
The current recommended regime for the treatment of M. abscessus infection relies
on a combination of clarithromycin, with an aminoglycoside such as amikacin and an
injectable antibacterial such as imipenem (Griffith et al., 2007). However, it has been
shown that these combinations are becoming increasingly unsuccessful, highlighting
the need for novel antimicrobials to combat the disease and potentiate the activity of
redundant antibiotics.

24
Recently M. abscessus has been sub-classified into three sub-species on the basis of
rpoB sequences: M. abscessus sensu stricto, M. massiliense and M. bolletii. Recent
research has shown that differentiation between these species is problematic as each
species shares ribosomal sequences (Tan et al., 2013).
It has been shown that although similar in genomic terms, the bacterial subspecies
differs in antibiotic resistance (Cole et al., 1998). This leads to the treatment of M.
abscessus and its subspecies notoriously difficult to treat. Treatment using multiple
antibiotics with several modes of action can reduce the microbial population but can
lead to the selection of resistant organisms (Jeon et al., 2009). Furthermore, M.
abscessus has been shown to be resistant to many of the anti-tuberculosis drugs in
clinical use today. Indeed the major pathogenicity factor of mycobacteria is the ability
of the bacterium to be intrinsically resistant or acquire resistance to antibiotics
(Fairhurst et al., 2002).
Acquired resistance as a result of genotypic changes within mycobacterial clinical
isolates is generally thought to be the result of spontaneous mutations affecting the
key targets of antibiotics but resistance may result from alteration in the function of
more than one gene. Alteration in chromosomal gene function represents the main
mechanism of acquired resistance in clinical strains of mycobacteria species; however,
resistance has been observed in species which lack the absence of mutations within
drug target genes suggesting other mechanisms can be involved (Cole, 2002; Rattan et
al., 1998). The intrinsic resistance of mycobacteria is well understood, with the major
contribution being the mycobacterial cell wall which consists of a complex matrix of
fatty acids and lipids (following Figure 2.7) that can hinder the penetration of
antimicrobial compounds (Cohn et al., 1997; Cole, 2002).

25
It is well documented that the cell envelope acts synergistically with antibiotic
inducible internal systems in competing against the effect of drugs. The internal
system, known as the intrinsic resistome, includes efflux pumps, antibiotic-
modifying/inactivating enzymes, target modifying enzymes and genes conferring metal
resistance. One of many inactivating enzymes that has been observed in M. abscessus
and M. tuberculosis is β-lactamase, which can assist the bacterium in nullifying the
effect of β-lactam antibiotics such as imipenem (Raviglione et al., 2006; Tailleux et al.,
2003).
The intrinsic resistance of MTB to most antibiotics is generally attributed to the low
permeability of the mycobacterial cell wall because of its specific lipid-rich composition
and structure. This low permeability limits drug uptake and seems to be one of the
main factors involved in resistance. Along with cell permeability, which limits drug
uptake, active efflux systems also provide resistance by extruding the drug molecules
that enter the cell, which therefore lowers the intracellular concentration of a given
drug. In mycobacteria the two main efflux pumps associated with drug resistance are
the lfrA efflux pump of M. smegmatis and the Rv1634 efflux pump of M. tuberculosis
which are able to remove drugs from the cell before the drug can take effect (Brennan,
2003; Niederweis, 2003).

26
1.4.7 Mycobacterial cell wall
The cell wall of mycobacteria differs from that of other bacteria and due to this has a
distinctive staining property known as acid fastness. This property is due to the
presence of the lipid rich wall as shown in Figure 1.8. The cell wall of mycobacteria has
been recognised as providing the bacilli with an effective innate immune defence
against lysososomal degradation. In particular, the Mycobacterium tuberculosis PI3P
analog glycosylated phosphatidylinositol lipoarabinomannan (ManLAM) has been
reported to block phagosome maturation; the LAM binding site is also highlighted in
Figure 2.7 (Black, 2004; Mims and Goering, 2013; Nguyen and Pieters, 2005).
Figure 1. 8 Differences in Bacterial Cell Wall Morphology. Adapated from (Akira, 2006)
ManLAM has several different effects within the macrophage, such as blocking the
PI3P-dependant pathway, which halts phagolysosome biogenesis, and inhibiting
calcium uptake in the macrophage cytosol, which is necessary for the accumulation of
PI3P on the phagosomal membrane (Fratti et al., 2003; Sturgill-Koszycki et al., 1996).
One of the most important macrophage combating molecules is interferon gamma
(IFN-ƴ), which is secreted by activated T cells and natural killer cells during infection.
IFN-ƴ signalling is used in many cellular processes, such as antigen presentation,
leukocyte-endothelium cell interactions, cell growth and apoptosis, and phagosome-
lysosome fusion. Indeed, it has been shown that both mice and humans with IFN-ƴ
genetic defects are extremely susceptible to mycobacterial diseases (Adams and
Hamilton, 1992; Murray et al., 2014; Stout, 1993).

27
In addition to the adaptive immune response, macrophage activation can be mediated
through activities of the toll-like receptors (TLR’s), of which TLR-2 and TLR-4 have key
roles. Activation of the TLRs via cell wall constituents leads to the activation of
mitogen-activated protein kinases (MAPKs). The MAPKs initiate signalling cascades
that activate transcription factors, which lead to the synthesis of tumour necrosis
factor (TNF-α), chemokine’s and other inflammatory mediators. These signalling
cascades boost antibacterial and inflammatory immune responses of macrophages
including phagosome maturation. However, these pathways are exploited by
pathogenic mycobacteria to promote mycobacterial survival within the macrophages.
Mycobacterium tuberculosis in particular uses ManLAM to inhibit activation of MAPK
in human monocytes (Means et al., 1999; Schaible et al., 1998; Schorey and Cooper,
2003).
Mycobacteria, and especially those of the MTC, has evolved many different strategies
for evading the host immune systems to either cause infection, or to lie dormant
within the cell until conditions are favourable for the bacteria to be reactivated.
Reactivation of the bacteria relies upon the host defence systems to be lowered in
cases such as malnutrition or in immunocompromised patients such as those with
HIV/AIDS (Lawn, 2005; Murray et al., 2014).

28
1.4.8 HIV Co-Infection
The high prevalence of tuberculosis co-infection with HIV/AIDS remains a common
complication, with an estimated 10 million people being infected. Most instances of
co-infection are seen in the developing nations, with sub-Saharan Africa exceeding
1000 infected per 100,000 population. Worldwide, TB is the most common cause of
death among patients with HIV/AIDS, killing 1 in every 3 individuals (Espinal et al.,
2001; Lawn, 2005; Murray et al., 2014)
HIV enters macrophages and CD4+ T cells by the adsorbtion of glycoproteins on its
surface to receptors on the target cell followed by fusion of the viral envelope with the
cell membrane and the release of the HIV capsid into the host cell. Shortly after this
the enzyme reverse transcriptase liberates the single stranded RNA genome from the
attached viral proteins and copies it into complementary DNA molecules. This process
leads to the depletion of M. tuberculosis specific CD4 lymphocytes and functional
impairment of CD4 lymphocyte-macrophage interactions resulting in impaired
granuloma formation. This ultimately leads to failure to restrict M. tuberculosis
replication (Mims and Goering, 2013; Gandhi et al., 2010; Friedland et al., 2007; Lawn,
2005).
The interaction between TB and HIV is bidirectional. The activation of mononuclear
cells during the host response to TB leads to accelerated HIV replication, which may
increase HIV load at anatomical sites involved with TB and systemically (Friedland et
al., 2007). The bacteriological response to anti tuberculosis treatment is not
significantly affected by HIV status. Standard therapy (Table 1.2), is used to treat the
patients within the first months and cure rates are similar to those without HIV
infection. However, mortality rates remain high for HIV infected individuals and can be
associated with developing countries with little or no resources for MTB infection,
poor compliance or lack of patient management (Rieder et al., 2009). In patients with
advanced immunodeficiency (define by a CD4 count of less than 100/µl) anti
tuberculosis treatment is complicated by the fact that finding Mycobacterium within
clinical specimens may result from infection of M. avium-intracellulare or other NTM
which require different treatment methods (Mims and Goering, 2013; Gandhi et al.,
2010; Friedland et al., 2007; Lawn, 2005).

29
Anti-HIV treatment, namely highly active antiretroviral therapy (HAART), leads to
dramatic reductions in the incidence of opportunistic infections, including TB as
pathogen-specific immune responses are restored. Concurrent administration of
HAART and anti-tuberculosis drugs is complicated by the fact that rifamycins
(rifampicin, rifapentine and rifabutin) tend to reduce serum concentrations of non-
nucleoside reverse transcriptase inhibitors and protease inhibitors, which may lead to
increased replication of the virus (Rieder, 2009).
1.4.9 Testing for tuberculosis
The tuberculin or Mantoux skin test (TST) is the primary standard method for the
determination of TB infection within individuals (Mims and Goering, 2013) (Goering,
2008). Tuberculin was first discovered by Robert Koch from a glycerine extract of M.
tuberculosis and was initially, but unsuccessfully, used as a remedy for MTB infection.
It wasn’t until Clemens Von Pirquet discovered that patients who had been vaccinated
against smallpox, but who were again injected, developed severe reactions, that the
importance of the tuberculin skin test could be noticed. The glycerol extract of M.
tuberculosis is still in use today and is known as purified protein derivative (PPD). This
extract is derived from proteins on the surface of the mycobacterial cell, which are
non-specific to mycobacteria. By using the same methods of injection, previous
exposure to MTB can be determined (De Keyser et al., 2014; Mims and Goering, 2013;
Rieder et al., 2009; Rooney, 2009)
Infection with TB leads to the development of an allergy to the tuberculin protein.
Therefore, during testing, 5 tuberculin units (TU) of PPD are injected into the inner
surface of the forearm. If the patient has had infection with TB, the tuberculin protein
produces a hypersensitivity reaction namely, inflammatory swelling, within 72 hours
(Rieder et al., 2009).

30
The TST is classified based on the size of the induration (palpable, raised, hardened
area of swelling) within 72 hours. And is based on 3 scales;
1. An induration of 5 or more millimetres is considered positive in:
HIV infected individuals.
Patients who have had recent contact with TB infected individuals.
Patients with abnormal chest radiographs consistent with prior TB.
Patients with organ transplants.
Patients who are immunosuppressed.
2. An induration of 10 or more millimetres is considered positive in:
Recent immigrants (< 5 years) from high prevalence countries.
Injecting drug users.
Mycobacterial laboratory workers.
Children <4 years of age.
3. An induration of 15 millimetres or more is considered positive in:
Any persons – including those that have no known risk factors for TB.
(Adapted from National centre for HIV/AIDS, Viral hep, STD and TB prevention)
In some cases, the TST may produce no skin reaction at all even in patients who are
known to be infected with M. tuberculosis, which can lead to false negative results
(Goering 2008). This however, does not exclude the active MTB infection, as the TST
can be suppressed by a number of factors, such as malnutrition, viral infections, HIV
infection, measles, chickenpox, glandular fever, cancer, corticosteroids and similar
drugs (Madigan 2009). A false positive result may be caused by non-tuberculosis
mycobacteria or previous administration of the BCG vaccine and in some cases,
vaccination with the BCG vaccine can lead to false positive results for many years
afterwards. This is due to the use of nonspecific proteins derived from M. tuberculosis
being recognised by the immunised host’s immune system (De Keyser et al., 2014;
Mims and Goering, 2013; Rieder et al., 2009).

31
In some patients with a latent TB infection, the immune response will gradually wane
over time and may show a negative TST. However, the initial skin test, although
negative, may stimulate the bodies’ reactions to tuberculin in further tests. To combat
false positives, a two-step testing method is used for adults who will be re-tested
periodically (e.g. health care workers) so that any future positive tests can be related
to a new infection. The two step testing relates to two separate TST; if the first TST is
negative a second test is given 1-3 weeks later, and if the second is negative the
patient is uninfected. If positive, the patient is considered previously infected (De
Keyser et al., 2014; Morán-Mendoza et al., 2013)

32
1.5 Treatment of tuberculosis
Treatment of TB relies on a combination of isoniazid, rifampicin, pyrazinamide,
ethambutol and streptomycin. The combinations and duration of course are
summarised in Table 2.1.
TB patients
TB treatment regimens
Initial phase Continuation phase
Daily
New patients never previously treated 2 HRZE 4RH or 6HE
Previously treated for longer than 1 month
2 HRZES/ 1 HRZE 5HRE or 5HREZ
Patients with drug resistant TB Patient specific regimens
Table 1. 2 Standard treatments for TB
KEY – H = isoniazid; R = Rifampicin; Z= pyrazinamide; E = ethambutol; S = streptomycin
The number indicates the duration in months that drug combinations should be
administered
(Adapted from Rieder et al., 2009)
Drugs are most frequently administered daily. The number before the drug
combination shows for how many months a drug combination is given. For example,
2HRZE indicates that isoniazid, rifampicin, pyrazinamide and ethambutol are given in a
single dose daily for 2 months (Rieder et al., 2009). Drugs are most frequently
administered daily. The number before the drug combination shows for how many
months a drug combination is given. For example, 2HRZE indicates that isoniazid,
rifampicin, pyrazinamide and ethambutol are given in a single dose daily for 2 months
(Reider, et al., 2009). Isoniazid is a prodrug that is activated by a bactericidal catalase-
peroxidase enzyme in MTB termed KatG. KatG, promotes the coupling of isonicotinic
acyl with NADH to form the NADH complex which binds to the enoyl-acyl carrier
protein reductase. This blocks the action of fatty acid synthase. Fatty acid synthase is
needed for the synthesis of mycolic acids within the mycobacterial cell wall leading to
cell death (Carel et al., 2014; North et al., 2013).

33
Isoniazid is normally given by mouth and highly effective concentrations of the drug
are achieved in all tissues including the cerebrospinal fluid. There is no cross resistance
with other drugs. Dosage varies upon treatment program but generally for daily use 5
mg kg-1 up to a maximum of 300 mg is given in a single dose. When used intermittently
(three times per week) the standard treatment is 10 mg kg-1 (Dooley et al., 2013;
Espinal et al., 2001).
Rifampicin inhibits bacterial DNA-dependant RNA synthesis by inhibiting bacterial
DNA-dependant RNA polymerase thus preventing extension of RNA products beyond a
length of 2-3 nucleotides; it is bactericidal and acts on both intracellular and
extracellular organisms. There is no cross resistance with other anti-TB drugs. Highly
effective concentrations are obtained in all tissues and moderate levels are found
within the cerebrospinal fluid. Dosage varies upon individual circumstances but in
general, for daily or intermittent use, 10 mg kg-1 up to a maximum 600 mg is the
accepted regimen. Rifampicin has several adverse effects, especially in older patients
or those with HIV/AIDS, leading to recurrence of hepatitis infections (Cole, 2002;
Espinal et al., 2001; Zhang et al., 1992).
Pyrazinamide is also an effective general bactericidal prodrug. Pyrazinamide diffuses
into M. tuberculosis where the enzyme pyrazinamidase converts pyrazinamide to the
active form pyrazinoic acid. Pyrazinoic acid slowly leaks out of the cell and converts to
protonated conjugate acid, which easily diffuses back into the bacilli and accumulate.
The overall effect is fatty acid synthesis is reduced by pyrazinoic acids binding to the
ribosomal protein S1 (RpsA) and inhibiting trans-translation. In daily use, dosage is
restricted to mg kg-1, and for intermittent, 35 mg kg-1is used and is taken orally. There
are many adverse effects with the use of pyrazinamide, such as liver damage and pain
in the joints (Gie 2003; Storia 2008; WHO 2003).

34
Streptomycin is a protein synthesis inhibitor. It binds to the small 16S rRNA of the 30S
subunit of the bacterial ribosome, interfering with the binding of formyl-methionyl-
tRNA to the 30S subunit. This leads to codon misreading leading to frame shift
mutations, defective protein synthesis and ultimately cell death. Streptomycin is not
absorbed from the intestine so is most often administered by intra-muscular injection,
where it readily diffuses into most body tissues. Dosage is commonly 15 mg kg-1 to a
maximum of 1 g, as it is excreted almost entirely through the kidney; the dose has to
be lowered in patients with poor renal function and in older age groups. There are
several adverse reactions; streptomycin can cross the placenta and cause deafness in
unborn children and, as such, use of streptomycin during pregnancy is not
recommended (Gie 2003; Storia 2008; WHO 2003).
Ethambutol is a bacteriostatic drug, and is mainly used to prevent the emergence of
drug resistance to the other drugs mentioned and its mode of action relies upon the
disruption of arabinogalactan. Arabinogalactan attaches to the mycolic acids of the
mycobacterium cell wall to form mycolyl-arabingalactan peptidoglycan in the cell wall.
Ethambutol inhibits the enzyme arabinosyl transferase, which is essential for
arabinogalactan synthesis and leads to increased permeability of the cell wall. It is
given orally at a dosage of 20 mg kg-1 for daily use and for intermittent 30 mg kg-1 three
times per week. Ethambutol has serious adverse reactions and as such, large doses are
no longer given. The main side effect is progressive loss of vision caused by retrobulbar
neuritis. It has been reported that some patients notice decreased vision within the
first few days of treatment. If unnoticed and the treatment continues, the likelihood of
the patient going blind is extremely high. Eye damage is exaggerated in patients with
renal failure and as such, treatment is not recommended for these patients (Rieder et
al., 2009)
As mentioned, ethambutol is used mainly to prevent the emergence of drug resistant
MTB and forms the basis of combination therapy against MTB. If anti-TB drugs were
given alone, resistant bacteria would replace the sensitive organisms. However, in
combination therapy, resistant species can be killed earlier in treatment with the other
drugs, preventing an abundance of resistant species in the host (Gie 2003; Storia 2008;
WHO 2003).

35
1.6 The burden of drug resistance
Ever since the discovery of antibiotics and their use against bacteria, resistance has
been a problem. In most cases, the time between antibiotic deployment and the
antibiotic resistance is less than 10 years. In the following Figure (2.8) a timeline of the
deployment of several antibiotics is shown against a timeline of observed bacterial
resistance.
Figure 1. 9 Timeline of antibiotic deployment and subsequent antibacterial resistance. Adapted from (Meziane-Cherif and Courvalin, 2014)
The first antibiotic that was discovered to be inhibitory towards the growth of M.
tuberculosis was streptomycin. Streptomycin was first introduced during 1943 and
consequently the first resistant strain was observed by Pyle in 1947. In 1948 the British
Medical Research Council (MRC) published a report which stated that streptomycin
therapy for pulmonary TB had similar mortality rates for treated and untreated
patients. Among patients who had been treated with streptomycin the majority who
had died had experienced relapse that was the result of an antibiotic resistant strain
(Gandhi et al., 2010).

36
Resistance mechanisms are either intrinsic or acquired. In the case of MDR TB,
acquired resistance is seen in genetic mutations, encoding either the drug target or the
enzymes involved in drug activation. The basis of resistance in some anti-TB agents is
still not fully understood, as in the case of streptomycin. Streptomycin resistance
emerges through a change in the bacterial binding site for streptomycin in the
ribosome; this process has only been seen in half the strains studied to date (Espinal et
al., 2001; Zhang et al., 1992).
Mutations in the pncA gene (encoding pyrazinamidase), are thought to be a major
mechanism of PZA resistance in MTB, but resistant strains containing the wild type
gene have been described. Moreover, the primary targets of activated isoniazid are
enzymes involved in the biosynthesis of cell wall mycolic acids. Mutations associated
with changes in these targets have been shown to contribute to isoniazid resistance
(Stewart et al., 2003; Zhang et al., 1992).
Resistance to anti-TB drugs continued to be recognised as a clinical problem through
the latter part of the 21st century. As a result, MDR and XDR TB are now becoming a
major threat to health worldwide, accounting for almost 3 % of all newly reported
cases of TB (Sayer, 2009). There have been several reports speculating the emergence
of totally drug resistant TB (TDR-TB) in India, Iran and Italy (Miglori, 2007; Rowland,
2012; Udwadia et al., 2012; Velayati et al., 2009).
Multidrug resistant TB is classed as MTB that is resistant to at least isoniazid and
rifampicin. In comparison, extensively drug resistant TB (XDR-TB) is MDR-TB that is also
resistant to one or more of; quinolones, kanamycin, capreomycin and/or amikacin. The
principles for treatment are the same for both types; however, XDR-TB is associated
with a much higher mortality rate because of the reduced number of effective
treatment options. Epidemiology of XDR TB is not very well understood, but it is
generally believed that it transmits easily between populations which are more
susceptible to MTB infection (Miglori, 2007; Rowland, 2012; Udwadia et al., 2012;
Velayati et al., 2009).

37
It has been hypothesised that without the development of new antimicrobials there
will be an exponential increase in the numbers of bacterial related deaths due to
resistant strains of antibiotics. Currently, strains of MRSA and C. difficile continue to be
a major cause of healthcare associated infection (HAI) which is proving difficult to
treat. (Gould, 2009)
To encourage the development of the new antimicrobials, the UK government has
recently published a review of current drug resistance and the predicted effects on
mortality rates worldwide by 2050 if no new classes of antibiotics are developed
(Figure 2.9).
Figure 1. 10 Predicted mortality rates due to antibiotic resistant bacterial infection by 2050 (O’Neil, 2014)
It is apparent from Figure 1.10 that without the development of antibacterials, or
indeed finding ways to potentiate the activity of redundant antibiotics, then mortality
rates of over 10 million per annum could be expected by 2050 (O’Neil, 2014).
Comment [DH1]: hould this sentence be here?

38
1.7 Using natural products to potentiate the activity of antibiotics
When antibiotics first became available over a century ago their popularity led to their
overuse and misuse; as such, over the last 20 years it has become clear that their
effectiveness is reducing as pathogens evolve resistance against them. Bacteria can
acquire multiple drug resistance, which requires the need of antibiotics with multiple
modes of action. Due to increased drug resistant strains of bacteria such as M.
tuberculosis and methicillin resistant Staphylococcus aureus there has been renewed
interest in natural products as potential sources of novel antibiotics (Cragg and
Newman, 2013; Coates and Hu, 2007; Pauli et al., 2005)
Natural products are a novel source of resistance modifying agents (RMAs); these are
sets of compounds which have multiple modes of action combating the bacterium’s
intrinsic and acquired resistance mechanisms. The discovery and development of
RMA’s could pave the way to reduce the spread of resistant bacteria and to ‘recycle’
well established antimicrobials, which are often cheaper and less toxic than newly
derived antimicrobials (Abreu et al., 2012; Lewis and Elvin-Lewis, 1995).
Antimicrobial synergy implies the beneficial interaction between two antimicrobial
drugs. Exceeding additive effects can take several forms. One compound may
potentiate the activity of the other at a biochemical level; one may assist the other in
order to penetrate the bacterial cell; one may protect the other from destruction; or
the two compounds may act on separate sections of the bacterial population (Acar,
2000)
The use of natural products with commonly used antimicrobials is a well-established
principle and is the reason for combination therapy in TB (Rieder et al., 2009). By using
two or more agents that have different targets in the bacterial cell, resistance can be
reduced. Synergy between these compounds could result in greater efficacy using two
agents than individually and may lead to lower host exposure to potentially toxic
compounds (Acar, 2000; Hemaiswarya et al., 2008).

39
Plants are known to produce a number of low molecular weight (MW <500)
compounds which have been shown to be antibacterial, albeit in some cases
considerably weaker than antibiotics produced by bacteria and fungi (Abreu et al.,
2012)
A study undertaken by Stermitz and colleagues reviewed the interaction between
berberine and 5o methoxyhydnocarpin, both of which are produced by berberry plants.
Berberine, a hydrophobic alkaloid that intercalates into DNA, is ineffective as an
antibacterial because it is readily extruded by pathogen encoded multidrug resistance
pumps (MDPs). Hence, the plant produces 5o -methoxyhydnocarpin that blocks the
MDP pump. This combination is a potent antibacterial agent (Lewis and Ausubel, 2006;
Stermitz et al., 2000).
Another way of overcoming resistance mechanisms such as β-lactamase enzymes;
modification of target sites and efflux pump inhibition is to use a combination of
antibiotics with multiple mechanisms of action. Inhibitors of beta lactamases have
been long known and therefore are administered with antibiotics as co-drugs
(Chambers et al., 1995). This has been especially seen in overcoming the resistance of
penicillinase, by administering clavulinc acid with the drugs sulbactam and tazobactam
(Lee et al., 2003)
However, tuberculosis and other mycobacterial infections continue to rise and are
currently considered a primary health threat. Coupled with the long treatment regime
is the lack of new antibiotics with different modes of action (O’Neil, 2014; Stewart et
al., 2003)

40
Current antimycobacterial treatment is the same as that over 40 years ago, requiring a
minimum of 6 months of multidrug chemotherapy. Novel targets are being identified
alongside developing better drugs for known targets. Synergistic interaction between
plant derived natural products and anti-tuberculosis drugs is gaining attention from
the scientific community, but reports of synergistic combinations are still limited.
Totarol, ferulenol and plumbagin were observed to increase the potency of
isonicotonic acid hydrazide by fourfold against Mycobacterium sp. A napthoquinone 7-
methyljuglone, isolated from the roots of Euclea natallensis, in combination with
isoniazid or rifampicin, resulted in a four to six fold reduction in the MIC of the
synthetic drugs (Mossa et al., 2004).
Several methods of detecting synergy are known but it has been reported that the
accurate prediction of a synergistic, additive, indifferent or antagonistic combination
between a drug and a natural product is crucial. The recognised gold standard is the
checkerboard method where combinations of two antimicrobials in concentrations
equal to, above and below their minimal inhibitory concentrations for the test
organisms are assayed (Acar, 2000).
The drug combination in which growth is inhibited is taken as the effective MIC of the
combination. Taking the effective MICs of each test compound in combination allows
for the fractional inhibitory concentration (FIC) to be calculated. The FIC values can
then accurately predict synergism, additive, indifferent or antagonism (Hall et al.,
1983a).
Therefore, whilst screening plants for antibacterial activity is promising, there is a need
for identifying potential resistance modifying agents, which alone may show little
antibacterial activity but in combination with antibiotics can increase the susceptibility
of resistant organisms. Little research has been undertaken in identifying plant and
antibiotic combinations active against species of mycobacterium. This could be due to
limited understanding of the mechanism of action of drugs and plant products or the
lack of plant extracts inhibitory towards the growth of these organisms.
Comment [DH2]: Repetition of reporst

41
1.8 Aim and objectives of this study
1.8.1 Thesis Aim
The aim of this these was to determine if hop extracts have inhibitory activity towards
clinically relevant bacteria such as Mycobacteria, identify active compounds and
determine if these compounds can potentiate the activity of antibiotics against drug
resistant organisms.
1.8.2 Thesis objectives
The objectives of this thesis were to:
Develop and optimise a hop extraction process.
Develop assays to determine the antibacterial activity of hop extracts
against a range of clinically relevant bacteria.
Identify differences in antibacterial activity between hop variants.
Identify compounds responsible for antibacterial activity.
Determine the inhibitory effect of hop extracts against multidrug resistant
Mycobacteria.
Develop and optimise assays to determine synergy, co-action, indifference
and antagonism between antibiotics and hop extracts
Examine the ability of hop extracts to potentiate the activity of antibiotics
against multidrug resistant Mycobacterium
Investigate the antibacterial mode of action of hop extracts and antibiotics
using scanning electron microscopy.

42
Chapter 2
General Materials and Methods

43
2.0 General Materials and Methods
2.1 General Materials
2.1.1 Sources of chemicals and reagents
All chemicals and reagents were purchased from Sigma Aldrich Ltd, UK, unless
otherwise stated in the text.
All solvents were from purchased from Thermo Fischer Scientific Ltd, UK unless
otherwise stated in the text.
2.1.2 Biological culture media
Middlebrook 7H10 agar and Middlebrook 7H9 broth (for the growth of
mycobacterium) and Luria broth (LB) and Luria agar (LA) for the growth of all other
organisms were purchased from Thermo Fischer Scientific Ltd, UK. These agars and
broths were made according to the manufacturer’s instructions and sterilised at 121 °C
for 15 minutes at 15 pounds per square inch (psi) pressure (Prestige, 9 L classic bench
top autoclave, LabShop, UK)
2.1.3 Diluents
Deionised water (diH2O) was obtained from an ELGA purelab option BP15 dispenser
(ELGA labwater, UK). The inorganic content of the water at 25°C was between 1-15
MΩ-cm with a total organic carbon content of <30 ppb. It was sterilised at 121 °C for
15 minutes at 15 psi (Prestige, 9 L classic bench top autoclave, LabShop, UK) to form
sterile distilled water (SDW).
Phosphate buffered saline (PBS) was prepared by dissolving 2 tablets in 500 mL of
diH2O once mixed, the solution contained 0.01 M phosphate buffer at pH 7.4
(composed of 0.0027 M potassium chloride and 0.137 M sodium chloride). Solutions
were sterilised by autoclaving at 121 °C for 15 minutes at 15 psi (Prestige, 9 L classic
bench top autoclave, LabShop, UK).

44
2.2 General Methods
2.2.1 Revival of bacterial cultures from Microbank™ Cryo-protective
beads
To generate a working culture, vials containing Cryo-protection beads (Pro-Lab
Diagnostics Ltd, UK) of the appropriate bacterium were removed from storage at -80
°C and defrosted on ice for 15 minutes. Once partially defrosted a single bead was
removed using a sterile 10 µL inoculation loop (Fisher Scientific, UK) and inoculated
into the appropriate broth for the appropriate time (Section 2.2.2).
2.2.2 Production of a bacterial suspension
Bacterial cultures were grown at 37 °C in broth within a shaking incubator (Thermo
Fischer, UK) at 150 revolutions per minute (RPM) for 72 hours (M. bovis var. BCG; M.
abscessus (all strains) and M. smegmatis); 18 hours (Escherichia coli NCTC 1093T;
Bacillus subtilis NCTC 10073; Staphylococcus aureus NCTC 13277 and methicillin
resistant Staphylococcus aureus NCTC 10442.
2.2.3 Determination of the concentration of bacterial suspensions
Centrifuge tubes containing 20 mL of LA or Middlebrook broth were inoculated from a
bacterial slope culture using a 10 µL inoculation loop. The inoculated broths were then
incubated ta 37 °C for the desired amount of time (2.2.2) in a shaking incubator at 150
RPM. After incubation the broths were centrifuged at 2600 x g for 15 min (Avanti J-20
XP, Beckman Coulter Inc. UK). The supernatant was removed and the pellet re-
suspended in sterile PBS to produce a stock solution with an optical density (OD) of 0.8
as determined by a spectrophotometer (Ultrospec 3100 Pro, Amersham Biosciences
Ltd., USA) set a wavelength of 600 nm (OD600). The neat bacterial culture stock was
diluted with PBS to produce a range of OD600 between 0.1 – 0.8.
Simultaneously, a viable count of the colony forming units (CFU)/mL for each dilution
was performed using the drop counting method by Miles et al., (1938). The method by
Miles et al., (1938) was performed as follows. A 10 μL aliquot of each culture dilution
was pipetted onto a sector of a circular TSA plate in triplicate and incubated for 24 h.
Following incubation, colonies were counted on each sector that contained between 3
- 30 countable cfu’s per spot and the average of the three spots was calculated.

45
The log cfu/mL-1 was then calculated by the following equation:
The results were then recorded into an Excel® spread sheet and an OD600 versus
CFU/mL graph was constructed for each bacterium. This produced a linear equation to
predict the cfu/ml in a sample based on the optical density of the solution at 600 nm.
This was repeated for each bacterium six times.
2.2.4 Preparation of a working culture
Bacteria were cultured as described in Section 2.2.3 and diluted in PBS to an OD₆₀₀
indicative of a concentration of 1 x 10⁹ cfu/mL-1. This working culture was then further
diluted in PBS using serial dilution to achieve the cfu/mL-1 required for subsequent
assays.
2.2.5 Production of a bacterial slope culture
Bacterial slopes are routinely used as a long-term working culture (Reed, 2007). Firstly,
60 ml of the appropriate agar solution was prepared as per manufacturer’s instructions
and cooled to 60° C in a water bath (Thermo Fischer, UK). After cooling, 20 ml of
molten agar was aseptically dispensed into each, of three, 50 mL centrifuge tubes
(Fischer scientific, UK). Each tube was then positioned at a 45° gradient so that the
agar had the greatest surface area and then allowed to set.
The agar slope was then inoculated with a 10 µL loop of the desired bacterial
suspension (Section 2.2.2) and incubated statically at 37° C until colonies were visible.
The bacterial suspension had been checked for purity, using the streak plate method
(Section 2.2.6). Isolated colonies were then Gram stained (Section 2.2.8.1) or acid fast
stained (Section 2.2.8.2) dependant on test bacteria. Cultures were then stored for
periods no longer than 21 days at 2° - 5° C.

46
2.2.6 Streak plate method for determination of culture purity
To ensure bacterial purity and isolate individual colonies, the streak plate method was
used. The method comprises of removing 10 µL of a bacterial suspension (Section
2.2.2) and transferring this to an appropriate agar plate. A series of streaks then
spreads the concentrated suspension across an agar plate in order to obtain individual
colony forming units (CFU’s) on the last streak. After the procedure was completed the
agar plate was incubated at 37 °C for the appropriate amount of time and colonies
were inspected for uniformity.
2.2.7 Staining methods to determine purity and identity of micro-
organisms
The Gram stain, developed by Hans Christian Joachim Gram in 1884 is the primary
identification tool used in microbiology (Reed, 2007). The Gram stain and the Ziehl-
Neelson (acid fast stain) are used to differentiate between Gram positive, Gram
negative and Mycobacterium species. The Gram stain bases bacteria into two groups;
bacteria that retain the initial crystal violet stain (purple) are said to be Gram positive,
whereas those that are decolourised and stain red with safranin/carbol fuschin are
said to be Gram negative (Beveridge, 2001). As previously described Mycobacteria
possess mycolic acids in the outer cell membrane and are therefore not stained by the
Gram stain (Reed, 2007). In this case the Ziehl Neelson stain is used (Section 2.2.8.2).
(Beveridge, 2001)

47
2.2.8 Preparation of bacterial cultures for both Gram stain and Ziehl-
Neelson stain
Colonies were isolated from a bacterial suspension and grown on solid media using the
streak plate method. A single colony of the chosen organism was then mixed with 50
µL of sterile distilled water (SDW) on the centre of a sterile glass slide (Fisher-Scientific,
UK). This turbid suspension was then spread across the slide using a fresh 10 µL
inoculation loop, the slide was then allowed to air dry within a laminar flow cabinet for
5 minutes, then it was passed through a Bunsen burner 3 times to heat fix the colony
to the slide.
2.2.8.1 The Gram Stain
1. The single bacterial colony is heat fixed
2. The slide is flooded with 2 % crystal violet (in 20 % ethanol / SDW solution) for
no longer than 60 seconds.
3. The crystal violet was then poured off and the slide flooded with Grams iodine,
for no longer than 60 seconds.
4. Slides were then rinsed with SDW to remove excess iodine.
5. Acetone was then added drop wise, and was left for a maximum of 3 seconds.
6. The slide was then rinsed with SDW
7. 2.5 % safranin (95 % ethanol/SDW) was then added as a counter-stain which
was then left for 10-15 seconds and was then rinsed with SDW to remove
excess safranin.
8. The smear was then left to air dry within a laminar flow cabinet, before being
examined under oil immersion x 100 magnification.

48
2.2.8.2 Ziehl-Neelson Stain for Mycobacterium
1. The single bacterial colony is heat fixed
2. The inoculated glass slide is then flooded with carbol fuchsin and held over a
breaker of steaming SDW at 60°C .
3. The slide was then steamed for 5 minutes whilst carbol fuschin was added to
ensure that the slide remained flooded.
4. The slide was then rinsed with dH2O to remove excess carbol fuchsin.
5. The slide was then decolourised with 95% ethanol containing 5% hydrochloric
acid.
6. Slide was then immediately rinsed with dH20.
7. The slide was then counter-stained with methylene blue, and left for 20-30
seconds.
8. The slide was then rinsed with dH2O to wash away excess methylene blue.
9. The slide was then allowed to air dry within a laminar flow cabinet.
10. After the staining procedure, the slides were examined directly under oil
immersion at x 100 magnification (Reed, 2007).
Figure 2. 1 Demonstration of a Ziehl-Neelson (acid fast) stain of
Mycobacterium smegmatis 8159

49
2.3 Statistical Analysis
All results presented in this study are a mean of at least three separate repeats unless
otherwise stated. All statistics were performed using IBM SPSS Statistics version 20.
2.3.1 Independent samples t-test
To determine the statistical difference in the means between two groups, the
parametric independent students t-test was used if the following assumptions were
met (Cohen, 1988).
1. The observations of the data were independent from each other.
2. The results follow normal distribution and pass normality tests.
3. The data sets to be compared show homogeneity of variance.
To assess normality, a histogram plot of the data was inspected to determine if a
normal bell shaped curve was observed with minimal skewedness. The Q-Q plots and
de-trended Q-Q plots were alos reviewed in conjunction with the results of the
Kolomogorov-Smirnov and Shapiro-Wilk tests for normality.
Levines test of the equality of variances was conducted to determine if the data sets
showed homogeneity of variance.
If any of the assumptions were violated, an appropriate transformation of the data was
attempted (Log₁₀, square root, etc) to normalise the data or the equivalent non-
parametric test will be used (e.g. Mann-Whitney U).
To determine the effect of size between the two groups, or the magnitude of
difference, the eta-squared value (N2) was determined by the following equation:
Where t= t value from t-test, n1 = sample size of group 1 and n2 – sample size of group
2. To interpret the N2 value the guidelines set out by Cohen (1988) shown in Table 2.1
were implemented.

50
Effect Size N2
Small 0.10-0.29
Moderate 0.30 – 0.49
Large >0.5
Table 2. 1 Interpretation of effect size of N2 between two statistically different groups (Cohen 1988).
2.3.2 One Way Analysis of Variance (ANOVA)
The parametric one-way ANOVA test was used to determine if there was a significant
difference in the means between two or more groups of data if the assumptions
described in Section 2.3.1 were met.
If a significant difference between groups was found, Tukeys honestly significant
difference (HSD) test was used to determine which groups were significantly different
from each other.
2.3.3 Pearson’s Correlation
Correlation analysis was used to determine the strength and direction of a linear
relationship between two variables. Pearson’s correlation of parametric correlation
was used if the following assumptions were met (Cohen 1988):
1. The relationship between two or more data sets is linear.
2. Observations in the data sets were independent.
3. Each data set in the analysis followed normal distribution.
4. The data sets showed homoscedasticity.
The strength of the relationship between variable was determined by the guidance set
of by Cohen (1988). The coefficient of determination (R2) was calculated by squaring
the Pearson product-moment correlation coefficient (r) obtained between two
variables.

51
Chapter 3
Determination of the antibacterial effects of hops against
clinically relevant bacteria

52
3.0 Determination of the antibacterial effects of hops against
clinically relevant bacteria
3.1 Introduction
Hops (Humulus lupulus) have been recognised for centuries as an important means of
flavouring beer (Cornelison, 2008). Recent research has focussed on using hop extracts
to improve the aroma, the stability of beer foam and as a preservative in a diverse
range of food products such as meat products (Hieronymus, 2012). Indeed, the reason
for using hops in beer is due to the fact that they contain antibacterial compounds
such as humulone (alpha acid) and lupulone (beta acid). Both acids are released into
the beer during the brewing process and increase both the shelf life of the product and
the taste of the beer. The bitterness of the beer is proportional to the concentration of
alpha acids, it is for this reason that a range of hop variants have been developed to
allow brewers to tailor the flavour of a particular beer.
Given that alpha and beta acid content of hops has been linked to antibacterial activity
(Acworth et al., 2012; Shen and Sofos, 2008) it is expected that the hop variants with
the highest alpha and beta acid content would demonstrate the greatest antibacterial
activity. In addition to being used in brewing, hops have a long history in herbal
medicine and have been used to treat a variety of conditions such as stomach cramps,
indigestion, insomnia and bacterial infections (Batchvarov and Marinova, 2001;
Sumner, 2000). In this chapter, the medicinal properties of this plant, specifically its
antibacterial activity against a range of medically important bacteria is investigated.
Of particular interest in the context of this study is the bacterium Mycobacterium
tuberculosis. As previously described it is an acid fast organism with a thick waxy outer
cell wall comprised of several mycolic acids, these contribute to the survival of the
pathogen within human macrophages.

53
Due to the virulence and long incubation times of M. tuberculosis, a simulant
organism, Mycobacterium smegmatis was employed to model the sensitivity of the
pathogen to antibacterial compounds. M. smegmatis is well described as a model
organism used within many screening assays. Unlike M. tuberculosis, M smegmatis is
fast growing, requiring 72 hours incubation at 37 °C to reach 1 x 10⁸ cfu/ml compared
to M. tuberculosis which requires up to 6 weeks to achieve a similar level of growth
(Chaturvedi et al., 2007b).
Mycobacterium smegmatis is non-pathogenic for healthy humans and as a
consequence can be handled and manipulated in a Category II laboratory (Chaturvedi
et al., 2007b; Tyagi and Sharma, 2002). Finally studies have shown that both bacteria
demonstrate a similar level of sensitivity to antibacterial compounds and thus M.
smegmatis has been used by a number of groups as a tool with which to identify
compounds with the potential to be active against M. tuberculosis (Chaturvedi et al.,
2007b).
A related organism, M. bovis is responsible for the animal form of the disease; bovine
tuberculosis (bTB). As previously described, bovine infection with this pathogen is
estimated to cost the UK economy over £100 million per year. M. bovis like M.
tuberculosis is also classed as a Category III pathogen and replicates at a similar rate
making it an impractical bacterium to use in high through put screening assays. In
contrast, the vaccine strain of M. bovis, Mycobacterium bovis Bacillus Calmette-
Guérin (BCG) rarely causes disease in healthy individuals (Category II organism) and
replicates in the laboratory at a similar rate to M. smegmatis (Fitzgerald et al., 2010)
In vitro studies have shown that BCG has a similar level of antibacterial sensitivity to
anti-tuberculosis compounds making it a suiTable model organism with which to
screen for antibacterial activity (Fitzgerald et al., 2010; Taneja and Tyagi, 2007).
Aside from Mycobacteria the sensitivity of other pathogenic bacteria to hop
compounds was also determined:

54
Staphylococcus aureus is a Gram positive cocci and considered a commensal organism
that is also an opportunistic pathogen within humans (Enright, 2003). One of the ways
M. smegmatis differs from S. aureus is in the nature of its cell wall; mycobacteria have
a thick waxy outer layer comprised of mycolic acids, which has been shown to increase
their virulence (Murray et al., 2014), whereas Gram positive organisms have an outer
layer of peptidoglycan. This difference in the cell wall has been shown to have an
effect on the sensitivity of the organism to antibacterial compounds found in beer
(Caballero et al., 2009).
Unfortunately the wide spread use of antibiotics has resulted in the emergence of
variants of this pathogen which are resistant to a wide range of antibiotics. One such
variant, Methicillin resistant Staphylococcus aureus (MRSA), has developed resistance
to beta-lactam antibiotics such as penicillin and has become a major cause of
healthcare acquired infection (Archer, 1998; Enright, 2003).
It is routinely used in clinical laboratories to determine the efficacy of antibiotics and
was included in this study as a reference strain with which to assess the antibiotic
activity of hop derived compounds. A second representative of Gram positive bacteria,
Bacillus subtilis was also included in this study. In contrast to Staphylococci these
bacteria form rods rather than cocci and rarely cause disease in healthy individuals
(Reed, 2010). The bacteria has previously been used to screen plant extracts for the
presence of antibacterial compounds (Rojas et al., 1992).
The final organism examined in this chapter, Escherichia coli, is considered a model
bacterium for Gram negative bacteria which differ from Gram positive and acid fast
organisms in that the cell wall contains an additional layer called the outer membrane
(Jackson, 2014). This outer membrane contributes to antibiotic resistance by hindering
the uptake and passage of compounds to the interior of the cell (Duffy et al., 2008).

55
This group of bacteria is made up of a large number of different serotypes the majority
of which are harmless to healthy individuals, however some serotypes such as E. coli
0157, can lead to morbidity (Duffy et al., 2008). As with B. subtilis; E. coli is
inexpensive to grow on routine media, grows relatively quickly compared to
Mycobacteria and non-pathogenic variants are routinely used to determine antibiotic
sensitivity (Duffy et al., 2008). The antibacterial compounds found in hops have been
reported to show little, if any, antibacterial activity against Gram negative organisms
(Beutler, 2009; Colegate and Molyneux, 2007; Dias et al., 2012).
This chapter describes the optimisation of an aqueous extraction and agar based assay
that was used to determine the antibacterial activity of 50 hop variants against a range
of bacterial species including Mycobacterium. The correlation of observed antibacterial
activity and (supplier) stated alpha and beta acid content of each hop variety was
investigated, assessing the hypothesis of (Caballero et al., 2009; Simpson and Smith,
1992) that the alpha and beta acid concentration make a major contribution to the
antibacterial activity of beer.

56
3.2 Materials
3.2.1 Bacterial cultures
3.2.2 Mycobacterium smegmatis NCTC 8159 T
Mycobacterium smegmatis was purchased from the Health Protection Agency (HPA)
culture collections service (Public Health England, Porton Down, UK). The strain was
first identified by Trevisan, 1889 and isolated from smegma found in soil and water
(Dostal et al., 2003). The bacterium has successfully been used as a safer, faster
growing simulant of M. tuberculosis (Chaturvedi et al., 2007a; Tyagi and Sharma,
2002). Cultures were stored in 10 % glycerol on Microbank™ Cryo-protective beads
(Pro-Lab Diagnostics Ltd, UK) at -80 °C until required.
3.2.3 Mycobacterium bovis Var. BCG NCTC 5692
A culture of Mycobacterium bovis BCG (Bacillus Calmette-Guerin) was purchased from
the HPA culture collections service (Public Health England, Porton Down, UK). The
original M. bovis BCG strain was developed by Calmette and Guerin between 1908 and
1919 by carrying out 231 passages of virulent M. bovis leading to spontaneous
attenuation resulting in a strain of M. bovis that was no longer virulent in humans or
animals. M. bovis BCG has been used as a surrogate organism for M. bovis and M.
tuberculosis (Khan and Sarkar, 2008; Ritz et al., 2009). M. bovis BCG strains are all
known to be resistant to pyrazinamide (Ritz 2009).
The culture was stored in 10 % glycerol on Microbank™ Cryo-protective beads (Pro-Lab
Diagnostics Ltd, UK) at -80 °C until required.

57
3.2.4 Escherichia coli NCTC 1093
A culture of Escherichia coli NCTC 1093 was purchased from the HPA culture
collections service (Public Health England, Porton Down, UK). Escherichia coli 1093 is a
facultative anaerobic Gram negative bacterium which was originally isolated from
human faeces by Dudgeon, 1921 at St. Thomas’s hospital UK. The bacterium grows on
nutrient broth (NB) and agar (NA) and forms smooth, cream colonies of 3 µm in length.
The bacterium has routinely been used in antibacterial assays (Khalil et al., 2013;
Shami et al., 2013) and has no known resistance to antibiotics routinely used to treat
Gram negative organisms. E.coli is used within this study as a comparison from acid
fast (Mycobacteria) strains and Gram positive strains.
3.3.5 Bacillus subtilis NCTC 10315
A culture of Bacillus subtilis NCTC 10315 was purchased from the HPA culture
collections service (Public Health England, Porton Down, UK). Bacillus subtilis NCTC
10315 is an aerobic Gram positive bacterium. The bacterium can be grown on NA and
NB at 37 °C to form rough, cream, circular colonies of 2 µm in length. The strain used
has been studied extensively and is a standard bacterial strain used to represent the
Bacillus genre; indeed it has routinely been used to screen potential antibacterial plant
extracts (Rojas et al., 1992)
3.3.6 Staphylococcus aureus (MSSA) NCTC 13277
Staphylococcus aureus NCTC 13277 is a gram positive facultative anaerobic organism
that was originally isolated from a human nose (Davies, 1988). The bacterium is grown
using NA and NB at 37 °C and forms smooth, cream, circular colonies of 1 µm in length.
This organism is a well-established standard strain used as a comparison for other
Gram positive organisms or comparing bactericidal susceptibility against the drug
resistant strain, methicillin resistant S. aureus (MRSA).

58
3.3.7 Methicillin resistant Staphylococcus aureus (MRSA) NCTC 10442
A culture of methicillin resistant Staphylococcus aureus NCTC 10442 was purchased
from the HPA culture collections service (Public Health England, Porton Down, UK). The
strain was originally isolated from a human finger at St. Lukes hospital Guilford, UK. It
is a facultative anaerobe which grows on NA and NB at 37 °C. It is well known
healthcare associated infection (Enright, 2003), resistance to methicillin or indeed
other penicillin class antibiotics is considered genetic and has been understood for
over 50 years (Enright, 2003) and requires the resistance gene mecA that encodes a
penicillin binding protein PBP2a (Enright, 2003).
MRSA was stored in 10 % glycerol on Microbank™ Cryo-protective beads (Pro-Lab
Diagnostics Ltd, UK) at -80° C until required.

59
3.4 Hop varieties
The hop varieties used in this study are shown in Table 3.1. They were purchased from (themaltmiller.com) and were provided in vacuum sealed, non-transparent packages.
Table 3. 1The hop varieties used in this study including country of origin, year of harvest and stated alpha and beta acid content (% w/w)
Hop Name/Type
Average estimated alpha acid content (%
w/w)
Average estimated beta acid content (% w/w)
Year of Harvest
Country of Origin
Syrian Goldings 2.75 6.40 2010 Slovenia
Hallertauer 3.20 6.60 2010 Germany
Bobek 3.90 N/A 2010 New Zealand
Sonnet 4.10 6.60 2010 USA
Liberty 4.50 5.00 2009 USA
Tettnang 4.50 6.40 2009 Germany
Willamette 4.50 3.00 2011 USA
Fuggles 4.90 N/A 2010 UK
Fuggles Pellets 4.90 N/A 2010 UK
Cascade 5.50 6.70 2010 USA
Cascade Pellets 5.50 6.70 2010 USA
Progress 5.50 N/A 2009 UK
Goldings 5.80 3.80 2010 UK
Boadicea 6.00 3.80 2009 USA
Brambling Cross 6.00 N/A 2011 UK
Summer Pellets 6.00 N/A 2011 Australia
NZ Pacifica 6.10 8.80 2011 New Zealand
Delta 6.50 N/A 2010 USA
Glacier 6.70 3.50 2007 USA
Motueka Pellets 6.70 N/A 2011 New Zealand
Amarillo 6.90 3.40 2010 USA
Amarillo Pellets 6.90 2.50 2009 USA
Challenger 7.60 3.70 2011 UK
Aurora 7.80 2.30 2010 USA
First Gold 7.90 3.50 2011 UK
Northdown 8.00 N/A 2010 UK
Northern Brewer 8.00 N/A 2010 Germany
Centennial Pellets 8.60 N/A 2011 UK
Centennial 8.60 4.40 2010 USA
Perle 9.60 5.40 2010 Germany
New Zealand Rakau 10.80 N/A 2011 New Zealand
Chinook Pellets 11.00 N/A 2010 USA
Simcoe 12.20 N/A 2010 USA
Target 12.50 N/A 2009 UK
Chinnok 12.70 N/A 2011 USA
Nelson Sauvin 12.80 N/A 2012 New Zealand
Galena 13.00 N/A 2010 USA
Green Bullet 13.70 N/A 2010 New Zealand
Summit 14.30 N/A 2011 USA
Magnum 14.50 2.50 2010 Germany
Sorachi Ace 14.90 4.20 2010 Japan
Citra (whole) and Pellets 15.00 N/A 2011 USA
Galaxy 15.10 N/A 2012 Australia
Pacific Jade 15.10 N/A 2011 New Zealand
Colombus 16.20 N/A 2010 USA
Pacific Gem 17.00 N/A 2011 New Zealand
Warrier 18.20 N/A 2010 USA
Apollo 19.50 N/A 2010 USA
Savinjski Goldings 20.75 N/A 2010 Slovenia

60
3.5 Methods
3.5.1 Maceration of hop material
Prior to the extraction of antibacterial compounds the hop material was macerated to
increase surface area and maximise the extraction of compounds. For this, hop
material was added to a processor (one touch power grater™, DKB Household, UK),
fitted with a 4 inch, double blade attachment. The processor was used at full power
(400 rpm) for 3 minutes at room temperature and pressure. After processing, the
resulting hop material was passed through a 2 mm mesh.
Another method of hop maceration using a pestle and mortar was also employed. Hop
material was ground using a pestle until no large fragments of hop material remained.
These two methods were compared to identify the most effective maceration method.
3.5.2 Aqueous hop extraction method
To identify the optimum extraction conditions 5 g samples of macerated hop material
were suspended in 200 mL of SDW and incubated at a range of temperatures (25, 50,
75 and 100 °C) in a water bath (Thermo Scientific, UK) for a range of times (30, 60, 120,
180 and 240 minutes). Following extraction the solutions were allowed to cool and
were then filtered through a Whatman® grade 1 paper using vacuum filtration to
remove any solids. The resulting extract was then used immediately in antibacterial
assays.

61
3.6 Antibacterial Assay Methods
3.6.1 Agar Well Diffusion Assay
This is a well-established method and is commonly used to determine antibacterial
activity against bacteria and fungi (Kim et al., 1995; Ríos and Recio, 2005)
Firstly, a range of agars (typtone soya agar, nutrient agar, lysogeny agar and brain
heart infusion agar) were assessed for their ability to support the growth of test
organisms and to allow the diffusion of antibacterial compounds. Agars were prepared
as per manufacturer’s instructions and autoclaved at 121 °C for 15 minutes at 15 PSI
(Prestige, 9 L classic bench top autoclave, LabShop, UK), after which agar was allowed
to cool to 45 °C in a water bath (Princeton, Thermo-Scientific). The agar was then
inverted gently and 20 mL aliquots were decanted into 45 x 90 mm petri dishes (Fisher
Scientific, UK) and placed in a lamina flow cabinet where they were allowed to cool
and set.
Plates were then inoculated with 150 µL of a bacterial suspension (Method 2.2.2)
standardised to 1 x 10⁶ cfu mL-1 (Method 2.2.3) and an even spread was made across
the plate using a sterile flat sided spreader (Fisher Scientific, UK), plates were then
incubated statically at 37 °C (Thermo Scientific, UK) for 3 hours.
A previously sterilised 6 mm borer (Fisher Scientific, UK) was then used to create 4
wells per plate. For each hop extract or test bacterium, newly sterilised equipment was
used. In each well 80 µL of the aqueous hop extract was pipetted; in addition to this,
on each plate 80 µL of H₂O was also pipetted into a well as a negative control and 80
µL of oleic acid (Sigma-Alrich, UK) at a concentration of 8 µg mL-1 in 50 % DMSO as a
positive control. This was chosen as a control as it is a naturally derived unsaturated
fatty acid which exhibits antibacterial properties (Zheng et al., 2005). Plates were then
carefully transferred to a static 37 °C incubator (Thermo Scientific, UK) for 24 or 72
hours depending on the test bacteria. Inhibition of bacterial growth was observed by a
clear zone of inhibition around the test well. The size of the zone of inhibition was
determined by measuring two diameters at right angles across the zone and
subtracting the diameter of the well itself (6 mm). Each assay was performed on 3
separate occasions on each bacterial species with each hop extract unless otherwise
specified.

62
3.6.2 Agar Incorporation Assay to determine the Minimum Inhibitory
concentration of hop extracts
The agar well incorporation assay allows for the determination of antibacterial activity
for different concentrations of hop extracts (v/v). In order to reduce the dilution effect
of the hop extracts on the nutrient content of the medium each agar was made up at
double its standard concentration (TSA 12 g 500 mL-1 diH₂O) and (Middlebrook 7H10
19 g 450 mL-1 diH₂O) and was autoclaved at 121 °C for 15 minutes at 15 PSI (Prestige, 9
L classic bench top autoclave, LabShop, UK) after which it was allowed to cool to 40 °C
in a water bath (Thermo-Fischer, UK).
Aqueous hop extracts, sterile distilled water and molten agar where then added to a
24 well plate (Sterlin, UK) in amounts specified in Table 3.2 and mixed to give a final
hop extract concentration as described in the table. The agar plates were then allowed
to set within a laminar flow cabinet for 30 minutes.
Well Number SDW
Amount (µL) Agar Amount
(µL) Hop Amount
(µL) % volume of hop extract
A1 0.00 2000 1000 33.00
B1 100 2000 900 30.00
C1 200 2000 800 26.00
D1 300 2000 700 23.00
A2 350 2000 650 21.60
B2 400 2000 600 20.00
C2 450 2000 550 18.30
D2 500 2000 500 16.00
A3 550 2000 450 15.00
B3 600 2000 400 13.00
C3 650 2000 350 11.60
D3 700 2000 300 10.00
A4 750 2000 250 8.00
B4 800 2000 200 6.60
C4 820 2000 180 6.00
D4 840 2000 160 5.30
A5 850 2000 150 5.00
B5 860 2000 140 4.60
C5 880 2000 120 4.00
D5 900 2000 100 3.30
A6 910 2000 90 3.00
B6 920 2000 80 2.66
C6 945 2000 55 0.83
D6 0.00 3000 0 0.00
Table 3. 2 The volumes of double concentrated agar, SDW, and aqueous hop extract used to generate a range of hop concentrations within the agar incorporation assay

63
After cooling, the plate was transferred to a static incubator (Thermo Scientific, UK) for
3 h at 37 °C. A previously prepared bacterial suspension (Method 2.2.2) was then
standardised to 1 x10⁶ cfu mL-1 (Method 2.2.3) and two 20 µL aliquots were pipetted
onto the surface of each well. Plates were then incubated for 24 or 72 h depending on
the test bacteria.
By using different concentrations of the hop extract against the test bacteria, the
minimum inhibitory concentration (MIC) could be calculated. The MIC was determined
by visually inspecting each well after incubation, the lowest concentration of hop
extract which inhibited growth, was considered the MIC. To determine the minimum
bactericidal concentration (MBC) the surface of each well was swabbed with a sterile
wooden swab (Fisher Scientific, UK) and transferred to either 10 mL Middlebrook 7H9
broth in the case of Mycobacteria or 10 mL TSB in the case of other bacteria. The
inoculated media was then incubated with shaking at 150 rpm at 37 °C for 24 or 72 h
dependant on the test bacteria.
After incubation, the absorbance of each solution was read at 600 nm (UV -6010,
Thermo Scientific, UK), using sterile broth as a negative control, the lowest
concentration of hops that prevented the growth of bacteria was considered the
minimum bactericidal concentration (MBC).
The method was repeated on 3 separate occasions for each test bacteria unless
otherwise specified.

64
3.7 Results
Hops are employed in the brewing process to enhance the aroma and flavour of beer
and to act as a natural preservative (Hornsey, 2003). It is known that the act of boiling
hops with water, malt and barley releases antimicrobial compounds into the beer
solution (Sakamoto and Konings, 2003b). This mixture, known as the wort, is heated
for a specific length of time and temperature as determined by the brewer to achieve
the desired aroma and flavour (Hornsey, 2003).
Hops which are used in brewing are provided in two forms; as un-macerated whole
hop cones or as macerated, compressed pellets. The whole hop cones undergo
minimal processing. In contrast, the pelleting process involves the hops cones being
broken down into a fine power by hammer milling (maceration) after which they are
compressed into 5 cm by 1 cm pellets (Hieronymus, 2012).
3.7.1 Optimisation assays for the extraction of antibacterial
compounds from hops this is an intro not the results
The effect of hop cone processing along with the time and the temperature of the
aqueous extraction of hop plants and the effect on antibacterial activity was
determined by using the zone of inhibition assay against M. smegmatis.

65
3.7.2 The effect of maceration on the release of water soluble
antibacterial compounds from hops
The degree of maceration and its effect on the release of water soluble antimicrobial
compounds from hops was determined. The release of antimicrobial compounds into
sterile distilled water from the following substrates was compared; hand macerated
whole hop cones, mechanically macerated whole hop cones and mechanically
disrupted pelleted hop cones. As a control, non-macerated hop cones were included.
Following aqueous extraction (Method 3.5.2) the presence of compounds with
antibacterial activity against M. smegmatis was determined using a zone of inhibition
assay using Middlebrook 7H10 agar (Figure 3.1).
Figure 3. 1 The effectiveness of hand and mechanical maceration on the release of polar antimicrobial compounds from hops following aqueous extraction. Activity was determined
using a zone of inhibition assay against M. smegmatis, positive controls and negative controls consisted of oleic acid (8 µg mL-1) and SDW. Each assay was repeated 3 times;
results presented are the mean, error bars represent standard deviation ( ±SD).
0
2
4
6
8
10
12
14
16
18
Unmaceratedwhole hops
Handmaceration of
whole hops
MechanicalMaceration of
whole hops
Mechanicallymacerated
pellets
Oleic acid (8µg/ml)
SDW
Me
an z
on
e o
f in
hib
itio
n (
mm
)
Maceration type, positive and negative controls
Northdown Galena Green Bullet Goldings Citra Challenger controls

66
As can be seen from the data presented in Figure 3.1 physical disruption of the hop
cone structure either by hand or using mechanical means resulted in an increase in the
antibacterial activity of hop extracts following aqueous extraction when compared to
undisrupted whole hops.
To determine if there were statistically significant differences between antibacterial
activity and the level of maceration data was subjected to a one way ANOVA. A
statistically significant difference (p = 0.026) between macerated and un-macerated
hops in terms of antibacterial activity was observed. As a statistically significant
difference was found a Tukey honest significant difference (HSD) post hoc analysis was
used to determine if the type of maceration had an impact on antibacterial activity.
A statistically significant difference (p = 0.027) was observed between mechanically
disrupted pelleted hop extracts (mean zone of inhibition (ZOI) 14.13 mm ±SD 1.203
mm) and untreated whole hops (mean ZOI = 12.82 mm ±SD 1.29 mm). In contrast no
statistically significant difference was observed between hand (p = >0.05; mean ZOI
10.66 mm ±SD 1.22 mm) and mechanical (p= > 0.05); mean ZOI = 12.82 mm ±SD 1.29
mm) maceration of whole hops.
This result is not surprising given that during the production of hop pellets the whole
hop cones are reduced to a powdered form prior to being compressed into pellets
(Hieronymus, 2012). This form of processing offers two distinct advantages over the
use of whole hops. The first is that the tight compression of the powdered hop
material is thought to slow degradation by minimising exposure to oxygen (De
Keukeleire, 2000). The second is that the powdering process increases the surface area
of the hop material across which, compounds could be extracted.
Based on these results pelleted hops, when available, were used in all future
antimicrobial assays. When pelleted forms of a particular variety were not available
then whole hops were subjected to mechanical maceration prior to extraction.

67
3.7.3 The effect of temperature on the release of water soluble
antibacterial compounds from hops
As previously mentioned hops are added to the wort and are heated at a temperature
determined by the brewer. This heating process is essential as it leads to the thermal
isomerisation of alpha and beta acids which enhances the taste of the beer and results
in the generation of antibacterial isomers such isohumulone (Acworth et al., 2012;
Jaskula et al., 2008; Stevens and Page, 2004).
To identify the optimum temperature for the maximum extraction of antibacterial
compounds, pelleted hop varieties were suspended in SDW for a period of 60 minutes
at 25 °C, 50 °C, 75 °C and 100 °C. Antibacterial activity was assessed against M.
smegmatis in a zone of inhibition assay, with +ve oleic acid 8 µg/mL-1 and –ve SDW
controls (Figure 3.2).
Figure 3. 2 The effect of extraction temperature on the release of antibacterial compounds from different varieties of hops. Pelleted hop variants were suspended in SDW at 25, 50 , 75
and 100 °C for 60 mins. Antibacterial activity was determined using a zone of inhibition assay against M. smegmatis. Each assay was repeated 3 times; results presented are the
mean, error bars represent standard deviation ( ±SD).
0
2
4
6
8
10
12
14
16
18
25 °C 50 °C 75 °C 100 °C Oleic acid (8µg/ml)
SDW
Me
an z
on
e o
f in
hib
itio
n (
mm
)
Extraction temperatures, positive (oleic acid) and negative (SDW) controls
Galena Northdown Green Bullet Goldings Challenger Citra Controls

68
It can be observed from Figure 3.2 that the antibacterial activity increased with the
degree of heating for all hop variants tested.
Using a one way ANOVA analysis it was found that there was a statistically significant
difference (p= <0.05) between heated (50 °C, 75 °C, 100 °C) and unheated (25 °C) hop
extracts and the level of antibacterial activity. To determine the optimum extraction
temperature data was subjected to a Tukey HSD analysis.
There was no statistically significant difference in activity between hops extracted at
room temperature (25 °C) and 50 °C (p = 0.693); and between 75 and 100 °C (p =
0.699). There was however a statistically significant difference between hops extracted
at 25 °C and 75 °C (p = <0.05), between 25 °C and 100 °C (p = <0.05) and between 50 °C
and 100 °C (p= < 0.05).
It has long been understood that heating hops during the wort boiling process
(approx. 100 °C ) leads to the release of the alpha and beta acids which are
responsible for aroma and bitterness (Arnold, 2005). It is these compounds which are
isomerised to form cis and trans isomers which are also thought to be responsible for
the antibacterial activity of beer (Caballero et al., 2009). Therefore it is possible that
the heating during extraction could be directly affecting the isomerisation of the alpha
and beta acids and thus the antibacterial activity.
It can be concluded from this data that an extraction temperature of 100 °C does not
have a detrimental effect on antibacterial activity; moreover heating leads to
antibacterial activity. Based on these results it was decided to adopt an extraction
temperature of 100 °C for all future studies.

69
3.7.4 The effect of extraction time on the release of polar antibacterial
factors from hops
In the previous assays the effect of maceration and temperature on the extraction of
antibacterial compounds from hops was analysed. To determine if the time that hops
were extracted influenced the recovery of antibacterial compounds pelleted hop
material was extracted as previously described (Method 3.5.2) at a temperature of 100
°C for 30, 60, 120 and 180 minutes and a zone of inhibition assay was used to
determine antibacterial activity against M. smegmatis. With +ve oleic acid 8 µg/mL-1
and –ve SDW controls
Figure 3. 3 The effect of extraction time of hop extracts at 100 °C and the level of antibacterial activity. Macerated hop material was heated at 100 °C for 30, 60, 120 and 180 minutes and after cooling to room temperature, were tested in a zone of inhibition assay against M. smegmatis on three separate occasions. Results represent the mean ZOI, error
bars ± SD, positive control (oleic acid) and negative (SDW).
0
2
4
6
8
10
12
14
16
18
30 mins 60 mins 120 mins 180 mins Oleic acid (8µg/ml)
SDW
Me
an z
on
e o
f in
hib
itio
n (
mm
)
Extraction times, positive (oleic acid) and negative controls (SDW)
Goldings Challenger Galena Northdown Green Bullet Citra Controls

70
As can be seen from the results presented in Figure 3.3 the time that hops are exposed
to 100 °C affects the magnitude of the resulting antibacterial activity and shows that
some hop variants are more sensitive to the effects of time than others. The hop
variant, Northdown failed to display any antibacterial activity following heating at 100
°C for 30 minutes while all other hop variants (n=5) displayed some level of
antibacterial activity.
A one way ANOVA of the data compared the extraction time at 30, 60, 120 and 180
minutes and the level of antibacterial activity; a statistically significant difference (p =
<0.05) was observed. Therefore a Tukey HSD post hoc test was used to evaluate the
statistical differences between each extraction time.
Firstly the mean zone of inhibition of hop variants against M. smegmatis after heating
at 100 °C for 30 minutes (mean 3.83 mm ± SD 0.935 mm) was compared to heating at
60, 120 and 180 minutes; and a statistically significant difference was observed (p = <
0.05).
However, comparing heating at 100 °C for 60 minutes (Mean ZOI 12.71 mm ± SD 0.790
mm) to 120 mins (mean ZOI 12.63 mm ± SD 0.686 mm) and 180 mins (mean ZOI was
11.47 ± SD 0.895 mm); it was found that there was no significant difference in activity
(p = 1.00; 0.652 respectively).
Even though an increase in the overall antibacterial activity was observed after heating
for 60 and 120 minutes, at 180 minutes there was a decrease in the mean zone of
inhibition. Previous research (Caballero et al., 2009) has highlighted that hop
compounds are heat sensitive; therefore prolonged heating further than 180 minutes
could lead to thermal decomposition of the antibacterial compounds.
Based on these results all future hop extractions were performed at 100 °C for 60
minutes prior to antibacterial activity testing.

71
3.7.5 Identification of a common commercial agar based culture media
with which to determine the sensitivity of MSSA, MRSA, E. coli and B.
subtilis against aqueous hop extracts
To determine if the antibacterial activity demonstrated by the hop extracts was
specific to a particular bacterial species, the hop variant Green Bullet was assessed for
its ability to inhibit the growth of the following bacteria. Gram positive organisms:
Methicillin sensitive (NCTC 13277) and resistant (NCTC 10442) isolates of
Staphylococcus aureus (MSSA; MRSA) and Bacillus subtilis (NCTC 10315) and Gram
negative bacteria Escherichia coli (NCTC 1093).
Due to the fact that these organisms grew poorly on Middlebrook 7H10 agar which
was used to determine the sensitivity of Mycobacteria; a range of commercially
available agars were compared for their ability to support growth and demonstrate
antibacterial activity.
Figure 3. 4 A comparision of the antibacterial sensitivity of MRSA, MSSA, E. coli and B. subtilis to an aqueous extract of Green bullet using an aqueous extract of Green Bullet hops
using different culture media. Antibacterial activity was determined using a zone of inhibition assay. Each assay was repeated 3 times; results presented are the mean, error bars
represent standard deviation (± SD).
0
2
4
6
8
10
12
14
16
18
TSA BHI LB N.A
Zon
e o
f in
hib
itio
n (
mm
)
B. subtilis MRSA MSSA E. coli Oleic acid SDW

72
All of the culture media supported the growth of the test bacteria. While the growth of
the Gram positive bacteria was inhibited by the Green Bullet hop extract the growth of
the Gram negative representative E. coli was not (Figure 3.4). This finding was not
suprising given that antibacterial compounds found in hops have been reported to
show little, if any, antibacterial activity against Gram negative organisms (Beutler,
2009; Colegate and Molyneux, 2007; Dias et al., 2012).
To determine if there was a statistically significant difference between the zone of
inhibition against all test bacteria and the agar used, data was subjected to a one way
ANOVA. No significant difference was observed between TSA and BHI (p=0.276); TSA
and LB (p=0.142) and TSA and NA (p= 0.132).
Due to the fact that TSA supported the growth of all test organisms and is regularly
employed in antibacterial assays it was selected to support all future studies involving
this selection of bacteria.

73
3.8 Comparison of the antibacterial activity of aqueous hop
extracts with their average alpha and beta acid concentration
The alpha and beta acid content of hops has been linked to the antibacterial properties
of beer (Dorman and Deans, 2000; Hornsey, 2003). Therefore to determine if the
stated alpha and beta acid content of a particular hop variant correlated with
observable antibacterial activity two agar based screening assays were used. These
assays consisted of a zone of inhibition assay and an agar incorporation assay which
were used to determine both a minimum inhibitory and bactericidal concentration of
each hop variant.
3.8.1 A comparison of the antibacterial activity of hop extracts against
M. smegmatis and their average alpha acid concentration using a zone
of inhibition assay
To determine if the stated alpha acid concentration of an individual hop extract
correlated with its observed antibacterial activity against M. smegmatis the mean zone
of inhibition (n =3) of each aqueous hop extract (n=50) was plotted against the stated
alpha acid content of each hop variant (Figure 3.5). To determine if a relationship
existed between these two variables a linear regression analysis was undertaken.

74
Figure 3. 5 Correlation of the stated alpha acid content of hop variants with the zone of inhibition against M. smegmatis using a zone of inhibition assay. Each assay was repeated 3
times; results presented are the mean, error bars represent standard deviation (± SD).
The R2 value (0.09) generated by the regression analysis of the data presented in
Figure 3.5 indicates that there is no significant correlation between alpha acid content
and antibacterial activity against M. smegmatis. The R2 value or coefficient of
determination demonstrates how well data fits to a statistical model; the better the
linear regression fits the data in comparison to the simple average the closer the
R2 value will be to 1. Therefore an R2 value of 0.09 demonstrates that there is no
correlation. To further determine if a statistical correlation existed the data was
subjected to a Pearson’s two tailed correlation test. This test determines the
relationship between two variables (0.5 - 1 = strong relationship; 0.1 - 0.5 weak
relationship) and determines the statistical significance of the correlation in the form
of a p value (< 0.05 not statistically significant; > 0.5 statistically significant. A Pearson’s
R value of 0.104 was determined, showing a very weak relationship between alpha
acid content and antibacterial activity.
y = 0.2186x + 8.3225 R² = 0.09
0
2
4
6
8
10
12
14
16
18
0.00 2.00 4.00 6.00 8.00 10.00 12.00 14.00 16.00 18.00 20.00
Me
an z
on
e o
f in
hib
itio
n (
mm
)
Stated alpha acid content of hop variants (%w/w)

75
3.8.2 A comparison of the antibacterial activity of aqueous hop extracts
against M. bovis BCG and other non-Mycobacterial species with their
stated alpha acid content using a zone of inhibition assay
In order to determine if there was a similar lack of correlation between the
antibacterial activity against other bacteria and alpha acid content, the same analysis
was performed using M. bovis BCG (NCTC 5692), the Gram positive bacteria; MRSA
(NCTC 10442), MSSA (NCTC 13277), and B. subtilis (10315) and the Gram negative
bacteria E. coli (NCTC 1093). The antibacterial activity of aqueous hop extracts was
assayed against each organism using a zone of inhibition assay as previously described
(Method 3.6.1). The mean zone of inhibition (n=3) was correlated against the stated
alpha acid concentration of each hop variant.
A summary of the results are presented in Table 3.4 which shows the calculated R2
values along with Pearson’s two tail R values for each bacterial species.
Bacterial Species
Linear Regression Analysis R2 value
Pearson’s Two tailed Correlation R value
MRSA 0.0030 0.1260
NCTC 10442
MSSA 0.0014 0.1040
NCTC 13227
B. subtilis 0.0746 0.1030
NCTC 10315
E. coli No inhibition No inhibition
NCTC 1093
M. bovis 0.0040 0.0960
BCG NCTC 5692
Table 3. 3 Statistical analysis of the correlation of the stated alpha acid content of hop variants (n=50) and the mean zone of inhibition against
MRSA, MSSA, E. coli, B. subtilis and M. bovis BCG using a zone of inhibition assay (n=3). Table shows the linear regression analysis ( R2 value) as well
as Pearon’s R values.

76
From the results presented in Table 3.3, no obvious correlation between the alpha acid
content of each hop variant and antibacterial was observed. As was previously
observed, no antibacterial activity was demonstrated against E. coli.
These results are surprising given that alpha acids are widely recognised as possessing
antibacterial activity and as such it would be expected that they would contribute to
the antibacterial activity of the aqueous hop extracts (Caballero et al., 2009; Cragg and
Newman, 2013; Natarajan et al., 2008). The lack of correlation could be due to a
problem with how the alpha acid concentrations are determined, or the fact that the
alpha acids and their heat derived isomers only make a small contribution to the
overall antibacterial activity observed from the hop extracts.

77
3.8.2. A comparison of the antibacterial activity of aqueous hop
extracts against M. smegmatis with their stated beta acid content using
a zone of inhibition assay
To define if the stated beta acid concentration of an individual hop extract correlated
with the antibacterial activity against M. smegmatis, the mean zone of inhibition (n=3)
of each aqueous hop extract (n=50) was plotted against the stated beta acid content of
each hop variant (Figure 3.6). To determine if a relationship existed, a linear regression
analysis was undertaken on the data.
Figure 3. 6 The correlation of the stated beta acid content of hop variants (n=21) and the mean zone of inhibition against M. smegmatis using a zone of inhibition assay. Each assay
was repeated 3 times; results presented are the mean, error bars represent standard deviation (± SD).
An initial observation of Figure 3.6 and the linear regression analysis (R2 value 0.0567)
suggests that there is no direct correlation between the beta acid content of hops and
antibacterial activity against M. smegmatis. To confirm this observation the data was
subjected to a Pearson’s two tailed correlation which generated a Pearson’s R value of
0.09 further suggesting no correlation.
y = -0.7183x + 10.21 R² = 0.0567
0
2
4
6
8
10
12
14
16
18
0 1 2 3 4 5 6 7 8
Me
an z
on
e o
f in
hib
itio
n (
mm
)
Stated beta acid content of hop variants (w/w)

78
3.8.3 A comparison of the antibacterial activity of aqueous hop extracts
against M. bovis BCG and other non-Mycobacterial species with their
stated beta acid content using a zone of inhibition assay
In order to determine if there was a similar lack of correlation between antibacterial
activity and beta acid content with other bacteria the same analysis was performed
using M. bovis BCG (NCTC 5692), the Gram positive bacteria; MRSA (NCTC 10442),
MSSA (NCTC 13277), and B. subtilis (10315) and the Gram negative bacteria E. coli
(NCTC 1093). The antibacterial activity of aqueous hop extracts was assayed against
each organism using a zone of inhibition assay as previously described (Method 3.5.1).
The mean zone of inhibition (n=3) was correlated against the stated alpha acid
concentration of each hop variant.
A summary of the results are presented in Table 3.4 which shows the results of the
linear regression analysis (R2 values) along with Pearson’s two tail R values for each
bacterial species.
Table 3. 4 Statistical analysis of the correlation of the stated beta acid content of hop variants (n=21) and the mean zone of inhibition against MRSA, MSSA, E. coli, B. subtilis and
M. bovis BCG using a zone of inhibition assay (N=3). Table shows the linear regression analysis (R2 value) as well as Pearson’s R values.
Bacterial Species Linear Regression Analysis
R2 value Pearson’s Two tailed Correlation R value
MRSA NCTC 10442
0.0540 0.2150
MSSA NCTC 13227
0.0750 0.1470
B. subtilis NCTC 10315
0.0660 0.1100
E. coli NCTC 1093
No inhibition No inhibition
M. bovis BCG NCTC 5691
0.0550 0.1320

79
The results from all of the hop variants found no obvious correlation between the
stated beta acid content and antibacterial activity. As was previously observed no
antibacterial activity was seen against E. coli.
Again, these results are surprising given that lupulone, a beta acid found in hops and
beer is known to be antibacterial (Erdmann, 1951; Siragusa et al., 2008). The beta acids
comprise of 3 compounds, lupulone, adlupulone and colupulone (Van Cleemput et al.,
2009a) and the stated beta acid content of a hop refers to the total concentration
(w/w) of all three compounds. Thus, it may be the case that lupulone is present in
much smaller amounts than the other beta acids, this may explain the lack of
correlation. It may also be the case, given that beta acids have been described as being
weakly non-polar (Shen and Sofos, 2008), that the aqueous extraction process used
may not have efficiently extracted all of the available beta acids.

80
3.8.4 Comparison of the antibacterial activity of aqueous hop extracts
with their average alpha and beta acid concentration against M.
smegmatis using an agar well incorporation assay
The zone of inhibition assay is a useful tool with which to rapidly screen the
antibacterial activity of large numbers of hop extracts against all test bacteria.
However, the information which can be obtained from this assay is limited when
compared to a standardised agar incorporation approach which allows both the
minimum inhibitory (MIC) and bactericidal (MBC) concentrations of the test agent to
be determined.
For this reason, an agar incorporation assay (adapted from previous research (Varela
et al., 2008)) was employed. A comparison of the antibacterial activity of the various
aqueous hop extracts using the agar diffusion and agar incorporation assays against
M.smegmatis is shown in the following table (Table 3.5).

81
Table 3. 5 The antibacterial activity (ZOI, MIC and MBC) of aqueous hop extracts against M. smegmatis determined using a zone of inhibition and agar incorporation assay. (Results
represent n=3)
Antibacterial activity of hop extract
Hop variant Mean Zone of inhibition
(mm)
Agar incorporation
MIC
MBC
( % v/v hop extract) (As % v/v hop extract)
Galena 2.60 33.00 33.00
Styrian Goldings 4.15 33.00 33.00
Cascade 5.50 13.00 15.00
Simcoe 6.12 13.00 17.00
Savinjski Goldings 6.16 6.60 8.00
Summer Pellets 6.34 6.60 10.00
Boadicea 6.72 5.30 5.30
Perle 6.75 16.00 16.00
Galaxy 7.35 5.30 6.00
Summit 7.35 13.00 20.00
NZ Pacifica 8.04 10.00 10.00
Apollo 8.20 7.00 8.00
Hallertauer 8.20 10.00 10.00
Bobek 8.30 10.00 10.00
Liberty 8.30 33.00 33.00
Sonnet 8.37 4.60 5.00
Sorachi Ace 8.62 15.00 16.00
Motueka Pellets 8.95 13.00 15.00
Tettnang 8.95 10.00 15.00
Fuggles 9.25 13.00 15.00
Colombus 9.50 10.00 10.00
Delta 9.62 5.30 6.00
Chinnok 10.25 10.00 10.00
Centennial Pellets 10.65 11.60 13.00
Northdown 10.66 13.00 15.00
Amarillo 10.75 5.00 5.00
Cascade Pellets 11.20 11.60 11.60
Brambling Cross 11.33 7.00 7.00
Pacific Jade 11.36 6.60 8.00
Progress 11.52 10.00 10.00
Challenger 11.55 10.00 10.00
Northern Brewer 11.66 3.00 4.00
Nelson Sauvin 11.68 4.00 4.60
Aurora 11.72 5.30 6.00
Amarillo Pellets 12.15 4.00 4.60
Pacific Gem 12.37 16.00 20.00
Target 12.37 18.30 18.30
Williamette 12.50 3.00 5.50
Fuggles Pellets 12.90 11.60 11.60
Glacier 13.52 3.30 3.30
First Gold 13.75 3.30 4.00
Chinook Pellets 14.20 8.00 10.00
Centennial 14.32 4.60 5.00
Rakau 14.62 16.00 18.30
Green Bullet 14.80 10.00 10.00
Magnum 15.04 5.30 5.30
Warrier 15.20 10.00 10.00
Goldings 16.40 10.00 10.00
Citra 16.45 2.66 2.66

82
Analysis of the results presented in Table 3.5 reveal that for several hop variants there
was a marked difference in the results obtained using the zone diffusion and agar
incorporation assays.
For example the hop variants Goldings and NZ Pacifica had identical MIC and MBC
values (10 % v/v) yet there zones of inhibition differed markedly with diameters of
16.4mm and 8.4mm respectively.
A similar disconnection was observed between the Goldings and Citra variants which
demonstrated similar mean zones of inhibition values (16.4 mm ±SD 0.13 and 16.45
mm ±SD 0.11) but differed markedly with regards MIC and MBC levels (Goldings
MIC/MBC 10 % v/v and Citra MIC/MBC 2.66 % v/v ).
To determine if the differences between the ZOI, MIC and MBC were statistically
significant the mean zone of inhibition results were compared to the MIC and MBC
values using a paired samples t test. A significant difference was seen between the
mean zone of inhibition and the MIC (p=0.001) and the MBC (p=0.001) respectively.
From these results, it is possible to conclude that although the zone of inhibition assay
is a useful method with which to detect antibacterial activity, the agar incorporation
assay gives a more quantitative measure of the antibacterial activity of a hop extract.

83
3.8.5 A comparison of the antibacterial activity (MIC) of hops extracts
against M. smegmatis and average alpha acid concentration
determined using an agar incorporation assay
To determine if the stated alpha acid concentration of an individual hop extract
correlated with its observed antibacterial activity against M. smegmatis the MIC (n=3)
of each aqueous hop extract (n=50) was plotted against the stated alpha acid content
of each hop variant (Figure 3.7). To determine if a relationship existed between these
two variables data was subjected to a linear regression analysis.
Figure 3. 7 A comparison of the antibacterial activity (MIC) of aqueous hop extracts with their stated alpha acid content. Antibacterial activity was determined using an agar
incorporation assay against M. smegmatis grown on Middlebrook 7H10 agar Each assay was repeated 3 times; results presented are the mean.
The linear regression analysis suggests that there is no correlation between the stated
alpha acid content and MIC. To confirm this observation the data was subjected to a
Pearson’s two tailed correlation which generated an R value of 0.681 suggesting no
correlation.
y = 0.0941x + 9.4697 R² = 0.0036
0
5
10
15
20
25
30
35
0 2 4 6 8 10 12 14 16 18 20
MIC
(%
v/v
) o
f h
op
ext
ract
s
Stated alpha acid content of hop variants (w/w)

84
3.8.6 A comparison of the antibacterial activity (MBC) of hops extracts
against M. smegmatis and average alpha acid concentration
determined using an agar incorporation assay
To determine if the stated alpha acid concentration of an individual hop extract
correlated with its observed antibacterial activity against M. smegmatis the MBC (n=3)
of each aqueous hop extract (n=50) was plotted against the stated alpha acid content
of each hop variant (Figure 3.8). To determine if a relationship existed between these
two variables linear regression analysis of the data was performed.
Figure 3. 8 A comparison of the antibacterial activity (MBC) of aqueous hop extracts with their alpha acid content. Antibacterial activity was determined using an agar incorporation assay against M. smegmatis grown on Middlebrook 7H10 agar Each assay was repeated 3
times; results presented are the mean
The linear regression analysis suggests that there is no correlation between the stated
alpha acid content and MBC. To confirm this observation the data was subjected to a
Pearson’s two tailed correlation which generated an R value of 0.546 suggesting no
correlation.
y = 0.1406x + 10.099 R² = 0.0078
0
5
10
15
20
25
30
35
0 2 4 6 8 10 12 14 16 18 20
MB
C (
%v/
v) o
f h
op
ext
ract
s
Average alpha acids (% w/w) content of individual hops

85
3.8.7 A comparison of the antibacterial activity (MIC) of hop extracts
against M. smegmatis and the average beta acid concentration
determined using an agar incorporation assay
To determine if the stated beta acid concentration of an individual hop extract
correlated with its observed antibacterial activity against M. smegmatis the MIC (n=3)
of each aqueous hop extract (n=50) was plotted against the stated alpha acid content
of each hop variant (Figure 3.9). To determine if a relationship existed between these
two variables a linear regression analysis of the data was performed.
Figure 3. 9 A comparison of the antibacterial activity (MIC) of aqueous hop extracts with their beta acid content. Antibacterial activity was determined using an agar incorporation assay against M. smegmatis grown on Middlebrook 7H10 agar Each assay was repeated 3
times; results presented are the mean.
The linear regression analysis suggests that there is no correlation between the stated
Beta acid content and MIC. To confirm this observation the data was subjected to a
Pearson’s two tailed correlation which generated a P value of 0.254 suggesting no
correlation.
y = -73.774x + 11.182 R² = 0.1478
0
2
4
6
8
10
12
14
0.00% 1.00% 2.00% 3.00% 4.00% 5.00% 6.00% 7.00% 8.00% 9.00% 10.00%
The
MIC
of
ho
p e
xtra
cts
(% v
/v)
Stated beta acid concentration of hop variants (% w/w)

86
3.8.8 A comparison of the antibacterial activity (MBC) of hop extracts
against M. smegmatis and the average beta acid concentration
determined using an agar incorporation assay
To determine if the stated beta acid concentration of an individual hop extract
correlated with its observed antibacterial activity against M. smegmatis the MBC (n=3)
of each aqueous hop extract (n=50) was plotted against the stated alpha acid content
of each hop variant (Figure 3.10). To determine if a relationship existed between these
two variables a linear regression analysis of the data was performed.
Figure 3. 10 A comparison of the antibacterial activity (MBC) of aqueous hop extracts with their beta acid content. Antibacterial activity was determined using an agar incorporation assay against M. smegmatis grown on Middlebrook 7H10 agar. Each assay was repeated 3
times; results presented are the mean.
The linear regression analysis suggests that there is no correlation between the stated
Beta acid content and MBC. To confirm this observation the data was subjected to a
Pearson’s two tailed correlation which generated a Pearson’s R value of 0.884
suggesting no correlation.
R² = 0.1893
y = -102.28x + 13.536
0
2
4
6
8
10
12
14
16
18
0.00% 1.00% 2.00% 3.00% 4.00% 5.00% 6.00% 7.00% 8.00% 9.00% 10.00%
The
MB
C (
% v
/v)
of
ho
p e
xtra
cts
Stated beta acid concentration of hop varinats (w/w)

87
3.8.9 A comparison of the antibacterial activity (MIC and MBC) of
aqueous hop extracts against M. bovis BCG and non-Mycobacterial
species with their stated alpha acid content using an agar
incorporation assay
In order to determine if there was a similar lack of correlation between MIC and MBC
and alpha acid content with other bacteria the same analysis was performed using M.
bovis BCG (NCTC 5692), the Gram positive bacteria; MRSA (NCTC 10442), MSSA (NCTC
13277), and B. subtilis (10315) and the Gram negative bacteria E. coli (NCTC 1093). The
MIC and MBC of each organism was plotted against the stated alpha acid
concentration of 50 hop variants and a linear regression analysis was performed. The
data was then subjected to a Pearson’s two tailed correlation. A summary of the
results are presented in Table 3.6 which shows the results of the linear regression
analysis ( R2 values) along with Pearson’s two tail R values for each bacterial species.
Bacterial species
Linear regression analysis of MIC and alpha acid
(R2 value)
Linear regression analysis of MIC and alpha acid
(R2 value)
MSSA NCTC 13227
0.0005 0.0635
MRSA NCTC 10442
0.0098 0.0012
M. bovis BCG NCTC 5691
0.0016 0.0014
B. subtilis NCTC 10315
0.0450 0.0016
Table 3. 6 Statistical analysis (linear regression and Pearson’s two tailed correlation) of the MIC and MBC of aqueous hop extracts against MSSA, MRSA, M. bovis BCG and B. subtilis
with stated alpha acid content.
As displayed in Table 3.6, no correlation was found between the MIC and MBC of any
organism and the stated alpha acid concentration of the hop variants.

88
3.8.10 Comparison of the antibacterial activity (MIC and MBC) of
aqueous hop extracts against M. bovis BCG and non-Mycobacterial
species with their stated beta acid content using an agar incorporation
assay
The MIC and MBC of each organism was plotted against the average beta acid
concentration of 21 hop variants and a linear regression analysis was performed. The
data was then subjected to a Pearson’s two tailed correlation. A summary of the
results are presented in Table 3.7 which shows the results of the linear regression
analysis ( R2 values) along with Pearson’s two tail R values for each bacterial species.
Table 3. 7 The MIC and MBC of organisms MSSA, MRSA, M. bovis BCG and B. subtilis against aqueous hop extracts were correlated with the average beta acid concentration and the
calculated R2 values are displayed.
No correlation between the MIC and MBC of any organism and the stated beta acid
concentration was observed.
Bacterial species
Linear regression analysis of MBC and beta acid
(R2 value)
Pearson’s two tailed correlation of MIC and beta
acid (R value)
MSSA NCTC 13227
0.0038 0.142
MRSA NCTC 10442
0.0035 0.147
M. bovis BCG NCTC 5691
0.0016 0.284
B. subtilis NCTC 10315
0.0001 0.514

89
3.9 Discussion
It is clear from this study that the level of maceration, extraction temperature and the
time that the hop material is exposed to heat has a marked effect on antibacterial
activity. Pelleted macerated hops demonstrated the greatest activity presumably due
to increased surface area over which antibacterial compounds could be extracted and
the fact that the pelleting process reduces the oxidation and thus the degradation of
compounds.
The effect of heat on the antibacterial activity of the hop extracts is likely to have been
the consequence of two processes, energy driven release of compounds from plant
material into the aqueous solution and the isomerisation of released compounds such
as the alpha and beta acids.
Heating of the hop extracts leads to the isomerisation of the alpha acids (humulone,
cohumulone and adhumulone) into iso-α-acids via an acyloin type ring contraction.
This isomerisation reaction has been understood since 1971 (De Keukeleire and
Verzele, 1971), it has been shown that the isomerisation of hop acids leads to
increased antibacterial activity in the beer (Caballero et al., 2009). The recovery of the
cis and trans isomers of the alpha acids is comparatively low (utilising a maximum of
60 % of starting concentration of hop alpha acids) when using traditional hopping
techniques such as simply adding hops to boiling wort when compared to using
prepared hop extracts (Jaskula-Goiris, 2010). Furthermore, the isomerisation of hops
and thus their utilisation within the brew, can vary significantly between brewers and
in some cases between brew to brew, this can be due to many factors including pH,
temperature and the degree of maceration (Jaskula-Goiris, 2010).
Indeed given that the hop plant is known to contain over 800 separate compounds it is
not surprising that substances such as proteins and tannins may well interact with the
hop acids resulting in a reduction of isomerisation (Acworth et al., 2012).

90
In brewing, the isomerisation of the hop alpha and beta acids during the boiling of the
wort is used to increase the aroma and bitterness properties of the beer. The main
alpha and beta acids humulone and lupulone, are relatively hydrophobic and thus
aqueous extraction is a relatively inefficient process. Heat induced isomerisation of
these compounds into their respective cis and trans isomers increases there solubility
in water and thus promotes the extraction process (Acworth et al., 2012).
While heating increased the antibacterial activity of hop extracts, prolonged heating (>
60 mins) resulted in a loss of activity. Malowicki and colleagues observed that while
isomerisation of alpha acids increased with time there was also increased thermal
degradation. Suggesting that prolonged boiling at 100 °C could have an adverse effect
on antibacterial activity (Malowicki and Shellhammer, 2005b).
In this study, two agar based screening methods were used to determine the
antibacterial activity of heat treated hop extracts. The broth based micro dilution
method was considered. However, due to the inherent turbidity of the hop extracts
following heating it was not practical (Zgoda and Porter, 2001).
While the zone of inhibition assay proved a useful tool with which to rapidly determine
the antibacterial of multiple hop extracts it does have limitations. The size of zone of
inhibition is affected by the concentration of antibacterial agent in the sample, the
thickness and nature of the supporting agar and also the density of the bacterial
inoculum. Thus while rapid, the assay is a relatively insensitive tool with which to
identify differences in the antibacterial activity of different hop variants (Ashworth,
2012, Brandon, 2014).
For this reason, an agar incorporation assay was developed and employed which
allowed for the determination of the minimum inhibitory concentration and minimum
bactericidal concentration of each hop variant. Agar incorporation methods have the
advantaged of providing a more quantitative result than the zone of inhibition assay
(Roberts 1998).

91
Using this assay it was observed that all hop variants demonstrated some level of
antibacterial against the Mycobacterial isolates examined in this study. The Citra
variety demonstrated the greatest inhibitory activity against M. smegmatis and M.
bovis BCG with the Galena variety showing the least. No correlation between the
antibacterial activity of the hop varieties examined in this study and their stated alpha
and beta acid content was observed. To determine if this lack of correlation was
specific to mycobacteria, the activity of the hop varieties against selected Gram
positive and Gram negative bacteria was determined.
These organisms, unlike Mycobacterium require a more complex growth medium and
for this reason I determined the ability of different commercial media, TSA, BHI, LB and
NA, to support the growth of these organisms and to assess the antibacterial activity of
the hop extracts.
The use of a zone of inhibition assay and a Green Bullet hop extract showed that all
four media were equally effective at supporting growth and demonstrating
antibacterial activity. Due to availability, TSA was used to determine the relative
antibacterial activity of all of the hop variants. The results for the Gram positive
bacteria mirrored those seen for mycobacteria with no correlation observed between
antibacterial activity and the stated alpha and beta acid content.
As expected no antibacterial activity against E.coli was observed. As the only Gram
negative bacteria the lack of activity is probably due to the nature of its cell wall
(Cowan, 1999). In Gram negative bacteria, the outer cell membrane differs from the
Gram positive by having a thick layer of lipopolysaccharides and proteins (Grayson,
2009). There are essentially two distinct pathways that an antibiotic can take: a lipid-
mediated pathway for hydrophobic compounds and general diffusion porins for
hydrophilic compounds. The lipid and protein compositions of the outer membrane of
the Gram negative organism have a strong impact on the sensitivity of bacteria to
antibiotics; rendering them less susceptible than Gram positive organisms (Delcour,
2009).

92
Overall the lack of correlation between the hop acid content and antibacterial activity
was surprising given that the hop alpha and beta acids have been described as
antibacterial (In Acworth et al., 2012). It is hypothesised that other compounds in the
hop extract contribute for the observed activity. Hops have been shown to contain
over 800 compounds some of which may be directly antibacterial or act in a synergistic
manner to enhance the activity of other antibacterial compounds. Once such
compound is xanthohumol, a bioactive prenylated chalcone which to date has only be
found in hops and is known to be antibacterial (Acworth et al., 2012; Ceh et al., 2007;
Stevens and Page, 2004). The compound is also isomerised in the wort during the
boiling stage to form iso-xanthohumol which is also antibacterial (Acworth et al.,
2012). The results presented in this chapter supports earlier work which suggests that
other compounds in addition to hops acids, contribute to the antibacterial activity of
beer (Acworth et al., 2012; Everard et al., 2012; Van Cleemput et al., 2009b).

93
Chapter 4
Quantification of the antimicrobial components of hops

94
4.0 Quantification of the antimicrobial compounds of hops
4.1 Chapter introduction
Natural products and their derivatives have been identified for their medical
importance for thousands of years. A search of the NAPRALAERT database (an alert
network for published literature on novel natural products) lists 58,725 plant species,
of which, 6350 have been shown to have antimicrobial activity. Contrarily, even though
natural products continue to be a primary source of new antimicrobials (Bérdy, 2012)
only 20 new antibacterial compounds from natural products have been brought to the
market since the year 2000 (Butler and Cooper, 2011; Wright, 2012).
Several reasons have been proposed for this decline in clinical development including;
time of research and difficulty in extraction of the novel metabolite, the cost of taking
the drug through clinical trials and the rise of bacterial resistance which can render the
antimicrobial redundant before reimbursement of the initial investment (Abreu et al.,
2012).
The importance of discovering novel antimicrobials has never been so significant. For
example, the rise of multidrug resistant strains of M. tuberculosis (MDR-TB) has been
linked to the acquired immunodeficiency syndrome (AIDS) epidemic, poor
socioeconomic conditions, immigration and the lack of inhibitory antimicrobials. Due
to a lack of novel antimicrobials, curing patients of MDR-TB is extremely low with 50%
making a full recovery compared to more than 95 % of patients with antibiotic
sensitive TB (Ahmad and Aqil, 2009; Mahady, 2005)
For these reasons, conventional medicine is increasingly receptive to plant-based
medicines. This is due to not only the rise of bacterial resistance to traditional
antibacterials, but also the rapid rate of botanical species extinction (Cowan, 1999).
Furthermore, the general public have been made increasingly aware of the overuse
and misuse of antibiotics, and are now becoming interested in alternative medicines
such as ‘medicinal plants’. It has been estimated that up to 80 % of the population of
developed countries worldwide use botanical products and consider them to be safe
and effective (Mahady, 2001)

95
While thousands of plant species have been tested against many different strains of
bacteria, the most common are E. coli, B. subtilis, C. pneumonia and Methicillin
Resistant S. aureus (MRSA). However, little research has been paid to species of
mycobacterium even though many strains such as M. tuberculosis and M. abscessus
have developed increased resistance to front line antibiotics such as rifampicin (Jeon et
al., 2009; Petrini, 2006).
In this chapter, the compounds which are directly responsible for the antibacterial
activity against M. smegmatis was further investigated. Whilst it has been shown that
several plant species are useful therapeutics (including; opium, belladonna and aloe)
when used in their natural state, second generation natural products from the
processing of the plant, to purified chemical compounds with an identified structure
are now becoming more commonplace. Drugs such as taxol from Taxus brevifolia for
the treatment of ovarian cancer followed the same development and evaluation as
other pharmaceutical drugs (Ahmad and Aqil, 2009; Iwu, et al., 1999)
In Chapter 3, the antibacterial activity of crude hop extracts against a range of clinically
relevant bacteria was investigated and data correlated with the alpha and beta acid
concentrations. No statistically significant correlation was observed so therefore this
chapter describes the extraction and bioassay guided fractionation of the antibacterial
component molecules within hops.
In the production of beer, hops are primarily extracted in water during the wort boiling
process and it has been shown that both the alpha- and beta-acids, as well as potential
antibacterial compounds, are transferred to the brew during this stage (Caballero et
al., 2009; Cornelison, 2008; Neve, 1991; Stevens and Page, 2004). For this reason,
several volatile polar organic solvents such as methanol have been used in this project
during the hop extraction process to mimic the polarity of water, while being simpler
to manipulate in the laboratory. The use of solvents in plant extraction is well
documented (Eloff, 1998; Parekh et al., 2005; Sharifa et al., 2008) and research by
Wang et al. (2006) suggests that traditional solvent extraction is as efficient and
reliable as other processes, such as supercritical CO2 extraction (Wang and Weller,
2006).

96
Following treatment with a solvent, the crude hop extract is a complex mixture of over
800 compounds (Neve, 1991). The difficulties of separating this mixture further, not
just in hops but many natural products, has been associated with the decline in drug
discovery from nature (Vu et al., 2008). The key separation technique in natural
product chemistry is chromatography (Colegate and Molyneux, 2007). Its most basic
form, thin layer chromatography (TLC) has been used to separate crude hop extracts
for over 50 years (Bhandari, 1964).
This method is used to separate non-volatile mixtures, usually on a thin layer of
adsorbent material (the stationary phase) such as silica gel coated on an aluminium or
glass plate. The sample is added to the plate and a suitable solvent (mobile phase)
draws the analyte up the plate by capillary action. Different analytes will elute up the
TLC plate at different rates depending on their polarity, producing separation (Reed,
2007). In this study, the use of TLC was combined with a bacterial assay to develop a
bioassay-guided, bio autographic TLC technique originally described, and adapted from
(Fleming, 1942). In summary, TLC methodology produces a separation of a complex
mixture over which a thin layer of Mycobacterium smegmatis can be overlaid onto the
surface of the TLC plate. Inhibition of growth can then be observed after bacterial
exposure to a stain. Although not a quantitative method, it can locate potential
antibacterial compounds (and eliminate inactive compounds) within the mixture
(Rahalison et al., 1991).
Further separation methods, such as preparative TLC and column chromatography, can
then be used for high volume recovery of a specific compound as they are relatively
time consuming, laborious and can be of low resolution (Andersen, 1969; Bhandari,
1964; Hostettmann et al., 1998; Reed, 2007; Stavri et al., 2004; Zeković et al., 1994).

97
The primary method for analyte identification is high or ultra-pressure liquid
chromatography (HPLC/UPLC) coupled to mass spectrometry (Acworth et al., 2012;
Baker et al., 2008). HPLC utilises the development of high pressure pumps with
reproducible, reliable flow rates to give rapid separation with reduced band
broadening (Reed, 2007). To aid in the identification of separated compounds, the
HPLC system is usually coupled to a mass spectrometer (MS). This method relies on
splitting the eluent from the column so that only a small volume reaches the MS.
Chromatograms show peaks which correspond to the elution of particular
components. It is then possible to analyse individual peaks and obtain a mass for that
component (Colegate and Molyneux, 2007; Koehn and Carter, 2005).
In this chapter, the validity of the methods used have not only been confirmed, but
antimycobacterial analytes from methanol hop extracts have been tested, purified and
identified. Differences between the most antimicrobial and least antimicrobial hop
extracts have been observed and reasons for the differences in antibacterial activity
discussed. This chapter also highlights the difficulties in obtaining pure bioactive
compounds from complex natural products.

98
4.2 Materials
4.2.1 Sources of chemicals and reagents
All chemicals and reagents were purchased from Sigma Aldrich Ltd, UK, unless
otherwise stated in the text.
All solvents were from purchased from Thermo Fischer Scientific Ltd, UK, unless
otherwise stated in the text.
4.2.2 Diluents
Deionised water (diH2O) was obtained from an ELGA purelab option BP15 dispenser
(ELGA labwater, UK). The inorganic content of the water at 25 °C was between 1-15
MΩ-cm with a total organic carbon content of <30 ppb. It was sterilised at 121 °C for
15 minutes at 15 psi (Prestige, 9L classic bench top autoclave, LabShop, UK) to form
sterile distilled water (SDW).
4.2.3 Bacterial cultures
Mycobacterium smegmatis 8159T was used as a simulant organism for M. tuberculosis
and was grown and standardised as described in Section 2.2.2 and 2.2.3
All growth media was purchased and produced as described previously in Chapter 2,
unless otherwise stated.

99
4.3 Methods
4.3.1 Organic solvent extraction of hop material
Fresh hop material was machine macerated as previously described and 20 g
transferred to a flat bottom 1500 mL conical flask, which was suspended in 1000 mL of
methanol. Other organic solvents (ethyl acetate, acetone) were also trialled to
determine the greatest yield.
The solution was mixed continuously for 48 hours at 100 rpm at room temperature
and pressure. After this time stirring was halted and solid hop material filtered through
a Whatman® size 1 under vacuum pressure to remove any solid hop material.
Resulting solvent was retained and solid hop material was re-suspended in 1000 mL of
fresh methanol for a further 24 hours at room temperature and pressure with mixing
at 100 rpm. Following this, hop material was filtered as previously described and
weighed; hop extract solution was stored at room temperature in the dark until
required.
4.3.2 Hop solution evaporation
Following extraction, both the 24 and 48 hour solutions were combined and re-filtered
through a Whatman® size 1 filter to remove any remaining solids. The resulting
solution was decanted into a 1000 mL round bottom flask. This was then attached to a
Buchi Rotavapor 200 (Buchi, Switzerland) under vacuum pressure (15 bar) and rotated
at 50 revolutions per minute (rpm) at 30 °C.
Waste solvent was firstly checked for compounds by using thin layer chromatography
(Method 4.4.3) and if no compounds were found it was discarded. The resulting dry
hop extract (crude hop extract) was removed from the flask, weighed and stored at 3
°C in the dark until required.

100
4.3.3 Thin Layer chromatography separation of hop extracts
Hops (n=50) detailed in (Section 3.1) were extracted using (Method 4.3.1) and dried by
solvent evaporation (Method 4.3.2). Dry crude hop extracts (10 mg) were then re-
suspended in 1 mL of methanol to give a final concentration of 10 mg/mL-1; a 1:10
dilution series was then prepared in methanol to give final dilutions of 10, 1, 0.1, 0.01,
0.001 mg/mL-1 and each dilution was mixed gently using a desktop vortex (Vortex
Genie 2T shaker, Fisher Scientific, UK) for 15 seconds.
Using a fresh capillary pipette 25 µL of each dilution was removed and spotted onto
the surface of a thin layer chromatography (TLC) plate (50 mm x 75 mm, 0.20 mm
Silica). The TLC plate was then placed horizontally within a fume cupboard at room
temperature and pressure for 10 minutes to allow any excess solvent on the TLC plate
to evaporate. TLC separation of the hop extract was dependant on the solvent system
(mobile phase) and several ratios of the organic solvents hexane, ethyl acetate,
methanol and ethanol were optimised to allow for optimum analyte separation. The
solvent system methanol : ethyl acetate (ratio 1:1) was chosen for all future
separations.
50 mL of freshly prepared solvent system was decanted into a TLC developing tank
(100 mm2 x 100 mm2) and the TLC plate loaded with extract was placed into the
solvent system allowing 1 cm between the surface of the solvent and the extract. The
tank was then covered and the solvent allowed to run for 45 minutes or until the
solvent covered 18 cm of the plate. The distance that the solvent travelled on the plate
was recorded and the plate was examined under visible and UV light (365 nm, UVitech,
UK). Each visible separated analyte was then measured for its total distance travelled
from the baseline.
The Rf values of analytes could then be determined by using the following equation:
This method was repeated on three occasions under the same conditions and the Rf
values recorded.

101
4.3.4 Bacterial overlay assay
The bacterial overlay assay utilises the TLC separation as described previously (4.3.3)
but includes the addition of bacteria to allow visualisation of bioactive analytes as
originally described by Fleming, (1942) and adapted from Rahalison, (1991).
Each hop variant (n=50) was extracted and a 0.1 mg/mL-1 solution of crude hop extract
in methanol was prepared. As a control, Streptomycin solution (stock concentration 1
mg/mL-1 in 1 mM EDTA, Sigma-Aldrich, UK) was also diluted in methanol to give a final
concentration of 6 µg/mL-1.
All samples were then spotted onto the surface of a TLC plate as described earlier
(Method 4.4.3) and were separated using the previously described solvent system.
Once separated, each plate was dried within a fume cupboard at room temperature
and pressure to ensure that no solvent remained on the plate. As a control, on each
occasion a TLC plate without samples was also run and dried for the same amount of
time, this was to ensure solvent evaporation.
A 72 hour Mycobacterium smegmatis suspension was prepared as described (Section
2.2.2), and was centrifuged at 5000 x g for 15 minutes (Avanti J-20 XP, Beckman
Coulter Inc. UK) at which time a bacterial pellet was formed. Supernatant was removed
and discarded; the remaining pellet was washed twice with diH2O. The pellet was then
re-suspended in 25 ml of sterile LB broth, mixed using a desktop vortex (Vortex Genie
2T) for 30 seconds at full power (3000 rpm) and standardised to 1 × 10⁵ cfu /mL-1 as
described in Section 2.2.3.
The inoculated broth was then spread evenly over the TLC plate which was then rested
horizontally within a laminar flow cabinet for 5 minutes to allow evaporation of excess
solution. The inoculated TLC plate was transferred to a sterile container and stored
vertically in an incubator at 37 °C in high humidity for 72 hours.

102
The TLC plate was then removed from the incubator and placed inside a laminar flow
cabinet. The tetrazolium salt, 2,3,5-triphenyltetrazolium chloride (20 µg/mL-1), was
prepared by diluting to 3 µg/mL-1 in SDW and then transferring to a spray equipped
bottle. The solution was then sprayed evenly onto the surface of the plate, which was
then re-incubated at 37 °C for 4 h in high humidity.
Upon visualisation, metabolically active bacteria convert the tetrazolium salt into an
intensely coloured formazan; inhibitory compounds appear as clear spots against a red
background. The Rf values of antibacterial analytes were recorded on three separate
occasions. This method gives a qualitative indication of inhibitory activity from
separated analytes and has been successfully used in antibacterial bio-autographic
assays in other studies (Rahalison, 1991; Valgas, 2007; Waksmundzka-Hajnos, 2008).
This method is used as a high-throughput screen to further guide separation of
potentially inhibitory compounds.
4.3.5 Column chromatography
Column chromatography is another useful method of separation based on the TLC
method and utilises the same solvent system. Separated analytes elute through a
column with a stationary phase which can be made of either silica or Sephadex® (Reid
and Sarker, 2012). Column chromatography has several advantages over the
preparative TLC method. Perhaps most importantly is that a larger sample volume can
be eluted through the column and larger amounts of the sample collected
(Hostettmann et al., 1998; Reid and Sarker, 2012).
4.3.6 Silica gel column chromatography
Silica gel is the most commonly used stationary phase in chromatography and
separates compounds based on their polarity (Reid and Sarker, 2012). For this method,
15 g of silica (60Å 45 µm) was packed into a glass column (60 cm x 15 cm) so that it
was 2/3 full. The column was then flushed with 1 L methanol : ethyl acetate (1:1) and
600 mL was then eluted and discarded.

103
Hops were extracted as previously described in Section 4.4.1, the solvent evaporated
(Section 4.4.2) and 5 g of resulting crude hop extract was re-suspended in 10 mL of
methanol.
The solution was mixed using a desktop vortex and the hop suspension was added
drop-wise to the surface of the silica gel using a Pasteur pippete. Once loaded, the
column was eluted under gravity and 20 mL fractions were collected until all visible
bands were collected.
Each fraction was then concentrated to 5 mL and analysed using the bacterial overlay
assay (Section 4.3.4), Rf values of antibacterial analytes were recorded and the
relevant fractions of identical Rf values combined, concentrated and weighed. They
were then stored at 3 °C in the dark until required. This method was repeated on 2
separate occasions.
4.3.7 Sephadex® LH-20 Column chromatography
Although silica gel is a useful method of separating compounds, it also has several
problems. Yield/recovery of extracts can be low as compounds can bind to the silica,
thus not eluting from the column. Since silica chromatography separates compounds
based on polarity, the methanol extraction method extracts polar compounds and thus
further polarity based separations can be problematic.
Another stationary phase which can be used is Sephadex®, a cross linked dextran gel
that separates compounds based on their molecular size and is mostly used for high
molecular weight molecules such as proteins, but Sephadex® LH-20 is commonly used
in natural product separation (GE-Healthcare, 2011). Sephadex® LH-20 is a cross-
linked dextran gel composed of macroscopic beads synthetically derived from a
dextran polysaccharide.
To prepare a column, 15 g Sephadex® LH-20 was mixed with 200 mL of the solvent
system (methanol : ethyl acetate (1:1)) to allow the dry powder to become swollen
and form a slurry. The slurry was then transferred to a glass column (60 cm x 1.5 cm),
suspended in 1000 mL of the solvent system and allowed to stand for 12 hours.

104
After resting, 600 mL of the solvent system was eluted under gravity through the
column twice and 5 mL of the previously re-suspended crude hop extract (0.5 g/mL-1 in
methanol) was added drop-wise to the surface using a Pasteur pippete.
To load the hop extract into the column, 25 mL of the solvent system was eluted under
gravity so that the extract visually entered the Sephadex®; the column was then re-
filled with 1000 mL of the solvent system and elution begun under gravity. Fractions of
20 mL were collected at a flow rate of 5-10 cm/hr-1, until 250 mL of eluent had passed
after the last visible band had eluted from the column.
Each fraction was then concentrated to 5 mL re-examined for antibacterial activity
using the bacterial overlay assay and the Rf values of antibacterial analytes were
recorded. Fractions which demonstrated antibacterial activity and had identical Rf
values were combined, concentrated and stored at 3 °C in the dark until required.
4.3.8 Mass spectrometry
Antibacterial analytes separated and isolated from the crude hop mixture were
primarily checked for purity and identification using liquid chromatography mass
spectrometry (LC-MS). LC-MS is commonly used for the identification of hop
compounds (Taylor et al., 2003; Vu et al., 2008), it is useful tool for detecting analytes
of a low concentration and limited purity (Reusch, 2013; Vu et al., 2008) such as those
extracted from natural products (Imperato, 2006).
4.3.8.1 Sample preparation for mass spectrometry
The sample was firstly prepared by identifying an antimicrobial spot on the TLC plate
following overnight incubation (section 4.3.4) and separating the appropriate ‘spot’ on
using column chromatography from the overall mixture. The Rf value of the compound
was checked against the original inhibitory spot using TLC.
The solvent used in the extraction process was then evaporated using Method 4.3.2
and the remaining solid material weighed. This material was then re-suspended in
acetonitrile to give a concentration of 1 mg/mL-1 and were finally filtered (0.45 µm
Whatman) prior to analysis.

105
4.3.8.2 Sample analysis using mass spectrometry
The analysis was carried out using an Agilent 1100 series (Agilent Technologies, Polo
Alto, CA, USA) chromatographic system equipped with a series binary pump,
microvacuum degasser, series thermostatted column compartment and variable
wavelength UV–vis detector. Sample injections were made through an autosampler.
Data collection and processing were performed using an Agilent ChemStation
software, version A.10.01 (Agilent Technologies).
The columns Agilent Zorbax SB-C18 (5 μm particle size, 250 mm × 4.6 mm) (Agilent
Technologies, Polo Alto, CA, USA) and Waters XTerra® with hybrid particles containing
both inorganic (silica) and organic (organosiloxane) components (5 μm particle size,
150 mm × 4.6 mm) (Waters, Milford, MA, USA) were used. Water for chromatography
was obtained applying the System Simplicity 185 (Millipore, Billerica, MA, USA)
purification system. The mobile phase and the solution to be injected were degassed
and vacuum filtered prior to use through a Whatman 0.45 μm nylon membrane filter
(Whatman International, Maldstone, UK) (Zivanovic et al., 2006).

106
4.3.9 High resolution mass spectrometry (HRMS)
Whilst LC-MS was used to identify dominant ions within hop extracts, high resolution
mass spectrometry (HRMS) can be employed to precisely identify compounds by their
high resolution mass values. HRMS is a double focusing technique meaning peaks of
compounds can be differentiated by their molecular mass determined accurately to at
least three decimal places (Reusch 2013).
On this basis it is possible for HRMS to distinguish precisely between empirical
formulas with similar nominal masses which would only be determined to 1 decimal
place in MS as demonstrated in Table 4.1.
Formula C6H12 C5H8O C4H8N2
Mass 84.0939 84.0575 84.0688
Table 4. 1 An example of different empirical formulas of compounds separated using HRMS with similar molecular masses Adapted from (Reusch, 2013)
This makes HRMS a useful tool in natural product compound identification initially as it
can distinguish between compounds of a similar nominal mass, but also using attached
software it is able to estimate the elemental composition of potential compounds.
Sample analysis was undertaken by the EPSRC National Mass Spectrometry Service at
Swansea University, using an LTQ Orbitrap XL.

107
4.3.10 HPLC
A Waters 2695 liquid chromatograph system comprising of a vacuum degasser,
quaternary pump, auto- sampler, thermostatic column compartment and photodiode
array detector was used. The column used was a C18 reversed phase Kingsorb 5 mm
(150 x 4.6 mm) (Phenomenex Ltd., UK) with a Kingsorb 5 mm C18 (30 x 4.6 mm) guard
column. Mobile phases consisted of 0.1 % ortho-phosphoric acid in ultra-purified water
(v/v) (mobile phase A) and 0.1 % (v/v) ortho-phosphoric acid in methanol (mobile
phase B). The gradient elution was performed as shown in Table 4.2.
Mobile Phase (%)
Time (min) A B
0 - 5 80 20
5 - 7 76 24
7 - 10 76 24
10 - 20 60 40
20 - 25 50 50
25 - 25.5 80 20
25.5 - 30 80 20
Table 4. 2 Composition of the mobile phase in the gradient elution system between 0 and 30 min. Mobile phase A consists of 0.1% ortho-phosphoric acid in ultra-purified water and
mobile phase B 0.1 %(v/v) ortho-phosphoric acid in methanol (eluent B). All gradients were linear.
Post-run time was 5 min. Elution was performed at a solvent flow rate of 1 mL/min-1.
Detection was accomplished with a diode array detector and chromatograms were
recorded at 210 and 280 nm. The column was maintained at 30 °C. The sample
injection volume was 15 μL.

108
4.4 Results
4.4.1 Identification of optimum polar organic solvent for the extraction
of hop components.
The organic solvents (methanol, ethanol and ethyl acetate) were used in the organic
extraction method as described in (Method 4.3.1). The total yield from each hop
following extraction in each solvent is displayed in Figure 4.1.
Figure 4. 1 Comparison of the total yield (g) of hop varieties Citra, Galena, Northdown, Cascade and Fuggles following organic solvent extraction (72h) of 20 g of hop material in 1
litre (L) of methanol, acetone and ethyl acetate (n=3; ±SD)
The recoverable yield of hop extracts following extraction was assayed by using five
hop varieties (Citra (pellets); Galena; Northdown; Cascade and Fuggles) and extracting
in three solvents (methanol, acetone and ethyl acetate) as described in Method 4.3.1.
0
1
2
3
4
5
6
7
8
9
10
Citra pellets Galena Northdown Cascade Fuggles
Ho
p e
xtra
ct r
eco
vere
d (g
)
Hop varietieis used
Methanol Acetone Ethyl Acetate

109
Upon initial observation of Figure 4.1, it is apparent that the recoverable yield of the
Citra pellets is increased when compared to the other hop variants. This, as explained
in Chapter 3, may be due to the relative stability of the hop compounds after the
pelleting process or the fact that maceration prior to pelleting of the hop materials
increases the available surface area of the Citra hop variant.
To determine if there was a statistically significant difference between the total yield
of extracted hop material after exposure to the organic solvents A one-way ANOVA
was carried out on the data using SPSS software (Method 2.3). Results indicated a P
value > 0.05 indicating no statistically significant difference between the extraction
solvents and total recoverable yield.
On inspection of the Tukey Post Hoc analysis (Method 2.3) the methanol extraction
produced an average 7.788 g ± SD 0.556 g yield per 20 g of dry hop material (38.9%)
compared to acetone (6.708 g ± SD 0.478 (33.4%)) and ethyl acetate (6.986 g ±SD
0.442 g (34.93%)). It was on this basis that methanol was used in all future extractions.

110
4.4.2 Optimisation of a solvent system for the separation of organic
solvent extracts of hops
Thin layer chromatography relies on the separation of the crude hop extracts using a
mobile phase consisting of a solvent system of one or more solvents. Previous
methods for hop natural product isolation reported several solvent systems (Bhandari,
1964; Hamburger and Cordell, 1987; Hostettmann et al., 1998) utilising ratios of
hexane, ethyl acetate, methanol and acetone. In Table 4.3 the ratios of several solvent
systems used in typical natural product separations are listed; and were trialled for
separation of crude hop extracts.
Table 4. 3 The ratios of organic solvents used for the determination of an optimum solvent system for hop extract separation using thin layer chromatography. Each ratio is defined as a
number (e.g. 1:1:1:1 where each solvent would be in an equal volume) Adapted from (Bhandari, 1964; Hamburger and Cordell, 1987; Hostettmann et al., 1998)
Optimum separation was determined by ultraviolet (UV) light at 365 nm (UVitec,
Cambridge, UK) and visible light. In the following Figure (4.2) separation of the Citra
crude hop extract using methanol : ethyl acetate (1:1) (ratio 14) and using ratio 2,
hexane : ethyl acetate (8:2) are shown.
Ratio number Hexane Ethyl Acetate Methanol Acetone
Ratio 1 1 1 1 1
Ratio 2 8 2 0 0
Ratio 3 7 3 0 0
Ratio 4 2 8 0 0
Ratio 5 3 7 0 0
Ratio 6 4 6 0 0
Ratio 7 5 5 0 0
Ratio 8 0 0 8 2
Ratio 9 2 4 4 0
Ratio 10 2 4 0 4
Ratio 11 6 4 0 0
Ratio 12 0 1 1 0
Ratio 13 0 0 1 1
Ratio 14 1 1 0 0

111
Figure 4. 2 Comparison of Citra crude hop extract (0.1 mg/ml) after separation using TLC and the solvent system methanol : ethyl acetate (1:1) (left) and using hexane : ethyl acetate (8:2)
(right)
Solvent system optimisation relied on visual inspection of separated spots on the TLC
plate. This was evident in Figure 4.2 where ratios 2 and 14 are compared; as it can be
observed that ratio 14 (methanol : ethyl acetate (1:1) (left) has a much better
compound resolution than ratio 2 (hexane : ethyl acetate (8:2) on the right.
The reason for the separation in different solvents is due to the polarity of the
compounds present. The crude hop extracts used were extracted using the polar
solvent methanol. It was hypothesised that the majority of compounds present will be
polar and separation can be enhanced by using a more polar solvent system.
Based on these results the solvent system methanol : ethyl acetate (1:1) was used for
all future separations.

112
4.4.3 Thin layer chromatography separation of hop extracts
TLC analysis of each hop variety (n=50) was completed and the Rf values of isolated
hop analytes were recorded. In Figure 4.3 hops 1-14, were extracted in methanol and
separated using TLC. The Rf values of separated spots were then calculated.
Figure 4. 3 The separation of hops 1 -14 using the TLC assay and calculation of Rf values of separated hop analytes (representative of 3 separate repeats)
After separation, six individual spots could be isolated and the Rf values were recorded
and shown in the following Table (4.4). In several hop samples including sample 6
separation of the complete extract was challenging. This method however, was a
precursor to antibacterial testing. Therefore, before further separation techniques
were used, the antibacterial overlay assay was employed to guide further component
purification.

113
Hop variety Rf value 1 Rf value 2 Rf value 3 Rf value 4 Rf value 5 Rf value 6
± SD 0.001 ± SD 0.003 ±SD 0.002 ±SD 0.003 ±SD 0.004 ±SD 0.011
Amarillo 0.02 0.23 0.38 0.62 1.00
Amarillo Pellets 0.02 0.23 0.38 0.62 1.00
Apollo 0.02 0.24 0.32 0.38 0.62 1.00
Aurora 0.02 0.24 0.32 0.38 0.62 0.99
Boadicea 0.02 0.23 0.32 0.38 0.62 1.00
Bobek 0.02 0.23 0.32 0.38 0.62 0.99
Brambling Cross 0.02 0.23 0.32 0.62 1.00
Cascade 0.02 0.23 0.32 0.38 0.62 1.00
Cascade Pellets 0.02 0.23 0.32 0.38 0.62 1.00
Centennial 0.02 0.23 0.32 0.38 0.62 0.99
Centennial Pellets
0.02 0.24 0.32 0.38 0.62 1.00
Challenger 0.02 0.23 0.32 0.38 0.62 0.99
Chinnok 0.02 0.24 0.32 0.38 0.62 1.00
Chinook Pellets 0.02 0.23 0.32 0.38 0.62 1.00
Citra 0.02 0.23 0.32 0.38 0.62 0.99
Citra Pellets 0.02 0.23 0.32 0.38 0.62 0.99
Colombus 0.02 0.38 0.62
Delta 0.02 0.32 0.38 0.62
First Gold 0.02 0.32 0.38 0.62 1.00
Fuggles 0.02 0.23 0.32 0.38 0.62 1.00
Fuggles Pellets 0.02 0.23 0.32 0.62 1.00
Galaxy 0.02 0.23 0.32 0.62 0.99
Galena 0.02 0.23 0.32 0.38 0.62 0.99
Glacier 0.02 0.23 0.32 0.38 0.62 0.99
Goldings 0.02 0.23 0.32 0.38 0.62
Green Bullet 0.02 0.23 0.32 0.38 0.62 1.00
Hallertauer 0.02 0.32 0.38 0.62 1.00
Liberty 0.02 0.32 0.38 0.62 1.00
Magnum 0.02 0.23 0.38 0.62 0.99
Motueka Pellets 0.02 0.38 0.62
Nelson Sauvin 0.02 0.32 0.38 0.62 1.00
Northdown 0.02 0.32 0.38 0.62 0.99
Northern Brewer 0.02 0.32 0.38 0.62
NZ Pacifica 0.02 0.32 0.38 0.62 0.99
NZ Rakau 0.02 0.24 0.33 0.38 0.62
Pacific Gem 0.02 0.23 0.38 0.62 0.99
Pacific Jade 0.02 0.32 0.38 0.62 0.99
Perle 0.02 0.32 0.38 0.62
Progress 0.02 0.23 0.38 0.62 1.00
Savinjski Goldings
0.02
0.32 0.38 0.62 1.00
Simcoe 0.02 0.32 0.38 0.62
Sonnet 0.02 0.32 0.38 0.62
Sorachi Ace 0.02 0.32 0.38 0.62 0.99
Styrian Goldings 0.02 0.32 0.38 0.62 1.00
Summer Pellets 0.02 0.32 0.38 0.62
Summit 0.02 0.23 0.32 0.38 0.62
Target 0.21 0.23 0.32 0.38 0.62 0.99
Tettnang 0.21 0.23 0.32 0.38 0.62
Warrier 0.02 0.23 0.32 0.38 0.62
Williamette 0.23 0.32 0.38 0.62 0.99
Table 4. 4 Hop variants (n=50) were separated using the TLC assay and the Rf values separated spots (analytes) were recorded. Values are representative of 3 repeats; ± SD as
described

114
4.4.4 The bacterial overlay assay
Whilst the TLC method is a useful assay for separation, this study was bioassay guided.
The bacterial overlay assay is a useful means of determining the inhibitory activity of
TLC separated hop analytes. Each hop (N=50) was overlaid with M. smegmatis using
(Method 4.3.4). Inhibitory activity was recorded as clear spots and the corresponding
Rf value was recorded. Figure 4.4 is a representative example of the bacterial overlay
assay showing 6 clear areas of inhibition.
Figure 4. 4 The bacterial overlay assay using M. smegmatis against methanol hop extracts of hops 1-18 (Table 2.2). Inhibition is highlighted by unstained white spots in contrast to the
stained (red) background indicating growth of the bacteria. Rf values refer to the Rf of separated spots. Figure representative of 3 separate repeats. Positive control Streptomycin
(6 µg/ml-1)
Using the bacterial overlay assay, six separate Rf values proved to be inhibitory
towards the growth of M. smegmatis. Each hop variety was assessed for the presence
and antibacterial activity of these analytes, and corresponding Rf values of inhibitory
analytes, are detailed in the following Table (Table 4.5).

115
Hop variety Rf value 1 Rf value 2 Rf value 3 Rf value 4 Rf value 5 Rf value 6
±SD 0.001 ±SD 0.001 ±SD 0.000 ±SD 0.000 ±SD 0.000 ±SD 0.001
Amarillo 0.02 0.23 0.38 0.62
Amarillo Pellets 0.02 0.23 0.38 0.62
Apollo 0.02 0.24 0.32 0.38
Aurora 0.02 0.32 0.38
Boadicea 0.02 0.23 0.32 0.38
Bobek 0.02 0.32 0.38
Brambling Cross 0.02 0.23 0.32
Cascade 0.02 0.23 0.32 0.38
Cascade Pellets 0.02 0.23 0.32 0.38
Centennial 0.02 0.23 0.32 0.38
Centennial Pellets 0.02 0.24 0.32 0.38
Challenger 0.02 0.23 0.32
Chinnok 0.02 0.24 0.32 0.62
Chinook Pellets 0.02 0.32 0.62
Citra 0.02 0.23 0.32 0.38 0.62 0.99
Citra Pellets 0.02 0.23 0.32 0.38 0.62 0.99
Colombus 0.02 0.38 0.62
Delta 0.02 0.32 0.62
First Gold 0.02 0.32 0.38 0.62 1.00
Fuggles 0.02 0.23 0.32 0.62 1.00
Fuggles Pellets 0.02 0.23 0.32 0.62 1.00
Galaxy 0.02 0.23 0.32 0.62 0.99
Galena 0.32 0.62
Glacier 0.02 0.38 0.62
Goldings 0.02 0.23 0.32 0.38 0.62
Green Bullet 0.02 0.23 0.62 1.00
Hallertauer 0.02 0.32 0.38 0.62
Liberty 0.02 0.32 0.38 0.62
Magnum 0.02 0.23 0.38 0.62 1.00
Motueka Pellets 0.02 0.38 0.62
Nelson Sauvin 0.02 0.32 0.38 0.62
New Zealand Rakau 0.02 0.24 0.33 0.38 0.62
Northdown 0.02 0.32 0.38 0.62
Northern Brewer 0.02 0.32 0.62
NZ Pacifica 0.02 0.32 0.62
Pacific Gem 0.02 0.23 0.38
Pacific Jade 0.02 0.32
Perle 0.02 0.32 0.38
Progress 0.02 0.23 0.38 0.62
Savinjski Goldings 0.02 0.32
Simcoe 0.02 0.32
Sonnet 0.02 0.32
Sorachi Ace 0.02 0.32 0.38 0.99
Styrian Goldings 0.02 1.00
Summer Pellets 0.02 0.32 0.38
Summit 0.02 0.23 0.38
Target 0.21 0.32 0.99
Tettnang 0.21 0.32 0.62
Warrier 0.02 0.38 0.62
Williamette 0.23 0.32 0.38 0.99
Table 4. 5 The Rf values of separated hop components in which inhibitory activity in the bacterial overlay assay against M. smegmatis 8159 was observed. Rf values are a result of 3
separate repeats (± SD)
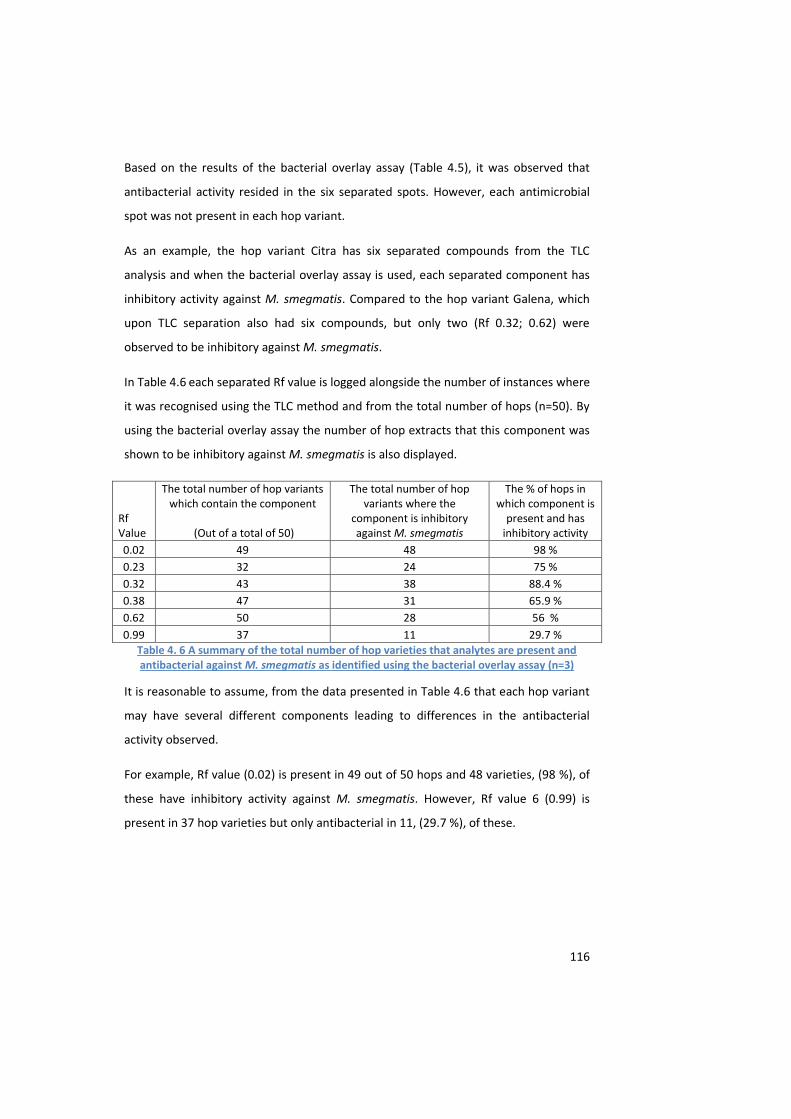
116
Based on the results of the bacterial overlay assay (Table 4.5), it was observed that
antibacterial activity resided in the six separated spots. However, each antimicrobial
spot was not present in each hop variant.
As an example, the hop variant Citra has six separated compounds from the TLC
analysis and when the bacterial overlay assay is used, each separated component has
inhibitory activity against M. smegmatis. Compared to the hop variant Galena, which
upon TLC separation also had six compounds, but only two (Rf 0.32; 0.62) were
observed to be inhibitory against M. smegmatis.
In Table 4.6 each separated Rf value is logged alongside the number of instances where
it was recognised using the TLC method and from the total number of hops (n=50). By
using the bacterial overlay assay the number of hop extracts that this component was
shown to be inhibitory against M. smegmatis is also displayed.
Rf Value
The total number of hop variants which contain the component
(Out of a total of 50)
The total number of hop variants where the
component is inhibitory against M. smegmatis
The % of hops in which component is
present and has inhibitory activity
0.02 49 48 98 %
0.23 32 24 75 %
0.32 43 38 88.4 %
0.38 47 31 65.9 %
0.62 50 28 56 %
0.99 37 11 29.7 % Table 4. 6 A summary of the total number of hop varieties that analytes are present and antibacterial against M. smegmatis as identified using the bacterial overlay assay (n=3)
It is reasonable to assume, from the data presented in Table 4.6 that each hop variant
may have several different components leading to differences in the antibacterial
activity observed.
For example, Rf value (0.02) is present in 49 out of 50 hops and 48 varieties, (98 %), of
these have inhibitory activity against M. smegmatis. However, Rf value 6 (0.99) is
present in 37 hop varieties but only antibacterial in 11, (29.7 %), of these.

117
As only six antimicrobial spots were separated from the crude hop extracts, it is
possible that each spot contains a mixture of compounds or similar polarity which have
not been fully separated by the TLC assay. However, to determine if there was any link
between the Rf values and that of known antimicrobial compounds from hops, a
literature search was undertaken though no related compounds were identified on this
basis.
This was not surprising as TLC separation can be highly affected by the use of different
solvent systems and local conditions (Reed, 2007). There are several reasons why the
TLC assay is limited. The first is that only a low sample weight can be used. In each
bacterial overlay assay, each hop variety was assayed at the same weight. In varieties
which had lower concentrations of antibacterial analytes, the activity could be missed
leading to negative results and the possibility of missing potential bioactive
compounds. By using a higher initial sample weight separation of the extract would be
reduced as the TLC plate would become overloaded.
However, even though separation is restricted; the bacterial overlay and TLC assay are
used here solely for primary separation of hop extracts and to ascertain the
antibacterial activity, so that further separation and purification methods can be
guided.
A conclusion gained from using this assay was that several hop compounds may
contribute to the overall biological activity and these may have similar polarities,
leading to restricted separation in the TLC assay. For this reason, a further separation
technique was used: column chromatography. Due to the laborious nature of the
method and the use of high amounts of solvent, two hop variants were chosen for
further investigation. The first hop variety, Citra, was chosen because all of the
components separated using the TLC assay had inhibitory activity against M.
smegmatis, the highest of all hop extracts tested. The other, Galena, had only two
inhibitory components. This mirrors the result found in the previous chapter and may
go some way to explain the different levels of activity.

118
4.4.5 Separation of antimicrobial hop components using silica gel
column chromatography
Although the TLC assay is a useful method to separate an initial mixture of compounds,
it is limited by the amount of sample that can be loaded and therefore collected. For
this reason column chromatography was employed.
Once all fractions had been collected, Citra (n=126) Galena (n=130) solvent was
removed by evaporation and each resulting extract was re-suspended in 1 mL of
methanol. Each fraction was then assayed using the bacterial overlay assay against M.
smegmatis; fractions with the same Rf values and antibacterial activity were
combined, the solvent evaporated and extract weighed (Table 4.7).
Hop variety
Galena 5 g of extract Citra 5 g of extract
Total weight of recovered sample (g) including (1-6)
2.3 g (total loss of 2.7 g)
2.4 g ( total loss of 2.6 g)
1) Recovered Weight of Rf 0.02 Recovered (0.015 g) not inhibitory
Recovered (0.035 g) Inhibitory
2) Recovered weight of Rf 0.23 Not recovered Not recovered
3) Recovered weight of Rf 0.32 Recovered (0.024 g) Inhibitory
Recovered (0.037 g) Inhibitory
4) Recovered weight of Rf 0.38 Recovered (0.023 g) not inhibitory
Recovered (0.048 g) Inhibitory
5) Recovered weight of Rf 0.62 Not recovered Not recovered
6) Recovered weight of Rf 0.99 Recovered (0.035 g) not inhibitory
Recovered (0.094 g) Inhibitory
Total weight of recovered antibacterial analytes 0.024 g 0.214 g
Table 4. 7 The recovered weight (g) of hop components from the Galena and Citra hop variants separated using silica gel column chromatography. Bold text highlights recovered
antibacterial components as a result of 3 separate repeats
Several differences between the two hop variants and the recovered antimicrobial
components were observed in Table 4.8. Firstly component 1 (Rf 0.02) was shown to
have antibacterial activity against M. smegmatis using the bacterial overlay assay in
the Citra variant only. This was also observed using the TLC overlay assay previously.
Another difference was observed in that the recovered weight of component 1
differed between variant; with 0.035 g recovered from Citra and 0.015 g recovered
from Galena.

119
In neither case was component two or five recovered. This was perhaps surprising as it
was shown to be inhibitory in the Citra variant and as the solvent system was the same
as previously used, suggests that the component had either become ‘stuck’ within the
column or had eluted with other components.
Component three was recovered from both varieties and was observed to also still be
inhibitory towards the growth of M. smegmatis. Again, a difference in the recovered
weight was noticed between the two variants with Galena (0.024 g) having a
considerably less yield than Citra (0.037 g).
As in component one, components four and six were also recovered, but again
observed inhibitory activity in the Citra variant only, matching that of the TLC overlay
assay, but also observed a much lower yield of the components in the Galena variant.
The differences in the recovered weight of the components highlights that there may
be a difference in compounds separated between the two variants. However, it may
indicate a problem with the separation and recovery method as Table 4.6 also details
the total amount of hop extract that was recovered following column chromatography
separation. Significant loss of extract was experienced in both Citra (-2.6 g) and
Galena (-2.7 g) extracts as can be expected in column chromatography. This is due to
the use of silica as a stationary phase (Moldoveanu and David, 2002), non-polar
compounds which are absorbed into the silica should elute first followed by the more
polar compounds. Depending on the solvent system in use, compounds adsorbed can
bind to the silica reducing elution and the degree of separation.
This may be true of analytes 2 and 5, both of which were present in the original TLC
analysis but where not recovered from the column.
Overall this method highlights that a high yield of analytes from the TLC analysis can be
separated using column chromatography, isolated and assayed against bacteria for
their biological activity. The method also highlights that there is a significant loss of
yield due to the potential polarity of compounds within the hop extract. It was also
noticed that no more separation of compounds was observed using this method.

120
4.4.6 Sephadex® LH-20 Column chromatography
Due to the ability of column chromatography to separate and recover a high yield of
components from the extract, another form of stationary phase was used: sephadex®
LH-20. As in the silica column chromatography method the hop variants Citra and
Galena were again chosen for further separation and identification.
Once all fractions had been collected Citra (n=103) Galena (n=93). Each fraction was
assayed for biological activity against M. smegmatis; fractions from the same variant
with the same Rf values and antibacterial activity were combined, the solvent
evaporated and extract weighed (Table 4.8).
Extract weight and Hop variety
Galena 5 g of extract Citra 5 g of extract
Yield of recovered sample (g) Loss of sample (g)
4.99 g Total loss – 0.01 g
4.98 g Total loss – 0.02 g
1) Recovered Weight of Rf 0.02 Recovered (0.141 g) not active
Recovered (0.128 g) Active
2) Recovered weight of Rf 0.23 Recovered (0.103 g) Not active
Recovered (0.116 g) Active
3) Recovered weight of Rf 0.32 Recovered (0.086 g) Active
Recovered (0.095 g) Active
4) Recovered weight of Rf 0.38 Recovered (0.112 g) not active
Recovered (0.134 g) Active
5) Recovered weight of Rf 0.62 Recovered (0.103 g) Active
Recovered (0.126 g) Active
6) Recovered weight of Rf 0.99 Recovered (0.995 g) not active
Recovered (0.136 g) Active
Total weight of Recovered antibacterial analytes
0.189 g 0.735 g
Table 4. 8 The total weight of recovered hop extracts and the weight of antibacterial hop components as determined by the bacterial overlay assay against M. smegmatis following
separation using Sephadex® LH-20 column chromatography
By comparing this method to the silica column chromatography, the first difference is
the overall yield of the hop extracts. In this method 4.99 g of the Galena extract and
4.98 g of the Citra extract was recovered, compared to 2.3 g and 2.4 g respectively
using silica gel. The second difference is that all components identified in the TLC
method were isolated from the column. In comparison using silica gel, analytes 2 and 5
were not recovered which shows the difference in the nature of the stationary phase.

121
4.5 Mass spectrometry
Mass spectrometry is a commonly used tool for the identification of natural products
and has been used for the characterisation of hop extracts (Taylor et al., 2003; Vu et
al., 2008).
Each component separated using Sephadex® column chromatography was assayed
using mass spectrometry to determine the mass of dominant compounds. The masses
of the compounds detected using mass spectrometry were compared to known
antimicrobials previously isolated from hops (Table 4.9 below). Known antimicrobial
compounds (Table 4.9) were discounted from further investigation.
Table 4. 9 molecular weight (MW; MW+H₂; MW+Na; 2MW+Na) and chemical formula of known compounds from hops
Chemical formula search was conducted using the NCBI chemical search engine (NCBI,
2014).
Compound M
(molecular Weight) M + H
+ M + Na+
2M + Na+
Formula
Adhumulone 579.003 580.003 602.003 1181.006 C₂₁H₃₀O₅
Adlupulone 428.290 429.290 451.290 879.580 C₂₇H₄₀O₄
Co-humulone 348.43 349.433 371.433 719.866 C₂₀H₂₈O₅
Co-lupulone 400.550 401.550 423.550 824.101 C₂₅H₃O₄
Farnesol 222.366 223.366 245.366 467.732 C₂₅H₂₆O
Geraniol 154.249 155.249 177.249 331.498 C₁₀H₁₈O
Geranyl acetate 196.286 197.286 219.286 415.572 C₁₂H₂₀O
Humulone 362.459 363.459 385.459 747.919 C₂₁H₃₀O₅
Isocohumulone 332.433 333.433 355.433 687.867 C₂₀H₂₈O₄
Limonene 136.234 137.234 159.234 295.468 C₁₀H₁₆
Linalool 154.249 155.249 177.249 331.498 C₁₀H₁₈O
Lupulone 414.577 415.577 437.577 852.155 C₂₆H₃₈O₄
Myrcene 136.234 137.234 159.234 295.468 C₁₀H₁₆
Trans-2-nonenal 140.222 141.222 163.222 303.445 C₉H₁₆O
Xanthohumol 354.396 355.396 377.396 731.792 C₂₁H₂₂O₅
α-humulene 204.351 205.351 227.351 431.702 C₁₅H₂₄
β-carotene 536.872 537.872 559.872 1096.745 C₄₀H₅₆

122
4.5.1 Mass spectrum analysis of components isolated from Rf 6
The Citra hop extract was separated using Sephadex®® column chromatography and
the component identified as Rf 6 was isolated, the mass spectrum of this the
component is displayed in Figure 4.5.
Figure 4. 5 Mass spectrum of component 6 extracted from Citra hop variant using column chromatography
The mass spectra of component presented a baseline peak with an m/z of 385.2, with
a second lower intensity peak with an m/z of 747.2. Using the information gained from
the literature search, it became apparent that this molecule was humulone with the
peak at m/z 385.2 matching the MW+ Na from Table 4.10, the second peak with an
m/z of 747.2 was determined as the 2M+Na species of this compound.
The Galena hop extract was also extracted and separated using Sephadex®® column
chromatography and the MS of the component isolated is displayed in the following
Figure (4.6)

123
Figure 4. 6 Mass spectrum of Rf 6 extracted from Galena hop variant using column chromatography
From the mass spectra observed in Figure 4.6, it is possible to note the presence of a
peak with an m/z 385.2, which was previously identified from the Citra extract as
humulone. It is also noticeable that there are multiple secondary peaks within the
fraction (m/z 273.2; 283.3; 768.0; 1454 and 2359.6).
It is hypothesised that the presence of these compounds has an antagonistic effect on
the antibacterial activity of humulone. As the dominant compound humulone has been
previously shown to be antibacterial and is well described in literature no further
separation and purification was undertaken on this component (Erdmann, 1951; Stavri
et al., 2004)

124
4.5.2 Mass spectrum analysis of components isolated from Rf 5
Component Rf 5 was separated from both the Citra and Galena extracts using
Sephadex® column chromatography, and each extract was weighed to 1 mg/mL-1 and
suspended in HPLC grade methanol. In Figure 4.7 the resulting spectra is displayed.
Figure 4. 7 Mass spectrum of Rf value 0.62 extracted from Citra hop variant using column chromatography and analysed using mass spectrometry (representative of 2 repeats)
The mass spectra of Citra has one baseline peak at m/z 379.2 Comparing the mass to
published literature, this peak corresponds with the research carried out by (García-
Villalba et al., 2006) who identified this mass as an oxidised derivative of humulone
using a similar technique. Humulone and its oxidised derivatives have been shown to
be inhibitory towards the growth of bacteria (Cornelison, 2008). The analysis was also
carried out using the Galena variety as shown in the following Figure (Figure. 4.8).

125
Figure 4. 8. Mass spectrum of Rf 0.62 extracted from galena hop variant using column chromatography and analysed using mass spectrometry (representative of 2 repeats)
After initial observation, it is possible to notice that the Galena extract, like the Citra
extract has the oxidised humulone derivative at m/z 379.2. Several other peaks were
also observed at m/z 569.4; 706.5; 708.5 and 871.
The bacterial overlay assay indicated that this component was inhibitory towards the
growth of M. smegmatis in extracts from both the Citra and Galena varieties. Further
investigation using mass spectrometry on this component reveals a dominant
compound which can be identified using current literature as an oxidised humulone
derivative which has been previously identified as antibacterial (Cornelison, 2008).
Therefore, the inhibitory activity can be linked to this compound and no further
separation or isolation procedures were undertaken.

126
4.5.3 Mass spectrum analysis of components isolated from Rf 4
Component four (Rf 0.38) was also separated from the both the Citra and Galena hop
extracts using Sephadex® column chromatography and by using the bacterial overlay
assay was shown to be inhibitory towards the growth of M. smegmatis in the Citra
variant only. In Figure 4.9 the mass spectra of component three from the Citra variant
is displayed.
Figure 4. 9 Mass spectrum of Rf value 0.38 extracted from Citra hop variant using column chromatography
From the initial mass spectra several peaks were observed; the first with an m/z of
401; corresponds using Table 4.10 with the compound co-lupulone. Co-lupulone
(C₂₅H₃₆O₄) is another example of a bitter acid related to lupulone, and differs in the
number of carbonyls; co-lupulone is a well-researched bioactive compound commonly
isolated from hops (Van Cleemput et al., 2009a)
Further investigation reveals that lupulone (m/z 415.1) can also be identified from the
Citra hop extract. Based on the fact that both the lupulone and co-lupulone are the
most dominant compounds, it can be assumed that the majority of antimicrobial
activity can be associated with these compounds. Another peak identified (m/z 537.2)
is associated with the pigment β-carotene and is a common pigment found within the
majority of plant products (Vu et al., 2008) and has not been reported as antimicrobial.

127
The component 3 (Rf 0.38) was extracted from the Galena variety was also assayed
using mass spectrometry and the mass spectrum is displayed in Figure 4.10.
Figure 4. 10 Mass spectrum of Rf value 0.38 extracted from Galena hop variant using column chromatography
As can be seen from the mass spectra of component 0.383, there is a peak at 414.3
which was also previously identified in the Citra extract. A peak with an m/z of 301.1
was also observed but after investigation was shown to be a common contaminant
within the mass spectrum. Peaks with an m/z of 659.3 and m/z 768.0 were also
observed in the mass spectrum, although due to the lack of inhibitory activity against
M. smegmatis no further investigation was undertaken. In conclusion, the inhibitory
activity observed in the bacterial overlay assay by the Citra extract with an Rf of 0.383
can be associated with the presence of both lupulone and co-lupulone, this activity can
be further associated with previous research (Erdmann, 1951; Siragusa et al., 2008).

128
4.5.4 Mass spectrum analysis of components isolated from Rf 3
Both Galena and Citra hop extracts were separated using Sephadex®® column
chromatography and the analytes at Rf 0.32 present in both the Citra and Galena
variants were observed to be inhibitory to the growth of M. smegmatis. In Figure 4.11
the mass spectrum of the Citra extract is displayed.
Figure 4. 11 Mass spectrum of Rf value 0.32 extracted from the Citra hop variant using column chromatography
Several peaks were observed in the mass spectrum analysis, the first (m/z 301.0) can
be identified as a contaminant which is commonly observed in mass spectrometry and
is not a concern.
The baseline peaks (m/z 439.0 and m/z 413.1) were observed and after a literature
search compound m/z 413.1 was identified as the oxidised lupulone derivative,
adlupulone as previously described by (Ceslova et al., 2009) . The second component
with an m/z 439 can be identified as a fragment of the m/z 416.1, which identified by
(Ceslova et al., 2009) is also an oxidised derivative of lupulone. Another peak at m/z
273.0 has also been previously identified as an epicatechin a catechin isomer (Shui and
Leong, 2004).

129
The Galena extract which also showed inhibitory activity at Rf value 0.32 was also
assayed using mass spectrometry and the mass spectrum is displayed in Figure 4.12.
Figure 4. 12 Mass spectrum of Rf value 0.32 extracted from the galena hop variant using column chromatography
Again fragments in the instrument are observed at m/z 301.0 and are ignored from the
investigation. Several peaks are observed from the Galena extract which are similar to
the Citra extract namely m/z 273.0; previously identified as catechin; m/z 413.1; 439.0
which were also previously identified as the lupulone derivative adlupulone.
In conclusion, component 3 (Rf 0.32) separated from both the Citra and Galena hop
extracts exhibited inhibitory activity against M. smegmatis in the bacterial overlay
assay. Mass spectrum analysis revealed 3 dominant compounds with a m/z of 439.0;
413.1 and 273.0, relevant literature was searched and it was found that these m/z
corresponded to compounds lupulone, adlupulone and epicatechin; all of which have
previously been shown as antibacterial. Therefore no further identification was
undertaken on this extract.

130
4.5.5 Mass spectrum analysis of components isolated from Rf 2
Component two (Rf 0.23) was also separated from the both the Citra and Galena hop
extracts using Sephadex® column chromatography and by using the bacterial overlay
assay the extract was shown to be inhibitory towards the growth of M. smegmatis in
the Citra variety only. In Figure 4.13 the mass spectra of the Citra extract is displayed.
Figure 4. 13 Mass spectrum of Rf value 0.23 extracted from the Citra hop variant using column chromatography
From the mass spectra two peaks were identified (m/z 413.3 and m/z 768.0). Previous
identification showed that peak m/z 413.3 was lupulone and whilst being present in
the previous fraction, the compound has eluted from the column within this fraction
also. Another peak at m/z 768.0 and 1454.9 was discounted from further studies as it
was shown to be a common plasticiser.

131
The component from the Galena variety, although not inhibitory towards the growth
of M. smegmatis was also assayed using mass spectrometry and the mass spectrum is
displayed below in Figure 4.14.
Figure 4. 14 Mass spectrum of Rf value 0.23 extracted from the Galena hop variant using column chromatography
The mass spectra of the Galena variety showed that there was an absence of m/z
413.3. Due to the lack of antibacterial activity from the fraction no further separation
of the extract was undertaken.

132
4.5.6 Mass spectrum analysis of components isolated from Rf 1
Component one (Rf 0.02) was also separated from the both the Citra and Galena hop
extracts using Sephadex® column chromatography and by using the bacterial overlay
assay was shown to be inhibitory towards the growth of M. smegmatis in the Citra
variety only. In Figure 4.15 the mass spectrum of the Citra extract is displayed.
Figure 4. 15 Mass spectrum of Rf value 0.02 extracted from the Citra hop variant using column chromatography
This component was inhibitory towards the growth of M. smegmatis on the baseline of
the bacterial overlay assay. This suggests that this component may contain compounds
which are weakly non-polar and thus would not elute through the TLC plate.
Mass spectrometry analysis shown in Figure 4.15 above reveals the presence of
lupulone (m/z 413.1),
The second peak of interest m/z 439.0 has been previously identified as adlupulone
and was therefore not subject to any further investigation.

133
It was observed that there was a high amount of corresponding peaks within the
mixture. It may be that these components are of a low polarity, meaning that
separation using the current solvent system is not possible. Whilst it may be possible
to further investigate this sample for any other antimicrobial compounds, it was
hypothesised that the previously identified compounds were responsible for any
antimicrobial activity.
Although component one isolated from the Galena extract did not exhibit any
inhibitory activity, it was also analysed using mass spectrometry and the mass
spectrum is displayed in the following Figure (4.16).
Figure 4. 16 Mass spectrum of Rf value 0.02 extracted from the galena hop variant using column chromatography
The mass spectrum of Rf 0.02 from the Galena extract also has a mass with an m/z of
413). The component also does not have a peak at m/z 439.0 which corresponded to
adlupulone. These differences may allude to the variation in activity between the two
varieties. It was also observed as in the Citra variant that that there were also a
number of peaks. However, as this component did not produce any inhibitory activity
towards the growth of M. smegmatis no further isolation techniques were undertaken.
These compounds were also identified in the Citra component this was also another
reason why no further separation was undertaken.

134
4.6 High Resolution Mass Spectrometry (HRMS)
High resolution mass spectrometry was used to determine more precisely the
structure of any identified compounds and to help locate the predominant
antimicrobial polyphenol xanthohumol (XN). It is known that the compound has a
molecular weight of 354.39 and a chemical formula of C₂₁H₂₂O₅. By combining
separated active extracts of both the Galena and Citra extracts and then analysing at
molecular weights between m/z 200 and 400 it was hypothesised that XN could be
identified.
In the following Figure 4.17 the HR-MS of the crude Citra hop extract is displayed with
emphasis on the m/z between 200 and 500.
Figure 4. 17 High resolution mass spectra of the crude Citra hop extract
It can be initially observed from Figure 4.17 that the baseline compound has an m/z at
210.1274. Upon investigation this was reported to be a contaminant within the mass
spectra and was therefore discounted from any further investigation.
The second compound of interest (m/z 463.1719) had not been previously observed in
any of the previous mass spectras’. To further identify the compound, a more intense
mass spectra is displayed in the following Figure 4.18.

135
Figure 4. 18 High Resolution Mass Spectra of compound m/z 463.1719 isolated from the antibacterial Citra crude hop extract
By using high resolution mass spectrometry it is possible to use the instrument to
estimate the theoretical mass and potential elemental composition of compounds
isolated to an accuracy of ± 3 ppm. By estimating the chemical composition of the
compounds, further investigations would be performed using databases such as
SciFinder to try and match the compound with those previously identified.

136
In Figure 4.19 the estimations of the chemical formula of this compound are displayed
Figure 4. 19 Estimated elemental composition report (± 3 ppm) of m/z 463.1719 isolated from the Citra crude hop extract provided by the high resolution mass spectrum. Red arrow
indicates most likely compound composition
The elemental composition report of m/z 463.1719 highlights 25 possible elemental
compositions for m/z 463, upon observation it was apparent that all but one of these
included a nitrogen compound. The presence of nitrogen indicates alkaloid
compounds, of which according to current literature, none have been isolated from
hops. After searching relevant literature and an advanced search on SciFinder®
(www.scifinder.cas.org) no matching chemical entities were found. Therefore on this
basis, a novel chemical entity isolated from the antibacterial Citra crude hop extract
with the chemical formula C₂₅ H₂₈ O₇ m/z 440 is presented.

137
4.7 UPLC-HR-MS determination of compounds isolated from the
Citra crude hop extract
4.7.1 UPLC separation of crude Citra hop extract
Ultra pressure liquid chromatography (UPLC) coupled to HR-MS was used to further
prove the methodology. In the following Figure (4.20) the chromatogram of the Citra
crude hop extract is displayed.
Figure 4. 20 UPLC chromatogram of Citra crude hop extract with selected peaks circled in red; image is representative of two separate repeats
Reviewing the chromatogram and comparing the peak molecular weight to that
reviewed in Table (4.10) three peaks were apparent (m/z 353; 361 and 414).

138
4.7.2 Elemental composition of m/z 361
Firstlty the peak (m/z 361.200) was reviewed by using the attached high resolution
mass spectrometer and was able to identify the chemical composition (± 3 ppm) in
negative ion absorption as shown in the following Figure 4.25.
Figure 4. 21 UPLC HR-MS chromatogram and elemental composition report of m/z 361.200 isolated from the crude Citra hop extract
Figure 4.21 details 3 possible chemical compositions for the compound isolated within
UPLC. The first with the lowest variation had a calculated m/z 361.2015 and a formula
of C₂₁ H₂₉ O₅. This compound can therefore be positively identified as humulone (hop
alpha acid) which has an m/z of 362 and a formula of C₂₁ H₃₀ O₅. One hydrogen is
missing from the isolated compound due to the negative ion absorption.

139
4.7.3 Elemental composition of m/z 414
The next peak isolated had a m/z of 414.981 (ES+), after observing the data collected in
Table 4.10 this mass matched that of lupulone. In the following Figure 4.22 the
elemental composition report of the isolated compound.
Figure 4. 22 UPLC HR-MS chromatogram and elemental composition report of m/z 414.981 isolated from the crude Citra hop extract
The elemental composition report of m/z 414.9809 identified four possible elemental
compositions. The most probable match was hypothesised to be m/z 414.9879 with
the elemental composition of C₂₅ H₃ O₇ which can be positively identified as lupulone
(hop beta acid).

140
Finally a third peak was also identified with an m/z 353.134. This peak was of particular
interest as the mass matched that of xanthohumol as previously identified in Table
4.10. The chromatogram and elemental composition report of this component is
displayed in the following Figure (4.23).
Figure 4. 23 UPLC HR-MS chromatogram and elemental composition report of m/z 353.1389 isolated from the crude Citra hop extract
The elemental composition report of m/z 353.134 gives one possible formula: C₂₁H₂₁O₅
with a calculated mass of m/z 353.1389 (ES-). This matches the chemical formula for
xanthohumol as previously described.
Previous analyses did not locate the polyphenol xanthohumol. It is hypothesised that
this compound did not elute up the TLC plate remaining in the mixture on the baseline
and was masked by other compounds. Another possibility is that the compound
concentration when separated using TLC is diluted therefore preventing its ability to
inhibit the growth of the bacteria. It may also be the case that when separated based
on the polarity an antagonistic effect is seen preventing any antimicrobial activity
being observed from the compound.

141
4.8 Discussion
The use of plants in their crude form or purified extracts for the exploitation of their
healing powers is an ancient theory (Cowan, 1999). It is therefore unsurprising that in
the present day nearly 50 % of all pharmaceuticals worldwide have originated from
plant derived sources (Beutler, 2009; Cragg and Newman, 2013).
However, since the development of antibacterials in the 1950’s the use of plant
derived natural products to treat bacterial infections have declined. Ever since the
development of antimicrobials there have been incidences with bacterial resistance as
a consequence there is a lack of new antibiotics and multidrug and extensively drug
resistant organisms are becoming more apparent.
The main aim of this chapter was to build on the information gained in Chapter 4 and
determine the chemical constituents of the antimicrobial hop extracts. A suitable
volatile organic solvent was firstly identified. It is true that some antimicrobial
constituents may be present in the non-polar extract. However, as antimicrobial
activity has been identified in beer, a polar extraction method was employed.
Three solvents were trialled and the total yield of hop extract of five hop variants
following 72 hour extraction was investigated. No statistically significant difference
between the level of total yield (g) of hop material between the solvents used was
observed. Previous research by (Verzele and Keukeleire, 2013) identified that
methanol has been traditionally used for the extraction of hop alpha and beta acids, so
therefore it was on this basis that methanol was used in all future extractions.
Upon initial observation of Figure 4.1 it appeared that the Citra hop pellet had a higher
yield than the other hop variants when extracted in methanol, This, as previously
explained in Chapter 3, may be due to the relative stability of the hop compounds after
the pelleting process or the fact that maceration prior to pelleting of the hop materials
increases the available surface area of the Citra hop variant.

142
The next stage of the extraction process was to separate the hop extracts on a TLC
plate, several solvent systems were trialled to give an optimum separation. The solvent
systems generated were as a result of a literature search concerning natural product
separation and isolation. A solvent system of a 1:1 ratio of methanol : ethyl acetate
was finally used. This predominantly polar solvent mix was based on the principle that
the majority of the extract was from the polar fraction and therefore produced the
most optimum separation.
Each hop variant (n=50) was then extracted in methanol and separated using TLC. It
was observed from this method that 6 individual spots could be visualised. Several
methods of visualisation (UV, Vanillin staining, etc) were also trialled but it was found
that due to the pigments within the hops each spot could be observed by eye (data not
shown). By calculating the Rf values of each separated spot it was possible to locate
the spots at a later date if further analysed.
Upon analysis there were a total of 6 clear spots separated. However, in each hop
variant there was a mixture of present and absent spots. To determine if the presence
or absence of these spots had a positive effect on the antimicrobial activity employed a
bacterial overlay assay.
The bacterial overlay assay employed was originally described by Fleming, 1942, and
was adapted for use within this report. Briefly, a bacterial film suspended in growth
media is applied to the surface of a solvent free TLC plate and is then incubated under
high humidity at 37 °C. Bacteria can then be stained and metabolising cells visualised
as a red colour against areas of no growth (clear). As a control, in each case a TLC plate
which had not been used for separation of hop components was also inoculated and
examined. A TLC plate which had been exposed to the solvent system and dried in the
same way as the test plates was also used. In each case bacterial growth was observed.
It was interesting to observe that bacterial inhibition resided in the six spots separated
in the initial TLC. However, this was not the same for every spot of equal Rf value,
indeed comparing the most inhibitory hop variant Citra (6 antimicrobial spots) to the
least active hop variant Galena (2 antibacterial spots) several differences could be
noticed.

143
The most common (98% of variants) inhibitory spot was found to be close to the
baseline of the TLC plate (Rf 0.02) and was hypothesised to contain a mixture of hop
components of mixed polarity so therefore would not elute along the TLC plate using
the mobile phase employed. It may also be the case that due to the number of
components which may have been extracted, optimum separation was not possible
using this method. In comparison, the least common (11 %) inhibitory spot was found
to be at the solvent front of the TLC separation (Rf 0.99) and it was hypothesised that
these compounds were the most polar and so therefore were readily dissolved into the
solvent system.
To try and identify potential components of the antibacterial spots and to ascertain if
there were differences in the chemical composition of the Galena and Citra hop
variants, both variants were further separated using column chromatography. It was
found that by using a stationary phase of silica gel a high amount of extract was lost
within the column, possibly due to the compounds becoming ‘stuck’. Therefore
another form of stationary phase, Sephadex®, which separates compounds based on
size was used and it was found that a much higher yield was achieved.
Upon fractionation of the hop extract, each fraction was further analysed using TLC
and the solvent system previously identified. Post further TLC analysis each fraction
was again assessed for inhibitory activity against M. smegmatis and the Rf values of
inhibitory spots calculated. On no occasion was a new spot identified so therefore
fractions with the same antimicrobial Rf value spots were combined, dried and
weighed.
There were considerable differences in the weights of recovered components between
the hop variants. This was the same for both non-inhibitory and inhibitory
components. Reviewing the total yield from the extraction it is clear that these
components were not lost within the column. It is hypothesised that the differences
could be due to the differences in the chemical constituents of each component.

144
To help identify any known components of each fraction, mass spectrometry was used,
as Citra had so far been the most inhibitory hop variant and Galena the least, these
were chosen for further investigation. A literature search was conducted to identify
the molecular weights and empirical formulas of known antimicrobial compounds from
hops and was adjusted to show the common species detected in the mass
spectrometer M, M+H, M+Na and 2M+Na..
Each separated spot from the hop variants Citra and Galena was isolated using column
chromatography and analysed using mass spectrometry.
Component 6 (Rf 0.99) of the Citra hop variant was first investigated, and it was
possible to hypothesise based on the molecular weight, that the compound humulone
was present. This was also the case for the Galena extract. This compound was
thought to be present in both hop variants antibacterial activity was only observed in
the Citra variant. Upon further investigation the spectra from the Galena extract
recognised a range of other peaks, it was hypothesised that the presence of these
peaks, ultimately other compounds, may have an antagonistic effect on the
antibacterial activity of humulone. It may also be the case that the concentration of
this compound in the Galena variety may be lower than the Citra variant.
The next component investigated, 5, had an Rf value of 0.62 and it was found based on
the mass of 379.2 that an oxidised derivative of humulone was present in the Citra
variant. Humulone and its oxidised derivatives are known to be antimicrobial
(Cornelison, 2008; García-Villalba et al., 2006). Component 5 was antimicrobial when
isolated from the Galena variant and the same molecular weight peak was also
identified from this extract. It may be that as this was the most dominant peak that the
presence of this compound was responsible for the antibacterial activity of this spot.
Component 4 (Rf 0.38) was also investigated and several peaks were observed, notably
from the Citra extract the peaks matched the molecular weights of the known
antimicrobial compounds; lupulone and co-lupulone (Van Cleemput et al., 2009a).
Based on the fact that both lupulone and co-lupulone are the most predominant
compounds it can be assumed that, at least, the majority of antimicrobial activity can
be associated with the presence of these compounds.

145
Interestingly as was the case with humulone, a compound with a mass matching
lupulone was also detected in the Galena hop extract but no inhibitory activity was
observed against M. smegmatis. Other peaks were observed with a molecular weight
of m/z 659 and 768, but as there was no inhibitory activity, no further identification or
separation procedures were undertaken. In conclusion the inhibitory activity observed
in the bacterial overlay assay by the Citra extract with an Rf of 0.38 can be associated
with the presence of both lupulone and co-lupulone, this activity can be further
associated with previous research (Erdmann, 1951; Siragusa et al., 2008)
Component 3 (Rf 0.32) was also analysed and from the Citra hop variant and the
relevant masses were matched to a hop beta acid adlupulone which has been
previously described as antibacterial (Ceslova et al., 2009); Reed, 2007). Another peak
at m/z 273.0 was matched to the mass of epicatechin. Catechin is a secondary plant
metabolite belonging to the group flavan-3-ol, part of the natural family of flavonoids,
found in many plant species, it has been described as an antioxidant and has been
shown to be antibacterial (Bhandari, 1964; Ceslova et al., 2009; Stevens and Page,
2004). Catechin typically has two benzene rings and a dihydropyran heterocycle ring
with an hydroxyl group (Figure 4.24). This configuration allows for two chiral centres
on the molecule which can produce four diasteroisomers; two in trans configuration
(catechin) and two in cis configuration (epicatechin) (Ceslova et al., 2009).
Figure 4. 24 the structure of epicatechin isolated from component 3 present in both Citra and Galena hop extracts

146
Several peaks are observed from the Galena extract which are similar to the Citra
extract namely m/z 273.0: previously identified as catechin; m/z 413.1; 439.0 which
were also previously identified as the lupulone derivative adlupulone. In conclusion,
component 3 (Rf 0.32) separated from both the Citra and Galena hop extracts
exhibited inhibitory activity against M. smegmatis in the bacterial overlay assay. Mass
spectrum analysis revealed 3 dominant compounds with a m/z of 439.0; 413.1 and
273.0, relevant literature was searched and it was found that these m/z corresponded
to compounds lupulone, adlupulone and epicatechin; all of which have previously been
shown as antibacterial. Therefore no further identification was undertaken on this
extract.
Component 2 (Rf 0.23) was also separated from the both the Citra and Galena hop
extracts using Sephadex® column chromatography and by using the bacterial overlay
assay the extract was shown to be inhibitory towards the growth of M. smegmatis in
the Citra variety only. From the mass spectra 2 peaks were identified (m/z 413.3 and
m/z 768.0). Previous identification showed that peak m/z 413.3 was lupulone and
whilst being present in the previous fraction, the compound has eluted from the
column within this fraction also. This is a hazard of TLC separation as a high starting
weight of compound will elute throughout the whole plate possibly masking other
compounds present (Reed, 2007).
Mass spectrum analysis was also carried out on the Galena extract, although as no
inhibitory activity was observed, no further investigation was carried out. It was also
noticed that this fraction did not contain any peaks with a molecular weight which
matched that of previously identified antimicrobial hop compounds.
The final component, component 1, was isolated from the baseline of the TLC
separation (Rf 0.02) and was hypothesised to contain the largest amount of
compounds due to the lack of separation of non-polar compounds. Analysis revealed
peaks with matching molecular weights to lupulone. Lupulone has been reported as
weakly non-polar (Van Cleemput et al.,2009a) and therefore would be able to elute in
mixtures with other compounds of mixed polarity (Hamburger and Cordell, 1987)
which may explain why lupulone and related compounds are found at multiple points
on the plate.

147
It was observed that there was a high amount of corresponding peaks within the
mixture. It may be that these components are of a low polarity, meaning that
separation using the current solvent system is not possible. Whilst it may be possible
to further investigate this sample for any other antimicrobial compounds, it was
hypothesised that the previously identified compounds were responsible for any
antimicrobial activity.
The mass spectrum of Rf 0.016 from the Galena extract also has a mass with an m/z of
413 which matched that of lupulone. The component also does not have a peak at m/z
439.0 which corresponded to adlupulone. These differences may allude to the
variation in activity between the two varieties. It was also observed as in the Citra
variant that that there were also a number of peaks. However as this component did
not produce any inhibitory activity towards the growth of M. smegmatis no further
isolation techniques were undertaken.
It may be the case that several other compounds in each component are also
inhibitory towards the growth of the bacteria but are outside the limits of detection
using the relatively crude isolation technique. It is hypothesised that several
compounds within each component are antibacterial and potentially act in a
synergistic manner. When these compounds are separated using the TLC method and
or column chromatography the synergistic activity is reduced which may lead to
antagonistic combinations; or, that upon separation the relative concentration of
these compounds is reduced so that no inhibitory activity is observed.
This may be the case for xanthohumol (XN). Xanthohumol is widely regarded as the
most bioactive compound found within hops (Acworth et al., 2012; Ceh et al., 2007;
Narvaez et al., 2013; Stevens and Page, 2004). However using the developed extraction
method it was not apparently separated from the crude mixture. To try and identify
this component and any other potential compounds, the entire bioactive Citra hop
extract was isolated and analysed using high resolution mass spectrometry. As
mentioned in the introduction, HR-MS is able to estimate to ± 3 ppm the elemental
composition of separate peaks within a mixture. Interestingly, xanthohumol was not
isolated using this method. However, a peak was observed at a mass of m/z 440 with
an estimated elemental composition of C₂₅ H₂₈ C₇.

148
This peak was analysed further by searching SciFinder for corresponding compounds.
In total 458 compounds with the same mass and formula were found from the
database, which contains over 60 million (Ruddigkeit et al., 2012). Further refining of
the results by search for “hops” revealed no corresponding literature. By searching
“Humulus lupulus”, 2 corresponding articles were identified (Hideo, 2007; Schaefer et
al., 2005), but were not related to this compound in any way. On this basis the novel
compound C₂₅ H₂₈ C₇ is presented as part of the antimycobacterial fraction of the Citra
hop extract. This is an area that will require more investigation to secure a precise
characterisation, further research would be required.
To further confirm the presence of xanthohumol ultra-high pressure liquid
chromatography coupled to high resolution mass spectrometry was used. The initial
separation revealed three peaks of interest (m/z 353; 361 and 414) which by using HR-
MS were hypothesised to be humulone, lupulone and xanthohumol. This result shows
that the initial biological assay and subsequent determination was able to successfully
isolate both the alpha and beta acids; but was unable to separate xanthohumol.
This may be due to several reasons: the concentration of XN is reduced upon
separation and therefore is not antibacterial when tested; extraction of the compound
in methanol or other volatile solvents leads to an oxidation reaction of the compound,
this would potentially lead to compound to form a polymer effectively taking it outside
the limits of the chosen mass spectra limits. It may also be the case as previously
mentioned that when separated the compound is in contact with antagonistic
compounds preventing antibacterial activity.
This chapter therefore highlights the main difficulties of natural product separation
and identification. An array of compounds can make separation difficult even when
separation is based on polarity or molecular size. If separation is achieved, another
problem that can arise is achieving a sufficient compound weight for identification
purposes.

149
This chapter has successfully demonstrated that it is possible to separate each of the
50 hop variants and further confirmed that the Citra hop extract is the inhibitoriest
whilst the Galena variant is the least inhibitory. Furthermore differences between
these two variants have been identified and this has preluded to a hypothesis on the
differences in antibacterial activity.
A novel compound which was associated with the antibacterial fraction of the crude
Citra hop extract was isolated. This is a promising result and will need future
investigation to purify and further characterise. It may be possible that alone this
compound does not have any inhibitory activity but when combined with other
separated hop compounds it may exhibit synergism.
Finally the principle of the methods used has been proven by isolating the most
common antimicrobial compounds; humulone, lupulone and xanthohumol from the
crude Citra hop extract using ultra pressure liquid chromatography.

150
Chapter 5
Synergistic Activity between Hop Extracts and Antibiotics and their Mode of Action

151
5.0 Synergistic activity between hop extracts and antibiotics and
their mode of action
5.1 Introduction
The first antibiotic that was discovered to be inhibitory towards the growth of
Mycobacterium tuberculosis was streptomycin. It was discovered in 1943 by Dr. Albert
Schatz and is considered one of the top 20 discoveries of the 20th century (Pringle,
2013). Its mode of action is to inhibit protein synthesis. It functions by binding to the
16s rRNA of the 30S subunit of the bacterial ribosome thus preventing the binding of
formyl-methionyl tRNA to the 30S subunit (Tanoira et al., 2014). Although a successful
inhibitor of the pathogen the, toxicity to the antibiotic is well described and has been
acknowledged since 1947, as has the emergence of bacterial resistance (McDermott,
1947; Avent et al., 2011; Siddiqui and Qureshi, 2014; Tanoira et al., 2014).
Antibiotic resistance can be defined as the ability of an organism to survive following
exposure to one or more antibiotics. Organisms resistant to multiple antibiotics are
considered multidrug resistant (MDR) (Conly, 1998; O’Brien et al., 2014).
The World Health Organisation (WHO) periodically completes global surveillance
surveys on the level of M. tuberculosis to antibiotics and it is estimated that out of 100
clinical isolates of M. tuberculosis at least 23.8 % will be resistant to streptomycin
(Cohn et al., 1997; Dooley et al., 2013; Gandhi et al., 2010); For these reasons
streptomycin is infrequently used for the treatment of tuberculosis.
Resistance of M. tuberculosis to antimycobacterial drugs is not a new phenomenon as
shown by streptomycin. However, resistance of TB to other mycobacterial drugs is
increasing exponentially leading to the emergence of multidrug (MDR-TB) and
extensively drug resistant (XDR-TB) strains (Murray et al., 2014). One of the most
extensive studies undertaken to report the incidences of MDR-TB and XDR-TB
worldwide analysed 17,690 clinical isolates and found that 20 % were MDR and were 2
% XDR (Centers for Disease Control and Prevention (CDC), 2006).

152
One of the ways to combat the development of resistance is to employ a combination
therapy approach consisting of two or more antibiotics (Acar, 2000). This offers a
number of potential advantages: (1) broad-spectrum coverage for the initial treatment
of infected patients; (2) the ability to treat polymicrobial infections; (3) avert the
selection of resistant microorganisms; (4) reduce dose-related toxicity; and (5) increase
the potential for synergistic activity (Lienhardt et al., 2010).
The current treatment regime for pulmonary TB utilises a combination of antibiotics
comprising of isoniazid and rifampicin (every day for 6 months) which provides broad
spectrum coverage of the initial infection. This is supplemented by pyrazinamide and
ethambutol which are taken every day for the first 2 months to avert the selection of
resistant microorganisms. In the case of extra-pulmonary TB, the same combination
therapy is used but treatment is extended to 12 months (Centers for Disease Control
and Prevention (CDC), 2006).
There are two main reasons for using a combination therapy approach to treat M.
tuberculosis infection. The first is to reduce the possibility of resistant organisms by
using antibiotics with several modes of action. For example isoniazid (INH) inhibits the
formation of mycolic acids on the cell surface effectively inhibiting the growth of the
bacterium. As previously mentioned, INH is used in combination with rifampicin.
Rifampicin inhibits RNA polymerase which inhibits DNA transcription, therefore
reducing the ability of the bacterium to gain antibacterial resistance.
In this chapter the antibacterial activity of several antibiotics was assayed against
antibiotic resistant clinical isolates of M. abscessus a fast growing organism related to
M. tuberculosis. It is a poorly understood multidrug resistant organism which has been
shown to cause abscesses in the lungs of patients with cystic fibrosis (Henry, 2014).
The antibiotics assayed in this chapter are commonly used to treat both M.
tuberculosis and M. abscessus and as a consequence drug resistance is often
encountered (Meziane-Cherif and Courvalin, 2014).

153
One of the antibiotics commonly used to treat mycobacterial infection is isoniazid
(INH) which is a pro-drug activated by a bacterial peroxidase. The mode of action is to
inhibit the synthesis of mycolic acids which are key components of the mycobacterial
cell wall (Simons et al., 2010) and thus prevent the growth of the bacteria (bactericidal
activity). Although commonly used, the drug has several severe side effects such as
liver damage which can lead to morbidity (Murray et al., 2014; Zhang et al., 1992).
Another commonly used antibiotic, Ethambutol (EM), also works by disrupting the
formation of mycolic acids which increasing the permeability of the bacterial cell wall
to antibiotics. Ethambutol, unlike INH is bacteriostatic so is commonly used in
combination therapy with INH, rifampicin and pyrazinamide which have bactericidal
effects. EM has several severe side effects including decreased vision and chronic liver
failure (Coban et al., 2014).
Rifampicin (RIF) was introduced in 1967 and is used in combination therapy to treat
tuberculosis and other Mycobacterial infections. Its mode of action is to prevent
bacterial DNA-dependent RNA synthesis by inhibiting the action of RNA polymerase
(Calvori, 2005). Bacterial resistance to RIF is common and occurs as a result of
mutations in the rpoB gene which alters the rifampicin binding site on RNA polymerase
and thus prevents the antibiotic from binding. For this reason RIF is always used in
combination with other antibiotics (BNF.org). A further complication of using the drug
is its hepatotoxicity which requires regular liver function tests to ensure patient health,
(Coban, et al., 2014).
Pyrazinamide (PYR) is a prodrug which is commonly used in combination with INH and
RIF to treat tuberculosis. Uniquely, PYR diffuses across the cell wall of the bacterium
where the enzyme pyrazinamidase converts the drug into the active form pyrazinoic
acid which increases internal pH (Cabellero, 2009). There are several theories as to the
mode of action of the drug but it is generally assumed that pyrazinoic acid acts by
disrupting membrane potential which prevents energy production (Zhang, et al.,
2008). The drug is also thought to inhibit the action of fatty acid synthase required by
the bacterium to synthesise fatty acids and binds to ribosomal protein S1 (RpsA)
inhibiting trans-translation of tRNA (Coates et al., 2011; Shi et al., 2011). Pyrazinamide
is also hepatotoxic and is the most common cause of drug induced hepatitis.

154
Pyrazinamide has no activity against actively growing TB bacilli at neutral pH but
instead targets non-replicating bacteria at acid pH such as those found inside
macrophages (McDermott and Tompsett, 1954; Shi et al., 2011; Tarshis and Weed,
1953).
Mycobacterium tuberculosis is just one bacteria within the mycobacterial species,
other related organisms such as M. avium and M. abscessus can also cause serious
healthcare associated infections (Petrini, 2006). To treat these pathogens and to
counter the rise of multidrug resistant isolates two additional antibiotics, imipenem
and ciprofloxacin, which have been shown to have inhibitory activity against these
pathogens, have been employed to treat infected individuals (Inderlied et al., 1989;
LaBombardi and Cataldo-Caputzal, 1993).
Imipenem (IM) is an intravenous β-lactam antibiotic and a member of the carbapenem
class of antibiotics which is generally used to treat Gram negative bacteria such as
Escherichia coli and Pseudomonas aeruginosa; it has also been shown to be active
against several species of Mycobacterium such as M. abscessus (Dooley et al., 2013;
Singh et al., 2014).
Beta lactam antibiotics act by binding to penicillin binding proteins (PBP’s). In Gram
negative organisms the PBP’s which imipenem has the most affinity for are, PBP-1a, 1b
and PBP-2. The binding of imipenem to PBP’s results in inhibition of cell wall synthesis;
in addition, direct binding PSP-2 and PBP-1b results in rapid cell lysis and death without
filament formation (Inderlied et al., 1989; Rodloff et al., 2006; Carvela et al., 1984).
Commonly mycobacteria are recognised as being intrinsically resistant to beta lactam
antibiotics. This is due, in part, to the presence of β-lactamase (an enzyme which
inhibits the binding to PBP’s). In addition to this, the lipid rich mycobacterial cell wall is
thought to be a virtually impenetrable barrier to polar molecules such as beta-lactam
antibiotics (Chambers et al., 1995). In a recent study however by Singh et al, (2014) the
susceptibility of 67 clinical isolates of Mycobacterium abscessus to imipenem was
investigated and it was found that only 14% were resistant; (MIC50 5 µg) (Singh et al.,
2014).

155
Imipenem has also been shown to be synergistic in vitro, with other anti-mycobacterial
drugs (Singh et al., 2014) as well as being inhibitory towards the M. tuberculosis strain
H37Ra (Chambers et al., 1995). Side effects are uncommon although it has been
reported that when used in high concentrations IM can cause seizures (BNF.org).
Ciprofloxacin (CIP) is a broad spectrum, second generation, fluoroquinolone (BNF.org)
and is commonly used in the treatment of a wide range of Gram positive and negative
bacterial infections. Ciprofloxacin is also commonly used alone or in combination with
other antibacterial drugs in the treatment of infections for which the bacterial
pathogen has not been identified, including urinary tract infections and abdominal
infections (Naber et al., 2006; Solomkin et al., 2010). CIP prevents cell division by
inhibiting DNA gyrase, necessary to separate bacterial DNA (Drlica and Zhao, 1997;
Inderlied et al., 1989; LaBombardi and Cataldo-Caputzal, 1993).
Given the ability of bacteria to evolve it is perhaps not surprising that they have
developed resistance to the antibiotics which are currently in use. The situation is not
helped by the fact that the cost of developing new antimicrobials far outweighs any
financial gain to the pharmaceutical companies and as a consequence there are no
new classes of antibiotic in the developmental pipeline, indeed no new classes of
antibiotics have been brought to the market since 1980 (Phillips, 2013).
An alternative to discovering new antibiotics would be to identify natural compounds
which restore the activity of redundant antibiotics or enhance their current level of
antibacterial activity (Coates et al., 2011; Cragg and Newman, 2013). One such
combination was identified by Cooper, et al., where synergistic activity was observed
between Manuka honey and beta lactam antibiotics against an oxacillin resistant strain
of S. aureus (Jenkins and Cooper, 2012). In another study Mossa (2004) and colleagues
observed that plant derived compounds such as diterpenes, totarol, ferulenol and
plumbagin increased the potency of isonicotonic acid hydrozide against M. smegmatis,
M. chelone, M. xenopei and M. intracellulare (Mossa et al., 2004).

156
Another example of a natural product derived antibacterial is clavulanic acid which is
derived from Streptomyces clavuligerus. Clavulanic acid or augmentin, is a Beta-lactam
antibiotic which when used alone is not itself inhibitory but when used in combination
with the penicillin type antibiotics such as amoxicillin, it can overcome antibiotic
resistance in bacteria that secrete β-lactamase enzymes (Reading and Cole, 1977).
When reporting the activity of combinations of antibiotics there has been confusion
regarding the classification of synergy, additive, co-active and indifferent. In this report
I have used several methods to determine the interaction of the test compounds and
therefore it is important to define the terminology used. In this report I class the
activity of hop-antibiotic combinations as antagonistic (one will reduce the activity of
the other); indifferent (the combination does not enhance or reduce the activity of
each drug); co-active (appearance of increased activity in one, or both drugs); additive
(statistically significant (FIC = >1 : <2) decrease in MIC of one compound when in
combination); synergy (statistically significant (FIC < 0.5) decrease in MIC of both test
compounds when in combination.
In this chapter the antibacterial activity of hop derived extracts against clinical isolates
of M. abscessus including those resistant to multiple antibiotics was investigated. The
ability of these extracts to potentiate the activity of the following antimicrobials:
isoniazid, ethambutol, ciprofloxacin, pyrazinamide, imipenem and rifampicin were also
studied. Finally the effect of exposure to hop extracts and antibiotics, alone and in
combination on M. abscessus structure using scanning electron microscopy (SEM) was
also investigated.

157
5.2 Materials and Methods
5.2.1 Clinical isolates of Mycobacterium abscessus
Clinical isolates were kindly provided by Dr. Joachim Burget and Dr. Mike Ruddy,
University Hospital of Wales, Cardiff (UHW) and were collected from patients during
July 2012 (Table 5.1); each isolate was characterised by a unique reference number
(assigned by UHW) which is displayed in Table 5.1 alongside the known antibiotic
resistance profiles.
Unique UHW strain number
Known antibiotic resistance (MIC > 128 µg/mL-1)
Collection date
8899 Imipenem, Rifampicin 11/07/2012
9495 Rifampicin Imipenem 11/07/2012
9568 Rifampicin 12/07/2012
9723 Rifampicin, Ciprofloxacin, 12/07/2012
10006 Rifampicin, Ciprofloxacin, Imipenem
21/07/2012
10332 Rifampicin 22/07/2012
11365 Rifampicin Ciprofloxacin, Imipenem
23/07/2012
11490 Rifampicin 24/07/2012
Table 5. 1 The UHW unique clinical isolate strain number, known antibiotic resistance (determined by an MIC > 128 µg/mL-1), and isolation date of Mycobacterium abscessus
strains

158
5.2.2 Growth media
Clinical isolates of M. abscessus were isolated using lysogeny agar (LA) and were
supplied as actively growing cultures in lysogeny broth (LB). All subsequent
antibacterial assays utilising M. abscessus were undertaken using LA and LB and were
prepared according to manufacturer’s instructions (10 g (LA/LB) / 500 mL of SDW) and
were autoclaved at 121 °C for 15 minutes and 15 PSI before use (Prestige, 9 L classic
bench top autoclave, LabShop, UK).
5.2.3 Antibiotics
The antibiotics used in this study were; isoniazid, ciprofloxacin, rifampicin, imipenem,
ethambutol and pyrazinamide. For the agar incorporation assay; Etest strips which had
a concentration gradient (0 µg to 256 µg) of each antibiotic were used. For the zone of
inhibition assay each antibiotic was supplied as a sensitivity disc (Fisher Scientific, UK)
and concentrations of 5, 10, 25, 50 and 100 µg were used. All antibiotic containing
reagents were stored at -20 °C prior to use.
5.2.4 Crude hop extract
Based on the results presented in Chapter 3 the hop variant Citra demonstrated the
highest level of antibacterial activity and was used to generate the extracts which were
used in these studies. The method for obtaining aqueous hop extract was described in
detail in Chapter 3.; briefly, 5 g of pelleted Citra hop variant was machine macerated
into a powder with a diameter less than 2 mm. Macerated hop material was then
suspended in 200 mL of SDW at 100 °C for 60 minutes and was then allowed to cool to
room temperature. Solid hop material was removed by filtration (Whatman® size 2
filter), under gravity and resulting supernatant was used neat and termed crude hop
extract; the crude hop extract was made fresh prior to each assay.

159
5.2.5 Purified hop extracts
The compounds in the Citra hop variant were separated as described in Chapter 4;
briefly 1 mL of a 1 g/mL-1 Citra aqueous hop extract was separated using preparative
thin layer chromatography and was assayed for antibacterial activity using the
bacterial overlay assay (Method 4.3.4). Separated spots which displayed antibacterial
activity towards M. abscessus 9495 were isolated, weighed and identified UPLC, as
previously described in Chapter 4. The hop compounds isolated by this process are
presented in Table 5.2.
Extract Number
Predominant compound as
identified by mass spectrometry
Compound weight
as tested (µg)
2737 G Humulone 5
2737 Y Lupulone 5
1426 G Adlupulone 5
Table 5. 2 Extracted hop compounds used in the synergy assays. Compounds were separated from preparative thin layer chromatography based on their antibacterial activity and the
predominant compound identified using mass spectrometry.

160
5.2.6 Characterisation of bacterial structure following exposure to
antibacterial compounds using scanning electron microscopy
Fresh cultures of M. abscessus and M. smegmatis were prepared as previously
described in section 2.2.2 and were standardised to 1 x 10⁶ cfu/mL-1.
Prior to fixing, 1 mL of bacterial culture was suspended in 1 ml of ciprofloxacin (0.12
µg/mL-1), imipenem (8 µg/mL-1) and Citra crude hop extract (0.125 % v/v). For synergy
studies, antibiotics were prepared in 0.125 % v/v Citra crude hop extract at the
concentrations previously mentioned. Controls consisted of M. abscessus and M.
smegmatis suspended in SDW. Each sample (test and control) was incubated statically
at 37 °C for 1, 6 10, 12, 18 and 24 hours on three separate occasions. At each time
point the appropriate sample was prepared for imaging as descried below.
5.2.6.1 Sample preparation and imaging
Treated bacterial cultures were pelleted by centrifuging at 2600 x g for 10 min and the
supernatant removed. Cultures were then fixed at room temperature for 1 h by
suspending in 500 μL of 2 % glutaraldehyde in 0.1 M sodium cacodylate buffer (pH
7.4). The samples were then centrifuged at 2600 xg for 10 min and the supernatant
was removed. To each sample, 500 μL of a solution containing a ratio of 2:2:1 of 2 %
osmium tetroxide: 0.1 M sodium cacodylate (pH 7.4): 25 % glutaraldehyde and
incubated for 1 h at room temperature.
Samples were centrifuged again and the supernatant was removed. The samples were
re-suspended in 50 % ethanol in diH₂O for 1 minute and then centrifuged at 5000 x g.
After removing the supernatant this process was repeated with 70, 80 and 95 %
ethanol in diH₂O followed by three washes with absolute ethanol. The samples were
stored in 1 mL of absolute ethanol at room temperature before dehydration under
vacuum on carbon grids, sputter coating with platinum and imagining on a scanning
electron microscope.
For each sample, 25 different fields of view were examined at 10,000 x and 50,000 x
magnification using a Zeiss SIGMA FEG-SEM scanning electron microscope.

161
5.3 Methods to characterise the combined antibacterial activity of
hops and antibiotics
5.3.1 Modified zone of inhibition assay
This method is a variation of the agar well diffusion assay (Section 3.6.1. In this assay
LA was prepared as per manufacturer’s instructions (10 g per 500 mL-1 SDW) and 20
mL of sterile, molten LA was transferred to a petri dish and allowed to set. A 1 x 10⁶
cfu/mL-1 suspension of each test strain of M. abscessus (Section 2.2.2 and 2.2.3) was
evenly spread onto the surface of the agar using a sterile spreader (Fischer Scientific,
UK) and incubated statically at 37 °C for 3 hours.
Two agar based radial assays were employed to assess interaction. In the first, 80 µl of
crude hop extract was added to a 6 mm diameter well which had been bored into the
agar. An antibiotic impregnated disc was then placed 5 cm from the centre of the well
after which the plate was incubated at 37 °C for 24 hours. In the second assay, sterile
paper sensitivity test discs were loaded with hops compounds at a concentration of 5
µg/mL-1 and left to dry. Discs containing antibiotics and hop compounds were then
placed 5 cm apart on the surface of an inoculated agar and incubated at 37° C for 24
hours. Following incubation the agar plates were inspected for the presence of zones
of inhibition. The shape of the interaction between the zones of inhibition generated
by each disc was used to indicate the type of interaction between the two agents
(Figure 5.1).
Figure 5. 1 The possible types of interaction between two antibacterial agents. Depending on the appearance of the interaction it is classified antagonistic, no effect or Co-active. Adapted
from Piddock, (1990).

162
5.3.2 Modified agar incorporation assay
To further characterise the interaction of hop derived compounds and antibiotics, the
hop agar incorporation assay was employed. This allowed the minimum inhibitory
concentration (MIC) of each hop extract to be determined against each test organism.
To determine the interaction of hop extracts and antibiotics the following method was
employed. A sub MIC concentration of hop compound was incorporated into agar
using a variant of the previously described method (Method 3.6.2). Following
inoculation of the surface of the agar plate with the test organism the plate was
incubated at 37 °C for 3 hours.
To determine the sensitivity of the organism to a chosen antibiotic the E-test or
episolmeter test was employed. The Etest consists of a predefined gradient (usually
between 256 µg – 0 µg) of antibiotic concentrations on a plastic strip, allowing the MIC
value of antibiotics, antifungal and antimycobacterial agents. The addition of a
concentration gradient allows for the results to be less subjective, in the zone of
inhibition assay the pattern of growth is used to describe positive co-action whereas
using the E-test a reduction in the MIC value is used (Reed, 2007; Wanger et al., 1995)
An Etest strip containing the chosen antibiotic was then positioned onto the surface of
the agar and the plate was returned to the incubator at 37 °C for 24 hours. As a control
the assay was performed using agar from which the hop compound had been omitted.
Figure 5. 2 Determination of the MIC value of Gentamicin against E.coli using an Etest strip. The clear zone represents the area of inhibition and the point at which the edge of the zone
meets the scale on the strip represents the MIC.
MIC Value
Zone of no
growth

163
An example of an E-test strip test plate following incubation can be seen in Figure 5.2.
A clear area of no growth is observed which leads to a narrowing point indicating the
minimum inhibitory concentration. When crude hop extract is incorporated into the
agar the zone is again read, and depending on the result the combination was classed
as co-active (decrease in MIC), antagonistic (increase in MIC) or indifferent (no change
to MIC). All assays were repeated on no less than 3 separate occasions unless
otherwise stated.
To identify a change in the MIC rather than experimental error a 3 dilution decrease in
the MIC value was used. Any changes below this value were taken to be experimental
error or ‘no effect’. The 3 dilution rule has been previously used to determine additive
effects using this assay (Reed, et al., 2007).
5.3.3 Identification of synergy using a checkerboard method
To test for synergy, indifference or antagonism the checkerboard method was used
and was adapted from White et al., 1996. The combinations tested against each clinical
isolate of M. abscessus were ciprofloxacin plus Citra crude hop extract and imipenem
plus Citra hop extract. The concentration range for each antimicrobial was 0.015 – 32
µg/mL-1 and was prepared from a stock solution prepared in diH₂O. For the Citra crude
hop extract concentration ranged from 0.05 % - 0.8 % v/v and was prepared as
previously described.
Each inoculum of M. abscessus was prepared as previously described and standardised
to a concentration of 1 x 10⁶ cfu/mL-1 in double concentrated lysogeny broth (20 g/l).
Within an MIC plate (Sterlin, UK) 80 µL of standardised bacterial suspension along with
50 µL of fresh double concentrated broth was added. To each well a 100 µL
combination of ciprofloxacin or imipenem (Range 0.015 µg/mL-1 – 32 µg /mL1)
prepared in Citra hop extract (Range 0.05 – 0.8 % v/v) was added to give a range of
concentrations of each test antibacterial. Plates were then incubated at 37 °C for 24
hours with shaking at 50 rpm.

164
Controls consisted of imipenem and ciprofloxacin and Citra hop extract only at the
concentrations listed above; sterile distilled water; and 80 µL of M. abscessus
suspended in 50 µL of double concentrated broth with 100 µL of SDW. Growth was
observed by eye as either turbid (growth) or clear (no growth) in each well.
To evaluate the effect of different combinations of antibiotics and hops the fractional
inhibitory concentration (FIC) was calculated for each antibiotic in each combination.
The following formula was used to calculate the FIC:
Definitions:
MICA - The MIC of ciprofloxacin/ imipenem (Drug A) alone MICB – The MIC of Citra hop extract (Drug B) alone MICAB – The MIC of drug A in combination with B MICBA – The MIC of drug A in combination with A
FIC (fractional inhibitory concentration) index calculations:
FIC Index = MICAB / MICA + MIC BA / MIC B
MICAB = MIC of A in the presence of B; MICBA = MIC of B in the presence of A
Results were then interpreted as follows:
Interpretation FIC
Synergy < 0.5
Additive > 0.5 and < 1.0
Indifference > 1 and < 4.0
Antagonism > 4.0
Table 5. 3 Interpretation of the FIC to identify synergy, additive, indifference or antagonism between antibiotics and crude hop extract
Adapted from Acar, (2000); White et al., (1996)
.

165
5.4 Results
5.4.1. Determination of the antibiotic sensitivity of clinical isolates of
M. abscessus
To confirm the antibiotic sensitivity of the clinical isolates of M. abscessus provided by
the UHW a disc diffusion assay was employed (Method 5.3.1). The following range of
antibiotics and disc concentrations were used; rifampicin, imipenem, ciprofloxacin and
pyrazinamide at concentrations of 5 and 10 µg. The resulting zone of inhibition
following overnight incubation is shown in Table 5.4; no inhibition is indicated by (NI).
Imipenem Ciprofloxacin Pyrazinamide Rifampicin Ethambutol
Strain number 5 µg 10 µg 5 µg 10 µg 5 µg 10 µg 5 µg 10 µg 5 µg 10 µg
The mean zone of inhibition (mm)
8899 NI NI 22.8 46.2 NI NI NI NI NI 1.2
9495 22.3 48.3 22.6 44.3 NI NI NI NI NI 1.4
9568 25.3 49.6 28.6 52.6 1.4 3.7 NI NI NI 1.1
9723 26.7 51.6 NI NI NI 1.4 NI NI NI NI
10006 NI NI NI NI NI NI NI NI NI NI
10332 22.6 46.2 25.3 49.7 1.6 3.5 NI 1.1 NI 1.2
11365 25.8 50.2 NI NI NI NI NI NI NI NI
11490 26.4 51.3 29.4 50.5 NI NI NI NI NI NI
Table 5. 4 The zone of inhibition (mm) of 5 and 10 µg antibiotic sensitivity discs (imipenem; ciprofloxacin; pyrazinamide; rifampicin and ethambutol) against clinical isolates of M.
abscessus as a result of 3 separate repeats (NI= no inhibition). Controls consisted of +ve Gentamicin at 10 µg/mL-1 and –ve an inoculated filter disc with 50 µL of SDW
Imipenem was found to be the most effective antibiotic at the concentrations tested
for these isolates while rifampicin was the least.
Comparing the results obtained from Table 5.1 the bacterial sensitivities to the
antibiotics appears to match those expected. This is especially the case for strain
number 10332 which appears sensitive to all antibiotics assayed at both 10 µg/mL-1, in
comparison; strain 11365 is the most resistant.

166
5.4.2. Determination of the sensitivity of clinical isolates of M.
abscessus to Citra hop extract
The antibacterial activity of the Citra crude hop extract was next determined by the
using the previously developed zone of inhibition assay (method 3.6.1). The average
zone of inhibition was calculated on 3 separate occasions against all of the clinical
isolates of M. abscessus and the results displayed in Figure 5.3.
Figure 5. 3 The average zone of inhibition (mm) of Citra crude hop extracts against clinical isolates of M. abscessus. Results shown are the mean of 3 separate repeats, error bars
represent ± Standard deviation (SD)
All of the clinical isolates of M. abscessus were susceptible in varying degrees to the
hop extract. To determine if there was a statistically significant difference in the level
of antibacterial activity observed against theses isolates, a one way ANOVA and Tukey
post hoc analysis of the zones of inhibition generated by strains 11365 and 8899 was
performed. A p value (>0.05) indicated that there was no significant difference in the
zones of inhibition suggesting that all of the isolates demonstrated a similar level of
sensitivity to the hop extract. The fact that antibiotic resistant isolates were as
susceptible as there antibiotic susceptible counterparts suggests that the extract
contains compounds that may act in a manner which differs from that of the particular
antibiotics and that they may have utility as antimicrobial agents.
0
5
10
15
20
25
11365 10332 9568 11490 9723 9495 10006 8899
Ave
rage
zo
ne
of
inh
ibit
ion
(m
m)
M. abscessus strain number

167
5.4.3 Characterisation of the combined antibacterial activity of hops
and antibiotics against clinical isolates of M. abscessus
To characterise the interaction of individual antibiotics and the hop extract, an agar
diffusion assay was used (section 3.6.1). An antibiotic sensitivity disc containing 10 µg
of the antibacterial agent was placed 5 cm from a well containing Citra hop extract and
was incubated overnight. The resulting growth was examined for evidence of
synergism, antagonism or no effect.
Figure 5.4 shows an example of an antibiotic/ hop interaction which demonstrated
coactivity against M. abscessus 9495.
Figure 5. 4 Synergistic interaction between the antibiotic imipenem (10 µg/mL-1) and crude Citra hop extract against the clinical isolate Mycobacterium abscessus 9495. Zones of
inhibition shown in black indicate normal inhibition whilst zones in red indicate synergism. Figure shown is representative of 3 separate repeats.
Figure 5.5 is an example of the zone of inhibition assay between the Citra crude hop
extract and the antibiotic ethambutol (10 µg) against the clinical isolate M. abscessus
9568. The figure details ‘no effect’ (Figure 5.1), meaning that no coactivity or
antagonistic activity was observed.
.
Imipenem
(10 µg/mL-1
)
Citra Crude
Hop extract

168
Figure 5. 5 An example of the zone of inhibition assay detailing no effect between the antibiotic ciprofloxacin (10 µg/mL-1) and the crude Citra hop extract against the clinical
isolate Mycobacterium abscessus 9568. Figure shown is representative of 3 separate repeats
For ease of analysis the interaction for each clinical isolate has been collated and is
presented in Table 5.5
M. abscessus strain numbers
Imipenem 10 µg
Ciprofloxacin 10 µg
Pyrazinamide 10 µg
Rifampicin 10 µg
Ethambutol 10 µg
8899 NE NE NE NE NE
9495 CO NE NE NE NE
9568 CO CO NE NE NE
9723 CO NE NE NE NE
10006 NE NE NE NE NE
10332 CO CO NE NE NE
11365 NE NE NE NE NE
11490 CO CO NE NE NE
Table 5. 5 A summary of the activity of crude hop extract and antibiotics against clinical isolates of M. abscessus determined using an agar diffusion assay. (Key – CO = Co-active; NE
= No effect; A = antagonism. Results determined on three separate occasions
As can be seen from Table 5.5 the degree of antibacterial interaction varied depending
on the type of antibiotic and the test organism. Antimicrobial co-action was observed
between hop extracts and imipenem (n=5) followed by Ciprofloxacin (n=3). In no case
was antagonism observed.
Citra crude
hop extract
Ciprofloxacin
(10 µg/mL-1)

169
While the Citra hop extract demonstrated antibacterial activity against all strains of M.
abscessus tested, the isolates varied in their response to particular combinations of
hop extract and antibiotics. Isolates 9568, 10332 and 11490 demonstrated coactivity
with two of the antibiotics tested.
Strain numbers 10006, 8899 and 11365 showed no effect with any of the antibiotics
which suggests fundamental differences between the sensitivity of these bacteria. It is
interesting to note that 10332 demonstrated the greatest range of antibiotic
sensitivities while 10006 was the most resistant.

170
5.4.4. Determination of the sensitivity of clinical isolates of M.
abscessus to individual compounds isolated from the Citra hop extract
To determine the degree of antibacterial activity of the Citra hop purified components,
isolated in Chapter 4, 5 µg of test compound was transferred to a paper sensitivity disc
and employed in a zone of inhibition assay (Method 3.6.1). The assay was repeated on
3 separate occasions and the results are presented in Table 5.6.
M. abscessus strain numbers
Extract 2737 G Mean ZOI ±SD
(mm)
Extract 2737 Y Mean ZOI ±SD
(mm)
Extract 1426 G Mean ZOI ±SD
(mm)
8899 18.3 ± 0.45 14.2 ± 0.10 16.5 ± 0.33
9495 12.3 ± 0.11 15.3 ± 0.11 17.3 ± 0.42
9568 12.3 ± 0.21 16.6 ± 0.32 15.4 ± 0.18
9723 11.6 ± 0.44 14.8 ± 0.88 18.2 ± 0.14
10006 11.2 ± 0.52 14.1 ± 0.23 15.6 ± 0.77
10332 10.9 ± 0.19 12.4 ± 0.31 14.7 ± 0.11
11365 12.3 ± 0.18 13.6 ± 0.54 15.2 ± 0.46
11490 12.2 ± 0.16 13.4 ± 0.44 14.9 ± 0.14
Table 5. 6 The antibacterial activity of Citra hop sub-fractions (2737G; 2737Y and 1426G) against clinical isolates of M. abscessus determined using a zone of inhibition assay. Each
value is a mean ZOI ± SD (mm) based on three separate repeats
As can be observed in Table 5.6 all three extracts demonstrated varying degrees of
inhibitory activity against all of the clinical isolates of M. abscessus. The data was
subjected to Tukey HSD Post Hoc analysis to determine if there was a statistically
significant difference in the sensitivity of the strains. A p value of > 0.05 indicated that
there was no difference in strain sensitivity to any of the hop extracts tested.
Comparing the sensitivity data from Table 5.3 and Table 5.6, initial observations
indicate that there is a decrease in the average zone of inhibition (mm) of the purified
extracts when compared to the crude hop extract. A one way ANOVA compared the
average ZOI (mm) of the crude hop extract against all strains with the average ZOI of
the purified hop extracts against all strains. It was found that there was a statistically
significant difference (p=<0.05) in the level of antibacterial activity, therefore a
reduction in the overall activity.

171
This is perhaps not surprising as hops are known to contain more than 800 separate
compounds of which more than 20 have been reported to be antibacterial (Sumner,
2010). It is possible that individually these compounds do not possess a measurable
level of antibacterial activity but when in combination, as in the crude extract, an
antibacterial affect can be observed. It may be the case that the separation and
purification of these fractions actually increases the availability of these compounds
compared to the original extract. It may be the case that other compounds can act
antagonistically preventing their antibacterial activity.
5.4.5. Determination of synergy between hop derived compounds and
antibiotics using an agar based zone of inhibition assay
The interaction between the antibacterial hop sub-fractions with antibiotics was
assayed using an agar based method. No effect between any of the hop extracts and
antibiotics assayed was observed.
Given that coactivity was observed using the crude hop extract these results suggest
that either the hop compounds necessary for synergy were missing from the purified
fractions or that synergy is the consequence of the combined activity of a number of
compounds found in the crude hop extract.

172
5.4.6 Determination of the MIC of Citra hop extract against clinical
isolates of M. abscessus using an agar incorporation assay
To further determine if there was a positive co-action between the crude hop extract
and the antibiotics a modified agar incorporation assay utilising E-test strips was used
(section 5.3.2). By measuring changes in the MIC I hypothesised that the any changes
in antimicrobial activity could be more accurately determined.
The first stage of this process was to determine the level of sensitivity of the bacterial
isolates to the crude hop extract so that the level of hop extract to incorporate into the
agar for the E-strip assay could be determined. As can be seen in Table 5.7 all isolates
were sensitive to the Citra hop extract. A p value of > 0.05 using a one way ANOVA
indicated that there was no statistically significant difference between the MIC of the
crude hop extracts and the bacterial isolates
M. abscessus strain number
The MIC of crude Citra hop extract (% concentration of hop extract v/v)
8899 1.25
9495 0.625
9568 1.25
9723 1.25
10006 1.25
10332 0.625
11365 0.625
11490 0.625 Table 5. 7 The MIC of crude Citra hop extract against clinical isolates of M. abscessus
determined using an agar incorporation assay. Results represent the mean of three separate assays
It was interesting to observe in Table 5.7 that even though the organisms were
resistant or sensitive to different antibiotics there was no variation in their sensitivity
to the hop extract. This highlights fundamental differences in the mode of action(s) of
the hop extract and the antibiotics previously assayed.
This assay also supported the findings of previous research (Table 5.3) which detailed
the zone of inhibition and showed no variation in the sensitivity of the isolates to the
hop extract.

173
5.4.7 Determination of the MIC of antibiotics against clinical isolates of
M. abscessus using the E-strip test.
The method employed was a variant of the agar incorporation method developed in
Chapter. A sub-inhibitory concentration of Citra hop extract was incorporated into the
agar prior to the addition of the E-strip. As a control the hop extract was omitted.
Typical examples of the results generated with this method are presented in the
following figures (5.6 and 5.7).
Figure 5. 6 The effect of imipenem 0-256 µg on the left and with the incorporation of a sub-inhibitory concentration (0.3125 % (v/v)) of Citra crude hop extract on the right. Figure
representative of 3 separate repeats.
Figure 5.6 shows the effect of hop extract at a concentration of 0.3125 % v/v on the
sensitivity of M. abscessus 10332 to imipenem. In the presence of the hop extract, the
zone of inhibition was larger and the MIC value reduced from 6.0 µg to 0.03 µg
suggesting a synergistic effect.

174
As can be observed in Figure 5.7 the addition of a ciprofloxacin Etest had an inhibitory
effect on the growth of M. abscessus 10332 (MIC – 0.12 µg). When compared to the
image on the right, in which 0.3125 % (v/v) Citra hop extract was incorporated into the
agar. The zone of inhibition surrounding the Etest strip was much larger, the MIC value
had also decreased to 0.06 µg from 0.12 µg. Although not considered a significant
decrease in MIC to be synergistic, a positive co-action was assumed due to the
increase in the zone of inhibition.
Figure 5. 7 The Etest of ciprofloxacin (256 – 0 µg) against M. abscessus 10332 without the incorporation of Citra hop extract (0.0625 % v/v) (left) and with the incorporation of extract.
A summary of the results for all of the isolates of M. abscessus examined in this study
to determine the interaction between hop extract and antibiotics is shown in the
following Table (Table 5.8).

175
Table 5. 8 The effect of Citra hop extract on the antibiotic sensitivity of clinical isolates of M. abscessus. The MIC of imipenem; ciprofloxacin; pyrazinamide; rifampicin and ethambutol
was determined using the Etest before and after the incorporation of Citra hop extract (0.312 % v/v). The numerals in red denote a reduction in the MIC, suggesting coactivity.
Results are representative of 3 separate repeats.
In this assay the concentration of the hop extract did not change, instead a variation of
the MIC of the antibiotic was used to determine an antagonistic (> MIC); indifferent
(no change in MIC); co-active (< 3 fold decrease in MIC).
Therefore on this basis, the antibiotic which demonstrated the highest level of Co-
activity, was imipenem, specifically in strains 10332 and 11365.
Imipenem Ciprofloxacin Pyrazinamide Rifampicin Ethambutol
Strain numbers
MIC (µg)
MIC with Hop Ext.
(0.312%v/v) (µg)
MIC (µg)
MIC with Hop Ext.
(0.312%v/v) (µg)
MIC (µg)
MIC with Hop Ext.
(0.312%v/v) (µg)
MIC (µg)
MIC with Hop Ext.
(0.312%v/v) (µg)
MIC (µg)
MIC with Hop Ext.
(0.312%v/v) (µg)
8899 >32 >32 6 6 >32 >32 >32 >32 >32 >32
9495 8 2 6 6 >32 >32 >32 >32 >32 >32
9568 8 2 0.12 0.06 >32 >32 >32 >32 >32 >32
9723 8 2 >32 >32 >32 >32 >32 >32 >32 >32
10006 >32 >32 >32 >32 >32 >32 >32 >32 >32 >32
10332 6 0.03 0.12 0.06 >32 >32 >32 >32 >32 >32
11365 6 0.12 >32 >32 >32 >32 >32 >32 >32 >32
11490 8 2 1 0.5 >32 >32 >32 >32 >32 >32

176
It has been proposed that hops contain compounds which induce the release of
bacterial cell wall degrading enzymes which contribute to their antibacterial activity
(Carder, 1987). Given that imipenem also targets the bacterial cell wall it is interesting
to speculate that the effect seen in these studies is a consequence of an interaction
which enhances the access of either drug to its target. The fact that the purified
antibacterial hop compounds failed to interact with imipenem suggests that their
mode of action does not involve any form of direct cell wall damage.
The interaction between hops and ciprofloxacin although detectable was not as
dramatic as that seen with imipenem. Whilst no evidence of co-activity was observed,
an increase in the size of the zone of inhibition was seen suggesting a form of positive
interaction.
Ciprofloxacin is a broad spectrum antibiotic used against both Gram positive and Gram
negative organisms and works by inhibiting DNA gyrase enzymes inhibiting cell
division. Resistance to ciprofloxacin has been linked to a lack of cell wall permeability
which is a classical defence mechanism in mycobacteria (Chatterje., 1997; Jarlier.,
1994)
As previously discussed in this chapter, each hop extract had observable antibacterial
activity against the M. abscessus isolates. Therefore it may be that the hop extract is
degrading the bacterial cell wall, leading to intracellular exposure to ciprofloxacin. In
each case between the hop extract and pyrazinamide; rifampicin and ethambutol an
indifferent result was given. Interestingly all isolates had an MIC value of more than 32
µg/mL-1 to the anti-tuberculosis drugs ethambutol, pyrazinamide and rifampicin. This
highlights previous research which suggests that Mycobacterium abscessus is
intrinsically resistant to these antibiotics (Brown-Elliott et al., 2012; Griffith et al.,
2007; Medjahed et al., 2010).

177
5.4.8 Checkerboard method for determining synergy between
imipenem, ciprofloxacin and hop extracts against M. abscessus 9568,
10332 and 11490
To further determine and quantify if the combinations of hop extract and antibiotic
were synergistic, additive, indifferent or antagonistic. The checkerboard method was
used.
Based on the results gained from Table 5.8, three strains of Mycobacterium abscessus
were employed: 9568, 10332 and 11490. These strains were chosen due to the
changes in MIC values of the antibiotics (imipenem and ciprofloxacin) seen in the
previous assay 5.4.7. Results are presented in Tables 5.9 and 5.10 and represent 3
separate repeats.
Definitions:
MICA - The MIC of ciprofloxacin/ imipenem (Drug A) alone MICB – The MIC of Citra crude hop extract (Drug B) alone MICAB – The MIC of drug A in combination with B MICBA – The MIC of drug A in combination with A
M. abscesuss Single Drug Imipenem Hop ext.
Combination FIC Index
Interpretation
MIC A MICB MICAB MICBA
9568 8 1.25 2 0.625 0.77 Additive
10332 6 0.625 0.03 0.156 0.255 Synergistic
11490 8 0.625 2 0.625 1.25 Indifference Table 5. 9 Results of the checkerboard assay determining the MIC of imipenem and Citra
crude hop extract alone and in combination with subsequent interpretation of the FIC index. Values of 3 separate repeats ±SD 0.00
M. abscessus Single Drug CIP Hop ext.
Combination FIC Index
Interpretation
MIC A MICB MICAB MICBA
9568 0.12 1.25 0.06 0.625 1.0 Indifference
10332 0.12 0.625 0.06 0.312 0.99 Additive
11490 1 0.625 0.5 0.625 1.5 Indifference Table 5. 10 Results of the checkerboard assay determining the MIC of ciprofloxacin (CIP) and Citra crude hop extract alone and in combination with subsequent interpretation of the FIC
index. Values of 3 separate repeats ±SD 0.00

178
The checkerboard method represents the gold standard in synergy testing and its
effectiveness has been evaluated previously by researchers in the field of antibiotic
synergy (Petersen et al., 2006; Harada et al., 2014; Zuo et al., 2014).
The advantages of this method allow the subsequent MIC’s of both test agents, in this
case the antibiotics imipenem and ciprofloxacin and Citra crude hop extract, to be
determined alone and in combination. Furthermore the method allows for the
fractional inhibitory concentration (FIC) to be defined and a synergistic, additive,
indifferent or antagonistic result being given for each combination. The FIC was first
described by Elion (1954) and determines the statistical significance that two separate
drugs will act in a synergistic or antagonistic manner based on a number determined
between 0 and > 4 (Elion et al., 1954; Hall et al., 1983b).
In the case of imipenem, 3 different interpretations of interaction were determined.
Interestingly the MIC of imipenem in the checkerboard method matched that as
determined in the modified agar incorporation method, however, several
concentrations of hop extract were used in combination with the antibiotics. An
observed synergistic effect (FIC = 0.255) between imipenem (MIC 0.03 µg/mL-1 in
combination with Citra crude hop extract 0.156 % v/v) against the strain 10332 was
seen. This is a reduction from 6 µg/mL-1 of imipenem and 1.25 % v/v of Citra hop
extract when used alone.
An additive effect (FIC = 0.77) between imipenem (2 µg/mL-1) and Citra crude hop
extract (0.625 % v/v) from an original concentration of 8 µg/mL-1 and 1.25 % v/v
against strain number 9568 was also observed.
In the third bacterium trialled 11490, although the MIC of imipenem dropped from 8
µg/mL-1 to 2 µg/mL-1 when in combination with a 0.625 % v/v hop extract. The FIC
(1.25) indicated that this was an indifferent effect.

179
When compared to results of ciprofloxacin alone and in combination with the hop
extract similar activity to the results obtained in the modified agar incorporation assay
against the test bacterium was observed.
Whilst the FIC in each case indicated that there was no synergistic effect, an additive
interaction was seen against M. abscessus 10332. This is identified by the MIC of
ciprofloxacin reducing to 0.06 µg/mL-1 from 0.12 µg/mL-1 and the Hop extract MIC
being reduced to 0.312 % v/v from 0.625 % v/v which resulted in an FIC of 0.99 which
was just below the threshold of indifferent (FIC >1 and <4).
Whilst an indifferent effect was seen between the test agents against strains 9568 (FIC
= 1.0) and 11490 (FIC = 1.5) a decrease in both the MIC of the ciprofloxacin and hop
extract in both cases was observed. This is considered statistically insignificant
‘indifferent’ according to the FIC.
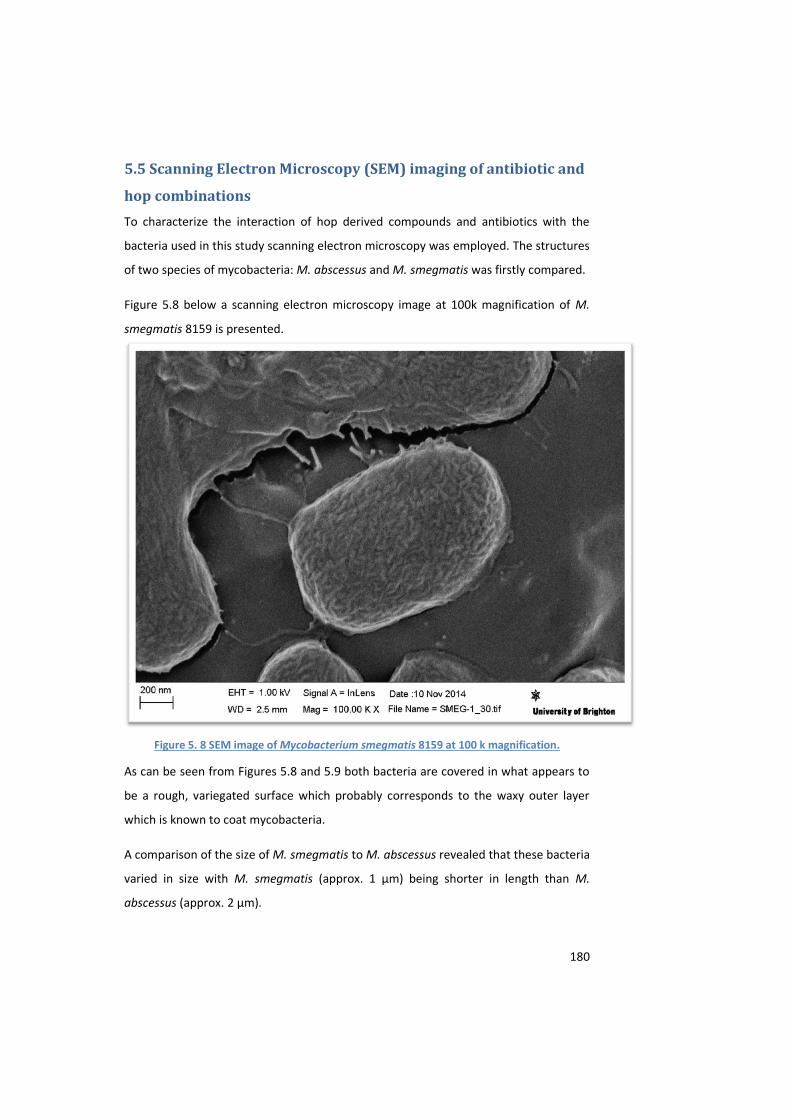
180
5.5 Scanning Electron Microscopy (SEM) imaging of antibiotic and
hop combinations
To characterize the interaction of hop derived compounds and antibiotics with the
bacteria used in this study scanning electron microscopy was employed. The structures
of two species of mycobacteria: M. abscessus and M. smegmatis was firstly compared.
Figure 5.8 below a scanning electron microscopy image at 100k magnification of M.
smegmatis 8159 is presented.
Figure 5. 8 SEM image of Mycobacterium smegmatis 8159 at 100 k magnification.
As can be seen from Figures 5.8 and 5.9 both bacteria are covered in what appears to
be a rough, variegated surface which probably corresponds to the waxy outer layer
which is known to coat mycobacteria.
A comparison of the size of M. smegmatis to M. abscessus revealed that these bacteria
varied in size with M. smegmatis (approx. 1 µm) being shorter in length than M.
abscessus (approx. 2 µm).

181
Figure 5. 9 SEM image of Mycobacterium abscessus 10332 at 50, 000 x magnification representative of 25 separate images.
Figure 5.9 represents 25 separate images of the bacteria in situ. Several observations
can be made; notably there is a lack of single cells. This may be due in part to the waxy
surface of the bacteria comprised of hydrophobic lipids and glycoproteins which allow
the bacteria to adhere (Brennan, 2003; Ryan et al., 2004; Tyagi and Sharma, 2002). The
lipid rich cell wall is a well-known virulence factor in mycobacteria and aids in drug
resistance by acting as a permeability barrier (Ryan et al., 2004).

182
5.5.1 Characterisation of bacterial structure following exposure to
Citra hop extract using SEM
To determine if exposure to Citra hop extract had any effect on cellular morphology,
cells of Mycobacterium abscessus 10332 were incubated for 10 hours with (0.3125 %
v/v) of hop extract. After which, they were examined using SEM (Figure 5.10).
Figure 5. 10 SEM image of M. abscessus 10332 (50k magnification) after 10 h incubation with 0.3125 % (v/v) Citra crude hop extract- representative of 25 separate images
In comparison with the control M. abscessus (Figure 5.9), the hop extract is having a
demonstrable effect on the cell structure, whilst size does not seem to be affected,
pitting of the cells forming crevices is clearly visible.

183
5.5.2 Characterisation of bacterial structure following exposure to
Ciprofloxacin using SEM
To determine if exposure to ciprofloxacin had any effect on cellular morphology, cells
of Mycobacterium abscessus 10332 were incubated for 10 hours with 6 µg/mL-1
ciprofloxacin after which they were examined using SEM (Figure 5.11).
Figure 5. 11 SEM image of M. abscessus 10332 at 50k magnification after incubation with ciprofloxacin (6 µg/mL-1) for 10 hours. representative of 25 separate images
Comparison of these images with those of untreated bacteria (Figure 5.9) revealed
obvious differences in the appearance of the cell. The waxy cell surface has been lost
and the cells are noticeably larger (approx. 3-4 µm) and are visibly pitted. These
differences may be due to the antibiotic inhibiting the action of DNA gyrase and
thereby preventing cell division and cell surface differentiation.

184
5.5.3 Characterisation of bacterial structure following exposure to
imipenem using SEM
Next investigated was the effect of exposure to the bet-lactam antibiotic, imipenem,
on the cellular morphology of M. abscessus following incubation with imipenem (6
µg/mL1) for 10 hours. As was the case for ciprofloxacin treatment the bacteria exposed
to imipenem had smoother cell surfaces than those of the untreated control.
Imipenem is known to interact with penicillin binding proteins in the cell wall which
may explain the effect on cell surface morphology (Chambers et al., 1995).
Figure 5. 12 SEM image of M. abscessus 10332 at 50 k magnification after incubation with imipenem (6 µg/mL-1) for 10 hours. Figure representative of 25 separate images

185
5.5.4 Characterisation of bacterial structure following exposure to
Citra hop extract and ciprofloxacin using SEM
To determine the effect of a combination of Citra hop extract and ciprofloxacin, M.
abscessus 10332 was incubated with 0.312 % v/v hop extract and 0.06 µg/mL-1
ciprofloxacin for 10 hours (Figure 5.13).
Figure 5. 13 SEM image of M. abscessus 10332 after incubation with ciprofloxacin (0.06 µg/mL-1) and Citra crude hop extract (0.312 % v/v) for 10 h. Representative of 25 separate
images
A large decrease in the number of intact cells was observed. This suggested that the
combination of agents had resulted in the destruction of the cell wall of the bacterium.
Those cells which had not been destroyed displayed a similar appearance to the
ciprofloxacin treated bacteria in Figure 5. 11.

186
5.55 Characterisation of bacterial structure following exposure to Citra
hop extract and imipenem using SEM
The effect of imipenem and the Citra crude hop extract on the structure of M.
abscessus 10332 was next investigated. The bacterium was incubated for 10 hours
with a sub-inhibitory concentration of hop extract (0.156 % (v/v) and 0.03 µg/mL-1 of
imipenem and then visualised (Figure 5.14).
Figure 5. 14 SEM image of M. abscessus 10332 after incubation with imipenem (0.03 µg/mL-1) and Citra crude hop extract (0.156 % v/v) for 10 h. Representative of 25 separate images
A large decrease in the number of intact cells was observed, suggesting that the
combination of agents had resulted in the destruction of the bacterial cell wall.

187
To confirm that this cellular disruption was not a localised artifact, additional images
were captured at a lower magnification (10,000 versus 50,000) which also showed
extensive cellular disruption suggesting that the combination of hops and imipenem
was extremely effective at destroying cells of M. abscessus 10332 (Figure 5.15)
Figure 5. 15 SEM image of M. abscessus 10332 at a magnification of 10 k after incubation with Imipenem (0.03 µg/ml) and Citra crude hop extract (0.156 % v/v) for 10 h detailing the
lack of visible cells representative of 25 separate images

188
5.6 Discussion
The organism Mycobacterium abscessus has been described as a new antibiotic
nightmare (Nessar et al., 2012). While the bacterium is intrinsically resistant to some
classes of antibiotics, its ability to acquire resistance to other front line drugs makes it
a difficult pathogen to treat, particularly when encountered in patients with cystic
fibrosis (CF) (Cullen et al., 2000; Petrini, 2006; Seddon et al., 2013).
Distinguishing M. abscessus from other chronic bacterial pulmonary infections found in
the advanced stages of CF is extremely challenging, as such, there is a concern that the
use of broad spectrum antibiotics may simply select for the emergence of antibiotic
resistant isolates of M. abscessus (Cullen et al., 2000).
Incidences of M. abscessus infections are increasing: the CDC assessed 3,805 adults
and 3,317 children with cystic fibrosis and found that 5.0 % and 3.3 % of these patients
respectively had been diagnosed with an mycobacterial infection, of those, only 44 %
of adults and 47 % of children were receiving or had received treatment (Seddon et al.,
2013).
M. abscessus is often a neglected infection and as a consequence is becoming a major
healthcare concern. As was shown in Chapter 3 hop extracts contain compounds which
inhibit the growth of Mycobacterium smegmatis and for this reason, the antibacterial
activity of Citra hop extract and compounds isolated from this extract against clinical
isolates of Mycobacterium abscessus was determined.
Clinical isolates were obtained from patients treated at the University Hospital of
Wales, Cardiff during July 2012. In total eight clinical isolates which varied in their
susceptibility to commonly used antibiotics were assayed for their susceptibility to 5
and 10 µg antibiotic discs of imipenem, ciprofloxacin, pyrazinamide, rifampicin and
ethambutol. From this it was observed that the most sensitive organism was M.
abscessus 10332 whilst in comparison strain 11365 was the most resistant.
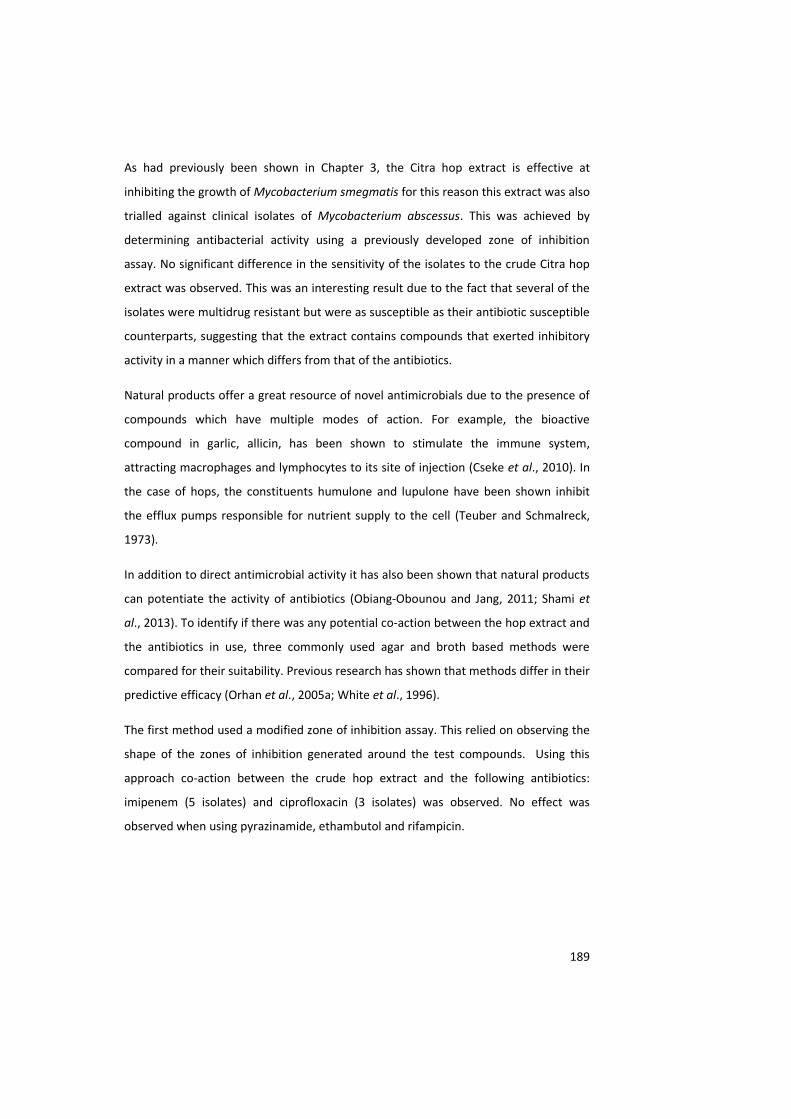
189
As had previously been shown in Chapter 3, the Citra hop extract is effective at
inhibiting the growth of Mycobacterium smegmatis for this reason this extract was also
trialled against clinical isolates of Mycobacterium abscessus. This was achieved by
determining antibacterial activity using a previously developed zone of inhibition
assay. No significant difference in the sensitivity of the isolates to the crude Citra hop
extract was observed. This was an interesting result due to the fact that several of the
isolates were multidrug resistant but were as susceptible as their antibiotic susceptible
counterparts, suggesting that the extract contains compounds that exerted inhibitory
activity in a manner which differs from that of the antibiotics.
Natural products offer a great resource of novel antimicrobials due to the presence of
compounds which have multiple modes of action. For example, the bioactive
compound in garlic, allicin, has been shown to stimulate the immune system,
attracting macrophages and lymphocytes to its site of injection (Cseke et al., 2010). In
the case of hops, the constituents humulone and lupulone have been shown inhibit
the efflux pumps responsible for nutrient supply to the cell (Teuber and Schmalreck,
1973).
In addition to direct antimicrobial activity it has also been shown that natural products
can potentiate the activity of antibiotics (Obiang-Obounou and Jang, 2011; Shami et
al., 2013). To identify if there was any potential co-action between the hop extract and
the antibiotics in use, three commonly used agar and broth based methods were
compared for their suitability. Previous research has shown that methods differ in their
predictive efficacy (Orhan et al., 2005a; White et al., 1996).
The first method used a modified zone of inhibition assay. This relied on observing the
shape of the zones of inhibition generated around the test compounds. Using this
approach co-action between the crude hop extract and the following antibiotics:
imipenem (5 isolates) and ciprofloxacin (3 isolates) was observed. No effect was
observed when using pyrazinamide, ethambutol and rifampicin.

190
It was also observed that strains 10006 and 11365 showed no increased sensitivity to
any of the antibiotics tested and that strain 10332 demonstrated the greatest range of
antibiotic sensitivities whilst 10006 was the most resistant.
To further investigate antibacterial coaction, the antibacterial compounds: humulone,
lupulone and adlupulone were also trialled using the same method. Unfortunately in
each case, no effect was observed between the combinations. This suggested that
synergistic activity is a consequence of the combined activity of a number of
compounds present in the crude hop extract.
As previously mentioned in Chapter 4, compound extraction relies on the
demonstration of antibacterial activity. Thus, it may be the case that the compounds
responsible for the co-active effect with antibiotics lack any direct antibacterial activity
and therefore would not have been selected for extraction.
To further identify if there was a coactive effect, the agar incorporation assay
previously described in Chapter 3 was employed. Determination of the MIC of the
crude Citra hop extract against each clinical isolate of M. abscessus revealed no
statistically significant difference in the level of sensitivity to the extract.
Based on these results, a sub MIC concentration (0.312 % v/v) was chosen for all
bacterial isolates and incorporated into the agar and an Estrip of each antibiotic placed
on the surface of the inoculated agar. The results obtained were compared to those
generated in the absence of the hop extract. In the context of this project coactivity
was determined by a 3 fold decrease in the antibiotic MIC, indifference as no change in
MIC and antagonism as an increase in MIC. In previous studies a single dilution change
in MIC was considered coactive (White et al., 1996).
The advantage of utilising agar incorporation over that of the zone of inhibition assay is
that it allows for the measure of different levels of antibiotic sensitivity and thus
generates a semi quantitative result. By using this technique it was found that this was
most apparent in strains 10332 and 11365 when in conjunction with imipenem and
9568 and 10332 when subjected to ciprofloxacin. In each case between the hop
extract and pyrazinamide, rifampicin and ethambutol an indifferent result was given.

191
There are several possible reasons for the different results observed between the two
assays:
1. The zone of inhibition is observed by eye and therefore the observed ‘pattern’
of growth is subjective. A pattern which is suggestive of coactive may indeed
represent indifferent.
2. The Estrip gives a much more quantifiable result which enables a determination
to be made of any changes in relative antibiotic sensitivity. However, the strip is
not designed for the purposes of synergy and therefore small changes in MIC
below the limits of detection on the E-strip may go unnoticed.
In the context of this study, these two agar based screening assays were used as a
means of selecting hop and antibiotic combinations worthy of a more detailed study
such as checkerboard method. This method represents the “gold standard” assay with
which to determine potential synergistic interactions (Petersen et al., 2006; Harada et
al., 2014; Zuo et al., 2014).
Using this method a synergistic effect for the combination of imipenem and hop
extract against strain 10332, an isolate which was sensitive to all of the antibiotics
examined in this study was observed. An additive effect was seen against strain 9568
while 11490 demonstrated indifference. This differs from the results obtained using
the agar assays which found a coactive effect highlighting the need to appreciate the
limitations of each assay.
For example, while the zone of inhibition assay is a classical method for determining
synergy, the interpretation of the results can be subjective and is dependent on
several factors including; the confluence of bacterial growth on the surface of the agar
and the chance of human error when spreading organisms. The E-test method suffers
from the same drawbacks and is considerably more expensive than the zone of
inhibition assay. Also whilst the effects of different concentrations of antibiotic could
be assessed, only one fixed concentration of hop extract is employed.

192
While the checkerboard method is considerably more labour intensive than the other
assays, it does overcome many of these issues and has the added advantage that
several concentrations of the test agents can be analysed at the same time. This allows
for any changes in the MIC of both test agents to be determined (Orhan et al., 2005a;
White et al., 1996). The checkerboard assay is also more reproducible than the E-test
in that White (1996) reports a 25% discrepancy between the two assays when used to
assess the coactivity of the same antibiotic combination (White et al., 1996)
In conclusion, the separate assays presented different results. In using the
checkerboard assay, synergy was observed between imipenem and the hop extract
against 10332 and an additive effect against strain 9568. When compared to the Etest,
an additive effect was seen against strain 10332 when exposed to ciprofloxacin and
hop extract, and an indifferent effect against 9568 using the Etest method.
While M. abscessus 10332 appeared to be sensitive to clinically relevant levels of
imipenem, the occurrence of isolates of M. abscessus which are resistant to the drug is
becoming increasingly common (Medjahed et al., 2010). This is due to the expression
of β-lactamase enzymes that degrade the activity of β-lactam antibiotics such as
imipenem. A number of the isolates examined in this study demonstrated a level of
drug resistance indicative of the production of β-lactamase enzymes. Unfortunately,
none of the resistant isolates examined in this study demonstrated any evidence of co-
activity with hop extracts
To determine the potential mode of action of the hop extract and the antibiotics alone
and in combination, scanning electron microscopy was used. One of the limiting
factors of SEM is the fixing and dehydration steps. This severe process can adversely
affect the structure of the bacterium and even destroy intact cells. This was a major
concern and for this reason the method utilised a short (30 seconds) contact time with
100 % alcohol to avoid dehydrating the cells.
Another problem that can be encountered when using SEM is to ensure that enough
field of view are examined to ensure that the images seen are representative of the
entire sample. Each image presented in this project is representative of a minimum of
25 separate images (all images are available in the appendix in CD form).

193
Firstly the structures of M. smegmatis 8159, the surrogate organism of M. tuberculosis
and the clinical isolate M. abscessus 10332 (chosen because it showed the most
promising interactions between hop extracts and antibiotics) were compared. No
obvious evidence of any cell damage (cell destruction, pitting) due to the fixing process
was observed in any of the bacteria visualised.
The two bacteria appeared to differ in size in that the mean length of M. smegmatis
was approximately 1 µm while M. abscessus was approximately 2 µm. Examination of
the bacterial surface revealed a rough, crenulated surface which presumably is
evidence of the waxy coat which is known to surround these bacteria (Ryan et al.,
2004)
Exposure to a sub-inhibitory concentration of Citra hop extract (0.3125 % v/v) had a
noticeable effect on the surface of the bacteria in that it became much smoother and
the cells were visibly pitted. Previous studies to identify the mechanism of
antimicrobial action of hop extracts have found that it was due to changes in the
permeability of the cell wall or membrane (Simpson and Smith, 1992; Teuber and
Schmalreck, 1973) with subsequent inhibition of respiration and of DNA and RNA
synthesis (Behr and Vogel, 2009). It may be the case that the hop extract exerts both of
these properties; firstly by breaking down the waxy outer layer of the cell wall which
secondly allows the compounds to access the cell and disrupt cellular mechanisms.
Indeed the intrinsic resistance of mycobacteria to antibiotics has been linked to the
impermeability of the mycolic acid containing cell wall which is responsible for the
bacterium’s natural resistance to antibiotics such as tetracycline, fluoroquinolones and
aminoglycosides.

194
Exposure of M. abscessus to ciprofloxacin and imipenem and its effect on cell wall
structure was next investigated. In the case of ciprofloxacin, the apparent waxy cell
surface was lost and the cells were noticeably larger (approx. 3-4 µm) and as was seen
following exposure to hop extract, visibly pitted. These differences may be due to the
antibiotic inhibiting the action of DNA gyrase and thereby preventing cell division and
cell surface differentiation.
A similar effect was noticed after the bacteria had been exposed to imipenem. The
bacteria had a much smoother surface than the untreated control. Imipenem is known
to interact with penicillin binding proteins involved in cell wall biosynthesis which may
explain the effect on cell surface morphology (Chambers et al., 1995).
Exposure of the bacterium to a combination of hop extract and ciprofloxacin at the
concentrations identified as being synergistic in the checkerboard assay resulted in a
marked reduction in whole bacterial cells. This was surprising given that the mode of
action of ciprofloxacin is to inhibit bacterial DNA synthesis. At this moment in time
there is no reasonable explanation of this phenomenon. Exposure of the bacterium to
a combination of hop extract and imipenem, at the concentrations identified as being
synergistic, had a similar effect on cellular morphology, in that the majority of bacteria
were lysed.
It has been reported that several hop compounds, namely the alpha and beta acids
(Orhan et al., 2005a) and xanthohumol (Stevens and Page, 2004), have antimicrobial
effects and demonstrate coactivity with several antimicrobials (Natarajan et al., 2008).
In the case of imipenem, both the hop extracts and the antibiotic have been shown to
act on the cell wall of the bacterium by inhibiting efflux pump mechanisms.

195
In conclusion, this chapter demonstrates that the Citra hop extract contains
compounds capable of inactivating multidrug resistant clinical isolates of M. abscessus.
It has also been shown that the extract contains compounds which enhance the
activity of the antibiotics imipenem and ciprofloxacin; the mechanisms by which this
enhancement is achieved and the identity of the compounds responsible has yet to be
determined. Electron microscopy studies suggest that these compounds affect the cell
wall of the bacterium in a manner which when give together result in the destruction
of the bacterium.
These encouraging results suggest that further research is merited to identify the hop
derived compounds responsible for these effects with a view to developing next
generation therapeutics for the treatment of drug resistant mycobacterium such as M.
tuberculosis.

196
Chapter 6
General Discussion, Conclusions and Future work
197
6.0 General Discussion
Bacterial resistance to antibiotics is a worldwide problem; indeed It is estimated that
almost one third of the world’s population is infected with M. tuberculosis of these
approximately 10% of cases are resistant to first line antibiotics (Murray et al., 2014)
The current cost of $1.5 billion required to bring a new antibiotic from the benchtop to
the market, coupled with the velocity of bacterial resistance has led to a lack of novel
antibiotics over the last 20 years. Due to this, current research into plant derived drug
discovery has seen resurgence. Indeed, over 50% of the drugs used today are derived
from natural products, and recent evidence suggests that as the general public are
being made aware of the decline of antibiotics, natural therapeutics are becoming
more accepted.
One such natural product which has been utilised for its antibacterial activity for
hundreds of years is the hop plant. Beer was originally produced without the addition
of hops. However, it was observed that during summer months ‘unhopped’ beer did
not last as long as its hopped counterpart due to bacterial contamination. As a
consequence the popularity of hopped beer increased (Sumner 1988). During the mid-
19th century, drinking water was heavily contaminated by faecal pathogens due to
poor sanitary arrangements. Beer was considered a safer drink due to the fact that
bacteria present were reduced due to a combination of boiling and the presence of
hop derived antimicrobial compounds (Sumner 1988).
The majority of research to date has been focused on characterising the antimicrobial
activity of hops against Gram positive bacteria such as lactobacillus which represent
the principal spoilage agents of beer (Ahn et al., 2007; Sagdic et al., 2003). Surprisingly
little attention has been paid to determine if these plants contain compounds that
have inhibitory activity against clinically important bacteria such as Mycobacterium.
This thesis sought to characterise the antibacterial activity of hops and their extracts
against a range of medically important Gram negative and positive bacteria;
Escherichia coli, Staphylococcus aureus and Mycobacteria.

198
Due to the pathogenicity of M. tuberculosis and its slow rate of growth on laboratory
media two simulant organisms: M.smegmatis and M. bovis BCG were used. Both
organisms have been shown to have similar sensitivities to antibiotics compared to M.
tuberculosis (Chaturvedi et al., 2007b; Tyagi and Sharma, 2002). M. smegmatis and M.
bovis both grow at a higher rate than M. tuberculosis and due to their lack of virulence
can be handled within a category II laboratory.
To determine the antibacterial activity of individual hop varieties an extraction process
was developed which mirrored that used during the brewing process. It was found that
the degree of maceration, extraction temperature and time influenced the inhibitory
activity of the crude extract. Furthermore, by increasing the time that machine
macerated hop material was exposed to 100 °C, the antibacterial activity was
increased.
The effect of heat on the antibacterial activity of the hop extracts is likely to have been
the consequence of two processes: energy drive release of compounds from plant
material into the aqueous solution and the isomerisation of released compounds such
as the alpha and beta acids. Isomerisation of these compounds due to heating has
been shown to increase the antibacterial activity of hop extracts. This was further
shown by the fact that when heated at room temperature (25 °C) there was little or no
antimicrobial effect. Prolonged heating of the extracts resulted in a loss of activity.
Increasing the time of heating increases isomerisation, and concurrently causes
thermal degradation. It has been suggested that prolonged heating could have an
adverse effect on the antibacterial activity (Jaskula-Goiris, 2010)
In this study two agar based screening methods were used to determine the
antibacterial activity of 50 hop variants. A broth based micro dilution method had
been considered. However, progress using this approach was inadequate due to the
inherent turbidity of the hop extracts following heating (Zgoda and Porter, 2001)

199
While the zone of inhibition assay proved to be a useful tool with which to screen the
activity of multiple hop extracts it lacked sensitivity. For this reason, an agar
incorporation assay was developed which allowed for the determination of the
minimum inhibitory and bactericidal concentrations (Roberts 1998). Using this assay it
was found that all of the hop variants demonstrated an inhibitory effect against all of
the test bacteria with the exception of Escherichia coli. Gram negative organisms such
as E.coli are often resistant to antibiotic substances due to the nature of their cell wall,
as such natural products rarely have an inhibitory effect against these organisms
(Yadav et al., 2012).
As has been hypothesised previously, an investigation into the correlation between
alpha and beta acid content of a particular hop variant and its antibacterial activity was
undertaken. No statistically significant correlation was observed. This was surprising
given that the hop alpha and beta acids have been reported to be antibacterial (In
Acworth et al., 2012). I hypothesise that other compounds in the hop extract are
responsible for the observed antibacterial activity. Hops have been shown to contain
over 800 compounds some of which may be directly antibacterial or act in a synergistic
manner to enhance the activity of other antibacterial compounds (Barbara Jaskula-
Goiris, 2010; Cornelison, J.M., 2008).
The results suggest that the antimicrobial activity demonstrated by the hop variants
was not due to a single component but was more likely due to a mixture of
components acting in a synergistic manner; the individual components were next
investigated.
To identify the antibacterial compounds present in the hop extracts an extraction and
identification system based on a combination of solvent extract and thin layer
chromatography (TLC) was developed. The technique was modified by overlaying the
separated compounds on the TLC plate with a layer of M. smegmatis. Following
incubation the plate was stained and for the presence of viable bacteria and any spots
of non-staining were taken to indicate the presence of antibacterial compounds.

200
Using this approach it was observed that the Citra hop variant (the variant with the
greatest antibacterial activity: (Chapter 3) had the greatest number of antimicrobial
spots, whilst the Galena variant (the least antimicrobial: Chapter 3) had the least
number of antimicrobial spots. These results support the methodology used in Chapter
3 which ranked the hops based on their antimicrobial activity and shows that the TLC
overlay method was a reliable means of determining antimicrobial activity.
A limitation of this approach is that it separates compounds on the basis of their
polarity, and as a consequence separated spots may contain a mixture of antimicrobial
and non -antimicrobial components of similar polarity. Based on the information
gained from Chapter 3 the Citra and Galena hop variants were selected for further
analysis. To further enhance the separation of compounds, column chromatography
was used.
The advantage of column chromatography in comparison to TLC was that a greater
quantity hop extract could be separated and as a consequence higher yields of
components of interest could be achieved. It is recognised that it’s possible for more
than one compound to be present of equal polarity in a single spot and that
conventional techniques could not separate them.
To identify the active components of the Citra and Galena spots selected based on
antimicrobial activity; both were analysed using mass spectrometry to elucidate the
compounds present. The compounds: adhumulone, lupulone, colupulone, adlupulone
and epicatechin were found to have similar masses to those extracted from the hop
extracts. There were differences in the isolation of these compounds from both
variants which suggested that their presence has an effect on the antimicrobial
activity.
The bioassay guided extraction technique failed to identify all of the antibacterial
compounds that are known to be present in hops. The most notable missing
compound was the antibacterial polyphenol, Xanthohumol which has been isolated
by others from this plant and is known to be active against mycobacteria (Acworth et
al., 2012; Ceh et al., 2007; Stevens and Page, 2004).

201
Further analysis was conducted to screen for the presence of XN via ultra-pressure
liquid chromatography which is an approach that has been used for a number of years
to identify natural product derived compounds (Acworth et al., 2012; Ahuja and
Rasmussen, 2011; Baker et al., 2008). Comparison of the crude extracts of the Citra
and Galena hop variants confirmed the presence of known antibacterial compounds
humulone and lupulone. Xanthohumol was also identified, it may have been the case
that this polyphenol was at a low concentration when separated from the hop extract
and therefore was missed during the initial screening process.
The presence of a new compound was detected and isolated from the antibacterial
fraction of the Citra hop variant; however it was found that this compound was not
itself antimicrobial. Although not singularly antimicrobial, as with many plant extracts,
compounds within an antimicrobial mixture are often synergised or potentiated by
each other. It is hypothesised that this is the case. However, more research is needed
to investigate the synergies between this compound and others from the extract.
By using several different methods of characterisation it was possible to gain an insight
into the constituents responsible for the antimicrobial activity of the extracts.
Natural product derived compounds have been successfully used to potentiate the
activity of antibiotics. As bacterial resistance increases, antibiotics are used at ever
increasing concentrations to the point where they are no longer efficacious and could
produce harmful side effects. A synergistic combination of antibiotics and a natural
product not only decreased the efficacious concentration but due to multiple
mechanisms of action, substantially decreases the likelihood of bacterial resistance
(Ahn et al., 2007; Jenkins and Cooper, 2012; Mossa et al., 2004; Shami et al., 2013).

202
Mycobacterium abscessus is a clinically relevant multidrug resistant organism which
has been shown to be intrinsically resistant to many first line antibiotics (Nessar et al.,
2012). To determine if hop extract contained compounds which potentiated the
activity of antibiotics the ability of the extract alone and in combination with
antibiotics to target clinical isolates of M. abscessus was investigated. In recent years
this fast growing non-tuberculosis mycobacterium and opportunistic pathogen has
emerged as a major burden to patients with cystic fibrosis (Cullen et al., 2000).
Variants have developed high level resistance to commonly prescribed antibiotics
which has resulted in the pathogen being described as an emerging antibiotic
nightmare (Nessar et al., 2012).
To investigate the potential synergistic activity between antibiotics and hops the
previously isolated hop compounds; (humulone; lupulone and xanthohumol) were
assayed against 8 clinical isolated of M. abscessus. Surprisingly, no synergistic effect
was observed.
As previously stated, antibacterial activity of hops is often as a result of a combination
of separate compounds. Therefore, the interaction between the whole crude extract
and antibiotics against clinical isolates of M. abscessus was characterised. To
determine the nature of these interactions three methods were employed.
Using the previously developed zone of inhibition assay, a positive coaction between
the Citra crude hop extract and the following antibiotics; imipenem and ciprofloxacin,
was identified. In no case was antagonism observed. To confirm these results, an agar
incorporation assay was used. For this, a sub MIC concentration of hop extract was
incorporated into the agar and an E-test strip of the antibiotic was placed on the
surface of an M. abscessus inoculated agar plate. As there is no standard regimen for
identifying a synergistic effect using this method, a threefold decrease in the MIC when
in combination with a sub-inhibitory concentration of hop extract indicated a positive
co action.

203
This method gave a quantifiable result as decreases in the MIC value could be
measured and thus were less subjective than relying on visualising the shape of the
interaction of zones of inhibition as in the previous method. While the two methods
agreed with regards the co-action between the hop extract and imipenem and
ciprofloxacin, no change in the MIC against any organism when the hop extract was
assayed alongside pyrazinamide, rifampicin and ethambutol.
As no co-activity had been observed from pyrazinamide, rifampicin and ethambutol,
the antibiotics ciprofloxacin and imipenem were assayed using the checkerboard
method. The checkerboard method is recognised as the old standard in characterising
antibiotic synergy and allows the classification of the interaction between the
antibiotics: imipenem and ciprofloxacin and the Citra crude hop extracts into the
following groups; synergistic, additive, indifferent or antagonistic (Hall et al., 1983a;
Orhan et al., 2005b).
For imipenem a synergistic interaction with the Citra hop extract against strain 10332;
an additive effect against strain 9568 and an indifferent effect against 11490 was
observed. These results differed from those seen with the other methods which
reported coactivity in each case. The results obtained for the interaction between
ciprofloxacin and hop extract also differed from the earlier assays in that an additive
effect against strain 10332 was observed. Whilst against strains 9568 and 11490 the
interaction showed an indifferent effect.
Taken together these results suggest that the hop extract contains compounds which
are capable of inhibiting the growth of mycobacteria and of enhancing the activity of
the cell wall damaging antibiotic imipenem.
The activity against antibiotic resistant strains suggested that the hop extract
contained compounds whose antimicrobial mode or modes of action differed from
that of the antibiotics assayed in this study. It is known that certain hop constituents
such as humulone can degrade the cell wall of Gram positive organisms (Cornelison,
2008) and therefore it was hypothesised that this compound could act synergistically
with other cell wall damaging antibiotics such as imipenem.

204
To determine if the hop extract damaged the architecture of the cell wall of the
Mycobacteria, selected bacteria were exposed to hop extract alone, and in
combination with antibiotics and examined the effect on the structure of M. abscessus
10332 by using scanning electron microscopy.
Exposure of M. abscessus 10322 to a sub-inhibitory concentration of hop extract
changed the topography of the cell wall from a rough to a smooth surface. It also
caused the cells to pit. One of the mechanisms of antimicrobial action of hop extracts
is thought to be due to changes in the permeability of the cell wall and membrane
(Simpson and Smith, 1992; Teuber and Schmalreck, 1973) which leads to the
subsequent inhibition of respiration and of DNA and RNA synthesis (Behr and Vogel,
2009). These images support the idea that exposure to hop derived compounds can
alter cell wall structure.
Exposure of the test bacteria to imipenem and ciprofloxacin also affected the cell
surface in a similar manner. In the case of ciprofloxacin this result was surprising in
that this antibiotic does not target the cell wall but rather interferes with the activity of
DNA gyrase which in turn inhibits the uncoiling of DNA gene expression. Indeed
following exposure to the ciprofloxacin the individual bacterial cells were noticeably
larger (approx. 3-4 µm); as was also the case with the imipenem exposed cells.
The exposure of the bacteria to both hop extract and ciprofloxacin, at the synergistic
concentration identified in the checkerboard assay, appeared to cause no additional
morphological changes to those seen when the bacteria were treated with
ciprofloxacin alone. Interestingly, a marked reduction in the number of intact bacterial
cells suggested that the combination of treatment had breached the cell wall.
A similar effect was also observed between the hop extract and imipenem. This
destructive interaction is perhaps not surprising given that both agents are known to
act on the cell wall of the bacterium (Vaughan et al., 2005).

205
6.1 Conclusions
The overall aim of this research was to identify hop derived compounds which had the
potential to be developed as drugs capable of treating antibiotic resistant strains of
mycobacteria. Using M. smegmatis, a fast growing simulant for M. tuberculosis, as a
screening tool it was found that hop varieties differed markedly in their ability to
inhibit bacterial growth. Subsequent studies showed that the most active hop variant,
Citra, was also able to inhibit the growth of clinical isolates of M. abscessus, a known
pathogen of humans. Of particular interest in the context of multi-drug resistant
mycobacteria was the fact that the Citra hop extract was equally effective against
sensitive and drug resistant isolates of M. abscessus suggesting that its mode of action
differed from that of the ciprofloxacin and imipenem.
Whilst the study identified the presence of previously described antibacterial
compounds with activity against mycobacteria it failed to identify any new
antimicrobial compounds. This could be due to the fact that there are no new
compounds to find or that the methods lacked the required sensitivity and specificity
to detect their presence.
Combined, the developed bioassay guided methods were able to detect the presence
of known antimicrobial compounds; whilst the detection of these compounds was
limited by the concentration of the compound and the concentration of bacteria; the
methodology was found to be successful in identifying differences between the hop
variants.
Whilst novel pure compounds were found to have no synergistic activity with
antibiotics, synergistic activity of the crude hop extract with imipenem against M.
abscessus raises the possibility that once identified; mixtures of pure compounds could
be used to potentiate the activity of antibiotics against drug resistant isolates of
mycobacterium.

206
6.2 Future work
This research highlights the possibility of the hop plant to successfully be used as an
antibacterial agent and as such raises several possibilities for further research.
Firstly, the hop variants should be analysed against more clinical isolates of drug
resistant M. abscessus and M. tuberculosis. Tubercculosis is going to become a major
healthcare concern worldwide over the next decade and as such the development of
novel antibiotics with differing modes of action or the ability to potentiate the activity
of redundant antibiotics should be of prime concern.
It would be interesting to separate as many compounds as possible from the hop
extract and testing different combinations of these to try and identify synergistic
combinations. By using HPLC or associated techniques to identify individual
components it may be the case that a new class of antimicrobials could be identified
which may not be specific to hops but may be wide ranging in nature.
Of course M. tuberculosis is not the only drug resistant organism, species such as
MRSA and C. difficle are a common hospital acquired infection and it would be
interesting to repeat the synergy assays with antibiotics such as methicillin or
metronidazole to identify other synergistic combinations.
Following the results of this research, it would be interesting to examine the
potentiation of intravenous antibiotics used for the treatment of M. abscessus
infection by hop extracts or hop compounds.

207
7.0 References
Abreu, A.C., McBain, A.J., Simões, M., 2012. Plants as sources of new antimicrobials and resistance-modifying agents. Nat. Prod. Rep. 29, 1007-21. doi:10.1039/c2np20035j
Acar, J.F., 2000. Antibiotic synergy and antagonism Med. Clin. North Am. 84, 1391–1406. doi:10.1016/S0025-7125(05)70294-7
Acworth, I., Ullucci, P., Thomas, D., 2012. Determination of isoxanthohumol, xanthohumol, bitter acids, and trans and cis-iso- alpha acids by HPLC with UV and EC detection. Planta Med 78, PJ3. doi:10.1055/s-0032-1321163
Acworth, I., Ullucci, P., Thomas, D., 2012. Determination of isoxanthohumol, xanthohumol, bitter acids, and trans and cis-iso- alpha acids by HPLC with UV and EC detection. Planta Med. 78. doi:10.1055/s-0032-1321163
Adams, D.O., Hamilton, T.., 1992. Molecular basis of macrophage activation, diversity and its orignis. The Macrophage 75–114.
Ahmad, I., Aqil, F. (Eds.), 2009. New strategies combating bacterial infection. Wiley-Blackwell, Weinheim.
Ahn, J., Grün, I.U., Mustapha, A., 2007. Effects of plant extracts on microbial growth, color change, and lipid oxidation in cooked beef. Food Microbiol. 24, 7–14. doi:10.1016/j.fm.2006.04.006
Ahuja, S., Rasmussen, H., 2011. HPLC Method Development for Pharmaceuticals. Academic Press.
Akira, S., Uematsu, S., Takeuchi, O., 2006. Pathogen Recognition and Innate Immunity. Cell 124, 783–801. doi:10.1016/j.cell.2006.02.015
Alanis, A.J., 2005. Resistance to Antibiotics: Are We in the Post-Antibiotic Era? Arch. Med. Res., Infectious Diseases: Revisiting Past Problems and Addressing Future Challenges Infectious Diseases: Revisiting Past Problems and Addressing Future Challenges 36, 697–705. doi:10.1016/j.arcmed.2005.06.009
Al Jarad, N., Demertzis, P., Jones, D.J., Barnes, N.C., Rudd, R.M., Gaya, H., Wedzicha, J.A., Hughes, D.T., Empey, D.W., 1996. Comparison of characteristics of patients and treatment outcome for pulmonary non-tuberculous mycobacterial infection and pulmonary tuberculosis. Thorax 51, 137–139.
Almaguer, C., Schönberger, C., Gastl, M., Arendt, E.K., Becker, T., 2014. Humulus lupulus – a story that begs to be told. A review. J. Inst. Brew. 120, 289–314. doi:10.1002/jib.160
Andersen, N.H., 1969. Preparative thin-layer and column chromatography of prostaglandins. J. Lipid Res. 10, 316–319.
Archer, G.L., 1998. Staphylococcus aureus: A Well-Armed Pathogen. Clin. Infect. Dis. 26, 1179–1181. doi:10.1086/520289
Arnold, J.P., 2005. Origin and history of beer and brewing: from prehistoric times to the beginning of brewing science and technology ; a critical essay. Reprint Edition by BeerBooks, Cleveland, Ohio.
Avent, M.L., Rogers, B.A., Cheng, A.C., Paterson, D.L., 2011. Current use of aminoglycosides: indications, pharmacokinetics and monitoring for toxicity. Intern. Med. J. 41, 441–449. doi:10.1111/j.1445-5994.2011.02452.x
Bajaj, Y.P.S., 1989. Medicinal and Aromatic Plants II. Springer Berlin Heidelberg, Berlin, Heidelberg.

208
Baker, G.A., Danenhower, T.M., Force, L.J., Petersen, K.J., Betts, T.A., 2008. HPLC Analysis of α- and β-Acids in Hops. J. Chem. Educ. 85, 954. doi:10.1021/ed085p954
Jaskula-Goiris, G.A., 2010. Hop α-acids isomerisation and utilisation: an experimental review. Cerevisia 35, 57–70. doi:10.1016/j.cervis.2010.09.004
Barth, H.J., Klinke, C., Schmidt, C., 1994. The hop atlas: the history and geography of the cultivated plant. Joh. Barth, Nuremberg, Germany.
Behr, J., Vogel, R.F., 2009. Mechanisms of Hop Inhibition: Hop Ionophores. J. Agric. Food Chem. 57, 6074–6081. doi:10.1021/jf900847y
Bérdy, J., 2012. Thoughts and facts about antibiotics: Where we are now and where we are heading. J. Antibiot. (Tokyo) 65, 385–395. doi:10.1038/ja.2012.27
Best, C.A., Best, T.J., 2009. Mycobacterium smegmatis Infection of the hand 4, 165–166. doi:10.1007/s11552-008-9147-6
Beutler, J.A., 2009. Natural Products as a Foundation for Drug Discovery, in: Enna, S.J., Williams, M., Barret, J.F., Ferkany, J.W., Kenakin, T., Porsolt, R.D. (Eds.), Current Protocols in Pharmacology. John Wiley & Sons, Inc., Hoboken, NJ, USA.
Beveridge, T., 2001. Use of the Gram stain in microbiology. Biotech. Histochem. 76, 111–118. doi:10.1080/bih.76.3.111.118
Bhandari, P.R., 1964. Identification of flavonoids in hops (humulus lupulus linne) by thin-layer chromatography. J. Chromatogr. A 16, 130–135. doi:10.1016/S0021-9673(01)82447-X
Black, J.G., 2004. Microbiology: principles and explorations. John Wiley, Hoboken, NJ. Borris, R.P., 1996. Natural products research: perspectives from a major
pharmaceutical company. J. Ethnopharmacol. 51, 29–38. Brennan, P.J., 2003. Structure, function, and biogenesis of the cell wall of
Mycobacterium tuberculosis. Tuberculosis, Proceedings from the 4th World Congress on Tuberculosis 83, 91–97. doi:10.1016/S1472-9792(02)00089-6
Brewmaster, 2014. American Brewmaster [WWW Document]. Am. Brewmaster. URL http://www.americanbrewmaster.com/Hop-Pellets (accessed 12.16.14).
Brosch, R., Gordon, S.V., Marmiesse, M., Brodin, P., Buchrieser, C., Eiglmeier, K., Garnier, T., Gutierrez, C., Hewinson, G., Kremer, K., Parsons, L.M., Pym, A.S., Samper, S., Soolingen, D. van, Cole, S.T., 2002. A new evolutionary scenario for the Mycobacterium tuberculosis complex. Proc. Natl. Acad. Sci. 99, 3684–3689. doi:10.1073/pnas.052548299
Brown-Elliott, B.A., Nash, K.A., Wallace, R.J., 2012. Antimicrobial Susceptibility Testing, Drug Resistance Mechanisms, and Therapy of Infections with Nontuberculous Mycobacteria. Clin. Microbiol. Rev. 25, 545–582. doi:10.1128/CMR.05030-11
Bundesinstitut fur Arzneimittel und Medizinprodukte (Germany), 1998. The complete German Commission E monographs. American Botanical Council ; Integrative Medicine Communications, Austin, Texas : Boston.
Butler, M.S., Cooper, M.A., 2011. Antibiotics in the clinical pipeline in 2011. J. Antibiot. (Tokyo) 64, 413–425. doi:10.1038/ja.2011.44
Caballero, I., Agut, M., Armentia, A., Blanco, C.A., 2009. Importance of tetrahydroiso alpha-acids to the microbiological stability of beer. J. AOAC Int. 92, 1160–1164.
Carel, C., Nukdee, K., Cantaloube, S., Bonne, M., Diagne, C.T., Laval, F., Daffé, M., Zerbib, D., 2014. Mycobacterium tuberculosis Proteins Involved in Mycolic Acid Synthesis and Transport Localize Dynamically to the Old Growing Pole and Septum. PLoS ONE 9, e97148. doi:10.1371/journal.pone.0097148

209
Ceh, B., Kac, M., Abram, V., 2007. Relationships between xanthohumol and polyphenol content in hop leaves and hop cones with regard to water supply and cultivar. Int. J. Mol. Sci. 8, 989–1000.
Centers for Disease Control and Prevention (CDC), 2006. Emergence of Mycobacterium tuberculosis with extensive resistance to second-line drugs--worldwide, 2000-2004. MMWR Morb. Mortal. Wkly. Rep. 55, 301–305.
Ceslova, L., Holcapek, M, M, F., Drstickova, J, L, M., 2009. Characterisation of prenylflavonoids and hop bitter acids invarious classes of czech beers and hop extracts using high performance liquid chromatography-mass spectrometry. J. Chromatogr. A 7249–7257.
Chadwick, L.R., Pauli, G.F., Farnsworth, N.R., 2006. The pharmacognosy of Humulus lupulus L. (hops) with an emphasis on estrogenic properties. Phytomedicine 13, 119–131. doi:10.1016/j.phymed.2004.07.006
Chambers, H.F., Moreau, D., Yajko, D., Miick, C., Wagner, C., Hackbarth, C., Kocagoz, S., Rosenberg, E., Hadley, W.K., Nikaido, H., 1995. Can penicillins and other beta-lactam antibiotics be used to treat tuberculosis? Antimicrob. Agents Chemother. 39, 2620–2624.
Chaturvedi, V., Dwivedi, N., Tripathi, R.P., Sinha, S., 2007a. Evaluation of Mycobacterium smegmatis as a possible surrogate screen for selecting molecules active against multi-drug resistant Mycobacterium tuberculosis. J. Gen. Appl. Microbiol. 53, 333–337.
Chaturvedi, V., Dwivedi, N., Tripathi, R.P., Sinha, S., 2007b. Evaluation of Mycobacterium smegmatis as a possible surrogate screen for selecting molecules active against multi-drug resistant Mycobacterium tuberculosis. J. Gen. Appl. Microbiol. 53, 333–337. doi:10.2323/jgam.53.333
Chin, L.S., Raynor, M.C., Wei, X., Chen, H.Q., Li, L., 2001. Hrs interacts with sorting nexin 1 and regulates degradation of epidermal growth factor receptor. J. Biol. Chem. 276, 7069–7078. doi:10.1074/jbc.M004129200
Coates, A.R., Halls, G., Hu, Y., 2011. Novel classes of antibiotics or more of the same? Br. J. Pharmacol. 163, 184–194. doi:10.1111/j.1476-5381.2011.01250.x
Coates, A.R.M., Hu, Y., 2007. Novel approaches to developing new antibiotics for bacterial infections. Br. J. Pharmacol. 152, 1147–1154. doi:10.1038/sj.bjp.0707432
Cohen, J., 1988. Statistical power analysis for the behavioral sciences, 2nd ed. ed. L. Erlbaum Associates, Hillsdale, N.J.
Cohn, D.L., Bustreo, F., Raviglione, M.C., 1997. Drug-resistant tuberculosis: review of the worldwide situation and the WHO/IUATLD global surveillance project. Clin. Infect. Dis. 24, S121–S130.
Colegate, S.M., Molyneux, R.J., 2007. Bioactive Natural Products: Detection, Isolation, and Structural Determination, Second Edition. CRC Press.
Cole, S.T., 2002. Comparative and functional genomics of the Mycobacterium tuberculosis complex. Microbiology 148, 2919–2928.
Cole, S.T., Brosch, R., Parkhill, J., Garnier, T., Churcher, C., Harris, D., Gordon, S.V., Eiglmeier, K., Gas, S., Barry, C.E., Tekaia, F., Badcock, K., Basham, D., Brown, D., Chillingworth, T., Connor, R., Davies, R., Devlin, K., Feltwell, T., Gentles, S., Hamlin, N., Holroyd, S., Hornsby, T., Jagels, K., Krogh, A., McLean, J., Moule, S., Murphy, L., Oliver, K., Osborne, J., Quail, M.A., Rajandream, M.-A., Rogers, J., Rutter, S., Seeger, K., Skelton, J., Squares, R., Squares, S., Sulston, J.E., Taylor, K., Whitehead, S., Barrell, B.G., 1998. Deciphering the biology of

210
Mycobacterium tuberculosis from the complete genome sequence. Nature 393, 537–544. doi:10.1038/31159
Conly, J., 1998. Controlling antibiotic resistance by quelling the epidemic of overuse and misuse of antibiotics. Can. Fam. Physician 44, 1769–1784.
Cook, J.L., 2010. Nontuberculous mycobacteria: opportunistic environmental pathogens for predisposed hosts. Br. Med. Bull. 96, 45–59. doi:10.1093/bmb/ldq035
Cornelison, J.M., 2008. Evaluation of Hops (humulus lupulus) as an antimicrobial in broiler diets. Int. J. Poult. Sci. 5, 134–136.
Cowan, M.M., 1999. Plant products as antimicrobial agents. Clin. Microbiol. Rev. 12, 564–582.
Cragg, G.M., Newman, D.J., 2013. Natural products: A continuing source of novel drug leads. Biochim. Biophys. Acta BBA - Gen. Subj. 1830, 3670–3695. doi:10.1016/j.bbagen.2013.02.008
Cseke, L.J., Kaufman, P.B., Warber, S., Duke, J.A., Brielmann, H.L., 2010. Natural Products from Plants. CRC Press.
Cullen, A.R., Cannon, C.L., Mark, E.J., Colin, A.A., 2000. Mycobacterium abscessus Infection in Cystic Fibrosis. Am. J. Respir. Crit. Care Med. 161, 641–645. doi:10.1164/ajrccm.161.2.9903062
De Keukeleire, D., 2000. Fundamentals of beer and hop chemistry. Quimica Nova 23, 108–112.
De Keukeleire, D., Verzele, M., 1971. The absolute configuration of the isohumulones and the humulinic acids. Tetrahedron 27, 4939–4945. doi:10.1016/S0040-4020(01)98199-2
De Keyser, E., De Keyser, F., De Baets, F., 2014. Tuberculin skin test versus interferon-gamma release assays for the diagnosis of tuberculosis infection. Acta Clin. Belg. 69, 358–366. doi:10.1179/2295333714Y.0000000043
Delcour, A.H., 2009. Outer membrane permeability and antibiotic resistance. Biochim. Biophys. Acta 1794, 808–816. doi:10.1016/j.bbapap.2008.11.005
Dias, D.A., Urban, S., Roessner, U., 2012. A Historical Overview of Natural Products in Drug Discovery. Metabolites 2, 303–336. doi:10.3390/metabo2020303
Dooley, K.E., Obuku, E.A., Durakovic, N., Belitsky, V., Mitnick, C., Nuermberger, E.L., on behalf of the Efficacy Subgroup, RESIST-TB, 2013. World Health Organization Group 5 Drugs for the Treatment of drug-resistant tuberculosis: unclear efficacy or untapped potential? J. Infect. Dis. 207, 1352–1358. doi:10.1093/infdis/jis460
Dorman, H.J., Deans, S.G., 2000. Antimicrobial agents from plants: antibacterial activity of plant volatile oils. J. Appl. Microbiol. 88, 308–316.
Dostal, S., Richter, E., Harmsen, D., 2003. Concise Guide to Mycobacteria and Their Molecular Differentiation. BoD – Books on Demand. Germany.
Drlica, K., Zhao, X., 1997. DNA gyrase, topoisomerase IV, and the 4-quinolones. Microbiol. Mol. Biol. Rev. MMBR 61, 377–392.
Duffy, G., Garvey, P., McDowell, D.A., 2008. Verocytotoxigenic E. Coli. John Wiley & Sons.
Elion, G.B., Singer, S., Hitchings, G.H., 1954 Antagonists of nucleic acid cerivatives VIII. Synergism in combinations of biochemically related antimetabolites. J. Biol. Chem. 208, 477–488.
Eloff, J.N., 1998. Which extractant should be used for the screening and isolation of antimicrobial components from plants? J. Ethnopharmacol. 60, 1–8. doi:10.1016/S0378-8741(97)00123-2

211
Enright, M.C., 2003. The evolution of a resistant pathogen – the case of MRSA. Curr. Opin. Pharmacol. 3, 474–479. doi:10.1016/S1471-4892(03)00109-7
Erdmann, W.F., 1951. Phytoncides. I. Lupulone and humulone; their antibacterial action and their use in tuberculous infections. Pharm. 6, 442–451.
Espinal, M.A., Laszlo, A., Simonsen, L., Boulahbal, F., Kim, S.J., Reniero, A., Hoffner, S., Rieder, H.L., Binkin, N., Dye, C., Williams, R., Raviglione, M.C., 2001. Global Trends in Resistance to Antituberculosis Drugs. N. Engl. J. Med. 344, 1294–1303. doi:10.1056/NEJM200104263441706
Everard, A., Geurts, L., Van Roye, M., Delzenne, N.M., Cani, P.D., 2012. Tetrahydro iso-Alpha Acids from Hops Improve Glucose Homeostasis and Reduce Body Weight Gain and Metabolic Endotoxemia in High-Fat Diet-Fed Mice. PLoS ONE 7, e33858. doi:10.1371/journal.pone.0033858
Fairhurst, R.M., Kubak, B.M., Shpiner, R.B., Levine, M.S., Pegues, D.A., Ardehali, A., 2002. Mycobacterium abscessus empyema in a lung transplant recipient. J. Heart Lung Transplant. 21, 391–394. doi:10.1016/S1053-2498(01)00339-4
Fang, Z., Doig, C., Kenna, D.T., Smittipat, N., Palittapongarnpim, P., Watt, B., Forbes, K.J., 1999. IS6110-Mediated Deletions of Wild-Type Chromosomes of Mycobacterium tuberculosis. J. Bacteriol. 181, 1014–1020.
Ferguson, J.S., Martin, J.L., Azad, A.K., McCarthy, T.R., Kang, P.B., Voelker, D.R., Crouch, E.C., Schlesinger, L.S., 2006. Surfactant Protein D Increases Fusion of Mycobacterium tuberculosis- Containing Phagosomes with Lysosomes in Human Macrophages. Infect. Immun. 74, 7005–7009. doi:10.1128/IAI.01402-06
Ferrari, G., Langen, H., Naito, M., Pieters, J., 1999. A Coat Protein on Phagosomes Involved in the Intracellular Survival of Mycobacteria. Cell 97, 435–447. doi:10.1016/S0092-8674(00)80754-0
Filmer, R., 1982. Hops and hop picking, History in camera. Shire Publications, Aylesbury, Bucks, UK.
Fitzgerald, S.D., Schooley, A.M., Berry, D.E., Kaneene, J.B., 2010. Antimicrobial Susceptibility Testing of Mycobacterium bovis Isolates from Michigan White-Tailed Deer during the 2009 Hunting Season. Vet. Med. Int. 2011, e903683. doi:10.4061/2011/903683
Fleming, A, 1942. In Vitro tests of penicillin potency. Lancet 242, 732–733. Foster, S., Tyler, V.E., 2000. Tyler’s honest herbal: a sensible guide to the use of herbs
and related remedies. Haworth, London. Fratti, R.A., Chua, J., Vergne, I., Deretic, V., 2003. Mycobacterium tuberculosis
glycosylated phosphatidylinositol causes phagosome maturation arrest. Proc. Natl. Acad. Sci. 100, 5437–5442. doi:10.1073/pnas.0737613100
Friedland, G., Churchyard, G.J., Nardell, E., 2007. Tuberculosis and HIV Coinfection: Current State of Knowledge and Research Priorities. J. Infect. Dis. 196, S1–S3. doi:10.1086/518667
Frothingham, R., Hills, H.G., Wilson, K.H., 1994. Extensive DNA sequence conservation throughout the Mycobacterium tuberculosis complex. J. Clin. Microbiol. 32, 1639–1643.
Galagan, J.E., 2014. Genomic insights into tuberculosis. Nat. Rev. Genet. 15, 307–320. doi:10.1038/nrg3664
Gandhi, N.R., Nunn, P., Dheda, K., Schaaf, H.S., Zignol, M., van Soolingen, D., Jensen, P., Bayona, J., 2010. Multidrug-resistant and extensively drug-resistant tuberculosis: a threat to global control of tuberculosis. The Lancet 375, 1830–1843. doi:10.1016/S0140-6736(10)60410-2

212
Gandhi, N.R., Shah, N.S., Andrews, J.R., Vella, V., Moll, A.P., Scott, M., Weissman, D., Marra, C., Lalloo, U.G., Friedland, G.H., 2010. HIV Coinfection in Multidrug- and Extensively Drug-Resistant Tuberculosis Results in High Early Mortality. Am. J. Respir. Crit. Care Med. 181, 80–86. doi:10.1164/rccm.200907-0989OC
García-Villalba, R., Cortacero-Ramírez, S., Segura-Carretero, A., Martín-Lagos Contreras, J.A., Fernández-Gutiérrez, A., 2006. Analysis of Hop Acids and Their Oxidized Derivatives and Iso-α-acids in Beer by Capillary Electrophoresis−Electrospray Ionization Mass Spectrometry. J. Agric. Food Chem. 54, 5400–5409. doi:10.1021/jf060207x
Gerhäuser, C., 2005. Beer constituents as potential cancer chemopreventive agents. Eur. J. Cancer 41, 1941–1954. doi:10.1016/j.ejca.2005.04.012
Gould, I.M., 2009. Antibiotic resistance: the perfect storm. Int. J. Antimicrob. Agents, Focus on Antibiotic Stewardship 34, Supplement 3, S2–S5. doi:10.1016/S0924-8579(09)70549-7
Griffith, D.E., Aksamit, T., Brown-Elliott, B.A., Catanzaro, A., Daley, C., Gordin, F., Holland, S.M., Horsburgh, R., Huitt, G., Iademarco, M.F., Iseman, M., Olivier, K., Ruoss, S., von Reyn, C.F., Wallace, R.J., Winthrop, K., 2007. An Official ATS/IDSA Statement: Diagnosis, Treatment, and Prevention of Nontuberculous Mycobacterial Diseases. Am. J. Respir. Crit. Care Med. 175, 367–416. doi:10.1164/rccm.200604-571ST
Gurib-Fakim, A., 2006. Medicinal plants: traditions of yesterday and drugs of tomorrow. Mol. Aspects Med. 27, 1–93. doi:10.1016/j.mam.2005.07.008
Haas, G.J., Barsoumian, R., 1994. Antimicrobial Activity of Hop Resins. J. Food Prot. 57, 59–61.
Hall, M.J., Middleton, R.F., Westmacott, D., 1983a. The fractional inhibitory concentration (FIC) index as a measure of synergy. J. Antimicrob. Chemother. 11, 427–433. doi:10.1093/jac/11.5.427
Hamburger, M.O., Cordell, G.A., 1987. A Direct Bioautographic Tlc Assay for Compounds Possessing Antibacterial Activity. J. Nat. Prod. 50, 19–22. doi:10.1021/np50049a003
Hammer, K.A., Carson, C.F., Riley, T.V., 1999. Antimicrobial activity of essential oils and other plant extracts. J. Appl. Microbiol. 86, 985–990.
Harada, Y., Chong, Y., Shimono, N., Miyake, N., Uchida, Y., Kadowaki, M., Akashi, K., Shimoda, S., 2014. Nosocomial spread of meticillin-resistant Staphylococcus aureus with -lactam-inducible arbekacin resistance. J. Med. Microbiol. 63, 710–714. doi:10.1099/jmm.0.065276-0
Haseleu, G., Intelmann, D., Hofmann, T., 2009. Structure determination and sensory evaluation of novel bitter compounds formed from β-acids of hop (Humulus lupulus L.) upon wort boiling. Food Chem. 116, 71–81. doi:10.1016/j.foodchem.2009.02.008
Hemaiswarya, S., Kruthiventi, A.K., Doble, M., 2008. Synergism between natural products and antibiotics against infectious diseases. Phytomedicine 15, 639–652. doi:10.1016/j.phymed.2008.06.008
Hieronymus, S., 2012. For the love of hops: the practical guide to aroma, bitterness, and the culture of hops. Brewers Publications, a division of the Brewers Association, Boulder, Colorado.
Hideo, 2007. Molecular Orientation of copeer phenanthroline-phtalocyanine dendrimer thin films by self assembly. Am. Chem. Soc. 40, 27–31.

213
Hornsey, I.S., 2003. A History of Beer and Brewing. Royal Society of Chemistry. Hostettmann, K., Marston, A., Hostettmann, M., 1998. Preparative Chromatography
Techniques Applications in Natural Product Isolation. Springer Berlin Heidelberg,
HPA, 2012. Tuberculosis in the UK: Annual report on tuberculosis surveillance in the UK, 2012.
Imperato, F., 2006. Phytochemistry: advances in research, 2006. Research Signpost, Trivandrum, Kerala, India.
Inderlied, C.B., Kolonoski, P.T., Wu, M., Young, L.S., 1989. Amikacin, ciprofloxacin, and imipenem treatment for disseminated Mycobacterium avium complex infection of beige mice. Antimicrob. Agents Chemother. 33, 176–180.
Iwu, M., Duncan, A.R.,, Okunji, C.O., 1999. New Antimicrobials of Plant Origin: Perspectives on new crops and new uses (ed. J. Janick). ASHS Press, Alexandria, VA, pp. 457–462.
Jackson, M., 1998. Beer. Dorling Kindersley, London. Jaskula, B., Kafarski, P., Aerts, G., De Cooman, L., 2008. A Kinetic Study on the
Isomerization of Hop α-Acids. J. Agric. Food Chem. 56, 6408–6415. doi:10.1021/jf8004965
Jenkins, R.E., Cooper, R., 2012. Synergy between oxacillin and manuka honey sensitizes methicillin-resistant Staphylococcus aureus to oxacillin. J. Antimicrob. Chemother. 67, 1405–1407. doi:10.1093/jac/dks071
Jeon, K., Kwon, O.J., Lee, N.Y., Kim, B.-J., Kook, Y.-H., Lee, S.-H., Park, Y.K., Kim, C.K., Koh, W.-J., 2009. Antibiotic Treatment of Mycobacterium abscessus Lung Disease. Am. J. Respir. Crit. Care Med. 180, 896–902. doi:10.1164/rccm.200905-0704OC
Kagan-Zur, V., 2014. Desert truffles: phylogeny, physiology, distribution and domestication.
Khalil, A.T., Khan, I., Ahmad, K., Khan, Y.A., Khan, M., Khan, M.J., 2013. Synergistic antibacterial effect of honey and Herba Ocimi Basilici against some bacterial pathogens. J. Tradit. Chin. Med. Chung Tsa Chih Ying Wen Pan Spons. -China Assoc. Tradit. Chin. Med. Acad. Tradit. Chin. Med. 33, 810–814.
Khan, A., Sarkar, D., 2008. A simple whole cell based high throughput screening protocol using Mycobacterium bovis BCG for inhibitors against dormant and active tubercle bacilli. J. Microbiol. Methods 73, 62–68. doi:10.1016/j.mimet.2008.01.015
Kim, J., Marshall, M.R., Wei, C., 1995. Antibacterial activity of some essential oil components against five foodborne pathogens. J. Agric. Food Chem. 43, 2839–2845. doi:10.1021/jf00059a013
King, Mike, 2014. Global functional food and nutraceuticals market forecast to surpass revenues of US$221Bn in 2014 [WWW Document]. Food Drink. URL http://www.companiesandmarkets.com/News/Food-and-Drink/Global-functional-food-and-nutraceuticals-market-forecast-to-surpass-revenues-of-US-221Bn-in-2014/NI8777 (accessed 4.2.14).
Koehn, F.E., Carter, G.T., 2005. The evolving role of natural products in drug discovery. Nat. Rev. Drug Discov. 4, 206–220. doi:10.1038/nrd1657
Komada, M., Soriano, P., 1999. Hrs, a FYVE finger protein localized to early endosomes, is implicated in vesicular traffic and required for ventral folding morphogenesis. Genes Dev. 13, 1475–1485.

214
La Bombardi, V.J., Cataldo-Caputzal, L., 1993. Ciprofloxacin susceptibility testing by MIC and disk elution of drug-resistant Mycobacterium tuberculosis and Mycobacterium avium complex. Antimicrob. Agents Chemother. 37, 1556–1557.
Langezaal, C.R., Chandra, A., Scheffer, J.J., 1992. Antimicrobial screening of essential oils and extracts of some Humulus lupulus L. cultivars. Pharm. Weekbl. Sci. 14, 353–356.
Larson, A.E., Yu, R.R.Y., Lee, O.A., Price, S., Haas, G.J., Johnson, E.A., 1996. Antimicrobial activity of hop extracts against Listeria monocytogenes in media and in food. Int. J. Food Microbiol. 33, 195–207. doi:10.1016/0168-1605(96)01155-5
Lawn, S., 2005. Tuberculosis among HIV-infected patients receiving HAART: lo... : AIDS. Clin. Sci. 19, 2109–2116.
Lee, N., Yuen, K.-Y., Kumana, P.C.R., 2003. Clinical Role of β-Lactam/β-Lactamase Inhibitor Combinations. Drugs 63, 1511–1524. doi:10.2165/00003495-200363140-00006
Lewis, K., Ausubel, F.M., 2006. Prospects for plant-derived antibacterials. Nat. Biotechnol. 24, 1504–1507. doi:10.1038/nbt1206-1504
Lewis, W.H., Elvin-Lewis, M.P., 1995. Medicinal Plants as Sources of New Therapeutics. Ann. Mo. Bot. Gard. 82, 16. doi:10.2307/2399976
Lienhardt, C., Vernon, A., Raviglione, M.C., 2010. New drugs and new regimens for the treatment of tuberculosis: review of the drug development pipeline and implications for national programmes: Curr. Opin. Pulm. Med. 1. doi:10.1097/MCP.0b013e328337580c
Madigan, M.T., 2003. Brock biology of microorganisms, 10th ed. ed. Prentice Hall/Pearson Education, Upper Saddle River, NJ.
Mahady, G.B., 2005. Medicinal Plants for the Prevention and Treatment of Bacterial Infections. Curr. Pharm. Des. 11, 2405–2427. doi:10.2174/1381612054367481
Mahady, G.B., 2001. Global Harmonization of Herbal Health Claims. J. Nutr. 131, 1120S–1123S.
Malowicki, M.G., Shellhammer, T.H., 2005b. Isomerization and Degradation Kinetics of Hop ( Humulus lupulus ) Acids in a Model Wort-Boiling System. J. Agric. Food Chem. 53, 4434–4439. doi:10.1021/jf0481296
Martindale, W., Reynolds, J.E.F., Royal Pharmaceutical Society of Great Britain, Council, 1996. The extra pharmacopoeia. Pharmaceutical Press, London.
McChesney, J.D., Venkataraman, S.K., Henri, J.T., 2007. Plant natural products: Back to the future or into extinction? Phytochemistry 68, 2015–2022. doi:10.1016/j.phytochem.2007.04.032
McDermott, W., 1947. Toxicity of streptomycin. Am. J. Med., Symposium on Streptomycin 2, 491–500. doi:10.1016/0002-9343(47)90095-8
McDermott, W., Tompsett, R., 1954. Activation of pyrazinamide and nicotinamide in acidic environments in vitro. Am. Rev. Tuberc. 70, 748–754.
Means, T.K., Wang, S., Lien, E., Yoshimura, A., Golenbock, D.T., Fenton, M.J., 1999. Human Toll-Like Receptors Mediate Cellular Activation by Mycobacterium tuberculosis. J. Immunol. 163, 3920–3927.
Medjahed, H., Gaillard, J.-L., Reyrat, J.-M., 2010. Mycobacterium abscessus: a new player in the mycobacterial field. Trends Microbiol. 18, 117–123. doi:10.1016/j.tim.2009.12.007

215
Meziane-Cherif, D., Courvalin, P., 2014. Antibiotic resistance: To the rescue of old drugs. Nature 510, 477–478. doi:10.1038/510477a
Miglori, G.., 2007. First tuberculosis cases in Italy resistant to all tested drugs. Milligan, S.R., Kalita, J.C., Pocock, V., Van De Kauter, V., Stevens, J.F., Deinzer, M.L.,
Rong, H., De Keukeleire, D., 2000. The Endocrine Activities of 8-Prenylnaringenin and Related Hop (Humulus lupulus L.) Flavonoids. J. Clin. Endocrinol. Metab. 85, 4912–4915. doi:10.1210/jcem.85.12.7168
Mims, C.A., Goering, R.V., 2013. Mims’ medical microbiology. Elsevier/Saunders, [Philadelphia?].
Moerman, D.E., 1996. An analysis of the food plants and drug plants of native North America. J. Ethnopharmacol. 52, 1–22.
Moir, M, 2000. Hops: A millennium review. J. Am. Soc. Brew. Chem. 58, 131–146. Moldoveanu, S.C., David, V., 2002. Sample Preparation in Chromatography. Elsevier. Moore, M., Frerichs, J.B., 1953. An unusual acid-fast infection of the knee with
subcutaneous, abscess-like lesions of the gluteal region; report of a case with a study of the organism, Mycobacterium abscessus, n. sp. J. Invest. Dermatol. 20, 133–169.
Morán-Mendoza, O., Tello-Zavala, M.C., Rivera-Camarillo, M., Ríos-Meza, Y., 2013. Comparison of different methods and times for reading the tuberculin skin test. Int. J. Tuberc. Lung Dis. 17, 1273–1278. doi:10.5588/ijtld.13.0147
Mossa, J.S., El-Feraly, F.S., Muhammad, I., 2004. Antimycobacterial constituents from Juniperus procera, Ferula communis and Plumbago zeylanica and their in vitro synergistic activity with isonicotinic acid hydrazide. Phytother. Res. 18, 934–937. doi:10.1002/ptr.1420
Murray, C.J.L.,et al., 2014. Global, regional, and national incidence and mortality for HIV, tuberculosis, and malaria during 1990-2013: a systematic analysis for the Global Burden of Disease Study 2013. Lancet. doi:10.1016/S0140-6736(14)60844-8
Naber, K.G., Bishop, M.C., Bjerklund-Johansen, T.E., Botto, H., Cek, M., Grabe, M., Lobel, B., Palou, J., Tenke, P., 2006. The management of urinary and male genital tract infections. Eur. Assoc. Urol. Eur. Assoc. Urol. Guidel. Arnh. Druk. Gelderland 1–126.
Nance, (first), Setzer, 2011. Volatile components of aroma hops (Humulus lupulus L.) commonly used in beer brewing. J. Brew. Distill. 2, 16–22.
Narvaez, N., Wang, Y., Xu, Z., Alexander, T., Garden, S., McAllister, T., 2013. Effects of hop varieties on ruminal fermentation and bacterial community in an artificial rumen (rusitec): Effects of hops on fermentation and bacteria in an artificial rumen. J. Sci. Food Agric. 93, 45–52. doi:10.1002/jsfa.5725
Natarajan, P., Katta, S., Andrei, I., Babu Rao Ambati, V., Leonida, M., Haas, G.J., 2008. Positive antibacterial co-action between hop (Humulus lupulus) constituents and selected antibiotics. Phytomedicine 15, 194–201. doi:10.1016/j.phymed.2007.10.008
NCBI, 2014. PubChem, compound search engine. NCBI. Nessar, R., Cambau, E., Reyrat, J.M., Murray, A., Gicquel, B., 2012. Mycobacterium
abscessus: a new antibiotic nightmare. J. Antimicrob. Chemother. dkr578. doi:10.1093/jac/dkr578
Neve, R.A., 1991. Hops. Chapman and Hall, London; New York. Newman, D.J., Cragg, G.M., 2007. Natural Products as Sources of New Drugs over the
Last 25 Years ⊥. J. Nat. Prod. 70, 461–477. doi:10.1021/np068054v

216
Newton, S.M., Lau, C., Wright, C.W., 2000. A review of antimycobacterial natural products. Phytother. Res. PTR 14, 303–322.
Newton, S.M., Lau, C., Wright, C.W., 2000. A review of antimycobacterial natural products. Phytother. Res. 14, 303–322.
Nguyen, L., Pieters, J., 2005. The Trojan horse: survival tactics of pathogenic mycobacteria in macrophages. Trends Cell Biol. 15, 269–276. doi:10.1016/j.tcb.2005.03.009
Niederweis, M., 2003. Mycobacterial porins--new channel proteins in unique outer membranes. Mol. Microbiol. 49, 1167–1177.
North, E., Jackson, M., Lee, R., 2013. New Approaches to Target the Mycolic Acid Biosynthesis Pathway for the Development of Tuberculosis Therapeutics. Curr. Pharm. Des. 20, 4357–4378. doi:10.2174/1381612819666131118203641
Obiang-Obounou, B.W., Jang, Y.P., 2011. Enriching modern pharmacotherapy through synergy assessment for the combination of natural products and synthetic drugs. Arch. Pharm. Res. 34, 1579–1581. doi:10.1007/s12272-011-1000-8
O’Brien, K.S., Blumberg, S., Enanoria, W.T.A., Ackley, S., Sippl-Swezey, N., Lietman, T.M., 2014. Antibiotic Use as a Tragedy of the Commons: A Cross-Sectional Survey. Comput. Math. Methods Med. 2014, e837929. doi:10.1155/2014/837929
O’Hara, M., Kiefer, D., Farrell, K., Kemper, K., 1998. A review of 12 commonly used medicinal herbs. Arch. Fam. Med. 7, 523–536.
O’Neil, J., 2014. Review on Antimicrbial Resistance. Antimcrobial Resistance: Tackling a Crisis for the health and wealth of Nations.
Orhan, G., Bayram, A., Zer, Y., Balci, I., 2005a. Synergy Tests by E Test and Checkerboard Methods of Antimicrobial Combinations against Brucella melitensis. J. Clin. Microbiol. 43, 140–143. doi:10.1128/JCM.43.1.140-143.2005
Orhan, G., Bayram, A., Zer, Y., Balci, I., 2005b. Synergy Tests by E Test and Checkerboard Methods of Antimicrobial Combinations against Brucella melitensis. J. Clin. Microbiol. 43, 140–143. doi:10.1128/JCM.43.1.140-143.2005
Parekh, J., Jadeja, D., Chanda, S., 2005. Efficacy of Aqueous and Methanol Extracts of Some Medicinal Plants for Potential Antibacterial Activity. Turk. J. Biol. 29.
Pauli, G.F., Case, R.J., Inui, T., Wang, Y., Cho, S., Fischer, N.H., Franzblau, S.G., 2005. New perspectives on natural products in TB drug research. Life Sci. 78, 485–494.
Petersen, P.J., Labthavikul, P., Jones, C.H., Bradford, P.A., 2006. In vitro antibacterial activities of tigecycline in combination with other antimicrobial agents determined by chequerboard and time-kill kinetic analysis. J. Antimicrob. Chemother. 57, 573–576. doi:10.1093/jac/dki477
Petrini, B., 2006. Mycobacterium abscessus: an emerging rapid-growing potential pathogen. APMIS 114, 319–328. doi:10.1111/j.1600-0463.2006.apm_390.x
Petrovska, B.B., 2012. Historical review of medicinal plants’ usage. Pharmacogn. Rev. 6, 1–5. doi:10.4103/0973-7847.95849
Peyron, P., Bordier, C., N′Diaye, E.-N., Maridonneau-Parini, I., 2000. Nonopsonic Phagocytosis of Mycobacterium kansasii by Human Neutrophils Depends on Cholesterol and Is Mediated by CR3 Associated with Glycosylphosphatidylinositol-Anchored Proteins. J. Immunol. 165, 5186–5191. doi:10.4049/jimmunol.165.9.5186

217
Pieters, J., McKinney, J., 2013. Preface.Pathogenesis of Mycobacterium tuberculosis and its interaction with the host organism. Curr. Top. Microbiol. Immunol. 374, v–vi.
Poston, T., 2006. BBC NEWS | Business | Brewing up profits in Cumbria [WWW Document]. URL http://news.bbc.co.uk/1/hi/business/5273828.stm (accessed 12.16.11).
Pringle, P., 2013. Experiment Eleven: Deceit and Betrayal in the Discovery of the Cure for Tuberculosis. Bloomsbury Publishing.
Rahalison, L., Hamburger, M., Hostettmann, K., Monod, M., Frenk, E., 1991. A bioautographic agar overlay method for the detection of antifungal compounds from higher plants. Phytochem. Anal. 2, 199–203. doi:10.1002/pca.2800020503
Raiborg, C., Bache, K.G., Gillooly, D.J., Madshus, I.H., Stang, E., Stenmark, H., 2002. Hrs sorts ubiquitinated proteins into clathrin-coated microdomains of early endosomes. Nat. Cell Biol. 4, 394–398. doi:10.1038/ncb791
Rattan, A., Kalia, A., Ahmad, N., 1998. Multidrug-resistant Mycobacterium tuberculosis: molecular perspectives. Emerg. Infect. Dis. 4, 195–209.
Rauter, A.P., Palma, F.B., Justino, J., Araujo, M.E., Santos, S.P., 2002. Natural products in the new millennium: prospects and industrial application.
Raviglione, M.C., Reichman, L.B., Hershfield, E.S. (Eds.), 2006. Reichman and Hershfield’s tuberculosis: a comprehensive, international approach, 3rd ed. ed, Lung biology in health and disease. Informa Healthcare, New York.
Reading, C., Cole, M., 1977. Clavulanic Acid: a Beta-Lactamase-Inhibiting Beta-Lactam from Streptomyces clavuligerus. Antimicrob. Agents Chemother. 11, 852–857. doi:10.1128/AAC.11.5.852
Reed, R.H., 2007. Practical Skills in Biomolecular Sciences. Pearson Education. Reid, R.G., Sarker, S.D., 2012. Isolation of natural products by low-pressure column
chromatography. Methods Mol. Biol. Clifton NJ 864, 155–187. doi:10.1007/978-1-61779-624-1_7
Reusch, W, 2013. Mass spectrometry. Rieder, H.L., Chiang, C.-Y., Gie, R., Enarson, D., Crofton, J., International Union against
Tuberculosis and Lung Disease, Foundation for Teaching Aids at Low Cost (London, E., 2009. Crofton’s clinical tuberculosis.
Ríos, J.L., Recio, M.C., 2005. Medicinal plants and antimicrobial activity. J. Ethnopharmacol., 100th Volume Special Section: Perspectives of Ethnopharmacology 100, 80–84. doi:10.1016/j.jep.2005.04.025
Rios, J.L., Recio, M.C., Villar, A., 1988. Screening methods for natural products with antimicrobial activity: A review of the literature. J. Ethnopharmacol. 23, 127–149. doi:10.1016/0378-8741(88)90001-3
Ritz, N., Tebruegge, M., Connell, T.G., Sievers, A., Robins-Browne, R., Curtis, N., 2009. Susceptibility of Mycobacterium bovis BCG Vaccine Strains to Antituberculous Antibiotics. Antimicrob. Agents Chemother. 53, 316–318. doi:10.1128/AAC.01302-08
Rodloff, A.C., Goldstein, E.J.C., Torres, A., 2006. Two decades of imipenem therapy. J. Antimicrob. Chemother. 58, 916–929. doi:10.1093/jac/dkl354
Rojas, A., Hernandez, L., Pereda-Miranda, R., Mata, R., 1992. Screening for antimicrobial activity of crude drug extracts and pure natural products from Mexican medicinal plants. J. Ethnopharmacol. 35, 275–283. doi:10.1016/0378-8741(92)90025-M

218
Rooney, A., 2009. The story of medicine: from early healing to the miracles of modern medicine. Arcturus, London.
Roth, M.G., 2004. Phosphoinositides in constitutive membrane traffic. Physiol. Rev. 84, 699–730. doi:10.1152/physrev.00033.2003
Rowland, K., 2012. Totally drug-resistant TB emerges in India. Nature. doi:10.1038/nature.2012.9797
Ruddigkeit, L., van Deursen, R., Blum, L.C., Reymond, J.-L., 2012. Enumeration of 166 Billion Organic Small Molecules in the Chemical Universe Database GDB-17. J. Chem. Inf. Model. 52, 2864–2875. doi:10.1021/ci300415d
Ryan, K.J., Ray, C.G., Sherris, J.C. (Eds.), 2004. Sherris medical microbiology: an introduction to infectious diseases, 4th ed. ed. McGraw-Hill, New York.
Sagdic, O., Karahan, A.G., Ozcan, M., Ozkan, G., 2003. Note: Effect of Some Spice Extracts on Bacterial Inhibition. Food Sci. Technol. Int. 9, 353–358. doi:10.1177/1082013203038976
Sakamoto, K., Konings, W.N., 2003a. Beer spoilage bacteria and hop resistance. Int. J. Food Microbiol. 89, 105–124. doi:10.1016/S0168-1605(03)00153-3
Sakamoto, K., Konings, W.N., 2003b. Beer spoilage bacteria and hop resistance. Int. J. Food Microbiol. 89, 105–124. doi:10.1016/S0168-1605(03)00153-3
Sanguinetti, M., Ardito, F., Fiscarelli, E., La Sorda, M., D’Argenio, P., Ricciotti, G., Fadda, G., 2001. Fatal pulmonary infection due to multidrug-resistant Mycobacterium abscessus in a patient with cystic fibrosis. J. Clin. Microbiol. 39, 816–819. doi:10.1128/JCM.39.2.816-819.2001
Schaefer, O., Bohlmann, R., Schleuning, W.-D., Schulze-Forster, K., Hümpel, M., 2005. Development of a Radioimmunoassay for the Quantitative Determination of 8-Prenylnaringenin in Biological Matrices. J. Agric. Food Chem. 53, 2881–2889. doi:10.1021/jf047897u
Schaible, U.E., Sturgill-Koszycki, S., Schlesinger, P.H., Russell, D.G., 1998. Cytokine activation leads to acidification and increases maturation of Mycobacterium avium-containing phagosomes in murine macrophages. J. Immunol. Baltim. Md 1950 160, 1290–1296.
Schorey, J.S., Cooper, A.M., 2003. Macrophage signalling upon mycobacterial infection: the MAP kinases lead the way. Cell. Microbiol. 5, 133–142. doi:10.1046/j.1462-5822.2003.00263.x
Seddon, P., Fidler, K., Raman, S., Wyatt, H., Ruiz, G., Elston, C., Perrin, F., Gyi, K., Bilton, D., Drobniewski, F., Newport, M., 2013. Prevalence of Nontuberculous Mycobacteria in Cystic Fibrosis Clinics, United Kingdom, 2009. Emerg. Infect. Dis. 19, 1128–1130. doi:10.3201/eid1907.120615
Serkani, J.E., Isfahani, B.N., Safaei, H.G., Kermanshahi, R.K., Asghari, G., 2012. Evaluation of the effect of Humulus lupulus alcoholic extract on rifampin-sensitive and resistant isolates of Mycobacterium tuberculosis. Res. Pharm. Sci. 7, 235–242.
Shami, A.-M.M., Philip, K., Muniandy, S., 2013. Synergy of antibacterial and antioxidant activities from crude extracts and peptides of selected plant mixture. BMC Complement. Altern. Med. 13, 360. doi:10.1186/1472-6882-13-360
Sharifa, A.A., Neoh, Y.L., Iswadi, M.I., Khairul, O., Abdul Halim, M., Jamaludin, M., Mohamed Azman, A.B., Hing, H.L., 2008. Effects of methanol, ethanol and aqueous extract of plantago major on gram positive bacteria, gram negative bacteria and yeast. Ann Microsc 8, 42–44.

219
Shen, C., Sofos, J.N., 2008. Antilisterial activity of hops beta acids in broth with or without other antimicrobials. J. Food Sci. 73, M438–442. doi:10.1111/j.1750-3841.2008.00962.x
Shi, W., Zhang, X., Jiang, X., Ruan, H., Barry, C.E., Wang, H., Zhang, W., Zhang, Y., 2011. Pyrazinamide inhibits trans-translation in Mycobacterium tuberculosis: a potential mechanism for shortening the duration of tuberculosis chemotherapy. Science 333, 1630–1632. doi:10.1126/science.1208813
Shui, G., Leong, L.P., 2004. Analysis of polyphenolic antioxidants in star fruit using liquid chromatography and mass spectrometry. J. Chromatogr. A 1022, 67–75. doi:10.1016/j.chroma.2003.09.055
Siddiqui, R.T., Qureshi, J.A., 2014. The prevalence of common mutations in rpsL gene associated with resistance to streptomycin in random and multiple drug resistant isolates of M. tuberculosis from Pakistan. Pak. J. Zool. 46, 1163–1166.
Simmonds, P.L., 1897. Hops; their cultivation, commerce, and uses in various countries. A manual of reference for the grower, dealer, and brewer. [WWW Document]. URL https://archive.org/details/cu31924003329145 (accessed 4.3.14).
Simpson, W.J., Smith, A.R., 1992. Factors affecting antibacterial activity of hop compounds and their derivatives. J. Appl. Bacteriol. 72, 327–334.
Singh, S., Bouzinbi, N., Chaturvedi, V., Godreuil, S., Kremer, L., 2014. In vitro evaluation of a new drug combination against clinical isolates belonging to the Mycobacterium abscessus complex. Clin. Microbiol. Infect. Off. Publ. Eur. Soc. Clin. Microbiol. Infect. Dis. doi:10.1111/1469-0691.12780
Siragusa, G.R., Haas, G.J., Matthews, P.D., Smith, R.J., Buhr, R.J., Dale, N.M., Wise, M.G., 2008. Antimicrobial activity of lupulone against Clostridium perfringens in the chicken intestinal tract jejunum and caecum. J. Antimicrob. Chemother. 61, 853–858. doi:10.1093/jac/dkn024
Solomkin, J.S., Mazuski, J.E., Bradley, J.S., Rodvold, K.A., Goldstein, E.J.C., Baron, E.J., O’Neill, P.J., Chow, A.W., Dellinger, E.P., Eachempati, S.R., Gorbach, S., Hilfiker, M., May, A.K., Nathens, A.B., Sawyer, R.G., Bartlett, J.G., 2010. Diagnosis and Management of Complicated Intra-abdominal Infection in Adults and Children: Guidelines by the Surgical Infection Society and the Infectious Diseases Society of America. Clin. Infect. Dis. 50, 133–164. doi:10.1086/649554
Stavri, M., Schneider, R., O’Donnell, G., Lechner, D., Bucar, F., Gibbons, S., 2004. The antimycobacterial components of hops (Humulus lupulus) and their dereplication. Phytother. Res. 18, 774–776. doi:10.1002/ptr.1527
Stead, W.W., Eisenach, K.D., Cave, M.D., Beggs, M.L., Templeton, G.L., Thoen, C.O., Bates, J.H., 1995. When Did Mycobacterium tuberculosis Infection First Occur in The New World?: An Important Question with Public Health Implications. Am. J. Respir. Crit. Care Med. 151, 1267–1268. doi:10.1164/ajrccm/151.4.1267
Stermitz, F.R., Lorenz, P., Tawara, J.N., Zenewicz, L.A., Lewis, K., 2000. Synergy in a medicinal plant: Antimicrobial action of berberine potentiated by 5′-methoxyhydnocarpin, a multidrug pump inhibitor. Proc. Natl. Acad. Sci. 97, 1433–1437. doi:10.1073/pnas.030540597
Stevens, J.F., Page, J.E., 2004. Xanthohumol and related prenylflavonoids from hops and beer: to your good health! Phytochemistry 65, 1317–1330. doi:10.1016/j.phytochem.2004.04.025
Stewart, G.R., Robertson, B.D., Young, D.B., 2003. Tuberculosis: a problem with persistence. Nat. Rev. Microbiol. 1, 97–105. doi:10.1038/nrmicro749

220
Stout, R.D., 1993. Macrophage activation by T cells: cognate and non-cognate signals. Curr. Opin. Immunol. 5, 398–403. doi:10.1016/0952-7915(93)90059-2
Sturgill-Koszycki, S., Schaible, U.E., Russell, D.G., 1996. Mycobacterium-containing phagosomes are accessible to early endosomes and reflect a transitional state in normal phagosome biogenesis. EMBO J. 15, 6960–6968.
Sumner, J., 2000. The natural history of medicinal plants. Timber Press, Portland, Or. Tailleux, L., Neyrolles, O., Honoré-Bouakline, S., Perret, E., Sanchez, F., Abastado, J.-P.,
Lagrange, P.H., Gluckman, J.C., Rosenzwajg, M., Herrmann, J.-L., 2003. Constrained intracellular survival of Mycobacterium tuberculosis in human dendritic cells. J. Immunol. Baltim. Md 1950 170, 1939–1948.
Taneja, N.K., Tyagi, J.S., 2007. Resazurin reduction assays for screening of anti-tubercular compounds against dormant and actively growing Mycobacterium tuberculosis, Mycobacterium bovis BCG and Mycobacterium smegmatis. J. Antimicrob. Chemother. 60, 288–293. doi:10.1093/jac/dkm207
Tan, J.L., Khang, T.F., Ngeow, Y.F., Choo, S.W., 2013. A phylogenomic approach to bacterial subspecies classification: proof of concept in Mycobacterium abscessus. BMC Genomics 14, 879. doi:10.1186/1471-2164-14-879
Tanoira, R.P., Sánchez-Patán, F., Girón, A.J., Roblas, R.F., Esteban, J., Guerrero, M.L.F., 2014. Tolerance and safety of intravenous streptomycin therapy in patients with tuberculosis. Infection 42, 597–598. doi:10.1007/s15010-014-0621-5
Tarshis, M.S., Weed, W.A., 1953. Lack of significant in vitro sensitivity of Mycobacterium tuberculosis to pyrazinamide on three different solid media. Am. Rev. Tuberc. 67, 391–395.
Taylor, A.W., Barofsky, E., Kennedy, J.A., Deinzer, M.L., 2003. Hop (Humulus lupulus L.) Proanthocyanidins Characterized by Mass Spectrometry, Acid Catalysis, and Gel Permeation Chromatography. J. Agric. Food Chem. 51, 4101–4110. doi:10.1021/jf0340409
Teuber, M., Schmalreck, A.F., 1973. Membrane leakage in Bacillus subtilis 168 induced by the hop constituents lupulone, humulone, isohumulone and humulinic acid. Arch. Für Mikrobiol. 94, 159–171.
Thomson, R.M., Yew, W.-W., 2009. When and how to treat pulmonary non-tuberculous mycobacterial diseases. Respirology 14, 12–26. doi:10.1111/j.1440-1843.2008.01408.x
Tyagi, J.S., Sharma, D., 2002. Mycobacterium smegmatis and tuberculosis. Trends Microbiol. 10, 68–69. doi:10.1016/S0966-842X(01)02296-X
Udwadia, Z.F., Amale, R.A., Ajbani, K.K., Rodrigues, C., 2012. Totally Drug-Resistant Tuberculosis in India. Clin. Infect. Dis. 54, 579–581. doi:10.1093/cid/cir889
Van Cleemput, M., Cattoor, K., De Bosscher, K., Haegeman, G., De Keukeleire, D., Heyerick, A., 2009a. Hop ( Humulus lupulus )-Derived Bitter Acids as Multipotent Bioactive Compounds. J. Nat. Prod. 72, 1220–1230. doi:10.1021/np800740m
Van Cleemput, M., Heyerick, A., Libert, C., Swerts, K., Philippé, J., De Keukeleire, D., Haegeman, G., De Bosscher, K., 2009b. Hop bitter acids efficiently block inflammation independent of GRalpha, PPARalpha, or PPARgamma. Mol. Nutr. Food Res. 53, 1143–1155. doi:10.1002/mnfr.200800493
Van Embden, J.D.A., van Gorkom, T., Kremer, K., Jansen, R., van der Zeijst, B.A.M., Schouls, L.M., 2000. Genetic Variation and Evolutionary Origin of the Direct Repeat Locus of Mycobacterium tuberculosis Complex Bacteria. J. Bacteriol. 182, 2393–2401.

221
Varela, N.P., Friendship, R., Dewey, C., Valdivieso, A., 2008. Comparison of Agar Dilution and E-test for antimicrobial susceptibility testing of Campylobacter coli isolates recovered from 80 Ontario swine farms. Can. J. Vet. Res. 72, 168–174.
Vaughan, A., O’Sullivan, T., Van Sinderen, D., 2005. Enhancing the Microbiological Stability of Malt and Beer — A Review. J. Inst. Brew. 111, 355–371. doi:10.1002/j.2050-0416.2005.tb00221.x
Velasco-Velázquez, M.A., Barrera, D., González-Arenas, A., Rosales, C., Agramonte-Hevia, J., 2003. Macrophage—Mycobacterium tuberculosis interactions: role of complement receptor 3. Microb. Pathog. 35, 125–131. doi:10.1016/S0882-4010(03)00099-8
Velayati, A.A., Farnia, P., Masjedi, M.R., Ibrahim, T.A., Tabarsi, P., Haroun, R.Z., Kuan, H.O., Ghanavi, J., Farnia, P., Varahram, M., 2009. Totally drug-resistant tuberculosis strains: evidence of adaptation at the cellular level. Eur. Respir. J. 34, 1202–1203. doi:10.1183/09031936.00081909
Vergne, I., Chua, J., Deretic, V., 2003. Mycobacterium tuberculosis phagosome maturation arrest: selective targeting of PI3P-dependent membrane trafficking. Traffic Cph. Den. 4, 600–606.
Verzele, M., Keukeleire, D.D., 2013. Chemistry and Analysis of Hop and Beer Bitter Acids. Elsevier.
Vieira, O.V., Harrison, R.E., Scott, C.C., Stenmark, H., Alexander, D., Liu, J., Gruenberg, J., Schreiber, A.D., Grinstein, S., 2004. Acquisition of Hrs, an essential component of phagosomal maturation, is impaired by mycobacteria. Mol. Cell. Biol. 24, 4593–4604.
Vu, H., Pham, N.B., Quinn, R.J., 2008. Direct Screening of Natural Product Extracts Using Mass Spectrometry. J. Biomol. Screen. 13, 265–275. doi:10.1177/1087057108315739
Wagner, H., Ulrich-Merzenich, G., 2009. Synergy research: Approaching a new generation of phytopharmaceuticals. Phytomedicine 16, 97–110. doi:10.1016/j.phymed.2008.12.018
Wallace, R.J., Brown, B.A., Onyi, G.O., 1992. Skin, Soft Tissue, and Bone Infections Due to Mycobacterium chelonae chelonae: Importance of Prior Corticosteroid Therapy, Frequency of Disseminated Infections, and Resistance to Oral Antimicrobials Other than Clarithromycin. J. Infect. Dis. 166, 405–412. doi:10.1093/infdis/166.2.405
Wang, B.-E., 2000. Treatment of chronic liver diseases with traditional Chinese medicine. J. Gastroenterol. Hepatol. 15, E67–E70. doi:10.1046/j.1440-1746.2000.02100.x
Wanger, A., Mills, K., Nelson, P.W., Rex, J.H., 1995. Comparison of Etest and National Committee for Clinical Laboratory Standards broth macrodilution method for antifungal susceptibility testing: enhanced ability to detect amphotericin B-resistant Candida isolates. Antimicrob. Agents Chemother. 39, 2520–2522.
Wang, L., Weller, C.L., 2006. Recent advances in extraction of nutraceuticals from plants. Trends Food Sci. Technol. 17, 300–312. doi:10.1016/j.tifs.2005.12.004
White, R.L., Burgess, D.S., Manduru, M., Bosso, J.A., 1996. Comparison of three different in vitro methods of detecting synergy: time-kill, checkerboard, and E test. Antimicrob. Agents Chemother. 40, 1914–1918.
Wilson, D.G., 1975. PLANT REMAINS FROM THE GRAVENEY BOAT AND THE EARLY HISTORY OF HUMULUS LUPULUS L. IN W. EUROPE. New Phytol. 75, 627–648. doi:10.1111/j.1469-8137.1975.tb01429.x

222
Woodske, D., 2012. Hop variety handbook. Wright, G.D., 2012. Antibiotics: A New Hope. Chem. Biol. 19, 3–10.
doi:10.1016/j.chembiol.2011.10.019 Wurmser, A.E., Gary, J.D., Emr, S.D., 1999. Phosphoinositide 3-Kinases and Their FYVE
Domain-containing Effectors as Regulators of Vacuolar/Lysosomal Membrane Trafficking Pathways. J. Biol. Chem. 274, 9129–9132. doi:10.1074/jbc.274.14.9129
Yadav, N., Yadav, E., Yadav, J.S., 2012. Antimicrobial activity of selected natural products against Gram-positive, Gram-negative and Acid-fast bacterial pathogens. Altern. Med. Stud. 2. doi:10.4081/ams.2012.e13
Zanoli, P., Zavatti, M., 2008. Pharmacognostic and pharmacological profile of Humulus lupulus L. J. Ethnopharmacol. 116, 383–396. doi:10.1016/j.jep.2008.01.011
Zeković, Z., Pekić, B., Lepojević, Ž., Petrović, L., 1994. Chromatography in our investigations of camomile (Matricaria chamomilla L.). Chromatographia 39, 587–590. doi:10.1007/BF02268284
Zgoda, J.R., Porter, J.R., 2001. A Convenient Microdilution Method for Screening Natural Products Against Bacteria and Fungi. Pharm. Biol. 39, 221–225. doi:10.1076/phbi.39.3.221.5934
Zhang, Y., Heym, B., Allen, B., Young, D., Cole, S., 1992. The catalase—peroxidase gene and isoniazid resistance of Mycobacterium tuberculosis. Nature 358, 591–593. doi:10.1038/358591a0
Zheng, C.J., Yoo, J.-S., Lee, T.-G., Cho, H.-Y., Kim, Y.-H., Kim, W.-G., 2005. Fatty acid synthesis is a target for antibacterial activity of unsaturated fatty acids. FEBS Lett. 579, 5157–5162. doi:10.1016/j.febslet.2005.08.028
Zivanovic, L., Zigic, G., Zecevic, M., 2006. Investigation of chromatographic conditions for the separation of ofloxacin and its degradation products. J. Chromatogr. A, 29th International Symposium on High Performance Liquid Phase Separations and Related Techniques Part I 1119, 224–230. doi:10.1016/j.chroma.2006.02.029
Zuo, G.-Y., Li, Y., Wang, G.-C., Li, Z.-S., Han, J., 2014. Synergistic effects of berberines with antibiotics on clinical multi-drug resistant isolates of methicillin-resistant Staphylococcus aureus (MRSA). Med. Chem. Res. 23, 2439–2444. doi:10.1007/s00044-013-0844-5

223
8.0 Appendices
Attached CD with Scanning Electron microscopy images