The Aftermarket Performance of Initial Public Offerings in Latin America
20
J. of Multi. Fin. Manag. 14 (2004) 47–66 The aftermarket performance of initial public offerings in Canada Maher Kooli a,∗ , Jean-Marc Suret b a Caisse de dép ˆ ot et placement du Québec, Research Department, Depositors’ Accounts Management, 1981 Avenue McGill College, 6th Floor, Montreal, Qué., Canada H3A 3C7 b School of Accountancy, Université Laval, Laval, Que., Canada Received 19 March 2002; accepted 3 December 2002 Abstract This paper attempts to fulfil the great need for the Canadian evidence on long-run performance of initial public offerings (IPOs). We examine the performance for up to 5 years after listing of over 445 Canadian IPOs from 1991 to 1998. The sample underperforms in the long run. However, the observed pattern is not always statistically significant, and depends on the methodology used and on the weighting schemes. Several behavioral explanations for the poor subsequent performance of Canadian issuing firms are explored. The divergence of opinions, hypothesis does not apply in explaining the aftermarket performance of Canadian IPOs, our evidence is however consistent with the hot issue market story. We also find some evidence of the fads hypothesis to explain the long-run behavior of large IPOs. © 2003 Published by Elsevier B.V. JEL classification: G32 Keywords: Initial public offerings; Underpricing; Aftermarket performance 1. Introduction A large volume of researches demonstrate that investors purchasing initial public offerings (IPOs) of common stocks earn a large positive abnormal return in the early aftermarket period. Such IPO underpricing is widely documented and appears to be internationally This paper is a revised version of Maher Kooli’s (Universit´ e Laval, Canada) Ph.D. thesis. ∗ Corresponding author. Tel.: +1-514-987-3000x2082; fax: +1-514-987-0422. E-mail address: [email protected] (M. Kooli). 1042-444X/$ – see front matter © 2003 Published by Elsevier B.V. doi:10.1016/S1042-444X(03)00038-0
-
Upload
independent -
Category
Documents
-
view
0 -
download
0
Transcript of The Aftermarket Performance of Initial Public Offerings in Latin America

J. of Multi. Fin. Manag. 14 (2004) 47–66
The aftermarket performance of initial publicofferings in Canada�
Maher Koolia,∗, Jean-Marc Suretb
a Caisse de dépˆot et placement du Québec, Research Department, Depositors’ Accounts Management,1981 Avenue McGill College, 6th Floor, Montreal, Qué., Canada H3A 3C7
b School of Accountancy, Université Laval, Laval, Que., Canada
Received 19 March 2002; accepted 3 December 2002
Abstract
This paper attempts to fulfil the great need for the Canadian evidence on long-run performance ofinitial public offerings (IPOs). We examine the performance for up to 5 years after listing of over445 Canadian IPOs from 1991 to 1998. The sample underperforms in the long run. However, theobserved pattern is not always statistically significant, and depends on the methodology used andon the weighting schemes. Several behavioral explanations for the poor subsequent performanceof Canadian issuing firms are explored. The divergence of opinions, hypothesis does not apply inexplaining the aftermarket performance of Canadian IPOs, our evidence is however consistent withthe hot issue market story. We also find some evidence of the fads hypothesis to explain the long-runbehavior of large IPOs.© 2003 Published by Elsevier B.V.
JEL classification:G32
Keywords:Initial public offerings; Underpricing; Aftermarket performance
1. Introduction
A large volume of researches demonstrate that investors purchasing initial public offerings(IPOs) of common stocks earn a large positive abnormal return in the early aftermarketperiod. Such IPO underpricing is widely documented and appears to be internationally
� This paper is a revised version of Maher Kooli’s (Universite Laval, Canada) Ph.D. thesis.∗ Corresponding author. Tel.:+1-514-987-3000x2082; fax:+1-514-987-0422.E-mail address:[email protected] (M. Kooli).
1042-444X/$ – see front matter © 2003 Published by Elsevier B.V.doi:10.1016/S1042-444X(03)00038-0
48 M. Kooli, J.-M. Suret / J. of Multi. Fin. Manag. 14 (2004) 47–66
omnipresent. Researchers also document that IPOs tend to underperform in the long run.For example,Ritter (1991)shows that US IPOs significantly underperform in the 3 yearsfollowing the offering. However, the international evidence on the long-run performance ofIPOs is less extensive than the one on underpricing, and less unanimously conclusive.
The study of the long-run performance of IPOs is important for several reasons. First,asRitter (1991)asserts, the existence of long-run systematic price patterns raises questionsconcerning aftermarket efficiency. Second, from an investor’s perspective, if the long-rununderperformance anomaly exists, active trading strategies may take place. In other words,investors fortunate enough to be allocated shares at the IPO should sell them almost im-mediately as the trading is started. Third, there is considerable variation in the measures ofabnormal returns and the statistical tests that empirical researchers use to detect long-runabnormal stock returns. Given these issues, the long-run performance would be the mostcontroversial area of IPO research, and there are still many unanswered questions. For ex-ample, in their recent review of IPO activity, pricing and allocations,Ritter and Welch(2002) note that: “Still, we hope to see further work to tell us which subsamples areparticularly prone to poor post-IPO performance, both in the United States and in othercountries”.
To date, there is no comprehensive study on the Canadian market.1 The Canadian contextis relevant for several reasons. First, Canadian IPO markets are relatively smaller than thosein the US, which makes the extrapolation of the US results on small markets inappropriate.2
Second, Canadian institutional investors are also much smaller on average than those in theUS, and they tend to be less aggressive and more passive in the process of going publicin comparison with their US counterparts. This could mean that Canadian institutionalinvestors have less ability to influence the pricing of IPOs in Canada. Third, there is someresearch evidence3 that Canadian markets are more efficient and less costly for raisingequity than the US markets. This could mean that Canadian IPO markets are more accuratein establishing valuations and pricing of new stock issues than the US markets. Thus, furtherresearch on the Canadian IPO markets seems warranted.
The purpose of this paper is to investigate the aftermarket performance of Canadian IPOsfrom 1991 to 1998. This is the first study that considers the four Canadian stock marketsthat are different in terms of characteristics of IPOs firms and prevailing regulations. Assuch, it represents a more comprehensive sample than just focusing on either one of thefour stock exchanges (seeJog, 1997). Moreover, we intend to give some explanations forthe documented long-run aftermarket performance.
We find that Canadian IPOs issued between 1991 and 1998 underperform in the longrun. However, our results should be interpreted cautiously. The observed pattern is not
1 Jog’s (1997)Canadian study focuses solely on successfully completed IPOs listed on the Toronto StockExchange (TSE) and provides limited explanations for the existence of the aftermarket underperformance ofIPOs. Although the TSE is Canada’s largest exchange, it could be inappropriate to assume that results pertainingto the TSE necessarily apply to other Canadian public equity markets.
2 Ritter (2001)reports average gross proceeds of US$ 63.55 million for a sample of 3527 US IPOs over theperiod of 1991 to 1998, while we report average gross proceeds of US$ 23.4 million for a sample of 445 CanadianIPOs over the same period.
3 SeeWilliams and Shutt (2000).
M. Kooli, J.-M. Suret / J. of Multi. Fin. Manag. 14 (2004) 47–66 49
always statistically significant, and depends on the methodology and the weighting schemesused. For example, we find that, using a value-weighted (VW) cumulative abnormal re-turns, Canadian IPOs underperform significantly after the first 5 years. (Loughran andRitter (1995)report similar findings for US IPOs over the period 1970–1990.) However,using buy-and-hold abnormal returns (BHARs), we find that the statistical significance ofunderperformance is less evident, while a calendar-time analysis shows that our samplesignificantly underperforms in the long run only on equally weighted (EW) basis. We haveattempted to shed some light on the reasons for this underperformance. Our evidence isconsistent with a market where firms take advantage of windows of opportunity by issuingequity during hot issues periods.
The remainder of this paper is organized as follows.Section 2reviews some of theinternational literature on IPO stock market performances.Section 3describes the dataand the methodology used in the empirical investigation.Section 4presents evidence onaftermarket underperformance.Section 5summarizes the findings and provides concludingremarks.
2. Aftermarket performance: theoretical and methodological reasons
2.1. Prior research
Table 1summarizes the contrasted results of previous empirical studies for the long-runperformance of IPOs.Paudyal et al. (1998)report that the performance of IPOs in Malaysiais not different from the performance of the market portfolio.Buser and Chan (1987)reportpositive risk-adjusted returns (11.2%) in the 2 years after listing, for their sample of 1078NASDAQ stocks for the period 1981–1985.Kiymaz (2000)also finds that Turkish IPOsoutperformed the market in the long-run during the 1990–1995 period.Kim et al. (1995)find that Korean IPOs outperform seasoned firms with similar characteristics.
Negative aftermarket returns for IPOs have been reported byRitter (1991), Aggarwal andRivoli (1990), Loughran and Ritter (1995), Levis (1993), Aggarwal et al. (1993), andFirth(1997). Brav and Gompers (1997)compare the performance of venture and non-venturecapital-backed IPOs to various benchmarks and find that matching IPOs to similar sizeand book-to-market firms eliminated the underperformance reported byLoughran andRitter (1995). They also suggest that we should look more broadly at the types of firmsthat underperform and not consider IPO firms as a distinct group. Studies in Australia (Finnand Higham, 1988), Germany (Uhler, 1989), and Hong Kong (McGuinness, 1992) all re-port negative but non-significant aftermarket performance. Clearly, there are internationalvariations in observed performances and further research seems warranted.
2.2. Reasons for the aftermarket underperformance
Theoretical explanations for the long-run underperformance of IPOs are less abundant.Aggarwal and Rivoli (1990)postulate that the aftermarket is not immediately efficient invaluing newly issued securities and that the abnormal returns earned by IPO investors arethe result of a temporary overvaluation by investors in early trading. This is consistent with

50 M. Kooli, J.-M. Suret / J. of Multi. Fin. Manag. 14 (2004) 47–66
Table 1International evidence on the aftermarket performance of IPOs
Country Reference Number ofIPOs
Issuing years Aftermarketperformance (%)
Australia Lee et al. (1996) 266 1976–1989 −46.5Austria Aussenegg (1997) 57 1965–1993 −27.3Brazil Aggarwal et al. (1993) 62 1980–1990 −47.0
Canada Jog (1997)a 130 1971–1992 −35.15 and−43.66Our analysis 445 1991–1998 −16.86
Chile Aggarwal et al. (1993) 28 1982–1990 −23.7Finland Keloharju (1993) 79 1984–1989 −21.1Germany Ljungqvist (1997) 145 1970–1990 −12.1Japan Cai and Wei (1997) 172 1971–1990 −27.0Korea Kim et al. (1995) 99 1985–1988 +2.0New Zealand Firth (1997) 143 1979–1987 −10.00Sweden Loughran et al. (1994) 162 1980–1990 +1.2United Kingdom Levis (1993) 712 1980–1988 −8.1
United States Loughran and Ritter (1995) 4753 1970–1990 −20.0Brav et al. (2000)b 4622 1975–1992 −44.2,−31.1,−28.4
and+6.6
The aftermarket performance is measured from the first closing market price following the formula:
100×[
1 + RIPO,t
1 + Rm,t
]− 100
whereRIPO,t is the average total return on the IPOs from the market price until the earlier of the delisting date or3 years;Rm,t is the average of either the market return or matching firm returns over the same interval.
a Jog used two reference portfolios: TSE 300 Index and TSE-Western Index.b Brav et al. (2000)uses five reference portfolios: S&P500, NASDAQ Composite, CRSP VW, CRSP EW, and
size and book-to-market.
the “impresario” hypothesis or the fads4 hypothesis (Shiller, 1990; DeBondt and Thaler,1985), which predicts that the greater the initial return is at the IPO date, the greater is thedegree of subsequent correction of overpricing by investors and the lower are the subsequentreturns.
Miller (1977) advances the divergence of opinion hypothesis to explain the underper-formance of IPOs. He suggests that investors who are most optimistic about an IPO willbe those who will buy it. If there is a great deal of uncertainty about the value of an IPO,there will be differences of opinion between optimistic and pessimistic investors. As theinformation increases with time, the divergence of expectations decreases and the pricesare consequently adjusted downwards. This explanation implies a negative relation betweenthe ex ante uncertainty5 and the aftermarket performance.
A third explanation is given by the windows of opportunity hypothesis which predicts thatfirms going public in high volume periods are more likely to be overvalued in comparison
4 A fad is defined as a temporary overvaluation caused by investors’ over-optimism.5 The ex ante uncertainty can be proxied by size, given the fact that there would be a great deal of uncertainty
for small firms with little or no operating history.

M. Kooli, J.-M. Suret / J. of Multi. Fin. Manag. 14 (2004) 47–66 51
with other IPOs. This explanation implies that the high-volume periods should be associatedwith the lowest long-run returns.6
Overall, we conclude that investor’s sentiment towards an IPO is an important factor inthe underperformance of this IPO, if such phenomenon even exists.
3. Data and methodology
3.1. Sample
Our original sample numbered 563 IPOs7 listed in the Toronto Stock Exchange (TSE),Montreal Stock Exchange, Vancouver Stock Exchange, Alberta Stock Exchange (ASE) andover-the-counter (CDN). The primary source of data is the “Record of New Issues: AnnualReport by theFinancial Post Datagroup” which reports offering dates, offering prices,issue size and the name of the underwriter. Long-term total returns are computed from dailyreturns data collected from Datastream. Of these 563 IPOs, 118 IPOs had to be droppedbecause they only trade over-the-counter and Datastream does not cover these stocks. Theresulting final sample comprises of 445 IPOs8 for the period between January 1991 andDecember 1998.
Table 2presents the distribution of the sample by year, both in terms of the number ofoffers and the gross proceeds. Further inspection ofTable 2reveals that the sample showsclear evidence of clustering. For example, 321 of the 445 sample offers (72.16%) occurredin 1993, 1994, 1996 and 1997. 62.84% (CAN$ 9212.3 million of the CAN$ 14,657 milliontotal) of the aggregate gross proceeds in the sample were raised in these 4 years alone, andthe rest (37.16% or CAN$ 5445.6 million of the CAN$ 14657 million total) was raised bythe 124 IPOs that occurred over 1991, 1992, 1995 and 1998. This result is consistent withthe notion of the hot issues market (Ritter, 1984). We therefore consider the years 1993,1994, 1996 and 1997 as hot periods, and 1991, 1992, 1995, 1998 as cold periods.
Table 3presents the distribution of the sample by size. Further inspection ofTable 3showsthat small IPOs (gross proceeds< CAN$ 1 million) represent 26.74% of the sample, whilelarge IPOs (gross proceeds> CAN$ 50 million) represent 12.58% of the sample. IPOs withgross proceeds between CAN$ 10 million and 50 million represent 31.80% of the sample.
6 Indeed, this pattern exists in the US.Loughran and Ritter (1995)argue that for IPOs, the rapid prior growthof many of the young companies makes it easy to justify high valuations by investors who want to believe thatthey have discovered the next Microsoft.
7 Units, closed-end funds, real estate investment trusts and Junior Capital Pool (JCP) companies are excludedfrom our sample. Unit offerings are excluded because we were not able to separate the value of offerings’ com-ponents (usually common stock with warrants). The JCP program was introduced in Alberta, and is similar to theblind pool programs that were implemented in the 1980s in the US to help start-up firms raise equity. JCP firmshave a limit of 18 months in which to complete a major transaction, otherwise they are delisted by the AlbertaStock Exchange. In this paper, we decide to exclude JCP IPOs from our sample, because Datastream does notcarry researchable historic price information for all JCP firms.
8 Of the 445 IPOs in our final sample, 63 were delisted within 5 years of the offer date. Of these, 5 were delistedwithin 1 year, 7 were delisted within 2 years, 12 were delisted within 3 years, and an additional 15 were delistedwithin 4 years of the offer date.

52 M. Kooli, J.-M. Suret / J. of Multi. Fin. Manag. 14 (2004) 47–66
Table 2Distribution of IPOs by year
Year Number ofIPOs
Gross proceeds(CAN$ million)
1991 11 1044.61992 25 1437.471993 78 2451.41994 70 2203.71995 41 442.81996 85 1754.41997 88 3297.831998 47 2025.6
Total 445 14657.9
The sample consists of 445 Canadian IPOs by firms subsequently listed on the Toronto Stock Exchange, MontrealStock Exchange, Vancouver Stock Exchange and Alberta Stock Exchange from January 1991 through December1998. We excluded the Junior Capital Pool IPOs.
Table 3Distribution of IPOs by size
Province Number ofIPOs
Gross proceeds(CAN$ million)
Gross proceeds< CAN$ 1 million 119 55.18CAN$ 1 million < gross proceeds≤ CAN$ 10 million 116 366.95CAN$ 10 million< gross proceeds≤ CAN$ 50 million 146 3433.77Gross proceeds > CAN$ 50 million 56 9663.78
Full sample 445 14657.9
The sample consists of 445 Canadian IPOs by firms subsequently listed on the Toronto Stock Exchange, MontrealStock Exchange, Vancouver Stock Exchange and Alberta Stock Exchange from January 1991 through December1998. We excluded the Junior Capital Pool IPOs.
Approximately, 23.5% of the aggregate gross proceeds in the sample were raised by theseIPOs.
Table 4presents the distribution of the sample by the industry, both in terms of thenumber of offers and the gross proceeds.Table 4reveals that the sample also covers differentindustries. Oil and gas, and mining represent 156 out of 445 IPOs (35% of the sample).About 22% (CAN$ 3248.65 million of the CAN$ 14,657.9 million total) of the aggregategross proceeds in the sample were raised by these industries.
3.2. Methodology
Given that various problems with both the measurement of abnormal returns and the spec-ification of tests for non-zero abnormal returns have recently been highlighted,9 we intendto use three measures to evaluate the long-run performance of IPOs: cumulative average
9 SeeBrav et al. (2000), Lyon et al. (1999), andMitchell and Stafford (2000).

M. Kooli, J.-M. Suret / J. of Multi. Fin. Manag. 14 (2004) 47–66 53
Table 4Distribution of IPOs by industry
Industry or sector Number ofIPOs
Gross proceeds(CAN$ million)
Mining 102 1644.1Oil and gas 54 1604.55Production 84 3927.98Technology 86 2838.06Financial services 18 590.27Real estate 11 537.8Biotech/pharmaceutical products 22 423.15Communications and media 17 1254.4Merchandising 14 445.06Othera 37 1393
Full sample 445 14657.9
The sample consists of 445 Canadian IPOs by firms subsequently listed on the Toronto Stock Exchange, MontrealStock Exchange, Vancouver Stock Exchange and Alberta Stock Exchange from January 1991 through December1998.
a The ‘Other’ category includes following sectors or industries: public services, transport, agriculture, con-glomerates, film production and others. We excluded the Junior Capital Pool IPOs.
adjusted returns (CARs), buy-and-hold abnormal returns and calendar-time abnormal re-turns (CTARs).
The aftermarket period includes the 60 months following the issue, where months aredefined as successive 21-trading-day periods relative to the IPO date.10 We measure theaftermarket performance both from the issue price, and from the first closing market price.This allows us to examine the performance of the IPOs acquired primarily by institutionalinvestors, who are able to buy at the issue price, and by individual investors, who usuallybuy at the market price.
Following Lyon et al. (1999), we use the control firms approach for the calculation ofthe excess returns. To choose a matching firm, on each 31 December, all common stockslisted on the Canadian stock exchanges that have not issued shares within the last 5 yearsare ranked by their market capitalization.11 A firm with a market capitalization between80% and 120% of that of the issuing firm is then chosen as its matching firm. We alsoconsidered, but rejected, the use of a control firm of similar size and book-to-market ratio,
10 Since the analysis is based on 60 months of post-IPO returns, the number in the sample decreases as thelength of the period increases. For example, since return data ends in 1998, the 1996 IPOs are included only inthe results for the first 24 months. Moreover, to be included in a particular year, the stock must have had returndata in the data base for at least 10 of the 12 months.
11 Our methodology is nevertheless susceptible to some bias. Matching on a size at the event date, and maintain-ing the match for several years, can make the benchmark return be a noisier measure of expected return. However,the rebalancing control firm approach accentuates the new listing and the rebalancing biases. It also creates anotherbias, called the “moment bias”, due to the fact that control firms exhibit positive and negative drifts after a periodof classification (Rau and Vermaelen, 1998). In this paper, we do not claim that the trade-off between the twoapproaches should always be resolved in favour of the non-rebalancing approach. The choice of each approachtherefore remains debatable.
54 M. Kooli, J.-M. Suret / J. of Multi. Fin. Manag. 14 (2004) 47–66
-0.3
-0.2
-0.1
0
0.1
0.2
0.3
1 4 7 10 13 16 19 22 25 28 31 34 37 40 43 46 49 52 55 58
Months
Aft
erm
arke
t per
form
ance
CAR VW
CAR EW
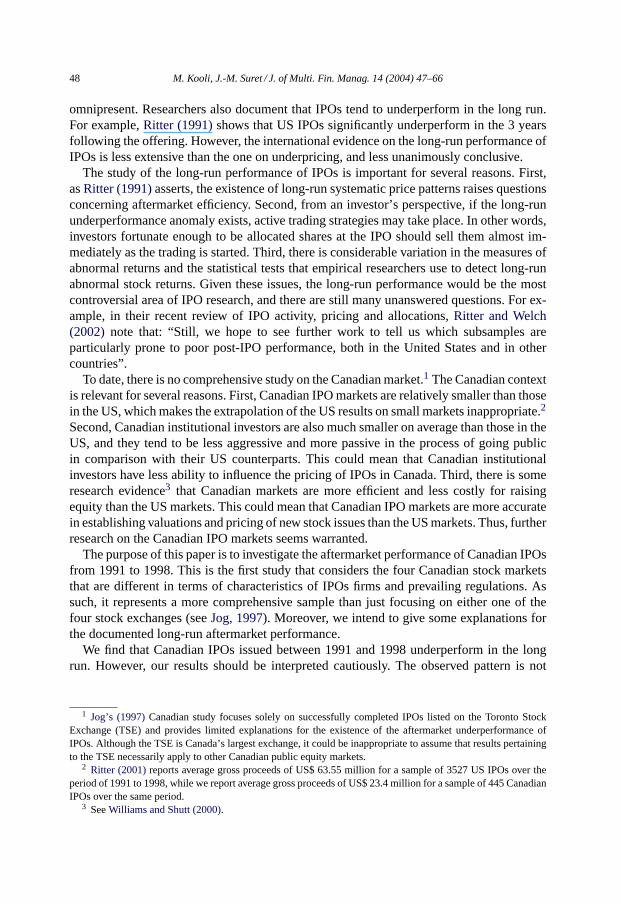
Fig. 1. Cumulative abnormal returns (CARs) from the issue price. The sample consists of 445 Canadian IPOsby firms subsequently listed on the Toronto Stock Exchange, Montreal Stock Exchange, Vancouver Stock Ex-change and Alberta Stock Exchange from January 1991 through December 1998. CAR VW is the value-weightedcumulative abnormal returns and the CAR EW is the equally weighted cumulative abnormal returns.
since this approach considerably reduces the number of firms in our sample.12 If the controlfirm is delisted before the end of the year, we replace the missing return with the matchingcontrol firm return, which results in the same filter (a market capitalization between 80% and120%). If a chosen matching firm subsequently issues stock, we treat it as if it is delistedon its offering date. We do not consider matching by industry because an industry cantime its offers to take advantage of industry-wide misevaluations. According toLoughranand Ritter (1995), controlling for industry effects reduces the ability to identify abnormalperformance.
4. Long-term performance results
4.1. Long-term performance of Canadian IPOs
4.1.1. Long-term performance measured from the issue priceFig. 1 provides evidence on relative performance with respect to our sample of control
firms. Table 5provides a summary of results of cumulative abnormal returns (CARs),over 60 months for 445 Canadian IPOs between January 1991 and December 1998. At 12months, the EW CAR is 12.36% (t-statistic:−2.21). At 36 months, the EW CAR is−6.15%(t-statistic:−0.47). From that point on, both the underperformance and its significancedropped markedly. The VW CARs are smaller in magnitude than the EW CARs. At 36months, the VW CAR is still positive at 0.02%, but not statistically significant (t-statistic:−0.94). At 48 months, the VW CAR is−8.78%, and statistically significant at the 10%level. At 60 months, the VW CAR is−11.02% (t-statistic:−1.67). These results are in linewith those obtained in other works. Thus,Chen and Pan (1998)find that market-adjustedreturns measured from issue price for Taiwan IPOs peak around 150 days after issuance, andthen start to decline smoothly.Kim et al. (1995)also report a 2-year matching firm-adjusted
12 For the majority of control firms, it was not possible to obtain the book value to determine the book-to-marketratio. This was the case of many non-TSE small firms.

M. Kooli, J.-M. Suret / J. of Multi. Fin. Manag. 14 (2004) 47–66 55
Table 5Cumulative abnormal returns from the issue price
Month Number of IPOs CARt (EW) t-statistic CARt (VW) t-statistic
1 445 0.2576 16.99 0.1221 57.002 442 0.2568 11.96 0.0894 28.773 438 0.2281 8.64 0.0879 19.28
12 391 0.1236 2.21 0.0811 4.4924 290 0.0344 0.38 0.0660 0.7536 217 −0.0615 −0.47 0.0201 −0.9448 163 −0.1554 −0.90 −0.0878 −1.7860 101 −0.2065 −0.84 −0.1102 −1.67
The sample consists of 445 Canadian IPOs by firms subsequently listed on the Toronto Stock Exchange, MontrealStock Exchange, Vancouver Stock Exchange and Alberta Stock Exchange from January 1991 through December1998. CAR from monthq to months is defined as:
CARqs =s∑
t=q
ARt
where
ARt = 1
nt
∑nt
i=1ARi,t
and ARi,t=Ri,t − Rm,t
and is the monthly abnormal return for firmi during the montht whereRi,t is the return of the firmi during themonth andRm,t the return on the benchmark during the corresponding time period. The statistical test for theCAR1,t is:
tCAR1,t= CAR1,t ×
√nt
t × var+ 2 × (t − 1) × cov
where var is the average of the cross-sectional variations over 60 months of the ARi,t , and cov the first-orderauto-covariance of the ARt series. CARs are equally weighted (EW) and value-weighted (VW).
return of 59.01% (t-statistic: 5.53) for Korean IPOs.Ritter (1991)documents that much ofthe underperformance occurs in the third post-issue year.
In short, it seems clear that those Canadian IPOs that continued to be listed for a longperiod provide much smaller returns than other companies on the stock market after 20months of performance or the “honeymoon” (on an EW basis) and 37 months (on a VWbasis). However, we should point out that the degree of significance of these aftermarketunderperformances is very low.
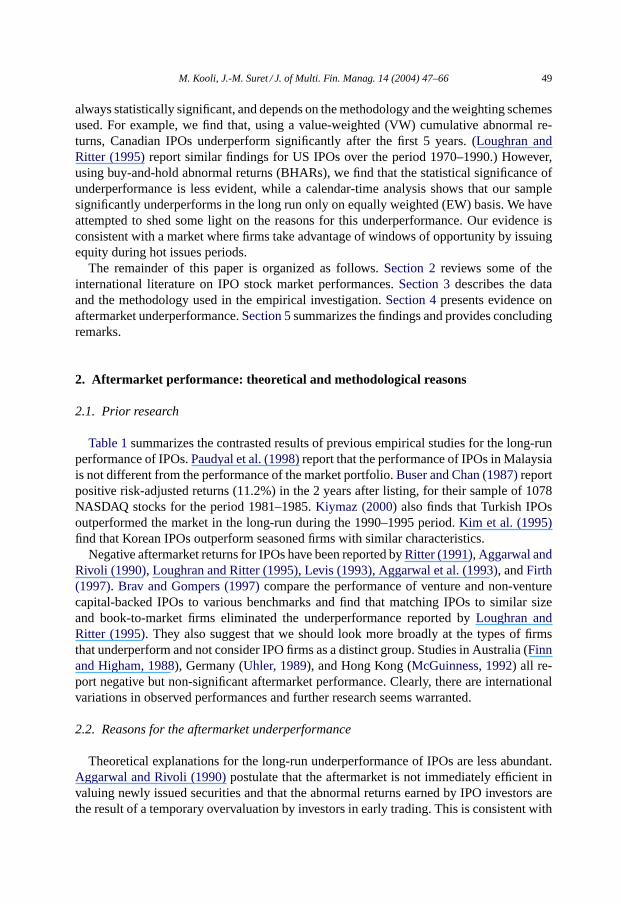
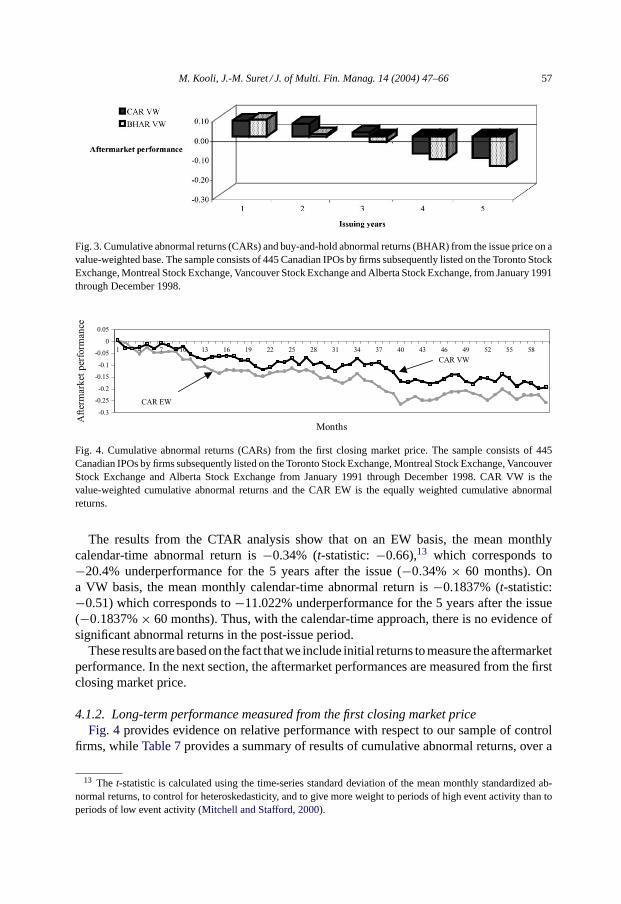
Table 6(panel A) provides the summary of the results obtained using the BHAR as asecond measure of aftermarket performance. Thus, on an EW basis, a zero initial invest-ment in the new issues would have resulted in a loss for the investors of 6.59% by theend of 36 months, and of 24.66% by the end of 60 months, in the post-IPO period. Nev-ertheless, none of these BHARs are statistically different from zero. On a VW basis, theaftermarket underperformance is smaller, and again, not statistically significant. Overall,the underperformances obtained from BHAR analysis are larger than those obtained fromCAR analysis. This confirmsBarber and Lyon’s (1997)findings that CAR yields positivelybiased test statistics, and BHAR yields negatively biased test statistics.Figs. 2 and 3confirmthese observations.

56 M. Kooli, J.-M. Suret / J. of Multi. Fin. Manag. 14 (2004) 47–66
Table 6Buy-and-hold abnormal returns
Year EW VW
Panel A: BHAR (1)1 0.1334 0.0861∗∗∗2 0.0456 0.01133 −0.0659 −0.02774 −0.1681 −0.11635 −0.2466 −0.1516
Panel B: BHAR (2)1 −0.1145 −0.0697∗∗∗2 −0.1441 −0.099∗3 −0.1996 −0.12324 −0.2394 −0.16695 −0.265 −0.2061
BHAR (1) is measured from the issue price and BHAR (2) from the first closing market price. The sampleconsists of 445 Canadian IPOs by firms subsequently listed on the Toronto Stock Exchange, Montreal StockExchange, Vancouver Stock Exchange and Alberta Stock Exchange from January 1991 through December 1998.The buy-and-hold abnormal return (BHAR) is defined as follows:
BHARi,T =[
T∏t=1
(1 + ri,t ) − 1
]−
[T∏
t=1
(1 + rm,t) − 1
]
whereT = 60 months or the delisted date of the stock,ri,t is the return of the firmi during the month andrm,t isthe return on the benchmark during the corresponding time period. EW is the equally weighted base and VW thevalue-weighted base. To test the null hypothesis of zero mean buy-and-hold return, we use the skewness-adjustedt-statistic. Thet-statistic is defined as:
t = √n ×
(S + 1
3γS2 + 1
6nγ
)
where
S = BHARt
σ(BHARt )
t = 12, 24, 36, 48 and 60 months andγ is an estimate of the coefficient of skewness.∗ Significant at 1%.∗∗∗ Significant at 10%.
Fig. 2. Cumulative abnormal returns (CARs) and buy-and-hold abnormal returns (BHARs) from the issue priceon an equally weighted base. The sample consists of 445 Canadian IPOs by firms subsequently listed on theToronto Stock Exchange, Montreal Stock Exchange, Vancouver Stock Exchange and Alberta Stock Exchangefrom January 1991 through December 1998.
M. Kooli, J.-M. Suret / J. of Multi. Fin. Manag. 14 (2004) 47–66 57
Fig. 3. Cumulative abnormal returns (CARs) and buy-and-hold abnormal returns (BHAR) from the issue price on avalue-weighted base. The sample consists of 445 Canadian IPOs by firms subsequently listed on the Toronto StockExchange, Montreal Stock Exchange, Vancouver Stock Exchange and Alberta Stock Exchange, from January 1991through December 1998.
-0.3
-0.25
-0.2
-0.15
-0.1
-0.05
0
0.05
1 4 7 10 13 16 19 22 25 28 31 34 37 40 43 46 49 52 55 58
Months
Aft
erm
arke
t per
form
ance
CAR EW
CAR VW
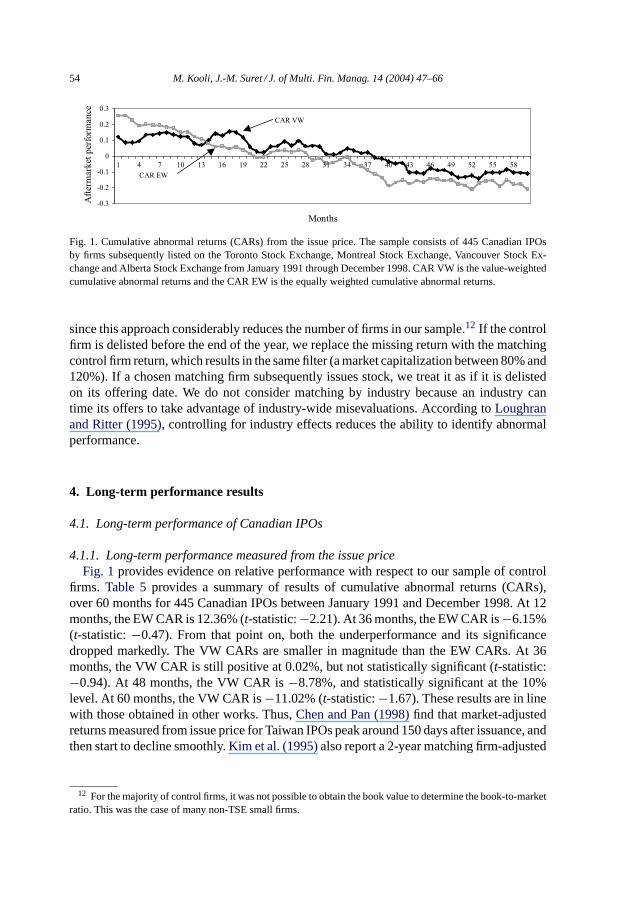
Fig. 4. Cumulative abnormal returns (CARs) from the first closing market price. The sample consists of 445Canadian IPOs by firms subsequently listed on the Toronto Stock Exchange, Montreal Stock Exchange, VancouverStock Exchange and Alberta Stock Exchange from January 1991 through December 1998. CAR VW is thevalue-weighted cumulative abnormal returns and the CAR EW is the equally weighted cumulative abnormalreturns.
The results from the CTAR analysis show that on an EW basis, the mean monthlycalendar-time abnormal return is−0.34% (t-statistic: −0.66),13 which corresponds to−20.4% underperformance for the 5 years after the issue (−0.34% × 60 months). Ona VW basis, the mean monthly calendar-time abnormal return is−0.1837% (t-statistic:−0.51) which corresponds to−11.022% underperformance for the 5 years after the issue(−0.1837%× 60 months). Thus, with the calendar-time approach, there is no evidence ofsignificant abnormal returns in the post-issue period.
These results are based on the fact that we include initial returns to measure the aftermarketperformance. In the next section, the aftermarket performances are measured from the firstclosing market price.
4.1.2. Long-term performance measured from the first closing market priceFig. 4 provides evidence on relative performance with respect to our sample of control
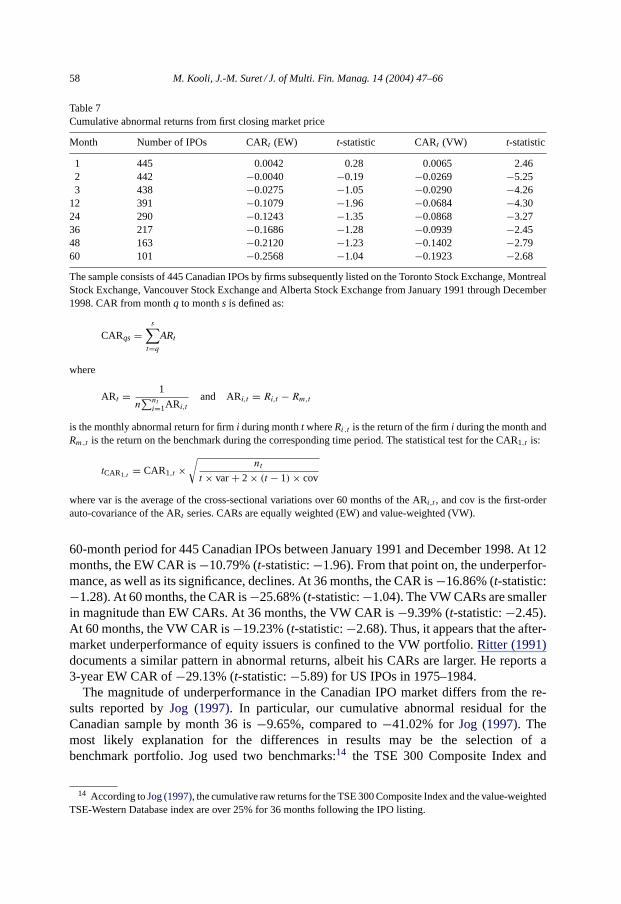
firms, whileTable 7provides a summary of results of cumulative abnormal returns, over a
13 The t-statistic is calculated using the time-series standard deviation of the mean monthly standardized ab-normal returns, to control for heteroskedasticity, and to give more weight to periods of high event activity than toperiods of low event activity (Mitchell and Stafford, 2000).
58 M. Kooli, J.-M. Suret / J. of Multi. Fin. Manag. 14 (2004) 47–66
Table 7Cumulative abnormal returns from first closing market price
Month Number of IPOs CARt (EW) t-statistic CARt (VW) t-statistic
1 445 0.0042 0.28 0.0065 2.462 442 −0.0040 −0.19 −0.0269 −5.253 438 −0.0275 −1.05 −0.0290 −4.26
12 391 −0.1079 −1.96 −0.0684 −4.3024 290 −0.1243 −1.35 −0.0868 −3.2736 217 −0.1686 −1.28 −0.0939 −2.4548 163 −0.2120 −1.23 −0.1402 −2.7960 101 −0.2568 −1.04 −0.1923 −2.68
The sample consists of 445 Canadian IPOs by firms subsequently listed on the Toronto Stock Exchange, MontrealStock Exchange, Vancouver Stock Exchange and Alberta Stock Exchange from January 1991 through December1998. CAR from monthq to months is defined as:
CARqs =s∑
t=q
ARt
where
ARt = 1
n∑nt
i=1ARi,t
and ARi,t = Ri,t − Rm,t
is the monthly abnormal return for firmi during montht whereRi,t is the return of the firmi during the month andRm,t is the return on the benchmark during the corresponding time period. The statistical test for the CAR1,t is:
tCAR1,t= CAR1,t ×
√nt
t × var+ 2 × (t − 1) × cov
where var is the average of the cross-sectional variations over 60 months of the ARi,t , and cov is the first-orderauto-covariance of the ARt series. CARs are equally weighted (EW) and value-weighted (VW).
60-month period for 445 Canadian IPOs between January 1991 and December 1998. At 12months, the EW CAR is−10.79% (t-statistic:−1.96). From that point on, the underperfor-mance, as well as its significance, declines. At 36 months, the CAR is−16.86% (t-statistic:−1.28). At 60 months, the CAR is−25.68% (t-statistic:−1.04). The VW CARs are smallerin magnitude than EW CARs. At 36 months, the VW CAR is−9.39% (t-statistic:−2.45).At 60 months, the VW CAR is−19.23% (t-statistic:−2.68). Thus, it appears that the after-market underperformance of equity issuers is confined to the VW portfolio.Ritter (1991)documents a similar pattern in abnormal returns, albeit his CARs are larger. He reports a3-year EW CAR of−29.13% (t-statistic:−5.89) for US IPOs in 1975–1984.
The magnitude of underperformance in the Canadian IPO market differs from the re-sults reported byJog (1997). In particular, our cumulative abnormal residual for theCanadian sample by month 36 is−9.65%, compared to−41.02% forJog (1997). Themost likely explanation for the differences in results may be the selection of abenchmark portfolio. Jog used two benchmarks:14 the TSE 300 Composite Index and
14 According toJog (1997), the cumulative raw returns for the TSE 300 Composite Index and the value-weightedTSE-Western Database index are over 25% for 36 months following the IPO listing.

M. Kooli, J.-M. Suret / J. of Multi. Fin. Manag. 14 (2004) 47–66 59
-0.3
-0.2
-0.1
0
0.1
0.2
0.3
1 4 7 10 13 16 19 22 25 28 31 34 37 40 43 46 49 52 55 58
Months
Aft
erm
arke
t per
form
ance
From first closing market price
From issue price
Fig. 5. Equally weighted cumulative abnormal returns. The sample consists of 445 Canadian IPOs by firmssubsequently listed on the Toronto Stock Exchange, Montreal Stock Exchange, Vancouver Stock Exchange andAlberta Stock Exchange from January 1991 through December 1998. The aftermarket performance is measuredfrom the first closing market price and from issue price.
the value-weighted TSE-Western Database Index, which gives more weight to largerstocks.
Table 6(panel B) provides the summary of results using the BHAR as a second measureof aftermarket performance. On an EW basis, a zero initial investment in the new issueswould have resulted in a loss for the investor of 19.96% by the end of 36 months, and 26.5%by the end of 60 months in the post-IPO period. Nevertheless, none of these BHARs arestatistically different from zero. On a VW basis, the underperformance is less important andagain not statistically significant.Brav et al. (2000)confirm these results using a sampleof US IPOs and different benchmarks. They report an EW 3-year BHAR between−44.2%and−28.4% (depending on the benchmark index). They also document that the abnormalperformance is substantially reduced with the value-weighting.
The results from the CTAR analysis show that on an EW basis, the mean monthlycalendar-time abnormal return is−0.42% and statistically significant (t-statistic:−2.00),which corresponds to−25.2% underperformance for the 5 years after the issue (−0.42%×60months). On a VW basis, the mean monthly calendar-time abnormal return is−0.32% butnot statistically different from zero (t-statistic:−1.38).
The main conclusion from this section is that the aftermarket performance measuredfrom the issue price is smaller than the one measured from the first closing market price.This difference is mainly explained by the relatively high underpricing of Canadian IPOs.Investors, who cannot get the chance to buy stocks at issue prices, mostly individual in-vestors, do not benefit from the high initial returns and they incur substantial losses, startingfrom the second month after the issue. Nevertheless, institutional investors, who gener-ally buy stocks at issue prices earn profits up till the 20th month after the issue.Figs. 5and 6confirm these observations. Moreover, it is obvious that our sample underperforms inthe long run. However, our results should be interpreted cautiously. The observed patternis not always statistically significant, and depends on the methodology used and on theweighting schemes.15 For example, when performance is measured using value-weighted
15 In a sample of over 3661 IPOs issued between 1935 and 1972,Gompers and Lerner (2001)find underperfor-mance when event-time buy-and-hold abnormal returns are used, but even this result is not consistently statisticallysignificant. The underperformance disappears when they use cumulative abnormal returns.

60 M. Kooli, J.-M. Suret / J. of Multi. Fin. Manag. 14 (2004) 47–66
-0.25
-0.2
-0.15
-0.1
-0.05
0
0.05
0.1
0.15
0.2
1 4 7 10 13 16 19 22 25 28 31 34 37 40 43 46 49 52 55 58
Months
Aft
erm
arke
t per
form
ance
From first closing market price
From issue price
Fig. 6. Value-weighted cumulative abnormal returns. The sample consists of 445 Canadian IPOs by firms subse-quently listed on the Toronto Stock Exchange, Montreal Stock Exchange, Vancouver Stock Exchange and AlbertaStock Exchange from January 1991 through December 1998. The aftermarket performance is measured from thefirst closing market price and from the issue price.
cumulative abnormal returns, we find that Canadian IPOs are not a good long-term invest-ment. Later, we will attempt to find a plausible explanation for the underperformance ofIPOs in Canada and to analyze the relationship between the aftermarket performance andsample characteristics.
4.2. Cross-sectional patterns
We now turn to the cross-sectional analysis of the long-run performance of the IPOs.Table 8shows BHARs by proceeds, initial return, and industry. While both issues withgross proceeds smaller than CAN$ 10 million, and those with CAN$ 10 million and more,underperform in the aftermarket, the first group performs worse than the latter group over60 months. This corroborates the hypothesis that the ex ante uncertainty is positively relatedto underperformance.
Table 8also suggests that overpriced stocks perform better than underpriced stocks.This confirms the existing US evidence, which indicates that underpriced stocks show amore negative long-term performance. This result is mildly supportive of the overreac-tion or fads hypothesis. When the sample is segmented by the industry, we notice thatthe long-run performance of IPOs varies widely between industries.16 For example, fi-nancial IPOs outperform at 12, 24, 36, 48 and 60 months and mining IPOs underperformat 12, 24, 36, 48 and 60 months. This underperformance may be explained by the highinitial returns for this sector (35.71%). Oil and gas IPOs show the same pattern as min-ing IPOs, but the underperformance at 60 months is not statistically significant. We alsoobserve that oil and gas stocks perform worse than those of other sectors (−37.94% at60 months).Ritter (1991)also finds that oil and gas IPOs in the US had high initial re-turns but very poor aftermarket performance. He also reports that financial IPOs had better3-year stock return performances than those in other sectors. Moreover, we also find thattechnology IPOs underperform over the same period. Technology IPOs had among thehighest aftermarket underperformance. Communications and media, and merchandisingIPOs are overpriced and exhibit less dramatic underperformance than other sectors. At 60
16 When the sample is divided in this way, the power oft-statistics on the difference across subsamples is reduceddue to the small number of firms in each sector.

M. Kooli, J.-M. Suret / J. of Multi. Fin. Manag. 14 (2004) 47–66 61
Table 8BHARs (%) and subsample characteristics
Sample 12 months 24 months 36 months 48 months 60 months Underpricing
BHAR (full sample) −11.45 −14.41 −19.96 −23.94 −26.5 20.57
Biotech/pharmaceuticalproducts
−16.37 −26.35∗∗∗ −38.20∗ −29.00 −16.20 17.03
Communications andmedia
−17.70∗∗∗ −23.85 −12.69 −2.65 3.82 −4.66
Financial services 5.83 13.33 25.09 21.62 22.88 1.31Mining −21.14∗ −17.82∗∗∗ −18.92∗∗∗ −31.31∗∗ −25.19∗ 35.71∗Oil and gas −14.60 −16.28 −35.90 −27.31 −37.94 29.04∗Othera −17.14∗∗∗ −14.84 −19.11 −16.90 −21.99 22.37∗Production −11.86∗ −17.15 −26.28 −28.19 −25.03 11.11Real estate −5.73 −19.42 −26.89 −24.66 −32.99 16.9Merchandising −4.25 −2.04 −1.2 −0.16 −2.14 −1.9Technology 2.17 −16.34 −22.15 −22.98∗∗ −20.90∗ 19.77∗
Proceeds≤ CAN$10 million
−22.85∗ −27.53∗ −21.87∗ −42.58∗ −44.86∗ 38.56∗
Proceeds > CAN$10 million
1.8 −2.7 −10.93 −7.9 −3.1 0.06
Hot period −13.52∗ −15.34∗ −18.06∗∗∗ −30.12∗∗∗ −39.08b,∗ 22.03∗Cold period −6.40 −6.56 −10.41 −9.46 −4.6 16.77∗
Overpriced IPOs −3.35 −13.26 −11.14 −14.25 −6.73 −25.44∗Underpriced IPOs −14.35∗ −17.23∗ −18.75∗ −28.66∗ −28.61∗ 41.79∗
The sample consists of 445 Canadian IPOs by firms subsequently listed on the Toronto Stock Exchange, MontrealStock Exchange, Vancouver Stock Exchange and Alberta Stock Exchange from January 1991 through December1998. BHARs exclude initial returns and are equally weighted. Underpricing is calculated as: [(mean of the closingmarket price of the five first days of trading)− (issue price)]/issue price.
a The ‘Other’ category comprises the following sectors and industries: public services, transport, agriculture,film production, conglomerates and other.
b The t-test for differences in average initial return between the following subgroups: hot and cold IPOs,significant at the 5% level.
∗ Significant at 1%.∗∗ Significant at 5%.∗∗∗ Significant at 10%.
months, communications and media IPOs outperform the matching control firms. Overall,the 3-year underperformance of IPOs is present in all but one of the 10 industry group-ings. Also, the 5-year underperformance of IPOs is present in all but 2 of the 10 industrygroupings.
We also segmented the sample in two periods in terms of number and volume of issues.The years 1993, 1994, 1996 and 1997 represent the hot period, and 1991, 1992, 1995 and1998 represent the cold period. This segmentation shows that the underperformance ofCanadian IPOs is not a generalized phenomenon. At 36 months, the BHAR is−18.06%for hot issues, and−10.41% for cold issues. At 60 months, the BHAR is−39.08% forhot issues, and−4.6% for cold issues. Thet-value on the difference in average initialreturn between hot and cold IPOs is significant at the 1% level. This is consistent with

62 M. Kooli, J.-M. Suret / J. of Multi. Fin. Manag. 14 (2004) 47–66
the evidence that firms choose to go public when investors are willing to pay high mul-tiples (price-earnings or market-to-book), reflecting the optimistic assessments of the netpresent value of growth opportunities.Ritter (1991)claims that (p. 3) “investors are pe-riodically overoptimistic about the earnings potential of young growth companies” andthat (p. 4) “(. . . ) firms going public when investors are irrationally overoptimistic aboutthe future potential of certain industries. . . ” His interpretation may be consistent withthe window of opportunity hypothesis. The subsequent negative aftermarket performanceobserved is due to the loss of optimism among investors, when they recognize that theearnings are not maintaining their momentum. All things being equal, the greater the dis-appointing realizations of the net cash flows, the larger the ultimate price correction.Teohet al. (1998)observe that issuers of IPOs can report earnings in excess of cash flows bytaking positive accruals. They also provide evidence that issuers with unusually high ac-cruals in the IPO year experienced poor stock return performance in the 3 years there-after.
In short, it is apparent that the underperformance of Canadian IPOs varies across industriesand according to the period of issue. In addition, we find some evidence that the high initialreturn of Canadian IPOs may explain the aftermarket underperformance.
4.3. Results of multiple regressions
In this section, two ordinary least square regressions were performed. BHARs are es-timated after 36 and 60 months, respectively, in order to assess the relationship betweenBHARs and issue-specific factors in a multivariate context. The regression model has thefollowing form:
BHARi1,s = α0 + α1Ti + α2UNDi + α3HOTi + εi,s (1)
wherestakes on a value of 36 or 60,Thas a value of 1 for technology issues and 0 otherwise,UNDi is the underpricing in stocki and HOT/COLDi has a value of 1 for hot issues and 0otherwise.
First, the HOT variable is treated as a dummy variable. However, the detection of asignificant effect would not allow us to conclude definitively, as we do not know whetherthe difference is due to the constant or to the independent variables. An effect on the constantwould mean that the hot period has an effect on the aftermarket performance, while an effecton the coefficients would suggest that the independent variables affect the dependant variabledifferently depending on whether the IPO is hot or cold. Second, we useJohnston’s (1985)structural adjustment methods to analyze the behavior of the HOT/COLD variable.Thus,we use the three following models:
Model1 : BHARi1,s = α0 + α1Ti + α2UNDi + εi,s (2)
Model2 : BHARi1,s = α0 + α1Ti + α2UNDi + α3HOTi + εi,s (3)
Model3 : BHARi1,s = α0 + α1Ti + α2UNDi + α3HOTi + α4TiHOTi
+ α5UNDiHOTi + εi,s (4)
M. Kooli, J.-M. Suret / J. of Multi. Fin. Manag. 14 (2004) 47–66 63
For each model, we isolate the squared sum of the residuals (SSR). We then test the threefollowing hypotheses:
• The equality of the constants hypothesis (model 1 versus model 2):
F = SCR1 − SCR2
SCR2/(n − k − 1)∼ F(1, n − k − 1)
• The equality of the coefficients hypothesis (model 2 versus model 3):
F = SCR2 − [SCR3/(k − 1)]
SCR3/(n − 2k)∼ F(k − 1, n − 2k)
• The equality of the regression’s line hypothesis (model 1 versus model 3):
F = SCR1 − [SCR3/k]
SCR3/(n − 2k)∼ F(k, n − 2k)
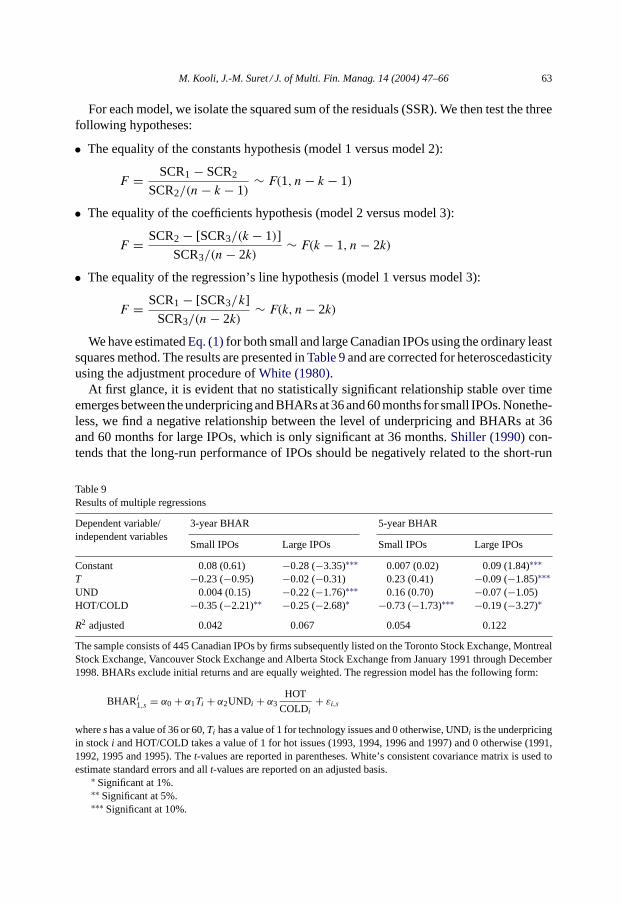
We have estimatedEq. (1)for both small and large Canadian IPOs using the ordinary leastsquares method. The results are presented inTable 9and are corrected for heteroscedasticityusing the adjustment procedure ofWhite (1980).
At first glance, it is evident that no statistically significant relationship stable over timeemerges between the underpricing and BHARs at 36 and 60 months for small IPOs. Nonethe-less, we find a negative relationship between the level of underpricing and BHARs at 36and 60 months for large IPOs, which is only significant at 36 months.Shiller (1990)con-tends that the long-run performance of IPOs should be negatively related to the short-run
Table 9Results of multiple regressions
Dependent variable/independent variables
3-year BHAR 5-year BHAR
Small IPOs Large IPOs Small IPOs Large IPOs
Constant 0.08 (0.61) −0.28 (−3.35)∗∗∗ 0.007 (0.02) 0.09 (1.84)∗∗∗T −0.23 (−0.95) −0.02 (−0.31) 0.23 (0.41) −0.09 (−1.85)∗∗∗UND 0.004 (0.15) −0.22 (−1.76)∗∗∗ 0.16 (0.70) −0.07 (−1.05)HOT/COLD −0.35 (−2.21)∗∗ −0.25 (−2.68)∗ −0.73 (−1.73)∗∗∗ −0.19 (−3.27)∗
R2 adjusted 0.042 0.067 0.054 0.122
The sample consists of 445 Canadian IPOs by firms subsequently listed on the Toronto Stock Exchange, MontrealStock Exchange, Vancouver Stock Exchange and Alberta Stock Exchange from January 1991 through December1998. BHARs exclude initial returns and are equally weighted. The regression model has the following form:
BHARi1,s = α0 + α1Ti + α2UNDi + α3
HOT
COLDi
+ εi,s
whereshas a value of 36 or 60,Ti has a value of 1 for technology issues and 0 otherwise, UNDi is the underpricingin stocki and HOT/COLD takes a value of 1 for hot issues (1993, 1994, 1996 and 1997) and 0 otherwise (1991,1992, 1995 and 1995). Thet-values are reported in parentheses. White’s consistent covariance matrix is used toestimate standard errors and allt-values are reported on an adjusted basis.
∗ Significant at 1%.∗∗ Significant at 5%.∗∗∗ Significant at 10%.

64 M. Kooli, J.-M. Suret / J. of Multi. Fin. Manag. 14 (2004) 47–66
underpricing. Our results suggest that investors’ overreactions hypothesis may explain thelong-run performance of large Canadian IPOs, and that the aftermarket underperformancenegates the high initial returns earned on the first trading day. The first significant negativerelationship between BHARs and the technology variable can be observed in BHARs at 60months for large IPOs. This confirms the fact that the technology IPOs underperform thesample of matching firms. At 36 months, this relationship is negative but not significantfor both samples. Moreover, a significant negative relationship between BHARs and HOTcan be observed for BHARs at 36 and 60 months. This finding confirms the window ofopportunity hypothesis. The coefficient of the HOT variable is significant and negative (atthe 1% level for large IPOs). As expected, hot IPOs underperform more than cold IPOs.This result remains unchanged even if we control for the level of underpricing and thetechnology sector. The squared sum of the residuals for models 1, 2 and 3 for large IPOsare 5.0410, 4.50637 and 4.5057, respectively, at 60 months. We reject the equality of theconstants and the equality of the regression line hypotheses at the 1% level (F1,67 = 7.95;F3,65 = 7.72). However, we cannot reject the equality of the coefficients hypothesis at 1%level (F2,65 = 0.004).17
Thus, the impact of the coefficients of the independent variables on the aftermarketperformance is the same whether the IPO is hot or cold. Nonetheless, the significant effecton the constant allows us to confirm that market conditions affect the long-run performanceof small and large Canadian IPOs.
Overall, these results clearly indicate that firms going public during hot issues market un-derperform in the long run. This is consistent with the windows of opportunity hypothesis.We also conclude that the level of underpricing may explain the aftermarket underperfor-mance of large IPOs.
5. Conclusion
In this paper, we empirically investigate Canadian initial public offerings (IPOs) to pro-vide an out of sample evidence of the long-run performance of IPOs. Canadian IPO marketsare relatively smaller than US IPO markets, which makes the extrapolation of US resultson small markets inappropriate. In a sample of over 445 Canadian IPOs between 1991 and1998, we find that the average initial return on the first trading day is 20.57%. The highinitial prices on the first day of listing may be due to the myopia of investors, who are unableto fully grasp the extent to which IPO firms engage in earnings management (Teoh et al.,1998).
We also find that our sample underperforms in the long run. However, our results shouldbe interpreted cautiously. The observed pattern is not always statistically significant, anddepends on the methodology used and on the weighting schemes. For example, whenperformance is measured using value-weighted cumulative abnormal returns, we find thatCanadian IPOs underperform significantly after the first 5 years. However, when event-timebuy-and-hold abnormal returns are used, this result is no longer statistically significant,
17 The results of the structural adjustment test remain unchanged when we consider the sample of small IPOsfor both periods: 36 and 60 months.

M. Kooli, J.-M. Suret / J. of Multi. Fin. Manag. 14 (2004) 47–66 65
while a calendar-time analysis shows that our sample significantly underperforms in thelong run only on equally weighted basis. In short, our results raise questions concerning theinterpretation of the underperformance of IPOs seen in previous studies.
When the sample is segmented by the industry, we observe that the long-run performanceof Canadian IPOs varies widely between industries. Consistent withRitter (1991), wefind that mining, and oil and gas issues show poorer performances than those of othersectors. Additionally, Canadian technology issues also underperform in the long run. Wehave attempted to shed some light on the reasons for the documented underperformance.While the divergence of opinions hypothesis does not explain the aftermarket performanceof Canadian IPOs, our evidence is consistent with the hot issue market story. We also findsome evidence of the fads hypothesis to explain the long-run behavior of large IPOs.
Of the firms that do go public, investors must be able to fully distinguish the high-valueissuers from the low-value issuers, or wealth transfers will result. However, issuers of IPOsor high-value firms should emphasize differentiation, which would enable them to raisecapital on more favorable terms.
Acknowledgements
We gratefully acknowledge valuable comments by Narjess Boubakri, Jean-Claude Cos-set, Jean-Marie Gagnon, Vijay Jog, Jean-François L’Her, Thomas Walker and also by par-ticipants at the 2001 International Conference in Finance (Namur, June 2001) and theNorthern Finance Association 2001 Conference (Halifax). Financial support of the SSRH(Grant 67816) is gratefully acknowledged.
References
Aggarwal, R., Rivoli, P., 1990. Fads in the initial public offering market? Financial Management 19, 45–57.Aggarwal, R., Leal, R., Hernandez, F., 1993. The aftermarket performance of initial public offerings in Latin
America. Financial Management 22, 42–53.Aussenegg, W., 1997. Short and long-run performance of initial public offerings in the Austrian stock market.
Vienna University of Technology Working Paper.Barber, B., Lyon, J., 1997. Detecting long-run abnormal stock returns: the empirical power and specification of
test statistics. Journal of Financial Economics 43, 341–372.Brav, A., Gompers, P., 1997. Myth or reality? The long-run underperformance of initial public offerings: evidence
from venture and non-venture capital-backed companies. Journal of Finance 52, 1791–1821.Brav, A., Geczy, C., Gompers, P., 2000. Is the abnormal return following equity issuance anomalous? Journal of
Financial Economics 56, 209–249.Buser, S., Chan, K., 1987. NASDAQ/NMS Qualification Stand, Ohio Registration Experience and the Price
Performance of Initial Public Offerings. Ohio Department of Commerce and National Association of SecuritiesDealers Inc., Columbus, OH.
Cai, J., Wei, K., 1997. The investment and operating performance of Japanese IPO. Pacific-Basin Finance Journal5, 389–417.
Chen, A., Pan, K., 1998. An answer to the long-run performance puzzle of IPO’s in Taiwan: an application of theFama-French model. National Sun Yat-Sen University Working Paper.
DeBondt, W., Thaler, R., 1985. Does the stock market overreact? Journal of Finance 40, 793–808.
66 M. Kooli, J.-M. Suret / J. of Multi. Fin. Manag. 14 (2004) 47–66
Finn, F., Higham, R., 1988. The performance of unseasoned new equity-issues-cum-stock exchange listings inAustralia. Journal of Banking and Finance 12, 333–351.
Firth, M., 1997. An analysis of the stock market performance of new issues in New Zealand. Pacific-Basin FinanceJournal 5, 63–85.
Gompers, P., Lerner, J., 2001. The really long-run performance of initial public offerings: the pre-NASDAQevidence. NBER Working Paper.
Jog, V., 1997. The climate for Canadian initial public offerings. In: Halpern, P. (Ed.), Financing Growth in Canada.University of Calgary Press, Calgary, pp. 357–401.
Johnston, J., 1985. Méthodes économétriques. Economica, Paris.Keloharju, M., 1993. The winner’s curse, legal liability, and the long-run price performance of initial public
offerings in the Finland. Journal of Financial Economics 34, 251–277.Kim, J., Krinsky, I., Lee, J., 1995. The aftermarket performance of initial public offerings in Korea. Pacific-Basin
Finance Journal 3, 429–448.Kiymaz, H., 2000. The initial and aftermarket performance of IPOs in an emerging market: evidence from Istanbul
stock exchange. Journal of Multinational Financial Management 10 (2), 213–227.Lee, P., Taylor, S., Walter, T., 1996. Australian IPO underpricing in the short and long run. Journal of Banking and
Finance 20, 1189–1210.Levis, M., 1993. The long-run performance of initial public offerings: the UK experience 1980–1988. Financial
Management 22, 28–41.Ljungqvist, A., 1997. Pricing initial public offerings: further evidence from Germany. European Economic Review
41, 1309–1320.Loughran, T., Ritter, J., 1995. The new issues puzzle. Journal of Finance 50, 23–51.Loughran, T., Ritter, J., Rydqvist, K., 1994. Initial public offerings: international insights. Pacific-Basin Finance
Journal 2, 165–199.Lyon, J., Barber, B., Tsai, C., 1999. Improved methods for tests of long-run abnormal stock returns. Journal of
Finance 54, 165–201.McGuinness, P., 1992. An examination of the underpricing of initial public offerings in Hong Kong. Journal of
Business Finance and Accounting 19, 165–186.Miller, E., 1977. Risk, uncertainty and divergence of opinion. Journal of Finance 32, 1151–1168.Mitchell, M., Stafford, E., 2000. Managerial decisions and long-term stock price performance. Journal of Business
73, 287–329.Paudyal, K., Saadouni, B., Briston, R., 1998. Privatisation initial public offerings in Malaysia: initial premium and
long-term performance. Pacific-Basin Finance Journal 6, 427–451.Rau, P., Vermaelen, T., 1998. Glamour, value and the post-acquisition performance of acquiring firms. Journal of
Financial Economics 49, 223–253.Ritter, J., 1984. The hot issue market of 1980. Journal of Business 32, 215–240.Ritter, J., 1991. The long-run performance of initial public offerings. Journal of Finance 46, 3–27.Ritter, J., 2001. Some factoids about the 2000 IPO market. University of Florida Working Paper.Ritter, J., Welch, I., 2002. A review of IPO activity, pricing, and allocations. Journal of Finance 52, 1795–1828.Shiller, R., 1990. Speculative prices and popular models. Journal of Economic perspectives 4, 55–65.Teoh, S., Welch, I., Wong, T., 1998. Earnings management and the long-run market performance of initial public
offerings. Journal of Finance 53, 1935–1974.Uhler, H., 1989. Going public in the Guimaraes, R., Kingsman, B., Taylor, S. (Eds.), A Reappraisal of the Efficiency
of Financial Markets. Springer-Verlag, Berlin, pp. 369–393.White, H., 1980. A heteroscedasticity-consistent covariance matrix estimator and a direct test for heteroscedasticity.
Econometrica 48, 817–838.Williams, H., Shutt, T., 2000. A comparison of IPO markets. The Conference Board of Canada, No. 296-00.