The adequate measurement of the workability of masonry mortar
242
Arenberg Doctoral School of Science, Engineering & Technology Faculty of Engineering Department of Civil Engineering The adequate measurement of the workability of masonry mortar Roel Hendrickx Dissertation presented in partial fulfillment of the requirements for the degree of Doctor in Engineering Sciences October 2009
-
Upload
khangminh22 -
Category
Documents
-
view
0 -
download
0
Transcript of The adequate measurement of the workability of masonry mortar

Arenberg Doctoral School of Science,Engineering & TechnologyFaculty of EngineeringDepartment of Civil Engineering
The adequate measurement ofthe workability of masonry mortar
Roel Hendrickx
Dissertation presentedin partial fulfillment ofthe requirements forthe degree of Doctorin Engineering Sciences
October 2009


The adequate measurement ofthe workability of masonry mortar
Roel Hendrickx
Jury: Dissertation presentedProf. Dr. Yves Willems, president in partial fulfillment ofProf. Dr. Koenraad Van Balen, promotor the requirements forProf. Dr. Dionys Van Gemert, promotor the degree of DoctorProf. Dr. Jan Elsen, advisor in Engineering SciencesProf. Dr. Jan Vermant, advisorDr. Thierry Chopin (Lhoist R&D)Prof. Dr. Caspar Groot (TUDelft)Prof. Dr. Staf RoelsDr. Nicolas Roussel (LCPC)
October 2009

© Katholieke Universiteit Leuven – Faculty of EngineeringKasteelpark Arenberg 1, B-3001 Leuven (Belgium)
Alle rechten voorbehouden. Niets uit deze uitgave mag worden vermenigvuldigden/of openbaar gemaakt worden door middel van druk, fotocopie, microfilm,elektronisch of op welke andere wijze ook zonder voorafgaande schriftelijketoestemming van de uitgever.
All rights reserved. No part of the publication may be reproduced in any form byprint, photoprint, microfilm or any other means without written permission fromthe publisher.
Cover and back: decorative masonry at Leiston abbey, Suffolk (UK).
Legal depot D/2009/7515/118ISBN 978-94-6018-136-8

Contents
List of Symbols vii
List of Figures xi
List of Tables xvi
Acknowledgements xix
Abstract xxi
Samenvatting xxii
1 Introduction 1
1.1 Problem statement . . . . . . . . . . . . . . . . . . . . . . . . . . . 1
1.2 Aim of the research . . . . . . . . . . . . . . . . . . . . . . . . . . . 2
1.3 Methodology . . . . . . . . . . . . . . . . . . . . . . . . . . . . . . 3
2 State of the art 7
2.1 Concise literature review on workability . . . . . . . . . . . . . . . 7
2.2 Standards on fresh mortar properties . . . . . . . . . . . . . . . . . 11
2.2.1 Overview of European and other standards . . . . . . . . . 11
2.2.2 The flow table test . . . . . . . . . . . . . . . . . . . . . . . 14
2.2.3 The Emley plasticity meter . . . . . . . . . . . . . . . . . . 16
i

ii CONTENTS
2.3 Non-standardised tests for fresh mortar . . . . . . . . . . . . . . . 18
2.3.1 Simple hand-operated tests . . . . . . . . . . . . . . . . . . 18
2.3.2 Mixer type rheometers . . . . . . . . . . . . . . . . . . . . . 19
2.3.3 Moving object rheometers . . . . . . . . . . . . . . . . . . . 19
2.3.4 Concrete rheometers . . . . . . . . . . . . . . . . . . . . . . 20
2.3.5 Dynamic impact setups . . . . . . . . . . . . . . . . . . . . 21
2.3.6 Dewatering rheometry . . . . . . . . . . . . . . . . . . . . . 21
2.3.7 Tribometer . . . . . . . . . . . . . . . . . . . . . . . . . . . 21
2.4 Summary . . . . . . . . . . . . . . . . . . . . . . . . . . . . . . . . 22
3 Theoretical aspects of rheology and hygric properties of masonry mortar 23
3.1 Introduction . . . . . . . . . . . . . . . . . . . . . . . . . . . . . . . 23
3.2 Composition of mortar . . . . . . . . . . . . . . . . . . . . . . . . . 24
3.2.1 General terminology . . . . . . . . . . . . . . . . . . . . . . 24
3.2.2 Mix ratio, composition and phase relationships . . . . . . . 25
3.2.3 Dry mix ratios for reference mortars . . . . . . . . . . . . . 27
3.3 Mortar rheology . . . . . . . . . . . . . . . . . . . . . . . . . . . . 29
3.3.1 Driving forces, continuum approach and flow regimes . . . . 29
3.3.2 Suspension rheology, maximum packing and polydispersity 35
3.3.3 Yield stress, thixotropy and the Bingham model . . . . . . 41
3.3.4 Squeeze flow theory . . . . . . . . . . . . . . . . . . . . . . 44
3.3.5 Semi-empirical mortar rheometry . . . . . . . . . . . . . . . 47
3.4 Geotechnical concepts applied to mortar . . . . . . . . . . . . . . . 53
3.4.1 Stress and deformation of soil . . . . . . . . . . . . . . . . . 53
3.4.2 Porosity of soils, compaction and consolidation . . . . . . . 55
3.4.3 Water transport in soil and application to mortar . . . . . . 56
3.4.4 Slurry filtration . . . . . . . . . . . . . . . . . . . . . . . . . 56
3.5 Water transport in mortar and brick . . . . . . . . . . . . . . . . . 57

CONTENTS iii
3.5.1 Porosity and water content of mortar and brick . . . . . . . 57
3.5.2 Capillarity in brick . . . . . . . . . . . . . . . . . . . . . . . 58
3.5.3 Liquid potential in mortar . . . . . . . . . . . . . . . . . . . 59
3.5.4 Liquid transport laws, diffusivity and permeability . . . . . 60
3.5.5 Sorptivity, desorptivity and transfer sorptivity . . . . . . . 62
3.5.6 Measuring water content . . . . . . . . . . . . . . . . . . . . 64
3.6 Summary . . . . . . . . . . . . . . . . . . . . . . . . . . . . . . . . 65
4 Experimental investigation of workability 67
4.1 Introduction . . . . . . . . . . . . . . . . . . . . . . . . . . . . . . . 67
4.2 Materials and mixing procedures . . . . . . . . . . . . . . . . . . . 68
4.2.1 Binders . . . . . . . . . . . . . . . . . . . . . . . . . . . . . 68
4.2.2 Sand . . . . . . . . . . . . . . . . . . . . . . . . . . . . . . . 70
4.2.3 Bricks . . . . . . . . . . . . . . . . . . . . . . . . . . . . . . 71
4.2.4 Mixing procedures . . . . . . . . . . . . . . . . . . . . . . . 72
4.3 Test setup and procedures . . . . . . . . . . . . . . . . . . . . . . . 74
4.3.1 General outline of the experiments . . . . . . . . . . . . . . 74
4.3.2 Experimental setup and course of one test . . . . . . . . . . 75
4.4 Quantitative results and composition of reference mortars . . . . . 75
4.4.1 Chosen water content for fixed dry mixes . . . . . . . . . . 75
4.4.2 Relation between water content, working method andpenetration value . . . . . . . . . . . . . . . . . . . . . . . . 77
4.4.3 The composition of reference mortars . . . . . . . . . . . . 79
4.4.4 Parenthesis: reproducibility and adaptation of referencemortars . . . . . . . . . . . . . . . . . . . . . . . . . . . . . 80
4.5 Qualitative results and definition of workability . . . . . . . . . . . 83
4.5.1 Description of workability properties for all mortars . . . . 83
4.5.2 Characterisation of the separate mortars . . . . . . . . . . . 85
4.5.3 Results of masons’ inquiry . . . . . . . . . . . . . . . . . . . 86

iv CONTENTS
4.6 Defining workability . . . . . . . . . . . . . . . . . . . . . . . . . . 90
4.7 Influence of workability on mechanical strength . . . . . . . . . . . 91
4.7.1 Objectives and test methods . . . . . . . . . . . . . . . . . 91
4.7.2 Masonry strength and strength of components . . . . . . . 92
4.8 Summary . . . . . . . . . . . . . . . . . . . . . . . . . . . . . . . . 93
5 Rheological experiments for the evaluation of workability 95
5.1 Introduction . . . . . . . . . . . . . . . . . . . . . . . . . . . . . . . 95
5.1.1 Relevant shear rates for bricklaying . . . . . . . . . . . . . . 95
5.1.2 Test methods . . . . . . . . . . . . . . . . . . . . . . . . . . 96
5.2 Standardised rheology-related tests . . . . . . . . . . . . . . . . . . 96
5.2.1 Preliminary tests on various mortars . . . . . . . . . . . . . 97
5.2.2 Tests on reference mortars . . . . . . . . . . . . . . . . . . . 98
5.3 Rotational rheometry of binder slurries . . . . . . . . . . . . . . . . 102
5.3.1 Viskomat measurements: technique and validation . . . . . 102
5.3.2 Coaxial cylinders rheometry . . . . . . . . . . . . . . . . . . 104
5.3.3 Concentration effect of binder slurries . . . . . . . . . . . . 105
5.3.4 Alternative approach to concentration effect of Binghambinder slurries . . . . . . . . . . . . . . . . . . . . . . . . . 108
5.4 Rotational rheometry of mortars . . . . . . . . . . . . . . . . . . . 110
5.4.1 Bingham behaviour of mortars . . . . . . . . . . . . . . . . 110
5.4.2 Concentration and the effect of air entrapment . . . . . . . 114
5.4.3 Bimodal and trimodal mortars: Farris’ law . . . . . . . . . 116
5.5 Compactability and maximum packing . . . . . . . . . . . . . . . . 118
5.6 Vane measurements . . . . . . . . . . . . . . . . . . . . . . . . . . 119
5.6.1 Laboratory vane apparatus for clayey soil . . . . . . . . . . 119
5.6.2 Small-scale vane measurements . . . . . . . . . . . . . . . . 128
5.7 Direct shear apparatus . . . . . . . . . . . . . . . . . . . . . . . . . 132

CONTENTS v
5.7.1 Total stress behaviour of mortar and sand . . . . . . . . . . 132
5.7.2 Dilation of mortar and sand . . . . . . . . . . . . . . . . . . 136
5.8 Squeeze tests . . . . . . . . . . . . . . . . . . . . . . . . . . . . . . 137
5.9 Summary: feasibility of rheological tests for mortar . . . . . . . . . 140
6 Water transport experiments and combined workability experiments 143
6.1 Introduction . . . . . . . . . . . . . . . . . . . . . . . . . . . . . . . 143
6.2 Standardised water retention tests . . . . . . . . . . . . . . . . . . 144
6.3 Desorption tests and permeability tests . . . . . . . . . . . . . . . 145
6.3.1 Suction tests . . . . . . . . . . . . . . . . . . . . . . . . . . 145
6.3.2 Filter press tests . . . . . . . . . . . . . . . . . . . . . . . . 148
6.3.3 Permeameter tests . . . . . . . . . . . . . . . . . . . . . . . 151
6.4 Water transport measurements by microfocus X-ray radiography . 154
6.4.1 Aim, method and validation . . . . . . . . . . . . . . . . . . 154
6.4.2 Moisture profiles in brick and attenuation in mortar . . . . 157
6.4.3 From mortar testing to model parameters . . . . . . . . . . 164
6.5 Modelling water transport . . . . . . . . . . . . . . . . . . . . . . . 169
6.5.1 Finite volume method . . . . . . . . . . . . . . . . . . . . . 169
6.5.2 Boundary conditions . . . . . . . . . . . . . . . . . . . . . . 171
6.5.3 Determination of interface potential . . . . . . . . . . . . . 171
6.5.4 Discussion of modelling results . . . . . . . . . . . . . . . . 172
6.6 Squeeze tests on brick substrate . . . . . . . . . . . . . . . . . . . . 176
6.6.1 Preliminary squeeze tests: influence of parameters . . . . . 176
6.6.2 Squeeze tests on reference mortars . . . . . . . . . . . . . . 177
6.7 Summary . . . . . . . . . . . . . . . . . . . . . . . . . . . . . . . . 179
7 Development of a new workability test method 183
7.1 Test principles . . . . . . . . . . . . . . . . . . . . . . . . . . . . . 183

vi CONTENTS
7.2 Implementation . . . . . . . . . . . . . . . . . . . . . . . . . . . . . 184
7.2.1 Pocket vane apparatus . . . . . . . . . . . . . . . . . . . . . 184
7.2.2 Combination with suction . . . . . . . . . . . . . . . . . . . 185
7.3 Preliminary measurements . . . . . . . . . . . . . . . . . . . . . . . 186
7.3.1 Calibration of the spring . . . . . . . . . . . . . . . . . . . . 186
7.3.2 Measuring procedure . . . . . . . . . . . . . . . . . . . . . . 186
7.3.3 Results for lime hydrate mortar and cement mortar . . . . 188
8 Conclusions and perspectives 191
8.1 A differentiated approach to mortar workability . . . . . . . . . . . 191
8.2 Contributions to the adequate measurement of mortar workability 192
8.3 Perspectives for further research . . . . . . . . . . . . . . . . . . . 193
Bibliography 197
List of publications 211

List of Symbols
Latin lettersA coefficient of capillary absorption kg/m2s0.5
a volume fraction of air/gaseous phase in mortar m3/m3
B mass fraction of binder in mortar kg/kgB/S binder to sand mass ratio of mortar kg/kgb volume fraction of binder in mortar m3/m3
C constant in Gummerson equation −c cohesion (in Coulomb model) N/m2
c′ shape factor in Kozeny-Carman law -D diffusivity m2/sD0 parameter in Gummerson equation m2/sDm diffusivity in material coordinates m2/sd final diameter in flow table test md0 initial diameter in flow table test mE (static) Young’s modulus N/mm2
Em,dyn dynamic Young’s modulus N/mm2
e void ratio m3/m3
F torque parameter in Emley test −F ∗ reduced normal force in squeeze test N/mFn normal force in spreading test mFt tangential force in spreading test mf flow mf ′ dimensionless flow m/mfbc mean compressive strength of brick N/mm2
fmc mean compressive strength of mortar N/mm2
fwc characteristic compressive strength of masonry wall N/mm2
h final height in flow table test mh0 initial height in flow table test m
vii

viii LIST OF SYMBOLS
K permeability m/sK∗ fitting parameter in empirical permeability formula m/sKc permeability of filter cake m/sKm permeability in material coordinates m/skB Boltzmann constant 1.38 · 10−16 erg/CM Mass of plunger in plunger test kgMb mass of binder in mortar kgMs mass of sand in mortar kgMw mass of water in mortar kgm material (Lagrange) coordinate mm compressibility (Section 3.4) kN/m2
P plasticity value in Emley test −pcap capillary pressure N/m2
Q resilience of spring in vane test /NmR radius of pot in plunger test (Section 3.3.5) mR desorptivity of mortar kg/m2s0.5
R particle radius (Section 3.3.1) (m)Re outer radius mRi inner radius mr Radius of plunger in plunger test mS mass fraction of sand in mortar kg/kgS transfer sorptivity, sorption coefficient (Section 3.5) kg/m2s0.5
s volume fraction of sand in mortar m3/m3
s slump ms′ dimensionless slump m/mT torque NmTE time parameter in Emley test −t time su pore water pressure N/m2
Va volume of air in mortar kgVb volume of binder in mortar kgVs volume of sand in mortar kgVw volume of water in mortar kgW mass fraction of water in mortar kg/kgW/B water to binder mass ratio of mortar kg/kgw volume fraction of water in mortar m3/m3
wcap capillary moisture content dm3/m3
wsat saturated moisture content m3/m3
Z bulk mass specific surface area m2/kgz0 reference height in plunger test mzin dropping height in plunger test mzfin final height in plunger test m
LIST OF SYMBOLS ix
Greek lettersα fitting parameter in empirical permeability formula -αp peak dilation angle
β fitting parameter in empirical permeability formula -γ shear angle radγ shear rate m/sε porosity m3/m3
ζ bulk volumic specific surface area m2/m3
η viscosity Pa · s[η] intrinsic viscosity -[ηb] intrinsic viscosity of binder particles -[ηf ] intrinsic viscosity of filler particles -ηpl plastic viscosity of Bingham materials Pa · sηr relative viscosity -ηs solvent viscosity Pa · s
[ηs] intrinsic viscosity of sand particles -θ water ratio m3/m3
ξ trowel angle in spreading test radρb (particle) density of binder kg/m3
ρb,b bulk density of binder kg/m3
ρb,s bulk density of sand kg/m3
ρM bulk density of mortar kg/m3
ρ∗M (imaginary) bulk density of airless mortar kg/m3
ρs (particle) density of sand kg/m3
ρw density of water/liquid phase in mortar kg/m3
σ normal stress N/mm2
σ′ effective normal stress N/m2
τ shear stress N/m2
τ tortuosity (Section 3.5) -τ0 zero shear viscosity of Bingham materials N/m2
τy yield stress N/m2

x LIST OF SYMBOLS
φ solid fraction m3/m3
φ∗ solid fraction with air bubbles counted as solid m3/m3
φ0 solid fraction of mortar before desorption m3/m3
φb filler solid fraction (in Farris formulation) m3/m3
φf binder solid fraction (in Farris formulation) m3/m3
φm maximum packing (in flowing suspension) m3/m3
φm,b maximum packing of binder m3/m3
φm,f maximum packing of filler m3/m3
φm,s maximum packing of sand m3/m3
φPr solid fraction after compaction in Proctor test m3/m3
φs sand solid fraction (in Farris formulation) m3/m3
φT total solid fraction m3/m3
φ∞ solid fraction of mortar after long time of desorption m3/m3
tanφ′ tangens of friction angle (in Coulomb model) -Ψ (total) potential of liquid J/kgΩ rotational / angular velocity rad/s
AbbreviationsAE contains air entraining agent -BET Brunauer-Emmett-Teller method (gas adsorption) -BJH Barrett-Joyner-Halenda method (gas adsorption) -DLVO Derjaguin and Landau, Verwey and Overbeek theory -PP plunger penetration mmPSD particle size distribution (laser granulometry) -XRF X-ray fluorescence -SSA specific surface area m2/kgTGA thermo-gravimetric analysis -WRV water retention value %mass
CVM control volume method -FVM finite volume method -

List of Figures
2.1 Emley plasticity meter . . . . . . . . . . . . . . . . . . . . . . . . . 17
2.2 Viskomat mixer-type rheometer . . . . . . . . . . . . . . . . . . . . 19
2.3 Measuring geometry of Contec Visco5 concrete rheometer . . . . . 21
3.1 Variations in bulk density of wet sand . . . . . . . . . . . . . . . . 27
3.2 Typical values for forces acting on a lime hydrate particle. . . . . . 30
3.3 Spheres kept in contact by a liquid meniscus. . . . . . . . . . . . . 31
3.4 Homogeneous and local flow rate. . . . . . . . . . . . . . . . . . . . 33
3.5 Different flow regimes for colloidal suspensions. . . . . . . . . . . . 35
3.6 Available space for suspension of an increment of solid particles. . . 36
3.7 Squeeze tests at constant volume and constant surface. . . . . . . . 44
3.8 Deformation hypothesis for free slump. . . . . . . . . . . . . . . . . 48
3.9 Assumed geometry of penetration process. . . . . . . . . . . . . . . 49
3.10 Critical stress as a function of plunger penetration. . . . . . . . . . 51
3.11 Geometry and parameters for spreading - Coussot. . . . . . . . . . 52
3.12 Geometry and parameters for spreading - Naniwa. . . . . . . . . . 53
3.13 Schematic process of filtration. . . . . . . . . . . . . . . . . . . . . 62
4.1 Grading of the siliceous quarry sand from Zutendaal. . . . . . . . . 70
4.2 Practical mortar testing . . . . . . . . . . . . . . . . . . . . . . . . 76
xi

xii LIST OF FIGURES
4.3 Water to binder ratios (W/B) selected by masons. . . . . . . . . . 76
4.4 Air content of reference mortars. . . . . . . . . . . . . . . . . . . . 80
4.5 Determination of new composition. . . . . . . . . . . . . . . . . . . 82
4.6 Geometry of masonry specimens. . . . . . . . . . . . . . . . . . . . 92
4.7 Typical stress-strain diagram of a compressive test. . . . . . . . . . 93
4.8 Stress-strain diagrams of all masonry specimens by mason 3. . . . 93
5.1 Flow table diameter as a function of W/B. . . . . . . . . . . . . . 98
5.2 Plunger penetration and flow. . . . . . . . . . . . . . . . . . . . . . 99
5.3 Relations between results of different tests in preliminary tests. . . 100
5.4 Flow value as a function of vane yield stress. . . . . . . . . . . . . 100
5.5 Model values and experimental values for the plunger penetration test.102
5.6 Flow curves for 4 binder slurries. . . . . . . . . . . . . . . . . . . . 105
5.7 Coaxial cylinders measurements of lime hydrate slurries. . . . . . . 106
5.8 Flow curves of slaked lime putties at different solid fractions. . . . 106
5.9 Linear fit to logarithmic transformation of Krieger-Dougherty law. 107
5.10 Plastic viscosity as a function of solid fraction for binder slurries. . 109
5.11 Bingham yield stress as a function of solid fraction for binder slurries.110
5.12 Flow curves of mortars with different binders. . . . . . . . . . . . . 112
5.13 Flow curves of mortars with lime hydrate as a binder. . . . . . . . 113
5.14 Viscosity of mortar versus sand solid fraction. . . . . . . . . . . . . 115
5.15 Air content and sand solid fraction of lime hydrate mortar. . . . . 116
5.16 Experimental data and predicted curves for viscosity of bimodal andtrimodal mortars. . . . . . . . . . . . . . . . . . . . . . . . . . . . . 118
5.17 Compaction curve for Zutendaal sand. . . . . . . . . . . . . . . . . 119
5.18 Compaction curves for mortar mixtures. . . . . . . . . . . . . . . . 120
5.19 Working principles of the laboratory vane test for clayey soil. . . . 120
5.20 Typical vane experiment. . . . . . . . . . . . . . . . . . . . . . . . 121

LIST OF FIGURES xiii
5.21 Calculated vane shear stress with 4 formulae . . . . . . . . . . . . 123
5.22 Yield stress un-sheared and after pre-shearing. . . . . . . . . . . . 124
5.23 Adapted driving mechanism of the vane apparatus. . . . . . . . . . 125
5.24 Vane yield stress measurements of a lime hydrate mortar. . . . . . 126
5.25 Vane yield stress for different types of mortar. . . . . . . . . . . . . 127
5.26 Vane yield stress of lime hydrate mortar measured with 4 differentsprings. . . . . . . . . . . . . . . . . . . . . . . . . . . . . . . . . . 128
5.27 Shear stress as a function of time. . . . . . . . . . . . . . . . . . . . 129
5.28 Shear stress as a function of rotation angle. . . . . . . . . . . . . . 131
5.29 Rotation angle as a function of time. . . . . . . . . . . . . . . . . . 131
5.30 Working principle of the direct shear test. . . . . . . . . . . . . . . 132
5.31 Typical direct shear test on lime hydrate mortar (1.5 kPa). . . . . 133
5.32 Typical direct shear test on lime hydrate mortar (4.5 kPa). . . . . 134
5.33 Typical direct shear test on moist sand (7%). . . . . . . . . . . . . 134
5.34 Typical direct shear test on moist sand (14%). . . . . . . . . . . . 135
5.35 Peak shear stress as a function of normal stress for three types ofmortar. . . . . . . . . . . . . . . . . . . . . . . . . . . . . . . . . . 135
5.36 Peak shear stress as a function of normal stress for dry and moistsand. . . . . . . . . . . . . . . . . . . . . . . . . . . . . . . . . . . . 136
5.37 Squeeze tests on lime hydrate mortar. . . . . . . . . . . . . . . . . 138
5.38 Experimental result of squeeze test and Coulomb fitting. . . . . . . 139
5.39 Experimental result of squeeze test and Bingham fitting. . . . . . . 139
6.1 Adaptation of ASTM test apparatus to measure desorption properties.146
6.2 Fitting parameters to experimental results of suction test. . . . . . 147
6.3 Results of suction test on different mortars . . . . . . . . . . . . . 147
6.4 Desorption of lime hydrate mortar at different levels of ∆p. . . . . 148
6.5 Working principle and image of lab setup of the pressure cell . . . 149
6.6 Permeameter setup: longitudinal section and image. . . . . . . . . 153

xiv LIST OF FIGURES
6.7 Results of permeameter tests. . . . . . . . . . . . . . . . . . . . . . 154
6.8 Test specimen geometry for X-ray imaging of water transport. . . . 156
6.9 Water content as a function of Boltzmann variable. . . . . . . . . . 157
6.10 Attenuation profile for lime hydrate mortar. . . . . . . . . . . . . . 158
6.11 Attenuation profile for lime hydrate AE mortar. . . . . . . . . . . . 158
6.12 Attenuation profile for lime-cement mortar. . . . . . . . . . . . . . 159
6.13 Attenuation profile for hydraulic lime mortar. . . . . . . . . . . . . 159
6.14 Attenuation profile for cement mortar. . . . . . . . . . . . . . . . . 160
6.15 Attenuation profile for cement AE mortar. . . . . . . . . . . . . . . 160
6.16 Integrals of moisture fronts for different mortars. . . . . . . . . . . 162
6.17 Differential attenuation in the cement mortar joint. . . . . . . . . . 164
6.18 Experimental data for permeability of lime hydrate mortar. . . . . 166
6.19 Calculated values for permeability of different mortars. . . . . . . . 167
6.20 Fit of experimental data tot the Croney and Coleman formula. . . 167
6.21 Diffusivity of lime hydrate mortar calculated with two differentmethods. . . . . . . . . . . . . . . . . . . . . . . . . . . . . . . . . . 168
6.22 Incoming and outgoing flux in the jth control volume. . . . . . . . 170
6.23 Results of simulations of water transport (1). . . . . . . . . . . . . 172
6.24 Results of simulations of water transport (2). . . . . . . . . . . . . 172
6.25 Model curves for mortar and brick 15 minutes after contact. . . . . 174
6.26 Experimental curves for brick 15 minutes after contact. . . . . . . 174
6.27 Simulated moisture curves in cement mortar and brick. . . . . . . . 176
6.28 Three parameters which influence the squeeze force of mortar onsubstrate. . . . . . . . . . . . . . . . . . . . . . . . . . . . . . . . . 178
6.29 Image after and during squeeze test. . . . . . . . . . . . . . . . . . 179
6.30 Geometry of the brick specimen used as substrate for squeeze tests. 179
6.31 Results of squeeze tests with reference mortars on brick substrate. 180
7.1 Pocket vane apparatus with exchangeable vanes. . . . . . . . . . . 185

LIST OF FIGURES xv
7.2 Technical drawing of the upscaled new vane geometry. . . . . . . . 186
7.3 Combination of a suction setup and pocket vane tests. . . . . . . . 187
7.4 Test setup and data for calibration of the spring. . . . . . . . . . . 187

List of Tables
2.1 Standardised tests for consistency and workability of mortar. . . . 13
2.2 Standardised tests for water retention of mortar. . . . . . . . . . . 14
2.3 Standardised tests for consistency of binder paste and putty. . . . 15
2.4 Test parameters for flow table test. . . . . . . . . . . . . . . . . . . 16
3.1 Dry composition of reference mortars. . . . . . . . . . . . . . . . . 28
3.2 Size aspects of particles . . . . . . . . . . . . . . . . . . . . . . . . 30
4.1 Physical and chemical properties of binders. . . . . . . . . . . . . . 69
4.2 Physical properties of sands. . . . . . . . . . . . . . . . . . . . . . . 71
4.3 Physical properties of bricks. . . . . . . . . . . . . . . . . . . . . . 71
4.4 Outcome of hypothesis test about W/B. . . . . . . . . . . . . . . . 77
4.5 Working methods of masons. . . . . . . . . . . . . . . . . . . . . . 78
4.6 Composition of reference mortars. . . . . . . . . . . . . . . . . . . 79
4.7 Original and corrected values for W/B . . . . . . . . . . . . . . . . 81
4.8 Remarks of masons while working with solid facing brick. . . . . . 87
4.9 Remarks of masons while working with small and large perforatedbricks. . . . . . . . . . . . . . . . . . . . . . . . . . . . . . . . . . . 88
4.10 Priorities for mortars. . . . . . . . . . . . . . . . . . . . . . . . . . 89
4.11 Occurrence and appreciation of mortar types. . . . . . . . . . . . . 89
xvi

LIST OF TABLES xvii
5.1 Estimation of typical shear rates for applications of masonry mortar. 96
5.2 Results of selected mortars in preliminary standardised tests. . . . 99
5.3 Flow table test and plunger penetration test on reference mortars. 100
5.4 Solid fraction and Bingham parameters of binder slurries. . . . . . 104
5.5 Krieger-Dougherty parameters of lime hydrate and cement slurries. 110
5.6 Viscosity of slurries and Krieger-Dougherty parameters of mortars. 114
5.7 Model parameters for particles and solvent. . . . . . . . . . . . . . 117
5.8 Resilience of springs used in vane tests. . . . . . . . . . . . . . . . 123
5.9 Peak dilation angle αp() for different types of mortar. . . . . . . . 137
5.10 Peak dilation angle αp() for sand. . . . . . . . . . . . . . . . . . . 137
6.1 Results of standardised water retention tests on reference mortars. 144
6.2 Results of suction tests and filter press tests. . . . . . . . . . . . . 151
6.3 Fitted parameters for liquid permeability and potential of mortars. 169
7.1 Results of preliminary test on lime hydrate mortar. . . . . . . . . . 188
7.2 Results of preliminary test on cement mortar. . . . . . . . . . . . . 189
7.3 Relative increase of yield stress for both mortars. . . . . . . . . . . 189


Acknowledgements
A short word of thanks to all who made this PhD possible, in random order,especially those whom I undoubtedly forgot:
to my promotors Koen Van Balen and Dionys Van Gemert, for their supportthroughout the research, for the many useful suggestions and remarks, for theirconfidence, for everything they taught me;
to the members of the jury, for the dedication they showed in reading the manuscript,for finding the weaknesses without condemning the work, especially to CasparGroot and Nicolas Roussel, for taking the trouble of the trips to Leuven;
to the advisors Jan Elsen and Jan Vermant, for being my reference in their domainwhen it was needed;
to the people of Lhoist, for proposing the research subject, for their financial supportand their motivation till the end: Thierry Chopin, Frederik Verhelst, Ziad Habib,Alain Laudet, Daniel Daviller, Jérôme Minet, Michel Rizza, Margaret Thomson,Didier Lesueur and Angelika Rettel;
to my fellow researchers and friends at the civil engineering department, in thefirst place my office mates Özlem, Elke, Robbrecht, Iveta and Karel for the manybeautiful shared moments, and to Annelies, Ugur, Gert, Els, Rui and Saartje, notto forget my (ex-)colleague running mates Wine, Bjorn, Filip and Luc for theirappreciated help in clearing my mind, to Edwin for his kind help in experiments;
to the technical and administrative staff for their important contribution to thepractical realisation of many projects small and large: Kristine, Frank, Stephan,Luc, Noël, Jean, Gerda, Iris, Roger, Danielle, Danny and Freddy;
to colleagues in other divisions or departments for sharing their knowledge andprecious equipment: Staf Roels, Greet Kerckhofs, Johan Vanhulst, Erik Toorman,Steven Vandebril, Georgina Wilkins and Jan Mewis;
to colleagues farther away for their useful input: Margaret Carter, Carlos Rodriguezand Hans Janssen;
xix

xx ACKNOWLEDGEMENTS
to the Master students whose energy and intelligence boosted the experimentalresearch: Katleen Vermeir, Dries Becelaere, Roel Bonte, Wouter Debacker,Katrien Bruyninckx, and especially to Martin Rezeau for his out-of-the-ordinarycontribution;
to the contractors who participated in the research: Building, Verstraete enVanhecke, Monument Vandekerckhove, Corda, Hugé and De Bont;
to my friends who patiently learnt that mortar is not the same as concrete and thatscience can be a source of torment and distress: Tobe, Arend, Cecile (for passingme the job), Elise, Eva, Mieke, Toon, Katelijne, Arnout, Tomek, Anik, Giorgio,the boys band boys, Veerle and the others;
to my family for the often invisible but important and continuing backup in all myprojects,
thank you.
Roel Hendrickx
October 2009

Abstract
Workability of mortar is a complex notion, in the first place because it is acombination of properties and hence difficult to measure as a whole, and secondlybecause mortar itself is a complex material, which has characteristics of differenttypes of material. The initial problem statement of this research is that no reliablemeasurement techniques for workability exist, which provide a link between thesubjective feeling of the mason using a mortar on site, and measurable physicalproperties of the material.
Existing definitions of workability were extended, based on practical experimentswith 6 masons and 7 types of mortar. The different aspects of workability weretranslated into physical parameters of rheology, water transport, density, andother properties related to friction and adhesion. The experimental part startswith the measurement and description of the rheology of mortars and binderslurries in different flow regimes: hydrodynamic, lubricated or frictional. Mostlyrotational methods were used with different sizes and geometries. Secondly thewater transport was measured using newly developed setups made up of existingparts and apparatuses. The mortar is assumed in this approach to be oversaturated,and consolidating while its interstitial liquid is being desorbed through contactwith a brick. Models are proposed and validated for the rheological interpretationand the calculation of water transport. Next to this more fundamental work, anew experimental method was developed to combine aspects of yields stress anddesorption of liquid in one relatively simple test. The two main features of thistest are a pocket vane apparatus and a suction apparatus.
The results of the experimental and theoretical research allow to link the propertiesof the components and the mix ratios to the properties of the mix. This offerspossibilities for quality assessment and product design of mortars. The combinationof the studied properties makes up the workability, a concept through which abridge is made between physical parameters and practical use for masons.
xxi

Samenvatting
Verwerkbaarheid van mortel is een complex begrip, vooreerst omdat het eencombinatie is van eigenschappen en daardoor moeilijk in zijn geheel te meten, enten tweede omdat mortel zelf een complex materiaal is, dat kenmerken vertoont vanverschillende materiaaltypes. De initiële probleemstelling van dit onderzoek washet gebrek aan betrouwbare meetmethodes voor verwerkbaarheid, die een verbandleggen tussen het subjectieve aanvoelen van een metselaar op de werf, en meetbarefysische eigenschappen van het materiaal.
Aan de hand van een praktijkgericht experimenteel onderzoek met 6 metselaars en7 soorten mortel werden bestaande definities van verwerkbaarheid gepreciseerd enaangevuld. De verschillende aspecten van verwerkbaarheid werden vertaald naarfysiche parameters van reologie, watertransport, dichtheid, adhesie en wrijving. Hetexperimenteel gedeelte vangt aan met de meting en beschrijving van de reologievan mortels en van de brij van bindmiddel en water in verschillende vloei-regimes.Daarbij werd vooral gebruik gemaakt van rotationele methodes in verschillendematen en geometrieën. Ten tweede werd het watertransport gemeten aan de handvan nieuw ontwikkelde technieken die samengesteld zijn uit bestaande onderdelenen apparaten. Daarbij werd aangenomen dat de mortel initieel oververzadigd is,en dat hij compacteert wanneer er water uit onttrokken wordt door contact meteen baksteen. Modellen voor de reologie en het watertransport zijn voorgestelden gevalideerd. Naast dit fundamentele werk is ook een nieuwe proefmethodeontwikkeld die meting van de vloeidrempel en het onttrekken van water combineertin een eenvoudige test. De twee belangrijkste elementen hiervan zijn een zak-vin-apparaat en een zuigapparaat met vacuümpomp.
De resultaten van het experimenteel en theoretisch onderzoek laten toe om deeigenschappen van de componenten van de mortel en de mengverhoudingen teverbinden met de eigenschappen van de mengeling. Dit opent mogelijkhedenvoor kwaliteitscontrole van mortels en productontwikkeling. De bestudeerdeeigenschappen vormen samen de verwerkbaarheid van de mortel, een begrip datde brug vormt tussen fysiche eigenschappen en het praktisch gebruik door demetselaar.
xxii

Chapter 1
Introduction
1.1 Problem statement
Workability is considered to be the most important property of fresh mortar (ASTM,2004a; RILEM, 1978; Oates, 1998). It is strongly related to the workmanshipof the craftsman. The mortar’s workability and the mason’s workmanship are adetermining factor for the quality of the execution of masonry, which, together withthe intrinsic qualities of the used materials, in turn determines the overall qualityof the composite. This includes its strength, frost resistance, resistance to waterpenetration, deformability and resilience, surface hardness, etc.. Simple inquirieslearn that masons are not so much concerned about these qualities of hardenedmasonry: as long as they think the workability is good, they are happy. As alogical consequence water content of fresh mortar is determined by the subjectivefeel of workability, and not by concerns of strength or durability.
The influence of early-age phenomena on durability-related properties has beenthe subject of some study. Especially the transport of water between bricks andmortar influences the quality of the interface (Brocken and Larbi, 1999; Groot,1993; Brocken et al., 1998; Bowler et al., 1996b). Authors stress the need formore research about the physics of these phenomena (Hall and Hoff, 2002). Themechanism of bricklaying itself also gives rise to unequal bond strength development,especially over the top interface of each brick (Vermeltfoort, 2005). Importantdifferences in bond strength due to workmanship of the mason have also beenreported (Baker, 1979). Among the multitude of influencing factors, workabilityof mortar emerges as the most unclear, ill-defined, and indeed hard to measure.This scientific vacuum is recognised by normalising committees in the field. AnASTM committee states that “The mason can best assess workability observing the
1
2 Introduction
response of the mortar to the trowel” and a RILEM committee concludes likewisethat “All known test methods are inferior to the craftsmen’s judgment”, therebyconfirming the lack of adequate measuring tools (ASTM, 2004a; RILEM, 1978).
In common Belgian practice mortar is either delivered as a pre-fabricated dry orwet mix, or it is composed on-site of separate components. In the case of on-sitecomposition and dry pre-fabricated mortars, the water content is determined bya mason or an assistant shortly before the application. A well-known problemoriginates from the fact that a mortar composed of well-graded sand, cementand water, in mix ratios prescribed by standards, usually has poor workability.Admixtures like air-entraining agents are typically used to mend these problems.On the other hand, too much entrained air gives a poor bond: 14% to 17% isstated as a maximum (Grimm and Houston, 1975; Grimm, 1982; SBR, 1985). Theuse of other binders than cement, or the addition of lime, may provide alternativesolutions. The addition of lime hydrate powder to masonry mortar has an importantinfluence on several aspects of its workability (Van Balen and Van Gemert, 1990).When comparing these different types of mortar, existing standard methods toassess workability fall short: it appears that mortars with very different behaviourhave equal rates, or that mortars with the same rates behave differently (Bowleret al., 1996a; RILEM, 1978; Van Balen and Van Gemert, 1990). This means thatthese tests are not material-independent. The best-known example is the flowtable test, for which target values are given in building standards. These valuesare suited for cement mortar, but they result in unworkable lime mortars.
The feeling of workability is subject to regional and national differences. This isrecognised in international investigations and by international industrial producersin the domain. Reasons for this can be found in the influence of the sand, whichis mostly a regional product, and different traditions in education, use of tools,climatic differences, etc.. This subtle variation emphasises the problematic goalof setting target values, e.g. in European standards, and the need for adequatemeasuring methods to assess them.
1.2 Aim of the research
To be successful in analysing workability, the multitude and the complexity ofits parameters have to be recognised. An adequate measurement of workabilitymeans that different aspects have to be quantified in well-described test procedureswhich are repeatable and reproducible. The variability in mortar components (sandgrading and surface characteristics, binder composition and grinding fineness, ionicstrength of the tap water, etc.) greatly complicates this matter.
Priority goes to testing methods which are practical, cheap and easy to performon-site or in an equipped laboratory. The breeding ground of such proposals is a

Methodology 3
thorough and well-founded assessment of existing methods, either standardised ornot. Their evaluation is included in a state-of-the-art (Chapter 2). By consequencethe two possible tracks leading to the primary aims are: select and/or adapt suitableexisting methods, or develop one or several new testing methods from scratch.
Two secondary goals can be formulated: a scientific description of mortarmixtures, and the development of tools for optimisation. Suitable terminology andmathematical formulations to assess mortar mixtures are lacking in literature: theneed for such a framework however urged itself in the course of the research. Adescription of the phases with a consistent use of symbols has to be developed inorder to frame and control the subject. Even if many researchers proposed theirown consistent notations for some aspects, a wide approach over the domain offresh mortar was not found. Secondly any measuring method or tool for theoreticalanalysis may prove useful for optimisation of mortar compositions. Equations forimportant parameters such as viscosity or water permeability of the material canbe used as input for an optimisation scheme. For some cases a minimum viscosityfor a set solid fraction of mortar may be ideal, or a minimal variability of viscosityas a function of water content. A clear understanding of a mortar’s workability asa function of the properties of its components opens the way to optimisation of thecomposition. Such possibilities will be briefly discussed, but not discussed in detail.
A third aim, which was developed as a sidetrack, is the assessment of the influenceof workability on the mechanical strength of masonry. This is relevant for thestatistical quantification of the variability in masonry due to workability-relatedissues. Because of the limited overlap with the main subject, this part is onlybriefly mentioned in the text.
1.3 Methodology
The foundation for the composition of reference mortars is laid in practice-basedexperiments. The idea for these experiments emerged from the (problem) statementthat the mason’s judgment is still the most reliable criterion. An international testpanel of experienced masons was invited to work in the laboratory with differentkinds of brick and different types of mortar. The experimental work is describedin Chapter 4. It is left to their judgment how the eventual reference mortars arecomposed, and their comments serve as a basis for a broad definition of workability.The problem is split up into many parts, each of which is to be linked to measurablephysical quantities. The identification of the relevant phenomena is the first step.Two major clusters of properties were identified: the rheology-related propertiesand properties of water transport and related transport of solid matter.

4 Introduction
Theoretical background
The second step is the search for a suitable theoretical framework for each of theobserved processes. This is far from evident because of the lack of precedents,and in many cases it involves a relatively quick prospecting-like scan of a vastfield of disciplines. Each separate discipline tends to have a typical (historicallygrown) terminology and prerogatives. As rheology is concerned, we made thechoice to investigate the feasibility of traditional suspension rheology, applied tothe case of highly concentrated suspensions. The applied concepts from rheology,as well as those from other disciplines, are described in Chapter 3. One may arguethat the theory of (semi-dilute) suspension rheology is not suited, because of theimportance of phenomena related to the granular nature of the material and theobvious multi-phase behaviour. Therefore a series of concepts from soil science areintroduced and developed within the context of mortar applications. A third track,which was identified initially but not further developed, is the one of granularmechanics, in which discrete particles are considered. Most of the applications inthis field concern dry materials, or grains with water menisci between them. A wayof applying it to mortar-like mixtures was not obvious.
The nature of the forces which determine the movement of particles in a mortar alsoobliged to introduce concepts of colloid physics. Colloids are two-phase systems ofwhich one has at least one dimension between the nanometer and the micrometer.Especially lime particles suspended in water are subjected to colloidal forces, nextto gravity and hydrodynamic forces. As a last field of interest the physics ofporous solids is involved, because of the importance of the suction of bricks for theworkability of mortar. Building physics offers suitable methods to analyse masstransport through bricks. It is clear that neither rheology, soil science, colloidscience nor building physics can give a complete answer to the questions at hand.An attempt is made to apply suitable theories from these different fields to partialproblems and to combine them to one useful corpus.
Limits of the subject
The scope of the research is also determined by the chosen limits in time andtype of materials. Only the workable time of a freshly mixed mortar is considered:practically we restrict this to the first two hours. This falls within the so-calleddormant period of hydration reactions in cementitious materials and before thestart of setting of all mortars. The process of drying, setting and eventuallyhardening, is explicitly excluded from this investigation, as are all chemical andphysical processes involved with it. Possibilities of artificially influencing workabletime with set retarders and accelerators are not considered.
The materials used in the experiments are chosen in order to cover a wide range

Methodology 5
of binder types. This is motivated by the aim of searching material-independentmeasuring methods. The practical applications of these mortars are not the firstconcern: a pure lime hydrate mortar is included in the programme, even if it isnowadays not allowed to use within the prescriptions of the Eurocode for masonry.We have a strong interest in the material itself, for a better understanding of itsinfluence when combined with other binders. These other binders include normal(Portland) cement, natural hydraulic lime, a mix of lime hydrate and cement, andtwo products with admixtures (lime hydrate and cement). Their properties aredescribed in detail in Section 4.2.
Experimental investigations
The experimental work on the rheology of mortar is gathered in Chapter 5. Allexperiments related to water transport phenomena are described in Chapter 6. Inboth chapters the mortar compositions used are those that were derived from thepractical experiments with masons which are derived in the preceding Chapter 4.Most of this experimental work involves the development of suitable test methods,which are described in detail. Towards the end of the experimental part, some testsare introduced which combine rheological measurements with water transport.
New test methods and conclusions
The outcome of the experiments and their analysis are used for the developmentof a new test method for mortar workability in Chapter 7. The principles of thismethod follow from the practical criteria explained before, and the implementationfollows the gained experience of rheological and hygric mortar testing. Preliminarytest results are given to assess the feasibility of the proposed method.
The concluding Chapter 8 summarises the most important contributions to thediscipline of mortar workability and the possible benefits for masonry practice.The remaining gaps in theoretical and experimental work are identified and lead toa series of propositions for further research.


Chapter 2
State of the art
2.1 Concise literature review on workability
The workability of mortar has received very little attention in scientific literature,when compared to other materials like concrete. Several causes may be at thesource of this lack: mortar is still considered as a low-tech material, with applicationtechniques strongly rooted in tradition, the market nowadays is increasinglydominated by a limited number of companies which protect their technology,and last but not least: mortar workability is a very complex matter. It is acombination of many aspects, involving the properties of micro-scale and nano-scale colloidal systems, together with the problems of meso-scale and macro-scaleapplications. This complexity is masked by the prevailing use of a limited numberof binders on the market.
Definitions
The definition of workability is addressed in various texts, which are often owingto the work of standardizing institutions or specialized committees. The non-mandatory appendix to ASTM standard C 270-04a provides a good basis for adefinition : “Workability is the most important property of plastic mortar. Workablemortar can be spread easily with a trowel into the separations and crevices of themasonry unit. Workable mortar also supports the weight of the masonry units whenplaced and facilitates alignment. It adheres to vertical masonry surfaces and readilyextrudes from the mortar joints when the mason applies pressure to bring theunit into alignment. Workability is a combination of several properties, includingplasticity, consistency, cohesion, and adhesion, which have defied exact laboratory
7

8 State of the art
measurement. The mason can best assess workability observing the response ofthe mortar to the trowel.” And further: “The capacity of a masonry mortar toretain satisfactory workability under the influence of masonry unit suction andevaporation rate depends on the water retentivity and setting characteristics of themortar (ASTM, 2004a).” In the same philosophy Kampff identifies six propertiescontrolling workability: consistency, water retention, time of set, weight, adhesionand penetrability (Kampff, 1961). Problems arise however when vague conceptslike consistency and plasticity have to be assessed in detail.
A RILEM committee distinguished workability, consistence and plasticity as follows:“Consistence is that property of a mortar by virtue of which it tends to resistdeformation; plasticity is that property of a mortar by virtue of which it tendsto retain its deformation after the reduction of the deforming stress to its yield”(RILEM, 1978). And workability is defined as a combination of factors whichdetermines the ability of the mason to do his work. An experimental programmeby that same RILEM committee involving 5 masons led to the conclusion that (1)all craftsmen were able to attain the desired consistence independently of the (dry)mix composition, (2) each craftsman has an individual ideal consistence, (3) allknown test methods are inferior to the craftsmen’s judgment and some are notsuited for mortars made with specific binders.
The measurement of workability
A short review on the measurement of workability, focusing on some well-knownstandard methods, is published in Bowler et al. (1996a). The authors state thatconsistence is determined by water content and measured by plunger penetrationtest or dropping ball test. Plasticity on the other hand is related to permanentdeformation after application of stress (if it is higher than yield stress) and itis measured with the flow table. Correlation between plunger penetration anddropping ball values is demonstrated, as well as between plunger penetrationand flow table, however with different coefficients for air entrained mortars andother mortars. The flow table is stated to give a good measure for workability ascohesivity at constant consistence. In the definition of the authors, consistence isrelated to the result in the penetration tests and cohesivity to the result of the flowtable test.
Although these findings illustrate the blurry definitions of the terms used, theydemonstrate nonetheless that different experiments are necessary to characterise amortar’s workability, and that some general phenomena could be identified: theinfluence of air entraining agent on water need, and the problematic behaviour ofordinary Portland cement mortar, which evolves from too stiff to lacking cohesionwhen more water is added.

Concise literature review on workability 9
Rheology
The measurement of rheology of mortar has been reviewed by Banfill et al. (2006).He distinguished - apart from the empirical standardised methods - three categoriesof tests: rotational rheometry, compressive rheology and test methods with practicalfocus. Most rotational methods have their origin in concrete rheology. Some of thereviewed methods have only very limited published data. One of the methods whichwas effectively used, mainly on liquid mortar and paste, is the Viskomat method(Banfill et al., 2006; Flatt et al., 2006; Seabra et al., 2007; Golaszewski, 2004)(Section 5.3). Kaci et al. (2009) used a vane-like geometry in a recent investigationof rendering mortars, pointing to issues of thixotropy and shear thinning. Animportant contribution to coaxial cylinder rheometry of cementitious materials ismade by Wallevik, who not only created a framework to describe the basic equationsof flow for the heterogeneous material, but also applied a microstructural thixotropymodel to the observed phenomena with some success (Wallevik, 2003, 2005). Noorand Uomoto have also obtained meaningful results for concrete mortars with acomparable test method using roughened coaxial cylinders (Noor and Uomoto,2004). Yield stress measurements on mortar with a vane are also reported (Rajgelj,1985; Bauer et al., 2007), or with a pin or a ball which moves through the mortar(Tresouthick et al., 1993; Laüger et al., 1999).
Much more abundant are the references to rheology of small scale systems, i.e.binder pastes or slurries without sand. A number of researchers applied classicalrheometric methods (Struble and Sun, 1995; Mansoutre, 1999; Saak et al., 2001)or a mixer-type rheometer (Lootens et al., 2004). In the publications of Rousseland Coussot (2005); Wallevik (2005) the results are used to calibrate thixotropicmodels. Among alternative test methods much attention was recently given toslump tests (Clayton et al., 2003; Roussel, 2005; Saak et al., 2004; Schowalter andChristensen, 1998; Pashias and Boger, 1996), squeeze tests (Toutou et al., 2005;Roussel et al., 2006) and the Marsh cone test (Roussel and Le Roy, 2005).
Specific research about hydrated lime pastes and slaked lime putties, and thedifference between both, can be found in Ruíz-Agudo and Rodriguez-Navarro(2008b,a), Vávrová and Kotlík (2004), Atzeni et al. (2004, 2006) and Strotmannand Jägers (2000). As early as the 1950’s, Backmann already showed the basicsof lime hydrate slurry rheology in two remarkable studies (Backman, 1953, 1954),which unfortunately do not appear to have incited other researchers to publishon the subject. He presented an adequate Couette-like rheometer and obtainedconvincing flow curves.

10 State of the art
Water retention
Several authors have mentioned water retention as one of the desirable propertiesof a workable mortar (Kampff, 1961; Van Balen and Van Gemert, 1991; Thomson,2000). Only recently it has been the subject of a more rigorous description as aquantity of desorptivity: the mortar is considered as a porous soft solid whichis dewatered in contact with an absorbing masonry unit. A theoretical basis isprovided by Hall and Hoff (2002), experimental validation is published by Greenet al. (1999), Carter et al. (2003) and Collier et al. (2007).
Building lime
An extensive bibliography until March 2003 about lime and its use in conservationis available by the Getty Conservation Institute (Getty conservation institute, 2003).Comprehensive information about the chemical and physical properties and theuse of lime can be found in the work of Boynton and Oates (Boynton, 1966; Oates,1998). More recent general publications with reference to building practice andlime putties are available by Elert et al. (2002), Hansen et al. (2008), or in Dutchby Van Balen et al. (2003) and in German by Stark and Wicht (2000). Usefulpublications concerning practical use are published by schools in Avignon and León(Ecole de León, 2004; Ecole d’Avignon, 2005), both focusing in the first place onrender and plaster applications. Early research on measuring plasticity of buildinglime was done in the beginning of last century by Warren Emley (Emley, 1920,1917). His quest to find suitable test methods and to understand the nature oflime plasticity was a great inspiration for this PhD.
Lime and workability
Several authors investigated the influence of lime as a binder on the workability ofmortar. Van Balen and Van Gemert demonstrated the advantages of the addition oflime hydrate in cement mortars for water retention and the prevention of segregationand bleeding (Van Balen and Van Gemert, 1991). A general appreciation ofworkability of mortar with natural hydraulic lime as a binder is given by Hanleyand Pavía, but their measuring method is limited to the flow table (Hanley andPavía, 2008). Thomson and Godbey investigated different workability aspects forlime hydrate mortars: plasticity, water retention, soundness and sand carryingcapacity (Thomson, 2000; Godbey and Thomson, 2002). Green studied the effectof addition of lime specifically for water retention (Green et al., 1999).

Standards on fresh mortar properties 11
2.2 Standards on fresh mortar properties
2.2.1 Overview of European and other standards
Most standards about building materials can be classified in one of three groups:(1) product standards, which describe a product and its requirements; (2) teststandards, which describe test methods to check if a product complies to therequirements, and (3) design standards, which provide the rules according to whicha building can be designed, calculated or constructed. Standards which have thesame subject or which describe different test methods for the same material aregrouped together in series.
This study is in the first place restricted to the European context, and will refermostly to CEN standards, except when other known standards describe interestingalternative test methods or provide a basis for comparison. In this section we donot mention the specific edition or year of publishing of the standards. In theexperimental sections they will be mentioned for each test. The standard EN1996-1-1 or Eurocode 6 (CEN, 2002) gives the general rules for constructions innormal and strengthened masonry, including the basic requirements of mortar.The regulations are different according to the type of mortar: pre-batched mortar(wet or dry) has to comply to the EN 998-2, while mixed-on-site mortars aresubjected to separate rules (art. 6.3.2) (CEN, 2003). Classification can be basedon design strength (category M1 to M15), or on composition in volume partscement:lime:sand. Any general purpose mortar should have at least the strength ofa M1 mortar. About the workability of mortars there is no requirement, exceptthat the consistency of the mortar should be “appropriate for the type of units”(art. 6.4.2). Vice versa the units may be prepared for a good bond with the mortarby wetting.
The most important series of mortar test methods are the EN 1015 standards,which describe among others: sieve analysis, sampling, consistence by flow tableand plunger penetration, density and air content, workable time, bending tensilestrength and compressive strength (CEN, 1998). The EN 988-2 resumes many ofthese items, but applies them to ready-made mortars (CEN, 2003). Specifically forlime the EN 459-1 defines the different types of binders and the EN 459-2 describesthe test methods (CEN, 2001). The EN 459 series overlaps partially with the EN1015 series and with the EN 196 series, which is the reference for cement mortars(EN 196-1 for strength and EN 196-2 for chemical analysis) (CEN, 1995). The EN413 series covers masonry cement, a term which is also common in the USA andwhich is used for pre-batched mixtures of hydraulic binders and additives, to whichsand and water have to be added (CEN, 2005). These standards also refer to theprocedures in the EN 196 series.
This short-list illustrates how the relevant test methods for fresh mortars are

12 State of the art
scattered over the different products that can be used: ready-mix mortars, on-sitemortars, cement, lime, or masonry cement. The same test procedure turns upseveral times, sometimes with subtle changes. Table 2.1 gives an overview ofthe tests that are proposed by several European and American standards, withthe reference, the tested property and measured quantity, as well as a schematicrepresentation. Some of these standards are superseded and are to be consideredas historical documents.
Consistency of mortar
The words consistency and consistence are used as synonyms in literature and areused as such in this text, depending on the use in the cited reference. The tests forconsistency of mortar can be classified in three groups: flow tests, penetration testsand other tests. The flow test will be discussed below in detail. Penetration testsmeasure the depth of penetration of an object with a certain mass which is releasedat zero (quasi-static) or finite height (dynamic) above a mortar sample. Thepenetrating object may be a ball, a cone or a cylindrical plunger with hemisphericaltop. The CEN-standardised plunger penetration apparatus is used in severalprocedures throughout this thesis.
The mobilimeter or mo-meter gives an empirical measure for the ability of themortar to flow out of a vertical recipient via a horizontal gutter under subsequentdynamic impacts. Data of this apparatus are rare and the link to practice or torheological properties is not clear. Hence this method is not further considered.
The workability meter gives a measure for the resistance against flow under vibration.A sample of mortar with an inclined lateral surface is released and put undervibration at prescribed amplitude and frequency. The time necessary for themortar to reach a certain height at the opposite wall of the container, is a measurefor workability. The apparatus presents a problem however, in that the vibratingmotor is connected to one side, so that the vibration is not the same over the lengthof the container. Calibration tests were performed with accelerometers on twopositions on the bottom. Two times integrating the data gives the displacement.It emerged from the data that the apparatus can not be calibrated properly: thedesign does not allow to reach the demanded accuracy. Results of this test aretreated as relative data only.
All standardised tests for water retention or resistance against bleeding have thesame working principle: a potential difference in water pressure is created and thequantity of evacuated water after a certain time is measured (Table 2.2). Thispotential difference can be realised with a vacuum pump, through contact withabsorbing paper, or simply by exploiting the difference between pore water pressurein the bulk of the mortar and at the surface (in the case of the bleeding test).

Standards on fresh mortar properties 13
Table 2.1: Standardised tests for consistency and workability of mortar.
Standard Property tested/measured quantity Apparatus used
EN 1015-03EN 459-2DIN 1164
ASTM C230BS 4551
Consistency of fresh mortar/diameter of slumped cone after shocking
Flow table
EN 1015-4EN 459-2EN 413-2DIN 4211
Consistency of fresh mortar/depth of penetration
Plunger penetration
BS 4551-1BS 6463-1
NBN B14-213
Consistency of fresh mortar/depth of penetration
Dropping ball
NBN B14-214ASTM C472-99ASTM C187
Consistency of fresh mortar/depth of penetration
Cone penetration app.
NBN B14-208 Consistency of fresh mortar/number of blows to empty receptacle
Mobilimeter
NF P18-452 Workability of mortar/time to reach specified deformation
Workability app.
Standards for the consistency of pastes and slurries are based on the modifiedVicat apparatus, the Emley plasticity meter or the flow table (Table 2.3). Themodified Vicat apparatus is in fact a penetration test with a cylindrical plungerin quasi-static circumstances. The flow table is in this context used to measurea number of shocks necessary to achieve a fixed diameter. This procedure washowever discarded in this research after preliminary tests: values of 220 to 260shocks were obtained for a normal lime hydrate (CL90 according to EN 459-1), andthe required bias could not be reached. The Emley plasticity meter is a remarkableapparatus which is successfully used to discriminate the quality of lime hydrates

14 State of the art
Table 2.2: Standardised tests for water retention of mortar.
Standard Property tested/measured quantity Apparatus used
ASTM C110-04.10 Water retention of hydrated lime/decrease in flow
Vacuum gauge apparatus
EN 459-2DIN 18555
Water retention of fresh mortar/mass ratio of retained water
Filter paper plates
EN 413-2NBN B14-212
Water retention/mass ratio of retained water
Filter paper and weight
NBN B 14-205 Bleeding of fresh mortar/mass percentage of released water
Pipette
for plastering purposes. Its working principles are discussed in Subsection 2.2.3.
2.2.2 The flow table test
The flow table is the most widely accepted apparatus to measure the consistencyof mortar. It consists of a circular plate which is lifted and then dropped overa specified height. The basic principle of slump and flow tests is that a sampleis poured or scooped in a conical or cylindrical frustum, which is then carefullylifted, so that the material is allowed to deform under its own weight. Be the initialheight h0 and initial base diameter d0, and the dimensions after deformation h andd, the (spread) flow is defined as f = d/d0 and the slump as s = h0 − h.
If the material’s yield stress is below the maximal shear stress caused by the weight,there will be a significant deformation (theory in Subsection 3.3.5). For most freshmasonry mortars, and for feasible values of h, this is not the case. The dynamicimpact induced by dropping the base-plane over a certain height increases the effectof weight, thus creating a measurable slump or flow. Some of the test parametersare the same for the different standards: the mould’s base diameter d0 = 10cm,top diameter dt = 7cm and height h = 6cm. Other parameters however may notbe constant and cause important differences (Table 2.4):

Standards on fresh mortar properties 15
Table 2.3: Standardised tests for consistency of binder paste and putty.
Standard Property tested / measured quantity Apparatus used
ASTM C110-04.6ASTM C187-04
Standard consistency /depth of penetration
Modified Vicat app.
ASTM C110-04.7 Plasticity /combined time and torque
Emley plasticity meter
NBN B 13-206 Plasticity/number of shocks for specified flow
Flow table
1. The dropping height: the higher the table and mortar fall, the higher thevelocity at the moment of impact and thus the larger the amount of energyto be dissipated in deformation of the sample.
2. The number of shocks: a higher number evidently gives a higher flow value,although after an initially strong increase, the diameter will only increasemarginally because the driving force decreases with decreasing sample height.
3. Mass of moving parts and apparatus stiffness: the total mass falling is thesum of the mass of the top parts (plate and shaft) of the apparatus and themass of the mortar sample. If the effects of friction in the apparatus and withthe air, and of the elastic effects at the impact can be neglected, no differenceshould be recorded. This means that it is assumed that the rigid plate goesfrom finite velocity to zero velocity in an infinitesimal time interval. However,given the fact that impact effects probably do play a role, a different masswill lead to a slightly different result. The apparatus goes through a phase ofdamped oscillation, as is the case with the mortar itself.
4. Surface type: it can be empirically observed that some mortars display higherfriction in contact with some materials than with others (metal, plastic, glass).In all cases, an unscratched and perfectly even plate should be used, butdifferent surface treatment and different material properties may cause largevariation. Tribometric experiments may clarify this question, but are notavailable in literature.

16 State of the art
5. Lubrication: this can strongly decrease the friction between the sample andthe table. Reproducibility is however a major issue: the thickness of thewater or oil layer is hard to control. In general the test is designed to measurethe properties of the mortar, and not of the mortar-plate interface. Fromthis point of view, and to be consistent with free slump theory, an optimallubrication is preferable.
Table 2.4: Test parameters for flow table test in different standards.
ASTM C230-03 EN 1015-3 EN 459-2Height of drop (mm) 12.7± 0.13 10± 0.2 10± 0.2
Number of 25 15 15shocks in 15 s
Mass of 4.08± 0.05 3.25± 0.1 4.2 to 4.5moving parts (kg)
Surface type Cast bronze, Rockwell Any (e.g. glass or Polished stainlesshardness 25 HRB stainless steel), steel coarseness
resistant to corrosion ≤ 0.0032mm,coarseness with engraved≤ 0.005mm circle
Lubrication Lightly lubricated Lightly lubricated No lubrication (cleanwith light oil with very low and dry surface)
SAE-10 viscosity non resinmineral oil
The strength of the flow table is that it gives an indication of yield stress. Theanalytical expressions for slump from existing publications provide a relationbetween dimensionless values of stress and slump (or flow). Thus we may expectto find meaningful results if stresses are scaled with ρMgh0 and diameters with d0.This is in agreement with observations by other authors that air entrained mortars,which have lower density, need higher flow values than other mortars (Bowler et al.,1996a). Indeed if these air entrained mortars have a comparable yield stress, theirdimensionless yield stress will be much higher, due to their lower density, whichcauses a lower flow.
2.2.3 The Emley plasticity meter
The Emley plasticity meter is designed to measure an index for the plasticity oflime pastes or mortars. The history of its development is documented in (Emley,1917, 1920) and the standard procedures and apparatus are described in the ASTMC110-04 standard (ASTM, 2004b). The standard is only referring to lime pastes,but in the original publication Emley also describes its use for mortar. Tests arecarried out on pastes with a W/B which leads to a fixed penetration with the

Standards on fresh mortar properties 17
modified Vicat apparatus (standard consistency). The cylindrical sample is placedon an absorbing base plate and brought into contact with a metal top plate (Fig.2.1). When the motor is in action, the base plate moves at constant rate upwardsin helicoidal motion, while the top plate remains in position. By this movementthe sample is subjected to a combination of compression, torsion and desorption ofwater. The torque which is transferred to the top plate is recorded with a cantileversystem. The test is ended when the maximum torque of the scale is reached, orwhen the torque stops increasing, i.e. when the sample looses its strength. At thatmoment the time TE and torque value F are recorded and imputed in the formulafor plasticity index P :
P =√T 2E + (10F )2 (2.1)
Figure 2.1: Emley plasticity meter with gypsum base plates.
A material will have a low P if it looses water quickly, which leads to fast stiffeningand premature ending of the test, or if it has a low resistance to shear.
Although the method has proven its use to distinguish different types of lime(Thomson, 2005), there is no real scientific basis for an interpretation in physicalterms. The repeatability of the test in the same lab can be fairly good (variationsaround 10% in our experiments), but reproducibility depends on several factors.
1. The sorptivity and porosity of the absorbing base plates may vary. Some dataabout the bias due to the base plate are presented in Godbey and Thomson(2002).
2. It is difficult to achieve the same initial normal force (in a repeatable way).The test can start when the sample is in contact with the top plate, butupward movement of the sample is only possible in steps, so it can be difficultto find the right position, for a low but non-zero value.
18 State of the art
3. The course of the test is not always continuous. Ideally the increase in torquewould be monotonic, but in fact often slip-stick phenomena can be observed,which cause a small temporary decrease. Slippage occurs at the interfacewith the base plate.
2.3 Non-standardised tests for fresh mortar
This section deals with those workability-related test methods that were foundin literature and that can not be related to one of the standardised proceduresdiscussed above. Among these are simple hand-operated tests, a series of mixer-typerheometers and moving object rheometers, concrete rheometers which can also beused on the scale of mortar, dynamic impact setups, a dewatering rheometer and atribometer.
2.3.1 Simple hand-operated tests
This type of tests is most common in practice, but least of all reproduced inscientific literature, even though they are recognised as the most authoritativeavailable (Kampff, 1961). The methods for which no sources are mentioned, arederived from the experimental programme discussed in Chapter 4. The first methodconsists of moving the trowel through the mortar to judge it. The resistance tostirring should be correct, and some masons may consider the scraping sound ofthe trowel as an indication for the mortar to be too lean.
Another wide-spread method in Belgium is the bread-making or sausage-makingtest. A quantity of mortar is taken on the trowel or in hand, and tossed over andover a couple of times. If it forms a cohesive ellipsoid volume, without sticking tothe trowel or hand, it is judged workable.
In some tests the interaction with the brick is also taken into account. This may beas simple as smearing a mortar layer on one brick in a thickness of e.g. 2 cm, andthan squeezing the excess mortar out of the joint with a second brick which comeson top of it. If squeezing does not require excessively high force, the mortar isworkable (oral information by C. Groot, TUDelft). One step further is to leave thebricks in contact for some time (e.g. one minute), and then to separate them againby pulling in the direction perpendicular to the joint. If the mortar divides overthe two bricks, workability is good and a sufficient bond can be expected (Westra,1973).
A similar procedure where the bricks are not separated, but simply lifted andchecked for remaining together after 15 minutes, is the Canadian Suter couplet test.A variant of the same is used in New Zealand. In RILEM test MR5 the bricks

Non-standardised tests for fresh mortar 19
of a newly made couplet are wrenched apart after some minutes, to check wetherrupture takes place in the mortar or brick (RILEM, 2009).
2.3.2 Mixer type rheometers
In stead of creating one of the standard rheometric flow geometries (coaxial cylinders,cone and plate or parallel plates), viscosity can be measured through the torqueexerted on a rotating mixer paddle. Many different shapes of blades can be found.The paddles as proposed by Banfill of Tattersall were extensively used for concreteand are more recently also applied to earth mortars (Banfill, 1994; Azeredo et al.,2008). The Viskomat by Schleibinger has a paddle with inclined planes, whichprevents premature sedimentation (Fig. 2.2). The paddle is lowered into the pot,which rotates at controlled angular velocity. The torque on the paddle is measuredwith a force cell. The major advantage of these mixer type rheometers are theease of use and the prevention of sedimentation and shear localistation. Thedisadvantage lies in the difficulty of interpreting the outcome in terms of rheologicalparameters.
Figure 2.2: Viskomat mixer-type rheometer: vertical section,lateral section through paddle and horizontal section.
2.3.3 Moving object rheometers
By moving an object through a mortar at controlled speed or force and measuringthe other parameter, some information can be obtained about the resistance of themortar against shearing or squeezing. Paar Physica developed a rotating ball fixturefor a rheometer, with a ball of diameter 10 mm, which moves over a circular orbitthrough mortar. The passage of the ball disturbs the mortar, so that measurementscan only be taken over the time span of one revolution. The apparatus has beenused to compare the influence of different types of methyl cellulose on the rheology

20 State of the art
of lime cement plasters (Müller, 2000). The resistance of a ball moving at velocityv through a Newtonian liquid can be conveniently described as long as there is noturbulence: F = 6πηvR (Hiemenz and Rajagopalan, 1997). When the viscosity andyield stress of a mortar is low enough, a ball’s dropping velocity due to gravity canbe used to calculate viscosity: this type of setup is conventionally called Höpplerviscometer. In yield stress materials the final height of a dropping ball can alsobe used to calculate yield stress, when some assumptions about the process aremade (Vogel, 2006). If a Bingham model is assumed for the mortar, and if thespeed of the ball can be measured or controlled viscous drag, shear stress and shearrate can be calculated according to Noaya (cited in Noor and Uomoto (2004)). Amechanism for lifting a ball at constant speed was successfully applied by Noorand Uomoto (2004).
In a workability meter developed by a team of American consultants, the dragexerted on a moving pin or stylus is measured, in stead of a ball. Contrary to the balldrag instruments, it is the mortar which moves (in a rotating bowl) and the forceexerted on the pin is measured. Because of the large size of the bowl and the slowrotation, values are recorded over a period of 35 minutes before the disturbed zoneis reached again. Therefore the outcome is also used as an indication of workabletime and thixotropic build-up, as long as there is no segregation (Tresouthick et al.,1993).
2.3.4 Concrete rheometers
Most of the test setups that have been developed to measure workability of concretecan be used also for mortar in a more or less adapted form (Bartos et al., 2002).The Contec Visco5 is a coaxial cylinder viscometer with vane-shaped inner andouter cylinder planes (Fig. 2.3). Fixtures of different sizes can be fitted to themechanism. The difference with a classical Couette geometry (with conical lowerend) is that the forces on the lower part are not measured: only the torque on thecylindrical part is taken into account. This apparatus is developed for use with selfcompacting concrete and has also been used to measure cement pastes (Wallevik,2003; Heirman et al., 2009; Wallevik, 2005). The outer cylinder rotates (shear ratecontrolled) and the torque on the inner cylinder is recorded.
The BTRheom is another concrete rheometer, developed at LCPC, to measurerelatively fluid concrete. Because of the alternative horizontal ring-shaped geometry,it offers the possibility to measure the vertical dilation or expansion of the materialwhile sheared (Bartos et al., 2002), a feature which is more common in soil mechanicsor granular mechanics (Lootens et al., 2005). However this apparatus does notoffer the possibility to downscale the measuring unit to optimal sizes for mortar.

Non-standardised tests for fresh mortar 21
Figure 2.3: Measuring geometry of Contec Visco5 concrete rheometer,custom-built for use with mortars: vertical and horizontal section.
2.3.5 Dynamic impact setups
Most of the standardised tests include a dynamic impact to deform mortar, becauseof its relatively high yield stress. Applying deformation with a dropping mass alsohas the advantage of easily quantifying the energy that is transferred to the mortarfor deform: kinetic energy of the mass equals viscous deformation energy dissipatedin the sample. Casali and Prudencio (2008) developed a setup where the numberof blows to obtain a fixed reduction in height is recorded. This number can beexpressed as an amount of energy.
2.3.6 Dewatering rheometry
The development of a suspension’s elastic modulus during the process of evacuationof the liquid phase can be measured with the immobilisation cell by Paar Physica.The setup was developed to follow up the development of paper coatings. As thesuspension’s solid fraction increases, the moduli increase likewise. An assumptionabout the dewatering kinetics is necessary to draw conclusions about the rheologicalparameters (Wollny, 2001).
2.3.7 Tribometer
Tribometry is the discipline concerned with measuring frictional stress betweendifferent materials. Most tribometers measure the force needed to move a plane witha certain roughness and normal force over a pasty or granular material at a certain

22 State of the art
speed. Friction between the blade of a trowel and mortar is an important factorin mortar workability. No direct reference were found, but successful experimentshave been carried out for concentrated clay suspensions over a metal blade ofvarying roughness (Djelal, 2001) and for plastic concrete, in order for the study ofpumpability (Kaplan, 2001).
2.4 Summary
Most of the present knowledge about workability is rooted in building standards.A common starting point for a definition can be formulated as follows: workabilityis a combination of properties of fresh mortar, that allow the proper use by themason for bricklaying. Which properties are part of this set, and how they aredefined in different sources, is subjected to some variation. Words like consistencyare recurrent in many writings, but the exact meaning needs clarification.
Scientific literature about rheology and water retention of masonry mortar is scarce.The most relevant sources deal with the rheology of cement paste, self-compactingconcrete or concrete mortar. About lime hydrate paste and mortar, most researchis still in an early stage of development, even though some interesting publicationsdate back to the 1950’s. It can even be stated that, after the work of Warren Emleyin the 1920’s, no spectacular progress has been made in the science of lime mortarrheology.
The flow table test is often identified with the notion of workability, because ofits apparent good performance for a range of mortars. However the importantlimitations of this method have been amply demonstrated, and alternatives likepenetration methods have not (yet) succeeded in replacing it. Test methods relatedto water retention are less numerous: only two important principles were found instandards.
Apart from standardised methods, some simple empirical hand-operated tests, doneby masons, exist next to such sophisticated and expensive machines as mixer-typerheometers, moving object rheometers and large concrete rheometers. While thehand tests are the most reliable, they give no possibility whatsoever for scientificanalysis, and vice versa for the second group. Or, less severely formulated: somebasic interpretation is missing to set the necessary criteria for assessment of amortar’s quality based on the outcome of rheometric tests.

Chapter 3
Theoretical aspects of rheologyand hygric properties ofmasonry mortar
3.1 Introduction
In this chapter the theoretical framework for the analysis of rheological and hygricproperties of masonry mortar is introduced. The terminology, variables and symbolsof the composition of mortar are the subject of Section 3.2. A distinction is madebetween the mix ratio of a mortar, i.e. the masses of the constituents needed toproduce it, and the composition, including air content, which is also dependenton the mixing procedure and conditions, and which can be expressed as volumefractions and mass fractions of the mix when it is ready for use.
Section 3.3 deals with rheology in a broad perspective. It starts with assessing towhat extent mortar can be considered as a continuum with continuum properties.The inhomogeneous nature of the mortar and the different scales of the constituentsare cause to the complexity of the behaviour. The composition, but also theimposed deformation rate, causes a mortar to respond in different ways, which areclassified as flow regimes.
The concepts of suspension rheology can be applied under certain conditions, andare briefly introduced. The accent is on the relationship between the properties andthe concentration of the suspended particles and the properties of the suspension.The section ends with the theoretical discussion of typical experimental methodsthat can be applied for such concentrated materials: squeeze tests, spreading tests
23

24 Theoretical aspects of rheology and hygric properties of masonry mortar
and penetration tests. Simple models are proposed to link the results to materialparameters.
The applicability of geotechnical theories and methods is explored in Section 3.4.Sand being the main volume fraction of mortar, it is obvious to look for parallelsbetween the behaviour of mortar and moist sandy soil. This is done for themechanical behaviour, as well as for hygric properties. Concepts like drainage, porewater pressure and effective stress, can almost directly be transferred to mortartheory. The fact that soil science usually deals with unsaturated granular materialsis a restriction. However, the related theory for filtration of slurries, which stemsprimarily from mining applications, does provide some analysis tools for mortar, inthe oversaturated range.
Water transport within a mortar joint and transport from mortar to a brick isdiscussed in Section 3.5. The brick’s hygric behaviour is mostly determined byits capillary porosity. The water retention curve and diffusivity or permeabilitycharacterise this phenomenon. A mortar is more complex because the solid skeletonchanges due to water transport: it is oversaturated in the initial state and thegrains get closer to eachother while the water is being desorbed. The local voidratio is a variable and determines the hydraulic potential and the permeability.Contact between the dewatered slurry and the porous substrate is described interms of desorptivity, sorptivity and transfer sorptivity.
3.2 Composition of mortar
3.2.1 General terminology
The Technical Dictionary of European Mortars defines mortar, in correspondencewith EN and ISO standards, as a mix of one or more inorganic or organic binders,aggregates, fillers, additives and/or admixtures (EMIO, 2000). In this text onlymortars with mineral binders are considered, and with sand as an aggregate. Theaggregate is a granular material that does not contribute to the hardening reactionof the mortar. It is useful to distinguish additives from admixtures. An additive is afinely divided inorganic material that may be added to mortar in order to improveor achieve special properties. An admixture is an organic or inorganic materialadded in small quantity to modify the properties of the mortar in the fresh and/orhardened state. The binders used in this research are commercial products whichcomply with EN standards, and the additives that are present in them (premixedin the factory) will not be considered separately. When admixtures are used (eitherair entraining agent, plasticizing agent or general purpose admixtures), their dosagewith reference to the binder mass will be explicitly mentioned. A mortar is calleda masonry mortar if it is used for laying masonry units, be it in (traditional)

Composition of mortar 25
thick or thin layers. The process is in principle the same for fired clay units as forconcrete or calcium silicate blocks, although they may have very different hygricproperties. Hence the results obtained with bricks can not be generalised withoutsome important considerations. Other mortar types, which are not the main topicof this work, are pointing mortars, and renders or plasters.
3.2.2 Mix ratio, composition and phase relationships
The notations and relationships in this section are inspired by the description ofconcrete mix design in Lambotte (sd). The masses of the different componentsin a mix are designated Ms, Mb and Mw. Capitals are used to denote the massfractions:
S = Ms
Ms +Mb +Mw(3.1)
for the sand mass fraction, and B and W are defined likewise as binder massfraction and water mass fraction. Thus we can describe a mortar’s mix ratioby two variables: water to binder ratio (W/B) and binder to sand ratio (B/S).Each dry constituent is characterised by a bulk density ρb and a real density orparticle density ρ. Air is the fourth constituent and its mass can be neglected whencompared to the masses of the other three. Volume fractions of the mortar aredenoted in lower case: s for sand volume fraction, b for binder, w for water and afor air:
s = VsVs + Vb + Vw + Va
(3.2)
and likewise for b, w and a. The air’s volume fraction completes the sum in theequation:
s+ b+ w + a = 1 (3.3)
For mass fractions we can write:
S +B +W = 1 (3.4)
These mass fractions can be calculated from the mortar’s mix ratio parametersB/S and W/B:
S = (1 + (B/S) + (W/B)(B/S))−1 (3.5a)
B = (B/S) · S (3.5b)
W = (W/B) ·B (3.5c)

26 Theoretical aspects of rheology and hygric properties of masonry mortar
For a clear understanding it is important to distinguish the mortar’s mix ratiofrom its composition. The mix ratio is not more than the correct mass ratios of theoriginal components, regardless of how they will be mixed. The composition onthe other hand depends also on the mixing procedure and it includes such variableas air content and mortar bulk density.
The bulk density of the mortar ρM can be written as the total mass in a unitvolume, including the air present in this volume. A imaginary but useful conceptis the airless density of the mortar ρ∗M , i.e. the density of the pure mortar pastediscarding the entrained or entrapped air:
ρM = sρs + bρb + wρw(+a · 0) (3.6a)
ρ∗M = ρM1− a = sρs + bρb + wρw
1− a (3.6b)
This airless bulk mortar density ρ∗M can easily be calculated as a weighted averageof the particle densities of the constituents:
ρ∗M =(S
ρs+ B
ρb+ W
ρw
)−1(3.7)
Substitution of (3.7) in (3.6) allows to calculate the air content from the mix ratioand the measured densities of the components and the mortar:
a = 1− ρMρ∗M
= 1− ρM(S
ρs+ B
ρb+ W
ρw
)(3.8)
This means that, if a measured value for air content is known, e.g. by using thecompression method, this information is redundant with this calculated value.
The mass fractions and volume fractions are not equal, but they differ with a ratioof densities:
S = sρsρM
; B = bρbρM
; W = wρwρM
(3.9)
For many applications it is convenient to work with quantities for the solid fraction,symbol φ. The complement is called the porosity ε:
φ = s+ b (3.10a)
ε = 1− φ = w + a (3.10b)
However in some cases it will be practical to consider the air bubbles as part ofthe solid material, because they can also be seen as a dispersed phase. Therefore

Composition of mortar 27
we introduce symbols for modified solid fraction and porosity:
φ∗ = s+ b+ a (3.11a)
ε∗ = 1− φ∗ = w (3.11b)
3.2.3 Dry mix ratios for reference mortars
For reasons of reproducibility and accuracy, the recipes for mortars are givenin mass ratios throughout the text (B/S and W/B). This is to avoid problemswith large fluctuations of bulk densities ρb,b and ρb,s. Measured bulk density ofpowders is highly sensitive to compaction and may vary as much as with a factor2, depending on the pressure exerted and the agglomeration due to interparticleforces (Kwan and Wong, 2008). Similar problems are expected to be negligeablefor sand in a lab situation, when sand is oven-dried, but they have to be consideredwhen working on-site. Moist sand can be more loose-packed thanks to its cohesion,and may have a bulk density decrease of 15 to 35% with reference to dried sand(Fig. 3.1) (PCA, 2004).
Figure 3.1: Variations in bulk density of wet sand: increase of total volume anddecrease of bulk density. Reproduced from PCA (2004).
However, the origin of the choice of (B/S) is related to considerations of thevolumes. It is generally accepted in traditional literature that a suitable binder(bulk) volume is one which fills the voids between the sand grains. This can beachieved roughly by using a 1:3 bulk volume ratio, considering that the voids ina dry sand make up between 25% and 35% of its volume (Ecole d’Avignon, 2005;

28 Theoretical aspects of rheology and hygric properties of masonry mortar
Van Balen et al., 2003). Many traditional recipes respect this simple rule. 1:3mortars lime:sand or cement:sand are common in many publications, and likewise1:1:6 or 1:2:9 cement:lime:sand.
For reasons of practical usefulness, target values of B/S are derived from valuesexpressed in weight of binder per bulk volume of dry sand. This reflects on-sitepractice, when binders are delivered in bags of 10, 20 or 25 kg and sand is deliveredin bulk. For cementitious binders a value of 300 kg of binder on 1m3 of dry sandapproximately results in a traditional mortar 1:3 (by volume). Indicative valueswere based on a normative document: a proposition for the French DTU 20.1(AFNOR, 2004). The lower values given by this document were adopted in general,but with slight changes (based on experience of the guiding committee involvedwith the research) intended to aim at comparable subjective feeling of richness inbinder for the different materials (Table 3.1). The loose-packed bulk density ρb,swas used to recalculate this dosage (kg/m3) to a B/S (kg/kg). More informationabout the products mentioned in the table can be found in Section 4.2.
Table 3.1: Dry composition of reference mortars. The medium packed bulk densityis taken for ρb,b and bulk volume ratios are calculated with ρb,s = 1418kg/m3
Binder Limehydrate
Limehydrate AE
Lime-cement
Hydrauliclime Cement
Dosage (kg/m3) 180 180 300 300 350B/S (kg/kg) 0.112 0.112 0.187 0.187 0.218ρb,b (kg/m3) 473 462 674 812 1069
Bulk volume ratiobinder:sand (m3/m3) 0.381 0.390 0.445 0.369 0.327
For comparison with traditional recipes, bulk volume ratios were calculated, byusing the medium-packed bulk density of the binders. These values were obtainedby measuring the powder that was scooped straight from the bag into a calibratedvolume, in order to approximate the reality on-site. It is significantly higher thanthe loose packing (measured after sieving) and lower than the bulk density of thecompacted powders (Section 4.2).
Many other standards are still often referred to for the composition of mortars,even if superseded in some cases. In the context of masonry mortars with lime, wecan cite the DIN 1053 part 1, NBN B14-001, ASTM C270 and CSA 179. Accordingto the different editions, slight variations may exist. The current EN standardsgive no references for composition. This obvious lack may be due to internationaldifferences in the matter. In practice this situation favours the use of ready-mademortars (sand and binder) as opposed to mortars composed on-site.
Mortar rheology 29
3.3 Mortar rheology
3.3.1 Driving forces, continuum approach and flow regimes
Mortar as a suspension
Suspensions are two-phase systems of solid particles dispersed in a continuousliquid medium. Mixing of a quantity of binder powder in water results in a slurryor paste, where the (solvated) binder particles make up the solid phase, and theliquid (continuous or interstitial) phase is an aqueous solution of different ions likeCa++ and OH−. When sand is added to this system a mortar is obtained, whichcan be considered as a suspension of sand in binder slurry, or as a suspension ofsand and binder particles in the aqueous solution.
When air bubbles are present in small quantity, they may be considered as anextra suspended (or dispersed) phase. When under certain circumstances, e.g. byflocculation of particles, the solids become interconnected and form a continuousphase with a certain strength, we talk about a gel, rather than a suspension. Mortarsat rest display this behaviour, and are thus rather questionably suspensions. Thesame goes for lime hydrate pastes after a certain resting time. However duringshear flow, suspension-like behaviour is observed, which justifies the study of thefeasibility of suspension theory.
Size effect of particles in mortar
The components of mortar vary widely in size, physical and chemical characteristics.The description of the suspension’s behaviour is introduced with a fictitious physicalexperiment to assess the effect of the size of particles. It consists in consideringa small volume of 1 cc of solid lime hydrate particles (volume of solids, not bulkvolume) suspended in an aqueous medium. The complicated shape of the particles(especially binder particles) and their size distribution are neglected: all are assumedto be spherical and equal in size.
Values for the specific surface area (SSA) of this quantity of solids are listed inTable 3.2. The mortar components and typical geological materials of comparablesize are also mentioned (geological data based on Craig (1987)). The importance ofthis consideration can be illustrated by considering a suspension of 1 volume partmicron-sized spheres, mixed with 1 volume part of spheres one order of magnitudesmaller. In such a case the smallest fraction stands for some 91% of the total surface:the smaller particles have a large influence on the suspension as a whole. TheSSA determines the amount of surface available for adsorption of water molecules(solvation), for localisation of surfactants (e.g. present in admixtures) and for theexchange of chemical reactants.

30 Theoretical aspects of rheology and hygric properties of masonry mortar
Table 3.2: Size aspects of particles: 1cc of material in spheres of equal radius R.
R (m) Surface of1 cc (cm2) SSA (cm2/g) Mortar component
of similar sizeGeologicalsize range
10−2 3 · 100 1.2 · 100 - medium gravel10−3 3 · 101 1.2 · 101 sand coarse sand10−4 3 · 102 1.2 · 102 sand fine sand10−5 3 · 103 1.2 · 103 binder medium silt10−6 3 · 104 1.2 · 104 binder clay10−7 3 · 105 1.2 · 105 binder -10−8 3 · 106 1.2 · 106 admixture molecule -
10−9 3 · 107 1.2 · 107 water molecule,admixture molecule -
Depending on R, the relative importance of different types of forces changesdrastically. Fig. 3.2 represents typical values for gravity, capillary force , diffusionforce, viscous drag force, electrostatic repulsion and Van der Waals attractiveforces.
15
-10
-5
0
ce (N
)
-30
-25
-20
-15
-9 -8 -7 -6 -5 -4 -3 -2
10 lo
g fo
rc
10 log particle radius (m)
Gravity Capillary
Diffusion Electrostatic rep.
Viscous drag VdW attractive
Figure 3.2: Typical values for different forces acting on a spherical lime hydrateparticle suspended in water, as a function of particle radius R.
A series of assumptions were made to calculate these numbers, which are onlyindicative for the order of magnitude.
– A density of 2.5 g/cc was counted to estimate the effect of gravity.

Mortar rheology 31
– The capillary force is the maximum force that can be exerted by a meniscusbetween two equal particles, assuming a surface tension of the air-liquidinterface of 37 · 10−3 N/m (Fig. 3.3) (Duran, 2000). The ratio between innerand outer radii of the contour of the meniscus is estimated on r2/r1 = 5.
R
R
r1
r2
Mg
Figure 3.3: Spheres kept in contact by a liquidmeniscus, redrawn after Duran (2000).
– The diffusion force, according to Fick’s law, depends on concentration andconcentration gradient. The concentration in mass per unit volume is basedon the binder slurry in a reference mortar with air lime (Section 3.2) and thegradient on a reduction of this concentration by half over a distance of 0.1 m(Hiemenz and Rajagopalan, 1997). This situation may arise when a freshlymixed binder slurry is left at rest and sedimentation occurs.
– Viscous drag force is a function of velocity and the particle friction factor,which can easily be calculated for spheres (Hiemenz and Rajagopalan, 1997).Here a relative velocity between the liquid and the solid particle of 0.1 m/sis assumed; values scale proportionally for other velocities. We will furtherdemonstrate that the assumed viscosity of water for the solvent probablyunderestimates the real solvent viscosity with a factor ≈ 4 (Section 5.3), butthis doesn’t change the order of magnitude.
– The estimation of the magnitude of electrostatic repulsion is based on aconfiguration of two particles at interparticle distance equal to the radius.An indicative zeta potential of 34mV was taken from literature (Giorgi et al.,2002; Rodriguez-Navarro et al., 2005) and used as approximation for thesurface potential. The ionic strength of the solvent was calculated for asaturated solution of Ca(OH)2 in water, at 25C (I = 75mM) (Rodriguez-Navarro et al., 2002). This results in a value for the Debye-Hückel parameterκ = 9.0 · 109 m−1 or a double layer thickness of 1.1nm. Such relatively smalldecay length of electrostatic force is due to the high ion concentration, which

32 Theoretical aspects of rheology and hygric properties of masonry mortar
also characterises cement liquid (Kauppi et al., 2005). The double layerthickness can be imputed into the Derjaguin approximation for electrostaticpotential between two spherical particles (Hiemenz and Rajagopalan, 1997).A simplified formula with 1.5R as an average distance between facing surfaceswas used to derive the force from the potential.
– Van der Waals attractive forces are estimated according to Flatt andBowen (2006): F ≈ 1
12A(h)a
h2 , where A(h) stands for the Hamaker constant,a is a characteristic size, taken equal to R, and h the inter-particle distance,which was fixed on an arbitrary value of R/2. For the Hamaker constant, bylack of exact data, an order of magnitude is based on a value for CaCO3 inwater: A(h) ≈ 1.5 · 10−20J (Bergström, 1997).
Although sand has slightly different material parameters, it is clear that the sandgrains are above all affected by gravity. When they move through water, viscousdrag is however also important: a slurry of sand may be kept stable by vigorousstirring. The capillary force of a meniscus is relatively small. For the larger binderparticles the situation changes: viscous drag forces may become more importantthan gravity, and capillary forces are nearly in the same order of magnitude. Thistendency is more pronounced as the size decreases towards the smallest fractionsof binder particles. Those particles are much more stable than the sand, evenwhen diffusion forces or electrostatic forces are still too small to prevent settlingand aggregation. Aggregation means that different particles remain in contactand together form a cluster, which moves as one particle with a complex shape.Aggregates may vary in size and deformability, and they may be reversible ornot, depending on whether or not they can break up in their original particlesagain. Only the very smallest fraction of the binder and the molecules of water andadmixture are subjected to Brownian motion, which can be linked to the diffusiveforces.
Literature confirms that, according to the DLVO theory of colloidal stability, limesuspensions display but limited stability (Giorgi et al., 2002; Rodriguez-Navarroet al., 2005); cement and hydraulic lime particles are even less stable because oftheir larger size. In the case of lime, improved stability (with respect to a mix of drycommercial hydrate in water) is reported for wet slaked slurries (Rodriguez-Navarroet al., 2005), lime hydrate produced by homogeneous phase precipitation and useof solvents as interstitial liquid (Giorgi et al., 2002), use of chemicals in the slakingliquid (Holmes et al., 1922), or high-shear mixing of slurries (Strotmann and Jägers,2000). Concrete and mortar technology promotes the use of admixtures to improve,among others, the stability. They are usually surfactants and are attracted to thesolid-liquid or the gas-liquid interfaces, where they influence the stability of airbubbles or enhance the steric or electrostatic repulsion between binder particlesor between particles and sand (Flatt and Bowen, 2003; Flatt et al., 2004; Kauppiet al., 2005).

Mortar rheology 33
Homogeneity, continuum approach and properties of granular pastes
The direct application of continuum laws, like the basic laws of fluid mechanics, ishazardous because of the macroscopic heterogeneity in a mortar. In most liquidsthe scale of the particles is a molecule scale, which is far below the scale of processesobserved in rheometric experiments: the material can be considered as a continuum.This critical scale for observation of continuum parameters can be understood asfollows: the average of certain parameters in an arbitrary volume of the critical sizeshould not be different from those in the bulk material surrounding it (Coussot,2005). Local density ρM is the most obvious of these parameters. A reasonable butarbitrary assumption could be: 10 times the diameter of the largest particle, i.e.≈ 2 cm. Below this scale not only density and concentration of components vary,but also the rate of deformation. Especially this last point is of interest: whena macroscopic shear rate of 10 s−1 is observed, the shear rate in the interstitialpaste may be 20 s−1 or higher, because the shear rate over the solid particles iszero and the total gradient over the gap is the macroscopic value (Fig. 3.4). Thesame consideration goes for water in a slurry.
yv(y)
Figure 3.4: Difference between flow rate in homogeneous liquids andlocal flow rate of the interstitial liquid around suspended particles.
In terms of fundamental description of flow of mortar, the governing equations ofconservation of mass and momentum can be explicited by introducing the concept ofthe continuum particle. This is an arbitrary assembly of particles and liquid, withina certain boundary surface, large enough to fulfill the criterion of homogeneity, butstill smaller than the scale of the process that is observed. Wallevik developedformulations for the vector position of such a continuum particle, its velocity, theforces acting on it, etc., which leads to an Eulerian description for fluid transport(Wallevik, 2003).
Characterisation of different flow regimes
In a sheared suspension, the forces exerted by the fluid on the particles inducetranslation and rotation. Vice versa the presence of the particles leads to changesin the velocity field in the surrounding media. These forces are called hydrodynamicforces and their magnitude has the order of the viscous drag in Fig. 3.2. The

34 Theoretical aspects of rheology and hygric properties of masonry mortar
relative importance of different forces can be characterised by several dimensionlessnumbers. The Péclet number is a dimensionless group which compares the timescale of flow to that of diffusion. It is defined as (Larson, 1999):
Pe = ηsγR3
kBT(3.12)
where ηs is the viscosity of the solvent, R the radius of the particle, kB Boltzmann’sconstant and T absolute temperature.
At typical shear rates the particle Péclet number of a binder slurry is ≈ 2.5 · 10−3
which means they are both influenced by Brownian motion and hydrodynamic forces(together with gravity). The influence of hydrodynamic forces on the sand grainsis even more important as they have a mean diameter in the order of magnitudeof 0.1 mm. Their particle Péclet number is estimated ≈ 4 · 108, indicating thatBrownian motion is negligible.
In a broader perspective, including effects of solid fraction (φ), the hydrodynamicregime is limited also by other regimes (Fig. 3.5) (Ancey, 2007; Coussot and Ancey,1999). Towards higher solid fraction, lubricational flow is observed. In the approachof Ancey φc is the minimum concentration for a network of particles in close contactto form (φc ≈ 0.50 for spheres of equal diameter), while φm is the maximum packingas defined below. For increasing shear rate (γ) flow may become turbulent at lowsolid fractions, or characterised by collisions, at high solid fraction. The particleReynolds number is used as a criterion for the transition. The applications andexperiments that are studied in this thesis are all within the lower range of shearrates and the higher range of solid fractions and they can be located in the regionsC, B, E and F of the diagram.
A similar classification of flow regimes is proposed by Coussot, based on theBagnold number, Stokes number and Leighton number (Coussot, 2005). He alsodistinguishes types of materials, all of them with high solid fraction, dependingon which types of flow regimes may occur more or less likely. Pastes are systemsin which soft interactions (i.e. hydrodynamic) predominate. They are basicallythixotropic yield stress fluids. In granular materials on the other hand hardinteractions between grains predominate. Their frictional behaviour is somewhatanalogous to the contact between two solids. In granular pastes either soft or directinteractions may predominate, depending on the flow regime.
A binder paste falls within this definition of a paste and dry or slightly moist sandis obviously a granular material. A masonry mortar with typical water content is agranular paste. It can be expected that a transition exists, at some critical solidfraction, below which hydrodynamic interactions in the paste dominate, and abovewhich the friction between the sand grains dominates. Because friction betweensand grains goes together with far greater energy dissipation than shear flow in
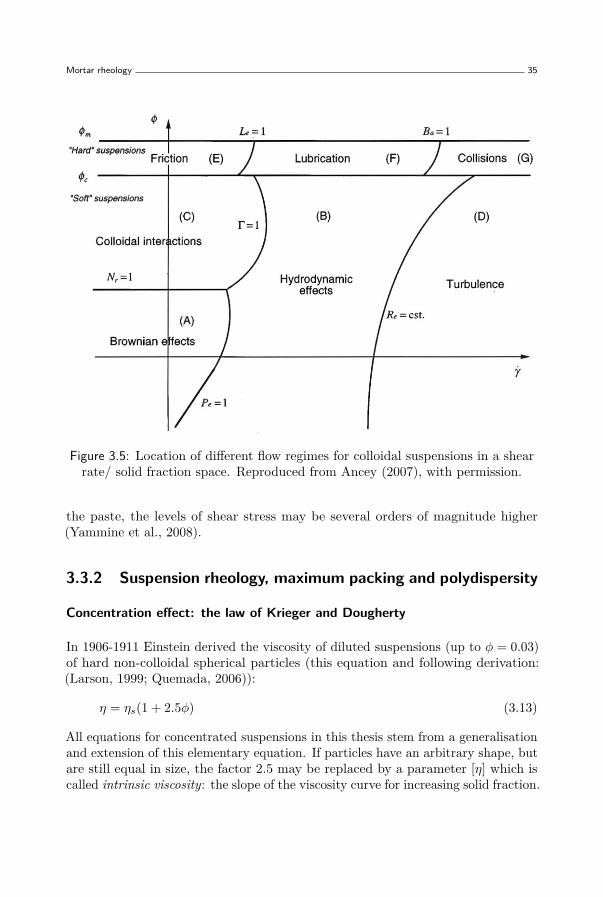
Mortar rheology 35
Figure 3.5: Location of different flow regimes for colloidal suspensions in a shearrate/ solid fraction space. Reproduced from Ancey (2007), with permission.
the paste, the levels of shear stress may be several orders of magnitude higher(Yammine et al., 2008).
3.3.2 Suspension rheology, maximum packing and polydispersity
Concentration effect: the law of Krieger and Dougherty
In 1906-1911 Einstein derived the viscosity of diluted suspensions (up to φ = 0.03)of hard non-colloidal spherical particles (this equation and following derivation:(Larson, 1999; Quemada, 2006)):
η = ηs(1 + 2.5φ) (3.13)
All equations for concentrated suspensions in this thesis stem from a generalisationand extension of this elementary equation. If particles have an arbitrary shape, butare still equal in size, the factor 2.5 may be replaced by a parameter [η] which iscalled intrinsic viscosity: the slope of the viscosity curve for increasing solid fraction.

36 Theoretical aspects of rheology and hygric properties of masonry mortar
Arrhenius proposed to use the derivative form for the increment of viscosity:
dη(φ) = [η]η(φ)dφ (3.14)
An important aspect to consider when reaching higher concentrations is that theeffect of an increase in solid fraction dφ becomes larger (Fig. 3.6). If VT is thetotal volume of the suspension, which already contains φVT solid particles, theremaining solvent volume is (1−φ)VT . To take into account this effect, an incrementof suspended particles should rather be written as dφ/(1− φ). Finally, when φcontinues to increase, this expression needs a correction because the real space leftover for the added particles is even more reduced by the fact that the packing ofthe already present particles is restricted by a maximum packing fraction φm (Fig.3.6). The minimal fraction occupied by them is φ/φm. So the effects of decreasingavailable volume and packing characteristics of particles is taken into account byexpressing the solid fraction increment as dφ/(1− φ
φm) (Rezeau, 2008).
1- 1-m
Figure 3.6: Available space for suspension of an increment of solid particles in adilute suspension (left) and a concentrated suspension (right).
This semi-empirical extension transforms the Arrhenius equation into the derivedform of the Krieger-Dougherty equation:
dη(φ) = [η]η(φ)
1− φ
φm
dφ (3.15)

Mortar rheology 37
This equation can be integrated from zero solid fraction to the actual solid fractionφ, viscosity going from ηs to η (a prime is added to the symbols of the variables):
η∫ηs
dη′
η′(φ) =φ∫
0
[η]dφ′
1− φ′
φm
ln ηηs
= [η][−φm ln(1− φ′
φm
]φ0
η(φ)ηs
=(
1− φ
φm
)−[η]φm(3.16)
The left term of this equation is defined as relative viscosity ηr.
Strictly speaking, the Krieger-Dougherty law is not derived for materials like binderslurries, because they are not spherical and part of their behaviour is due to colloidalinteraction. However the interest of applying this law, despite this contradiction,is that it has been used in literature over a wide range of materials, and that thereported values of the parameters, e.g. in Barnes et al. (1989), Struble and Sun(1995) and Wierenga and Philipse (1998), are useful for comparison. It has to bekept in mind that the obtained parameters do not have the same physical meaningas intended in the original laws.
Maximum packing and intrinsic viscosity
The two most important particle parameters in this semi-empirical law are intrinsicviscosity and maximum packing fraction. Intrinsic viscosity is the dilute limit ofthe relative viscosity increment per unit of solid fraction:
[η] = limφ→0η − ηsφηs
(3.17)
The lower limit of [η] is 2.5 for spheres, as demonstrated by Einstein. [η] increaseswhen the aspect ratio of the particles increases, e.g. for ellipsoids instead ofspheres. Aspect ratio is the particles’ largest dimension divided by the smallest.Its contribution to viscosity is easily understood by the fact that rotation of non-spherical particles requires more energy dissipation in the surrounding fluid. Inliterature measurements are reported for intrinsic viscosity of rods and fibers, withvalues ranging from 10 to 6000 for aspect ratios from 10 to 1300 (Wierenga andPhilipse, 1998). For plate-like particles, like hydrated lime, references were notfound.

38 Theoretical aspects of rheology and hygric properties of masonry mortar
The maximum packing fraction in the equation is not the same as the theoreticalmaximum of close-packed spheres. Shapiro and Probstein distinguish the randomloose packing from the random close packing (Shapiro and Probstein, 1992). Therandom close packing is the maximum that can be obtained by applying externalforce. For undeformable spheres it is about 0.64, still far below the theoreticalmaximum of a cubic space-centered lattice (0.74). The random close packing is thedensest possible packing with a random structure. External load has to be appliedto approach it. This can be done experimentally for a mortar - if water can beevacuated, or in dry state - by a compaction procedure in a rigid container, likecompression with a tamper or vibration.
The random loose packing is the least dense packing that can support an externalload like gravity. It can be reached experimentally by reducing the effect ofgravity to an infinitesimal amount, e.g. in a sediment of particles in a fluid ofmarginally lower density (Onoda and Liniger, 1990). This random loose packingcan be identified with the maximum packing fraction in rheology, hence Shapiro’ssuggestion to call it fluidity limit, as it is the volume fraction below which thesuspension behaves like a liquid, in that an applied shear stress induces velocitygradients in the mixture (Shapiro and Probstein, 1992). Above the fluidity limitthe suspension can support a finite shear stress and hence exhibits properties of asolid. When solid fraction exceeds this fluidity limit, ordering must take place toenable fluidization. Another property of suspensions above random loose packing,is that the solid fraction has to dilate in order to create shear flow. This may giverise to negative pressure in the solvent (Onoda and Liniger, 1990).
Note that the above mentioned laws and remarks about packing and intrinsicviscosity are ony valid for underformable and non-colloidal particles. If particles aresubjected to repulsive or attractive forces, this has an important influence on thevalues of the parameters. Moreover it is generally accepted that maximum packingis different for high shear rates and low shear rates, if particles are subjected toBrownian motion and repulsive interparticle forces. At low shear, i.e. low Pécletnumber, colloidal repulsive forces prevent the particles to approach closer to eachother than a certain limit, but the relative importnace of these forces decreaseswhen shear rate increases (Dhaene and Mewis, 1994).
Values for φm or [η] can be either obtained by fitting experimental data to Eq.(3.16) or, in the case of φm, by assuming a relation with a directly measured packingfraction. This can be done in dry or wet state. Such relations, usually a fixed ratiobetween different states of packing, are mentioned in Shapiro and Probstein (1992);Onoda and Liniger (1990). For fine powders like cement and lime, measurements ofpacking in dry state are complicated by agglomeration and high sensitivity to thecompaction procedure. A wet measurement method was found to give meaningfulindications for φm (Kwan and Wong, 2008).

Mortar rheology 39
Polydispersity and the Farris theory
Both sand and binders are characterised by a particle size distribution, with ratiosof the largest to the finest particle not rarely exceeding 10. The above describedtheory of Krieger and Dougherty is valid for suspensions of non-Brownian hardparticles, which can have equal sizes (monodisperse or monomodal) or have e.g. two(bimodal) or three (trimodal) size fractions. If a range of different sizes is present,the suspension is polydisperse. When a potential has an effect on the interparticledistance between, the effective solid fraction should take the range of these forcesinto account.
The presence of different sizes of particles has an important influence: smallparticles fill the voids between larger ones, thus leading to a higher maximumpacking φm. Estimating this maximum packing proved to be the major challengefor predicting their viscosity. Gondret and Petit reviewed available theories forbimodal non-Brownian spheres. Apart from solid fraction these suspensions arealso characterised by the size ratio between the two suspended phases; modelsare proposed to predict viscosity based on these two elements (Gondret and Petit,1997). Bimodal colloidal suspension, with typical different behaviour at low andhigh shear rate, were studied in Dhaene and Mewis (1994). A generalised modelfor polydisperse spheres is proposed by Sudduth (1993), more particularly aimedat optimisation of latex paints composed of different fractions.
Problems for applications of most of these theories to mortar arise when the non-sphericity of binder particles has to be considered. In our study we especially makeuse of the older and more general theory provided by Farris (1968). Farris considersthe polydisperse system as a suspension of the larger particles in a medium, whichhappens to be a suspension itself. This medium in turn may be looked at as asuspension of smaller particles in another suspension of even smaller ones. For theanalysis he ranks all present solid components from small to large and defines theirfractions φ1, φ2, . . . φn based on the volumes they occupy (V1, V2, . . . Vn) and thesolvent’s volume Vs:
φ1 = V1
V1 + Vs(3.18a)
φ2 = V2
V1 + V2 + Vs(3.18b)
φn = VnV1 + V2 + . . .+ Vn + Vs
(3.18c)
This approach leads to a simple formula to predict the viscosity of multimodalsuspensions starting from the solid fractions of the components and a functionH(φi) , which gives the relative viscosity as a function of solid fraction for any

40 Theoretical aspects of rheology and hygric properties of masonry mortar
fraction i.
ln ηr =n∑i=1
lnH(φi) (3.19)
If the Krieger-Dougherty equation (3.16) is substituted for the function H(φi),thereby introducing the intrinsic viscosity and the maximum packing of eachfraction, the suspension’s relative viscosity can be obtained as:
ln ηr =n∑i=1
ln(1− φiφm,i
)−[ηi]φm,i (3.20)
One should keep in mind that the total solid fraction, which is defined as:
φT = V1 + V2 + . . .+ VnVs
(3.21)
is not equal to the sum of the different fractions φi, with the adopted definitions in(3.18). In a bimodal suspension for example it is: φT = 1− (1− φ1)(1− φ2).
In his article Farris also demonstrated how the equation can be used to calculate thebest ratio of components to have minimal viscosity for a fixed total solid fraction.The remarkable result for the case of only spherical particles is:
φ1 = φ2 = . . . = φn (3.22)
For a mortar with sand, binder, water and air, the volume fractions s, b, w and awere defined in Section 3.2. In accordance with the Farris theory, the followingparallel definitions can be added:
φs = VsVT
= s (3.23a)
φa = VaVa + Vs + Vw
(3.23b)
φb = VbVb + Va + Vs + Vw
(3.23c)
These definitions are based on the reasonable assumption that air is present asdispersed bubbles, which have a size between that of the sand and the binder. Ifa filler is added to the system, we can define an extra volume fraction f and φfand rewrite the equations. When no air is present, the formulae are simplified byputting a = 0 and φa = 0.

Mortar rheology 41
3.3.3 Yield stress, thixotropy and the Bingham model
The problem of yield stress
The meaning of yield stress of a mortar depends on the flow regime. One maydefine it as the shear stress that the material experiences when shear rate decreasesto zero (denoted τ0). The Bingham yield stress is an example of such a definition.Secondly it can be defined as the shear stress that needs to be applied to a mortarat rest to initiate flow (denoted τy). These two definitions lead to different values ofyield stress, because of the different flow regimes that pre-dominate: hydrodynamicor lubricational for the first, frictional for the second. In fact, measuring yield stressby decreasing shear rate to zero - in line with the first definition - is a physicalimpossibility, because in a concentrated suspension shear localisation occurs beforeshear rate attains zero (Ovarlez et al., 2006). This discrepancy, and the reason forshear localisation, can be found in local inhomogeneity and may be modelled usingthe notion of thixotropy (Moller et al., 2006).
There is experimental evidence that in concentrated polydisperse suspensions of non-Brownian spheres small particles migrate to the high shear zone, while the largerones remain in the low shear zone. Likewise rough particles migrate to the zone oflowest shear, by contrast to the smooth ones (Plantard et al., 2006). If we thenconsider that any yielding phenomenon, unlike laminar flow in rheometers, occursnear a shearing plane, it is clear that local inhomogeneity is a determining factor.For multiphase fluids (including the gaseous phase) of high solid fraction (above0.5), there is no real scientific answer to these problems yet, despite considerablerecent developments (Mewis and Wagner, 2009).
Thixotropy can be defined as “the continuous decrease of viscosity with time whenflow is applied to a sample that has been previously at rest and the subsequentrecovery of viscosity in time when the flow is discontinued” (Mewis and Wagner,2009). A thixotropic material at rest, or sheared below a critical shear rate,will gain structure, i.e. its viscosity increases. This is called aging or structuralbuild-up. On the other hand, when the applied shear rate is sufficiently high, theviscosity decreases again, which is called rejuvenation of structural break-down.This phenomenon can be linked to microstructural changes in the material, like theformation and breakup of flocs or aggregates. It is well-known that cement pastesexhibit a viscosity increase at rest, that is in part reversible and irreversible (Jarnyet al., 2008; Roussel, 2005). Only the reversible part is covered by thixotropy.
The structure of a material can be characterised by a structure parameter λ, whichvaries from 0 to 1. A critical shear rate exists, at which λ remains constant intime. A shear rate lower than this critical level causes viscosity to increase andfinally flow will stop in a portion of the material, which may further move as a rigidplug. A flow curve (shear stress as a function of shear rate) for which dλ/dt = 0 is

42 Theoretical aspects of rheology and hygric properties of masonry mortar
called steady state flow curve. All the combinations of shear rate and shear stresswhich would be measured if a fluid has a particular constant level of structure λare constant structure curves (Moller et al., 2006; Roussel, 2005).
Moller et al. explain the development of local sheared zones with the concept ofavalanche behaviour (Moller et al., 2006). Consider a material at rest, when anincreasing shear stress is applied to it on a well-defined place. When flow starts,near the place where stress is applied, the viscosity will decrease dramaticallyin that specific zone, and when stress remains constant, this causes an increasein shear rate. This is known to happen in granular materials (geological flows),and has also been found in bentonite suspensions. It can also be observed in atraditional rotating mortar or concrete mixer: the material sticks to the wall until acritical angle is reached, when the avalanche effect starts (see also the inclined planeexperiments in Coussot (2005)). Aging of that same material can be understoodas an inverse avalanche effect: viscosity increases as shear rate decreases. Thisimplies that below a critical shear rate a steady laminar flow is not possible: forall these stresses the steady-state viscosity is infinite.
For an experiment in a coaxial cylinder rheometer with the inner cylinder rotatingthis means that steady state cannot be reached below a certain rotation speed.Instead a limited zone close to the surface of applied stress is sheared, and anotherzone remains at rest. How large the sheared zone is, depends on the shear historyand the applied stress or shear rate protocol.
The result is that many different maximum stresses can be obtained in yield stressexperiments, which supports arguments to reject it as a material property. We canhowever speak of a dynamic yield stress as the stress below which no permanent flowoccurs. Experiments are more useful if they demonstrate the dependence of yieldstress on test parameters, and if the shear history before the test is well-describedand reproducible. By doing so, the dynamic character of yield stress is evidenced.
Thixotropy models
The above introduced manner of characterising a fluid by a structural parameter λemerges from a family of models called structural kinetics models. Apart from thisapproach, two other important categories of models have been used in previousresearch: continuum mechanical and microstructural (Dullaert, 2005).
Continuum mechanical models introduce time dependency in the expressions forthe stress tensor and the rate of deformation tensor by means of integral ordifferential memory functions. This means that the entire history can be used tocalculate the rheological parameters. Microstructural models attempt to describethe basic physical mechanisms of build-up and break-down of flocs and deriverheological parameters from it. The model of Hattori and Izumi is based on

Mortar rheology 43
micro-structural considerations and it was used to predict thixotropic behavior ofcement paste measured with a concrete and mortar rheometer (Wallevik, 2003,2005). The starting point is a model for orthokinetic and perikinetic coagulationin a monodisperse suspension of spheres. Rheologic quantities are derived from thecoagulation state on a given moment. Wallevik has adapted the theory by addinga more empirical memory function to the basic theory. With these adaptations,good correlation was found with experimental data.
Applications of structural kinetics models were made for cement paste (Jarny et al.,2008; Roussel, 2005) and lime-cement grouts (Vermeir, 2007). In both studies itwas necessary to take special measures to prevent sedimentation. The obtaineddata confirm that part of the structure increase is irreversible, and thus not strictlyto be considered as thixotropic.
The Bingham model for plastic fluids
Materials which display a yield stress are called plastic materials. Ideally theybehave as a Hookean solid below the yield stress, and as a Newtonian liquid aboveit. Such behaviour, characterised by a yield stress τ0 and a plastic viscosity ηpl,was described by Bingham (1922).
τ = τ0 + ηplγ (3.24)
Thanks to its simplicity and the good correspondence to experimental data of manyindustrially interesting dispersions, this model is wide-spread for plastic materials.Many other models, among which the often used Herschell-Bulkley model, arereviewed in Macosko (1994).
We define viscosity η as shear stress divided by shear rate, at any point of theflow curve, and not as the local derivative dτ/dγ. In this definition it is clearthat the viscosity of a Bingham material goes to infintiy for zero shear rate, anddecreases for increasing shear rate, towards a constant value ηpl. In the light ofthe considerations about thixotropic behaviour of mortars and binders slurries andpastes, it is evident that a Bingham model alone can not be adequate to describetheir rheology completely. We propose however to use the model for constantstructure flow curves after a considerable pre-shear, so that we can assume a low(close to zero) value of the structure parameter λ. Another recommendation forthe experiments follows logically: step-down procedures in shear rate are bettersuited to conserve this low state of structure then step-up procedures, and shorterprocedures are better than long procedures, all this to prevent important changesof λ while testing proceeds.
To prevent any confusion the Bingham yield stress, or any stress at zero shear rate,referring to a state of laminar flow, will be referred to as τ0. Stresses which result
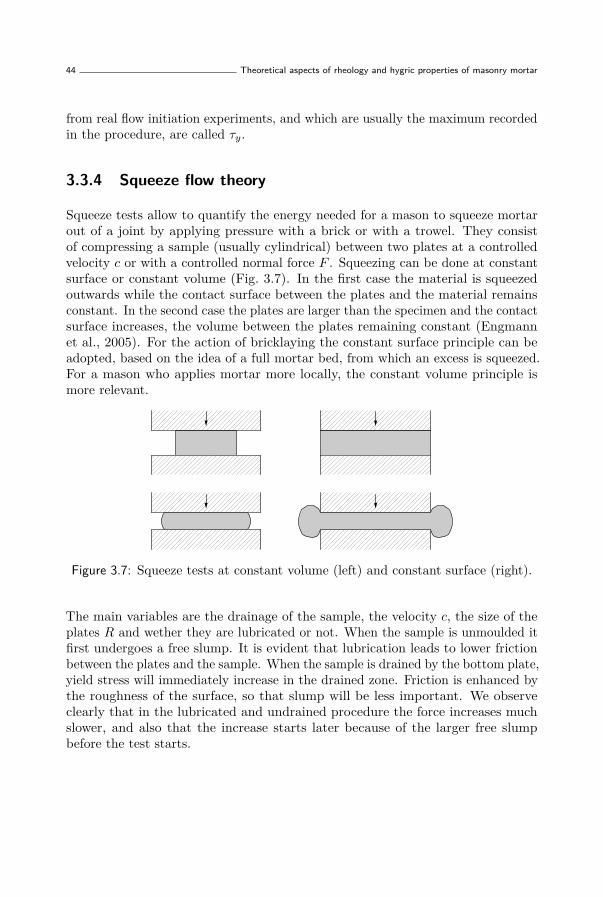
44 Theoretical aspects of rheology and hygric properties of masonry mortar
from real flow initiation experiments, and which are usually the maximum recordedin the procedure, are called τy.
3.3.4 Squeeze flow theory
Squeeze tests allow to quantify the energy needed for a mason to squeeze mortarout of a joint by applying pressure with a brick or with a trowel. They consistof compressing a sample (usually cylindrical) between two plates at a controlledvelocity c or with a controlled normal force F . Squeezing can be done at constantsurface or constant volume (Fig. 3.7). In the first case the material is squeezedoutwards while the contact surface between the plates and the material remainsconstant. In the second case the plates are larger than the specimen and the contactsurface increases, the volume between the plates remaining constant (Engmannet al., 2005). For the action of bricklaying the constant surface principle can beadopted, based on the idea of a full mortar bed, from which an excess is squeezed.For a mason who applies mortar more locally, the constant volume principle ismore relevant.
Figure 3.7: Squeeze tests at constant volume (left) and constant surface (right).
The main variables are the drainage of the sample, the velocity c, the size of theplates R and wether they are lubricated or not. When the sample is unmoulded itfirst undergoes a free slump. It is evident that lubrication leads to lower frictionbetween the plates and the sample. When the sample is drained by the bottom plate,yield stress will immediately increase in the drained zone. Friction is enhanced bythe roughness of the surface, so that slump will be less important. We observeclearly that in the lubricated and undrained procedure the force increases muchslower, and also that the increase starts later because of the larger free slumpbefore the test starts.

Mortar rheology 45
Analytical solutions for Bingham materials
Roussel studied the behaviour of Bingham materials (yield stress τ0, plastic viscosityηpl) in constant surface squeeze tests. He proposes a division of the material inthree zones: the upper and lower zones are assumed to be in shear flow and thecentral zone is assumed to be in purely extensional flow. Unyielded zones areneglected: the yield criterion (Von Mises) is fulfilled over the whole volume. Theboundary condition is no slip (rough plates, sticking flow) and constant velocity ofone of the plates. The solution of the velocity field is based on variational analysisand the minimisation of an energy dissipation function. Force F is given as afunction of plate separation h and plate velocity c by the formula (Roussel et al.,2006):
F = − 6πηplcR4
h3(1− β)(2 + β)2 −2πτ0R
2(√
3βh+R)h(β + 2) (3.25)
R is the radius and β a dimensionless parameter indicating the boundary betweenthe zones (zboundary = β · h/2) which is a function of the global Bingham numberg:
2β3 − 3β(3g + 2) + 4 = 0 (3.26)
This parameter g compares the magnitude of viscous forces and plastic forces:g = ηplcR/τ0h
2 and is a constant over the volume. To find ηpl and τ0, the obtainedexperimental relation between F and h can be fit to this equation.
Covey and Stanmore developed a similar theory in which the formula dependson a plasticity number Π which relates viscous stress to yield stress: Π =− (ηplcR) /
(τ0h
2). The solution is valid within the lubrication approximation(h << R) and the assumption of no slip (Covey and Stanmore, 1981):
2πτ0R3
3h + 4πR3
7h2 |2τ0ηplcR|1/2 (Π < 0.05) (3.27)
πτ0R3
h+ 3πR4 |c| ηpl
2h3 (Π > 10) (3.28)
In the case of a mortar with typical values the first condition is fulfilled until aseparation of ≈ 4.5mm is reached.
The condition of perfect sticking contact (no slip) is often unrealistic. Slip can betaken into account by a wall friction coefficient m (0 < m < 1). Slip is treated as avelocity discontinuity across an interface of vanishing thickness. Meeten comparedtheoretical predictions with experimental data for different materials and differentdegrees of plate roughness (Meeten, 2004). His approach however is to do testswith constant force, which is less interesting for a material which has predominant

46 Theoretical aspects of rheology and hygric properties of masonry mortar
plastic behaviour like mortar. The question of slip is also addressed by Sherwoodand Durban (1996), who found the following expression for F as a function of h,with friction coefficient m:
F
31/2πR2τ0= N +
Ψw + 12 sin 2Ψw +N ln 1 +m
1−m
2m(
1 + N
(1−m2 )1/2)
+ 2m3√
3
(1 + N
(1−m2)1/2
)R
h(3.29)
where N is a reverse Bingham number (N =(2√
3ηplc)/ (hτ0)) and Ψw stands for
arcsinm. At low levels of wall friction (m2 << 1), the equation simplifies to:
F
31/2πR2τ0∼= (1 +N)
(1 + 2m
3√
3R
h
)(3.30)
Analytical solution for perfectly plastic Coulomb materials
Toutou modelled the force-distance dependence as a function of the Coulombparameters cohesion C and friction coefficient tanφ. In this case only considerationsof total stress are made. Assumptions are: no slip (roughened plates) and constantsurface (Toutou et al., 2005).
F = Cπh2
2(tanφ)2 exp 2 tanφRh− C πRh
tanφ
(1 + h
2R tanφ
)(3.31)
Phase segregation during squeezing
An important complication for mortars is the migration of the liquid phase throughthe material during the test. There is experimental evidence that a cement paste’sapparent yield stress increases at low compression speed because of fluid drainagethrough the granular skeleton and sample hardening (Toutou et al., 2005): theliquid has time enough to move, so that excess pore water pressure is dissipated andeffective stress increases. This happens much less when the plates move at highervelocity: the liquid remains more in place. Liquid pressure is equal to atmosphericpressure at the edges of the (deformed) cylinder but will be greater near the centralaxis, where effective stress by consequence will decrease.
Sherwood provides theories both for the case of very low speed (Sherwood, 2005)and for the case of higher velocities (Sherwood, 2002). For the study of bricklaying,where squeezing is done in a matter of seconds, the second type seems more relevant.Sherwood proposes governing equations for liquid migration and deformation in
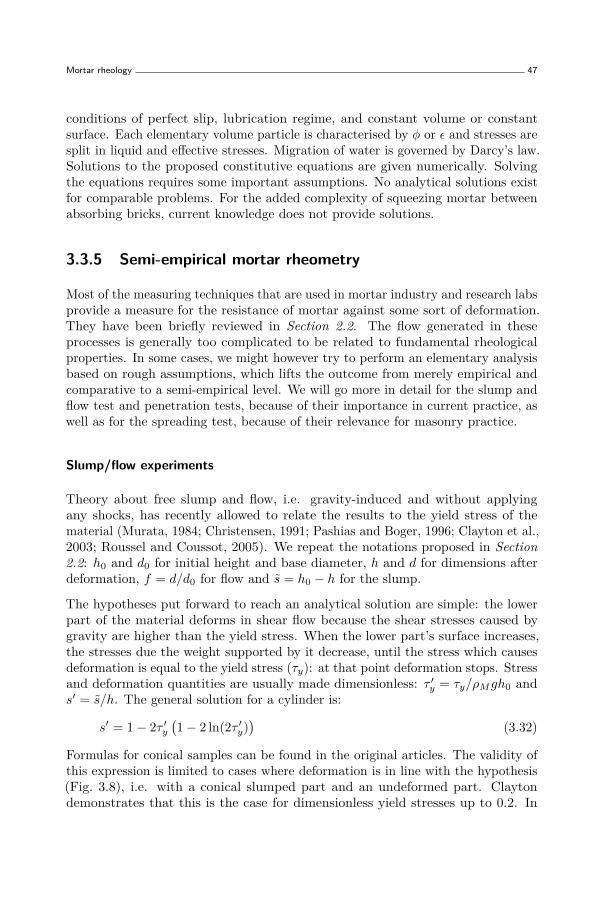
Mortar rheology 47
conditions of perfect slip, lubrication regime, and constant volume or constantsurface. Each elementary volume particle is characterised by φ or ε and stresses aresplit in liquid and effective stresses. Migration of water is governed by Darcy’s law.Solutions to the proposed constitutive equations are given numerically. Solvingthe equations requires some important assumptions. No analytical solutions existfor comparable problems. For the added complexity of squeezing mortar betweenabsorbing bricks, current knowledge does not provide solutions.
3.3.5 Semi-empirical mortar rheometry
Most of the measuring techniques that are used in mortar industry and research labsprovide a measure for the resistance of mortar against some sort of deformation.They have been briefly reviewed in Section 2.2. The flow generated in theseprocesses is generally too complicated to be related to fundamental rheologicalproperties. In some cases, we might however try to perform an elementary analysisbased on rough assumptions, which lifts the outcome from merely empirical andcomparative to a semi-empirical level. We will go more in detail for the slump andflow test and penetration tests, because of their importance in current practice, aswell as for the spreading test, because of their relevance for masonry practice.
Slump/flow experiments
Theory about free slump and flow, i.e. gravity-induced and without applyingany shocks, has recently allowed to relate the results to the yield stress of thematerial (Murata, 1984; Christensen, 1991; Pashias and Boger, 1996; Clayton et al.,2003; Roussel and Coussot, 2005). We repeat the notations proposed in Section2.2: h0 and d0 for initial height and base diameter, h and d for dimensions afterdeformation, f = d/d0 for flow and s = h0 − h for the slump.
The hypotheses put forward to reach an analytical solution are simple: the lowerpart of the material deforms in shear flow because the shear stresses caused bygravity are higher than the yield stress. When the lower part’s surface increases,the stresses due the weight supported by it decrease, until the stress which causesdeformation is equal to the yield stress (τy): at that point deformation stops. Stressand deformation quantities are usually made dimensionless: τ ′y = τy/ρMgh0 ands′ = s/h. The general solution for a cylinder is:
s′ = 1− 2τ ′y(1− 2 ln(2τ ′y)
)(3.32)
Formulas for conical samples can be found in the original articles. The validity ofthis expression is limited to cases where deformation is in line with the hypothesis(Fig. 3.8), i.e. with a conical slumped part and an undeformed part. Claytondemonstrates that this is the case for dimensionless yield stresses up to 0.2. In

48 Theoretical aspects of rheology and hygric properties of masonry mortar
s
hh0
r
z
d0
= gzv v
d
Figure 3.8: Deformation hypothesis for free slump of a cylindrical volume ofa yield stress material, based on Clayton et al. (2003).
the two limiting cases of high or low yield stress, the theory is invalid. At highyield stress, it underestimates the actual yield stress. At very low yield stress,the material behaves more like a spreading liquid and the flow is counteracted aswell by a non-negligible effect of surface tension: spreading causes an increase inliquid-solid interface dA and subsequently an energy increase of dA · γLG. Rousseland Coussot found corrected formulas for this case which include a factor involvingthe contact angle and surface tension (Roussel et al., 2005).
The case of masonry mortar falls obviously out of the range of the simple theory.With typical values of τy = 1000Pa, ρM = 2000kg/m3, h0 = 6cm, the dimensionlessyield stress is equal to 0.85, much higher than the limiting value of 0.2 for freeslump theory. Only very liquid mortar with yield stress below 350Pa would fall inthe applicable range.
This problem of non-significant free deformation is overcome by the dynamic effectof shocks which multiplies the driving force of gravity. In solid mechanics, simplecases of dynamic impact of a falling object can be calculated by multiplying thestatic force with an impact factor n (Hibbeler, 2008). The assumptions are that themoving body is rigid, that the stationary body is linear elastic and that no energy islost in the collision. The maximum deformation is calculated from conservation of(kinetic and elastic deformation) energy. It is tempting to propose a dynamic impactfactor for slump deformation, but an analytical calculation requires expressions fordeformation energy, i.e. for viscous energy dissipation. As these are not readilyavailable, an empirical determination of an impact factor could be an alternative ifmodelling the flow table test is the aim. Such a model could iteratively calculatethe deformation of one impact fifteen times consecutively, taking into account thechanged dimensions after the previous strokes.
Penetration tests
The most elementary geometry is considered: a cylindrical plunger of mass M andradius r which penetrates into a cylindrical pot of mortar with radius R. The

Mortar rheology 49
plunger moves along the z axis, either starting at z0, in contact with the surfaceof the mortar, of from an initial height zin, which causes the plunger to arriveat the surface with a speed v. An approach based on viscoelastic modulus isproposed by Coussot (2005). Two alternative options can be formulated: (1) asimple expression of energy conservation, which allows taking into account droppingheight easily, or (2) an approach based on geotechnical theory for resistance of soilagainst penetration of piles. The first is represented in Fig. 3.9 and will be furtherdeveloped.
t
z
zin
z0
zfin
z'z2
z1
2R
2r
Figure 3.9: Assumed geometry of penetration process.
The total energy loss of the plunger Epl during the process from the moment ofcontact until the moment of stoppage at depth zfin is the sum of initial kineticenergy and the difference in potential energy:
Epl = Ekin + Epot = 12Mv2 +
∫ zfin
z0
F (z)dz (3.33)
The velocity v depends on the dropping height: v =√
2gzin. The integral withunknown force F (z) has to be equal to M · (zfin− z0). If the reference for potentialenergy is taken as z0 = 0, the sum becomes:
Epl = Ekin + Epot = M(gzin + zfin) (3.34)
This energy is equal to the energy increase of the mortar, in which we distinguishthree components: surface energy, displacement energy and shear deformationenergy. The mortar has a surface tension, which has to be overcome to penetrate it.When the plunger penetrates, the surface deforms into a curved shape, which hasa larger surface than the initial flat surface. Without making assumptions of the

50 Theoretical aspects of rheology and hygric properties of masonry mortar
shape, we may take the cross section of the plunger πr2 as an approximation of thesurface increase ∆A. As an approximation for surface tension of a paste in whichall grains are surrounded by water, we can adopt the surface tension of a water-airinterface γWA (Coussot, 2005). This leads to an expression for the surface energyincrease:
Esurf = πr2γWA (3.35)
Displacement energy is the energy that is needed to change the arrangement ofthe mortar from the initial cylinder into a cylinder with a central hole of radiusr and depth zfin and an elevated surface due to displacement of mortar. Be ∆z1the vertical displacement of the plunger and ∆z2 the elevation of the surface. Theequality of volume displaced by the plunger and gained due to elevation of thesurface writes: ∆V = πr2∆z1 = π(R− r − t)2∆z2, which gives the value of ∆z2.Name an axis z′ with origin at depth zfin and positive upwards. The verticaldisplacement energy increment over height ∆z′ of a small annular volume dV isdE = ρMg∆z′dV , with dV = Adz′ if A is the ring-s cross-section, which can bewritten as A = π(R − r − t)2. If we assume that the material at depth z′ = 0 islifted over a distance ∆z = 0, and that this lifting distance has a linear increaseup to ∆z = ∆z2 on position z′ = zfin, this displacement energy can be integratedover the lifted zone:
Edisp =∫ zfin
0ρMg
∆z2
zfinz′Adz′ = ρMg
∆z2
zfinAz2fin
2 (3.36)
Shearing occurs in a limited zone of thickness t around the plunger, with initialshear angle γ = 0 and final angle γfin. We apply principles of solid mechanics toestimate the energy per unit volume of deformation Ev =
∫ γfin0 τdγ. Assume a
perfect plastic behaviour with τ = τc for any non-zero value of γ = arctan(∆z1/t).This makes the integral equal to τcγfin/2. The shear angle at stoppage is afunction of penetration depth: γfin = arctan zfin/t. The volume over which theshear deformation occurs is: V = π((r+ t)2− r2)∆z1 = πt∆z1(2r+ t). This resultsin a formula for the shear energy:
Eshear = τcγfin2 πt∆z1(2r + t) (3.37)
The total energy balance of the mortar and plunger is written by combining Eq.(3.34) till (3.37):
Ekin + Epot = Esurf + Edisp + Eshear (3.38)
M(gzin + zfin) = πr2γWA + ρMgπr2
2 z2fin + πtτc arctan zfin
tzfin(2r + t)
(3.39)
If thickness t is known, the critial shear stress τc can be plotted as a functionof penetration depth zfin by using this equation (Fig.3.10). Estimates for t can

Mortar rheology 51
6000
8000
10000
tress
c
(Pa)
0
2000
4000
0 0.02 0.04 0.06 0.08
Crit
ical
st
Plunger penetration zfin (m)
Figure 3.10: Critical stress as a function of plunger penetration for the geometry ofstandard EN 459-2 and with an assumed values of t = 5mm.
be done on the basis of visual observation of the test. In most cases Esurf andEdisp in Eq. (3.39) are negligible compared to Eshear, which allows to simplify theformula and to calculate the critical shear stress:
τc = 2M(gzin + zfin)arctan
(zfint
)πtzfin(2r + t)
(3.40)
Spreading tests
In spreading flow a fluid or semi-solid material is spread over a solid surface by meansof a solid surface which moves against it in tangential motion. Coussot’s approach isto consider very slow (quasi-static) flow within the lubrication approximation (lownormal velocities compared to tangential), so that incipient motion corresponds toyield stress in tangential direction. When the contact area of the moving plane (thetrowel) has dimensions L and D, the tangential force exerted on it is: Ft = τyDL(Fig. 3.11a). An estimation of normal force Fn follows from the momentum balanceof a fluid portion between x and x+ dx (Fig. 3.11b). Horizontal balance gives:
dp · h(x) = τydx− τydx cos ξ (3.41)
∂p
∂x= − τy
h(x) (1− cos ξ) ≈ − ξ2τy2h(x) (3.42)
where the cosine is replaced by the first two terms of the Taylor expansion. Forsmall values of ξ the following simplified expression is obtained by integration ofthe pressure distribution over the surface (Coussot, 2005):
Fn = ξLDτy2 (3.43)

52 Theoretical aspects of rheology and hygric properties of masonry mortar
Ft
Fn
L
D
x
t
v y
y
p-dpp
dx
h(x)
y cos
Figure 3.11: Geometry and parameters for spreading of a mortar layer (a) andhorizontal balance of a mortar portion (b), based on Coussot (2005).
One of the assumptions made here is that the remaining thickness t is smallcompared to the height of the considered fluid portion. This assumption and thecondition of small angles are not fulfilled in the practical case of mortar spreading.For this reason we propose a more generalised integration of the principle of Coussotand we obtain:
Fn = Dξ2τy2 cos2 ξ
ln( t
t+ L cos2 ξ) (3.44)
If reduced normal stress (FN/LDτy) is plotted as a function of the trowel angle,it is clear that both formulas have comparable results at small angles, but thatFn increases fast when the angle increases. At about 0.28 radians normal stressbecomes more important than tangential stress, which is assumed always equal toτy.
Naniwa investigated an empirical description of custom-designed trowellingexperiments, without however linking the measurements to a constitutive modelfor the material (Naniwa, 1983). The mason’s action on the trowel consists of aforce F and a moment M (Fig. 3.12). The direction of F follows from the relationbetween tangential and normal reaction force of the mortar, which defines the angleφ: tanφ = Ftr/Fnr. The moment is due to the fact that the resultant force of themortar acts on the centre of the blade, while the action of the mason acts on thehandle, which is at a distance d from the blade: M = Fd sinφ. The angle betweenthe substrate and the trowel is ξ, the trowel moves at speed v.
This approach and the test setup allows to evaluate the influence of v on the forceF , an aspect which is omitted in the purely plastic model by Coussot, and obtaina certain value as the limit of F for v → 0: a yield force, which can be related toBingham yield stress τ0.

Geotechnical concepts applied to mortar 53
v
FnrFtrFr
F M
d
Figure 3.12: Geometry and parameters for spreading of mortar,based on Naniwa (1983).
3.4 Geotechnical concepts applied to mortar
3.4.1 Stress and deformation of soil
Geotechnical engineering deals with soil as a foundation and building material anddescribes the state of stress, stability and deformation, as well as water contentand flow of water in various types of soil. A soil mechanic approach to mortaris complementary to the theory of rheology. Indeed rheology usually addressessituations of conservation of volume, deviatoric stresses and movements in terms ofthe second invariant of the strain rate tensor. The importance of normal stress inrheology usually only appears when dealing with visco-elastic materials (Vermant,2005).
Soil mechanics on the other hand offers tools to deal with volume change andtriaxial stress conditions, as well as the influence of pore water pressure. Theimportance of normal stresses in the description of shear deformation appears in thefrictional and lubricated regime. Like mortars under low shear rates, soils clearlydisplay yielding behaviour, hence the common use of failure criteria. This alsoexplains why the Mohr-Coulomb criterion is proposed by Coussot for descriptionof granular pastes of hard particles in a non-Newtonian medium (Coussot, 2005).This medium may be itself a non-dilute suspension of colloidal and non-colloidalparticles, like a binder slurry.
According to Terzaghi’s concept that soil strength is only dependent on the skeletonof the solid grains. This is strictly spoken not true when the interstitial liquid is aconcentrated paste, but for mortars it is probably a good approximation. Totalstress is the sum of effective stress σ′ and pore water pressure u:
σ = σ′ + u (3.45)
54 Theoretical aspects of rheology and hygric properties of masonry mortar
Negative pore water pressure causes an increased effective stress. When a saturatedsoil or a mortar is subjected to a normal stress increase, the pore water will takeup part of the total stress, thereby reducing the effective stress in the grains. Ifdrainage is possible, part of the pore water will be evacuated until equilibrium isreached. The difference between initial pore water pressure and the final equilibriumvalue is called excess pore water pressure.
If the interstitial phase is assumed not to be able to take up shear stress, we canstate that τ ′ = τ . The Mohr-Coulomb failure criterion as a function of effectivestresses writes:
τ = c′ + σ′ tanφ′ (3.46)
with c′ the cohesion and φ′ the angle of friction (Lancellotta, 1995). Its moregeneral form, as a function of the principal stresses, represents a pyramid in stressspace (Degrande and Vandepitte, 2007). When the stress condition reaches thisyield surface, failure occurs. Failure is understood as the initiation of movement ofone rigid body relative to another along a critical sliding plane.
If a mortar’s interstitial phase is the binder slurry, which has a finite yield stress,total shear stress is the sum of the contribution from the grains and the contributionof the slurry. On a generalised level, we may write the stress tensor Σ as a sum:
Σ = Σgr(φs) + Σsl(φb) (3.47)
The first term is a function of the sand solid fraction, and varies widely for differentflow regimes, i.e. different importance of direct contact or hydrodynamic forces.The second term gives the influence of the slurry, which depends less on the flowregime. As the slurry is a liquid, this second term may be written as the sum of ahydrostatic and deviatoric stress tensor.
In experiments the effective stress in wet materials is only known if pore waterpressure can be measured. In most situations this is not the case, so that anundrained shear strength is obtained, and total stress analysis is appropriate.
Plasticity is a keyword in soil science as well as for mortars. Depending on thewater content, the mechanical behaviour of fine soil can be described as solid,semisolid, plastic or liquid. This physical state is called consistency. Plastic stateis described as the range of water content at which the soil can be moulded intoany desirable shape without rupture. This ability of soil is due to the action ofthe clay particles. In the semisolid state, cracks appear upon deformation. Thelimits between the regions are determined traditionally by rolling a sample, withthe Casagrande cup or with a falling cone (penetration method). Plasticity index(Ip) and liquidity (Il) index can be derived from the results.

Geotechnical concepts applied to mortar 55
3.4.2 Porosity of soils, compaction and consolidation
Porosity ε is the volume of non-solids (pores) divided by the total volume ina representative quantity of material. It is linked to packing, i.e. the state ofcompaction, which depends on the applied pressure. Instead of porosity, soilmechanics often uses the void ratio e, which is the volume of non-solids divided bythe volume of solids. It relates to solid fraction φ as:
e = ε
φ= 1− φ
φ(3.48)
A decrease of e causes an increase of loadbearing capacity, hence the use of theassociated term consolidation. The amount a granular material can be compactedwhen effective stress increases from σ′0 to σ′1 is the compressibility m:
m = 11 + e0
(e0 − e1
σ′1 − σ′0
)(3.49)
with e0 and e1 the void ratio before and after the pressure change. Thestress/compaction relation can also be characterised by the compression index C:
C = e0 − e1
log σ′1σ′0
(3.50)
The pressure in mortar during the process of bricklaying is caused by the forceof the mason’s action, the weight of the top bricks and of the mortar itself, andthe capillary suction of the brick. Presumably the compaction goes through twophases:
– The first phase is characterised by an important excess pore water pressure,and compaction is determined by the evacuation of water. We can assumethat the volume decrease of the mortar bed is the opposite of the volume ofevacuated water. If initial volume fractions are designated with an index 0,∆V is the mortars volume change and ∆Vw the volume of desorbed water,the decreased volume fraction of water w can be found as:
w = w0V0 −∆VwV0 −∆Vw
(3.51)
Similar formulae can be written for the remaining volume fractions of sand,binder and air. They remain valid as long as no air or solids are exchangedat the boundaries of the system.
– The second phase starts when the excess pore water is dissipated and effectivestress is (nearly) equal to total stress, or even greater, when there is significantsuction. It follows Eq. (3.49) and (3.50).
56 Theoretical aspects of rheology and hygric properties of masonry mortar
3.4.3 Water transport in soil and application to mortar
Water transport through granular materials can be described much in the sameway as through a porous solid (Hall and Hoff, 2002). Stationary flow q in volumeper unit of time through a saturated granular material is described using Darcy’slaw:
q = KsatAh
l(3.52)
with Ksat the permeability in saturated state, A the surface and l the length of thesystem. h stands for the difference in potential over the sample (∆Ψ) expressedin height of water column. A more detailed account of total potential of liquidin a compacting granular material is given in Section 6.3.2. The extended law ofDarcy for varying void ratio, and thus varying permeability, is given in Section3.5. In the initial state of a mortar, there is more water present than necessaryto fill the voids in the loose packed dry material, i.e. the mortar is oversaturated.This follows from the simple observation of loose packed bulk density of the drymaterial (Section 4.2) and the actual volume fractions of the reference mortarsafter mixing (Section 4.4). The mortar’s hygric properties upon compaction canbe described as a function of either water content or void ratio. Equations forwater retention curves and permeability or diffusivity of soil have been proposed inseveral publications (Van Genuchten, 1980; Rajkai et al., 2004; Nuth and Laloui,2008).
A mortar’s volume change during application may or may not be taken intoaccount in the determination of the water retention curve. When the solid skeletonis compacted, pore diameters decrease and liquid potential increases. If this istaken into account, a description in terms of fixed geometric coordinates becomescomplicated, but it can be replaced conveniently by a material coordinate orLagrange coordinate system (Smiles, 1970). Void ratio replaces water content asthe principle variable in that case. If it is not taken into account, it is in factconsidered to be embedded in the variable water content (Nuth and Laloui, 2008).
As with solid materials, also water retention of soils is subjected to hysteresis.Drying curves always display the highest water contents. Unless mentionedotherwise, we always use wetting curves for bricks, and drying curves for themortar. Within the boundary conditions of our experiments, the change in watercontent is monotonic in both materials.
3.4.4 Slurry filtration
The process a mortar undergoes upon suction is in fact a case of filtration, or theformation of a filter cake out of a wet slurry by applying an external pressuredifference. Filtration theory is treated in depth in literature about mining and
Water transport in mortar and brick 57
treatment of industrial sludge (Smiles, 1970). Dewatering in contact with porousmaterials has been studied for bentonite in plaster mould in Smiles and Kirby(1994) and more recently for mortar in contact with bricks in Hall and Hoff (2002);Collier et al. (2007).
The determination of filtration parameters of the slurry, like permeability ordiffusivity, is based on assumptions about the variation of solid content over thethickness. The theory used in this investigation is taken over from Landman et al.(1999).
3.5 Water transport in mortar and brick
3.5.1 Porosity and water content of mortar and brick
Some relevant and important concepts of liquid transport through porous materialsare briefly mentioned in this section; extensive information can be found in Halland Hoff (2002) or Hens (2000). Only isothermal transport of liquid at ambienttemperature through bricks and mortar is considered. The solid phase is composedof the ceramic material in bricks, and the sand and binder fraction in mortar. Theliquid phase is an aqueous solution of ions with a certain amount of dispersedcolloidal binder particles, hence it has significantly different properties from purewater. The gaseous phase is a mixture of dry air and water vapour. Vapourtransport will be neglected. The dynamics of liquid in the porous material can bedescribed in terms of absorption (entry), migration (movement within the fabric) ordesorption (loss). When fresh mortar is used to construct a wall, liquid is desorbedfrom the mortar and absorbed by the brick.
Porosity ε is the volume ratio of non-solid phases to the total volume in a material.The pores are filled with gaseous and liquid matter. The matrix of ceramic brick isformed by dehydration of clay and coalescence of particles by high temperaturesintering. Porosity of ceramic brick is usually between 0 and 30%; the values forthe bricks in our experiments are given in Section 4.2. In the notation adoptedfor mortar composition we can write: ε = w + a = 1 − φ, with φ the total solidfraction: φ = s+ b. Porosity of mortars is a variable, in contrast to the porosity ofbricks, which is usually considered constant. Total porosity is composed of open(accessible, connected) porosity and closed (inaccessible, disconnected) porosity.Closed porosity will be counted as part of the solid matrix unless specifies otherwise.Measurements of open porosity are obtained in different ways:
– For bricks, open porosity is measured by saturating under vacuum with water(wsat = ε) and comparing the oven-dried and saturated weight. Capillary

58 Theoretical aspects of rheology and hygric properties of masonry mortar
water content (wcap) is obtained by a simple sorption test explained in (Halland Hoff, 2002).
– For mortars, porosity is calculated from particle densities of constituents andthe mix ratios (Section 3.2). It is assumed that during dewatering of a mortarby brick the volume of the other phases in the mortar remains constant, sothat the void ratio can be recalculated from the amount of desorbed water.This amount follows from water content data measured by X-ray attenuation.It is important to keep in mind that porosity or void ratio of a fresh mortaris different from the hardened mortar, because of the formation of capillarypores and gel pores during hardening (Aligizaki, 2006).
The assumption of constant porosity of bricks is not always valid in the zone ofthe interface with mortar: binder particles or fines from the sand may migrateinto the brick, thereby causing a local decrease of porosity. External stresses andtemperature are other factors which may influence the porosity.
Liquid content of brick is described by the same symbol as for mortar: w, which isa volume ratio (dm3/m3). The degree of liquid saturation s is the volume ratio ofliquid in the total open porosity: s = w/wsat.
3.5.2 Capillarity in brick
When the pores are partly filled by liquid and gas, the pressure difference betweengas and liquid pressure on both sides of the interface is called the capillary pressurepcap = pgas − pliquid. Vapour pressure pv in the gas is related to capillary pressurepcap as expressed in Kelvin’s law.
pvpv,sat
= exp(−( pcapρlRV T
))
(3.53)
In this equation pv,sat is saturation vapour pressure, ρl the density of the liquid, Rvthe gas constant for vapour and T absolute temperature. The left member of theequation is the relative humidity, also denoted Φ. In a hydrophilic material pcap isnegative and we call it capillary suction. A material is characterised by a capillarywetting curve: pcap as a function of w. In reality important hysteresis may exist,but we only consider the curve for wetting of bricks and drying of mortar.
In equilibrium, when pore pressure and liquid pressure are constant over a volumeof material, contact angles and curvature of interfaces are the same in all pores.The Young-Laplace equation relates capillary pressure to the radius of the curvedinterface r:
pcap = 2γGLr
cos θ (3.54)

Water transport in mortar and brick 59
with γGL the surface tension between liquid and gas, 2/r the curvature and θ thecontact angle. r is assumed positive when the surface is concave at the gas side,which is the case for hydrophilic materials.
Instead of using pressures, wetting phenomena can also be described in terms ofthermodynamic quantities: the hydraulic potential or liquid potential. This is ageneralized form of the capillary potential, which is related to pcap as Ψcap = pcap
ρlg.
Hydraulic potential gives a measure for the energy of a mass of water with referenceto an external reservoir and may be expressed per mole of material. Total hydraulicpotential is a function of capillary potential, elevation, pressure, chemical potentialand temperature. In relevant cases for this research chemical and temperaturepotential will be negligeable, and elevation will cause much smaller differences thancapillary suction. Pressure is relevant, e.g. when a brick is brought in contact withmortar with a significant force.
Empirical expressions for the capillary wetting curve, which are convenient formodelling, can be written in terms of potential (Van Genuchten, cited in Hall andHoff (2002)):
w = wcap
[1
1 + (αΨcap)n]1−1/n
(3.55)
with α and n empirical constants. They can also be expressed in terms of capillarypressure, as for example in a similar multimodal formula proposed by Carmelietand Roels (2002):
w = wcap∑
i=1→nli [1 + (aipcap)ni ]
(1−1/ni) (3.56)
In both equations the capillary water content is proposed as the maximum: this isfulfilled as long as slower processes of dissolution and diffusion of air do not playan important role.
3.5.3 Liquid potential in mortar
In the case of an oversaturated granular material, which looses water uponcompaction, capillary potential can be written as a function of void ratio e. Whene decreases, pore size decreases and the liquid potential increases. The relation canbe approximated over a certain range of e by the empirical equation proposed byCroney and Coleman (cited in Smiles (1970)):
e = α log Ψ + β (3.57)
with α and β two empirical constants. Experimental determination of the empiricalparameters and a choice of the equation that are best fit for the situation, will betreated in Section 6.4.

60 Theoretical aspects of rheology and hygric properties of masonry mortar
3.5.4 Liquid transport laws, diffusivity and permeability
Capillary liquid transport in brick
The unsaturated liquid transport in the brick can be written as a function ofpotential gradient and permeability K:
∂w
∂t= ∇K(Ψ)∇Ψ = div(K(Ψ)gradΨ) (3.58)
Permeability, like potential, is a function of water content w and it is equallysubjected to hysteresis. The dependency on w can be recalculated in terms of Ψ orpcap. We will discard hysteretic effects by considering only the wetting process forbrick and the drying process for mortar. During this process the permeability inboth materials decreases.
The diffusivity D is defined as D = K(∂Ψ/(∂w). It is a convenient parameter todescribe liquid transport as a process of diffusion with w as the leading variable.D can be measured conveniently for wetting of solid materials. A simple modelform for D is proposed by Gummerson (cited in Hall and Hoff (2002)):
D = D0 expCw (3.59)
An improved equation for the non-linear behaviour can be found in (Carmelietet al., 2007).
Liquid transport in compacting granular materials
For granular materials an important distinction is made between different regionsof moisture content: saturated or unsaturated. Most soil applications deal withunsaturated materials, but fresh mortar can be considered as saturated during theprocess of bricklaying. This approach is motivated by comparing the solid fractionin a fresh mortar to other reference states. For the example of a lime hydratemortar (materials and properties, see Section 4.2) the solid fraction in the freshstate is 0.60 (Section 4.4), which is higher than the dry measured solid fraction of0.46 without compaction and 0.57 after vibration, but lower than the highest solidfraction achieved by mechanical compaction: 0.70 (Section 5.5). In other words, itcan be expected that the high suction exerted by contact with capillary materialscauses an increase of φ from 0.60 upward, while water is desorbed. During thisprocess, as long as no air infiltrates, the mortar remains saturated.
Expressions for saturated permeability as a function of porosity are often based onthe work of Kozeny and Carman (see e. g. Kutilek and Nielsen (1994)). In simplifiedform it writes (Spielman, 1975):
K = ε3
5µζ2 (3.60)

Water transport in mortar and brick 61
where µ is kinematic viscosity (µ = η/ρ) and ζ the internal surface area perunit volume of the porous material. ζ can be written as a function of specificsurface area SSA (dimensions surface/mass of solids) and the density of the solids:ζ = SSA · ρ · (1− ε) where the factor (1− ε) corrects for the fact that only partof the material is filled with solids. If we call the specific surface area per unitvolume of solids Z, it is clear that Z = SSA · ρ. Hence the traditional form of theKozeny-Carman equation writes (Hetsroni, 1982):
K = ε3
k′Z2µ(1− ε)2 (3.61)
with k′ the Kozeny constant, which can be taken equal to about 5 for ε < 0.8. TheKozeny constant is a material constant, which counts for the effect of pore shapeand tortuosity. The equation can also be written with only one variable and oneempirical fitting parameter K∗ (Smiles, 1970):
K = K∗ε3
(1− ε)2 (3.62)
In order to apply these relationships to mortar, it is necessary to work withparameters which are in some way an average of those for the binder and the sand.An interesting alternative is the theory developed by Ben-Aïm, Le Goff and LeLec for permeability of binary mixtures (Ben-Aïm et al., 1971). They distinguishtwo limit cases: a serial combination of both materials as the upper limit (bedperpendicular to the direction of flow), and a parallel combination as the lowerlimit. If we define the volume fractions of binder and sand as Ys = s/(b+ s) andYb = b/(b+ s), the serial combination gives:
1K
= YsKs
+ YbKb
(3.63)
and the parallel combination:
K = KsYs +KbYb (3.64)
The expression of Kozeny and Carman can be used for both separate permeabilitiesof the components. Permeability for the bimodal system is:
K =(Y 2s
Ks+ 2KsKb
YsYb + Y 2b
Kb
)(3.65)
Where Ys can be substituted by 1− Yb or vice versa.
Material coordinates for liquid transport in compacting mortar
Water transport in compacting granular materials can conveniently be describedusing a material coordinate m in stead of the usual x (distance to edge or interface).

62 Theoretical aspects of rheology and hygric properties of masonry mortar
The material coordinate takes into account the change in void ratio e (Smiles,1970). m is defined by:
dmdx = (1 + e)−1 (3.66)
m =∫ x
0(1 + e)−1dx (3.67)
In m-space unit distance encompasses a unit volume of solid material. Fig. 3.13illustrates the case when the initial uniform solid fraction φ0 is equal to 0.5 so thatthe size of the sample is twice as large in x coordinates as in m coordinates. Interms of m the compacting mortar conserves its size throughout the process.
m x m x m xt = 0t > 0
t = 8
8
Figure 3.13: Schematic process of filtration: water is desorbed from a mortar at thebottom plane. x coordinates remain fixed, while m coordinates follow the material.
Conservation of mass leads to the uni-dimensional transport law (Smiles, 1970):
∂e
∂t= ∂
∂m
(Dm(e) ∂e
∂m
)(3.68)
where spatial derivatives refer to m-space. The index m refers to diffusivity andpermeability, which are related through:
Dm(e) = Km(e)dΨde = K
(1 + e)dΨde (3.69)
3.5.5 Sorptivity, desorptivity and transfer sorptivity
If a brick is in contact with an infinite water reservoir at constant pressure, and whenthe brick has infinite length, one-dimensional water uptake can be characterised byan absorption coefficient A, also called sorptivity, which is defined as:
A =∫ wsat
0λ(w)dw (3.70)

Water transport in mortar and brick 63
in which λ = x√t is the Boltzmann transformed coordinate with x the distance in
the material from the plane of contact. It can be shown that the total amount ofwater absorbed by the brick is M(t) = A
√t (Hall and Hoff, 2002). For a brick of
finite dimensions, water take-up has a bilinear increase as a function of√t, the
first section ends when the whole brick reaches capillary saturation, the secondshows a slower increase because dissolution of entrapped air is necessary to fillmore pores with water.
Likewise, the desorption of a semi-infinite quantity of mortar can be describedwith a coefficient of desorption or desorptivity R. The amount of desorbed wateris M = R
√t. Desorptivity of mortar can be measured. R is a function of
pressure, and can empirically be related to it by R = kPn with k and n empiricalconstants (Green et al., 1999). Desorptivity can be measured using a filter press,for 104Pa ≤ P ≤ 5 · 105Pa approximately (Carter et al., 2003) or using an adaptedsuction test, for 104Pa ≤ P ≤ 5 · 104Pa (Hendrickx, 2008).
When brick and mortar are combined, a transfer sorptivity S exists whichcharacterises the linear regime of water transfer as a function of
√t as long as
both are semi-infinite. This process can be either described using the transportequations (3.58) and (3.68), or it can be simplified by applying a sharp-front model,as proposed by Hall and Hoff. This model is based on two important assumptions:the brick is divided by a sharp front between capillary saturated and dry zones,and the mortar is divided in a zone of initial water content (low solid content),and a zone of minimum water content (maximal solid content: the cake). In bothmaterials the front proceeds and it can be demonstrated that (Hall and Hoff, 2002):
1S2 = 1
A2 + 1R2 (3.71)
when R is determined for the pressure which corresponds to the capillary suctionof the brick (the substrate-matched desorptivity). Experimental validation of thistheory is done by Collier et al. (2007). For any combination of a porous substrateand a compacting granular paste or slurry, S can be calculated for the specificvalues of initial water content and diffusivity of both materials.
In realistic situations however mortars are applied in thin layers, which meansthat this approach of semi-infinite volumes becomes somewhat academic. Duringa short initial phase, which corresponds to the compaction phase of the mortar,water transfer will be according to the semi-infinite theory. During this phase partof the brick will reach capillary water content over a certain depth. In the secondphase the mortar approaches the state of maximum compaction, and water transferproceeds much slower. The total amount of transferred water hardly increases,and inside the brick the moisture front will flatten out due to the diffusion of thepresent water. This situation can be simulated numerically by coupling the the

64 Theoretical aspects of rheology and hygric properties of masonry mortar
transport equations for mortar and brick, and discretising the equation for use in acontrol volume method.
3.5.6 Measuring water content
Direct methods for measuring the water content of bricks or mortars include dryingand weighing or chemical methods, e.g. using calcium carbide. Drying can be donein the oven, by vacuum-drying or freeze-drying. For mortars with hydraulic binderscare needs to be taken to control this process and interpret the results correctly(Knapen, 2007). Indirectly the water content of materials can be by quantified bymeasuring physical properties as the attenuation of neutrons, gamma and X-rays,resonance of magnetic dipoles (NMR), positron emission or electrical resistance(Groot, 1993; Brocken et al., 1998; Roels and Carmeliet, 2006).
We propose to use the method of attenuation of X-rays, based on the successfulresults with a relatively simple setup for brick specimens in Janssen et al. (2007);Roels and Carmeliet (2006). During the process of desorption of a mortar by abrick, the water content on a point (x, y) in the brick may be larger than the initialwater content, and the water content of the mortar lower. The difference betweenthe actual water content at a time t and the initial value is calculated from thedifference in intensity of transmitted X-rays before and after contact (t = 0 whenmortar and brick come into contact).
In practice a sample is placed in between an X-ray source and a detector plate.The intensity Idry transmitted by the dry specimen is recorded first. In this initialsituation a dry mortar mix could be used as a reference. During the water transfertest, an amount of water is taken up by the brick, which will cause attenuationof the beam, so that the measured transmitted intensity Iwet will be smaller. Ingeneral and for monochromatic X-rays, the ratio of transmitted (It) and incident(I0) intensities is related to the attenuation coefficient µ of the material and itsthickness d by Beer’s law:
ItI0
= exp(−µd) (3.72)
We can therefore write the dry and wet transmitted intensities as:
Idry = I0 exp (−µd) (3.73)
Iwet = I0 exp (−µd− µwdw) (3.74)
The dimension dw is the thickness of an imaginary equivalent layer of water whichattenuates the same amount of radiation as the water inside the specimen. Themoisture content w is equal to dw/d and can be calculated from the measured

Summary 65
intensities according to Roels and Carmeliet (2006):
w = − ln (Iwet/Idry)ρwµwd
= − ln Iwet − ln Idryρwµwd
(3.75)
3.6 Summary
Mortar is a mix of one or more inorganic or organic binders, aggregates, fillers,additives and/or admixtures. A mortar can be prepared according to mix ratios:binder to sand mass ratio B/S and water to binder mass ratio W/B. Traditionalmix ratios are given in bulk volumes cement : lime : sand with no specificationof water quantity. After mixing, a mortar contains an amount of air, and is fullydescribed by its composition in volume fractions s, b, w and a.
The most important parameter of a mortar when considered as a suspension, is thevolume solid fraction φ = s+ b, which may be given separately for sand and binder:φs and φb. Solid fraction and shear rate γ determine the flow regime of a mortarwhen it is sheared: frictional at low shear rate, lubricational or hydrodynamicat higher shear rate. The differences between the flow regimes are related to therelative importance of different forces that govern the motion of the particles.
With φ a variable, mortar and slurry viscosity depend on two important parametersof the particles: maximum packing fraction φm and intrinsic viscosity [η]. φm isnot the physical maximum of compaction, but corresponds to a maximum loosepacking. If both parameters are known (experimentally) for different fractions in asuspension, the suspension’s viscosity can be calculated with simple mixing rulesaccording to Farris.
Suspensions with high solid fractions typically display a yield stress τy andthixotropic behaviour. As long as shear stress is below τy they behave as elasticsolids. At higher stress levels, shear flow is induced. Thixotropy means that theviscosity decreases when flow is applied, and subsequently recovers in time whenflow is stopped. One of the consequences of thixotropy is that shearing may developlocally instead of over a large zone: in a thin region shear rate is high and as aconsequence viscosity is low, while over the bulk of the material large zones areunsheared.
For yield stress materials which are in homogeneous flow, the Bingham model isoften applied to describe the shear rate dependency of viscosity. However it is onlyvalid when the material is not subjected to thixotropy. The Bingham model andperfectly plastic model coupled with a yield criterion are used to analyse the flowin complex tests such as squeezing tests, penetration tests and spreading tests.
In geotechnical engineering, the total internal stress transmitted over a plane in amaterial is split into a part due to contacts between the grains, and a part due

66 Theoretical aspects of rheology and hygric properties of masonry mortar
to pressure of the interstitial liquid. In shear, the effect of the grains is muchstronger than the effect of the liquid, and this effect of the grains depends on thenormal stress. In this approach yield stress can be written as a function of internalnormal stress transmitted by the grains, called effective stress. Geotechnical theoryalso covers the compaction of granular materials upon drainage of the water andliquid transport through soils. Usually unsaturated phenomena dominate therelevant domain for soil engineering, but the theory of slurry filtration is found tobe complementary for the case of oversaturated phenomena.
Liquid transport through mortar, which changes due to water loss, is convenientlydescribed with adapted transport laws in material coordinates. The law of Kozenyand Carman can be used to express permeability as a function of void ratio.Existing analytical solutions of moisture transport between a slurry and a poroussolid only covers the case of two semi-infinite volumes. Other cases have to besolved numerically. A measuring method using microfocus X-ray radiography isproposed as a possibility to validate such numerical solutions.

Chapter 4
Experimental investigation ofworkability
4.1 Introduction
This chapter develops the criteria for assessment of workability, which will be usedas a reference throughout the following three chapters. In order to establish thesecriteria with a sufficient reliability, it was decided to go back to practice and doexperiments with an international panel of six masons: if there is reasonably smallvariance in the response of this test group, this leads to strong conclusions aboutworkability.
All experiments in this chapter are related to the test procedures with the masons’panel, whereas the experiments in Chapter 5 to Chapter 7 are lab work done onmortars of which the composition is derived from them.
After presenting the materials and methods for this practical investigation, theresults are discussed in two parts: quantitative and qualitative. Among thequantitative results are the variable water content and plunger penetration depthof the tested mortars. Out of these data, reference mix ratios are defined for furtheruse in the experiments. Qualitative information contains the subjective assessmentof the mortars and the results of an inquiry about workability. They provide thematerial for a definition of workability, which is based on the literature review, butextended and corrected in several aspects.
Strength tests on mortar, bricks and masonry are used for an assessment of theinfluence of workmanship on the mechanical behaviour under compression.
67

68 Experimental investigation of workability
4.2 Materials and mixing procedures
4.2.1 Binders
Five different binders were used in the experiments, with different chemical andphysical properties (Table 4.1). One of them - the cement - is used with andwithout admixtures, which brings the total to 6 different binder types to analyse.Apart from these industrial products, a slaked lime putty was also included inpart of the experimental programme. This material was obtained by wet slakingof quicklime in our lab. In order to avoid any confusion about terminology: limehydrate and hydrated lime refer to the same product, i.e. relatively pure CaOH2,which is obtained by dry slaking quicklime (CaO). Slaked lime is chemically verysimilar, but it is produced by slaking quicklime with an excess of water, in contrastwith the lime hydrate, which is slaked with stoichiometric amount of water. Bothbinders harden in contact with moist air containing CO2.
The slaked lime is always used in the form of a dense aqueous suspension orgel, which is called putty. The term hydraulic lime is used as an abbreviation ofnatural hydraulic lime, obtained by burning and slaking lime stone with impurities.Contrary to the lime hydrate, it hardens mostly through a chemical reaction withwater. Detailed notes on the different nature of these lime-based binders canbe found in Cizer (2009). Mixtures of air lime and cement are sometimes calledartificial hydraulic lime. In stead of this misleading term we will refer this productas lime-cement. The cement used in out experiments is an ordinary Portlandcement. The extension AE refers to the presence of air entraining agent.
The industrial names and standardised denominations of the binders are:
– Lime hydrate: Tradical 98 by Lhoist France, CL90S according to EN 459-1;
– Lime hydrate AE: the same product, but with addition of air entraining agentin the form of a powder in the factory;
– Lime-cement: Tradical 98 by Lhoist France (33.3%m) mixed with ordinaryPortland cement by Schwenck Germany, CEM I 42.5R according to EN 169-1(66.7%m);
– Hydraulic lime: FEN-XA by Tassullo Italy, NHL5 according to EN 459-1;
– Cement: ordinary Portland cement by Schwenck Germany, CEM I 42.5Raccording to EN 169-1;
– Cement AE: the same product, but with addition of a liquid air entrainer(BASF Micro-air 100) by 0.1% of the binder mass, and a plasticizer in powder(BASF Rheomix 359) by 0.5% of the binder mass.

Materials and mixing procedures 69
Table 4.1: Physical and chemical properties of binders.
Limehydrate
Limehydrate AE
Lime-cement
Hydrauliclime Cement
Chemical composition (XRF)CaO (%) 96.6 96.3 75.6 51.2 63MgO (%) 0.94 1.05 1.49 1.68 1.74Al2O3 (%) 0.059 0.072 2.6 4.9 4.6SiO2 (%) 0.144 0.19 9.6 16.6 16.7
Fe2O3 (%) 0.048 0.063 2.7 2.1 3.6SO3 (%) 0.1 0.18 2.8 2.1 4.5
Amount of hydrate and carbonate (TGA)Ca(OH)2 (%) 83.5 89.2 29.6 6.2 1.2CaCO3 (%) 12.7 5.5 5.7 37.7 4.8
Particle size (laser granulometry), SSA (BET), porosity (BJH)Median grain size
d50 (µm) 6.03 5.39 8.99 9.34 12.5
d10 (µm) 1.3 1.26 1.44 1.33 1.41d90 (µm) 22.5 21.8 33.5 64.1 39.3
SSA (m2/g) 12.0 11.9 4.5 3.5 1.3Pore volume
100-300Å (cm3/g) 0.025 0.024 0.008 0.005 0.004
Pore volume17-1000Å (cm3/g) 0.063 0.065 0.023 0.015 0.001
Particle density (pyknometer) and bulk densities / solid fractions (gravimetric)Particle density
(kg/m3) 2222 2222 2750 2780 3079
Loose packedρb,b (kg/m3) 373 373 592 725 954
Loose packed solidfraction (m3/m3) 0.168 0.168 0.215 0.261 0.31
Medium packedρb,b (kg/m3) 473 462 674 812 1069
ρb,b aftervibration (kg/m3) 498 498 766 873 1236
The raw quicklime, used for producing the slaked lime, is made of limestone froma quarry in Hermalle, Belgium (Dumont-Wauthier). The quicklime was poured inwater in a large stainless steel vessel in a 1 to 3 mass ratio solids to water. Themix was first stirred after 1 minute with a shovel. Then from 30 minutes after theaddition until 3 days later, it was regularly mixed with a rotating mixer fixture ona drill, in order to avoid any unreacted residue. After 1 week the putty was sievedthrough a mesh of 1 mm and stored in vessels with enough water to have at least 3cm of liquid covering the putty. The date of slaking was 13 November 2006, which is

70 Experimental investigation of workability
of importance considering the change of the material upon aging (Rodriguez-Navarroet al., 1998). The quicklime is highly reactive: T60C = 1min16sec according to EN459-2. It was observed that the slaking water reached boiling temperature withinseconds after the addition of the quicklime. TGA analysis on a vacuum-driedputty indicated the chemical composition: 92.3%Ca(OH)2, 4.2%CaCO3 and 3.5%of impurities (details on procedure: see Cizer (2009)). Median particle diameterd50 = 18.35µm, particle density ρb = 2267kg/m3 and SSA = 24.8m3/g.
4.2.2 Sand
Three types of sand are used and will be referred to as Zutendaal, standard andfiller. The first is a medium grain size siliceous sand from a quarry in Zutendaalby Hermaco, Belgium. It is classified as a sand 0/0.5 (0/1) according to EN13139.The filler is a very fine siliceous sand with similar physical properties from a quarryin Bourron, France (FT07 by Sifraco). The grains of both products are fairlyrounded. The standard sand is of unspecified origin, but the grading complies withthe EN196-1 and EN459-2 for use in mortar prisms. Physical properties of thesands are listed in Table 4.2 and sieving results are plotted in Fig. 4.1 accordingto EN933-1.
60%
80%
100%
ssin
g (%
)
0%
20%
40%
0.05 0.5 5
Frac
tion
pa
Sieve aperture (mm)
Zutendaal batch 1Zutendaal batch 2Zutendaal batch 3Zutendaal batch 4Standard
Figure 4.1: Grading of the siliceous quarry sand fromZutendaal for the 4 different batches.
Over the course of the research 4 batches of Zutendaal sand have been used. Itwill be mentioned in the description of each experiment which batch was used.

Materials and mixing procedures 71
Table 4.2: Physical properties of sands (’-’ means unknown or not measured).
Zutendaal Standard FillerMineral name quartz - quartzGrading (EN 13139) 0/0.5 (0/1) 0/2 0/0.1 (0/1)Median particle size (mm) 0.22 0.8 0.091Particle density ρs(kg/m3) 2629 2635 2650Loose packed ρb,s(kg/m3) 1418 1606 1303Loose packed solid fraction φs 0.54 0.61 0.49ρb,s after vibration (kg/m3) 1641 - 1554Solid fraction after vibration φs 0.62 - 0.59
4.2.3 Bricks
All masonry units are ceramic bricks. Three different sizes of brick were used forpractical tests with masons: a moulded facing brick, a small and a large perforatedbrick. The moulded facing brick is typical for visible facing work in Belgium. Thesmall perforated block is rather used for internal walls, or for the internal leaf ofa cavity wall. The large perforated brick is common in France and Germany toproduce single-leaf external walls. These three bricks were selected as representativefor nowadays masonry practice in Western Europe. The most determining factorsfor their performance during application are size and hygric properties (Table 4.3).
Table 4.3: Physical properties of bricks (’-’ means not measured; values betweenbrackets are measured on a different but similar brick).
Mouldedfacing
Extrudedfacing
Smallperforated
Largeperforated
Producer(nationality)
Vandemoortel(B)
Wienerberger(B)
Wienerberger(B)
Wienerberger(G)
Name Mono 3009 none Porotherm Poroton Plan-T14Nom. dimensionsL×D ×H (cm3) 19× 9× 5 21× 10× 5 29× 14× 19 37.5× 30× 24
Open porosityε (%m3/m3) 21 24 (32) (32)
Bulk densityρb (kg/m3) 2010 2001 (1690) (1690)
Capillary sat.wcap (dm3/m3) - 149.6 (254.8) (254.8)
Absorption coeff.A (kg/m2s0.5) 0.0039 0.1881 (0.299) (0.299)
The moulded facing brick was also used for mechanical tests. Its compressivestrength is fbc = 83.50MPa, bending tensile strength fbf = 18.24MPa and direct

72 Experimental investigation of workability
tensile strength fbt = 5.52MPa. Compressive strength testing was done on rectifiedbricks according to EN 772-1 (CEN, 1999). Bending tensile strength and directtensile strength were measured on prisms of 40× 40× 160mm3.
A custom-made extruded (solid) brick was used in experiments concerning watertransport. Its hygric properties are extensively documented (Poupeleer, 2007). Cutsamples of this brick are used in experiments where the aim is to model the hygricbehaviour.
4.2.4 Mixing procedures
Some preliminary tests have been executed with the often-cited mixing procedureof EN196-1 and EN459-2 CEN (2001, 1995). This procedure involves high-speedmixing and ensures ideal dispersion of binder and, if applicable, admixtures.Nevertheless this procedure was abandoned because the reference compositionswere based on large batches of approximately 25l mixed in a floor-model Hobartmixer type M80 at low speed, following procedure Mix 1. This larger mixer doesnot attain the same high speeds as the smaller table model. Secondly it appearedthat the standardised procedure was not suited for air entrained mixtures: it leadsto very large amounts of air and high variability compared to low speed mixing.Thirdly the high speed mixing does not reflect on-site practice.
Mix 1Use a Hobart M80 planetary mixer with a flat paddle (dough paddle). Quantitiesare based on a sand mass of 35 kg.
1. 75% of the estimated needed water quantity is poured in the bowl;
2. approximately half of the aggregate is added, then all the binder, and theother half of the aggregate;
3. mixing starts at low speed;
4. water is added by a mason, until the water content and homogeneity arejudged optimal;
5. mixing duration, including eventual interruptions, is not fixed, but takesapproximately 3 to 5 minutes.
A small-scale mixing procedure Mix 2 was designed to reproduce this mix forlaboratory batches. A distinct procedure Mix 3 was used for mortar with cementAE, because of the different behaviour of admixtures.

Materials and mixing procedures 73
Mix 2Use a Hobart N50 planetary mixer with flat paddle (dough paddle). Quantities arebased on a sand mass of 2700 g.
1. Pour the water into the bowl, then half of the aggregate, all of the binder,and the other half of the aggregate;
2. 0:00-1:30 mix at speed 1;
3. 1:30-2:00 take the bowl out of the mixer and scrape the material that sticksto the walls with the paddle in order to homogenise as much as possible;replace the bowl and paddle;
4. 2:00-4:00 mix at speed 1.
Mix 3Use a Hobart N50 planetary mixer with flat paddle (dough paddle). Quantities arebased on a sand mass of 2700 g.
1. Pour the water into the bowl, then half of the aggregate, all of the binder,and the other half of the aggregate;
2. 0:00-0:30 mix at speed 1;
3. 0:30-1:00 take the bowl out of the mixer and scrape the material that sticksto the walls with the paddle in order to homogenise as much as possible;replace the bowl and paddle;
4. 1:00-1:45 mix at speed 1.
For the preparation of binder slurries and diluted mortars a different procedureMix 4 was used.
Mix 4Use a Hobart N50 planetary mixer with wire whip. Quantities are based on abinder mass of 500 g for slurries, and 200 g for mortars.
1. All ingredients are poured into the bowl, the water first;
2. 0:00-2:00 mix at speed 1;
3. 2:00-3:00 take the bowl out of the mixer and scrape all the material whichsticks to the walls using the whip in order to homogenise as much as possible;replace the bowl and whip;
4. 3:00-5:00 mix at speed 1.

74 Experimental investigation of workability
Some of the preliminary experiments and experiments with the vaneand direct shear apparatus were done with the mixing procedure givenin EN 196-1, but with double quantities. It is referred to as Mix 5.Mix 5Use a Hobart N50 planetary mixer with flat paddle. This procedure is identical toEN 196-1, but quantities are double, i.e. a sand mass of 2700g in stead of 1350g.
1. Pour the water into the bowl and add the binder;
2. 0:00-0:30 mix at speed 1 (start immediately);
3. 0:30-1:00 mix at speed 1, while adding the sand steadily;
4. 1:00-1:30 continue mixing at speed 1;
5. 1:30-3:00 stop the mixer; during the first 15s, remove by means of a rubberscraper all the mortar adhering to the wall and bottom part of the bowl andplace in the middle of the bowl;
6. 3:00-4:00 mix at speed 2.
4.3 Test setup and procedures
4.3.1 General outline of the experiments
Six masons from three different countries (Belgium, France, the Netherlands) wereinvited to work in the laboratory with six different mortars and three differenttypes of bricks. They all had at least 5 years of experience with mortars containinglime. The panel was composed of three nationalities: Dutch (1 mason), French(1 mason) and Belgian (4 masons). Of the 4 Belgian masons 3 were from theFlemish region and 1 from the Walloon region. Each of them spent one day of worktogether with the author and two technicians for the execution of the experimentalprogramme described below. Four objectives were formulated:
1. to have an estimate of the suitable water to binder ratios (W/B) for fixed drymixes. For this purpose the masons could freely determine the water contentof a binder and sand mixture that was presented to them. The obtainedvalues serve as a reference throughout the research.
2. to evaluate the qualities of the so obtained 36 mortar mixes for practical work.The workmen were continuously filmed and interviewed during bricklaying inorder to obtain a maximum of information from their qualitative remarks.

Quantitative results and composition of reference mortars 75
This information was then further analysed and synthesised to clarify theconcept of workability.
3. to obtain information on some other subjective workability-related issues,such as the preferences and concerns of the masons with regard to masonrymortars. This was done by presenting them inquiries with quantitative,ordinal and qualitative questions.
4. to investigate and quantify the influence of variations in mortar due toworkability and workmanship issues on the mechanical strength of masonry.For this purpose small columns were made with the moulded facing brickand subjected to uniaxial compressive tests.
4.3.2 Experimental setup and course of one test
The experimental programme consisted of two sections: the first was done withfixed B/S, freeW/B and using Zutendaal sand; the second was done with free B/Sand free W/B, using the standard sand. In the first section of the programme,the B/S were fixed on the values mentioned in Table 3.1. Batches of approximately22 liters were mixed according to procedure Mix 1 (Fig. 4.2). The amount of wateradded by the mason was weighed and the consistency of each composition wasmeasured immediately by plunger penetration (EN 459-2:2001).
Each mortar batch was tested on all three brick types: both types of perforatedbricks were used to add three bricks to a single-leaf wallette, and the facing brickwas used to produce small columns of eight layers of three bricks each in alternatingbond (Fig. 4.2). The masons were continuously interviewed and filmed during thisprocedure. The detailed geometry, curing and mechanical testing procedure of thecolumns is treated in Section 4.7.
During the second section, in which standardised sand was used, W/B and B/Swere free to be chosen by the mason for the composition of small batches (1.2l).Mixing was done with a small trowel in a plastic bucket. The obtained mortarbatches were assessed as such without further use for bricklaying.
4.4 Quantitative results and composition of referencemortars
4.4.1 Chosen water content for fixed dry mixes
In the first section of the programme (fixed B/S), the selected W/B values rangefrom 0.8 for cement AE to 2.0 for lime hydrate (Table ??). A correlation was found

76 Experimental investigation of workability
Figure 4.2: Mason choosing the water content for a mortar mix in the first sectionof the practical tests, and production of masonry columns with the tested mortar.
1 5
2.0
2.5
3.0
3.5
4.0
PPW/B
0.0
0.5
1.0
1.5
Figure 4.3: Water to binder ratios (W/B) selectedby masons and measured plunger penetration (PP ).
Error bars indicate standard deviations.
betweenW/B and the specific surface area (SSA) of the binder. It is also clear thatfor air entrained mortars the required water content is significantly lower. W/Bhas a coefficient of variation (COV ) of 3% to 9% between the different masons forone specific binder.
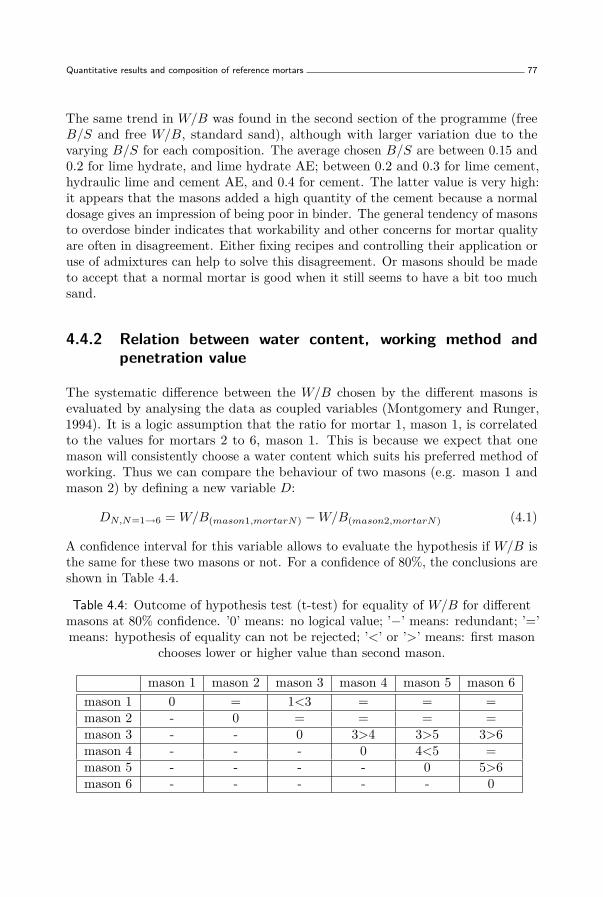
Quantitative results and composition of reference mortars 77
The same trend in W/B was found in the second section of the programme (freeB/S and free W/B, standard sand), although with larger variation due to thevarying B/S for each composition. The average chosen B/S are between 0.15 and0.2 for lime hydrate, and lime hydrate AE; between 0.2 and 0.3 for lime cement,hydraulic lime and cement AE, and 0.4 for cement. The latter value is very high:it appears that the masons added a high quantity of the cement because a normaldosage gives an impression of being poor in binder. The general tendency of masonsto overdose binder indicates that workability and other concerns for mortar qualityare often in disagreement. Either fixing recipes and controlling their application oruse of admixtures can help to solve this disagreement. Or masons should be madeto accept that a normal mortar is good when it still seems to have a bit too muchsand.
4.4.2 Relation between water content, working method andpenetration value
The systematic difference between the W/B chosen by the different masons isevaluated by analysing the data as coupled variables (Montgomery and Runger,1994). It is a logic assumption that the ratio for mortar 1, mason 1, is correlatedto the values for mortars 2 to 6, mason 1. This is because we expect that onemason will consistently choose a water content which suits his preferred method ofworking. Thus we can compare the behaviour of two masons (e.g. mason 1 andmason 2) by defining a new variable D:
DN,N=1→6 = W/B(mason1,mortarN) −W/B(mason2,mortarN) (4.1)
A confidence interval for this variable allows to evaluate the hypothesis if W/B isthe same for these two masons or not. For a confidence of 80%, the conclusions areshown in Table 4.4.
Table 4.4: Outcome of hypothesis test (t-test) for equality of W/B for differentmasons at 80% confidence. ’0’ means: no logical value; ’−’ means: redundant; ’=’means: hypothesis of equality can not be rejected; ’<’ or ’>’ means: first mason
chooses lower or higher value than second mason.
mason 1 mason 2 mason 3 mason 4 mason 5 mason 6mason 1 0 = 1<3 = = =mason 2 - 0 = = = =mason 3 - - 0 3>4 3>5 3>6mason 4 - - - 0 4<5 =mason 5 - - - - 0 5>6mason 6 - - - - - 0

78 Experimental investigation of workability
The outcome of this analysis has to be considered together with the observationson the working method of the masons (Table 4.5) and the measured penetrationvalues (Fig. 4.3). It clearly emerges that the method of mason 3 requires a morefluid mortar to enable him to extrude the excess mortar by hand. Otherwise thepressure on the wrist would become too high. On the other hand, masons 1, 5 and6 apply an incomplete filling of the joints, which means a more local applicationof the mortar bed: a smaller force has to be exerted on the brick to lower it inthe bed, hence their tendency to choose for a lower W/B. Mason 4 appears tochoose for a relatively low W/B compared to his working method; this correspondshowever with the observation that he preferred, from his professional point of view,to apply a higher force rather than to use more water.
Table 4.5: Working methods of masons.
Mason id. Filling ofhorizontal joints
Filling ofvertical joints Way of placing brick
mason 1 nearly complete incomplete tapping with(B, Fl) blade of trowelmason 2 complete complete (from above) tapping with
(F) rubber hammermason 3 complete complete (if possible only by hand, extruding
(N) when laying the brick) the mortar by pressingmason 4 nearly complete nearly complete mostly by hand, light(B, Wa) tapping with handle of trowelmason 5 incomplete smeared from the side tapping with(B, Fl) on brick in position blade of trowelmason 6 incomplete nearly complete; on brick tapping with(B, Fl) in position and new brick handle of trowel
The results of the plunger penetration test (Fig. 4.3) on the fresh mortars show avery large variance with COV from 15% to 43% and average values around 2.5cmfor most of the mortars. This variability is typical for the type of test and can berelated to the large influence of small differences in the way of execution, whichare difficult to exclude. As expected, mason 3 had consistently the highest value.Indeed, for the differences between the masons, the same considerations as forW/B are valid. Within the data for one mortar type, the correlation coefficientfound between PP and W/B fluctuates from 0.6 to 0.8 approximately.
From another perspective, we can also calculate the variance of W/B of all differentmasons for the same mortar type (in stead of comparing the behaviour of 2 masonsover all mortars), and compare it to the values of another mortar type. Thevariances of W/B for the 6 tested mortar types are not significantly different at alevel of 90% (f-test), except for the two extremes: the mortar with Cement has alower standard deviation (0.03) than the mortar with hydraulic lime (0.08). Thismeans that in general we can consider the variance of W/B equal for all batches,

Quantitative results and composition of reference mortars 79
and we propose the average value of 0.0035. This corresponds to a standarddeviation of 0.06kg/kg that can be taken as a general value for the variability ofW/B when different masons choose their personal ideal mortar mix.
4.4.3 The composition of reference mortars
Reference mortars are composed from the results of the 1st section of the practicalexperiments: B/S is based on Table 3.1 and W/B is fixed on the average from Fig.4.3. The compositions of the mortars obtained with mix procedure Mix 2 and Mix3, using sand of batch 2, were measured and calculated according to the principlesdeveloped in Section 3.2 (Table 4.6).
Table 4.6: Composition of reference mortars, based on practical experiments.Volume fractions of air and densities are given with both calculated and measured
values.
Limehydrate
Limehydrate AE
Lime-cement
Hydrauliclime Cement Cement
AES(kg/kg) 0.723 0.761 0.702 0.689 0.677 0.694B(kg/kg) 0.092 0.097 0.149 0.146 0.167 0.171W (kg/kg) 0.185 0.143 0.149 0.165 0.156 0.135s(m3/m3) 0.525 0.439 0.525 0.516 0.517 0.459b(m3/m3) 0.079 0.053 0.106 0.104 0.109 0.097w(m3/m3) 0.354 0.217 0.293 0.326 0.313 0.235acalc(m3/m3) 0.042 0.290 0.075 0.054 0.060 0.208ameas(m3/m3) 0.035 0.210 0.064 0.060 0.066 0.163ρM,calc(kg/m3) 1993 2140 2126 2083 2138 2199ρM,meas(kg/m3) 1908 1519 1966 1971 2009 1741
Some remarks have to be made about the air content a. The volume ratios of thecomponents can only be found if a is known. Values of a were obtained in twoways: (1) calculated with the densities ρM and ρ∗M (Eq. (3.8)) and (2) measureddirectly with the pressure method (EN 459-2:2001). Values for particle densitiesare given in Tables 4.1 and 4.2. The calculated air content differs systematicallyfrom the directly measured value, especially at high levels (15-30%) (Fig. 4.4).Three explanations can be given for this divergence:
– A part of the present air may be located in the crevices of the irregularlyshaped binder particles. These crevices can be considered as the pores ofthe (agglomerated) binder material. If these solid particles keep their shapeduring the compression test, the volume decrease will be less then expected,resulting in an underestimation of the actual air content.

80 Experimental investigation of workability
– The effect of air entraining agent is not constant in time: a mortar may havea large initial volume increase when reaction rate of the admixture is high,and then start to shrink again. In the test method density is measured first,and compressibility immediately after, so there may be a decrease during thesmall time gap between both measurements.
– In the pressure method it is assumed that the small quantity of air present ontop of the mortar before the test, is replaced by water which is run throughthe open space. If this water intrudes some of the air bubbles, which is verylikely near the surface, these bubbles will not be measured as gas any more,because they are no longer compressible.
Similar conclusions were drawn in a large experimental programme published inSBR (1985). More information could be obtained by applying other test methods,e.g. using a solvent to replace the air. Test prinicples are reviewed in RILEM(2009).
40%
m³)
y = 1.30x
0%
10%
20%
30%
0% 10% 20% 30% 40%
Air
cont
ent a
cal
cula
ted
(m³/
m
Air content a measured (m³/m³)
Figure 4.4: Air content a of reference mortars, measured withpressure method and calculated from bulk density.
4.4.4 Parenthesis: reproducibility and adaptation of referencemortars
Apparent difference in sand batches
Four different sand batches were used during the research. This was obviously notthe initial intention: the first batch was too limited for the large-scale practical

Quantitative results and composition of reference mortars 81
test programme, and the second and third batches proved unsufficient when largequantities were consumed in parallel experimental work. Between batch 1 and 2 nodifferences were noticed. However the differences between batches 1 and 2 on onehand, and 3 and 4 on the other hand were significant. When switching from batch2 to batch 3 with the same binder and mix ratios, there was a decrease in viscosityand yield stress of the mortar, and a decrease of water retention. Numerical valuesof several tests can be found in Becelaere and Bonte (2008).
The reason for this difference has not been identified: the grading of all 4 is quitesimilar and does not give sufficient explanation, nor does the quantity of organicmatter (methylene blue test).
Adaptation of reference mix ratios
Given the importance attributed in this study to the optimal feeling of workabilityfor masons, the choice was made to correct the reference composition when switchingsand batches (from 1 and 2 to 3 and 4). The new mix ratios were determined bya limited series of practical tests, carried out by mason 5, who came out of theprevious tests as the closest to average behaviour. The test consisted in making amix according to Mix 1, but in a small mixer in stead of a large one (quantities asin Mix 2-3 ). After each mix, two measures were taken with the plunger penetrationapparatus (EN 459-2:2001). With the new sand, this mason opted systematicallyfor a lower W/B, on average 7% below the old value obtained for the larger mix.However this value was not adopted as new reference, because it appeared thatthe produced mixes had quite different penetration values from the original largemixes.
For this reason a second procedure was followed, which consisted of approachingthe mean plunger penetration value of the original large mixes of all masons (Table??). Batches were mixed according to Mix 2-3 with variable W/B in order toattain the target value. The new reference value was chosen as the ordinate of thetarget value on a linear regression line (Fig. 4.5).
Table 4.7: Original and corrected values for W/B
lime lime hy- lime- hydrau- cement cementhydrate drate AE cement lic lime AE
Original W/B 2.016 1.475 0.998 1.132 0.930 0.788Corrected W/B 1.810 1.516 1.019 1.102 0.907 0.794
Hence two different compositions were used throughout the experimental chapters,one called original composition and another corrected composition. Unlessmentioned otherwise, all tests with sand batches 1 to 2 are done with the originalcomposition, and those with sand batch 3 to 4 with corrected composition.

82 Experimental investigation of workability
40
)30
n (m
m)
20netra
tion
0
ger p
en
10
Plu
ng lime hydrate lime hydrate AElime-cement hydraulic limecement cement AE
00.7 1.2 1.7 2.2
cement cement AE
Water to binder mass ratio W/B (kg/kg)
Figure 4.5: Determination of new composition by approaching original plungerpenetration value.
Variations in the binders as well can not be excluded. All binder batches wererenewed after approximately 15 months. The binders were originally selectedfor having constant and well-known characteristics at production, which wouldguarantee the continuity when the batches were renewed approximately every year.But small veriations in e.g. mixing fineness may have important consequences.
Some recommendations for similar investigations can be formulated:
– Work with one batch of sand. The whole batch should be dried, thoroughlymixed and divided into samples according to standard procedures. Storageshould be in dry conditions.
– The utmost care should be taken for packing and storage of binder powders.Packing in airtight barrels with some moisture reducing agent is necessaryfor use over several years.
– Mixtures produced with different sizes of mixers should not be compared,even when the procedure is similar.

Qualitative results and definition of workability 83
4.5 Qualitative results and definition of workability
4.5.1 Description of workability properties for all mortars
While working with the different mortars, the masons of the test panel were asked togive any positive or negative remark which they found relevant for the workabilityof the mortar. It was found that, although none of the masons could give a cleardefinition of the abstract concept of workability, they were nonetheless very preciseabout all the subtle aspects of it, from the moment that they started to work. Wefirst give an account of these various aspects by listing the phenomena that themasons encountered during work. We use the expressions used by them (translatedfrom Dutch or French), and give an interpretation of their physical meaning andan indication for the desired behaviour. As these remarks are recurrent for thedifferent mortar types, they are considered as general requirements or properties.In the next section, they will be attributed to each of the mortar types separately.
Sticks to the brick The mortar should adhere well to the bricks: to theunderlying brick as well as to the sides of the adjacent brick and to the brick whichis put in place. The work is much easier if a mortar sticks and holds to a verticalbrick face: the mortar for a vertical joint is either thrown against or smeared onthe brick already in position, or smeared to the side plane of the brick which is tobe put in place. A third possibility is that the new brick is used to push up themortar against the adjacent brick which is already in place, in one single movementwith the positioning of the brick. Alternatively, the vertical joint will have to befilled up from the top after placing the bricks, which takes much more work and isnot always evident.
Sticks to the trowel The mason stirs the mortar in the tub and takes up anaccurately estimated quantity of material with his trowel. Stirring is harder whenthe mortar adheres strongly to the trowel. Ideally he can make a “thick sausage”of mortar on the trowel, of appropriate size, which is cohesive on itself but doesnot stick to the trowel. Transfer to the masonry is generally done by throwing, orby scooping when larger quantities are necessary. It is believed that throwing witha certain speed results in good adhesion. This throwing or scooping is complicatedwhen the mortar does not release the trowel easily. This problem also plays whenthe mortar is spread or smeared: it should remain cohesive and stick to the brick,but not to the trowel. This phenomenon is evidently related to density, as a heaviermortar will easier drop off a metal blade, while a light mousse-like paste will tendto be more sticky, even when the contact surface is smaller.
Light or heavy Lighter mortar makes stirring and application to the brickseasier. The energy necessary for transfer of a lower mass decreases with lower mass.Some masons experience problems of the wrist due to the heavy and recurrentloads. Other physical problems masons testified about, were injuries of back and

84 Experimental investigation of workability
knees, both evidently related to the position during work, but also to the densityof the mortar.
Easy to spread mortar bed Spreading is done with the trowel under acertain angle, either in a continuous motion (covering the whole brick with thesame thickness) or in an up-and-down going motion (leaving an uneven mortarbed). The action is a combination of squeeze flow and laminar shear flow. In bothcases the quantity of mortar is estimated to obtain a good filling of the bed jointwhen the new brick is pushed into position. The force needed is related to theyield stress and viscosity of the mixture and depends on the speed of the trowelmovement. The shear resistance of the mortar is also related to the applied normalforce, with the ratio between normal stress and shear stress depending on thetrowel angle. This resistance should not be too high.
Easy to squeeze mortar bed Depending on the way of working, the brickis placed in a purely vertical motion, squeezing out the mortar laterally, or in acombined horizontal and vertical motion. The latter is the most applied techniqueand can be done in a continuous or a left-and-right motion. The mortar is squeezedat a speed which is usually decreasing. Resistance against squeezing increases withdecreasing distance between the brick surfaces and with increasing velocity. Excessmortar can be extruded at two or more sides in an asymmetrical way, and is usuallyimmediately removed with the trowel. The mortar’s resistance to extrusion shouldnot be too small, to avoid instability of the next courses, but also not too large,which is hard for the mason.
Stiffens too fast due to water loss The porous bricks exert capillary suctionon the mortar, causing a water flow from mortar to brick. The decrease of watercontent leads to a strong increase in the mortar’s viscosity and yield stress. Thisphenomenon is required to give stability to the masonry, but should not occur toofast, because it hinders the correct positioning of the brick. Placing a brick is donein a time span between 1 and 30 seconds, depending on the situation. Gainingrigidity is positive starting about 1 minute after contact with the brick. In somecases, masons prefer to apply a mortar bed for several units at once: this is onlypossible when the mortar does not loose too much water during 1 or more minutes.This phenomenon can be described in terms of desorption of water from the freshmortar and concentration-dependent viscosity.
Releases water when compressed In stead of being absorbed by capillarity,water can also be “squeezed” out of the mortar when pressure is applied. Thisoccurs when a rather wet mortar is used for jointing and compressed with ametal tool. As long as the mixture is oversaturated with water, and water is notimmediately drained, this pressure results in excess pore water pressure, drivingout the water, until the solid grain skeleton can take over this stress. This effect isnegative, because it complicates the correct shaping of the joint and the expelledwater stains the bricks. A high permeability of the mortar makes the water seepage

Qualitative results and definition of workability 85
easier. This effect is not important when jointing is done later with another mortar.
Water rises in the tub There is a water flow from the bulk of the mortarto the top, which results in a gradient in water content: liquid on top and dense,heavy mortar at the bottom. This effect is called “bleeding” in literature andit necessitates remixing by the mason, which consumes time and energy. Highpermeability of the mixture and high pressure gradients are the driving parametersof the problem.
Bricks float or swim When shear resistance in the bulk of a bed joint is nothigh enough after bricklaying, bricks may slide out of position. This can happenone or several layers below the top layer and is triggered by tapping on the bricksor pressing them. High quality visible masonry is impossible when floating occurs.
Stains the bricks Bricks are stained by a mixture of water and binderparticles which runs over the surface or which permeates from the edges of thejoints. The effect is worsened when the water content of the mortar is higher andthe mortar has low viscosity or yield stress. The problem is prevented when themortar is sufficiently cohesive and does not loose much liquid in contact with thebrick.
Easy to fill holes or vertical joints The mason has to be able to fill verticaljoints from above, by throwing or smearing mortar, but at the same time mortarshould not fall into the perforations of the bricks. Mortar is thrown into holeseasier and falls easier to the bottom of the joint when it is heavier. This is moredifficult to do with low density mortars. The resistance to penetrate into verticalperforations of a brick is higher when the mortar has a higher yield stress.
Lean or coarse versus fat, greasy or creamy A mortar is called lean orcoarse when it gives an impression of being poor in binder. The grains of sandscratch the trowel, which can be heard and felt by the mason. The opposite is amortar which is creamy or fat, which masons relate to a higher binder content orthe presence of admixtures.
Dry or rigid versus wet or fluid These remarks relate to the impressionof appropriate water content. Although the masons were asked to determine theirideal water content, some of the mortars gave the impression of being too rigidwhen used with a certain brick. This indicates that it is hard to predict the mortar’sbehaviour when mixing the components.
4.5.2 Characterisation of the separate mortars
In Tables 4.8 and 4.9 all the above described properties are attributed to thedifferent mortars. Table 4.8 groups the remarks given while working with the solidfacing brick; Table 4.9 does the same for all the remarks that were mentioned

86 Experimental investigation of workability
concerning work with both types of perforated bricks. Some of the defaults, liketoo fast stiffening due to water loss, apply especially to the perforated bricks, whichhave a higher absorption coefficient. Others, like the problem of floating bricks,apply especially to the facing brick, which has a low absorption coefficient.
It is clear from the number of remarks, that it is easier for masons to identifyproblems than to identify qualities of a mortar. A remarkable result is that themortar with the worst score, the cement mortar, could be turned into the mortarwith the best score (cement AE) by adding the appropriate admixtures. Most ofthe mortars without air entraining agent are judged negatively for being too heavyor rigid. In this category the Lime hydrate mortar has the best overall score.
Two of the recurrent deficiencies deserve special attention, because they mademortars unacceptable for the masons. The first is the low water retention for thehydraulic lime mortar and the cement mortar: this causes bleeding and prematurestiffening when the mortar is spread on the bricks. This was unacceptable for usewith both types of perforated brick, which had a high suction rate; for the smallfacing brick it could be accepted. The second major problem was the floatingof the bricks that occurred with the mortar with lime hydrate AE. This mortardoes not gain enough shear resistance to keep the bricks in place. In the case ofvisible brickwork, this was judged unacceptable. The problem is also related tothe low suction rate of the brick: when the brick absorbs more water in shortertime, stiffening may improve. Apart from these rather grave deficiencies, the othermortars were considered workable. From the above stated, we also conclude thatevery composition has to be judged for a combination of brick and mortar.
4.5.3 Results of masons’ inquiry
The masons were asked for their opinion about priorities for mortar qualities, typesof sand and mortar, mixing procedures, admixtures, influence of lime, applicationof mortar for different purposes and type of mixers. The priorities were assessedby giving a mark from 1 to 12. The scores were normalised to a percentage, ofwhich averages and standard deviations are given in Table 4.10. The major concernappears to be workable time, i.e. the length of the time before setting of the mortar.In general the properties related to ease of work have a high score, and thoserelated to long term qualities and durability a low score. Mechanical propertieshave an intermediate appreciation.
There still seems to be a clear preference of the masons for mortars mixed on thesite as opposed to prefabricated products (Table 4.11). They are also most used intheir working situation. This is probably typical for these experienced masons whowork in conservation and not representative for construction industry as a whole.Prefabricated wet mortars are rarely used by these masons.

Qualitative results and definition of workability 87
Table 4.8: Identification numbers of masons who made remarks while workingwith solid facing brick, sorted by type of remark (vertical entry)
and by mortar type (horizontal entry).
Mortars with binder: Limehydrate
Lime hy-drate AE
Lime-cement
Hydrauliclime Cement Cement
AEPositive remarksSticks to the brick 4 1,4 4Easy to spreadmortar bed 2 2,3 1
Easy to squeezemortar bed 2,3,4 1,2,3,5
Easy to fill holes/vertical jointsNo water rising
in tub 1
No staining 1,2,5 1,3 1,3Stable, needs no
remixing 5 2,5,6
Negative remarksSticks tothe trowel 2,4,5 2
Too heavy, hardfor the wrist 4 3
Water risesin tub 5 1,2,3,4,6 6
Releases waterwhen compressed 1,6 1
Bricks floator swim 2,6 6
Stiffens too fastdue to water loss 2,3 2,3,5
Stains the bricks 4 2 1,2Hard to fill holesor vertical jointHard to spread 2Hard to squeeze 3 2,3,5,6 2,5,6
Too leanor coarse 5
Too dry,stiff or rigid 1,3,4,6 2 4
Not stable,has to be remixed 1,4,5 1,2,5,6

88 Experimental investigation of workability
Table 4.9: Identification numbers of masons who made remarks while workingwith small and large perforated bricks, sorted by type ofremark (vertical entry) and by mortar type (horizontal entry).
Mortars with binder: Limehydrate
Lime hy-drate AE
Lime-cement
Hydrauliclime Cement Cement
AEPositive remarksSticks to the brick 2,3,4,5,6 2 1 4 4,6 2,6Easy to spreadmortar bed 3 1
Easy to squeezemortar bed 4,5,6 1,3,5,6 5 1,2,3,4,5,6
Easy to fill holes/vertical joints 2 4
No water risingin tub 1 2
No staining 4Stable, needs no
remixing 1 2,3
Negative remarksSticks tothe trowel 4,5
Too heavy, hardfor the wrist 1 3 3,6
Water risesin tub 4 1,2,4,6 2,4,5,6
Releases waterwhen compressed 1
Bricks floator swim
Stiffens too fastdue to water loss 4 2 1,3,4,5 1,2,5,6
Stains the bricks 1Hard to fill holesor vertical joint 2
Hard to spreadHard to squeeze 2 4,5
Too leanor coarse 6 5 4
Too dry,stiff or rigid 1,3,4 3,5
Not stable,has to be remixed 5 2

Qualitative results and definition of workability 89
Table 4.10: Priorities for mortars as stated by test panel of masons,normalised to a score in percentage, in order of highest score.
Property Mean Stdev1 Workable time 82% 10%2 Workability 71% 27%3 Adhesion to brick 68% 34%4 Productivity 63% 31%5 Early strength 61% 16%6 Mechanical resistance 58% 22%7 Shrinkage 54% 14%8 Visual aspect 47% 19%9 Cost 46% 44%10 Thermal insulation 42% 23%11 Environmental nuisance 33% 14%12 Frost resistance 26% 29%
Table 4.11: Occurrence and appreciation of mortar typesin work situation of test panel.
Mortar type Most used PreferredMixed on site 50% 56%
Prefabricated dry (silo) 44% 33%Prefabricated wet 6% 11%
The masons’ ideas about sand were quite diverging, as could be expected from theirdifferent origin and the pre-dominant use of local sands in general. The followingremarks were made about the use of sands in general and about the specific caseof Zutendaal sand:
– In general the Zutendaal sand is regarded as acceptable to very good for thepurpose of bricklaying.
– Most masons are used to working with coarser sand and usually also preferthat. Reference is often made to Rhine sand 0/2 or 0/3.
– In France coarser sand is used more often; in the Netherlands special yellowishwell-graded sands are sold as masonry sand.
– The Belgian masons refer to a local yellow sand which has a good reputationfor workability (Pfeffermann, 1999; Broothaers, 2000).
– Comments on the normal sand were more negative. It is considered unsuitablefor masonry work. The impression remained coarse, even with large quantities

90 Experimental investigation of workability
of binder added. A recurring idea was that there are not enough fine grainsin it.
The use of admixtures was generally appreciated. They were said to improveworkability, workable time, water retention and frost resistance. The only drawbacksare the price and the odour. These important advantages are maybe the reasonof some doubtful practices. It appears that admixtures are often used despite theban on them in the job description. The products referred to are not known bythose who use them, they are delivered in large flasks labeled mortar oil or mortarfat, without any indication of the content, let aside any official technical approval.Dosage depends on the experience of the user and there is a certain awareness ofthe risk for errors.
The question about use of lime aroused mixed reactions. It is recognised asimproving water retention, but less positive are the high water need and too slowor too fast setting. Slow set recurs also among the positive points: mortar remainsworkable even after application, and the leftovers can be reused the next day. Itimproves the adherence to existing masonry and the cohesion of the mortar itself.Lime in mortar is to be avoided for solid bricks and water-resistant masonry.
The question if different mortar mixtures were used for different types of brickor different parts of the building, was answered negatively with an exception forthe Dutch mason. General-purpose mortar is the rule, even when bricks can becompletely different. The principles proposed by the Dutch mason were in thesense of lower binder content for work with perforated bricks, and higher bindercontent for water-tight masonry.
Three types of mixers were mentioned to be used frequently for on-site mixing:rotating concrete mixers, cylinder mixers with rotating paddle and screw-mixerswhich are down-scaled versions of the silos with dry mixed prefabricated mortars.
4.6 Defining workability
Workability of mortar is a combination of properties, which determine the easeof use and effectiveness for masonry. The definitions given in ASTM and RILEMpublications can be preserved, but a more precise definition of some of the propertiesand a general classification of the whole is proposed (ASTM, 2004a; RILEM, 1978).The use of the notion of consistency is questionable: it may come handy to express afeeling in conversation, but its physical meaning is too blurry. Instead all propertieswhich involve the relation between stress and deformation can be classified underthe rheology of the mortar. The description and measurement of these rheologicalproperties are developed in Chapter 5.

Influence of workability on mechanical strength 91
All other aspects of workability as listed and described above (except density) canbe classified as hygric properties or water transport properties. Their importance isnot only in the water need of hydraulic binders, but also in the fact that they governthe rheological properties: when water content decreases, yield stress and plasticviscosity increase. Through these mechanisms water transport is related to bleeding,stability (retained homogeneity), water release upon compression, and water releaseand subsequent stiffening in contact with brick. Adhesion to brick is enhanced bywater flowing to the brick, and adhesion to the trowel is lower when a slipperywater film is easily formed. Water transport through mortar can be described inthe same way as through porous solid materials. The governing parameters aredesorptivity, permeability or diffusivity. The description and measurement of thewater transport properties is developed in Chapter 6.
4.7 Influence of workability on mechanical strength
4.7.1 Objectives and test methods
The variation in water addition and the different working methods of the masonsof the test panel lead to variations in the masonry. To assess this influence andto quantify it, a series of mechanical tests were done on the mortars, the bricksand the masonry columns. The test methods and results are briefly treated here; adetailed description can be found in Hendrickx et al. (2008a).
Immediately after the production of each mortar batch a set of prisms was producedaccording to EN 196-1 (CEN, 1995). Prisms with air lime and air lime AE werecured in the covered moulds for 10 days and for 80 more days in lab conditions20C and relative humidity of 60%. Prisms with all other binders were cured for 7days (demoulded after 24 h) at high relative humidity (92%) and then cured for 83days in lab conditions. Masonry columns were made of 24 bricks in alternatingbond between two concrete tiles (Fig. 4.6). The columns with hydraulic mortarswere wrapped in plastic sheet until 24 h after production, when the top tile isplaced. Curing was done in lab conditions for 90 days.
All mechanical experiments were carried out at an age of 90± 2 days. The mortarprisms were tested for flexural tensile strength fmf , compressive strength fmc anddynamic Young’s modulus Edyn by ultrasonic wave velocity (NBN B15-229:1976).Masonry columns were subjected to a displacement controlled compressive testat velocity v = 0.2mm/min on a Dartec hydraulic press (maximum capacity5000 kN). Driving force and deformation were continuously recorded by the forcecell of the press and 8 LVDTs, 1 vertical and 1 horizontal on each side of thecolumns (Fig. 4.6).

92 Experimental investigation of workability
4.7.2 Masonry strength and strength of components
Mortar prisms with varying W/B behave differently according to the nature ofthe binder used. The lime mortars show an influence of anisotropy due to theprocess of carbonation, while the hydraulic mortars show a decrease of strengthwith increasing W/B. Nevertheless these differences in mortar strength could notbe correlated to the strength of the masonry. In general the ratio of masonrystrength between the different binders, is far inferior to the corresponding ratio inmortar strength. The resulting stress-strain diagrams typically show an early startof horizontal deformation at the narrow sides, and later for the wide sides (Fig.4.7). The onset of cracking is not visible in the vertical deformation curve. Allcurves are non-linear due to damage accumulation: the Young’s modulus decreasescontinuously upon development of cracks in the structure.
Masonry columns displayed two distinguished failure modes, depending on thestrength and stiffness of the mortar used: ductile for the lime hydrate, lime hydrateAE and hydraulic lime versus brittle for the cement, lime-cement and cement AE.For the weakest mortars, a low lateral expansion was observed, which suggests aninternal failure and volume decrease by denser packing of the mortar (Fig.4.8).
300290
590
490
300190
300
5050
250
300
300
150
Figure 4.6: Geometry of masonry specimens and location of LVDTs.
The use of the model given in Eurocode 6 for prediction of masonry strengthfrom the strength of the components, was applied to the results, and proven tobe conservative for expected value (CEN, 2002). The model underestimates theexperimental value in all cases. The opposite is true for the variance calculatedfrom the model: here a lower value was predicted than the experimental value.This suggests that caution is needed when using the formula for similar cases: itspractical usefulness is proven but its physical meaning is doubtful, which leads toan incorrect estimation of variability due to workability issues (Schueremans andVan Gemert, 2006).

Summary 93
20
30
s (N
/mm
²)
Compressive tests on masonry columns 090507B6_graphs.xls copy PhD
0
10
-15 -10 -5 0 5 10
Axi
al s
tres
Strain (mm/m)
vertical wide sideshorizontal wide sideshorizontal narrow sides
Figure 4.7: Typical stress-strain diagram of a compressive test:column with cement mortar, produced by mason 2.
Figure 4.8: Stress-strain diagrams of all masonry specimensproduced by mason 3, made with different binders.
The most important conclusion towards the importance of workability andworkmanship is that the variations in mortar related to it do not affect thecompressive strength of masonry, at least not in combination with a high-strengthfacing brick (see Hendrickx et al. (2008a) for tables and extensive analysis).
4.8 Summary
The variation in freely chosen water content (W/B) for 6 masons are small. Thestandard deviation is approximately equal to 0.06kg/kg over a data set whichcovers 6 different mortar types. This is true when B/S is fixed. When B/S is

94 Experimental investigation of workability
also left free, there is no good agreement between different masons, and Portlandcement mortar is added in excessive quantities.
Despite this general agreement, systematic differences between some of the masonscould be detected with a significance of 80 %. These differences are related totheir working method. A mason who applies complete filling of joints and squeezesmortar out of the joints, chooses a higher W/B. It is however difficult to relatethese subtle differences to a measured value like the penetration of a plunger,because of the high variability in results.
The qualitative assessment of mortars by the test panel was remarkably consistent.All the recurring remarks of masons during work were recorded and describedexhaustively. This allowed to identify some important deficiencies of the mortars:in the first place premature stiffening due to water loss, and in the second placethe instability (“floating”) of bricks.
As a definition of workability, the existing definitions were found suitable, but amore precise description of its various aspects is provided. It is clear from thefindings that workability is a difficult equilibrium between these different aspects.For example a higher amount of entrained air reduces the weight, enhances waterretention and reduces the plastic viscosity. On the other hand too much air leadsto floating of bricks and mortar sticking to the trowel. Overall the properties canbe divided into rheological properties, hygric properties and density. A study ofthe parameters related to these three properties can be proposed as the best wayto quantify the workability of a mortar.

Chapter 5
Rheological experiments forthe evaluation of workability
5.1 Introduction
This chapter contains all experiments, carried out by the author in differentlaboratories, for the rheological characterisation of mortar. It uses the theoriesand models presented in Chapter 3 for the analysis; the aims of the tests and thereference compositions of the different mortars are based on Chapter 4.
5.1.1 Relevant shear rates for bricklaying
A range of relevant shear rates for the processes of masonry production can bederived from an intuitive quantification of typical dimensions and velocities. Thisis done in Table 5.1. The values for low shear mixing are based on a traditionalrotating concrete mixer; medium and high shear mixing are based on speed 1 and2 in a planetary mixer (Hobart N50). The latter are more relevant for lab practicethan for work on the building site. Trowelling or spreading a mortar bed is themost common action of the mason, followed by the squeezing of the mortar bedwith the top brick. The values chosen here are based on the observations in theexperiments described in Chapter 4. All values are approximative and are onlyindicative for the orders of magnitude.
95

96 Rheological experiments for the evaluation of workability
Table 5.1: Estimation of typical shear rates for applications of masonry mortar.
Process Typical dimension Typical Typicalperpendicular to velocity shear rateflow direction (m) (m/s) (m/s)
Low shear mixing 0.1 1 10Medium shear mixing 0.01-0.05 1 20-100High shear mixing 0.01-0.05 2 40-200Trowelling 0.01-0.05 0.5 10-50Squeezing 0.01 0.1 10
5.1.2 Test methods
Standardised tests are done in order to evaluate their potential for rheologicalcharacterisation. The more fundamental quantification of rheological parameters,especially Bingham parameters, is undertaken by using different rotationalrheometers. The primary objective is to find meaningful relationships betweenparticle properties, mix proportion, composition, and rheological behaviour of themortar mix. To achieve this, separate tests have been done on binder slurries anddiluted mortars, which do not present the same experimental difficulties as thereference compositions.
The possibilities of vane rheometry are explored to characterise mortars in thefrictional regime. The feasibility of different geometries, procedures and analyses isinvestigated.
Squeezing tests are discussed because of their particular practical relevance. Theaim is to assess the possibilities for parameter fitting of several models.
5.2 Standardised rheology-related tests
Two data sets will be treated in this section: a set of preliminary tests on differentmortars with different sands, and a set of tests on reference mortars. The firstseries of tests were performed before reference mixtures were fixed, and theypresent a wide range of experiments: flow table, plunger penetration, droppingball, and workability meter. In the second series, only flow table tests and plungerpenetration tests were done.
The values of measured and/or calculated air content are always mentioned, becausethey have an important influence on the rheological parameters and the outcomeof the standardised tests.

Standardised rheology-related tests 97
5.2.1 Preliminary tests on various mortars
In an early stage of the research various tests were performed on mortars withstandard sand, which were mixed according to Mix 5. The results illustrate therelation between the values obtained in different tests, like the flow table and theplunger penetration test, or the relation between test results and mortar parameterslikeW/B, bulk density ρM and air content a. Mix ratios were determined as follows:
– for cement mortar: 1/3 ;
– for hydraulic lime mortar: recalculated to obtain an identical bulk volumeratio as the cement mortar;
– for lime-cement mortar: based on bulk volume ratio of 1/3;
– for lime hydrate and lime hydrate AE mortars: based on bulk volume ratioof 1/2.
W/B was first aimed to obtain a flow table diameter of 155mm, which was judgedto give a workable mortar by experienced lab personnel (not masons). This valuewas adapted for the lime hydrate and lime hydrate AE mortars, which apparentlyneeded lower flows.
The flow table test was carried out according to EN 1015-3. The lubricating oilwas a low viscosity oil of type WD40. The results can not be compared to resultsof a similar flow table test with other test parameters. Dropping ball test, plungerpenetration test and workability apparatus test followed their respective standardsas described in Section 2.2.
The influence of W/B on the flow table diameter is shown in Fig. 5.1. An extradata set of a cement mortar with Zutendaal sand in stead of standard sand, butwith the same mix ratio parameters, is also represented. It is apparent that thevalues are far apart for different mortars, and that some mortars display a strongerdependence on W/B than others. The slope is particularly lower for lime hydrateand lime hydrate AE. A linear regression line through these data was used todetermine the W/B following the principles explained above.
The test results of the selected mortars are listed in Table 5.2. Some conclusionscan be drawn from these results and the variation of flow with water content:
– For each type of mortar, a higher flow means a higher plunger penetration(Fig. 5.2), but the relation is not clearly linear and the curve is different fordifferent mortar types. Flow is highly dependent on ρM , as explained inSubsection 3.3.5, but also the plunger penetration may be dependent on it,because inertia effect are expected to play.

98 Rheological experiments for the evaluation of workability
160
170
180
190
iam
ater
(m
m)
Lime hydrate
Lime hydrate AE
Lime-cement
Hydraulic lime
Cement (stan.)
120
130
140
150
0.4 0.9 1.4 1.9 2.4
Flow
tabl
e di
Water to binder mass ratio W/B (kg/kg)
Ce e (s a )
Cement (Zut.)
Figure 5.1: Flow table diameter as a function of water to bindermass ratio for mortars in preliminary tests.
– Plunger penetration and dropping ball penetration are very similar tests.Despite this similarity a clear relation between both is not seen in the results,but this may be due to scatter of the results (Fig. 5.3).
– Flow and workability apparatus time both give a measure for the tendency ofthe mortar to spread, hence the results are expected to be related. Generallya decreasing trend is visible, but for mortars with similar flow, the workabilityapparatus time differs substantially.
5.2.2 Tests on reference mortars
The reference mortars are distinguished from the preliminary mortar compositionsin that their B/S are based on generally accepted values, and that their W/Bare based on practical tests with a panel of masons (Section 4.4). Mixtures wereprepared according to Mix 2-3 and the flow table test and plunger penetrationtest were carried out according to EN 1015-3 and EN 459-2 respectively (Table5.3) (CEN, 1998, 2001). The obtained values are used to formulate possibleimprovements of the interpretation, based on the knowledge of the vane yield stress.The measurement procedure for this yield stress will treated in Section 5.6.

Standardised rheology-related tests 99
Table 5.2: Results of selected mortars in preliminary tests.The value with * was calculated in stead of measured.
Lime Lime hy- Lime- Hydraulic Cementhydrate drate AE cement lime
B/S (kg/kg) 0.125 0.125 0.191 0.188 0.333W/B (kg/kg) 1.48 1.41 0.88 0.88 0.51Flow diameter (mm) 131 149 156 155 156Plungerpenetration (cm) 3.1 4.4 3.0 3.7 -
Dropping balldepth (mm) 10.6 13.2 8.9 13.0 9.4
Workability apparatustime (s) 6.6 5.3 4.3 3.5 4.6
ρM (kg/m3) 2070 1689 2085 1956 2185*ameas (%m3/m3) 2.0 16.3 5.1 10.7 4.5
160
170
180
190
iam
eter
(mm
)
130
140
150
3 4 5 6 7
Flow
tabl
e di
Plunger penetration value (cm)
Lime hydrate
Lime hydrate AE
Lime-cement
Hydraulic lime
Figure 5.2: Plunger penetration and flowof various mortars in preliminary tests.
Flow analysed in dimensionless parameters
As explained in Subsection 3.3.5, the dimensionless slump s′ and dimensionless flowf ′ of a material are related to dimensionless yield stress τ ′y through relatively simplelaws. Of the 6 reference mortars, the highest vane yield stress is about 2.3 timeshigher than the lowest, while the highest dimensionless vane yield stress is about1.8 times higher than the lowest. Furthermore, it appears that the correlation withthe flow table value is not convincing in the normal analysis, but it is much better

100 Rheological experiments for the evaluation of workability
14.0
mm
)
12.0on (m
netra
tio
10.0
all p
en
8.0
Ba
3.0 3.5 4.0 4.5
Pl t ti ( )Plunger penetration (cm)
4.0
6.0
8.0
y a
pp.t
ime
(s)
0.0
2.0
120 130 140 150 160
Wor
kabi
lity
Flow table diameter (mm)
Figure 5.3: Relations between results of different tests in preliminary tests.
Table 5.3: Results of flow table test and plunger penetration test on referencemortars.
Lime Lime hy- Lime- Hydraulic Cement Cementhydrate drate AE cement lime AE
Flow table value (mm) 139 130 134 147 143 149Plunger penetration (cm) 1.8 2.2 1.9 2.1 2 2.2Bulk density ρM (kg/mş) 1908 1519 1966 1971 2009 1746Air content a (%m3/m3) 3.5 21 6.4 6 6.6 15.8
in a dimensionless stress analysis (Fig. 5.4).
R² = 0.656
1.45
1.5
1 35
1.4
f (m
/m)
1.3
1.35
Flow
1.25700 1000 1300 1600
Vane yield stress y (Pa)
R² = 0.877
1.45
1.5
f (m
/m)
1 35
1.4
nles
s flo
w
1.3
1.35
Dim
ensi
on
1.250.5 1 1.5
D
Dimensionless vane yield stress y (Pa/Pa)
Figure 5.4: Flow value as a function of vane yield stress and dimensionless vaneyield stress.
It can be concluded that the flow table test can give a good indication for thedimensionless yield stress of a mortar. In other words, if the density ρM is known,we can calculate the τy by assuming e.g. a linear relationship with two empirical

Standardised rheology-related tests 101
constants A and B:
f ′ = A+Bτ ′y (5.1)
τy = (f ′ −A)ρgh0
B(5.2)
It has to be noted that the proposed linear relation is merely empirical and doesnot have a real physical meaning. A more complicated function could solve thisproblem, but is less practical. A larger data set is needed to confirm the generalityof this relation, which will be different for every different set of test parameters.
The strength of this interpretation is that it solves the misunderstanding of thesearch for a certain flow value as a criterion for workability. When ρM varies withas much as 20% due to air entrainment, which has an important infuence on theflow value, the criterion has to change as well.
As will be demonstrated further in Section 5.4, mortars with entrained air atreference water content do not have lower yield stresses than the others, and mortarwith lime hydrate have higher yield stress than those with cement and hydrauliclime. So if it would be desirable to set standard ranges for the flow table test, itwould have to be diversified at least according to binder type and air content. Thefeasability of such an approach is questionable.
Plunger penetration assessed with a simple model
The results of the plunger penetration test are also compared to the measuredvane yield stress. The model proposed in Subsection 3.3.5 has a critical shearstress τc as the most important parameter. This critical stress can be expectedto be higher than the vane yield stress, because the rate of shear is much higherin the plunger penetration test than in the vane test. The relation between bothis assessed by using the vane yield stress as input parameter in the model, andplotting the predicted penetration as a function of the measured penetration (Fig.5.5).
The obtained data are not convincing enough to validate the model. Howevera logical trend can be observed, and more extensive data may lead to strongerconclusions via a statistical analysis.

102 Rheological experiments for the evaluation of workability
0.04
0.05
netr
atio
n (m
)
0.02
0.03
0.017 0.019 0.021 0.023
Mod
el p
en
Measured penetration (m)
Figure 5.5: Model values and experimental values for theplunger penetration test on reference mortars.
5.3 Rotational rheometry of binder slurries
5.3.1 Viskomat measurements: technique and validation
Experimental procedure
A Viskomat PC rheometer (Section 2.3) was used with a mortar paddle of diameter83mm. Binder slurries were composed with different binders and different solidfractions in order to study the effect of particle characteristics and concentration.The reference for all the mix ratios is the slurry that emerged from the masons’test programme, i.e. “normal” water content of the slurry is obtained by taking thereference mortar and omitting the sand (Section 4.4). Mixing was done accordingto Mix 4. Tests are started 1 minute after the end of the mixing procedure. Theapplied profile is a stepwise decrease from 120 to 20 rpm, each step during 30 s,with a pre-shear of 30 s at 120 rpm. After this protocol 4 more velocities followed,but these have not been further analysed. Every step yields between 7 and 8 datapoints, of which a trimmed average was taken. The output for each point is a valuefor time, torque, angular velocity and temperature. An estimate of the Reynoldsnumber indicates that the flow can still be considered laminar when the viscosityof the most diluted slurries is taken into account.

Rotational rheometry of binder slurries 103
Data analysis: Couette analogy
The obtained data were converted to shear rates by using the Couette analogytheory; this approach is validated hereafter by a simple calibration procedurebased on linear theory. The Couette analogy method is based on Bousmina et al.(1999); Aït-Kadi et al. (2002) and was proposed in Lootens et al. (2004) for cementslurries. A fictitious diameter Ri of a cylindrical bob is calculated, which wouldexperience the same torque as the actual paddle. A good correspondence couldbe demonstrated between data obtained from this calculation and reference dataobtained with a cone-plate geometry. If L is the paddle length, η the viscosity ofthe reference oil, Ω = 2πN the angular velocity (N rotating speed in revolutionsper unit of time) and T the recorded torque:
ReRi
=(
1 + 8π2LR2eη
ΩT
)1/2(5.3)
which leads to a ratio of 1.154 for the geometry used in the Viskomat. Shearrates can be deduced from this ratio of radii and Ω. The obtained value is anapproximation for the value in the middle of the fictitious gap:
γ = Ωln (Re/Ri)
(5.4)
The viscosity is calculated as:
η = T
Ω
(ReRi
)2− 1
4πLR2e
(5.5)
This approximation is strictly spoken only valid for power law liquids (includingNewtonian) without a real yield stress.
Data analysis: linear calibration
The second approach for data analysis starts from the linear relationship which isobtained between torque T and angular velocity Ω:
T = T0 +Hpl · Ω (5.6)
This formulation is analogous to the Bingham law and a similar terminologycan be adopted: T0 for yield torque and Hpl for relative plastic viscosity. Ifrelative viscosity H is defined as the ratio of torque to rotating speed, we can write:H = T/Ω = Hpl+T0/Ω. In a calibration with Newtonian oil (polydimethylsiloxane)of viscosity 1.052 Pa.s, we found a linear relationship T = C1 · Ω with coefficient

104 Rheological experiments for the evaluation of workability
C1 = 0.442Nmmmin. We assume that the torque is proportional to the volume-averaged shear stress and likewise the rotating speed is proportional to the volume-averaged shear rate: τ = C2T and γ = C3Ω. Substituting these two relations in(3.24) leads to:
τ = C2T0 +HplC2
C3γ (5.7)
which allows to identify the Bingham parameters as:
ηpl = C2
C3Hpl (5.8)
τ0 = C2T0 (5.9)
The ratio C2/C3 is equal to the coefficient C1 which was determined from theknown reference oil viscosity and the measured relative viscosity H. The constantC2 can not be determined with our experimental data and is used further as amaterial constant with unknown value.
Bingham behaviour of slurries
Both approaches lead to results that are in line with the Bingham model. Acomparison of fitted parameters is given in Table 5.4 for binder slurries with 30%decreasedW/B when compared to the reference. The values of the Couette analogyanalysis are represented graphically in Fig. 5.6. All result confirm the validity ofthe Couette analogy method, and the Bingham behaviour of the slurries, withinthe considered range of shear rates and shear stresses.
Table 5.4: Solid fraction and Bingham parameters of binder slurries at 30%decreased water content in mass
Couette analogy Linear calibrationBinder type φ(m3/m3) τ0(Pa) ηpl(Pas) τ0(Pa) ηpl(Pas)
Lime hydrate 0.238 27.6 0.190 9.9 C2 0.17Lime-cement 0.342 15.8 0.248 9.1 C2 0.25
Hydraulic lime 0.312 7.3 0.098 4.2 C2 0.10Cement 0.355 5.7 0.134 3.3 C2 0.13
5.3.2 Coaxial cylinders rheometry
Further comparative data are supplied by a limited series of parallel measurementsof the same lime hydrate slurries and slaked lime putties on a Malvern Gemini

Rotational rheometry of binder slurries 105
1
10
100
10 100
She
ar s
tress
(P
a)
Shear rate d/dt (1/s)
lime hydrate lime-cement
hydraulic lime cement
50
Figure 5.6: Flow curves for 4 binder slurries (W/B 30% below reference) and fittedBingham curves, plotted on log-log scale. Solid fractions are: φ = 0.238 for lime
hydrate, φ = 0.342 for lime-cement, φ = 0.312 for hydraulic lime,φ = 0.355 for cement.
rheometer with a Couette cell (DIN 53019). The experiments were carried out atthe lab of Lhoist R&D in Nivelles. The profile is a step-down profile similar to theViskomat protocol. Results for the slaked lime putties at different values of φ areplotted in Fig. 5.8. It can be noted that these putties have much higher viscosityat comparable solid fraction, than lime hydrated slurries.
When comparing both techniques for the same material, absolute values of viscositywere found to be comparable to the Viskomat results within a reasonable tolerance,at least for the higher shear rates (Fig. 5.7). However at low shear rates, adecreasing shear stress was observed, which is absent in the Viskomat results. Thisis probably the consequence of a reduced sheared zone: a portion of the gap remainsunsheared so that the recorded torque is in fact too low (Ovarlez et al., 2006). Thistrend was observed much less in the Viskomat, which indicates that the apparatusis very well fit for this material.
5.3.3 Concentration effect of binder slurries
A range of binder slurries with different solid fractions were measured in theViskomat. Further analysis was done with averages of two measurements. Theviscosity data for different concentrations, at one specific angular velocity, result

106 Rheological experiments for the evaluation of workability
0.8
1
1.2
1.4
(P
a.s)
Exp. coaxial
K.-D. fitting coaxial
K.-D. fitting Viskomat
0
0.2
0.4
0.6
0.16 0.19 0.22 0.25
Visc
osity
Solid fraction (m³/m³)
Figure 5.7: Coaxial cylinders measurements of lime hydrate slurriesat different concentrations, with fit to Krieger-Dougherty equation,and the same fit obtained with data from Viskomat measurements.
100
(P
a)
1
10
1 10 100
She
ar s
tress
Shear rate d/dt (1/s)
Figure 5.8: Flow curves of slaked lime putties at differentsolid fractions, obtained with coaxial cylinders
in a relation between viscosity η and solid fraction φ. Fitting of the experimentaldata to the equation of Krieger and Dougherty (3.16) was done by linear regressionon its logarithmic transformation:
ln(η(φ)) = ln(ηs)− φm [η] ln(
1− φ
φm
)(5.10)
For the six different values of angular velocity this leads to six values for the triplet(ηs, [η] , φm). After a first run of the algorithm, an average value was fixed for

Rotational rheometry of binder slurries 107
φm. The fitted values had a coefficient of variance of ≈ 0.1 for the hydrated limeand slaked lime, and of ≈ 0.05 for the cement. Subsequently, the values of ηsand [η] were recalculated using this maximum packing. The results obtained forlime hydrate slurry are shown in Fig. 5.9. It has to be noted that this procedureattributes the divergence of viscosity at high solid fraction to the intrinsic viscosity.In reality φm is slightly different for each shear rate due to a different state ofaggregation of the particles, so the situation is more complex.
−0.7 −0.65 −0.6 −0.55 −0.5 −0.45 −0.4
−2
−1.5
−1
−0.5
0
0.5
ln(η
)
ln(1−φ/φm
)
Figure 5.9: Linear fit to logarithmic transformationof Krieger-Dougherty law, data for lime hydrate slurry
at angular velocity 100 rpm.
Differences in particle properties
Similar viscosity measurements (at varying solid fraction) were done for slaked limeputties. As the slaked lime was available in the form of a putty, it was necessary todetermine its solid fraction experimentally. This can be performed by simple bulkdensity measurement, oven drying, vacuum drying or acid titration (Rezeau, 2008).Based on data of specific surface area (Section 4.2), we expect that slaked limeparticles have a higher aspect ratio than hydrated lime. A more irregular shape ofslaked lime is also reported in literature, and has been attributed to the randomaggregation of particles in slaked lime, versus a preferential oriented aggregationupon drying in the production of hydrated lime, which leads to a lower specificsurface area (Rodriguez-Navarro et al., 2005).
Another aspect which can have an influence on intrinsic viscosity is the internalporosity of the binder particles. This is markedly higher for lime hydrate binder
108 Rheological experiments for the evaluation of workability
than for the others, and it has an influence on the available amount of interstitialliquid, thereby contributing to higher intrinsic visosity.
At a solid fraction of 0.157 the slaked lime slurry has a yield stress of 15.4Pa and aplastic viscosity of 98mPas, which is higher than the values obtained for hydratedlime slurry, even at a higher solid fraction of 0.179: 2.69Pa and 22mPas. Theintrinsic viscosities, averaged over the different angular velocities, are 23.7 for slakedlime, and 19.1 for hydrated lime. In this procedure we assumed a maximum packingfraction of the slaked lime to be equal to the one of hydrated lime, an assumptionwhich is in good correspondence with the data. By doing so, we attribute thedifference in viscosity to the influence of the different particle shape (aspect ratio)of these chemically identical binders.
In a comparable series of experiments for cement slurries intrinsic viscosities around5 and maximum packing around 0.7 for cement slurries were found, which is notin contradiction with our results (Struble and Sun, 1995). As a general reference:the lower limit of [η] for particle suspensions is 2.5 for non-interacting spheres.Measurements for [η] exist e.g. for dispersions of rods and fibers, reporting valuesof 10 to 6000 for aspect ratios from 10 to 1300 (Wierenga and Philipse, 1998). Forirregular-shaped aggregates of plate-like crystals, like these lime particles, literaturereferences were not found and rheological measurements as presented here, can beused for relative quantification of the apparent parameters.
Another aspect of the slurries’ rheology is the non-negligible contribution of particleinteraction at low shear. From the lowest to the highest angular velocities, thedata systematically show an increase of φm by approximately 10% and a decreaseof [η] by the same amount. We do not extensively treat these differences, but theyindicate that the effect of colloidal forces is significant at low shear rates (Dhaeneand Mewis, 1994).
5.3.4 Alternative approach to concentration effect of Binghambinder slurries
The above analysis of solids concentration relates the apparent viscosity η ofbinder slurries to the parameters in the Krieger-Dougherty law. It can however bemeaningful to consider the Bingham plastic viscosity ηpl as the portion of viscositywhich is linked to the hydrodynamic effects due to an increase in concentration.This subsection – in contrast to the rest of the rheological analysis – gives a briefaccount of the possibilities of such an approach.
The hydrodynamic effects of concentration of binder particles in solvent can bedistinguished from other effects, which are responsible for the yield stress τ0. It canbe understood conceptually that hydrodynamic considerations should not influenceyield stress, which characterises essentially a motionless condition. One clear

Rotational rheometry of binder slurries 109
advantage of such an approach is that the obtained parameters can be consideredas material parameters, and do not depend on shear rate, as was the case in theanalysis above. Shear rate dependency is already included in the quantity of ηpl.
The analysis was done for the data of lime hydrate and cement (Fig. 5.10). Theobtained parameters are different from those in the apparent viscosity analysis(Table 5.5). It can be noticed that the results for cement slurry are quite consistent.This is not the case for the lime hydrate slurry: the relative contributions of intrinsicviscosity and packing have shifted. The resulting φm of 0.63 for cement is exactlythe same as what Kwan and Wong (2008) obtained from packing experiments,which in fact determine the dilatancy onset of binder pastes.
The lime hydrate slurry is possibly more subjected to agglomeration or flocculationand to the influence of deformability of the flocs. These phenomena are notsufficiently known to explain the presented data. In principle the value of φmshould have the same meaning in both analyses, whereas [η] must have a differentand presumably lower value for the plastic viscosity analysis.
0 1
1
ity
pl(P
as)
Lime hydrate
0.01
0.1
0.15 0.2 0.25 0.3
Pla
stic
vis
cosi
Solid fraction (m³/m³)
0 1
1
ity
pl (P
as)
Cement
0.01
0.1
0.25 0.3 0.35 0.4 0.45
Pla
stic
vis
cos
Solid fraction (m³/m³)
Figure 5.10: Plastic viscosity as a function of solid fraction for binder slurries oflime hydrate (a) and cement (b), and fit to Krieger-Dougherty law.
The relation between yield stress and solid fraction is plotted in Fig. 5.11. Usuallythis relation is found to obey a power law, comparable to the Krieger-Doughertylaw. Recently models have been developed to explain the behaviour in terms ofinterparticle forces and particle size distribution (Flatt and Bowen, 2006). In thiscase an exponential curve was found to give the best fit.

110 Rheological experiments for the evaluation of workability
Table 5.5: Krieger-Dougherty parameters of lime hydrate and cement slurries,obtained by fitting two different data sets.
Lime hydrate CementApparent viscosity analysisMaximum packing φm (m3/m3) 0.31 0.63Intrinsic viscosity [η] (Pas) 7.2 7.1Solvent viscosity ηs (mPas) 8 5Plastic viscosity analysisMaximum packing φm (m3/m3) 0.53 0.63Intrinsic viscosity [η] (Pas) 19.1 9.5Solvent viscosity ηs (mPas) 4 3
10
100
ress
0
(Pa)
Lime hydrate
1
10
0.15 0.2 0.25 0.3Bin
gha
m y
ield
st
Solid fraction (m³/m³)
10
100
ress
0
(Pa)
Cement
1
10
0.25 0.3 0.35 0.4 0.45Bin
gha
m y
ield
st
Solid fraction (m³/m³)
Figure 5.11: Bingham yield stress as a function of solid fraction for binder slurriesof lime hydrate (a) and cement (b), and fit to an exponential function.
5.4 Rotational rheometry of mortars
5.4.1 Bingham behaviour of mortars
Bimodal mortars were composed with all binders in corrected composition withsand of batch 4. Tests were done with the Viskomat for lower solid fraction, andwith the Visco5 for higher solid fractions. A general test series was done for mortarswith all binder types, in order to obtain comparative data. A more elaboratedtest series was done on mortars with lime hydrate as a binder. This choice wasmotivated by the assumption, based on other tests, that the air lime would presentthe least problems of rapid sedimentation.

Rotational rheometry of mortars 111
The Viskomat tests were performed in the same way as the tests on slurries. TheVisco5 coaxial cylinder measurements were performed with a custom-made multipleblade vane-type geometry with 65mm inner radius and 75mm outer radius (Section2.3). The applied measurement profile is a stepwise decrease in rotation rate from67.8 rpm down to 6.6 rpm in 10 steps, each step during 20 s. This profile followsa pre-shearing which was done during and immediately after the insertion of thegeometry and takes 15 s. The measurements started 4 minutes after the end ofthe mixing procedure. The necessary sample volume was obtained by running theprocedure Mix 2 with two mixers at the same time.
The Visco5 apparatus records time, angular velocity and torque. In the treatmentof the data, average torques are taken over the last 80 out of 100 points in eachstep. Shear rates are calculated from the assumption of a linear velocity profile overthe gap. Visual observation of the free surface during the test did not contradictthis assumption.
General measurements of mortars with all binders
All mortars present severe slip problems at reference composition. Therefore,and to assess the influence of concentration, mortars were tested with decreasedsand fraction φs. This was done by reducing the Ws from the original 2700g to2600, 2400, 2200 and 2000g. The data are reproduced as measured, even if theyshow severe measuring problems for most mortars (Fig. 5.12):
– Towards higher φs a smaller than expected increase of shear stress is observed,or even a decrease. This can be attributed to the effect of wall slip.
– Some mortars (lime hydrate, lime hydrate AE, hydraulic lime and cement)present for one or more measurements a drop of shear stress upon decreasingshear rate, which indicates a moment where the sheared zone is reduced.
– The mortar with cement AE shows a constant shear stress for most valuesof φs. This may be due to the formation of a slip plane with constantcharacteristics of shear resistance. This is an interesting feature for mortardesign: the mortar behaves apparently as a perfectly plastic material (constantshear resistance for any displacement) by forming a slip plane.
The most interesting conclusions can be drawn from comparison of the data atlowest φs, where the measuring method is still valid:
– The highest shear stress values are measured for lime hydrate, followed byboth mortars with air entraining agent (lime hydrate AE and cement AE).The shear stress decreases further for lime-cement, hydraulic lime and cement.

112 Rheological experiments for the evaluation of workability
101
102
101
102
103
Shear rate d/dt (1/s)
She
ar s
tres
s
(P
a)
a. lime hydrate
101
102
101
102
103
Shear rate d/dt (1/s)
She
ar s
tres
s
(P
a)
b. lime hydrate AE
101
102
101
102
103
c. lime-cement
Shear rate d/dt (1/s)
She
ar s
tres
s
(P
a)
101
102
101
102
103
d. hydraulic lime
Shear rate d/dt (1/s)
She
ar s
tres
s
(P
a)
101
102
101
102
103
e. cement
Shear rate d/dt (1/s)
She
ar s
tres
s
(P
a)
101
102
101
102
103
cement AE
Shear rate d/dt (1/s)
She
ar s
tres
s
(P
a)
Figure 5.12: Flow curves of mortars with different binders in reference compositionand lower values of sand content Ws: diamonds for Ws =2700g, circles for 2600g,
triangles for 2400 g, squares for 2200g and crosses for 2000g.
– The lime hydrate-based binders follow the Bingham law closely, whilehydraulic lime and cement have more than proportional increase of shear stressat higher shear rate. This is in agreement with measurements on cementitious

Rotational rheometry of mortars 113
materials, notably self compaction concrete, which were done with the sameapparatus. In concrete technology this observation has lead to the use ofthe Herschell-Bulkley model in stead of the Bingham model (Heirman et al.,2009). It uses three parameters: yield stress τy, and coefficients k and n:τ = τy + kγn (Vermant, 2005).
– In the case of an analysis of Bingham parameters: τ0 is consistently moreimportant than ηpl, which indicates the predominantly plastic behaviour.
Detailed measurements of mortar with air lime
The detailed analysis of flow characteristics of mortar with lime hydrate is basedon two extra test series: Visco5 measurements on mortars with increasing watercontent, and Viskomat tests on mortars with decreased sand fraction. Both datasets are complementary, because the Viskomat has a lower measurable range ofφs than the Visco5. The mortars were composed with sand of batch 3, originalcomposition. The Visco5 measurements show an excellent fit to the Bingham law,in analogy with the binder slurries (Fig. 5.13). At the highest solid fraction aslightly oscillating torque was recorded. All data obtained with the Viskomat couldas well be fitted to the Bingham law.
500
tress
(P
a)
510
She
ar s
t
Shear rate d/dt (1/s)
standard water + 5%water + 10% water + 15%
40
Figure 5.13: Flow curves of mortars with lime hydrate as a binder obtainedwith Visco5 rheometer, increased water content

114 Rheological experiments for the evaluation of workability
Table 5.6: Viscosity of slurries and Krieger-Dougherty parameters of mortars withlime hydrate binder at different angular velocities
Angular velocity 120 100 80 60 40 20Data from measurements on slurries:Slurry viscosity η (Pa · s) 0.11 0.12 0.14 0.16 0.22 0.43Data from measurements on mortars for a fixed value φm,s = 0.51Solvent viscosity ηs (Pa · s) 0.10 0.11 0.13 0.15 0.20 0.37Intrinsic viscosity [η] 1.56 1.52 1.49 1.49 1.51 1.50
5.4.2 Concentration and the effect of air entrapment
Both data sets described above were analysed in terms of viscosity as a function ofsand solid fraction φs. This means we regard the binder slurry as the solvent, ofwhich the viscosity can be calculated using the parameters derived above. Sandsolid fraction φs is in first instance calculated with Eq. (3.9), assuming that noair is present in the mix. From the Viskomat data set, the apparent Krieger-Dougherty parameters were obtained by fitting. They are consistent with thedirect measurements of the slurry: the calculated solvent viscosity of the mortarcorresponds to the directly measured viscosity of the slurry at the different velocities(Table 5.6). This is a strong indication for the validity of the applied approach. Theaverage maximum packing fraction of the sand (φm,s) is 0.51, and the variations inφm,s and [η] for different rotating speeds are within a range of 4%, which indicatesa less important influence of particle interaction in this mortar when compared tothe effect of binder in the slurries.
Problems arise however to interpret the data obtained from the Visco5measurements: their calculated sand solid fraction is higher than the φm,s obtainedfrom the Viskomat data (Fig. 5.14). If a fit to the Krieger-Dougherty law is madefor the Visco5 data another, higher φm,s is obtained. The difference between thebehaviour in the two data sets is explained by an entrapment of air, which did notoccur in the low φs mortars tested with the Viskomat, but which did occur in thehigh φs mortars tested with the Visco 5. When φs increases, at some point airstarts to be entrapped, which explains the error in the calculation of φs.
The presence of air at differentW/B is measured with two methods: gravimetric andby compression. The first method simply relies on a bulk density measurement of themortar in a calibrated vessel with a volume of 1 liter, followed by calculations usingthe measured particle densities and the known mix proportions. The theoreticaldensity of an airless mix is calculated, and the measured density is used to findthe amount of air which causes the difference. The second method relies on theassumption that the gaseous phase is the only compressible fraction in a mortar,and that both water and solid particles are incompressible. With a standardised

Rotational rheometry of mortars 115
0.1 0.2 0.3 0.4 0.5 0.610
−1
100
101
102
Sand solid fraction φs (m3/m3)
Vis
cosi
ty η
(P
as)
ViskomatVisco5 no airVisco5 corr air
Figure 5.14: Viscosity of mortar versus sand solid fraction, for lime hydrate mortar.Krieger-Dougherty fits to two data sets. The dashed line indicates critical sandsolid fraction for air entrapment. Sand solid fractions for Visco5 measurements are
calculated with two different assumptions: no air present, or approximatecalculated air content. All values for γ = 40 s−1.
instrument (EN 459-2) using two pressure chambers, the mortar’s volume reductionupon increasing pressure is recalculated to a percentage of air in the mortar, usingBoyle and Mariotte’s law.
The results demonstrate that at high W/B, there is no air entrapped at all, andthat below a critical value, there is a linear increase for decreasing water content(Fig. 5.15). The sand solid fraction which corresponds to this critical water contentis about 0.50. It appears that above this solid fraction air entrapment is necessaryin order to induce shear in the mortar. When the mortar is made to flow duringthe mixing procedure, a certain amount of air remains present between the sandgrains. This phenomenon can be linked to the dilation that is necessary to induceshear in densely packed granular materials. It has been reported by Reynolds(cited in Duran (2000)) that the deformation of sand is necessarily accompanied bya dilation.
This leads to important considerations about solid fraction and mortar rheology.The critical sand solid fraction for air entrapment (0.50) corresponds to the φmthat emerges from the Viskomat measurements on diluted mortars (0.51). Shapiroand Probstein found that, for suspensions of spherical particles, this φm can beidentified as the random loose packing of the dry material, which is the solidfraction the material occupies without any external compaction force operatingon it (Shapiro and Probstein, 1992). They demonstrated that the ratio between

116 Rheological experiments for the evaluation of workability
0.55
0.6
0.12
0.16
n s
(m³/
m³)
n a
(m
³/m
³) air vol fr (density)air vol fr (pressure)sand solid fraction
0.4
0.45
0.5
0.00
0.04
0.08
1.5 1.7 1.9 2.1 2.3 2.5 2.7
San
d so
lid f
ract
ion
Air
volu
me
frac
tio
Water to binder mass ratio W/B (kg/kg)
Figure 5.15: Air content and sand solid fraction of lime hydrate mortaras a function of water content. The sand solid fraction
which corresponds to a = 0 is about 0.50.
random close packing and random loose packing was a constant for the testedmaterials, equal to 1.19. In the case of the sand in our experiments, when takingthe vibrated solid fraction for the first, and the fitted φm for the second, we obtain0.62/0.51 = 1.22. Obviously, the measured loose packed (poured) solid fraction(0.55) is higher than φm because gravity causes some compaction (Table 4.2).According to Shapiro and Probstein ordering must take place to enable fluidizationwhen solid fraction exceeds this random loose packing (hence also called fluiditylimit). In systems where air cannot be entrapped, this means that the suspendedparticles will be forced to move in ordered clusters.
5.4.3 Bimodal and trimodal mortars: Farris’ law
The Farris model, combined with the Krieger and Dougherty law (Eq. (3.19),(3.20)), can be applied to predict the viscosity of multimodal mortars when particleand solvent parameters are known. The expressions for solid fractions for a bimodalmortar are given in Eq. (3.23).
A mortar with an extra filler fraction φf is also included in the experiments, inorder to investigate the theory’s validity. This mortar is referred to as trimodal,versus the bimodal mortar with only sand and binder. The composition of thetrimodal mortar is done in such a way that for each value of φT : φb = φf = φs.Solid fractions of sand and filler are kept below the critical solid fraction for airentrapment, so it can be assumed for all tests that a = 0.

Rotational rheometry of mortars 117
The parameters necessary for the calculations of any combination of solid fractionsare: φm and [η] for each particle type, and the solvent viscosity ηs. The particleparameters were derived experimentally for sand and binder according to theprocedures described above, at a shear rate of 73s−1, which corresponds to arotating speed of 100 rpm in the Viskomat (Table 5.7). The parameters of the fillerwere, as a first estimation, taken equal to those of the sand, because of the similarnature of both materials. Solvent viscosity was measured on a sample obtainedby centrifugation of a binder-water suspension, in a double Couette geometry of aPaar Physica MCR501 rheometer (tests carried out in labs of KULeuven, Chemicalengineering).
Table 5.7: Model parameters for particles and solvent in bimodaland trimodal mortars at shear rate 73s−1.
binder filler sandMaximum packing φm 0.53 0.51 0.51Intrinsic viscosity [η] 15.5 1.52 1.52Solvent viscosity ηs(Pa · s) 2.51 (direct experimental)
4.00 (experimental fit)
The obtained curve for the bimodal mortar gives an underestimation of theexperimental data by some 30% (Fig. 5.16). This difference is caused by thedifficulty to define and measure the solvent: it may contain more or less colloidalbinder particles, depending on the method of sampling (i.e. centrifugation), andthe viscosity may consequently vary. Alternatively ηs was obtained by the abovedescribed regression procedure for the slurry data, which yielded a higher valueof 4mPa · s. A recalculation with this value gives an excellent fit. An additionalremark needs to be made concerning the chosen shear rate: ηs is significantly higherfor lower rates because of the solvent’s colloidal nature.
The experimental data for the trimodal mortar are in good agreement with thecalculated curves (Fig. 5.16). It appears that the trimodal mortar has lower viscositythan the bimodal mortar below a certain total solid fraction, but higher viscosityabove it. This is because in the bimodal mortar φb remains constant (0.179) forvarying φT , while in the trimodal case it increases with φT . At φT ≈ 0.44 thebinder fraction of the trimodal mortar exceeds the one of the bimodal mortar,which leads to a higher viscosity of the system. This illustrates the importantinfluence of the fraction with high [η] on the viscosity of the whole system.

118 Rheological experiments for the evaluation of workability
0.01
0.1
1
10
0.3 0.35 0.4 0.45 0.5 0.55
Mor
tar v
isco
sity
, (P
a.s)
Total solid fraction, T (m³/m³)
Bimodal exp
Trimodal exp
Figure 5.16: Experimental data for viscosity of bimodal and trimodal mortars, andpredicted curves calculated with the Farris model. Solid and dash-dot lines usefitted experimental solvent viscosity, the dashed line directly measured solventviscosity. Dash-dot line for trimodal mortar; solid and dashed lines for bimodal
mortar.
5.5 Compactability and maximum packing
The state of compaction of a mortar is a very important variable. In the previoussections, values for maximum solid fractions were mentioned as:
– the maximum packing fraction φm obtained by fitting the Krieger-Doughertylaw to experimental values of viscosity;
– the loose packed solid fraction, obtained by pouring dry granular material ina container. If no compaction is caused by gravity, its limit value would berandom loose packing, equal to φm from rheological experiments.
– the random close packing, obtained (approximative) by vibrating the drymaterial.
An upper limit of the range of solid fractions, can be obtained in a mechanicalcompaction test. In soil science the compaction characteristics of a granular materialare described with a compaction curve. These curves are established experimentallyfor the sand and mortars according to ASTM D698-91 (ASTM, 1992). Compactionis achieved by dropping a standard weight in a standardised manner on the material

Vane measurements 119
in a cylindrical vessel. Data points of φ as a function of W are fitted to a parabolicfunction, which leads to a maximum. For the Zutendaal sand the maximum wasreached at water fraction W = 0.14 and is about 0.61m3/m3 (Fig. 5.17). In thisstate, 25% of the volume is occupied by water (w = 0.25) and 14% by air (a = 0.14).
0 605
0.610
0.615
0.620
(m³/m
³)
0.590
0.595
0.600
0.605
0.07 0.12 0.17 0.22
Sol
id fr
actio
n
Mass fraction of water W (kg/kg)
Figure 5.17: Compaction curve for Zutendaal sand obtained withstandard mechanical compaction (Proctor test).
The same tests performed on relatively dry mortar mixes yields maximum totalsolid fractions φT between 0.69 and 0.71, for mortars without air entraining agent(Fig.5.18). For the air entrained mortars, reproducibility is problematic: only themortar with lime hydrate AE could be measured and had a maximum solid fractionof 0.68m3/m3.
The degree of compaction of a mortar may be defined as the actual solid contentdivided by the maximum solid content. For reference mortar conpositions thedegree of compaction can be assessed using this Proctor value as a maximum. Itwas calculated for non-air-entrained mortars about 90% after mixing.
5.6 Vane measurements
5.6.1 Laboratory vane apparatus for clayey soil
Working principle with standard apparatus
The laboratory vane apparatus for clayey soil (ASTM D4648) measures themaximum torque on a vane (D × H) which is connected to a rotating motorby a calibrated spring (Fig. 5.19) (ASTM, 1987). The motor rotates at constant

120 Rheological experiments for the evaluation of workability
0.68
0.70
0.72
ctio
n T
(m³/m
³)
0.64
0.66
0.07 0.08 0.09 0.10 0.11 0.12 0.13
Tota
l sol
id fr
ac
Mass fraction of water W (kg/kg)
Lime hydrate
Lime hydrate AE
Lime-cement
Hydraulic lime
Cement
Cement AE
Figure 5.18: Compaction curves for mortar mixtures obtained withstandard mechanical compaction (Proctor test).
angular speed ω. The mechanism is designed in a way that two angles can berecorded: θ1, the amount of deflection over the spring and thus the magnitude ofthe torque, and θ2, the angle over which the vane has rotated inside the sample.The parameters that can be adapted in the standard apparatus are: the type ofspring, the size and D/H ratio of the vane, size and design of the pot.
t
inner scale
outer scale
knob with carrier
calibrated torque spring
vane 2
1
rotating motor
Figure 5.19: Working principles of the laboratory vane test for clayey soil.
The course of a typical test shows three stages (Fig. 5.20). In the initial stage there

Vane measurements 121
is an increase of θ2 due to repositioning of the vane and rearrangement of grainsin the mortar. In the second stage, θ1 and θ2 increase proportionally with time,which indicates elastic behaviour. In the third stage, the spring angle reaches amaximum and the residual angle increases faster, until the material yields. Torqueafter yielding can not be measured.
40
60
80
n an
gle
(°)
0
20
0 2 4 6 8
Rot
atio
n
Time (min)
Figure 5.20: Typical vane experiment at Ω = 9.2/min(mortar with cement AE).
One should keep in mind that this vane method is neither rate controlled, norstrictly stress controlled. The principle is a constant increase of rotation angle overthe spring, and thus a constant increase of torque, but there is no correction forthe non-negligible movement of the vane inside the material, which causes the realstress to lag slightly behind the ideal level.
Analysis of stresses is done in the assumption that yielding occurs in a cylindricalplane of area A which circumscribes the vane, and in the top and bottom planeof that cylinder, if the vane is immersed. Shear stress τ in this plane is linked tothe total torque T exerted on the vane by integrating over the cylindrical plane (αangular coordinates):
T =∫A
D
2 τdA =∫ 2π
α=0
D
2 τ(HD
2 dα)
(5.11)
which leads to:
τ = 2TπHD2 (5.12)

122 Rheological experiments for the evaluation of workability
When the vane is completely immersed, terms for top and bottom plane are added:
τ = T(πD3
2
)(H
D+ 1
3
) (5.13)
When the top plane of the vane is even with the surface of the mortar, only thebottom plane is counted, which gives:
τ = T(πD3
2
)(H
D+ 1
6
) (5.14)
Eq. (5.13) is the one proposed by ASTM. Shear stress is assumed to be uniformover the whole surrounding plane. However in reality, on top and bottom plane,shear stress will be varying from 0 at the center, to a maximum τm where r = D/2.If this distribution is assumed linear, corrected formulae can be derived for thecase of complete immersion:
τm = T(πD3
2
)(H
D+ 1
4
) (5.15)
and for the case when only the bottom plane is immersed:
τm = T(πD3
2
)(H
D+ 1
8
) (5.16)
Depending on the ratio H/D of the vane, Eq. (5.13) gives a fairly goodapproximation, with only a few % of difference for common ratios. The influenceof the choice of the formula is illustrated by a plot of the shear stress calculatedfor a vane of D = 30mm and T = 0.01Nm (Fig. 5.21).
Vane measurements of structural build-up in binder pastes
The evolution in time of the yield stress of binder paste was measured with the vanetest for lime hydrate. Lime hydrate paste is reported to undergo important changesin rheological properties: it builds up structure at rest, and can be brought back to alower structure when sheared. In order to quantify which part of structural build-upis reversible, every sample was tested before and after a remixing procedure.
Only one mix ratio was tested: W/B = 5/6, which corresponds to φ = 0.275.Vane dimensions were D × H = 45 × 45mm2, the dimensions of the pot were

Vane measurements 123
400
600
r stre
ss
(N/m
²)bottom only
bottom only corr.
top+bottom
0
200
0.25 1.25 2.25 3.25
Cal
cula
ted
shea
r
Vane dimension ratio H/D (m/m)
top+bottom corr.
Figure 5.21: Calculated vane shear stress with 4 formulae for D = 30mmand T = 0.01Nm. For the corrected formulae,the plotted stress is the maximum stress τm.
Table 5.8: Resilience of springs used in vane tests on limehydrate paste after different resting times.
Un-sheared Pre-shearedt(min) Q(/Nm) Q(/Nm)20 700 70030 700 70060 700 700120 460 460360 380 700
D ×H = 100× 80mm2. Angular velocity of the motor Ω was 9.2/min and theresilience Q of the used springs is given in Table 5.8. Q had to be adapted in orderto measure the wide range of yield stresses.
The paste was mixed according to Mix 4, after which it was transferred to thepot and the vane was immersed, with the top plane even with the paste surface.The end of the mixing procedure is taken as t = 0. The sample was then left torest in lab conditions, until the test was started at t = 20, 30, 60, 120 and 360min.Each time when the maximum stress was reached, the sample was remixed ina Hobart-mixer with dough paddle, 2min at speed 2, after which the test wasimmediately repeated with the remixed material. The obtained value after restingtime t is the un-sheared yield stress, the other corresponds to a pre-sheared state(Fig.5.22). The amount of structural buildup is enormous, and was fitted to apower law for both values. The increase of τy is 85% for t = 20min, 600% for
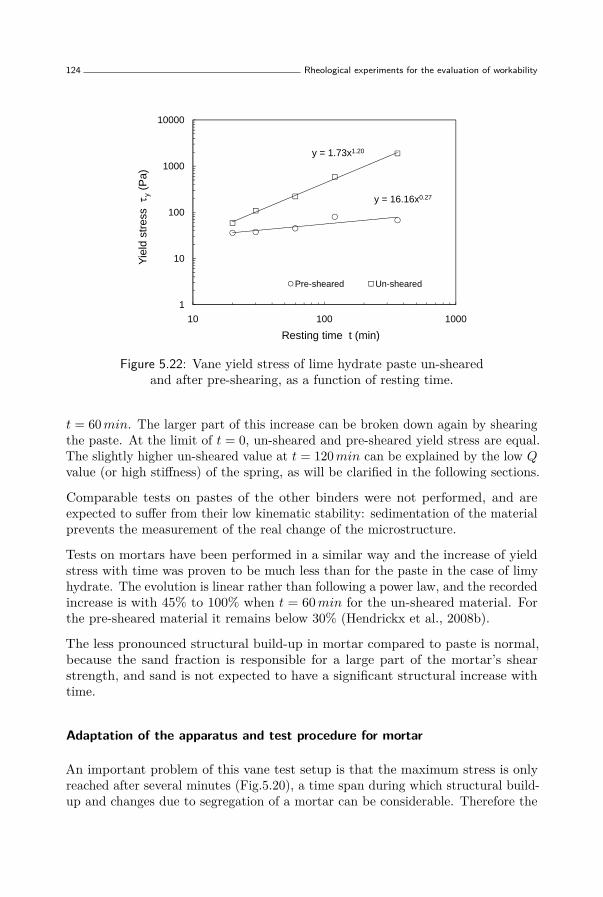
124 Rheological experiments for the evaluation of workability
y = 16.16x0.27
y = 1.73x1.20
100
1000
10000
ess
y
(Pa)
1
10
10 100 1000
Yiel
d st
re
Resting time t (min)
Pre-sheared Un-sheared
Figure 5.22: Vane yield stress of lime hydrate paste un-shearedand after pre-shearing, as a function of resting time.
t = 60min. The larger part of this increase can be broken down again by shearingthe paste. At the limit of t = 0, un-sheared and pre-sheared yield stress are equal.The slightly higher un-sheared value at t = 120min can be explained by the low Qvalue (or high stiffness) of the spring, as will be clarified in the following sections.
Comparable tests on pastes of the other binders were not performed, and areexpected to suffer from their low kinematic stability: sedimentation of the materialprevents the measurement of the real change of the microstructure.
Tests on mortars have been performed in a similar way and the increase of yieldstress with time was proven to be much less than for the paste in the case of limyhydrate. The evolution is linear rather than following a power law, and the recordedincrease is with 45% to 100% when t = 60min for the un-sheared material. Forthe pre-sheared material it remains below 30% (Hendrickx et al., 2008b).
The less pronounced structural build-up in mortar compared to paste is normal,because the sand fraction is responsible for a large part of the mortar’s shearstrength, and sand is not expected to have a significant structural increase withtime.
Adaptation of the apparatus and test procedure for mortar
An important problem of this vane test setup is that the maximum stress is onlyreached after several minutes (Fig.5.20), a time span during which structural build-up and changes due to segregation of a mortar can be considerable. Therefore the

Vane measurements 125
machine was adapted to work at higher rates. The existing motor (P = 0.157W )was replaced by a new AC motor (P = 28.5W ) which turns at 250 rpm. Theexistent transmission with two smooth pulleys and a round elastic ribbon, wasreplaced by an interchangeable set of 4 times 2 synchroflex pulleys and a belt, whichcan transmit higher forces (Fig. 5.23). By changing the pulleys, it was possible towork at motor speeds of Ω = 60, 110, 200 and 376/min in stead of 9.2/min inthe original situation.
Figure 5.23: Adapted driving mechanism of the vane apparatus withone of the four sets of pulleys.
Influence of test parameters on mortar yield stress
The adapted setup was used to study the influence of Ω, Q and vane size H ×Dfor mortars with different binder types. Tests were done in a cylindrical pot ofdimensions 3 times larger than those of the vane. The vane was in this casecompletely immersed to the center of the pot. Mortars were mixed according toMix 5. After the end of the mixing procedure the mortar was scooped in therecipient with attention to avoid air enclosures. The vane was lowered to the centerof the pot, and the test started 4 minutes after the end of mixing.
Repeatability of the results was satisfactory. All numerical results presented hereare averages of two tests. Experiments on the lime hydrate mortar with one typeof spring (Q = 460/Nm) at the four different speeds clearly show the importantinfluence of the rotational velocity (Fig. 5.24a). Stress increases faster and themaximum is higher, for higher Ω. The stress/strain behaviour during the secondstage of the test indicates that a faster stress increase leads to an apparent lowerstiffness in the quasi-elastic stage (Fig. 5.24b). Finally the resulting maximalquasi-elastic deformation before yielding is also higher for higher Ω (Fig. 5.24c).

126 Rheological experiments for the evaluation of workability
20 40 60 80 100
0.5
1
1.5
Time t (s)
She
ar s
tres
s τ
(kP
a)
60 °/min113 °/min200 °/min376 °/min
0 10 20 30 400
0.2
0.4
0.6
0.8
1
1.2
1.4
Vane rotation angle θ2 (°)
She
ar s
tres
s τ
(kP
a)
60°/min113°/min200°/min379°/min
0 20 40 60 80 1000
5
10
15
20
25
30
35
40
45
Time t (s)
Van
e ro
tatio
n an
gle
θ2 (
°)
60°/min113°/min200°/min379°/min
Figure 5.24: Vane yield stress measurements of a lime hydrate mortar. Influence ofΩ on yield stress (a, top left) and apparent stiffness (b, top right), and
deformation (c, bottom).
The measured influence of Ω is similar to the findings of Pérez-Foguet et al. (1999),who did FEM simulations of vane tests in a Bingham material at different velocities.They studied the stress/strain behaviour using an arbitrary Lagrangian-Eulerianapproach, and found an important increase of maximum torque for low Ω, leadingto an asymptotic torque for higher Ω.
A comparison of the four types of mortar tested at the same values of Ω,demonstrates that they follow the same trend (Fig. 5.25). Especially at Ω below200/min there is a strong increase in yield stress. There are two importantdifferences between the separate mortar types. The first is the absolute differencein yield stress: the lime-cement mortar has an almost 3 times higher yield stressthan the cement mortar. This is remarkable because all mortars are judged bymasons as having optimal water content. The second difference is that mortarswith air lime have a more pronounced increase of yield stress as a function of Ω,and that it continues at higher Ω. An explanation may be in the lower water

Vane measurements 127
permeability or higher resistance to drainage of these mortars (see measurementsof desorptivity in Section 6.3). As stated before, a mortar needs to dilate locallyin order to develop a shear plane. The dilation of the solid skeleton goes togetherwith a reverse flow of interstitial liquid. This means that a low permeability mortarmay have higher resistance to local dilation.
0 100 200 300 4000
0.5
1
1.5
2
Rotational velocity Ω ( °/min)
Yie
ld s
tres
s τ y (
kPa)
lime hydrate mortarlime−cement mortarhydraulic lime mortarcement mortar
Figure 5.25: Vane yield stress for different types of mortar.
The results also illustrate the influence of the rate of pore water drainage. Whendeformation or stress is applied faster, the granular paste will react more like anun-drained material, because the time is too short to reach a local equilibriumliquid content. It is well-known that the limiting value for high velocities is aconstant. The lower velocities in Fig. 5.25 are an intermediate case between drainedand un-drained. Normal stress in the sheared zone is not zero (as in solids), norhydrostatic (as in liquids), but it depends on a stress coefficient K0 (Lancellotta,1995). We will however not treat the influence of this small horizontal normalstress, and concentrate further on vertical normal stress in the direct shear test.
Experiments with two smaller vanes were also executed: a 15.5× 59.2mm2 vaneand a 12.7× 25.4mm2 vane (D×H). In both cases the yield stress was lower thanexpected.
The effect of using springs with higher stiffness (i.e. lower resilienceQ) is comparableto increasing Ω, because it equally causes a faster stress increase (Fig. 5.26). Againwe notice a more pronounced increase at the lower end of the stiffness range.

128 Rheological experiments for the evaluation of workability
50 100 150 200
0.3
0.6
0.9
1.2
1.5
1.8
Time t (s)
She
ar s
tres
s τ
(kP
a)
260 °/Nm380 °/Nm460 °/Nm700 °/Nm
Figure 5.26: Vane yield stress of lime hydrate mortar measured with 4 differentsprings.
5.6.2 Small-scale vane measurements
Apparatus and test geometry
In a traditional rheometer, vane dimensions are much smaller than the recommendedsize which follows from the previous section (D×H = 45× 45mm2). Neverthelessa series of tests were executed in order to investigate the possibilities of real rate-controlled and stress-controlled tests, and to record also the post-failure behaviour.Tests were performed in the lab of KULeuven Dept. of Chemical engineering on aPaar Physica MCR501 rheometer with a 6-blade vane geometry FL100/6W/Q1:D × H = 22 × 16mm2. This rheometer is stress-controlled, but the operatingsystem also allows rate-controlled measurements. Mortars were made with sandbatch 3 in original reference composition.
The standard measuring cup of the rheometer results in a small gap between innerand outer cylinder, in order to approach a Couette geometry (see e.g. Barnes et al.(1989)). This is unwanted in these experiments, because the first interest is inthe shear strength in frictional regime, and not in viscosity. Hence this cup wasreplaced by a cylindrical pot of De ×He = 65× 65mm2. A size ratio of 3 betweendimensions of the pot and the vane follows from the recommendations of Lidelland Boger (1996).
Reproducibility proved to be poor for these tests. This is related to the smallsize of the vane. For practical reasons the number of tests was reduced to one foreach set of parameters. Results are however given hereafter for qualitative andcomparative purposes.

Vane measurements 129
Constant rate tests
Constant Ω tests were performed on mortar batches mixed according to Mix 2-3,the test starting at 3.5 minutes after the end of mixing, at constant Ω of 0.001 rad/s.After the maximum was reached, the measuring pot was emptied, the batch wasremixed by hand (vigorous stirring), and a new sample was scooped in the pot.Then the test was started at Ω = 0.01 rad/s. This was repeated for Ω = 0.01 and1 rad/s. The testing of each speed took 3.5 minutes. In total 4 measures were donewith different samples of the same batch.
Fig. 5.27 shows the influence of Ω on the development of shear stress with time.At Ω = 0.001 rad/s there is a continuing increase and within 1000s no maximumis reached. From Ω = 0.01 rad/s the stress reaches a maximum followed by adecrease to a constant residual value. This behaviour is typical for thixotropicmaterials with a yield stress (Moller et al., 2006) and for cohesive granular materials(Lancellotta, 1995). It demonstrates the change in microstructure in the shearedzone. The residual value is larger for lower Ω. This can be explained as follows:shear flow causes a decrease of structure (λ), while resting time causes an increaseof structure. When the test is done at very low rate, the structural breakdowngoes slower than the structural build-up, so that the stress does not decrease. Athigher rates the situation is reversed, and the structural break-down is strongerthan build-up. This break-down is not recovered during the test.
0 200 400 600 800 10000
500
1000
1500
2000
Time t (s)
She
ar s
tres
s τ
(N
/m2 )
0.001rad/s0.01 rad/s
0.1 rad/s
1 rad/s
Figure 5.27: Shear stress as a function of time in a constant Ω testfor different values of Ω: cement mortar, sand batch 3, obtained with a vane
geometry in a stress-controlled rheometer.
Structural breakdown can be due to different reasons, and may be different indifferent flow regimes. In the case of these vane tests the flow regime is frictionalor lubricated, and shear only occurs in a limited zone.

130 Rheological experiments for the evaluation of workability
– The first reason for breakdown is microstructural change in the binder slurry.Different particles may form large aggregates or flocs when the mortar is atrest, and these flocs may break up again under flow. This breaking up requiresenergy and it has an influence on the values of the apparent parameters φmand [η], which causes important changes of viscosity. It does not necessarilycause a decrease of viscosity, because at some point it may result in lesspronounced polydispersity. Probably the majority of the weak bonds betweenflocculating particles are reversible, so that concepts of thixotropy can beapplied to describe the phenomenon.
– The second mechanism of break-down is the local dilation of the solid skeleton.This is visually observed with the large vane test for soil, and is directlyrelated to the formation of shear planes. Further evidence will be shownin Section 5.7. This form of local structure loss is not - or only partly -reversible, and can not be described by thixotropy.
– A third mechanism of local decrease of structure, which is more importantin the hydrodynamic or lubricational regime, is the migration of the largerparticles towards zones of lower shear rate, as opposed to the smaller ones.Likewise particles with a rough surface migrate more towards zones of lowershear rate than the smooth ones. This leads to lower viscosity in the zonesof high shear rate (Plantard et al., 2006). In other words: a polydispersesuspension of different types of particles accommodates itself to undergo animposed deformation with minimal energy.
Stress-controlled tests
A limited series of stress-controlled tests gives extra information about themechanism of yielding. Two procedures were followed: a continuous stress-rampand stepwise stress increase. The first was done for lime hydrate mortar and cementmortar, the second for lime hydrate mortar only. Batches were small (±250ml),composed with sand batch 2, and stirred by hand with a small spoon in a glassbeaker.
A continuous stress-ramp is comparable to the tests with soil vane apparatus: τincreases from 0 at a rate of 50Pa/s. Rotation angle θ is registered as a functionof time. This test reveals that the deformation of the mortar before yielding is notstrictly linear, but occurs partly in small steps (Fig. 5.28). The magnitude of thedisplacement at the edge of the vane is of the same order as the grain size of thesand, so it can be related to a local rearrangement of grains.
The stepwise stress increase test shows that the mortar is subjected to creep(Fig. 5.29). After each increase, there is a large initial deformation, followed bya secondary phase of low increase for constant stress. Each step had a duration

Vane measurements 131
of 5 s. Constant deformation is not reached within this interval. When the yieldstress is reached, viscous flow starts.
10−6
10−4
10−2
100
102
0
500
1000
1500
Angle of rotation θ (rad)
She
ar s
tres
s τ
(N
/m2 )
lime hydrate mortarcement mortar
Figure 5.28: Shear stress as a function of rotation angle for stress rampsat 50Pa/s in cement mortar and lime hydrate mortar.
0 10 20 30 40 50 60
10−4
10−3
10−2
10−1
100
Time t (s)
Rot
atio
n an
gle
θ (
rad)
47 Pa/step94 Pa/step141 Pa/step
Figure 5.29: Rotation angle as a function of time for stress stepsof different magnitude in lime hydrate mortar.

132 Rheological experiments for the evaluation of workability
5.7 Direct shear apparatus
5.7.1 Total stress behaviour of mortar and sand
Experimental setup and procedures
The direct shear apparatus is the most common apparatus to measure peak shearstresses and dilation of soils and rocks, even if it is known to generally overestimatefriction angles, and underestimate dilation angles (Lings and Dietz, 2004; Budhu,2000). The apparatus used in this study is standardised according to ASTM D3080(ASTM, 2004c). The working principle is shown in Fig. 5.30. Test parameterswere chosen at the limits of the setup, to give the best approximation to practicalvalues for masonry applications: a horizontal displacement velocity of 10 mm/min(the maximum), and the normal forces leading to normal stresses σ of 1.5 kPa (theminimum) up to 12kPa. From experience with the vane apparatus it is knownthat velocity should have an important influence on maximal shear stress, butthis influence could not be measured within the very low applicable range of thisapparatus.
F A
AFF = A
x
z hv
v
Figure 5.30: Working principle of the direct shear test.
The possibility of inserting a porous stone to drain the sample was not used.However the slow speed of the test and the non water-proof design of the sampleholder allow some drainage, so that test results are intermediate between drainedand un-drained values. Some interstitial liquid (typically 1 to 3 g) is expelled inthe beginning of the test. No attempts were done to measure pore water pressureduring the test.
Mortars were mixed according to EN169-1 with the sand of batch 2. Sample sizewas 10× 10 cm2, with a height of 25mm. Filling of the sample holder was startedshortly after mixing. The sample was placed in the machine and covered, normalforce applied, and the test started 4 minutes after the end of mixing.
For comparative tests on dry and moist sand, the exactly needed quantitiesof material were calculated based on a Proctor compaction test (ASTM D698-91). A moisture content of 14% (mass water on total mass) lead to the highestcompaction. Measurements were done on dry sand, 14% moisture content sand,and an intermediate case of 7% moisture content. In contrast to the mortar,

Direct shear apparatus 133
the compaction procedure is of major importance for the outcome of the results.This was done by filling in one layer and lightly tamping with a wooden tamper.Values of model parameters were obtained as averages out of three tests for eachcomposition and level of normal stress.
The most important problem encountered during the tests is the rotation of thecover plate on top of the sample. The contact point of this plate acts like aball-and-socket around which it freely rotates. This problem is well-known andimprovements are proposed by Lings and Dietz (2004). However they could not beimplemented within the scope of our study. Data of vertical displacement ∆z haveto be interpreted with caution.
Results of direct shear tests
Typical results for both sands and mortars show an increase of shear stress τ inthe beginning, then a slower increase towards peak stress, followed by a decreasetowards a more or less constant residual (or critical) stress (Fig. 5.31 till 5.34).This is comparable to the behavour of soils (Budhu, 2000).
0.2
0.3
0.4
1.0
1.5
2.0
men
t z
(mm
)
(k
Pa)
Shear stressVert. displacement
-0.1
0
0.1
-0.5
0.0
0.5
0 5 10 15
Verti
cal d
ispl
acem
She
ar s
tress
Horizontal displacement x (mm)
Figure 5.31: Typical direct shear test on lime hydrate mortarwith normal stress 1.5 kPa.
The peak is reached at smaller displacements for sand than for mortar. For mostmortar tests a clear residual value was not recorded, so that only the peak value canbe used for further analysis. Scatter on tests at low normal force is substantial, dueto the limited accuracy of the force cell. The initial stage of the test is characterisedby a reduction in volume, which is more pronounced for mortars than for thesand alone, and which increases with increasing normal force. The reasons for thisreduction are threefold: there is a rearrangement of the grains (compaction), in

134 Rheological experiments for the evaluation of workability
-0 1
-0.05
0
4
5
6
7
8
emen
t z
(mm
)
s
(kP
a)
-0.2
-0.15
-0.1
0
1
2
3
4
0 5 10 15
Verti
cal d
ispl
ace
She
ar s
tress
Horizontal displacement x (mm)
Shear stressVert. displacement
Figure 5.32: Typical direct shear test on lime hydrate mortarwith normal stress 4.5 kPa.
the case of the mortar also an expelled amount of liquid, and a volume reductionof air bubbles. After a minimum volume has been reached, the material starts todilate. The maximum rate of dilation corresponds to the point where the maximumshear stress is reached. Beyond this point, the rate of dilation decreases, and thevolume tends to an equilibrium value, which is however not reached in most of theperformed tests.
0.6
0.8
1
6
8
10
men
t z
(mm
)
(k
Pa)
-0.2
0
0.2
0.4
-2
0
2
4
0 2 4 6 8 10 12 Verti
cal d
ispl
acem
She
ar s
tress
Horizontal displacement x (mm)
Shear stressVert. displacement
Figure 5.33: Typical direct shear test on moist sand with 7% of water content,normal stress σ = 6.5 kPa.
Peak shear stress is plotted as a function of normal stress for mortar and for sand(Fig. 5.35 and 5.36). The friction angle φ for peak stress measured for lime mortar

Direct shear apparatus 135
0.6
0.8
1
6
8
10
men
t z
(mm
)
(k
Pa)
-0.2
0
0.2
0.4
-2
0
2
4
0 2 4 6 8 10 Verti
cal d
ispl
acem
She
ar s
tress
Horizontal displacement x (mm)
Shear stressVert. displacement
Figure 5.34: Typical direct shear test on moist sand with 14% of water content,normal stress σ = 6.5 kPa.
is 29.3, and for cement mortar 25.1. The values found for the sand are higher:38.6 for dry sand, and 32.1 and 47.1 for moist sand. Typical values in literaturefor dry quartz sand (in terms of effective stress) are about 33 (Bolton, 1986).
4
5
6
7
stre
ss
p(k
Pa)
lime hydrate mortarhydr. lime mortarcement mortar
0
1
2
3
0 2 4 6 8
Pea
k sh
ear s
Total normal stress (kPa)
Figure 5.35: Peak shear stress as a function of normal stress for three types ofmortar.
The sand measurements demonstrate that the addition of water induces cohesion.It is surprising that cement mortar has a higher shear resistance under non-zeronormal force: this is in apparent contradiction with the vane test results, where airlime mortar had systematically a higher value. A possible reason for this differencelies again in the lower permeability of the air lime mortar: cement mortar isprobably closer to the drained condition, because water is easier expelled. In limemortar, the interstitial liquid may still take up some pressure, so that the effective

136 Rheological experiments for the evaluation of workability
10
12
14
16
18
tress
p
(kP
a) dry sand
moist sand 7%
moist sand 14%
0
2
4
6
8
0 5 10 15
Pea
k sh
ear s
t
Total normal stress (kPa)
Figure 5.36: Peak shear stress as a function of normal stress for dry and moistsand.
shear stress is lower. By lack of online measurements of pore water pressure,definitive conclusions can not be drawn.
For the sand: results at different water contents should be the same if effectivestress is regarded. However in this un-drained condition pore water pressure isnon-zero and can also be negative (suction). In the latter case effective stress islarger than total stress, which causes the higher yield stress as observed.
5.7.2 Dilation of mortar and sand
The peak dilation angle αp is calculated as:
αp = tan−1(
dzdx
)xp
(5.17)
at the x value of the peak shear stress, with z the axis perpendicular to the planeof shear and positive upward (Fig. 5.30).
Tables 5.9 and 5.10 give the calculated values of the peak dilation angle for threetypes of mortar and the dry and moist sand. The mortars have much higher anglesthan sand, and moist sand has higher values than dry sand. The first phenomenonis logical if we consider that a sand grain, which has to move upward in dry sand,can move into an existing void, causing no net volume increase. A wet mortar onthe contrary has much lower air content, so that any movement of particle mustcause the movement of others. The differences in the sand at different normalstresses and moisture contents can be due to the initial compaction state before thestart of the test. When applying the same procedure the moist sand is expected tobe more compacted, which explains why it dilates more under shear.

Squeeze tests 137
Table 5.9: Peak dilation angle αp() for different types of mortar at different levelsof normal stress.
Normal stress 1.5 kPa 2.5 kPa 3.5 kPa 4.5 kPa 7.5 kPaLime hydrate mortar 38.6 26.3 13 11.8 8.2Cement mortar 38.4 - - 35.4 24.6Hydr. lime mortar - - 27.9 19.3 18.1
Table 5.10: Peak dilation angle αp() for sand in dry condition and with 7% and14% of water under three different levels of normal stress.
Normal stress 1.5 kPa 6.5 kPa 11.5 kPaDry sand 6.1 5 4.5Moist sand (7% mass water) 17.3 8.8 5.7Moist sand (14%mass water) 18 11.9 7.4
For all materials dilation decreases with increasing normal stress, which is in linewith the behaviour of normal soil (Lancellotta, 1995).
5.8 Squeeze tests
Several squeeze tests were performed in different conditions: a series in realisticconditions aimed to give relevant comparative data, and a series in model conditionsaimed at extracting model parameters. The realistic tests include contact with anabsorbing substrate and will be treated in Section 6.6 after discussion of watertransport. They were performed on small-scale cylindrical samples (R = 12.5mm)in a rheometer.
Experimental setup and test parameters
In this section, the tests in model-condition are discussed, in accordance with thetheory presented in Section 3.3.4. These tests were performed on a displacement-controlled hydraulic press (Schenck). Tests were done at constant surface (R =125mm) and the velocity was set c = 33mm/min. Initial specimen height h0 was20, 30, or 40mm. Two different lubrication conditions were applied: rough andlubricated. The rough condition was achieved by gluing water-resistant sandpaperof grade P60 to both surfaces. The lubricated condition was achieved by putting aplastic film between the surfaces of the press and the specimen, and lubricating itwith low viscosity oil of type WD40 on the side of the mortar.

138 Rheological experiments for the evaluation of workability
All tests were done with lime hydrate mortar. Batches were mixed with sand ofbatch 4 in original reference composition, according to Mix 2. The cylindricalspecimens were shaped on top of the lower surface of the press by scooping them ina frustum in PVC and tamping lightly. The excess was scraped off with a plasticruler and the frustum carefully lifted. First contact between the upper surfaceand the material, and start of the test, was 4 minutes after the end of the mixingprocedure.
Results and model fitting
Each test was done two times and the results are plotted in Fig. 5.37. Therepeatability of the test is fairly good. The curves for different speeds are not farapart for the cases of different initial height h0. In fact, according to the modelexpressions for the force as function of h (Eq. (3.29) and (3.31)), F as a functionof h is independent of h0. This means that the free slump of the specimens whenthe frustum is removed, should not have an important influence on the result ofthe squeeze test. The difference between the lubricated and the roughened case isclear (rough surface is indicated in the legend with suffix r).
0
20
40
60
80
100
0 2 4 6 8 10 12
Nor
mal
forc
e F
(kN
)
Plate separation h (mm)
h0=20 - test 1h0=20 - test 2h0=30 - test 1h0=30 - test 2h0=40 - test 1h0=40 - test 2h0=20 - test 1rh0=20 - test 2r
Figure 5.37: Squeeze tests on lime hydrate mortarwith different initial heights and lubricated and rough plates.
In order to obtain material parameters from the test results, a model and acalculation method have to be proposed. In Fig. 5.38 the best fit of the dataof one test to the model behaviour of a Coulomb material is plotted for test 2r,h0 = 20mm, according to the analysis of Toutou et al. (2005). The model assumesconditions of no slip. The obtained material parameters are: cohesion C ≈ 97 kNand friction angle tanφ ≈ 0.22. The cohesion is much larger than yield stressrecorded with other means (≈ 1.5 kN) and the fit with the data is poor.

Squeeze tests 139
1.0E+05
1.5E+05
forc
e F
(N)
h0=20
Toutou
0.0E+00
5.0E+04
0.0E+00 5.0E-03 1.0E-02 1.5E-02 2.0E-02
Nor
mal
f
Plate separation h (m)
Figure 5.38: Experimental result of squeeze test on lime hydrate mortarand fitted curve for a Coulomb material, according to Toutou.
The same can be said for a fit of a lubricated test (test 2, h0 = 20mm) to theformula by Sherwood and Durban (1996) for a Bingham material (Fig. 5.39). Thebest fit was obtained for τ0 ≈ 0 and a very high plastic viscosity ηpl = 2 · 106 Pas.The friction factor m was in this case equal to 0.01.
1.0E+05
1.2E+05
h0=20mm
8.0E+04
1.0E 05
F (N
) h0=30mm
h0=40mm
6.0E+04
l for
ce
Sherwood-Durban
4.0E+04
Nor
ma
0 0E+00
2.0E+04
0.0E+000.0E+00 5.0E-03 1.0E-02 1.5E-02
Plate separation h (m)
Figure 5.39: Experimental result of squeeze test on lime hydrate mortarand fitted curve for a Bingham material, according to Sherwood.
Both these results for fitting of experimental data do not show any relation to allother measurements of Bingham or Coulomb parameters. The reason is probablythe influence of inhomogeneities due to water transport during the test. At thevery high solid fractions of the mortar, a slight change of the local water content

140 Rheological experiments for the evaluation of workability
results in large difference of viscosity.
This problem could theoretically be overcome by increasing the velocity of theapproaching surfaces c. A test at high velocity will lead to values of undrainedstresses. From the point of view of practical applications this also seems relevant.However the hydraulic press and the rheometer used in this research do not allowto work at very high velocities. A theoretical basis for a numerical analysis of theinfluence of velocity and water transport is provided in Sherwood (2002, 2005).The feasibility of this approach remains to be confirmed.
5.9 Summary: feasibility of rheological tests formortar
The interpretation of results of standardised tests in rheological parameters iscomplex. Most of them can be related to a critical shear stress τc, but consideringthe fact that velocity and normal stress vary over test procedures, the level of stressmay not be comparable. The velocity or shear rate in one specific test proceduredoes not only depend on the test itself, but often also on the material properties.A meaningful comparison between different tests requires full knowledge of theseparameters and their influence.
Qualitative comparison was presented for the flow table, plunger and ballpenetration and the workability apparatus. The latter had to be discarded, becauseof the ill-described and unreproducible working mechanism. The flow table doesgive possibilities for quantitative analysis: it is demonstrated to give a value fordimensionless yield stress. This way of analysing takes into account the differencein density between different mortars. The modelling of the plunger penetrationtest was less convincing, presumably due to larger variance in the results.
Rotational rheometry is possible for slurries and mortars in hydrodynamic regime.For slurries this means reference composition or reduced water content; for mortarsit means they have to be diluted. Especially mixer-type rheometers of the Viskomattype gave good results, and offered the possibility to overcome the typical problemsof Couette cells. The concentration law of Krieger and Dougherty was usedsuccessfully to identify maximum packing and intrinsic viscosity of binder and sandparticles. Solvent visocity remained sometimes difficult to quantify. Confirmationof the theory is given by quantitative correspondence of mortar and slurry data.When solid fraction surpasses a critical level, air is or remains entrapped in themortar during mixing. This is what happens in all reference mortars, and it stronglyinfluences the rheology due to a shift in maximum packing, near the asymptote.The amount of entrapped air is quantified as a function of mix ratios for one typeof mortar.

Summary: feasibility of rheological tests for mortar 141
Analysis of multimodal systems is proven possible and successful using the simpleapproach of Farris. One trimodal mortar was produced and measured for validation.
It was not possible to measure viscosity of mortars with reference composition in aconvincing and reproducible way. Only in diluted systems the problem of slippagecould be avoided. They can however provide the necessary parameters which,together with a measurement of air entrapment, theoretically allow to extrapolateto the range of reference composition. Large errors due to slight variations are thedanger of this method.
In frictional regime shear localisation is rather the rule than an unwanted side-effect.Shear strength in such shear planes can be measured with a rotating vane. Thisvane should be large enough to avoid effects of local inhomogeneity of the solidfraction. The measuring procedure influences the results: higher applied stressincrease rates or rotation rates give higher maximum stresses.
The interpretation of this effect was refined by studying the effect of normal stressand dilation with a direct shear apparatus. Like sands, mortars dilate when shearis induced. This dilation in turn induces migration of interstitial liquid, so that thepermeability becomes important. At the same velocity, low permeability mortarsare closer to undrained condition, while high permeability mortars behave morelike drained materials. Substantial improvements need to be done to make a directshear apparatus work in conditions which are more relevant for mortar applications.
An ideal test method will have to combine shear stress measurements with ameasure of pore water pressure. Stress measurements would preferably be stress-controlled or rate-controlled, have large geometries, and high rate and torquecapacity. Additionally normal stress appears to be very important, and should beadaptable and measurable as well. From the scientific point of view, adaptationsof triaxial testing setups are interesting to be investigated for feasibility.


Chapter 6
Water transport experimentsand combined workabilityexperiments
6.1 Introduction
In this chapter all experiments concerning water transport properties of mortarsare discussed, as well as some experiments which combine water transport with arheological measurement. The importance of the water transport in mortars fortheir workability has been demonstrated in Chapter 4. In fact, too quick or tooslow water loss were identified as major problems in practical tests.
The effect that a change in water content has on the measured rheological propertieswas discussed in detail in Chapter 5. It appears that the viscosity of referencemortars as a function of water content (or solid fraction) is very close to anasymptote, which explains the large influence of small variations. Such variationsmay not only arise at the interface with an absorbing material, but also within thebulk of the mortar, when dilation and shear localisation occur.
Existing tests for water retention were presented in Chapter 2 and will beinvestigated below (Section 6.2). It is however necessary to invent new testmethods, in order to obtain more fundamental parameters (Section 6.3). Theseparameters, in the first place permeability, potential and diffusivity, were presentedin Chapter 3, where also the basic transport laws were introduced. Experimentalparameters, together with a numerical procedure to solve the equations, are usedto model desorption of mortar when brought in contact with brick (Section 6.5).
143

144 Water transport experiments and combined workability experiments
Results will be compared to the observations of the process with micro-focus X-rayradiography (Section 6.4).
Squeeze tests on brick substrate combine the desorption of water with compressiveflow. A preliminary series of tests on the reference mortars is presented in Section6.6. Although modelling of this combined problem is still too ambitious, anempirical analysis is possible.
6.2 Standardised water retention tests
Water retention is tested in three different procedures: using filter plates (EN459-2), filter paper (EN 413-2) and an adapted method with vacuum suction. Thelatter method uses the setup of ASTM C91 in an alternative procedure: a vacuumof 61 ± 8mbar is applied to the mortar during 15 minutes. This procedure isidentical - apart from the pressure level - to a directive of the French institutionCSTB (Sébaïbi et al., 2003). In these three tests methods, the water retentionvalue is the percentage of the water in the mortar that is not lost by desorption.
The results of the tests on reference mortars are listed in Table 6.1. The waterretention measured with filter plates and with vacuum suction have a reasonablecorrelation. Both methods discriminate the mortars in a way that corresponds tothe findings of the test panel (see 4.5).
The method with filter paper yields quite different results. During these testsproblems were observed of poor contact between the 9 individual sheets of absorbingpaper which are stacked and used at the same time. Some interesting trends can benoticed related to the difference between the binders. The water retention showsan increasing trend as a function of the specific surface area of the binder (compareTable 4.1). The mortars with air entraining agent give higher values than thecorresponding mortars without.
Table 6.1: Results of standardised water retention tests on reference mortars.
Lime Lime hy- Lime- Hydraulic Cement Cementhydrate drate AE cement lime AE
Water retentionfilter plates (%) 83 92 81 66 63 78
Water retentionfilter papers (%) 93 95 93 85 87 88
Water retentionsuction (%) 85 88 86 66 66 75
Further analysis of these data in terms of physical quantities is difficult, becausethey give only a value of one point in time, without revealing anything about a

Desorption tests and permeability tests 145
rate of desrption or a final equilibrium state. In the following sections, alternativemethods are developed to extend this knowledge.
6.3 Desorption tests and permeability tests
6.3.1 Suction tests
Apparatus and procedure
The apparatus of the ASTM C91 water retention test was adapted to containa larger sample volume, and the test procedure was changed in order to obtainmore information about material parameters. The height of the perforated dishwas increased from 20 to 60mm (Fig. 6.1). This allows to have sufficient datapoints, when suction is applied, for identifying the initial linear regime of water losswith the square root of time: M = R
√t (Section 3.5) and calculate the coefficient
of desorption R. M is the cumulative weight of desorbed water. The pressuredifference (p1 − p2) is generated by a vacuum pump, which can create a maximumdifference of atmospheric pressure (≈ 105 Pa).
The mortar batches were mixed according to Mix 2-3 (sand batch 2, originalreference composition), and scooped in the dish on top of a wetted filter paper.This was done in 2 layers, each of them tamped 10 times. The excess mortar wasscraped off with a plastic ruler. The flask which is under vacuum is connectedto the funnel by turning a valve. The air-tight sealing between the funnel andthe dish is made with a layer of silicone, which is moulded in contact with thedish. By doing so, sealing with petroleum or light grease is avoided. Otherwiseremoval and accurate weighing of the dish at different times during the test wouldbe complicated.
The mass of the dish with the filter paper and sample was measured at thebeginning of the test, after wiping the bottom of the dish quickly with a cloth.Other measurements of the decreased mass were taken after 1, 4, 9, 25, 36, 49, 64and 81 minutes, until the level of the vacuum could not be sustained any more dueto air breakthrough. Air breakthrough occurs increasingly from a certain pointonwards, but initially, the pressure drop over the sample can be kept constant byincreasing the suction of the pump. The repeated procedure for each step of closingthe valve, removing and wiping the dish, weighing, replacing, and reopening thevalve was done in 45 s.
It is assumed that the pressure applied through the perforations and the filterpaper, is equally divided over the bottom surface of the sample, and that thepressure drop over the filter paper is negligible compared to the pressure drop overthe sample.

146 Water transport experiments and combined workability experiments
p1
p2
20
40
mm
Figure 6.1: Adaptation of ASTM test apparatus to measure desorption propertiesof mortar: vertical section and image of lab setup.
Results and data analysis
The data points obtained are couples of cumulative desorbed water mass M andtime t for a specific combination of mortar type and pressure difference ∆p. Mincreases proportionally to the
√t until a certain point, from where it tends to
an asymptotic equilibrium value M∞. This asymptotic value corresponds to theequilibrium solid content φ∞ of the mortar for the applied vacuum suction. Theoriginal solid fraction of the mortar before desorption is designated φ0
The transition point between the linear and the asymptotic part of the M(t) curveis determined visually on a plot. The linear part is fit by least squares, which givesthe slope R. The asymptotic part is fitted to an exponential equation of the form:
M = A+B(1− exp(−C(√t−D)) (6.1)
where (D,A) are the coordinates of the transition point with the linear part, andB and C two fitting parameters (Fig. 6.2). The equilibrium value is found as:M∞ = A + B. M∞ can be recalculated to the equilibrium solid fraction φ∞, inthe assumption that no air has entered.
Results for mortars with all binders at ∆p = 20 000Pa are plotted in Fig. 6.3.Apart from the fitted parameters, it appears that some mortars suffered fasterfrom air breakthrough than others.

Desorption tests and permeability tests 147
120
160
200
d w
ater
M (g
) M 8
0
40
80
0 20 40 60 80
Mas
s de
sorb
ed
Sqrt time t0.5 (s0.5)
R
Figure 6.2: Fitting parameters to experimental results of suction test: dotted linefor
the linear fit of R and solid line for exponential function.
90
120
150
180
d w
ater
M (g
)
lime hydrate
lime hydrate AE
lime-cement
0
30
60
90
0 20 40 60 80
Mas
s de
sorb
e
Sqrt time t0.5 (s0.5)
hydraulic lime
cement
cement AE
Figure 6.3: Results of suction test on different mortars at ∆p = 20 000Pa.
Mortars were also tested at ∆p = 30 000, 40 000 and 50 000Pa. This range gavesatisfactory results for most mortars. M(t) curves for lime hydrate mortar areplotted in Fig. 6.4. The relation between R and ∆p can be fitted empirically toa power-law function of the shape R = C ·∆pn with C and n constants (Greenet al., 1999); in this case n ≈ 0.5.

148 Water transport experiments and combined workability experiments
90
120
150
180
ed w
ater
M (g
)
0
30
60
90
0 20 40 60 80 100
Mas
s de
sorb
e
Sqrt time t0.5 (s0.5)
20000Pa 30000Pa
40000Pa 50000Pa
Figure 6.4: Desorption of lime hydrate mortar at different levels of ∆p.
6.3.2 Filter press tests
The filter press or pressure cell for filtration of slurries is common in research ofdewatering of mining sludge and in geotechnics. The working principle is the sameas the suction test, but in stead of a vacuum pump to create a vacuum, compressedair is used to create higher pressures, which can be transferred to the materialvia a piston or via the enclosed gas, depending on the apparatus (Fig. 6.5). Thecompressed air is connected to the upper chamber of the pressure cell by a valve,which allows to regulate the pressure. A manometer gives a reading of the value p,which is the difference with atmospheric pressure.
Measurements were done in the lab of Lhoist R&D, Nivelles, with a pressure cellproduced by Faure. This apparatus complies to the standard AFNOR T97-001.The inner diameter is 70mm and sample size is variable by sliding the piston upor down. The cell can be rotated upside down, which facilitates the filling. Thepiston was put in position and a volume of ≈ 300ml was scooped on top of itwith a spoon in 3 layers, making up-and-downward motions to spread the mortarand avoid air inclusion. The exact mass of the sample was recorded by weighingthe mixing bowl before and after filling the press. A slight excess was scraped offthe edge before cleaning it. The sample was covered with a synthetic tissue andthe pressure cell closed. For good air-tight sealing surfaces were very clean, therubber closing ring was wetted, and the clips to close the press were put undersufficient tension. After closing, the cell was turned upright, and a balance waspositioned below it. Pressure was slowly increased with the valve. This proved tobe important, because any rapid increase of pressure causes jamming of the system.Duration of the test was between 15 and 20 min.
Mortar batches were mixed with sand of batch 4, according to procedure Mix

Desorption tests and permeability tests 149
W (t)
P
P
70 mm
Figure 6.5: Working principle and image of lab setup of the pressure cell forfiltration of mortar. Apparatus according to AFNOR T97-001.
2-3, in original reference composition. Tests were carried out at pressures of105, 2 ·105, 3 ·105 and 5 ·105 Pa. The observed behaviour is qualitatively comparableto the results of the suction tests, and data are analysid in the same way: the M(t)curve is divided in a linear part, from which the desorption coefficient R is fitted,and an exponential part, which leads to the equilibrium solid fraction φ∞. Data ofthese filter press tests are summarised together with data of the suction tests inTable 6.2. This table also gives the initial solid fraction φ0 and water content w0,as well as the maximum Proctor solid fraction φPr (Section 5.5).
An important difference between the two data sets emerges from the results. Thevalue of R increases logically when comparing both suction and filter press results.This is however not the case for the equilibrium solid fraction φ∞: higher values wereexpected in the filter press tests, which were performed at higher ∆p. Neverthelessin general lower values are found. It can be assumed that the real pressure exertedon the interstitial fluid in the filtration experiment is lower than expected, at least

150 Water transport experiments and combined workability experiments
after a certain test time.
The reason for this is that the stress in the pressure cell is exerted in a mechanicalway by the surface of the piston, while in the suction test, it is a difference inair pressure. The mechanical pressure will be taken up by the sand and binderskeleton (effective pressure) after expulsion of a small amount of water, so that wein fact have no idea about the pressure on the interstitial fluid. This hypothesis isconfirmed by the relatively short linear M(
√t) behaviour which is observed.
In terms of potential difference over the mortar specimen both tests can be linkedto different components of total potential Ψ:
Ψ = ψg + ψw + ψa + ψe (6.2)
This equation sums up the components of total potential (i.e. an amount of energyper unit of mass, with respect to a certain reference level), in the case when chemicalor thermal effects can be neglected (Kutilek and Nielsen, 1994). ψg and ψw arerelated to gravity and the soil water potential due to interfacial energy effects. ψwhas a different meaning for oversaturated and saturated materials when opposedto unsaturated materials. The saturated water potential (this case) is related tothe adhesion between lisuid and solid grains, whereas in usaturated materials ψwis in fact the capillary potential ψcap, which can be much higher. The pneumaticpotential ψa accounts for air pressure inside the soil pores being different from theoutside atmospheric pressure, if applicable. ψe is the envelope potential, whichcorresponds to mechanical pressure exerted on the surrounding surface of a volumeof granular material, such as overburden pressure of topsoil layers on a lower soillayer. It is reported that, for sandy soils, the contribution of ψe is limited becauseof the rapid transfer of these loads to the solid grain skeleton.
On the other hand, ψa is the pneumatic potential: the difference in air pressurewhich acts upon the material and on the pore water. The conclusion is thatdata about the value of ψw, which is necessary to model water transport, shouldpreferably be obtained by suctions tests, or by using a pressure cell which transferspressures directly via a pressure chamber and not via a piston. The piston modelpressure cell is more adequate for materials with an important fine fraction, likeclay or many industrial sludges, which do not suffer the problem of effective stresstransfer.
In this context the concept of compressive yield stress σy can be introduced. Thisis the externally applied stress level (ψe) at which no (further) compaction of acompressible material occurs. It is always related to a certain solid fraction: higherφ is related to higher σy. It gives a measure for the strength of the solid skeletonat that specific φ.

Desorption tests and permeability tests 151
Table 6.2: Results of suction tests and filter press tests. φPr stands for the solidfraction obtained in the Proctor compaction test. The fields with ’-’ could not be
measured.
∆p(Pa) Lime Lime hy- Lime- Hydr. Cement Cementhydrate drate AE cement lime AE
Characteristics of fresh mortar mixφ0(m3/m3) 0.604 0.493 0.632 0.62 0.627 0.556w0(m3/m3) 0.354 0.217 0.293 0.327 0.313 0.236φPr(m3/m3) 0.699 0.68 0.707 0.697 0.701 0.691Suction test resultsR(kg/m2s0.5) 20000 0.111 0.082 0.127 0.117 0.262 0.157φ∞(m3/m3) 0.678 0.529 0.701 0.728 0.740 0.639R(kg/m2s0.5) 30000 0.143 0.115 0.169 0.269 0.289 0.166φ∞(m3/m3) 0.716 - 0.709 0.777 - -R(kg/m2s0.5) 40000 0.177 0.124 0.186 0.314 0.311 0.221φ∞(m3/m3) 0.731 - 0.733 0.770 - -R(kg/m2s0.5) 50000 0.185 0.151 0.220 0.329 0.409 -φ∞(m3/m3) 0.764 - - - - -Filter test resultsR(kg/m2s0.5) 100000 0.992 - 0.469 0.667 1.21 0.579φ∞(m3/m3) 0.609 - 0.636 0.706 0.64 0.558R(kg/m2s0.5) 200000 2.228 - 2.187 0.926 1.544 0.764φ∞(m3/m3) 0.616 - 0.641 0.77 0.639 0.561R(kg/m2s0.5) 300000 - - 2.287 1.642 2.278 0.747φ∞(m3/m3) - - 0.641 0.805 0.641 0.561R(kg/m2s0.5) 500000 - - 3.664* 3.122 3.708 0.732φ∞(m3/m3) 400000* - - 0.64* 0.806 0.643 0.561
6.3.3 Permeameter tests
Saturated permeability measurement of soils can be done by measuring the fluxof water through a cylindrical specimen, at constant or decreasing head (pressuredrop). A typical commercial permeameter setup, like the Eijkelkamp apparatusused in this investigation, creates a maximum pressure head of approximately20mm. The flow goes from bottom to top and the head is kept constant byevacuating the excess through a sifon into a calibrated burette. The flow is read onthe scale of the burette. Saturation of soil samples is normally attained before startof the test by absorption of water from the bottom under atmospheric pressure orvacuum, which may take hours or days depending on the soil type. The test itselfcan take a couple of hours, for highly permeable samples, or up to several days forothers.
An adapted system can be proposed in order to shorten the duration of the test:two hours is a reasonable time to measure mortars, and later measurements shouldbe interpreted with caution, because of the proceeding hydration reactions. Alarger flux over the mortars is obtained by increasing the head to 60mm. This is

152 Water transport experiments and combined workability experiments
attained by placing the cylinder in a water basin, on top of rolls, and increasingthe water level around it (Fig. 6.6). No saturation procedure is followed: the freshmortar is transferred directly to the sample holder in the reference state, i.e. withapproximately 5% of air bubbles, when no air entraining agent is used.
The full procedure is as follows:
1. fix the perforated bottom and a synthetic tissue to the bottom of the samplering (a so-called Kopecky ring, Di = 50mm, H = 55mm);
2. prepare mortar batch according to Mix 2 or Mix 3 respectively, with sand ofbatch 4 in corrected composition;
3. fill the sample ring with the mortar, using a small spoon, making sure toavoid entrapped air, till slightly over the edge;
4. scrape off the excess mortar with a palette knife;
5. screw upper part of cylinder to lower part, providing a water-tight seal witha serrated rubber ring;
6. place the assembly on rolls in a water basin and fill the water until thenecessary head is reached;
7. cover the element with a moist cloth to prevent evaporation of water on topof the sample;
8. after different time intervals, remove the water on top of the sample with apipette (by tilting the sample) and weigh this water; ensure the conservationof the constant head by regulating the surrounding water level;
9. repeat the last 2 steps until the end of the test, in order to obtain at least 3points within the relevant time range.
The results of two tests for each mortar type are plotted in Fig. 6.7 (only 1 resultfor lime hydrate mortar). They show a constant flux q, which confirms the validityof Darcy’s law (Eq. 3.52). The proportionality is the permeability Ksat. Saturatedhas to be interpreted here as corresponding to the initial state of a mortar, i.e.with a small amount of entrapped air bubbles and (slightly) oversaturated withinterstitial liquid. It is assumed that the volume fractions of water (w) and air (a)remain constant.
In general the slope of the curve is higher for the mortars with low water retentionin conventional tests (compare Table 6.1). A notable exception is the mortar withcement AE. When a mortar contains more entrained air bubbles, it can be expectedthat they will act like a solid phase, which reduces the available cross section fortransport of water, and hence gives lower permeability and higher water retention.

Desorption tests and permeability tests 153
h
Figure 6.6: Permeameter setup: longitudinal section and image. Constant pressurehead h leads to a stationary flow of water from bottom to top.
This appears to be true for the mortar with lime hydrate AE, but it is not for themortar with cement AE.
Most probably the air bubbles in the mortar with cement AE were filled withwater during the test, so that in fact much more surface was available for watertransport. The measured behaviour does not correspond to the subjective feeling ofthe masons (see Table 4.8 and 4.9), who did not experience this mortar as havingtoo low water retention. Hence the results were not included in the graph anddiscarded for use in numerical calculations.
In some cases the curve does not exactly cross the y-axis at time t = 0, becausethere is a transitional regime before a steady flow is reached. In the analysisthe slope starting from the first measured point is considered. The mortar withcement AE is omitted in the interpretation. Three distinct levels of permeabilityare observed, of which the lowest for lime hydrate AE: Ksat ≈ 5 · 10−8 m/s, whichcorresponds to typical values of unfissured clays and clay-silts. Normal lime hydrateand lime-cement fall in the higher end of the same geotechnical category withKsat ≈ 2.5 and 2.8 · 10−7 m/s. Cement and hydraulic lime have similar values7 · 10−7 m/s, which is more like very fine sands or silts (Craig, 1987).

154 Water transport experiments and combined workability experiments
6
8
10
12
ater
mas
s M
(g)
lime hydrate
lime hydrate AE
lime-cement
hydr. lime
0
2
4
0 100 200 300
Cum
ulat
ive
wa
Time t (min)
cement
Figure 6.7: Results of permeameter tests, 2 tests for each mortar type.
6.4 Water transport measurements by microfocus X-ray radiography
6.4.1 Aim, method and validation
The principle of X-ray imaging for the measurement of water transport in porousmedia is explained in Section 3.5. The aim of the experiments in this section is tomonitor the early water transport between brick and mortar, and to understand andmodel the findings using experimentally measured material parameters. Tests withvery different types of mortar are used to assess the influence of these parametersand to validate the principles which are adopted for the model.
The practical situation which is approached in the setup, is liquid flow in the zonebetween two horizontal brick-mortar joints. A uniform water flow over the depthof the brick is assumed. Considering the symmetry of two brick at top and bottomplane of the joint, it can be assumed that there is no flow through the horizontalsymmetry plane in the joint. This means that each brick absorbs water from ahalf-joint of thickness 5mm, until an equilibrium is reached. This equilibrium isdetermined by the initial water content of both materials, their hygric propertiesand the boundary conditions.
In a real situation, drying occurs at both front and back side of the brick and fromthe joints outer surface. This influences the equilibrium state between brick andmortar, but has not so much influence during the first 2 hours. For this reason,and for simplicity, it is chosen to seal all sides of the specimen watertight, exceptthe top and bottom plane, which results in a 1-dimensional vertical flow.

Water transport measurements by microfocus X-ray radiography 155
One of the reasons not to incorporate the effect of drying at the sides, is thatthe climate in the X-ray apparatus can not be regulated. The conditions in thechamber ranged from 24 to 30C and from 50 to 30% of relative humidity, whichis not representative for outdoor practice. During a test, as the energy of theX-ray beam is dissipated, temperature of both specimen and evironment increases,and as a consequence relative humidity decreases (the moisture content of the airremaining approximately constant).
Experimental setup
Slices were cut from the extruded facing brick (properties, see Section 4.2) of90 × 40 × 13mm3 (W × H × D), which were oven dried for 48 hours at 105Cand cooled down to lab temperature in a desiccator. The thickness of 13mm hasbeen demonstrated to give optimal moisture content resolution for this material(Roels and Carmeliet, 2006). The dry specimens were sealed at the four side planesby wrapping them with universal tape (Fig. 6.8). Preliminary experiments withbituminous paint gave good results, but the partial impregnation of the brickcomplicated the estimation of the effective accessible thickness. A container for the5mm tick mortar layer was made in plexi plates of 4mm thickness, glued aroundthe specimen. Capillary uptake between the sealing tape and surrounding plateswas avoided with a silicone seal, which also served as glue to connect the platesto the taped brick. The bottom plane of the specimen was not sealed, in order toavoid pressure build-up due to entrapped air during water take-up.
The measuring system is an AEA Tomohawk in the lab of KULeuven, Departmentof Materials engineering. The X-ray source is a Philips HOMX161. Images areregistered with a CCD camera of 4096 intensity levels.
The specimen is placed at a distance of 777mm from the source. Source to detectordistance is 1500mm. This gives a magnification of 1.9305, which results in afield of view of 182 × 182mm2 and a pixel size of 0.0920mm. The source wasoperated at an energy level of 85 keV and 0.39mA (iris or diaphragm 81± 1%).Images were calculated as an average of 256 subsequent frames. At 55ms per framethis resulted in a time resolution of 14 s. The spatial resolution Rx and moisturecontent resolution Rw are calculated according to the procedures proposed byRoels and Carmeliet (2006) for the parameters of the setup: Rx = 7 · 10−4 m andRw = 3.2 kg/m3.
Testing procedure
The specimens were kept in dry atmosphere and were weighed before testing. TheX-ray source was turned on for 15 min, before taking the reference image, toavoid the recording of transitory low intensities. The mortar was prepared in the

156 Water transport experiments and combined workability experiments
405
90
t=13mm
mm
Figure 6.8: Test specimen geometry for X-ray imaging of water transport:dimensions and image without mortar and cover.
meantime, following the procedure Mix 2, respectively Mix 3 for cement AE, withsand batch 2 in original reference composition. The X-ray source was turned offand the mortar brought in the specimen with a palette knife. Air inclusions wereavoided by moving the palette knife up and down. The excess mortar was scrapedoff, and the sides of the plexi container are cleaned with a paper tissue. The mortarcontainer was then covered with a plexi plate with dummy elements on top of it.These dummies serve as reference dry material, with the same structure as thematerial which is wetted.
The moment the mortar was smeared on top of the brick is taken as referencetime t = 0. Images were taken after 1.5, 3, 6, 15, 30, 60 and 120min. As dataacquisition took 14 s (averaged over 256 images), it was started at approximately 7 sbefore the time stated. After 120min the mortar was removed from the specimenwith the palette knife and a brush and the specimen is weighed. The differencewith the initial mass gives the amount of absorbed water and allows the calculationof the attenuation coefficient µ for that particular test.
Data were stored as 1024× 1024 matrices of positive integers from 0 to 4096. Theresult of the logarithmic subtraction of the matrices gives values proportional towater content (Eq. (3.75)). Conversion to 1-dimensional moisture fronts was doneby averaging the values over a band of 100 pixels, to reduce scatter and the effectof small inhomogeneities. This band was chosen somewhere between the edgesand the center of the specimen. The factor to convert the values to water contentw is calculated via the attenuation coefficient µ, obtained through the measuredmass of absorbed water and the integral of the dimensionless final moisture contentcurve over the depth of the specimen.

Water transport measurements by microfocus X-ray radiography 157
Validation with free absorption experiment
The validity of the procedure is tested by performing absorption tests with one edgeof the specimens in contact with a free water surface. In the case of absorption bya semi-infinite porous material, the analytical solution is solved traditionally by thedefinition - after Boltzmann - of a variable λ = x/
√t. It can be demonstrated that
at all times, moisture profiles as a function of λ fall on the same curve (Hall andHoff, 2002). Hence such a plot can be used to check the validity of the measuringmethod (Fig. 6.9). The moisture fronts coincide, with some differences in the tipof the profiles.
0 0.5 1 1.50
50
100
150
200
Boltzmann variable λ=x/t0.5 (mm/s0.5)
Wat
er c
onte
nt w
(dm
³/m
³)
1.5 min3 min6 min
Figure 6.9: Water content as a function of Boltzmann variable λfor free water absorption test.
6.4.2 Moisture profiles in brick and attenuation in mortar
The observed phenomena are represented for each mortar type in split graphs: theleft part for the mortar, with unknown absolute scaling, and the right part for thebrick, scaled to volumetric moisture content w (Fig. 6.10, 6.11, 6.12, 6.13, 6.14 and6.15). Out of the two tests which were done for each mortar, only one is plotted(in stead of taking average profiles). A slight bias was observed in each couple oftests, in speed of progression of moisture fronts or in values of w. This was howevernot more than a couple % and smaller than the differences between two types ofmortar. Hence the choice of plotting one test as measured. However for numericaltreatment data are based on averages from the two tests.

158 Water transport experiments and combined workability experiments
−4 −2 01200
1250
1300
1350
1400
1450
x (mm)
Diff
eren
tial a
ttenu
atio
n in
mor
tar
(−
)
0 5 10 15 20 250
20
40
60
80
100
Distance to interface x (mm)
Wat
er c
onte
nt in
bric
k w
(dm
³/m
³)
1.5 min3 min6 min15 min30 min60 min120 min
Figure 6.10: Attenuation in mortar and moisture profiles in brickfor lime hydrate mortar.
−4 −2 0750
800
850
900
x (mm)
Diff
eren
tial a
ttenu
atio
n in
mor
tar
(−
)
0 5 10 15 20 250
20
40
60
80
100
Distance to interface x (mm)
Wat
er c
onte
nt in
bric
k w
(dm
³/m
³)
1.5 min3 min6 min15 min30 min60 min120 min
Figure 6.11: Attenuation in mortar and moisture profiles in brickfor lime hydrate AE mortar.

Water transport measurements by microfocus X-ray radiography 159
−4 −2 01100
1120
1140
1160
1180
1200
1220
1240
1260
1280
1300
x (mm)
Diff
eren
tial a
ttenu
atio
n in
mor
tar
(−
)
0 5 10 15 20 250
20
40
60
80
100
Distance to interface x (mm)
Wat
er c
onte
nt in
bric
k w
(dm
³/m
³)
1.5 min3 min6 min15 min30 min60 min120 min
Figure 6.12: Attenuation in mortar and moisture profiles in brickfor lime-cement mortar.
−4 −2 01000
1050
1100
1150
1200
1250
1300
x (mm)
Diff
eren
tial a
ttenu
atio
n in
mor
tar
(−
)
0 5 10 15 20 250
20
40
60
80
100
Distance to interface x (mm)
Wat
er c
onte
nt in
bric
k w
(dm
³/m
³)
1.5 min3 min6 min15 min30 min60 min120 min
Figure 6.13: Attenuation in mortar and moisture profiles in brickfor hydraulic lime mortar.

160 Water transport experiments and combined workability experiments
−4 −2 01600
1650
1700
1750
1800
1850
1900
x (mm)
Diff
eren
tial a
ttenu
atio
n in
mor
tar
(−
)
0 5 10 15 20 250
20
40
60
80
100
Distance to interface x (mm)
Wat
er c
onte
nt in
bric
k w
(dm
³/m
³)
1.5 min3 min6 min15 min30 min60 min120 min
Figure 6.14: Attenuation in mortar and moisture profiles in brickfor cement mortar.
−4 −2 0950
1000
1050
1100
1150
1200
1250
x (mm)
Diff
eren
tial a
ttenu
atio
n in
mor
tar
(−
)
0 5 10 15 20 250
20
40
60
80
100
Distance to interface x (mm)
Wat
er c
onte
nt in
bric
k w
(dm
³/m
³)
1.5 min3 min6 min15 min30 min60 min120 min
Figure 6.15: Attenuation in mortar and moisture profiles in brickfor cement AE mortar.

Water transport measurements by microfocus X-ray radiography 161
Observations on phenomena in the brick
Two phases can be distinguished in the dynamics of the moisture fronts in thebrick: in the short first stage the brick absorbs an important amount of water ina limited zone, in the second stage the amount of absorbed water increases verylittle and the diffusion of water in the initially dry brick leads to flattening of themoisture fronts.
The depth of the zone with high w after the first stage varies between 3mm for thelime hydrate AE mortar and 8mm for the cement mortar. The value of w in thiszone is mostly between 40 and 70 dm3/m3 (far below wcap), with a strong gradientin roughly the first 2 or 3mm from the interface. This zone close to the interfaceis difficult to interpret: a small part has overcapillary moisture content, due to thedissolution and diffusion of the air entrapped in the pores, but part of the very largeobserved increase is also due to an edge effect: the mortar container was emptyin the reference image and filled with mortar in all later images. The distinctionbetween these two effects can be made by observing the curves: the clear andsystematic evolution points to the continuing moisture transport phenomena, whilethe remaining constant jump is in fact the background noise due to the procedure.
The moment of transition between the first and second phase can be identifiedby the time from which w starts to decrease near the interface. The new curveshave lower w than the previous curves in this interface zone, but higher w at somedistance. This happens already before or around 1.5 min in the case of the limehydrate AE mortar, between 1.5 and 3min for the lime hydrate, lime-cement andcement AE mortars, and between 3 and 6 min for the hydraulic lime and cementmortars. The shape of the moisture front is slightly steeper for the mortars whichloose more water. A stretched tip is observed in the early profiles, but this tip doesnot proceed in the later profiles.
A plot of the integrals of the curves as a function of√t is given in Fig. 6.16. All
bricks have absorbed the final amount of water after about 16 min of contact.The theoretical linear relation between desorbed mass and
√t, which would be
characteristic for contact between two semi-infinite quantities, is already over atthe time of the first measurement, and may last even much shorter. This illustratesthe poor relevance of such a situation for masonry applications.
The absolute quantities of desorbed water differ as much as a factor 3 over thedifferent mortars. Mortar with entrained air looses significantly less water than thecorresponding mortar without entrained air: about 40%. This is partly explainedbecause they start with a lower value of w (15 to 25% lower, compare Table 4.6), butalso because of their different transport properties. The slight decrease measuredtowards the end of the experiment is probably due to some evaporation. Basedon these observations, we may expect that the attained values are the equilibriumvalues, and that changes will not occur before microstructural changes in the

162 Water transport experiments and combined workability experiments
mortar, due to hydration, cause changes in water potential, water content andpermeability.
0.8
1
1.2
1.4
mo
rta
r jo
int
(kg/
m²)
0
0.2
0.4
0.6
0 20 40 60 80 100
Wat
er
loss
of
ha
lf m
Sqrt time t0.5 (s0.5)
Lime hydrate Lime hydrate AE
Lime-cement Hydraulic lime
Cement Cement AE
Figure 6.16: Integrals of moisture fronts for different mortarsas a function of
√t. The values are averaged over two tests.
Observations on the attenuation of the liquid
The attenuation coefficient µ of the desorbed/absorbed liquid was calculatedseparately for each test, based on the equality between the integral of the finalmoisture front and the measured weight increase of the specimen. µ can beexpressed per unit of mass (cm2/g) or per unit of volume (m−1). For a 85 keVsource averages were calculated of µ = 58.38m−1 for the liquid from the limehydrate mortar, and in the same range: 59.83 for lime-cement and 63.18 forhydraulic lime. This is about three times higher than the coefficient of pure water,which is about 18m−1. This difference is not surprising, because the dissolvedions have a higher attenuation than water molecules. The value for the cementwater is lower: 50.07m−1, while the products with air entraining admixture have amuch higher attenuation: 70.26m−1 for cement AE and 91.24m−1 for lime hydrateAE. Apart from ions from the mineral binders, these liquids also contain dissolvedpolymer molecules and other non-specified substances.
It is clear from this analysis that the separate calculation of the coefficient foreach mortar is a necessity. The interstitial liquid behaves very differently whencompared to pure water, be it in terms of viscosity (Section 5.4), or in terms ofphysical and chemical characteristics.

Water transport measurements by microfocus X-ray radiography 163
Observations on phenomena in the mortar joint
The analysis of the evolution in the mortar joint is of primary importance to thisinvestigation, but it is greatly complicated by the fact that it is not possible todiscern two phenomena in the evolution of attenuation:
– the increase of attenuation by the compaction of the solid materials: φincreases from φ0 to a significantly higher value, close to φ∞;
– the decrease of attenuation caused by the desorption of interstitial liquid.
Furthermore the interpretation is also difficult near the edges of the mortar joint.Trial tests were performed with a dry mortar mix in the container while the referenceimage was taken, so that this edge would be diminished. However, because of thedifficulty in comparing this state with the state of varying compactness during thetest, this idea was abandoned in the definitive procedure. Hence no integrals ofthe curves were calculated for quantitative analysis.
The plots in Fig. 6.10 to 6.15 are scaled with the same factors as the correspondingcurves in the brick. This means: if no compaction would occur, the decrease wouldcorrespond to the water loss. Some conclusions can be drawn from observation ofthe plots:
– most profiles are skewed towards the interface, which probably indicates agradient in compaction;
– the subsequent graphs are approximately parallel to each other, because theirpermeability is still relatively high when compared to the brick;
– there are important fluctuations in attenuation over the joint thickness, whichmay indicate the formation of alternating higher and lower density, or themovement of sand grains;
– in some cases a peak is formed near the interface, which in some cases becomesgradually more pronounced.
A zoom on this last effect is presented in Fig. 6.17. The growth of the peak ismost important between 1.5min and 3min and can be due to the transport ofentrained binder particles, or a general local increase of φ. Such a zone of increasedsolid fraction will cause a local decrease of permeability. If binder particles move,this has an important effect on the quality of bond, a phenomenon which has beenreported by Brocken and Larbi (1999) and Groot (1993).
The curves for the mortar joints are subjected to important scatter, dependingon the place where the front is calculated (e.g. between 2 and 3 cm from the edge,

164 Water transport experiments and combined workability experiments
−5 −4 −3 −2 −1 01600
1650
1700
1750
1800
1850
Distance to interface x (mm)
Diff
eren
tial a
ttenu
atio
n in
mor
tar
(−)
1.5 min3 min6 min15 min30 min60 min120 min
Figure 6.17: Plot of differential attenuation in the mortar jointfor a test with cement mortar.
or between 7 and 8cm from the edge). This restriction, together with the otherproblems mentioned above, confirm the necessity of extra investigations to takemore general conclusions. As a final remark: the resolution observed here is alreadyfar below the size of a representative volume particle of mortar.
6.4.3 From mortar testing to model parameters
The ability of the interstitial liquid to flow through a mortar when a potentialgradient is applied, or to redistribute unequal concentrations, is expressed in termsof permeability K or diffusivity D. Both parameters are a function of porosity ε orvoid ratio e. This function must be known in order to perform model calculations.
Permeability
The Kozeny-Carman equation (Eq. (3.61)) expresses saturated permeability K asa function of ε and material constants, grouped together in the Kozeny constant k′.This constant can be expressed for soils as:
k′ = τ
c′(6.3)
with c′ a shape factor, which accounts for the irregular shape and interconnectionsbetween the pores, and τ ′ the tortuosity, which is the ratio between the real flowpath length and the straight distance between two points in soil. This correction

Water transport measurements by microfocus X-ray radiography 165
is necessary because the initial formulation of the law is for a bundle of parallelnon-intersecting pores with circular section.
The practical difficulty of determining c′ and τ can be overcome by taking theapproximative values of k′ = 5 as stated in literature or by incorporating it in anempirical fitting parameter (Kutilek and Nielsen, 1994).
An extra difficulty is that SSA and ρ are ambiguous for a heterogeneous mixtureof solids. The solid material in a unit volume of mortar consists of a mass fraction(B/S+ 1)−1 of sand, and a mass fraction (1− (B/S+ 1)−1) of binder. The Kozeny-Carman equation (3.61) can theoretically be used, if mass averaged parameters aredefined:
SSA = (B/S + 1)−1 · SSAs + (1− (B/S + 1)−1) · SSAb (6.4)
ρ = (B/S + 1)−1 · ρs + (1− (B/S + 1)−1) · ρb (6.5)
The experimental values for K are taken from the permeameter tests, for the initialnon-compacted state, and from suction tests for the permeability of the compactedmortar. A simple sharp front model in Hall and Hoff (2002) relates the permeabilityof the filter cake Kc to the coefficient of desorption R:
2Kc(∆Ψ)(φ∞φ0− 1) = R2
ρ2l
(6.6)
Considering that the filter cake has a solid fraction of φ∞, this leads to a datacouple (φ,K) for each measurement. A hypothesis has to be made about therelationship between phase variables s, b, w and a during dewatering, so that valuesfor ε or e and φ can be derived on any moment. The assumptions are:
– the volume decrease of the mortar is equal to the volume of desorbed water:no air is penetrating the material;
– the volume decrease of the entrapped air bubbles is neglected (in reality itmay be up to 33%);
– there is no net migration of binder particles with reference to the mortar’smaterial coordinate m, in other words B/S remains constant over the volume;
– evaporation during the suction test is neglected.
A least square fit of the Kozeny-Carman equation can be done using 1 point of thepermeameter test and 4 points of the suction test (Fig. 6.18). The basic equationis Eq.(3.62) with only one variable K∗.

166 Water transport experiments and combined workability experiments
1 0E 07
1.0E-06
bili
ty K
(m
/s)
Kozeny-Carman fit
Permeameter
Suction test
1.0E-08
1.0E-07
0.2 0.25 0.3 0.35 0.4
Pe
rme
ab
Porosity (m³/m³)
Figure 6.18: Experimental data for permeability of lime hydrate mortar and fit tothe Kozeny-Carman equation (K∗ = 7.64 · 10−7 m/s).
It is useful to compare this results to the theoretical calculations based on Eq.(3.61), with the rough estimate of k′ = 5 (Fig. 6.19). Calculations are based onthe particles’ properties as mentioned in Table 4.1. It appears that the predictedbehaviour for lime hydrate mortar is in one order of magnitude higher than theexperimental values. A corrected value of k′ ≈ 50 may be derived. The appeal ofthis approach is the strong theoretical link between the SSA of the binder andthe permeability. However it is probably the difficulty to measure this parameterand to estimate τ ′ and c′ which causes the large difference with the experiments.An experimental value of SSA, measured with a gas adsorption method, doesnot necessarily give a value which is relevant for evaluating moisture transport.When using SSA values obtained with a Blaine test, the correspondence withexperimental data is even worse.
Hydraulic potential
Considering the low amount of air in the mortar, which is present in isolatedbubbles, the total potential of the liquid within the material is mainly influencedby the hydraulic potential or water potential ψw, which is due to interactionbetween liquid molecules and the surface of the solid particles. It is only whenthe porosity and the gas fraction a increase during hardening that the capillarypotential becomes more important.
The equilibrium water content values of the suction tests are taken as experimentaldata points (e,Ψ) and fitted to Eq. (3.57), as proposed by Smiles (1970). Fig. 6.20gives the example of the lime hydrate mortar.

Water transport measurements by microfocus X-ray radiography 167
1.E-031.E-03
Lime hydrate Lime-cement
Hydraulic lime Cement
1.E-04Perm
eability K (m/s)
Hydraulic lime Cement
1.E-05
Perm
eability K (m/s)
1.E-06
Perm
eability K (m/s)
1.E-06
Perm
eability K (m/s)
1.E-07
0.2 0.25 0.3 0.35 0.4
Porosity ε (m³/m³)Porosity ε (m³/m³)
Figure 6.19: Calculated values for permeability of different mortars, based onKozeny constant k’=5 and experimental values of SSA (BET).
0 4
0.5
0.6
0.7
0.8
(-Ψ
)
0
0.1
0.2
0.3
0.4
0.28 0.29 0.3 0.31 0.32 0.33
log
(
Void ratio e (m³/m³)
Figure 6.20: Fit of experimental data tot the Croney and Coleman formula forwater potential of compacting soil: data of lime hydrate mortar.
Diffusivity
Two different approaches are worked out using the same experimental data: thefirst relies on a calculation based on expressions for permeability and potential, thesecond relies on the direct derivation from an analysis of the filtration process.
An expression for the diffusivity in material coordinates can be found by substitutingan equation for permeability (3.62) and an equation for potential (3.57) into (3.69).

168 Water transport experiments and combined workability experiments
The result is an equation with three empirical constants: K∗, α and β:
Dm(e) = −K∗
α
e3
(1 + e)2 exp(e− βα
)(6.7)
The direct approach is based on a physical theory developed by Smiles and Harvey,as explained in Landman et al. (1999). The process is a constant pressure filtrationwith φ0 the initial solid fraction, φ∞ equilibrium solid fraction (solid fraction of thecake) and R the desorptivity at the applied level of pressure. It is demonstratedthat the solid fraction-dependent diffusivity can be found as:
D(φ∞) =
dR2
dφ∞
2(
1φ0− 1φ∞
) (6.8)
The dependency on solid fraction φ can be recalculated to void ratio e or waterratio θ.
The results of both methods are plotted for lime hydrate mortar in Fig. 6.21. Itappears that they are consistent, at least for this case and the range of void ratios.Within the relevant range D increases monotonously, but this is not necessarilythe case. For increasing e, K will always increase, but the increase of Ψ with emay become small for higher e so that the factor 1/(1 + e) starts to dominate andthe curve reaches a maximum.
1 0E-07
1.5E-07
2.0E-07
y D
(m
²/s)
0.0E+00
5.0E-08
1.0E-07
0.2 0.3 0.4 0.5
Diff
usiv
ity
Void ratio e (m³/m³)
Empirical
Analytical
Figure 6.21: Diffusivity of lime hydrate mortar calculatedwith two different methods: empirical (based onCroney-Coleman and Kozeny-Carman laws) and
analytical (based on Smiles-Harvey).

Modelling water transport 169
The diffusivity curve resulting from the empirical models is interesting because ofthe possibilities for use in numerical transport models. Table 6.3 gives the fittedparameters of Eq. (6.7) for the different reference mortars. For most mortars theagreement between these data and the analytical values was fairly good. Howeverfor the mortars with air entraining agent, there was not sufficient data from thesuction tests, because air breakthrough occurred too fast to make a reasonableestimate of the equilibrium water content. In those cases the fitting to the Kozeny-Carman equation may cause larger mistakes, and a fit to the Croney-Colemanequation is not possible. Therefore the variables α and β for the lime hydrate AEmortar were taken over from the corresponding mortars without entrained air.
Table 6.3: Fitted parameters for liquid permeability and potential of mortars.Numbers in italics are not directly measured.
Lime Lime hy- Lime- Hydraulic Cementhydrate drate AE cement lime
K* (m/s) 7.64 · 10−7 6.90 · 10−8 3.61 · 10−7 2.85 · 10−6 1.41 · 10−6
α -0.40 -0.40 -0.25 -0.26 -0.12β 0.60 0.60 0.45 0.44 0.39
Another remark concerning the methods and results is that, when comparedto most industrial filtration processes, the dewatering of mortar causes only alimited increase in solid fraction. All fitted transport properties are derived frommeasurements of this small decrease. Without analysing the bias in the resultsin detail, it is clear that the method is very sensitive to scatter. Hence also theusefulness of applying several methods, which each have different behaviour withregard to scatter, and comparing the results.
Apart from the two applied methods to derive the diffusivity, other approximativeiterative methods are mentioned in literature. They require some mathematicalmanipulation, but may result in smaller errors due to scatter on experimentalresults (Landman et al., 1999).
6.5 Modelling water transport
6.5.1 Finite volume method
The numerical solution of the 1D moisture transport is addressed using afinite volume method (FVM) or control volume method (CVM). It consists of adiscretisation by dividing the mortar and brick in a mesh of elementary volumes, forwhich the conservation of mass is written (Hens, 2000). The size of the elementaryvolumes and the variables of the equations are in Lagrangian coordinates (m-

170 Water transport experiments and combined workability experiments
coordinates), so that the mesh conserves its size during the process, also when thex-coordinates of mortar particles change due to compaction.
The change of moisture content is the difference on incoming and outgoing fluxesq (Fig. 6.22). If the mortar is on the left and the brick on the right side, we canassume that water will be moving from left to right, which is the positive senseby convention. In stead of water content w or void ratio e, water ratio θ is usedas a state variable, as proposed in Smiles and Kirby (1994) for the dewateringof bentonite. θ is the volume fraction of water divided by the volume fraction ofsolids (θ = w/φ). Unidimensional transport is described by:
∂θ
∂t= ∂q
∂m= ∂
∂mDm
(∂θ
∂m
)(6.9)
m
j-1 j j+1
Figure 6.22: Incoming and outgoing flux in the jth control volume.
Although m and θ have different physical interpretations in mortar and in brick,this equation is valid in both materials. The diffusivity curves Dm(θ) determinetheir different nature. With index j for the coordinate and i for the time step, thediscretisation can be written as follows:
(θi+1j − θij)
∆t =
(Dim,j+1 +Di
m,j)2
(θij+1 − θij)∆m −
(Dim,j +Di
m,j−1)2
(θij − θij−1)∆m
∆m
(6.10)
With all moisture ratios known for time step i and known diffusivities, the moistureratio for time step (i + 1) is calculated directly from this equation. The timestep ∆t may be chosen differently for the early and later steps, and it is chosensmaller when this proved necessary for the stability of the calculation. In practice,the mortars with high diffusivity required a smaller initial time step to preservenumerical stability.

Modelling water transport 171
6.5.2 Boundary conditions
For the initial state, water ratio of the freshly mixed mortar is taken from Table4.6 and the water ratio of the brick is zero. In principle, any other initial moisturecontent or any moisture profile can be used as starting value, like for example apre-wetted brick. At the edges of the material the assumption is made that there isno water loss or gain, i.e. evaporation is neglected. This is implemented by settingthe last control volume at both edges on exactly the same water ratio as the onecalculated for the next volume, so that there will be no resulting flux.
The maximum water content for the brick is set on capillary saturation wcap. Thisis a simplification, because the X-ray experiments showed that a limited zone nearthe contact plane can have higher water contact. This was also observed for uptakeexperiments in Roels and Carmeliet (2006).
6.5.3 Determination of interface potential
Eq. (6.10) can not be solved for both elements left and right of the interface,because the diffusivity over the interface is not defined. Therefore an imaginaryextra element is created on the interface, which has a double water ratio θ0m atthe mortar side and θ0b at the brick side. These are two extra unknowns, whichcan be found using two extra equations of the interface conditions (Smiles andKirby, 1994; Brocken et al., 1998):
1. The incoming flux from the mortar is equal to outgoing flux towards thebrick.
θ−1 − θ0m
∆m/2 Dm,m + θ0b − θ1
∆m/2 Dm,b = 0 (6.11)
2. The potential at both sides is equal.
Ψ0m = Ψ0b ⇒ θ0b = f(θ0m) (6.12)
The extra indices m and b for diffusivity Dm refer to the mortar and brick. Thefunction f stands for the relation that can be derived the potential curves Ψ(θ) forboth materials. These two interface criteria are generally fulfilled on the interfacebetween any two different porous materials (Hall and Hoff, 2002). The fact that thepotentials must be equal, and that both materials have different water retentioncurves, implies that the moisture ratios θ are not equal at both sides.
Solving of the equations was done in an interative procedure in Matlab. The codeand details about the algorithm can be found in Debacker (2009).

172 Water transport experiments and combined workability experiments
6.5.4 Discussion of modelling results
The results are plotted in Fig. 6.23a for lime hydrate mortar, 6.23b for lime-cement mortar, 6.24a for hydraulic lime mortar and 6.24b for cement mortar. Foreasy comparison the fronts are plotted on the same time steps as in the X-rayexperiments. In this stage it proved to be too difficult to model the mortars withair entraining agent. Measurement of permeability and potential were problematic,and the assumptions which had to be made to obtain usable values, were apparentlytoo rough.
−5 0 5 10 15 20 25 300
50
100
150
200
250
Distance to interface (mm)
Wat
er c
onte
nt w
(dm
3 /m3 )
1.5 min3 min6 min15 min30 min60 min120 min
−5 0 5 10 15 20 25 300
50
100
150
200
250
Distance to interface (mm)
Wat
er c
onte
nt w
(dm
3 /m3 )
1.5 min3 min6 min15 min30 min60 min120 min
Figure 6.23: Results of simulations of water transport from lime hydrate mortar (a)and lime-cement mortar (b) to brick.
−5 0 5 10 15 20 25 300
50
100
150
200
250
Distance to interface (mm)
Wat
er c
onte
nt w
(dm
3 /m3 )
1.5 min3 min6 min15 min30 min60 min120 min
−5 0 5 10 15 20 25 300
50
100
150
200
250
Distance to interface (mm)
Wat
er c
onte
nt w
(dm
3 /m3 )
1.5 min3 min6 min15 min30 min60 min120 min
Figure 6.24: Results of simulations of water transport from hydraulic lime mortar(a) and cement mortar (b) to brick.
There is a good qualitative correspondence between the simulated process and theexperimental data. The position of the fronts is in most cases fairly well predicted.However some systematic differences can be observed:

Modelling water transport 173
– The over-capillary moisture contents in the brick near the interface are notpresent in the simulations. The simulations give a more horizontal waterfront near the interface, compared to the strong increase in reality.
– In most simulations, the quantity of desorbed water is overestimated whencompared to the measurements. This overestimation is more important insome mortars than in others.
Difference between mortar types
The differences between the mortar types become clear when the different mortarsare plotted together. This is done in Fig. 6.25 for the simulated curves and inFig. 6.26 for the experimental data, both at time t = 15min after contact. Hereit clearly shows that the lime hydrate mortar has in reality slower and less watertransfer than in the simulations. The opposite is true for the cement mortar. Thelime-cement mortar is in the correct range, and the hydraulic lime mortar slightlyoverestimated.
Two causes for this difference can be identified: errors in the estimation of themortar and brick parameters (in both directions), and the influence of an interfaceresistance. For quantification of the bias in parameter estimation, a larger numberof tests would be necessary, and a statistical analysis of the fitting procedure.
The hydraulic interface resistance deserves more consideration. In the previousanalysis perfect hydraulic contact was assumed between the mortar and the brick.Nevertheless there is evidence in literature for the existence of an interfacial contactresistance between brick and mortar in hardened masonry. This contact resistancemay be due to locally different transport properties or to imperfect contact. Poorcontact can be related to the process of bricklaying, to the microstructural changesduring setting and hardening of the mortar, or to local porosity as a consequence ofstrong water flow from mortar to brick (Hall and Hoff, 2002; Derluyn et al., 2009;Elsen, 1998). Local change in transport properties can be related in the mortar tojamming of entrained binder particles just in front of the interface, or in the brickto jamming of the pores by the smallest binder particles. Experimental evidenceof binder particle transport by microscopy combined with neutron transmissionobservations, is presented in Groot and Larbi (1999).
Experience with pressure filtration experiments (Section 6.3) supports the firsthypothesis: it appeared during filtration tests that dewatering of hydrated limemortar at higher pressures was not possible, notable because a dense paste of binderparticles was jamming the membrane. This problem was much less pronouncedwith the other binders, and was dependent on the applied pressure. If pressure waslow and increased slowly, more water could be expelled.

174 Water transport experiments and combined workability experiments
Figure 6.25: Model curves for mortar and brick 15 minutes after contact.
0 5 10 15 20 250
50
100
150
Distance to interface x (mm)
Wat
er c
onte
nt w
(dm
3 /m3 )
lime hydratelime−cementhydraulic limecement
Figure 6.26: Experimental curves for brick 15 minutes after contact.

Modelling water transport 175
The fact that this behaviour is more pronounced in lime hydrate mortar than inthe other binders, can be related to the shape of the particles. It is demonstratedin Section 5.3 that lime hydrate particles have much higher intrinsic viscosity thancement (16.5 versus 9.5). This can be related to the drag coefficient of a particlewhen it has a relative velocity in a liquid. High intrinsic viscosity is related to largeaspect ratio, and can be expected to be correlated to hydraulic radius and dragcoefficient.
Hence the preliminary hypothesis can be formulated: in the first phase of watertransfer binder particles are dragged along with the water flowing from mortarto brick. Lime hydrate particles tend to be migrate more than others and causestrong jamming of the layer near the interface.
Principles for correction of imperfect contact
A correction of the model for contact resistance should take into account twoimportant aspects: liquid flow and material parameters. It is clear that aresistance will only build up when a water flow drags particles towards the interface.Parameters for the correction can be: amount of water transport, rate of watertransport, relative velocity of the water.
Material parameters are more complex and should account for the mobility of theentrained particles and permeability of the immobile skeleton for the suspendedparticles. Drag coefficient, aspect ratio and hydraulic radius have already beenmentioned as possible indicators. Specific surface area can be an indirect wayto estimate this. On the other hand, the fraction of colloidal particles can alsobe important, for two reasons: they are small enough to migrate through finepores, and they are more dominated by viscous drag and more stable in suspensioncompared to larger particles.
Early transport after contact
The model gives an idea about the water transport immediately after contact. Inthe X-ray experiments the first observations could only be made after 1.5min, atime gap over which most of the water is already absorbed by the brick. As anexample, a series of moisture fronts for the cement mortar are plotted in Fig. 6.27.The moisture gradient in the mortar joint is more visible than in the later curves,but still very small for this type of mortar. It can be concluded that an assumptionof constant water content can be acceptable, when no lime hydrate is present inthe binder.

176 Water transport experiments and combined workability experiments
−5 0 5 10 150
50
100
150
200
250
300
350
Distance to interface (mm)
Wat
er c
onte
nt w
(dm
3 /m3 )
1 sec2 sec5 sec15 sec30 sec60 sec
Figure 6.27: Simulated moisture curves in cement mortar and brick shortly aftercontact.
6.6 Squeeze tests on brick substrate
In previous sections the theory of squeeze was presented (Section 3.3.4) andtheoretically interesting test procedures approaching perfect-slip or no-slipconditions were discussed (Section 5.8). It was proven feasible to perform squeezetests on mortar cylinders, but it was not possible to link the results in a meaningfulway to material parameters.
This section discusses squeeze tests on a brick slice substrate, which is much closerto reality than perfect-slip or no-slip squeeze flow. Contrary to model conditiontests, no attempt was done to relate the outcome of the tests to a rheological or aplastic model. For this reason the experiments are to be considered as empirical: theresult is an observation of complex phenomena which are not entirely understood.
6.6.1 Preliminary squeeze tests: influence of parameters
Test were performed with the reference lime hydrate mortar, using batch 4 sand,mixed according to Mix 2. The bricks were the extruded facing brick (highabsorption coefficient) and the moulded facing brick (low absorption coefficient).The apparatus was a Paar Physica MCR500 rheometer (KULeuven, lab of Chemicalengineering department) with parallel plate geometries.
The bottom plane of the rheometer was topped with a glass plate. The bricksubstrate was a cored cylinder of diameter 52mm or 28mm. At first the brick wascovered with plastic film, on which a cylindrical mould was placed. The mouldwas lubricated at the inside, then filled with mortar. The plastic film was taken

Squeeze tests on brick substrate 177
from under the mortar, so that it made contact with the brick, and the cylinderwas carefully lifted. The whole assembly was placed under the top plate of therheometer (which is as well lubricated) and the test was started at constant rate.The limitation is the maximum normal force of the rheometer: 50N .
Some of the parameters which influence the process are illustrated in Fig. 6.28.When a smooth surface in the squeeze test is replaced by an absorbing brick,the water content of the mortar will dramatically decrease, which increases theresistance to deformation (Fig. 6.28a). Depending on the absorption coefficientand porosity, this effect may be more or less important (Fig. 6.28b and Fig. 6.29).The effect of moistening the brick is shown by the two extremes: dry and capillarysaturated (Fig. 6.28c).
6.6.2 Squeeze tests on reference mortars
The comparison of the behaviour of the six reference mortars was done in a seriesof tests on mortar cylinders of R = 12.5mm and h0 = 15mm. The procedure isanalogous to the preliminary tests: rate controlled at velocity c = 0.5mm/s. Theinitial position of the lubricated top plate was 16mm above the basis of the mortarcylinder.
Mortars were composed with sand of batch 4, original composition. Mixing wasdone according to Mix 1, respectively Mix 3 for the mortar with cement AE. Fillingof the cylinder, unmoulding and placing in the apparatus was done between 1 and2min after the end of mixing. The test itself was started 25 sec later, and endedautomatically when a force of 45N was reached.
Two tests were done for each mortar, on two places of the same brick slice. Fig.6.30 shows the geometry of these specimens, which were not cored over the wholethickness of the slice (15mm), but only over 10mm. The ring-shaped groove wasthen filled with silicone in order to seal the cylindrical part, so that water transportduring the test would be one-dimensional.
The average of the two measurements for each mortar type is plotted in Fig. 6.31in quantities of reduced force F ∗ = Fh/πR2 as a function of dimensionless gaph/R. All curves, except the one for the lime hydrate mortar, show a non-monotonicincrease of the slope: two phases of marked increase are separated by a decrease.A plausible explanation for this phenomenon is that slippage occurs from a certainpoint. Referring to the description of Sherwood and Durban (1996) with frictioncoefficient m, it can be assumed that from a certain point a critical lateral frictionbetween mortar and brick is overcome, and slippage starts to occur, causing adecrease of m = 1 to a value 0 ≤ m ≤ 1. This slipping effect has possibly negativeinfluence for the bond strength.

178 Water transport experiments and combined workability experiments
50
brick - non lubricated
40
(N) no brick -
lubricated30
forc
e ( lubricated
20
Nor
mal
10
N
2R=50mmh0=30mmc=0.5mm/s
00 10 20 30 40
Gap (mm)
50
high abs. brick
40
(N)
low abs. brick
30
forc
e (
20
Nor
mal
10
N
2R=50mmh0=20mmc=0.5mm/s
010 15 20 25
Gap (mm)
50
dry brick40
(N)
saturated brick
30
forc
e (
20
Nor
mal
10
N
2R=25mmh0=50mmc=0.5mm/s
00 5 10 15 20 25
Gap (mm)
Figure 6.28: Three parameters which influence the squeeze force of mortar onsubstrate: presence of absorbing brick (a, top left), absorption coefficient of the
brick (b, top right) and moisture content of the brick (c, bottom).
In absolute values the mortars with lime-cement and hydraulic lime reach themaximum force at larger gap than the other mortars, which end in the same range.If squeezing from e.g. 6mm to 4mm is representative for a half joint in practice, aforce of 700N would be required to put a normal facing brick in place. This leads tothe assumption that the reference mortars have too high yield stress to work swiftlyin this way, and that this composition almost requires incomplete horizontal jointfilling. This conclusion can be related to the outcome of the practical investigation(Section 4.4) where the one mason who systematically chose for full horizontal jointsand the squeezing method, systematically had a higher W/B than the average,

Summary 179
Figure 6.29: Image after squeeze test on a strongly absorbing brick (left), andimage at the end of a squeeze test on a less absorbing brick (right).
105 15
Figure 6.30: Geometry of the brick specimen used as substrate for squeeze tests:top view and vertical section.
which was used for the reference composition.
Considering the problems encountered with fitting a simple “ideal” sqeeze testto theoretical models, and the extra complexity of desorption by the substrate,considerable normal stress and observation of slippage, no attempts were done tolink the data to material parameters.
6.7 Summary
The existing standardised tests with filter plates and vacuum suction give anindication for water retention of mortars, which corresponds qualitatively to thefeeling of masons. However new experimental methods had to be developed toobtain model parameters for the liquid transport in mortars. The most important

180 Water transport experiments and combined workability experiments
3000
4000
5000
6000
sion
load
F*
(Pa)
lime hydrate
lime hydrate AE
lime-cement
hydraulic lime
cement
cement AE
0
1000
2000
3000
0.2 0.3 0.4 0.5 0.6 0.7 0.8
Red
uced
com
pres
s
Dimensionless gap h/R (m/m)
Figure 6.31: Results of squeeze tests with reference mortars on brick substrate.
concept or assumption is that a mortar is considered as saturated, but with varyingvoid ratio. Most of this void space is filled with the liquid. When water is desorbed,the solid skeleton densifies, so that the liquid potential increases.
An adapted permeameter test was successfully used to quantify the permeability infresh state, but presented problems with high air content mortars. Vacuum suctiontests and pressure filtration tests were designed and applied to obtain potential and- via equations from cake filtration theory - diffusivity of the compacting mortar.Two data treatment methods proved to give comparable results, and lead to thefirst successful quantification of a fresh mortar’s hygric properties.
The observation with X-ray radiography during the process of water absorptionfrom a mortar by a brick, gives very useful information, but is difficult to interpretat the side of the mortar. Two simultaneous effects are hard to separate, so thatthe conclusions can not be straightforward. The method has important advantagesover other previously applied methods, notably the possibility to record a whole2-dimensional array at once, in stead of having to scan a profile.
The X-ray observations are especially useful to assess the possibilities of a numericalmethod, which takes into account the brick’s and the mortar’s parameters. Aniterative procedure was developed to determine the interface potential. Thecomparison of the results to the measured moisture profiles lead to the identificationof an important interface resistance, which is dependent on the type of binder inthe mortar. The hypothesis is that binder particles are dragged with the liquid

Summary 181
flow and cause jamming close to the interface. Properties related to hydraulic dragcan be correlated to the developed resistance.
Desorption of water and squeeze flow were combined in one test. The resultswere analysed on an empirical level. The importance of surface roughness, andabsorption characteristics of the substrate were shown. It appeared that for mostof the mortars slippage at the interface is probably an important aspect of the flow.


Chapter 7
Development of a newworkability test method
7.1 Test principles
The major problems for workability which emerged from the practical experimentswith the masons panel were:
– premature stiffening of the mortar due to rapid water loss to the brick, causinginability to position the brick correctly;
– insufficient increase of stiffness after longer time, causing instability of thebricks (“floating”).
The criteria for stiffness can easily be translated in terms of yield stress. If priorityis given to these two major problems, a method can be designed to measure the yieldstress of a mortar at various times during a procedure of desorption of interstitialliquid.
The temporal aspect of the test principles can be fixed, based on a typical timingduring the action of bricklaying:
– the not too high stiffness should be guaranteed 1 minute after the beginningof desorption;
– the high enough stiffness should be guaranteed 15 minutes after the beginningof desorption.
183
184 Development of a new workability test method
This is in the assumption that the imposed desorption proceeds at the same rateas the real desorption of the mortar when brought in contact with a brick.
Aspects that are not included in such a procedure but which were judgednevertheless important are:
– density of the mortar;
– adhesion of mortar to brick;
– workable time.
7.2 Implementation
The most successful measurements of (undrained) yield stress of mortar wereobtained with a vane apparatus (Section 5.6). The geometry used in the previouschapters was based on vanes of D×H = 45× 45mm2 in a laboratory test for clay,and of D ×H = 22× 16mm2 in a high-precision rheometer. Both vanes can beused when fully immersed, or with the top even with the surface, so that only thesides and bottom are sheared in the mortar.
Applying desorption to a quantity of mortar is rather difficult in a bulky specimen.To overcome this difficulty, and to stay closer to the geometry of a flat andwide mortar joint, the vane measurement should be done in a sample of reducedthickness. Hence the vane should have dimensions D >> H and H should be aslow as possible.
7.2.1 Pocket vane apparatus
These criteria can be met by using a commercially available pocket vane apparatus(Fig. 7.1). It works according to the same principles as the laboratory apparatusand the larger on-site apparatuses, but the vanes are smaller (with D >> H),spring stiffness is proportionally smaller, and it is operated by a turn of the handof the operator. It is easy to use, inexpensive and compact.
The most important restrictions are that:
– it can only be used with one spring, so that a large range of stiffness can onlybe covered by changing the vanes;
– the accuracy is rather low: reading has a scale from 0 to 10 with 0.5 thesmallest indicated unit;

Implementation 185
Figure 7.1: Pocket vane apparatus with exchangeable vanes.
– the standard vanes are in aluminium, which is corroded by cement and lime.
Eq. (5.16) can be used to calculate τm from the torque T which follows immediatelyfrom the scale reading and the spring stiffness (1Nm/360). It appears thatthe standard vanes are only good for use on materials with much higher yieldstress. Therefore an upscaled vane was produced, in stainless steel, with dimensionsD ×H = 70× 15mm2 (Fig. 7.2).
7.2.2 Combination with suction
Based on the all investigated water retention setups, two options can be put forwardto create the necessary desorption of interstitial liquid: contact with an absorbingsubstrate, or connection to a vacuum pump. The absorbing substrate may be therelevant masonry unit itself, gypsum plates as in the Emley test or filter paperplates.
For the sake of reproducibility and a straightforward scientific description, theoption of vacuum suction is worked out further. The apparatus used is the same asfor the suction tests to measure a mortar’s hygric properties (Section 6.3). In steadof a total sample height of 60mm (suction tests) or 20mm (ASTM), a height of30mm can be suitable in relation to the depth of the vane. The diameter of thefunnel dish (155mm) allows to do 1 test with the largest vane plus 3 tests withthe second largest (Fig. 7.3). The correct vacuum suction should be determined bydoing comparative tests between the setup and contact with the relevant masonryunit. An arbitrary value of 20 000Pa is used for preliminary tests.

186 Development of a new workability test method
70
36
18
1
2215
.3
25.5 4
15
Figure 7.2: Technical drawing of the upscaled new vane geometry for the pocketvane apparatus.
7.3 Preliminary measurements
7.3.1 Calibration of the spring
It is advisable to perform a calibration of the spring. Fig. 7.4 shows the setup withmovable mass M to create a known torque and measure the corresponding angleof rotation. The obtained constant is 1.06Nm/360, which allows to adopt thevalue given by the producer: 1.0Nm/360.
7.3.2 Measuring procedure
The procedure of the preliminary test uses the (available) funnel dish height of60mm and a vacuum pump working at 20 000Pa.
1. A mortar batch is mixed according to Mix 2 using the sand of batch 4 incorrected reference composition.

Preliminary measurements 187
tested zone
Figure 7.3: Combination of a suction setup and pocket vane tests. The dotted linesindicate tested zones with the largest (custom-built) and second largest vanes.
x
y
M
y = 0.3388x20
25
30
f ro
tatio
n (
°)
10
15
30 50 70 90
Ang
le o
f
Torque (Nmm)
Figure 7.4: Test setup and data for calibration of the springof the pocket vane apparatus.
2. The mortar is scooped with a rubber spatula in a mould for making mortarprisms (EN 196-2), without the inner separations: W ×L×H = 140× 160×40mm3. This is done in two layers, using the spatula to avoid formation ofair bubbles. (Any flat container of suitable size can be used.)
3. The excess mortar is scraped off in two movements, using a plastic ruler.
4. Two measurements are taken with the 70/15 vane.
5. The mortar is transferred to the funnel dish of the suction apparatus. Thisis also done with the spatula, filling the dish in two layers and avoidingformation of air bubbles.
6. The excess mortar is scraped off in two movements, using a plastic ruler.

188 Development of a new workability test method
7. The vacuum pump is started and suction applied to the sample by turningthe valve. This moment is recorded as time t = 0.
8. At t = 1min the valve is closed.
9. One measurement is done with the 70/15 vane. This may take 30 seconds intotal, so that the valve can be re-opened at t = 1.5min.
10. The valve is again closed at t = 15.5min.
11. Three measurements are done with the 48/5 vane.
7.3.3 Results for lime hydrate mortar and cement mortar
The results have to be analysed in a relative manner, because the optimum watercontent for different mortars leads to different vane yield stresses. This emerged frommeasurements on the reference mortars (Section 5.6) and is tentatively explainedthrough the influence of permeability on undrained stress values (Section 5.7). Theinitial value of τy after mixing is considered to be the ideal for each mortar, andthe relevant parameter is in the first place the increase of τy with respect to thisinitial value.
Two extreme cases are selected from the mortars without air entraining agent (forthe sake of simplicity): lime hydrate mortar and cement mortar (Table 7.1 and 7.2).In the practical tests with masons the first was characterised by a slow increase ofstiffness, the latter by a too rapid increase of stiffness (Section 4.5).
Table 7.1: Results of preliminary test on lime hydrate mortar.
Time of Test Reading T Vane K τsuction (min) (Nm) (m3) (N/m2)
0 1 6 0.6 70/15 0.000183 32820 2 6.6 0.66 70/15 0.000183 36101 1 7.2 0.72 70/15 0.000183 393915 1 2 0.2 48/5 2.07 · 10−5 968115 2 2.4 0.24 48/5 2.07 · 10−5 1161715 3 2.3 0.23 48/5 2.07 · 10−5 11133
The first conclusion is that the absolute numbers of τy are a factor 2.5 larger thanthose obtained with the laboratory vane apparatus. This difference is due to themuch larger rotational velocity even when compared to the highest applicable speedof the adapted laboratory apparatus.
Secondly the results confirm the characteristics observed in the practical test, whenthe relative increase of yield stress is analysed (Table 7.3). One minute of suction

Preliminary measurements 189
Table 7.2: Results of preliminary test on cement mortar.
Time of Test Reading T Vane K τsuction (min) (Nm) (m3) (N/m2)
0 1 3.2 0.32 70/15 0.000183 17510 2 3.3 0.33 70/15 0.000183 18051 1 6 0.6 70/15 0.000183 328215 1 3 0.3 48/5 2.07 · 10−5 1452115 2 3.2 0.32 48/5 2.07 · 10−5 1549015 3 3.7 0.37 48/5 2.07 · 10−5 17910
causes τy to increase with 14% for the lime hydrate mortar, versus 85% for thecement mortar. In this early stage the lime hydrate mortar was appreciated, whilethe cement mortar was found problematic. After 15 minutes of suction, the increasefor the lime mortar was judged not entirely sufficient, while for the cement mortarthis was judged positively.
Table 7.3: Relative increase of yield stress for both mortars.
∆τy(1min) ∆τy(15min)Lime hydrate mortar 14% 214%Cement mortar 85% 798%
This illustrates that, even when absolute vane yield stress can not be taken asa discriminator, this test does provide results which identify the most importantdefects of fresh masonry mortars. More extensive testing should give a better ideaabout the acceptable range for good mortars. Tentatively it can be estimated on< 50% after 1 minute and > 300% after 15 minutes.


Chapter 8
Conclusions and perspectives
8.1 A differentiated approach to mortar workability
This thesis started from the lack of adequate measuring methods for the workabilityof masonry mortar. The state of the art was made up in Chapter 2. The conclusionswere that many standards offer interesting test methods, with relevance for practicaluse, but two shortcomings remained problematic:
1. many methods are inconsistent if used for different types of mortar;
2. almost none of the methods provides physical parameters, so that the observedphenomena are difficult to explain. In other words, the level of analysis is inthe first place empirical.
The best foundation for such an investigation was found to be the assessment ofthe workmen who deal with the material on the site. Chapter 4 deals with thepractical test programme, executed with 6 experienced masons from 3 differentcountries. The outcome of these experiments were used for:
1. a definition of workability, i.e. the identification of positive and negativeaspects, which could be classified and related to physical parameters;
2. observations on different working methods for bricklaying, and their relationto the water dosage of the masons;
3. establishing reference compositions of mortars for use in further experiments;
4. assessment of the influence of workability-related variation in water contenton the mechanical strength of masonry.
191

192 Conclusions and perspectives
Workability is a combination of rheological properties, water transport propertiesand density. This division is maintained in the structure of the theoretical review(Chapter 3) and the experimental chapters (Chapter 5 and 6), but it is clear thatwater content has an important influence on rheology, and that density, throughair content, has an important impact on rheology as well. Most of the consideredproperties are interrelated.
8.2 Contributions to the adequate measurement ofmortar workability
In this section a brief overview is given of the aspects of the thesis which arenew: all methods for measurement and analysis which were either created from acombination of existing concepts, either an extension of an already used concept,or entirely new concepts
Systematic description of the composition of mortar
An extensive set of parameters and variables for fresh mortar parameters wasdeveloped, and the relations between them and the relevance of certain variablesfor workability were highlighted (Section 3.2).
Method to obtain flow curves of binder slurries and mortars
The use of a mixer-type rheometer and application of selected existing theorieslead to a reliable determination of flow curves, which is rare or nonexistent inliterature. The main ideas are the mixing principle to enhance stability and theshear rate-controlled step down profile of the procedure (Section 5.3-5.4).
Mortar and slurry viscosity as a function of particle parameters
Combination of the Krieger and Dougherty law with the Farris law lead to asuccessful description of a mortar’s viscosity as a function of particle parameters.The method can be used for optimisation of mixes (Section 5.4).

Perspectives for further research 193
Description of air entrapment in mortar at high solid fraction
The mixing of mortar from its constituents requires the presence of some air: thiscan be related to dilation of granular materials under shear, and has an importanteffect on viscosity, through a shift in maximum packing fraction (Subsection 5.4.2).
Shear strength of mortar in relation to dilation and permeability
Shear strength, or maximum shear stress in a defined process, depends on manyparameters including speed of applied force or displacement and normal stress.The normal stress dependence can be related to dilation and permeability. Most ofthese aspects were not recognised in literature (Section 5.7).
Application of cake filtration theory to mortar, using newly developed testmethods
Cake filtration has the important common feature of oversaturated, compactiongranular materials. Theoretical concepts derived in filtration literature were appliedto calculate the diffusivity curve of mortars.
Development of CVM method including measured mortar parameters
The obtained diffusivity curves were used as input for a numerical calculation ofmoisture transport (Section 6.5). Existing publications about the subject relied ongeneral assumptions about the mortar’s properties.
Development of a new test method with pocket vane and vacuum suction
A new method, which combines yield stress measurement with a vane and desorptionof mortar with a vacuum pump, is adequate to identify important flaws of freshmortar (Chapter 7).
8.3 Perspectives for further research
The possibilities for further research are manifold: newly proposed techniquesshould undergo a process of validation on a broader basis, and some new techniquesand methods of analysis follow logically from what is presented in this thesis.

194 Conclusions and perspectives
1. Determination of particle parameters for rheology can be done in solventsother than water. This should allow to enhance the stability and have morereliable results. In general, the approach with Viskomat was only extensivelyapplied to one type of binder. Use with different binders and differentcombinations of binders may extend and correct the hypotheses.
2. A measuring method for shear stress and normal stress combined withmonitoring of pore water pressure should be developed. Existing triaxialtest setups may be useful, at least as an inspiration. So far there are onlyhypotheses about the interaction of these parameters. Nonetheless theoreticalconcepts are readily available in geotechnical engineering.
3. The hypothesis of saturation of mortar throughout the process of dewateringshould be checked. Probably at some point air does intrude in the mortar,and capillary effects start to work. From that moment unsaturated transportparameters should be used.
4. The interface resistance between fresh mortar and brick should be investigatedmore in depth. Ideally it should be linked to material parameters andimplemented as an extension in the existing model code.
5. The CVM model for water transport from mortar to brick should be refinedand used to assess the consequences of different initial situations of moisturecontent of the materials. It could lead to important recommendations aboutcustom mortar design for specific types of brick, or about pre-wetting ofbricks. Another possible extension is to incorporate evaporation at the edges,and to extend the code to 2 dimensions.
6. The feasibility of discrete element methods (DEM) for analysis of mortars hasto be explored. The importance of granular behaviour is obvious from thephenomena discussed in this thesis. As a consequence it can be possible tomake meaningful models based on the different large sand grains as discreteunits with some pre-defined way of interacting. Mortars with sieved sands orunimodal glass beads can be produced to simplify the situation.
7. A suitable framework to account for the changes in the solid network, liquidflow and the relation of those phenomena to stress and deformation, maybe found in poromechanics. The feasibility of a poromechanical approachcan be checked by making a number of assumptions, write a set of governingequations, and apply them to simple tests like the vane test or direct sheartest. As it is essentially a Lagrangian coordinate system, large deformationsmay be difficult to treat.
In a more ambitious scope, and reasonably speaking on longer term, one canimagine more developed models. Two tracks are given as an example.

Perspectives for further research 195
1. A numerical model (poromechanical or not) can combine the effects ofstress and deformation with the effects of water transport. CVM analysisis appropriate for liquid transport, FEM for the deformation. In each timestep an interface potential and liquid fluxes between the control volumes aredetermined. The local mechanical parameters are derived from the resultingmoisture content, and deformation follows from those parameters and thestress tensor. It should be checked if commercial packages for soil mechanicsoffer good possibilities.
2. A microstrucural model could go beyond the time restrictions of this thesis andtake into account that hydration and carbonation change the microstructureof the mortar. This change in the structure of the porosity causes a changein the hygric properties. The quality of hardened masonry depends onthese processes. Much work has been done on the reaction kinetics andmicrostructure formation at early age of hydraulic and air-hardening mortars.There is also substantial information about the development of early strengthin mortars with hydraulic binders. Interesting perspectives can be openedby linking this knowledge to the knowledge of the processes in the first twohours.


Bibliography
AFNOR (2004). NF P 10-202-1 DTU 20.1 Travaux de bâtiment - ouvrages enmaçonnerie de petits éléments - parois et murs - partie 1: cahier des clausestechniques. Paris, preliminary document edition.
Aligizaki, K. A. (2006). Pore structure of cement-based materials. Taylor andFrancis, London.
Ancey, C. (2007). Plasticity and geophysical flows: a review. Journal of non-Newtonian fluid mechanics, 142:4–35.
ASTM (1987). ASTM D 4648-87 Standard test method for laboratory miniaturevane shear test for saturated fine-grained clayey soil. West Conshohocken.
ASTM (1992). ASTM D 698-91 Test method for laboratory compa tioncharacteristics of soil using standard effort. West Conshohocken.
ASTM (2004a). ASTM C 270-04a Standard specification for mortar for unitmasonry. West Conshohocken.
ASTM (2004b). ASTM C110 04 Standard test methods for physical testing ofquicklime, hydrated lime, and limestone. West Conshohocken.
ASTM (2004c). ASTM D 3080 Standard test method for direct shear test of soilsunder consolidated drained conditions. West Conshohocken.
Aït-Kadi, A., Marchal, P., Choplin, L., Chrissemant, A., and Bousmina, M.(2002). Quantitative analysis of mixer-type rheometers using the couette analogy.Canadian journal of chemical engineering, 80:1166–1174.
Atzeni, C., Farci, A., Floris, D., and Meloni, P. (2004). Effect of aging on rheologicalproperties of lime putty. Journal of the American ceramic society, 87(9):1764–1766.
Atzeni, C., Orru, D., Sanna, U., and Spanu, N. (2006). Notes on the rheology oflime putties and related mortars. Zement Kalk Gips international, 59(7):81–87.
197

198 BIBLIOGRAPHY
Azeredo, G., Morel, J., and Lamarque, C. (2008). Applicability of rheometers tocharacterizing earth mortar behavior. part i: experimental device and validation.Materials and structures, 41:1465–1472.
Backman, A. (1953). Über die grundbedingungen der geschmeidigkeit des baukalkes.Zement Kalk Gips, 6(42).
Backman, A. (1954). Apparatur und methodik zur messung der geschmeidigkeit-seigenschaften des kalkes. Zement Kalk Gips, 7(5):197–204.
Baker, L. (1979). Some factors affecting the bond strength of brickwork. In 5thinternational brick masonry conference, pages 84–89, Washington.
Banfill, P. (1994). Rheological methods for assessing the flow properties of mortarand related materials. Construction and building materials, 8(1):43–50.
Banfill, P., Starrs, G., Derruau, G., McCarter, W., and Chrisp, T. M. (2006).Rheology of low carbon fibre content reinforce cement mortar. Cement andconcrete composites, 28:773–780.
Barnes, H., Hutton, J., and Walters, K. (1989). An introduction to rheology.Elsevier, Amsterdam.
Bartos, P., M., S., and A.K., T. (2002). Workability and rheology of freshconcrete: compendium of tests. Report of RILEM technical committee 145-WSMWorkability of special concrete mixes. RILEM, Cachan.
Bauer, E., De Sousa, J., Guimarães, E., and Silva, F. (2007). Study of the laboratoryvane test on mortars. Building and environment, 42:86–92.
Becelaere, D. and Bonte, R. (2008). Toepasbaarheid van grondmechanischetestmethodes en principes voor de beschrijving van het mechanisch gedrag vanverse mortel. MEng thesis, Katholieke universiteit Leuven.
Ben-Aïm, R., Le Goff, P., and Le Lec, P. (1971). La perméabilité de milieux poreuxformés par empilement de mélanges binaires de grains sphériques. PowderTechnology, 5:51–60.
Bergström, L. (1997). Hamaker constants of inorganic materials. Advances inColloid and Interface Science, 70:125–169.
Bingham, E. (1922). Fluidity and plasticity. McGraw-Hill, London.
Bolton, M. (1986). The strength and dilatancy of sands. Géotechnique, 36(1):65–78.
Bousmina, M., Ait-Kadi, A., and Faisant, J. (1999). Determination of shear rateand viscosity from batch mixer data. Journal of rheology, 43(2):415–433.

BIBLIOGRAPHY 199
Bowler, G., Jackson, P., and Monk, M. (1996a). The measurement of mortarworkability. Masonry international, 10(1):17–23.
Bowler, G., Jackson, P., and Monk, M. (1996b). The role of mortar workability(cohesivity) in the rain penetration of masonry. Masonry international, 10(1):24–25.
Boynton, R. (1966). Chemistry and technology of lime and limestone. Interscience,New York.
Brocken, H. and Larbi, J. (1999). Composition of mortar as a function of distanceto the brick-mortar interface: a study on the formation of cured mortar structurein masonry using nmr, pfm and xrd. Heron, 44(4):257–270.
Brocken, H., Spiekman, M., Pel, L., Kopinga, K., and Larbi, J. (1998). Waterextraction out of mortar during brick laying: a nmr study. Materials andstructures, 31:49–57.
Broothaers, L. (2000). Zandboek Vlaanderen. Ministerie van de Vlaamsegemeenschap, afdeling natuurlijke rijkdommen en energie, Brussel.
Budhu, M. (2000). Soil mechanics and foundations. Wiley, New York.
Carmeliet, J., Janssen, H., and Derluyn, H. (2007). An improved moisture diffusivitymodel for porous building materials. In 12th symposium for building physics,Dresden.
Carmeliet, J. and Roels, S. (2002). Determination of the moisture capacity ofporous building materials. Journal of thermal envelope and building science,25:209–237.
Carter, M., Green, K., Wilson, M., and Hoff, W. (2003). Measurement of the waterretentivity of cement mortars. Advances in cement research, 15(4):155–159.
Casali, J. and Prudencio, J. (2008). A new test method for the evaluation of theworkability of concrete block masonry bedding mortars. In Masia, M., Totoev,Y., Page, A., and Sugo, H., editors, 14th International brick and block masonryconference, volume cd-rom. University of Newcastle, Sydney.
CEN (1995). EN 196-1 Methods of testing cement - Part 1: determination ofstrength. Brussels, 2nd edition.
CEN (1998). prEN 1015-1to7 Methods of test for mortar for masonry. Brussels.
CEN (1999). prEN 772-1 Methods of test for masonry units - Part 1: Determinationof compressive strength. Brussels, 1st edition.
CEN (2001). EN 459-2 Building lime - Part2: test methods. Brussels.

200 BIBLIOGRAPHY
CEN (2002). EN 1996-1-1 (Eurocode 6) Design of masonry structures - part 1-1:general rules for buildings - rules for reinforced and unreinforced masonry withBelgian application document included. Brussels, 1st edition.
CEN (2003). EN 998-2 Specification for mortar for masonry - part 2: masonrymortar. Brussels, 1st edition.
CEN (2005). EN 413-2 Masonry cement- Part 2: test methods. Brussels, 2ndedition.
Christensen, G. (1991). Modelling the flow of fresh concrete: the slump test. Phdthesis, Princeton university.
Cizer, O. (2009). Competition between carbonation and hydration on the hardeningof calcium hydroxide and calcium silicate binders. Phd thesis, Katholiekeuniversiteit Leuven.
Clayton, S., Grice, T., and Boger, D. (2003). Analysis of the slump test for on-siteyield stress measurement of mineral suspensions. International journal of mineralprocessing, 70:3–21.
Collier, N., Wilson, M., Carter, M., Hoff, W., Hall, C., Ball, R., El-Turki, A., andAllen, G. (2007). Theoretical development and validation of a sharp front modelof the dewatering of a slurry by an absorbent substrate. Journal of physics D:applied physics, 40:4049–4054.
Coussot, P. (2005). Rheometry of pastes, suspensions, and granular materials.Wiley, Hoboken, New Jersey.
Coussot, P. and Ancey, C. (1999). Rheophysical classification of concentratedsuspensions and granular pastes. Physical Review E, 59(4):4445–4457.
Covey, G. H. and Stanmore, B. R. (1981). Use of the parallel-plate plastometerfor the characterization of viscous fluids with a yield stress. Journal of non-Newtonian fluid mechanics, 8(3-4):249–260.
Craig, R. (1987). Soil mechanics. Van Nostrand Reinhold, Wakingham.
Debacker, W. (2009). Modelleren van vochttransport tussen baksteen en mortel aande hand van X-stralen-metingen. MEng thesis, Katholieke universiteit Leuven.
Degrande, G. and Vandepitte, D. (2007). Elasticiteits- en plasticiteitsleer. Deel II:Plasticiteit (course notes). Acco, Leuven.
Derluyn, H., Janssen, H., and Carmeliet, J. (2009). Capillary transport across theinterface brick - mortar in masonry. submitted for publication.
Dhaene, P. and Mewis, J. (1994). Rheological characterization of bimodal colloidaldispersions. Rheologica acta, 33:165–174.
BIBLIOGRAPHY 201
Djelal, C. (2001). Designing and perfecting a tribometer for the study of frictionof a concentrated clay-water mixture against a metallic surface. Materials andStructures, 34:51–58.
Dullaert, K. (2005). Constitutive equations for thixotropic dispersions. Phd thesis,Katholieke universiteit Leuven.
Duran, J. (2000). Sands, powders, and grains: an introduction to the physics ofgranular materials. Springer, New York.
Ecole d’Avignon, n. (2005). Techniques et pratique de la chaux. Eyrolles, Paris.
Ecole de León, n. (2004). La chaux et le stuc. guide pratique. Eyrolles, Paris.
Elert, K., Rodriguez-Navarro, C., Sebastian, E., and Hansen, A. (2002). Limemortars for the conservation of historic buildings. Studies in conservation,47(1):62–75.
Elsen, J. (1998). Influence of brick microstructure on the characteristics of cementmortars. In Baer, N., Fitz, S., and Livingston, R., editors, Conservation ofhistoric brick structures, pages 173–178. Donhead, Shaftesbury.
EMIO, n. (2000). EMOdico. Technical dictionary, volume 2. European MortarIndustry Organisation.
Emley, W. (1917). Instruments for measuring plasticity. Transaction of theAmerican ceramic society, 19:523–533.
Emley, W. (1920). Measurement of plasticity of mortars and plasters. Technicalreport, Department of commerce. Governing printing office.
Engmann, J., Servais, C., and A.S., B. (2005). Squeeze flow theory and applicationsto rheometry: a review. Journal of non-Newtonian fluid mechanics, 132:1–27.
Farris, R. (1968). Prediction of the viscosity of multimodal suspensions fromunimodal viscosity data. Transactions of the society of rheology, 12(2):281–301.
Flatt, R. and Bowen, P. (2003). Electrostatic repulsion between particles in cementsuspensions: domain of validity of linearized poisson-boltzmann equation fornonideal electrolytes. Cement and concrete research, 33(6):781–791.
Flatt, R. and Bowen, P. (2006). Yodel: A yield stress model for suspensions.Journal of the American ceramic society, 89(4):1244–1256.
Flatt, R., Larosa, D., and Roussel, N. (2006). Linking yield stress measurements:Spread test versus viskomat. Cement and concrete research, 36(1):99–109.
Flatt, R. J., Martys, N., and Bergstrom, L. (2004). The rheology of cementitiousmaterials. Mrs Bulletin, 29(5):314–318.

202 BIBLIOGRAPHY
Getty conservation institute, n. (2003). Preservation of lime mortars and plasters.GCI project bibliographies. Getty conservation institute, Los Angeles.
Giorgi, R., Dei, L., Ceccato, M., Schettino, C., and Baglioni, P. (2002).Nanotechnologies for conservation of cultural heritage: paper and canvasdeacidification. Langmuir, 18:8198–8203.
Godbey, R. and Thomson, M. (2002). Emley plasticity testing: first steps to aprecision and bias statement. In Throop, D. and Klingner, R., editors, Masonry:opportunities for the 21st century, pages 61–72. ASTM, West Conshohocken.
Golaszewski, J. (2004). Influence of superplasticizers on rheological behaviour offresh cement mortars. Cement and concrete research, 34(2):235–248.
Gondret, P. and Petit, L. (1997). Dynamic viscosity of macroscopic suspensions ofbimodal sized solid spheres. Journal of rheology, 41(6):1261–1274.
Green, K., Carter, M., Hoff, W., and Wilson, M. (1999). The effects of lime andadmixtures on the water-retaining properties of cement mortars. Cement andconcrete research, 29:1743–1747.
Grimm, C. (1982). Water permeance of masonry walls: a review of the literature.ASTM Masonry: materials, properties and performance, 778.
Grimm, C. and Houston, J. (1975). Structural significance of brick water absorption.ASTM STP, 589:272–289.
Groot, C. (1993). Effects of water on mortar-brick bond. PhD thesis, Technischeuniversiteit Delft.
Groot, C. and Larbi, J. (1999). The influence of water flow (reversal) on bondstrength development in young masonry. Heron, 44(2):63–78.
Hall, C. and Hoff, W. (2002). Water transport in brick, stone and concrete. Spon,London.
Hanley, R. and Pavía, S. (2008). A study of the workability of natural hydrauliclime mortars and its influence on strength. Materials and structures, 41:373–381.
Hansen, E., Rodríguez-Navarro, C., and Van Balen, K. (2008). Lime putties andmortars. insights into fundamental properties. Studies in conservation, 53:9–23.
Heirman, G., Hendrickx, R., Vandewalle, L., Van Gemert, D., Feys, D., De Schutter,G., Desmet, B., and Vantomme, J. (2009). Integration approach of thecouette inverse problem of powder type self-compacting concrete in a wide-gap concentric cylinder rheometer: Part ii. influence of mineral additions andchemical admixtures on the shear thickening flow behaviour. Cement and concreteresearch, 39(3):171–181.

BIBLIOGRAPHY 203
Hendrickx, R. (2008). Summary of experimental work 2005-2008. Technical report,Katholieke universiteit Leuven.
Hendrickx, R., Schueremans, L., Verstrynge, E., Van Balen, K., and Van Gemert,D. (2008a). Effect of mortar type and workmanship on the behaviour of masonryunder uniaxial compression. In Masia, M., Tutoev, Y., Page, A., and Sugo, H.,editors, 14th international brick and block masonry conference, volume cd-rom,Sydney.
Hendrickx, R., Van Balen, K., and Van Gemert, D. (2008b). Assessing workabilityof mortars by means of rheological parameters and desorptivity. In D’Ayala,D. and Fodde, E., editors, Structural analyis of historic construction, volume 2,pages 973–980, Bath. Taylor and Francis.
Hens, H. (2000). Bouwfysica 1. Warmte- en massatransport. Acco, Leuven.
Hetsroni, G. (1982). Handbook of multiphase systems. McGraw-Hill, London.
Hibbeler, R. (2008). Mechanics of materials. Pearson Prentice Hall, Upper SaddleRiver, New Jersey, 7th edition.
Hiemenz, P. and Rajagopalan, R. (1997). Principles of colloid and surface chemistry.Marcel Dekker, Basel, 2nd edition.
Holmes, M., Fink, G., and Mathers, F. (1922). Fundamental properties ofcommercial limes ii, the settling of milk of lime suspensions. Chemical andmetallurgical engineering, 27(25):1212–1216.
Janssen, H., Derluyn, H., and Carmeliet, J. (2007). Moisture transfer throughmortar joinst: interface resitances or hygric property changes? In 12th Symposiumfor building physics, volume 2, pages 808–815, Dresden.
Jarny, S., Roussel, N., Le Roy, R., and Coussot, P. (2008). Modelling thixotropicbehavior of fresh cement pastes from mri measurements. Cement and concreteresearch, 38:616–623.
Kaci, A., Chaouche, M., Andréani, P.-A., and Brossas, H. (2009). Rheologicalbehaviour of render mortars. Applied Rheology, 19(1):13794/1–13794/8.
Kampff, L. (1961). Workability of masonry mortars. Materials research andstandards, 1(1):7–8.
Kaplan, D. (2001). Pompage des bétons. PhD thesis, Ecole nationale des ponts etchaussées.
Kauppi, A., K.M., A., and Bergström, L. (2005). Probing the effect ofsuperplasticizer adsorption on the surface forces using the colloidal probe afmtechnique. Cement and concrete research, 35:133–140.

204 BIBLIOGRAPHY
Knapen, E. (2007). Microstructure formation in cement mortars modified withwater-soluble polymers. PhD thesis, Katholieke universiteit Leuven.
Kutilek, M. and Nielsen, D. (1994). Soil hydrology. Catena, Cremlingen-Destedt.
Kwan, A. and Wong, H. (2008). Effects of packing density, excess water andsolid surface area on flowability of cement paste. Advances in cement research,20(1):1–11.
Laüger, J., Mueller, M., and Thyrach, J. (1999). A new ball measuringsystem for large particle suspensions. Applied rheology - product information,19(July/August):145–147.
Lambotte, H. (s.d.). Wetenschappelijke betonsamenstelling. Beroepsvormingscen-trum voor betontechnologie, Kraainem.
Lancellotta, R. (1995). Geotechnical engineering. Balkema, Rotterdam.
Landman, K. A., Stankovich, J., and White, L. (1999). Measurement of the filtrationdiffusivity d(phi) of a flocculated suspension. AIChE Journal, 45(9):1875–1882.
Larson, R. (1999). The structure and rheology of complex fluids. Oxford UniversityPress, Oxford.
Lidell, P. and Boger, D. (1996). Yield stress measurements with the vane. Journalof non-Newtonian fluid mechanics, 63:235–261.
Lings, M. and Dietz, M. (2004). An improved direct shear apparatus for sand.Géotechnique, 54(4):245–256.
Lootens, D., Hébraud, P., Lécolier, E., and Van Damme, H. (2004). Gelation,shear-thinning and shear-thickening in cement slurries. Oil and gas science andtechnology - Rev. IFP, 59(1):31–40.
Lootens, D., Van Damme, H., Hémar, Y., and Hébraud, P. (2005). Dilatantflow of concentrated suspensions of rough particles. Physical review letters,95(26):268302–268305.
Macosko, C. (1994). Rheology : principles, measurements, and applications. VCH,New York.
Mansoutre, S. (1999). Water retention and granular rheological behavior of freshC3S paste as a function of concentration. Cement and concrete research, 29:1441–1453.
Meeten, G. (2004). Squeeze flow of soft solids between rough surfaces. Rheologicaacta, 43(1):6–16.

BIBLIOGRAPHY 205
Mewis, J. and Wagner, N. (2009). Thixotropy. Advances in colloid and interfacescience, 147:214–227.
Müller, M. (2000). Reducing the cost of lime cement plaster by selecting appropriatemethylcellulose combinations. Technical Report an99072e-b, Anton Paar.
Moller, P., Mewis, J., and Bonn, D. (2006). Yields stress and thixotropy: on thedifficutly of measuring yield stresses in practice. Soft matter, 2:274–283.
Montgomery, D. and Runger, G. (1994). Applied statistics and probability forengineers. John Wiley and Sons, New York.
Murata, J. (1984). Flow and deformation of fresh concrete. Materials and structures,17:117–129.
Naniwa, R. (1983). Application du mortier en monocouche épaisse à la constructionet à la reparation. In Proceedings of the 9th CIB Congress, volume 2, pages565–577, Stockholm.
Noor, M. and Uomoto, T. (2004). Rheology of high flowing mortar and concrete.Materials and structures, 37(272):513–521.
Nuth, M. and Laloui, L. (2008). Advances in modelling hysteretic water retentioncurve in deformable soils. computers and geotechnics, 35:835–844.
Oates, J. (1998). Lime and limestone: chemistry and technology, production anduses. Wiley, New York.
Onoda, G. and Liniger, E. (1990). Random loose packings of uniform spheres andthe dilatancy onset. Physical review letters, 64(22):2727–2730.
Ovarlez, G., Bertrand, F., and Rodts, S. (2006). Ecoulement de suspensionsconcentrées: détermination locale de la loi de comportement. In 41ième colloqueannuel du GFR. Rhéologie des suspensions de l’environnement et de l’industrie,pages 103–106, Cherbourg. GFR.
Pashias, N. and Boger, D. (1996). A fifty cent rheometer for yield stressmeasurement. Journal of rheology, 40(6):1179–1189.
PCA (2004). Masonry mortars. Technical report, Portland cement association.
Pérez-Foguet, A., Ledesma, A., and Huerta, A. (1999). Analysis of the vanetest considering size and time effects. International journal for numerical andanalytical methods in geomechanics, 23:383–412.
Pfeffermann, O. (1999). Dragend metselwerk. Ontwerp, berekening en uitvoeringvolgens Eurocode 6. Kluwer, Diegem.

206 BIBLIOGRAPHY
Plantard, G., Saadaoui, H., Snabre, P., and Pouligny, B. (2006). Ségrégation entresphères lisses et rugueuses dans une boue en écoulement. In 41ième colloqueannuel du GFR. Rhéologie des suspensions de l’environnement et de l’industrie,pages 111–114. GFR, Cherbourg.
Poupeleer, A.-S. (2007). Transport and crystallization of dissolved salts in crackedporous media. PhD thesis, Katholieke universiteit Leuven.
Quemada, D. (2006). Modélisation rhéologique structurelle. Dispersions concentréeset fluides complexes. Lavoisier, Paris.
Rajgelj, S. (1985). Cohesion aspects in rheological behaviour of fresh cementmortars. Materials and structures, 18(2):109–114.
Rajkai, K., Kabos, S., and Van Genuchten, M. (2004). Estimating the waterretention curve from soil properties: comparison of linear, nonlinear andconcomitant variable methods. Soil and tillage research, 79:145–152.
Rezeau, M. (2008). Rheological measurements on binder pastes. Technical report,Katholieke universiteit Leuven.
RILEM (1978). TC MR-13 on mortars and rendering. Tentitative recommendation.Materials and structures 11(63): 207-216.
RILEM (2009). TC 203-RHM Test methods for repair mortars for older masonry.Draft version.
Rodriguez-Navarro, C., Cazalla, O., Elert, K., and Sebastian, E. (2002). Liesegangpattern development in carbonating traditional lime mortars. Proceedings ofthe Royal Society of London Series a-Mathematical Physical and EngineeringSciences, 458(2025):2261–2273.
Rodriguez-Navarro, C., Hansen, E., and Ginell, W. S. (1998). Calcium hydroxidecrystal evolution upon aging of lime putty. Journal of the American ceramicsociety, 81(11):3032–3034.
Rodriguez-Navarro, C., Ruiz-Agudo, E., Ortega-Huertas, M., and Hansen, E. (2005).Nanostructure and irriversible colloidal behavior of Ca(OH)2: Implications incultural heritage conservation. Langmuir, 21(24):10948–10957.
Roels, S. and Carmeliet, J. (2006). Analysis of moisture flow in porous materialsusing microfocus x-ray radiography. International journal of heat and masstransfer, 49:4762–4772.
Roussel, N. (2005). Steady and transient flow behaviour of fresh cement pastes.Cement and concrete research, 35:1656–1664.
Roussel, N. and Coussot, P. (2005). “fifty-cent rheometer” for yield stressmeasurements: from slump to spreading flow. Journal of rheology, 49(3):705–718.

BIBLIOGRAPHY 207
Roussel, N., Lanos, C., and Toutou, Z. (2006). Identification of bingham fluidflow parameters using a simple squeeze test. Journal of non-Newtonian fluidmechanics, 135:1–7.
Roussel, N. and Le Roy, R. (2005). The marsh cone: a test or a rheologicalapparatus? Cement and concrete research, 35:823–830.
Roussel, N., Stefani, C., and Leroy, R. (2005). From mini-cone test to abramscone test: measurement of cement-based materials yield stress using slump tests.Cement and concrete research, 35:817–822.
Ruíz-Agudo, E. and Rodriguez-Navarro, C. (2008a). Effects of additives on limeputty rheology: applications in the design of mortars for conservation purposes.In Historical mortars conference, volume cd-rom, Lisbon.
Ruíz-Agudo, E. and Rodriguez-Navarro, C. (2008b). Rheology and microstructure oflime putty: implications for conservation purposes. In IX Congreso internacionalde rehabilitacion del patrimonio arquitectonico y edificacion, pages 153–158,Sevilla.
Saak, A., Jennings, H., and Shah, S. (2001). The influence of wall slip on yieldstress and viscoelastic measurements of cement paste. Cement and concreteresearch, 31:205–212.
Saak, A., Jennings, H., and Shah, S. (2004). A generalized approach for thedetermination of yield stress by slump and slump flow. Cement and concreteresearch, 34:363–371.
SBR (1985). Eigenschappen van metselmortels. Rotterdam.
Schowalter, W. and Christensen, G. (1998). Towards a rationalization of the slumptest for fresh concrete: comparison of calculations and experiments. Journal ofrheology, 42(2):865–870.
Schueremans, L. and Van Gemert, D. (2006). Probability density functions formasonry material parameters - a way to go? In Lourenço, P. B., Roca, P., Modena,C., and Agrawal, S., editors, Structural analysis of historical constructions,volume 2, pages 921–928, New Delhi.
Seabra, M., Labrincha, J., and Ferreira, V. (2007). Rheological behaviourof hydraulic lime-based mortars. Journal of the European Ceramic Society,27(2):1735–1741.
Sébaïbi, Y., Dheilly, R., and Quéneudec, M. (2003). Study of the water-retentioncapacity of a lime-sand mortar: influence of the physicochemical characteristicsof the lime. Cement and concrete research, 33:689–696.

208 BIBLIOGRAPHY
Shapiro, A. P. and Probstein, R. F. (1992). Random packings of spheres and fluiditylimits of monodisperse and bidisperse suspensions. Physical review letters, 68(9).
Sherwood, J. (2002). Liquid-solid relative motion during squeeze flow of pastes.Journal of non-Newtonian fluid mechanics, 104:1–32.
Sherwood, J. (2005). Liquid-solid motion during slow squeeze flow of pastes. Journalof non-Newtonian fluid mechanics, 128:163–171.
Sherwood, J. D. and Durban, D. (1996). Squeeze flow of a power-law viscoplasticsolid. Journal of non-Newtonian fluid mechanics, 62(1):35–54.
Smiles, D. and Kirby, J. (1994). Dewatering of sodium bentonite using a dryplaster-of-paris mould. Chemical engineering science, 49(22):3711–3717.
Smiles, D. E. (1970). A theory of constant pressure filtration. Chemical engineeringscience, 25(6):985–996.
Spielman, L. (1975). Flow through porous media and fluid-particle hydrodynamics.In Ives, K., editor, The scientific basis of filtration, pages 129–166. Noordhoff,Leiden.
Stark, J. and Wicht, B. (2000). Zement und Kalk: der Baustoff als Werkstoff.Birkhaüser, Basel.
Strotmann, R. and Jägers, E. (2000). Das neue alte bindemittel dispergiertesweisskalkhydrat - entwicklung, herstellung, mechanismen. In DispergiertesWeisskalkhydrat, pages 25–34. Michael Imhof, Petersberg.
Struble, L. and Sun, G.-K. (1995). Viscosity of portland cement paste as a functionof concentration. Advanced cement based materials, 2:62–69.
Sudduth, R. (1993). A generalized model to predict the viscosity of solutions withsuspended particles. iii. effects of particle interaction and particle size distribution.Journal of applied polymer science, 50:123–147.
Thomson, M. (2000). Plasticity, water retention, soundness and sand carryingcapacity: what a mortar needs. In Bartos, P., Groot, C., and Hughes, J., editors,International RILEM workshop on historic mortars: characterisation and tests,pages 163–172. RILEM, Paisley, Scotland.
Thomson, M. (2005). Why is type S lime special? In International Building LimeSymposium, volume cd-rom, Orlando.
Toutou, Z., Roussel, N., and Lanos, C. (2005). The squeezing test: a tool to identifyfirm cement-based material’s rheological behaviour and evaluate their extrusionability. Cement and concrete research, 35(10):1891–1899.

BIBLIOGRAPHY 209
Tresouthick, S., Dubovoy, V., and Gajda, J. (1993). Mortar workability apparatus:a new approach. Cement, concrete and aggregates, 15(1):89–92.
Van Balen, K., Van Bommel, B., Van Hees, R., Van Hunen, M., Van Rhijn, J., andVan Rooden, M. (2003). Kalkboek: Het gebruik van kalk als binmiddel voor metsel-en voegmortels in verleden en heden. Rijksdienst voor de Monumentenzorg, Zeist.
Van Balen, K. and Van Gemert, D. (1990). Kalk in metselmortel. studie vande invloed van kalk op metselmortel. Technical report, Katholieke universiteitLeuven.
Van Balen, K. and Van Gemert, D. (1991). Kalk in metselmortel. over het metenvan verwerkbaarheid en hechting en over de invloed van luchtbelvormers ensuperplastifieerders. voorlopig rapport. Technical report, Katholieke universiteitLeuven.
Van Genuchten, T. (1980). A closed-form equation for predicting the hydraulicconductivity of unsaturated soils. Soil science society of America journal,44(5):892–898.
Vermant, J. (2005). Toegepaste reologie (course notes H160). VTK, Leuven.
Vermeir, K. (2007). Het opstellen van een geschikt reologisch model voorinjectiegrouts. MEng thesis, Katholieke universiteit Leuven.
Vermeltfoort, A. (2005). Brick-mortar interaction in masonry under compression.PhD thesis, Technische universiteit Eindhoven.
Vogel, R. (2006). Fliesskurven von selbst-verdichtendem beton. zielvorgaben undfliessmodelle. In Greim, M. and Taubert, O., editors, Rheologische Messungenan mineralischen Baustoffmischungen, volume oral presentation, Regensburg.
Vávrová, P. and Kotlík, P. (2004). Study of lime putty’s characteristics. InGreim, M. and Taubert, O., editors, Rheologische Messungen an mineralischenBaustoffmischungen, volume oral presentation, Regensburg.
Wallevik, J. (2003). Rheology of particle suspensions. fresh concrete, mortar andcement paste with various types of lignosulfonates. PhD thesis, NorwegianUniversity of Science and Technology.
Wallevik, J. (2005). Thixotropic investigation on cement paste: experimental andnumerical approach. Journal of non-Newtonian fluid mechanics, 132:86–99.
Westra, J. (1973). Metselen: leer het zelf. Zomer en Keuning, Wageningen, 4thedition.
Wierenga, A. and Philipse, A. (1998). Low-shear viscosity of isotropic dispersionsof (brownian) rods and fibres; a review of theory and experiments. Colloids andsurfaces A, 137:355–372.

210 BIBLIOGRAPHY
Wollny, K. (2001). New rheological test method to determine the dewateringkinetics of suspensions. Applied rheology, 11(2):197–202.
Yammine, J., Chaouche, M., Guerinet, M., Moranville, M., and Roussel, N. (2008).From ordinary rheology concrete to self compacting concrete: A transitionbetween frictional and hydrodynamic interactions. Cement and concrete research,38(7):890–896.

List of publications
Articles in internationally reviewed scientific journals
Hendrickx, R., Rezeau, M., Van Balen, K., and Van Gemert, D. (2009). Mortarand paste rheology: concentration, polydispersity and air entrapment at high solidfraction. Applied Rheology (accepted for publication, to appear as 19 (2009) 52550).
Heirman, G., Hendrickx, R., Vandewalle, L., Van Gemert, D., Feys, D., De Schutter,G., Desmet, B., and Vantomme, J. (2009). Integration approach of the Couetteinverse problem of powder-type self-compacting concrete in a wide-gap concentriccylinder rheometer Part II. Influence of mineral additions and chemical admixtureson the shear thickening flow behaviour of powder type self-compacting concrete.Cement and concrete research, 39(3):171-181.
Hendrickx, R., Van Balen, K., and Van Gemert, D. (2009). The workabilityof masonry mortar assessed by masons. International journal for restoration ofbuildings and monuments, 15(1):39-50.
Papers at international conferences and symposia, published infull in proceedings
Hendrickx, R., Van Balen, K., Van Gemert, D., and Roels, S. (2009). Measuringand modelling water transport from mortar to brick. In Schueremans, L., editor,Building materials and building technology to preserve the built heritage (WTAreport series 33, Leuven, 8-9 October 2009, volume 1, pages 175-194. WTA,München.
Schueremans, L., Verstrynge, E., Silva, R., Oliveira, D., Hendrickx, R., Bruyninckx,K., and Van Gemert, D. (2009). Research developments at K.U.Leuven fordiagnostics and restoration of historical masonry, In Garrecht, H., and Leimer, H.,editors, 31th WTA-Tag, Darmstadt, 12-13 March 2009, pages 124-144. WTA.
211

212 LIST OF PUBLICATIONS
Hendrickx, R., Van Balen, K., and Van Gemert, D. (2009). Yield stressmeasurement of mortar using geotechnical techniques. In Wallevik, O.H., Kubens,S., and Oesterheld, S. editors, 3rd International RILEM symposium on rheology ofcement suspensions such as fresh concrete, Reykjavik, 19-21 August 2009, pages273-282. RILEM, Bagneux.
Hendrickx, R., Van Balen, K., and Van Gemert, D. (2008). Assessing workability ofmortars by means of rheological parameters and desorptivity. In D’Ayala, D., andFodde, E. editors, 6th Conference on Structural analysis of historical constructions,Bath, 2-4 July, volume 2, pages 973-979. CRC, London.
Van Balen, K., and Hendrickx, R. (2008). Preservation of workmanship orworkmanship for preservation. In D’Ayala, D., and Fodde, E. editors, 6th Conferenceon Structural analysis of historical constructions, Bath, 2-4 July, volume 1, pages3-12. CRC, London.
Hendrickx, R., Schueremans, L., Verstrynge, E., Van Balen, K., and Van Gemert,D. (2008). Effect of mortar type and workmanship on the behavior of masonryunder uniaxial compression. In Masia, M., Totoev, Y., Page, A., and Sugo, H.editors, 14th International Brick and Block Masonry Conference, Sydney, 17-20February 2008, volume cd-rom.
Hendrickx, R., Minet, J., Van Balen, K., and Van Gemert, D. (2008). Workabilityof mortars with building lime: assessment by a panel of masons versus lab testing.In Masia, M., Totoev, Y., Page, A., and Sugo, H. editors, 14th International Brickand Block Masonry Conference, Sydney, 17-20 February 2008, volume cd-rom.
Presentations at international conferences and symposia, pub-lished online
Hendrickx, R., Bruyninckx, K., Schueremans, L., Kerckhofs, G., Verstrynge, E.,Wevers, M., and Van Balen, K. (2009). Observation of the failure mechanismof brick masonry doublets with cement and lime mortars by X-ray CT. InMicrofocus X-ray computed tomography in materials research, Leuven, 9 June2009. http://www.mtm.kuleuven.be/Research/NDT/MicrofocusCT.
Hendrickx, R., Van Balen, K., Van Gemert, D., and Minet, J. (2006). Workabilityand rheology of lime-based mortars. In 15. Kolloquium und Workshop überRheologische Messungen an mineralischen Baustoffen, Regensburg, 8-9 March 2006.http://www.schleibinger.com/k2006.

LIST OF PUBLICATIONS 213
Papers at local conferences and symposia, published in full inproceedings
Hendrickx, R., Van Balen, K., Van Gemert, D., and Roels, S. (2007). Metselen metnatte of droge stenen? Experimentele bepaling van watertransport tussen voeg enbaksteen. In : Mooi bedacht, nuttig toegepast, Brussels, 28 November 2007. pages179-184. KVIV - WTCB.


Arenberg Doctoral School of Science, Engineering & TechnologyFaculty of Engineering
Department of Civil Engineering
Building Materials and Building Technology
Kasteelpark Arenberg 40 B-3001 Heverlee