Thailand's low-carbon scenario 2030: Analyses of demand side CO 2 mitigation options
7
Thailand's low-carbon scenario 2030: Analyses of demand side CO 2 mitigation options Pornphimol Winyuchakrit a , Bundit Limmeechokchai a, ⁎, Yuzuru Matsuoka b , Kei Gomi b , Mikiko Kainuma c , Junichi Fujino c , Maiko Suda c a Sirindhorn International Institute of Technology, Thammasat University, P.O. Box 22 Thammasat Rangsit Post Office, Patumthani 12121, Thailand b Graduate School of Engineering, Kyoto University, Katsura, Nishikyo-ku, Kyoto 615–8510, Japan c National Institute for Environmental Studies, 16–2 Onogawa, Tsukuba 305–8506, Japan abstract article info Article history: Received 4 October 2010 Revised 27 September 2011 Accepted 27 September 2011 Available online 22 October 2011 Keywords: CO 2 emissions Low carbon society Energy efficiency ExSS model GHG mitigation measures This paper presents the possibility for Thailand to become a low-carbon society (LCS). The methodology involves development of current CO 2 emission inventory, and quantification of socio-economic activity level in 2030. In this study, the increase of CO 2 emissions is estimated based on i) 2030 BAU (business-as- usual) without mitigation measures, and ii) 2030 CM (climate change mitigation measures) assumptions of employed demand-side technologies as well as the potential to reduce the CO 2 emissions by low-carbon measures available during 2005–2030. In this study, only selected climate change mitigation options, which have been found to be cost effective, are included in the 2030 CM scenario. Several comprehensive demand-side measures such as diffusion of low-carbon technologies in the residential sector, energy efficient buildings, energy efficient industry and fuel switching, and fuel substitution in the transport sector are proposed. Results show that i) the annual CO 2 emissions in the base year of 2005 are 185,983 kilo-ton (kt) of CO 2 , ii) under the scenario without climate change mitigation measures (the BAU scenario), year 2030 CO 2 emissions would increase to 563,730 kt-CO 2 or 3.03 times that of the base year 2005, and iii) by adopting the selected climate change mitigation measures, CO 2 emissions can be decreased approximately 28.4% compared to the 2030 BAU scenario, i.e. to 403,642 kt-CO 2 . The research findings hope to contribute to sustainable energy and environmental transition of Thailand, one of the fastest growing economies in Southeast Asia, towards a Thai low carbon society. © 2011 International Energy Initiative. Published by Elsevier Inc. All rights reserved. Introduction A low-carbon society (LCS) or low-fossil-fuel economy is a concept that refers to an economy which has a minimal output of greenhouse gas (GHG) emissions into the biosphere, but specifically refers to the greenhouse gas carbon dioxide. The increased concentration of these gases is producing global warming that affects long-term climate, with negative impacts on humanity in the foreseeable future. Due to human behavior, the global energy use and CO 2 emission patterns will increase. Thus, the society will adopt energy efficient devices and renewable en- ergy technologies to reduce energy consumption and CO 2 emissions. Globally implemented climate change mitigation measures, therefore, are proposed as a means to avoid catastrophic climate change, and as a precursor to the more advanced, zero-carbon society and renewable- energy economy. However, this LCS concept for developing countries such as Thailand would be different from the developed countries, having lower per capita emissions and low emissions per GDP. An LCS should consider: 1) the compatible actions of sustainable development from all groups of the society; 2) an equitable contribution towards the global effort to stabilize CO 2 concentration in the atmosphere; 3) a high level of energy efficiency and use low-carbon energy sources; and 4) patterns of consumption and behavior with low levels of GHG emissions (Skea and Nishioka, 2008). These considerations of the LCS study need to be investigated to understand the long-term global mitigation target in the countries and sectors. The key issues include the development of new technologies and the role of behavioral change in emission reduction (Strachan et al., 2008). Nevertheless, this study would provide opportunities for Thailand to decide the future energy scenario, related technologies and energy efficiency. At present, Thailand faces challenges in energy–environment– economic development with limited resources availability, minimum environmental impact, and global climate change. One of the approaches to overcome this development paradox is through adoption of a sustainable development paradigm. The LCS framework should also look at opportunities of co-benefits apart from direct GHG emission reduction. Such co-benefits, like improved local air quality in Energy for Sustainable Development 15 (2011) 460–466 ⁎ Corresponding author. E-mail address: [email protected] (B. Limmeechokchai). 0973-0826/$ – see front matter © 2011 International Energy Initiative. Published by Elsevier Inc. All rights reserved. doi:10.1016/j.esd.2011.09.002 Contents lists available at SciVerse ScienceDirect Energy for Sustainable Development
Transcript of Thailand's low-carbon scenario 2030: Analyses of demand side CO 2 mitigation options

Energy for Sustainable Development 15 (2011) 460–466
Contents lists available at SciVerse ScienceDirect
Energy for Sustainable Development
Thailand's low-carbon scenario 2030: Analyses of demand side CO2
mitigation options
Pornphimol Winyuchakrit a, Bundit Limmeechokchai a,⁎, Yuzuru Matsuoka b, Kei Gomi b, Mikiko Kainuma c,Junichi Fujino c, Maiko Suda c
a Sirindhorn International Institute of Technology, Thammasat University, P.O. Box 22 Thammasat Rangsit Post Office, Patumthani 12121, Thailandb Graduate School of Engineering, Kyoto University, Katsura, Nishikyo-ku, Kyoto 615–8510, Japanc National Institute for Environmental Studies, 16–2 Onogawa, Tsukuba 305–8506, Japan
⁎ Corresponding author.E-mail address: [email protected] (B. Limmeech
0973-0826/$ – see front matter © 2011 International Endoi:10.1016/j.esd.2011.09.002
a b s t r a c t
a r t i c l e i n f oArticle history:Received 4 October 2010Revised 27 September 2011Accepted 27 September 2011Available online 22 October 2011
Keywords:CO2 emissionsLow carbon societyEnergy efficiencyExSS modelGHG mitigation measures
This paper presents the possibility for Thailand to become a low-carbon society (LCS). The methodologyinvolves development of current CO2emission inventory, and quantification of socio-economic activitylevel in 2030. In this study, the increase of CO2 emissions is estimated based on i) 2030 BAU (business-as-usual) without mitigation measures, and ii) 2030 CM (climate change mitigation measures) assumptionsof employed demand-side technologies as well as the potential to reduce the CO2 emissions by low-carbonmeasures available during 2005–2030. In this study, only selected climate change mitigation options,which have been found to be cost effective, are included in the 2030 CM scenario. Several comprehensivedemand-side measures such as diffusion of low-carbon technologies in the residential sector, energy efficientbuildings, energy efficient industry and fuel switching, and fuel substitution in the transport sector areproposed. Results show that i) the annual CO2 emissions in the base year of 2005 are 185,983 kilo-ton (kt)of CO2, ii) under the scenario without climate change mitigation measures (the BAU scenario), year 2030CO2 emissions would increase to 563,730 kt-CO2 or 3.03 times that of the base year 2005, and iii) by adoptingthe selected climate change mitigation measures, CO2 emissions can be decreased approximately 28.4%compared to the 2030 BAU scenario, i.e. to 403,642 kt-CO2. The research findings hope to contribute tosustainable energy and environmental transition of Thailand, one of the fastest growing economies inSoutheast Asia, towards a Thai low carbon society.
© 2011 International Energy Initiative. Published by Elsevier Inc. All rights reserved.
Introduction
A low-carbon society (LCS) or low-fossil-fuel economy is a conceptthat refers to an economy which has a minimal output of greenhousegas (GHG) emissions into the biosphere, but specifically refers to thegreenhouse gas carbon dioxide. The increased concentration of thesegases is producing global warming that affects long-term climate, withnegative impacts on humanity in the foreseeable future. Due to humanbehavior, the global energy use and CO2 emission patterns will increase.Thus, the society will adopt energy efficient devices and renewable en-ergy technologies to reduce energy consumption and CO2 emissions.Globally implemented climate change mitigation measures, therefore,are proposed as a means to avoid catastrophic climate change, and as aprecursor to the more advanced, zero-carbon society and renewable-energy economy.
However, this LCS concept for developing countries such asThailand would be different from the developed countries, having
okchai).
ergy Initiative. Published by Elsevi
lower per capita emissions and low emissions per GDP. An LCS shouldconsider: 1) the compatible actions of sustainable development fromall groups of the society; 2) an equitable contribution towards theglobal effort to stabilize CO2 concentration in the atmosphere; 3) ahigh level of energy efficiency and use low-carbon energy sources;and 4) patterns of consumption and behavior with low levels ofGHG emissions (Skea and Nishioka, 2008). These considerations ofthe LCS study need to be investigated to understand the long-termglobal mitigation target in the countries and sectors. The key issuesinclude the development of new technologies and the role ofbehavioral change in emission reduction (Strachan et al., 2008).Nevertheless, this study would provide opportunities for Thailand todecide the future energy scenario, related technologies and energyefficiency.
At present, Thailand faces challenges in energy–environment–economic development with limited resources availability, minimumenvironmental impact, and global climate change. One of theapproaches to overcome this development paradox is throughadoption of a sustainable development paradigm. The LCS frameworkshould also look at opportunities of co-benefits apart from direct GHGemission reduction. Such co-benefits, like improved local air quality in
er Inc. All rights reserved.

Table 2Estimated socio-economic indicators in 2030.
2005 2030 2030/2005
Population 60,991,000 68,815,004 1.13No. of households 19,016,784 36,265,390 1.91GDP (million Baht) 8,016,595 30,802,306 3.84GDP per capita (Baht/capita) 131,439 447,610 3.41Gross output (million Baht) 18,755,884 68,456,651 3.65
Primary industry (million Baht) 1,116,621 2,801,864 2.51Secondary industry (million Baht) 11,453,496 38,008,931 3.32Tertiary industry (million Baht) 6,185,767 27,645,856 4.47
Floor space for commercial (million m2) 88 394 4.47Passenger transport demand (million p-km) 191,520 216,088 1.13Freight transport demand (million t-km) 188,524 589,859 3.13
461P. Winyuchakrit et al. / Energy for Sustainable Development 15 (2011) 460–466
Thailand, provide an opportunity to minimize social costs. The objec-tives of this study are to present scenarios on the establishment of asustainable LCS in Thailand for climate change mitigation.
Socio-economic indicators of Thailand
In energy demand modeling and CO2 emissions in Thailand in2030, several quantitative assumptions have to be provided (seeTable 1). This study uses the 2005 input–output table from theNational Economic and Social Development Board (NESDB) andsocio-economic data from the National Statistical Office (NSO) withforecasted population and GDP in 2030 to estimate the output ofeconomy in 2030 as shown in Table 2 and Fig. 1 (NESDB, 2010;NSO, 2010).
Methodology
A procedure to create a Thai LCS scenario
In order to create a local LCS scenario, a method based on the idea of“back casting”, which sets a desirable goalfirst in order to determine thedirection of energy and environmental conservation activities and re-form societies and lifestyles based on vision to the future (Gomi et al.,2011), and then seeks a way to achieve it, was developed (Matsuokaet al., 2009). The back casting method is defined as “calculating backto the present from a specific target point in the future”. This is done“to determine the potential for future physical implementation of thattarget and the type of measures that will be needed to arrive at thatpoint” (Robinson, 1990). Fig. 1 shows an overview of the method.
(1) Setting frameworkThe framework of the LCS scenarios consists of a target region,the base year of 2005, the target year of 2030, target activities,low-carbon targets, and number of scenarios (Gomi et al.,2010). In this study, the target year is 2030. As an environmen-tal target, we targeted CO2 from energy use because it will be amain source of CO2 emissions in Thailand in 2030.
(2) Assumptions of socio-economic situationBefore conducting quantitative estimation, a qualitative future
image should be written. It is an image of lifestyle, economyand industry, land use, and so on.(3) Quantification of socio-economic assumptions
To estimate a snapshot based on a future image of (2), values ofexogenous variables and parameters are set. Using those inputs,the socio-economic indices of the target year such as population,GDP, output by industry, and transport demand are estimated forExSS model as shown in Table 1.Table 1Quantitative assumptions of socio-economic indicators in 2030.
Average population growtha 0.49% p.a. increase (2005–2030)Demographiccomposition
0–14: 21.00%, 15–64: 71.34%, 65+: 7.66%
GDP increase byindustryb
Primary industry: approximately 3.90% p.a. increaseSecondary industry: approximately 5.13% p.a. increaseTertiary industry: approximately 6.44% p.a. increase
Exportsb 3.17% p.a. increasePrivate consumptionb 8.44% p.a. increaseGovernmentconsumptionb
3.17% p.a. increase
Modal share in transport [Railway] 12.0%, [buses] 20.0%, [motorcars] 20.0%,[motorcycles] 10.0%,[Walking] 25.0%, [bicycles] 12.0%, [air] 0.2%
Sources:a National Statistical Office(2010).b National Economic and Social Development Board(2010).
(4) Collection of low-carbon measuresClimate change mitigation measures are used which arethought to be available in the target year, for example, highenergy-efficiency devices, transport structure such as publictransport, and use of renewable energy. In this research weemployed themeasures shown in preceding studies in Thailandon energy efficiency improvement and renewable energy utili-zation, and climate change mitigation.
(5) Setting introduction of CO2 mitigation measures
Since there can be various portfolios of climate changemitigationmeasures such as costminimization, ease of acceptance by stake-holders, technical achievability and so on (Utaka et al., 2009).(6) Estimation of CO2 emission in the target year
Based on socio-economic indices and assumption of measures,CO2 emissions are calculated.(7) Proposal of policies
A policy is set to introduce the measures defined. Available poli-cies depend on the situation of themunicipality or the country inwhich it belongs. The model can calculate emission reduction ofeach countermeasure. Therefore, it can show reduction potentialof countermeasureswhich especially need local policy. It can alsoidentify measures which have high reduction potential andtherefore are important.Fig. 1. Procedure to create an LCS scenario.
462 P. Winyuchakrit et al. / Energy for Sustainable Development 15 (2011) 460–466
Extended snapshot tool (ExSS)
The analysis tool used in this study is called the Extended SnapShotTool (ExSS), and is developed by Kyoto University (Gomi et al., 2010).ExSS consists of seven blocks with input parameters, exogenous vari-ables and variables between modules (Matsuoka et al., 2009; Shuklaet al., 2009). ExSS is a system of simultaneous equations. Given a setof exogenous variables and parameters, solution is uniquely defined.In this simulation model, only CO2 emissions from energy consumptionis calculated, even though, ExSS can be used to estimate other GHG andenvironmental loads such as air quality from fuel combustion. In manyLCS scenarios, exogenously fixed population data are used. However,people migrate more easily, when the target region is relatively asmaller area such as a state, district, city or town. Population is decidedby demand from outside of the region, labor participation ratio, demo-graphic composition and relationship of commutingwith the outside ofthe region. To determine output of industries, an input–outputapproach with “export-base approach” is combined in line with thetheory of regional economics.
In this study, industries producing export goods are called “basicindustry”. Production of basic industries induces other industries i.e.non-basic industries, through demand of intermediate input and con-sumption of their employees. The number of workers must fulfilllabor demand of those industries. Given assumptions of wherethose workers live and labor participation ratio, population living inthe region is computed. This model enables us to consider viewpointsof regional economic development to estimate energy demand andCO2 emissions. For future estimation, assumption of export value isespecially important if the target region is thought to develop led bya particular industry, such as automotive manufacturing.
Passenger transport demand is estimated from the population andfreight transport demand, whereby it is a function of output bymanufacturing industries. Floor area of commerce is determinedfrom output of tertiary industries. With driving force and activitylevel of each sector, energy demand by fuels is determined withthree parameters. These parameters are energy service demand perdriving force, energy efficiency and fuel share. Diffusion of countermeasures changes the value of these parameters, and so changesthe GHG emissions.
4,355 2,407
6,151
2,164
7,000
3,565
12,686
572
1,991
6,186
27,646
10,000
20,000
30,000
40,000
50,000
60,000
70,000
80,000
Out
put
(Bil.
Bah
t)
Agriculture
Mining and Quarrying
Construction
Textiles
Food and Beverage
Chemicals
Other industries
Metallic & Machinery
Nonmetallic
Services
68,457
18,756
LCS scenario description
This study develops scenarios for energy demand and CO2 emissionsin 2030 without and with climate change mitigation measures (CM).Scenarios include i) 2005 BAU scenario, ii) 2030 BAU scenario, and iii)2030 CM scenario.
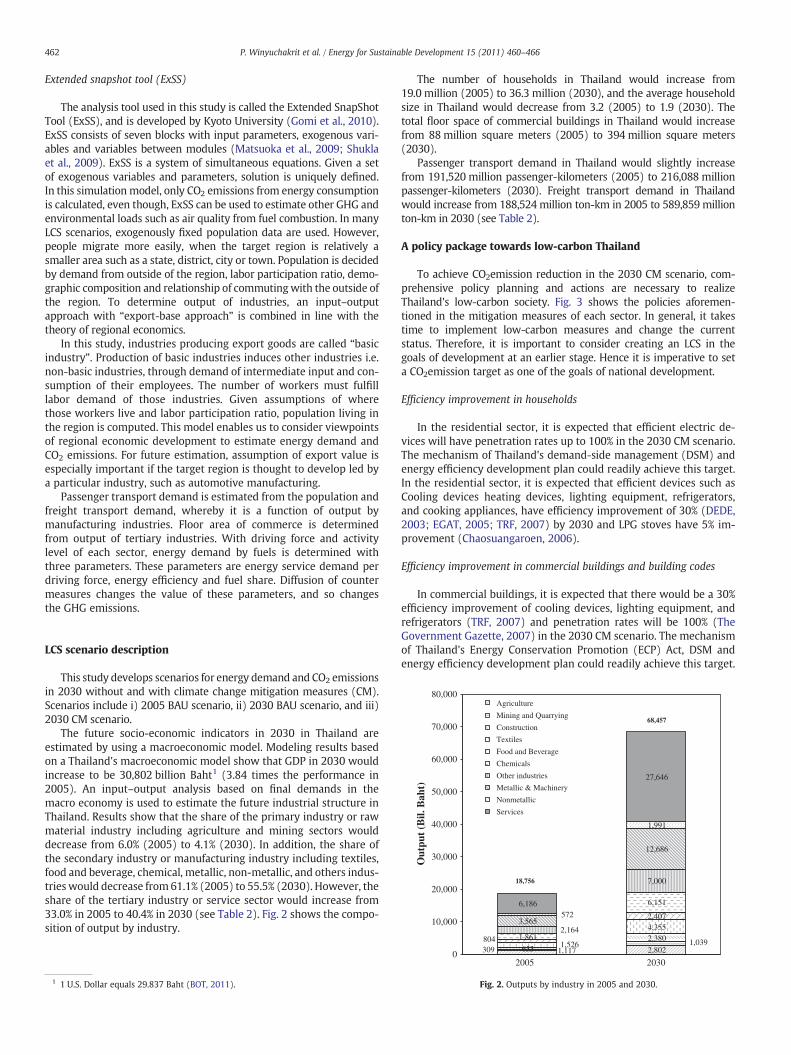
The future socio-economic indicators in 2030 in Thailand areestimated by using a macroeconomic model. Modeling results basedon a Thailand's macroeconomic model show that GDP in 2030 wouldincrease to be 30,802 billion Baht1 (3.84 times the performance in2005). An input–output analysis based on final demands in themacro economy is used to estimate the future industrial structure inThailand. Results show that the share of the primary industry or rawmaterial industry including agriculture and mining sectors woulddecrease from 6.0% (2005) to 4.1% (2030). In addition, the share ofthe secondary industry or manufacturing industry including textiles,food and beverage, chemical, metallic, non-metallic, and others indus-tries would decrease from 61.1% (2005) to 55.5% (2030). However, theshare of the tertiary industry or service sector would increase from33.0% in 2005 to 40.4% in 2030 (see Table 2). Fig. 2 shows the compo-sition of output by industry.
1 1 U.S. Dollar equals 29.837 Baht (BOT, 2011).
The number of households in Thailand would increase from19.0 million (2005) to 36.3 million (2030), and the average householdsize in Thailand would decrease from 3.2 (2005) to 1.9 (2030). Thetotal floor space of commercial buildings in Thailand would increasefrom 88million square meters (2005) to 394 million square meters(2030).
Passenger transport demand in Thailand would slightly increasefrom 191,520 million passenger-kilometers (2005) to 216,088 millionpassenger-kilometers (2030). Freight transport demand in Thailandwould increase from 188,524 million ton-km in 2005 to 589,859 millionton-km in 2030 (see Table 2).
A policy package towards low-carbon Thailand
To achieve CO2emission reduction in the 2030 CM scenario, com-prehensive policy planning and actions are necessary to realizeThailand's low-carbon society. Fig. 3 shows the policies aforemen-tioned in the mitigation measures of each sector. In general, it takestime to implement low-carbon measures and change the currentstatus. Therefore, it is important to consider creating an LCS in thegoals of development at an earlier stage. Hence it is imperative to seta CO2emission target as one of the goals of national development.
Efficiency improvement in households
In the residential sector, it is expected that efficient electric de-vices will have penetration rates up to 100% in the 2030 CM scenario.The mechanism of Thailand's demand-side management (DSM) andenergy efficiency development plan could readily achieve this target.In the residential sector, it is expected that efficient devices such asCooling devices heating devices, lighting equipment, refrigerators,and cooking appliances, have efficiency improvement of 30% (DEDE,2003; EGAT, 2005; TRF, 2007) by 2030 and LPG stoves have 5% im-provement (Chaosuangaroen, 2006).
Efficiency improvement in commercial buildings and building codes
In commercial buildings, it is expected that there would be a 30%efficiency improvement of cooling devices, lighting equipment, andrefrigerators (TRF, 2007) and penetration rates will be 100% (TheGovernment Gazette, 2007) in the 2030 CM scenario. The mechanismof Thailand's Energy Conservation Promotion (ECP) Act, DSM andenergy efficiency development plan could readily achieve this target.
1,117 2,802 309 1,039
653 2,380
1,526 804 1,861
02005 2030
Fig. 2. Outputs by industry in 2005 and 2030.

2
Fig. 3. Policy package for Thailand's low-carbon society vision 2030.
Table 3Expected fuel switching of non-electric devices in industry (DEDE, 2007).
Industry Device Fuel type Penetration in2030 BAU (%)
Penetration in2030 CM (%)
Textiles Boiler Oil 97.73 48.86Gas 2.27 51.14
Food & beverage Boiler Coal 0.50 0.50Oil 1.31 13.10Gas 1.51 1.51Biomass 84.88 84.89
Chemical Boiler Coal 41.36 20.68Oil 24.60 12.30Gas 23.98 23.98Biomass 10.06 43.04
Others Boiler Coal 29.51 14.75Oil 66.00 33.00Biomass 4.49 52.25
Metallic Furnace Coal 0.24 0.24Oil 3.58 3.58Electricity 96.18 96.18
Non metallic Kiln Coal 68.31 34.16Oil 17.91 8.96Biomass 5.92 49.02Electricity 7.86 7.86
9,721 25,986 20,121 3,305
14,771 11,391 25,753
81,189
64,621
7,548
8,516
3,979
11,000
34,402
28,857
0
20,000
40,000
60,000
80,000
100,000
120,000
140,000
160,000
180,000
2005 2030 BAU 2030 CM
Ene
rgy
dem
and
(kto
e)
Residential Commercial Industry Passenger transport Freight transport
Fig. 4. Final energy demand by economic sector.
463P. Winyuchakrit et al. / Energy for Sustainable Development 15 (2011) 460–466
Building envelope focused on the materials to limit heat transferthrough walls (opaque and fenestration) and roofs must complywith Thailand's building codes 2010 (The Government Gazette,2009). Overall efficiency improvement for this measure is expectedto increase 20% after 2010 (TRF, 2008). Therefore the new Thailand'sbuilding codes could readily achieve this target.
Efficiency improvement and fuel switching in industry
Energy consumption in agriculture, mining, and constructionaccounted for only about 6.0% of total energy consumption in thecountry; therefore, it was assumed that the technologies in thesesub-sectors will not be changed while the technologies for energyefficiency improvement in electric devices in textiles, food andbeverage, chemical, others, metallic, and non metallic sub-sectors willbe improved by 10% in motors, 30% in lighting, and 20% in othersequipment with penetration rates of 100% in 2030 (TRF, 2007). Themechanism of Thailand's ECP Act, DSM and energy efficiency develop-ment plan could readily achieve this target. In the non-electric devices,it was assumed that the technologies in agriculture, mining, andconstruction sectors will not be changed while the technologies intextiles, food and beverage, chemical, others, metallic, and non metallicindustries will be improved and switched to lower carbon fuels as pre-sented in Table 3.
Efficiency improvement in the transport sector
i) Fuel economy improvement (FEI). In this action, energy effi-ciency improvement in both the passenger and freight trans-ports such as small vehicles, large vehicles, buses, andmotorcycles increases up to 20% (Pongthanaisawan et al.,2007) in the 2030 CM scenario by using advanced automotive
technologies. In addition, in this action eco-cars in Thailandwill also be promoted with tax reduction and partial subsidyin investment. In addition, environmental performance stan-dard of vehicles is needed.
ii) Fuel switching. In this action, technology of both the passen-ger and freight transports such as small vehicles, large vehi-cles, and buses will switch from oil to compressed naturalgas (CNG). In addition, the technology improvement inCNG engines will increase by 20% (Pongthanaisawan et al.,2007) in the 2030 CM scenario. This action also includeshybrid and plug-in hybrid cars that will substitute for con-ventional gasoline engines, resulting in energy savings of30% (Kuwattanachai, 2009) when compared to the 2030 BAUscenario.
iii) Travel demand management (TDM). In this action, compre-hensive promotion of travel demand management (TDM)in the passenger transport is required. It is estimated thattravel demand in small vehicles, large vehicles, buses, andmotorcycles decreases by 7.4% in the 2030 CM scenario byusing eco-driving, bus priority, and non-motorized transport(Pongthanaisawan et al., 2007). Several studies of Ministryof Energy show that this action does not require any capitalinvestment except the incentives and promotion, and theTDM action is readily cost effective (TRF, 2007).

20,889 55,838 43,085 22,686
101,391 78,188 86,034
276,045
190,183
22,933
25,875
10,719
33,441
104,581
81,468
0
100,000
200,000
300,000
400,000
500,000
600,000
2005 2030 BAU 2030 CM
GH
G e
mis
sion
s (k
t-C
O2)
Residential Commercial Industry Passenger transport Freight transport
Fig. 5. GHG emissions by sector.
464 P. Winyuchakrit et al. / Energy for Sustainable Development 15 (2011) 460–466
iv) Modal shift. In this action, the modal share of passenger transportwill change to be 25.0%, 20.0%, 15.0%, 12.8%, 12.0%, 10.0%, 5.0%, and0.2% by walk, bus, small vehicles, bikes, train, motorcycles, largevehicles, and airplanes, respectively (TRF, 2008). Moreover, themodal share of freight transport will changed only in the large ve-hicle and train. The share of small vehicles, ships, and airplaneswill not be changed. The share of large vehicles will decrease by28.0% and will be substituted by train.
Energy demand and CO2 mitigation potential in 2030
The macro-economic model is used to estimate future energy de-mand and CO2 emissions for the year 2030 based on the scenarioquantification. The estimated results of energy demand and CO2
emissions are presented in Figs. 4 and 5. Table 4 presents final energydemands in 2005 and 2030 developed by using ExSS tool.
In the 2030 BAU scenario, final energy demand would increasefrom 57,327 ktoe in 2005 to 164,863 ktoe in 2030. Final energydemand of the industrial sector is expected to be 81,189 ktoe andwould maintain the largest share of 49.3%, followed by transportsector (42,918 ktoe; 26.0%), and residential and commercial sectors(40,756; 24.7%) in 2030 (see Fig. 4). The primary energy demand in
Table 4Final energy demand by sector (unit: ktoe).
Coal Petroleum Natural gas
2005 ScenarioResidential - 1897 -Commercial - - -Industry 6755 7233 1520Passenger transport - 7,479 44Freight transport - 10,999 1
Total 6755 27,628 1565Share 11.8% 48.2% 2.7%2030 BAU scenario
Residential - 5071 -Commercial - - -Industry 23,217 21,043 4917Passenger transport - 8461 49Freight transport - 34,397 4
Total 23,217 68,972 4971Share 14.1% 41.8% 3.0%2030 CM scenario
Residential - 3940 -Commercial - - -Industry 9353 13,537 5512Passenger transport - 3128 191Freight transport - 26,697 117
Total 9353 47,301 5820Share 7.3% 36.7% 4.5%
Note: The 2030 BAU scenario is a modeling result without any additional measures to improfuel substitution of less CO2 intensive fuel is assumed.
Thailand is projected to increase from 74,845 ktoe in 2005 to226,165 ktoe in 2030. There would be a total of 76,142 ktoe of petro-leum and 73,644 ktoe of natural gas consumed in 2030 in the BAU sce-nario. In 2030, the demand of coal would increase by 3.5 times whencompared to 2005, and the demand for natural gas would increase by3.5 times. Biomass, solar and wind, and hydro energy in the primaryenergy in 2030 climate change mitigation measure (CM) scenariowould be 39,317 ktoe, and account for 21.8% of primary energy supply.
Based on primary energy demand by energy sources, total CO2 emis-sions in the BAU scenario are projected to increase from 185,983 kt-CO2
in 2005 to 563,730 kt-CO2 in 2030. The modeling results also show thatCO2 emissions from industry would be 276,045 kt-CO2 in 2030, andaccounted for 49.0% of total CO2 emissions in 2030. In 2030, CO2
emissions from passenger and freight transport are also found to beabout 2.31 times the amount in 2005, and the share would be 23.1% oftotal CO2 emissions (see Fig. 5). In the BAU scenario, CO2 emissions percapita would increase from 3.05 t-CO2 per capita in 2005 to 8.19 t-CO2
per capita in 2030.In 2030, the model results estimate that total CO2 emissions in
Thailand is to be reduced from 563,730 kt-CO2 in the BAU scenarioto 403,642 kt-CO2 in the climate change mitigation measures (CM)scenario by adoption of measures for mitigating CO2 emissions, andaccount for 28.4% of total CO2 reduction (see Fig. 6). Based on themodel simulation, the reductions of CO2 emissions by types of coun-termeasures are contributed by comprehensive measures.
In the 2030 CM scenario, among the measures, energy efficiencyimprovement in industrial sector accounts for the largest proportionof 53.6% of the total CO2 reductions, followed by efficiency improve-ment in the commercial sector (14.5%), efficiency improvement inthe freight transport sector (14.4%), efficiency improvement in thepassenger transport (9.5%), and efficiency improvement in theresidential sector (8.0%) sector.
Among the categories of climate change mitigation measures, TheThai government should take effective measures in the industrialsector and the transport sector, and help with the penetration of renew-able energy. In order to realize a low-carbon society, Thailand has tohave new and strong policies to encourage and promote these climatechange mitigation measures.
Biomass Solar & wind Electricity Total
5621 - 2203 9721- - 3305 33055332 - 4913 25,753- - 5 7,548- - 0 11,00010,953 - 10,426 57,32719.1% 0.0% 18.2% 100.0%
15,026 - 5889 25,986- - 14,771 14,77116,193 - 15,818 81,189- - 5 8516- - 1 34,40231,219 - 36,484 164,86318.9% 0.0% 22.1% 100.0%
11,649 - 4532 20,121- - 11,391 11,39122,506 - 13,712 64,621549 - 111 39792038 - 5 28,85736,743 - 29,751 128,96828.5% 0.0% 23.1% 100.0%
ve energy efficiency or CO2 intensity. In 2030 CM scenario, higher energy efficiency and

185,983
563,730
403,642
0
100,000
200,000
300,000
400,000
500,000
600,000
2005 2030 BAU 2030 CM
GH
G e
mis
sion
s/re
duct
ions
(kt
-CO
2)Freight transport, 23,114 kt-CO2
Passenger transport, 15,156 kt-CO2
Industry, 85,863 kt-CO2
Commercial, 23,203 kt-CO2
Residential, 12,753 kt-CO2
GHG emissions
Fig. 6. Breakdown of CO2emission reduction potential.
465P. Winyuchakrit et al. / Energy for Sustainable Development 15 (2011) 460–466
Climate change mitigation by sectors
Residential sector
The forecasted population of Thailand in 2030 is 68.8 million. Theenergy demand in the residential sector is determined based on GDP,number of households and population. In 2005, the average house-hold size was 3.2 (3.2 members per household), and it is forecastedto be only 1.9 in 2030. The number of households would increasefrom 19 million in 2005 to 36 million in 2030. In the 2030 BAU sce-nario, energy consumption in households increase to 25,986 ktoeand CO2 emissions would increase to 55,838 kt-CO2, 2.8 times greaterthan 2005, respectively. The emissions can be mitigated in the 2030CM scenario, 22.8% lower than the BAU scenario. The mitigation inthe residential sector is found to be 43,085 kt-CO2, mainly in efficien-cy improvement of electric devices (see Fig. 7(a)).
a
d
c
4,476kt-CO2
EEI (non electrical appliances)
8,277 kt-CO2
EEI (electrical appliance
43,579 kt-CO2
Fuel switching
2,921 kt-CO2
Fuel switching 4,197 kt-CO2
FEI
8,037 kt-CO2
Modal shift
Fig. 7. Breakdown of emission mitigation by means in (a) residential sector, (b) commercia
Commercial sector
Energy demand in the commercial sector is estimated based on thefloor space of the commercial buildings. Driven by growth of tertiary in-dustry, in 2030, it would increase to 4.5 times greater than 2005 (seeFig. 7(b)). In the 2030 BAU scenario, energy consumption in this sector in-creases to 14,771 ktoe and CO2emission increase to 101,391 kt-CO2, 4.5times greater than in 2005, respectively. The emissions in this sector canbe mitigated in the 2030 CM scenario, 23,203 kt-CO2 or 22.9% lowerthan the BAU scenario. The mitigation measures in this sector are foundin efficiency improvement and building code.
Industrial sector
In this study, “industry sector” as an energy consuming sectormeans primary and secondary industries. Output of those industrieswould increase to 68,456 billion Baht in 2030 or 3.7 greater than2005. Without energy efficiency improvement or the 2030 BAU sce-nario, energy demand and CO2 emissions would increase to 3.2times from the base year 2005, respectively. In the 2030 CM scenario,energy efficiency improvement and fuel shifting in this sector couldreduce CO2 emissions by 85,863 kt-CO2, and account for 31.1% ofCO2 reduction in industry (see Fig. 7(c)).
To promote mitigation measures of industries, incentives to investin energy efficiency improvement is essentially important. Taxes,subsidies and low interest loans will be central policies for this sector.Promotion of advanced technologies from abroad is also effective.
Transport sector
In the passenger transport sector, the transport demand would in-crease from 191,520 million passenger-km in 2005 to 216,088 millionpassenger-km in 2030 or 1.1 times greater than 2005 due to
b
e
s)
20,313 kt-CO2
EEI (electrical appliances)
2,890 kt-CO2
Building insulation
14,374 kt-CO2
EEI (electrical appliances)
27,909 kt-CO2
EEI (non electrical appliances)
7,062 kt-CO2
Fuel switching
9.463 kt-CO2
Modal shift
6,589 kt-CO2
FEI
l sector, (c) industrial sector, (d) passenger transport, and (e) freight transport sector.
466 P. Winyuchakrit et al. / Energy for Sustainable Development 15 (2011) 460–466
population growth (see Fig. 7(d)). This results in an increase in ener-gy demand in passenger transport from 7548 ktoe in 2005 to8516 ktoe in 2030. Currently, small vehicles and motorcycles are themain mode of mobility in Thailand. If modal share does not change,CO2 emissions from passenger transportation would increase from22,933 to 25,875 kt-CO2 in 2030. However in the climate changemitigation measure scenario, energy efficiency improvement, traveldemand management, fuel substitution, and modal shift can mitigateCO2 emissions at around 58.6%.
In the freight transport sector, due to the growth of output of themanufacturing industries, freight transport demand would increasefrom 188,524 million ton-km in 2005 to 589,859 million ton-km in2030, resulting in increasing energy demand in freight transport to34,402 ktoe or 3.1 times greater than 2005 (see Fig. 7(e)). The freighttransport demand in Thailand is much greater than the passengertransport demand because Thailand is the largest market of pick-upvehicles in Southeast Asia. In the climate change mitigation measurescenario, energy efficiency improvement, fuel substitution, andmodal shift can mitigate CO2 emissions at about 22.1%.
Conclusions
This LCS scenario study is aimed at communication among policymakers, administrators, academic researchers, and the public onclimate change response in Thailand. This study considers only selectedfeasible demand-side options for climate change mitigation. In order tomitigate the emission to a lower level, several comprehensivemeasures such as diffusion of low-carbon technologies in the residen-tial sector, energy efficient buildings, energy efficient industry andfuel switching, and fuel substitution in the transport sector areproposed. In the 2030 BAU scenario, CO2 emissions would increase to563,730 kt-CO2 or 3.0 times higher than the base year 2005. By adopt-ing selected climate change mitigation measures available by 2030, theCO2 emissions could be decreased approximately 28.4% compared tothe 2030 BAU scenario, and reduced to 403,642 kt-CO2. In 2005, theper capita emission for Thailand was about 3.1 t-CO2/year. In 2030, itwould increase to 8.2 t-CO2/year, and 5.9 t-CO2/year without andwith climate change mitigation measures, respectively. Therefore, themitigation target could be achieved by a combination of initiatives onboth supply and demand side. If those policies are planned from theearly stage, Thailandwill be able to develop not only as a premier growthcentre but also serve as amodel for LCS developing countries. In addition,the societal benefits and co-benefits of climate change mitigation mea-sures should be further investigated for sustainable development.
Acknowledgements
A part of this research was supported by the Environment Researchand Technology Development Fund (S-6) of the Ministry of the Envi-ronment, Japan. Authors would like to thank the National Institute forEnvironmental Studies (NIES) Japan for the access to the Asia-PacificIntegrated Model (AIM/ExSS) and the database, and Kyoto Universityand Prof. Ram M Shrestha for the guidance in LCS modeling.However, only the authors are responsible for the views expressed inthis paper and for any errors.
References
Bank of Thailand (BOT). http://www.bot.or.th/thai/statistics/financialmarkets/exchangerate/_layouts/application/exchangerate/exchangerate.aspx. [July 25, 2011].
Chaosuangaroen, P. 2006. An assessment of long term energy demand and energyefficiency improvement in Thailand. Thesis. pp. 42–46.
Department of Alternative Energy Development and Efficiency (DEDE). Energyconsumption trend in residential sector. Thailand: Ministry of Energy;2003.
Department of Alternative Energy Development and Efficiency (DEDE). Renewableenergy development plan (15 years): 2008–2002; 2007http://www.dede.go.th/dede/images/stories/english/information/promo-renew-energyfeb-11.pdf. July19, 2011.
Electricity Generating Authority of Thailand (EGAT). Demand side management inThailand; 2005http://www2.egat.co.th/dsm/. May 24, 2010.
Gomi K, et al. A low-carbon scenario creation method for a local-scale economy and itsapplication in Kyoto city. Energy Policy 2010;38:4783–96.
Gomi K, et al. A systematic quantitative backcasting on low-carbon society policy incase of Kyoto city. Technol Forecast Soc Chang 2011;78:852–71.
Kuwattanachai N. Hybrid and electric cars. TRF Newsletters, 12; 2009.Matsuoka Y, et al. Low-carbon city 2025 sustainable Iskandar Malysia; 2009.
p. 24–5.National Economic and Social Development Board (NESDB). http://www.nesdb.go.th/
Default.aspx?tabid=972010. May 22, 2010.National Statistical Office (NSO). http://portal.nso.go.th. May 22, 2010.Pongthanaisawan J, et al. Road transport energy demand analysis and energy saving
potentials in Thailand. Asian J Energy Environ 2007;8:49–72.Robinson JB. Futures under glass a recipe for people who hate to predict. Futures 1990:
820–42.Shukla PR, et al. Ahmedabad low carbon society vision 2030; 2009. p. 24–5.Skea J, Nishioka S. Policies and practices for a low-carbon society. Clim Policy 2008;8:
S5-S16.Strachan N, et al. Policy implications from the low-carbon society (LCS) modeling pro-
ject. Clim Policy 2008;8:S17–29.Thailand Research Fund. Research programme on policy research for promoting
the development and utilisation of renewable energy and the improvementof energy efficiency in Thailand. Energy Planning and Policy Office; 2007.pp. 3-11–3-23.
Thailand Research Fund. Final report: research of renewable energy implementationand energy efficiency improvement in Thailand. Thailand: Energy Policy and Plan-ning Office; 2008.
The Government Gazette, 2007. Thailand. 124, pp. 1–10.The Government Gazette, 2009. Thailand. 126, pp. 9–15.Utaka F., et al. 2009. A roadmap towards low carbon Kyoto, 21.