
Schiphol The Grounds 2030. A Scenario for Integration of Electric Mobility into the Built...
350
Transcript of Schiphol The Grounds 2030. A Scenario for Integration of Electric Mobility into the Built...

ii SCHIPHOL THE GROUNDS 2030
Delft University of Technology
Landbergstraat 15 2628CE Delft
The Netherlands T +31 (0) 15 278 9318
Schiphol Group
Post box 7501 1118 ZG Schiphol
The Netherlands T +31 (0) 20 601 9111
The Diemigo project is made possible with the support of Transumo. Transumo (Transition to Sustainable Mobility) is a Dutch platform for over 150 companies, governments and knowledge institutes that cooperate in the development of knowledge with regard to sustainable mobility. Transumo aims to contribute to the transition from the current inefficient mobility system towards one that enables greater economic competitiveness, as well as a strong focus on people and the environment. The research and knowledge development activities under Transumo began in the year 2005 and will continue at least until 2009. Currently, more than 20 projects are conducted under the scope of Transumo. More information is available at www.transumo.nl

SCHIPHOL THE GROUNDS 2030 iii
SCHIPHOL THE GROUNDS 2030 A SCENARIO FOR INTEGRATON OF ELECTRIC MOBILITY INTO THE BUILT ENVIRONMENT
Authors: Dr.ir. Sacha Silvester Ir. Satish kumar Beella Dr.ir. Arjan van Timmeren Prof.dr.ir. Pavol Bauer Dr. Jaco Quist Dr.ir. Stephan van Dijk Schiphol contact person: Ir Jonas van Stekelenburg Graphic design and layout: Mr. Marin Licina Ir. Satish kumar Beella © Delft University of Technology, 2010 All rights reserved. No part of this book may be reproduced, transcribed, stored in a retrieval system, translated into any other language or computer language or transmitted in any form or by any means, electronic, mechanical or photocopying, recording or otherwise, without the prior written permission of the copyright owner.

iv SCHIPHOL THE GROUNDS 2030

SCHIPHOL THE GROUNDS 2030 v
Foreword The introduction of electric mobility into Dutch Society is one of the promising options to create a more sustainable mobility system for the future. Electric vehicles offer the promise of major reductions in local CO2, NOX and particulate emissions. In addition, electric vehicles are silent, easy to service and have high ‘well-to-wheel’ energy efficiency. However, the introduction of electric vehicles into society also poses several important challenges. Current electric vehicle technologies have limitations with respect to ease of use, driving range, and time-to-charge, and are relatively expensive. Moreover, the use of electric vehicles requires an adequate charging and electric grid infrastructure, as well as dedicated solutions for vehicle charging and storage that are optimally integrated into the built environment. The possible linking of renewable –decentralised- energy generation and storage in electric vehicles, the switch from ICE-based to electrical and ICT based technologies and the entrance of new ‘players’, the shift from ownership to usership, the pressure from (local) communities to improve urban environment are some of the important developments that will lead to a radical change of our mobility system. What the exact outcome of the transition process will be and how the process itself will look like is still uncertain. It is challenging that in spite of these uncertainties a lot of stakeholders in the transition already preparing themselves. An enormous amount of small-scale pilots with electric mobility is announced and a few pilots -integrating energy production, infrastructure, vehicle-, building- and urban design- are actually on the way. These pilots offer short learning cycles: “if we fail, we quickly fail, if we succeed we built further”. This report presents the results of an integrated research and design pilot for the introduction of electric vehicles in the urban environment. The Schiphol Group has the ambition to develop its properties and business park areas in a more sustainable and socially responsible way. Therefore, electric mobility is an interesting option to consider. To explore this option, The Grounds location at Schiphol was chosen as a challenging case. The project was exciting as a result of the collaboration with a leading organisation such as Schiphol and also because of the participation of twenty-five researchers and designers from four different faculties of the Delft University of Technology. The results of the project demonstrate that it is possible to create a multifunctional, sustainable and comfortable urban area in which the electric mobility is very well integrated. It can even be concluded that sustainable urban development is becoming more feasible because of the clever integration of renewable energy, electricity grid design, inductive charging and customized electric vehicle services. Some of the components of the proposed plan are very promising and can be developed immediately, since most of the required technologies are currently available. These components can act as stepping-stones towards -and demonstrators for- the integrated Schiphol The Grounds ‘2030’ plan. The Grounds location near Schiphol Airport City has been a unique case for developing novel concepts and methods. However, to be able to generalise the findings and to validate the applied methodology, many other urban areas should be developed. I hope that this report will inspire the Schiphol Group and will help to fulfil their sustainability goals. Let’s challenge this sustainable future! Sacha Silvester March, 2010

vi SCHIPHOL THE GROUNDS 2030

SCHIPHOL THE GROUNDS 2030 vii
Acknowledgements The Diemigo research project was initiated in April 2009 and completed in November 2009. Many people have contributed to this project and without their commitment and efforts the results of this project would not have been achieved. We would like to thank Jan Klinkenberg, director of Transumo, for supporting this challenging project and for his help during the critical phases. We would also like to thank the enduring support and enthusiasm of Jonas van Stekelenburg of the Schiphol Group who is also the project manager of The Grounds. The project has also benefited from the knowledge of Teun Bijlsma, Patrick Janssen, Jan-Willem Samama, Maurits Schaafsma, Tabor Smeets, Gert-Jan Vermeulen, Martijn van Boxtel, Ho, van der Horst en Wagemakers, all from the Schiphol Group. We hope the results of this project will inspire the Schiphol Group to pursue their sustainability strategy even more vigorously in the coming decade. Several employees at the Delft University of Technology have provided critical support for the administrative and financial aspects of this project. We would like to thank Linda Roos and Remco Blijleven for their energy and dedication. Finally, but most importantly, this project has been executed by a dynamic team of bright researchers from Delft University of Technology and we would like to thank all of them for their contribution: Pavol Bauer, Satish kumar Beella, Siebe Broersma, Carlos Castillo Cortes, Stephan van Dijk, Jeremie Doppler, Chandler Elizabeth Hatton, Inge Heit, Kas Hemmes, Frank van der Hoeven, Jessica Abad Kelly, Peter van Kouwen, Marin Licina, Bauke Muntz, Gregorio Muraca, Jaco Quist, Paul de Ruiter, Sacha Silvester, Stefan van der Spek, Neil Stembridge, Koen Terra, Arjan van Timmeren, Anne-Lorene Brigitte Helene Vernay and Yi Zhou.

viii SCHIPHOL THE GROUNDS 2030
SCHIPHOL THE GROUNDS 2030 ix
Table of Contents 1 Executive Summary ...............................................................................................1
1.1 Key results ......................................................................................................1 1.2 Recommendations ..........................................................................................6 1.3 Recommendations for Schiphol ......................................................................7
2 Introduction ............................................................................................................8
2.1 The Challenge.................................................................................................8 2.2 Research Structure & Questions.....................................................................9 2.3 Schiphol and The Grounds ...........................................................................11 2.4 Deliverables ..................................................................................................12
3 Methodology ........................................................................................................13
3.1 Introduction ...................................................................................................13 3.2 Three major challenges.................................................................................13 3.3 Methodological approach..............................................................................15
4 Challenges and Requirements.............................................................................18
4.1 Technology assessment ...............................................................................18 4.1.1 Electric Vehicle Technology ...................................................................18 4.1.2 Battery Technology ................................................................................33 4.1.3 Battery Charging ....................................................................................42 4.1.4 Electrical Grid.........................................................................................49 4.1.5 Battery Design Issues ............................................................................57 4.1.6 Electric Vehicle Design Issues ...............................................................68 4.1.7 Fast Charging Design Issues .................................................................71
4.2 Developments in electric mobility..................................................................81 4.2.1 Market and pilot developments ..............................................................81 4.2.2 Government and politics ........................................................................86 4.2.3 Industry ..................................................................................................88 4.2.4 International activities on electric mobility ..............................................95 4.2.5 Overview initiatives and pilots abroad..................................................103 4.2.6 Conclusions on developments in electric mobility................................105
4.3 Actors, users & social aspects ....................................................................105 4.3.1 Actors ...................................................................................................105 4.3.2 Social aspects ......................................................................................108 4.3.3 Conclusions..........................................................................................122
4.4 Urban context and potentials ......................................................................126 4.4.1 The Built Environment & E-mobility, Approach ....................................126 4.4.2 Climate and sustainable energy potential analysis of Schiphol and the Haarlemmermeer .............................................................................................131 4.4.3 Schiphol, the urban context..................................................................140 4.4.4 Conclusion ...........................................................................................168
4.5 Design scenarios ‘The Grounds 2030’ ........................................................170 4.5.1 General background future development scenarios ............................170 4.5.2 Plotting the scenarios...........................................................................173 4.5.3 Mental maps of the future ....................................................................174 4.5.4 Key factors ...........................................................................................175 4.5.5 Critical Forces ......................................................................................176 4.5.6 Driving Forces ......................................................................................177

x SCHIPHOL THE GROUNDS 2030
4.5.7 Selected scenarios...............................................................................182 5 Concepts............................................................................................................190
5.1 Mobility/functional concepts ........................................................................190 5.1.1 EV schiPOOL System ..........................................................................190 5.1.2 Do Anything Box ..................................................................................191 5.1.3 Energy Card .........................................................................................192 5.1.4 Compact and Stacked..........................................................................192 5.1.5 Modular Society ...................................................................................193 5.1.6 Resource Exchange Node (REN) ........................................................194 5.1.7 Self-Sufficient Communities .................................................................195 5.1.8 Better Tomorrow ..................................................................................196 5.1.9 Complete Package...............................................................................197 5.1.10 Service-Oriented Autonomous Vehicles ............................................197 5.1.11 Seamless Mobility ..............................................................................198 5.1.12 Mobile Built Environment ...................................................................199 5.1.13 Build-a-Vehicle ...................................................................................199 5.1.14 New Generation EVs..........................................................................200
5.2 Urban concepts ...........................................................................................201 5.2.1 Built Environment and approach ..........................................................201 5.2.2 Integration of e-mobility within future scenarios for ‘Elzenhof The Grounds’...........................................................................................................203 5.2.3 Integrated urban mobility and electric charging concepts ....................235 5.2.4 Conclusion (urban concepts) ...............................................................236
5.3 Grid and charging concepts ........................................................................237 5.3.1 Travel Pattern.......................................................................................238 5.3.2 Load Profile of Different Buildings........................................................239 5.3.3 Charging Pattern ..................................................................................241 5.3.4 Scenario Results (Generation Eco-Geek)............................................244 5.3.5 Economic Analysis and Grid Design ....................................................249
5.4 Scenario selection.......................................................................................254 5.4.1 Criteria and method for selection .........................................................254 5.4.2 Selected Scenario Delineation .............................................................255
5.5 Morphological charts ...................................................................................261 6 Design phase .....................................................................................................265
6.1 The ‘Elzenhof The Grounds’ design scenario ‘Generation Eco-Geek’...........265 6.1.1 Background of the concept ..................................................................265 6.1.2 Conceptual design ‘Generation Eco-geek’ scenario elaboration .........280 6.1.3 Strategy of implementation ..................................................................285 6.1.4 Conclusion ...........................................................................................294 6.1.5 Urban design conclusions ....................................................................295
6.2 Mobility ........................................................................................................296 6.2.1 Ecar 0f 2030.........................................................................................296
6.3 Induction Charging: Interaction and user experience .................................302 6.4 Grid Design .................................................................................................305 6.5 Conclusions.................................................................................................307
7 Conclusions and Recommendations .................................................................308
7.1 State of the art in electric mobility and future trends...................................308 7.2 Design solutions for the Schiphol case ........................................................309 7.3 Urban design and electric mobility concepts ...............................................310 7.4 Energy infrastructure design .......................................................................311 7.5 Methodology ................................................................................................312

SCHIPHOL THE GROUNDS 2030 xi
7.6 Recommendations .......................................................................................312 7.7 Recommendations for Schiphol ..................................................................313
8 References.........................................................................................................314 9 Appendix ............................................................................................................324
9.1 Results from other three Scenarios.............................................................324 9.1.1 Results of Scenario “Time to eat the dog”............................................324 9.1.2 Results of Scenario “As Good as Its Gets” ..........................................328 9.1.3 Results of Scenario “Footprints on the Water” .....................................332
9.2 Appendix D Standards for EVs ...................................................................336 10 Illustrations.......................................................................................................337


1 Executive Summary A large-scale introduction of electric vehicles into Dutch society has a variety of benefits, including higher ‘Well-to-Wheel’ efficiencies, the mitigation of local greenhouse gas emissions, particulate pollution, and noise, and an increased need for the production of renewable energy. The batteries of electric vehicles could also be used as auxiliary storage capacity for the electricity grid, further reinforcing the integration of renewable energy in both decentralised and centralised electrical grids. Although these benefits provide incentives for many parties and stakeholders to pursue the electrification of mobility in the Netherlands, much is still unknown about the complexities arising from the integration of electric mobility in the built environment, especially at a large scale. To explore these complexities and develop a better understanding of the true benefits of electric mobility, an integrated scenario development project (called DIEMIGO) was jointly undertaken by the Delft University of Technology and the Schiphol Group. This report presents the main results of this project and demonstrates the consequences of, and design solutions for, the large-scale introduction of electric vehicles into the built environment. The integrated scenario and design solutions have been developed for a future business park near Schiphol Airport City, called ‘The Grounds’, which Schiphol aims to develop in a sustainable way. The objectives of this project were twofold:
- To develop an integrated methodology to design effective solutions for the implementation of large-scale electric mobility in the built environment.
- To develop a location-specific scenario for the year 2030 for one of the urban development areas at Schiphol Airport City (i.e., The Grounds), based on this methodology.
When putted more concretely, an assessment focussing on electric vehicle technology and battery technology, market and social developments and finally the urban context was the input for the development of four scenarios. Concepts of the urban design, electrical infrastructures, the buildings and the vehicle concepts were generated for each of the scenarios. The most challenging of the four scenarios was selected and elaborated into a location-specific scenario for Schiphol in the year 2030. The TRANSUMO (Transition to Sustainable Mobility) program – a research program subsidised by the Dutch national government to improve the knowledge infrastructure of the Netherlands on sustainable mobility–provided the financial support for this research project. A multi-disciplinary team of researchers from the Faculties of Architecture, Electrical Engineering, Industrial Design, and Technology Policy and Management at TU Delft worked together with experts from the Schiphol Group to execute the project and develop solutions.
1.1 Key results The key results of the study are summarised below: - To assess the feasibility (in social, economic, technological, and policy terms) of
existing electric mobility concepts an extensive technology assessment was executed at the beginning of the project, with the following main outcomes:

2 SCHIPHOL THE GROUNDS 2030
- The range of electric vehicles (EVs) is limited when compared to conventional cars. The state of current battery technology, although it is constantly improving, is one of the reasons for the limited usage of EVs. Significant technological breakthroughs are needed in order to develop an EV with a comparable range and an affordable price.
- Safety, modularity and compatibility will be the key aspects in establishing dynamic and long-term solutions for EV charging infrastructures. It is of great importance for successful implementation that these user-related aspects are taken into account when assessing EV technologies.
- The biggest bottleneck for the electrical infrastructure is achieving sufficient distribution capacity in the grid if EVs are concentrated in particular regions or locations and fast charged.
- The availability of full sized EVs for personal transport is still limited. However, with regard to market developments in the Netherlands, the numbers of hybrid EVs, professional market niches (e.g. on-site, public services, vans & small trucks), and electric bikes (pedelecs) and scooters are constantly growing.
- The environmental benefits of EVs are almost completely dependent on the type of energy production that is used to charge the battery.
- Changes in consumers’ behaviour (e.g. using a second car, rental car or public transport) for longer trips might need certain adaptations and changes specific to their mode choices in order to use EVs and related infrastructure. This situation could be avoided with the implementation of technological solutions such as fast charging, battery swapping and range extenders.
- The higher purchasing price of an EV is a barrier for the buyer. As a result, there is need for and likelihood of different business models, such as battery leasing, which will develop in the early years of EVs.
- The vehicle-to-grid (V2G) option for exchanging electricity back and forth to the grid is viable if the EV charging and energy distribution markets are matched. In the United States, V2G services are very profitable for users if this match is sold as spinning reserves and grid regulation. However, these high value energy markets are presently non-existent in the Netherlands. Changes are required in the current Netherlands energy market in order to make V2G services economically viable.
- To establish clear guidelines for the design of effective solutions for the integration of electric mobility in urban environments in the future, four different Design Orienting Scenarios (DOS) for 2030 were developed. In addition to the existing Policy Oriented Scenarios (POS) of the CPB (CPB 2004), which deal with the macro-scale of the socio-technical systems and present a variety of possible futures and facilitate political decisions, these scenarios are conceived as tools to be used in design processes. They are made of a variety of comparable visions, which are motivated and enriched with visible and tangible proposals. The driving forces for the scenarios are:
o CO2 neutral policy o Zero emission regulation in urban areas o Sustainable behaviour o Focus on usership o Technology developments, particularly ones related to batteries, fast
charging and range extenders.

SCHIPHOL THE GROUNDS 2030 3
Fig 1. Central location of Schiphol - ‘Generation Eco-Geek’ was the scenario chosen for further development,
because it is the most conscious of the four developed scenarios with regard to sustainability (Fig 2). This scenario describes a world in which rapid technological development and minimalistic design principles are essential. Generation Eco-Geek marks a change in consumer behaviour: consumers exhibit a clear preference for value-based products and attention to detail. The Dutch society is CO2 neutral and 70% of all Dutch cars are electric. Schiphol Airport also acts as a showroom for modern technological advancements. The airport is automated, space efficient and flexible, allowing it to remain compact and effective. This scenario is used to guide the development of the different design aspects, such as the urban profile and the modal split (mix of different travel modes) of The Grounds area of Schiphol.
- To determine the operational context for future mobility systems at a specific
location (i.e. The Grounds area), an urban indicator tool was developed. Based on the tool one can determine and simulate the type of activities and user groups in the area, the land usage for different functions such as working, parking, recreation, and local energy production, the number of electric vehicles and the anticipated vehicle usage.
Fig 2. Representation of the four scenarios, including ‘Generation Eco-Geek’
4 SCHIPHOL THE GROUNDS 2030
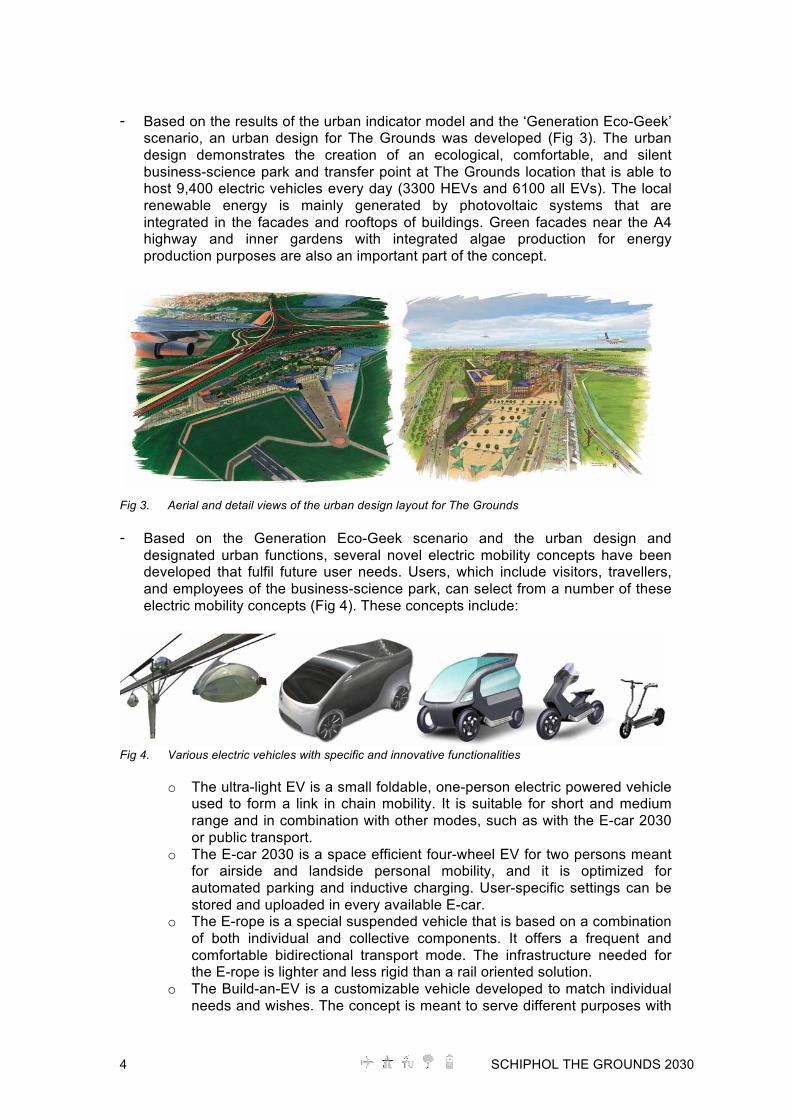
- Based on the results of the urban indicator model and the ‘Generation Eco-Geek’
scenario, an urban design for The Grounds was developed (Fig 3). The urban design demonstrates the creation of an ecological, comfortable, and silent business-science park and transfer point at The Grounds location that is able to host 9,400 electric vehicles every day (3300 HEVs and 6100 all EVs). The local renewable energy is mainly generated by photovoltaic systems that are integrated in the facades and rooftops of buildings. Green facades near the A4 highway and inner gardens with integrated algae production for energy production purposes are also an important part of the concept.
Fig 3. Aerial and detail views of the urban design layout for The Grounds - Based on the Generation Eco-Geek scenario and the urban design and
designated urban functions, several novel electric mobility concepts have been developed that fulfil future user needs. Users, which include visitors, travellers, and employees of the business-science park, can select from a number of these electric mobility concepts (Fig 4). These concepts include:
Fig 4. Various electric vehicles with specific and innovative functionalities
o The ultra-light EV is a small foldable, one-person electric powered vehicle used to form a link in chain mobility. It is suitable for short and medium range and in combination with other modes, such as with the E-car 2030 or public transport.
o The E-car 2030 is a space efficient four-wheel EV for two persons meant for airside and landside personal mobility, and it is optimized for automated parking and inductive charging. User-specific settings can be stored and uploaded in every available E-car.
o The E-rope is a special suspended vehicle that is based on a combination of both individual and collective components. It offers a frequent and comfortable bidirectional transport mode. The infrastructure needed for the E-rope is lighter and less rigid than a rail oriented solution.
o The Build-an-EV is a customizable vehicle developed to match individual needs and wishes. The concept is meant to serve different purposes with

SCHIPHOL THE GROUNDS 2030 5
the help of standard components (two, three or four wheels, covered or open, variable ratio of person vs. luggage space, etc.)
- The new generation electric vehicles are proposed along with an urban plan and
building integrated supportive infrastructure for parking, charging, and vehicle assembly and distribution. There are many methods to charge EV batteries according to their different charging characteristics. Conductive charging technology is currently the most favoured, as it allows for the connection of EVs to an existing power supply with high efficiency and without the need for additional infrastructure. However, the recommended infrastructure to support the aforementioned mobility concepts makes use of induction charging technology. The use of induction charging increases the freedom and flexibility with which the charging infrastructure can be integrated into the built environment. Both static induction charging and dynamic (i.e., in-road and on the go) induction charging enable users to recharge their vehicles with ease at The Grounds (Fig 5).
Fig 5. Dynamic Induction charging lane (left) and induction charging with the receptor located in the bumper (right) - The EV charging activities take place in the automated Park&Charge long-term
garage, where the automated parking configuration and system result in a very dense parking solution (Fig 6). These garages – optimally oriented towards the sun - are equipped with photovoltaic facades and rooftops to locally generate electricity from solar energy.
- The load profile modelling, the expected variation in the electrical load versus
time, indicates that local solar power generation is matched to the anticipated electrical load at The Grounds business-science park on weekdays, including the charging of electric vehicles. On weekends, there is an excess of locally produced solar power.
Fig 6. Schematic layouts of automatic parking at the Park&Charge garage and renewable charging facilities

6 SCHIPHOL THE GROUNDS 2030
- Three different charging strategies are distinguished in this project: dumb, controlled and smart. In the case of ‘Dumb’ charging, no intelligence is added to the system and EVs are directly charged when connected to the grid. ‘Controlled’ charging means that EVs are charged during specific time-slots during the day. ‘Smart’ charging is also controlled and part of a smart network. A smart network is managing the grid load by enabling matching between demand and supply of electricity and the more effective integration of local renewable energy production (i.e. solar power).
- Local electricity production with photovoltaic systems is economically feasible.
Local renewable energy production enables the existing grid to cope with the intensified electricity flows resulting from the large-scale charging of electric vehicles. Thus there is no need to invest in strengthening the existing grid. Moreover, it is estimated that after the year 2020, the cost of grid electricity will be higher than solar production costs. The annual benefits from using solar energy will reach up to €1.3 million in the year 2030.
- The V2G function of the Park&Charge garage is already economically attractive.
With the assumption that the batteries of EV in the parking garages can always share the real-time bidding market, the annual revenue from the 6100 vehicles parked at The Grounds is estimated to be €0.19 million.
- To support the large-scale charging of electric vehicles and the integration of
local renewable energy production different grid topologies are suggested; either a pure AC grid or a parallel AC-DC grid would suffice. A pure DC grid linked to the existing DC railroad grid could also be used, but this would require an update of the DC railroad grid, which is a 2601 km track equipped with 1.5 kV DC. The three proposed grid topologies do not have significant differences from an economic point of view.
- Finally, vivid visualizations of the urban plan and the proposed mobility solutions
are used for the communication of the project to external parties.
1.2 Recommendations - The Schiphol Airport City location has been one of the first locations in the
Netherlands to test and develop novel concepts and methods. To be able to generalise the findings and to validate the methodology, a number of diverse urban areas should also be researched, such as city centres and suburbs, and greenfield as well as brownfield situations.
- The Technology Assessment executed within the framework of this project
provides a general picture of the potential benefits of integrating electric mobility in the built environment. The specific consequences for Schiphol and its stakeholders resulting from the novel design choices made in this project – in terms of the environmental impact, the economic aspects and the identification of potential social, technical, and organizational barriers - have to be elaborated in greater depth. This assessment could not be accomplished within the available time span for the project.
- A number of the future concepts presented in this project should be developed further. These include:

SCHIPHOL THE GROUNDS 2030 7
o The switch towards electric drive trains in the case of the ‘Built-an-EV’ appears promising with respect to the standardization of components and the development of universal EV-platforms. Customer acceptance of these highly customizable products is still unclear, as is the effect of customization when ownership of EVs is shifts towards usership.
o Fast induction charging, although currently used in domestic appliances, is still being developed for the induction charging of EVs. Aspects such as safety, efficiency, environmental impact, costs and usability should be thoroughly investigated.
o The automated Park&Charge garage, with its combined parking, charging and PV power generation, is one of the most interesting concepts resulting from this project. In the DIEMIGO case a large-scale version of the Park&Charge garage is presented. Research into a modular set-up for the Park&Charge garage is recommended. Smaller scale versions could be a very interesting option for sub- urban living areas. Further research could also include alternative configurations (e.g. horizontal distribution) and the transformation of existing parking spaces to automated smart charging parking, or hybrid elaborations of both. In addition, research is recommended on the possibilities of converting existing (automated) parking garages into Park&Charge facilities.
o The smart grid integration needs to be investigated further for both charging and utilization of renewable energy sources, and its integration into buildings and building components, like building facades and parking area floors or ceilings.
- The lifetime of a battery system depends, among other factors, on the number of
discharge/charge cycles. The incorporation of EV batteries as a buffer in the electricity grid (V2G) will lead to an increase in the number of cycles. This consequence can be a potential hindrance for the V2G option. Little is known about the effects on batteries that are integrated into V2G systems. Research on the effects of V2G on the lifetime of car battery systems and the environmental and economic consequences is recommended.
1.3 Recommendations for Schiphol - The integral design and its basic assumptions for The Grounds area have to be
evaluated and validated by Schiphol and its stakeholders. - Some of the components of the proposed plan are very promising and can be
developed already, as most of the required technologies are already available. These components can act as stepping-stones towards -and demonstrators of- the integrated ‘2030’-plan.
- The principle of ‘decentralized concentration’ and the ‘short-cycles’ city, the Park&Charge garages, the Ultra Light EV and small-scale experiments with smart grids are recommended.

8 SCHIPHOL THE GROUNDS 2030
2 Introduction
2.1 The Challenge Mobility is a crucial part of daily life. It enables people to overcome the distance that separates their homes from the places where they work, learn, recreate, seek care, do business, or interact with family and friends. Businesses are also heavily dependent on mobility to overcome the distances that separate them from their suppliers, markets, and employees. However, when implemented at a large scale, mobility has a number of negative repercussions: congestion, particulate pollution, greenhouse gas emissions, noise, and accidents, to name a few. Another concern is that the world’s current mobility systems rely almost exclusively on a single, limited source of non-renewable energy — petroleum. The challenge, that society as a whole faces, is the design, development, and implementation of mobility systems that are more efficient, more equitable and less disruptive, both socially and environmentally (WBCSD 2004). The transition from conventional mobility technologies towards a situation in which electric vehicles (EVs) play a leading role is one of the most promising opportunities for achieving a sustainable mobility system. A large-scale introduction of electric vehicles has a variety of benefits, including higher ‘Well-to-Wheel’ efficiencies, the mitigation of local greenhouse gas emissions, particulate pollution, and noise, and increased support for renewable energy production. Moreover, electric vehicle batteries may provide auxiliary storage capacity for the electricity grid, further reinforcing the integration of renewable energy conversion technologies in the national electrical grid. Past efforts to introduce electric mobility to the general public have struggled to transcend the niche markets that EVs have historically occupied. This is because the complexity associated with the widespread deployment of electric mobility necessitates a radical transition process, which draws upon specific knowledge of consumer behaviour as related to the use of products and services, as well as the anticipated trajectory of vehicle technologies. Infrastructures must be developed for the physical, as well as for the information and communication domains. To be successful in integrating electric mobility into our built environment, synergetic research and innovation processes must take place; these form the backbone of this research project. This research falls within the context of the DIEMIGO project, which aims to advance the integration of electric mobility into the built environment. The TRANSUMO (Transition to Sustainable Mobility) program (Transumo 2009) – a research program subsidised by the national government to improve the knowledge infrastructure of the Netherlands – has shown direct interest in the DIEMIGO project. This project addresses a number of aspects associated with the transition toward electric mobility, including system innovation, supportive infrastructure, built environment, and vehicle products and services. System Innovation The foreseen complexity and impact of the transition towards electrical mobility elicits the term ‘system innovation’. System innovation can be defined as a combination of technological, organizational, and cultural changes that result in a vastly different approach to the performance of familiar tasks. This project strives to develop a new understanding of mobility in relation to urban infrastructure. In doing this, several

SCHIPHOL THE GROUNDS 2030 9
research methods can be utilized, including ‘backcasting’ (Quist 2007), ‘visioning’, and the development of ‘design-orienting scenarios’ (van Notten, Rotmans et al. 2003; Manzini 2008). The development of a method to cope with this complex ‘design’ process will be one of main objectives of this project. Infrastructure The creation of supportive and reliable vehicle charging infrastructures is vital to the mass-deployment of electric mobility. Contemporary energy infrastructure is not yet suited to host large amounts of electrical vehicles (Hatton 2009). Also, the ICT infrastructure necessary to manage the vehicle charging process has not yet been established. It is apparent that the semi-permanent incorporation of vehicle batteries into the electrical grid in the form of vehicle-to-grid interaction can improve the operational efficiency of the energy distribution system; the integration of this technology must be handled with care and ingenuity. Simple, context-sensitive infrastructural systems will be necessary to support user acceptance and the smooth deployment of electric vehicles. The integration of the electrical grid and ICT infrastructures, the designation of the charging speed, and the design of interfaces that support the location of charging stations and the charging, payment, and communication processes are to be addressed. Built Environment Architects and urban designers must address the integration of charging infrastructure into the contemporary urban fabric. These designers may consider the positive effect that reduced noise and air pollution will have on the built environment. They may also consider the specification of land uses that are conducive to electric mobility, the coupling of vehicle charging with local renewable energy generation, and the design of parking facilities equipped with charging amenities. Vehicle Product & Service Design The notion of well-functioning electric vehicles for public transport is a familiar one. In the near future, personal vehicles such as scooters, motorcycles, cars, and trucks will also undergo the process of electrification. The design of this new generation of vehicles must account for distinct changes in the interaction that takes place between users and vehicles, as well as that which takes place between vehicles and transport infrastructure. Designers of these future mobility concepts must also reflect on the influence of social and cultural trends on mobility patterns.
2.2 Research Structure & Questions This research will ease the challenges that society now faces in the mobility domain, as well as contribute to the generation of fundamentally new scientific knowledge. The epistemological aim of this programme is to contribute to the development of scientific knowledge through ‘design inclusive research’. The goal of including design into the research process is to create new opportunities for generating new knowledge, which cannot be derived another way or can be obtained more effectively (Horvath 2008). Design inclusive research is combining analytic research methods with synthetic/constructive design methods.

10 SCHIPHOL THE GROUNDS 2030
Fig 7. Design Inclusive Research. Left the research steps and right the design steps. (Horvath 2008) The process of design inclusive research is composed of three phases: the phase of explorative research actions, the phase of creative design actions and the phase of evaluative research actions. In the first phase, the existing knowledge and new developments about a specific phenomenon are analysed and the specific research questions and design problems are formulated. After the design phase, the third evaluative phase encompasses the verification of the hypothesis and the validation of the research and design methods and findings. The main research question of the DIEMIGO-project is: ‘How to integrate electric vehicles into urban and local energy infrastructures to improve large-scale adoption in 2020-2030?’ The DIEMIGO-project is structured according to the three phases of the design inclusive research approach. The main research question is split-up in the following three sub-questions that represent the explorative, creative and evaluative phases:
i. What are the challenges and requirements? a. What are the mobility needs for 2030? b. What local and decentralized energy sources could be integrated into the
built environment? c. What are the limitations of the grid for large scale EV introduction? d. What are the challenges and requirements from an urban perspective?
ii. What are the different solutions? a. Which EV concepts fulfil the expected mobility needs? b. Which urban and layout typologies fulfil the mobility, built environment and
energy infrastructure needs? c. Which are the interfaces most suited for the users, the EVs and the built
environment? d. What are the charging types, strategies and grid topologies?
iii. What is the effectiveness? a. Which solutions and technologies are feasible in what time scale? b. How it will affect the penetration of EVs and consumer acceptance? c. How and in which way can this project stimulate sustainability and a
reduction of emissions?

SCHIPHOL THE GROUNDS 2030 11
2.3 Schiphol and The Grounds The ‘design inclusive research’ methodology mandates the use of appropriate case studies. The Schiphol Group is a strong partner for this project, as Schiphol Airport City is a complex location that serves as a pivotal point in the Dutch transport network. The Schiphol Group is currently devising a roadmap to illustrate the implementation of electric mobility (2008-2020) among its own fleet in close coordination with the neighbouring municipalities. The Schiphol Group considers electric mobility as an important opportunity for both its own fleet as well as for other public and private mobility streams flowing into and out of Schiphol Airport City. The Schiphol Group provided the research team with several options for locations to serve as case for this project. An assessment for location choice will be part of the project, in which the following criteria will be considered: • Potential for combining the existing electric infrastructure (ProRail) with grid-to-
vehicle and vehicle-to-grid facilities • Potentially fast car-plane connections for EVs only • Potentially fast car-inner city connections (e.g. for EVs only) by integrating a
smart Transferium option next to the planned metro station • Potential Landside/Airside combinational charging/services and energy exchange • Potential EV car-share Network Hub with fast connections (highways A4, A9, and
A10) • Potential integration of risk strategy energy management system as a basis for a
resilient energy system (integrating EVs, renewable energy, and development planning)
• Challenging complexity and potential interference with several planned developments.
The main objectives of the project are: • To develop a preliminary methodology for planning, organizing and implementing
large scale e-mobility and electric charging infrastructures. The 60Ha area (referred to as ‘The Grounds’) of Schiphol (and the roadmap developed by Econcern/Schiphol) will serve as a case; the strategy can be generalized in that it can be rolled out in other regions and locations (e.g. public and private fleet owners, centres that attract major mobility). This methodology is based on a single case (e.g. Schiphol) and will need further development after this project in order to improve validity and usability.
• To develop a design of a fast charging interface (including interfacing, grid connection, urban design implications, location choice, and implementation strategy) specifically for The Grounds; the strategy for setting up fast charge infrastructure can be applied to other regions/areas, fleet owners and contexts (e.g. grid characteristics).
The available time for the execution of this project has been limited because of the conclusion of the Transumo program in November 2009. Due to the fact that the project had to be finished within seven months, criteria were formulated together with representatives of The Schiphol Group in order to help focus the activities of the research and design team at TU Delft. These criteria guided the use of the restricted time as effectively and efficiently as possible.

12 SCHIPHOL THE GROUNDS 2030
The following three statements explain the decision focus: • The urban plan, its buildings, the charging infrastructure and the mobility
solutions are stepping stones in the direction of a ‘sustainable Schiphol’ or ‘C02 neutral Schiphol by 2012’.
• The infrastructure integration of the buildings and the mobility solutions are expected to be innovative and well supported by the latest developments. More important than the actual design manifestation are the requirements formulated to guide the generation of the design options.
• Potentially demonstrable elements of the scenarios in the near future or solutions that can already be applied are important in order to show the potential of the transition towards electric mobility for Schiphol Airport City. These spin-offs will motivate the various stakeholders, whose support is needed for the long-term transition process.
As a consequence of the limitations of this project – with respect to the available time – it was decided to focus on the first two phases of the ‘design inclusive research’ approach, namely the analysis phase and the conceptual phase. The third phase –the evaluative phase – is therefore beyond the scope of the project.
2.4 Deliverables This project has the following deliverables: • Technology assessments report on the ‘technical and social’ strengths and
weaknesses of the state-of-the-art electric vehicle and charging technology. • A first-of-a-kind electric mobility development methodology, that describes the
steps and considerations when setting up large scale electric mobility and charging infrastructure for particular regions, fleet-owners or municipalities.
• Urban development and mobility scenarios for the Elzenhof The Grounds area. It should include: building/charging interfaces, urban planning design, grid characteristics, location aspects and mobility concepts and patterns.
• Development of mobility concepts based on the interaction of future users and contexts.
• Technical design of the charging infrastructure; interfaces between electric vehicles and the buildings at The Grounds.
• A technical requirements plan for the electrical infrastructure to support electric charging.
• An integrated urban design for the Elzenhof The Grounds area (focusing on the integration of e-mobility and electric charging).
• Visual representations of the e-charging solutions and the urban development plan.

SCHIPHOL THE GROUNDS 2030 13
3 Methodology
3.1 Introduction The large-scale introduction of electric vehicles in our society is much more than a simple substitution of the internal combustion drive train by an electrical one. To really take advantage of all of the potential benefits, the transition towards electric mobility has to offer: • The sustainability of urban areas, by means of the reduction of noise, CO2, NOx
and dust emissions • New possibilities for urban development, through the disappearance of
restrictions caused by noise, etc. • Efficient energy systems by linking the buffer capacity of EV batteries to the
electricity grid and peak shaving • Buffer of distributed renewable wind, solar and surplus energy of micro combined
heat/power systems • Attractive product-service business propositions, a shift from products towards
services. Synchronised actions from a broad array of stakeholders have to take place in order to establish a sustainable mobility system. In this project a first attempt of a methodology is developed to cope with the complexity of these mutually dependent developments. This methodology, when fully developed, is meant to support the following stakeholders in urban mobility in taking the right decisions towards sustainability: • Regional authorities • Urban developers • City planners • Infrastructure and utilities companies • EV solution providers • Fleet owners In this chapter the major methodological challenges of the project will be elaborated, leading to description of the applied methodological framework.
3.2 Three major challenges Electric transportation as a system innovation The introduction of electric vehicles and transportation into society involves innovation at different levels and sub-systems of the mobility system. System innovation goes beyond existing organisations and radically changes the relationship between companies, organisations and individuals. System innovation can be defined as a combination of technological, organizational and cultural changes that results in a totally new fulfilment of needs. Transitions and system innovations are seen as social learning processes. Currently, the public debate is focused on the performance characteristics of existing and future electric vehicles and in what way they fulfil customer and user requirements (e.g. driving range, speed, safety, costs, ease of use, and environmental impact). Although customer needs fulfilment of the vehicle is essential for the adoption of EVs by users, it is not the only factor that needs to be taken into account. EVs imply innovation at several levels of the mobility system; for user adoption, it is also necessary to develop an effective electrical and urban infrastructure that supports the

14 SCHIPHOL THE GROUNDS 2030
driver in making efficient use of an EV. For example, traditional fuel-based transportation is based on the wide availability of fuelling stations, optimally located at highways and within cities. The location of these fuelling stations is in part determined by the existing urban infrastructure (e.g. roads, intermodal hubs, and urban area functions) and related mobility patterns. With respect to EVs, the necessary electric and urban infrastructure is only partially available. Although most EVs can be charged with normal household sockets, charging solutions at business areas, large parking lots, flats, or crowded inner city streets have only received limited attention. Moreover, in order to be able to supply sufficient electricity to charge multiple EVs at a certain location within a certain time, the electrical infrastructure (grid) needs to be able to cope with this (peak) demand intelligently. This suggests that the transition to electric mobility in the next decades also requires changes and innovations at the level of urban and electrical infrastructures. The challenge is not only to design and improve efficient electric vehicles and mobility concepts, but also to design and implement urban and electrical infrastructure solutions that enable the transition to electric mobility. Adoption and diffusion of E-mobility Currently, the central question for regional authorities, local governments, cities and infrastructure and utility companies is how to accommodate and support the introduction of EVs into society. Primarily, this discussion is based on a 'technology-push' approach; EVs offer all kinds of new possibilities, they seem to have benefits for the environment, and infrastructural solutions have to be developed to support this in the best way possible. Although this is not incorrect, it tends to miss the point that the adoption of electric transportation is highly dependent on the evolution of mobility needs in the future. These mobility needs are partially determined by urban developments and the related geographic distribution of urban functions, as well as the consumer/user trends of the future. The challenge is to align the technical possibilities of EVs and the related infrastructure solutions in a better way with future mobility needs. In this project a user-driven approach will be applied. This will require: • Deep insight in user needs for mobility to identify new mobility solutions or to
improve the adoption of existing solutions. • Designing artefacts and creating visual representations in order to get quick
feedback from users and producers. • Designing artefacts to allow for experimentation and simulation, so that quick
feedback for improvement can be obtained. Making decisions in an uncertain world The past years have witnessed the introduction of numerous and very different electric vehicle concepts and electric charging infrastructures (e.g. charging poles, or batter swapping stations). Also, at the level of the components of electric vehicles, technological developments are rapidly occurring (new battery types, electric drive trains, power management systems, hybrid vehicles and range extenders). Only very recently has the standardization of components and designs begun, but no definite dominant designs have emerged and new concepts are still being developed. Also, the availability of electric vehicles is still limited, except for several types of hybrid electric vehicles. This places regional developers, local governments, infrastructure and utilities companies, and fleet owners in a difficult situation. Since the direction of the development and adoption path of EVs is still highly uncertain, making investments in the right infrastructure solutions in the long term is complex. As investments in infrastructural solutions tend to be high and returns accrue only in the long term, this creates high investment risks for these actors. The strategic challenge at this stage is not to invest in single, highly specialized infrastructural solutions (because it is still highly uncertain whether these solutions will become dominant),

SCHIPHOL THE GROUNDS 2030 15
but to develop and invest in solutions that allow and can accommodate many different technological options. This option-approach circumvents the risk of premature lock-ins in sub-optimal infrastructure and EV solutions.
3.3 Methodological approach The methodology for identifying, selecting, and developing the right combination of EV concepts, urban and electric infrastructure solutions has to facilitate the three strategic challenges as explained in the previous section: (1) It has to be able to address interdependent elements and sub-systems of the mobility system, (2) It should align future mobility and user needs with technological solutions, and (3) It should be able to identify the infrastructure and mobility solutions that can accommodate a wide variety of EV options in the future. The applied methodology is structured according to the following phases: analysis, scenario development, concept development, design prototyping and evaluation.
Analysis Within this phase a technology assessment is made of electric mobility in the Netherlands, mapping both developments on Hybrid Electric Vehicles (HEVs) and full Electric Vehicles (EVs). It covers not only technological developments relevant for electrical mobility at a system level, but also (policy) developments by the government and developments in niche markets, pilots and experiments in society. In addition, it identifies social, environmental and economic aspects of the large-scale introduction and adoption of electric mobility in the Netherlands.
The findings of the technology assessment are being validated during a workshop with important stakeholders. The main goal of this workshop is to (1) collect the expectations and opinions of these actors regarding relevant social aspects, barriers and drivers related to electric mobility up to the year 2030, and (2) to work on vision development for future electric mobility and to elaborate it for different types of built environments.
Based on the results of the Technology Assessment and workshop, all of the key factors that are relevant for the transition towards electric mobility will be identified. Ranking and clustering the key factors according to importance and uncertainty will lead to the formulation of the driving forces. These driving forces will form the input for the scenario development phase.
During the analysis, specific research will be executed on the climate and the sustainable energy potential of the selected area. The possibilities of local decentralized energy production for powering electric mobility at the Elzenhof The Grounds location will be investigated. Furthermore, the analysis of the urban context has to provide the most suited functionalities for the chosen location. Scenario development Scenario building is especially useful in circumstances in which it is important to take a long-term view of the technological developments and related strategies of the actors involved. It is also useful when there are a limited number of key factors influencing appropriate strategies, but also a high level of uncertainty about these influences. Scenario building tries to build plausible views of different possible futures for relevant actors based on groupings of certain key environmental influences and drivers of change. The result is a limited number of logically consistent yet different scenarios that can be considered alongside each other. There are two main benefits to scenario building. First, actors can examine the strategic options against the

16 SCHIPHOL THE GROUNDS 2030
scenarios and carry out a ‘what-if’ analysis. Scenarios can be used to determine the robustness of different strategies. Second, the implications of scenarios can be used to challenge pre-assumptions about the environment and technological development in which industry actors operate. This is especially important when change is unpredictable and industry actors are concerned with short-term interests, goals and results (Johnson & Scholes, 1997). Practice shows that scenarios have been applied in an increasing number of disciplines and sectors. Several overviews of the diversity of applications have been carried out (van Notten, Rotmans et al. 2003). Scenarios can be classified according to aspects such as project gal, scenario content and process design. Manzini (2006) makes the distinction between Policy-oriented scenarios (POS) and Design-oriented scenarios (DOS). Policy-oriented scenarios usually deal with the macro-scale of the socio-technical systems and present a variety of possible futures and facilitate political decisions. Design-oriented scenarios are conceived as tools to be used in design processes. These scenarios should propose a variety of comparable visions that have to be clearly motivated and enriched with visible and (potentially) feasible proposals. A Design-Oriented scenario is supposed to create inspiration for designers whether in industry, government, universities or NGOs, to design urban plans, products, services and social arrangements that might take steps towards the realisation of these scenarios (Green 2001). A DOS should contain the following elements: • Various proposals developed as concrete plans, products and/or services. • A global ‘vision’ picturing the effect of the implementation of the ‘proposals’ and
their possible impact. • The essential characteristics explaining the main effects and benefits that the
DOS is expected to have in terms of sustainability, economics and user acceptance.
• A storyboard, describing ‘a day in the life…’ of the mobility user in 2030. An assessment of the essential characteristics - sustainability, economics and user acceptance –will lead to the selection of the most promising scenario. This scenario will form the context for the concept development. To quantify the effects of the different scenarios, such as the impact on urban development in terms of the number of EVs and the pressure on the available space and facilities, an instrument referred to as the ‘Urban Indicator’ will be developed and applied. Concept development During the concept development phase, different options for urban plans, mobility concepts and electric infrastructures are being developed in parallel. One of the important instruments to be used in fostering the richness of the options generated is the morphological chart. “A morphological chart is a visual way to capture the necessary product functionality and explore alternative means and combinations of achieving that functionality. For each element of product function, there may be a number of possible solutions. The chart enables these solutions to be expressed and provides a structure for considering alternative combinations” (IFM 2009). Design prototyping Potentially demonstrable elements of the scenarios in the near future or solutions that can already be applied are important in order to show the potential of the transition towards electric mobility for Schiphol Airport City. These spin-offs will motivate the various stakeholders, whose support is needed for the long-term transition process.

SCHIPHOL THE GROUNDS 2030 17
Visual representations of the urban development, the mobility concepts, the e-infrastructure and the e-charging solutions will be important deliverables of the project. Due to the limited time available for the whole project, real physical prototyping is not an option. Evaluation This phase will not be included in the project. As part of the follow-up research within the DIEMIGO-program, the Schiphol the Grounds project will serve as a case to develop an evaluation framework for:
- The ecological aspects (ecological quality, emissions, and use of natural resources).
- The social aspects (perceived characteristics, acceptance of urban design, mobility concepts, and product-/service propositions).
- The economic aspects (return-on-investment and new business opportunities).

18 SCHIPHOL THE GROUNDS 2030
4 Challenges and Requirements
4.1 Technology assessment
4.1.1 Electric Vehicle Technology Conventional vehicles (CV) use an internal combustion engine to propel the vehicle, whereas electric vehicles (EV) use stored energy (rechargeable battery, ultra capacitors or flywheel) to drive an electric motor, which propels the vehicle. A hybrid electric vehicle (HEV) has both an internal combustion engine and an electric machine as power sources, with the overall aim of reducing fossil fuel consumption. The term ‘electric vehicle’ is used throughout this report according to the European standard IEC 61851 [Appendix 9.2]. The definition is given as follows:
Any vehicle propelled by an electric motor draining current from a rechargeable storage battery or from other portable energy storage devices (rechargeable, using energy from a source off the vehicle such as a residential or public electrical service), which is manufactured for use on public streets, roads or highways.
This description therefore covers fully electric/battery electric vehicles (BEV), plug-in hybrid electric vehicles (PHEV) and range extending solar electric vehicles (SEV). These types of vehicles will be the focus of this report. Both HEVs and PHEVs share common technology, so they are sometimes discussed in parallel. Fig 8 shows the configuration of the different types of vehicles.
(a)
(b)
(c)
(d)
Fig 8. (a) HEV, (b) PHEV, (c) BEV and (d) SEV Configurations

SCHIPHOL THE GROUNDS 2030 19
4.1.1.1 State of the Art Although most major vehicle manufacturers worldwide are in the process of developing EVs for mass production, the commercial availability of these vehicles is still limited. This may be due to many factors, including the fear of transition to new and largely unknown technology as well as the dependence on the electricity supply infrastructure. Many unknown factors also exist on a management level, on a technology level and on the end user level. Development strategies for EV manufacturers can be difficult to formulate, largely due to the dependence of the technology on the electrical power generation industry. Coupled with this is the uncertainty surrounding the use pattern of EVs in the future, which may differ from the manner in which conventional vehicles are used today. However in light of these difficulties, EV development is mainly focused on extending the all electric range (AER) of both PHEVs and BEVs and lowering costs (Ehsani 2005). The temporary nature of HEV technology is discussed in (RBGS 2008), where it is argued that the complexity of developing these vehicles may be inhibiting the development of more sustainable or zero emissions solutions, such as fully electric and fuel cell technologies. A summary of development strategies for OEM’s, component suppliers and emerging technology suppliers is provided, in light of alternative drive vehicles. A comprehensive overview of currently available EVs is provided in (Fuhs 2009), which also provides an outline for future plans for production of EVs up to the year 2013 (Fig 9).
Fig 9. EV Vehicles (RBGS 2008)
4.1.1.2 PHEV Technology Map The PHEV class of vehicle has the most complex configuration among the electric vehicles considered in this report. In order to improve fuel efficiency and reduce CO2 emissions, a dual power source is used to propel the vehicle. Many design challenges exist in developing optimum PHEVs, both on a component and control level. A classification method for hybrid vehicles is first presented, followed by a brief description of PHEV control systems.

20 SCHIPHOL THE GROUNDS 2030
4.1.1.2.1 Hybridization Rate The hybridization rate (HR) is a measure used to describe how strongly the powertrain is hybridized (Liao, Weber et al. 2004). It is defined as the ratio of electric power to total power and is described by Equation 1.1.
4.1
Where, Pem is the power provided by the electric machine and Pice is the power provided by the internal combustion engine. The classification of the different values of HR is shown in Table 1. Table 1. Hybridization rate classification
HR Classification CV (conventional vehicle)
HEV (mild and micro hybrid) HEV (semi hybrid)
HEV (full hybrid) BEV (battery electric vehicle)
Fig 10. Hybridization Rate In terms of hybrid classification, the one with the lowest contribution of electric power is referred to as a micro hybrid. In a micro hybrid, the electric motor is used for applications such as engine stop/start and regenerative braking, but it cannot be used to supply additional torque to the wheels. In a mild hybrid, the electric drive motor can assist the engine when extra power is needed, but it is incapable of propelling the vehicle. In a full hybrid, the electric motor is capable of propelling the vehicle on its own, generally for low speed manoeuvring and light cruising conditions.

SCHIPHOL THE GROUNDS 2030 21
Table 2. HEV Functionality
HEV Classification
Micro hybrid Mild hybrid Full hybrid
Functionality Engine start-stop whilst idling
Engine off while decelerating
Mild regenerative
braking
Electric power assist
Engine cycle optimization (Atkinson
cycle)
Full regenerative braking
All electric drive
Improvement of fuel economy (%)
2-4 10-20 30+
4.1.1.2.2 PHEV Vehicle Configuration PHEV’s have similar powertrain architecture to that of HEVs, with the addition of a connection to a mains supply. They are broadly categorized by the connection of the powertrain components, which define the energy flow and control ports. The main architectures are: series, parallel and series-parallel. A schematic of these configurations is show in Fig 11 and a comparison of the fuel economy and driving performance is shown in Table 3 (TMC 2003). Series The use of an internal combustion engine to drive a generator and provide electrical power for one or more traction motors is a common propulsion method which has been used in locomotives for many years (Miller 2004). The series hybrid is based on this technology, with the addition of some form of energy storage. The traction motor is the only power supply unit with a direct connection to the road wheels. The advantage is that the internal combustion engine can be operated at its most efficient point to generate the necessary current for driving the traction motor or charging the battery. This type of configuration is most advantageous for start-stop style driving, such as public urban transport. Parallel The parallel hybrid architecture can simultaneously transmit power to the drive wheels from both the internal combustion engine and the battery-powered electric drive. Although most parallel hybrids have a traction motor between the vehicle's engine and transmission, a parallel hybrid can also use its engine to drive one of the vehicle's axles while the electric motor drives the other axle and/or a generator used for recharging the batteries. Series-parallel The series-parallel or dual-mode hybrid has the flexibility to operate in either series or parallel mode. These types of hybrid power trains are currently used by Ford, Nissan and Toyota and the advantage is that both series and parallel hybrid modes are possible. Since 2007, most plug-in hybrid conversions have made use of this architecture. Although this type of architecture is more flexible in terms of driving modes, it is also more complex and costly.

22 SCHIPHOL THE GROUNDS 2030
Fig 11. HEV Architecture Table 3. HEV Architecture Comparison
Fuel economy improvement Driving performance
Idling stop
Energy recovery
High efficiency
control
Total efficiency
Acceleration Continuous high output
Series Good Excellent Good Good Poor Poor Parallel Good Good Poor Good Good Poor Series-Parallel
Excellent Excellent Excellent Excellent Good Good
4.1.1.2.3 PHEV Components and Control A general representation of the main components in a series-parallel PHEV is shown in Fig 12, which shows the power flow between components and the control structure required to ensure optimum performance. The driver input is represented by the accelerator pedal angle φacc and the brake pedal angle φdec. As described in (TMC 2003), the ICE used in commercially available HEVs is different from those used in conventional vehicles. A heat cycle engine is used, which has a higher thermal efficiency but limited output. It is ideal for use in HEVs, as additional power can be provided by the secondary power source. The main electrical components used for the secondary power source are the electric machine, the power converters and the battery. These are similar to the components used in BEVs, which are described in Section 1.3.

SCHIPHOL THE GROUNDS 2030 23
Fig 12. PHEV Technology Transmission and Powertrain Control The driving performance of a PHEV is a crucial factor in determining the market success of this type of vehicle. ‘Driveability’ is a term used to describe the performance of a vehicle in response to a driver’s input.
Good vehicle driveability is characterized by the driver having ease of control of the vehicle and confidence in both predictable and desirable responses to the drivers demands. It is very much dominated by the performance of the powertrain and vehicle in transient conditions (Wicke, Brace et al. 2000).
From this description, it is evident that driveability is mainly concerned with the longitudinal dynamics of a vehicle in response to driver inputs. In a vehicle with dual power sources, such as the PHEV, powertrain control is crucial to ensure smooth power delivery to the road wheels and therefore good driveability. Coupling of the torque produced by the internal combustion engine with that produced by the electric machine can be achieved with planetary gear sets or continuously variable transmissions (CVT). The control of these components is challenging for the powertrain engineer, especially in keeping costs as low as possible. Planetary or epicyclic gear sets are commonly used in vehicles with automatic transmission and have been employed in PHEV transmission systems (Miller 2004). CVT’s offer a continuous gear ratio between input and output shafts, ensuring a smoother transition between driving states. The hydraulic clamping forces can be high and as a result, efficiencies are lower than with an epicyclic system. Energy Management The overall aim of an energy management system (EMS) is to minimize the fuel consumption, whilst ensuring that the driver’s demands are met. Managing the power being transmitted to the road wheels in a PHEV is a complex task and many methods have been adopted, including rule based systems and those based on various optimization algorithms (Hofman, Steinbuch et al. 2007). Rule based systems are generally more intuitive, but an in depth knowledge of the system is required.
24 SCHIPHOL THE GROUNDS 2030
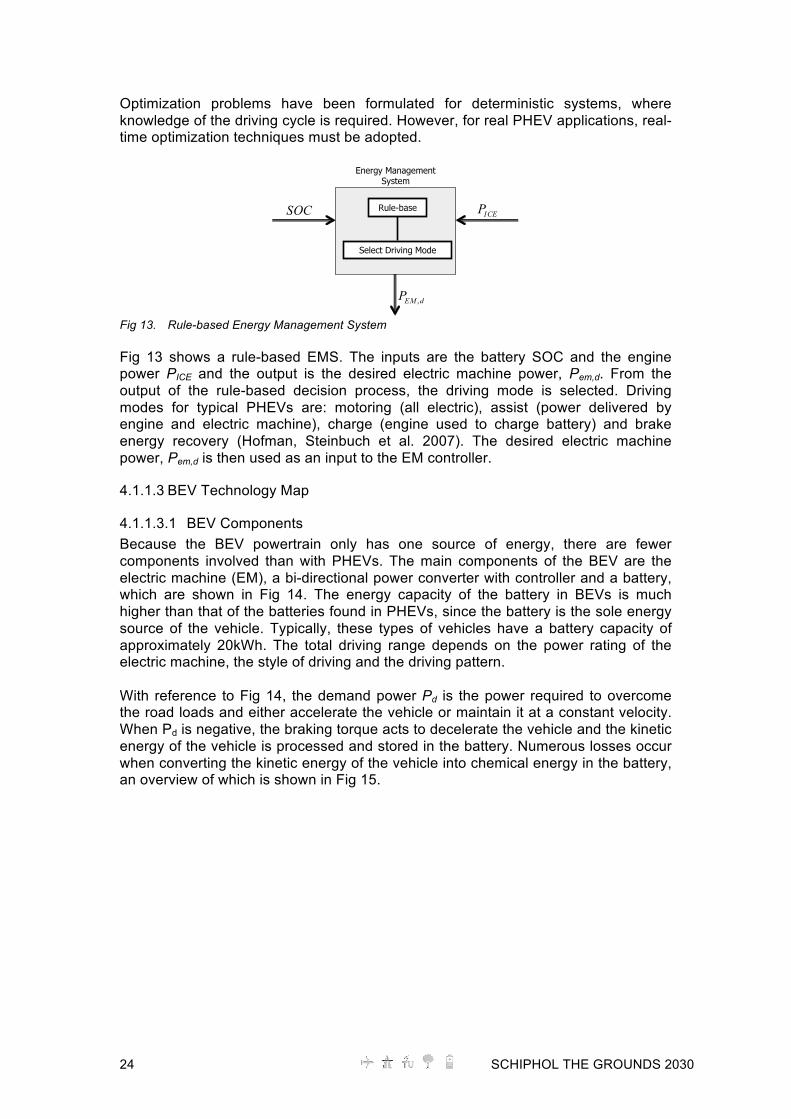
Optimization problems have been formulated for deterministic systems, where knowledge of the driving cycle is required. However, for real PHEV applications, real-time optimization techniques must be adopted.
Fig 13. Rule-based Energy Management System Fig 13 shows a rule-based EMS. The inputs are the battery SOC and the engine power PICE and the output is the desired electric machine power, Pem,d. From the output of the rule-based decision process, the driving mode is selected. Driving modes for typical PHEVs are: motoring (all electric), assist (power delivered by engine and electric machine), charge (engine used to charge battery) and brake energy recovery (Hofman, Steinbuch et al. 2007). The desired electric machine power, Pem,d is then used as an input to the EM controller.
4.1.1.3 BEV Technology Map
4.1.1.3.1 BEV Components Because the BEV powertrain only has one source of energy, there are fewer components involved than with PHEVs. The main components of the BEV are the electric machine (EM), a bi-directional power converter with controller and a battery, which are shown in Fig 14. The energy capacity of the battery in BEVs is much higher than that of the batteries found in PHEVs, since the battery is the sole energy source of the vehicle. Typically, these types of vehicles have a battery capacity of approximately 20kWh. The total driving range depends on the power rating of the electric machine, the style of driving and the driving pattern. With reference to Fig 14, the demand power Pd is the power required to overcome the road loads and either accelerate the vehicle or maintain it at a constant velocity. When Pd is negative, the braking torque acts to decelerate the vehicle and the kinetic energy of the vehicle is processed and stored in the battery. Numerous losses occur when converting the kinetic energy of the vehicle into chemical energy in the battery, an overview of which is shown in Fig 15.

SCHIPHOL THE GROUNDS 2030 25
Fig 14. BEV Technology
Fig 15. Brake Energy Recovery Losses Power flow in a BEV is controlled via the EM controller, which controls the power delivered to or extracted from the battery. This is achieved by evaluating the driver intention via the pedal inputs. Based on the control inputs from the brake and accelerator pedals (φacc and φdec), the EM controller provides appropriate signals to the power converter, whose function is to regulate power flow between the electric motor and energy source. As the BEV can be connected to a mains supply, it can also operate in vehicle-to-grid (V2G) and grid-to-vehicle (G2V) modes. However, operating in V2G mode requires a control interface between the vehicle and the grid connection. Electric Machine Selecting the power rating of an electric machine for use within a BEV depends on the vehicle mass and the desired acceleration performance (Miller 2004). For PHEVs, the hybridization rate must also be considered. Many types of electric machines exist, which can be used to provide the necessary propulsion power. Some general requirements of electric machines for use within both PHEVs and BEVs are as follows (Hussain 2003):
• Ease of control • Fault tolerance • High efficiency • High power at high speed (cruising) • High power density • High low-speed torque (accelerating) • Peak torque 2-3 times continuous torque rating • Extended constant power region of operation • Low acoustic noise • Low electromagnetic interference (EMI)
Mechanical losses Rolling resistance losses, mechanical brake losses, transmission losses, engine drag torque
Electrical losses EM drag torque, EM conversion losses, converter losses, internal resistance of battery
Stored Energy
Kinetic Energy

26 SCHIPHOL THE GROUNDS 2030
Electric machine design should be optimized so that the kinetic energy of the vehicle generates as much electrical power as possible and so that the stored energy from the battery can be delivered to the road wheels as efficiently as possible. EV motors differ from industrial motors, as they generally require high low-speed torque, enabling the vehicle to meet acceleration requirements. A wide range of operating speeds is also a requisite. In contrast, industrial motors are generally optimized for specific rated conditions and have less dynamic operating conditions. Four types of electric machines have been used in both PHEVs and BEVs to date, which are outlined as follows:
• Brushed DC motor • Induction motor • Permanent magnet motor • Switched reluctance motor
Fig 16. Electric Machine Performance for EVs (Zeraoulia, Benbouzid et al. 2006) Evaluating the benefits of different machine designs for use within BEVs is a complex process. In (Zeraoulia, Benbouzid et al. 2006), a scoring system was applied to the four main types of electric machines used in BEVs, the results of which are shown in Fig 16. It was concluded that both induction motors and permanent magnet motors are the most suitable, and it was suggested that both technologies could be applied to achieve an optimum BEV driveline configuration. An overview is also provided of the various electric machine technologies applied to currently available PHEVs and BEVs. With reference to Fig 17, electric machines are sometimes characterized with respect to the speed range, constant torque range and constant power range. At speeds above the base speed the torque decreases, resulting in constant power. The effects of extending the constant power operating region of an electric machine on the performance of a simple BEV model were examined in (Moore, Rahman et al. 1999). Performance parameters examined were acceleration time and distance, and overtaking time and distance. For high speed cruising, it was generally found that electric machines with higher extended range ratios (ratio of constant torque region to constant power region), the acceleration time and distance increased.
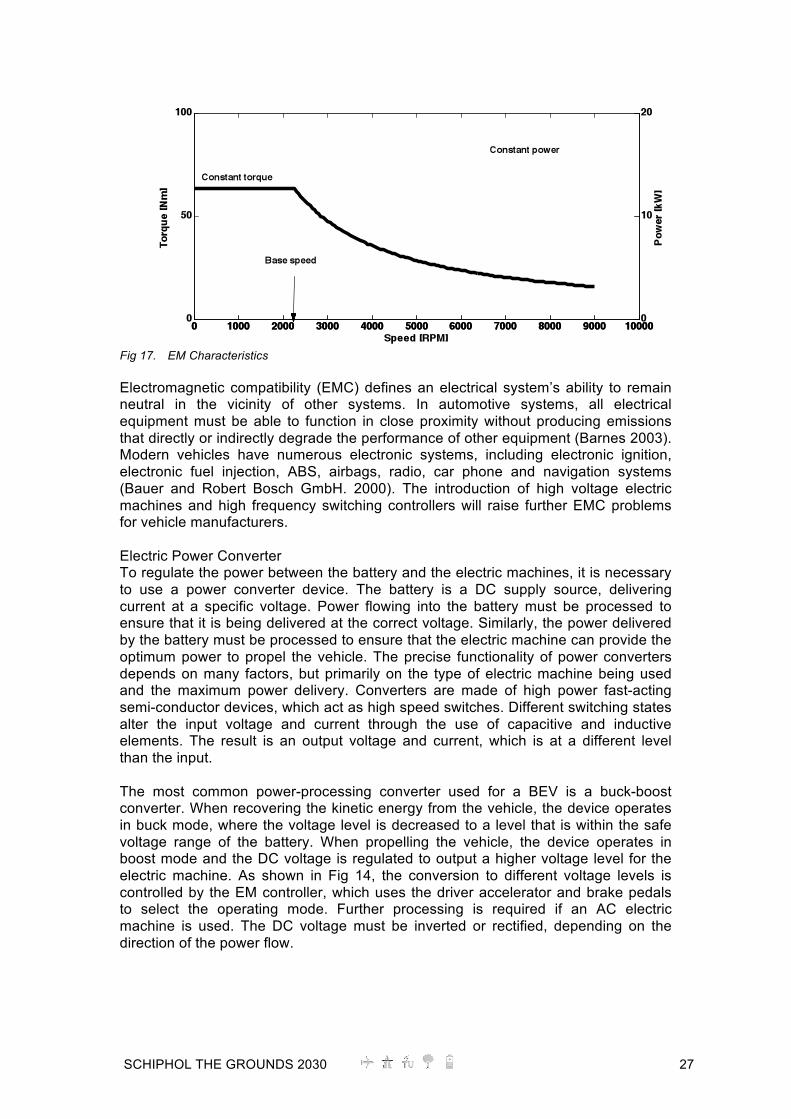
SCHIPHOL THE GROUNDS 2030 27
Fig 17. EM Characteristics Electromagnetic compatibility (EMC) defines an electrical system’s ability to remain neutral in the vicinity of other systems. In automotive systems, all electrical equipment must be able to function in close proximity without producing emissions that directly or indirectly degrade the performance of other equipment (Barnes 2003). Modern vehicles have numerous electronic systems, including electronic ignition, electronic fuel injection, ABS, airbags, radio, car phone and navigation systems (Bauer and Robert Bosch GmbH. 2000). The introduction of high voltage electric machines and high frequency switching controllers will raise further EMC problems for vehicle manufacturers. Electric Power Converter To regulate the power between the battery and the electric machines, it is necessary to use a power converter device. The battery is a DC supply source, delivering current at a specific voltage. Power flowing into the battery must be processed to ensure that it is being delivered at the correct voltage. Similarly, the power delivered by the battery must be processed to ensure that the electric machine can provide the optimum power to propel the vehicle. The precise functionality of power converters depends on many factors, but primarily on the type of electric machine being used and the maximum power delivery. Converters are made of high power fast-acting semi-conductor devices, which act as high speed switches. Different switching states alter the input voltage and current through the use of capacitive and inductive elements. The result is an output voltage and current, which is at a different level than the input. The most common power-processing converter used for a BEV is a buck-boost converter. When recovering the kinetic energy from the vehicle, the device operates in buck mode, where the voltage level is decreased to a level that is within the safe voltage range of the battery. When propelling the vehicle, the device operates in boost mode and the DC voltage is regulated to output a higher voltage level for the electric machine. As shown in Fig 14, the conversion to different voltage levels is controlled by the EM controller, which uses the driver accelerator and brake pedals to select the operating mode. Further processing is required if an AC electric machine is used. The DC voltage must be inverted or rectified, depending on the direction of the power flow.

28 SCHIPHOL THE GROUNDS 2030
Fig 18. Typical BEV Power Electronics Fig 18 illustrates the typical layout of power electronics components in a BEV, which is connected to an off-board charger. The auxiliary supply provides the necessary power for equipment within the vehicle. This is usually 12V for current vehicles but may be increased to 42V for future vehicles. A three-phase induction motor or a permanent magnet is typically selected (Emadi, Ehsani et al. 2003) to propel the vehicle. In general, the mechanical transmission is based on fixed gearing and a differential, but there are many possibilities for BEV configurations, depending on cost and performance constraints.
4.1.1.3.2 BEV Vehicle Configurations A number of configurations are possible for BEVs, which provides more flexibility for the driveline layout. Single motor configurations usually drive either front or rear axles, while the wheels are driven synchronously. With a dual motor configuration, each wheel can be driven independently, which means that there is more control over the vehicle when cornering. Fig 19(a) shows the components and Fig 19(b) shows the electrical schematic for a BEV with a dual motor configuration. Although most EV manufacturers currently adopt the single motor configuration, the dual motor configuration has been also been used (Westbrook 2001).

SCHIPHOL THE GROUNDS 2030 29
Fig 19. Dual Motor Configuration Components (a) and Electrical Schematic (b) Another possibility is using a separate motor to drive each wheel independently. The in-wheel motors can be either geared or gearless, as represented in Fig 20 (a) and (b) respectively. The gearless option has the potential to improve the overall efficiency of the driveline, but additional controller complexity and required hardware make such a system more complex. Fig 20 (c) shows the electrical schematic for the in-wheel motor configuration.
Fig 20. In-wheel Motor Configurations – Geared (a), Gearless (b) and Electrical schematic (c)

30 SCHIPHOL THE GROUNDS 2030
4.1.1.4 Prospects and Developments In terms of prospects for future development of EVs, three areas have been identified. These are as follows:
• Use of photovoltaic (PV) cells as range extenders for EVs • Integration of EVs with a smart charging infrastructure • Optimal use of stored energy in the vehicle
4.1.1.4.1 Solar Electric Vehicle (SEV) The use of photovoltaic cells to power electric vehicles is limited by the low efficiency, the low power density and the high cost of this technology. For these reasons, the successful development of SEVs has been restricted to one-off vehicles, such as prototypes or competition vehicles. An overview of the component specifications of some of these vehicles is provided in Table 4. Table 4. SEV Performance Parameters
SEV Koenigsegg Quant
(Koenigsegg 2009)
TU Delft Nuna 5
Cambridge University
CUER
Solar taxi
PV cell technology
Thin film PV with
Pyradian coating
Gallium-arsenide
triple junction
Silicon cells
Monocrystalline
PV cell area
No data 6m2 6m2 6m2
PV cell efficiency*
38% (theoretical)
28% 21% 16%
PV cell power+
No data 1.68kW 1.26kW 0.96kW
Energy storage
NLV mobile redox Flow
Accumulator Energy Storage
5kWh Li- polymer
5kWh Li-polymer
14.1kWh ZEBRA
Electric motor
No data No data 1.8kW brushless DC hub motor
No data
*Efficiency figures for AM1.5 +Power based on irradiance of 1kWm-2
According to (Wyrsch 2006), large scale use of PV cell powered vehicles will only be achieved when costs are reduced, crash safety regulations are met, mass produced low-weight PV cells are available and consumer acceptance is high. A more realistic short term solution is to employ PV cells to power auxiliary equipment within a SEV, as shown in Fig 21. This would reduce the total load on the battery, enabling all of the battery energy to be used solely for propulsion and thus extend the range of the battery.

SCHIPHOL THE GROUNDS 2030 31
Fig 21. PV Technology for Automotive Applications
Fig 22. Solar Cell Efficiencies (Source NREL.gov) Two major restrictions exist in using PV cells for automotive applications: the limited surface area and additional mass penalty. Increasing the efficiency and enabling more surface area to be covered with PV cells would increase the power output. Today’s conventional vehicles have a total surface area of approximately 2.5m2 (excluding windows), which could be covered with PV cells. To cover the windows of the vehicle, PV cells with a transparency of 70-80% is required. The power density of PV cells must be sufficiently low to ensure that no additional mass penalty is imposed. Thin-film PV cells offer the most promising solution. It was shown in (Wyrsch 2006) that an amorphous silicon cell was developed with a power density of 3.2Wg-1 for AM1.5 and 4.3Wg-1 for AM0. This particular application was optimized for power density instead of efficiency, as it was being developed for space applications. An overview of the best research cell efficiencies is shown in Fig 22.

32 SCHIPHOL THE GROUNDS 2030
Fig 23. SEV Technology Although most advanced PV cell technologies are developed for the space industry, cost and mass production issues mean that they are unsuitable for the automotive industry. Some automotive companies are looking towards the development of thin film solar technologies for extending the driving range of EVs (Koenigsegg 2009). Fig 23 shows a proposed schematic of a range-extending SEV. The PV module is used to provide additional energy to the battery and a possible power electronics topology is shown in Fig 24.
Fig 24. SEV Power Electronics Topology
4.1.1.4.2 Smart charging control systems To implement a controlled charging infrastructure, reliable 2-way communication links must be established with electricity suppliers and the battery management system (BMS), which must include additional functionality for integrating with a smart grid control network. A schematic for a smart charging system is shown in Fig 25, where the user input is a departure time and the desired SOC on departure. It should

SCHIPHOL THE GROUNDS 2030 33
be noted that for controlled charging infrastructure, the power flow is uni-directional whereas for a V2G infrastructure, there is bi-directional power flow.
Fig 25. Controlled Charging from Smart Grid
4.1.1.4.3 Energy management Research has been reported on using GPS data to optimize the energy management strategy for HEVs (van Keulen 2009). This type of optimization strategy could also be applied for both BEVs and SEVs. Using route information, it is possible to optimize the vehicle trajectory, especially for maximizing brake energy recovery. Traffic and weather data could also be used as inputs to the energy management system, ensuring the minimum fuel consumption for a planned journey. This type of energy management strategy could be useful for heavy-duty vehicles that operate on fixed-route services. For passenger vehicles, a GPS energy management system, coupled with a smart charging grid, could provide a convenient way to ensure that the EV is sufficiently charged for further journeys.
4.1.2 Battery Technology
4.1.2.1 State of the Art Electrochemical storage devices used in EV must fulfil certain requirements, so that the EV can perform in a satisfactory manner. The key requirements are as follows:
• High specific power so that the driver’s acceleration expectations can be met • High specific energy to ensure a satisfactory range • Long, maintenance-free lifetime • Safe operation under a wide range of conditions • End of life disposal has a minimum environmental impact • High efficiency in charge and discharge cycles
The power and energy requirements for different types of EVs are listed in Table 5, together with common voltage ratings. For the purposes of this report, five categories of EV batteries are described, which is similar to that described by (Van den Bossche, Vergels et al. 2006)and (Westbrook 2001). These categories are outlined as follows:
• Lead acid • Nickel based: NiMH, NiCad • High temperature: Sodium-nickel-chloride (NaNiCl or Zebra) • Lithium based : Lithium-ion (Li-ion) and Lithium-polymer (Li-poly) • Metal air: Aluminium air (Al-air) and Zinc-air (ZN-air)
Grid Bus
Power line
Data line
BMS User inputs
Time to depart and desired
SOC
Battery
Charge Control
Off board charger
Charge station controller
Connector
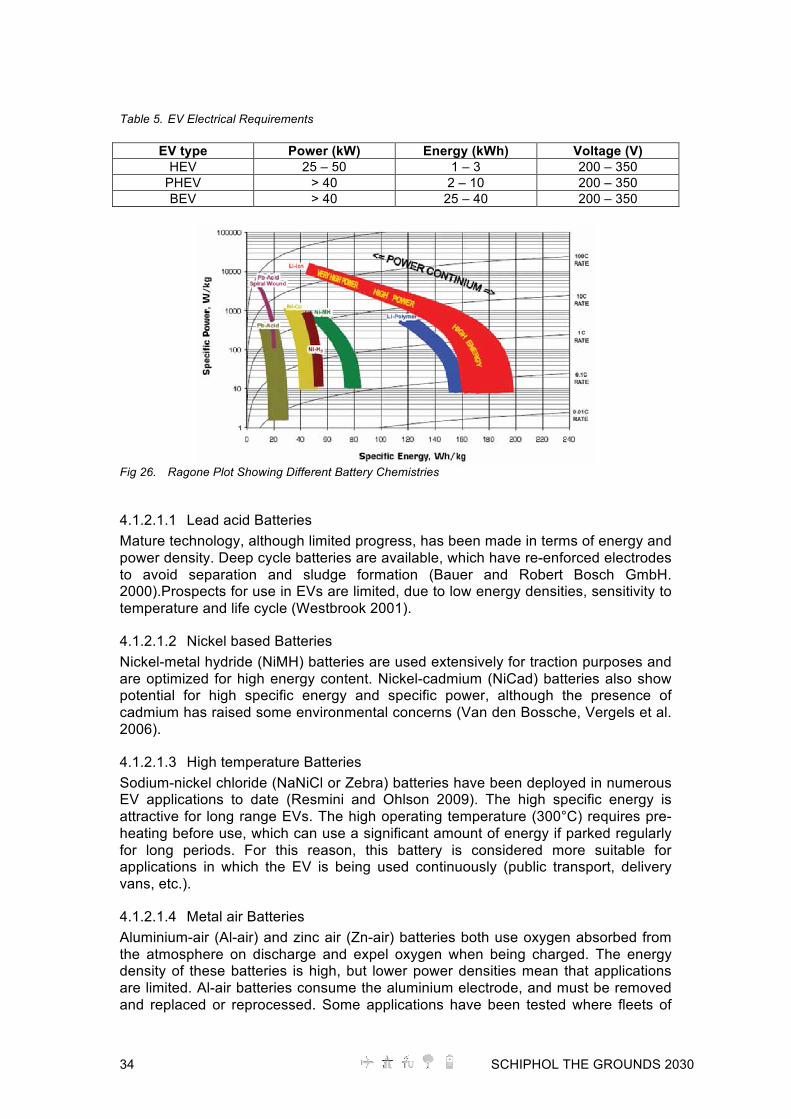
34 SCHIPHOL THE GROUNDS 2030
Table 5. EV Electrical Requirements
EV type Power (kW) Energy (kWh) Voltage (V) HEV 25 – 50 1 – 3 200 – 350
PHEV > 40 2 – 10 200 – 350 BEV > 40 25 – 40 200 – 350
Fig 26. Ragone Plot Showing Different Battery Chemistries
4.1.2.1.1 Lead acid Batteries Mature technology, although limited progress, has been made in terms of energy and power density. Deep cycle batteries are available, which have re-enforced electrodes to avoid separation and sludge formation (Bauer and Robert Bosch GmbH. 2000).Prospects for use in EVs are limited, due to low energy densities, sensitivity to temperature and life cycle (Westbrook 2001).
4.1.2.1.2 Nickel based Batteries Nickel-metal hydride (NiMH) batteries are used extensively for traction purposes and are optimized for high energy content. Nickel-cadmium (NiCad) batteries also show potential for high specific energy and specific power, although the presence of cadmium has raised some environmental concerns (Van den Bossche, Vergels et al. 2006).
4.1.2.1.3 High temperature Batteries Sodium-nickel chloride (NaNiCl or Zebra) batteries have been deployed in numerous EV applications to date (Resmini and Ohlson 2009). The high specific energy is attractive for long range EVs. The high operating temperature (300°C) requires pre-heating before use, which can use a significant amount of energy if parked regularly for long periods. For this reason, this battery is considered more suitable for applications in which the EV is being used continuously (public transport, delivery vans, etc.).
4.1.2.1.4 Metal air Batteries Aluminium-air (Al-air) and zinc air (Zn-air) batteries both use oxygen absorbed from the atmosphere on discharge and expel oxygen when being charged. The energy density of these batteries is high, but lower power densities mean that applications are limited. Al-air batteries consume the aluminium electrode, and must be removed and replaced or reprocessed. Some applications have been tested where fleets of

SCHIPHOL THE GROUNDS 2030 35
EV delivery vehicles are running with Zn-air batteries, where removable zinc cassettes can be replaced when discharged by recharged units. The low specific power of metal air batteries may require these battery types to be restricted to long distance delivery vehicles, but the advantages of regenerative braking may be sacrificed.
4.1.2.1.5 Lithium based Batteries Lithium based batteries are classified by the type of active material. Two main types exist, those with liquid (Li-ion-liquid) and those with polymer electrolyte (Li-ion-polymer). The Li-ion-liquid type is generally preferred for EV applications. Within the Li-ion-liquid type, there are three lithium materials: lithium cobalt, (or lithium manganese oxides), lithium iron phosphate and lithium titanate. Lithium Manganese Lithium manganese (LiMn2O4) offers a potentially lower cost solution. It has been largely studied for electrical vehicle application, especially in Japan. The drawback of this type of battery is the poor battery life due to the slight solubility of Mn. Lithium iron phosphate Lithium iron phosphate (LiFePO4) batteries are manufactured by many companies in the world and have gained credibility as a result of their use in power tools. Lithium iron phosphate cells have a much lower energy density than standard format cells, but can be charged much faster (on the order of twenty to thirty minutes). LiFePO4 has been recently considered because it features improved stability during overcharge, which is good for safety, very high power and the potential for lower cost due to the use of iron. Lithium titanate Lithium titanate allows charging on the order of ten minutes and has been shown to have an extremely long cycle life - on the order of 5000 full depth of discharge cycles. Lithium titanate has high inherent safety because the graphite anode of two other batteries is replaced with a titanium oxide. Table 6. Qualitative Comparison of EV Batteries (adapted from (Pistoia 2009))
Attribute Lead-acid Ni-MH ZEBRA Metal-air Li-ion
Specific energy (kWhkg-1) 1 2 3 3 3
Specific power (kWkg-1) 1 3 1 1 3
Capacity (kWh) 1 2 3 3 3
Discharge power (kW) 3 2 2 1 3
Charge power (kW) 1 2 2 1 3
Cold temperature performance (kW and kWh) 3 2 3 2 1
Shallow cycle life 2 3 1 1 3
Deep cycle life 1 3 1 1 2
Cost (€kW-1 or €kWh-1) 3 1 1 1 1
Abuse tolerance 3 3 2 2 2
Maturity technology 3 3 2 2 2
Maturity manufacturing 3 1 2 2 1
Recyclability (Van den Bossche, Vergels et al.
2006)
1 1 3 2 2
1=poor; 2=fair; 3=good

36 SCHIPHOL THE GROUNDS 2030
4.1.2.2 Prospects and Developments The increasing demand on portable energy storage devices is pushing the development of secondary battery cells. With increasing demand comes diversity of application, which also applies to the field of EV battery technology. As summarized by Axsen et al (Axsen, Burke et al. 2008), the limiting factors of current battery technology for use in EV applications are specific power, specific energy, lifetime, safety and cost. A review of ongoing research addressing these issues is presented below.
4.1.2.2.1 Specific Power The ability of a battery to deliver and accept energy at very high rates is limited by the physical processes occurring within the battery cells. When current flows into the battery, the reaction within the cell must occur at a corresponding rate (Kiehne 2003). This means that the dynamics of the reaction at the electrode surface and the transport of ions (kinetic properties) must occur at the same rate as the supplied current. Because of the high currents associated with high power, the reaction rate is unable to match the rate at which current is being supplied. As a result, the capacity of the battery is reduced and joule heating occurs within the cell. Hybrid Energy Storage One method of achieving electrical energy storage with a high specific power is to use ultracapacitors (UC) (Guidi 2009). The use of UC’s alone would not suffice, as these components display poor specific energy characteristics. The ideal solution is to use a hybrid energy storage method in a parallel configuration as shown in Fig 27. This type of set up combines the high specific power density of UC’s with the higher specific energy of an electrochemical battery (B). Fig 27(a) shows the case for a low power demand, where B is able to charge the UC. Fig 27(b) shows the case where a higher power is demanded and both B and UC contribute to the total power supply. Both energy storage sources can be recharged using regenerative braking, as shown in Fig 27(c). However, this type of configuration is more costly, due to the additional components and the additional complexity in controlling and managing both power sources. This cost could be offset by selecting a battery technology which has high specific energy, as specific power is no longer a requirement to fulfil. Materials for Fast Charging
A recent article (Kang and Ceder 2009) published by MIT describes a material with high lithium bulk mobility. This describes the mobility of electrons within a reacting material and can be related to the current flowing into the cell. The article describes how the power capability of a lithium battery critically depends on the rate at which the lithium ions can migrate through the electrolyte and electrode structure into the active electrode material. The high rate capability of the proposed material (LiFePO4) enables full battery discharge in 10-20s, with a specific power of 170 kWkg-1 at 400C and 90 kWkg-1 at 200C. Table 7 compares the quoted specific power capabilities of using the proposed material with existing battery technology.
(a) Low power demand

SCHIPHOL THE GROUNDS 2030 37
(b) High power demand
(c) Regenerative braking
Fig 27. Hybrid Energy Storage Table 7. Specific Power Comparison
Battery Technolo
gy
Pb Acid VRLA NiCd Ni MH ZEBRA Li-Ion Li-ion poly
Ultra-capacit
or (Miller and
Smith)
Li-Ion with new
material (Kang and
Ceder 2009)
Specific Power
[kWkg-1]
0.075 0.15 0.12 0.2 0.15 0.35 – 3 0.35 13-17 170
It should be noted that the objective of this work was to verify the theoretical capabilities of the proposed material in both charge and discharge scenarios. However, experimental results were only presented for the discharge case. Although the results in this article have been disputed (Zaghib, Goodenough et al. 2009) and consequently defended (Ceder and Kang 2009), it demonstrates that there is much research activity in achieving a battery chemistry with high rate capabilities.
4.1.2.2.2 Specific Energy The restricted energy content of batteries is one of the major drawbacks limiting the successful implementation of EV technology. Considering the specific energy of gasoline is 11.8kWhkg-1 corresponding to more than 2kWhkg-1 useful specific energy (Westbrook 2001), the limitations of the battery powered EV become apparent. Two emerging battery technologies addressing the specific energy limitations are lithium air (Li-air) and lithium flour (Li-flour). Li-Air It has been stated that the specific energy of conventional batteries will not exceed 250Whkg-1, and further advancements will depend fundamentally on new approaches and new materials (Broussely and Archdale 2004). In lithium air batteries, oxygen is drawn in from the atmosphere and consequently used in the reaction, resulting in a safe, compact and lightweight construction. It is also stated that using an O2 electrode could increase the capacity by 5-10 fold (Bruce 2008).

38 SCHIPHOL THE GROUNDS 2030
Fig 28. Specific Energy Comparison
4.1.2.2.3 Battery Lifetime A hybrid energy storage system utilizing a low power battery with a high power ultracapacitor can also reduce the stress on individual cells within a battery pack. Such a system ensures that individual battery cells are operating at their optimum power rating. However, the main system employed to address lifetime issues associated with EV battery packs is the Battery Management System (BMS). Battery Management System (BMS) Individual battery cells a show a reduction in capacity with increasing charge and discharge cycles, as well as variations in temperature. When cells are connected in a series or parallel configuration as in a battery pack, management and control of the charge and discharge conditions becomes crucial to extend the lifetime and limit ageing effects of individual cells. A battery management system (BMS) is used to monitor, control and balance the pack. The main functions of a BMS are outlined in Fig 29 and a schematic layout is shown in Fig 30. The cost and complexity of a BMS depends on the functionality and intelligence built into the management system. State-of-charge (SOC) estimation is an important parameter to measure accurately, especially if EVs are integrated with a smart electrical grid. Different methods of estimating SOC are detailed in (Pop 2008).

SCHIPHOL THE GROUNDS 2030 39
Fig 29. BMS Functionality
Fig 30. BMS Schematic
Thermal control and management Because the performance of battery cells varies with temperature, it is therefore crucial to include a thermal management system in the battery pack. This ensures that all cells are both electrically and thermally balanced and, as a result, the lifetime will be extended. An ideal thermal management system will fulfil many requirements, as outlined in Fig 31. Thermal management systems can either use air or liquid as
CAN PHEV/BEV
CAN BMS
BATTERY PACK
VOLTAGE CONTROL
& CURRENT CONTROL
& SOC
ESTIMATION
THERMAL MANAGEMENT
THERMAL CONTROL
ISOLATION FAULT DETECTION POWER MANAGEMENT
CELL BALANCING
R1
R2
COOLING SYSTEM
TEMPERATURE SENSOR
VEHICLE CONTROLLER - Motor Control and EMS
BATTERY MANAGEMENT
SYSTEM (BMS)
VOLTAGE CONTROL
CURRENT CONTROL
THERMAL CONTROL
ISOLATION FAULT DETECTION
THERMAL MANAGEMENT POWER MANAGEMENT
CELL BALANCING
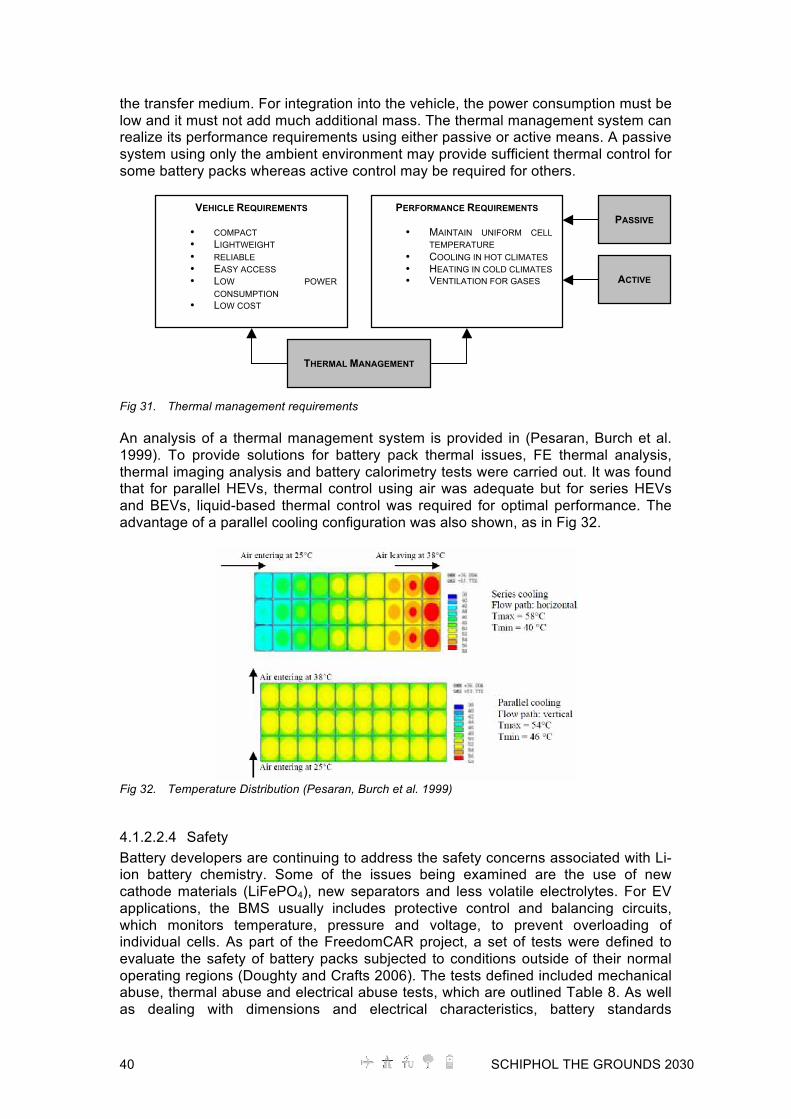
40 SCHIPHOL THE GROUNDS 2030
the transfer medium. For integration into the vehicle, the power consumption must be low and it must not add much additional mass. The thermal management system can realize its performance requirements using either passive or active means. A passive system using only the ambient environment may provide sufficient thermal control for some battery packs whereas active control may be required for others.
Fig 31. Thermal management requirements An analysis of a thermal management system is provided in (Pesaran, Burch et al. 1999). To provide solutions for battery pack thermal issues, FE thermal analysis, thermal imaging analysis and battery calorimetry tests were carried out. It was found that for parallel HEVs, thermal control using air was adequate but for series HEVs and BEVs, liquid-based thermal control was required for optimal performance. The advantage of a parallel cooling configuration was also shown, as in Fig 32.
Fig 32. Temperature Distribution (Pesaran, Burch et al. 1999)
4.1.2.2.4 Safety Battery developers are continuing to address the safety concerns associated with Li-ion battery chemistry. Some of the issues being examined are the use of new cathode materials (LiFePO4), new separators and less volatile electrolytes. For EV applications, the BMS usually includes protective control and balancing circuits, which monitors temperature, pressure and voltage, to prevent overloading of individual cells. As part of the FreedomCAR project, a set of tests were defined to evaluate the safety of battery packs subjected to conditions outside of their normal operating regions (Doughty and Crafts 2006). The tests defined included mechanical abuse, thermal abuse and electrical abuse tests, which are outlined Table 8. As well as dealing with dimensions and electrical characteristics, battery standards
THERMAL MANAGEMENT
VEHICLE REQUIREMENTS
• COMPACT • LIGHTWEIGHT • RELIABLE • EASY ACCESS • LOW POWER
CONSUMPTION • LOW COST
PERFORMANCE REQUIREMENTS
• MAINTAIN UNIFORM CELL TEMPERATURE
• COOLING IN HOT CLIMATES • HEATING IN COLD CLIMATES • VENTILATION FOR GASES
PASSIVE
ACTIVE
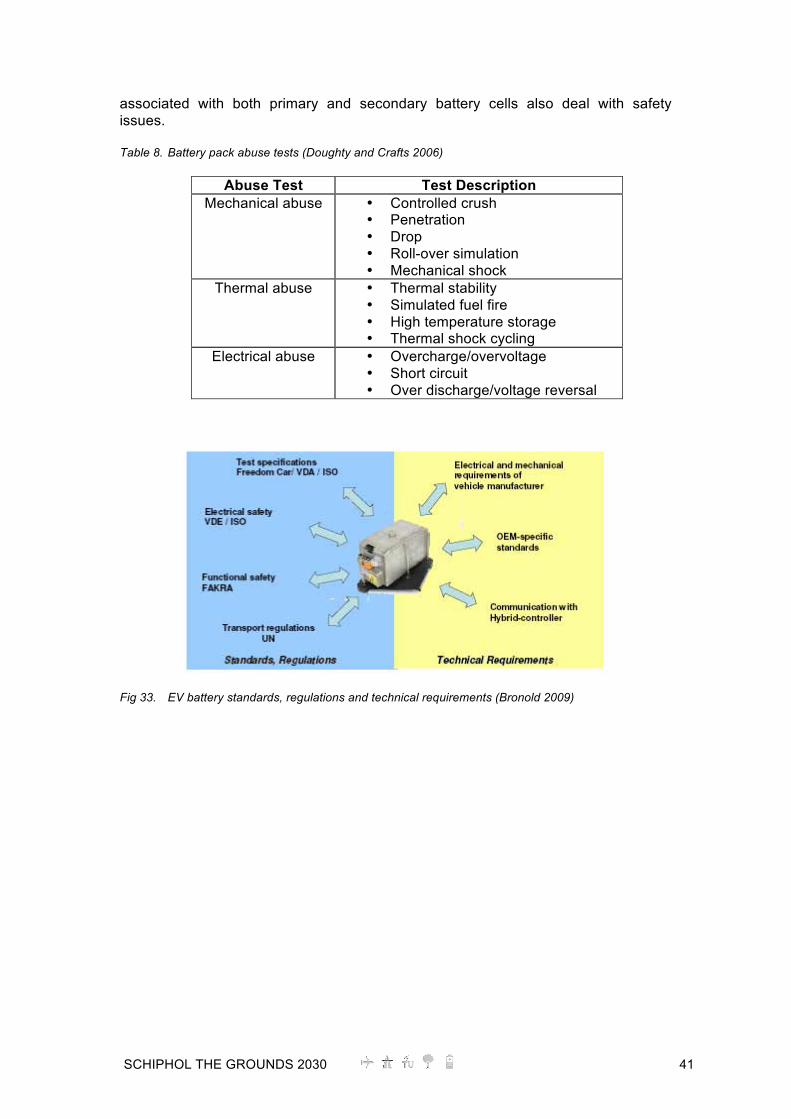
SCHIPHOL THE GROUNDS 2030 41
associated with both primary and secondary battery cells also deal with safety issues. Table 8. Battery pack abuse tests (Doughty and Crafts 2006)
Abuse Test Test Description Mechanical abuse • Controlled crush
• Penetration • Drop • Roll-over simulation • Mechanical shock
Thermal abuse • Thermal stability • Simulated fuel fire • High temperature storage • Thermal shock cycling
Electrical abuse • Overcharge/overvoltage • Short circuit • Over discharge/voltage reversal
Fig 33. EV battery standards, regulations and technical requirements (Bronold 2009)

42 SCHIPHOL THE GROUNDS 2030
4.1.3 Battery Charging The performance of the battery and therefore the EV is highly dependent on the manner in which the battery is charged and discharged. The battery charger replenishes the energy in an electric vehicle in a similar manner to refilling a fuel tank with gasoline. The difference is that the charger offers different possibilities to charge the vehicle, such as over night at home, instead of refuelling at a gasoline station. The battery charger is a device that converts the alternating current distributed by the grid to the direct current needed to recharge the battery. There are many methods to charge EV batteries according to their different charging characteristics (Ehsani 2005). Effective charging consists of recharging the battery until its full capacity is reached without extended overcharge or excessive temperature. Otherwise, an over-voltage or an overheating may cause deterioration of the battery’s performance and life, or even cause serious safety problems. The chargers operate in two operating modes. The first one is recharge mode, which will depend on the battery’s chemistry. This is referred to as grid-to-vehicle (G2V). The second mode is referred to as inverter mode, which means the battery energy can be inverted and supplied back to the grid or to other AC electricity suppliers. This is referred to as vehicle-to-grid (V2G). Fig 34 shows the general configuration for both operating modes. The interface determines and limits the possible solutions for charging the battery and for the purposes of this report, two types of interface are considered. These are conductive and inductive charging, which are discussed in more detail in the following sections.
Fig 34. Power flow for G2V and V2G Operation Modes
4.1.3.1 State of the Art The physical location of the components for converting the power supplied by the grid to the power required by the vehicle battery can be categorized as on-board and off-board chargers. On-board chargers are located within the vehicle, so the size and power rating are constrained by the available space. Off-board chargers are located outside the vehicle, a set up that provides more flexibility in terms of the power that can be delivered. Both classes of charging devices must contain control circuits and communicate in real-time with the vehicle battery. This is to ensure that the battery is optimally charged, preventing any damage to the battery through overcharging. Both types of charging devices are discussed below, with respect to both conductive and inductive charging interfaces.

SCHIPHOL THE GROUNDS 2030 43
4.1.3.1.1 Conductive Charging Conductive charging technology is currently the most favoured, as it allows for the connection of EVs to an existing power supply without the need for extra infrastructure. Different charging modes have been described [Appendix 9.2], which are shown in Fig 35 and outlined in Table 9.
Fig 35. Conductive Charging Modes [Appendix 9.2] Table 9. Outline of Conductive Charging Modes [Appendix 9.2]
Charge Mode
Description of supply Usage Charger location
1 - EV is connected to the AC supply network utilizing standard socket outlets at the supply side - 1-phase or 3-phase - No control signals
Domestic and
unspecific industrial
On-board
2 Same as for mode 2, but for US supply voltage Same as mode 2
Same as mode 2
3 - EV is connected to the AC supply network utilizing dedicated supply equipment - 1-phase or 3-phase - Control signals included
Public or private
On or off-board
4 - EV is connected to the AC supply network utilizing dedicated supply equipment (higher power) - DC supply to vehicle - Control signals included
Private Off-board
On-board charger The on-board charger is located inside the vehicle, as shown in Fig 36(a). It is designed with a low charging rate and it is dedicated to charging the battery for a long period of time. The on-board charger needs to be lightweight (typically less than

44 SCHIPHOL THE GROUNDS 2030
5 Kg) and compact, due to the limitation of allowable payload and space in the EV and the PHEV. The advantage of this charger is that the battery can be recharged at any standard electrical outlet. It can easily communicate with the BMS thanks to the internal wiring network, leading to higher performance and lower cost. On the other hand, this solution is suitable to the PHEV application in which the specific energy is lower. The drawback of this charger is the limitation of the power output because of size and weight restrictions. There are two methods for designing the bidirectional AC-DC converter: one is that the bidirectional converter separates from the driving system, which is referred to as independent circuit topology and is shown in Fig 36(b). The other one is to combine the motor driving with the converter. This is commonly named combination circuit topology and is shown in Fig 36(c). Generally, a battery charger includes not only a bidirectional AC-DC converter, but also an isolation transformer and associated control unit. In this section, the focus is on the AC-DC bi-directional topology. In addition, several bidirectional converter topologies exist and can be used as the PHEV charger, which is discussed in (Shi, Meintz et al. 2008).
(a)
(b)
(c)
Fig 36. On-board Charger (a) with Independent Circuit Topology (b) and Combination Circuit Topology (c)(Shi, Meintz et al. 2008) Off-board charging The off-board battery charger is separated from the vehicle, as shown in Fig 37. It can be designed with either a high or low charging rate, and is not limited in its weight and size. The off-board charger is suitable for charging the vehicle overnight with a long charging time or at a public station with a faster charging time (more than 1Hr). In contrast, the high power off-board charger is a fast charger which is designed for commercial applications. This solution is suitable for high power designs, because the power output of fast charges is limited only by the ability of the batteries to accept the charge. The charging time of the fast charger is less than 1 hour. Even if the EV owner can shorten the time, this implies the use of a fast charger. However, the availability of this method is restricted due to limitations of the supply network. Since the off-board chargers and the BMS are physically separated, reliable communication is important to ensure correct charging conditions. Depending on the battery’s type, voltage, temperature and SOC supplied by BMS, the off-board charger will adopt a proper charging method.
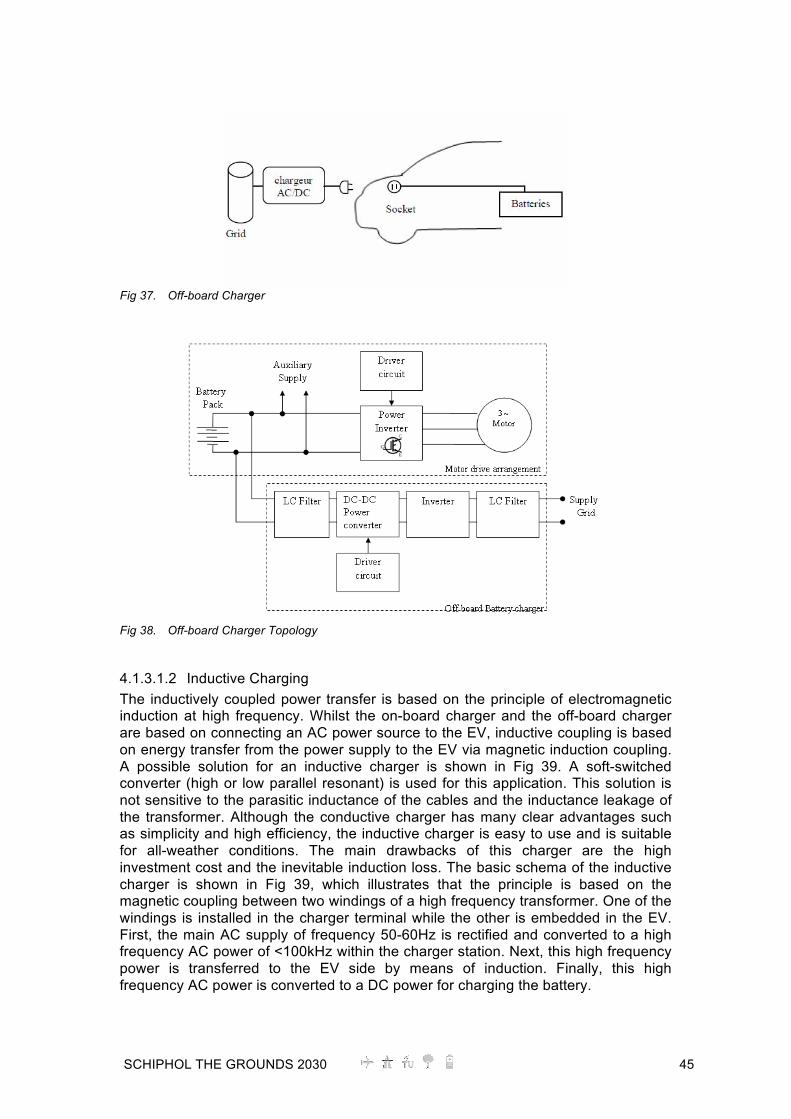
SCHIPHOL THE GROUNDS 2030 45
Fig 37. Off-board Charger
Fig 38. Off-board Charger Topology
4.1.3.1.2 Inductive Charging The inductively coupled power transfer is based on the principle of electromagnetic induction at high frequency. Whilst the on-board charger and the off-board charger are based on connecting an AC power source to the EV, inductive coupling is based on energy transfer from the power supply to the EV via magnetic induction coupling. A possible solution for an inductive charger is shown in Fig 39. A soft-switched converter (high or low parallel resonant) is used for this application. This solution is not sensitive to the parasitic inductance of the cables and the inductance leakage of the transformer. Although the conductive charger has many clear advantages such as simplicity and high efficiency, the inductive charger is easy to use and is suitable for all-weather conditions. The main drawbacks of this charger are the high investment cost and the inevitable induction loss. The basic schema of the inductive charger is shown in Fig 39, which illustrates that the principle is based on the magnetic coupling between two windings of a high frequency transformer. One of the windings is installed in the charger terminal while the other is embedded in the EV. First, the main AC supply of frequency 50-60Hz is rectified and converted to a high frequency AC power of <100kHz within the charger station. Next, this high frequency power is transferred to the EV side by means of induction. Finally, this high frequency AC power is converted to a DC power for charging the battery.

46 SCHIPHOL THE GROUNDS 2030
Fig 39. On-board Induction Charger
Fig 40. Inductive Charger Basic Schematic
4.1.3.1.3 Charging Infrastructure Standard charging (Mode 1: 6 hours< charging time < 8 hours) Standard charging for EVs uses a charging power of 3.3 kW, corresponding to a socket- outlet of 230 V, 16A. This type of charger is the most extensively used in Europe and is a single phase AC charger. This type of charging is dedicated to a normal charging of 6 to 8 hours and is generally an onboard charger (located inside the vehicle). Due to its simplicity and low cost, Mode 1 is the preferred mode for all charging operations at a private location, such as the household or workplace. However, Mode 1 has a number of safety problems, such as the fact that its safety depends on a residual current device (RCD) on the supply side. The installation of such a device is now enforced by national codes in most countries. Semi-fast charging (Mode 3: 2hours< charging time < 6 hours) Semi-fast charging is defined as a power level of 7 to 22 kW, corresponding to either a 1-phase 32A outlet or a 3-phase 16A outlet. This allows for double the available power. A semi-fast charging infrastructure allows a charging time of between 2Hr and 6Hr for a 30kWh battery. This type of infrastructure corresponds to Mode 3, which is directly connected to an AC supply network. The connector is equipped with a control pilot conductor to protect the user and other equipment. The concept of the control pilot used is detailed in the European standards [Appendix 9.2]. Fast charging (Mode 4: charging time < 1 hours) In charging Mode 4, the vehicle is charged with a DC current provided by an off-board charger. This solution is most often used for fast charging stations which require a very heavy infrastructure. The following types of fast charger are described:

SCHIPHOL THE GROUNDS 2030 47
• Fast charger • Super fast charger • High AC charger
Fast charger – It is a charging system based on power electronics that converts AC power to controlled DC power in order to charge the EV battery. In Europe, the fast charger station belongs to Mode 4, which is the most expensive mode. Its usage is limited only to public charging stations. In a fast charger station, the vehicle cannot be charged as rapidly as at a gas station. The charging time required to fully charge a battery is nearly 25-35 min. The power peak of this charger station is situated around 50-75KW. Super Fast charger – The goal of a Super Fast charger is to recharge a battery in the same time as required to re-fuel a conventional vehicle. The recharging time of this component is also comparable to a “battery swapping” method established by the Renault project “Better Place”. Since the peak power is very high, this charger requires a special component for the high power. High AC charger – Mode 4 consists of high power AC charging up to 250A. Currently, powerful AC sources are used to charge a traction battery via the traction inverter. In this case, the adaption of the voltage is performed by an off-board mains transformer. As a consequence, this charger is used only for special applications. There are currently two vendors on the market that supply fast charging systems: AeroVironment and Akervade. Both state a recharge time of approximately 10-15 minutes. The Charger Test AV900 from AeroVironment has the capability to supply a power of 250KW with a DC current of 1000 A. The power factor of this type of charger is 0.99%. AeroVironment offers 10 minutes recharging at 600V with a special prototype dedicated to BEVs. Aker-Wade advertises the possibility of recharging an EV in 10 minutes. The prototype system is able to supply a power of 250KW, with a maximum charging current of 600A at 420V DC. The efficiency of this charger is estimated at 92%. The Aker-Wade fast charge system also contains a smart grid interface which is capable of preventing peak loading on the electrical grid. The system has an optional energy storage unit that is integrated into the fast charger station. This will allow renewable energy sources (such as wind, photovoltaic and hydro) to store off peak generated power in the battery for later use. As a result, peak loading on the utility grid could be prevented, allowing it to be used as a stored energy resource for use during periods of peak demand.

48 SCHIPHOL THE GROUNDS 2030
(a)
(b)
Fig 41. Commercially Available Fast Charging Systems

SCHIPHOL THE GROUNDS 2030 49
4.1.4 Electrical Grid From the standards, the EV/PHEV charging methods can be divided into 3 categories, listed as Table 10 and shown as Fig 42. Table 10. Charging modes of EV/PHEV
Type kVA Charging Time Charging method Slow/Normal 1 -5 6Hr AC: 1 phase, 230 V, 16 or 32 A Semi-fast/Medium 10 – 25 1 -3Hr AC: 3 phase, 230 V, 32 or 63 A Fast 180 - 400 5 – 15 min Undetermined, DC off-board charging or
battery swapping
Fig 42. Charging modes of EV/PHEV
4.1.4.1 Grid Impact
4.1.4.1.1 Steady-State After being used, the EV’s battery should be charged. With the increase of the individual battery rating and number of EVs, the charging load cannot afford to be neglected from the grid point of view. An example with rough estimation shows the importance of taking into account the charging load of EV for grid power balancing. The peak load of the Netherlands is around 16GW in 2008(Haarlemmermeer 2009). With an estimation of 6% growth, in 2020 the peak load will be 30GW. And in 2030, the peak load will be 54GW. It is also
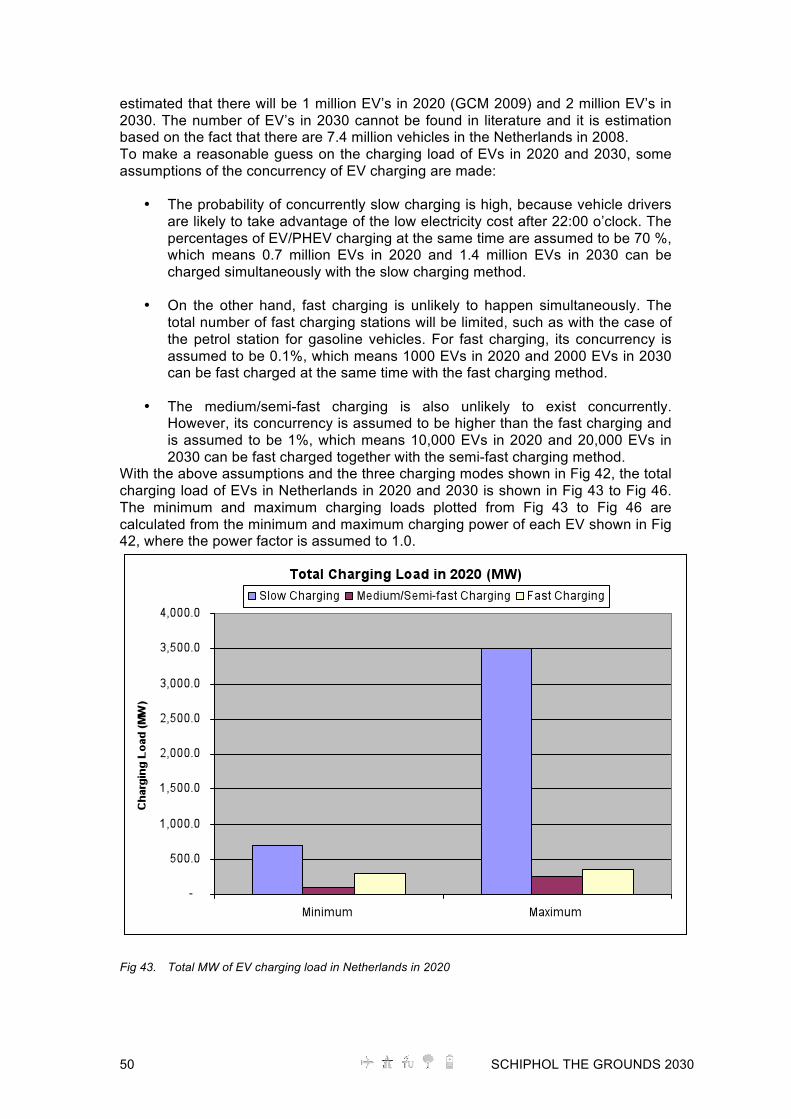
50 SCHIPHOL THE GROUNDS 2030
estimated that there will be 1 million EV’s in 2020 (GCM 2009) and 2 million EV’s in 2030. The number of EV’s in 2030 cannot be found in literature and it is estimation based on the fact that there are 7.4 million vehicles in the Netherlands in 2008. To make a reasonable guess on the charging load of EVs in 2020 and 2030, some assumptions of the concurrency of EV charging are made:
• The probability of concurrently slow charging is high, because vehicle drivers are likely to take advantage of the low electricity cost after 22:00 o’clock. The percentages of EV/PHEV charging at the same time are assumed to be 70 %, which means 0.7 million EVs in 2020 and 1.4 million EVs in 2030 can be charged simultaneously with the slow charging method.
• On the other hand, fast charging is unlikely to happen simultaneously. The
total number of fast charging stations will be limited, such as with the case of the petrol station for gasoline vehicles. For fast charging, its concurrency is assumed to be 0.1%, which means 1000 EVs in 2020 and 2000 EVs in 2030 can be fast charged at the same time with the fast charging method.
• The medium/semi-fast charging is also unlikely to exist concurrently.
However, its concurrency is assumed to be higher than the fast charging and is assumed to be 1%, which means 10,000 EVs in 2020 and 20,000 EVs in 2030 can be fast charged together with the semi-fast charging method.
With the above assumptions and the three charging modes shown in Fig 42, the total charging load of EVs in Netherlands in 2020 and 2030 is shown in Fig 43 to Fig 46. The minimum and maximum charging loads plotted from Fig 43 to Fig 46 are calculated from the minimum and maximum charging power of each EV shown in Fig 42, where the power factor is assumed to 1.0.
Fig 43. Total MW of EV charging load in Netherlands in 2020

SCHIPHOL THE GROUNDS 2030 51
Fig 44. Percentage of total charging load with peak load in Netherlands in 2020
Fig 45. Total MW of EV charging load in Netherlands in 2030

52 SCHIPHOL THE GROUNDS 2030
Fig 46. Percentage of total charging load with peak load in Netherlands in 2030 From the results shown in Fig 43 to Fig 46, the following conclusions can be drawn:
• Slow charging will have the largest influence on the overall power balance of the grid. The fast charging and semi-fast charging load will not have the same national impact as slow charging, because of the limited stations/places. However, both types may have strong influences on the local grid.
• In 2020 one million EV/PHEVs will have the total load as high as 3.5 GW or 12% of the peak load in the Netherlands.
• In 2030 two million EV/PHEVs will have the total load as high as 7 GW or 12% of the peak load in the Netherlands.
The charging load of EVs approaches the goal of wind power integration in the year 2020 (20%). Its grid influences on aspects such as power balancing and power flow have to be carefully studied, such as with as wind power integration. Extensive research has been carried out on the power balancing of charging EVs in recent years (Graham 2001; Green 2001; Kempton 2001; Brooks, Research et al. 2002; Kempton and Tomic 2005; Kempton and Tomic 2005; Denholm and Short 2006; Letendre, Denholm et al. 2006; Markel, Brooker et al. 2006; Short and Denholm 2006; Kintner-Meyer, Schneider et al. 2007; McCarthy, Yang et al. 2007; Parks, Denholm et al. 2007; Tomic and Kempton 2007). In this report, the grid aspects such as power balancing and power flow are defined as steady state problems of EV. Load Shaping Since the charging time and power can be controlled, theoretically the EV can work as energy storage to provide energy at peak-load and consume energy at light-load. However, the EV is generally recommended for providing a short term regulation function instead of providing energy at peak-load (Brooks, Research et al. 2002; Kempton and Tomic 2005; Kintner-Meyer, Schneider et al. 2007), due to the

SCHIPHOL THE GROUNDS 2030 53
coincidence of peak-load and peak-driving time. The limited energy capacity of the battery has to be reserved for driving. On the other hand, the EV is often charged at night. The charging can be controlled to flatten the night load curve (fill the load valley at night) or to improve renewable energy integration (Pecas Lopes, Soares et al. 2009). In (Ummels 2009), the bottlenecks for large scale wind power integration are investigated. One economic bottleneck exists at night, when the load is low and thermal power plants reach their minimum allowed productions. Wind power has to be dumped in such a situation. With the smart charging of EVs at night, wasted wind energy can now be utilized, as shown in Fig 47.
Fig 47. Smart Charging of EV to improve wind energy integration(Pecas Lopes, Soares et al. 2009) Regulation Considerable income can be acquired by adding additional functions to the EV, where it will be not only seen as a controllable load but also as a distributed energy source. An example of this architecture is shown in Fig 48. For the V2G function, the total EVs will be seen as a virtual power plant and their on-board converters will be utilized. The off-board fast charger is not expected to be used for this function; therefore the bi-directional fast charger is not necessary. The state of charging (SOC) and power of an EV providing regulation function is shown in Fig 49. In Fig 49, the intervals of driving, charging, and grid regulation are shown. Generally speaking, the V2G function with grid regulation will not be a threat for the SOC or total energy of the EV’s battery. The grid regulation results in bi-directional power flow. Sometimes, it is necessary for it to be regulated up which draws energy from the EV, and other times it is necessary for it to be regulated down which sends energy to the EV. The benefits of these functions are evident. However, the actual income depends on the availability of the regulation markets. In (Rahman and Shrestha 1993; Kempton 2001; Brooks, Research et al. 2002; Kempton and Tomic 2005; Denholm and Short 2006; Kintner-Meyer, Schneider et al. 2007; McCarthy, Yang et al. 2007), long term

54 SCHIPHOL THE GROUNDS 2030
capacity contracts for regulation and spinning reserve are assumed to be available for EVs. With this assumption, the potential revenues of EVs are found to be very high. The long term contract promises that EVs will receive money not based on the actual energy exchange with the grid, but based on the contracted capacity. However, in certain countries such as the Netherlands, where real-time bidding market instead of long term capacity contract exists, the revenue is found to be small. Another important point is that the cost would also be caused by the regulation function, because of the additional charging and discharging which degrades the battery. This can be defined as battery “wear out” costs associated with “throughput battery energy” (Brooks, Research et al. 2002).
Fig 48. Architecture of the vehicle-based grid regulation system(Brooks, Research et al. 2002)

SCHIPHOL THE GROUNDS 2030 55
Fig 49. Power and SOC of EV with regulation function (Pecas Lopes, Soares et al. 2009)
4.1.4.1.2 Dynamics Harmonics (Berisha, Karady et al. 1996; Lo, Sustanto et al. 1999; Bass, Harley et al. 2001; Basu, Gaughan et al. 2004; Lu and Jiang 2005)studied the harmonics generated by EVs. However, the EV charger is a VSC, and its harmonics are dependent on its modulation, and should therefore not be a major concern. Besides, the VSC of EVs can work as an active filter to limit the existing harmonics in the grid (Bojrup 1999). Short Circuit Current and Protection EV/PHEVs may change the power flow direction when they are discharged to provide grid support, which will influence grid protection. This topic was not found in current literature, but should be a concern for future review. Flicker It might not be a problem, as the charging power can be controlled smoothly.

56 SCHIPHOL THE GROUNDS 2030
4.1.4.2 Summary Table 11 shows a summary of the key areas of focus for EWI and how they are related to the four future scenarios created by the DIEMIGO project team. Table 11. EWI Technology Focus
Time to eat the dog
As good as it gets
Footprints on the water
Generation eco-geek
Electric vehicle
technology
PHEV BEV
PHEV BEV Controlled charging (G2V)
PHEV BEV Controlled charging (G2V)
PHEV BEV SEV Smart charging (G2V and V2G)
Battery technology
Currently available battery cell and pack technology (Highest specific power and specific energy available)
Currently available battery cell and pack technology (Highest specific power and specific energy available)
Currently available battery cell and pack technology (Highest specific power and specific energy available)
Li-air (High specific energy) LiFePO4 (high specific power)
Charging technology
Normal charging (conductive)
Normal charging (conductive and inductive) Conductive fast charging
Normal charging (conductive and inductive) Conductive fast charging
Normal charging through renewable energy grid (conductive and inductive) Inductive fast charging
Electrical Grid
Grid strengthened and capable of supporting increased demand Uncontrolled (dumb) charging (G2V)
Grid strengthened and capable of supporting increased demand Controlled charging (G2V)
Grid strengthened and capable of supporting increased demand Controlled charging (G2V)
Energy from renewable sources (35% surface area covered by solar cells) Smart charging (G2V and V2G)

SCHIPHOL THE GROUNDS 2030 57
4.1.5 Battery Design Issues
4.1.5.1 Battery Modelling Given the complex nature of electrochemical energy storage devices, a number of approaches for predicting their voltage behaviour have been adopted. For the purposes of this report, these are broadly classified as shown in Fig 50. Method 1 uses the charge and discharge curves provided by battery manufacturers to estimate the relevant battery parameters. This method is sufficient for estimating the steady state (constant current) characteristics of a battery cell, but is limited under conditions of dynamic loading. Method 2 uses an equivalent circuit model to capture the dynamic behaviour of the battery cell. This is the most common modelling technique and many different equivalent circuits have been proposed (Gao and Liu 2002; De Koning, Veltman et al. 2004; Chen and Rincon-Mora 2006; Kroeze and Krein 2008). Method 3 models the behaviour of the battery cell from first principles. This approach requires a solid understanding of materials, electrochemistry, thermodynamics and chemical reaction kinetics. This modelling approach is outside the scope of the DIEMIGO project. Therefore, the modelling of the battery cell outlined in this report focuses on Methods 1 and 2 only.
Fig 50. Battery Modelling Methods
Battery model
Method 1 – Steady state
Advantage Quick and simple to implement
Disadvantage Not suitable for dynamic loading
Method 2 – Dynamic Advantage
Dynamic behaviour and no load conditions are captured
Disadvantage Parameters must be estimated through measurements or from manufacturer data
Method 3 – Electrochemical
Advantage Individual battery chemistries modelled from first principles giving more accurate results
Disadvantage Expert knowledge in electrochemistry is required and models can by computationally expensive
Battery performance parameters

58 SCHIPHOL THE GROUNDS 2030
4.1.5.2 Battery Performance Parameters Each of the battery modelling techniques outlined in the previous section output the battery performance parameters of interest, which are described below. These parameters describe characteristics for batteries in general, but in the context of this report, they describe the characteristics of Li-ion cells. Nominal voltage ( ) The nominal voltage of a particular cell is specified by the battery manufacturer. For Li-ion cells, it is a value of 3.6V. Nominal capacity ( ) This is the rated capacity of the battery cell, and is usually measured for a particular cell by discharging at 0.1C or one-tenth of current capacity (see C-rate description below). The capacity is measured in Ah and can be related to the energy content by considering the nominal voltage. The energy content of the battery cell is given by Ebat:
Charge/Discharge rate (C-rate) This parameter describes the magnitude of current drawn from or input into the battery, in terms of the rated or nominal capacity of the battery. A battery cell discharging at a rate of 1C will deliver its nominal capacity for 1Hr whilst a cell discharging at 2C will deliver its nominal capacity in 0.5Hr. Fig 51 shows the discharge characteristics for various theoretical battery cells with different nominal capacities. These curves show the 1Hr discharge currents (Fig 51(a)) and the 1A discharge times (Fig 51(b)) for each capacity. It should be noted that these curves are theoretical and thus physical limitations exist, constraining the time a particular cell can deliver current (Kiehne 2003). Maximum charge rates for currently available Li-ion cells are usually between 3C and 6C, even though there are some high power Li-ion cells that are optimized for 2C to 100C continuous discharge. (a) (b)
Fig 51. Ideal Characteristics (a) 1Hr Discharge Current and (b) 1A Discharge Time

SCHIPHOL THE GROUNDS 2030 59
Terminal voltage ( ) This is the voltage measured at the terminals of the battery cell. It is a function of the materials used and the mechanical construction. Open circuit voltage ( ) Also referred to as the equilibrium potential, the open circuit voltage describes the no-load potential difference of the cell and is a function of the type of active material on the electrodes, the construction of the electrodes and the type of electrolyte. With reference to Fig 52(a), the terminal voltage is the same as the open circuit voltage when switch S is open (this assumes zero order dynamics to reach the open circuit voltage). State of charge ( ) This parameter describes the instantaneous charge of the battery cell, or the amount of electrical energy stored in a cell at any instant in time. When switch S is closed in Fig 52(b), current starts to flow into or out of the battery. The ratio of the actual charge of the battery Q, to the nominal charge Qnom describes the SOC. Depth of discharge (DOD) The rate of the net ampere-hours discharged from a battery at a given rate to the rated capacity. It can also be described as 1-SOC. Rate dependant capacity ( ) A reduction in usable battery capacity is observed with high rates of charge or discharge current. This effect was first characterized by Peukert (Peukert 1897), who derived an empirical relationship for lead acid-batteries. Energy Efficiency The efficiency of a battery cell is usually specified in terms of a round trip efficiency, which considers a complete charge and discharge cycle. Two loss mechanisms are assumed (USABC 1996), and the following efficiencies are defined:
• Coulombic efficiency, :
4.2
• Energy efficiency, :
4.3
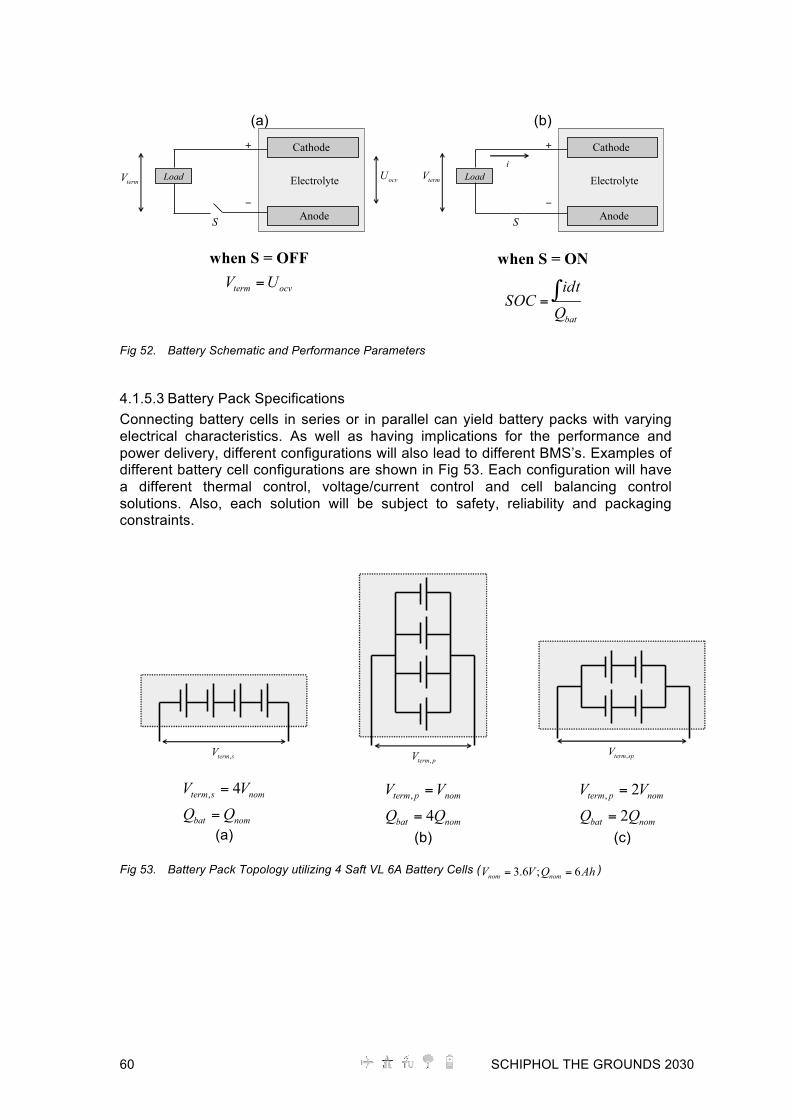
60 SCHIPHOL THE GROUNDS 2030
(a)
(b)
Fig 52. Battery Schematic and Performance Parameters
4.1.5.3 Battery Pack Specifications Connecting battery cells in series or in parallel can yield battery packs with varying electrical characteristics. As well as having implications for the performance and power delivery, different configurations will also lead to different BMS’s. Examples of different battery cell configurations are shown in Fig 53. Each configuration will have a different thermal control, voltage/current control and cell balancing control solutions. Also, each solution will be subject to safety, reliability and packaging constraints.
Fig 53. Battery Pack Topology utilizing 4 Saft VL 6A Battery Cells ( )
(a)
(b)
(c)

SCHIPHOL THE GROUNDS 2030 61
4.1.5.4 Modelling Method 1 Modelling method 1 uses constant current charge and discharge information, which is usually available from battery cell manufacturers. Because it uses constant current characteristics, this modelling method is only suitable for steady state conditions. For this reason, it may not be suitable for simulations in HEVs or BEVs, unless constant power demand (constant velocity) situations are being examined. It could be considered useful for examining G2V charging scenarios. The main advantage of this method is that it is relatively straightforward to implement and different battery models can be easily compared, assuming the relevant data is available from the manufacturer. The characteristics of the battery cell for constant charge and discharge rates are shown in Fig 54. It can be seen from these characteristics that high charge and discharge rates result in a reduction of the capacity of the battery. Therefore, to maximize the energy content of the battery cell, low charge and discharge rates are desirable. Unfortunately, this comes at the expense of the maximum achievable power and the charge times. Table 12 provides the manufacturer’s specification of the battery cell used for simulation.
(a)
(b) Fig 54. Charge and Discharge Characteristics Table 12. Li-ion Battery Characteristics
EiG ePLB Q013 Battery Cell Nominal voltage, Vnom 2.2V Nominal capacity, Qnom,cell 12Ah Specific energy 61Wh/kg Specific power 587W/kg Weight 0.45kg Maximum charge current 15C Recommended charge current 6C Maximum discharge current 15C (<10s) Recommended discharge current 6C
A schematic model is shown in Fig 55. It can be seen that a coulomb counting method is used to estimate the SOC. The model outputs the desired voltage for charging (negative current), discharging (positive current) and no load (zero current). When no load is applied, the output voltage drops to the open circuit voltage UocvI, which is a function of SOC. It is possible to estimate Uocv from the manufacturer’s
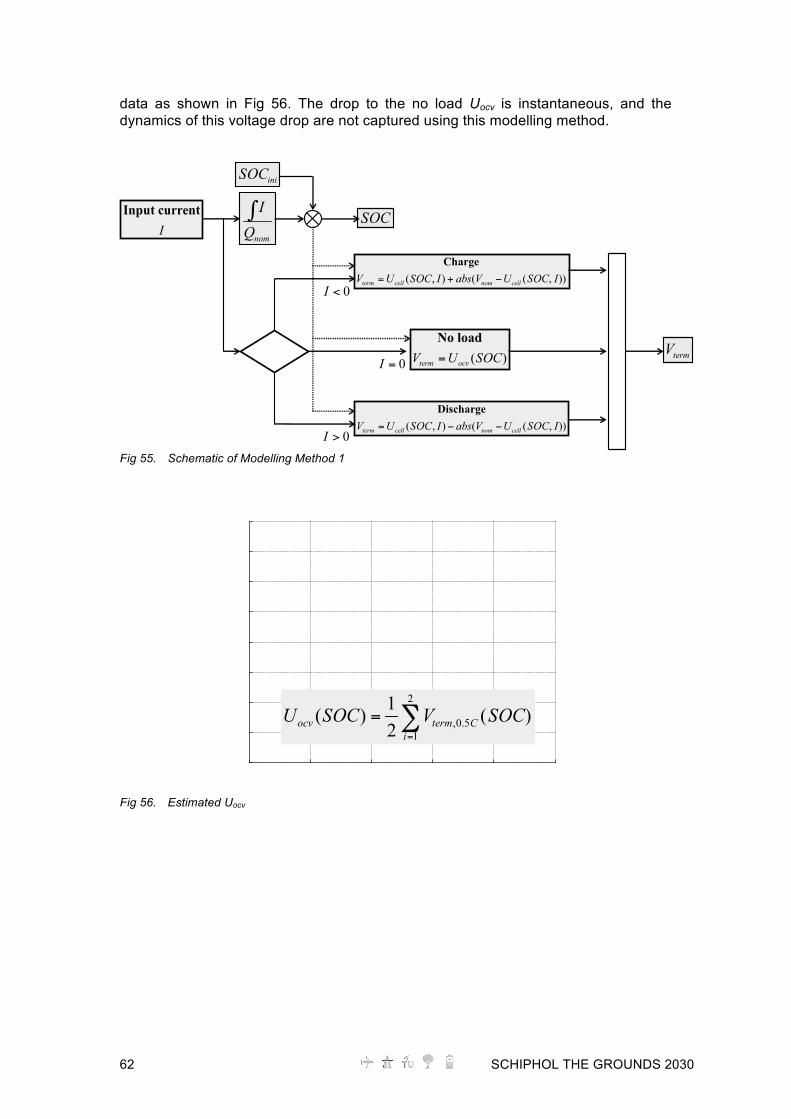
62 SCHIPHOL THE GROUNDS 2030
data as shown in Fig 56. The drop to the no load Uocv is instantaneous, and the dynamics of this voltage drop are not captured using this modelling method.
Fig 55. Schematic of Modelling Method 1
Fig 56. Estimated Uocv
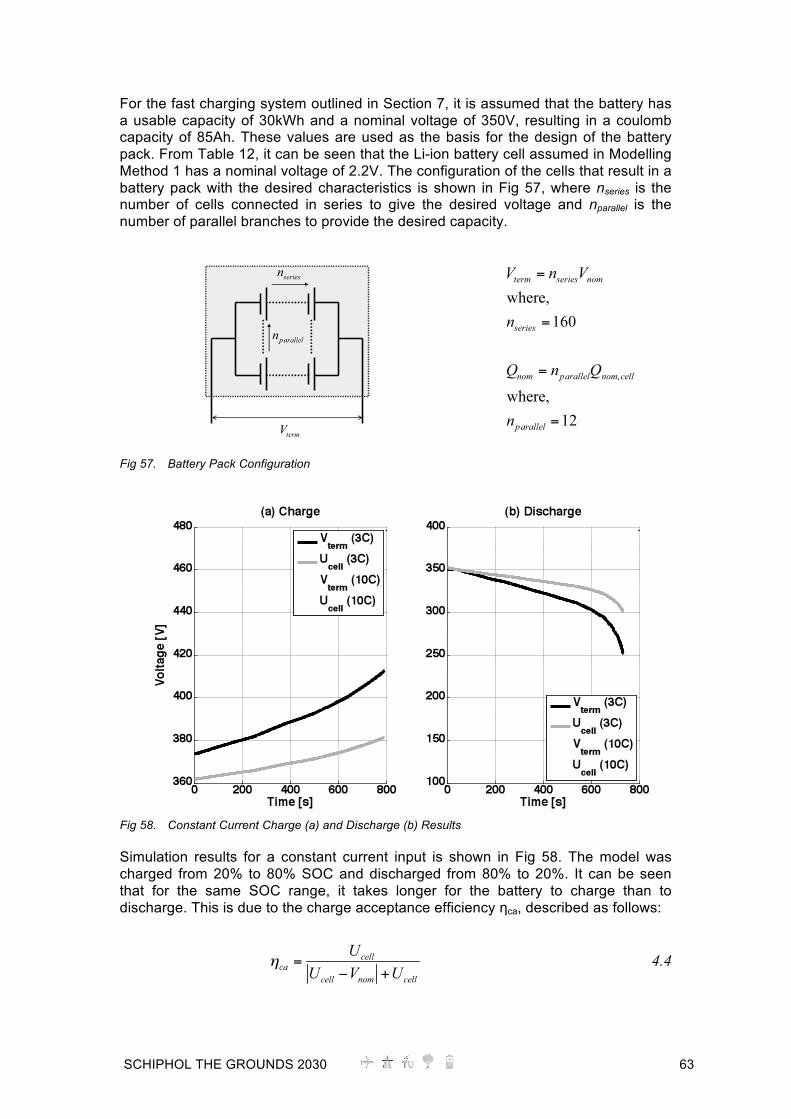
SCHIPHOL THE GROUNDS 2030 63
For the fast charging system outlined in Section 7, it is assumed that the battery has a usable capacity of 30kWh and a nominal voltage of 350V, resulting in a coulomb capacity of 85Ah. These values are used as the basis for the design of the battery pack. From Table 12, it can be seen that the Li-ion battery cell assumed in Modelling Method 1 has a nominal voltage of 2.2V. The configuration of the cells that result in a battery pack with the desired characteristics is shown in Fig 57, where nseries is the number of cells connected in series to give the desired voltage and nparallel is the number of parallel branches to provide the desired capacity.
Fig 57. Battery Pack Configuration
Fig 58. Constant Current Charge (a) and Discharge (b) Results Simulation results for a constant current input is shown in Fig 58. The model was charged from 20% to 80% SOC and discharged from 80% to 20%. It can be seen that for the same SOC range, it takes longer for the battery to charge than to discharge. This is due to the charge acceptance efficiency ηca, described as follows:
4.4

64 SCHIPHOL THE GROUNDS 2030
Simulation results for an impulse input current of 3C are shown in Fig 59(a)-(c) and results for 10C are shown in Fig 59d)-(f). The effect of the charge efficiency can be clearly seen, as the no load SOC levels decrease with each charge cycle. The instantaneous voltage drops can also be clearly seen, which do not capture the real dynamic behaviour of the battery.
Fig 59. Simulation Results for Impulse Current
Fig 60. Battery Roundtrip Efficiency

SCHIPHOL THE GROUNDS 2030 65
4.1.5.5 Modelling Method 2 The main limitation of using Modelling Method 1 is the inability to capture the dynamic behaviour of the battery. To understand more on the dynamics of batteries, the reader is referred to Jossen (Jossen 2006). Here a thorough explanation is given of the different dynamic effects which define the voltage characteristics of a battery cell. Table 13 summarizes these findings and shows the time range associated with each effect. Table 13. Dynamic Characteristics of Batteries and Time Scales
Battery dynamics Time range Electric effects (electric and magnetic)
Surface effects (double layer capacitance) Mass transport effect (diffusion etc)
Cycle effect (deep discharge cycles etc) Ageing effects
The circuit shown in Fig 61(a) is a simple first order system, the voltage dynamics of which are presented in Fig 61(b) and (c), in response to a constant current input. The values of resistor and capacitor in this circuit simulation are chosen arbitrarily. With a time constant , the voltage rise across the capacitor VC is described by:
4.5
(a) (b) (c)
Fig 61. RC Parallel Circuit (a); Voltage Dynamics for 5mΩ (a) and 8mΩ (b) Although changes in battery cell voltage can be attributed to complex electrochemical processes, the dynamics of these processes can be emulated through the use of an equivalent circuit. From measurement data, it is possible to select suitable resistive and capacitive elements, which yield the correct terminal voltage levels of the battery. The modelling approach adopted for this study is similar to that described by (Abu-Sharkh and Doerffel 2004) and (Schweighofer, Raab et al. 2002). The equivalent circuit model is shown in Fig 62 and the schematic of the physical processes that the

66 SCHIPHOL THE GROUNDS 2030
model emulates is shown in Fig 63. The terminal voltage Vterm, is described as follows:
4.6
The voltage characteristics for this model with three different parameter sets are presented. The parameters used are given in Table 14 and the results for a 3C input current are shown in Fig 64 for constant charge and discharge current and in Fig 65 for an impulse current profile. It can be seen that on removal of the load current, the voltage transients are captured in a more realistic manner than with Modelling Method 1. The roundtrip efficiencies of the battery model with the three different parameter sets are also presented in Fig 65(d). Decreasing efficiencies (both energy and coulombic) correspond to an increase in the values of resistances Rsurf and Rionic.
Fig 62. Equivalent Circuit Model of Proposed Battery Model
Fig 63. Schematic of Charging/Discharging Process
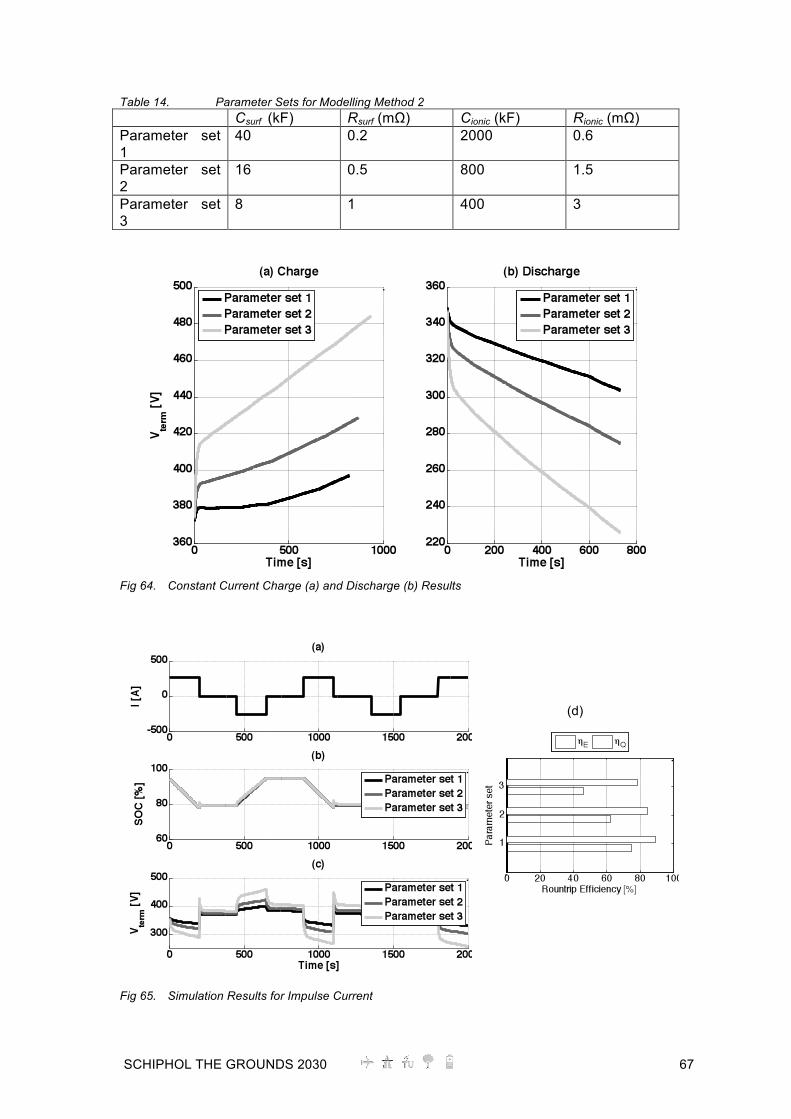
SCHIPHOL THE GROUNDS 2030 67
Table 14. Parameter Sets for Modelling Method 2 Csurf (kF) Rsurf (mΩ) Cionic (kF) Rionic (mΩ) Parameter set 1
40 0.2 2000 0.6
Parameter set 2
16 0.5 800 1.5
Parameter set 3
8 1 400 3
Fig 64. Constant Current Charge (a) and Discharge (b) Results
(d)
Fig 65. Simulation Results for Impulse Current

68 SCHIPHOL THE GROUNDS 2030
4.1.6 Electric Vehicle Design Issues
4.1.6.1 EV Driveline Model This section shows how the battery is discharged through the use of various drive cycles. The drive cycles chosen are NEDC (European standard), JC08 (Japanese standard) and FTP Highway (US standard). Only the BEV and the all electric range (AER) of the PHEV are modelled here, as hybrid drive modes require the modelling of energy management systems, the development of which is beyond the scope of the DIEMIGO project. From the velocity profile and the vehicle parameters, it is possible to estimate the motive power required by the vehicle power source. Assuming the vehicle is driving on a surface with no inclination and there are no environmental forces, the demand power is derived as shown in Fig 66.
Fig 66. Vehicle Demand Power for Various Drive Cycles From Fig 66, Froll is the rolling resistance, Fdrag is the air drag and Facc is the force required to accelerate a point mass, described by the following equations:
4.7
4.8
4.9
The parameters used in the simulations are provided in Table 15, which represent a typical small to medium sized passenger vehicle. The velocity profile and demand power are shown in Figure 1. It should be noted that the power demand shown is an

SCHIPHOL THE GROUNDS 2030 69
ideal profile, with the dynamics of the vehicle in acceleration and deceleration being neglected.
Table 15. EV Parameters
Vehicle mass Mv 1300 kg Drag coefficient Cw 0.347 - Frontal area Av 2.19 m2
Rolling friction coefficient cr 0.014 - Wheel radius Rw 0.302 m Air density 1.29
Differential gear ratio rd 0.3 - Knowledge of the demanded power by the road wheels allows the wheel torque, Tw to be calculated:
4.10
where,
4.11
Only one reduction gear is assumed in this driveline, therefore:
4.12
where is the efficiency of the differential gear. When calculating the mechanical torque output of the electric machine, Tem in motoring mode, the efficiency of the electric machine must also be considered. The electric power is therefore defined as:
4.13
The electrical torque, Telec can be related to the current flowing in the electric machine by the machine constant:
4.14
where Kem is a constant derived from the rated speed and rated voltage of a particular electric machine. A schematic of the EV driveline is shown in Fig 67. It can be seen that a positive power corresponds to the battery discharging and a negative power corresponds to the battery charging. Transmission, buck-boost and electric machine efficiencies are considered (ηd, η bb and ηem) with values of 90%, 95% and 90% respectively. Results from the simulation, which uses battery Modelling Method 1, are shown in Fig 68. It is assumed that the EV has an initial SOC of 50%. It can be seen that the larger 30kWh battery is able to complete all three drive cycles, whilst

70 SCHIPHOL THE GROUNDS 2030
remaining above the lower recommended SOC limit (20%). However, the smaller 10kWh battery is unable to complete any of the drive cycles without re-charging.
Fig 67. EV Driveline Model
Fig 68. Results from EV Driveline Model with Various Drive Cycles
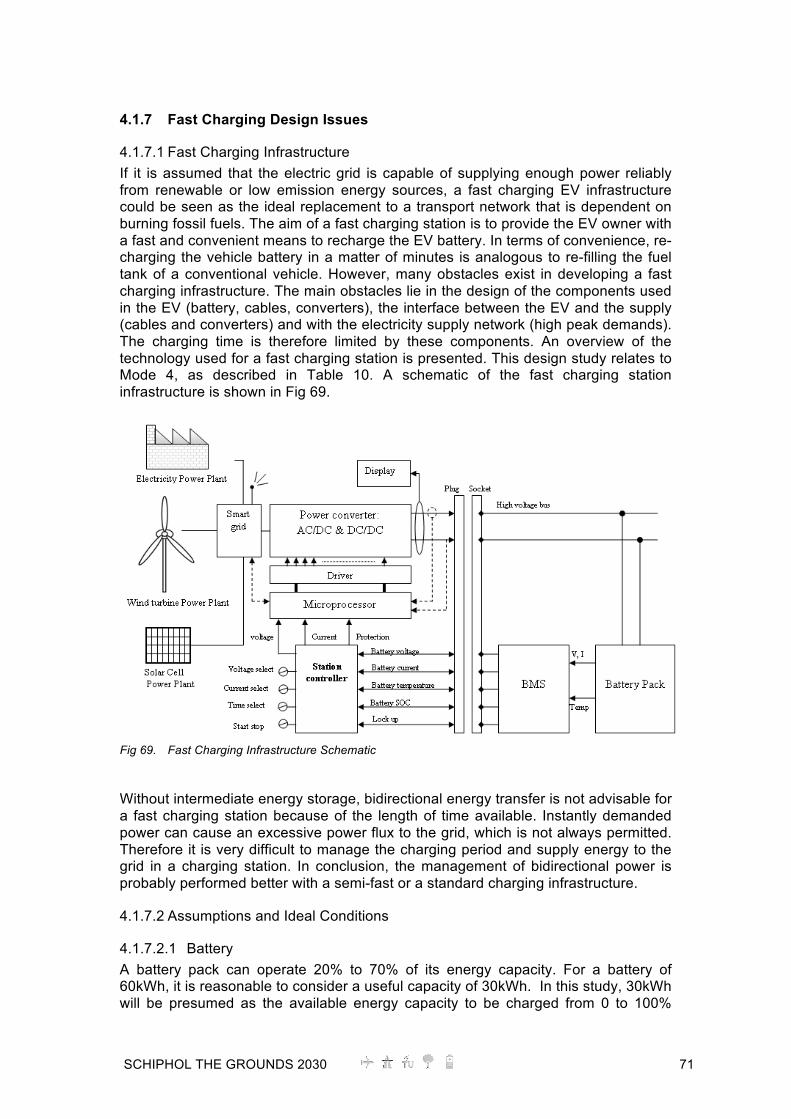
SCHIPHOL THE GROUNDS 2030 71
4.1.7 Fast Charging Design Issues
4.1.7.1 Fast Charging Infrastructure If it is assumed that the electric grid is capable of supplying enough power reliably from renewable or low emission energy sources, a fast charging EV infrastructure could be seen as the ideal replacement to a transport network that is dependent on burning fossil fuels. The aim of a fast charging station is to provide the EV owner with a fast and convenient means to recharge the EV battery. In terms of convenience, re-charging the vehicle battery in a matter of minutes is analogous to re-filling the fuel tank of a conventional vehicle. However, many obstacles exist in developing a fast charging infrastructure. The main obstacles lie in the design of the components used in the EV (battery, cables, converters), the interface between the EV and the supply (cables and converters) and with the electricity supply network (high peak demands). The charging time is therefore limited by these components. An overview of the technology used for a fast charging station is presented. This design study relates to Mode 4, as described in Table 10. A schematic of the fast charging station infrastructure is shown in Fig 69.
Fig 69. Fast Charging Infrastructure Schematic Without intermediate energy storage, bidirectional energy transfer is not advisable for a fast charging station because of the length of time available. Instantly demanded power can cause an excessive power flux to the grid, which is not always permitted. Therefore it is very difficult to manage the charging period and supply energy to the grid in a charging station. In conclusion, the management of bidirectional power is probably performed better with a semi-fast or a standard charging infrastructure.
4.1.7.2 Assumptions and Ideal Conditions
4.1.7.2.1 Battery A battery pack can operate 20% to 70% of its energy capacity. For a battery of 60kWh, it is reasonable to consider a useful capacity of 30kWh. In this study, 30kWh will be presumed as the available energy capacity to be charged from 0 to 100%
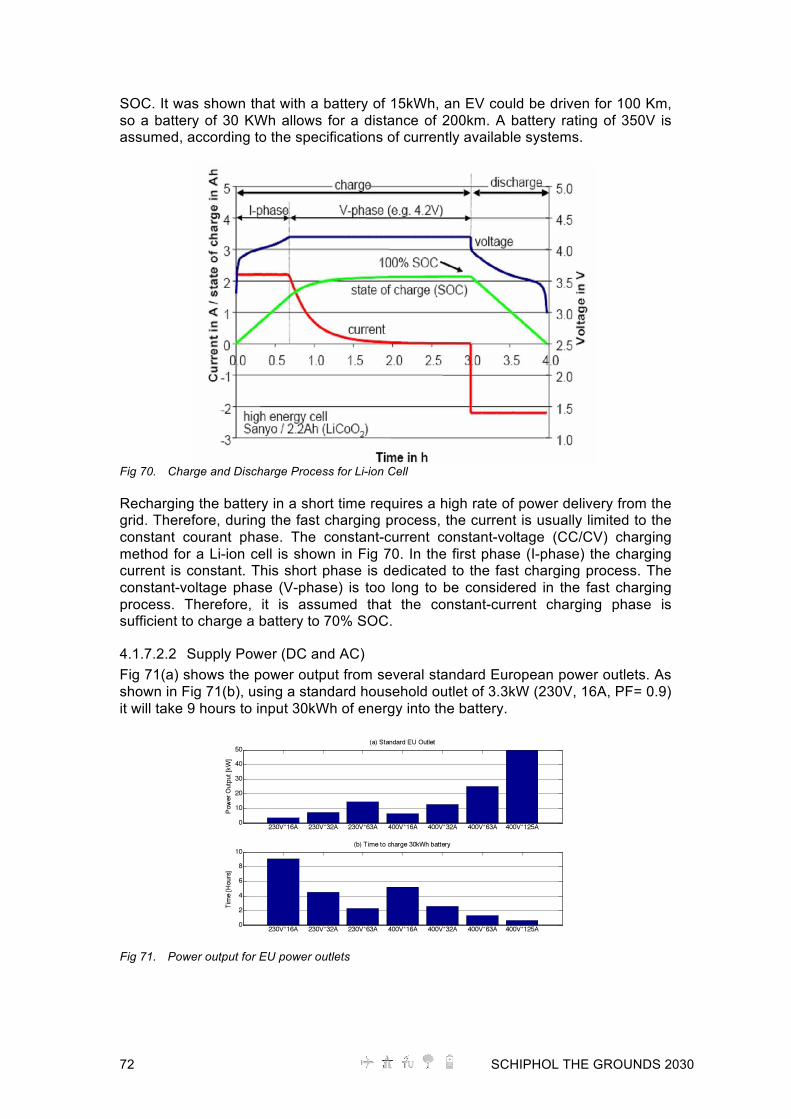
72 SCHIPHOL THE GROUNDS 2030
SOC. It was shown that with a battery of 15kWh, an EV could be driven for 100 Km, so a battery of 30 KWh allows for a distance of 200km. A battery rating of 350V is assumed, according to the specifications of currently available systems.
Fig 70. Charge and Discharge Process for Li-ion Cell Recharging the battery in a short time requires a high rate of power delivery from the grid. Therefore, during the fast charging process, the current is usually limited to the constant courant phase. The constant-current constant-voltage (CC/CV) charging method for a Li-ion cell is shown in Fig 70. In the first phase (I-phase) the charging current is constant. This short phase is dedicated to the fast charging process. The constant-voltage phase (V-phase) is too long to be considered in the fast charging process. Therefore, it is assumed that the constant-current charging phase is sufficient to charge a battery to 70% SOC.
4.1.7.2.2 Supply Power (DC and AC) Fig 71(a) shows the power output from several standard European power outlets. As shown in Fig 71(b), using a standard household outlet of 3.3kW (230V, 16A, PF= 0.9) it will take 9 hours to input 30kWh of energy into the battery.
Fig 71. Power output for EU power outlets

SCHIPHOL THE GROUNDS 2030 73
Fig 72 shows the ideal DC supply power to charge a 30kWh battery for various charge times. The ideal power values assume there are no losses in the converters and batteries. The ideal power is calculated as follows:
4.15
where Ebat is the capacity of the battery in kWh and tchg is the charge time in hours. The current delivered to the battery to meet the charging time requirements is shown in Fig 73. Results are presented for different values of battery nominal voltage, Vnom. The current is described by the following expression:
4.16
Fig 72. Ideal DC Power Supply and Times to Charge 30kWh Battery
Fig 73. Ideal DC Current and Time to Charge 30kWh Battery
To charge the EV battery in 5 minutes, a power supply of 360kW is required for each vehicle. For a battery with a nominal voltage of 200V, the current flowing into the battery at this charge rate is 1800A. This high power causes problems for the battery and for the cables/connectors between charging station and the vehicle.
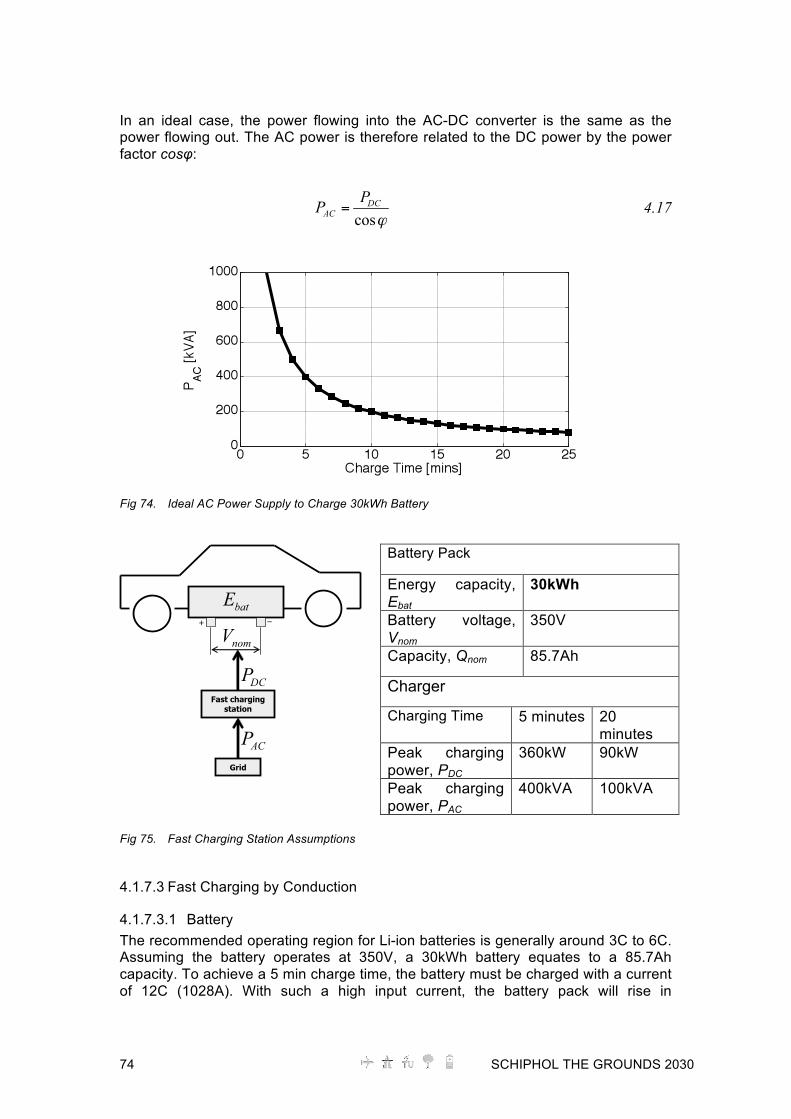
74 SCHIPHOL THE GROUNDS 2030
In an ideal case, the power flowing into the AC-DC converter is the same as the power flowing out. The AC power is therefore related to the DC power by the power factor cosφ:
4.17
Fig 74. Ideal AC Power Supply to Charge 30kWh Battery
Battery Pack
Energy capacity, Ebat
30kWh
Battery voltage, Vnom
350V
Capacity, Qnom 85.7Ah
Charger
Charging Time 5 minutes 20 minutes
Peak charging power, PDC
360kW 90kW
Peak charging power, PAC
400kVA 100kVA
Fig 75. Fast Charging Station Assumptions
4.1.7.3 Fast Charging by Conduction
4.1.7.3.1 Battery The recommended operating region for Li-ion batteries is generally around 3C to 6C. Assuming the battery operates at 350V, a 30kWh battery equates to a 85.7Ah capacity. To achieve a 5 min charge time, the battery must be charged with a current of 12C (1028A). With such a high input current, the battery pack will rise in

SCHIPHOL THE GROUNDS 2030 75
temperature and thermal management becomes more critical than with normal charging. In addition, both the lifetime and efficiency of the battery will be reduced.
4.1.7.3.2 DC Cable Limitations The cable connecting a 200V battery pack to a fast charging station is limited by currently available flexible cables (Nexans 10056622). These types of cables are limited to a DC current of 550A, which is much less than the required rating of 1800A. Thermal management of the cabling may also be required, to ensure that the power losses are kept to a minimum. Choosing a higher battery voltage will reduce the current required to deliver the same power, but it must be ensured that the higher voltages do not introduce further problems associated with electro-magnetic compatibility (EMC). So with the available 550 A maximum current limited by available flexible cabling, the following charging times can be achieved for a 30kWh battery pack:
• 200V battery pack in 17 minutes - 3C (450A) charging current is possible • 350V battery pack in 9.6 minutes - 6C (514A) charging current is possible
The high currents required for fast charging may have adverse effects on the connectors of the battery terminals and charging interface. This is particularly important if the battery swapping concept is considered to be viable. To avoid any of these issues associated with cabling and connectors, inductively coupled power transfer could also prove to be feasible. Suitable placing of the inductive coils is a critical factor, as increasing the distance between the inductive coils decreases the efficiency of the power transfer.
4.1.7.3.3 AC Cable Limitations The AC cable greatly affects the maximum line to line voltage. Normally the current and the voltage are limited by electricity suppliers. In this study, it is assumed that the fast charger station can use three supply voltages, 690VAC, 2kVAC and 10kVAC. The DC grid of the electric train is not considered in this section and it is assumed that the charging station is connected to an AC grid only. The AC line to line voltage is described by the following expression:
4.18
where PAC is the AC charging power, Icable is the current through the cable and cosφ is the power factor. Fig 74 shows the AC voltage limits for a maximum charging power of 360kW, with different cable solutions. Different cabling solutions are discussed below.
• 32 A cable - Fig 76 shows that the AC voltage requires a supply of 360kW according to the limitation of the AC cable. With a 32A cable, the AC voltage is almost 3.5kV. Normally the available voltage is 10kV. This solution is not recommended for power electronics, as the voltage across the elements is too high.
• 69A cable – The voltage obtained for a 360kW charging power is 1.1kV. This
solution can be implemented with a cable dedicated to a medium voltage of 5kV. The thickness of this medium voltage cable is 1.3 inches, which is

76 SCHIPHOL THE GROUNDS 2030
manufactured by Eurocabos. This cabling solution could theoretically provide a maximum power of 1.6 MW. Such a solution is unnecessary for two reasons. First, because the available power is over 4 times the required amount and therefore it would increase the cost. Second, because installation of a transformer to extend the medium voltage is costly.
• 206A cable – The low voltage cable available from Eurocabos (114Y03195X)
provides a good solution. The maximum available power is 384kW, which is almost the same as the required power for the fast charger. The cost of this solution is between 35 and 41€/km. The advantages of this solution are that low voltage AC cables are cheaper and easy to extend, and by keeping VAC low, voltage stresses on components are reduced and as a result component costs are reduced.
Fig 76. Voltage Limits for Different AC Cable Solutions
4.1.7.3.4 Fast Charger Power Density Fig 77 shows an estimate of the required volume of the converters for different charge times. The power density figures adopted are taken from (Pavlovsky 2006) and represent the current status (1.7kW/L) and the predicted future trend (6kW/L and 10kW/L). It should be noted that these values only consider the energy conversion components and do not consider any additional equipment required for thermal control (Gerber 2005). Fig 78 shows the charger volume for a 360kW (5 minute) rated fast charge station.
Fig 77. Fast Charger Volumes for Different Power Densities

SCHIPHOL THE GROUNDS 2030 77
Fig 78. Charger Volume for 5 minute Fast Charging Station
4.1.7.3.5 Fast Charger Station Connectors In Europe, the International Electrotechnical Commission (IEC) 61851 applies to equipment for charging electric road vehicles at standard AC supply voltages (as per IEC 60038) up to 690V and at DC voltages up to 1000V, and for providing electrical power for any additional services on the vehicle if required when connected to the supply network. IEC 61851 promotes different charging levels analogous to SAE J1772 used in the US. Coordination between SAE J1772 and IEC 61851 is ongoing. In the US, Level III corresponds to the level of the fast charger in Europe. The Society of Automotive Engineers (SAE) J-1772 committee (USA) develops EV charging and connector standards. With SAE’s Level III connector, drivers can take advantage of public EV fast charger stations without being confined to an overnight home charger. Level III charging can be completed in as little time as 10 minutes. The receptacle (vehicle side) will fit the fuel inlet compartment with a mounting flange. Fig 79(a) and (b) show an example of Level III vehicle-side connectors.
(a)
(b)
Fig 79. Charging Connectors Communication between the vehicle and the fast charger is being developed by IEC 61851-24 (Electric vehicle conductive charging system – Part 24: Communication between vehicle and charging station). This communication will be performed by a cable with a connector, similar to that shown in Fig 79(b). The monitoring and safety of the charging process is carried out by the cable. The protocol of communication used will be similar to an onboard control or safety pilot, which corresponds to standard IEC 309-2 described by Brussa [Appendix 9.2]. The main purpose of the control pilot (formerly known as the Safety Pilot) is to increase the safety and reliability of the EV charging process. The main functions are as follows:
• Verify that the vehicle is properly connected • Continuous protective earth conductor integrity checking

78 SCHIPHOL THE GROUNDS 2030
• Energization of the system • De-energization of the system • Determination of ventilation requirements of the charging area • Transmission of the current rating of EV supply equipment • Start/stop charging • Retain/release coupling
The load impedance on the vehicle side consists of a resistor connected in series with a diode. The negative half wave of the control pilot signal remains unloaded; therefore the wall box can distinguish between the presence of a vehicle and an unintended turn on request. Communication from the on board charger to the wall box is provided by changing of the load impedance. Four operating states (A, B, C and D), as well as two idle states (I) and (X), are possible.
Fig 80. On-board Charge Control
4.1.7.4 Fast Charging by Induction Charging the EV batteries by means of contactless energy transfer could provide an alternative means to implement a fast charging station. Although induction charging has been used in many consumer electronics, applications involving EVs are limited (Wang, Stielau et al. 2005) and (Sugimori, Sakamoto et al. 2000). The fast charging application of interest is a stationary charging point, as represented in Fig 81. Solutions involving a moving track (KAIST 2009) are not considered, as the cost and complexity of developing an infrastructure to support a charging-while-moving system are very much unknown at this point in time. Electromagnetic Compatibility (EMC) issues, which may impact other electronic devices within the vehicle, are not addressed. Similarly, the effect of environmental factors, such as temperature and humidity on energy transfer are not considered in this report.

SCHIPHOL THE GROUNDS 2030 79
Fig 81. Induction Charging Schematic
4.1.7.4.1 Efficiency Design Considerations Location of primary and secondary coil The placement of the pick-up coils of an induction charging system is crucial to ensure both maximum efficiency and ease of use. For the public transport system described in (Villa, Sallan et al. 2009), the proposal consists of primary coils embedded in the road at bus stops with secondary coils placed underneath the bus. The battery can be charged during normal service whilst stationary. For passenger vehicle applications, it may be possible to embed the primary coil in the front or rear bumper. Parking the vehicle close to a structure holding the secondary coil at bumper height would allow the battery to be charged whilst the vehicle is parked. The sensitivity of the system to misalignment between the coils must also be considered when analyzing the effectiveness of a contactless charging system. It is desirable to keep the air gap between the primary and secondary coils as small as possible, as any increase in this parameter results in a reduction in efficiency. The moving track induction charging system reported in (KAIST 2009) has claimed an energy transfer efficiency of 80% with a 1cm air gap, which drops to 60% when the air gap is increased to 12cm. Another study looking at a public transport application examines a 200kW inductive coupling power transfer system with a 35cm air gap, where the battery is recharged at predetermined intervals. Experimental tests using a scaled down system (5kW) show efficiencies of 80-85% for a 20cm air gap and 60-70% for a 33cm air gap. Material and Construction of pick-up coils The physical construction of the pick-up coils is another issue that must be carefully considered. If there is a large separation between the windings, a large leakage inductance will be present which reduces the magnetic flux, thus requiring a larger magnetizing current. The use of ferrite cores is also shown to improve efficiency (Mecke 2001), where it was shown that coils without iron cores required much higher transmission frequencies to achieve a high efficiency. Supply frequency The frequency of the AC supply also influences the energy transfer efficiency, with higher frequencies giving higher efficiencies. The maximum supply frequency is limited by the physical limitations of the frequency converter and by potential EMC issues within the vehicle.

80 SCHIPHOL THE GROUNDS 2030
4.1.7.4.2 Contactless Converter Solutions The secondary rectifier with the filter can be connected by fixed and better cooled copper bars on the battery in the car (inside the bar, the thermal contact is incomparable to the inter-wire thermal contact in a thick cable). The contactless converter is introduced by Load Resonant Converters (LRCs) which have many more distinct features than conventional power converters due to the soft commutation of the switches, no turn-off loss or stress is present. These LRCs are especially well-suited for high-power applications, because they allow high-frequency operation of equipment whose size and weight reduce, without conversion efficiency and imposing extra stress on the switches (Skvarenina 2002). For the scenario assumed in this report, the type of load resonant converter is a series converter which operates in a super resonant mode (15-25 KHz) and regulates power to the battery by increasing the operating frequency to reduce output current for a given voltage. Fig 82 shows the structure for a supply voltage of 690V, 2kV, 6kV. The converter is divided into 2 main parts, the AC-DC converter and the DC-DC converter. Concerning the DC-DC converter, it is preferable to choose a full bridge architecture on the primary side. Because of cost, flyback or forward converters cannot be considered for high voltage and high current applications.
Fig 82. Converter Solution Topology for Contactless Charging
• 690VAC (932V rectified DC, 3x81A rms current with PF=90%) – The converter, shown in Fig 83, is to be super-resonant with a large primary winding, switched at 20-30 kHz, with ferrite plates to concentrate the field. In this cases, the secondary rectifier must accept and average current of 550A (or 330 A for the alleviated case). This is where most of the losses are produced, as the high speed power diodes that can be subjected to 300 or 500 V dissipate elevated power.
Fig 83. DC-DC Resonant Converter
• 2kV AC (2700 V rectified DC, 3x17 or 3x28 A rms current at PF=90%) – The large primary winding, the large stray inductance, and the resulting overvoltage are more problematic in this case because of the higher supply voltage. This medium voltage appears to be the maximum allowable for

SCHIPHOL THE GROUNDS 2030 81
supplying the fast charger. The choice of higher voltage limits the possibility of switching devices to very slow ones. The AC-DC converter shown in Fig 84 is a multilevel inverter, which is required to divide the voltage to the each of the components. With high voltage supplies, the efficiency of this converter is better than the full bridge rectifier.
Fig 84. AC-DC Converter
4.2 Developments in electric mobility
4.2.1 Market and pilot developments If not specified otherwise, the developments in electric mobility that are described in this chapter were found on the internet (online news articles, company websites, etc.).
4.2.1.1 Market niches As discussed in Chapter 2, plug-in hybrids and battery-powered electric vehicles are not yet widely commercially available. However, the hybrid vehicle without the plug-in option is in full commercial stage. The most well known hybrid vehicles are the Toyota Prius, the Honda Civic and the Insight. In the last year, new fiscal regulations for cleaner cars have contributed to a doubling of the sales of hybrid vehicles. In January 2009, more than 23,000 hybrids were on the road in the Netherlands. A year earlier, this number was 11,300 vehicles. This increase in sales is mainly impulsed by drivers who use the car for business purposes. Favourable tax measures for this group of drivers have spurred the sales of hybrid vehicles. As a result, more than half of the hybrids currently in use are registered to a company name. There is also a rise in sales of hybrids to private consumers: from 7,800 in 2008 to 11,000 in 2009. Electric mobility is not limited to the use of electric cars alone. In recent years, other electric means of electric transport have become more and more popular. There is a large growth in demand for Electric bikes, or e-bikes, in recent years. The Netherlands is well known for the widespread use of bicycles. There are approximately 18 million bicycles in use (an average of 3 per household). 1.4 million bikes were sold in the Netherlands in the year 2008. 120,000 of those were electric, a market share of 8.6%. E-bikes have a higher purchase price than conventional ones and therefore contribute more per bike to the overall turnover of the bicycle business in the Netherlands. In May 2009, e-bikes accounted for the first time for more overall turnover (37.8%) than conventional bikes (37.6%).

82 SCHIPHOL THE GROUNDS 2030
The sale of electric scooters is rising as well. In 2008, 2,100 electric scooters were sold, a market share of 5.6%. In 2009, the sale of electric scooters is expected to grow to 5,000 units, a market share of 14.5%. Other examples of market niches are electric vehicles for the elderly and disabled (scootmobiel), and a two-wheeled electric vehicle called Segway.
4.2.1.2 Professional user market niches The development of diesel-electric hybrid and full-electric propulsion during the past decade in professional niches is quite significant. The largest professional niches where hybrid and full electric propulsion were adopted are:
• On-site rolling equipment • Public services • Delivery and logistics
On-site rolling equipment During the past decade, electric powered traction for on-site rolling equipment has been introduced mainly in the form of diesel-electric hybrid propulsion. Some examples found are the first of a kind in their market segment. One example is a mild hybrid shovel that uses 10% less diesel by means of motor management. The reduction in diesel consumption of a new introduced hybrid excavator is estimated to be 25%. The hybrid excavator reclaims the braking energy of the rotational movements of the excavator (Fig 85). The first diesel-electric hybrid heavy forklift has also been introduced, claiming a reduction in diesel consumption of at least 13%. In the year 2007, the first full electric container tractor for container terminals was tested and introduced. The manufacturer claims to have sold about 20 units already.
Fig 85. Diesel-electric hybrid excavator reclaims rotation energy Delivery and logistics The Dutch truck company DAF has developed a 7.5 ton hybrid truck. The incentive for the development of the truck was the increasingly strict rules for noise reduction at loading in cities. In the United States, Mack has also developed a hybrid truck. The Newton built by Smith (UK) has developed a 7.5 ton full electric truck. With an average speed of 80 km/h and a range of 150 km, it is popular as a delivery truck for shops.

SCHIPHOL THE GROUNDS 2030 83
The UK-built Modec 5.5 ton van also has similar technical characteristics. Smith also built the Edison, an electric 3.5 ton box van. In the UK, Smith already delivers electric vans to customers, including TNT and DHL. Smaller delivery vans are commercially available. Examples include the British Mega van, the US ZAP van and the Chinese Eagle and Wayhi vans. Electric vans converted from ICE-vans will be commercially available in 2010, such as the Piaggio Porter, the Fiat Doblo and the Ford van. In the Netherlands, the development of the Quicc van has been limited by the bankruptcy of its major firm Econcern, but it is expected to build the small vans in the very near future. A growing range of electric delivery is was to be expected. Electric vehicles are more energy efficient than ICE-powered vehicles, especially during operations with many starts and stops, something typical for delivery vans. The current active British involvement in electric trucks and delivery vans is not surprising, considering the British tradition of home milk delivery. To ensure quiet delivery in the very early morning hours, the “milk floats” (milk delivery vehicles) in the UK have been electric for decades. In Utrecht, an electric delivery vehicle called Cargohopper delivers goods from a distribution centre just outside the city to individual businesses located in the city centre. Public service Diesel-electric buses have been introduced in the market on a large scale in this past decade. On a global scale, more than ten bus manufacturers currently build hybrid buses and sales in North America are in the thousands of units. The development of full-electric buses has started during this past decade. From several pilots, ranges of about 200 km were reported and specific energy consumption was reported to be around 1.2 to 1.4 kWh per km. Full market introduction has not yet started. Arriva is an international bus company that has announced that it wants to start using three electric buses for public transport in the city of Den Bosch. Spijkstaal conducts a pilot with the ZEUS bus (Zero Emission Urban System) in Rotterdam. This fully electric city bus has a top speed of 35 km/h and operates up to 5 hours in city traffic. In the city of Apeldoorn, the first electric street suction sweeper (ISAL 360) in the market is being tested in a pilot. When the results of the pilot are satisfactory, the municipality will order 5 units. A first pilot of an electric garbage truck is being tested in Rotterdam by the waste company Van Gansewinkel. The Ecotruck 7000, built by Spijkstaal, has a top speed of 32 km/h and a range of 60 km. In the UK, tests were performed with a converted Ford transit pickup truck claimed to be the first electric refuse collecting vehicle in the world. In the US, Odyne has converted several garbage trucks into hybrid trucks. Volvo has already delivered hybrid garbage trucks, which were introduced in Stockholm in 2008. Mack has also developed a hybrid truck in the US. Due to the start and stop operation, hybrid trucks are useful as garbage trucks.
4.2.1.3 Pilots & multi-actor initiatives Currently, availability of electric cars to private customers is very limited. Electric cars are therefore mainly in use as part of company fleets and government vehicles. Following is an overview of these activities and pilots.

84 SCHIPHOL THE GROUNDS 2030
Essent is a large energy company in the Netherlands and it is attempting to let 100 of its employees drive electric cars before the end of 2009. Eneco is another energy company that has announced it will convert 500 of its company cars to electric in the upcoming four years. Charging points for these cars will be installed at the employees' homes. The municipalities of cities such as Rotterdam, Amsterdam, Leeuwarden and Utrecht are also supporting electric mobility pilot projects. Groen Rijden is an organization that aims to stimulate clean mobility in the public sector. As part of the Rotterdam Climate Initiative (RCI), different stakeholders in the city such as the port of Rotterdam, the local government, an environmental service company and an organization of local entrepreneurs have announced plans to cut CO2 emissions and other toxic substances in half through the use of alternative fuels, engines and radical optimization of traffic behaviour. Rotterdam is also making efforts to reduce toxic emissions from inland and sea navigation. The Dutch capital Amsterdam has announced a plan to gradually introduce electric cars in its own fleet of vehicles: starting with 2,000 cars between 2009 and 2011, and expanding to 40,000 electric cars in the city of Amsterdam between 2015 and 2020. Leeuwarden has initiated a project called Drive 4 Electric (D4E). Leeuwarden is aiming to contribute to the goal of deploying 100,000 electric and biofuel vehicles by 2015 in the provinces of Friesland, Drenthe, and Groningen. The D4E project proposes starting with the deployment of 100 electric vehicles, 15 electric taxis (operated by Leeuwarden Taxi Centraal), and 2 electric garbage trucks. Taxis TCA (Taxi Centrale Amsterdam) is the largest taxi company in the Netherlands. In 2009, TCA began using electrically converted British black cabs as part of the taxi fleet. North of Amsterdam, there is already an all electric taxi called Eco2go Cleancab. Amsterdam also intends to deploy electric tourist vehicles. Electric taxi services have also been announced in Utrecht: the taxi company Prestige is starting to collaborate with charging point supplier Mister Green in the use of electric Tuk Tuks in 2009, followed by electric taxi cars in 2010. Car sharing Greenwheels is a car sharing company that is involved in pilot projects in Amsterdam and Den Bosch, where it will support shared electric cars in combination with charging spots. In the city of Veenendaal, a company called CarSharing has recently started to offer an electric car as part of a car sharing scheme. Postal services TNT is the biggest postal and express service company in the Netherlands. It is currently testing the use of electric trucks and delivery vans as part of the mail delivery process. TNT has recently announced its plans to start a pilot project for delivering mail in the islands in the north of the Netherlands with electric cars, bikes, and scooters. Competing express service companies such as DHL and GLS are also taking part in electric vehicle pilot projects. Lease companies Athlon Car Lease is a car lease company that is initiating pilot projects in order to gather information about suitable cars, required infrastructure, and the business model of leasing electric cars. Leaseplan is another car lease company involved in a pilot project in collaboration with the energy supplier Nuon. The objective of this pilot
SCHIPHOL THE GROUNDS 2030 85
project is to gain knowledge about real world experiences with electric mobility. Multilease is yet another lease company that has signed a declaration of intent with All Green Vehicles and Groen Rijden to collaborate intensely on stimulating electric mobility in the Netherlands. Ambulance The first electric support car for ambulances was unveiled on the Dutch island of Terschelling. This car is based on the Th!nk City electric car. In another pilot project that is taking place on the island of Ameland, testing is also being carried out of a similar electric vehicle. Islands are often chosen for electric mobility pilot projects because the limited range of current EVs is not a significant obstacle on these small islands. Urgenda The Urgenda foundation is an initiative of the Erasmus University Rotterdam. The goal of Urgenda is to make the Netherlands more sustainable ‘from the ground up’ by starting innovative initiatives and stimulating entrepreneurship. One of the action points is to have a million electric cars on the road in the Netherlands in the year 2020. Participants in the foundation are from the private sector, NGO’s, media, government, and intermediate organizations. In order to stimulate the production and sale of EVs, organizations and companies associated with Urgenda such as Eneco, TNT and ABN Amro recently announced the intention to purchase 3,000 electric cars. This will be done with a public tender: the company that can deliver the best performing EV at the lowest price will get the order. The Ministries of Transport, Public Works and Water Management (VenW) Housing, Spatial Planning and the Environment (VROM) also announced that they will place orders for the selected car (Bezemer 2009).
4.2.1.4 Research initiatives and collaborations C,mm,n Project In 2005, the Dutch environmental organization Society for Nature and Environment (Stichting Natuur en Milieu) approached the three technology universities in the Netherlands with a proposal to produce a sustainable mobility concept for the year 2020. TU Eindhoven, TU Delft and the University of Twente accepted this proposal by starting the c,mm,n project. Several different organizations, such as the lease company Athlon Car Lease, the bank Rabobank, the IT and business services company Logica, the sustainable mobility platform Transumo, the municipality of Amsterdam, the Rotterdam University of Applied Sciences, and the Netherlands Centre for Social Innovation (TNO) are also involved in this project. C,mm,n follows the open source model: anyone can contribute and use the resources to offer mobility services, just as long as any derived work produced is released back into the community under an open source licence. More than 800 people are currently involved in this project and about 80 are making active contributions. The Transumo (Transition to Sustainable Mobility) foundation is a platform of companies, government institutions, and research institutions that are involved in researching sustainable mobility. Approximately 150 organizations research an alternative to the current mobility system. The new system aims to contribute to reinforcing the Dutch economy, while benefitting the environment and society. D-Incert (Dutch Innovation Centre for the Electrification of Road Transport) is an initiative of the three technology universities in the Netherlands (TU Delft, TU

86 SCHIPHOL THE GROUNDS 2030
Eindhoven, TU Enschede) in cooperation with the applied sciences universities (HTS) Arnhem/Nijmegen and Rotterdam. D-INCERT aims to bring together actors from the scientific community, commercial sector, environmental organizations, policy makers, entrepreneurs, scientists and a broader public. These actors jointly identify the barriers that need to be overcome for electric mobility and initiate projects to stimulate research and development on critical issues and prevent effort scattering. The Next Generation Infrastructure (NGInfra) is a foundation that proposes cooperation between scientists from different disciplines, policy makers, regulators, infrastructure managers, investors, designers, planners, contractors, service providers and operators to develop and test theories, models and tools to ensure that the infrastructures of the future function at their full potential.
4.2.2 Government and politics
4.2.2.1 Dutch National government On July 3rd 2009, the Dutch government announced its ambition for the Netherlands to become a guiding country and international learning environment for electric mobility. A prognosis was given of 1 million electric vehicles in the year 2025. The government makes a financial contribution of up to 65 million Euros and expects the private sector to contribute an additional 500 million Euros. In the announced plan (van der Hoeven and Eurlings 2009) the government contributes on three aspects:
1. Stimulate the introduction of electric mobility: encourage market introduction and remove barriers.
2. Introduce pilot and demonstration projects. Government purchases (government as a ‘launching customer’) directed to electric mobility, supporting the charging infrastructure, research & development, and production of electric vehicles. Founding a consortium and implement supporting policy.
3. A coordinated and phased market introduction. The government recognizes the advantages electric mobility can offer for the Netherlands: improving the energy position, using electric cars as buffer for off-peak electricity, and opportunities for the Dutch industry and economy. Environmental benefits, such as 35% lower CO2 emissions and no tailpipe emissions, help the Netherlands comply with international air standards. Fiscal policies and the introduction of taxing per distance (kilometerbeprijzing) will positively influence the business model of electric vehicles. The installation of a charging infrastructure is stimulated by the government: this infrastructure becomes a part of the current government policy related to fuel stations. The use of renewable energy for this infrastructure becomes a requirement. A Taskforce Smart Grids has been appointed to develop a vision on the introduction of a smart grid for the middle and long term. New safety rules and regulations need to be developed for electric vehicles, such as considerations for crash-, fire-, and water-safety. Pilot projects have been initiated in order to gain insight into the business model for electric vehicles. Investments in R&D and the production of cars and components for electric vehicles have also been announced. The government also plans to promote city distribution centres where electric cars transport goods to shops and businesses in the city centre.

SCHIPHOL THE GROUNDS 2030 87
A taskforce of the current Dutch coalition cabinet formed by the political parties Christian Democratic Appeal (CDA), Labour Party (PvdA), and ChristianUnion (CU) recently published a report about electric mobility. In this report, advice is given to base policy to support electric mobility on current, proven technology. This means not focusing on promises of the future, but on readily available cars with an electric range of 80-150 km. The report recommends supporting Dutch companies involved with range extender technology because it is seen as a promising development. However, investing public money in a national charging infrastructure is seen as undesired; making this investment is the responsibility of private companies. The taskforce expects the electric car to be a good supplement to public transport. It would therefore be recommended to implement charging points at train stations across the country. The excess capacity in the electricity network of the railroads could be used for charging electric cars. The report also recommends making the rules and regulations regarding the installation of charging points more flexible. In order to stimulate the purchase of electric cars by private customers, the taskforce recommends subsidizing the relatively expensive battery. Furthermore, introducing financial regulations which cover the warranty of the batteries would take the risk of owning this battery away from the vehicle owner. This would make consumers more inclined to invest in an electric vehicle instead of a conventional one. Finally, priority should be given to reaching international standardization agreements on formats and connections for the charging infrastructure. This infrastructure should be gradually installed; it could be possible that future developments make current infrastructure obsolete in a short period of time. Therefore, in order to prevent a lock-in in this infrastructure, flexibility towards future developments should be kept in mind (Bolier 2009). For developing a sustainable national energy economy in the future, the Energy Transition program was initiated by the Dutch government a couple of years ago. The Energy Transition is an initiative of the Dutch Ministry of Economic Affairs, the Ministry of Housing, Spatial Planning and the Environment, the Ministry of Agriculture, Nature and Food Quality, the Ministry of Transport, Public Works and Water Management, the Ministry of Foreign Affairs and the Ministry of Finance. Seven themes for the Energy Transition have been defined. These themes were selected because they are feasible and they offer the Netherlands considerable economic opportunities. A platform has been set up for each theme; the Sustainable Mobility Platform is involved with different types of cleaner vehicles and fuels. The Sustainable Mobility Platform aims to include entrepreneurs, local and regional governments, and other relevant organizations in order to accelerate market introduction of sustainable fuels and vehicle technologies.
4.2.2.2 Regional and local policy The implemented policies and pilot projects carried out by different local municipalities are discussed in section 4.2.2.1, specifically in the paragraph on electric vehicle users. Regional governments in the Netherlands (provinces) are also involved with electric mobility. An example is the Energy Valley organization, an initiative of the provinces of Drenthe, Friesland, and Groningen in the north of the Netherlands. Energy Valley aims to improve employment rates in these provinces by stimulating energy activities. Promoting the use of alternative fuels for vehicles is also part of the Energy Valley’s objectives. Other provinces, such as the province of North-Brabant, are involved with electric mobility as well: North-Brabant invests in the plans developed in the municipality of Den Bosch. North-Brabant announced its ambition to have 200,000 electric cars in the province by the year 2020.

88 SCHIPHOL THE GROUNDS 2030
4.2.3 Industry
4.2.3.1 Industry in the Netherlands Industry developments regarding electric vehicles The following discussion of industry developments is focused on the Netherlands. Three groups of actors are involved with electric vehicles: car manufacturers, the automotive supply industry, and the users of electric cars, each of which will be discussed separately. Vehicle manufacturers There are several companies involved in the development and production of electric vehicles located in the Netherlands. One company, Duracar, is involved with developing and producing electric transport solutions for urban areas. Duracar’s first product is the QUICC! DiVa, a small, fully electric delivery van that will go into mass production in the year 2010. TTd, which stands for Transport Techniek Delft, is yet another company involved in the production of various types of electric vehicles. TTd cooperates with Duracar on the production of the QUICC! DiVa. TTd has also converted a hybrid car (Toyota Prius) into a Plug-in hybrid and produced an electric scooter. All Green Vehicles (AGV) is a Dutch company that recently announced plans to build a production facility for electric cars in the Netherlands. In this factory, electric versions of the Korean sports car Spirra will be built. AGV will also assemble electric versions of the Volvo V50 and C30 in this factory. All of these cars will be equipped with in-house developed Li-ion battery packs. AGV also plans to import small Suzuki trucks without their engine from China, in order to convert these to electric vehicles and bring them to the market under their own brand name. AGV is also planning to import six-seater electric cars from the South African manufacturer Optimal Energy. The Netherlands has a well established bus and truck industry. Manufacturers such as Daf, VDL, and Spijkstaal are currently investigating electric and hybrid drivetrains. Electric Cars Europe (ECE) is a producer and importer of electric cars that has created an electric sports car by converting a Lotus Elise into electric drive. ECE has plans to collaborate with Detroit Electric, Friend EV, and Proton in order to produce electric cars on a large scale. Detroit Electric is an American production company and Proton is a Malaysian car manufacturer. Automotive supply industry Although many large automotive manufacturing plants are situated outside the Netherlands, many suppliers to these plants are located in the Netherlands. Some of these suppliers are presently focusing more on developing and producing components for electric powered vehicles. An example of such a company is Innosys Engineering, a company that develops electric drivetrains for vehicles up to a total vehicle weight of 3.5 tons. Another company, Friend EV (which stands for Frisian Environmental Development), is focusing on developing highly efficient and lightweight electric motors that can be applied in electric vehicles. The previously mentioned company Detroit Electric will implement electric motors produced by Friend EV in cars from the Malaysian manufacturer Proton in order to convert them to all electric drive. Production is expected to start in 2010 (Knoppers 2009). A company called e-Traction is also developing electric motors, however unlike Friend EV, e-Traction is developing in-wheel electric motors. Their product named Whisper is already in use in an electric bus used for passenger travel in the city of Apeldoorn. Range extenders are also being developed in the Netherlands. A company called PEEC Power is developing a lightweight, highly efficient generator for electric vehicles. This generator is different

SCHIPHOL THE GROUNDS 2030 89
from a conventional combustion engine in that no mechanical connection exists between the pistons and the crankshaft. In fact, there is no crankshaft in this generator at all; two opposing pistons move back and forth inside one cylinder. In order to generate electricity, the pistons turn an attached ring with magnets, forming a dynamo that creates an electrical current. Evisol is yet another company that specializes in electric vehicle components. In 2007, Evisol developed an electric car based on the Lotus Seven and destined for demonstration purposes named the Evisol Thorr. The company SP Innovation imports conversion kits produced by the British company Amberjack which enable the conversion of a hybrid car (Toyota Prius) into a Plug-in hybrid. Electric vehicle users The third group of actors consists of the parties that use electric vehicles. Currently, electric cars are available on a very limited basis to private customers. Electric cars are therefore currently mainly in use as parts of fleets of company and government vehicles. Following is an overview of these actors. Essent is a large energy company in the Netherlands and it is attempting to let 100 of its employees drive electric cars before the end of 2009. Eneco is another energy company that has announced it will convert 500 of its company cars to electric in the upcoming four years. Charging points for these cars will be installed at the employees' homes. The municipalities of cities such as Rotterdam, Amsterdam, Leeuwarden and Utrecht are also supporting electric mobility pilot projects. Groen Rijden is an organization that aims to stimulate clean mobility in the public sector. As part of the Rotterdam Climate Initiative (RCI), different stakeholders in the city such as the port of Rotterdam, the local government, an environmental service company and an organization of local entrepreneurs have announced plans to cut CO2 emissions and other toxic substances in half through the use of alternative fuels, engines and radical optimization of traffic behaviour. Rotterdam is also making efforts to reduce toxic emissions from inland and sea navigation. The Dutch capital Amsterdam has announced a plan to gradually introduce electric cars in its own fleet of vehicles: starting with 2,000 cars between 2009 and 2011, and expanding to 40,000 electric cars in the city of Amsterdam between 2015 and 2020. Leeuwarden has initiated a project called Drive 4 Electric (D4E). Leeuwarden is aiming to contribute to the goal of deploying 100,000 electric and biofuel vehicles by 2015 in the provinces of Friesland, Drenthe, and Groningen. The D4E project proposes starting with the deployment of 100 electric vehicles, 15 electric taxis (operated by Leeuwarden Taxi Centraal), and 2 electric garbage trucks. Table 16 gives an overview of the actors discussed above. Table 16. Overview of actors involved with electric vehicles in the Netherlands Vehicle manufacturers Automotive supply industry Technology suppliers Duracar Innosys Engineering Epyon
Transport Techniek Delft Friend EV Mister Green
Daf e-Traction Reewoud Energietechniek
VDL Evisol Elektromotive
Spijkstaal Amberjack (imported by SP Innovation)
Coulomb Technologies

90 SCHIPHOL THE GROUNDS 2030
Electric Cars Europe PEEC power
All Green Vehicles
Detroit Electric
Proton Industry developments regarding user interface and charging NRGspot The NRGspot concept was developed by Epyon, a Dutch company specialized in charging technology. The NRGspot system is part of a public fast charging infrastructure for electric vehicles. NRGspots can be used to fast charge electric vehicles ranging from delivery scooters, electric bicycles to electric cars and delivery trucks. The system can be used by subscribers and is accessed through an intelligent interface. After a quick log-in, the system can be used to charge the user’s electric vehicle within 15-30 minutes. The system will initially be placed at strategic places near shopping centres in large cities. The NRGspot can be used by fleet owners such as delivery services, taxi services and individual consumers. Two first-generation models of NRGspots have been installed in the city of Rotterdam. However, fast charging is not yet possible at these locations (only slow charging) because is is prohibited by Kema regulations on user safety. Various stakeholders are involved in the NRGspot pilot project in the city of Rotterdam: the fleet owner TNT, the electric bike and scooter supplier Qwic, the product design studio Mango, and the municipality of Rotterdam. ChargePoint Reewoud Energietechniek is a company involved in installing charging spots under the name ChargePoint. The system was developed in the United States by Coulomb Technologies and has been adapted by Reewoud Energietechniek in order for it to be used in the Netherlands. The first orders were placed by the municipalities of Amsterdam (initially 45 spots, followed by 200 spots available in 2012) and Apeldoorn. Coulomb Technologies supplies charging points that communicate over a wireless network to one main charging point. This main charging point is connected to the central controlling station. Users have access to the charging points with a magnetic pass or smart card, which also can store credit for paying for the charged electricity. To use a ChargePoint charging station, a user holds an authorized smart card near the card reader on the station's front panel. Once authorized, the station door will unlock, allowing the user to plug in their vehicle, and will energize the outlet once the door is safely locked securing the driver's cord. Another payment option is paying by means of a mobile phone. In pilot projects such as the one in Amsterdam, users can charge their vehicles free of charge. Elektrobay The British company Elektromotive specializes in charging accessories for electric and Plug-in hybrid vehicles. In a short period of time, they have installed 160 units of their charging pole product Electrobay in the UK. Electrobay charging poles have been exported to other countries as well; Elektromotive has received orders from Saudi Arabia, Sweden, Germany and the Netherlands. Electrobays are able to handle various payment methods for the electricity charged. Users own a key fob for gaining access and verify their authorization to the Electrobay. Key fobs are key chain attachments that utilize authentication technology in order to communicate with the charging pole. The key fob connects when moved near to a yellow spot on the pole. Currently, the charged electricity is paid for by storing credit on the key fob.
SCHIPHOL THE GROUNDS 2030 91
Preparations are being made to facilitate payment via mobile phone (by sending a SMS), or by automatically billing the electricity account of the customer. E-points for electric bikes and scooters The energy supplier Nuon, the environmental organization Natuurmonumenten, and the charge point supplier Mister Green have begun to install 26 charging points for electric bikes and scooters in national parks throughout the Netherlands. The number of charging points for electric bikes and scooters is expanding rapidly. On the website (http://www.elektrischvervoernederland.nl/epoints.php) a total number of 826 charging points are shown (mainly near restaurants, hotels, bike repair shops, etc.), at which bikes and scooters can be charged for free. Table 17. Overview of actors involved with user interface in the Netherlands Technology suppliers Interface users Various other stakeholders Epyon TNT Qwic
Mister Green municipality of Rotterdam Designstudio Mango
Reewoud Energietechniek municipality of Amsterdam Natuurmonumenten
Elektromotive municipality of Apeldoorn Kema
Coulomb Technologies municipality of Den Bosch
Private electric scooter and bicycle users
Industry developments regarding energy sector and the infrastructure Dutch energy market The value chain of the Dutch energy market consists of different parties: energy producers, the facilitator of the high voltage network (Tennet), regional network companies (that facilitate distribution networks and the low voltage network), buyers (the party that buys the electricity for the providers), and providers (that sell electricity to customers). The largest energy producers in the Netherlands are: Nuon, Essent, Electrabel, Intergen, Delta, and E.ON. However, electricity is also imported to the Netherlands from abroad. The Netherlands is a net importer of electricity: in the year 2008, 24.967 GWh was imported and 9.116 GWh exported. For this importing and exporting ability, the Dutch electricity network is connected to the neighbouring countries Belgium and Germany. Besides connections to these countries, there is also a connection to Norway. New connections are planned with Denmark and Great Britain. The regional network companies Enexis, Liander, DELTA Netwerkbedrijf, Westland Infra, NRE Netwerk, RENDO, Cogas, and TenneT recently announced a plan to install a charging infrastructure for electric cars. These network companies have established a foundation which plans to implement 10,000 public charging spots over the coming years. In 2009, the first charging spots were installed. The objective of this initiative is to implement 10,000 charging points by the year 2012. The main energy providers in the Netherlands are Essent, Eneco, and Nuon. Prorail Prorail is a Dutch company that is responsible for the railroad infrastructure in the Netherlands. This company is currently investigating the possibility of using the facilities at train stations and the rail line electricity network to install public charging
92 SCHIPHOL THE GROUNDS 2030
points. By doing so, the spare capacity of the rail line network could be utilized for charging cars. Table 18. Overview of actors involved with energy and the infrastructure in the Netherlands Energy producers Energy network
and infrastructure Energy providers
Delta Electrabel E.ON EPZ Essent Intergen Nuon Producers from abroad
Better Place Cogas Delta Enexis Liander NGInfra NRE Netwerk Prorail RENDO Tennet Westland Infra
Atoomstroom Dong De Nederlandse Energie maatschappij Essent Eneco Energiedirect Greenchoice Nuon Oxxio ONS
4.2.3.2 Global car industry Renault-Nissan The French manufacturer Renault and the Japanese manufacturer Nissan formed an alliance in the year 1999. Under this alliance, the companies jointly develop new cars. Recently, Nissan unveiled the Leaf, an electric car scheduled to go into mass production for the global market in the year 2012. Renault-Nissan plans to quickly ramp up the production of electric vehicles in Japan, Europe and the U.S. over the next several years. The Alliance has formed partnerships with 26 governments, cities and other organizations in order to advance the deployment of EVs worldwide. Currently, Renault-Nissan is testing prototype EVs in fleets of vehicles. The Alliance has begun initiatives in Japan, Israel, Denmark, Portugal, Monaco, the UK, France, Switzerland, Ireland, China and Hong Kong. In the United States, the Alliance is active in Tennessee, Oregon, Sonoma County, San Diego, Tucson, Phoenix (Arizona), Seattle (Washington) and Raleigh (North Carolina). Renault-Nissan recently announced an alliance with the car rental company Europcar to manufacture electric vehicles available for customer rentals starting in 2010. Electric rental cars will first be available in Europe (specifically, France, Germany, Belgium, Spain, Italy, Portugal and the United Kingdom) followed by Australia and New Zealand. Renault-Nissan is also involved in the Better Place project, which will be discussed later in more detail. Toyota Plug-in Prius Toyota is currently developing a Plug-in version of the hybrid car Prius. The company has announced its PHEV Prius roll-out plans: a total of 500 new-generation plug-in Prius cars will be fleet tested in Europe, Japan and the US by the year 2010. In Europe, Toyota will bring 100 plug-in Prius cars to France, Strasbourg first, followed by cities in the UK, Germany and the Netherlands by mid-2010. The plug-in hybrids will be leased for three years to local companies and partners. The energy company EDF will install charging points in private homes and at participating partner locations, as well as in parking lots and along the roads. The goal of these pilots is to broaden consumer understanding and acceptance, in preparation for broad commercialization in the future.
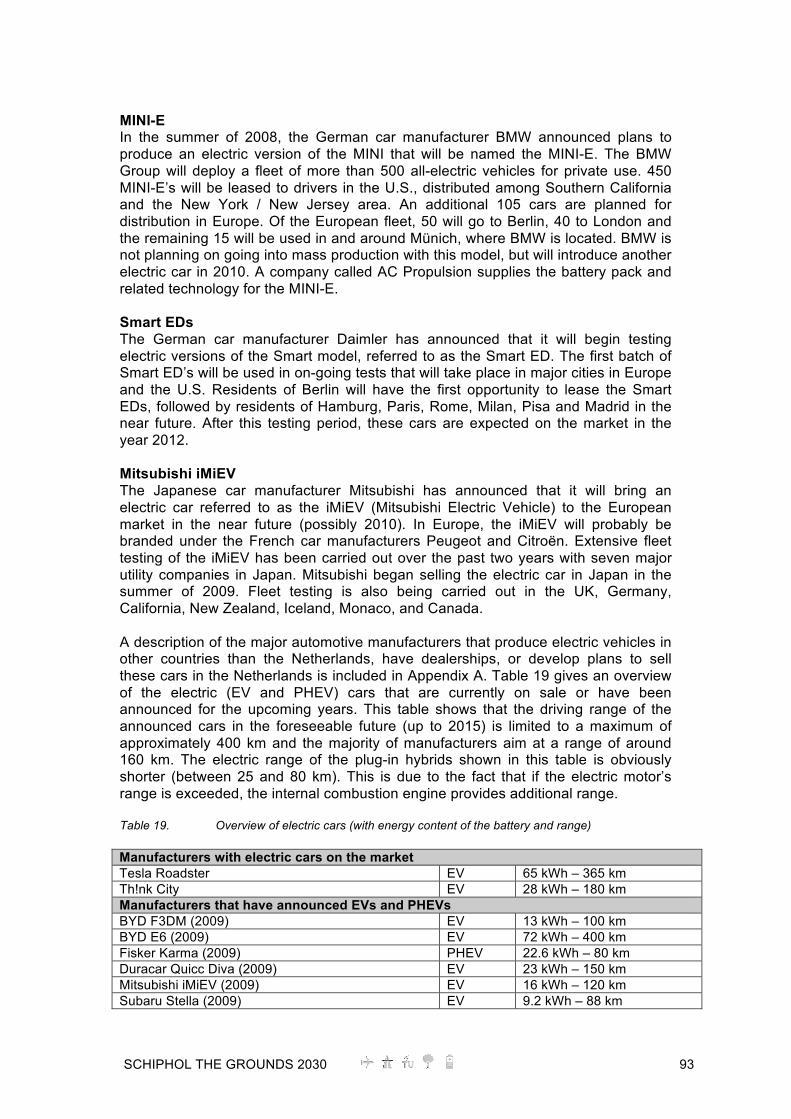
SCHIPHOL THE GROUNDS 2030 93
MINI-E In the summer of 2008, the German car manufacturer BMW announced plans to produce an electric version of the MINI that will be named the MINI-E. The BMW Group will deploy a fleet of more than 500 all-electric vehicles for private use. 450 MINI-E’s will be leased to drivers in the U.S., distributed among Southern California and the New York / New Jersey area. An additional 105 cars are planned for distribution in Europe. Of the European fleet, 50 will go to Berlin, 40 to London and the remaining 15 will be used in and around Münich, where BMW is located. BMW is not planning on going into mass production with this model, but will introduce another electric car in 2010. A company called AC Propulsion supplies the battery pack and related technology for the MINI-E. Smart EDs The German car manufacturer Daimler has announced that it will begin testing electric versions of the Smart model, referred to as the Smart ED. The first batch of Smart ED’s will be used in on-going tests that will take place in major cities in Europe and the U.S. Residents of Berlin will have the first opportunity to lease the Smart EDs, followed by residents of Hamburg, Paris, Rome, Milan, Pisa and Madrid in the near future. After this testing period, these cars are expected on the market in the year 2012. Mitsubishi iMiEV The Japanese car manufacturer Mitsubishi has announced that it will bring an electric car referred to as the iMiEV (Mitsubishi Electric Vehicle) to the European market in the near future (possibly 2010). In Europe, the iMiEV will probably be branded under the French car manufacturers Peugeot and Citroën. Extensive fleet testing of the iMiEV has been carried out over the past two years with seven major utility companies in Japan. Mitsubishi began selling the electric car in Japan in the summer of 2009. Fleet testing is also being carried out in the UK, Germany, California, New Zealand, Iceland, Monaco, and Canada. A description of the major automotive manufacturers that produce electric vehicles in other countries than the Netherlands, have dealerships, or develop plans to sell these cars in the Netherlands is included in Appendix A. Table 19 gives an overview of the electric (EV and PHEV) cars that are currently on sale or have been announced for the upcoming years. This table shows that the driving range of the announced cars in the foreseeable future (up to 2015) is limited to a maximum of approximately 400 km and the majority of manufacturers aim at a range of around 160 km. The electric range of the plug-in hybrids shown in this table is obviously shorter (between 25 and 80 km). This is due to the fact that if the electric motor’s range is exceeded, the internal combustion engine provides additional range. Table 19. Overview of electric cars (with energy content of the battery and range) Manufacturers with electric cars on the market Tesla Roadster EV 65 kWh – 365 km Th!nk City EV 28 kWh – 180 km Manufacturers that have announced EVs and PHEVs BYD F3DM (2009) EV 13 kWh – 100 km BYD E6 (2009) EV 72 kWh – 400 km Fisker Karma (2009) PHEV 22.6 kWh – 80 km Duracar Quicc Diva (2009) EV 23 kWh – 150 km Mitsubishi iMiEV (2009) EV 16 kWh – 120 km Subaru Stella (2009) EV 9.2 kWh – 88 km

94 SCHIPHOL THE GROUNDS 2030
Tata Indica EV (2009) EV ? kWh – 200 km Chery S18 EV (2009) EV 40 kWh – 150 km Coda EV (2010) EV 33.8 kWh – 140 km Ford Connect (2010) EV 24 kWh – 160 km General Motors Volt (2010) PHEV 16 kWh – 64 km Chrysler (Dodge) Circuit EV (2010) EV 26 kWh – 280 km Chrysler (Jeep) PHEV (2010) PHEV 27 kWh – 64 km Chrysler Town & Country (2010) PHEV 22 kWh – 64 km Detroit Electric e63 (2010) EV 25 kWh – 180 km Detroit Electric e46 (2010) EV 40 kWh – 320 km BMW EV (2010) EV unknown
42 kWh – 240 km 70 kWh – 368 km
Tesla Model S (3 versions) (2011) EV
95 kWh – 480 km Th!nk Ox (2011) EV 40 kWh – 200 km Renault-Nissan (2012) Leaf EV 24 kWh – 160 km Toyota Prius plug-in (2012) PHEV 4.8 kWh – 25 km Daimler Smart ED (2012) EV 14 kWh – 115 km Ford Focus EV (2012) EV 23 kWh – 160 km Ford Escape PHEV (2012) PHEV 10 kWh – 64 km Volvo V70 PHEV (2012) PHEV 11.3 kWh – 42 km Volkswagen UP! EV (2013) EV ? kWh – 130 km Volkswagen Golf Twin Drive (2015) PHEV 12 kWh – 50 km Honda EV (2015) EV unknown
4.2.3.3 Battery manufacturers & other suppliers Many large car manufacturers have recently started to form alliances and joint ventures with battery manufacturers in the development of lithium-ion batteries for cars. Table 20 shows an overview of the partnerships that have been formed between car and battery manufacturers. This indicates that important players are preparing for mass production of vehicles based on this technology. Table 20. Alliances between car and battery manufacturers Car Manufacturer Battery Manufacturer Toyota Panasonic (Toshiba)
GM, Opel, Chevrolet A123 (Continental), CPI (LG), Hitachi, Enerdel
Ford Johnson-Control-Saft(JCS), Enerdel, Sanyo
Renault, Nissan AESC (NEC)
Volvo, Saab ETC
GE, Think A123, Enerdel, Zebra (Electrovaya)
Mitsubishi Lithium Energy Japan
BYD BYD
Hyundai, KIA LG
Fiat Bolloré, Magneti Marelli, FAAM SpA
Daimler, Mercedes-Benz Continental, Johnson-Control-Saft (JCS)
Audi, VW, Honda Sanyo There are also firms other than battery manufacturers that are involved in the development of electric vehicles. Companies such as engineering firms or divisions,

SCHIPHOL THE GROUNDS 2030 95
production companies and drivetrain developers play an important role in the development process of new electric vehicles. Robert Bosch Automotive is the largest supplier of parts to European carmakers. French supplier Faurecia is the second largest, and the previously discussed Canadian company Magna International is the third largest supplier. Some examples can be given of industry collaborations between different companies working on announced electric cars. For example, U.S. Plug-in hybrid start-up Fisker plans to manufacture the Karma car in Finland. The Valmet Automotive company will be responsible for building the bodies and the final assembly in Uusikaupunki, Finland. The EV manufacturer Th!nk recently announced it will move its electric car production from Norway to this factory as well. Fisker is targeting a production start in late 2009. The Canadian battery producer Electrovaya and India’s Tata Motors have partnered to produce the electric version of Tata’s Indica hatchback. The Indica electric car will be manufactured in Norway by the Norwegian EV tech company Miljø Innovasjon, using Tata’s design and Electrovaya’s lithium-ion batteries. The California EV start-up Coda Automotive (formerly Miles Electric Vehicles) announced that it will be introducing an all-electric sedan to the mainstream California market in 2010. The Coda sedan will be assembled in China by Hafei Automobile Industry Group. The new car is based on an existing Hafei chassis that has been re-engineered by Porsche Engineering from Germany. The engineering division of the British sports car manufacturer Lotus is involved in the development and production of the Tesla Roadster. This car is assembled at the Lotus factory in Hethel, England, with drivetrain components and body components supplied to the factory by Tesla. Established manufacturers such as Ford and Renault are seeking the expertise of specialized companies for developing their EVs. Ford is collaborating with Smith Electric vehicles and Renault uses electric drivetrains from AC Propulsion in the electric Renault Meganes that are used in the Better Place pilot projects. Other established companies that cooperate in developing electric cars include Siemens Corporate Technology and Porsche tuning specialist Ruf Automobile. Ruf and Siemens developed an adapted power train for an electric Porsche called the eRuf Greenster.
4.2.4 International activities on electric mobility In order to generate an overview of international activities on electric mobility, a review was carried out of news articles on these activities. An attempt has been made to make this discussion as complete as possible; however, it might be the case that some activities taking place in the world have been overlooked. An example of a company that is carrying out activities on a global scale is Better Place. This American company intends to accelerate the transition to electric cars. Better Place plans to deploy the infrastructure on a country-by-country basis with initial deployments beginning in 2010 and commercial sales beginning in 2012. After Israel, Denmark, Australia, California, Hawaii, and Canada, the Netherlands is the next country in which Better Place plans on becoming active. The infrastructure that Better Place proposes consists of a network of charging points supplemented by
96 SCHIPHOL THE GROUNDS 2030
battery swapping stations for longer trips. Better Place owns the batteries and charges the customer for the distance travelled via a subscription. This business model is similar to the way mobile phones are traded.
4.2.4.1 Country-specific activities France The French government announced a plan to expand a sustainable transportation infrastructure in France, including more funding for electric vehicles. Subsidies and affordable loansv, totalling €250 million, are being offered to companies developing EVs and EV-related equipment. Renault reached an agreement with the French electric utility company EDF in order to develop a zero emissions personal transportation system. EDF already possesses a substantial fleet of electric vehicles, claimed to be the world’s largest. EDF will cooperate with Renault on bringing the battery-powered vehicles that it is developing with its partner Nissan to the mass market in France. The goal of the cooperation is to set up charging infrastructure and distribute charging systems to consumers prior to a commercial launch of electric vehicles in 2011. The companies will jointly study the engineering and regulatory requirements and make sure that the hardware is in place to support the effort. In September of 2010, 100 battery-powered vehicles produced by the French and Japanese automakers will be put into service in a field test around Paris. The automakers will use the test as a final real world evaluation of the passenger and commercial electric vehicles it plans to launch in 2011. EDF and various local authorities will be installing a charging infrastructure at parking areas, along highways and at workplaces. The mayor of Paris recently announced plans to offer an EV public rental service named Auto’lib. This electric car rental service was inspired by the public bike rental system Ve’lib that is already in place in Paris. An electric car rental service of 50 converted Peugeot 106 cars is already available in the city of La Rochelle. Great Britain The UK government has announced a £250 million incentive program designed to get more plug-in and electric vehicles on British roads. The program is aimed primarily at next-generation full-function electric vehicles. Consumers would receive up to £5,000 in subsidies towards the purchase of full electric or plug-in hybrid vehicles. In addition to subsidizing car purchases, the government wants to invest in more public charging outlets. London mayor Boris Johnson launched a plan to get 100,000 electric cars on the streets of London by 2015, including the creation of 25,000 charging stations. He promised electric motorists an exemption from the congestion charge imposed on drivers in central London. £20 million of the national project has been set aside for developing the country’s infrastructure of charging points. The Technology Strategy Board announced a total of £25 million for eight projects to make EVs and “ultra-low carbon vehicles an everyday feature of life on Britain’s roads in less than five years.” Automotive partners include Ford, BMW (MINI), Smart, Mitsubishi and Toyota. Ford will start testing a fleet of battery-powered Focuses in the UK in the year 2010 with funding from a British government program. The electric Focuses will be used by staff from Scottish and Southern Energy in Hillingdon, Middlesex, a utility company that is partnering with Smith and Ford on the program.

SCHIPHOL THE GROUNDS 2030 97
BMW will also be a part of the year-long, £25 million field test with its MINI E. Utility company Scottish and Southern Energy will be testing the cars along with the Focus EVs. The MINI factory is located in Oxford. The utility company will install public and private charging stations around Oxford for use by the car drivers and for monitoring usage data. Over 100 Smart EDs will be tested in 2010 as part of fleets of leased cars. These test fleets are building up to the Smart ED’s general availability in 2012. By 2010, the electric Smart should be in limited series production, featuring lithium-ion battery packs supplied by Tesla. Germany The German government approved a plan that aims to put 1 million electric vehicles on the road by 2020. The government plans to spend €500 million on the plan over the next three years, including €115 million for establishing eight test regions that will examine how the cars could best be introduced. It plans to put € 170 million into battery research, making domestic production a priority and ensuring that German experts are trained in the technology. Other measures that will be considered include incentives, such as special traffic lanes or parking spots for electric cars. Germany’s Volkswagen, Europe’s largest automaker, has said that it plans to introduce its first electric cars to the market in the year 2013. Car manufacturer Daimler, which has been testing an electric version of its two-seater Smart, is working with California-based electric car maker Tesla Motors Inc. on developing better battery and electric drive systems. Daimler and German utility RWE have announced that they will begin an electric car field test. The “e-mobility Berlin” project will see Daimler deploy a fleet of over 100 Smart ED and Mercedes A-Class electric cars. In cooperation with parking space company APCOA, RWE will install 500 public charging stations to support these vehicles. The MINI-E is also being tested in Berlin and Münich. The Münich test will take 12 months to complete. E.On will provide electricity for the cars in the form of 13 special charging stations near the city centre. The electricity for these stations will be certified as originating from renewable energy sources. Frankfurt Airport is testing two Mitsubishi iMiEVs on site. There are currently about 3,000 vehicles of various types being operated in and around the airport. By 2015, the owner of the facility wants 20 percent of the fleet to be battery powered. By the end of the next decade, the plan is to have over 60 percent of the airport vehicles running on electricity. The German rental company Sixt is the first company that offers electric cars for rent. Starting in a pilot project in 2009, Sixt, RWE and Siemens organized a road show in which test drives could be made with an eRUF Greenster and a Tesla Roadster. Visitors to the road show could try out these electric cars themselves. Sixt is also testing electric cars in pilots in Denmark and Germany with converted Citroen C1 EVs. Spain The Spanish government has announced it will spend up to 10 million Euros to support the early introduction of electric vehicles and to build a charging infrastructure. Spain is taking multiple paths towards helping domestic automakers produce cleaner cars, including offering low-interest loans to automakers operating within its borders. General Motors is an automaker that is currently looking at bringing plug-in vehicles to Spain. Spain launched a series of plans to make the

98 SCHIPHOL THE GROUNDS 2030
country greener. It includes a target of 1 million hybrid, plug-in and all-EV cars on the roads by 2015. The government is offering subsidies for 15-20 percent of the vehicles' cost. The Ministry of Industry, as well as two regional Governments, have created a task force along with Renault to give the EV car project a boost and retain workplaces in Spain. The Spanish Ministry of Industry, Tourism and Commerce has announced an agreement with Nissan-Renault to study the possibility of a large-scale project (similar to Better Place) to manufacture and sell EVs in Spain, as well as creating a network to plug them. Norwegian manufacturer Th!nk has announced that it will deliver 550 Th!nk City electric cars to Spain in 2009 and 2010. A pre-program demonstration project starting with 5 TH!NK city vehicles began in the early summer of 2009. These first vehicles were intended to gather early real time experiences of running and operating EVs in Spain. The Ministry of Industry and the Institute for Diversifying and Saving Energy have presented a plan called Proyecto Movele. Under Movele, the government would install an electric car infrastructure in several cities. The electric vehicles consist of an eventual fleet of 500 cars expected to be purchased in part by private owners and in part by the state (subsidized in both cases up to by 30% state funds). The cities of Seville and Barcelona have been chosen along with the capital Madrid to implement a test network of 546 state-subsidised recharging points. In Madrid, a test project has begun that will convert 30 telephone booths into charging stations. The rise of the mobile phone has made telephone booths increasingly underused. Phone boxes are often ideally placed close to the curbs of pavements and already have their own electricity supply, making them relatively easy to adapt. Seville is Spain’s fourth largest city and its municipality plans to install 75 public electric vehicle recharging stations, a project that is expected to finish in 2009. Seville is placing recharging stations in the most used parking lots in the city, as well as at the airport, city hall offices and other official buildings. The plan includes 500 electric cars, which will be allocated not only to public institutions but to private users as well. Additionally, the program includes three 24-hour mechanics posts ready to fix any issue with batteries or electric motors. Italy Daimler is expanding the e-mobility test program that will launch in Berlin in 2009 to Italy in 2010. 100 Smart ED cars will go into service in the Italian cities of Rome, Milan and Pisa in 2010. Italian power provider Enel will set up a network of 400 smart charging stations in those three cities. Daimler will supply and maintain the cars while Enel will provide the electricity from renewable energy sources such as hydro, solar and geothermal. The Enel charging stations will be able to retrieve identification data from cars when they are plugged in, enabling direct billing of the operator of the vehicle. The charging infrastructure will also be able to communicate remotely with vehicles, allowing drivers to locate available charging points. In the city of Bergamo, the opportunity exists to rent a small electric car with a short range, or neighbourhood electric vehicle (NEV). These vehicles have been named Startlab Open Street and can be rented from a company called Puntogiallo. As a bonus, Bergamo offers free parking spaces for these EVs. Denmark Denmark was one of the first countries to collaborate with the Better Place Project in developing a charging infrastructure. Recently, Denmark announced plans for a test that combines wind power and vehicle-to-grid (V2G) technology. In this test, electric vehicle batteries are used as a temporary buffer during calm air periods. Denmark

SCHIPHOL THE GROUNDS 2030 99
plans to hold this V2G test on the island of Bornholm, a location that already has enough wind turbine capacity to meet 40 percent of its electricity needs. However, only 20 percent of its power is derived from wind because of inconsistency. Denmark will use plug-in vehicles to evaluate whether the capacity utilization of wind power can be improved by feeding power from the cars back into the grid. If the project is successful, more wind turbines will be added with the goal of meeting half of Bornholm’s power needs with wind. Another interesting development is that it is possible on the Stena Line ferry service to charge an electric car on board during the journey. The ferry travels between Oslo, Norway to Frederikshavn, Denmark. Sweden Mitsubishi is partnering with the energy company Fortum to promote the use of electric vehicles in Sweden and Finland by promoting the new iMiEV in those countries. Fortum generates and distributes electricity and heat in Scandinavia and the Baltic region. As an electricity provider, Fortum is interested in promoting any devices that consume its product and is making plans to build a charging network in the region to facilitate the use of EVs. In the Northern areas of Sweden and Finland, a preliminary network is already in place thanks to the block heaters that people plug in on their cars during the long cold winters. Fortum has been promoting the iMiEV at public events in Finland and expects field test cars to arrive in the fall of 2009. The Swedish manufacturer Volvo (owned by Ford) and the energy utility Vattenfall have made an announcement that the two companies have partnered to develop a plug-in diesel hybrid that should begin series production in 2012. The first 3 demonstration vehicles are to be completed in the summer of 2009. Volvo will supply the cars while the energy utility will provide charging units and carbon-free electricity for charging the Volvo V70 plug-in hybrid. The Swedish company AutoAdapt is currently producing a battery-powered Fiat 500 at its factory near Gothenberg. Autoadapt is working with Alelion Batteries and Fiat to carry out series production of several Fiat models with electric drive. The company plans to build about 100 of the Fiat 500s in 2009 and 300 in 2010. Fiat will provide a rolling chassis without any powertrain hardware and Autoadapt will install the lithium-ion batteries, power electronics and electric drive hardware. The company is offering three battery options with 60-, 90- or 120-mile ranges. Following the launch of the 500, Autoadapt will develop electric versions of the Punto, Grande Punto and Panda. Norway Residents of Oslo, Norway are able to participate in a new car sharing plan called Move About. Move About will start public car sharing with 13 Th!nk City electric cars at three locations in downtown Oslo. The program will be open to anybody with a driver’s licence. The car manufacturer Tata is testing a limited number of the Indica electric cars in Norway. Tata is most famous for the low budget car Nano; however in the European market, Tata intends to be known for electric vehicles. Following the Norwegian introduction, Tata plans to expand the Indica EV to other European markets and then possibly to the U.S. Finland In Finland’s second largest city, Espoo, the utility company Fortum is building an EV recharging network. also worked on the network in Stockholm, Sweden. Both Espoo and Fortum will use these stations starting in the winter of 2009. The cars that will be

100 SCHIPHOL THE GROUNDS 2030
used are a plug-in Prius and an all-electric Fiat Doblò. The city of Espoo will begin with three vehicles and Fortum will use 10. Israel The electric transport company Better Place intends to install thousands of recharging points for electric cars across Israel that will be ready for commercial use by 2011. In a pilot project, it will install 500 charging points by the end of 2009 in certain cities, including Tel Aviv, Haifa and Jerusalem. The company expects to have 500,000 charging points by the time the first cars are on the market. The firm was founded by the Israeli former software executive Shai Agassi. Better Place projects that by 2020, almost all of the cars in Israel will be electric vehicles. Better Place, which is based in Palo Alto, California, has signed deals for similar electric car networks in San Francisco, Hawaii, Denmark and Australia, but the project in Israel is seen as its pioneer system. The firm has signed agreements with the Israeli government and with Renault-Nissan, who will supply the electric cars. United States of America The United States is the one of the first countries in which electric cars are made available to private customers. Tesla is an American company that is already selling an electric sports car, the Roadster. Tesla announced a 4-door, 7-seater model, named model S, which will become available in 2011. General Motors plans to offer the Plug-in hybrid Chevrolet Volt in the U.S. in the year 2010. General Motors is presently testing prototype versions of this car. Another company located in the U.S. is Fisker. Currently, 26 dealerships have signed up to begin selling the Fisker’s plug-in hybrid Karma at the end of 2009. President Barack Obama has announced plans to dedicate $2.4 billion in federal grants to develop next-generation electric vehicles and batteries, and the infrastructure needed to support them. $99.8 million of these federal grants have been awarded to eTec, a division of ECOtality that specializes in electric vehicle charging systems. This will allow eTec to install 2,500 EV charging stations in Tennessee, Oregon, San Diego, Seattle and the Phoenix/Tucson region in Arizona. Nissan has pledged to support the project with up to 1,000 new Leaf EVs in each of these selected markets. BMW is currently leasing 450 MINI-E’s to individual retail customers in the U.S. Those customers will get the cars for a one-year field test, so that BMW can gain experience with real world use of electric vehicles. BMW will take the lessons learned from this test and incorporate them into a new dedicated electric vehicle that it is developing. 50 MINI-E’s are being reserved for special fleet use. These cars will be used in New York City by the Street Condition Observation Unit which prowls the city in search of potholes and graffiti. The University of California at Davis, a university with a dedicated plug-in Hybrid Electric Vehicle Research Center, will ask drivers of the all-electric MINI-E about their experiences with the cars. Over the next year, UCD will ask 50 volunteer MINI-E drivers questions, both online and during interviews, and will also collect data through travel diaries. The international car manufacturer Ford is collaborating in developing a new intelligent vehicle-to-grid communications system with the Electric Power Research Institute (EPRI), the U.S. Department of Energy, Southern California Edison, the New York Power Authority, the Consolidated Edison of New York, the American Electric Power of Columbus, Ohio, the Alabama Power of Birmingham, Atlanta-based Southern Company, the Progress Energy of Raleigh, N.C., the DTE Energy of Detroit, the National Grid of Waltham, Mass, Pepco Holdings, the New York State
SCHIPHOL THE GROUNDS 2030 101
Energy and Research Development Authority, and Hydro-Québec, the largest electricity generator in Canada. Ford is manufacturing 21 plug-in hybrid Escapes that are being tested with those utility partners. The new communication system allows drivers to program how and when the vehicles will be charged. Among other things, drivers can define the completion time for charging or desired charging rates. If multiple vehicles in a neighbourhood are being plugged in simultaneously, the meters can help manage the charging to prevent circuit overload. The city of St. Petersburg in Florida is not a part of Ford’s plug-in hybrid test program, but it will soon be testing a Ford PHEV Escape. Progress Energy will be partnering with the city to convert one of the 14 Escape hybrids in the city fleet to enable plug-in capability. The cost will be covered by the utility company which is working to develop a public charging network in the Tampa Bay region. The two-year test program will evaluate the performance of the vehicle, as well as what the requirements of a charging network will be. Ford Motor Co. will also offer an all-electric Ford Transit Connect BEV van in 2010 and plans to have three other electric vehicles available in the U.S. by 2012. Johnson Controls-Saft, which will supply the battery system for the plug-in hybrid electric vehicle, is a joint venture between auto parts maker Johnson Controls Inc. and Paris-based battery producer Saft SA. Smith Electric Vehicles US Corporation announced that the site of its new factory will be in Kansas City, MO. Among the first companies that will buying US-built Smith EVs is Canteen Vending Services. The U.S. car manufacturer Chrysler is currently testing a fleet of 250 battery-powered minivans for the U.S. Postal Service. The U.S. Postal Service will be using the vans for a variety of duties at locations around the country, including daily home delivery. The telecommunications company AT&T announced plans to invest over half a billion dollars over the next decade to place 15,000 alternative fuel vehicles in its fleet. AT&T has already purchased its first electric vehicles and the company is adding Smith Electric Vehicles to its fleets. This first Newton small lorry for AT&T will be put into regular use in order to evaluate operating costs and performance. Maintenance and repair costs of the electric powertrain (particularly the battery) and the real world range are the biggest areas of interest for AT&T. In Newark, DE, a project has started that will test the first two-way Vehicle to Grid infrastructure. Sponsored by a $730,000 grant from the U.S. Department of Energy, the project helps the state and the University of Delaware to purchase specially-equipped cars (retrofitted versions of the Scion xB) which will obtain electricity from the local utility and return some of it when the car is parked and plugged in. In Madison, WS, the local utility Madison Gas and Electric (MGE) will begin installing a charging network in the state capitol. MGE has purchased six Chargepoint units from Coulomb Technologies. MGE plans to offset all electricity use from the Chargepoints with renewable energy. The first unit will be installed in 2009, with all six in place by early 2010. The city of Seattle, WA, has formed a partnership with Nissan to build a public charging infrastructure for electric vehicles. The city will be among the first locations to receive Nissan’s new EV when it goes into fleets for testing in late 2010. About $20 million will be used to install 2,550 chargers in Seattle between 2009 and the summer of 2011. Each Nissan Leaf buyer will get a charger and 1,550 chargers will be installed in parking garages and places where people shop for one or two hours. Nissan has announced that it has partnered with AeroVironment and the District of Columbia to install infrastructure to accommodate the hundreds of electric vehicles in

102 SCHIPHOL THE GROUNDS 2030
Washington, DC. The charging points will be put to use by both the government and the public over the next few years. AeroVironment played a large role in the creation of both GM’s solar-powered Sunraycer and Impact pre-EV1 prototype, and it currently supplies charging infrastructure components for many industrial customers. AeroVironment’s chargers will be incorporated into the District’s Fleet Share program, which already includes transportation services encompassing Metro, Bus, car sharing, bike sharing, bike stations and racks. Canada In Canada, the provincial government of British Columbia, the city and the local utility BC Hydro have signed on to a program for testing Mitsubishi electric cars. The city and the utility will each get an iMiEV for testing; more will be distributed in the future. The province has set a goal of reducing greenhouse gas emissions by one third by the end of the next decade. Better Place is also active in Canada; the company is running a pilot in the province of Ontario. Japan Two Japanese manufacturers have announced plans to introduce all-electric cars to the market in 2009. Mitsubishi begins delivery of the iMiEV in August and the Subara Stella EV will also be available to retail customers in the summer. Toyota has announced a leasing program for its new plug-in Prius in Japan. Starting at the end of 2009, Toyota will lease 200 plug-in Priuses to government and commercial fleets in Japan. In addition to the 200 cars in Japan, 150 cars will be distributed in the U.S. and Europe. The plug-in hybrid Prius is expected in about two years. Toyota plans to start series production of a plug-in Prius for retail sale in 2012. Better Place has recently piloted the world’s first battery swapping station for electric vehicles in the Japanese city of Yokohama. A fully automatic system takes out the empty battery and replaces it with a fully charged one within minutes. The driver stays inside the car during the swapping process. The electric vehicle infrastructure company has announced to carry out a pilot project involving a battery switching station and battery-powered taxis operated by Nihon Kotsu taxis in Tokyo. Expressing a desire to replace the 60,000 Tokyo fleet in the next decade, the trial will be underway in January 2010 with up to four vehicles specially prepared using commercially available platforms by the engineering firm Tokyo R&D Co. This company will also build the battery swapper, situated in Central Tokyo, and supply the diagnostic software for the three-month test. The Japanese postal service in Kanagawa and Tokyo is currently testing electric vans. The Japanese mail service ultimately wants to convert its fleet of 22,000 delivery vehicles to electric ones. In the summer of 2009, Japan Post starts a 5-year lease program for 20 Mitsubishi iMiEVs and 20 Subaru Stellas. Most of these cars will be based in Kanagawa, where there is already a degree of recharging infrastructure in place. In addition to the consumer type vehicles, the mail services company will also evaluate 9 solar panel-topped battery-powered trucks and several electric single-seaters. Toyota will supply Japan Post with a demonstration model of the plug-in Prius around the end of 2009. The Japanese convenience store chain Lawson has ordered 150 Mitsubishi iMiEVs to replace some of its commercial vehicles starting in the summer of 2009. This will be the first step in Lawson’s electric shift; all 1,500 Lawson vehicles are intended to go electric in the future. Lawson is considering installing electric vehicle chargers in its parking lots in order to contribute to a public charging infrastructure. There are currently about 8,000 Lawson stores in Japan.

SCHIPHOL THE GROUNDS 2030 103
China China is developing a nation-wide charging network for electric cars. The State Grid Corporation of China (SGCC) has quickly risen in a few years to become the largest electricity transmission and distribution company in the world. SGCC plans to create a nationwide electric-vehicle charging network for China. The Corporation previously set up the infrastructure to charge 55 lithium-ion buses and over 400 other electric vehicles that served the athletes and staff of the Olympic games. The company has now started to install charging stations in Shanghai, Beijing, Tianjin and other cities that will serve as pilot programs. Chinese car manufacturer BYD (Build Your Dreams) has plans to sell its plug-in hybrids and electric cars in China as well as abroad. China’s Minister of Science and Technology, Wan Gang, announced expectations that 1,000,000 “new-energy vehicles,” mostly comprised of electric cars, will be driving on the nation’s roads and comprise as much as 10 percent of car sales as early as 2012. The Chinese automaker has signed a memorandum of understanding with the German car manufacturer Volkswagen to collaborate in the area of electric mobility and vehicles that use lithium-ion batteries. Nissan is currently in talks with the Chinese government to roll out an electric vehicle pilot program in Wuhan, a large city in central China. The Renault-Nissan alliance has officially confirmed an agreement with the Chinese Ministry of Industry and Information Technology for developing an electric vehicle market and infrastructure in China. The Chinese government plans a 13 city program, of which the pilot in Wuhan is the first. Renault-Nissan will provide vehicles as well as guidance for setting up a public charging network. The automaker alliance plans to introduce its battery powered vehicles in China in 2011, a year ahead of its global retail sales launch of EVs. New Zealand In New Zealand, a pilot has started with the Mitsubishi’s iMiEV electric car in cooperation with the local utility Meridian Energy. Unlike most utilities, Meridian claims to be a 100 percent renewable power provider with hydroelectric and wind generation. Meridian has been a proponent of electric cars for years, and has its own Electric Vehicle Program that is tasked with researching EV technology and implementing strategies to help New Zealand unlock a more sustainable personal transportation future, using renewable electricity.
4.2.5 Overview initiatives and pilots abroad In Table 21, an overview is given of the previously discussed locations of pilot projects that are taking place on an international level. The table indicates where the pilot is held and which actors are involved. Table 21. Locations of pilot projects: country, region, city (if specified) Country State / Region / City France (EDF, Europcar) Paris (Daimler, Renault-Nissan, Auto’lib),
Strasbourg (Toyota, EDF) La Rochelle (EV rental)
United Kingdom (Mitsubishi, Europcar, Toyota, Daimler)
London (BMW), Oxford (BMW), Hillingdon (Ford, Scottish and Southern Energy)
Germany (Europcar, Sixt Toyota) Berlin (Daimler, RWE, BMW, E.on), Munich (BMW, E.on), Frankfurt (Airport, Mitsubishi)

104 SCHIPHOL THE GROUNDS 2030
Spain (Europcar) Madrid (Daimler, Th!nk), Seville (Th!nk), Barcelona (Th!nk)
Italy (Europcar) Rome (Daimler, Enel), Milan (Daimler, Enel), Pisa (Daimler, Enel) Bergamo (Puntogiallo)
Denmark (Better Place, Renault-Nissan, Sixt)
Bornholm (V2G pilot), Frederikshavn (Stena Line)
Sweden (Mitsubishi, Fortum, Volvo, Vattenfall)
Norway (Tata) Oslo (Move About)
Finland Espoo (Fortum) Israel (Better Place, Renault-Nissan)
Madison (Madison Gas and Electric) Newark (University of Delaware) New York (Ford), New York City (BMW, SCOU) Tennessee (Renault-Nissan, eTec) Oregon (Renault-Nissan, eTec) Ohio (Ford) Alabama (Ford) Atlanta (Ford) Michigan (Ford) Massachusetts (Ford) Charlotte (Canteen Vending Services) California (Ford, Better Place, Renault-Nissan, Mitsubishi), San Diego (Renault-Nissan, eTec) Hawaii (Better Place, Renault-Nissan) Sonoma (Renault-Nissan, eTec) Phoenix (Renault-Nissan, eTec) Tucson (Renault-Nissan, eTec) Seattle (Renault-Nissan, eTec) Washington D.C. (Chrysler, US Postal) Dallas (AT&T) Raleigh (Renault-Nissan, Ford)
United States of America
St. Petersburg (Progress Energy) Canada (Ford, Hydro-Québec) British Columbia (BC Hydro, Mitsubishi) Ontario (Better Place, Renault-Nissan) Japan (Mitsubishi, Lawson) Yokohama (Better Place, Renault-Nissan),
Kanagawa (Japan Post), Tokyo (Japan Post, Better Place, Nihon Kotsu taxi)
China Shanghai (SGCC), Beijing (SGCC), Tianjin (SGCC), Wuhan (Renault-Nissan), Hong Kong (Renault-Nissan)
New Zealand (Mitsubishi, Meridian Energy) Australia (Better Place, Renault-Nissan) Netherlands (Better Place, Renault-Nissan, Toyota)
Iceland (Mitsubishi) Portugal (Renault-Nissan, Better Place, Europcar)
Monaco (Renault-Nissan, Mitsubishi) Switzerland (Renault-Nissan) Ireland (Renault-Nissan) Belgium (Renault-Nissan, Europcar)
SCHIPHOL THE GROUNDS 2030 105
4.2.6 Conclusions on developments in electric mobility With regard to market developments in the Netherlands, it can be concluded that HEVs, professional market niches (e.g. on-site, public services, vans & small trucks), and electric bikes (pedelecs) and electric scooters are growing considerably. However, the availability of full sized electric vehicles for personal transport is still very limited. PHEVs like the plug-in Prius are announced in the near future, Ev’s currently on the market are limited to the Norwegian Th!nk, Tesla Roadster, and regular cars from which the ICE is replaced by an electric motor. Many major car manufacturers are however announcing HEVs, PHEVs and full BEVs for the coming years and are testing so-called concept cars. With regard to policy, it can be concluded that most national governments in the developed world are actively supporting and facilitating pilots with EVs, as well as the general introduction of EVs. In the Netherlands, as well as abroad, large cities and utilities are strongly involved in forthcoming pilots. In the Netherlands, a new industry is emerging that focuses on production of components for the electrical car system. This includes firms that produce different types of charging equipment, as well as firms specializing in organizing and coordinating pilots in practice.
4.3 Actors, users & social aspects In this chapter an overview is provided of the different sectors where previously collected actors belong to. Overviews of the automotive and energy supply chains are given. The chapter is concluded with a discussion of the social aspects related to electrical mobility.
4.3.1 Actors
4.3.1.1 Overview In the previous chapters, a large number of actors or stakeholders have been mentioned when describing market developments, as well as developments in industry, government, and pilots in society. Research actors have also been mentioned. The individual actors involved with electric mobility that have been collected in the previous chapters can be grouped into categories. For example, different car manufacturers such as Tesla, Th!nk, and Renault-Nissan belong to the group 'car manufacturers'. A distinction can be made between large global car manufacturers and manufacturers that produce smaller numbers of electric vehicles, such as Tesla and Th!ink, or manufacturers that target professional niche markets for electric vans or on-site equipment. This categorization has been performed for all of the actors mentioned in the previous chapters. This resulting list consists of groups of actors belonging to one of the following four domains:
• Actors that belong to the government or legislation domain. • Private actors in the business domain that belong to the supply chain of
electric vehicles or to the electricity chain, including firms that are associated with the end-of life phase.
• The public research domain of universities and institutes. • The domain of society and users. Users can be individual consumers as well
as professional users.
This categorization has been adopted from an earlier study (Van Merkerk 2007); the approach is also applied in (Van Kouwen 2008). In Fig 86, an overview is given of this categorization, indicating which groups of actors are involved with electric mobility and to which of the four sectors they belong.

106 SCHIPHOL THE GROUNDS 2030
Fig 86. Actor overview: actor groups involved with electric mobility from the four sectors
4.3.1.2 Government & legislation domain The main actor in the Netherlands is the national government, and in particular, relevant ministries such as the Ministry of Transport and Public Works (V&W), the Ministry of Housing, Spatial Planning & the Environment (VROM), the Ministry of Economic Affairs and the Ministry of Public Health. Another important government-related actor is the RDW, which is the national authority responsible for monitoring the safety and environmental aspects of the vehicle fleet in the Netherlands. This organization is also responsible for the approval of new vehicles in the Netherlands, including electric vehicles. In addition, EU policymakers and governmental organizations are important for changes in regulation as well as for the standardization needed for electric vehicles. This is particularly important for charging, chargers and other V2G aspects. Local and regional authorities are also important government actors because of local permits, local and regional spatial planning procedures, and for enabling and facilitating local experiments and pilots with electric vehicles.
4.3.1.3 Business domain / private sector The business domain or private sector can be thought of as two supply chains: (1) the automotive supply chain and (2) the energy chain. Users are also an important part of the supply chain, but they are dealt with in the section below on the users & society domain.
SCHIPHOL THE GROUNDS 2030 107
4.3.1.4 Automotive supply chain The actors involved in the automotive supply chain are formed from suppliers, manufacturers, and disposal categories. However, users are left out. The actors from the first three categories were discussed previously. Two groups of business actors in the automotive supply chain that have not yet been dealt with are explicitly mentioned here. First, certain supplier firms related to ICE vehicle components will be negatively affected by the rise of electric vehicles. Second, the actors involved in the automotive disposal phase have not yet been discussed, but are important both in the current system and also in the disposal of larger batteries needed for EVs, PHEVs and HEVs. The actors involved in disposal and recycling are briefly discussed below. Disposal The goal of Auto Recycling Nederland (ARN) is to limit the amount of waste resulting from scrap cars. Recycling materials from scrap cars helps to limit the amount of waste generated. Scrap cars are collected at no cost to the current owner. This is possible because buyers of new cars pay a dismantling fee. ARN has a network of associated vehicle dismantling companies. These companies can only join the ARN if they comply with certain norms, which are tested by the Raad voor Accreditatie (RvA). Only those disposal companies associated with the ARN may receive the dismantling fee. The board of the ARN consists of representatives from the following organizations: STIBA (dismantling companies), RAI (car manufacturers and importing firms), BOVAG (repair, maintenance garages), and FOCWA (bodywork and accident repairs companies).
4.3.1.5 Energy chain The energy chain contains another set of important actors in the business domain. In Table B2 (See Appendix B), the chain for energy production, network/infrastructure, providers, and users is shown. The actors belonging to these categories were discussed previously. It must be noted that the actors with stakes in the ICE fuel chain will be negatively affected and must also be regarded as relevant actors.
4.3.1.6 User and society domain A distinction should be made between private end-users or consumers and professional users. The large majority of users of electric vehicles are professional users such as firms, lease companies, fleet owners, the government and other kinds of organizations. These actors were mentioned in the market and pilot development in previous section. However, three substantial and growing groups of consumer end-users can be identified: (1) drivers of different types of HEVs, (2) Electric bike users, and (3) electric scooter users. Environmental organizations and other public interest groups are also important actors in this domain. Both environmental and nature organizations such as the Society for Nature and the Environment (st. Natuur & Milieu), WNF, Greenpeace, Friends of the Earth and also the ANWB (the Dutch association of car drivers; a powerful actor in the public domain) are all supporting the introduction of electric mobility for various reasons. Some of these, such as Natuurmonumenten are professional users, while others, like Natuur & Milieu are very active in electric mobility initiatives.
4.3.1.7 Public Research Public research is not dealt with extensively in this report; however it is relevant to mention that in the Netherlands considerable public research efforts are dedicated to:

108 SCHIPHOL THE GROUNDS 2030
• Renewable energy technologies, decentralized energy systems and Carbon Capture & Storage (CSS);
• Batteries, charging and grid implications. This research takes place at the three Technical Universities, ECN, TNO and to a lesser extent at other universities.
4.3.2 Social aspects The key consequence of any transition is the effect it has on society: not only the changes in technology, but also the effects on the culture and structure of society. The transition to a transport system based on electric vehicles could result in a number of benefits and critical issues for society. In this chapter, the main benefits and critical issues (environmental, social, and economic) are discussed in the same order as the technology assessment in chapter 2: first electric vehicles, followed by the charging and user interface, and lastly the electrical grid and infrastructure.
4.3.2.1 Benefits & critical issues of vehicles Environmental issues concerning electric vehicles. This section covers the environmental performance of PHEVs and BEVs as compared to ICEs in terms of energy use, CO2, air pollution, noise, and the toxicity of batteries. In order to gain insight into the main environmental benefits of electric driving, the main advantage of electric propulsion should be considered: its energy efficiency. As a result of this energy efficiency, a lower amount of energy is required for travelling the same distance with an electric car when compared to an ICEV. Electric motors are very efficient in comparison to internal combustion engines: they deliver the required power, while using relatively little energy from the battery. An ICEV running on gasoline has an efficiency of approximately 18%. A diesel powered car is slightly more efficient at 23%, but nowhere close to the efficiency of electric vehicles, which can reach 76% (Kendall 2008). In order to get a feel for the potential efficiency gains that could be achieved by driving on electricity, it is useful to compare the energy use for personal transport with the total energy an average person uses per day. Such a comparison has been made for the UK (MacKay 2009) and is shown in Fig 86. In this example, the total energy inputs that are required for covering a single person’s energy needs is set at 125 kWh per day. This person uses this energy for three main categories of consumption: transport, heating, and electricity. The potential for energy saving is the largest for the transport category; the other two categories are already achieving a high level of efficiency and have less room for improvements. If we focus on the current transport use, a typical car-driver is assumed to travel 50 km per day. Conventional cars have an energy use that ranges from 40 kWh per 100 km for the most efficient ICEV up to 180 kWh per 100 km for high-powered sports cars. For this comparison, an efficiency of 80 kWh per 100 km is taken as the typical ICEV. The value of of 80 kWh per 100 km translates into 40 kWh per 50 km as shown in the second column of Fig 87.

SCHIPHOL THE GROUNDS 2030 109
Fig 87. Single person energy use By switching to electric driving instead of using fossil fuels, large efficiency gains can be achieved, as shown in the third column. Electric cars typically have an energy use of 15 kWh per 100 km. Travelling the same 50 km with an electric car would require only 7.5 kWh (instead of the 40 kWh discussed before). Substituting a large share of the current cars on the road with electric powered vehicles could bring significant efficiency gains to the average energy consumption for transport. In the example shown in this Fig 87, the future amount of energy used for transport per person is reduced to half (20 kWh) as compared to the current amount. Due to this lower energy use, the overall emissions per distance travelled are likely to be lower as well; this implication will be discussed hereafter. The well-to-wheel CO2 emissions of a BEV, when driving on electricity charged from the current Dutch supply, is 100 g CO2 per kilometre. This number is considerably lower than the average conventional car, which has a CO2 emission of 170 g per kilometre (Nagelhout and Ros 2009). The primary energy use and CO2 emission of ICEs, HEVs and BEVs are compared in Table 22. The primary energy use of gasoline is calculated by taking into account the feedstock (crude oil) production and transport, and gasoline production and distribution (EIA 1999). The CO2–emission is calculated with the assumption that gasoline has the chemical properties of octane, with a density of 0,72 kg/litre. The extra amount of energy used to convert crude oil into gasoline is between 13,2% and 22,6% of the energy content of gasoline. In Table 22, the average is used. The amount of primary energy of a kWh of electricity is 7,69 MJ (MNP 2009). The CO2-emission of Dutch electricity in 2004 was 468 grams per kWh, and this value is expected to drop by more than 20% by the year 2020 (Energierapport 2008). Table 22. Primary energy use and CO2 emission of ICE’s, HEV’s and BEV’s per 100 km (BEV-data: based on average Dutch national electricity grid) Type Fuel consumption
in liters or kWh Primary energy MJ
kg CO2-emission
gram SOx-emission
ICE, large car, SUV 14,3 liters (1:7) 1 538 31,5 1,1 2 ICE, large middle class 10,0 liters (1:10) 1 376 22,0 0,7 2

110 SCHIPHOL THE GROUNDS 2030
ICE, regular middle class 7,7 liters (1:13) 1 290 16,9 0,5 2 ICE, small car 6,3 liters (1:16) 1 237 13,9 0,5 2 HEV Prius 5,0 liters (1:20) 1 188 11,0 0,4 2 HEV Honda Insight 4,4 liters (1:23) 1 165 9,7 0,3 2 Tesla Roadster 17,5 kWh 135 8,2 2,3 Th!nk, (small car) 15 kWh 115 7,0 2,0 i MiEV (small car) 10 kWh 77 4,7 1,3 1: gasoline to distance ratio (liters:km’s) 2: based on maximum amount of sulfur in gasoline (50 ppm) and assumption SOx is SO2 To estimate the amount of exhaust emissions, the vehicles are compared based on the Euro V norms (Van Essen 2008) passenger cars, which will be implemented in September 2009, and based on the national emissions of the Dutch energy production of the year 2007. Table 23. Primary energy use and CO2 emission of ICEs and BEVs in gram per 100 km (BEV-data: based on average Dutch national electricity grid) Type Carbon
Monoxide HC VOC NOx PM PM10
ICE, < 1305 kg 100 10 6 0,5 ICE, 1305 kg to 1760 kg 181 13 7,5 0,5 ICE, > 1760 kg 227 16 8,2 0,5 Tesla Roadster 1,2 2,6 8,8 0,079 Th!nk 1,1 2,2 7,5 0,068 i MiEV (Mitsubishi) 0,7 1,5 5 0,045 One very important factor of the airborne emissions, except for CO2, is that the access points of the emissions are on and around the roads for ICE vehicles and around power plants for BEVs. The emissions from power plants are less threatening from a public health perspective than the emissions from vehicle tailpipes, since the latter are released in much closer proximity to individuals (Kliesch and Langer 2006). All in all can be said that the emissions from BEVs are completely dependent on the way the energy for the electricity was generated. This implies that large gains can be achieved for electric driving when a larger share of renewable energy sources is included in the electricity mix. Electric motors generally operate more quietly than internal combustion engines. The most noise generated in a car comes, however, from the tires and wind resistance. The largest gains in the reduction of noise from cars when switching to electric propulsion can be achieved at low speeds, when tires and wind generate little noise. Therefore, there is a potential for reducing traffic noise in urban environments, since cars in cities drive at slower speeds. Although generally lower noise levels from traffic would be desirable for people living and working in cities, pedestrians will need to get used to and become aware of quieter vehicles which they might not notice at, for example, road crossings. The effect of noise from any source can be expressed in the term “noise costs”. The noise costs (Litman 2009) of a certain source are estimated costs for health, reduction of annoyance (i.e. costs of sound barriers) and financial damages (i.e. rent losses of houses). The noise costs of electric vehicles in urban areas are about 1/3rd of the average and compact vehicles and in rural areas almost half of average and compact vehicles (SEI 2007). Several studies have been performed related to whether there is enough lithium available in the world for substituting the current vehicle base with cars that are
SCHIPHOL THE GROUNDS 2030 111
supplied with a Li-ion battery. The general consensus seems to be that the availability of lithium is not a significant issue. One study (Lache, Nolan et al. 2008) concludes that lithium will remain to be a viable, relatively abundant source of power for automobiles over the long term. In the year 2015, lithium production is expected to be sufficient to make 1 billion batteries for PHEVs (Hunik and Ross 2008). There are about 800 million cars and lorries in the world today; replacing each of those vehicles with plug-in hybrid vehicles powered by a 15 kWh Li-ion battery would use up to 30% of the world's known lithium reserves. In addition, the demand for lithium could be eased by recycling used batteries, which has already proved its value with lead acid starter batteries in conventional cars (Armand and Tarascon 2008). Another issue related to the batteries is the toxicity of the applied hazardous metals and electrolyte. After the battery has degraded to the point that it cannot be used anymore to power a vehicle, these materials will not end up in the environment if they can be recycled. However, if as a result of an accident with an electric powered car, electrolyte leaks from the battery, it is possible that ground water could become contaminated (BERR and DfT 2008). If an electric car is going to be scrapped, the batteries do not have to be recycled immediately: they could become useful as stationary batteries for alternative purposes. After years of operation inside a car, a battery will still have a large share of its energy storage potential and it could be used for non-automotive applications, such as load levelling for the grid to accommodate renewable energy. Properly capturing this residual value can have a significant impact on the financial viability of an electric vehicle. The toxic aspects of batteries in an undesired waste stage (partial or full incineration, landfill, or recycling with toxic emissions) are to be compared with the benefits of decreased airborne emissions (with the exception of SOx, when electricity from the Dutch national grid is used). In Life Cycle Analysis (LCA), these aspects have been studied. One study (SEI 2007) shows that when comparing the airborne emissions during the life cycle of a BEV, a petrol car and a diesel car, the BEV emits significantly less CO2, CO, NOx and hydrocarbon emissions. While PM emissions are comparable, the BEV has more SOx emissions during its life cycle than petrol and diesel cars. In this study, however, the accounting of emissions of metals was not found. Another study (Van den Bossche, Vergels et al. 2006) focused on the comparison of batteries for applications in PHEVs and BEVs. This study showed that the Li-ion batteries have around 40% less environmental impact than the NiMH batteries. However, these figures have not been compared in an overall analysis that includes the effect of using less primary energy and emitting less harmful emissions. One study (Vereecken 2003) also accounted for the ecotoxity by taking lead emissions into account. The comparison of an electric Peugeot 106 (small car) found a 60% smaller environmental impact during the life cycle than a reference car, and 70% less environmental impact than a VW Golf (Euro IV emission). The results of a more comprehensive LCA study (BERR and DfT 2008) that assesses the potential environmental impacts of electric cars in the UK in the year 2020 are shown in Table 24. For this LCA, the shares of different energy sources changes with respect to the future energy supply. In the year 2007, renewable energy constitutes 5%, nuclear 15%, gas 43%, and coal 34%. In the year 2020, these shares are assumed to become more renewable and less coal-based: 32% renewable energy, nuclear: 6%, gas: 41%, coal: 17%. Table 24. Summary of studied potential environmental impacts by vehicle type (assuming a Grid mix for 2020) for a single vehicle over vehicle life (180,000km) Environmental Impact
EV ICV (50% petrol,
Units Context, explanation
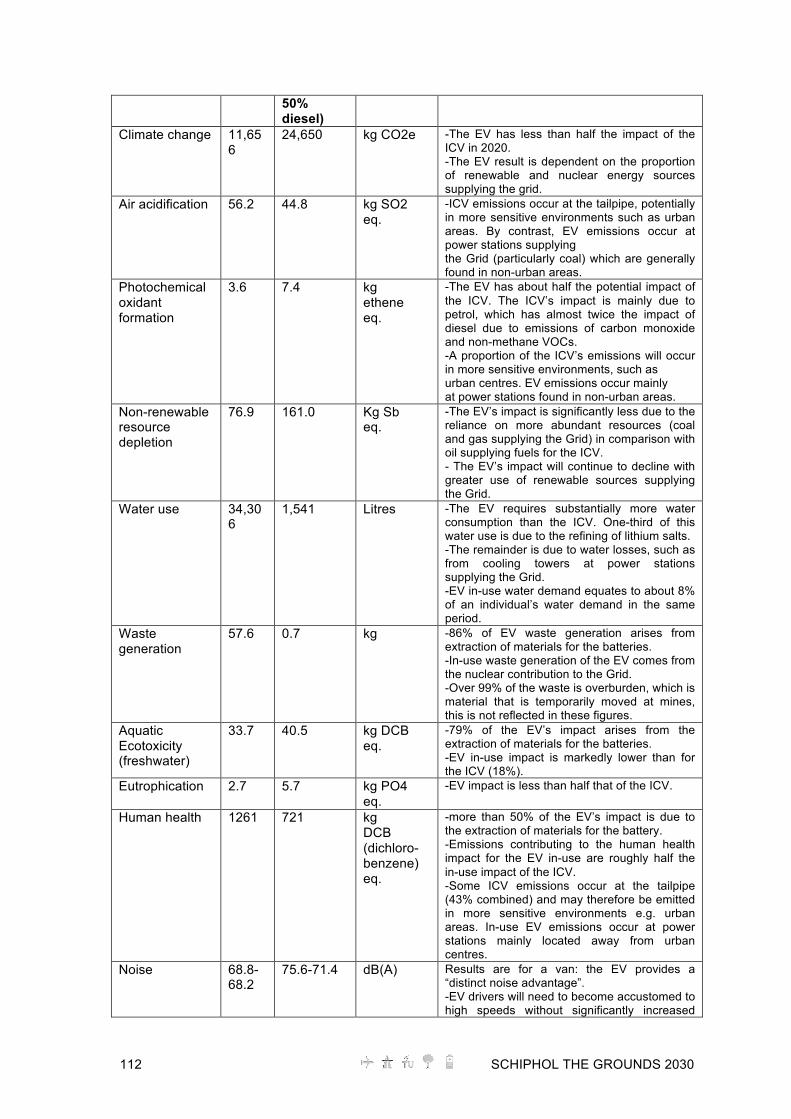
112 SCHIPHOL THE GROUNDS 2030
50% diesel)
Climate change 11,656
24,650 kg CO2e -The EV has less than half the impact of the ICV in 2020. -The EV result is dependent on the proportion of renewable and nuclear energy sources supplying the grid.
Air acidification 56.2 44.8 kg SO2 eq.
-ICV emissions occur at the tailpipe, potentially in more sensitive environments such as urban areas. By contrast, EV emissions occur at power stations supplying the Grid (particularly coal) which are generally found in non-urban areas.
Photochemical oxidant formation
3.6 7.4 kg ethene eq.
-The EV has about half the potential impact of the ICV. The ICV’s impact is mainly due to petrol, which has almost twice the impact of diesel due to emissions of carbon monoxide and non-methane VOCs. -A proportion of the ICV’s emissions will occur in more sensitive environments, such as urban centres. EV emissions occur mainly at power stations found in non-urban areas.
Non-renewable resource depletion
76.9 161.0 Kg Sb eq.
-The EV’s impact is significantly less due to the reliance on more abundant resources (coal and gas supplying the Grid) in comparison with oil supplying fuels for the ICV. - The EV’s impact will continue to decline with greater use of renewable sources supplying the Grid.
Water use 34,306
1,541 Litres -The EV requires substantially more water consumption than the ICV. One-third of this water use is due to the refining of lithium salts. -The remainder is due to water losses, such as from cooling towers at power stations supplying the Grid. -EV in-use water demand equates to about 8% of an individual’s water demand in the same period.
Waste generation
57.6 0.7 kg -86% of EV waste generation arises from extraction of materials for the batteries. -In-use waste generation of the EV comes from the nuclear contribution to the Grid. -Over 99% of the waste is overburden, which is material that is temporarily moved at mines, this is not reflected in these figures.
Aquatic Ecotoxicity (freshwater)
33.7 40.5 kg DCB eq.
-79% of the EV’s impact arises from the extraction of materials for the batteries. -EV in-use impact is markedly lower than for the ICV (18%).
Eutrophication 2.7 5.7 kg PO4 eq.
-EV impact is less than half that of the ICV.
Human health 1261 721 kg DCB (dichloro-benzene) eq.
-more than 50% of the EV’s impact is due to the extraction of materials for the battery. -Emissions contributing to the human health impact for the EV in-use are roughly half the in-use impact of the ICV. -Some ICV emissions occur at the tailpipe (43% combined) and may therefore be emitted in more sensitive environments e.g. urban areas. In-use EV emissions occur at power stations mainly located away from urban centres.
Noise 68.8-68.2
75.6-71.4 dB(A) Results are for a van: the EV provides a “distinct noise advantage”. -EV drivers will need to become accustomed to high speeds without significantly increased

SCHIPHOL THE GROUNDS 2030 113
engine noise. Pedestrians and other road users will need to become accustomed to quieter vehicles.
From the above table it can be concluded that electric cars have substantially lower environmental impacts on climate change, photochemical oxidant formation, non-renewable resource depletion, aquatic ecotoxicity, and noise. However, the potential impact on air acidification, water use, waste generation, and human health could be higher as a result of using EVs. Social issues concerning electric vehicles. The key difference between conventional cars running on fossil fuels and the PHEVs and BEVs discussed in this report, is that fossil fuels can be substituted by grid supplied electricity. A benefit for society of the use of electricity for transport purposes could be a reduction of the dependence on imported oil from geopolitically unstable regions. Since the fossil fuels that power conventional cars are imported from abroad, the national oil dependence can be decreased by electric driving. This effect can strengthen the national energy security of a particular country, since electricity can come from a variety of sources, often generated within the country itself. Various researchers have looked into the question whether it is possible for a vehicle purchaser to gain back the higher upfront investment in a PHEV or BEV (mainly caused by the expensive battery) by driving on a cheaper fuel in the form of electricity. This issue will be discussed in the following paragraph. However, it is questionable to what extent consumers make careful economic calculations before deciding on the choice of their next new car. Other factors might be of at least comparable importance for consumers, such as having control over refuelling and whether the image of driving a particular car matches the owner’s identity: what somebody drives says something about that person. Vehicles can therefore act as strong indicators of social status and success. Vehicle manufacturers might discover new approaches for marketing alternative vehicle concepts such as the BEV and PHEV to potential customers. One author points at the possibilities these alternatives to the conventional car might offer by packaging the vehicle in a way that presents a new and attractive value set. By marketing an EV or PHEV as an advanced car that offers silent operation, low fuel costs, home refuelling convenience (fewer stops at the gas station), simplicity, and user friendliness, such a value set could become desirable for the consumer. Offering such a complete package instead of focusing solely on the environmental benefits would possibly attract a wider range of customers than the consumers who are willing to pay a premium for 'greenness' (Barkenbus 2009). The results of recent market research in which 13500 people across 18 countries were surveyed indicate that there currently is a strong desire to go green among potential car buyers: even if money were no object, nearly six in ten people say that they would rather buy a green car than a dream (beautiful, powerful, sporty) car (Miller 2009). An important aspect in which BEVs and conventional cars differ is the driving range. Due to the large energy content of fossil fuels, ICEVs can travel several hundreds of kilometres once the tank has been filled. Additionally, when it is time to refuel again, this can be done within minutes at a fuel station. For electric cars, this is an entirely different situation. The range of electric cars is expected to be considerably lower than that of ICEVs, at least until the year 2030 (BERR and DfT 2008). Depending on the charging method, charging the battery of a car can take several hours. The advantage of the PHEV concept is that this car can be driven with the combustion

114 SCHIPHOL THE GROUNDS 2030
engine once the battery is depleted. In a BEV, there is no such on-board backup for an empty battery. Possible solutions for the fear of running out of electricity, or ‘range anxiety’, can be sought in technologies and in the more social or behavioural approach people take towards personal mobility. An example of a technological solution for the limited range of BEVs is fast charging the batteries, which enables users to charge their batteries quickly. It might also be possible to replace the depleted batteries with fully charged ones at dedicated service stations. If users are willing to take the shorter range of their BEV for granted and only use a car that has a suitable range for their vast majority of trips, this is expected to have large implications for users’ behaviour when taking longer trips. Potential solutions, besides technological ones, could be hiring a conventional car for occasional longer trips, taking part in a car-sharing program, and using public transport for longer journeys. All of these options require a radical change in the ways users have grown accustomed to is required for their personal mobility (BERR and DfT 2008). The buyers of the first BEVs and PHEVs might have doubts about the new technology that is used in these vehicles, and whether this technology is mature enough to be a satisfactory replacement for the proven technology of an ICEV. The main unknown issues are related to the battery: is the battery safe, reliable and does it have sufficient longevity. Although simulations can be performed in a laboratory setting in order to gain insight into these issues, a proven track record in real life would probably have the most meaning in consumers’ eyes. In order to guarantee that battery reliability and longevity are not a concern for the user, battery leasing could be introduced. By leasing batteries, the risk of owning the battery is carried by the company offering this service. This concept will be explained further in upcoming chapters. Economic issues concerning electric vehicles. As mentioned earlier, the business model for owning an electric vehicle is entirely different than one for a conventional car. Due to the higher purchase price of a car that is equipped with a large, expensive battery, the upfront investments for vehicle owners are substantially higher than for cars running on conventional fuels. On the other hand, the fuel costs are much lower: in the Netherlands driving on electricity would cost approximately 3-5 Eurocents per kilometre; for one of the cheapest fossil fuels (diesel) the consumer pays 9 Eurocents per kilometre (Alem 2008). This results in the question of whether it is possible for an electric vehicle owner to earn back the higher upfront investment from the lower running costs per distance driven. A recent study (BERR and DfT 2008) has indicated that for the first couple of years, a vehicle that travels 18000 km in the UK, the running costs of electric cars is expected to be well above the running costs of a conventional car.

SCHIPHOL THE GROUNDS 2030 115
Fig 88. Comparative costs of running an EV and a petrol ICV – 2010 to 2030 In Fig 88, a comparison is shown of the expected running costs of an EV with those of an ICV. The range of these running costs is influenced by the (fossil) fuel price, the battery costs, the electricity costs, and market interventions. In the period in which the two vehicle types overlap, an EV could become cost competitive. According to this diagram, this could occur at some point between the years 2015 and 2026. Included in the above calculation is an expected drop in future battery costs due to an increase in battery production numbers, resulting in economies of scale. In this cost comparison, it is assumed that the performance of the battery remains sufficient for a lifespan of 10 years. As discussed earlier, it is not known whether this longevity can be achieved in real life, since no such track record for the relatively new technology of Li-ion batteries exists. It is obvious that a need for earlier replacement of the battery for will seriously affect the running costs. This uncertainty also makes it difficult to assess what the second-hand value of an EV would be after a couple of years of ownership. One type of costs which could be beneficial for the EV in comparison to an ICEV are the maintenance costs. Since in an EV there is no need for replacement of fluids and parts such as engine oil, spark plugs, valves, and fuel pumps, the maintenance might be limited to regular check-ups of the tires and brakes. An EV’s brakes will also last longer because of regenerative braking. The brakes have to contribute less to the braking power, which reduces wear on the vehicle's braking pads and discs. An advantage of the PHEV concept is that a smaller and therefore cheaper battery can be applied than in a BEV. A PHEV is nevertheless more expensive than an ICE or HEV due to the double drivetrain and application of a larger battery than in a HEV. A running costs comparison (Norman Shiau, Samaras et al. 2009) between PHEVs with different All Electric ranges of 11, 32, 64, and 96 km has shown that the batteries of a PHEV should be sized according to the charging pattern of the driver. A PHEV with a range of 11 km has the best economic performance for frequent charges within 20 miles. For less frequent charging (20-100 miles). PHEVs with a larger capacity are not the lowest cost alternative. HEVs would be less costly for these longer charging intervals.

116 SCHIPHOL THE GROUNDS 2030
The issue of having the car owner pay a large sum for the batteries upfront could be dealt with by implementing an alternative business model, such as leasing batteries. In this business model, the ownership of the battery is separated from the ownership of the car. By leasing batteries in this way, the price premium caused by the expensive batteries is spread out over several years, thereby making these investment costs part of the running costs. Instead of buying fuel, the driver pays for the distance travelled, which is similar to how cell phone companies sell consumers minutes for making calls. Besides the difficulties associated with an individual owner earning back his or her investment, some serious resistance may come at a larger scale from automobile manufacturers, oil companies, and repair businesses that have invested billions into the supply and production infrastructure of conventional vehicles. One would expect these powerful industries to exert immense influence with policymakers and the public in order to maintain the status quo (Sovacool and Hirsh 2008). Also, the government could receive less tax revenue from electric vehicles than from conventional cars. Government income could therefore decline if more people drive electric cars. It is unsure how governments will response to this issue, but recent plans from policymakers indicate that increased taxes on gasoline and diesel could be used to compensate for this decline.
4.3.2.2 Benefits & critical issues of the user interface Environmental issues concerning the user interface. In recent years, increasingly strict European standards regarding local air pollution have resulted in the delay of building projects in the Netherlands. The improved environmental performance of electric vehicles could decrease levels of particular matter (PM). This could have an effect on the built environment where the user interface and charging points could be applied. If electric cars were used on a larger scale, new buildings could be planned in closer proximity to roads. For example, if electric mobility becomes widespread, the municipality of Amsterdam expects to be able to build 9000 new houses due to the cleaner air. It should be noted that EVs are not completely PM free: the wear of tires and brakes of electric cars will contribute to the emission of PM. Electric cars are estimated to emit 30-50% less PM in comparison to ICEVs. Social issues concerning user interface Social issues regarding the user interface are related to safety, security, and user friendliness. Since many car users, especially those who live in large cities do not have a private garage or carport, charging points are to be created at the parking places in which these people leave their cars. Safety measures are important for these charging points in order to prevent accidents. Examples of safety and security measures include placing barriers in front of charging points to avoid collisions with cars, safety systems that prevent cars from driving away while plugged in, and preventing vandalism and attempts of hackers to break in the software that controls the charging process or commit account fraud. The installation of roadside charging points could also lead to issues caused by the cords spanning the distance between the charging point and the vehicle, which could be hazardous to pedestrians, cyclists, or other drivers. User friendliness aspects also need to be taken into account: the interface should be easy to use and understand. Charging points and stations also need to be consistent and compatible across different municipalities and regions in order to prevent the inconvenience of isolation (Hatton 2009). Economic issues concerning the user interface.

SCHIPHOL THE GROUNDS 2030 117
The business model of investing in a charging infrastructure for energy companies could be high-risk. Building, maintaining, and managing this infrastructure requires a high investment. It is difficult to earn back this investment solely through the sale of electricity if electricity is priced as low as it is at the moment. As a result, the price charged for electricity could be increased, which would harm the economic advantages of driving on electricity (van den Berg, Harms et al. 2009).
4.3.2.3 Benefits & critical issues of the electrical grid and infrastructure Environmental issues concerning the electrical grid and infrastructure By charging electric vehicles with electricity from the grid, it becomes possible to (partially) use electricity from renewable sources for transport purposes. The environmental performance of a car driving on electricity is completely dependent on how the electricity was generated. By incorporating more renewable energy sources such as wind and solar power into the electricity mix, the emissions caused by driving electric cars are decreased. As explained earlier, by making vehicles perform an energy storage function, energy companies are able to integrate more renewable energy into the overall electricity mix. The application of demand-side management (or V2G) makes these intermittent resources thereby more reliable and it could stimulate the production of renewable energy. If batteries are mainly charged at off-peak times, a large extension of the electricity network would not be necessary. It is not so much a question of whether the electricity network would be able to deliver the required power; a potential bottleneck could be that the amount of energy that is stored in the car batteries is not sufficient to realize the desired ability to direct all available electricity to those batteries at periods of high supply (Blom 2009). Social issues concerning the electrical grid and infrastructure In order to avoid the construction of additional capacity and to incorporate more renewable (wind) energy into the electricity supply, the charging of electric vehicles should ideally occur at off-peak times, which occur at night. This raises the question of how the future users of electric vehicles are going to respond: how and when will the charging of the batteries occur? The expected charging behaviour is related to how the vehicle is used on a day-to-day basis and what possibilities are available to the user for charging the batteries. As shown in Fig 89, three possible charging scenarios are considered: optimal charging, evening charging, and twice per day charging. In scenario (a) Optimal Charging, the vehicles charge during periods of low demand. This scenario perfectly allocates electric vehicle charging in order to flatten the system load as much as possible. In order to achieve such charging behaviour, the installation of smart meters which centrally monitor and control the charging would be required. In this scenario, generators that are currently shut off at night can pick up the electricity demand from the electric vehicles. It is therefore not necessary to install additional generation, transmission, and distribution capacity. In scenario (b) Evening Charging, smart meters are not installed to delay the charging until national demand is low. Users of electric vehicles begin charging as soon as they return from work between 6 and 8 PM. This scenario matches with the current commuting pattern of many people. As a result of this, the additional load for charging these vehicles is added to the already existing peak demand in the early evening. At this time electricity demand is high because many people watch television, cook, have lights on, etc. If users charge their vehicle according to this scenario, the installation of additional capacity will eventually be required when the number of electric vehicles rises.

118 SCHIPHOL THE GROUNDS 2030
Users of electric vehicles in Scenario (c) Twice Per Day Charging have the opportunity to charge their vehicle at work. As a result of this, charge load from the vehicles is added when drivers arrive at work (between 7 AM and 10 AM) and when they return from work, such as in the previous scenario: between 6 and 8 PM. This results in a load shape with two peaks per day with potentially significant implications for the electricity capacity if the number of vehicles is rising (Lemoine and Kammen 2009).
Fig 89. Charging scenarios (Lemoine and Kammen 2009) As shown in the previous paragraphs, the best results for flattening the demand for electricity can be achieved with the use of a smart grid consisting of remotely controllable smart meters. However, there may be some privacy issues related to these smart meters. A recent study (Cuijpers and Koops 2008) concluded that smart meters might give energy companies insight into users' personal lives. Tracking energy use shows whether a user is away or at home, the type of electronic products
SCHIPHOL THE GROUNDS 2030 119
he or she owns, and when these products are being used. It is presently not clear how the data gathered from the smart meters can be securely stored and protected. This data needs to be protected from hackers, housebreakers, and possibly terrorists. Current Dutch government regulations, especially the established division between the energy and network company could also hamper the development of a smart grid. An important aspect that is required of the electrical infrastructure for charging vehicles is the achievement of a certain level of standardization. This standardization should include agreements between utility companies and vehicle manufacturers about aspects of the infrastructure, including industry standards for charging methods, plugs, cables, meters, and payment methods. Especially in the case of a battery swapping infrastructure, there is a need for a high level of standardization. It would require the cooperation of EV manufacturers and importers at an early stage in order to influence battery pack design and enable exchange systems to be widespread (BERR and DfT 2008). Experiences in the past have established that standardization is crucial for electric mobility: the lack of a charging standard was a significant limitation in the commercialization of full electric vehicles in California in the 1990s (Williams and Kurani 2007). One of the main arguments in support of fast charging batteries is that this method closely resembles the way conventional vehicles are currently fuelled. As with filling up the tank of a car with petrol, one could charge the battery within (±10) minutes. Although fast charging is expected to last a bit longer than it takes to fill a tank with gasoline, the required change in user behaviour would be less radical than in the case of slow charging cars for several hours. Fast charging could also be used as a backup for slow charging and it could enable BEV owners to travel longer distances by using fast charging on these occasions. Although fast charging could offer a solution to one of the main drawbacks of BEVs (the limited range), which might result in 'peace of mind' for BEV owners because they wouldn’t have worry about running out of electricity, other issues related to fast charging need to be overcome first. The main issues are related to safety concerns and the large impact that fast charging could have on the electrical grid if it occurs at several places simultaneously. As the charging rate increases, so do the dangers of overcharging or overheating the battery. Preventing the battery from overheating and terminating the charge when the battery reaches full charge are actions that become much more critical. Each cell chemistry has its own characteristic charging curve and battery chargers must be designed to detect the end of charge conditions for the specific chemistry involved. In addition, the installed equipment must prevent the battery from overheating during the charging process. Fast charging also requires more complex chargers. Since these chargers must be designed for specific cell chemistries, it is not normally possible to charge one cell type in a charger that was designed for another cell chemistry. Universal chargers, able to charge all cell types, must have sensing devices that can identify the cell type and apply the appropriate charging profile (BERR and DfT 2008). The concept of exchanging battery packs might introduce some safety issues that also need to be dealt with before such a system could become widely implemented. Besides the possible danger of handling the heavy batteries, it might be risky to establish the connection between the battery and the vehicle numerous times. This connection carries a very high current and may become worn after many battery changes. This has the potential of resulting in a massive discharge, which would create the risk of an electrical shock for nearby people (BERR and DfT 2008).
120 SCHIPHOL THE GROUNDS 2030
If charging private vehicles is considered from the user's perspective, some technological developments in charging might have implications for these users. Since they can plug in their car at home, users might see benefits in the time saved from not going to the petrol station anymore. In the V2G concept, it should be considered whether using a part of the energy content of the battery for services to the grid would be desirable from a vehicle owner's point of view. It is important to keep in mind that users buy their car primarily for transport purposes. The idea that V2G might bring them additional profits could be an added value, but it should not stand in the way of being able to use their cars for travel. Consumers like the idea of having a car available that they can jump into at anytime. Having to wait for the car to charge or not being able to leave in case of an emergency could be unacceptable for users. It is therefore also important that the V2G service does not excessively deplete the battery: there must be a range distance reserved for an unanticipated trip, for example to a hospital. As will be explained later, V2G services can serve different power markets. If the battery of the car is used for the most obvious market (regulation), the battery is only used for a very small part (~4%) for grid regulation (Lache, Nolan et al. 2008). In this case, using a part of the battery for uses other than transport would probably be barely noticeable to the owner. Economic issues concerning the electrical grid and infrastructure The emergence of rechargeable electric vehicles opens up a new, potentially large market for electricity. The business of fuelling the transport sector is presently almost completely dominated by large oil companies. The entry of electric utility companies to this market, offering an alternative to these fossil fuels in the form of electricity, introduces new competition to existing companies. Another potential economic benefit is that the reduction in dependence on foreign oil could have massive implications for reducing trade deficits and stimulating domestic economies (Lache, Nolan et al. 2008). The installation of additional capacity in generation, transmission, and distribution requires large investments in infrastructure. These investments are likely to lead to higher electricity prices. However, if electricity can be sold to a new market of electric vehicle users who charge their batteries during off-peak hours, and additional construction of infrastructure can be largely avoided, the overall cost of electricity might drop (Pratt 2007). As shown before, charging electric vehicles during off-peak hours, when national demand for electricity is low, has several advantages. One way to stimulate the users of electric vehicles to charge at off-peak hours would be to offer low rate tariffs for electricity. In this case, the price for electricity is high at times with high demand and it drops at off-peak hours. The question remains whether the low price of electricity during off-peak hours will be sufficient incentive to stimulate users to charge during those hours, or perhaps they will take the higher price for granted in order have a charged battery. An American survey (Lemoine and Kammen 2009) showed that Americans, if they owned a Plug-in hybrid vehicle, have no preference between using gasoline and electricity if gasoline prices are $1.50 per gallon. Higher gasoline prices would lead them to drive as much as possible in electric mode and gasoline prices lower than $1.50 per gallon would lead them to always drive on gasoline in charge sustaining mode. If gasoline prices are at least $2.00 per gallon, users would always want to recharge at off-peak electricity tariffs. Only if gasoline costs more than $3.73 per gallon, would users sometimes consider charging on-peak, but only if necessary. The average US price of gasoline in June '08 was $4.10 per gallon. Although this is an American survey and the response of Dutch users is not known, it does indicate that consumers can be very responsive to price differences in their electricity tariffs. Moreover, the price

SCHIPHOL THE GROUNDS 2030 121
of gasoline in the Netherlands is much higher than in America (converted to $/gallon, it was approximately $9.10 per gallon in June '08). In order to be able to deal with fluctuations in the energy supply of electricity, creating a way to temporarily store this energy would be very desirable, especially when the use of renewable intermittent energy sources is rising. In some cases, excess generated power can be sold to other countries. Creating a storage facility can be achieved in several ways. For example, grid connected electricity storage (GCES) facilities which are often based on pumped hydro energy are already being used to support grid stability. An economic drawback of the installation of GCES facilities is that it requires significant additional investments, and the customer does not benefit from this technology to a large degree (Blom 2009). The reason why storing energy in car batteries could work economically is because the batteries are purchased for transportation purposes, yet they are idle 96% of the time. The electric grid and automobile fleet could be complementary: the grid has (almost) no storage, automobiles must have storage. The electric grid has high capital costs and low production costs, while the automobile fleet is the inverse. Electric generators are used 57% of the time, automobile vehicle batteries are only used 4% of the time (Kempton and Tomic 2005). From the user of a Plug-in vehicle’s perspective, offering V2G services might become profitable if they receive an economic benefit from the electricity company for the electricity supplied. In the literature, examples are shown of situations in which delivering electricity back to the grid (vehicle to grid, or V2G) would make economic sense. V2G is only logical if the vehicle and power markets are matched. It could, in theory, provide an additional revenue stream for owners of Plug-in vehicles. In the United States, several different power markets can be distinguished. Each market has specific requirements and cost structures for the power delivered to these markets. The baseload power market consists of the "bulk" power generation. These generators are delivering the largest share of power compared to other markets. Baseload power is running most of the time and is paid for per kWh generated. Peak power generation is another type of power generation which is used during times of predictable high demand. For example, during hot summer days, widespread use of air-conditioning can be predicted, for which peak power can be used. Peak power is also paid for per kWh generated. A third market consists of power generators that are set-up and ready to respond quickly in case of failures. These “spinning reserves” are the highest value component of the electric market. Spinning reserves are not only paid for the power they generate, they are also paid in part for simply being available: a 'capacity payment' per hour available (for being plugged in). The fourth market is power generation for regulation: this is used to keep the frequency and voltage of the power generation steady. Although not as highly valued as spinning reserves, regulation power is also partly paid for by simply being available. From the literature (Kempton and Tomic 2005) it can be concluded that presently, V2G is not suitable for baseload power generation: vehicles cannot provide baseload power at a competitive price. However, it may be suitable for peak power in some cases. It could be competitive for spinning reserves and might be highly competitive for regulation. If vehicle batteries are used for frequency regulation and spinning reserves, batteries need to be available on an on-line basis: all is needed are tiny bursts of power for balancing. Owners are compensated for this service, according to the literature this has the potential of being rather profitable: owners could earn between $2554,- (Kempton and Tomic 2005) and $3285,- (Barkenbus 2009) a year. These payments would significantly accelerate the decrease in payback period that a

122 SCHIPHOL THE GROUNDS 2030
user has to go through for their investment in the battery pack. However, the drawback for the Dutch power market is that these high valuations for spinning reserves and regulation do not currently exist. This is purely based on the power markets in the United States. Different business models can be thought of when considering the V2G option. A short term application would be the use of fleets of electric vehicles that return to the same central parking place each night. In this fleet management strategy, the fleet operator sells V2G directly to the grid operator. For example, a fleet of 100 vehicles, supplied with a battery pack of 15kW each, would be able to bid 1 MW contracts during non-driving hours. The advantage of this business model is that implementing V2G to a single fleet at a single location simplifies the on-board electronics inside the car. Certified metering is not needed at the vehicle level, only at the level of the fleet parking structure (Kempton and Tomic 2005). Another business model would be to buy V2G power from hundreds or thousands individual vehicle owners. In this case, electric utility companies would expand their business from selling retail electricity to also purchasing V2G power from consumers. Financial incentives might be needed for consumers in order to let them stay plugged in when possible. When power is delivered to the grid, consumers receive money for this service. In this case, larger investments are needed: chargers and meters need to be bi-directional and need to be installed for each participating customer. Different technological options for the charging infrastructure have different implications with respect to the required investments and payback on those investments. Installing a dense network of charging points for electric vehicles could be costly. It is questionable whether this investment can be earned back through the sale of electricity alone and therefore whether it would be feasible. Range extending facilities, such as fast charging and battery swapping stations, would also require large investments. It is likely that the power obtained from these facilities would cost more for the consumer than the electricity charged slowly at home or at a charging point. For the home charging option, an issue is which party would pay for the required smart meter: would it be the utility company or the individual customer. Consumer organizations have already objected to the latter option. An economic advantage of a more evenly balanced power demand as result of a smart grid is that the economic performance of renewable energy improves due to the fact that these sources can be better utilized. The economic advantage of charging vehicles from solar panels is that as soon as the required investment in the installation is made, substantial gasoline savings can be achieved immediately. Instead of substituting the dependence on fossil fuel with electricity from the grid, customers generate the electricity themselves and can become completely independent of any supplier of their energy for transport. If the solar charging facilities are located at users’ workplaces, these facilities can be of added value for their employers. Solar collector parking facilities can be viewed as part of a multi-faceted benefit package for employers, similar to having on-site day-care or fitness equipment. If no vehicles are charging, some of the generated solar power can be fed back in the grid, or it could be used locally in the workplace (Birnie Iii 2009).
4.3.3 Conclusions In this report an overview is provided of the current status of electric mobility. Attention has been given to the technological aspects, ongoing developments, and

SCHIPHOL THE GROUNDS 2030 123
the role of different actors in the field of this new transport system. In this final chapter the main findings and conclusions on these topics are summarized. Technological developments Due to the technological limitations of current battery technologies, the range of electric vehicles is shorter than that of conventional cars. Although batteries are constantly improving, making an affordable fully electric car with a range comparable to that of ICE cars would require significant technological breakthroughs. It seems that no shortage in lithium availability would occur if electric vehicles were to be produced at a mass scale. Considering the development of Li-ion batteries and the dependence of BEVs (comparable to classic ICE vehicles) on Li-ion batteries, the development and growth in the numbers of PHEVs is very likely to be significant the coming decade, probably with BEV’s with a smaller range than a classic ICE vehicle. The development of FCHEVs requires large investments and a large adaptation of infrastructure, and therefore the support of governmental bodies. Grid-to-wheel analysis shows that FCHEVs are less efficient than BEVs when electricity is generated from sustainable resources. The examples from the user interface chapter demonstrate that the logic, ergonomics, and comfort of the systems (as experienced by the user) must inform decisions related to choice of technology, apparatus, and interface. Of utmost priority is the safety of the vehicle charging systems. It is of the great importance that usability and the user interaction process are taken into account when assessing electric vehicle technologies. The success of highly technical products is often related to the consumer’s ability to relate to them. Thus, the development of infrastructural systems that are simple, familiar, and context-sensitive will be critical in boosting consumer confidence and enabling successful market penetration. An assessment must therefore be made of the ways in which the design of the vehicle charging station can encourage users to operate within a system of electrified road transport. Currently, the key issues with respect to user confidence relate to the cost, simplicity, and practicality of vehicles and the charging networks that they rely on. In particular, charging systems must mitigate concerns about the immediate availability of “fuel” for electric vehicles. Of equal importance is the ability of charging infrastructures to adapt to the technologies, interfaces, and business models that govern them. Potential investments in large-scale vehicle systems may be hampered if infrastructures are designed in such a way that they cannot be modified. Therefore, modularity and compatibility will key to establishing dynamic and long-term solutions for vehicle infrastructures. Future developments in infrastructure are expected to be ICT related, such as the possibility to manage the charging and other features of electric cars remotely by means of mobile phone applications. The chapter about the electrical grid and infrastructure showed that substantial reinforcements of this grid and infrastructure are needed if EVs are going to be charged in an uncontrolled manner. A controlled way of charging (such as with a smart meter) could help to utilize spare capacity in the grid and thereby prevent peak loads. By doing so, demand side management, or vehicle to grid capabilities are achieved, which can contribute to a better use of intermittent renewable energy. The biggest bottleneck for the electrical infrastructure is achieving sufficient distribution capacity in the grid if electric cars are concentrated in particular regions or locations. Prospects of the electric grid and infrastructure are: attempts to decrease the carbon intensity of the energy generation, the possibility for BEV users to drive virtually emission free if they are willing to pay slightly more for renewable electricity, directly charging batteries from solar panels (solar to vehicle), and using electric cars as home energy components.

124 SCHIPHOL THE GROUNDS 2030
Market, user, policy and pilot developments With regard to market developments in the Netherlands, it can be concluded that HEVs, professional market niches (e.g. on-site, public services, vans & small trucks), and electric bikes (pedelecs) and electric scooters are growing considerably. However, the availability of full-sized electric vehicles for personal transport is still very limited. PHEVs, such as the recently announced plug-in Prius, Ev’s currently on the market are limited to the Norwegian Th!nk, Tesla Roadster, and regular cars from which the ICE is replaced by an electric motor. However, many major car manufacturers are announcing HEVs, PHEVs and full BEVs for the coming years and are testing so-called concept cars. With regard to policy, it can be concluded that most national governments in the developed world are actively supporting and facilitating pilots with EVs and the introduction of EVs in general. In the Netherlands as well as abroad, large cities and utilities are especially strongly involved in (forthcoming) pilots. In the Netherlands a new industry is emerging that produces components for the electrical car system. This includes firms that produce different types of charging equipment, as well as firms that specialize in organizing and coordinating pilots in practice. Actors It can be concluded that actors from all four domains are involved, with a wide variety of groups from the private and the user/society sectors. With regard to users, it can be concluded that professional users are in the lead in buying and using EVs and HEVs. Growing groups of consumer users include HEVs, electric scooters and electric bikes. With regard to pilots and experiments, it can be concluded that these are driven by local authorities and utilities. There is an emerging electrical mobility industry in the Netherlands, which includes producers of electric vehicles for professional use, producers of charging equipment and firms offering services to organize and to coordinate electrical mobility experiments. Environmental issues The major environmental benefits of electric mobility in comparison to the current petroleum-based transport sector are a result of the low primary energy use due to the high efficiency of electric cars. This high efficiency, in combination with a more sustainable power supply, results in lower impacts on climate change (CO2 emissions), smog, (photochemical oxidant formation), non-renewable resource depletion, and noise pollution (especially at lower speeds). It should be noted that many of these environmental benefits are almost completely dependent on the type of energy generation that is used to charge the battery. Emissions are not only reduced by electrical mobility, but they no longer occur at the vehicles’ tailpipe, but instead at power stations, which are mainly located away from urban centres. Lower particulate matter emissions will have a positive effect on developments in the built environment where the user interface is applied. It could, for example, become possible to build at a shorter distance from roads if emission levels are lowered by the use of electric cars. Although the availability of lithium is sufficient in order to produce enough batteries to replace each car currently on the road with an EV, there are environmental issues related to the mining and processing of materials for these batteries. The extraction of this material can increase the potential impact on water use, waste generation, and human health. The application of well-executed recycling methods for these batteries can limit the need for extracting raw materials and, as a result, the consequences of these issues. Social issues

SCHIPHOL THE GROUNDS 2030 125
The shorter range of EVs in comparison to conventional cars poses new challenges for supporting these cars in order to make them feasible for users. Changes in consumers’ behaviour (using second hand cars, rented cars, or public transport) for longer trips might be needed in order to make these cars acceptable and practical if no technological solutions (fast charging, battery swapping, or range extender) are implemented. Potential benefits for consumers, such as having the ability to charge a car at home instead of going to the fuel station and the image/social status associated with certain cars, could offer new opportunities for marketing electric cars by packaging the vehicle in a way that presents a new and attractive value set for consumers. An important social issue related to preventing overload of the electrical grid is making sure that electric vehicle users are able and willing to charge their batteries during off-peak hours. Potential privacy and security issues resulting from the use of smart meters could however become negative aspects from a consumer’s perspective. The decrease in oil dependence that can be achieved with electric driving could be a strong argument for using electricity to propel cars. Achieving standardization agreements between utility companies and vehicle manufacturers on infrastructure aspects including industry standards for charging methods, plugs, cables, meters, and payment methods is critical for the success of electric mobility. Safety, security, and user friendliness issues need to be taken into account in the design of the user interface. Safety aspects of fast charging and battery swapping technology also have to be dealt with before they can be implemented ona large scale. Regarding the V2G option of delivering electricity back to the grid, it should be noted that consumers probably prefer to be able to use their cars at any time and they do not want their batteries to be depleted because of this V2G functionality. Economic issues From an economic point of view, electric cars differ from conventional cars in the sense that they are currently more expensive to buy, but are less expensive to drive due to the low costs of electricity. It is currently not possible for drivers to earn back their higher investment in an electric car with achieving lower running costs by driving on electricity. This situation is expected to change in favour of EVs. In the foreseeable future, electric cars can become cost competitive with conventional cars. The tipping point is expected to occur in the period between the years 2015 and 2026. Because the higher upfront investment in an EV could be a barrier for consumers, different business models, such as battery leasing, are likely to originate in the early years of electric cars. The most feasible way for achieving an evenly distributed demand of electricity during the day is through the use of smart meters for individually allocating charge to each car. As a result of the use of such a smart grid, the economic performance of renewable energy can improve due to the fact that these sources can be better utilized. Besides smart meters, low electricity tariffs during off-peak hours could be implemented to make charging during those times more financially attractive for consumers. The V2G option of delivering charged electricity back to the grid only makes sense if the vehicle and power market are matched. In the United States, V2G services can be very profitable for users if it is sold as spinning reserves and grid regulation. However, these high value power markets are currently do not exist in the Netherlands. Changes in the Netherlands’ energy market are therefore required in order to make delivering electricity to the grid economically viable. Industries with large vested interests in the petroleum-based transport sector and the government with high tax revenues from current fuels and cars sales may seek ways to maintain this source of income. It is currently unknown how these powerful parties would respond if many drivers were to choose electricity to power their car.
126 SCHIPHOL THE GROUNDS 2030
Another economic issue could be the high-risk business model of making investments in a charging infrastructure, which are difficult to earn back by selling electricity. Range extending facilities such as fast charging and battery swapping stations would also require significant investments.
4.4 Urban context and potentials In this chapter, a general approach to integrate innovative infrastructural concepts and E-mobility into our build environment is explored. Subsequently, important environmental and spatial development related information on the surroundings of Schiphol is discussed. With this knowledge, the energy potentials of Schiphol’s surroundings and the specific areas of The Grounds and Elzenhof can be determined. Finally, in several maps, different forms of on-site potential available amounts of energy will be shown.
4.4.1 The Built Environment & E-mobility, Approach
4.4.1.1 Spatial planning in relation to change/innovation Spatial planning, the planning of infrastructures and mobility systems are becoming more complex and mutual depended. Due to intensive use and technological development the life cycle of infrastructures in general is becoming shorter. Infrastructures have to be radically updated more frequently. One of the background features is that the necessity of extension and/or change of infrastructures becomes less predictable and involves higher risks. Consequently, this leads to a spatial planning following an unbridled development of infrastructures, with the corresponding negative consequences for liveability and quality at various scale levels. Big investments and/or structural changes will not be able to take place so easily, unless collectively supported by all stakeholders. This points to the importance of strategic “location development”. In this situation, the importance of urban direction and the guarantee (defence) of specific public services increases. Especially in the case of the introduction of electric mobility, the actual pressure on changing infrastructures to adapt to EVS, together with the resulting grid and BE consequences, results in an increasing pressure on aspects of general or public interest, and a general increase in the pressure on transport and the increasing complexity of the connectiveness and dependence. It is important to note that spatial quality is context-bound and dynamic. Also, its aspects depend on place, time, scale level, social circumstances and cultural background, to be translated into an “approach of layers”, distinguishing between three physical planning layers, viz. basis, networks and occupation. As a continuation, recent approaches in the practical world of urban planning mainly concern the way that changes are dealt with. There is a shift in the way that matters are approached: o from (static) planning to (dynamic) directing, o from arrangement to development, o from (quantitative) allocation of programmes to (qualitative) planning of
conditions, o from expansion to transformation, and o from spatial planning to designing research and strategic interventions. An important aspect to consider is “conditionality” (Fig 90). Environmental care is pointless when there is no attention for the quality of (urban) development. Environmental-technical measures are useless when environmental care is
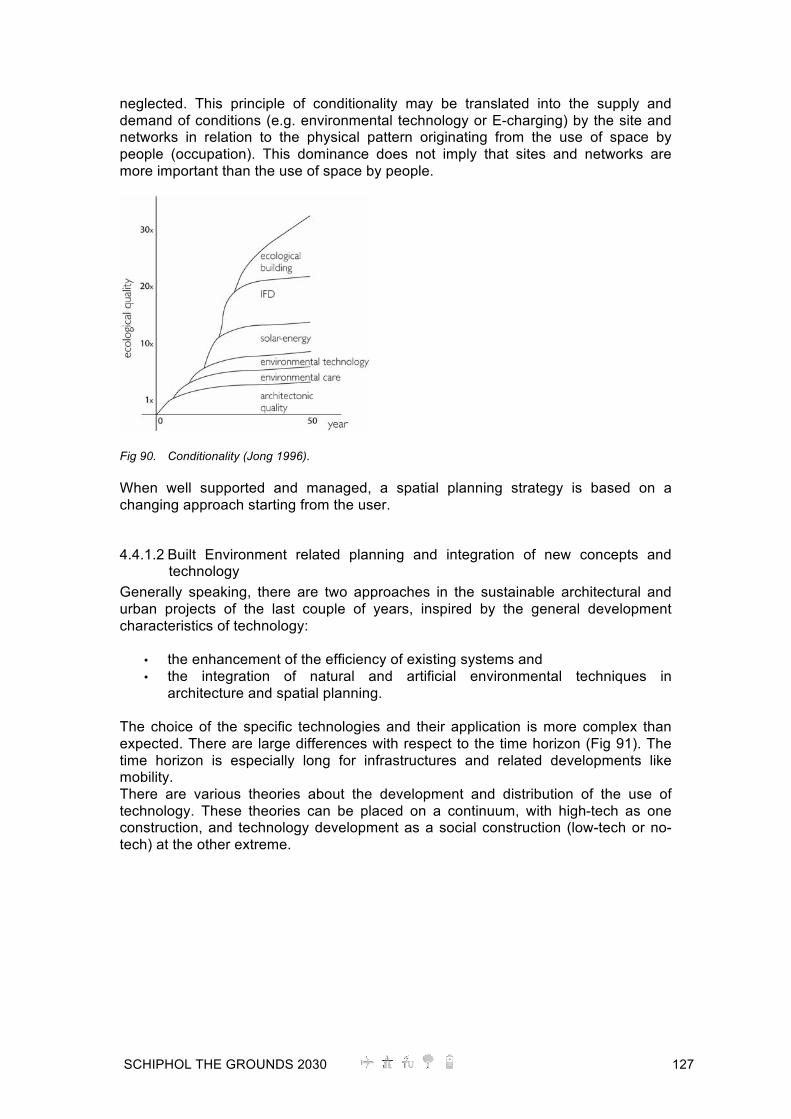
SCHIPHOL THE GROUNDS 2030 127
neglected. This principle of conditionality may be translated into the supply and demand of conditions (e.g. environmental technology or E-charging) by the site and networks in relation to the physical pattern originating from the use of space by people (occupation). This dominance does not imply that sites and networks are more important than the use of space by people.
Fig 90. Conditionality (Jong 1996). When well supported and managed, a spatial planning strategy is based on a changing approach starting from the user.
4.4.1.2 Built Environment related planning and integration of new concepts and technology
Generally speaking, there are two approaches in the sustainable architectural and urban projects of the last couple of years, inspired by the general development characteristics of technology:
• the enhancement of the efficiency of existing systems and • the integration of natural and artificial environmental techniques in
architecture and spatial planning. The choice of the specific technologies and their application is more complex than expected. There are large differences with respect to the time horizon (Fig 91). The time horizon is especially long for infrastructures and related developments like mobility. There are various theories about the development and distribution of the use of technology. These theories can be placed on a continuum, with high-tech as one construction, and technology development as a social construction (low-tech or no-tech) at the other extreme.

128 SCHIPHOL THE GROUNDS 2030
Fig 91. Time horizon of technological development. Several technology critics claim that it is technology that causes environmental problems, and that consequently it cannot be part of the solution of these problems (Timmeren 2006). The underlying idea is that technology has an exploitative relationship with the natural surroundings, with the combination of technology and capitalism leading to a system in which there is no attention for a maintainable balance between environment and technology. Technology critics argue that the search for relatively simple “technical fixes” does not do anything to the underlying causes of the environmental problem and, consequently, cannot offer a maintainable solution. What is more, this new technology has its own unexpected and unplanned side effects and may lead to yet more problems. To a certain extent, this is true for many of the currently proposed and initiated interfaces and charging techniques for Electrical Vehicles (EVs) in the built environment. Within the –second- integrated approach, it may be argued that, because of the performance of integral systems and concepts focused on sustainability, spatial segregation may pose a problem. Moreover, for breaking through this spatial segregation, the increasing complexity and lack of transparency appear to be stumbling blocks that point to a vicious circle. This can be explained by considering the relationship between uncertainties and complexity: to accept no uncertainties is hardly complex and does not lead to innovations, whereas to neglect uncertainties can also be taken to be too simple (Geldof 2002) . In the latter case, all sorts of measures are tried and implemented in the plan without the uncertainties being explicitly taken into account. Then, the problems are usually passed on to the management phase or the systems managers. The true extent of complexity lies somewhere in between and may lead to useful innovations, and therefore should be taken as a starting point by Schiphol within the roadmap to include e-mobility in its long-term future.
4.4.1.3 Built Environment related planning and integration of new concepts for E-mobility and E-infrastructures within the context of Schiphol
In analyzing energy systems, a model can be utilised, consisting of four layers (Arnbak 1999). In such an arrangement, it is possible to position the various technical and economic processes in a specific relationship with the energy grid. The two lower layers mainly concern technical aspects of the supply of energy, while the two higher layers are more related to economic processes (Künneke 2001). The lowest layer is the (physical) Infrastructure (1). (2) Technical Processes: control (adjustment) required to have the energy flows perform in a technically satisfying way; (3) Products (e.g. electricity); and (4) Service to the client: everything that the

SCHIPHOL THE GROUNDS 2030 129
consumer can do with the product supplied through the infrastructure, e.g., lighting, driving, etcetera Fig 92.
Fig 92. Model of the different layers of energy networks (e=energy; g=natural gas; w=water), after: (Arnbak 1999). At the moment, two trends can be perceived in the management of several types of infrastructures necessary for the various utilities and the terms of use and maintenance. One trend is the shift from public to private ownership. Another is the fact that the costs of infrastructure are becoming more and more connected to actual use. Simultaneously, the government is expected to protect the various areas of the public or common interest. With an ongoing waning of governmental power, public enterprises, whether privatized or not, can operate more and more independently with specific business decisions, and are observed to actually do so. All over the world, the economic field of influence is changing. So-called “open” economic structures are arising (Sassen 2004), with enterprises breaking off historic ties with national and/or regional authorities. More and more frequently, it is the enterprises that design the structures and infrastructures and control the (logistic) chains. The first trend stated also applies for Schiphol. This means that Schiphol will be able to take the lead with greater ease (to some extent), for instance with respect to the integration of E-charging concepts attached to or even integrated into the (road) infrastructures. Besides this lack of a so-called ‘first mover problem’, an additional advantage is that the enhancement of strategic information, e.g., the labelling of electricity, is easier for a decentralized scale of generation and distribution (e.g. in the case of a Schiphol micro-grid). Because of the gradual shift towards the supply of services, rather than only products, it is exactly this aspect that has gained significance during the last few years. It must be noted that the current energy infrastructure and generation systems do not perform optimally when environmental aspects are the starting points. In addition to the issue of generation, high-quality fuels and electricity are used for many tasks where the high-energy quality (exergy) is unnecessary, wasteful and expensive. With the introduction of electricity-based mobility, both new possibilities and existing problems become visible. With respect to the incorporation of large scale electricity charging in urban electricity infrastructures, it is important to state that the infrastructure strongly correlates with production. A change desired in the infrastructure, e.g. a bottleneck with respect to capacity, can be solved by investing in extending the infrastructure (now often accepted), but most of the time also by adapting the “production” in strategic spots of the central grid (one could speak of site incentives: incentives for speeding up production wherever desirable). One possibility is to connect or disconnect decentralized, additional sustainable sub production (generation or processing capacity).

130 SCHIPHOL THE GROUNDS 2030
As for Schiphol, a micro-grid for its electricity (or a hybrid electricity grid) might be an interesting option. Such solutions imply potentially smaller scales of implementation and optional possibilities for incorporating renewable sources. The potential benefits are a possible reduction of infrastructure and better visibility and tuning into the demand, and more flexibility. An approach focused on the design of processes in this case would be a good starting point: changes in the dynamic quality lead to techniques and systems, which may result in synergy effects. Present-day design principles particularly emphasize the “extrinsic values” (fastest transport, minimum integration, maximum capacity, etc.). By changing these to “intrinsic values”, better tuning to site-specific (ecological) conditions and regenerative ability may be achieved. Table 25 shows a comparison of characteristics between conventional centralized configurations, and configurations at smaller scale levels. Table 25. Characteristics of large-scale and small-scale configurations
Decentralized energy (or distributed resource) can be defined as energy production at or near the point of use, regardless of size, technology or fuel used, both off-grid and on-grid. It includes high efficiency cogeneration (CHP), trigeneration (CCHP), on-site renewable energy and industrial energy recycling and on-site power (embedded generation). Usually, decentralized energy generation implies systems with a limited capacity (up to 10,000 kW) distributed over an electricity, heat and gas distribution grid. Almost all energy generation systems are also available as decentralized versions. Within the scope of this study, only sources, which imply or include locally available electricity based on renewable sources will be included. The most common renewable energy sources applied locally, and to be investigated in the next chapter, are sun, wind, environmental heat (and optional electricity generation) and biomass (including biogas, with via CHP electricity generation). The requirements that a decentralized system must meet are (Timmeren 2006): o The production and processing of the various flows takes place closer to the
users than usual, and the generated or processed flows are brought or returned to the users in a direct way;
o All, or a considerable part of, the responsibilities and powers are at a lower (than average) (management) level, closer to operation.
The general idea behind smaller systems is their relative simplicity and adaptability, and therefore their possibility for creating extra (sustainable) capacities in situations where (Timmeren 2006): 1. Centralized systems have not been built yet; 2. Existing systems have reached the limits of their capacity and new buildings,
districts and/or higher densities are planned, e.g., use as a (temporary) back-up provision;
3. Bio-climatical, geological or circumstantial characteristics make interventions (e.g., in the subsoil) difficult and/or expensive;

SCHIPHOL THE GROUNDS 2030 131
4. There is a desire for enhanced environmental performance, e.g., through interconnections with other “infra” systems;
5. The (part of the) market has been liberalized; 6. There are existing or new niches, as occasions for new (also decentralized)
technology; 7. There is a convergence of infrastructures and a pursuit of network structures of a
stronger decentralized nature, with parts of the grids being able to work relatively autonomously, e.g., for the support of flexible planning and restructuring concepts;
8. Ideologically oriented considerations play a role, also as an educational principle; 9. An improved network geometry (error and attack tolerance) is needed. With regard to Schiphol, situations 4, 5 and 6 can be especially directive for a roadmap towards more decentralized electricity integrations based on renewable energy. To some extent situation 3, due to the relative large availability of surface for wind/solar energy, applies and eventually even situations 8 and 9. Within the scope of this study it is therefore important to include an extensive potentials study focusing on existing or easily accessible renewable sources.
Fig 93. Schematic map of the Haarlemmermeer in 2009. Schiphol is located at the top-right (northern side).
4.4.2 Climate and sustainable energy potential analysis of Schiphol and the Haarlemmermeer
4.4.2.1 Topography and historical context of the Haarlemmermeer / Schiphol area Before 1848, the largest lake of the Netherlands was situated southwest of Amsterdam. The lake was formed by the extraction of turf, which was used as a fuel. The lake – called “Haarlemmermeer”– had an aggressive growth rate. The expansion of the lake repetitively flooded nearby lands, eventually covering more than 17.000

132 SCHIPHOL THE GROUNDS 2030
hectares. Due to the rapid increase, more and more villages disappeared and soon the water became an increasing threat to the nearby cities of Amsterdam, Leiden and Haarlem. The only way to stop this `Waterwolf´ was to drain the lake and reclaim the original land. The reclamation was completed in 1852, but Jan Adriaanszoon Leeghwater had already initiated the first proposal in 1643 and similar sketches by Nicolaus Samuel Cruquius in 1742 were found. Their names are nowadays still connected to the drainage system. It took almost centuries, until the water had flooded to the gates of Amsterdam and in the streets of Leiden, until their idea was executed. This delay is not surprising; the scope and the investments of the project would be controversial even in current times, despite modern technology. It was estimated that more than 800 million tons of water was pumped by three large steam-engines. The reclaimed land was established as a separate municipality, which is still referred to as Haarlemmermeer (Fig 93). The initial inhabitants of Haarlemmermeer were pioneers. After they migrated to the area, they divided almost every piece of land agriculture, creating a unique polder grid. The following generations introduced greenhouses, which boosted the population and wealth of the municipality. The largest impact on the region was caused by the introduction of Schiphol Airport. Schiphol opened on 16 September 1916 as a military airbase, consisting of a few barracks and a field serving as both a platform and runways. Although it is known internationally as the airport of Amsterdam, it is located within the boundaries of the Haarlemmermeer. The main port is nowadays the major aviation hub in the Netherlands and the associated commercial activities have created a very dynamic and fast-growing surrounding area. Over the last 35 years, the population of Haarlemmermeer has doubled to more than 140,000. A large logistics area is situated South of Schiphol Airport. With the presence of Schiphol and its commercial activities, the Haarlemmermeer offers employment for more than 100,000 labourers (Haarlemmermeer 2009). Furthermore, the presence of Schiphol – which ranks as Europe’s 3rd largest airport and 14th in the world for cargo tonnage – has crowned the municipality as the second economic centre of the Netherlands after Rotterdam. Therefore, it is possible to say that at the present time the airport has the status of one of the major energy consumers (and to some extent materials) in the Netherlands and that, in turn, is reflected on the state of the environment. Additionally, the gradual extension of the airport’s capacity increases the environmental footprint and raises issues of redevelopment of the Schiphol airport in a sustainable way. On the other hand, the directorate of Schiphol Airport understands the necessity of technological and conceptual transition of Schiphol’s ideology towards sustainable, feasible and optimal solutions, which will decrease the environmental footprint and improve the image of the company in terms of environmental friendliness.
4.4.2.2 Future projects (in)directly related to Schiphol Over the past decades, Haarlemmermeer transformed itself into an area with a fast-pace and significant expansion. This still continues the next decades; public and private parties have planned to carry out more than 120 building projects within the municipality before the year 2030. The largest projects are: the development of 10,000 residences in the west, called ‘Westflank’; a leisure park of 325 hectares in the middle, called ‘Park of the 21st century’ (or ‘Park21’); a large logistics area between Schiphol and Hoofddorp, called ‘Amsterdam Connection Trade’ (or ‘ACT’); and an area of 450 hectares for glasshouse horticulture in the eastern part called ‘PrimAviera’.
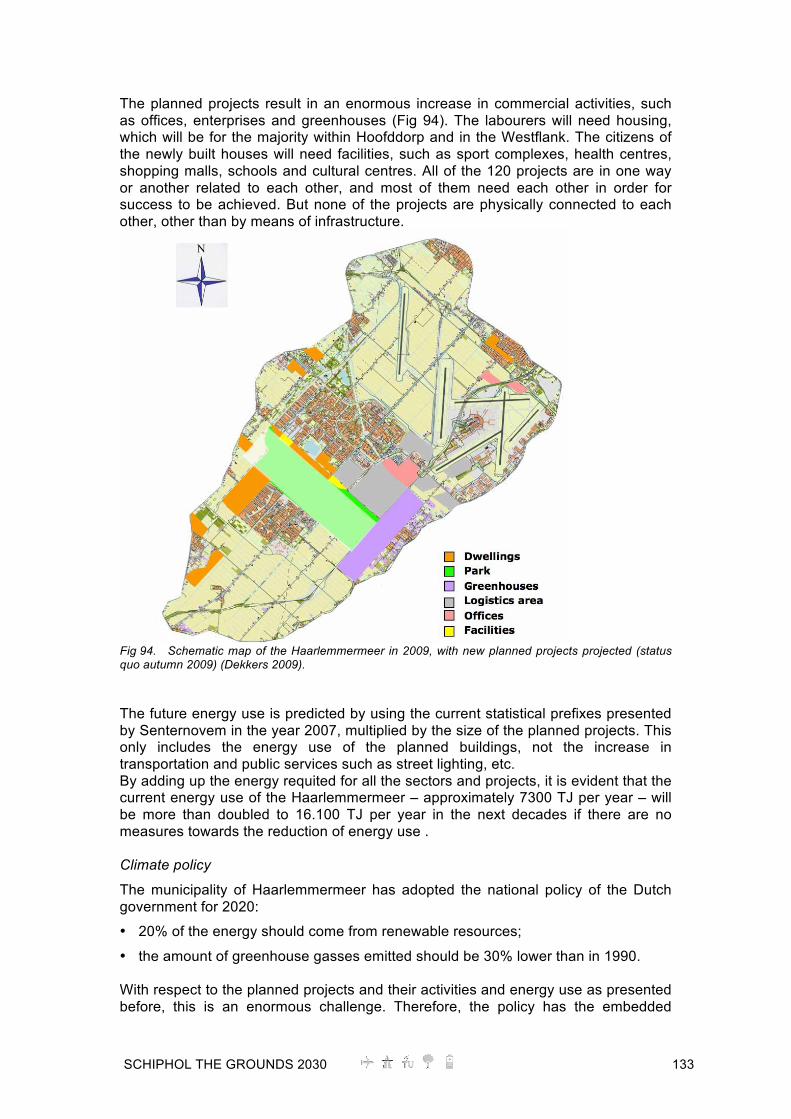
SCHIPHOL THE GROUNDS 2030 133
The planned projects result in an enormous increase in commercial activities, such as offices, enterprises and greenhouses (Fig 94). The labourers will need housing, which will be for the majority within Hoofddorp and in the Westflank. The citizens of the newly built houses will need facilities, such as sport complexes, health centres, shopping malls, schools and cultural centres. All of the 120 projects are in one way or another related to each other, and most of them need each other in order for success to be achieved. But none of the projects are physically connected to each other, other than by means of infrastructure.
Fig 94. Schematic map of the Haarlemmermeer in 2009, with new planned projects projected (status quo autumn 2009) (Dekkers 2009). The future energy use is predicted by using the current statistical prefixes presented by Senternovem in the year 2007, multiplied by the size of the planned projects. This only includes the energy use of the planned buildings, not the increase in transportation and public services such as street lighting, etc. By adding up the energy requited for all the sectors and projects, it is evident that the current energy use of the Haarlemmermeer – approximately 7300 TJ per year – will be more than doubled to 16.100 TJ per year in the next decades if there are no measures towards the reduction of energy use . Climate policy
The municipality of Haarlemmermeer has adopted the national policy of the Dutch government for 2020:
• 20% of the energy should come from renewable resources;
• the amount of greenhouse gasses emitted should be 30% lower than in 1990. With respect to the planned projects and their activities and energy use as presented before, this is an enormous challenge. Therefore, the policy has the embedded

134 SCHIPHOL THE GROUNDS 2030
requirement that all of the planned building projects for housing and offices should be carbon neutral, meaning that there will be no net CO2 emitted.
4.4.2.3 Climate (temperature, sun, wind, precipitation) Climatologically, Schiphol lies in a coastal area, for which the average Dutch temperatures of 9.8-10,1°C apply. Though, as can be seen in Fig 95, in the last decennia there has been an increase in the annual average temperature. With the foreseen climate change, a further increase can be expected (Fig 96).
Fig 95. Annual average temperatures (left) (KNMI, 2007) and average temperature in January (upper right) and July (lower right) (Wolters-Noordhoff 2005)
Fig 96. Average Dutch temperatures since 1880 (Wolters-Noordhoff 2005) For the built environment of Schiphol, this increase means that in summertime, more energy will be required for cooling the office buildings. Cooling buildings requires more energy than heating them. This implies that it will be especially important to build in a passive way and prevent the need for cooling. The characteristics of the sun play an important role in the built environment with respect to energy use. For this reason, knowledge of sun paths and the amounts of available energy are of substantial importance to designers. The sun is the largest energy source for the Earth. It provides one square meter of Dutch soil of 3,5 GJ of energy every year(KNMI 2006). Fig 97 shows maps of Schiphol and its surroundings with regard to annual sun hours and energy content of the radiation. Fig 98 illustrates the sun path of the latitude at which Schiphol lies: 52° north. The maximum angle of the sun in the summer on this latitude is 62°. In this case, the sun turns from Northeast to Northwest. In the winter, the maximum angle is 14°, while the sun rises in the Southeast and sets in the Southwest.

SCHIPHOL THE GROUNDS 2030 135
Fig 97. Average annual sun hours in the Schiphol area (left) and energy content of the solar radiation (right) (KNMI 2006)
Fig 98. Sun paths for latitude 52° The average annual wind speeds are shown in Fig 99 by two maps; the left indicates wind speeds at a height of 30m. And the right illustrates speeds at a height of 100m. With these average wind speeds, the energy potentials for different windmills can be calculated.
Fig 99. Wind speeds at different heights (left: 30 meters, right: 100 meters (KNMI 2006)

136 SCHIPHOL THE GROUNDS 2030
Fig 100. Maximum permitted building height as a result of the LIB (Waterstaat 2003). The aircraft flying routes to and from Schiphol affect a radius of kilometres beyond the legal boundaries of the airport itself. To prevent legal problems, there are several restrictions for buildings and urban developments that are defined in the airport’s area development agreement. The LIB (in Dutch: ‘Luchthaven Indelings Besluit’) establishes the following (Waterstaat 2003):
• Height limits: No building should be built at such a height that it becomes a threat to the aircrafts. This can either be in the form of a change in the wind patterns or a risk for collision. The height limits vary from 0 meters close to the runways to 150 meters in the Southern point of the municipality. For example, due to this restriction the number of locations for large on-shore wind turbines has been decreased.
• Building restraints: No buildings are allowed below the usual flight routes. This is, among other reasons, due to the fact that forced landings should be possible. Furthermore, there are additional restrictions on dwellings that are not allowed close to aircraft flying routes.
• Bird restrictions: There are restrictions on the developments of areas that might attract birds. Large open water, reed beds or parks are not allowed within approximately a five kilometre radius of the airport without official clearance. This is due to the fact that birds might get stuck in the airplane engines.
Fig 100 shows all of the restrictions on the maximum building heights. Both ‘Elzenhof The Grounds’ and the ‘60ha The Grounds’ are located in areas with a maximum building height of 20 meters. For the use of wind energy, this means that only very small wind mills can be built on-site. The climate characteristics of the rainfall are illustrated in Fig 101. On the left, the figure indicates the annual average amount of rain, whereas the right figure shows the surplus of water, this is pumped out of the polder. With the increasing amounts of rain in last decennia, as illustrated in Fig 102, more water has to be pumped away, which requires more energy. General expectations are of drier summers and wetter winters (KNMI 2006)
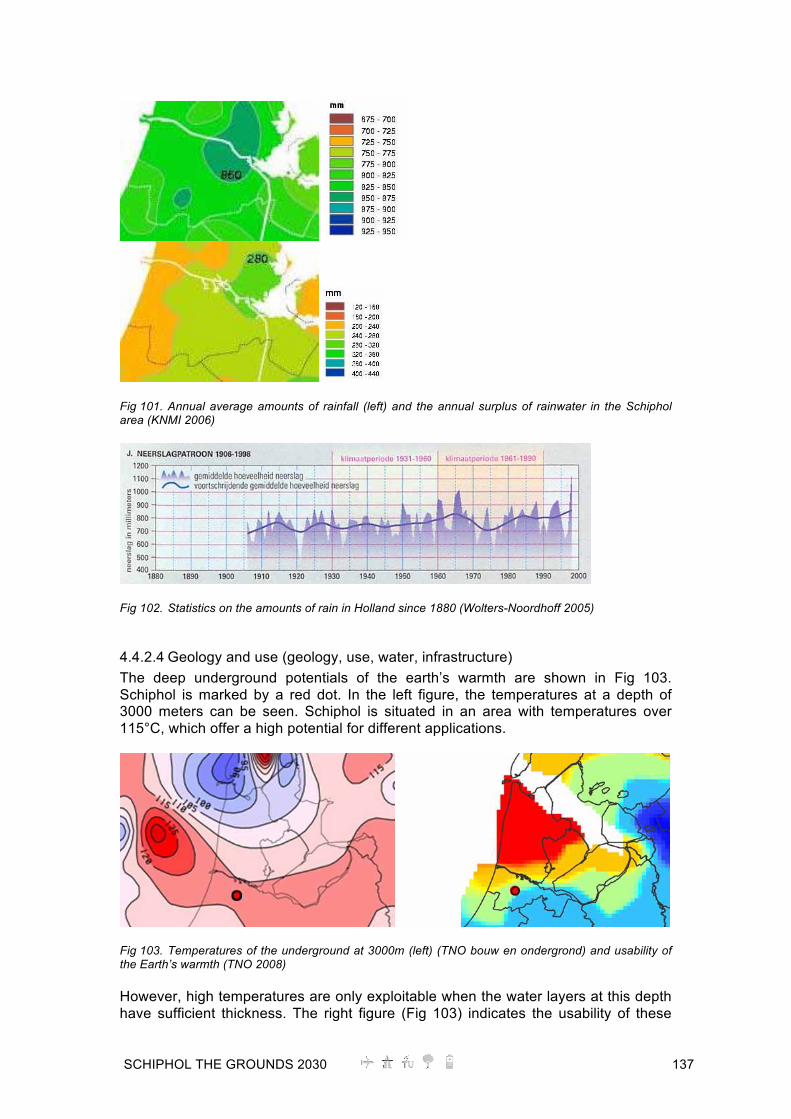
SCHIPHOL THE GROUNDS 2030 137
Fig 101. Annual average amounts of rainfall (left) and the annual surplus of rainwater in the Schiphol area (KNMI 2006)
Fig 102. Statistics on the amounts of rain in Holland since 1880 (Wolters-Noordhoff 2005)
4.4.2.4 Geology and use (geology, use, water, infrastructure) The deep underground potentials of the earth’s warmth are shown in Fig 103. Schiphol is marked by a red dot. In the left figure, the temperatures at a depth of 3000 meters can be seen. Schiphol is situated in an area with temperatures over 115°C, which offer a high potential for different applications.
Fig 103. Temperatures of the underground at 3000m (left) (TNO bouw en ondergrond) and usability of the Earth’s warmth (TNO 2008) However, high temperatures are only exploitable when the water layers at this depth have sufficient thickness. The right figure (Fig 103) indicates the usability of these

138 SCHIPHOL THE GROUNDS 2030
layers (blue is unusable and red is highly usable). Schiphol is situated in an area with reasonable opportunities in this area. However, for electricity production, this temperature is not sufficient without adding a lot of extra energy. Therefore, the technology in general is used in the Netherlands for heat production. This differs from the seasonal storage of heat in the sense that no energy is stored for compensation. The heat source used at several kilometres depth is formed after ages of heat conduction from the centre of the Earth. When this energy is used, the formation will cool down faster than it can be reheated. The question then arises whether or not the usage of geothermal energy should be considered a sustainable technology, since it is not renewable within a short time span (TNO 2008) Much can be said about the geological properties of the municipality. Three of them are of most importance for this research: the quality of the water-bearing formations for seasonal heat storage, the feasibility for soil heat exchangers and the heat capacity of the deep formations for geothermal energy purposes. In the layers closer to the surface, up to a depth of 50m, heat and cold can be exchanged. Both Schiphol focal areas are marked in red (Fig 104).
Fig 104. Usability geothermal heat and cold exchange (TNO 2008) The locations where aquifers are situated that are the most suitable for open heat exchange systems are shown in Fig 105 at two different depths. Due to the fact that the whole Haarlemmermeer is located below sea level, there is a great deal of salt water mixing in the groundwater. This brackish water has negative effects on the performance of the system and should therefore be investigated with care or avoided altogether. The particular locations where the salt water might influence the heat capacity and the infrastructure of the system are labelled “undesirable” when it is seriously discouraged or “caution” when the water-bearing formation should be thoroughly examined before usage. For both ‘The Grounds’ areas the shallow aquifers are not a real option.

SCHIPHOL THE GROUNDS 2030 139
Fig 105. The suitability for seasonal storage with shallow aquifers at 15 – 35 meters depth (left) and deep aquifers between 45 – 200 meters (right) (IF Technology 2008 ).
Fig 106. The suitability for soil heat exchangers (IF Technology 2008 ). The most feasible location for vertical soil heat exchangers differs within the Haarlemmermeer, and for the two ‘The Grounds’ areas too. The best locations for this technology are shown in Fig 106 and in Fig 104 in more detail (focusing on the Haarlemmermeer). As can be seen, the best potentials exist for the ‘60ha The Grounds’ area.
4.4.2.5 Short summary and energy potential maps of the Haarlemmermeer With a maximum annual solar power of 370.000 Joule per cm2, a substantial part of the electricity and heat demand can be provided by technologies as described in previous sections. The differences within the Schiphol area itself don’t appear to be substantial. However, the difference of solar radiation between the Schiphol areas ‘60ha The Grounds’ and ‘Elzenhof The Grounds’ – 10.000 Joule per cm2 – is about 28 kWh per square meter, which can make a difference.
Fig 107. Summary of main renewable sources (sun/wind) projected on the Haarlemmermeer

140 SCHIPHOL THE GROUNDS 2030
As for the wind energy use, the difference in wind speed is of major importance for the energy potential. It is remarkable to see that the wind patterns differ at only 70 meters difference. At 30 meters high, the average wind speed is the highest on the western part of Haarlemmermeer, while at 100 meters, the South and part of the Northeast are more suitable for wind turbines. The difference in the generated energy in Haarlemmermeer between the perfect located wind turbines on 30 meters height (6 m/s) and at 100 meters (8 m/s) is a factor of 2.37. To illustrate this, in order to provide electricity to 2000 dwellings for a year, the following is needed:
• 1x 100 meters high wind turbine or
• 25x 30 meters high wind turbines or
• More than 10,000 2 meters high wind turbines.
Fig 108. Summary of the main soil-related potentials with respect to energy (soil & aquifers), projected on the Haarlemmermeer
4.4.3 Schiphol, the urban context The Schiphol Group is developing several projects on their premises. Two potential interesting projects were suggested to take into account for the DIEMIGO-project; the so-called 60 ha The Grounds and Elzenhof The Grounds. Fig 109 illustrates the topographical surroundings of the airport. In both the satellite and the simplified topographic map, the two locations of the DIEMIGO research (Schiphol ‘60ha The Grounds’ and Schiphol ‘Elzenhof The Grounds’) are highlighted in red.
Fig 109. Satellite view (left; courtesy of Google Maps) and topographic view (right) with both locations (The Grounds and the Elzenhof) marked in red
4.4.3.1 Topography and ‘look & feel’ of the “60 ha The Grounds” Schiphol Group has made plans to develop an area of 60 hectares, located North-west of the airport. It is adjacent to landing strip 3, along which the sound barrier is to be constructed.

SCHIPHOL THE GROUNDS 2030 141
Fig 110. Map of 60ha (courtesy: Google Maps). The 60ha is an agricultural area. The land is currently leased by Schiphol Group to farmers. Most farms are dedicated to producing potatoes and other vegetable, and one farm on the site is a horse farm.
Fig 111. Bird’s eye view of ‘The Grounds’ (60ha) location (courtesy: Google Maps)

142 SCHIPHOL THE GROUNDS 2030
Fig 112. Images of the 60ha ‘The Grounds’ area.
4.4.3.2 Topography and ‘look & feels’ “Elzenhof The Grounds” The bird’s eye views are of both locations and they show the most important measurements. The ‘Elzenhof The Grounds’ consists of approximately 30 hectares, though for future plans, this area probably could expand to the north and east. The ‘60ha The Grounds’ is approximately twice as large: 60 hectares. It is bounded by the future sound barrier on one side and only by grassland on the other side (Fig 113).
Fig 113. Bird’s eye view of the Elzenhof (30 ha.) location (courtesy of Google Maps).
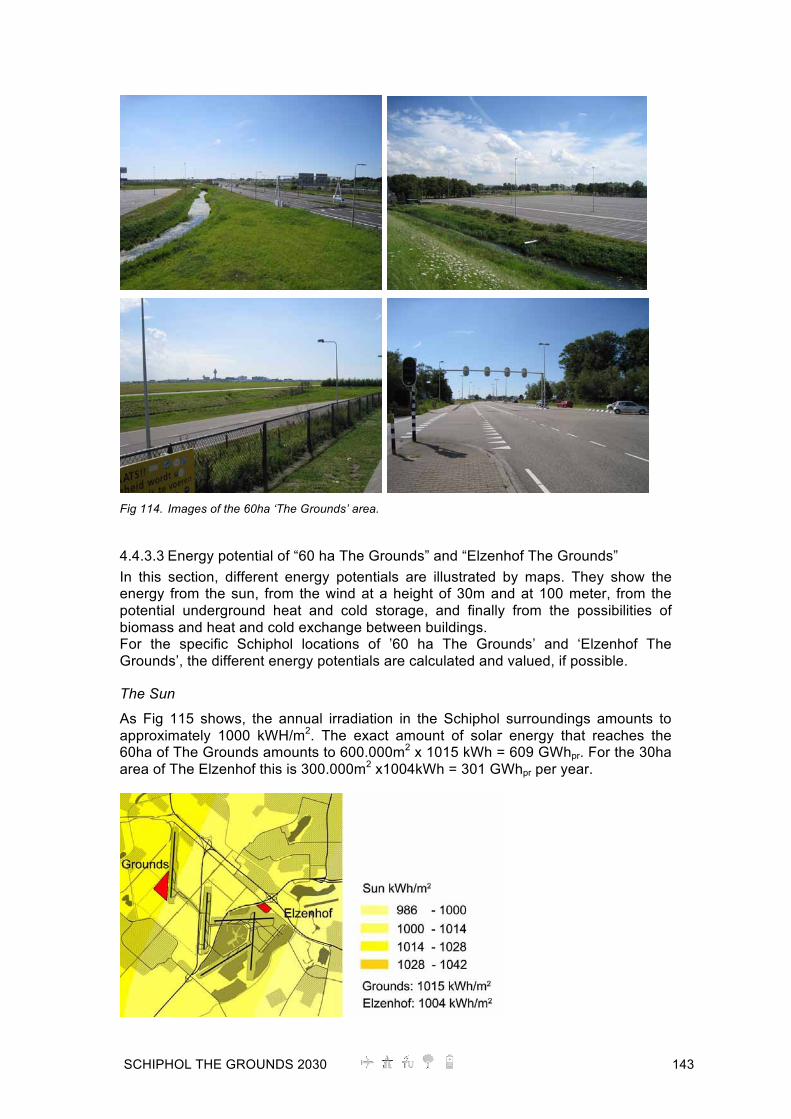
SCHIPHOL THE GROUNDS 2030 143
Fig 114. Images of the 60ha ‘The Grounds’ area.
4.4.3.3 Energy potential of “60 ha The Grounds” and “Elzenhof The Grounds” In this section, different energy potentials are illustrated by maps. They show the energy from the sun, from the wind at a height of 30m and at 100 meter, from the potential underground heat and cold storage, and finally from the possibilities of biomass and heat and cold exchange between buildings. For the specific Schiphol locations of ’60 ha The Grounds’ and ‘Elzenhof The Grounds’, the different energy potentials are calculated and valued, if possible. The Sun
As Fig 115 shows, the annual irradiation in the Schiphol surroundings amounts to approximately 1000 kWH/m2. The exact amount of solar energy that reaches the 60ha of The Grounds amounts to 600.000m2 x 1015 kWh = 609 GWhpr. For the 30ha area of The Elzenhof this is 300.000m2 x1004kWh = 301 GWhpr per year.

144 SCHIPHOL THE GROUNDS 2030
Fig 115. Energy potential map of the sun These are the amounts of primary energy that can be harvested to generate electricity by means of solar cells or heat collectors to generate heat. Potentials with respect to photovoltaic systems and heat collectors
Current systems with solar cells have average efficiencies of 6-15% for well-oriented panels, depending on the kind of solar cells that are used. These efficiencies are expected to increase significantly in the next two decennia. Heat collectors could thermodynamically have efficiencies of around 60%, though in practice they are around 30%, because the collected heat is not used immediately. When calculating solar irradiance, the tilt of the receiving surface is of significant influence on the energy yield. On flat roofs, photovoltaic modules will most often be put in arrays in the optimized tilted position towards the sun. To prevent arrays from shading each other and to prevent a certain distance between the arrays should be taken in account. This uncovered area is also used for maintenance. In Fig 116 this distance is shown schematically. Generally there will always be a slight mismatch by the lowest solar radiation. By choosing an adequate ground cover ratio (GCR), little mismatch will appear with a good coverage of the roof. In the figure on the right the influence of the GCR on the annual mismatch is shown.
Fig 116. Distance between PV arrays (left) and influence of the Ground Cover Ratio (right) [www.pv-monitoring.novem.nl] A ground cover ratio of 35% provides an acceptable mismatch of 3%. The ground cover ratio is defined by:
This GCR is taken into account for flat roofs in the calculation in Table 26 of solar yields on buildings. Table 26. Most important factors for calculating solar yields (Schiphol ‘Elzenhof The Grounds’).
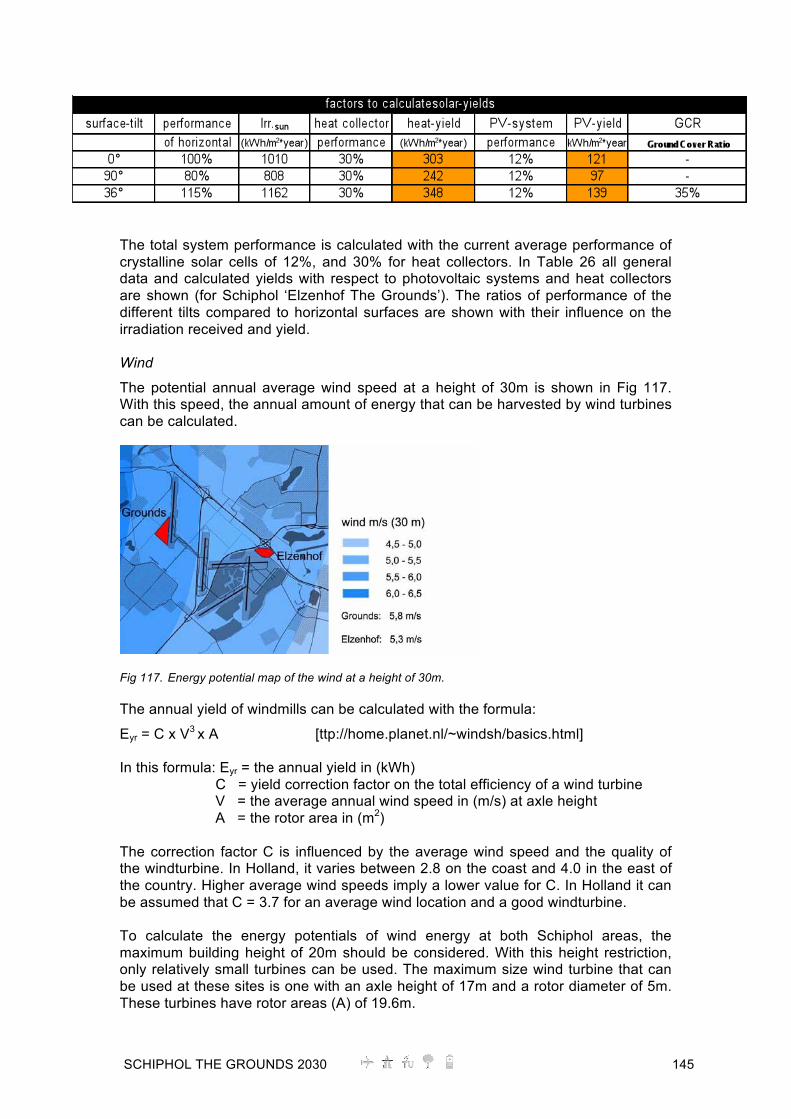
SCHIPHOL THE GROUNDS 2030 145
The total system performance is calculated with the current average performance of crystalline solar cells of 12%, and 30% for heat collectors. In Table 26 all general data and calculated yields with respect to photovoltaic systems and heat collectors are shown (for Schiphol ‘Elzenhof The Grounds’). The ratios of performance of the different tilts compared to horizontal surfaces are shown with their influence on the irradiation received and yield. Wind
The potential annual average wind speed at a height of 30m is shown in Fig 117. With this speed, the annual amount of energy that can be harvested by wind turbines can be calculated.
Fig 117. Energy potential map of the wind at a height of 30m. The annual yield of windmills can be calculated with the formula:
Eyr = C x V3 x A [ttp://home.planet.nl/~windsh/basics.html] In this formula: Eyr = the annual yield in (kWh) C = yield correction factor on the total efficiency of a wind turbine V = the average annual wind speed in (m/s) at axle height A = the rotor area in (m2) The correction factor C is influenced by the average wind speed and the quality of the windturbine. In Holland, it varies between 2.8 on the coast and 4.0 in the east of the country. Higher average wind speeds imply a lower value for C. In Holland it can be assumed that C = 3.7 for an average wind location and a good windturbine. To calculate the energy potentials of wind energy at both Schiphol areas, the maximum building height of 20m should be considered. With this height restriction, only relatively small turbines can be used. The maximum size wind turbine that can be used at these sites is one with an axle height of 17m and a rotor diameter of 5m. These turbines have rotor areas (A) of 19.6m.

146 SCHIPHOL THE GROUNDS 2030
The average wind speed at The Elzenhof site is 5.3 m/s at 30m and 7.3 m/s at 100m (Fig 118); this implies an average wind speed of 4.9 m/s at 17 meters high. The yield factor C is not particularly high at this height and location, and thus is assumed to be C = 3.0. With these figures, the calculated annual yield of electricity produced per wind turbine is 7000 kWh/year. A certain minimum distance between the different windturbines should be considered in order to have negligible disturbance between them. To calculate this, a minimum distance of 7 times the rotor diameter is used (rule of thumb). Thus, the distance at Schiphol should be 7 x 5m = 35m between turbines; the ground space per wind turbine would be: 35m x 35m = 1250 m2. The ‘Elzenhof The Grounds’ location has an area of 30 hectares; therefore this location could house 300.000m2 / 1250 m2 = 240 windturbines. The total energy potential of The Elzenhof would then be: 240x7000kWh = 1680 MWhe, or: 56 MWhe/hectare (5,6 kWh/m2), with the windmills on a grid of 35m (in both directions). The ‘60ha The Grounds’ area has a slightly higher average wind speed (5.5 m/s), which represents a significantly higher energy output per wind turbine, since this speed is calculated to the third power: 9700 kWh/turbine. With its 60 hectares, the ‘60ha The Grounds’ area has a wind energy potential of: 4656 MWhe, or: 78 MWhe/hectare (7,8 kWh/m2).
Fig 118. Energy potential map of the wind at a height of 100m. The potential annual average wind speed at a height of 100 meters is shown in Fig 118. However, this is less relevant for this location with the corresponding restrictions in building heights. Large wind turbines with an axle height of 100 meters and a rotor diameter of 50 meters should harvest 2.2 GWhe per wind turbine at the ‘60ha The Grounds’ area. Approximately five of these giant wind turbines could be placed here. At the ‘Elzenhof The Grounds’ area two or three of these turbines could be placed, generating a yield of 2.0 GWhe each. Geothermal energy
In Fig 119 the geothermal energy potentials are valued according to the suitability of exchanging heat. This map considers the shallow underground that could be connected with heat pumps to be part of a heating (or cooling) system of buildings (Fig 105).

SCHIPHOL THE GROUNDS 2030 147
Fig 119. Energy Potential Map of the suitability of heat exchange with the shallow underground The potentials of the deeper underground are illustrated in more in detail in Fig 106. They cannot be exactly defined for small locations such as the ‘60ha The Grounds’ and ‘Elzenhof The Grounds’ areas, but the figures illustrate the potentials of the region. Biomass Biomass is briefly mentioned here since the built environment has a relatively small biomass production. However, if all organic waste is collected and digested into biogas (methane) in an anaerobic fermentation plant (or digester), it can be converted into heat and electricity in a small Combined Heat and Power station (CHP). Not only is green energy produced locally, but energy is also saved at the decentralized (organic) waste treatment station. Organic waste from the built environment consists of human manure, green kitchen waste and, to some extent, solid biomass (wood, straw, etc.) from urban green areas. Apart from this, other organic waste from nearby farmers that grow crops could be collected and used in the digester as well. Another option when making use of the biomass in the built environment is to incorporate active production, such as in the form of algae growth in facades or rooftops. This biomass can be used either in the biogas digester or to generate biodiesel. Nowadays there are still few examples of this, especially incorporated in building elements. There is a much research (and discussion) on this option however, especially since improvements are expected in increasing algae growth potential. The use of algae production to capture CO2 is also an important focus here. Also important for both the ‘60ha The Grounds’ and ‘Elzenhof The Grounds’ locations is the existence of a CO2 pipeline. This OCAP line could have various extensions to the decentralized sanitation and reuse facilities in order to capture extra carbon dioxide in the system. Also, an extension could be carried out towards other important projects, such as to PrimAviera in order to provide the greenhouses with the valuable feed. What comes directly forth from the pipeline grid are a few locations where algae production could best be realized. These locations are enclosed by the most fertile surface water (e.g. near the Hoofdvaart), existing wastewater treatment plants (like near Badhoevedorp), and near the carbon dioxide OCAP pipeline, so that both essential resources for algae production (apart from sunlight) are present.

148 SCHIPHOL THE GROUNDS 2030
Fig 120. Potential locations in the Haarlemmermeer for Decentralized Sanitation and Reuse (DESAR) in relation to the existing OCAP pipeline and optional, i.e. necessary and/or potential extensions (Dekkers 2009). Heat-cold exchange within the built environment
In developing urban environments, already at an early stage, the future heat and cold demand can be calculated. Different functions with different demands can be connected in an energy system to fit simultaneous heat and cold demands. Exchanging heat and cold between buildings is only possible if different functions are located within small distances of each other.
4.4.3.4 Analysis of integration and spatial optimisation of car park at ’60 ha The Grounds’ and ‘Elzenhof The Grounds’ areas
Since the integration of electric mobility in Schiphol ‘The Grounds’ will involve large amounts of electric cars as well as conventional cars, it is important to closely analyze the integration and spatial optimization of car parking which has to be dealt with at both The Grounds areas. The main means for storing a large amount of cars in

SCHIPHOL THE GROUNDS 2030 149
relatively dense areas such as business parks is the use of parking garages or terrains. Parking garages and terrains form locations with high concentrations of cars. They are therefore also suitable for becoming a place in which the functions of car storage, electric charging and the production of renewable energy can be integrated. The vehicles can be plugged in and their batteries can be charged, or their capacity could even be used in times of peak demand (so-called ‘Vehicle-to-grid’ or ‘V2G’). In this case, the available surfaces on these generally large buildings or terrains can be used to produce electricity with renewable sources. In this section, explorative research has been carried out on the different typical ways of parking in parking garages and parking terrains, in order to facilitate comparison and get a feeling of the differences in space use, appearance and area available, to integrate production of renewable energy. Parking garages have been separated into traditional parking garages and automatic parking garages. For parking garages, a traditional parking garage with ramps and a ramped parking garage are compared, while the ‘lift and slide’ variant of automatic parking has been briefly investigated.
Traditional parking garages
In traditional parking garages (Fig 121), the car owner drives the car into the building and parks it in an available place. From there on, the driver finds their way walking out of the building. The car is collected by following the inverse process. ‘Roads’ lead through the building, sloped from floor to floor, with parking places next to them.
Fig 121. Some examples of conventional (mono-functional) parking garages (www.co.berks.pa.us) Automatic parking systems
Automatic parking is a new, yet existing and well-known form of parking in which automated mechanisms are integrated into the garages in order to store cars in a much more space efficient way. Car owners do not have to go to the actual parking place itself, so the height of each storey can be lowered and both routes to the parking places and the parking places themselves can be optimized for improved use of space. Automated car elevators and moving pallets distribute the cars in the garage and they need a minimum of spatial tolerance. The building constructions can be decreased due to smaller strains and, as a result, smaller spatial tolerances are needed. With automatic parking, the car is driven next to the entrance of the building on a car elevator or a pallet. After the passengers have left the car, it is automatically and electrically transported to a free parking

150 SCHIPHOL THE GROUNDS 2030
place. When the owner wishes to pick up his car, it is rapidly and automatically moved to the entrance. Automatic and traditional parking garages exist in different forms, sizes and means of automatic car transport. Fig 122 shows three examples of automatic parking garages. The lightweight constructions result in more ‘architectural freedom’ than more conventional ones, mostly in concrete materialized traditional garages.
Fig 122. Images of automatic parking garages (courtesy of www.crow.nl and www.yf-parking.com ) In the Japanese example shown in the lower part of Fig 122 some of the mechanical components of the shifting system are illustrated in greater detail. Fig 123 illustrates some other mechanisms used in automatic parking garages. The lower pictures concern small-sized isolated parking garages that consist entirely of distributing mechanisms (rotating system). These systems, called Smart Parking, are used a lot in Japan, where the price of space is high.
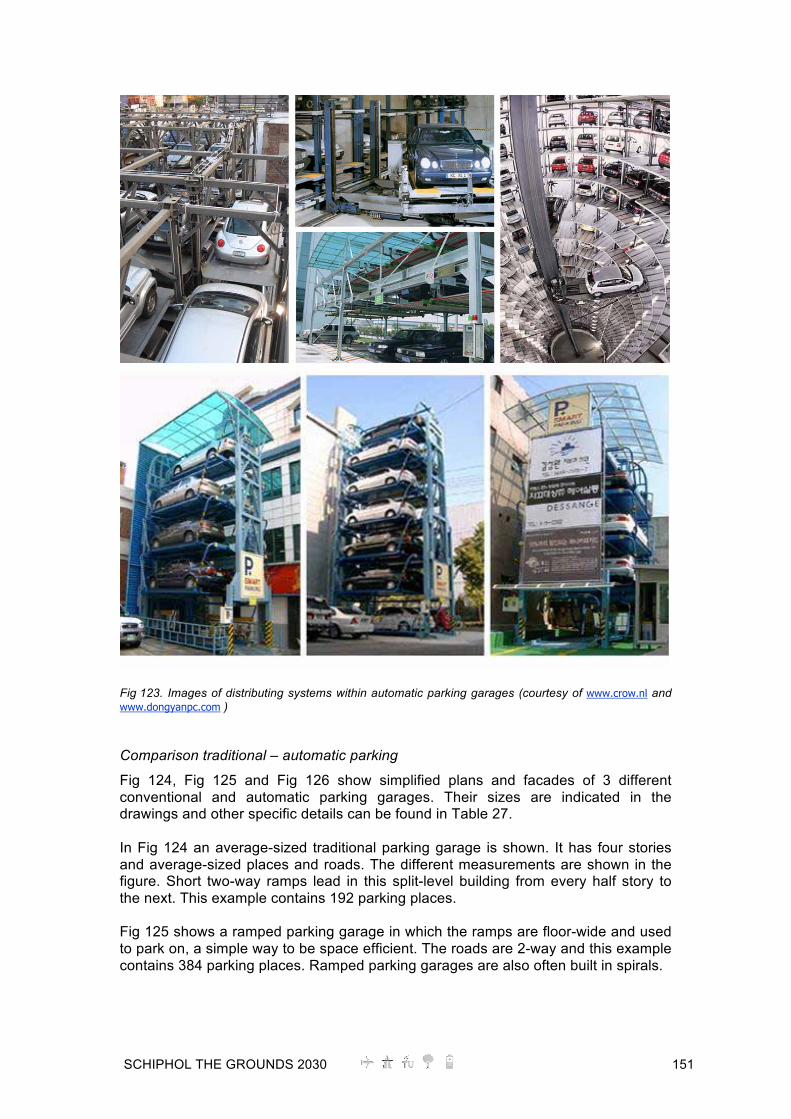
SCHIPHOL THE GROUNDS 2030 151
Fig 123. Images of distributing systems within automatic parking garages (courtesy of www.crow.nl and www.dongyanpc.com ) Comparison traditional – automatic parking
Fig 124, Fig 125 and Fig 126 show simplified plans and facades of 3 different conventional and automatic parking garages. Their sizes are indicated in the drawings and other specific details can be found in Table 27. In Fig 124 an average-sized traditional parking garage is shown. It has four stories and average-sized places and roads. The different measurements are shown in the figure. Short two-way ramps lead in this split-level building from every half story to the next. This example contains 192 parking places. Fig 125 shows a ramped parking garage in which the ramps are floor-wide and used to park on, a simple way to be space efficient. The roads are 2-way and this example contains 384 parking places. Ramped parking garages are also often built in spirals.

152 SCHIPHOL THE GROUNDS 2030
Fig 124. Typical plan and longitudinal/cross sections of a traditional parking garage with ramps.
Fig 125. Typical plan and longitudinal section of a traditional ramped parking garage.

SCHIPHOL THE GROUNDS 2030 153
Fig 126. Typical plan and longitudinal/cross sections of an automatic parking garage. Fig 126 shows drawings of an automatic parking garage similar to the upper left picture of Fig 122. Three car lifts can bring cars up to seven stories high, where they can be shifted one or two places horizontally. Car elevators can lift cars up to 20 stories or even higher. The ground floor has a normal height because it has to be suitable for people to enter. All higher levels only require the maximum height of the highest cars that the garage is suited for. In general, the height between constructions is approximately 1.75 meter and floor-to-floor height is 2.00 meter. In the following table the average total area (A) per parking place is calculated by dividing the total floor area by the total amount of parking places of the garage. The volume (Vol.) is calculated by dividing the building volume by the total amount of parking places. Table 27. Sizes and capacities of the parking garages in Fig 122, Fig 123 and Fig 124
It is evident that the building area per parking place of an automatic parking garage is significantly smaller than that of a traditional one. The total building volume can especially be much smaller: between 2 and 3 times smaller. Though traditional parking garages do not deal with the high costs for all mechanical (moving) parts of automatic parking garages, the cost of the building structure is much higher. CROW (national knowledge platform on infrastructure, traffic, transport and public space) carried out some calculation examples (CROW 2002) of the costs of both types of garages. These examples show that the prices per parking place can be even cheaper for automatic parking, since the differences in building structure are greater than the additional costs of the transport mechanisms.
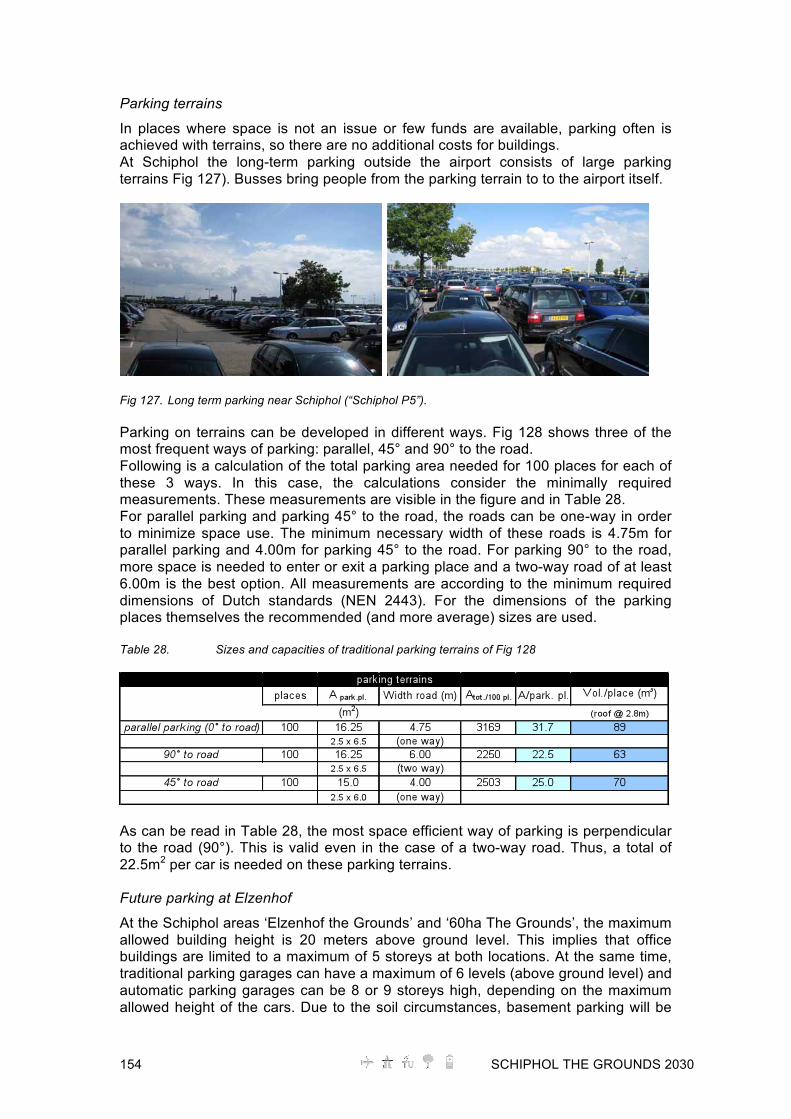
154 SCHIPHOL THE GROUNDS 2030
Parking terrains
In places where space is not an issue or few funds are available, parking often is achieved with terrains, so there are no additional costs for buildings. At Schiphol the long-term parking outside the airport consists of large parking terrains Fig 127). Busses bring people from the parking terrain to to the airport itself.
Fig 127. Long term parking near Schiphol (“Schiphol P5”). Parking on terrains can be developed in different ways. Fig 128 shows three of the most frequent ways of parking: parallel, 45° and 90° to the road. Following is a calculation of the total parking area needed for 100 places for each of these 3 ways. In this case, the calculations consider the minimally required measurements. These measurements are visible in the figure and in Table 28. For parallel parking and parking 45° to the road, the roads can be one-way in order to minimize space use. The minimum necessary width of these roads is 4.75m for parallel parking and 4.00m for parking 45° to the road. For parking 90° to the road, more space is needed to enter or exit a parking place and a two-way road of at least 6.00m is the best option. All measurements are according to the minimum required dimensions of Dutch standards (NEN 2443). For the dimensions of the parking places themselves the recommended (and more average) sizes are used. Table 28. Sizes and capacities of traditional parking terrains of Fig 128
As can be read in Table 28, the most space efficient way of parking is perpendicular to the road (90°). This is valid even in the case of a two-way road. Thus, a total of 22.5m2 per car is needed on these parking terrains. Future parking at Elzenhof
At the Schiphol areas ‘Elzenhof the Grounds’ and ‘60ha The Grounds’, the maximum allowed building height is 20 meters above ground level. This implies that office buildings are limited to a maximum of 5 storeys at both locations. At the same time, traditional parking garages can have a maximum of 6 levels (above ground level) and automatic parking garages can be 8 or 9 storeys high, depending on the maximum allowed height of the cars. Due to the soil circumstances, basement parking will be

SCHIPHOL THE GROUNDS 2030 155
possible, however only when the total surface is not too large. Table 29 contains some values for storey heights and maximum numbers of storeys above ground
level.

156 SCHIPHOL THE GROUNDS 2030
Fig 128. Three typical traditional parking terrain lay-outs for 100 parking places Table 29. Storey heights and maximum number of storeys possible for the ‘Elzenhof The Grounds’ and ‘60ha The Grounds’ area as a result of height restrictions.
Potential photovoltaic yields for the different built parking solutions
For the three typical parking garages illustrated in Fig 124, Fig 125 and Fig 126, the surfaces that are suitable for harvesting energy from the sun by photovoltaic systems have been determined. To do so, the roof area and the area of south-facing facade above the first floor have been measured. The south facade has only been counted for the buildings that have a large surface compared to the roof surface. This is only valid for the high and small automatic parking garage (assumed that this facade faces south). Fig 129 illustrates schematically where and in what manner the photovoltaic systems are positioned on the buildings.
Fig 129. Integration of PV cells in the three different parking garage alternatives shown in Fig 124 and Fig 126

SCHIPHOL THE GROUNDS 2030 157
To be able to predict and calculate the annual yields of the photovoltaic systems as dimensioned and illustrated in the previous figures, certain variables have to be determined. Calculations of the amounts of electricity produced by photovoltaic panels begin with the available sunshine at the location itself. After multiplying the incoming solar energy by the efficiency of the total solar system and by the available surface, the yield of the system can be determined. The energy potentials of the Haarlemmermeer and Schiphol area, the amount of annually available sunshine for ‘Schiphol Elzenhof The Grounds’ has been determined to be approximately 1010 kWh/m2. This is the amount of energy that reaches a horizontal surface. In general, solar cells are positioned or integrated into rooftops with an optimal orientation to the sun. For Schiphol, this is at a tilted angle of 36° and a deviation of 5° west with respect to the south. In this position, the yield of a square meter of solar panels is significantly higher. In Table 30 the general data on photovoltaics used to calculate yields at Schiphol is shown. The ratios of performance of the different tilts compared to horizontal surfaces are shown with their influence on the irradiation received and yield. Table 30. The most important factors for calculating photovoltaic yields (at the Schiphol ‘The Grounds’ areas)
In Table 31 all of the suitable areas for solar cells on the different parking buildings are calculated. Together with the data in Table 30 and Table 31, the total optimized yields can be calculated. These yields are shown in Table 32, concerning the total annual building yield per parking place. The average daily yield is shown in the rightmost column. Table 31. Suitable surfaces for solar cells on the parking garages (at Schiphol ‘The Grounds’ areas)
Table 32. Photovoltaic yields of the three different types of parking garages (at Schiphol ‘The Grounds’ areas)
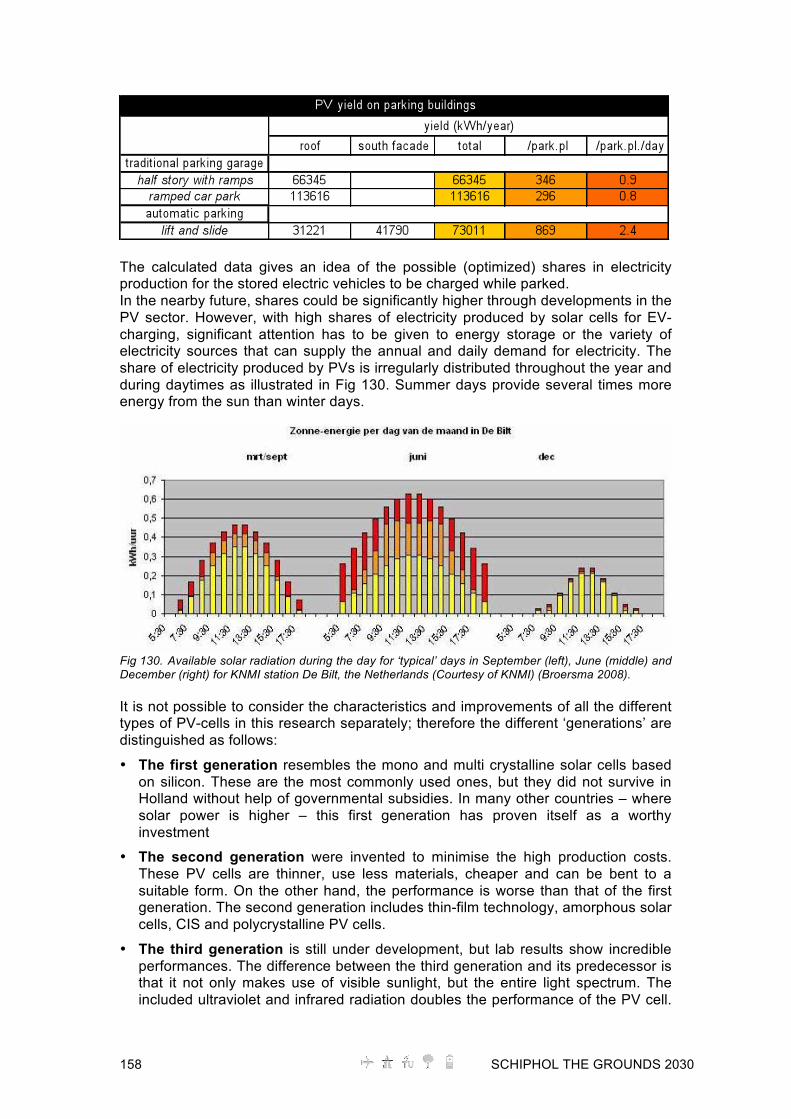
158 SCHIPHOL THE GROUNDS 2030
The calculated data gives an idea of the possible (optimized) shares in electricity production for the stored electric vehicles to be charged while parked. In the nearby future, shares could be significantly higher through developments in the PV sector. However, with high shares of electricity produced by solar cells for EV-charging, significant attention has to be given to energy storage or the variety of electricity sources that can supply the annual and daily demand for electricity. The share of electricity produced by PVs is irregularly distributed throughout the year and during daytimes as illustrated in Fig 130. Summer days provide several times more energy from the sun than winter days.
Fig 130. Available solar radiation during the day for ‘typical’ days in September (left), June (middle) and December (right) for KNMI station De Bilt, the Netherlands (Courtesy of KNMI) (Broersma 2008). It is not possible to consider the characteristics and improvements of all the different types of PV-cells in this research separately; therefore the different ‘generations’ are distinguished as follows:
• The first generation resembles the mono and multi crystalline solar cells based on silicon. These are the most commonly used ones, but they did not survive in Holland without help of governmental subsidies. In many other countries – where solar power is higher – this first generation has proven itself as a worthy investment
• The second generation were invented to minimise the high production costs. These PV cells are thinner, use less materials, cheaper and can be bent to a suitable form. On the other hand, the performance is worse than that of the first generation. The second generation includes thin-film technology, amorphous solar cells, CIS and polycrystalline PV cells.
• The third generation is still under development, but lab results show incredible performances. The difference between the third generation and its predecessor is that it not only makes use of visible sunlight, but the entire light spectrum. The included ultraviolet and infrared radiation doubles the performance of the PV cell.

SCHIPHOL THE GROUNDS 2030 159
Moreover, there is even a potential for higher performances in the future.
The performance of the three generations is shown in Fig 131and is given in percentages of transformed energy from light to electricity. Table 33 shows the expected performance improvements. The most interesting development is the enormous improvement potential of the third generation (which is taken as a starting point within further DIEMIGO research). It can theoretically reach the thermodynamic limit of 78%, although this probably never will be achieved.
Fig 131. The three generations of PV cells and their theoretical efficiencies and prices (Green 2006 ) It should be noted that the figure below only summarizes the potential of solar cells, however the second generation is still under improving performance and the third generation is not commercially available. Table 33. The technical performance summary of electricity generation with PV cells (Dekkers 2009) *1).
It is assumed here that the proven technologies will not improve much in efficiency (Green, 2006). Calculations are done with the average solar intensity in Haarlemmermeer (KNMI 2006)
(1) ‘Diffusion of Innovations’, (Rogers 1964) (2) ++= Very good, += Good, 0= Reasonable, -= Bad, ~= Unknown
The usage of PV cells on rooftops has no direct influence on the local ecosystem. They are passive systems that are applied with no harmful consequences, but also no positive effects on the ecosystem itself. The reduced carbon dioxide can be calculated from the performance, and compared to conventional methods for electricity production. Also, the emitted greenhouse gasses from the production of the PVs cell are embedded. Throughout the lifecycle, solar cells emit almost ten times as much carbon dioxide per kWh produced than wind turbines, between 19-59 grams CO2-eq per generated kWh (Jacobson 2008 ). This factor should not be neglected. Nevertheless, the system still reduces the global warming potential overall because electricity from coal-fired power plants emits 566 g CO2 per kWh

160 SCHIPHOL THE GROUNDS 2030
(Senternovem 2007). In Table 34 the Reduction in Global Warming Potential of different PV cell generations is shown (Senternovem 2007; Jacobson 2008 ) Table 34. The ecological feasibility summary of electricity generation with PV cells (Dekkers 2009).
(1) ++= Very good, += Good, 0= Reasonable, -= Bad, ~= Unknown
Photovoltaic technology is unfortunately one of the technologies that still does not compete with conventional means of electricity production in the Netherlands without subsidies. It is, however, predicted that there will be a breakpoint somewhere between 2015 and 2020 when the electricity prices from PVs and power plants will compete with each other due to rising oil prices (so-called ‘grid parity’). The economical feasibility of the three distinguished generations of PV is summarized in Table 35. Table 35. The ecological feasibility summary of electricity generation with PV cells (Dekkers 2009).
(1) (Jacobson 2008 ); (Green 2006 ) (2) ++= Very good, += Good, 0= Reasonable, -= Bad, ~= Unknown
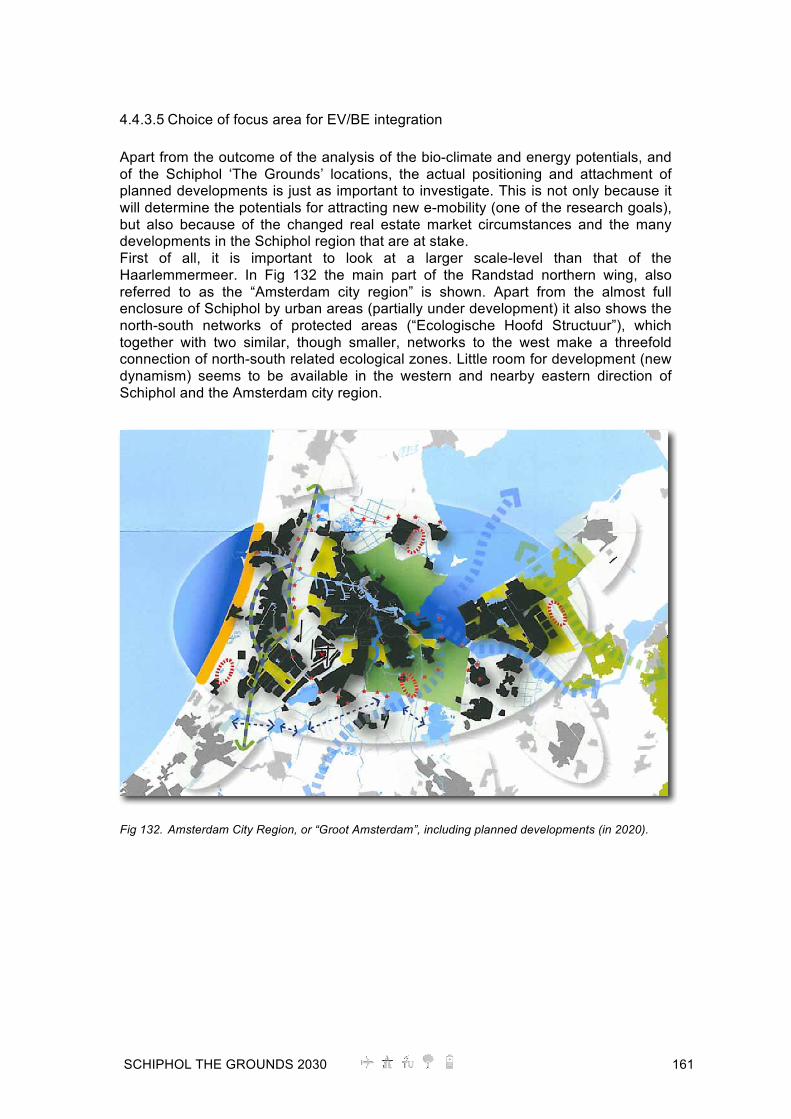
SCHIPHOL THE GROUNDS 2030 161
4.4.3.5 Choice of focus area for EV/BE integration Apart from the outcome of the analysis of the bio-climate and energy potentials, and of the Schiphol ‘The Grounds’ locations, the actual positioning and attachment of planned developments is just as important to investigate. This is not only because it will determine the potentials for attracting new e-mobility (one of the research goals), but also because of the changed real estate market circumstances and the many developments in the Schiphol region that are at stake. First of all, it is important to look at a larger scale-level than that of the Haarlemmermeer. In Fig 132 the main part of the Randstad northern wing, also referred to as the “Amsterdam city region” is shown. Apart from the almost full enclosure of Schiphol by urban areas (partially under development) it also shows the north-south networks of protected areas (“Ecologische Hoofd Structuur”), which together with two similar, though smaller, networks to the west make a threefold connection of north-south related ecological zones. Little room for development (new dynamism) seems to be available in the western and nearby eastern direction of Schiphol and the Amsterdam city region.
Fig 132. Amsterdam City Region, or “Groot Amsterdam”, including planned developments (in 2020).

162 SCHIPHOL THE GROUNDS 2030
Fig 133. Some images of the reference proposals for the ‘60ha The Grounds’ area (MultiCorporation 2009). After the realisation of the already planned developments, Amsterdam City Region’s new developments will mostly be located in a north-eastern direction, near Amsterdam’s neighbouring ‘co-city’ Almere. Other Randstad north-wing related developments will be situated more towards the north of Amersfoort and west of Utrecht. This means that the development of the ‘60ha The Grounds’ area will be relatively remotely situated in comparison to areas that will direct new economic development in the northern Randstad wing. Within the DIEMIGO trajectory, the main focus however was placed on the possibilities for attracting new forms of e-mobility and the possibility of connecting Schiphol’s so-called Airside (ground related) fleet to the development of an area in which, based on sustainable generation of energy, vehicles can be charged as well. The latter, due to the remote location of the ‘60ha The Grounds’ area, proved difficult from the start of the project. Besides this, yet another problem was encountered. Due to the many developments in the surrounding areas the landside approach of the site also resulted to be difficult. This was especially true if additional mobility, e.g. for the sake of ‘vehicle to grid’ inclusion, was needed. Fig 134 shows the planned landside connection of the ‘60ha The Grounds’ area to the surrounding road infrastructures. Interventions to prevent a traffic congestion due to further densification of the areas in the Haarlemmermeer are planned to take place at different levels. The ‘60ha The Grounds’ area will be connected to regional road infrastructures by broadening of the

SCHIPHOL THE GROUNDS 2030 163
existing polder road, which connects it to the N205. At a regional level, both the N205 and N207 are planned to be doubled along the busiest sections.
Fig 134. Road connections of the ‘60ha The Grounds’ area (MultiCorporation 2009). The ‘Bennebroekseweg’ (parallel to the N201 at southern side of Hoofddorp) will also be doubled and connected to the A4 highway and to the N206/N208. Nevertheless, problems are expected at the connections of both roads with the N201 and the A4 and A9 highways. Problems are especially expected at the connection with the N201. Therefore, the average driving time from any place in the polder or outside the polder to the Schiphol ‘60ha The Grounds’ area is not expected to be optimal. This also places additional pressure on the stated sustainable goals, even in the case of a presumed large ratio of e-vehicles related to this area. As for the other surrounding roads of the ‘60ha The Grounds’ area, these mostly consist of existing polder roads with a small profile. In the current regional and structural plans of the Haarlemmermeer Municipality, most of these roads will be dedicated to destination-

164 SCHIPHOL THE GROUNDS 2030
related traffic and recreational bicycle routes (Fig 135). Fig 135. Planned bicycle route layout south of the ‘60ha The Grounds’ area (OntwerpAtelier 2009). With regard to Public Transportation, the ‘60ha The Grounds’ area also is sub-optimally situated. At a distance, Bus 140 on a part of the N201 and the Zuid-Tangent connection Haarlem, Hoofddorp to Schiphol and Amstelveen (planned to be enlarged in northern direction towards IJmuiden as well) are available. Other public transportation connections will have to be dedicated to this site only, and will therefore be relatively sub-optimal as well.
Fig 136. Proposed development variants of the ‘Testing Grounds’ (left) and ‘Knowledge Grounds’ (right) (MultiCorporation 2009)
Fig 137. Proposed development variant ‘Green Grounds’ (MultiCorporation 2009), assessed as being the best variant.

SCHIPHOL THE GROUNDS 2030 165
The proposed thematic focus of the possible development roadmaps and related names of the area are: 1. Testing Grounds (Fig 136, left) 2. Knowledge Grounds (Fig 136, right.) 3. Green Grounds (Fig 137)
The three possible roadmaps respectively are attached to a connection to the direct surroundings (1 and 2) and to a more regional scale-level (3). Within the context of the recent development and the poor accessibility as stated above, the third proposed concept (Green Grounds) has been selected as the best option for the ‘60ha The Grounds’ area. However, as for the desired integration of innovative concepts for e-mobility by the Schiphol Group, this Grounds site does not appear to be the most promising. The following is a summary of the general assessment of the ‘60ha The Grounds’ area:
o Due to the remote location, the area can be an optimal site for testing new
concepts, (i.e. with incorporation of functions which will involve relative little employees per square meter) (+);
o Due to the connection (and latest plans) for recreation-based development and interconnections, the area can be an optimal site for attracting Haarlemmermeer polder or Schiphol oriented recreational functions based on slow individual transportation concepts (foot, bicycle, etc.) (+);
o The possible electrical surplus for the built environment can only be used locally, while the connection to the existing electrical infrastructure (still) is questionable (unclear) (+/-);
o A possible surplus for Airside mobility is poor due to large distances (-); o Inclusion of a ‘vehicle to grid’ option within the development plans will be difficult,
due to the poor accessibility and capacity problems of the connecting infrastructures (-);
o The ‘60ha The Grounds’ area can be developed successfully, however, even if the modal-split of employees (and visitors) would be 100% EV based, sustainability would still be a critical issue due to the poor capacity of the Landside connections (no additional EV mobility can be attracted other than small and/or recreational EVs). So, accessibility/interconnection to other developments should be included strategically (-).
Since ‘The Grounds’ approach is based on a thematic programme hypothesis, a shift could either be made in the programme, such as shifting towards an elaboration of the ‘60ha The Grounds’ area on the basis of ‘Green Grounds’ with less emphasis on larger forms of e-mobility, or in finding another location for the DIEMIGO focus, with improved feasibility for Schiphol and implementation as well. The latter was chosen, as one of the few alternatives available, Schiphol ‘Elzenhof The Grounds’ resulted to have potentials for all of the required goals, including accessibility and potentials for sustainable development.
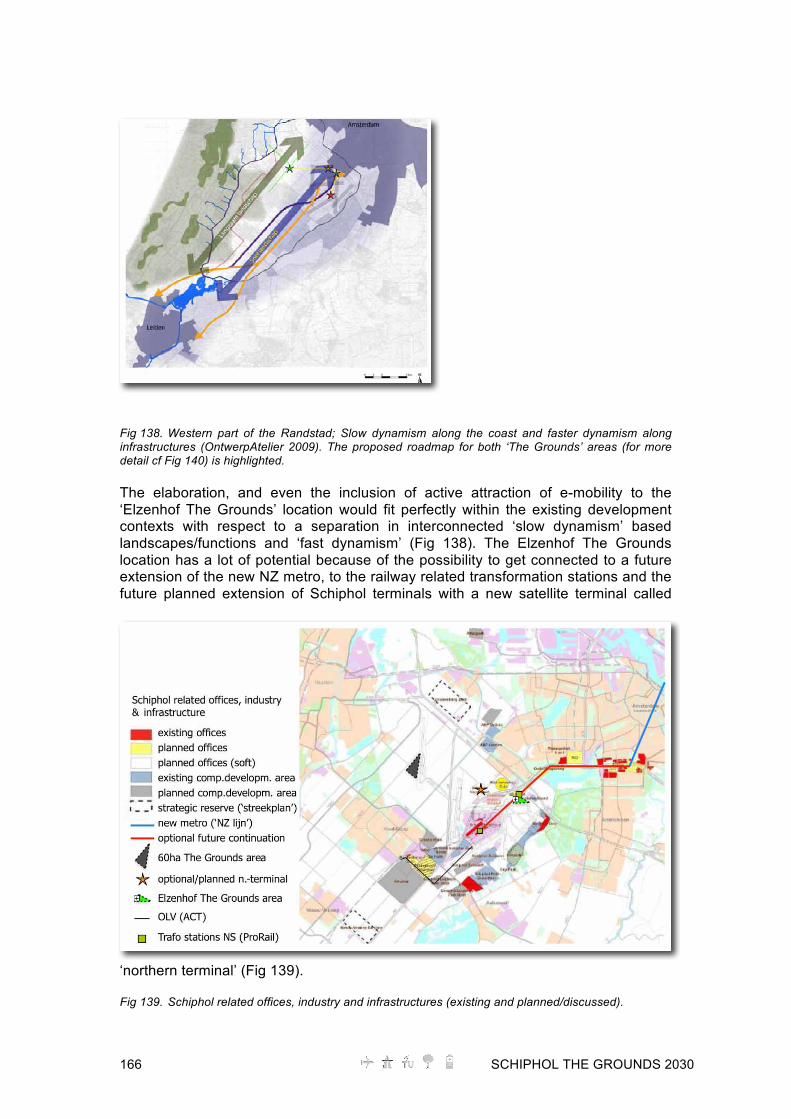
166 SCHIPHOL THE GROUNDS 2030
Fig 138. Western part of the Randstad; Slow dynamism along the coast and faster dynamism along infrastructures (OntwerpAtelier 2009). The proposed roadmap for both ‘The Grounds’ areas (for more detail cf Fig 140) is highlighted. The elaboration, and even the inclusion of active attraction of e-mobility to the ‘Elzenhof The Grounds’ location would fit perfectly within the existing development contexts with respect to a separation in interconnected ‘slow dynamism’ based landscapes/functions and ‘fast dynamism’ (Fig 138). The Elzenhof The Grounds location has a lot of potential because of the possibility to get connected to a future extension of the new NZ metro, to the railway related transformation stations and the future planned extension of Schiphol terminals with a new satellite terminal called
‘northern terminal’ (Fig 139). Fig 139. Schiphol related offices, industry and infrastructures (existing and planned/discussed).
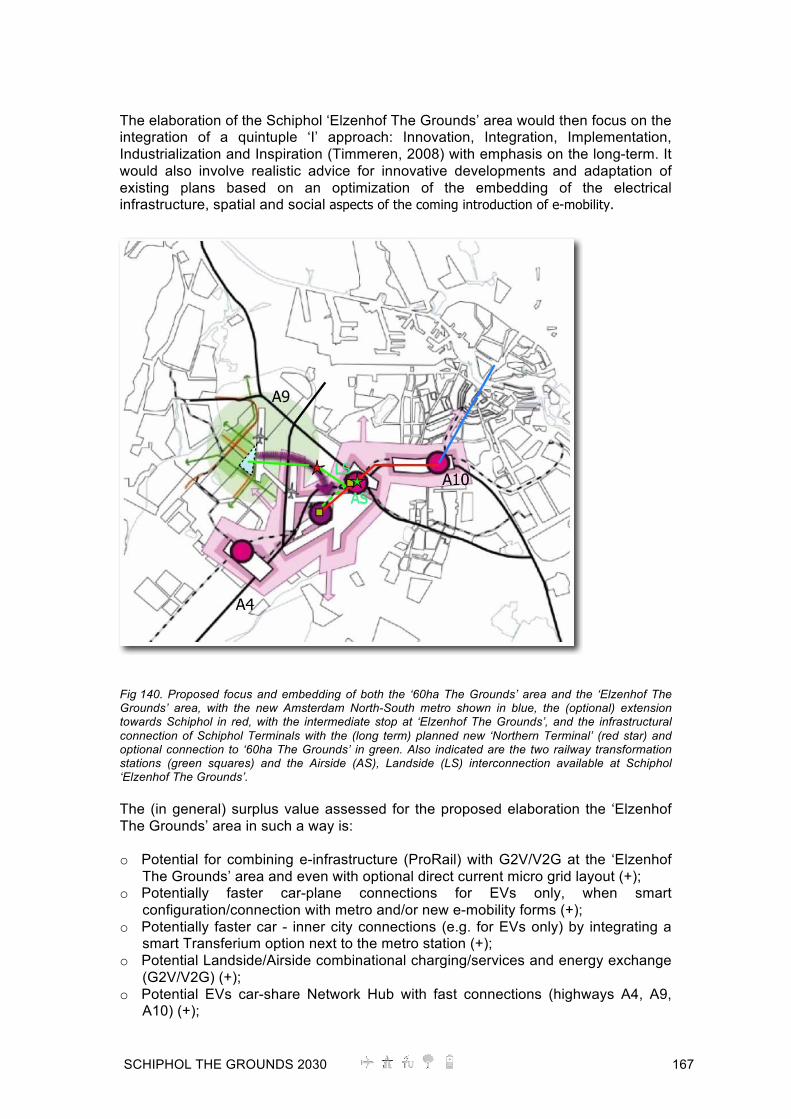
SCHIPHOL THE GROUNDS 2030 167
The elaboration of the Schiphol ‘Elzenhof The Grounds’ area would then focus on the integration of a quintuple ‘I’ approach: Innovation, Integration, Implementation, Industrialization and Inspiration (Timmeren, 2008) with emphasis on the long-term. It would also involve realistic advice for innovative developments and adaptation of existing plans based on an optimization of the embedding of the electrical infrastructure, spatial and social aspects of the coming introduction of e-mobility.
Fig 140. Proposed focus and embedding of both the ‘60ha The Grounds’ area and the ‘Elzenhof The Grounds’ area, with the new Amsterdam North-South metro shown in blue, the (optional) extension towards Schiphol in red, with the intermediate stop at ‘Elzenhof The Grounds’, and the infrastructural connection of Schiphol Terminals with the (long term) planned new ‘Northern Terminal’ (red star) and optional connection to ‘60ha The Grounds’ in green. Also indicated are the two railway transformation stations (green squares) and the Airside (AS), Landside (LS) interconnection available at Schiphol ‘Elzenhof The Grounds’. The (in general) surplus value assessed for the proposed elaboration the ‘Elzenhof The Grounds’ area in such a way is: o Potential for combining e-infrastructure (ProRail) with G2V/V2G at the ‘Elzenhof
The Grounds’ area and even with optional direct current micro grid layout (+); o Potentially faster car-plane connections for EVs only, when smart
configuration/connection with metro and/or new e-mobility forms (+); o Potentially faster car - inner city connections (e.g. for EVs only) by integrating a
smart Transferium option next to the metro station (+); o Potential Landside/Airside combinational charging/services and energy exchange
(G2V/V2G) (+); o Potential EVs car-share Network Hub with fast connections (highways A4, A9,
A10) (+);

168 SCHIPHOL THE GROUNDS 2030
o Potentially cheaper Schiphol - New northern Terminal connection, by means of smart configuration options and combined new e-mobility based connection (+);
o Potential integration of risk strategy energy management system as a basis for a resilient energy system (integrating EVs, renewable energy, development planning) (+/-);
o More complexity and possible interference with several existing developments (-). With respect to the ‘Elzenhof The Grounds’ area, the potentials for combining e-infrastructure (V2G), faster car-plane connections for EVs only, faster car-inner city connections (transferium), Landside/Airside combinational charging/services and energy exchange, EVs car-share Network Hub with fast connections and a possible inclusion of developments to come (Northern Terminal) make it an ideal location for the development and realization of a integrated renewable energy powered e-mobility hub for northwestern Europe.
4.4.4 Conclusion o Spatial planning and the planning of networks and mobility will have to be inspired
more by aspects of flexibility. o Pressure on changing infrastructures to adapt to the introduction of e-mobility,
along with the resulting grid- and BE consequences, results in an increasing pressure on aspects of “general or public interest”.
o The search for relatively simple “technical fixes” does not do anything for the
underlying causes of the problems to be solved and what is more, it has its own unexpected and unplanned side effects that may lead to further problems. This applies to most of the currently proposed and initiated interfaces and charging techniques for Electrical Vehicles (EVs) in the built environment.
o In addition to the issue of generation, high-quality fuels and electricity are used for
many tasks in which high-energy quality is unnecessary, wasteful and expensive. With the introduction of electricity-based mobility, both new possibilities and problems become visible.
o Both “external costs” and the inclusion of so-called “variabilization” of the costs
(and actual use of infrastructures) can better be incorporated into energy-based systems when they are attached to smaller scales of implementation.
o Increasing the consumers’ subjective dependence with respect to many essential
services in life, and electricity in general, requires a simplification of the processes, products and parties involved. Hence, a larger concentration on integral provision of services, or the supply and management of integral packages, offers possibilities.
o Infrastructure strongly correlates with production. A desired change in the
infrastructure, e.g. a bottleneck with respect to capacity, can be solved by adapting the “production” at strategic points of the (central) grid. Schiphol, as a large energy consumer with potential space for solutions and potentials such as huge concentrations of (e-)mobility, should take this as a lead for future

SCHIPHOL THE GROUNDS 2030 169
developments. o Schiphol is pivotal point for mobility in the Netherlands, and can take e-mobility as
an important opportunity for both its own fleet as well as for mobility streams towards Schiphol and (nearby) passing by mobility.
o Present-day design principles particularly emphasize the “extrinsic values”.
Schiphol can achieve a better tuning to site-specific conditions, sustainability and regenerativeness, when the design principles of the future developments place greater emphasis on the “intrinsic values”.
o Also important for Schiphol is including sustainability, via reliability, as an added
value at a relatively small cost, e.g. in the form of a decentralized (autonomous) utility and backup.
o Interesting options for Schiphol are a micro-grid for its electricity or a hybrid
electricity grid. o Haarlemmermeer transformed itself into an area with a fast-pace and significant
expansion. This will continue during the next decades and will generate both potential opportunities as well as problems for Schiphol-related developments. Two solutions are available: a strategy aimed at self-sufficiency or the full integration and adaption of future Schiphol developments to the other developments around Schiphol.
o As for site and climate based renewable energy potentials, due to the location
next to airside activities and the resulting height restrictions, the best option for both ‘The Grounds’ areas will be: the integration of solar energy for electricity and the use of the available waste heat; cascading principles and deep aquifers for storage to match the heat/cold supply; and sustainable demand within the system boundaries.
o Due to its remote location, the ‘60ha The Grounds’ area can be an optimal site for
testing new concepts, and the connection of recreation-based development and interconnections, as long as little new mobility for employees and visitors will be attracted (other than e-bikes and small EVs).
o With respect to the ‘Elzenhof The Grounds’ area, the potentials for combining e-
infrastructure (V2G), faster car-plane connections for EVs only, faster car-inner city connections (transferium), Landside/Airside combinational charging/services and energy exchange, EVs car-share Network Hub with fast connections and a possible inclusion of developments to come (Northern Terminal) make it an A-location for the development and realization of a sustainable integrated building integrated e-mobility hub for northwestern Europe.

170 SCHIPHOL THE GROUNDS 2030
4.5 Design scenarios ‘The Grounds 2030’
4.5.1 General background future development scenarios The urban developments in and around Schiphol, ‘Elzenhof The Grounds’ in particular, will be realized at a spread timescale throughout the coming decades. The planning – with the associated decisions on sustainability – does however find place on an early stage. For technological developments, a decade is a long time; products that are not economical attractive right now, might be competing within a few years. On top of that, the prices of conventional electricity generation and natural gas extraction are predicted to rise with a rapid pace due to scarcity, resulting in an increased economical feasibility on renewable energy sources. In order to give an insight in the feasibility of the proposed measures various scenarios will be used. For this research, the used scenarios are condensed to the predictions of technological performance, product price developments, energy pricing and climate change. The energy prices are of great importance in the majority of the proposed techniques in the following Chapters. The current energy price, for example, for normal users in Holland is around the € 0,08 per kWh without taxes and € 0,23 per kWh with taxing (Eneco, 2009). But history and all future models show that these prices will rise in the coming years. The causes for the change are among others the increasing coal and gas prices due to scarcity, the political problems in oil producing countries (geo-political instability), the probable inclusion of CO2 in the electricity price, the increase of the energy demand due to economical growth, the market behaviour of the producers and the production of renewable energy. Summarized, the energy prices are dependant on multiple variables related to society. In an attempt to analyze these developments, the Netherlands Bureau for Economic Policy Analysis (Centraal PlanBureau, CPB) formulated four probable scenarios. Each scenario resembles a shift in the current society towards a combination of a few characteristics. The different variables that cause changes in topics as energy pricing, affluence, purchasing power or political influences are dedicated to one of these scenarios. With these figures, various complex models can predict what the future fluctuations will be in the four scenarios for Europe.

SCHIPHOL THE GROUNDS 2030 171
Fig 141. The four future Scenarios for Europe and their main characteristic (CPB, 2005)
According to the Netherlands Bureau for Economic Policy Analysis, each of the future scenarios for Europe has an equal probability of occurring. The four scenarios and their main characteristics are shown in Fig 141. Strong Europe focuses on global public responsibilities for their society while the Global Economy is more founded on private parties. It is also possible that there will be an ending in the globalization trends and national sovereignty would prevail. The public controlled Regional Communities and the Transatlantic Market with private responsibilities are related to a more regional focused society. These scenarios will be used to predict the energy pricing in the Netherlands in the coming decades. The results will be used in the predictions of the future economic feasibility of the techniques discussed in the forthcoming Chapters. In Fig 142, the predicted prices of electricity and natural gas are shown according to the scenarios. Unfortunately, the calculations on the scenarios were based on the values of 2002. Currently, in 2009, the energy prices have changed dramatically, which undermined the accuracy of the scenarios. For this research, the results are still used for calculations, but with small modifications to the current energy price levels. Instead of taking 2002 as a starting point, 2009 is taken and gradually extended towards the future. The percents of rise in price levels fit in with the results that are predicted by the Netherlands Bureau for Economic Policy Analysis.
Fig 142. Electricity (above) and natural gas (below) pricing predictions in the Four Scenarios for Europe (without taxes). Updated with current prices (Jansen et al., 2006) Climate Change

172 SCHIPHOL THE GROUNDS 2030
The last model that is used for the future predictions is that of climate change. The Dutch meteorological institute, the KNMI (Koninklijk Nederlandse Meteorologisch Instituut) developed different climate scenarios for the Netherlands. Just as the scenarios mentioned earlier, they developed four different scenarios based on two characteristics. At first, there is a probability that the air circulation patterns change within the coming decades due to global climate change. The change in air circulation might have the effect that the weather in the Netherlands will shift from a maritime to a continental climate. According to the KNMI, this phenomenon has about 50% change of occurring. Second, it is known that the annual mean temperature will rise the coming decades. However, this can either be only 1 or more than 2 degrees. For the scenarios they take those two options as characteristics (cf Fig 143, Hurk et al., 2006).
Fig 143. The four climate scenarios for the Netherlands; G+, W+, G, W (Hurk et al., 2006)
In Fig 143 above, the climate scenarios are schematically shown. From the characteristics of the scenarios, weather conditions such as perception rate, sun hours, wind speeds, temperature and humidity can be predicted. For the following Chapters, the most important outcomes will be the changes of the incoming solar and wind potential. These differences in climate change might have a serious effect on the performance of various techniques (Fig 144). Wind turbines, for example, have 15% difference in efficiency from best case [W+] and worst case [W] scenario. This has a major effect in the payback time and the carbon reduction of the technology.
Fig 144. The potential for electricity production from wind energy (left) and solar energy (right) in the Netherlands in 2050 (Hurk et al., 2006)

SCHIPHOL THE GROUNDS 2030 173
At the same time the technology itself will also develop, in previous section the main starting points as for the technologies involved in Schiphol ‘Elzenhof The Grounds’ are explained. As for the Climate Change scenarios the W+ scenario will be leading; this means a calculated rise in temperature in 2030 of at least 1 degrees Celsius. Moreover to an increased wind potential in 2030 of approximately 6% (or 15% in generated electricity) and an increased sun potential in 2030 of 4,5%.
4.5.2 Plotting the scenarios The method section explains the approach used in plotting the scenarios(IEA 2003; Hopkins 2008; Vale and Vale 2009; Fahey and Randall c1998) and eventually scenario directions. The use of these methods is also extended to the creative phase in order to detail the scenarios.
4.5.2.1 Decision focus Not all scenarios address specific decisions. Scenarios are also a learning tool for investigating general areas of risk and opportunity. Even exploratory scenarios must build around a relevant question to have focus and internal consistency. In this case, the boundary conditions and requirements give decision focus. As such, the decision focus can be explained with the following four statements:
i. The development is a stepping stone for ‘sustainable Schiphol’ or ‘C02 neutral Schiphol by 2040’
ii. The Infrastructure integration with buildings is expected to be innovative and well supported with the latest developments
iii. Good balance between practicality and the implementation plan in time iv. Potential demonstrable elements of the scenario in a short time
4.5.2.2 List of driving forces Driving forces are the most significant elements in the external environment. The forces are categorised into social, technological, economic, environmental and political areas. The second step is to find key forces that are inevitable or predetermined. These are the trends that are already evident and are unlikely to vary significantly in any of the scenarios. The last step in defining key forces is most likely to define or significantly change the nature of the direction of the scenario. Here it is necessary to analyze two directions: How uncertain we are about the net effect of a force? How important is the outcome to the project?
4.5.2.3 Approach The basic approaches to creating scenarios are inductive and deductive ways.
i. Inductive approach
a. Significant events future: Identification of significant future events or plot elements, and development of a larger story around them.
b. The Official future: This may be the future that the decision makers really
believe will occur! Could be also part of a significant events future!
ii. Deductive approach: Prioritize the long list of key factors and driving trends in order to find the two most critical uncertainties.

174 SCHIPHOL THE GROUNDS 2030
The deductive approach is used to create the scenario plots. The choice is made in order to make the scenarios as realistic as possible and to also make use of the uncertainties and latest developments.
4.5.2.4 The scenario tools 1) The scenario matrix: A 2X2 scenario matrix with the two most critical trends or
uncertainties. 2) Embellishing the scenario plot: The driving forces should be used to compose the
scenario plots, while the most important/uncertain forces shape the logics that distinguish and drive these scenarios
3) Amplifying the scenario a) Systems and patterns systems thinking (the systems iceberg model) b) Building narratives: two ways to create the narrative are to use a news paper
clip from the future or to creating character, such as Obama or Al Gore. c) Typical plots: To be effective, plots must make people rethink their
assumptions! Most of the times, frightening and implausible scenarios are discounted, which is not good for the outcome! Plots should also be made for the fall of technologies and twists and turns of the political systems.
Fig 145. The systems iceberg model
4.5.3 Mental maps of the future The mental maps of the future are also an important tool in creating and detailing the scenarios. The starting point is also creating the decision focus and it consists of a six step process. The steps are as follows
i. Identify and analyze the organizational issues that will provide the decision focus.
ii. Specify the key decision factors. iii. Identify and analyze the key environmental forces. iv. Establish the scenario logics. v. Select and elaborate the scenarios. vi. Interpret the scenarios for their decision implications.
Events
Patterns
Structure
Systems • Visible
manifestations • Trends and
combinations • Casual
relationships
Scenarios • The story • Sequences and
form • Driving forces • Scenario logic

SCHIPHOL THE GROUNDS 2030 175
4.5.4 Key factors The factors which would be influential for stimulating Electric Vehicle implementation and growth in the future are derived in this section with the help of the following three steps:
- Deriving the driving forces - Identifying the predetermined forces - Significant forces with the potential to change the course or direction
4.5.4.1 Driving Forces The boundary conditions for the defining driving forces are as follows:
- The question, what forces will affect and stimulate electric mobility introduction at Schiphol and the Netherlands in general?
- Social, technological, economic, environmental and political forces are taken as five categories.
- Only positive and direct forces are considered. In other words, ‘Bio fuels developments might negate the EV development’, are not considered.
- Only mobility is considered in creating scenarios, i.e., electric mobility.
Fig 146. Driving forces for Electric mobility introduction at Schiphol The method applied at this moment is a group brainstorm with four people. The first listed elements are the ongoing developments and effects of present system. The second step is to list the stimulants per category. Then it is interesting to see how this ‘list of driving forces’ holds when compared with the official document (Aaanpak elektrisch rijden1) published recently in the next phase.
1 Website www.ez.nl search ‘Licht op groen voor elektrisch rijden’ http://www.ez.nl/Actueel/Pers_en_nieuwsberichten/Persberichten_2009/Juli_2009/Licht_op_groen_voor_elektrisch_rijden
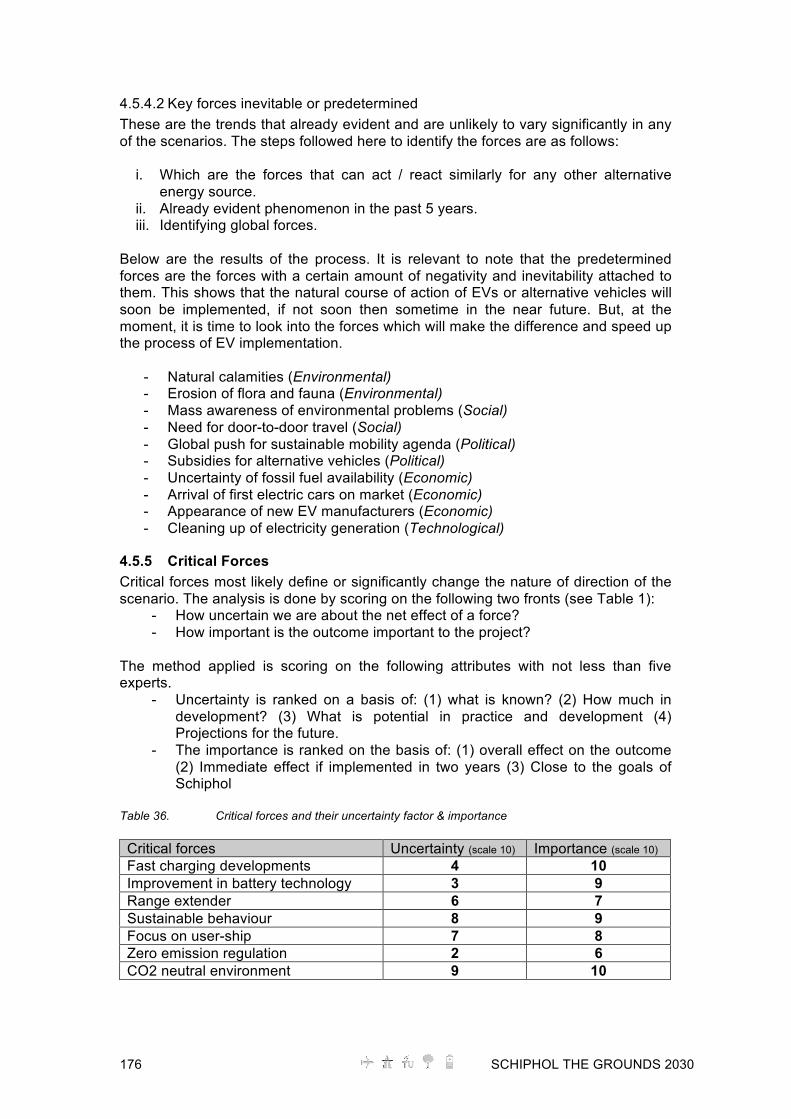
176 SCHIPHOL THE GROUNDS 2030
4.5.4.2 Key forces inevitable or predetermined These are the trends that already evident and are unlikely to vary significantly in any of the scenarios. The steps followed here to identify the forces are as follows:
i. Which are the forces that can act / react similarly for any other alternative energy source.
ii. Already evident phenomenon in the past 5 years. iii. Identifying global forces.
Below are the results of the process. It is relevant to note that the predetermined forces are the forces with a certain amount of negativity and inevitability attached to them. This shows that the natural course of action of EVs or alternative vehicles will soon be implemented, if not soon then sometime in the near future. But, at the moment, it is time to look into the forces which will make the difference and speed up the process of EV implementation.
- Natural calamities (Environmental) - Erosion of flora and fauna (Environmental) - Mass awareness of environmental problems (Social) - Need for door-to-door travel (Social) - Global push for sustainable mobility agenda (Political) - Subsidies for alternative vehicles (Political) - Uncertainty of fossil fuel availability (Economic) - Arrival of first electric cars on market (Economic) - Appearance of new EV manufacturers (Economic) - Cleaning up of electricity generation (Technological)
4.5.5 Critical Forces Critical forces most likely define or significantly change the nature of direction of the scenario. The analysis is done by scoring on the following two fronts (see Table 1):
- How uncertain we are about the net effect of a force? - How important is the outcome important to the project?
The method applied is scoring on the following attributes with not less than five experts.
- Uncertainty is ranked on a basis of: (1) what is known? (2) How much in development? (3) What is potential in practice and development (4) Projections for the future.
- The importance is ranked on the basis of: (1) overall effect on the outcome (2) Immediate effect if implemented in two years (3) Close to the goals of Schiphol
Table 36. Critical forces and their uncertainty factor & importance Critical forces Uncertainty (scale 10) Importance (scale 10) Fast charging developments 4 10 Improvement in battery technology 3 9 Range extender 6 7 Sustainable behaviour 8 9 Focus on user-ship 7 8 Zero emission regulation 2 6 CO2 neutral environment 9 10

SCHIPHOL THE GROUNDS 2030 177
4.5.6 Driving Forces
4.5.6.1 Fast charging developments Developments with respect to fast charging will greatly affect the mobility pattern associated with electric vehicles. The charging speed dictates the amount of time required to recharge a vehicle battery. Slow charging requires that users only travel to destinations that are within their vehicle’s action radius. Should the vehicle battery be too low for the return trip, then the user must wait 6-8 hours while the battery recharges. Semi-fast charging mitigates this problem to some extent, as the battery charging time is reduced to just a couple of hours. With fast charging, there is no longer a need to restrict journey length based on the action radius. The trend toward fast charging will have a number of affects on EVs and EV culture both now and in the future. Currently, many potential EV drivers are hesitant to invest in an EV because they are concerned that their personal mobility might be limited by the vehicle’s finite action radius (BERR and DfT 2008). The development of a comprehensive infrastructure for vehicle charging will alleviate this concern. However, such a “comprehensive infrastructure” must also provide a solution for urgent charging needs. The deployment of EVs in the coming years will be strongly contingent on the user’s perception of the mobility that these new vehicles offer. Contemporary dependence on the internal combustion engine sets a high standard for electric vehicles, which many believe should offer the same “anywhere, anytime” convenience. Opportunities for high-speed charging protocols are limited by a number of factors, including the cost, the risk of battery failure battery, and the capacity of the regional and local electricity grid networks. While these factors may be overcome with future generations of batteries, battery charging devices, and electricity grid networks, it is unlikely that fast charging will ever become an activity that is affordable enough to perform on a daily basis. Thus, it will remain a luxury activity. Fast charging as a luxury activity may be utilized by the general public in “emergency” situations. However, the primary market for this technology is likely to remain the elite, whose time is valued by a different metric. Market segmentation (both in terms of vehicle and charging cost) is positive, as it enables the generation of unique products that meet the needs of specific consumer groups. Increasing segmentation in the electric vehicle market in the coming decades will help the market to mature and become vibrant and diverse.
4.5.6.2 Improvements in battery technology Battery technology is both one of the most important driving forces and one of the most certain. The development of affordable, high energy density batteries has been crucial to the reintroduction of electric vehicles, which have been largely neglected since the early 20th century. Nonetheless, many will argue that contemporary batteries have not yet achieved the affordability and energy storage capabilities necessary to support a widespread implementation of electric mobility. Continued improvements in this field will therefore aid the deployment of electric and plug-in hybrid vehicles. A rapid transition to electric mobility will require the implementation of electric vehicle infrastructures that support the capabilities of contemporary vehicle batteries. In the past, anticipated advancements in battery technology have deferred the development of comprehensive charging infrastructures. Yet the prevalence of electric vehicles in

178 SCHIPHOL THE GROUNDS 2030
the coming decade will depend on our ability to implement infrastructures that support worst-case battery range statistics. The durability and safety of vehicle batteries will also have a large impact on the rate of the transition to electric mobility. Accounts of combusting batteries and chemical fires have left a scar in the minds of consumers. To achieve consumer acceptance, the safety of vehicle batteries must be guaranteed. Furthermore, batteries are by far the most expensive component of an electric vehicle, which means that the battery should not be the first thing to be defective on a vehicle. It has been suggested that the risk associated with purchasing a vehicle battery may be mitigated by allowing drivers to loan the battery rather than purchase it. This is a particularly pertinent solution should a battery swapping system be implemented. The developments toward safe, reliable, and durable batteries will accelerate the penetration of electric vehicles. In the coming decades, electric vehicles may be optimized for specific driving conditions. For instance, some vehicles may be designed to maximize vehicle range, while others will maximize peak power. This requires the optimization of various vehicle batteries (or vehicle battery technologies) for strong performance in a number of specific situations. If battery optimization enables the diversification of vehicle typology, then electric vehicles may replace internal combustion vehicles for most applications. The last ten years have seen an increasing focus on lithium-ion battery technology and it is expected that lithium-ion batteries will prevail in next generation vehicles (Vyas, Ng et al. 1997). The recent emergence of lithium-iron phosphate, lithium-air, and nickel-lithium chemistries suggests that lithium is here to stay. Yet lithium is widely recognized as an environmentally detrimental material. An issue that will be of increasing significance in coming years is the environmental impact of batteries; battery manufacturing and end-of-life conditions will have a large influence on the degree to which electric mobility can become a sustainable form of transportation. An inability to manufacture and dispose of vehicle batteries responsibly may signal the end of electric mobility. This is true for lithium batteries, as well as other battery chemistries.
4.5.6.3 Range Extender The range of an electric vehicle is somewhat limited when compared to the range of a standard combustion engine vehicle. However, it is also true that for the 5.3 million Dutch that commute by car to work each day, the average house-work commute is just 17 kilometres2. Yet cars are also heavily relied upon for errands, excursions, visits, and vacations. Many consumers are therefore hesitant to invest in a vehicle that may not be able to take them from Leeuwarden to Maastricht in one go. A range extender is any onboard energy source that can power an electric vehicle should the battery be depleted. Among other range extenders are extra batteries, a fuel cells, and bio-ethanol fuel tanks. In the case of the latter, an additional engine is necessary to convert the energy stored in the bio-ethanol fuel to mechanical work. Many contemporary plug-in hybrids, such as the Toyota plug-in Prius, utilize conventional fuels and an internal combustion engine to compensate for restricted all-electric range. Plug-in hybrids with internal combustion engines are largely viewed as a transition technology, which will enable the electric vehicle to emerge on the market in spite of the energy storage capacity shortcomings, high manufacturing costs, and moderate 2 CBS Statline.
SCHIPHOL THE GROUNDS 2030 179
reliability that plague the contemporary battery industry. Many vehicle manufacturers are therefore looking to low-sulphur internal-combustion engines in combination with smaller, more affordable batteries. These types of hybrids will likely dominate the electric mobility market in the immediate future, as mass production of all-electric vehicles is not expected before 2014, at the earliest (BERR and DfT 2008). The continued development of range extenders is a definitive driving force for EVs. The integration of range extenders may greatly accelerate the transition to electric mobility in many of the markets that are less readily suitable for battery powered vehicles. The flat landscape and short distances between cities make the Netherlands appropriate for the immediate implementation of electric mobility. However, in the US, where distances are greater and the terrain is often hilly, range extenders may be a necessary step in the electric mobility revolution. Additionally, range extenders may help the EV industry overcome shortcomings in the infrastructural network. Range extender technology may become less prevalent with significant advances in battery technology. With improvements in the energy density, cost, and reliability of batteries, there is a chance that the off-the-shelf electric vehicles will travel as far as today’s internal combustion engine vehicles (battery technology references: expected range by 2025). In a world in which electric vehicles are standard, range extenders may be utilized for niche vehicles, such as for extending the range of goods transport vehicles.
4.5.6.4 Sustainable Behaviour Over the last decade, sustainability is an issue that has gained considerable attention in the media and in the marketplace, as well as in our everyday lives. While a precise definition of sustainability is vehemently contested, an apt description of sustainable behaviour can be broadly articulated: sustainable behaviour may include minimizing energy use, using resources efficiently (and restricting the use of those resources that are non-renewable), mitigating carbon emissions, nurturing ecologic diversity, and fostering social sustainability by creating healthy environments for living and working. With respect to mobility, sustainable behaviour is a stark and certain driving force, whose relevance is likely to escalate in coming decades. In the field of mobility, sustainable behaviour pivots on the efficient use of energy to perform the journeys mandated by everyday life. The “efficient use of energy” implies the minimization of travel-related carbon emissions, as harvesting energy from conventional energy sources is directly linked to the release of carbon dioxide into the atmosphere. Biking and walking are good examples of sustainable transit behaviour. Over longer distances, sustainable travellers may utilize public transit or opt to carpool, perhaps in a vehicle that makes use of a low-impact fuel, such as electricity generated from renewable sources. We are waking up to the reality that fossil resources are limited. Moreover, the urgent need to combat global warming is eminent. Our ability to conserve fossil fuels and mitigate the causes of global warming will, in many ways, define the transition to sustainable transport behaviour. The coming decade will see a dramatic shift in commuter activities as many strive to reduce their personal impact. Voluntary changes in behaviour will undoubtedly be reinforced by policies such as the kilometerheffing, which will penalize gratuitous reliance on personal vehicles, and the continued subsidization of public transit, which currently helps thousands of commuters get to work each day.

180 SCHIPHOL THE GROUNDS 2030
If we are to overcome our profligate use or misuse of resources, future generations must embrace sustainable behaviour in their work, leisure, and travel. New forms of personal, shared, and public mobility will likely emerge. However, the largest change that will result from the trend towards sustainable behaviour will be the way in which we consider our mobility options. Individuals will be increasingly aware of the direct impact of their decisions on the world around them. This will enable the market to adjust itself to a situation in which transport costs truly reflect the resources employed to get from point A to point B.
4.5.6.5 Usership Recent years have seen a dramatic increase in the amount of services that operate on a usership model. These services enable consumers to share physical products at a lower cost and thereby provide access to items that these consumers may have otherwise gone without. A strong example of product sharing is timesharing, which facilitates partial ownership of vacation homes, bringing the vacation home market to the middle class. Product sharing services are closely related to a broader phenomenon that is gaining momentum around the world: community-based products and services. This includes things like flexible offices spaces, home exchange programs, and online communities for auctioning, buying, and selling goods. Moreover, many individuals are involved in online social networking communities to (in part) fulfil their requisite for social interaction. The accelerated growth of social networking tools and product sharing services is indicative of the budding market for vehicle sharing programs. It is likely that such programs will become increasingly prevalent in the coming decades. Both paratransit and public transit are archaic yet highly functional examples of transportation usership; an individual may purchase the right to occupy a seat in a vehicle to get from point A to pint B. The idea of vehicle sharing takes this concept one step further. The cost of purchasing, maintaining, and storing a vehicle can be limiting for consumers looking to maintain the flexibility to use a variety of transport services. Thus, the replacement of ownership with usership is highly attractive to potential drivers that would like access to a vehicle for intermittent journeys. Recently, several vehicle usership programs have emerged around the world. In the Netherlands, the dominant vehicle sharing services is GreenWheels. Product sharing services have also been suggested as an economic and practical way to overcome the consumer tendency to purchase a vehicle that caters to “what if” scenarios rather than daily transportation needs. Should consumers have on-demand access to a larger vehicle with a greater range, then there would be no need to invest in such a vehicle for everyday purposes. This is particularly relevant to electric vehicles, which are well suited for shorter distances and lighter loads.
4.5.6.6 Zero emission Particulate pollution can lead to serious health concerns in dense urban areas. Internal combustion vehicles are a notable source of particulate pollution in cities, where crowded motorways and congested roads dissect the built environment. In recent years, the Netherlands has put considerable effort into reducing the risk of pollution-related health concerns by lowering the speed limit along highways that skirt residential areas and tightening vehicle efficiency and emissions standards. Legislation currently prohibits the construction of public buildings on sites adjacent to major roadways. Following the publication of RIVM research findings indicating that 2300-3500 deaths occur each year in the Netherlands as a result of prolonged exposure to excessive particulate pollution, the no-build radius was increased from 100 m to 300 m along motorways (Calis and Frouke 2009). A 50 m no-build radius holds for provincial roads.

SCHIPHOL THE GROUNDS 2030 181
The issues that surround particulate pollution form a sure driving force for electric mobility. However, so long as these issues are combated with reactive, rather than proactive legislation, electric mobility many not receive the impulse that it otherwise could. The long-term solution to particulate pollution is not to specify which areas of our city are “liveable” and which are not, but to cap emissions at their source. Regulation will play a key role in driving vehicle emissions standards down. It is likely that future policies will limit permissible emission levels in urban areas in order to increase the quality of life and decrease pollution-related health concerns in at-risk locations. In the long term, it is likely that “no tolerance” zones will emerge.
4.5.6.7 CO2 Neutral Legitimate concern about climate change has generated a new marketplace for buying and selling: emissions trading. Emissions trading incentivizes the reduction of pollutants by creating a market for the sales of emissions credits among companies that exceed their emissions limits and those that fall short of them. The result is that the contaminators must pay (or purchase credits in compensation) for their “misbehaviour”. Future economies may be largely grounded in carbon trading in addition to monetary exchange. Trading is of particular significance for carbon dioxide emission, as the purchase of carbon credits is one of the key ways in which countries can meet the CO2 emission limits set by the Kyoto protocol. Thus, the need for commercial organizations to bargain on the carbon market place has increasingly pertinence. While relatively uncertain, this driving force will be highly influential in the future of electric mobility. The success of carbon trading schemes will dictate the economic feasibility of many projects in the mobility, energy, and industry sectors, as these sectors are often carbon dioxide intensive. Projects that may have otherwise been infeasible may become economically practicable through carbon trading schemes. The success of a carbon natural economic system may therefore bolster alternative mobility implementation programs and renewable energy infrastructures.

182 SCHIPHOL THE GROUNDS 2030
4.5.7 Selected scenarios
4.5.7.1 As good as it gets
Fig 147. Traits of scenario ‘As good as it gets’ This scenario depicts a utopian future characterized by economic prosperity and conscientious consumerism. Such a future just might be “as good as it gets”. The scenario is based on the variables3 ‘bulging economy’ and ‘sustainable behaviour’. The confluence of these two variables fosters an economy that is fuelled by innovation and a society in which work and leisure are well balanced. The result is the formation of well organized and tight-knit communities that enable individuals to flourish. Core user profiles:
Successful, independent, highly educated professionals working in knowledge or service industries: KLM’s junior management staff; young, talented individuals just setting out on their career path.
A wide cross section of the population.
Role of Schiphol Schiphol owns and maintains a community EV system. Users can subscribe to this community for commuting, business, and leisure transport. Schiphol develops these niche EVs in collaboration with other vehicle companies. Schiphol has a strong base of electric mobility-oriented infrastructure. Schiphol can house several concepts and niche EVs in order to fulfil the needs of sustainability-driven individuals. 3 This scenario is combination of following: 1) Hero car; 2) Stay at home; 3) Singing of birds; 4) Plug at work and 5) Ladies in town (See in Appendix 1 for a detailed description of early scenario work)
Sustainable behaviour fuelled with
Individualism
Still connected
Better mix of work and leisure (Many working from home)
User ship
Economic growth
Environmental consciousness
How much green is green?
Personal and community benefits
Consumerism with a conscience
Innovation Economy
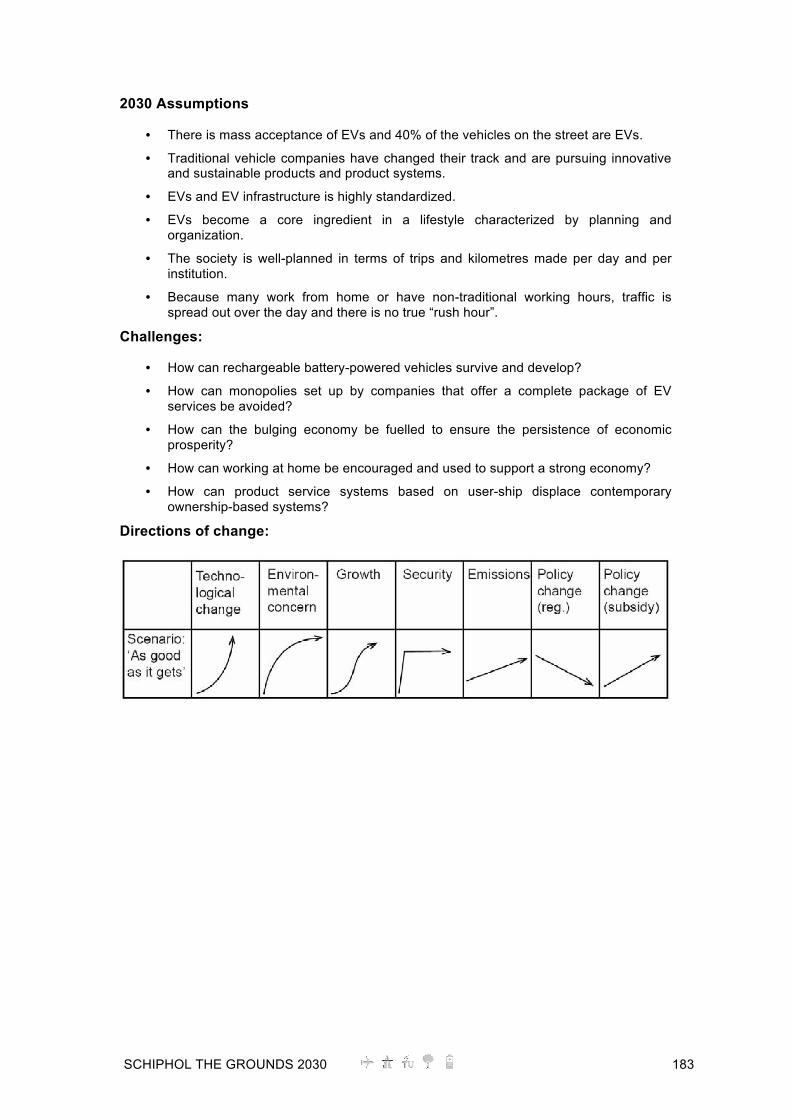
SCHIPHOL THE GROUNDS 2030 183
2030 Assumptions
• There is mass acceptance of EVs and 40% of the vehicles on the street are EVs.
• Traditional vehicle companies have changed their track and are pursuing innovative and sustainable products and product systems.
• EVs and EV infrastructure is highly standardized.
• EVs become a core ingredient in a lifestyle characterized by planning and organization.
• The society is well-planned in terms of trips and kilometres made per day and per institution.
• Because many work from home or have non-traditional working hours, traffic is spread out over the day and there is no true “rush hour”.
Challenges:
• How can rechargeable battery-powered vehicles survive and develop?
• How can monopolies set up by companies that offer a complete package of EV services be avoided?
• How can the bulging economy be fuelled to ensure the persistence of economic prosperity?
• How can working at home be encouraged and used to support a strong economy?
• How can product service systems based on user-ship displace contemporary ownership-based systems?
Directions of change:

184 SCHIPHOL THE GROUNDS 2030
Solutions of the Interface
• Service-oriented autonomous vehicles.
• Companies provide products and services as a complete package.
• Individuals enjoy a variety of transport options which can be personalized to meet their daily needs.
Effect on the built environment:
• Flexible, modern offices
• Buildings are oriented toward practicality rather than prestige.
Policy interventions:
• Governmental organizations are early adapters.
4.5.7.2 Time to eat the dog
Fig 148. Traits of scenario ‘Time to eat the dog’ This scenario contradicts the growth-based systems that are characteristic of the western world. It is based on the variables4 ‘sustainable behaviour’ and ‘unstable economy’. The scenario envisions a world in which economic insecurity is handled by means of efficiency and tight regulation. The name, which refers to a book on sustainable living, reflects the need to espouse environmental accountability and to adapt modern lifestyles to cope with the reality of resource limitation. Core user profiles
People who work at Schiphol and commute by car or public transit: The Delta Airlines stewardess based in Schiphol, who lives in Haarlem and commutes to work in accordance with her variable work schedule.
4 This scenario is combination of following: 1) Making lemons in to lemonade! and 2) time to eat the dog! (See in Appendix 2 for a detailed description of early scenario work)
Communities and Synergies
Unstable growth
Focus on Long-term value
Very careful consumption
Focus on practicality!
Focus on efficiency
SCHIPHOL THE GROUNDS 2030 185
People who store their vehicle at Schiphol and use the airport as a hub: The investment banker, who carpools with his wife to Schiphol each morning in their EV and then uses public transit to get to work in the Zuidas.
Role of Schiphol Schiphol has an adequate base of electric mobility-oriented infrastructure. Schiphol optimizes the use of different energy sources and utilizes unique mobility concepts and niche EVs in order to achieve energy efficient and CO2 neutral economy. 2030 assumptions
• Less investment into infrastructure.
• Europe has managed to allocate sufficient funding towards development of renewable energy production. This enabled the EU to meet its 20-2020 energy goals. In the year 2030, 25% of energy in the Netherlands comes from renewable sources.
• Only the modifications needed to preserve energy grid functionality have received funding. Large increases in local grid capacity necessary to support high rates of energy transfer have been (indefinitely) postponed.
• Fossil fuels have become incredibly expensive and are frowned upon by the general public, who value sustainable and economic mobility solutions.
• Many individuals choose to use small EVs such as bikes and scooters. Larger EVs are often utilized for carpooling and organized excursions.
Challenges
• How can new transport technologies be promoted and implemented in the absence of market drivers?
• How can long-term value be maximized while maintaining flexibility and reducing investment costs?
Directions of Change
Solutions of Interface:
• Apparatuses perform multiple functions and are less site-specific within the context of Schiphol.
• Users receive feedback regarding the environmental impact of personal activities.
• Travel to Schiphol’s vehicle hub via small, personal transport and perhaps further by carpool in a larger vehicle.

186 SCHIPHOL THE GROUNDS 2030
Affect on built environment:
• Compact areas with layered functions.
• Infrastructures require minimal investment and are often modular, flexible, and reusable.
• Buildings are oriented toward practicality rather than prestige.
4.5.7.3 Footprints on the water
Fig 149. Traits of scenario ‘Footprints on the water’ This scenario is based on the variables5 ‘decentralized resources’, ‘sustainable behaviour’, ‘vehicle usership’, and ‘range extended EVs’. The name, “Footprints on the Water”, refers to the principles of ecology and carbon footprints. A self-sufficient, sustainable society is one that treads with undetectable footprints - as undetectable as footprints on water. The realization of a zero-impact society would be a miraculous change of events in the tumultuous relationship between man and nature. Core user profiles
People who work at Schiphol and commute by car or public transit: The manager of Green Solutions B.V., who has recently chosen to relocate the company to one of Schiphol’s many office locations.
Airline passengers that park their vehicles at Schiphol and fly: The industrial ecology professor from The University of Leiden, who passes through Schiphol when travelling to and from international conferences.
Role of Schiphol
5 This scenario is combination of following: 1) Remote vehicle communities; 2) Distributed economies; and 3) Zero-impact solution (See in Appendix 3 for a detailed description of early scenario work)
Self-sufficient communities Localized (energy)
production and resource management
Zero-impact lifestyles
Customized solutions
Strong Logistics Focus on
communication
Networks for exchanging resources
Focus on integration

SCHIPHOL THE GROUNDS 2030 187
Schiphol is a key node in the emergent network of self-sufficient micro-societies. The airport itself has an identity as a zero-impact community, and interacts with other such communities via local, international, and virtual networks. The amenities on and around the airport form a platform for the exchange of resources (including human capital). Schiphol has a unique identity as being more than just an airport, but is an active participant in the development of a new sustainable lifestyle. Schiphol supports responsible business and transit activities for those whose work or recreation brings them to the airport. 2030 assumptions
• Western society is able to overcome its fascination with individualism and independence and embrace shared-possessions and usership programs.
• It is possible for communities to achieve zero-impact status by exchanging resources directly without being hampered by the constraints of national utilities infrastructures.
• Shelter, energy, and mobility can be provided as a package to individuals within distinct sustainable communities.
• Electricity is the primary vehicle “fuel”. However, most vehicles are equipped with range extenders. Fuel for various types of range extenders can be generated locally and is available to vehicle drivers.
Challenges
• How can a logistical system for the exchange of resources be organized without mandating the use of national utilities infrastructures?
• How can different types of vehicles that run on different types of fuels and are operated users with differing schedules is integrated into one vehicle exchange hub?
• How can local communities and virtual communities be integrated in a single resource management network?
Directions of change
Solutions of interface
• Interfaces allow users to manage carpooling and vehicle usage schedules.
• Vehicle usage network is automatically updated in accordance with traffic and delays.
Effect on the built environment
• Schiphol is a critical node in the resource exchange network.
• Traffic for the airport and for the transit hub is completely intermixed.
• Vehicle exchange facilities are located as close as possible to other transit facilities.
• Vehicle servicing and recharging/refuelling takes place at the transit hub.
• Physical and virtual logistics networks are seamlessly integrated.
• Parking is reinterpreted to accommodate vehicle charging.

188 SCHIPHOL THE GROUNDS 2030
Policy interventions Resources (such as energy and water) may be directly exchanged between communities.
4.5.7.4 Generation Eco-Geek
Fig 150. Traits of scenario ‘Generation Eco-Geek’ This scenario describes a world in which rapid technologic development and minimalistic design principles play a key role. The scenario is based on the variables6, ‘sustainable behaviour’, ‘technologic development’, ‘CO2 neutral economy’, and ‘vehicle usership’. The name alludes to the convention of identifying distinct generations and articulating to their social and cultural significance. Generation ‘Eco-Geek’ marks a change in consumer behaviour: consumers exhibit a clear preference for value-based products and attention to detail. These Eco-Geeks have a long-term perspective manifested in their interest in education and innovation. Core user profiles:
Schiphol’s Airside vehicle management:
Air France-KLM’s logistical coordinator, who is responsible for all of the airline’s airside vehicles at Schiphol.
Airline passengers that park their vehicles at Schiphol and fly:
The clean-shaven businessman, who catches KLM’s 07:10 flight to Stockholm twice weekly.
Role of Schiphol
6 This scenario is combination of following: 1) Age of the eco-nerds; and 2) Two-pieces and Minis (See in Appendix 4 for a detailed description of early scenario work)
Attention to detail
Long-term orientation
Minimalism
Smart application of appropriate technologies
Value-based products Focus on collaboration
Confidence
Focus on education and transfer of knowledge

SCHIPHOL THE GROUNDS 2030 189
Schiphol is a showroom for modern technological advancements. The airport operates like a well-oiled machine; it is highly automated, easily navigated, and always up to date with real-time travel information on planes, trains, and ground transportation. Efficient use of space and the elimination of extraneous systems and/or processes have reduced the demand for expansion, allowing the airport to remain compact and streamlined. Schiphol harbours several thriving business parks. The companies located in these business parks tend to be characterized as erudite, future oriented, and collaborative. Flexible office environments allow these companies to create ideal work environments. 2030 assumptions
• Products and infrastructures are modular and multi-functional and can therefore be utilized in a variety of manners.
• There has been a significant increase in automation in the transit sector. Many products can intelligently interact upon contact as well as remotely.
• There is universal access to education and the average member of society is highly tech-savvy.
Challenges
• How can technology be adjusted to support products characterized by the expression, “less is more”?
• How can consumption take place in a society that values simplicity and minimalism?
• How local identities preserved and culture-specific needs are met a minimalistic and high-tech world?
• How can production remain efficient and obsolete technologies avoided when technological development moves at a very rapid pace?
Directions of Change:
Solutions of Interface:
• Products encourage users to think while using them.
• Simple, highly compatible interfaces that can be used all over the world.
• Vehicles charge automatically without user initiation.
• Versatile hardware can be easily adapted to software.
Effect on the built environment:
• Naked streets.
• Flexible, multi-use buildings and infrastructures.
• Unmanned vehicles utilize spaces unsuitable for humans.
Policy interventions:
• Minimalistic regulation encourages smart decision making.
190 SCHIPHOL THE GROUNDS 2030
5 Concepts
5.1 Mobility/functional concepts
5.1.1 EV schiPOOL System Main elements 1. Schiphol manages and maintains an EV carpooling system. 2. The routes, as well as the EVs are customized for schiPOOLing purposes. Functionalities (new) 1. The schiPOOL system is a simple way to organize carpooling for:
a. People who commute to Schiphol from other locations inside or outside the Randstad.
b. People who commute via Schiphol to other locations in the Amsterdam area.
Built environment 1. schiPOOL ‘drop-off’ points enable schiPOOL drivers to drop off their passengers
right at their destinations. These ‘drop-off’ facilities are located at every business park on Schiphol property and at a number of selected ‘drop-off’ points.
2. Dedicated schiPOOL parking spots, equipped with charging infrastructure, are located through the Schiphol campus.
EV function 1. The EVs used in the schiPOOL system are designed for carpooling and facilitate
typical commuting-related rituals. 2. Each EV can be customized by the schiPOOL group using the vehicle for the
duration of the ‘lease’ period (the period in which that group uses that vehicle for commuting purposes, see ‘Role of Schiphol’).
Interfaces 1. Unique interfaces enable commuters that travel to Schiphol or elsewhere in the
Amsterdam area to: a. Get in touch with each other. b. Organize schiPOOL groups. c. Plan schiPOOL routes.
Role of Schiphol 1. Schiphol provides EV carpooling facilities and organizes and maintains the
carpooling system: a. The EVs in the schiPOOL system are owned by Schiphol. Schiphol
provides parking/charging facilities. b. Individuals can subscribe to the schiPOOL system. These individuals may
then become part of a schiPOOL group. A schiPOOL group is one carload of people who travel together as a carpool.
c. A schiPOOL group can request a vehicle, which the group will use for a predetermined period of time.
2. EVs are provided to schiPOOL groups under a ‘lease’ construction. This enables for longer use of an EV by a schiPOOL group.

SCHIPHOL THE GROUNDS 2030 191
5.1.2 Do Anything Box Main elements: • The Do Anything Box is a small, modular infrastructure that can be placed
anywhere. • The infrastructure is composed of a base unit and several modules, or functional
units, each with a different functionality. • The core unit consists of an electrical connection and the structural frame to
support the attachment of functional units. • At each location, a set of functional units can be combined with a base unit to
produce an infrastructural element that performs a specific set of functions (determined by the individual functional units included).
Functionalities: 1. The basic functionality of the Do Anything Box is to provide the electrical current
necessary to recharge EVs and other electronic devices. (Note: the devices must be equipped with their own transformer.) This functionality is provided by specific functional units that support charging at various currents (i.e. 230 V, 380 V etc.)
2. The Do Anything Box may include functional units that support ticketing activities such as those used for:
a. Parking b. Public transport c. Airport check-in
3. The Do Anything Box may also include functional units that provide information, such as:
a. Public transit schedules b. Flight departure and arrival information c. Maps and other tourist information
4. The specific functional units may be added to the core unit if they are useful/required based on the location of the unit.
Built environment 1. The core unit is placed at all key locations. These locations may be landside or
airside, inside or outside. 2. The functional units attached to each base unit depend on the locational context. EV function 1. Any type of EV can use the Do Anything Box to recharge. Interfaces 1. There is one standard interface for charging, ticketing, and information retrieval activities. This interface may itself be a functional unit (for example a touch-screen module). Role of Schiphol 1. The Do Anything Box is specific and unique to Schiphol. 2. The Do Anything Box is one, simple piece of infrastructure that facilitates several
of the activities that employees and travelers may need to perform at Schiphol. 3. This infrastructure serves the needs of the 80,000+ people who work on Schiphol
property, as well as the airline and public transit passengers who travel through Schiphol.
4. The infrastructure must have a standard design, that can be integrated into any location at Schiphol.
192 SCHIPHOL THE GROUNDS 2030
5.1.3 Energy Card Main elements 1. The Energy Card is used to monitor and control the energy consumption of an
individual or group. 2. The Energy Card provides access to a communal EV and public transport
network (by monitoring kilometers traveled). 3. The system incentivizes reductions in energy usage. Functionalities (new) 1. The Energy Card provides access to electricity amenities, such as outlets, EV
charging facilities, climate control, etc. 2. The Energy Card enforces a quota based on pre-defined limits on electricity use
for each car holder. For example, the Boss might have more energy credit on his card than an intern.
3. The card can be used to monitor and plan personal energy consumption activities.
Built environment 1. All electrical amenities throughout the built environment have the capability of:
a. Identifying all users b. Monitoring energy consumption by the users
EV function 1. The Energy Card system provides transport opportunities via communal EVs and
public transport connections. 2. Communal EVs can be accessed with an Energy Card. The card keeps track of
the kilometers driven, and subtracts these kilometers from the cardholder’s energy budget.
3. Public transit is extension of the communal EV system and works on the same principle.
Interfaces 1. The Energy Card is used to access to EV and public transit. 2. EVs are charged whenever they are parked on Schiphol property. Role of Schiphol 1. The system provides a tool for Schiphol to increase transparency and
communication regarding energy use at on Schiphol property. 2. The Energy Card will help to reduce energy use and will likely result in positive
PR for Schiphol. 3. The Energy Card can be distributed by means of the employers/groups that have
facilities located on the Schiphol property. These employers/groups can provide their employees/members with cards.
4. The Energy Card individuals who work on Schiphol property to interact with energy consuming amenities, including mobility systems. Energy consumption is monitored and budgeted.
5. Schiphol may be the starting point for the Energy Card system. Later, the system could be extended to the surrounding Randstad areas or throughout the Netherlands.
5.1.4 Compact and Stacked Main elements
SCHIPHOL THE GROUNDS 2030 193
1. The core idea Compact and Stacked is to ‘close the loop’ in the cycle of production, usage, and discharge.
2. Compact and Stacked creates an link among the waste generated by daily activities and the products/services used for other daily activities.
3. In this system, the responsibility is in the hands of the end-users. Functionalities (new) 1. Compact and Stacked includes mechanisms to convert waste to energy, fuel, or
other inputs for products/services. 2. The system provides feedback to end-users in order to help these users take
responsibility for the products/services they use and the waste they produce each day.
Built environment 1. Vehicle parking/charging facilities are integrated into offices by means of vertical
layering. 2. Renewable energy generation is connected to parking/charging facilities for EVs. 3. These parking/charging facilities are also connected to waste streams. 4. These parking/charging facilities include Vehicle-to-Grid infrastructure. EV function 1. All vehicles are ultra-light and highly practical. 2. The vehicles are equipped with range extenders, which are fueled by waste
streams. 3. EVs are designed to be communal vehicles supplied by an employer/group for
use by their employees/members. Range extended EVs are calibrated to the needs of their users and are equipped to process the type of waste their users tend to generate.
4. All vehicles are equipped for Vehicle-to-Grid interaction. Interfaces 1. Interfaces enable end-users to play an active role in the conversion of waste to
energy/fuel/inputs for other activities. 2. Interfaces also enable employers/groups to engage in planning activities in order
to better fit their daily activities in ‘the loop’. Role of Schiphol 1. Schiphol can shorten the production and consumption cycle, thereby becoming
more efficient and less wasteful. 2. Schiphol may become a role model for the ‘close the loop’ mentality. 3. To do this, Schiphol must provide advanced Compact and Stacked office spaces
with integrated EV facilities. 4. Schiphol has the opportunity to play several roles. Schiphol can:
a. Learn by demonstration. b. Lead by example. c. Propagate by communication.
5.1.5 Modular Society Main elements 1. The Modular Society utilizes a communal, standard element as the basis of a
mobility system. This communal element is a wheel, equipped with an electromotor and battery.

194 SCHIPHOL THE GROUNDS 2030
2. Vehicles are owned by individuals. However, these vehicles lack an electromotor, battery and one of their wheels. Therefore, a standard wheel must be attached to the private vehicle in order to make it run.
Functionalities (new) 1. There are a plethora of niche vehicles, which are small, compact, and meet the
specific needs of their owners. 2. The standard wheel fits all of the different niche vehicle typologies. 3. The wheels (which contain the batteries for the vehicles) may or may not be
attached to the EV during charging: a. Wheels can be charged at wheel docking stations. b. Wheels can be charged while attached to the EVs at other locations.
4. Wheel docking stations provide wheel swapping services. This enables instant ‘refueling’ for vehicles with depleted batteries.
Built environment 1. Communal docking stations are located at a high density throughout the Schiphol
property. 2. There docking stations charge wheels in a compact manner. 3. Parking facilities enable wheels to be charged while attached to the vehicles.
EV function 1. All EVs are compatible with the communal wheels. 2. Users purchase and own their niche vehicle of choice and then subscribe to the
communal wheel system. 3. Onboard energy monitoring systems help users to plan charging/swapping
activities. Interfaces 1. The docking ports provide automated wheel swapping. 2. Parking/charging facilities are provided for all vehicle typologies. Role of Schiphol 1. Schiphol may act as a pilot for a the large-scale implementation of the Modular
Society. This mobility system will eventually be implemented at a larger national or international scale.
2. Schiphol must work to coordination service providers for the communal wheels, docking stations, and charging infrastructure. Schiphol must coordinate:
a. Niche vehicle distribution. b. Parking and charging stations. c. Wheel docking stations. d. Safety and maintenance check-ups.
5.1.6 Resource Exchange Node (REN) Main elements 1. The REN is a ‘Wall Street’ for exchanging resources. 2. Resources (energy, water, etc.) have a dynamic value, which is determined on a
regular basis. 3. The REN recognizes that sustainability also has a dynamic value. Functionalities (new)

SCHIPHOL THE GROUNDS 2030 195
1. The dynamic cost of products/services at the REN are based on how heavily the system is taxed by demand for those products/services. For example, tickets for public transit are more expensive during peak hours.
2. Participants are encouraged to generate their own resources by means of renewable energy production, gray water treatment, etc. Excesses can then be exchanged for other resources that are in short supply.
Built environment 1. EV charging infrastructure provides charging at various speeds. Available
charging speeds and the cost of charging are directly dependent on the energy demand at that point in time.
2. The built environment integrates amenities for the resource generation and exchange among individuals/groups.
EV function 1. The value of an EV is largely based on a life cycle analysis (LCA) of the vehicle.
Affordable vehicles will therefore tend to be small and energy efficient. 2. EVs are charged on demand; charging is paid for by the individual who plans to
use the vehicle. Interfaces 1. The dynamic values of various resources are published/communicated on daily
basis. 2. Interfaces facilitate EV charging and usership. Role of Schiphol 1. All dynamic values of resources are location-specific. Thus RENs with their own
‘Wall-Streets’ will exist for each municipal area, such as Amsterdam, Utrecht, Rotterdam, etc.
2. Schiphol is the pilot REN, and may continue to be the most important one.
5.1.7 Self-Sufficient Communities Main elements 1. The employers/groups located on Schiphol property, are asked to set up self
sufficient communities. 2. These communities generate the resources that they consume during their work
day. Functionalities (new) 1. Local production of electricity and other resources. Built environment 1. The built environment can be adapted to the specific needs of individual
communities. 2. Each community has their own stet of communal vehicles, which are stored in
communal parking locations. EV function 1. Each community has a “white” EV system for their members. 2. The white EVs could be tailored to the community to which they belong. Interfaces

196 SCHIPHOL THE GROUNDS 2030
1. White EVs can be borrowed from the communal parking locations at Schiphol Therefore, commuting activities begin and end at Schiphol; home is the transit point.
2. Public transit access is also based on these self-sufficient communities. These community have ‘energy kilometers’, which can be traded for the energy that they have locally generated.
Role of Schiphol 1. The Schiphol Group can be a role model and the first business to set up a self
sufficient community with a white EV fleet. 2. Schiphol, as whole, is a larger self sufficient community made up of the smaller
communities based on the employers/groups that utilize the Schiphol property. 3. The Self-Sufficient Community system will enable Schiphol to be a role model for
the Netherlands. Schiphol will become energy independent and highly energy efficient.
5.1.8 Better Tomorrow Main elements 1. Better Tomorrow is a mobility network based on one standard vehicle. The
network enables: a. A high degree of system and vehicle standardization. b. Better maintenance of vehicles, vehicle batteries, and supportive
infrastructure. 2. Better Tomorrow vehicles are leased to employees that work on Schiphol
property. The EVs are owned by Schiphol Functionalities (new) 1. The Better Tomorrow network enables carefree vehicle usership. 2. EVs are standardized and therefore affordable and easy to maintain. Built environment 1. There is a simple and a standardized vehicle infrastructure, which is integrated
into buildings and parking facilities. 2. The Better Tomorrow vehicle network is specific and unique to Schiphol. EV function 1. Airside vehicles utilize battery swapping facilities. These vehicles must therefore
all have a standardized chassis. 2. There is one standard landside vehicle. Interfaces 1. Interfaces enable smart-grid management for vehicle charging. 2. Interfaces enable Vehicle-to-Grid interaction. 3. Automated battery swapping facilities are available for airside vehicles. Role of Schiphol 1. Schiphol is the owner of the Better Tomorrow, a unique EV system. Schiphol
owns the vehicles and the infrastructure utilized by this system. 2. Schiphol may charge employers/groups located on Schiphol property to
participate in the Better Tomorrow system. 3. The Better Tomorrow system, based out of Schiphol, can become the EV hub for
the whole Haarlemmermeer municipality.

SCHIPHOL THE GROUNDS 2030 197
4. Schiphol can take a leading role in the development of functional EV networks and knowledge transfer in the field of electric mobility.
5.1.9 Complete Package Main elements 1. One Complete Package is provided for each user to manage his/her energy
needs, including home, travel, and work needs. 2. The package includes means for energy generation and usage management. 3. Packages are prepaid and can be selected based on user preferences. 4. The packages require minimal set-up (modular assembly) and may be used
immediately. Functionalities (new) 1. Complete Packages include amenities for a, storage and (smart) usage of
energy. 2. The packages consist of standard modules, which can be assembled to meet the
needs of the user, the context (home/work/other) and the location. 3. Transport is integrated in the form of EVs as well as public transport (allotted km
based on the selected package). 4. The EV becomes another domestic appliance. Built environment 1. Standard EV docking stations are provided at home and at work. These docking
stations enable the EV to make use of local (as well as grid) electricity for charging purposes.
2. Each user functions as an independent entity, but contributes to the collective whole creating benefits for all.
EV function 1. The EV is integrated into the built environment (home or work, depending on
where the user is located). 2. Like the rest of the Complete Package, the EV can be modified to suit the
taste/needs of the user by means of standard, modular elements. Interfaces 1. Interfaces enable monitoring and budgeting of energy production, storage, and
use. 2. Interfaces enable Vehicle-to-Grid interaction 3. The interfaces are customizable (both at home and at work) Role of Schiphol 1. Schiphol stimulates the energy consumption awareness by creating a prepaid
energy contracts. These contracts are not only used at work, but also at home. Therefore energy awareness does not end when the work day ends.
2. Local energy production (particularly at work) is coupled on EV fleet needs. 3. Schiphol promotes energy accountability, which will help them create an identity
and set an example as a responsible and sustainable business.
5.1.10 Service-Oriented Autonomous Vehicles Main elements
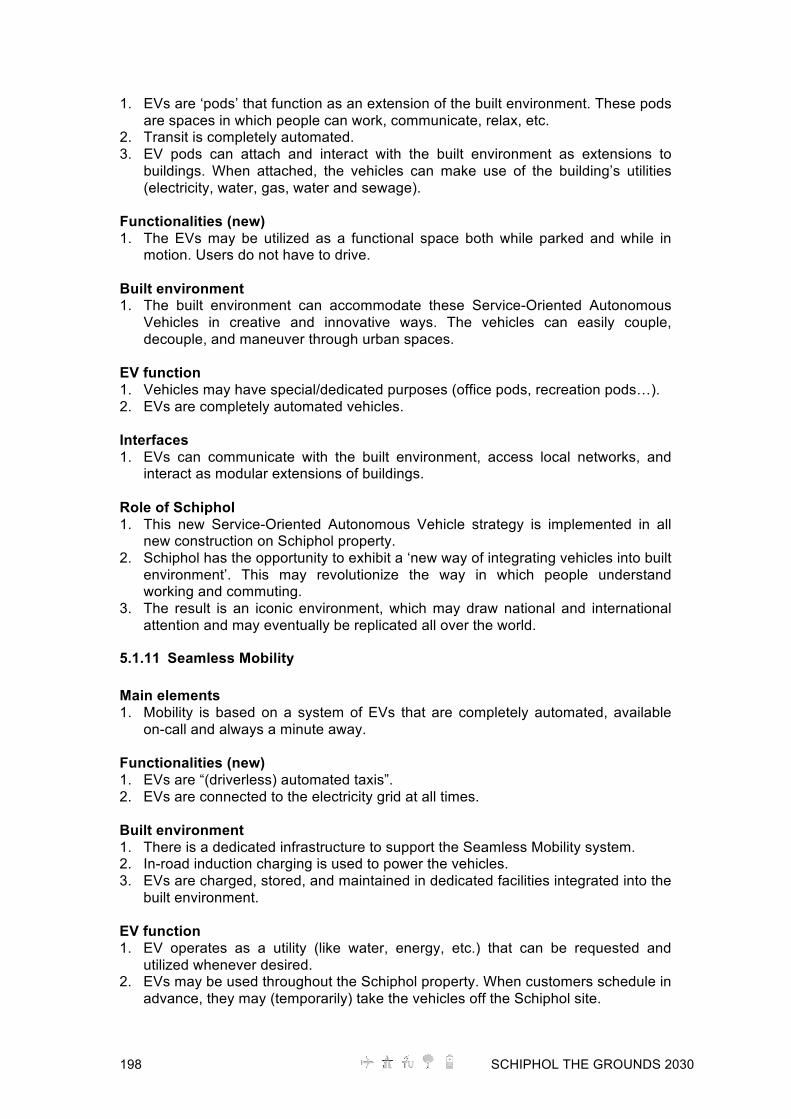
198 SCHIPHOL THE GROUNDS 2030
1. EVs are ‘pods’ that function as an extension of the built environment. These pods are spaces in which people can work, communicate, relax, etc.
2. Transit is completely automated. 3. EV pods can attach and interact with the built environment as extensions to
buildings. When attached, the vehicles can make use of the building’s utilities (electricity, water, gas, water and sewage).
Functionalities (new) 1. The EVs may be utilized as a functional space both while parked and while in
motion. Users do not have to drive. Built environment 1. The built environment can accommodate these Service-Oriented Autonomous
Vehicles in creative and innovative ways. The vehicles can easily couple, decouple, and maneuver through urban spaces.
EV function 1. Vehicles may have special/dedicated purposes (office pods, recreation pods…). 2. EVs are completely automated vehicles. Interfaces 1. EVs can communicate with the built environment, access local networks, and
interact as modular extensions of buildings.
Role of Schiphol 1. This new Service-Oriented Autonomous Vehicle strategy is implemented in all
new construction on Schiphol property. 2. Schiphol has the opportunity to exhibit a ‘new way of integrating vehicles into built
environment’. This may revolutionize the way in which people understand working and commuting.
3. The result is an iconic environment, which may draw national and international attention and may eventually be replicated all over the world.
5.1.11 Seamless Mobility Main elements 1. Mobility is based on a system of EVs that are completely automated, available
on-call and always a minute away. Functionalities (new) 1. EVs are “(driverless) automated taxis”. 2. EVs are connected to the electricity grid at all times. Built environment 1. There is a dedicated infrastructure to support the Seamless Mobility system. 2. In-road induction charging is used to power the vehicles. 3. EVs are charged, stored, and maintained in dedicated facilities integrated into the
built environment. EV function 1. EV operates as a utility (like water, energy, etc.) that can be requested and
utilized whenever desired. 2. EVs may be used throughout the Schiphol property. When customers schedule in
advance, they may (temporarily) take the vehicles off the Schiphol site.

SCHIPHOL THE GROUNDS 2030 199
Interfaces 1. Users may utilize vehicles on-demand or schedule trips in advance. 2. GPS-based systems are used to locate vehicles and users and to plan trips. Role of Schiphol 1. Schiphol facilitates the unique Seamless Mobility system, which may be used on
and around Schiphol. 2. Schiphol provides the EVs, the dedicated infrastructure, and all maintenance
facilities. 3. Everyone that works on Schiphol property may utilize the system for commuting
purposes.
5.1.12 Mobile Built Environment Main elements 1. Mobility is based on a Mobile Built Environment rather than vehicles that move
through the built environment. 2. Mobility is on-demand. Functionalities (new) Built environment 1. Each unique area on the Schiphol campus is equipped with site-specific mobility
infrastructure. EV function 1. Rather than vehicles moving through static space, the infrastructure physically
moves. This may take the form of conveyor belts, light rails, and moving platforms, etc.
Interfaces 1. Proximity sensors and/or contactless smart cards enable on-demand
functionality throughout the Mobile Built Environment. 2. Goods transport takes place by means of scheduled delivery services. Role of Schiphol 1. Schiphol is equipped with an smooth and efficient mobility system. Users leave
their vehicles on the outskirts of Schiphol and experience this unique system while on and around the airport.
2. The system serves the employees that work at Schiphol as well as travelers. 3. In the future, this type of system could be implemented in city centers throughout
the Netherlands.
5.1.13 Build-a-Vehicle Main elements 1. EVs are composed of several modules. These modules can be combined to form
a vehicle that is capable of the functions desired by the user. 2. Build-a-Vehicle EVs are part of a vehicle usership system based a Schiphol. Functionalities (new)

200 SCHIPHOL THE GROUNDS 2030
1. Vehicles are assembled, used, disassembled, and then reassembled for the next user.
2. Build-a-vehicle components are assembled/disassembled and stored automatically. Battery charging takes place during storage.
3. These EVs may also be stored in assembled form, should that be more convenient for the user.
4. Employees that work on Schiphol property use these vehicles communally. Built environment 1. There are mini-hubs throughout Schiphol where vehicles can be picked up and
dropped off. 2. These hubs takes care of maintenance (repair work, cleaning, etc.) of Build-a-
Vehicle’s modular parts. EV function 1. EVs can be customized according to the desired number of wheels, power,
battery capacity or even function. Interfaces 1. EV charging takes place automatically (during storage). 2. Several pre-determined battery packs are available for different range/speed
requirements. 3. Users receive an electronic keycard, which provides access at the mini-hubs. 4. There is a virtual interface for vehicle selection. 5. Communication between system and EV takes place via broadband technology. Role of Schiphol 1. Schiphol acts as the main hub in the Build-a-Vehicle system. Schiphol is a key
connection point between other hubs, which may be located at cities or key transfer points.
2. Schiphol provides, services, and maintains the EVs available at the Schiphol hub.
5.1.14 New Generation EVs Main elements 1. Mobility is based on a new standard for EVs. These New Generation EVs are
developed for specific mobility patterns and niche situations. Functionalities (new) 1. Functionalities of the vehicles are defined according to their purpose and the
users needs (rather than a traditional standard). 2. New vehicles are created for new usage contexts. Built environment 1. The built environment accommodates a flexible and highly customizable
infrastructure. 2. EVs travel in different lanes, depending on the wattage of the vehicle. 3. Storage/parking is vehicle-dependent. EV function 1. New Generation EVs decouple personal mobility from “the car”. 2. Vehicles are efficient, personalized, and selected based on user needs. Interfaces

SCHIPHOL THE GROUNDS 2030 201
a. Vehicles can be coupled with remote energy sources – this creates the possibility of self-sufficiency.
b. Interfaces are flexible and customizable. Role of Schiphol 1. Schiphol plays an active role in introducing the New Generation EVs. Schiphol
can lead the market in introducing new vehicle and infrastructure systems. 2. Schiphol must adapt their built environment to accommodate New Generation
EVs and encourage the people who work at Schiphol to utilize them.
5.2 Urban concepts In this chapter first of all general backgrounds for the development of four future design scenarios will be explained. Subsequently the Urban Indicator, a tool developed to combine the functional programme with a modal split based on the scenarios, is explained and used to calculate the amount of (e-) vehicles to be expected, and the amount and type of parking needed. With this four design scenarios for Schiphol ‘Elzenhof The Grounds’ are developed and explained. After the evaluation of the scenarios one final future scenario and elaboration is chosen and will be developed in detail in the next chapter.
5.2.1 Built Environment and approach
5.2.1.1 Urban Indicator The Urban Indicator is a tool for calculating the number of electrical cars and the pressure on available space and amenities for each scenario based on an urban design proposal. The urban design consists of a proposed programme in square meters (i.e. business, hotel, commercial facilities, leisure, culture, housing, amenities, parking) and a spatial configuration. The Urban Indicator uses the available area and projected urban programme as input and several specifically defined variables. The main variables are based on the future use and users of the area: Different groups of users with different purposes and different modal splits will use the area. For the modal split the following variables are (if applicable) considered: car alone, car passenger, car pooler, train, metro, bus, motorbike, bike. In every scenario, the existence and profile of the groups will be adapted to the scenario leading to a variation in mobility pattern and modal split. In total seven groups of users of the area are considered. In the first level of the Urban Indicator model these seven groups of users result in a number of electrical cars both All Electric cars and Hybrid cars:
1. Employees working on the location (destination): The first group, the employees working at the Grounds, are used in all four scenarios. The modal split varies mostly depending on the availability of the metro. The number of cars is calculated based on the number of employees that is related to the programme on the location. The required parking capacity for electrical vehicles varies from 750 to 950 based on the scenario
2. Schiphol Group employees (transit): The second group, the Schiphol Group employees, is a group that can be controlled by the employer. The number of electrical cars depends on the number of employees and the average occupancy

202 SCHIPHOL THE GROUNDS 2030
grade, leading from 400 up to 1000 cars. This group also exists in all four scenarios.
3. Other employees of Schiphol (transit): The other employees, the third group, are less easy to influence. This group is only taken into account in scenario 3 and scenario 4.
4. Travellers using P long (transit): In all scenarios, for the travellers using P-Long only the electrical vehicles are considered to be parked on the Grounds. This group varies between 3000 and 4000 cars based on the scenario.
5. Airside car fleet (destination): Also the electrical vehicles of the airside car fleet are considered to be parked at the Grounds. Based on the scenarios, between 160 and280 vehicles are airside-related
6. Rental cars: The Grounds offers an excellent location for the electrical rental cars. In scenario 2 150 cars and scenario 4 250 cars are allocated here.
7. Commuters with destination Amsterdam: transferium / P&R (transit) Finally, the Grounds could offer an attractive location as Transferium for (electrical) vehicles of commuters to Amsterdam. In scenario 3 around 150 cars are counted for and in scenario 4 about 250 cars are counted for.
The second level of the Urban Indicator model is used as a tool to predict the charging requirements at the location. Therefore, a distinction is made for three aspects: distance (radius) of travel, duration (hours) of the parking and time window (day/night/full day). Every aspect consist of three classes:
o Distance: 0-15km (10km average); 15-30km (25km average); >30km (50km average).
o Duration: 0-9hrs (day part); 2 days (business); 8 days (long travel).
o Time window: 0800-1800 (day time); 1800-0800 (night time); 0000-2400 (all day). The third level of the Urban Indicator model is used to determine the land-use and forms the base for the design proposals. The projected urban functions and related parking programme occupy the available space. But, the space for buildings is limited due to requirements of the buildings themselves and necessary space for infrastructure, water and green. The pressure on the space requires building in levels and piling up different functions, including parking. Unfortunately, the sky is the limit here as the height of buildings is restricted. The key variables are the average number of building layers (levels) leading to the build footprint, and the allocation of space for infrastructure, water and green. The required parking can be arranged on ground level, occupying space or in buildings enlarging the gross square area. The distribution of the functions in the area results in four indicators:
4. Gross square area; the total square meters of (projected) urban programme
5. Floor-Space Index (FSI); the gross square area divided by the available space (plan area)
6. Ground-Space Index (GSI); the build footprint divided by the available space (plan area)
7. Open-Space Ratio (OSR); the not-build area divided by the gross square area
SCHIPHOL THE GROUNDS 2030 203
Based on the information three sets of diagrams have been made to visualise the location profile:
1. occupation (build, parking, infrastructure, water, green, undefined)
2. functions (business/offices, housing, commercial, leisure, culture, parking, ...)
3. indicators (FSI, GSI, OSR) In scenario 1, most ground space is allocated for parking (35%). The programme is limited to offices. Further, the FSI is rather low (0,9) and the OSR is almost equal to the FSI. In scenario 2, the programme is the same size (200,000 m2), but here most parking is organised in buildings leading to a higher FSI (1,6) and more build area (25%). As a result, the OSR is reduced. In scenario 3, the programme is smaller (135,000 m2) and less parking is allocated in the area. Due to the high amount of water (>35%), there is a lot of pressure on remaining space. The FSI is low (1,0). In scenario 4, the programme is the same size as in scenario 3. Here, all parking is located in buildings, resulting in a higher FSI (1,4). The space is almost equally divided between build, water and green, resulting in a well-balanced environment.
5.2.2 Integration of e-mobility within future scenarios for ‘Elzenhof The Grounds’
5.2.2.1 Defining amounts of EVs and building programme per scenario To be able to make future visions, visualized by concepts and designs, some variables have to be defined first. This is explained shortly in the previous paragraph. For visualized future visions, first a specific location is needed, for which in this research the Schiphol related area of ‘The Grounds’ areas are chosen, and ‘Elzenhof The Grounds’ in particular. As a basis for this location the functions of the buildings must be defined. With the existing plans to develop a business park here, an indication of desired functions exists. As the focus within the DIEMIGO elaboration is based on innovative integration of electric mobility with possible surplus effects for both the location itself as for Schiphol, high amounts of electric cars will be attracted to the area to be able to visualize the consequences and possibilities of electric mobility in this specific urban setting. With the help of the within this research developed ‘Urban Indicator’, numbers of future amounts of electric vehicles and spatial consequences in an urban setting are calculated. However, to be able to get proper data out of the Urban Indicator, different assumptions for different variables have to be made first. These variables concern the different groups of people (employees, visitors, passing by, etc.) and their modal splits, including assumptions concerning future growth of Schiphol as well. Since specific numbers of future amounts of electric vehicles and spatial consequences for this area in 2030 are required as output of the urban indicator, the input of data should fit this future too. The four different design scenarios that will be discussed in the coming chapter are used to extract all data related to Schiphol and

204 SCHIPHOL THE GROUNDS 2030
the ‘Elzenhof The Grounds’ location necessary to complete the Urban Indicator outcomes. In the Urban Indicator, different groups of people to be attracted to the ‘Elzenhof The Grounds’ location have been identified. For the groups attracted, in these different scenarios, their modal splits are specified. Different groups of users attracted to ‘Elzenhof The Grounds’ Table 37. Calculation of EVs on the ‘Elzenhof The Grounds’ within four design scenarios
Previous scheme (Table 37) gives an overview of the different groups that are expected to be attracted to the ‘Elzenhof The Grounds', including the specific ones that will be attracted in each of the different scenarios. For all groups the present-day data with amounts of persons or parking spaces (or vehicles) necessary are shown. The scheme visualizes how the final amounts of EVs that are to be expected in the ‘Elzenhof The Grounds’ area in the different scenarios are calculated. For the amount of employees in business park ‘Elzenhof The Grounds’ and thus the amount of offices to be developed, Table 37 indicates the planned amount of built square meters (offices) divided by a normal gross area per employee. So this also concerns the amount of people to be expected after realization of the business park itself. For all four scenarios counts that an attempt has been made to attract a (relative) high amount of EVs to the area, to be able to visualize what effects of high penetration of electric mobility can be. This results for all scenarios that apart from the EVs of employees of the business park itself, three other groups of users with EVs will always be attracted to the area as well: The Schiphol Group employees, all Schiphol traveler’s (with EVs) that want to make use of the P-Long parking facility, and Schiphol Airport’s Airside (AS) fleet. Schiphol Group is mentioned as specific group since this group can best be influenced by the Schiphol management as for their modal split. This is of importance within the roadmap specifically, if they want to be leading in The Netherlands as for adoption of electric mobility. This accounts for both landside (LS) and airside related fleet (AS). Finally, today’s (conventional) P-Long (P5) is situated next to ‘Elzenhof The Grounds’ area. Its future share of EVs will also be attracted to the business park. Building programs

SCHIPHOL THE GROUNDS 2030 205
The previous stated means that all scenarios for Schiphol ‘Elzenhof The Grounds’ will not only accommodate offices and associated parking places, but also important parking accommodations for travellers and other Schiphol employees. Therefore additional accommodation of high frequent and high quality public transport to the airport and surrounding offices and industry will have to be offered at the location itself as well. With this the basic backgrounds have been developed for each of the scenarios to be able to design rough sketches for an urban plan, including a high amount of electric vehicles penetration in the built environment. The used labelling as for the goals with respect to the sustainability of the different design scenarios refers to the actual subdivision of energy labelling from G improving towards A. The ‘A’ level however has been split/specified into A-, A0 tot A+ ; in which the ‘A- ‘ level refers to in-between B / A level. Also an extra level: ‘ψ’ –pronounced as: psi– has been added, referring to energy-plus, resp. (clean) water or green (biomass) ‘productive’ (i.e. -generating). DGBC, refers to the ‘Dutch Green Building Challenge’, based on the BREEAM coding for sustainability of buildings: at six ‘levels’: “rejected”, “pass”, “good”, “very good”, “excellent”, “outstanding”. The appraisal in the international BREEAM coding focuses on: energy efficiency / CO2, water efficiency, surface water management, local site related waste management, building related waste management and material use (and in case of the top ‘level’ also lifespan/’end-of-life’ of buildings). In the next four paragraphs for each of the four scenarios, first of all the different groups that will be attracted to ‘Elzenhof The Grounds’ area will be discussed (including their modal splits). Secondly the consequences for the building program, especially the parking program will be discussed. The building program will be visualized by use of reference projects, and in the end elaborated into a two-dimensional sketch of a possible urban plan. Finally the EV/BE interfaces or related concepts and services will be discussed.
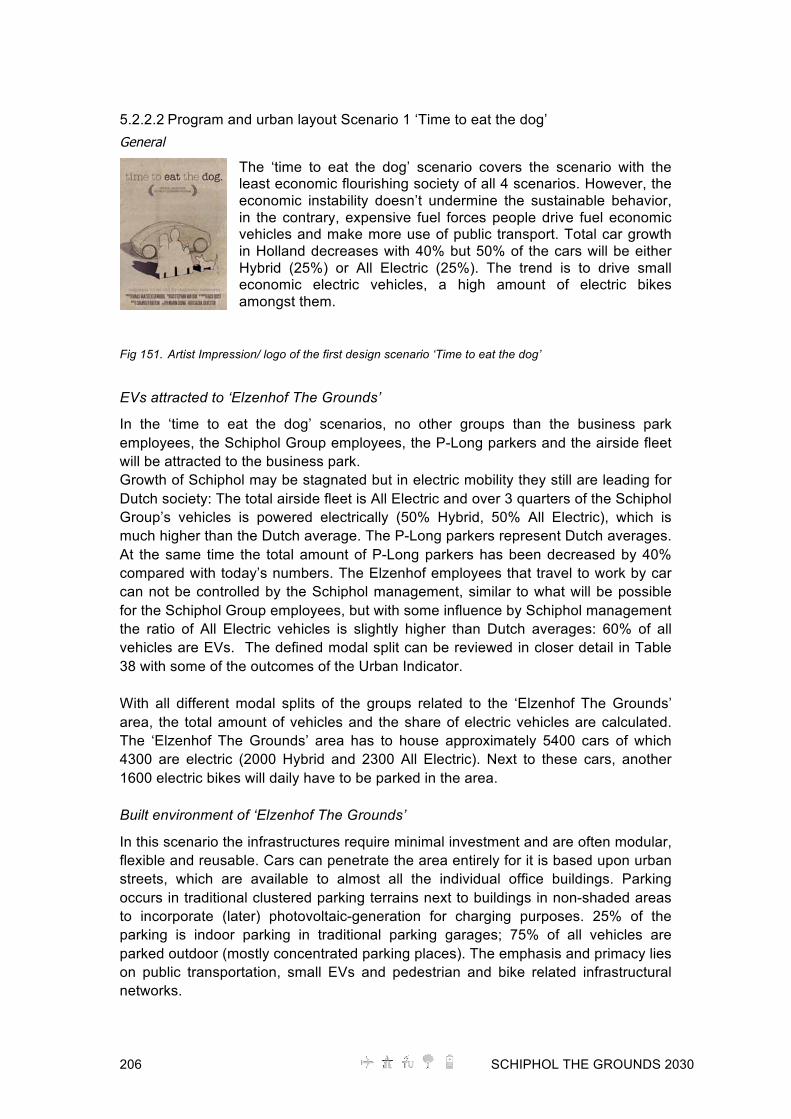
206 SCHIPHOL THE GROUNDS 2030
5.2.2.2 Program and urban layout Scenario 1 ‘Time to eat the dog’ General
The ‘time to eat the dog’ scenario covers the scenario with the least economic flourishing society of all 4 scenarios. However, the economic instability doesn’t undermine the sustainable behavior, in the contrary, expensive fuel forces people drive fuel economic vehicles and make more use of public transport. Total car growth in Holland decreases with 40% but 50% of the cars will be either Hybrid (25%) or All Electric (25%). The trend is to drive small economic electric vehicles, a high amount of electric bikes amongst them.
Fig 151. Artist Impression/ logo of the first design scenario ‘Time to eat the dog’
EVs attracted to ‘Elzenhof The Grounds’
In the ‘time to eat the dog’ scenarios, no other groups than the business park employees, the Schiphol Group employees, the P-Long parkers and the airside fleet will be attracted to the business park. Growth of Schiphol may be stagnated but in electric mobility they still are leading for Dutch society: The total airside fleet is All Electric and over 3 quarters of the Schiphol Group’s vehicles is powered electrically (50% Hybrid, 50% All Electric), which is much higher than the Dutch average. The P-Long parkers represent Dutch averages. At the same time the total amount of P-Long parkers has been decreased by 40% compared with today’s numbers. The Elzenhof employees that travel to work by car can not be controlled by the Schiphol management, similar to what will be possible for the Schiphol Group employees, but with some influence by Schiphol management the ratio of All Electric vehicles is slightly higher than Dutch averages: 60% of all vehicles are EVs. The defined modal split can be reviewed in closer detail in Table 38 with some of the outcomes of the Urban Indicator. With all different modal splits of the groups related to the ‘Elzenhof The Grounds’ area, the total amount of vehicles and the share of electric vehicles are calculated. The ‘Elzenhof The Grounds’ area has to house approximately 5400 cars of which 4300 are electric (2000 Hybrid and 2300 All Electric). Next to these cars, another 1600 electric bikes will daily have to be parked in the area. Built environment of ‘Elzenhof The Grounds’
In this scenario the infrastructures require minimal investment and are often modular, flexible and reusable. Cars can penetrate the area entirely for it is based upon urban streets, which are available to almost all the individual office buildings. Parking occurs in traditional clustered parking terrains next to buildings in non-shaded areas to incorporate (later) photovoltaic-generation for charging purposes. 25% of the parking is indoor parking in traditional parking garages; 75% of all vehicles are parked outdoor (mostly concentrated parking places). The emphasis and primacy lies on public transportation, small EVs and pedestrian and bike related infrastructural networks.

SCHIPHOL THE GROUNDS 2030 207
The Urban typology concerns medium sized compact areas with an urban density Floor Space Index (FSI) of 0.8. The buildings in general will have 4 layers. National reference projects for the FSI of the urban plan of this scenario are the Rotterdam, Feijenoord district and Venserpolder in Amsterdam Zuidoost (Fig 152). International reference is Seine Rive Gauche in Paris (France) (Fig 153). The total Gross Floor Space of all buildings (GFS) is calculated on 234,000 m2. Of which offices will represent the major part: 200,000 m2. These will be flexible modern offices with an ‘open plan office’ (an enclosed space designed to accommodate 13 or more workplaces) with additional flex cellular meeting rooms.
Fig 152. Venserpolder, Amsterdam (www.afwc.nl)
Fig 153. Seine Rive Gauche sustainable office development, Paris, France
The buildings have good spatial flexibility and use space efficiently; they are oriented toward practicality rather than prestige and are appropriate for interaction and social control. The internal climate control is centralized, the acoustic and visual privacy is limited. The remaining 34,000 m2 will be used in by traditional parking garages (Fig 154).

208 SCHIPHOL THE GROUNDS 2030
Fig 154. Traditional parking garage (www.voelkelconstruction.com)
Previous data and (other) specifications can be reviewed in Table 38 and are schematically visualized in Fig 155 in building blocks and outdoor parking space projected on the ‘Elzenhof The Grounds’ site.
Fig 155. Schematic three dimensional visualization of building volumes and parking places according to the functional program of design scenario 1 ‘Time to eat the dog’ (Courtesy of Google Maps). Energy generation and –use in ‘Elzenhof The Grounds’
Renewable sources based electricity will be partly generated decentralized by an extensive amount of PV-covered parking places and small wind turbines with vertical axes which are integrated with the construction of the covering of these parking places (Fig 157, left and Fig 158). Road Energy systems collect heat and cold that can be stored in the underground and used within the buildings (Fig 156, right).

SCHIPHOL THE GROUNDS 2030 209
Fig 156. Decentralized energy generation: outdoor parking places with solar cell roofs (left) and road energy systems (right) (knowledge.allianz.com) The Urban plan will be labelled as follows:
Energy label: A- / Water label: B / ‘Green’ label: B, Dutch Green Building Council / ‘overall’: “Very Good” . Interfaces between the built environment and the EVs will be existing ‘Stand alone’ and ‘Add-on’ concepts. Emphasis will be on smart policy interventions and service related innovative concepts based on renewable sources (wind, sun) (Fig 157). The next innovative interfaces between built environment and vehicle concepts will fit in this scenario (cf elaboration and assessment in detail: DIEMIGO sub research Faculty IDe):
o ‘Do anything box’; surplus robustness to sustain unlimited connection with (different) systems.
o ‘EV (schi)pool system’; demand based charging while parked.
o ‘Schiphol Energy card (sEC)’; limited and controlled access to EVs & infra.
o ‘Better tomorrow!’; smart grid.
Fig 157. Outdoor parking places with decentralized electricity generation by wind and sun Urban layout / general plan ‘Elzenhof The Grounds’
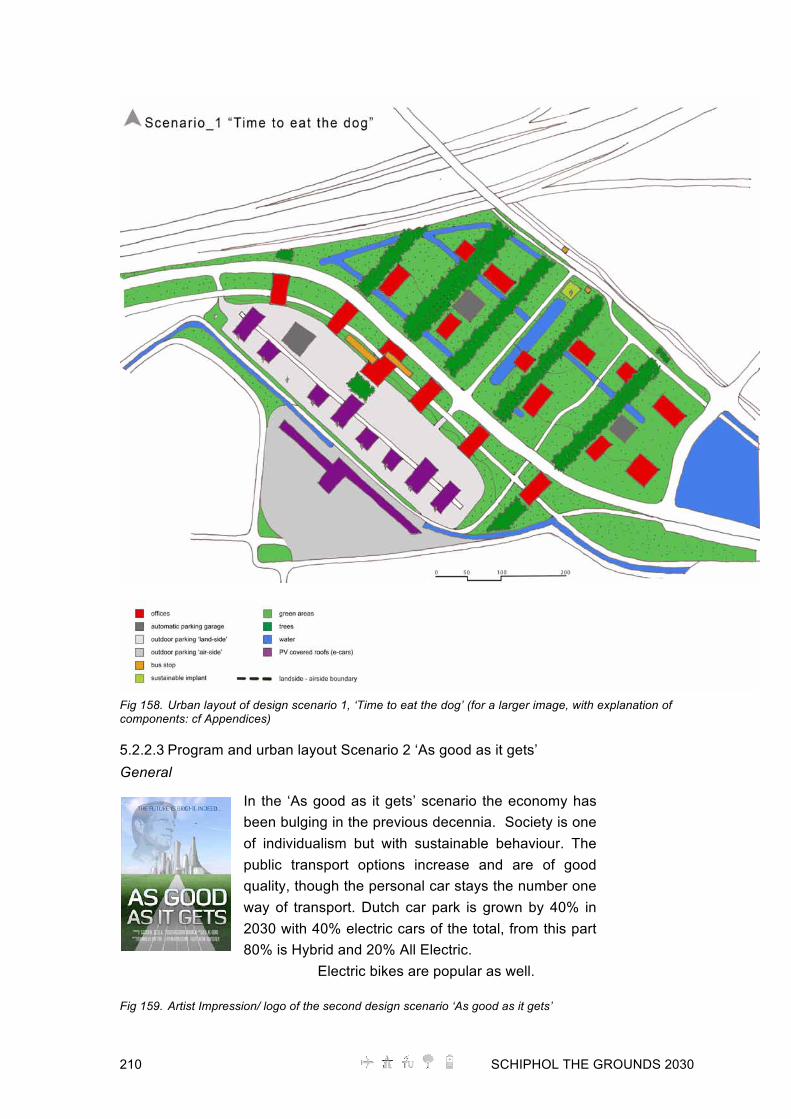
210 SCHIPHOL THE GROUNDS 2030
Fig 158. Urban layout of design scenario 1, ‘Time to eat the dog’ (for a larger image, with explanation of components: cf Appendices)
5.2.2.3 Program and urban layout Scenario 2 ‘As good as it gets’ General
In the ‘As good as it gets’ scenario the economy has been bulging in the previous decennia. Society is one of individualism but with sustainable behaviour. The public transport options increase and are of good quality, though the personal car stays the number one way of transport. Dutch car park is grown by 40% in 2030 with 40% electric cars of the total, from this part 80% is Hybrid and 20% All Electric.
Electric bikes are popular as well. Fig 159. Artist Impression/ logo of the second design scenario ‘As good as it gets’

SCHIPHOL THE GROUNDS 2030 211
EVs attracted to ‘Elzenhof The Grounds’
Apart from the 4 main groups (the business park employees, the Schiphol Group employees, the P-Long parkers and the airside fleet) also the electric rental cars will be housed at ‘Elzenhof The Grounds’. The ‘Elzenhof The Grounds’ area has a perfect metro connection with both Schiphol airport and Amsterdam Zuid-as and Amsterdam inner city. This is the new metro line extension of the North-South line from Schiphol to Amsterdam. Schiphol has grown by 50% and is one of the leading stakeholders in electric mobility in the Netherlands. Their total Airside fleet (except from heavy trucks and emergency related heavy vehicles) is All Electric and all Schiphol employees are provided with electric vehicles of which 75% is All Electric. The P-Long parkers concern Dutch averages in their share of EVs: 40% is electric, of which 20% All Electric, 80% Hybrid. With the growth of Schiphol and the personal car that stays the most important transportation option, the share of EVs of the P-Long parkers consists daily of 5600 vehicles to be stored at ‘Elzenhof The Grounds’ area. The rentals represent a relative small group but are all 20% All Electric, 80% Hybrid. The exact defined modal splits can be reviewed in Table 38 with some of the outcomes of the Urban Indicator. With all different modal splits of the groups related to the ‘Elzenhof The Grounds’ area, the total amount of vehicles and the share of electric vehicles are calculated. The ‘Elzenhof The Grounds’ area has to house around 9400 cars of which 8000 are electric (5500 Hybrid and 2500 All Electric). Next to these cars, another 500 electric bikes will daily have to be parked in the area. Built environment of ‘Elzenhof The Grounds’
Infrastructures require optimization related investments and are modular, flexible and reusable. Individuals enjoy a variety of transport options that can be personalized to meet their daily needs. Cars can penetrate the area by urban streets on to clustered office buildings. Parking mostly occurs in indoor parking garages that are frequently integrated in these office buildings, partially (semi-)underground and/or next to buildings in sunny areas to incorporate (immediate) photovoltaic generation for charging purposes. The area has optimized connections to public (e-) transportation, like the new metro (towards train) and “Zuidtangent” though, infrastructural individual e-mobility networks have primacy. The urban typology exists of maximized, compact areas with real urban density and a Floor Space Index (FSI) of 1.3. Most buildings consist of five layers and are built to the maximum allowed height of 20 meters. Building blocks act as independent entities with collective benefit. Examples of other projects to the urban plan for this scenario are the Potzdammer Platz in Berlin, Germany (Fig 162) as an international references, and as national reference: Amsterdam, Science Park (Fig 160) and business location Papendorp in Utrecht (Fig 161).
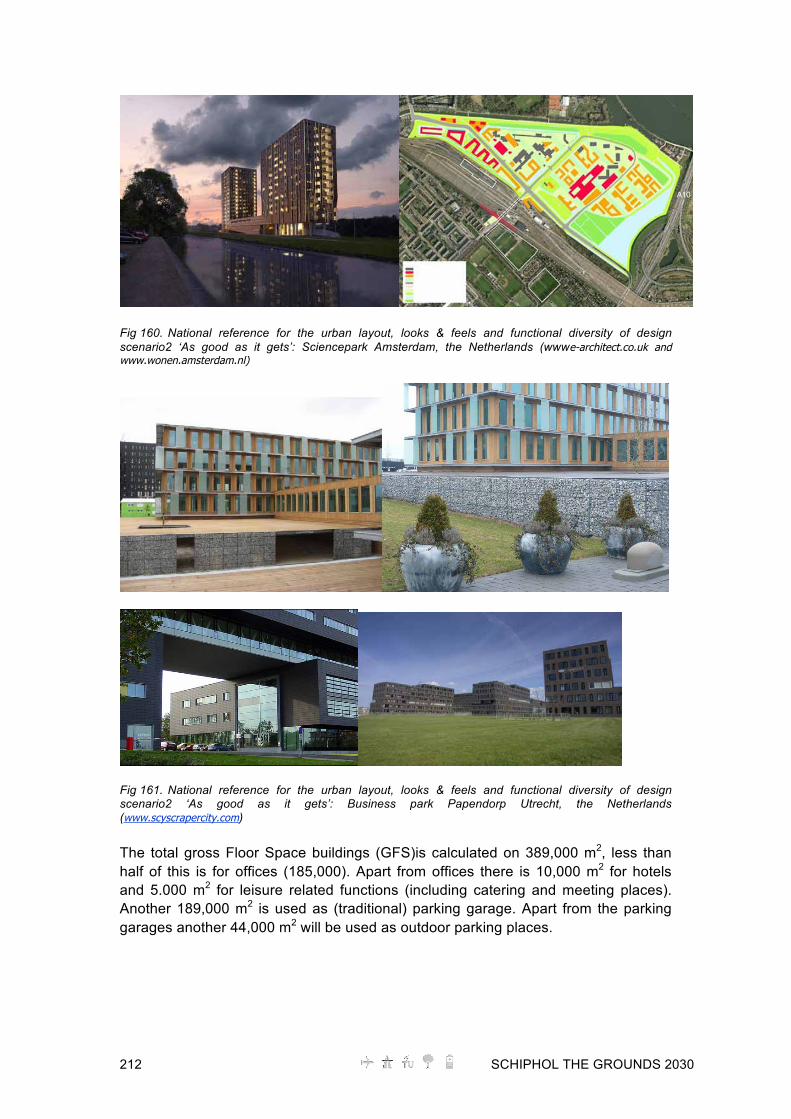
212 SCHIPHOL THE GROUNDS 2030
Fig 160. National reference for the urban layout, looks & feels and functional diversity of design scenario2 ‘As good as it gets’: Sciencepark Amsterdam, the Netherlands (wwwe-architect.co.uk and www.wonen.amsterdam.nl)
Fig 161. National reference for the urban layout, looks & feels and functional diversity of design scenario2 ‘As good as it gets’: Business park Papendorp Utrecht, the Netherlands (www.scyscrapercity.com) The total gross Floor Space buildings (GFS)is calculated on 389,000 m2, less than half of this is for offices (185,000). Apart from offices there is 10,000 m2 for hotels and 5.000 m2 for leisure related functions (including catering and meeting places). Another 189,000 m2 is used as (traditional) parking garage. Apart from the parking garages another 44,000 m2 will be used as outdoor parking places.
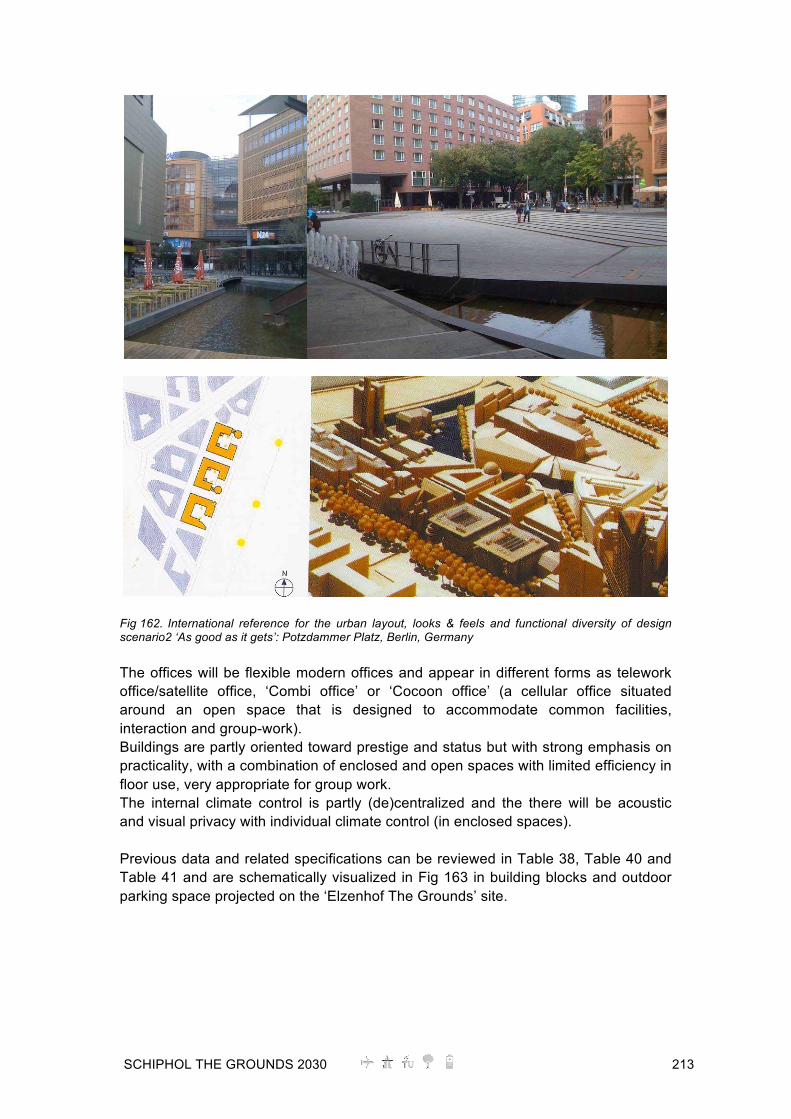
SCHIPHOL THE GROUNDS 2030 213
Fig 162. International reference for the urban layout, looks & feels and functional diversity of design scenario2 ‘As good as it gets’: Potzdammer Platz, Berlin, Germany The offices will be flexible modern offices and appear in different forms as telework office/satellite office, ‘Combi office’ or ‘Cocoon office’ (a cellular office situated around an open space that is designed to accommodate common facilities, interaction and group-work). Buildings are partly oriented toward prestige and status but with strong emphasis on practicality, with a combination of enclosed and open spaces with limited efficiency in floor use, very appropriate for group work. The internal climate control is partly (de)centralized and the there will be acoustic and visual privacy with individual climate control (in enclosed spaces). Previous data and related specifications can be reviewed in Table 38, Table 40 and Table 41 and are schematically visualized in Fig 163 in building blocks and outdoor parking space projected on the ‘Elzenhof The Grounds’ site.

214 SCHIPHOL THE GROUNDS 2030
Fig 163. Schematic three dimensional visualization of building volumes and parking places according to the functional program of design scenario 2 ‘As good as it gets’ (Courtesy of Google Maps). Energy generation and –use in ‘Elzenhof The Grounds’
The facades and roofs of the built environment are widely used to harvest green electricity by use of photovoltaic systems. PV is integrated in the office buildings and parking garages (roofs, façades). Semi-decentralized wind turbines with a maximum allowed height of 20 to 30 meter along highway A4 contribute to green energy production as well. Communal services are sustainable energy related: bus stops with integrated solar cells (Fig 164), decentralized wind generator based charging posts, specific services like battery swapping, where charging is outsourced, decentralized heat and cold supply through heat and cold storage in the (deep)underground connected with Combined Heat Power systems fuelled with biogas. On building scale, ventilation is mostly offered naturally through smart use of wind (over/under pressure), solar chimneys, and solar cavity walls. Heat pumps, connected with the underground are also used to provide buildings individually with heat. Production, storage and usage of energy will be a homogeneous mix. The Urban plan will be labelled as follows:
Energy label: A0 / Water label: A- / ‘Green’ label: B, Dutch Green Building Council / ‘overall’ label’: “Excellent” .

SCHIPHOL THE GROUNDS 2030 215
Fig 164. Traditional parking garage and bus stop with add-on PV panels for electricity generation Interfaces between the built environment and the EVs will be updated ‘Clustered’ concepts and with emphasis on ‘complete packages’ of product/services to be integrated in existing buildings. The next innovative interfaces between built environment and vehicle concepts will fit in this scenario (cf elaboration and assessment in detail: DIEMIGO sub research Faculty IDe):
o ‘Seamless mobility’; The built environment (BE) maintains EVs automatically by the surplus of sustainable sources; EVs total battery capacity is used as storage for electricity.
o ‘Service oriented autonomous vehicles’; ‘plug and play docking stations’ with access and control communication between the BE and EV.
o ‘Complete package’; charge and store, while parking.
o ‘Better tomorrow!’; A smart grid connected with a battery swapping service
Urban layout / general plan ‘Elzenhof The Grounds’

216 SCHIPHOL THE GROUNDS 2030
Fig 165. Urban layout of design scenario 2, ‘As good as it gets’

SCHIPHOL THE GROUNDS 2030 217
5.2.2.4 Program and urban layout Scenario 3 ‘Footprints on the water’ General
In the third design scenario, ‘Footprints on the water’, society is fully based on sustainable behaviour and is less individualistic. The trend is to use more decentralized energy sources and the vehicle ownership shifts more to a vehicle usership. As for energy source, for mobility, electricity has become an important fuel often combined with range extenders. The Dutch car fleet has slightly decreased (-10%) and consists for half of it of electric vehicles, with 60% Hybrid cars and 40% All Electric vehicles.
Fig 166. Artist Impression/ logo of the third design scenario ‘Footprints on the water’ EVs attracted to ‘Elzenhof The Grounds’
In this scenario other groups than the main four groups (the business park employees, the Schiphol Group employees, the P-Long parkers, and the Airside fleet) are attracted to ‘Elzenhof The Grounds’ business park. By attracting a major share of the all Schiphol employees’ EVs too, the business park also functions as a high quality transit hub with excellent service for EV parkers and resulting in a smaller CO2 footprint. About half of all Schiphol employees are attracted to use ‘Elzenhof The Grounds’ as transit hub and park their cars there. Combined with the transit hub, also an additional P+R Transferium for ‘electric vehicles only’ is located at the site. This Transferium also will be used by people visiting Amsterdam city-region and will result in an estimated additional amount of 150-parked EVs daily. Schiphol is doing well in this scenario, but due to refined efficiency and new technologies, the total amount of employees has decreased by 20%. All Schiphol group employees are provided with electric vehicles, of which 75% is All Electric. P-Long travellers represent Dutch averages again and the ‘Elzenhof The Grounds’ employees have a slightly higher ratio of EVs than Dutch average. This is due to an increased possible influence by Schiphol Group. The exact defined modal split can be reviewed again in Table 38 with some of the outcomes of the Urban Indicator. With all different modal splits of the groups related to the ‘Elzenhof The Grounds’ area, the total amount of vehicles and the share of electric vehicles are calculated. The ‘Elzenhof The Grounds’ area has to house around 7400 cars of which 6900 are electric (3900 Hybrid and 3000 All Electric). Next to these cars, another 1100 electric bikes will have to be parked in the area every day. Built environment of ‘Elzenhof The Grounds’
Infrastructures are fully optimized as for individual e-mobility and public (e-)transportation, and are well approachable by either foot and (e-)bike. Extra attention has been paid to the connection of Transferium and e- Charge&Park facility. The development of the ‘Elzenhof The Grounds’ area has a surplus value for the

218 SCHIPHOL THE GROUNDS 2030
Amsterdam-region related mobility because of the function of (e-mobility) transit hub. The infrastructure related investments are modular, flexible and reusable and (sustainable) resources are exchangeable. Vehicle servicing and recharging/refuelling takes place at the transit hub at the sides of the site. Cars do not penetrate the area: mass transit systems connect the compact nodes and optimized car hubs. The use of ‘streets’ is re-balanced in favour of the (e-)bikes, pedestrians and the community (liveability). Parking is reinterpreted to accommodate vehicle charging by innovative communal automatic parking garages for nodes and for the e-mobility transit hub. These garages are mostly aboveground and separating Schiphol Airside from Landside. They are south orientated for integration of photovoltaic systems for charging purposes. Also these garages partly are integrated to urban layout to function as a sound barrier. The emphasis with regard to mobility integration is put on the application of an entire range of EVs (individual) and optimized connections to public (e-)transportation, like the new metro extension (towards train, inner city and Schiphol center), and the improved “Zuidtangent”. Within the site: individual walking and cycling networks have primacy. The urban typology is one with green areas combined with compact nodes (‘Decentralized Concentration’; at larger scale: polycentric urban development)). The nodes have a real urban density; the area will have a Floor Space Index (FSI) of 0.9. The buildings will be built to the maximum allowed height in compact interconnected setting, which results in up to six above ground layers within the twenty-meter of height allowed. The buildings have intermixed and double functions to achieve maximum efficiency and excellent small-scale urban comfort and liveability. National references are the business district ‘Europa Park’ in Groningen (Fig 167), the EVA center and Panta Rhei building in Lanxmeer, Culemborg, the Netherlands by Alexandra Dietzsch (Fig 168, right; Fig 173, left) and the ‘IBN DLO’ building, Wageningen, the Netherlands by Behnish jr. architects (Fig 168, right). International references to the urban plans for this scenario are of Shanghai, Lu Jia Zui (RRP; 1992, not realized), and the Faculty of Architecture of the MIT, Boston, USA (Fig 169)

SCHIPHOL THE GROUNDS 2030 219
Fig 167. National reference urban lay-out: Europapark, Groningen (www.jaapkraayenhof.nl, www.mijnwijk.groningen.nl & www.europapark.groningen.nl)
Fig 168. National references for building typologies: IBN DLO Building, Wageningen (left, Behnish & partners), and the ‘Panta Rhei’ building, Lanxmeer, Culemborg (center, right, Alexandra Dietzsch)
The total gross Floor Space of the buildings (GFS) is calculated on 262,000 m2, of which 120,000 m2 is used for offices. Apart from offices there is 10,000 m2 for hotels and 5,000 m2 for leisure related functions (including catering and meeting places).
Fig 169. International reference urban node lay-out & building type: MIT, Boston, USA by Behnish & partners. Another 128,000 m2 is used for indoor parking, 75,000 m2 for (traditional) parking garages and 53,000 m2 for concentrated mechanical parking garages (, left). These archetypes will be combined with similar shaped buildings to achieve the clusters decentralized self-sufficiency based on a combination of several decentralized technologies (Timmeren 2006) and new stacked forms of urban agriculture (Fig 170, right). Apart from the indoor parking garages another 34,000 m2 will be used for (semi-) outdoor parking places (Fig 170).

220 SCHIPHOL THE GROUNDS 2030
Fig 170. Automatic parking garage (left; www.crow.nl) and Chris Jacob’s integrated urban farming concept (right)
Fig 171. Semi underground parking places with buildings and car-free zones on top The offices will be flexible modern offices and appear in different forms and combinations such as ‘Group offices’, ‘Project Spaces’ and ‘Team Office’- concepts (an enclosed space designed to accommodate four to twelve workplaces, e.g. dedicated to a particular project or team) with additional flex- cellular meeting rooms as intermediate between cellular offices and office landscape, consisting of medium sized rooms, each accommodating approximately four to twelve people. Buildings are oriented toward prestige, but with less emphasis on practicality, they have limited spatial flexibility and use efficiency and appropriate for group work. The internal climate control is decentralized and the acoustic and visual privacy is limited. Previous figures and (other) specifications can be reviewed in Table 39, Table 40 and Table 41 and are schematically visualized in Fig 172 in building blocks and outdoor parking space projected on the ‘Elzenhof The Grounds’ site.
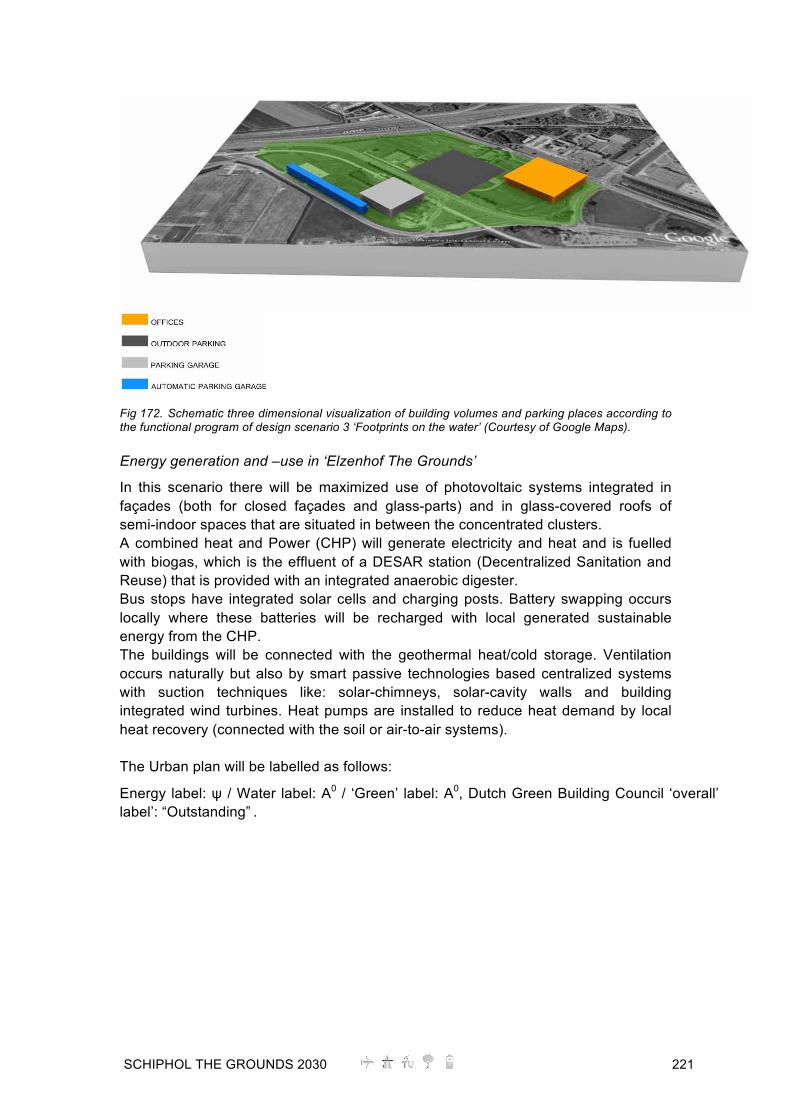
SCHIPHOL THE GROUNDS 2030 221
Fig 172. Schematic three dimensional visualization of building volumes and parking places according to the functional program of design scenario 3 ‘Footprints on the water’ (Courtesy of Google Maps). Energy generation and –use in ‘Elzenhof The Grounds’
In this scenario there will be maximized use of photovoltaic systems integrated in façades (both for closed façades and glass-parts) and in glass-covered roofs of semi-indoor spaces that are situated in between the concentrated clusters. A combined heat and Power (CHP) will generate electricity and heat and is fuelled with biogas, which is the effluent of a DESAR station (Decentralized Sanitation and Reuse) that is provided with an integrated anaerobic digester. Bus stops have integrated solar cells and charging posts. Battery swapping occurs locally where these batteries will be recharged with local generated sustainable energy from the CHP. The buildings will be connected with the geothermal heat/cold storage. Ventilation occurs naturally but also by smart passive technologies based centralized systems with suction techniques like: solar-chimneys, solar-cavity walls and building integrated wind turbines. Heat pumps are installed to reduce heat demand by local heat recovery (connected with the soil or air-to-air systems). The Urban plan will be labelled as follows:
Energy label: ψ / Water label: A0 / ‘Green’ label: A0, Dutch Green Building Council ‘overall’ label’: “Outstanding” .
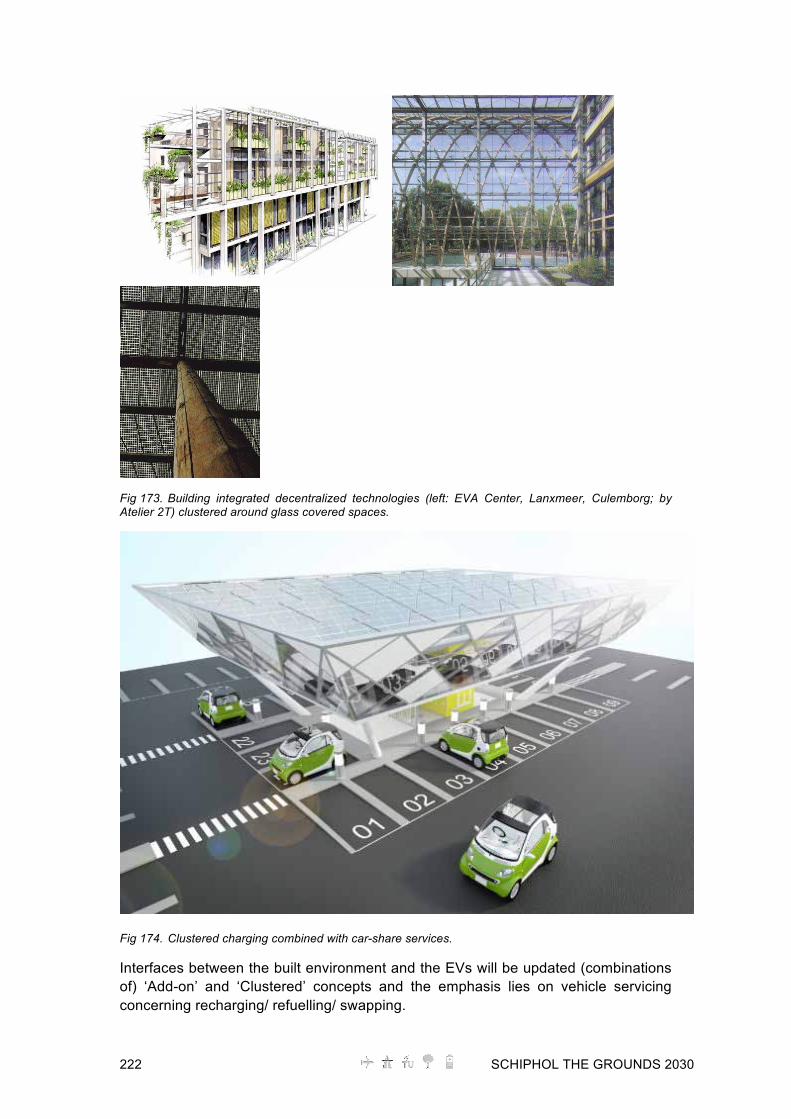
222 SCHIPHOL THE GROUNDS 2030
Fig 173. Building integrated decentralized technologies (left: EVA Center, Lanxmeer, Culemborg; by Atelier 2T) clustered around glass covered spaces.
Fig 174. Clustered charging combined with car-share services.
Interfaces between the built environment and the EVs will be updated (combinations of) ‘Add-on’ and ‘Clustered’ concepts and the emphasis lies on vehicle servicing concerning recharging/ refuelling/ swapping.
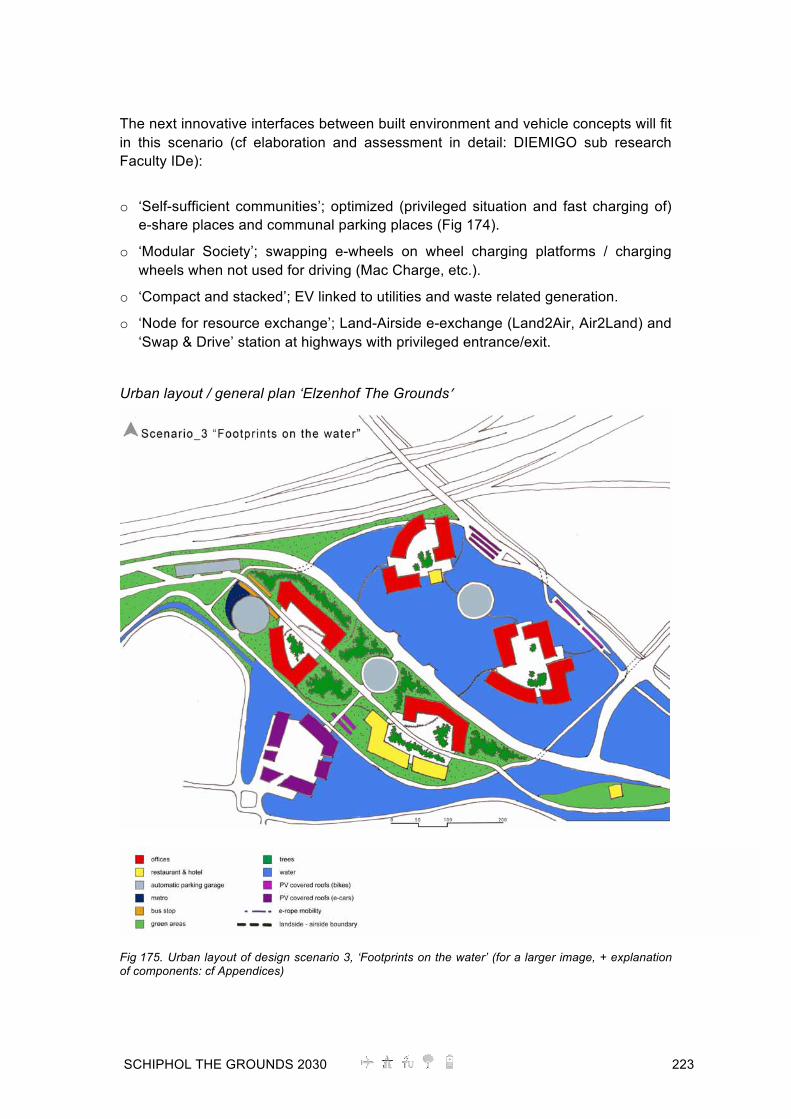
SCHIPHOL THE GROUNDS 2030 223
The next innovative interfaces between built environment and vehicle concepts will fit in this scenario (cf elaboration and assessment in detail: DIEMIGO sub research Faculty IDe):
o ‘Self-sufficient communities’; optimized (privileged situation and fast charging of) e-share places and communal parking places (Fig 174).
o ‘Modular Society’; swapping e-wheels on wheel charging platforms / charging wheels when not used for driving (Mac Charge, etc.).
o ‘Compact and stacked’; EV linked to utilities and waste related generation.
o ‘Node for resource exchange’; Land-Airside e-exchange (Land2Air, Air2Land) and ‘Swap & Drive’ station at highways with privileged entrance/exit.
Urban layout / general plan ‘Elzenhof The Grounds’
Fig 175. Urban layout of design scenario 3, ‘Footprints on the water’ (for a larger image, + explanation of components: cf Appendices)

224 SCHIPHOL THE GROUNDS 2030
5.2.2.5 Program and urban layout Scenario 4 ‘Generation Eco-Geek’ General
In the ‘generation Eco-geek’ scenario, society is the most conscious of all four scenarios with regard to sustainability. Dutch society is CO2 neutral as for all new initiated developments and most of its existing stock. Total Dutch car park decreased by 20% but thanks to the new smart mobility alternatives, and also because of increased amount of users switching from vehicle ownership to vehicle user ship 70% of all Dutch cars are electric. Of which only 30% is Hybrid, while 70%
is All Electric. Fig 176. Artist Impression/ logo of the third design scenario ‘Footprints on the water’
EVs attracted to ‘Elzenhof The Grounds’
In the “Generation Eco-geek’ scenario an attempt to attract all possible (and relevant) groups to be attracted to the site, is made. Apart from the four main groups (the business park employees, the Schiphol Group employees, the P-Long parkers and the Airside fleet), all Schiphol employees that travel by EV are attracted to the site. Besides of an innovative Transferium for EVs only, in this scenario also All Electric rentals are located here, and combined with innovative forms of ‘tailor made for the masses’ concepts. Schiphol again is doing well in this scenario. Due to refined efficiency and introduction of new smart technologies and systems the total of employees could decrease by 10%. All Schiphol group employees are provided with electric vehicles of which 90% is All Electric. The airside fleet is completely All Electric. P-Long parkers and the ‘Elzenhof The Grounds’ employees correspond to Dutch averages as for their EV / non-EV ratio. The ‘Elzenhof The Grounds’ development has excellent public transport connections with the rest of the airport and Amsterdam city region. The detailed modal splits of all groups involved in this scenario again can be reviewed in Table 39 with some outcomes of the Urban Indicator. With all different modal splits of the groups related to the ‘Elzenhof The Grounds’ area, the total amount of vehicles and the share of electric vehicles are calculated. The ‘Elzenhof The Grounds’ area has to house around 10.000 cars of which 9400 are electric (3300 Hybrid and 6100 All Electric). Next to these cars, another 900 electric bikes will have to be parked in the area every day. Built environment of ‘Elzenhof The Grounds’
Infrastructures at the site are fully optimized for individual public e-transportation, from there on the connections to ‘inner garden’, which contains of silent ‘deep green’ areas and which are only approachable by foot and (e-)bike (or similar modes). The development of the site has a surplus value for the northern wing of the Randstad and related mobility because of the function of (e-mobility) transit hub. The transferium within the ‘Elzenhof The Grounds’ business park functions as a transit hub with intermixed individual (e-)mobility and collective transportation of the individual e-modes (so called: IC- or IP-transportation). Here it is also interconnected

SCHIPHOL THE GROUNDS 2030 225
with other Schiphol places by a so-called ‘green-rope’. It transports Schiphol passengers but also rental cars from and to the site (Fig 184 and Fig 185show examples). The infrastructure related investments are modular, flexible and reusable and (sustainable) resources are exchangeable. Vehicle servicing and recharging can take place at the transit hub at the side(s) of the site in Park&Charge garages or even during communal transportation or on the road by road integrated systems. E-mobility modes (except for e-bikes) do not penetrate the area. Mass transit systems connect the compact nodes and the optimized car hub’s, the ‘streets’ are only semi paved for (e-)bike and pedestrian mobility and for community related activities with emphasis on high quality urban comfort levels. Parking is reinterpreted to accommodate vehicle charging: innovative communal automatic IP garages with excellent connections with the rest of the transit hub. These parking garages almost entirely above ground and form a Landside/Airside separation which functions as a sound barrier as well. Besides of that, their façades are sun orientated for solar charging of the façade integrated photovoltaic. Fig 177 shows some references on these buildings.
Fig 177. Automatic parking garage and integrated double façades for electricity generation (www.crow.nl), solar shading and decentralized ventilation with heat recovery in Cité Interlional, Lyon (France) by Renzo Piano Building Workshop. The urban typology is one of green areas with compact low-rise nodes with an average density with a Floor Space Index (FSI) of 1.2 and the buildings generally have 5 layers. They are organized in efficient ways never with single function development. International references for the urban plan for this fourth scenario are the Cité Interlional (RPBW) in Lyon (France) (Fig 178), the Science and Technology Park in Gelsenkirchen (Germany) and the Masdar City project in Abu Dhabi (United Arab Emirates) (Fig 179). National references the Wall in Almere by MVRDV (not realized; Fig 181) and the winter palace concept by Kempe & Thill (not realized; Fig 180).
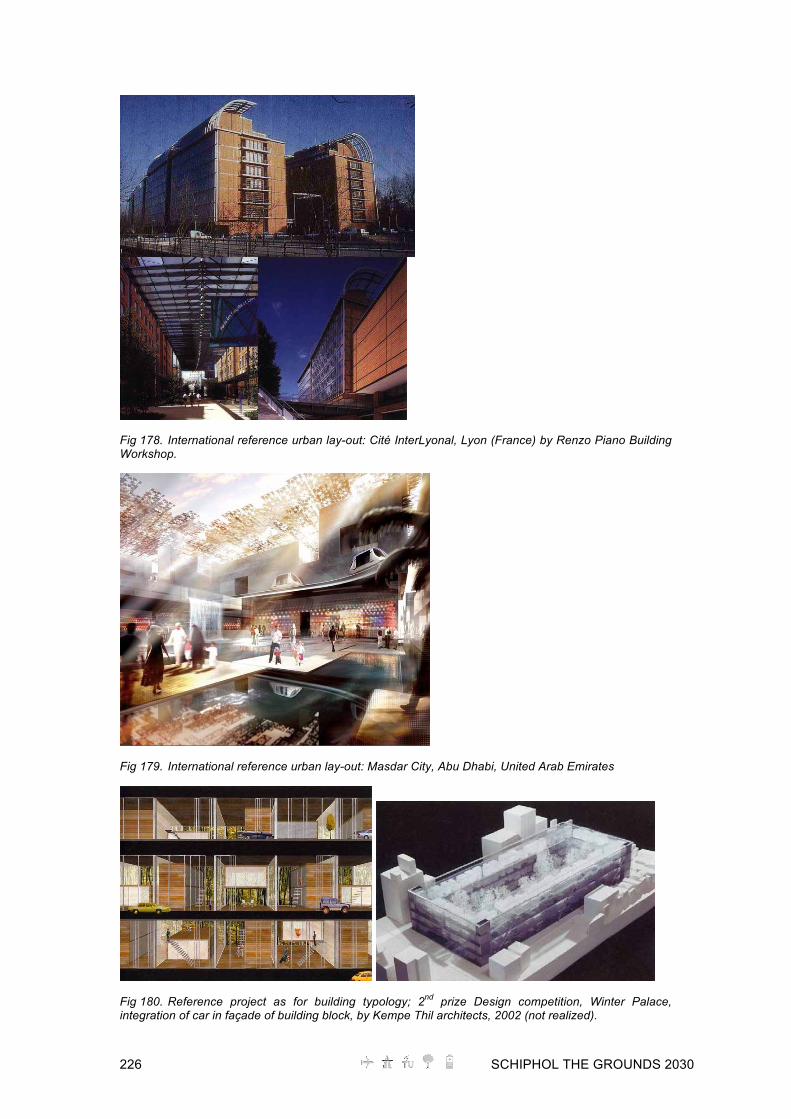
226 SCHIPHOL THE GROUNDS 2030
Fig 178. International reference urban lay-out: Cité InterLyonal, Lyon (France) by Renzo Piano Building Workshop.
Fig 179. International reference urban lay-out: Masdar City, Abu Dhabi, United Arab Emirates
Fig 180. Reference project as for building typology; 2nd prize Design competition, Winter Palace, integration of car in façade of building block, by Kempe Thil architects, 2002 (not realized).

SCHIPHOL THE GROUNDS 2030 227
Fig 181. Reference project as for urban block typology; ‘The Wall’ by MVRDV, 2006 (not realized). The total gross Floor Space buildings (GFS) is calculated on 350,000 m2, of which 120,000 m2 is used for offices. Apart from offices there is 10,000 m2 for hotels and 5000 m2 for leisure related functions (including catering and meeting places). Another 215,000 m2 is used for indoor parking of which almost half of it in (traditional) parking garages and the rest in automatic parking garages. No parking occurs on outdoor parking places, except for some car-share places at strategic spots near inner garden entrances.
228 SCHIPHOL THE GROUNDS 2030
Fig 182. Schematic three dimensional visualization of building volumes and parking places according to the functional program of design scenario 4 ‘Generation Eco Geek’ (Courtesy of Google Maps). The building types can vary internal but are mostly offices elaborated as ‘Free office’ - concepts with combinations of telework offices, guest offices and club offices with personal and shared offices. Buildings and spaces are fully organized towards prestige and status. Different spaces have limited spatial flexibility but have excellent efficiency in use. The buildings climate controls are decentralized, acoustic and visual privacies are optimal. Previous figures and (other) specifications can be reviewed in Table 39, Table 40 and Table 41 and are schematically visualized in Fig 182 in building blocks and outdoor parking space projected on the ‘Elzenhof The Grounds’ site. Energy generation and –use in ‘Elzenhof The Grounds’
Local energy is mainly generated by photovoltaic systems that integrated in façades and roofs to a maximum possibility. Apart from that green façades near highway A4 and inner garden façades with integrated algae production for energy purposes will be part of the concept. Parking garages that charge EVs have the Vehicle to Grid integrated system and the EVs total batteries capacity forms a back-up battery for Schiphol, as well as a new way to earn money while offering visitors/users additional services and comfort. A combined heat and Power (CHP) will generate electricity and heat. It is fuelled with biogas that comes from a DESAR installation (Decentralized Sanitation and Reuse), elaborated as a Sustainable Implant (S.I.) that consists of a combination of anaerobic treatment of organic waste and black water, an High rapid Green Algae farming, connected to horticulture based environments, additional inorganic waste collection facility and the CHP. Bus stops and Airside roof coverings have integrated photovoltaic systems and decentralized wind turbines and charging posts connected to the structural components. The stacked car-share parking places are attached to concentrated (clustered) charging in direct relation to the CHP plant within the Sustainable Implant. This Sustainable Implant also is connected to the centralized spot for heat/Cold storage in soil and is connected to an extension to the OCAP tube for CO2 exchange. Decentralized natural ventilation systems are integrated in façades (climate adaptive skin, solar-cavity walls, etc.) and besides of that building integrated wind turbines (roof/façade rims) are standard in all buildings. The hotel is connected to heat pumps for local heat recovery (soil & air-to-air). The Urban plan will be labelled as follows:
Energy label: A+ / Water label: A+ / ‘Green’ label: A+, Dutch Green Building Council / ‘overall’ label’: “Outstanding” .

SCHIPHOL THE GROUNDS 2030 229
Fig 183. Innovative car-share parking optimization at short distance of (e-) public transportation.
Fig 184. Example of integration of high-frequent, highly-sustainable e-rope mobility concepts
Fig 185. Combined concepts of e-rope mobility and car-share services
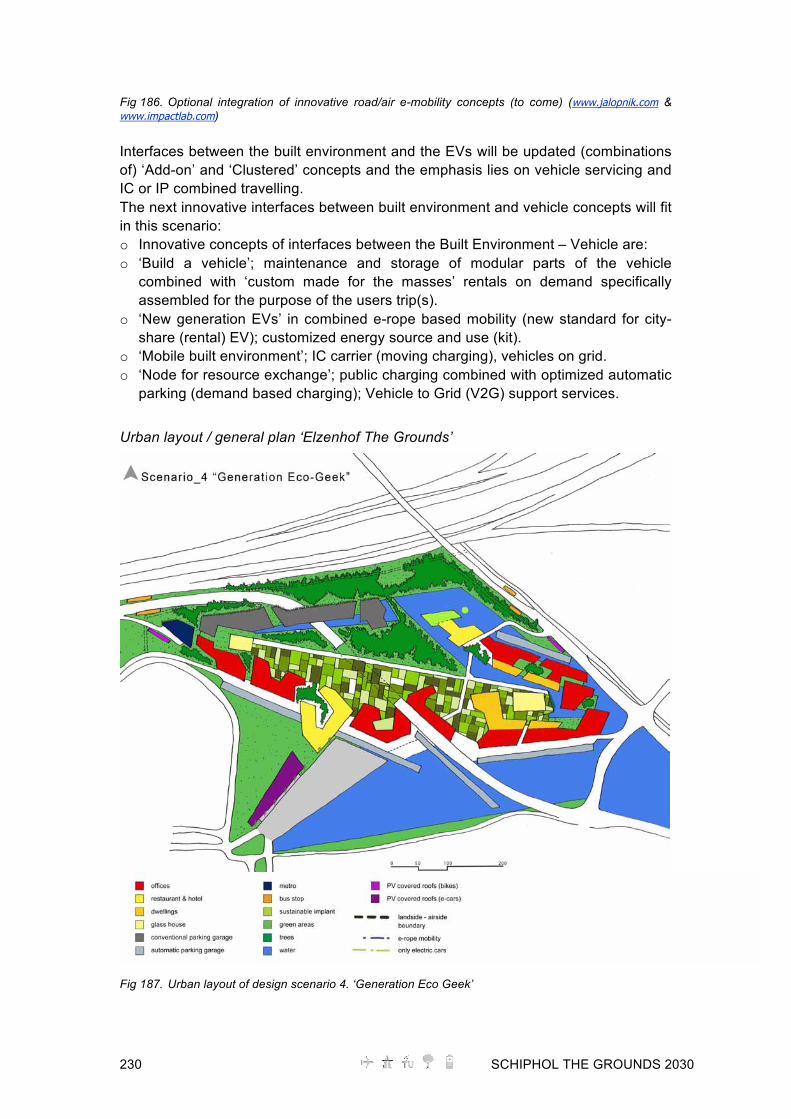
230 SCHIPHOL THE GROUNDS 2030
Fig 186. Optional integration of innovative road/air e-mobility concepts (to come) (www.jalopnik.com & www.impactlab.com) Interfaces between the built environment and the EVs will be updated (combinations of) ‘Add-on’ and ‘Clustered’ concepts and the emphasis lies on vehicle servicing and IC or IP combined travelling. The next innovative interfaces between built environment and vehicle concepts will fit in this scenario: o Innovative concepts of interfaces between the Built Environment – Vehicle are: o ‘Build a vehicle’; maintenance and storage of modular parts of the vehicle
combined with ‘custom made for the masses’ rentals on demand specifically assembled for the purpose of the users trip(s).
o ‘New generation EVs’ in combined e-rope based mobility (new standard for city-share (rental) EV); customized energy source and use (kit).
o ‘Mobile built environment’; IC carrier (moving charging), vehicles on grid. o ‘Node for resource exchange’; public charging combined with optimized automatic
parking (demand based charging); Vehicle to Grid (V2G) support services.
Urban layout / general plan ‘Elzenhof The Grounds’
Fig 187. Urban layout of design scenario 4. ‘Generation Eco Geek’

SCHIPHOL THE GROUNDS 2030 231
Evaluation of scenarios features and building program In previous paragraphs the four design scenarios have been translated and visualized for the ‘Elzenhof The Grounds’ area. For Scenarios 1 (‘Time to eat the dog’) and Scenario 2 (‘As good as it gets’) the most important features and factors on influence on electric mobility and the program of the built environment have been summarized in Table 38 The same is done for Scenario 3 (‘Footprints on the water’) and Scenario 4 (‘Generatoin Eco-Geek’) in Table 39. Table 38. Summary of traits of the design scenarios 1 ‘Time to eat the dog’, and 2 ‘As good as it gets’.

232 SCHIPHOL THE GROUNDS 2030
Table 39. Summary of traits of the design scenarios 3 ‘Footprints on the water’, and 4 ‘Generation Eco-Geek’.
The more specific figures on exact amounts of cars and the ways how to be integrated in the built environment (parking) in the different scenarios can be reviewed in Table 40. Together with those figures different dimensions of the different building programs have been summarized in Table 41.

SCHIPHOL THE GROUNDS 2030 233
Table 40. Required number of parking places in the four design scenarios.
Table 41. Dimensions and specifications of buildings and parking space of 4 scenarios at ‘Elzenhof The Grounds’
The four scenario's are evaluated using a comprehensive set of six criteria: Urban design, Climate adaptation, Flexibility, Parking, Public transport, Environmental impact. Table 42 shows the outcomes. Urban design

234 SCHIPHOL THE GROUNDS 2030
Urban design deals with the relation between buildings and the city with public space and infrastructure as important intermediary elements between the two. Scenario 1 provides poor relations between buildings and public space. Scenario 4 effectively creates a large campus like court that allows links and relations between the buildings. Climate adaptation
The creation of more surface water is the most prominent climate adaptation requirement in The Netherlands. It responds to the increased precipitation that will characterise future weather patterns. Scenario 1 contains the least surface water. Scenario 3 contains clearly the most. Flexibility
Each urban plan needs a certain level of flexibility that allows the plan to respond to the requirements of owners, builders or developers. Scenario 3 presents the most rigid design. Each building is part of a small cluster and all clusters are more or less the same. Scenario 4 seems to allow the most freedom to develop buildings in different shapes and sizes. Parking
The parking solution presented in Scenario 3 is the one that is most detached from the buildings while the underwater connection with its surrounding roads is the most complicate. Scenario 4 presents different solutions that are well linked to both the road network and the real estate development. Public transport
Scenario 1 only offers a bus connection. Scenario 4 offers a metro connection and a direct rope connection to the Schiphol Airport transport hub. Environmental impact
The site is plagued by different sources of noise pollution. Scenario 3 with its open water provides the least protection against the impact of the A4 and A9 motorways, and against the noise of Amsterdam Airport Schiphol. Scenario 4 is effectively using the buildings and parking structures to create an large court that is shielded from most of the noise production in its vicinity.
Table 42. Summary of evaluation assessment of the 4 design scenarios at ‘Elzenhof The Grounds’

SCHIPHOL THE GROUNDS 2030 235
As can be seen in Table 42 the overall score of design Scenario 4 ‘Generation Eco-Geek’ is highest. Apart from this, the same scenario also contains most innovations for both integration of EVs and related charging options. Finally, the conceptual design offers excellent opportunities to elaborate environmental technologies and positive consequences of EV integration as for urban climate and urban comfort.
5.2.3 Integrated urban mobility and electric charging concepts Different concepts regarding electric mobility have been defined in the DIEMIGO sub research by the Faculty of IDe and after an assessment were awarded to and integrated into the different plans for ‘Elzenhof The Grounds’ within the four design scenarios. In this paragraph all innovative concepts will be summarized and explained concerning their function and/or interfaces between the built environment and vehicle concepts. ‘Do anything box’ This concept surplus robustness to sustain unlimited connection with (different) systems; any electronic device with its transformer can be hooked in to the system attached to the conventional electricity grid.
‘EV (schi)pool system’ This system facilitates parking combined with charging facilities and good car pool services at The Elzenhof hub. It is appropriate for all different sizes of EVs that can be charged on the owners demands, this includes battery swapping. This modern upgraded parking facility is equipped with restrooms and kiosks and has a good public transport connection with Schiphol Plaza.
‘Schiphol Energy card’ (sEC) This is a personalized card that licenses its holder to limited and controlled access of EVs & public transport. Different forms of transportation are accessible and will charge the cardholder according to energy use.
‘Better tomorrow!’ This is the name of EV-service stations. On The Elzenhof they can provide a standard charging station for different types of EVs. At the airside of The Elzenhof their station can provide battery-swapping facilities for the airside fleet. The stations can have smart grid connections or provide a V2G function.
‘Seamless mobility’ This service positions EVs divided over The Elzenhof area provided with their own park and charging places in the built environment where they can be charged and maintained when required. Users pre-plan their trip digitally and get access to a nearby-stationed EV that can fulfil its user’s demands. The built environment (BE) maintains EVs automatically by the surplus of sustainable sources; EVs total battery capacity is used as storage for electricity and provide a V2G function. ‘Service oriented autonomous vehicles’
236 SCHIPHOL THE GROUNDS 2030
‘Plug and play docking stations’ with access and control communication between the BE and EV and smart vehicle distribution based on Parking availability, user demand – usage patterns -modal split-, and external data).
‘Complete package’ With EVs integrated into houses and offices, this service provides the users with predetermined packages of energy for the households/offices and EVs where the EVs form a part of the energy system when parked (and charged) (V2G as well). Collective users (in offices) have limited access. ‘Self-sufficient communities’ This is a location-based system with shared EVs optimized to the community needs. Effective utilization of clean but intermittent power sources. These communities EVs are totally charged with local produced energy and have communal parking places. ‘Modular Society’ This system provides EV-owners with wheels with integrated batteries. The EVs without the e-wheels are owned by the user. The e-wheels are leased and owned by the ‘modular society’. They provide in small e-wheel swapping and charging platforms that are always located nearby. ‘Compact and stacked’ This is a ‘cradle-to-cradle’ (C2C) based concept that links energy and material use with waste and consumption to accomplish a more energy responsible behaviour with consumers. Public charging combined with optimized automatic parking (demand based charging). ‘Node for resource exchange’ Land-Airside e-exchange (Land2Air, Air2Land) integrated in LS/AS separation (fence and/or building), and ‘Swap & Drive’ station at highways with privileged entrance/exit ‘Build a vehicle’ This service provides users with customized vehicles on customs demands. These ‘e-rentals' are modular vehicles assembled according to user preferences for travelling style and weather conditions. Maintenance, charging and storage of modular parts occurs at the rental station. ‘Mobile built environment’ IC carrier (moving charging), vehicles on grid with inductive charging (both static and dynamic). Vehicle (re)distribution is built-environment incentives based. ‘New generation EVs’ These EVs set a new standard in electric mobility. They are efficient and personalized using different forms of parking and infrastructure that are flexible and customizable.
5.2.4 Conclusion (urban concepts)
SCHIPHOL THE GROUNDS 2030 237
o The Urban Indicator is a useful tool for calculating the number of electrical vehicles and the pressure on available space and amenities for future scenarios based on urban design proposals. It offers opportunities to estimate effects on its main variables, like future use and users of the area (different groups of users with different purposes and different modal splits), and in that way to predict the charging requirements at the location.
o Schiphol ‘Elzenhof The Grounds’ will accommodate offices, hotel(s), amenities
and associated parking places, but also important parking accommodations for additionally attracted EVs and belonging accommodation of high frequent /high quality public transport to the airport and surrounding industrial and business areas.
o After assessment of the four design scenarios for Urban design, Climate
adaptation, Flexibility, Parking, Public transport, Environmental impact, and determination of potentials for innovative EV/BE interfaces and new urban/building typologies the fourth scenario, ‘Generation Eco-Geek’ -‘deep green with vehicle to grid’ & ‘grid to vehicle’ exchange- is chosen to be elaborated within this sub research more in detail.
o Most promising EV/BE interfaces and charging concepts determined in close
cooperation with other DIEMIGO sub research groups are service oriented packages, customized concepts, smart charging concepts based on static and dynamic inductive charging and attached renewable energy sources.
5.3 Grid and charging concepts Grid Design Research Method Simulation is used to investigate the grid influence of charging an EV. The weekly load profile is calculated to design the distribution grid, selecting the transformer, cable and optimal charging mode for an EV. This simulation uses the Matlab codes developed in this project. The procedure is planned as follows and is discussed in detail in the next sections.
• Modelling procedure – modelling of the weekly load profile of the business park and modelling of the charging load of EVs based on the assumed travel pattern.
• Design procedure – choice of the optimal charging mode and comparison of different grid topologies.
• Economic analysis – calculation of the economics of the design, including the benefits of renewable energy and smart charging.
First, the travel pattern is investigated, then the load pattern is studied, and finally the charging pattern is discussed.

238 SCHIPHOL THE GROUNDS 2030
5.3.1 Travel Pattern
5.3.1.1 Initial Assumption Due to an initial lack of necessary data, some assumptions on the travel pattern were made by the author in order to begin the project. Travel patterns, such as car usage and average driving distance in Elzenhof, are assumed to be consistent throughout the Netherlands. The initial assumptions are discussed below. The travel pattern, including car usage and driving distance, is crucial for the estimation of the charging load of an EV. (NHTS 2001; MON 2006; Madian, Walsh et al. 2008)investigated the travel pattern by means of surveys. From (MON 2006), the travel pattern in 2006 in the Netherlands can be deduced, and is plotted in Fig 188 and Fig 189.
Fig 188. Traffic pattern - car usage in the Netherlands
Fig 189. Traffic pattern - driving distance in the Netherlands
SCHIPHOL THE GROUNDS 2030 239
Besides the Netherlands’ travel pattern in (MON 2006), assumption of the user groups of the new parking places in The Grounds/Elzenhof were initially made for this project, when no information on the user group was received from the project partners. For this specific location, the user group assumption cannot be found in literature and is therefore assumed in this report and the initial scenario of 600 EVs, the electrical load of The Grounds is calculated. Table 43. Assumption of EV user groups in DIEMIGO project Group Percentage among total EVs Explanation Long parking 5% Cars are parked for more
than one week. Local 30% People that live around the
parking area of The Grounds/Elzenhof, whose travel patterns are the same as (MON 2006)and shown in Fig 188 and Fig 189.
Commuting 65% People that drive to the business park The Grounds/Elzenhof (50% arrive at 8:00 and leave 16:00, 50% arrive at 9:00 and leave 17:00).
5.3.1.2 Final Pattern However, after discussions with the project partners, major changes were made to these initial assumptions.
• The local drivers became the minor group. • The long parking group became the dominant group. • The commuting group became the middle group and fast charging is required
for this group. The detailed travel pattern in Elzenhof can now be found in the DIEMIGO Urban Indicator section.
5.3.2 Load Profile of Different Buildings
5.3.2.1 Office Load Initially, only the office buildings were considered in this project, and later the hotel and leisure buildings were included. (Yik, Burnett et al. 2001; Lam, Li et al. 2003; Pedersen, Stang et al. 2008) discuss the electrical load of office buildings and in (Pedersen, Stang et al. 2008), key figures for the electrical load of these buildings are suggested:
• Electrical load during weekdays = 23.8 W/m2 • Electrical load during weekends = 13 W/m2
However, after comparing the results from the survey on the office electricity load in Netherlands, the design load for the office building is specified as:
• Electrical load during weekdays = 12 W/m2 • Electrical load during weekends = 6.6 W/m2
The typical daily load profile is also drawn in (Pedersen, Stang et al. 2008), as shown in Fig 190.
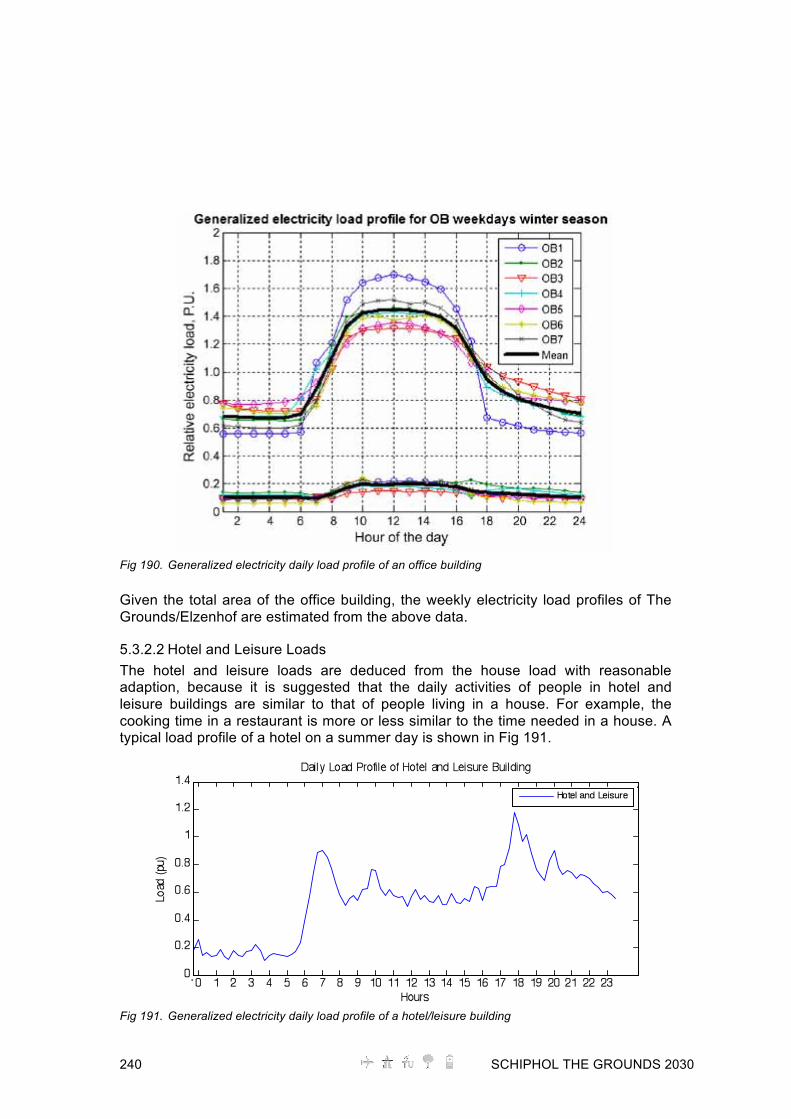
240 SCHIPHOL THE GROUNDS 2030
Fig 190. Generalized electricity daily load profile of an office building
Given the total area of the office building, the weekly electricity load profiles of The Grounds/Elzenhof are estimated from the above data.
5.3.2.2 Hotel and Leisure Loads The hotel and leisure loads are deduced from the house load with reasonable adaption, because it is suggested that the daily activities of people in hotel and leisure buildings are similar to that of people living in a house. For example, the cooking time in a restaurant is more or less similar to the time needed in a house. A typical load profile of a hotel on a summer day is shown in Fig 191.
Fig 191. Generalized electricity daily load profile of a hotel/leisure building

SCHIPHOL THE GROUNDS 2030 241
5.3.3 Charging Pattern
5.3.3.1 Initial Assumption The charging pattern is strongly correlated with the travel pattern. Initially, the number of EVs that belong to the residents living near The Grounds/Elzenhof is assumed to be dominant. Thus, three charging patterns for the local group were assumed. The charging patterns for the long parking and commuting groups only consider dumb charging and smart charging.
5.3.3.1.1 Dumb charging For the commuting user group, it was assured that the EVs are charged to at least 80% in The Grounds/Elzenhof before departing in the afternoon. The charging time is therefore between 8:00–17:00 and the EVs are charged directly after their arrival to the parking spaces. Fast charging is not considered here, because the load of dumb slow charging is already significant. For the long parking group, the EVs are also charged directly after their arrival, and it is assumed that they arrive at The Grounds/Elzenhof on a Monday.
Fig 192. Dumb charging mode
5.3.3.1.2 Delayed uncontrolled Charging For the commuting user group, charging is evenly distributed during the daytime of the working days, between 8:00–17:00. Fast charging is considered, but the number of fast charging stations is assumed to be two in this study. For the long parking group, the charging is evenly distributed across all of the weeknights, between 22:00–7:00, because of the low price of electricity price during this time.

242 SCHIPHOL THE GROUNDS 2030
Fig 193. Delayed off-peak charging mode
5.3.3.1.3 Smart Charging For the commuting group, the charging pattern is the same as “controlled charging”, in which charging is evenly distributed between 8:00–17:00. For the long parking group, the EVs are charged with smart charging, which takes into account the grid limitation, improves the grid integration of renewable energy, and provides a V2G function.
Fig 194. Smart charging mode
5.3.3.2 Final Pattern With the new travel pattern indicated in the DIEMIGO Urban Indicator, the long parking group is dominant. Therefore, the charging patterns are adjusted according to the change in travel patterns. There are three charging patterns: dumb charging, controlled charging, and smart charging.
5.3.3.2.1 Dumb charging
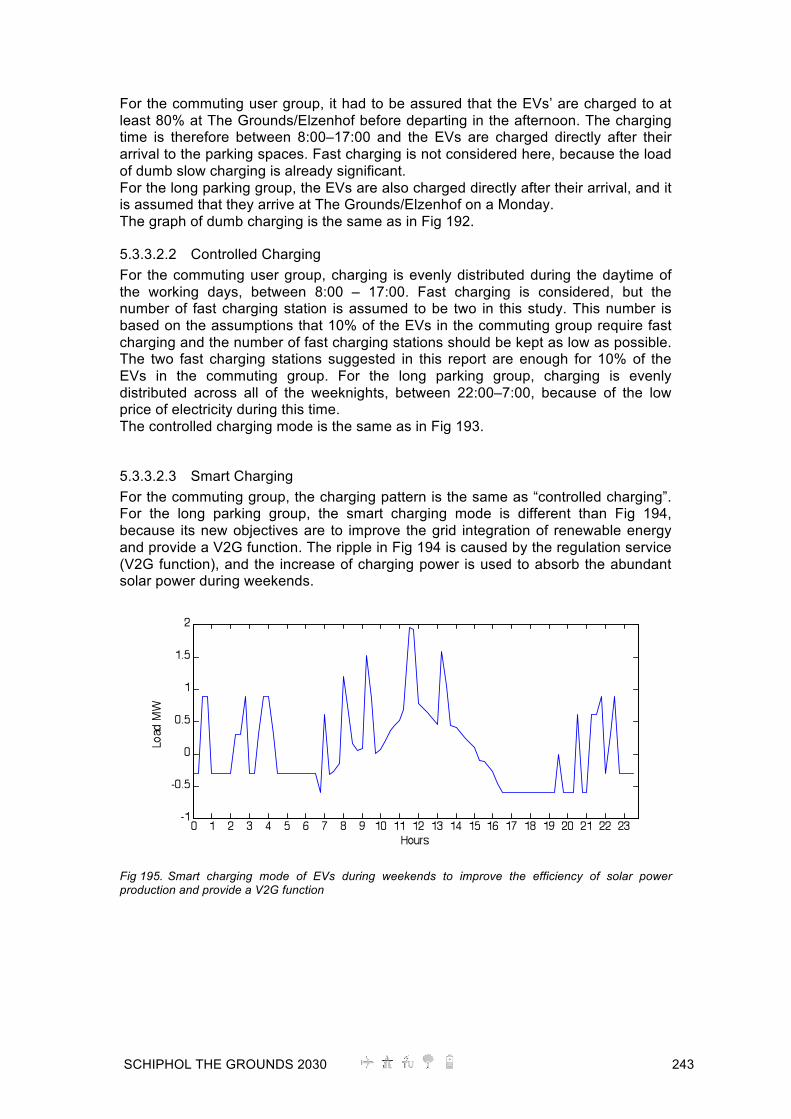
SCHIPHOL THE GROUNDS 2030 243
For the commuting user group, it had to be assured that the EVs’ are charged to at least 80% at The Grounds/Elzenhof before departing in the afternoon. The charging time is therefore between 8:00–17:00 and the EVs are charged directly after their arrival to the parking spaces. Fast charging is not considered here, because the load of dumb slow charging is already significant. For the long parking group, the EVs are also charged directly after their arrival, and it is assumed that they arrive at The Grounds/Elzenhof on a Monday. The graph of dumb charging is the same as in Fig 192.
5.3.3.2.2 Controlled Charging For the commuting user group, charging is evenly distributed during the daytime of the working days, between 8:00 – 17:00. Fast charging is considered, but the number of fast charging station is assumed to be two in this study. This number is based on the assumptions that 10% of the EVs in the commuting group require fast charging and the number of fast charging stations should be kept as low as possible. The two fast charging stations suggested in this report are enough for 10% of the EVs in the commuting group. For the long parking group, charging is evenly distributed across all of the weeknights, between 22:00–7:00, because of the low price of electricity during this time. The controlled charging mode is the same as in Fig 193.
5.3.3.2.3 Smart Charging For the commuting group, the charging pattern is the same as “controlled charging”. For the long parking group, the smart charging mode is different than Fig 194, because its new objectives are to improve the grid integration of renewable energy and provide a V2G function. The ripple in Fig 194 is caused by the regulation service (V2G function), and the increase of charging power is used to absorb the abundant solar power during weekends.
Fig 195. Smart charging mode of EVs during weekends to improve the efficiency of solar power production and provide a V2G function

244 SCHIPHOL THE GROUNDS 2030
5.3.4 Scenario Results (Generation Eco-Geek) In this section, the electrical load profile of The Grounds/Elzenhof will be discussed, including: office load, hotel load, leisure load, solar production, load of dumb slow charging, load of controlled charging, and load of smart charging, both in a daily and weekly profile. From the load profile, the optimal charging method can be selected, the electrical grid is then designed, and finally the economic analysis can be carried out. Only the results of the “Generation Eco-Geek” scenario are presented here. Results of the other scenarios can be found in Appendix 9.
5.3.4.1 Office, Hotel and Leisure Load Profile of The Grounds/Elzenhof
Fig 196. Weekly load profile of Elzenhof in 2030
Fig 197. Daily load profile of The Grounds/Elzenhof in 2030

SCHIPHOL THE GROUNDS 2030 245
5.3.4.2 Solar Production Profile The total available area of solar panels at The Grounds/ Elzenhof is assumed to be 35% of the office building area, as indicated in the DIEMIGO Urban Indicator document. The efficiency of solar production is assumed to be 30% in the year 2030, while it is currently 20%. According to the project partners, climate change will increase solar production by 4.5% in the year 2030. With this information and the assumptions that have been made, the available solar production of The Grounds/Elzenhof is calculated as shown in Fig 198.
Fig 198. Weekly solar production profile in Elzenhof in 2030 It can be seen that the solar production is higher than the local load not only on weekends, but also on weekdays. With smart charging, the abundant solar energy can be used by the EVs. This will be more economical than sending the abundant solar energy to the grid, due to the estimated low tariff of solar energy in the year 2030.
5.3.4.3 Charging Load In this section, the loads of two charging patterns are presented, which are dumb slow charging and controlled charging. For both charging patterns, the commuting group contains two sub-groups: one sub-group arrives at 8:00 and leaves at 16:00; another sub-group arrives at 9:00 and leaves at 17:00. Smart charging will be discussed in the next section, following discussion of its economic benefits. Smart charging will not only distribute the charging load, but will also improve the economic efficiency of solar power production and raise revenues with a V2G function.
5.3.4.3.1 Dumb Slow Charging With dumb slow charging, the EVs are charged directly after their usage, without considering the grid limitation. The load of dumb slow charging shows high power peak, due to the simultaneous charging of many EVs. The highest peak power is caused by the charging of the EVs of the long parking group, which are assumed to arrive at Elzenhof on Monday and are all charged simultaneously at 22:00 o’clock.

246 SCHIPHOL THE GROUNDS 2030
Fig 199. EV/PHEV direct-slow charging weekly load profile in 2030
Fig 200. EV/PHEV direct-slow charging daily load profile in 2030
Fig 201. Weekly profile of total Load of Elzenhof with dumb charging and solar production in 2030

SCHIPHOL THE GROUNDS 2030 247
Fig 202. Weekly grid power flow at the main 50kv/10kv transformer of Elzenhof with dumb charging in 2030 The dumb charging option even with slow charging is not acceptable. This is due to the following:
• The maximum load due to charging is much higher than the total electrical load of Elzenhof without charging. The high peak power requires a large update of the power network, which is very costly.
• The solar production is higher than the load even during weekdays. It has to either be sold to the grid at a low price (due to the estimated low solar tariff in the year 2030) or it has to be dumped.
However, as the charging of EVs can be controlled, with the appropriate charging mode the above shortcomings can be avoided. Controlled charging is discussed in the next section.
5.3.4.3.2 Controlled Charging With controlled charging, the charging of EVs is distributed across the possible charging period. For the commuting (daytime parking) group, the charging time is between 8:00–17:00 o’clock. Fast charging is considered with limited fast charging stations, which are assumed to be two in this study.
Fig 203. EV/PHEV controlled charging weekly load profile in 2030

248 SCHIPHOL THE GROUNDS 2030
Fig 204. EV/PHEV controlled charging daily load profile in 2030
Fig 205. Total Load of Elzenhof with controlled charging and solar production
Fig 206. Weekly grid power flow at the main 50kv/10kv transformer of Elzenhof with controlled charging

SCHIPHOL THE GROUNDS 2030 249
Controlled charging is a much better option than dumb charging for the following reasons:
• The power peak is limited from 30 MW to 2 MW at the main transformer. • The solar power fits the electrical load during weekdays.
However, it has one shortcoming: • The solar power during weekends is much larger than the load.
The smart charging method is proposed in order to solve this problem. It will be discussed in the next section, after an analysis of the economic aspects of this project. The economic analysis determines the main functions of the smart charging.
5.3.5 Economic Analysis and Grid Design
5.3.5.1 Solar Production and Benefits
Fig 207. Cost of solar production and electricity from grid From Fig 207, it can be seen that the solar production cost will be more inexpensive than the grid electricity cost from the year 2020. In the year 2030, it will be very economically efficient to use solar power for local energy. The annual savings of using solar energy is 2.23 Million Euros, if the solar production is consistent during the summer and winter. However, in the Netherlands, radiation in the winter is much lower than in the summer, which makes the solar production in winter about 20% of
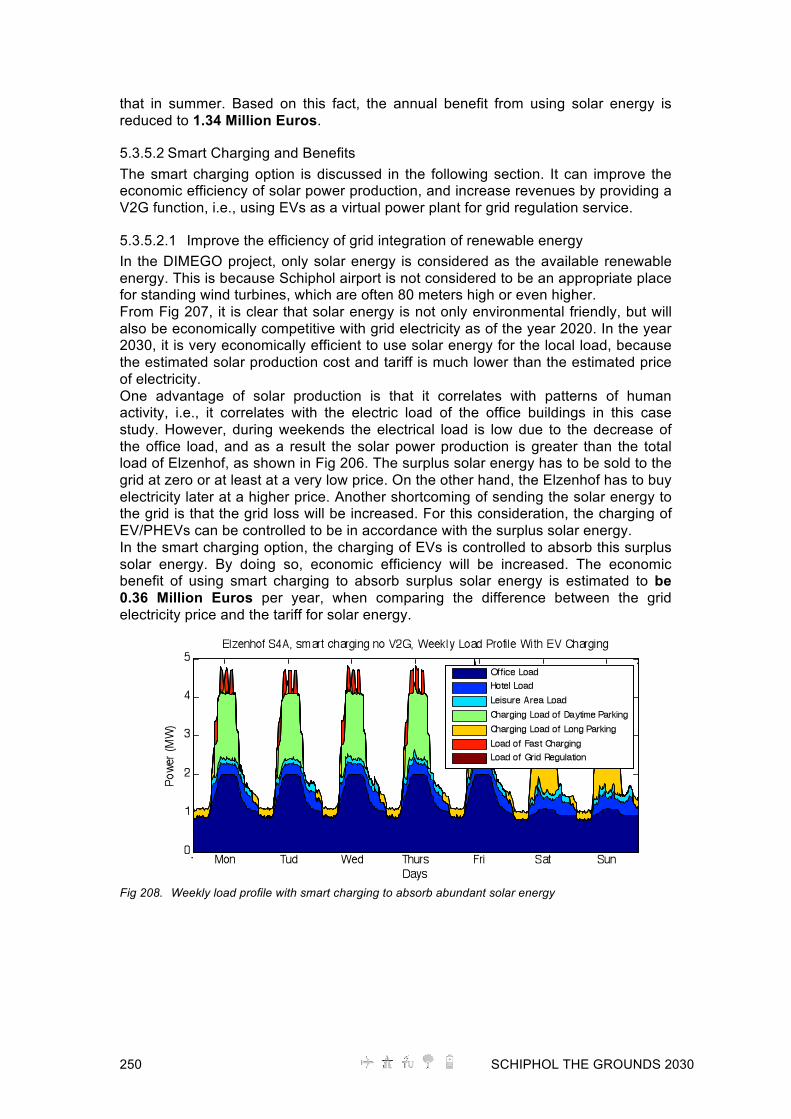
250 SCHIPHOL THE GROUNDS 2030
that in summer. Based on this fact, the annual benefit from using solar energy is reduced to 1.34 Million Euros.
5.3.5.2 Smart Charging and Benefits The smart charging option is discussed in the following section. It can improve the economic efficiency of solar power production, and increase revenues by providing a V2G function, i.e., using EVs as a virtual power plant for grid regulation service.
5.3.5.2.1 Improve the efficiency of grid integration of renewable energy In the DIMEGO project, only solar energy is considered as the available renewable energy. This is because Schiphol airport is not considered to be an appropriate place for standing wind turbines, which are often 80 meters high or even higher. From Fig 207, it is clear that solar energy is not only environmental friendly, but will also be economically competitive with grid electricity as of the year 2020. In the year 2030, it is very economically efficient to use solar energy for the local load, because the estimated solar production cost and tariff is much lower than the estimated price of electricity. One advantage of solar production is that it correlates with patterns of human activity, i.e., it correlates with the electric load of the office buildings in this case study. However, during weekends the electrical load is low due to the decrease of the office load, and as a result the solar power production is greater than the total load of Elzenhof, as shown in Fig 206. The surplus solar energy has to be sold to the grid at zero or at least at a very low price. On the other hand, the Elzenhof has to buy electricity later at a higher price. Another shortcoming of sending the solar energy to the grid is that the grid loss will be increased. For this consideration, the charging of EV/PHEVs can be controlled to be in accordance with the surplus solar energy. In the smart charging option, the charging of EVs is controlled to absorb this surplus solar energy. By doing so, economic efficiency will be increased. The economic benefit of using smart charging to absorb surplus solar energy is estimated to be 0.36 Million Euros per year, when comparing the difference between the grid electricity price and the tariff for solar energy.
Fig 208. Weekly load profile with smart charging to absorb abundant solar energy

SCHIPHOL THE GROUNDS 2030 251
Fig 209. Daily load profile with smart charging to absorb surplus solar energy
Fig 210. Weekly load profile of total electrical load with smart charging and solar production
Fig 211. Weekly grid power flow at the main 50kv/10kv transformer of Elzenhof
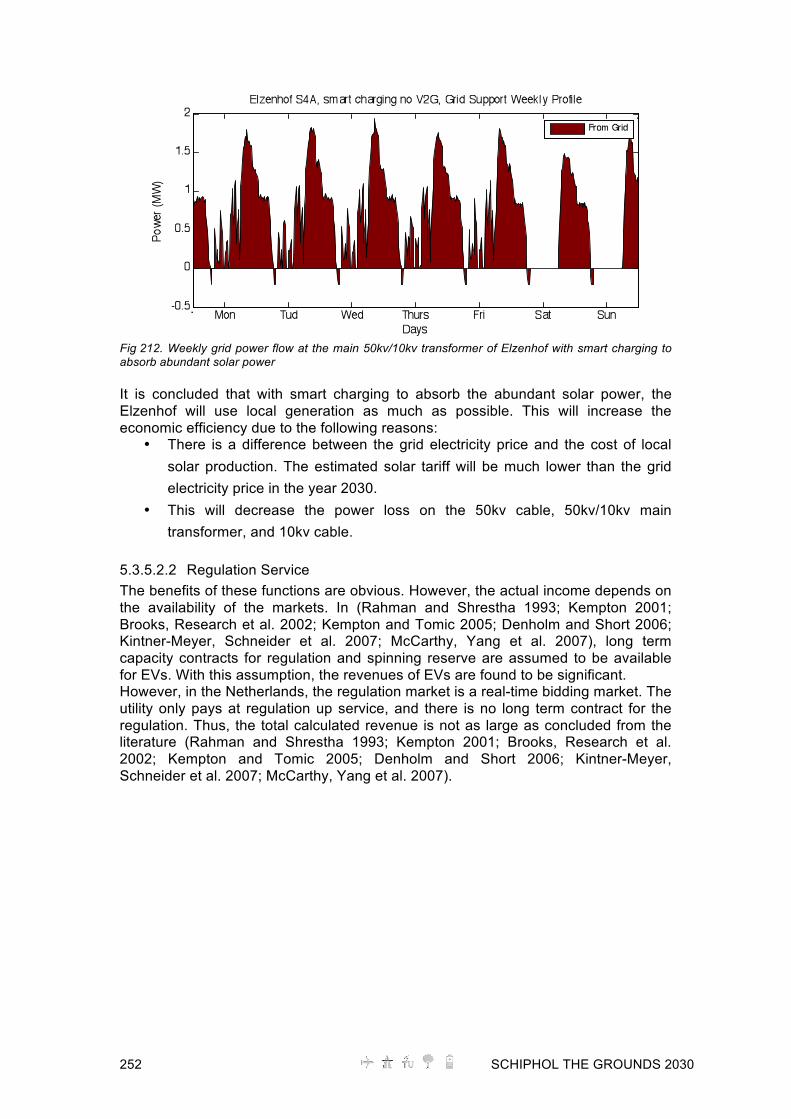
252 SCHIPHOL THE GROUNDS 2030
Fig 212. Weekly grid power flow at the main 50kv/10kv transformer of Elzenhof with smart charging to absorb abundant solar power It is concluded that with smart charging to absorb the abundant solar power, the Elzenhof will use local generation as much as possible. This will increase the economic efficiency due to the following reasons:
• There is a difference between the grid electricity price and the cost of local solar production. The estimated solar tariff will be much lower than the grid electricity price in the year 2030.
• This will decrease the power loss on the 50kv cable, 50kv/10kv main transformer, and 10kv cable.
5.3.5.2.2 Regulation Service The benefits of these functions are obvious. However, the actual income depends on the availability of the markets. In (Rahman and Shrestha 1993; Kempton 2001; Brooks, Research et al. 2002; Kempton and Tomic 2005; Denholm and Short 2006; Kintner-Meyer, Schneider et al. 2007; McCarthy, Yang et al. 2007), long term capacity contracts for regulation and spinning reserve are assumed to be available for EVs. With this assumption, the revenues of EVs are found to be significant. However, in the Netherlands, the regulation market is a real-time bidding market. The utility only pays at regulation up service, and there is no long term contract for the regulation. Thus, the total calculated revenue is not as large as concluded from the literature (Rahman and Shrestha 1993; Kempton 2001; Brooks, Research et al. 2002; Kempton and Tomic 2005; Denholm and Short 2006; Kintner-Meyer, Schneider et al. 2007; McCarthy, Yang et al. 2007).

SCHIPHOL THE GROUNDS 2030 253
Fig 213. Records of the Netherlands' regulation up/down costs in one day The total revenue of providing regulation up service in the Netherlands today is calculated from the real regulation price recorded in June 2009, and the scenario is Scenario 4 with 6100 long parking EVs which can participate in the regulation service. With an optimal assumption that the EV/PHEVs can always share the real-time bidding regulation market, the annual revenue from Elzenhof providing regulation service is estimated to be 0.19 Million Euros. It is calculated from the real price of the regulation market in the Netherlands. With a long term contract as stated in (Kempton and Tomic 2005), 0.014 €/kWh is for both regulation up and down, the annual revenue is 0.8 Million Euros, taking into account the grid limitation. The EVs can benefit economically from this long term contract, even if no electrical power is actually exchanged with the grid. If the grid is strengthened, i.e., four more 10kV cables are laid in Elzenhof for the grid regulation service, the annual revenue can reach 4 Million Euros, without taking into account the additional infrastructure cost. The above calculations do not include the wear-out cost of the batteries. The total load of Elzenhof with the regulation power from EVs is shown in Fig 214 and Fig 215.
Fig 214. Weekly load profile of Elzenhof with smart charging providing V2G function
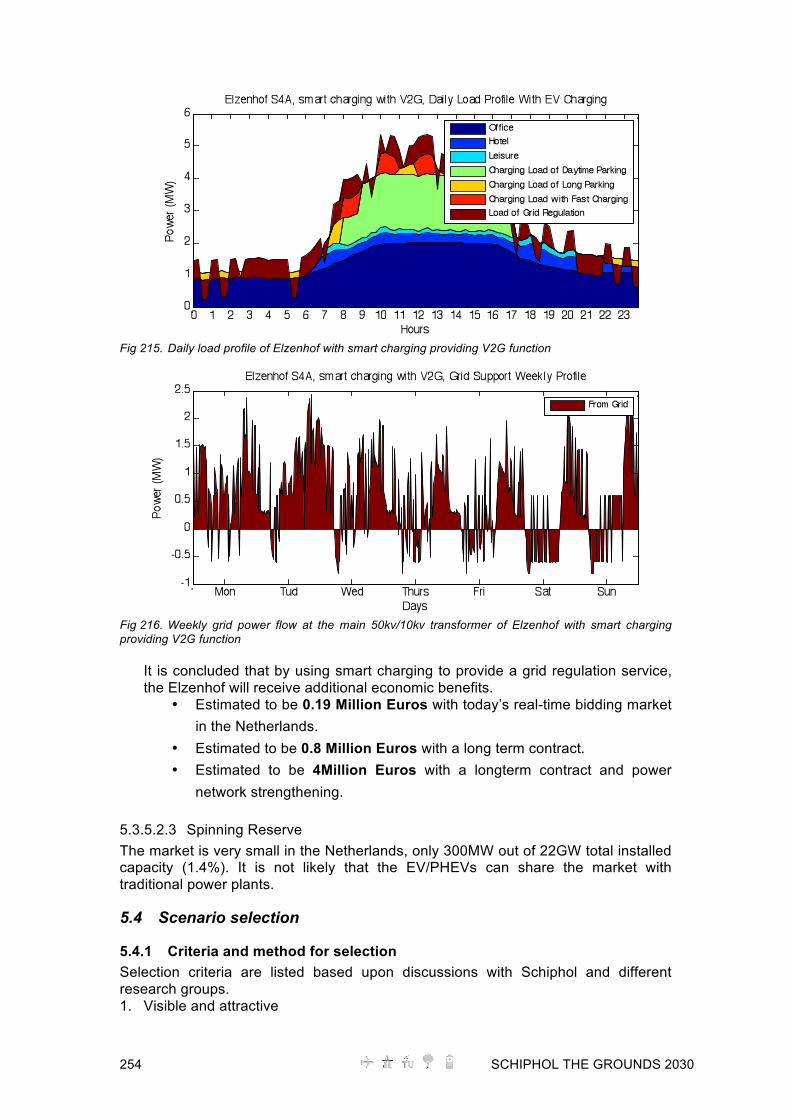
254 SCHIPHOL THE GROUNDS 2030
Fig 215. Daily load profile of Elzenhof with smart charging providing V2G function
Fig 216. Weekly grid power flow at the main 50kv/10kv transformer of Elzenhof with smart charging providing V2G function
It is concluded that by using smart charging to provide a grid regulation service, the Elzenhof will receive additional economic benefits.
• Estimated to be 0.19 Million Euros with today’s real-time bidding market in the Netherlands.
• Estimated to be 0.8 Million Euros with a long term contract. • Estimated to be 4Million Euros with a longterm contract and power
network strengthening.
5.3.5.2.3 Spinning Reserve The market is very small in the Netherlands, only 300MW out of 22GW total installed capacity (1.4%). It is not likely that the EV/PHEVs can share the market with traditional power plants.
5.4 Scenario selection
5.4.1 Criteria and method for selection Selection criteria are listed based upon discussions with Schiphol and different research groups. 1. Visible and attractive

SCHIPHOL THE GROUNDS 2030 255
2. Consequences and implications 3. Simple and real story 4. Academic guess and support of trends 5. Tangible which Schiphol can easily put on the table 6. Data and knowledge support on each aspect The above-mentioned aspects are derived into following questions and statements to select one scenario direction. 1. Visible and attractive
a. Is it a ‘trend’, ‘a way forward’ or ‘qualitative future’? b. Does it match with ‘priorities and interests of Schiphol’? c. Will it be attractive to its stakeholders? d. How much will be the Schiphol’s influence on it? e. Support of strong (characteristic/key) words f. Adequate and simple illustration
2. Consequences and implications
a. Predictability of consequences (of functionalities) b. Outcomes
3. Simple and real story
a. Clarity of the scenario b. The detail in three sentences
4. Academic guess
a. How much scientific studies support? b. What trends say?
5. Tangible with Schiphol can easily put on the table
a. Logical future (Chronology/ simple progression/ trend/ a way forward/ qualitative future/ what Schiphol wants!?)
b. Feasibility c. Trialability
6. Data and knowledge a. Urban indicators b. Technology assessment part
5.4.2 Selected Scenario Delineation Generation Eco-Geek is the selected scenario. Summary The following scenario describes a world in which rapid technological development and minimalistic design principles play a key role. It marks a change in consumer behaviour, as people exhibit a clear preference for value-based products and attention to detail. Members of the society described in this scenario have a long-term perspective, which is manifested in their interest in education, collaboration, and innovation. The characteristics of this scenario can be depicted by means of a mind-map in which key traits are identified and their relationship to each other is illustrated with arrows.
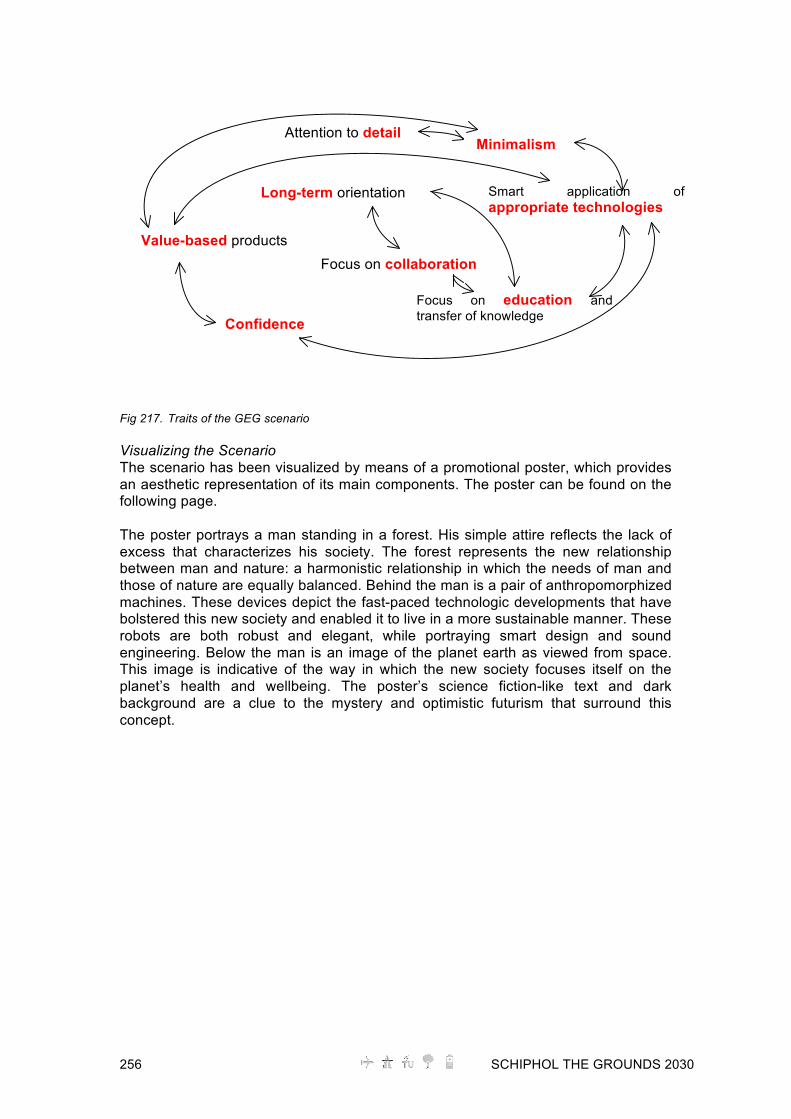
256 SCHIPHOL THE GROUNDS 2030
Fig 217. Traits of the GEG scenario Visualizing the Scenario The scenario has been visualized by means of a promotional poster, which provides an aesthetic representation of its main components. The poster can be found on the following page. The poster portrays a man standing in a forest. His simple attire reflects the lack of excess that characterizes his society. The forest represents the new relationship between man and nature: a harmonistic relationship in which the needs of man and those of nature are equally balanced. Behind the man is a pair of anthropomorphized machines. These devices depict the fast-paced technologic developments that have bolstered this new society and enabled it to live in a more sustainable manner. These robots are both robust and elegant, while portraying smart design and sound engineering. Below the man is an image of the planet earth as viewed from space. This image is indicative of the way in which the new society focuses itself on the planet’s health and wellbeing. The poster’s science fiction-like text and dark background are a clue to the mystery and optimistic futurism that surround this concept.
Attention to detail
Long-term orientation
Minimalism
Smart application of appropriate technologies
Value-based products Focus on collaboration
Confidence
Focus on education and transfer of knowledge
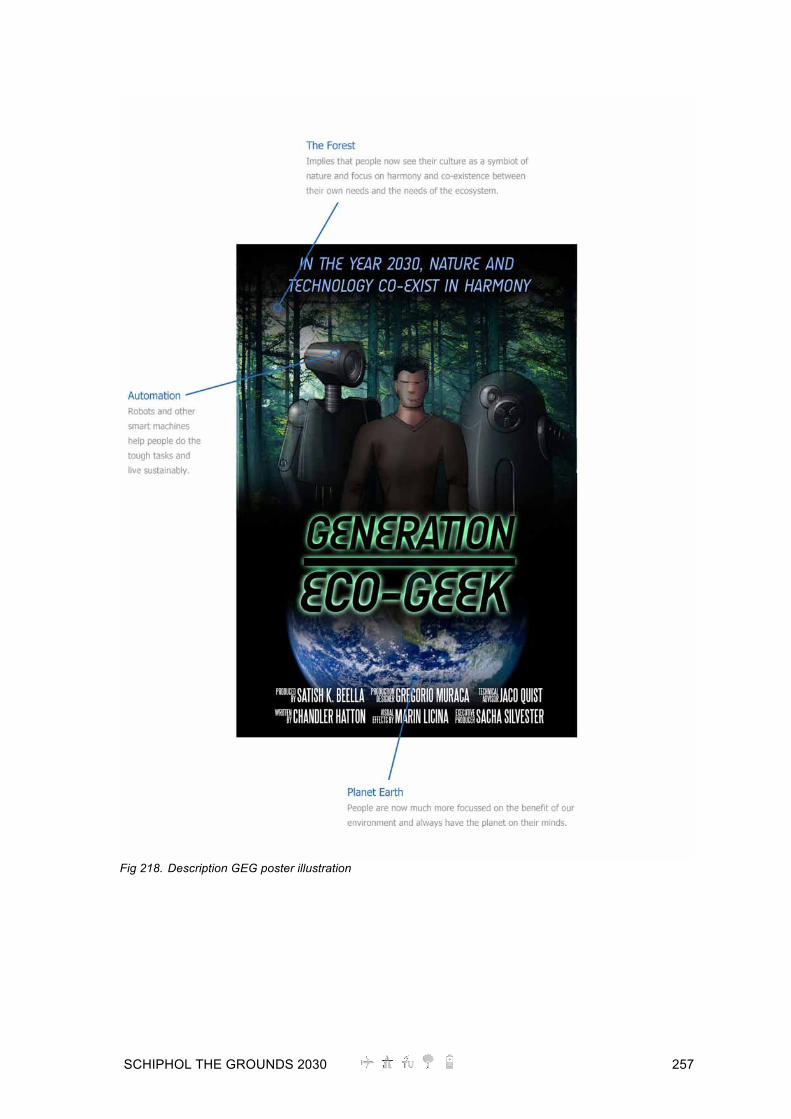
SCHIPHOL THE GROUNDS 2030 257
Fig 218. Description GEG poster illustration

258 SCHIPHOL THE GROUNDS 2030
Development of the Generation Eco-Geek scenario This scenario was developed by exploring the critical forces specified in the analysis phase of the DIEMIGO project. These critical forces were the basis for 14 preliminary scenarios, which were later consolidated into 4 final scenarios. Each preliminary scenario was based on a combination of two to four critical forces that were assumed to play a dominant role. “Generation Eco-Geek” emerged from two preliminary scenarios; the critical forces relevant to these scenarios included sustainable behaviour, CO2 neutral economy, vehicle usership, fast charging developments, and improvements in battery technology. In this case, the latter two forces have been extrapolated to developments in electric vehicle technology. Both preliminary scenarios were centred on high technology, minimalistic, value-based products and sustainable behaviour and also on the critical forces listed above. The role of Schiphol In this scenario, Schiphol will play a key role in introducing new technologies for both sustainable development and electric mobility. The airport area will become a showroom for modern technological advancements: renewable energy generation technologies, sustainable resource management principles, innovative mobility concepts, and emergent vehicle infrastructures will premier in the offices, shops, and airport facilities. These systems that will be initially implemented at Schiphol may later be exported to cities throughout the Netherlands and abroad. Schiphol acts as a main hub in the Netherlands’ mobility system, serving as the meeting point and interchange in the heart of the Randstad7. As such, the airport operates like a well-oiled machine: it is highly automated, easily navigated, and always up to date with real-time travel information of planes, trains, and ground transportation. Efficient use of space and the elimination of extraneous systems and/or processes have reduced the demand for expansion, allowing the airport to remain compact and streamlined. Schiphol harbours several thriving business parks. The companies located in these business parks tend to be characterized as erudite, future oriented, and collaborative. Flexible office environments allow these companies to create ideal work environments. The airport encourages the people working in the Schiphol business parks as well as travellers to utilize Schiphol’s innovative mobility systems. Trends for the year 2030 Several trends underpin the Generation Eco-Geek scenario for 2030. These trends are articulated below:
• Products and infrastructures are increasingly modular and multi-functional and can therefore be utilized in a variety of manners.
• There is pervasive access to education and the average member of society is very tech-savvy.
• There has been a significant increase in automation in the transit sector. Many products can intelligently interact upon contact as well as remotely. This level of automation is widely accepted throughout the consumer-base.
7 It consists of the four largest Dutch cities (Amsterdam, Rotterdam, The Hague and Utrecht), and the surrounding areas.

SCHIPHOL THE GROUNDS 2030 259
• Consumers embrace a variety of mobility concepts, including innovative public transport services, linked mobility systems, electric cars, and smaller, niche vehicles.
• Europe has managed to allocate sufficient funding towards the development of renewable energy production. This enabled the EU to meet its 20-2020 energy goals. In the year 2030, 35% of the energy in the Netherlands comes from renewable sources (wind and solar).
Challenges for the year 2030 The realization of the Generation Eco-Geek scenario in 2030 will require several challenges to be overcome. The key challenges associated with this scenario are as follows:
• Technology must be adjusted to support products characterized by the expression “less is more”, rather than products that adhere to the maxim “bigger is better”.
• Consumer behaviour must be adapted to reflect the core values of simplicity and minimalism.
• Local identities must be preserved and culture-specific needs be met in a world that is both minimalistic and high-tech.
• Production must remain efficient and obsolete technologies avoided despite the rapid pace of technological development.
5.4.2.1 Scenario Implications Effect on the built environment Schiphol’s new complex will embody the qualities expressed by the Generation Eco-Geek scenario. The scenario lends itself to compact and flexible, multi-purpose buildings and versatile infrastructures. Communication between the built environment and its users will take place through explicative design and clear, minimalistic indicators, such as those prescribed by the “Naked Streets” principle. The construction will take on the form of a wall that connects several low-rise nodes constructed in the green. This wall will act as a barrier, separating the complex from the noisy and chaotic outside world. The internally oriented complex will be a quiet and peaceful place to do business. Mixed-use buildings will house a range of functions, including offices, hotels, and leisure facilities. These facilities will be constructed using the tenants of sustainable urban and architectural design. Decentralization will enable smart energy management; energy generation and principle energy use as well as climate control will be decentralized. Two types of workspaces will be available: ‘free offices’ and ‘personal offices’. The ‘free office’ format is a format in which employees will share workspaces, relocating themselves according to their daily needs. In contrast, personal offices will be individualized and highly customizable. Effect on infrastructure The complex’s infrastructure will be optimized to accommodate the mobility needs of both the people working in the Schiphol business parks as well as travellers. Like the buildings, the infrastructure will be located at the exterior of the complex site, maintaining an open green space in the centre. The infrastructural arteries that transverse the complex will be located underground.

260 SCHIPHOL THE GROUNDS 2030
The new complex will provide short-term (workday) parking for the complex’s employees as well long-term parking for travellers. Emphasis will be placed on accommodating electric vehicles; these vehicles may be parked in special, automated lots. Connections to Schiphol plaza will serve the needs of travellers as well as those of employees that make use of national public transit systems for their daily commute. However, major public transit modes will not penetrate the complex, instead, personal rapid transit solutions will be available. The use of linked mobility systems such as e-bikes and e-scooters will be highly encouraged. Infrastructure for the generation of solar energy will be located throughout the complex and utilized to meet the energy demands of the built environment as well as those of the vehicles that must be charged in the parking facilities. The complex will also be connected to the national energy grid. An innovative and smart grid network will support distributed energy generation and use.

SCHIPHOL THE GROUNDS 2030 261
5.5 Morphological charts Morphology is defined as the form and structure of an organism or any of its parts (Merriam-Webster’s). Morphological charts are developed for vehicle charging, EV and built environment in order to help the design phase.

262 SCHIPHOL THE GROUNDS 2030
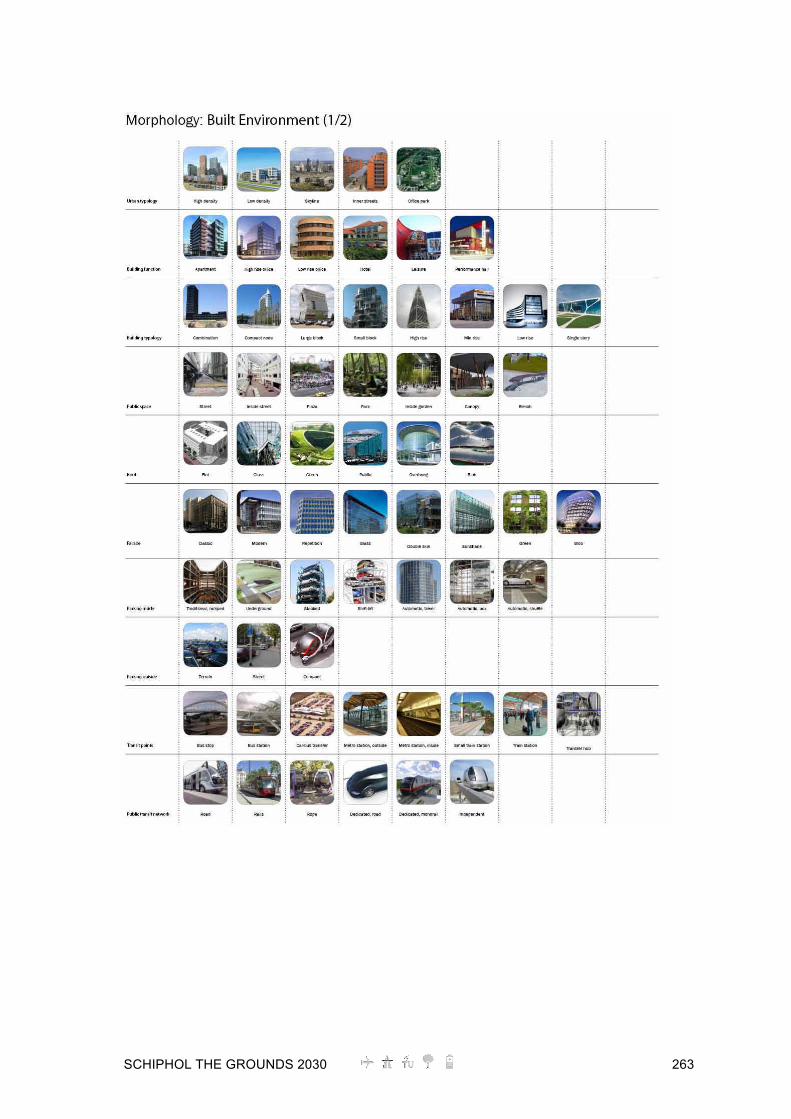
SCHIPHOL THE GROUNDS 2030 263

264 SCHIPHOL THE GROUNDS 2030

SCHIPHOL THE GROUNDS 2030 265
6 Design phase
6.1 The ‘Elzenhof The Grounds’ design scenario ‘Generation Eco-Geek’
In this sub-chapter, the backgrounds for the final elaboration of the chosen design scenario ‘Generation Eco-Geek’ (design scenario nr.4) will first be explained. Next, the conceptual design is illustrated by means of images and screenshots from the animation. Finally, a strategy for implementation is discussed, with emphasis on the roadmap towards the elaboration and the possible and essential steps to be taken now.
6.1.1 Background of the concept
6.1.1.1 Urban typology Scenario 4 can be described as a multi functional campus. The overall shape of the building ensemble at ‘Elzenhof The Grounds’ within the context of this design scenario ‘Generation Eco-Geek’ is a parallelogram. All building structures are organised around a high-quality, deep green inner garden (Fig 219).
Fig 219. Overall (urban) plan final elaboration Schiphol ‘Elzenhof The Grounds’ according to design scenario ‘Generation Eco-Geek’.

266 SCHIPHOL THE GROUNDS 2030
The model of the ‘short-cycles city’ forms the basis for this elaboration (Timmeren & Tawil, 2005). It is a further development of the principle of decentralized concentration (which is also the basis for the scenario ‘Footprints on the water’). Apart from the relatively small diameter, or compactness, the main line of approach is the integration of ecological and environmental-technical principles and the possibility of urban types of agriculture. As it turns out, small-scale autonomous entities based on regenerative systems have come within reach because of recent technological improvements (Timmeren, 2006). This also holds for connected small-scale “semi”-autonomous or autarkic entities, which will be more able to absorb the continuous transformations on account of their non-isolated character. It is part of a system based on a geographically clustered network of nodes that aim at autonomy, which offers possibilities for timely anticipation of changes that originate from technique, society or market conditions. This network philosophy or geometry starts from the creation of “cells”, which form a spatial, social, economic or ecological (strong) network, in a hierarchic relationship or otherwise (Saxenian, 1984). As for public spaces, such as squares and green areas, they disappear because of the cutting back on public management budgets and because of the absence of sufficient building lots. The public space for inhabitants is also pushed back in the ordinary street scene due, among other reasons, to the increase in (motor) traffic. In addition to this, it can be noted that many of the existing (shattered) green areas are disregarded and abandoned. This is caused by the fact that less and less money is available for maintenance and management of these spaces. Many of the green areas are in discomfort areas, shattered or they are of limited composition. In summary, it can be stated that in supporting its population, the developed ‘landscape’ has to provide ongoing supplies of energy and materials for habitat, daily living, and economic activity. In order to be sustainable, the supply systems for energy and materials must be continually self-renewing, or regenerative, in their operation. The ecological and spatial conditions of the open areas in and around towns and cities, however, are increasingly under pressure: distances increase, technical infrastructures become less visible and traffic infrastructures more and more often become obstructions and cause irritation. From a social standpoint, this has negative consequences for the “user”.
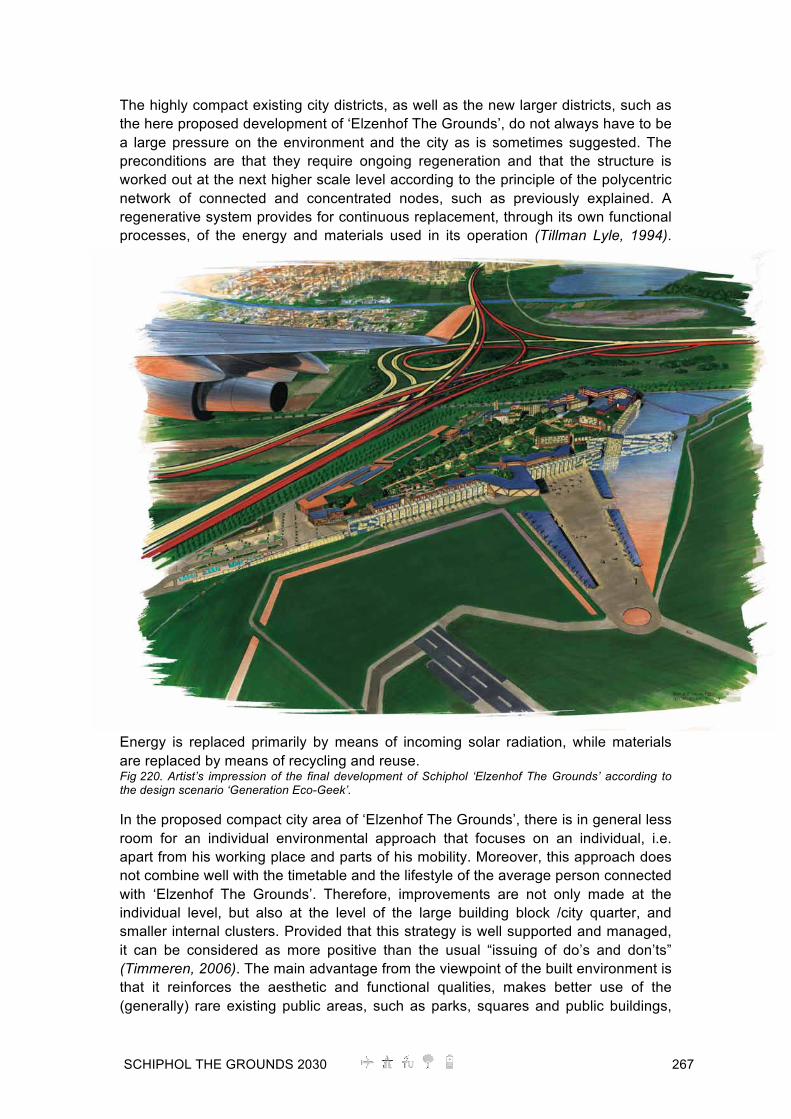
SCHIPHOL THE GROUNDS 2030 267
The highly compact existing city districts, as well as the new larger districts, such as the here proposed development of ‘Elzenhof The Grounds’, do not always have to be a large pressure on the environment and the city as is sometimes suggested. The preconditions are that they require ongoing regeneration and that the structure is worked out at the next higher scale level according to the principle of the polycentric network of connected and concentrated nodes, such as previously explained. A regenerative system provides for continuous replacement, through its own functional processes, of the energy and materials used in its operation (Tillman Lyle, 1994).
Energy is replaced primarily by means of incoming solar radiation, while materials are replaced by means of recycling and reuse. Fig 220. Artist’s impression of the final development of Schiphol ‘Elzenhof The Grounds’ according to the design scenario ‘Generation Eco-Geek’.
In the proposed compact city area of ‘Elzenhof The Grounds’, there is in general less room for an individual environmental approach that focuses on an individual, i.e. apart from his working place and parts of his mobility. Moreover, this approach does not combine well with the timetable and the lifestyle of the average person connected with ‘Elzenhof The Grounds’. Therefore, improvements are not only made at the individual level, but also at the level of the large building block /city quarter, and smaller internal clusters. Provided that this strategy is well supported and managed, it can be considered as more positive than the usual “issuing of do’s and don’ts” (Timmeren, 2006). The main advantage from the viewpoint of the built environment is that it reinforces the aesthetic and functional qualities, makes better use of the (generally) rare existing public areas, such as parks, squares and public buildings,

268 SCHIPHOL THE GROUNDS 2030
and improves the transparency of solutions. In doing so, it gives the general quality of life and sustainability a positive boost. In summary, the main characteristics are:
o clever locations, with an emphasis on the proximity of utilities, and a focus on EVs and especially e-bikes and pedestrians as for the inner garden
o dense building, with distances fit for walking or cycling
o zoning traffic, EV preferences, and emphasis on walking and cycling distances and public transport
o interweaving activities, EV related services and relevant bases for structures
o more careful operational integration and design of (natural) processes, with an emphasis on regeneration and comfort (e.g. smart use of possibilities for certain types of symbiosis of more sustainable, differentiated infrastructural facilities, particularly where clever locations, dense building and interweaving use of space are concerned) (cf. Chapter 5.3.1)
At the same time, as stated before, an important role has been given to the relatively informally organized inner garden. It is based on a strategy of participation, placing emphasis on acquiring conscious attention for commitment. This includes:
o visibility of the relation between the city and nature in design: with respect to space, urban development and as a process
o human habitat as to the basic conditions
o creating space for self-activation There are several spatial conditions to be connected to them. In addition to creating space for self-activation, an important part is creating space for initiatives and changes during implementation, but also after the attribution of functions has been accomplished (Timmeren & Tawil, 2005). The phase of use, after implementation, is of equal importance. A key element in the proposed urban layout is the inner garden. It is (diagonally) divided into two main parts, with each a ‘typical’ elaboration and belonging management. The concept for the southern half of this garden fits in well with plans introduced in some countries for more “rummaging nature” in urban areas. The space gained, because of less paving, is used as “private” lots or for collectively managed public or semi-public green spaces. Fewer pavements also results in less disturbance of the water balance, so that less compensation surface of open water is required. An important aspect of this inner garden based on informal and light urban development is that it is not necessary for the occupant to possess the piece of land around his or her own office (or home). The model asks for it to start from alternative types of land management. At the same time, all tenants of office spaces will have the opportunity to use a semi-private piece of inner garden. Using this land is free, and it can be for lunch purposes, for organising meetings, for rest/meditation and/or to be lent to other

SCHIPHOL THE GROUNDS 2030 269
users. Some basic rules for management will be applied in this inner garden. This is not only to defend its (deep) green ‘look & feel’, but also to achieve real surplus value by introducing new forms of urban agriculture (for reference cf urban retrofit project in Kolding, Denmark; Fig 221).
Fig 221. Reference project for inner garden and integration of urban agriculture: Kolding, Denmark (Torben Gade).
The concept for the northern part of the inner garden consists of an enclosed ‘management free’ green area. Here, nature and natural processes, within spatial boundaries and eventual maintenance, will be left free and will be more difficult to access. It can be considered as a secret garden or ‘hortus conclusus’. The Grounds inner garden is shielded by the surrounding buildings with a strong emphasis on the reduction of the noise produced by the surrounding highways and airport. Water storage is plentiful and located on the outer rim of the northern and eastern side of the plot (along the Airside platform and eastern Park&Charge garages).
6.1.1.2 Building program and functional diversity The business-science park ‘Elzenhof The Grounds’ houses three main program types: offices, parking facilities and the transit hub. Next to these, there are all kinds of facilities and functions established for employees and visitors in order to make the park an exclusive, comfortable and self-sufficient environment. These secondary functions include hotels and catering facilities, shops, sports facilities, a sustainable implant and even some guesthouses. The offices, hotels, dwellings and glasshouses come in different sizes and shapes. The total Gross Floor Space (GFS) of all buildings, except for the public transport facilities (the bus/metro station), is calculated to be 350.000 m2, of which 215.000 m2 is used for indoor parking and 135.000 m2 is used for other functions. The main program, apart from the parking, consists of offices that have different sizes and forms but are internally mostly arranged according to ‘Free office’ concepts, with combinations of telework offices, guest offices and club offices with personal and shared offices.
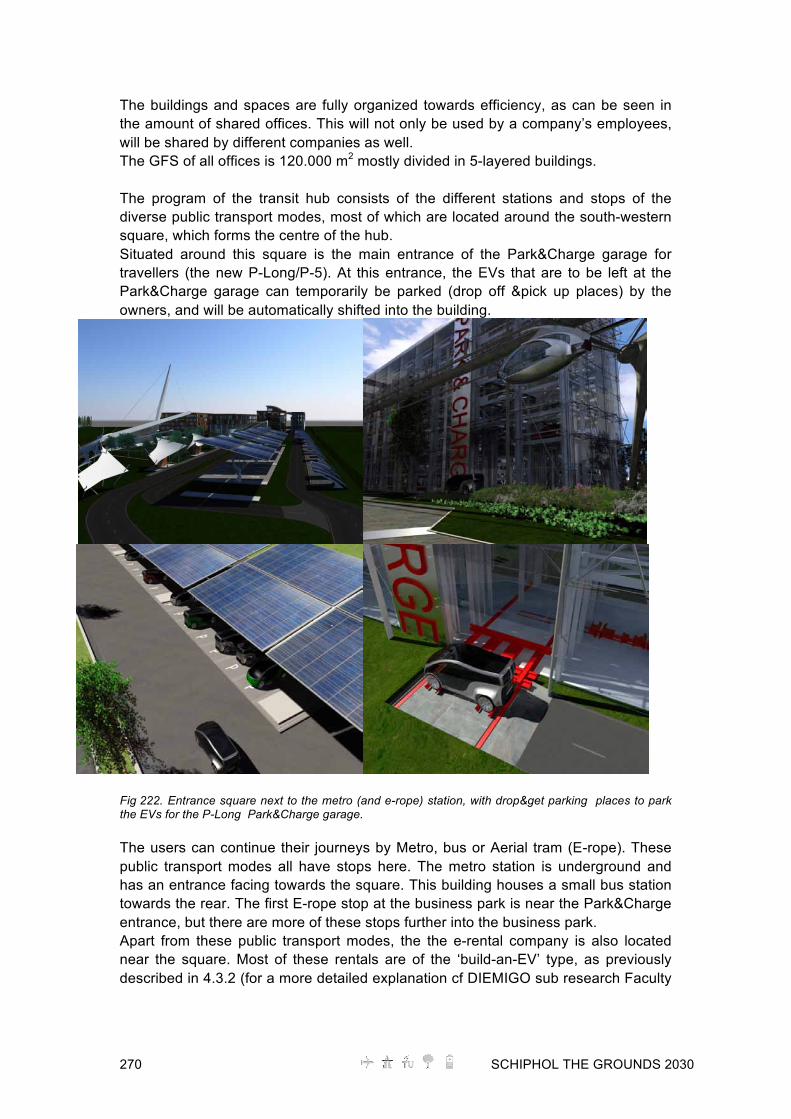
270 SCHIPHOL THE GROUNDS 2030
The buildings and spaces are fully organized towards efficiency, as can be seen in the amount of shared offices. This will not only be used by a company’s employees, will be shared by different companies as well. The GFS of all offices is 120.000 m2 mostly divided in 5-layered buildings. The program of the transit hub consists of the different stations and stops of the diverse public transport modes, most of which are located around the south-western square, which forms the centre of the hub. Situated around this square is the main entrance of the Park&Charge garage for travellers (the new P-Long/P-5). At this entrance, the EVs that are to be left at the Park&Charge garage can temporarily be parked (drop off &pick up places) by the owners, and will be automatically shifted into the building.
Fig 222. Entrance square next to the metro (and e-rope) station, with drop&get parking places to park the EVs for the P-Long Park&Charge garage.
The users can continue their journeys by Metro, bus or Aerial tram (E-rope). These public transport modes all have stops here. The metro station is underground and has an entrance facing towards the square. This building houses a small bus station towards the rear. The first E-rope stop at the business park is near the Park&Charge entrance, but there are more of these stops further into the business park. Apart from these public transport modes, the the e-rental company is also located near the square. Most of these rentals are of the ‘build-an-EV’ type, as previously described in 4.3.2 (for a more detailed explanation cf DIEMIGO sub research Faculty

SCHIPHOL THE GROUNDS 2030 271
IDe). This rental facility stores the components and builds the custom ordered rentals, and its capacity is over 250 EVs. The parking facilities are divided into 6 different buildings, of which the southern parking wall is the largest and it also forms a border with the airside, functioning as a sound barrier and heat collector. This parking garage consists of 4 building blocks, all of which are automatic garages. One of these has a cylindrical shape and is slightly higher than the others. The automatic garages all have 9 levels above ground. These are the Park&Charge garages for the Schiphol travellers, the today’s P-long for EVs only. These garage blocks have, apart from an entrance at the south-eastern square, another underground entrance on the east side. The other parking garages are situated at the other side of the urban plan. One is located on the west side and it is a traditional parking garage. Another automatic garage is located on the northern side. All of the garages have charging facilities for EVs. These two garages are used on a daily basis by the business park employees and other Schiphol employees. The sustainable implant is located in the northwest area of the site and it contains 3 different biomass related building elements: A Combined Heat and Power (CHP) station, a fermentation station and building integrated algae tubes. The CHP transforms biogas into electricity and heat. The biogas is produced at the fermentation station and at the sustainable implant biodiesel is produced from algae. The ‘urban inner street’ connects the square of the transit hub and the Park&Charge garage with all leisure related functions, the hotel(s) and a large part of the offices. It is glass covered (with partly integrated solar cells) and the aerial tram leads through it. At the street level, the south side buildings consist mostly of the automatic parking garage, interrupted by a hotel block and an entrance to the airside. This entrance is for Schiphol employees only. The north side at the street level mostly has leisure related functions, catering, other common functions (5000M2 in total). The entrances of the offices that are housed at the higher levels and at the back side of the inner street. Also a hotel is integrated with the inner street. This hotel cuts trough this street and the Park&Charge garage and has rooms in the inner street, towards the airside and towards the inner garden. This hotel has its own restaurant. Another hotel is located at the north side of the site, along with sport facilities and a restaurant. Both hotels add up to 10.000m2 including restaurants and have a total capacity of around 350 guests.
6.1.1.3 Infrastructures To be able to change the built environment in accordance with the principles of sustainable development there is a need to reverse the inter-relationship between infrastructure and societal needs. This forms the basis for the elaboration of ‘Elzenhof The Grounds’ as explained in this chapter. An important aspect is the interconnection of several individual and collective (e-) mobility modes, both within the radial direction of the Amsterdam City region as well as tangential connections (towards Amstelveen, Hoofddorp and Haarlem). The strategic location of ‘Elzenhof The Grounds’ in the armpit of highway crossing A4/A9/A10 along with the former stated connections with public transportation at several scale levels make the location an excellent EV transport hub annex transferium (Fig 223).
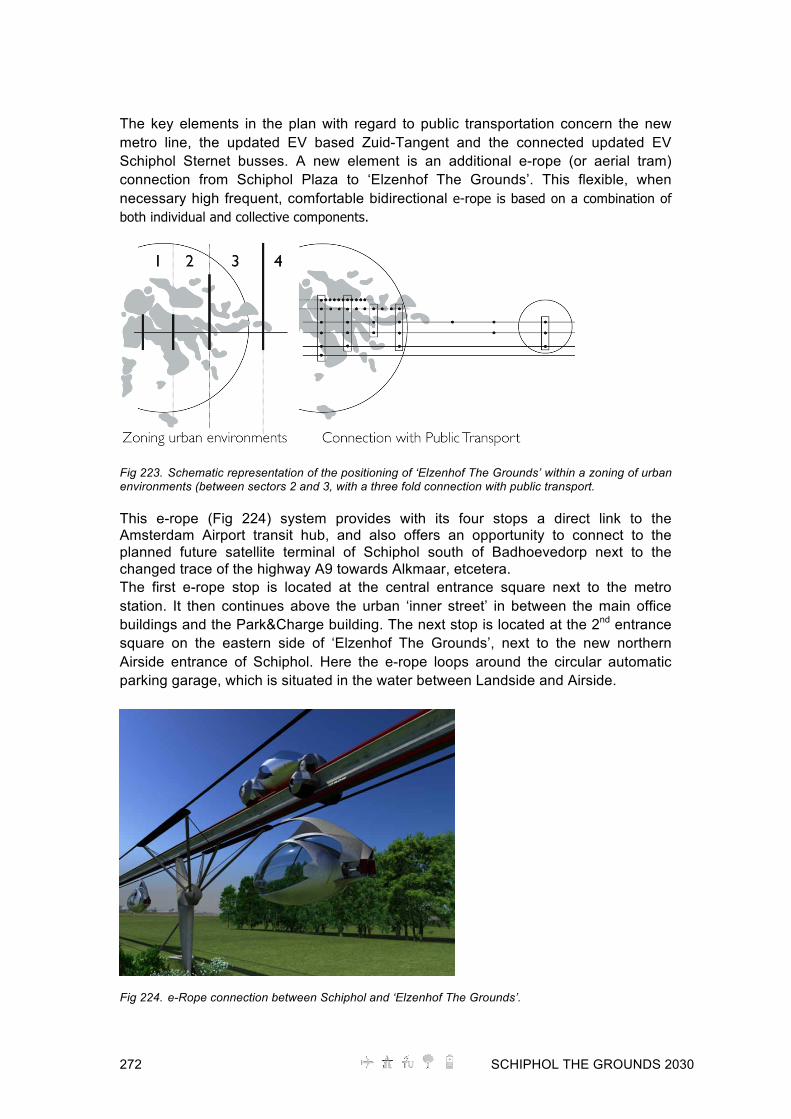
272 SCHIPHOL THE GROUNDS 2030
The key elements in the plan with regard to public transportation concern the new metro line, the updated EV based Zuid-Tangent and the connected updated EV Schiphol Sternet busses. A new element is an additional e-rope (or aerial tram) connection from Schiphol Plaza to ‘Elzenhof The Grounds’. This flexible, when necessary high frequent, comfortable bidirectional e-rope is based on a combination of both individual and collective components.
Fig 223. Schematic representation of the positioning of ‘Elzenhof The Grounds’ within a zoning of urban environments (between sectors 2 and 3, with a three fold connection with public transport.
This e-rope (Fig 224) system provides with its four stops a direct link to the Amsterdam Airport transit hub, and also offers an opportunity to connect to the planned future satellite terminal of Schiphol south of Badhoevedorp next to the changed trace of the highway A9 towards Alkmaar, etcetera. The first e-rope stop is located at the central entrance square next to the metro station. It then continues above the urban ‘inner street’ in between the main office buildings and the Park&Charge building. The next stop is located at the 2nd entrance square on the eastern side of ‘Elzenhof The Grounds’, next to the new northern Airside entrance of Schiphol. Here the e-rope loops around the circular automatic parking garage, which is situated in the water between Landside and Airside.
Fig 224. e-Rope connection between Schiphol and ‘Elzenhof The Grounds’.
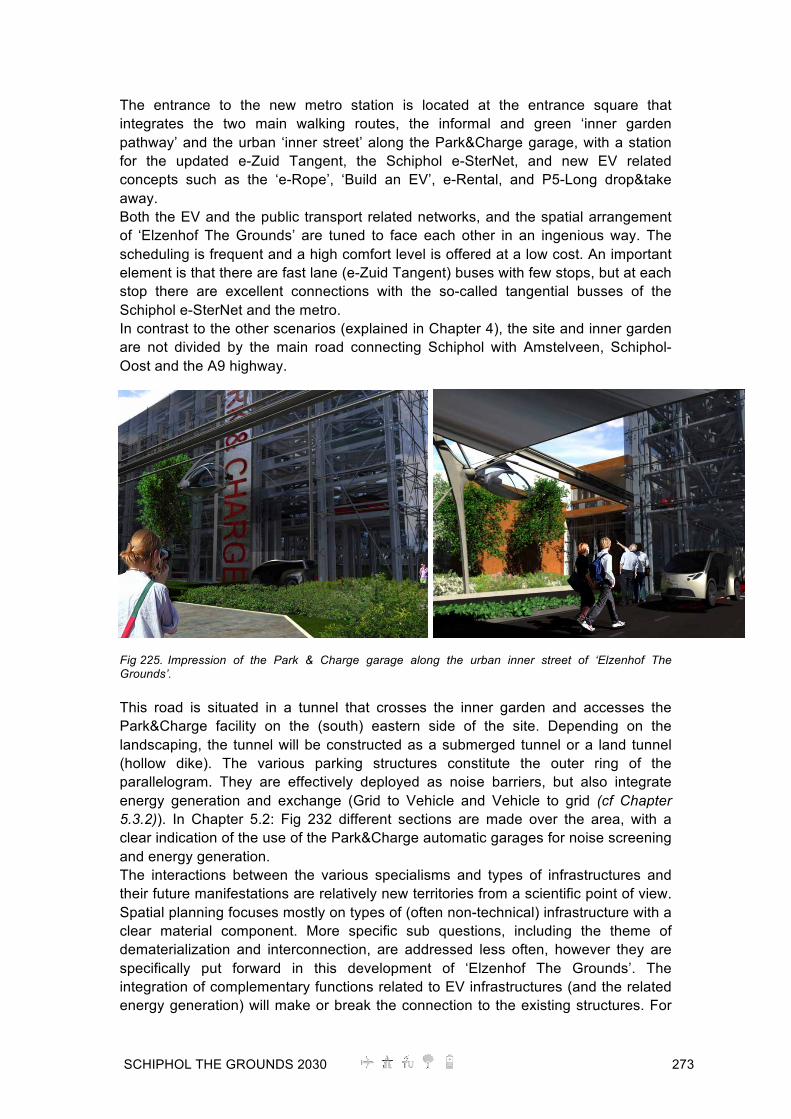
SCHIPHOL THE GROUNDS 2030 273
The entrance to the new metro station is located at the entrance square that integrates the two main walking routes, the informal and green ‘inner garden pathway’ and the urban ‘inner street’ along the Park&Charge garage, with a station for the updated e-Zuid Tangent, the Schiphol e-SterNet, and new EV related concepts such as the ‘e-Rope’, ‘Build an EV’, e-Rental, and P5-Long drop&take away. Both the EV and the public transport related networks, and the spatial arrangement of ‘Elzenhof The Grounds’ are tuned to face each other in an ingenious way. The scheduling is frequent and a high comfort level is offered at a low cost. An important element is that there are fast lane (e-Zuid Tangent) buses with few stops, but at each stop there are excellent connections with the so-called tangential busses of the Schiphol e-SterNet and the metro. In contrast to the other scenarios (explained in Chapter 4), the site and inner garden are not divided by the main road connecting Schiphol with Amstelveen, Schiphol-Oost and the A9 highway.
Fig 225. Impression of the Park & Charge garage along the urban inner street of ‘Elzenhof The Grounds’. This road is situated in a tunnel that crosses the inner garden and accesses the Park&Charge facility on the (south) eastern side of the site. Depending on the landscaping, the tunnel will be constructed as a submerged tunnel or a land tunnel (hollow dike). The various parking structures constitute the outer ring of the parallelogram. They are effectively deployed as noise barriers, but also integrate energy generation and exchange (Grid to Vehicle and Vehicle to grid (cf Chapter 5.3.2)). In Chapter 5.2: Fig 232 different sections are made over the area, with a clear indication of the use of the Park&Charge automatic garages for noise screening and energy generation. The interactions between the various specialisms and types of infrastructures and their future manifestations are relatively new territories from a scientific point of view. Spatial planning focuses mostly on types of (often non-technical) infrastructure with a clear material component. More specific sub questions, including the theme of dematerialization and interconnection, are addressed less often, however they are specifically put forward in this development of ‘Elzenhof The Grounds’. The integration of complementary functions related to EV infrastructures (and the related energy generation) will make or break the connection to the existing structures. For

274 SCHIPHOL THE GROUNDS 2030
segments that are left to market forces, positive effects are soon to be expected on the efficient use of the structures or infrastructures and, thus, on the affordability of the accompanying services. This is why a strong emphasis has been placed on this aspect in the development of ‘Elzenhof The Grounds’. Using locally exploited energy sources, “New Utility Companies” will have to be formed. These NUC’s will operate rather differently from current utility companies, and could be attached to the spatial developer (Schiphol Group). They would not operate on an industrial scale (such as sewage treatment plants or large electricity plants), nor would they be utilities of a personal nature, on an individual or company level. They will occupy the intermediary space, decentralized, at a scale that would ensure exploitation at the most efficient and renewable levels. Thus, the best-fit scale level would be that of Schiphol. The utilities can be structured in compliance and accordance with the businesses that benefit from them. Users of the utilities can in that way gain influence on ‘their’ utility companies. Those who directly benefit (the consumers) could be a participating shareholder of the NUC’s.
6.1.1.4 Energy generation This section summarizes all of the local sources of sustainable energy that are integrated in the further elaboration of the scenario ‘Generation Eco-Geek’ presented in this chapter. The future energy demand of the built environment will partly exist of electricity demand and partly of heat (and cold) demand to heat up (and cool down) the buildings. The electricity demand at ‘Elzenhof The Grounds’ will come from both the office buildings (as well as hotels and leisure facilities) and from the charging facilities for the EVs. It requires calculations based on a preliminary design in order to visualize the amount of sustainable energy that can be generated (decentralized) at ‘Elzenhof The Grounds’ itself, and how these different sources are related to each other. The calculations focus on the electricity generation and demands only (focus of the DIEMIGO research) and should be considered as indicative. The different techniques of heat supply will be described in detail, however they will not be quantified. Electricity demand
First, the future electricity demand will be roughly calculated. The urban plan of the business park will house 135.000 m2 of office buildings along with a small part of hotels and leisure related functions, as well as another 215.000 m2 of parking garages. The electricity demand other than for charging will come mainly from the buildings other than the parking garages. The electricity demand of the parking garages will not be considered here except for the charging of the EVs. The daily average power demand per square meter amounts to 10.5 W/m2, a figure also used in the related research on the Elzenhof grid design (cf DIEMIGO sub research Faculty EWI) which implies an annual demand of 92 kWh/m2. With 135.000m2, the electricity demand will amount to 12.4 GWhe/year. For the calculations on the electricity demands for charging EVs, the following assumptions have been made. All EVs that are charged at the ‘Elzenhof The Grounds’ business park are only charged for their initial range; i.e. the distance that they need to drive to arrive at the site. This distance has been estimated to be an average of 30 kilometres (based on the Schiphol mobility report). Another

SCHIPHOL THE GROUNDS 2030 275
assumption is that all parked cars from travellers remain in the parking garages during an average of 4 days (data obtained from a Schiphol Group mobility specialist). The Elzenhof in this scenario houses 9400 EVs daily, of which 5600 are from travellers. The latter have to be charged within 4 days, which means that an average of 1900 EVs are charged every day. Along with the other daily visiting 3800 EVs, this results in 5700 EVs being charged daily for 30km. Thus, the daily charge every day consists of coverage of a distance of approximately 171.000 km. As stated in the DIEMIGO sub research by EWI Faculty, average EVs use 20 kWh to drive 150km, which means 7.5 km with every kWh. With this background information, the daily electricity demand for charging purposes at the ‘Elzenhof The Grounds’ has been calculated to be around 23 MWhe/day, which is 8.3 GWhe/year. The largest part of the total annual electricity demand according to these rough calculations amounts approximately 21 GWhe/year. Electricity generation by solar cells
A major share of electricity in this scenario will be generated by solar cells integrated in the buildings. For example, Fig 226 shows the photovoltaic roofs on top of the parking garages near the main square, where EVs can be left to be automatically parked in the Park&Charge garages.
Fig 226. Image of the photovoltaic roof covered P5-Long drop&take away parking places for the Park&Charge garages. The major part of the total roof area will be used for these purposes. To calculate the electricity generation, it is assumed that 35% of the roof area is covered with solar cells that are optimally positioned towards the sun (cf DIEMIGO sub research Faculty EWI). The total roof area of 58.000m2 at the ‘Elzenhof The Grounds’ business park will then be covered with 20.300m2 of photovoltaic systems. This results in the production of 2.82 GWhe/year (with 139 kWh/m2for optimized positions).

276 SCHIPHOL THE GROUNDS 2030
Apart from the roofs, all southern facades of the parking garages that border the airside will also have integrated solar cells. This area measures 800 meters in total, with a height of 20 meters. With an estimated coverage of 75% of its surface, another 12.000m2 of photovoltaic systems will generate electricity. This will generate a minimum of 1.75 GWhe/year (with 97kWh/m2 for vertical surfaces). In total, solar cells integrated at ‘Elzenhof The Grounds’ could harvest approximately 4,57 GWhe/year with the performances of current 1st generation cells. With the expected increase in performance over the coming decades, an almost 3 times higher output can be expected from 3rd generation solar cells in 2030. This will result in an annual electricity production of roughly 13 GWhe/year. Electricity generation by wind
Small wind turbines (with a height of 20 meters) can be placed alongside the approximately 900 meters of A4 highway that form the side of the business park with the best wind potential. A single line of wind turbines on every 35 meters could house a row of 25 wind turbines. With an annual electricity production of 7 MWhe per turbine (cf Chapter 3.3.3), the total share amounts to 0,2 GWhe/year per row. Local biomass production
Located at the business park is a fermentation plant that will generate biogas out of local organic waste, consisting of a mixture of human manure, green kitchen waste and, to some extent, solid biomass (small wood, straw, etc.) from the green areas of ‘Elzenhof The Grounds’. Furthermore, active production of biomass is incorporated into the built environment in the form of algae systems in facades (Fig 227). This biomass can be used to generate bio diesel and the residual waste could be used in the biogas digester. The algae production is also connected by an extension of the nearby situated OCAP CO2 pipeline (cf Chapter 3.3.5), to increase the production and to capture additional CO2 as well. It is difficult to incorporate calculations on
expected amounts of produced energy of the planned algae production, since production processes are still in full development. Fig 227. Example of add-on algae façade component to be integrated in the double layered building façades

SCHIPHOL THE GROUNDS 2030 277
For the biogas production from organic waste, only an indicative rough calculation has been made. Some figures are known of biogas production out of human manure combined with green organic kitchen waste. In total, 11m3 methane can be produced from one person’s annual production (Afvalwater ontketend, 2005). An estimated amount of approximately 6000 employees will work daily at the business park (another 60.000 people will have their cars parked at ‘Elzenhof The Grounds’, but they will not be considered because of the limited time that they will be present at the business park). These people will stay an average of 8 hours per day at the park, which translates to 2000 people that are permanently on location. The total annual methane production would then amount to approximately 22.000m3 methane. With an energy content of 10.7 kWh/m3, with methane an amount of 0,24 GWhpr/year of primary energy can be generated. Within the CHP at the moment, this is subdivided with a ratio of 30% of electricity and 70% in heat. As for the calculations in this scenario, this ratio can be improved up to 50% electricity and 50% heat by the year 2030 (the focus of this elaboration). Heat production
The total heat (and cold) demands will be produced locally. The installations will be sized according to the demand. A heat network will connect all different buildings and will be connected with the local underground for heat and cold storage (cf Chapter 3.2.4) by means of heat pumps. Excess heat will be returned to the network in the summer time and heat will be exchanged for cold with the underground (again by means of heat pumps). The glass parking garages will function as solar collectors and will produce enough heat for the site. The heat pumps will require a considerable contribution from the total electricity demand. Conclusion
The future energy demands of ‘Elzenhof The grounds’, including the daily charging of almost 10.000 EVs, can be produced locally to a large extent. However, connections with the municipal electricity grids will remain important, since green electricity is not produced equally during the year. The main share of the green electricity in the calculations is produced by solar cells, which generate in summer over 5 times more energy than in winter (a detailed elaboration of energy grid lay-out can be found in the DIEMIGO sub research by Faculty EWI).
6.1.1.5 Interfaces BE and EV In this section the main charging interfaces between the built environment and the electric vehicles will be explained. The Vehicle-2-Grid Park&Charge garage (inductive charging)
Vehicle-to-Grid (V2G) systems are systems in which batteries are used as ancillary storage for the electricity network. Vehicle batteries may be loaded from or discharged to the grid network depending on the variations in energy demand. V2G systems support the use of intelligent charging protocols, which may be necessary for the mass deployment of electric vehicles.

278 SCHIPHOL THE GROUNDS 2030
Fig 228. Bi-directional charging from and to the electricity grid. Within the final elaboration of the ‘Generation Eco-Geek’ scenario almost 10.000 cars have to be housed. Within the whole business park, except for some car-share parking hubs, all parking is indoors. The different parking garages are fully adjusted to electric vehicles, while some of them are also accessible for conventional vehicles with internal combustion engines. Half of the parking garages concern ultra modern mechanical parking garages for Schiphol travellers. These garages are only accessible for electric vehicles that will be automatically distributed through the building and will be positioned in a parking place to be charged. In these garages, it is standard that the charging process is fully automatic and occurs without cables by means of inductive energy transfer (Fig 230). These Park&Charge garages also all fulfil a V2G function. Human access in these buildings is only for maintenance. The garage has a special entrance area where the cars are dropped off or returned to their owners (the ‘drop and get’ parking places). At these places, the owners park their cars and get their e-tickets on their phones after having chosen their charging and parking wishes. From here on, all parked cars at the entrance will be shifted into the building one after another, with no waiting time for the owners. The e-ticket corresponds to the owner’s car and with this ticket, the car is returned within several minutes to the entrance. By mobile phone or internet, the car can be pre-ordered in order to have it waiting at the entrance. V2G systems may aid in the integration of renewable energy sources into the grid network. The harvest of energy from renewable sources, such as wind and solar energy, cannot be scheduled in the same way as a coal-powered energy plant. In order to compensate for this, vehicle batteries can absorb excess electricity at times when renewable production is high, and can contribute electricity at times when the

SCHIPHOL THE GROUNDS 2030 279
demand for electricity is greater than the supply. Fig 228 visualizes both directions of electricity flows within the ‘Park&Charge’ garage. It is connected with a smart grid. In general, the cars will be charged when (more than) sufficient sustainable electricity is available and/or the total demand of electricity in the Netherlands is low. The latter implies that charging occurs at night when the total energy demand is lowest, during daytime when solar power is available, and during weekends when the business park needs less electricity. In this way, the batteries of parked EVs will temporarily become a part of Schiphol’s sustainable energy system. The EV’s batteries are connected to the grid by means of a bi-directional charging device and can be used by Schiphol for ‘peak shaving’ in expensive times of peak demand. During the course of the day, there are dramatic variations in regional electricity demand. Demand for electricity from the Dutch national grid network tends to peak between the hours of 19:00 and 21:00 and is at a low between the hours of 2:00 and 5:00. If EVs were to be plugged in when users returned home from work, the resulting grid loading would precisely coincide with peak demand, causing problems for the energy distribution system. Smart management by network operators could enable charging during periods of low demand, resulting in a levelling off of the grid demand profile, instead of an amplification of the peak. In this way, Schiphol can economically benefit from this battery capacity but so can the EV owners, who allow Schiphol to make use of their battery capacity by parking in the garage. They will be charged less for their parking and charging at ‘Elzenhof The Grounds’. Fig 225 shows some views on the elaborated ‘Park&Charge’ garage. Solar roof airside fleet
Schiphol’s electric vehicle fleet is mainly charged with solar power. At the so-called Airside of ‘Elzenhof The Grounds’, this Airside fleet is housed. It consists of approximately 250 cars that are fully electric and are charged by means of inductive charging interfaces connected to the solar roof of the parking spaces along the Airside platform. This roof provides enough electricity to charge the whole fleet during the year. This means that there is enough electricity in wintertime; the excess electricity during summer time is used by the ‘Park&Charge’ garage. Dynamic inductive charging lane
Inductive charging is different from other forms of EV charging because it does not require a physical connection between the vehicle and the charging unit. Instead, induction charging utilizes magnetic inductive coupling, which enables the transfer of power across a small air gap between the inductor source (located on the charging unit) and the receptor (located on the vehicle). Inductive charging may take place by means of static charging, which describes the act of charging while the vehicle is parked, or dynamic charging, which describes the act of charging while driving by means of in-road induction charging devices. In the elaboration of the ‘Generation Eco-Geek’ scenario, Schiphol provides (dynamic) inductive charging lanes, which may be utilized by EV drivers that have no time to recharge their vehicles while they are parked. In these lanes, dynamic contactless energy transfer charges the EV’s batteries while the vehicle is on the move. Fig 229 visualizes schematically how EVs are being charged.

280 SCHIPHOL THE GROUNDS 2030
Fig 229. Scheme of dynamic inductive charging (for further information cf DIEMIGO sub research Faculty IDe).
These lanes are generally not used to fully charge the batteries; the speed of charging is limited and the efficiency of charging is not as high as during standard charging. Nonetheless, these lanes can extend the ranges of the vehicles that drive on them. The charging lanes can be supplied with electricity by local small electricity storages that are connected to solar cells that are incorporated in the sides of the roads.
Fig 230. Scheme of dynamic inductive charging (for further information cf DIEMIGO sub research Faculty IDe).
Within the Park&Charge garage, but also in other EV parking places, the ‘static’ variant of inductive charging is being introduced (Fig 230).
6.1.2 Conceptual design ‘Generation Eco-geek’ scenario elaboration

SCHIPHOL THE GROUNDS 2030 281
In this section, a general overview is given of the final elaboration of a preliminary design of ‘Elzenhof The Grounds’ within the context (and starting points) of the ‘Generation Eco-Geek’ scenario (cf Chapter 4.2.5 and Chapter 5.1). Apart from this
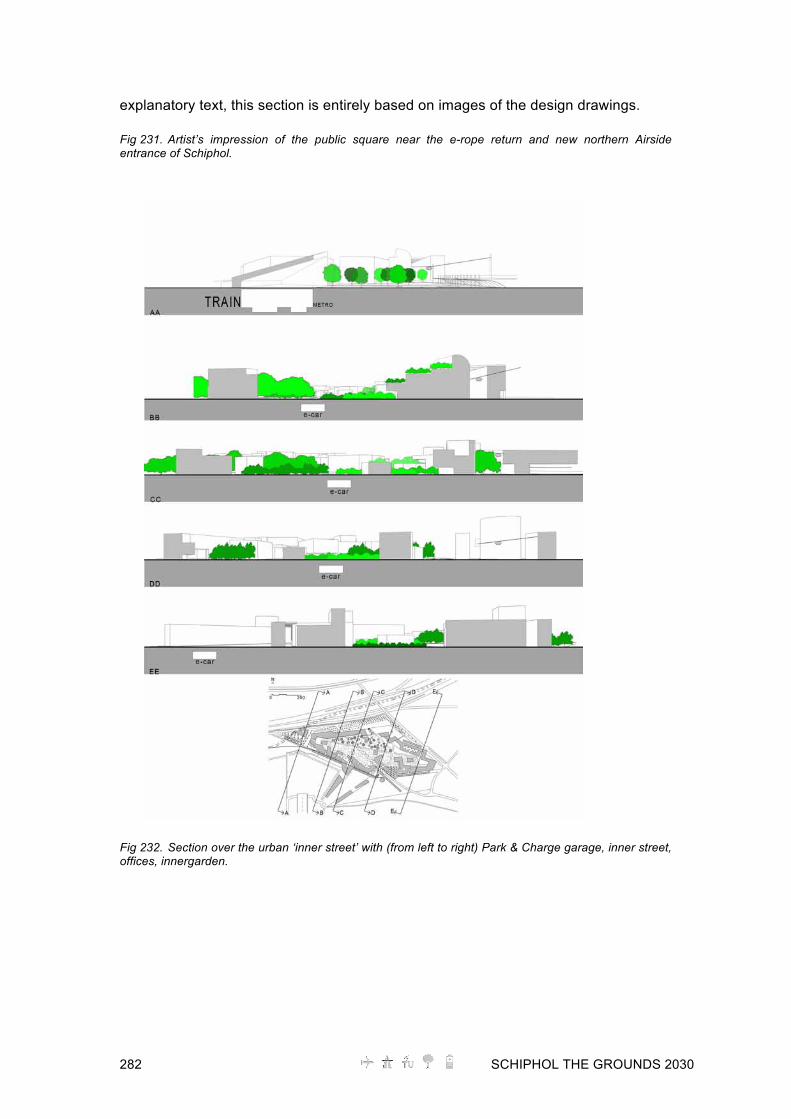
282 SCHIPHOL THE GROUNDS 2030
explanatory text, this section is entirely based on images of the design drawings. Fig 231. Artist’s impression of the public square near the e-rope return and new northern Airside entrance of Schiphol.
Fig 232. Section over the urban ‘inner street’ with (from left to right) Park & Charge garage, inner street, offices, innergarden.

SCHIPHOL THE GROUNDS 2030 283
Fig 233. Artist’s impression of the northern entrance of ‘Elzenhof The Grounds’, with Sustainable Implant, amenities and car-share ‘stacked parking’ hub.

284 SCHIPHOL THE GROUNDS 2030
Fig 234. Artist’s impression of the (silent) garden with ‘inner street’ for small EVs and pedestrians.
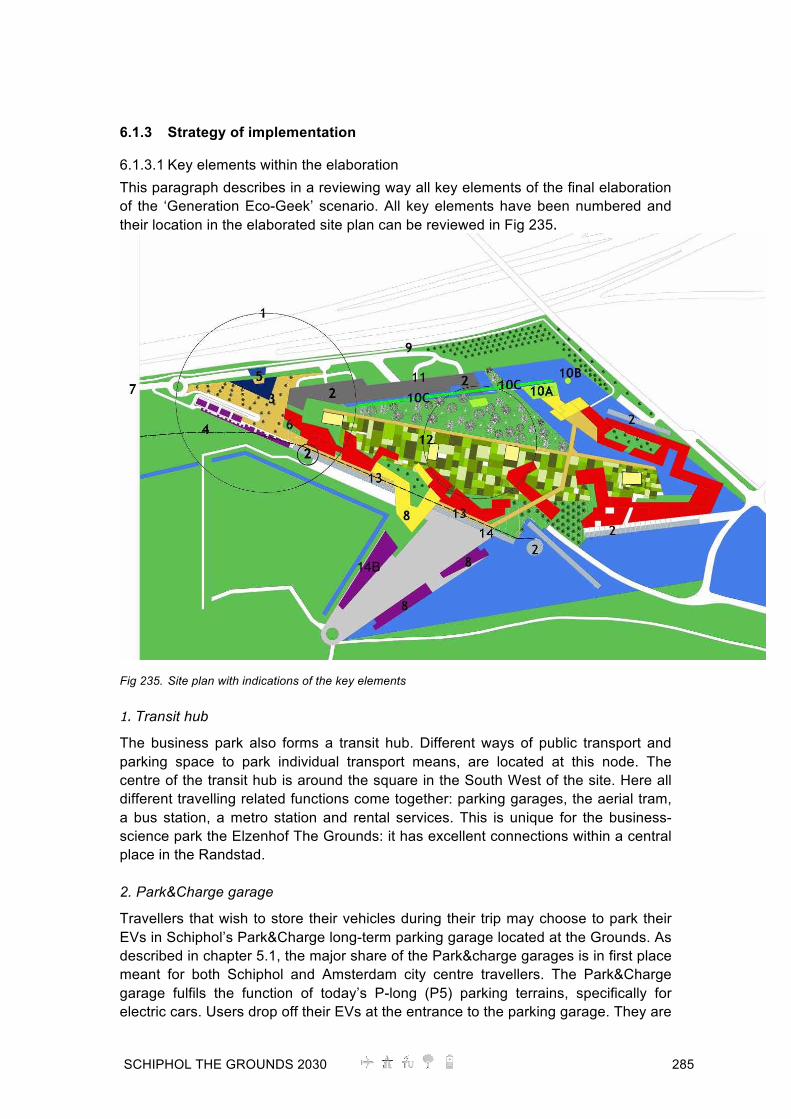
SCHIPHOL THE GROUNDS 2030 285
6.1.3 Strategy of implementation
6.1.3.1 Key elements within the elaboration This paragraph describes in a reviewing way all key elements of the final elaboration of the ‘Generation Eco-Geek’ scenario. All key elements have been numbered and their location in the elaborated site plan can be reviewed in Fig 235.
Fig 235. Site plan with indications of the key elements 1. Transit hub
The business park also forms a transit hub. Different ways of public transport and parking space to park individual transport means, are located at this node. The centre of the transit hub is around the square in the South West of the site. Here all different travelling related functions come together: parking garages, the aerial tram, a bus station, a metro station and rental services. This is unique for the business-science park the Elzenhof The Grounds: it has excellent connections within a central place in the Randstad. 2. Park&Charge garage
Travellers that wish to store their vehicles during their trip may choose to park their EVs in Schiphol’s Park&Charge long-term parking garage located at the Grounds. As described in chapter 5.1, the major share of the Park&charge garages is in first place meant for both Schiphol and Amsterdam city centre travellers. The Park&Charge garage fulfils the function of today’s P-long (P5) parking terrains, specifically for electric cars. Users drop off their EVs at the entrance to the parking garage. They are

286 SCHIPHOL THE GROUNDS 2030
being charged during parking. The vehicles will then be conveyed into the garage and automatically stored. The vehicles are returned fully charged at the entrance to the garage upon the traveller’s return. Other Park&Charge garages can be used on a daily basis by the business park employees and other Schiphol employees. The southern part of the Park&Charge garage, which forms one side of the inner street functions not only functions as a sound barrier for the inner street and the whole business park itself but also forms a huge solar collector. It is connected with the district heating network and the underground’s heat and cold storage. The Park&Charge garage fulfils a vehicle-to-grid function: the batteries of parked EVs will temporarily become a part of Schiphol’s sustainable energy system (cf later explanation). 3. Metro Station
The new Amsterdam ‘North-South’ metro line is extended towards Schiphol airport in this scenario. The ‘Elzenhof The Grounds’ transport hub also has a metro stop, which is located between Schiphol Plaza (NS railstation and NS Highspeed) and Amsterdam Zuid-as, the main business area of Amsterdam. 4. Aerial tram: the E-rope
Electric mobility also includes a variety of dedicated or route-dependent vehicles, which rely on permanent electricity connections. A less known example for inner-city are ropeways. Ropeways or aerials trams exist already well over a century. In Europe most of them can be found in the Alps, the mountain range that stretches over France, Switzerland, Austria, Italy and Germany. The transport takes place along one or more ropes that are fixed between pillars or mountains. Cabins move along these cables. The most striking feature of aerial trams is the fact that they can effectively transport people and goods over large height differences. Ropeways can deal with gradients over 40% while the tallest aerial tramway pillar measures over 100 metres (Glacial Aerial Tramway Kaprun III Austria: 114 m). So far their applicability has mainly been restrained to mountainous areas. The classical large aerial tramway is currently experiencing something of a renaissance. This helps to spur its technological development. In the last decade the reliability, speed and passenger capacity of ropeway systems has increased. A number of ropeways operate currently with a speed of 10 m/s (36 km/h). Manufacturers claim that speeds of 12 m/s (43 km/h) can be reached with a passenger capacity over 100 individuals (Steurer, 2009). With an operational speed over 40 km/h these ropeways can for the first time compete with light-rail or tram systems in urban areas. Pilot studies into implementing ropeways as a regular means of transportation are undertaken in Grenoble. That pilots are undertaken in this city is remarkable. It was Grenoble that, together with Nantes, ignited the renaissance of light-rail in Europe, reversing the trend of tramway closures that started in the fifties.

SCHIPHOL THE GROUNDS 2030 287
Table 44. Comparison between different urban mobility modes, including ropeway (Ef Cables, 2009)
The data in Table 44 may explain why a pioneer in urban transportation is willing to look into the possibilities of aerial trams. A ropeway system would be about three times cheaper than a regular tramway while it provides an energy efficiency that is the best of all motorised transport modes.
Another advantage is the fact that a ropeway system has relatively little impact at ground level, a fact that reduces the complexity of transportation planning.
Airports are often used as testing locations for new public transport systems such as monorails or people movers. Within the aim of Schiphol to elaborate ‘The Grounds’ area as “Testing Grounds” this fits well too. Based on the technical innovation that is ongoing, and based on the fact that a transport pioneer like Grenoble seriously looks into the use of aerial tramways as a mode of urban transportation, and based on the promising energy-efficiency and total investment costs, the use of a so-called e-rope could fit the profile of Amsterdam Airport Schiphol very well. 5. Bus station
Today’s site of Elzenhof The Grounds already houses 1 or 2 bus stops of the Zuidtangent. This bus line connects nearby cities and villages with Schiphol airport. 6. Rentals (‘Built a vehicle’)
Before landing at Schiphol, airline passengers may order custom-made e-rentals based on their preferred travelling style and the predicted weather conditions. The build-a-vehicle e-rentals are modular vehicles, which are assembled on demand, according to a variety of user- specified options such as the number of wheels, battery size, or the driver’s preferred posture. This rental car service is situated in the transit hub, they only provide electric vehicles, including these customized pre-ordered vehicles. This service is called ‘Built a vehicle’ (Fig 236). Maintenance, charging and storage of modular parts occurs at the rental station.

288 SCHIPHOL THE GROUNDS 2030
Fig 236. Build an EV’-rental vehicles and some of the components (for further information cf DIEMIGO sub research Faculty IDe). 7. Dynamic inductive charging lanes
One of these lanes (as describes in Chapter 5.1.5) is situated next to ‘Elzenhof The Grounds’ business park in the South-western entrance until the other side of the site, near its North eastern entrance. It is a special charging lane, situated parallel to other normal lanes. 8. PV-roofs/facades
It is standard to integrate major amounts of solar cells in the building skin. This is a competitive way of being provided with electricity. The integration mostly occurs in an architectonical attractive way, of which the business park is a good example. Solar panels are not added products but form integrated pieces of the buildings. 9. Small wind turbines
Though not generating the same amount of electricity as the solar cells, a row of small wind turbines (not exceeding 20m of height due to airport related site restrictions) is situated at the Northern side of the location, along the A4, as well as on top of the Airside solar roofs along the platform, to contribute to the total of local generated sustainable energy (cf Chapter 5.1.4). 10. Sustainable Implant: 10A. CHP + 10B. Fermentation station + 10C. algae facade
In the armpit of highway A4 and A9 a clustering of integrated green technologies has been projected within an innovative building block component which is named Sustainable Implant (S.I.). Main reason for this place is the relative easy extension of the existing OCAP tube in the Haarlemmermeer towards this place on the site. The connection to the OCAP

SCHIPHOL THE GROUNDS 2030 289
tube (cf Chapter 3.3.5) can be used for the introduction of both CO2 transportation and use. The S.I. concerns a transparent building block in the north-western corner of ‘Elzenhof The Grounds’ with attached a transparent water tower situated in the enclosing canal (Fig 237). In this way it forms an obelisk for green design which will be well visible and recognizable when travelling at the side of Amsterdam along or towards Schiphol.
Fig 237. Example of the Sustainable Implant with integrated components for anaerobic digestion, CHP, waste collection and composting as elaborated for EVA Lanxmeer, Culemborg (Atelier 2T, 2006).
The building houses mainly the water treatment of the entire ‘Elzenhof The Grounds’ area. Here, behind a sealed double skin façade with integrated Algae transportation, the wastewater treatment (anaerobic treatment) of the hotel, offices and amenities, like the next door restaurant and Wellness & sports facility building are situated, together with heat recovery installations and attached seasonal storage in aquifer. Three of the installations within this system component (the façade, the solar-cavity spaces with hanging gardens and the agricultural glasshouses on top of the building block) are fully integrated in the design of ‘Elzenhof The Grounds’. Resuming, the S.I. contains three different biomass related building elements: A Combined Heat and Power station (CHP) where the produced biogas is transformed into electricity and heat. The heat is pumped into the local district heating grid. The electricity is returned to the smart grid. The biogas is produced inside, in a sealed fermentation tank, in which the local organic waste is fermented, without any undesired odours. The third component within the S.I. is the algae harvesting from the HRA plant integrated in glass tubes façade add-on systems in the inner garden façades of the conventional parking garages at the western side of the ‘Elzenhof The Grounds’ development. With the harvested algae’s a small amount of bio diesel is produced to (additionally) fuel emergency vehicles of Schiphol with large power demands (cf Chapter 5.1.4). 11. ‘Mur vegetal’

290 SCHIPHOL THE GROUNDS 2030
An important component at the ‘Elzenhof The Grounds’ side of the highway A4 is the use of urban vegetation as means of adaptation in the building skin of the (conventional) parking garages. As the highway A4 (and A9) will still represent a number of vehicles passing which are non-EV this ‘Mur vegetal’ (Fig 238) is included to improve air quality and urban comfort pro-actively at this side of the building. The desired effect is that in doing so, it will help significantly to cool the local climate by evapotranspiration. The urban heat island effect and heavy storms caused by large temperature differences between cities and their surroundings are therefore reduced. Climbing plants can cool buildings during the green season through shading. Green roofs can cool buildings with poor insulation during the warm season due to evapotranspiration. Urban vegetation will also reduce local flooding by its water uptake during the growing season. Using nature’s processes usually means using them on the site where they occur. Distribution routes are thus much shorter than those of most (conventional) industrial processes, which usually require transport of both energy and materials.
Fig 238. From left to right: ‘Marché des Halles, Patrick Blanc, Avignon (France); Musée Du Quai Branly, Patrick Blanc, Paris (France); Quantas Lounge, Sydney Int. Airport (Australia) and : ‘Living wall’, Tokyo (Japan). Mostly for this reason an essential step is an inventory of on-site resources and processes within the ‘Elzenhof The Grounds’ specific located façades and the urban air quality. Besides of that, it will be necessary to include more ‘water based’ systems inside façades, in stead of trying to ventilate water(damp) as soon as possible. Including the proposed open water based flows and/or PCM inside facades will imply an entirely new approach of material use, methodology and structural layout of building skins. 12. Green urban inner garden
In present-day (compact) towns and cities, there is a growing need for green areas that make use of the specific qualities of their locations, typical for them and possibly protected, for recreational and especially ‘climate adaptive’ reasons (so called ‘climate robustness). Large scale city greening, by e.g. greening rooftops, increasing the number of trees and using climbing plants on walls, can are also applied for within the rest of the urban plan. An unexpected silent green urban inner garden is situated in this compact urban business park. With all buildings around the inner garden functioning as sound barriers and lots of green incorporated in the facades
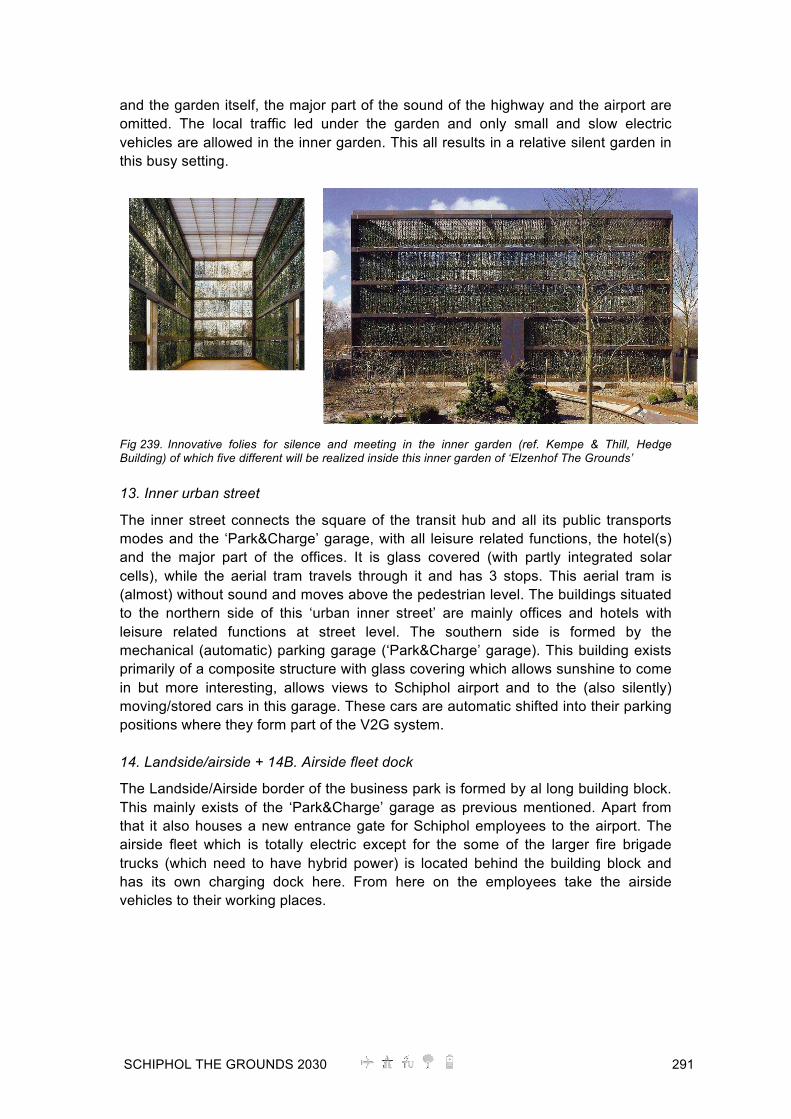
SCHIPHOL THE GROUNDS 2030 291
and the garden itself, the major part of the sound of the highway and the airport are omitted. The local traffic led under the garden and only small and slow electric vehicles are allowed in the inner garden. This all results in a relative silent garden in this busy setting.
Fig 239. Innovative folies for silence and meeting in the inner garden (ref. Kempe & Thill, Hedge Building) of which five different will be realized inside this inner garden of ‘Elzenhof The Grounds’ 13. Inner urban street
The inner street connects the square of the transit hub and all its public transports modes and the ‘Park&Charge’ garage, with all leisure related functions, the hotel(s) and the major part of the offices. It is glass covered (with partly integrated solar cells), while the aerial tram travels through it and has 3 stops. This aerial tram is (almost) without sound and moves above the pedestrian level. The buildings situated to the northern side of this ‘urban inner street’ are mainly offices and hotels with leisure related functions at street level. The southern side is formed by the mechanical (automatic) parking garage (‘Park&Charge’ garage). This building exists primarily of a composite structure with glass covering which allows sunshine to come in but more interesting, allows views to Schiphol airport and to the (also silently) moving/stored cars in this garage. These cars are automatic shifted into their parking positions where they form part of the V2G system. 14. Landside/airside + 14B. Airside fleet dock
The Landside/Airside border of the business park is formed by al long building block. This mainly exists of the ‘Park&Charge’ garage as previous mentioned. Apart from that it also houses a new entrance gate for Schiphol employees to the airport. The airside fleet which is totally electric except for the some of the larger fire brigade trucks (which need to have hybrid power) is located behind the building block and has its own charging dock here. From here on the employees take the airside vehicles to their working places.

292 SCHIPHOL THE GROUNDS 2030
6.1.3.2 Essential steps to be taken now at ‘Elzenhof The Grounds’ Within the stated list of key-elements there it is important to determine the importance and preferred sequence (as for achieving the sustainability goals and desired realisation of innovative concepts agreed on). Spatial conditions with respect to the built environment are often linked to Vitruvius’s “Utilitas, Firmitas, Venustas”. Most people are inclined to call suitability for building open to objectification, usability less so and beauty actually not. This study focuses on the general utilities, technical systems and their essential networks. Besides this, a scale level is considered which is larger than that of the building (and the context) only. Consequently, the main spatial criteria are: flexibility, complexity, identity and strategy. At the same time, these spatial criteria have a strong relation with the parties involved. Consequently, dilemmas occur quite easily there. A possible solution is the enhancement of the social involvement with the new solutions through information and successful examples or “pilot projects”. The use of Schiphol ‘60ha The Grounds’ as ‘Testing Grounds’ for ‘Elzenhof The Grounds’ business area development and innovative mobility integration concepts, will be essential. At the same time it is important to map out the parties involved and their interests (as for ‘Elzenhof The Grounds’). Moreover, a successful implementation of new systems also depends on the users’ acceptance. Acceptance (adoption), early participation and the correct knowledge, or the attempt to reduce the lack of knowledge in users, is of decisive importance for commitment to the issue. Therefore the users’ interests should be put first, when alternatives or solutions are offered here. Looked on from the efficiency of the infrastructure and systems, any type of density is all right. However, there is a paradox in the (centralized) density model of the “Compact City”, that has been taken as a lead within this design scenario elaboration: further density produces advantages at a macro level (mostly related to efficiency), but also disadvantages. In summary, the assumed qualities of the Compact City are (Timmeren, 2006): o Efficient qua distribution of human activities and efficient use of facilities; o Optimum use of infrastructure and viability of Public Transport (commitment) and
transport systems not based on cars; o Protection of public space elsewhere (in this case also in the inner garden of
‘Elzenhof The Grounds’), or preservation of land and energy elsewhere through compressed development;
o Good access to workplaces, utilities and facilities, and reduced need for travelling;
o The potential of social and cultural diversity, and perhaps higher quality of life; o A safe and lively environment; o Advantages as a result of concentration of activities and facilities; o Less pollution or enhances (more concentrated) possibilities of treatment; o Vitality and diversity, or through diversity (if elaborated well). Nevertheless, several possible flaws are recognized in this model as well: o Increased congestion (and possible pollution); o Reduced consumption of (one’s own) space and privacy; o Possibility of increased social segregation between city centres and their
‘polycentric’ outer nodes.
SCHIPHOL THE GROUNDS 2030 293
The new pattern of spatial development arising from this study, based on a compact city model with integration of informal elaborations and smaller scale levels of services can become the strategic starting point for the sustainability of more and more towns and regions. This approach of “Decentralized Concentration” is based on the model of polycentric development and consists of several compact high-density settlements with centres that are situated at a certain distance from the main town centre. It’s a challenge that may be summarized as the complex affair of optimizing the land use and its transportation flows (or urban development), and the simultaneous guarantee of a good quality of life. The support of existing bio-climate, urban infrastructures and systems is of essential importance. Specific conditions should be met, however (Timmeren, 1999b). With respect to technical infrastructure, it comes down to: either linking up and shared efficiency (compactness), or disconnecting and individual or local self-sufficiency. Moreover, the physical (hard, aboveground) infrastructure of the latter must be disconnected from the technical infrastructure and must be connected to the soft (and visible) infrastructure as far as this is possible. Provided that they were designed well and organized according to sustainability, these forms of Decentralized Concentration in towns or cities can appear as strategic parts within the design of future urban networks (Roaf & Viljoen, 2004). Key factors are sustainability and flexibility of the technical infrastructure and the land use, or better: use of “open-sky” or daylight lit space. Within the proposed spatial development, more attention for smart use of infrastructure, rooftop use, energy consumption in connection to land use and surface paving is of importance. Within this context, the following components of ‘Elzenhof The Grounds’ development, as presented in this chapter, should be implemented in an early stage: Noise barrier/ Park&Charge garage To improve the environmental quality of the site it is essential to build the parking facilities early. These buildings will shield the site against most of the noise, and if elaborated as proposed the particle matter as well, of the highways (and airport). Two types of noise barriers are proposed in this elaboration; the ‘Park&Charge’ garage, and the (more) conventional garages with algae façade and ‘mur vegetal’. Both cases can be tested in an early stage at the Schiphol ‘Testing Grounds’ 60ha area, to improve concepts and to investigate lay-outs. Apart from that it is important to start Transport hub: Metro; Bus station; Aerial tram The aerial tram needs to be built in an early stage. It provides the public transport link with Amsterdam Schiphol. There can be a testing setup as well at ‘60ha The Grounds’, but it can even be done within existing Schiphol Terminals and (parking) facilities. Eventually the connection to the new northern Terminal (and its connection to both Schiphol Plaza/Terminals and ‘Elzenhof The Grounds’ should be investigated more closely.

294 SCHIPHOL THE GROUNDS 2030
The metro connection can provide a similar service, however, the extension of the Amsterdam metro is an external factor that Amsterdam Airport Schiphol cannot control and will remain uncertain until it is built. Within the existing context of problems during construction of the (first extension of the) new north-south metro line, it becomes clear that both excellent planning and economical calculations will be necessary. A good working transport hub will enable the business park with integrated P-long for EVs to work properly. Landscaping Landscaping can raise the spatial quality of the site and should be done as soon as possible. The proposed setup of two different sorts of ‘green’ environments along a boulevard like axis could (or should) be taken as a lead. If the design is willing to play with some sloping the 'tunnel' could be built as a 'hollow dike' construction, saving a considerable amount of money. At the same time the track can become a testing track of dynamic inductive trajectory (after pilot testing at Schiphol ‘Testing Grounds’ 60ha area). Site development The real estate, the ad joint public space can develop gradually according to the market demand. Offices can be built in an early stage and can follow the ‘urban inner street’, eventually closing in the ‘inner garden’. The residential units (guest houses) require a reduction of the noise pollution before they can be realized. The hotel, however could be realized at an early stage, to attract important amenities (also office development related). Water storage Water storage can be made in different phases and grow in parallel to the development of the overall project. Sustainable energy infrastructure Already in an early stage there must be taken care of a proper working sustainable energy infrastructure. Connections between buildings to share and use of the same centrally produced and stored energy should be made in an early phase of the development of the area.
6.1.4 Conclusion
1. Looked on from the angle of “sustainable development”, the urban development model of “Decentralized Concentration”, preferably worked out into the principle of the “Short Cycles City”, may be considered as the most logical and conditional.
2. In order to be able to speak of participation, a “self-learning” superstructure must be aimed for, with social learning processes being integrated into the development and use phases.
3. Decentralization of projects to lower scale levels makes it easier to formulate concrete common objectives, but also demands more guidance.
4. The definition, design, involvement in and laying down in a legal framework of the spatial intermediary levels of “ensemble/neighbourhood”, “urban network” and “(eu)region” and their green structures are essential for the success of sustainable spatial development according to Decentralized Concentration.
SCHIPHOL THE GROUNDS 2030 295
Urban design conclusions
1. The research presented demonstrates the need to include interdisciplinary
approaches to the integration of strategies for raising public awareness, for marketing the different qualities of essential flows, especially energy (exergy / cascading), and establishing a service business for building and integrated Electric Mobility on the basis of operating more decentralised installations. In addition to the issue of sustainable energy generation, with the introduction of electricity-based mobility both new possibilities and problems become visible, especially as for its interconnection with, and integration in the built environment.
2. Around the world several concepts for EV charging and EV/Building interfaces have
been developed, or are under development. In general however integrated smart grid concepts, comfortable charging or user focused services and innovative charging are still lacking and mostly based on the principle of relatively simple “technical fixes” and do not address to problems to be solved in case of large scale introduction of Electric Mobility. Moreover, integration in the built environment is poor and full of potential pitfalls, especially as for security of supply when implemented at large numbers.
3. Electric infrastructure strongly correlates with production and peek demand. A
change desired in the infrastructure, e.g. a bottleneck with respect to capacity, can be solved by adapting the “production” in strategic spots of the (central) grid. As for the latter, Schiphol, being a large energy consumer with potential space and control for solutions and potentials like huge concentrations of (e-)mobility, can be seen as such a strategic spot and therefore can be leading in the transition towards large scale Electric Mobility based on electricity generation with renewable sources.
4. Schiphol related developments can best comply with a self-sufficiency aiming
strategy, or the full integration and adaption of future Schiphol developments to other spatial developments around Schiphol on the basis of industrial ecology and interconnection of essential flows (energy, waste/nutrients/materials and water).
5. Schiphol can achieve better tuning to site-specific conditions, sustainability and
regenerativeness of its systems, when design principles of future developments are based on “intrinsic values” (services) and when sustainability is connected to reliability, e.g. in the form of a decentralized (autonomous) utility and backup for its energy supply. As for the latter, a micro-grid or a hybrid electricity grid, interconnecting e-mobility and renewable sources are promising options.
6. Schiphol is a pivotal point in mobility in the Netherlands / NW Europe, and can take
e-mobility as a large opportunity for its own fleet as well as for mobility streams towards Schiphol and (nearby) passing by mobility and integrated development of its built-environment and their interconnection.
7. As a result of site and climate based potentials and due to existing height restrictions
the best option for energy supply based on renewable sources as for Schiphol ‘The Grounds’ areas will be the integration of solar energy as for electricity and use of biomass, available waste heat, cascading principles and deep aquifers for (heat/cold)

296 SCHIPHOL THE GROUNDS 2030
storage.
8. At the Schiphol Elzenhof The Grounds area the potentials are high for: combining e-infrastructure (Vehicle to Grid / Grid to Vehicle), faster Car-Plane connections for EVs only, faster car Schiphol-inner city connections (transferium), Landside/Airside combinational charging/services, additional services, like an EVs car-share network hub with fast connections and a possible inclusion of innovative regenerative systems for energy production based on renewables and energy exchange and storage with strategic area development.
9. Due to the remote situation the ‘60ha The Grounds’ area can be an optimal site for
testing new concepts, and the connection of recreation based development and interconnections, as long as there will not be attracted too much new mobility for employees and visitors (other than e-bikes, and small EVs).
10. On the basis of desired improved sustainability and frontline positioning of Schiphol
‘Elzenhof The Grounds’ with respect to EV integrating facilities, four different future design scenarios have been elaborated. They can roughly be characterized as: (1) ‘economical involution, (2) ‘economical prosperity’, (3) ‘green decentralization’, and (4) ‘deep green with vehicle to grid’ & ‘grid to vehicle’ exchange. After assessment of the design scenarios for Urban design, Climate adaptation, Flexibility, Parking, Public transport, Environmental impact, and determination of potentials for innovative EV/BE interfaces and new urban/building typologies the fourth scenario, ‘Generation Eco-Geek’, has been chosen and further elaborated in detail. The elaboration shows the large amount of potentials of integrating Electric Mobility and its potential benefits for comfort and sustainability of urban spaces, buildings and integrated (electric) mobility.
6.2 Mobility
6.2.1 Ecar 0f 2030 Ecar of 2030 is derived from a design exercise. How an E-car of 2030 functions? How it looks like? And relates to the user? In wide perspective, can we illustrate the E-cars specifications of 2030? If so, how and which form they would shape into from the present? Subsequently how it will affect the charging and other infrastructures around it? 1. Pre conditions
• Schiphol area and the Netherlands in general form the playing ground for this E-car.
• A ‘general’ car could be the starting or reference point. (Car could be defined as a road vehicle with an engine, four wheels, and seats for a small number of people (Cambridge def.))
• User could be defined if necessary!! 2. Expected Output
• In terms of exploratory research and design sketches/doodles/illustrations • The result could be used in the animation film and stimuli for other
contemporary EVs of 2030

SCHIPHOL THE GROUNDS 2030 297
6.2.1.1 Key vehicle traits: 1. Thin; small footprint 2. Standard chassis 3. Mobile communication/navigation 4. Easy to enter 5. Active safety 6. Distinctive appearance 7. Two-seater 8. “luxury” appeal 9. Reference to renewable energy production
How will an E-car function in 2030? The E-car will still be a simple car. However some things will be enhanced, including:
1. Increased space efficiency; especially when parked 2. Customizability 3. Reduced number of passengers (two) 4. Electro-motor, battery, and induction charging 5. Automated parking and charging, which can be activated from outside the
vehicle What are the now ways in which the vehicle relates to the user?
• Remote access and control (both while parked and while driving) • User-specific settings • Potential for new ways of driving
What will the E-car look like?
• Retro • Modern • Aerodynamic • Luxurious • Urban
What are some general specifications for the E-car of 2030? Packaging:
• Number of wheels: 4 • Number of seats: 2 • Motor capacity (motor and drive-train): Electromotor with a top speed of 150
km/hr • Fuel tank: lithium-air battery • Spare tire: none; Tweels • Windshield…need to come out of the exercise • Styling line…need to come out of the exercise
Styling:
• Conveys ideas of trust and longevity; the use of chrome and robust materials. • Foldable; compactable for parking • Sliding doors • Wheels that turn 90 degrees for parking • Modular components • Convertible as the standard • Minimal luggage space

298 SCHIPHOL THE GROUNDS 2030
• Side-by-side seating; but passenger seat may have a different form and functionality as the passenger plays a different role than the driver
• Cockpit-like controls – the driver has the feeling of control (even in the case of auto-pilot)
• Driver has an experience similar to that of playing a video game • Increased visibility with lots of glass
Where does contemporary regulation conflict with innovation?
• Current regulation requires too much in the way of safety: o Requirement of physical breaking o Crash-worthiness (crumble zones; airbags; mass of vehicle;
dimensions) • Current regulation does not push for recyclability and design for end-of-life.
What are the key steps that will help to get us from where we are to the E-car of 2030?
• Revise regulation to support innovation in the vehicle industry • Place emphasis on the role of technology and stimulate technologic
development in: o New materials and material use o Battery technology
• Standardization of elements must take place immediately; in particular: o Charging o Batteries o Infrastructure
The market must be driven by consumers, so the ‘product’ that customers are offered must be appealing and get the job done Table 45. Mobility Global trends Global trends: Consequences for
mobility: Implications:
Urbanization • Increased congestion
• Space constraints (driving and vehicle storage)
• Fewer remote destinations (access to amenities at destination)
• Regulation and car-free zones
• Limitations on vehicle storage space will favor compact vehicles with a thin body and small footprint.
• Parking constraints will favor stackable, foldable vehicles.
• It is always possible to refuel at the destination; therefore, there is no need to carry a fuel surplus onboard the vehicle.
• If vehicles are left at outskirts of the city items inside the vehicle must be secure.
Resource management
• The costs associated with the resources required to produce the vehicle are incorporated into the price of the vehicle
• “Over consumption” is not cool
• Vehicles that use environmentally benign materials and use materials sparingly will be favored.
• Vehicles that have high fuel economy will be favored.
• There may be a decoupling of battery size from vehicle, as individuals will not want to purchase a larger battery than they expect to need.
Multi-fuel economy
• Challenge in maintaining a supply of multiple fuels; challenge in maintenance
• Specialized use
• Vehicles that run on multiple fuels may tolerate a degree of flexibility with respect to the composition and purity of the fuels.
• Fuels that are abundant and well suited for specific uses may be utilized by niche
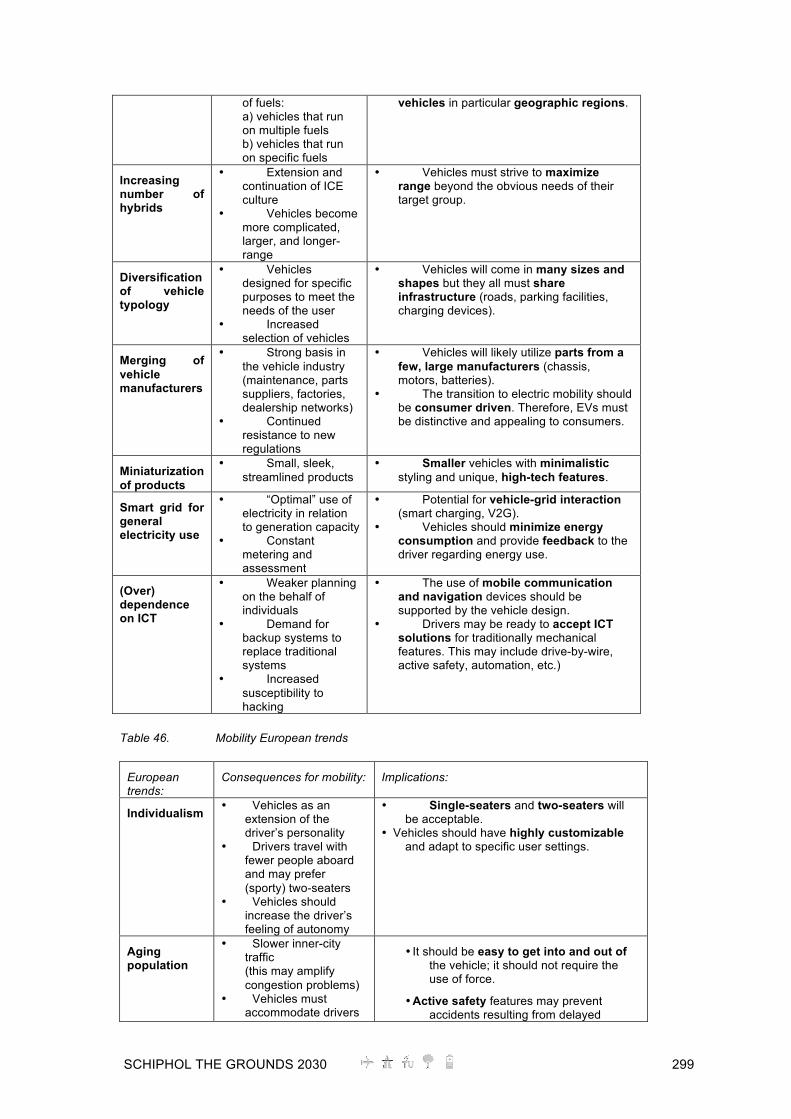
SCHIPHOL THE GROUNDS 2030 299
of fuels: a) vehicles that run on multiple fuels b) vehicles that run on specific fuels
vehicles in particular geographic regions.
Increasing number of hybrids
• Extension and continuation of ICE culture
• Vehicles become more complicated, larger, and longer-range
• Vehicles must strive to maximize range beyond the obvious needs of their target group.
Diversification of vehicle typology
• Vehicles designed for specific purposes to meet the needs of the user
• Increased selection of vehicles
• Vehicles will come in many sizes and shapes but they all must share infrastructure (roads, parking facilities, charging devices).
Merging of vehicle manufacturers
• Strong basis in the vehicle industry (maintenance, parts suppliers, factories, dealership networks)
• Continued resistance to new regulations
• Vehicles will likely utilize parts from a few, large manufacturers (chassis, motors, batteries).
• The transition to electric mobility should be consumer driven. Therefore, EVs must be distinctive and appealing to consumers.
Miniaturization of products
• Small, sleek, streamlined products
• Smaller vehicles with minimalistic styling and unique, high-tech features.
Smart grid for general electricity use
• “Optimal” use of electricity in relation to generation capacity
• Constant metering and assessment
• Potential for vehicle-grid interaction (smart charging, V2G).
• Vehicles should minimize energy consumption and provide feedback to the driver regarding energy use.
(Over) dependence on ICT
• Weaker planning on the behalf of individuals
• Demand for backup systems to replace traditional systems
• Increased susceptibility to hacking
• The use of mobile communication and navigation devices should be supported by the vehicle design.
• Drivers may be ready to accept ICT solutions for traditionally mechanical features. This may include drive-by-wire, active safety, automation, etc.)
Table 46. Mobility European trends
European trends:
Consequences for mobility: Implications:
Individualism • Vehicles as an extension of the driver’s personality
• Drivers travel with fewer people aboard and may prefer (sporty) two-seaters
• Vehicles should increase the driver’s feeling of autonomy
• Single-seaters and two-seaters will be acceptable.
• Vehicles should have highly customizable and adapt to specific user settings.
Aging population
• Slower inner-city traffic (this may amplify congestion problems)
• Vehicles must accommodate drivers
• It should be easy to get into and out of the vehicle; it should not require the use of force.
• Active safety features may prevent accidents resulting from delayed

300 SCHIPHOL THE GROUNDS 2030
with restricted maneuverability
• Vehicles must accommodate drivers with slower reaction times
reaction times.
• Atomization in heavy traffic conditions may increase the flow of traffic and enhance driver comfort.
Decreasing in household size
• Less people/things to carry in the car
• Fewer kids equates to more money for other things
• Reduced seating and storage space, as compared to current vehicles, will be acceptable.
• Vehicles may be more expensive relative to average household income (however fueling them may be less expensive). They may therefore be a more luxurious product.
Highway culture
• Larger vehicles • Vehicles should fulfill
a variety of needs as users spend a lot of time in them
• Vehicles must be comfortable place to be during the daily highway commute, and will likely include opulent details like cup holders, mp3 players, etc.
• The interior must afford significant space to allow the user not to feel cramped.
New vehicle manufacturers
• Impulse of technology from different industries
• Regulation is easier to implement as manufacturers are not “in a rut”
• Stricter legislation will come into place encouraging vehicles to be more efficient and less carbon-emitting.
• The EV will likely follow trends of the high-tech sector, including digitalization, miniaturization, “ultra-thin” profiling, integration of multiple product functionalities...
EVs in the service side of mobility
• Increased use of EVs on the service side
• Fleets and route-dependent vehicles will be early implementers for EV infrastructures
• Early infrastructures will likely be simple to use and economic to produce, to serve the needs of commercial fleets. Consumers will likely make use of this type of infrastructure.
Carbon trading
• More responsible driving as a result of increased awareness
• Increased use of green energy for mobility purposes
• Local energy production for use in EVs will be embraced by individuals and institutions.
• EVs may try to identify more directly with ideas of sustainability and carbon neutrality…this may be a strong selling point for a carbon-conscious culture.
Renewable energy generation
• Support for the case of the EV
• Integration of solar (parking structures, buildings, etc.)
• Charging vehicles at night using wind
• EVs may use increases in renewable energy production as a springboard. The use of physical and visual and conceptual links to renewable energy production and vehicle charging will therefore be an asset.
• Roofs and walls of parking structures will likely be fitted with PV arrays.
• Wind farms (both remote and urban) will likely be utilized for vehicle charging.

SCHIPHOL THE GROUNDS 2030 301
Fig 240. Illustration of an Ecar 2030
Fig 241. 3D illustration of Ecar 2030
Fig 242. 3D illustration of Ecar 2030

302 SCHIPHOL THE GROUNDS 2030
Fig 243. Illustration of a Built-an-EV and its platform (above)
6.3 Induction Charging: Interaction and user experience For users, the key parameters associated with any vehicle charging technology are the charging process, charging cost, and charging speed. These parameters determine both the convenience with which users can charge their EV and the degree to which vehicle charging taxes their bodies, their agendas, and their pockets. The distinction between inductive and conductive vehicle charging is most pronounced with respect to the charging process. Induction charging is unique from other forms of EV charging because it does not require a physical connection between the vehicle and the charging unit. Instead, induction charging utilizes a magnetic inductive coupling, which enables a transfer of power across a small air gap between the inductor source (located on the charging unit) and the receptor (located on the vehicle). This air gap may be as large as several tens of centimetres, however, the smaller the gap the more efficient the power transfer. By contrast, traditional conductive couplings require a plug and socket system. For safety reasons, the plug and socket are generally equipped with an electrical interlocking system to ensure that there is sufficient contact at the interface prior to power transfer. This means that someone or something must physically place the plug into the socket and apply the necessary force to establish a robust connection. A conductive coupling requires precision and accuracy and is therefore a challenge to integrate into an automated system. Difficulties associated with the positioning of
SCHIPHOL THE GROUNDS 2030 303
the vehicle relative to the charging unit make conductive coupling prohibitively complex, especially when there is no standardized vehicle. The task of physically connecting the vehicle to the charging unit is best left to the user, who must directly interact with the charging unit (and perform a series of actions not dissimilar to those involved in refuelling an internal combustion engine vehicle). Induction charging techniques change all that. With induction charging, a physical connection is unnecessary and the user’s role in the charging process is greatly simplified. For example, rather than parking near a charging unit, stepping out of the vehicle and establishing a conductive coupling, users of in induction charging systems need only to park the vehicle in such a manner that the onboard induction receiver is in close proximity to the inductor source. The source may be located below the vehicle, in the road surface, or next to the vehicle, all of which may be in the built environment (Fig 229 and Fig 230). This simplification reduces the number of actions that the user must perform in order to facilitate the charging process but also requires greater accuracy and consistency during parking. Moreover, it transforms the act of vehicle charging from an active activity to a passive activity. If induction sources are located at the parking facilities that individuals use on a daily basis, then those individuals will no longer have to remember to charge their vehicles and the actions that they must perform to enable vehicle charging are no different than the actions that they would otherwise perform. Inductive charging also opens up the possibility of dynamic charging, or charging while driving. This can be compared to static charging, which describes the act of charging while the vehicle is parked. In-road induction charging is a technology that completely eliminates the need to suspend a journey in order recharge an electric vehicle. The implementation of in-road induction charging may have large implications for range anxiety and user confidence. Currently, concerns about vehicle action radius and supportive infrastructure hamper widespread roll-out of electric mobility(BERR and DfT 2008). If implemented in the near future, such a system might accelerate the market penetration of electric vehicles. However, mounting inductive sources in 10% of all road surfaces is both financially and logistically exacting(Herskovitz 2009). Also worth considering is that, with vehicles parked as much as 96% of the time(Kempton and Tomic 2005), charging while driving may not be necessary. In addition to differences in the process of creating a connection for power transfer, conductive and inductive charging systems differ with respect to the user input interface. The user input interface is the means by which users can communicate their charging preferences. A user may instruct his or her vehicle when to charge, how much to charge, or weather to feed electricity back to the energy grid. In the case of a conductively coupled charging system, this information may be directly input into either the charging unit or the vehicle. However, the simplicity of the induction charging system eliminates the need for the user to directly interact with the charging unit and therefore reduces the relevance of inputting information in such a way. Instead, users may input charging preferences by means of a portable electronic device or may remotely access the charging system through one or more access interface(s) permanently installed elsewhere (such us at home or at work). While mobile and remote access to the charging system can be implemented in conductive charging systems, it is practically mandatory for inductive charging systems. The other parameters impacting the way in which the user experiences vehicle charging are less significant when establishing a distinction between inductive and
304 SCHIPHOL THE GROUNDS 2030
conductive charging techniques, but must also be considered. For both charging techniques it is possible to charge vehicles at a variety of speeds, including slow, semi-fast, and fast charging. There is a slight difference in cost between conductive and stationary inductive charging. This difference is largely dependent on the efficiency of the inductive charging process, which is influenced by the distance between the source and receiver. At an exceptionally low inductive charging efficiency of 60%, the cost of vehicle charging may increase by 67%, such as from €0.12 per kWh to €0.20 per kWh. While a 67% increase in cost per kilometre is notable, the per kilometre cost of driving an electric vehicle would remain significantly less than that of an internal combustion engine vehicle. This low charging efficiency would also decrease the well-to-wheel efficiency of the electric vehicle; however, the well-to-wheel efficiency will not dip below that of a gasoline or diesel internal combustion vehicle (MacLean and Lave 2003; Flipsen 2006). Efficiencies for induction charging systems are likely to be much greater than 60%. The difference in cost between conductive and inductive charging is likely to have a minimum impact on consumer behaviour, as the convenience of induction charging is likely to outweigh the difference in price, provided that the user is not charged for the disparity in installation costs. Induction charging systems are generally more expensive than conduction charging systems. It can be concluded that, for users, the primary advantage of induction charging systems is the tendency of vehicle charging to become a passive, remotely controlled activity, rather than an active, directly controlled activity. For designers and developers of electric vehicles and vehicle charging infrastructures, a technology that enables passive initiation of the charging process is positive because it will likely bolster consumer confidence though perceived freedom and simplicity. Furthermore, induction charging technology is well aligned with the savvy, smart electronics that are increasingly dominant in the contemporary marketplace. However, induction charging may reduce ‘presencing’, or the degree to which the user is aware of his or her activities and the impact of those activities on a larger scale (Ehrenfeld 2008). This may diminish the impact of electric mobility as a driver for the transformation of consumer behaviour toward a situation in which people exhibit a clear preference for value-based products.

SCHIPHOL THE GROUNDS 2030 305
6.4 Grid Design
Fig 244. AC grid of Elzenhof
Fig 245. DC grid of Elzenhof
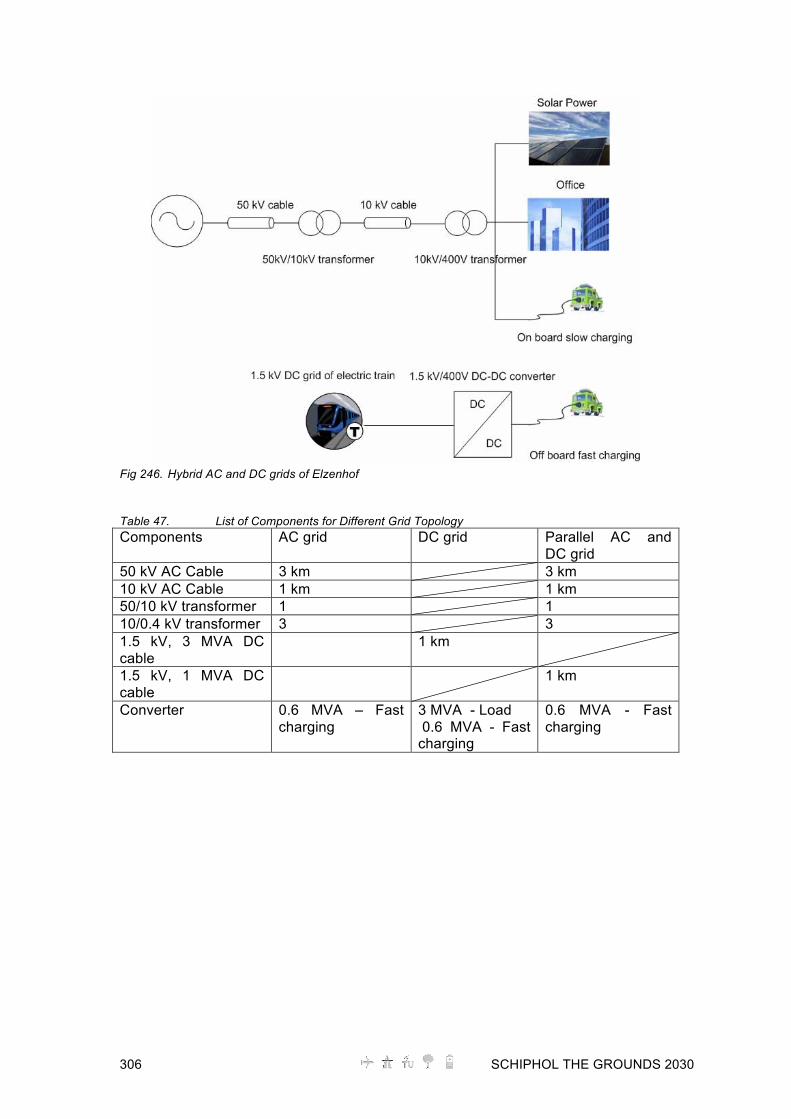
306 SCHIPHOL THE GROUNDS 2030
Fig 246. Hybrid AC and DC grids of Elzenhof Table 47. List of Components for Different Grid Topology Components AC grid DC grid Parallel AC and
DC grid 50 kV AC Cable 3 km 3 km 10 kV AC Cable 1 km 1 km 50/10 kV transformer 1 1 10/0.4 kV transformer 3 3 1.5 kV, 3 MVA DC cable
1 km
1.5 kV, 1 MVA DC cable
1 km
Converter 0.6 MVA – Fast charging
3 MVA - Load 0.6 MVA - Fast charging
0.6 MVA - Fast charging

SCHIPHOL THE GROUNDS 2030 307
Fig 247. Compare components costs of AC, DC, and parallel AC-DC grids The costs of the three different grid topologies as shown from Fig 244 to Fig 247 are plotted in Fig 247. The costs include the total cost of the AC grid. Only the costs of the components are compared, whereas the other costs such as layout and construction are not included. It is evident that the costs of the three different topologies are not significantly different, though the parallel AC and DC grids seem to be the most economic choices. The AC grid is costly because the price of the fast charging converter (two stages converter from AC to DC) is elevated. The cost of the DC grid is increased by the requirement of a converter with large power ratings. Furthermore, the pure DC grid will have to supply the load of 3.6 MW, which approaches the power rating of the train network 4.5MW. The additional cost to upgrade the DC train network may be very large, though its quantitative calculation is not considered here. The conclusion is that either using the pure AC grid, or using the parallel AC and DC grids, is the best option. In the parallel AC and DC grids, the DC grid is only used for the fast charging of EVs.
6.5 Conclusions From the above analysis, the electrical grid of Elzenhof is designed, and the optimal charging method – smart charging – is proposed. 1. The three grid topologies do not have very large differences from an economic
point of view. The use of either the pure AC grid or the parallel AC-DC grid is suggested in this report, because the use of the pure DC grid would require an update of the DC train network.
2. The economics of using solar power is quantitatively analysed in this report, and it is deemed economically efficient in the year 2030. Based on this analysis, it is suggested that local generation be used as much as possible, including solar, wind or other sources.
3. The smart charging method is proposed in this report. It can absorb the abundant
solar power during weekends, and it can provide a grid regulation service (V2G function).

308 SCHIPHOL THE GROUNDS 2030
7 Conclusions and Recommendations The integration of electric vehicles into the urban environment is one of the main challenges for the transition towards sustainable mobility. How to accomplish this integration was the leading question behind this research study. In order to answer this question, different aspects were investigated, such as:
- What are the long-term technological developments for electric mobility? - What are the mobility needs in 2030? Which EV concepts fulfil the future
mobility needs? - What local and decentralized energy sources could be integrated into the built
environment? - What are limitations of the grid for large scale EV introduction? - Which urban and layout typologies fulfil the needs with respect to mobility, the
built environment and energy infrastructure? - What are the interfaces best suitable with regard to users, EVs and the built
environment? - What are the charging type, strategy and grid topology?
In this chapter, conclusions are drawn upon these different aspects and on the methodology used. Finally, recommendations for the integration of electric mobility in the built environment in general, and specifically for Schiphol Airport City are formulated.
7.1 State of the art in electric mobility and future trends An extensive assessment on the state-of-the-art of electric mobility was executed to provide the context for the scenario development and the design of urban, mobility and infrastructure solutions for the future. The large-scale transition towards electric mobility offers a variety of potential benefits, like higher ‘Well-to-Wheel’ efficiencies, the mitigation of local greenhouse gas emissions, particulate pollution, and noise, and increased support for renewable energy production. However, current electric mobility solutions still have several important limitations and the consequences of the large-scale implementation of these solutions for support infrastructures (i.e., grid, urban plan, chargers) are uncertain. For the development of future scenarios it is of importance to take the following uncertainties and limitations into account:
- The limited range of EVs and the uncertainty about developments on battery technology, range extenders and fast charging technology.
- Uncertainty about the safety, modularity and compatibility of charging systems to be developed.
- Uncertainty about the distribution capacity of the electricity grid. - The environmental benefits of electric mobility depend on the inclusion of
renewable energy production into the system. It is uncertain whether or not enough renewable energy will be available in time to avoid the extension of non-renewable electricity plants.
- The limited market availability of full sized electric vehicles for personal mobility.
- The role of collective advantages like mitigation of local emissions and noise and the grid buffer capacity (‘spinning reserve’) in translation to attractive propositions for the end-user.

SCHIPHOL THE GROUNDS 2030 309
Another assessment was executed to identify global and European trends on urbanization, mobility and climate mitigation and adaptation, and its consequences for mobility in general and vehicle solutions in particular. The most important trends affecting the adoption of electric mobility are summarized below:
• Urbanization, leading to increased congestion, space constraints, smaller driving distances and regulation for car-free zones.
• Stringent CO2 reduction targets and increased awareness for responsible driving and use of green energy resources.
• Growing individualism, aging population and decreasing household size; which are mainly visible in Europe.
• Vehicle related trends such as an increasing number of hybrids, the diversification of typology and the merging of vehicle manufacturers.
• Growing dependency on ICT for automation and customization and hype around smart grid and V2G for mass acceptance.
• Growing service orientation and the creation of new niches for the broader acceptance of EVs.
With regard to governmental policy, it can be concluded that most national governments in the developed world are actively supporting and facilitating pilots with EVs and the introduction of EVs in general as well. In the Netherlands, as well as abroad, large cities and utilities are strongly involved in pilot and demonstration projects, which are rolling out in the near future. In the Netherlands, a new industry sector is emerging that produces components for the EV system. This includes firms producing different types of charging equipment, electric drivetrains and in-wheel electric motors. In July 2009, a couple of months after the start of this project, the Dutch Government formulated a program for the introduction of EVs in which the ambitions & targets and measures are formulated. Around the year 2020 the number of electric cars in the Netherlands is forecasted to be 200,000 and there will be 1,000,000 in the year 2025. Within the DIEMIGO-project, the ambition level was set at a challenging 1,000,000 EVs (HEV & BEV) in 2020.
7.2 Design solutions for the Schiphol case The Schiphol Group offered the opportunity to select one of their peripheral areas as a case study to investigate how electric mobility could or should be integrated within the urban environment, the mobility needs and the energy infrastructure. This so called ‘The Grounds’ area is enclosed by the A4 and A9 highways and appears to be a very promising location for the large-scale implementation of electric mobility. The following reasons and opportunities make it a promising location: - The potential for combining the existing electric infrastructure (the railroad
network of ProRail) with grid-to-vehicle and vehicle-to-grid facilities. - The possibility of efficient car-plane connections (i.e. seamless mobility). - The possibility of better car and inner city connections by integrating a
Transferium option next to the planned transfer point such as the metro station. - The scope to combine landside and airside transport for the charging/services and
energy exchange. - The potential for an EV-sharing network hub with fast connections (A4, A9, and
A10 highways).

310 SCHIPHOL THE GROUNDS 2030
- The capacity for the local production of renewable energy, such as solar, wind, geothermal and biomass.
- The scope of a sustainable urban design through the possibilities and integration of the functions such of a business area, renewable energy production and urban green/agriculture.
7.3 Urban design and electric mobility concepts An urban plan was developed, resulting in a combination of a business-science park and a mobility transfer hub. The principles of ‘decentralized concentration’ were chosen for the development of the area. The urban structure around Schiphol will be a collection of several concentrated centres, one of which is The Grounds. This principle is a challenging way of combining optimal use of the space with a high quality of living/working. Within this decentralized concentration, the requirements are coming for the short-cycles city approach was leading for the urban design. Within the concentrated areas walking, (e-) bicycling and ultra-light EVs will be the primary mobility modes. The ultra-light EV is a small foldable, one-person electric powered vehicle used to form a link in chain mobility. It is suitable for short and medium range and in combination with other modes, such as with the E-car 2030 or public transport. Between the concentrated areas, combinations of public and private transport will be the dominant modes. Three concepts were defined in this study. The E-car 2030 is a space efficient four-wheel EV for two persons meant for airside and landside personal mobility, which is optimized for automated parking and inductive charging. User-specific settings can be stored and uploaded in every available E-car. The E-rope is a special suspended vehicle that is based on a combination of both individual and collective components. It offers a frequent and comfortable bidirectional transport mode. The infrastructure needed for the E-rope is lighter and less rigid than a rail oriented solution. The Build-an-EV is a customizable vehicle to match individual needs and wishes. The concept is meant to serve different purposes with the help of standard components (two-, three of four wheels, covert or open, variable ratio of person versus luggage space etc.). Part of the urban design is the Park&Charge Garage solution. This automated parking system makes it possible to store electric vehicles in high densities and charge them simultaneously. By situating these garages and the offices/hotels on the outer edge, the centre of the territory can be kept as an open green public space. The actual transfer point is situated on the southwest corner of the territory. A Metro station, an E-rope stop, an E-car 2030 exchange point, the Park&Charge Garage entrance and the service station for tailor-made e-rentals are concentrated at this location to provide Schiphol employees, visitors and passengers with seamless connections. Additionally, the ‘closing of cycles’ on the level of The Grounds is an important element. The urban plan provides possibilities for local agriculture, production of biomass and wastewater treatment. With the integral urban design for The Grounds location it has been demonstrated that sheltering and servicing of 9400 electric cars in a green, comfortable and silent business-science park of only 30 ha is feasible.

SCHIPHOL THE GROUNDS 2030 311
7.4 Energy infrastructure design The energy needed for the charging a large fleet of electric vehicles (as well as the local energy consumption of buildings, etc.) can be supplied partly by locally produced renewable energy. Schiphol Airport is not considered to be an appropriate place for large wind turbines. The maximum building height of 20 meters at The Grounds location means that a vast amount of small turbines will be needed. The application of PV-technology looks much more promising for integration into the built environment. Assuming that the efficiency of the commercially available PV-cells will increase from 20% nowadays to 30% in 2030 as forecasted in this report, it is shown that solar energy not only contributes to CO2 reduction, but will also be economically competitive with grid electricity from 2020 onwards. In 2030, it is beneficial to use solar energy for local load, because the estimated solar production cost and tariff is much lower than the estimated electricity price. One advantage of solar energy production is that it correlates with human activity, i.e., in this case study it correlates with the electrical load of office building. However during weekends, the electrical load is low due to the decrease of the office load, and thus the solar power production is more than the total load of the site. With smart charging, the charging of EVs is controlled to absorb this superfluous solar energy. By doing so it will also increase the economic efficiency. The economic benefit of using smart charging to absorb the superfluous solar energy is found to be € 0.36 million per year, when comparing the difference between the grid electricity price and the solar energy tariff. The ‘Park&Charge Garages’ developed to park and charge large numbers of electric vehicles at the same time are covered with PV-panels and fulfil a vehicle-to-grid function: the batteries of the parked EVs will temporarily become a part of Schiphol’s sustainable energy system. Smart charging is a prerequisite for the vehicle-to-grid function. It is needed to absorb the abundant solar power on the weekends, and to provide the grid regulation service (vehicle-to-grid function). With an optimal assumption that the batteries of EV/HEVs in the parking garages can always share the real-time bidding regulation market, the annual revenue from The Grounds providing regulation service is estimated to be € 0.19 million. Inductive charging is applied in the Park&Charge garage, so that charging is completely wireless and easy to use. Additional renewable energy for offices and other urban functions will be generated by the locally produced biomass in the local combined heat power plant. These renewable options are not yet sufficient to completely match the total local demand and supply of energy. This research design study shows that it is possible to create an attractive business-science park where sustainability, the use of renewable energy and different modes of electric mobility are integrated.
312 SCHIPHOL THE GROUNDS 2030
7.5 Methodology Although it was not possible within the timeframe of this research to include the evaluation phase along with the verification, validation and consolidation phases, the ‘design inclusive research’ approach as applied in this project looks very promising. From a methodological point of view, some of the primary experiences are as follows:
- The ambition to actually design or develop a solution placed a great deal of pressure on the analysis phase. A clear formulation of a theoretical framework that could be converted into requirements for the design phase has got into hot water.
- Due to the time pressure, less stakeholder involvement was acheived than originally intended.
- Design has been a powerful means to generate synergy between the different disciplines (architecture, urbanism, industrial design, electrical engineering, technology assessment and innovation management).
- More cases have to be carried out in order to further develop the methodology for the large-scale implementation of electric mobility in the built environment.
7.6 Recommendations - The Schiphol Airport City location has been one of the first locations in the
Netherlands to test and develop novel concepts and methods. To be able to generalise the findings and to validate the methodology, a number of diverse urban areas should also be researched, such as city centres and suburbs, and greenfield as well as brownfield situations.
- The Technology Assessment executed within the framework of this project
provides a general picture of the potential benefits of integrating electric mobility in the built environment. The specific consequences for Schiphol and its stakeholders resulting from the novel design choices made in this project – in terms of the environmental impact, the economic aspects and the identification of potential social, technical, and organizational barriers - have to be elaborated in greater depth. This assessment could not be accomplished within the available time span for the project.
- A number of the future concepts presented in this project should be developed further. These include:
o The switch towards electric drive trains in the case of the ‘Built-an-EV’
appears promising with respect to the standardization of components and the development of universal EV-platforms. Customer acceptance of these highly customizable products is still unclear, as is the effect of customization when ownership of EVs is shifts towards usership.
o Fast induction charging, although currently used in domestic appliances, is still being developed for the induction charging of EVs. Aspects such as safety, efficiency, environmental impact, costs and usability should be thoroughly investigated.
o The automated Park&Charge garage, with its combined parking, charging and PV power generation, is one of the most interesting concepts resulting from this project. In the DIEMIGO case a large-scale version of the Park&Charge garage is presented. Research into a modular set-up for

SCHIPHOL THE GROUNDS 2030 313
the Park&Charge garage is recommended. Smaller scale versions could be a very interesting option for sub- urban living areas. Further research could also include alternative configurations (e.g. horizontal distribution) and the transformation of existing parking spaces to automated smart charging parking, or hybrid elaborations of both. In addition, research is recommended on the possibilities of converting existing (automated) parking garages into Park&Charge facilities.
o The smart grid integration needs to be investigated further for both charging and utilization of renewable energy sources, and its integration into buildings and building components, like building facades and parking area floors or ceilings.
- The lifetime of a battery system depends, among other factors, on the number of
discharge/charge cycles. The incorporation of EV batteries as a buffer in the electricity grid (V2G) will lead to an increase in the number of cycles. This consequence can be a potential hindrance for the V2G option. Little is known about the effects on batteries that are integrated into V2G systems. Research on the effects of V2G on the lifetime of car battery systems and the environmental and economic consequences is recommended.
7.7 Recommendations for Schiphol - The integral design and its basic assumptions for The Grounds area have to
be evaluated and validated thoroughly by Schiphol and its stakeholders. Schiphol Airport City and its direct environment is governed by a large number of laws and rules. The further development of the scenario and its concepts has to take place within this legal framework.
- Some of the components of the proposed plan are very promising and can be developed already, as most of the required technologies are already available. These components can act as stepping-stones towards -and demonstrators of- the integrated ‘2030’-plan.
- The principle of ‘decentralized concentration’ and the ‘short-cycles’ city, the Park&Charge garages, the Ultra Light EV and small-scale experiments with smart grids are recommended.
314 SCHIPHOL THE GROUNDS 2030
8 References Abu-Sharkh, S. and D. Doerffel (2004). "Rapid test and non-linear model characterisation of solid-state lithium-ion batteries." Journal of Power Sources 130(1-2): 266-274. Alem, v., C. (2008). Rijden voor vijf cent per kilometer. Brabantsdagblad. Armand, M. and J. M. Tarascon (2008). "Building better batteries." Nature 451: 652-657. Arnbak, J. (1999). Policy priorities for information infrastructure development. Research Workshop on telematics and the economy of infromation societies. Zoetermeer. Axsen, J., A. Burke, et al. (2008). Batteries for Plug-in Hybrid Electric Vehicles (PHEVs): Goals and the State of Technology. DAVIS, Institute of Transportation Studies, University of California. Barkenbus, J. (2009). "Our electric automotive future: CO2 savings through a disruptive technology." Policy and Society 27: 399–410. Barnes, M. (2003). Practical Variable Speed Drives and Power Electronics, Elsevier. Bass, R., R. Harley, et al. (2001). Residential harmonic loads and EV charging. IEEE Power Engineering Society Winter Meeting, 2001. Basu, M., K. Gaughan, et al. (2004). Harmonic distortion caused by EV battery chargers in the distribution systems network and its remedy. Universities Power Engineering Conference, 2004. UPEC 2004. 39th International. Bauer, H. and Robert Bosch GmbH. (2000). Automotive handbook. Stuttgart. Berisha, S. H., G. G. Karady, et al. (1996). Current harmonics generated by electric vehicle battery chargers. Proceedings of the 1996 International Conference on Power Electronics, Drives and Energy Systems for Industrial Growth, New Delhi, India. BERR and DfT (2008). Investigation into the Scope for the Transport Sector of a Switch to Electric Vewhicles and Plug-in Hybrid Vehciles. London, Arup and Cenex. Bezemer, M. (2009). "Bedrijven kopen 3000 elektro-auto’s." from http://www.trouw.nl/groen/nieuws/article2856412.ece/Bedrijven_kopen_3000_elektro-auto_rsquo_s_.html. Birnie Iii, D. P. (2009). "Solar-to-vehicle (S2V) systems for powering commuters of the future." Journal of Power Sources 186(2): 539-542. Blom, J. H. (2009). De tweede revolutie: “recente ontwikkelingen in de elektrische energievoorziening”, Elfde Hidde Nijland rede. Bojrup, M. (1999). Advanced control of active filters in a battery charger application.

SCHIPHOL THE GROUNDS 2030 315
Department of Industrial Electrical Engineering and Automation (Institutionen för industriell elektroteknik och automation), Lund Institute of Technology ( Lunds tekniska högsk.). M.Sc. Bolier, M. (2009). "Coalitiepartijen: 'Scepsis rond elektrisch rijden is verdwenen'." from http://www.zerauto.nl/blog/index.php/2009/08/17/vloeiende-versnelling-elektrische-auto-n. Broersma, S. (2008). De PV wirefree zonwering. Faculty of Architecture. Delft, Delft University of Technology. MSc. Bronold, M. (2009). Lithium-Ionen Batteriesysteme fur Hybrid- und Elecktrofahrzeuge. Design and Elektronik Entwicklerforum. Munchen. Brooks, A. N., D. Research, et al. (2002). Vehicle-to-grid Demonstration Project Grid Regulation Ancillary Service with a Battery Electric Vehicle, AC Propulsion, Inc. Broussely, M. and G. Archdale (2004). "Li-ion batteries and portable power source prospects for the next 5-10 years." Journal of Power Sources 136(2 SPEC. ISS.): 386-394. Bruce, P. G. (2008). "Energy storage beyond the horizon: Rechargeable lithium batteries." Solid State Ionics 179(21-26): 752-760. Calis, M. and T. Frouke (2009). Een oorlog over fijnstofrapporten (A war over particulate pollution repors). The Gederlander. Ceder, G. and B. Kang (2009). "Response to "unsupported claims of ultrafast charging of Li-ion batteries"." Journal of Power Sources 194(2): 1024-1028. Chen, M. and G. A. Rincon-Mora (2006). "Accurate Electrical Battery Model Capable of Predicting Runtime and I-V Performance." IEEE Transactions on Energy Conversion 21(2). CPB (2004). "Netherlands Bureau for Economic Policy Analysis." from www.cpb.nl. CROW (2002). Van parkeerbeheer naar mobiliteitsmanagement. Ede. Cuijpers, C. and B. Koops (2008). Het wetsvoorstel ‘slimme meters’: een privacytoets op basis van art. 8 EVRM, Universiteit van Tilburg – Centrum voor Recht, Technologie en Samenleving. De Koning, M. F., A. Veltman, et al. (2004). Modeling battery efficiency with parallel branches. PESC Record - IEEE Annual Power Electronics Specialists Conference. Aachen, Germany. Dekkers, F. (2009). Sustainable area development in Haarlemmermeer. Faculty of Architecture. Delft, Delft University of Technology. MSc. Denholm, P. and W. Short (2006). An Evaluation of Utility System Impacts and Benefits of Optimally Dispatched Plug-In Hybrid Electric Vehicles, National Renewable Energy Laboratory, USA. Doughty, D. H. and C. C. Crafts (2006). FreedomCAR Electrical Energy Storage System Abuse Test Manual for Electric and Hybrid Electric Vehicle Applications.
316 SCHIPHOL THE GROUNDS 2030
SAND 2005-3123. Ehrenfeld, J. (2008). Sustainability by design : a subversive strategy for transforming our consumer culture. New Haven, Yale University Press. Ehsani, M. (2005). Modern electric, hybrid electric, and fuel cell vehicles : fundamentals, theory, and design. Boca Raton, CRC Press. EIA (1999). Automotive Fuels for the Future, The Search for Alternatives. Emadi, A., M. Ehsani, et al. (2003). Vehicular Electric Power Systems: Land, Sea, Air, and Space Vehicles. New York, NY: Marcel Dekker. Energierapport (2008). M. o. E. affairs. Den Haag. Fahey, L. and R. M. Randall (c1998). Learning from the future: competitive foresight scenarios. New York, Wiley. Flipsen, S. F. J. (2006). "Power sources compared: The ultimate truth?" Journal of Power Sources 162(2): 927-934. Fuhs, A. E. (2009). Hybrid vehicles and the future of personal transportation. Boca Raton, CRC Press. Gao, L. and S. Liu (2002). "Dynamic Lithium-Ion Battery Model for System Simulation." IEEE Transactions on Components and Packaging Technologies 25(3). GCM (2009). "GreenCar Magazine." Retrieved 20, August, 2009, from http://www.greencarmagazine.net/2009/07/in-the-year-2020-there-will-be-one-million-electric-cars-on-the-road-in-the-netherlands/. Geldof, G. D. (2002). Omgaan met Complexiteit bij Integraal Waterbeheer. Civiele Techniek. Enschede, Universiteit Twente. PhD. Gerber, M. B. (2005). The Electrical, Thermal and Spatial Integration of a Converter in a Power Electronic Module - PhD Thesis. Delft, TU Delft. Graham, R. (2001). "Comparing the Benefits and Impacts of Hybrid Electric Vehicle Options." Electric Power Research Institute (EPRI), Palo Alto, CA, Report 1000349. Green, K., Ph. Vergragt (2001). Towards sustainable households: a methodology for developing sustainable technologal and social innovations. 9th Greening of Industry Network Conference, January 2001. Bangkok: 20. Green, M. A., Third Generation Photovoltaics Advanced Solar Energy Conversion, 2006 (2006 ). Third Generation Photovoltaics Advanced Solar Energy Conversion. Guidi, G., T.M. Undeland, and Y. Hori, (2009). Effectiveness of Supercapacitors as Power-Assist in Pure EV Using a Sodium-Nickel Chloride Battery as Main Energy Storage. EVS24. Stavanger, Norway. Haarlemmermeer, M. (2009). Statistics. F. Dekker. Haarlemmermeer. Hatton, C. E. (2009). Charging Stations for Urban Settings. The design of a product platform for electric vehicle infrastructure in Dutch cities. Faculty of Industrial Design
SCHIPHOL THE GROUNDS 2030 317
Engineering. Delft, Delft University of Technology. Master: 128. Herskovitz, J. (2009). "South Korea tries recharging road to power vehicles." Retrieved 18 May, 2009, from www.reuters.com/article/idUSTRE54G07U20090517. Hofman, T., M. Steinbuch, et al. (2007). "Rule-based energy management strategies for hybrid vehicles." International Journal of Electric and Hybrid Vehicles Volume 1(Number 1): 71 - 94. Hopkins, R. (2008). The Transition Handbook: From Oil Dependency to Local Resilience Green Books; 1st edition. Horvath, I. (2008). "On the differences between research in design context and design inclusive research in the domain of industrial design engineering." Journal of Design Research Vol. 7(No. 1): 61-83. Hunik, R. and R. Ross (2008). De Toekomst Van De Accu, IWO Presentation. Automotive Technology Centre (ATC) electric vehicle symposium. Hussain, I. (2003). Electric and Hybrid Vehicles: Design Fundamentals, CRC Press. IEA (2003). ENERGY TO 2050: Scenarios for a Sustainable Future. IF Technology (2008 ). "Bodemenergie: De potentiele duurzame energiebron van Noord-Brabant." IFM (2009). "Morphological charts." from http://www.ifm.eng.cam.ac.uk/ctm/idm/tools/concept/morph.html. Jacobson, M. Z. (2008 ). Review od Solutions to Global Warming. Air Pollution, and Energy Security, draft Air Pollution, and Energy Security. Jong, T. M. d. (1996). The existing Environmental perception inhibits consideration of effective solution to the ecological crisis. The Architectural Anual. Delft/Rotterdam, 010 Publishers. '95-'96. Jossen, A. (2006). "Fundamentals of battery dynamics." Journal of Power Sources 154(2): 530-538. KAIST (2009). "Korean electric car gets a charge - an induction charge - from the road." Retrieved 4 september, from http://green.autoblog.com/2009/09/02/korean-electric-car-gets-a-charge-an-induction-charge-from-t/. Kang, B. and G. Ceder (2009). "Battery materials for ultrafast charging and discharging." Nature 458(7235): 190-193. Kempton, W. (2001). Vehicle-to-grid power: battery, hybrid, and fuel cell vehicles as resources for distributed electric power in California. Davis, Institute of Transportation Studies, University of California. Kempton, W. and J. Tomic (2005). "Vehicle-to-grid power fundamentals: Calculating capacity and net revenue." Elsevier Journal of Power Sources 144(1): 268-279. Kempton, W. and J. Tomic (2005). "Vehicle-to-grid power fundamentals: Calculating capacity and net revenue." Journal of Power Sources 144(1): 268-279.

318 SCHIPHOL THE GROUNDS 2030
Kempton, W. and J. Tomic (2005). "Vehicle-to-grid power implementation: From stabilizing the grid to supporting large-scale renewable energy." Elsevier Journal of Power Sources 144(1): 280-294. Kendall, G. (2008). Plugged In, The End Of The Oil Age. Kiehne, H. A. (2003). Battery Technology Handbook, Marcel Dekker Inc. Kintner-Meyer, M., K. Schneider, et al. (2007). Impacts Assessment of Plug-In Hybrid Vehicles on Electric Utilities and Regional US Power Grids Part 1: Technical Analysis, Pacific Northwest National Laboratory. Kliesch, J. and T. Langer (2006). Plug-in Hybrids: An Environmental And Economic Performance Outlook, American Council for an Energy-Efficient Economy KNMI (2006). "www.knmi.nl." Knoppers, R. (2009). "Friese elektromotor is veel lichter, Technisch Weekblad." from http://www.technischweekblad.nl/friese-elektromotor-is-veel-lichter.65593.lynkx. Koenigsegg (2009). "The NLV Quant- A solar electric car." Retrieved July, 2009, from http://www.koenigsegg.com/pressreleases.php?view=16. Kroeze, R. C. and P. T. Krein (2008). Electrical Battery Model for Use in Dynamic Electric Vehicle Simulations. IEEE Power Electronics Specialists Conference. Rhodes, Greece. Künneke, R. W., Bouwmans, I., Kling, W.L., Poelje, H. van, Slootweg, J.G., Stout, H.D., Vries, L.J. de, Wolters, M. (2001). Innovatie in energienetwerken. Faculteit Techniek, Bestuur en Management i.s.m. Delfts Interfacultair Onderzoekscentrum (DIOC) ‘Design and Management of Infrastructures’. Delft, Delft University of Technology. Lache, R., P. Nolan, et al. (2008). Electric Cars: Plugged In, Batteries must be included, Deutsche Bank FITT research. Lam, J. C., D. H. W. Li, et al. (2003). "An analysis of electricity end-use in air-conditioned office buildings in Hong Kong." Building and Environment 38(3): 493-498. Lemoine, D. M. and D. M. Kammen (2009). "An innovation and policy agenda for commercially competitive plug-in hybrid electric vehicles." Environmental Research Letters 4(039701): 3. Letendre, S., P. Denholm, et al. (2006). Electric & Hybrid Cars: New load, or New Source? Public Utilities Fortnightly. Liao, G. Y., T. R. Weber, et al. (2004). "Modelling and analysis of powertrain hybridization on all-wheel-drive sport utility vehicles." Proceedings of the Institution of Mechanical Engineers Part D-Journal of Automobile Engineering 218(D10): 1125-1134. Litman, T. (2009). Transportation Cost and Benefit Analysis II – Noise Costs, Victoria Transport Policy Institute (www.vtpi.org).

SCHIPHOL THE GROUNDS 2030 319
Lo, E. W. C., D. Sustanto, et al. (1999). Harmonic load flow study for electric vehicle chargers. Proceedings of the IEEE 1999 International Conference on Power Electronics and Drive Systems, 1999. PEDS'99. , Hong Kong. Lu, Y. and J. Jiang (2005). Harmonic-study of electric vehicle chargers. Proceedings of the Eighth International Conference on Electrical Machines and Systems, 2005. ICEMS 2005. MacKay, D. J. C. (2009). Sustainable Energy - without the hot air, Cambridge. MacLean, H. L. and L. B. Lave (2003). "Evaluating automobile fuel/propulsion system technologies." Progress in Energy and Combustion Science 29(1): 1-69. Madian, A. L., L. A. Walsh, et al. (2008). U.S. Plug-In Hybrid and U.S. Light Vehicle Data Book: Hybrid Vehicles, Battery Technology, Travel Patterns, Vehicle Stock, Sales Trends, Performance Trends, The Brookings Institution and Google.org. Manzini, E. (2008). Scenarios of sustainable ways of living. Blog Ezio Manzini. Milano, Blog Ezio Manzini: 1-9. Markel, T., A. Brooker, et al. (2006). Plug-in Hybrid Vehicle Analysis, Milestone Report, National Renewable Energy Laboratory. McCarthy, R. W., C. Yang, et al. (2007). Impacts of Electric-drive Vehicles on California’s Energy System. Proceedings of the 23rd Electric Vehicle Symposium, Anaheim. Mecke, R. (2001). Contactless Inductive Energy Transmission Systems with Large Air Gap. EPE 2001 Graz. Miller, J. M. (2004). "Propulsion Systems for Hybrid Vehicles." IEE Energy and Power Series, The Institution of Electrical Engineers 45. Miller, J. M. and R. Smith Ulatrcapacitor Assisted Electric Drives for Transportation, Maxwell Technologies. Miller, S. (2009). "Dream, green or in between?" Synovate Research global 'Dream versus green' cars survey. from http://www.synovate.com/insights/infact/issues/200906/segment1.shtml?id=. MNP (2009). "Brandstofverbruik en netto elektriciteitsproductie elektriciteitscentrales 1990 – 2007." Retrieved 30 juli 2009, from www.milieuennatuurcompendium.nl. MON (2006). Mobiliteitsonderzoek Nederland 2006, Ministerie van Verkeer en Waterstaat. Moore, S. W., K. M. Rahman, et al. (1999). "Effect on Vehicle Performance of Extending the Constant Power Region of Electric Drive Motors." SAE 1999-01-1152. MultiCorporation (2009). Nagelhout, D. and J. P. M. Ros (2009). Elektrisch autorijden, Evaluatie van transities op basis van systeemopties, Planbureau voor de Leefomgeving (PBL).

320 SCHIPHOL THE GROUNDS 2030
NHTS (2001). Highlights of the 2001 National Household Travel Survey, Bureau of Transportation Statistics, U.S. Department of Transportation. Norman Shiau, C., C. Samaras, et al. (2009). "Impact of battery weight and charging patterns on the economic and environmental benefits of plug-in hybrid vehicles." Energy Policy 37: 2653-2663. OntwerpAtelier, W. (2009). Parks, K., P. Denholm, et al. (2007). "Costs and emissions associated with plug-in hybrid electric vehicle charging in the Xcel Energy Colorado service territory." National Renewable Energy Laboratory, Technical Report NREL/TP-640-41410. Pavlovsky, M. (2006). Electronic DC Transformer with High Power Density - PhD Thesis. Delft, TU Delft. Pecas Lopes, J. A., F. J. Soares, et al. (2009). Smart Charging Strategies for Electric Vehicles: Enhancing Grid Performance and Maximizing the Use of Variable Renewable Energy Resources. EVS24 International Battery, Hybrid and Fuel Cell Electric Vehicle Symposium. Stavanger, Norway. Pedersen, L., J. Stang, et al. (2008). "Load prediction method for heat and electricity demand in buildings for the purpose of planning for mixed energy distribution systems." Energy & Buildings 40(7): 1124-1134. Pesaran, A. A., S. Burch, et al. (1999). An Approach for Designing Thermal Management Systems for Electric and Hybrid Electric Battery Packs. 4th Vehicle Thermal Management Systems Conference and Exhibition. London, UK. Peukert, W. (1897). "Über die Abhängigkeit der Kapazität von der Entladestromstärke bei Bleiakkumulatoren." Elektrotechnische Zeitschrift 20. Pistoia, G. (2009). Battery Operated Devices and Systems, Elsevier. Pop, V., et al. (2008). Battery Management Systems: Accurate State-of-Charge Indication for Battery-Powered Applications, Springerlink. Pratt, R. (2007). Potential Impacts of High Penetration of Plug-in Hybrid Vehicles on the U.S. Power Grid, Presentation Pacific Northwest National Laboratory. Quist, J. (2007). Backcasting for a sutainable future. Delft, Delft University of Technology / Eburon Publishers. Rahman, S. and G. B. Shrestha (1993). "An investigation into the impact of electric vehicle load on the electric utility distribution system." IEEE Transactions on Power Delivery 8(2): 591-597. RBGS, R. B. S. C. (2008). "Powertrain 2020: A Perspective from China. Shenyang, October 31st 2008." Resmini, F. and J. Ohlson (2009). ZEBRA battery integration in "Think City" pure battery electric vehicle. EVS 24. Stavanger, Norway. Sassen, S. (2004). The Global City: New York, London, Tokyo. Oxford, Princeton University Press.

SCHIPHOL THE GROUNDS 2030 321
Schweighofer, B., K. Raab, et al. (2002). Modeling of High Power Automotive Batteries by the Use of an Automated Test System. IEEE Instrumentation and Measurement Technology Conference. Anchorage, AK, USA. SEI (2007). "Hybrid Electric and Battery Electric Vehicles, Technology, Costs and Benefits." Retrieved November 2007. Senternovem (2007). Cijfers en tabellen 2007 – Kompas, energiebewust wonen en werken. Utrecht, SenterNovem. Shi, L., A. Meintz, et al. (2008). Single Phase Bidirectional AC-DC Converters for Plug-in Hybrid Electric Vehicle Applications,. IEEE Vehicle Power and Propulsion Conference. Harbin, China. Short, W. and P. Denholm (2006). A Preliminary Assessment of Plug-In Hybrid Electric Vehicles on Wind Energy Markets, National Renewable Energy Laboratory, USA. Skvarenina, T. (2002). The Power Electronics Handbook, CRC Press. Sovacool, B. and R. Hirsh (2008). "Beyond batteries: An examination of the benefits and barriers to plug-in hybrid electric vehicles (PHEVs) and a vehicle-to-grid (V2G) transition." Energy Policy 37: 1095–1103. Sugimori, K., H. Sakamoto, et al. (2000). "A One-Converter Contactless Charger for Electric Vehicles." Electrical Engineering in Japan 132(2). Timmeren, A. v. (2006). Autonomie & Heteronomie. Integratie en verduurzaming van essentiële stromen in de gebouwde omgeving. Faculteit Bouwkunde. Delft, Technische Universiteit Delft. PhD. TMC (2003, May 2003). "Toyota Hybrid System: THS II." Retrieved June, 2009, from http://www.toyota.co.jp/en/tech/environment/ths2/SpecialReports_12.pdf. TNO (2008). Renewed interest in geothermal energy. Nederlandse Organisatie voor Toegepast Natuurwetenschappelijk Onderzoek (TNO). Delft, Nederlandse Organisatie voor Toegepast Natuurwetenschappelijk Onderzoek (TNO), . Tomic, J. and W. Kempton (2007). "Using fleets of electric-drive vehicles for grid support." Elsevier Journal of Power Sources 168(2): 459-468. Transumo (2009). "Home page." Retrieved September 2009, from http://www.transumo.nl/NL/Home.aspx. Ummels, B. C. (2009). Power System Operation with Large-Scale Wind Power in Liberalised Environments. Electrical Power Engineering. Delft, Delft Univeristy of Technology. Doctor. USABC (1996). Electric Vehicle Battery Test Procedures Manual Rev 2, Idaho National Engineering Laboratory. Vale, R. and B. Vale (2009). Time to Eat the Dog?: The Real Guide to Sustainable Living Thames & Hudson.
322 SCHIPHOL THE GROUNDS 2030
van den Berg, J., I. Harms, et al. (2009). Actieplan Elektrisch Rijden Op weg naar één miljoen elektrische auto’s in 2020, Achtergronddocument, DHV. Van den Bossche, P., F. Vergels, et al. (2006). "SUBAT: An assessment of sustainable battery technology." Journal of Power Sources 162(2): 913-919. van der Hoeven, M. J. A. and C. Eurlings (2009). "Plan van aanpak elektrisch rijden” brief ministers Eurlings en van der Hoeven aan parlement. Den Haag. Van Essen, e. a. (2008). Handbook on estimation of external costs in the transport sector Produced within the study Internalisation Measures and Policies for All external Cost of Transport (IMPACT). Delft. van Keulen, T., et al (2009). Optimal Energy Management in Hybrid Electric Trucks Using Route Information. IFP International Conference Advances in Hybrid Powertrains. Paris & Lyon. Van Kouwen, P. M. (2008). The role of Plug-in hybrid vehicles in the electrification of the Dutch transport sector-Master Thesis Faculty Science and Innovation Management, University Utrecht. Van Merkerk, R. (2007). Intervening in emerging nanotechnologies Copernicus Institute for Sustainable Development and Innovation. van Notten, P. W. F., J. Rotmans, et al. (2003). "An updated scenario typology." Futures 35(5): 423-443. Vereecken, e. a. (2003). "How to define clean vehicles? Environmental impact rating of vehicles." International Journal of Automotive Technology 4(2): 77-86. Villa, J. L., J. Sallan, et al. (2009). "Design of a high frequency Inductively Coupled Power Transfer system for electric vehicle battery charge." Applied Energy 86(3): 355-363. Vyas, A. D., H. K. Ng, et al. (1997). "Batteries for electric drive vehicles: evaluation of future characteristics and costs through a Delphi study." SAE Special Publications 1274: pp. 13-34. Wang, C. S., O. H. Stielau, et al. (2005). "Design Considerations for a Contactless Electric Vehicle Battery Charger." IEEE Transactions on Industrial Electronics 52(5). Waterstaat, M. V. e. (2003). Luchthavenindelingsbesluit Schiphol 2003. Den Haag. WBCSD (2004). Mobility 2030, meeting the challenges to sustainability Geneva, World Business Council for Sustainable Development. Westbrook, M. H. (2001). "The Electric Car: Development and future of battery, hybrid and fuel-cell cars." IEE Power Series 38. Wicke, V., C. J. Brace, et al. (2000). " The potential for simulation of driveability of CVT vehicles." SAE Transactions - Journal of Passenger Cars(SAE 2000-01-0830). Williams, B. D. and K. S. Kurani (2007). "Commercializing light-duty plug-in/plug-out hydrogen-fuel-cell vehicles: “Mobile Electricity” technologies and opportunities." Journal of Power Sources 166: 549–566.

SCHIPHOL THE GROUNDS 2030 323
Wolters-Noordhoff (2005). De Grote Bosatlas – editie 52, 5e oplage. Groningen,. Wyrsch, N., et al. (2006). Ultra Light Amorphous Silicon Cell for Space Applications. 4th World Conference and Exhibition on Photovoltaic Solar Energy Conversion, Hawaii. Yik, F. W. H., J. Burnett, et al. (2001). "Predicting air-conditioning energy consumption of a group of buildings using different heat rejection methods." Energy & Buildings 33(2): 151-166. Zaghib, K., J. B. Goodenough, et al. (2009). "Unsupported claims of ultrafast charging of LiFePO4 Li-ion batteries." Journal of Power Sources 194(2): 1021-1023. Zeraoulia, M., M. E. H. Benbouzid, et al. (2006). "Electric Motor Drive Selection Issues for HEV Propulsion Systems: A Comparative Study." IEEE Transactions on Vehicular Technology 55(6): 1756-1764.

324 SCHIPHOL THE GROUNDS 2030
9 Appendix
9.1 Results from other three Scenarios
9.1.1 Results of Scenario “Time to eat the dog”
9.1.1.1 Office, Hotel and Leisure Load Profile of Elzenhof
Fig 248. Weekly load profile of Elzenhof in 2030
Fig 249. Daily load profile of Elzenhof in 2030
9.1.1.2 Solar Production Profile Solar energy production is not considered in this scenario.
9.1.1.3 Charging Load In this section, the loads of two charging patterns are presented: dumb slow charging and controlled charging. In both charging patterns, the commuting group contains two sub-groups: one sub-group arrives at 8:00 and leaves at 16:00; another sub-group arrives at 9:00 and leaves at 17:00. The smart charging option will be presented in the next section, after a discussion of the economic benefits associated with it. Smart charging will not only distribute the charging load, but can also improve the economic efficiency of solar power production and increase revenues by means of a V2G function.

SCHIPHOL THE GROUNDS 2030 325
9.1.1.3.1 Dumb slow charging In the dumb slow charging option, the EVs are directly charged after being used, without consideration of the grid limitation. The load of dumb slow charging shows a high power peak, due to the simultaneous charging of many EVs.
Fig 250. EV/PHEV direct-slow charging weekly load profile in 2030
Fig 251. EV/PHEV direct-slow charging daily load profile in 2030
Fig 252. Weekly grid power flow at the main 50kv/10kv transformer of Elzenhof with dumb charging
9.1.1.3.2 Controlled Charging
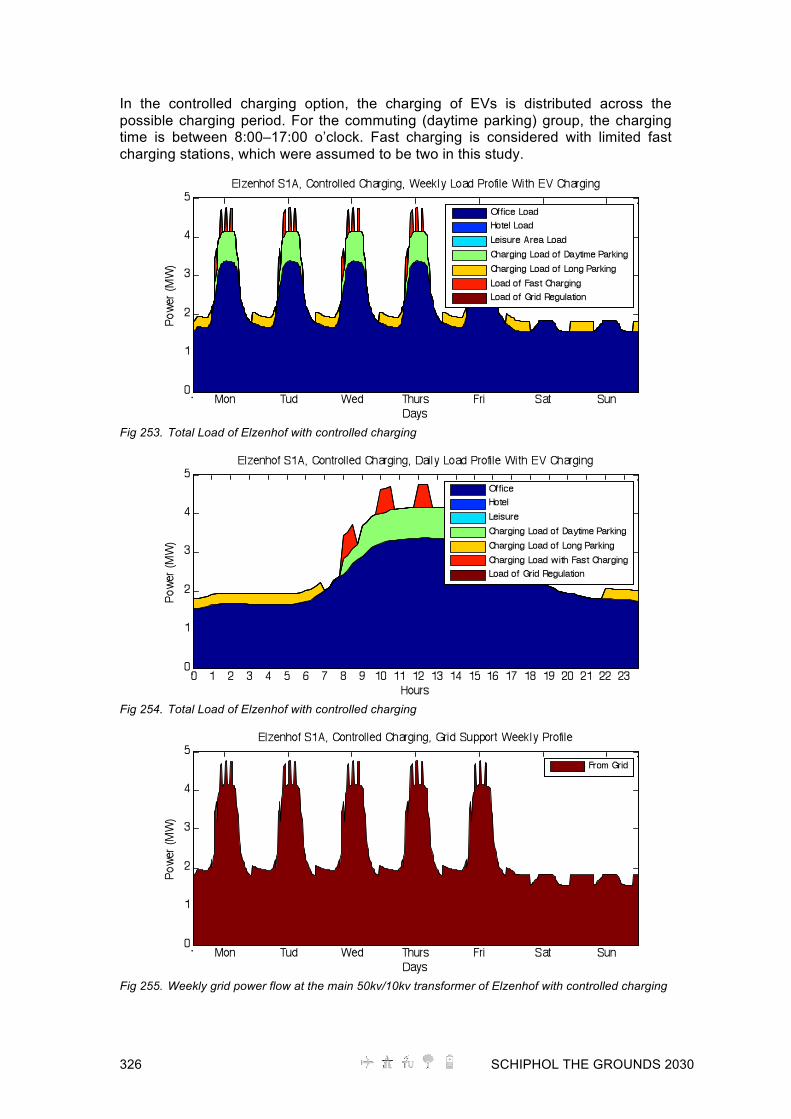
326 SCHIPHOL THE GROUNDS 2030
In the controlled charging option, the charging of EVs is distributed across the possible charging period. For the commuting (daytime parking) group, the charging time is between 8:00–17:00 o’clock. Fast charging is considered with limited fast charging stations, which were assumed to be two in this study.
Fig 253. Total Load of Elzenhof with controlled charging
Fig 254. Total Load of Elzenhof with controlled charging
Fig 255. Weekly grid power flow at the main 50kv/10kv transformer of Elzenhof with controlled charging

SCHIPHOL THE GROUNDS 2030 327
9.1.1.3.3 Smart Charging
Fig 256. Weekly load profile of Elzenhof with smart charging providing V2G function
Fig 257. Daily load profile of Elzenhof with smart charging providing V2G function
Fig 258. Weekly grid power flow at the main 50kv/10kv transformer of Elzenhof with smart charging providing V2G function

328 SCHIPHOL THE GROUNDS 2030
9.1.2 Results of Scenario “As Good as Its Gets”
9.1.2.1 Office, Hotel and Leisure Load Profile of Elzenhof
Fig 259. Weekly load profile of Elzenhof in 2030
Fig 260. Daily load profile of Elzenhof in 2030
9.1.2.2 Solar Production Profile Solar energy production is not considered in this scenario.
9.1.2.3 Charging Load In this section, the loads of two charging patterns are presented: dumb slow charging and controlled charging. In both charging patterns, the commuting group contains two sub-groups: one sub-group arrives at 8:00 and leaves at 16:00; another sub-group arrives at 9:00 and leaves at 17:00. The smart charging option will be presented in the next section, after a discussion of the economic benefits associated with it. Smart charging will not only distribute the charging load, but can also improve the economic efficiency of solar power production and increase revenues by means of a V2G function.

SCHIPHOL THE GROUNDS 2030 329
9.1.2.3.1 Dumb slow charging In the dumb slow charging option, the EVs are directly charged after being used, without consideration of the grid limitation. The load of dumb slow charging shows a high power peak, due to the simultaneous charging of many EVs.
Fig 261. EV/PHEV direct-slow charging weekly load profile in 2030
Fig 262. EV/PHEV direct-slow charging daily load profile in 2030
Fig 263. Weekly grid power flow at the main 50kv/10kv transformer of Elzenhof with dumb charging

330 SCHIPHOL THE GROUNDS 2030
9.1.2.3.2 Controlled Charging In the controlled charging option, the charging of EVs is distributed across the possible charging period. For the commuting (daytime parking) group, the charging time is between 8:00–17:00 o’clock. Fast charging is considered with limited fast charging stations, which were assumed to be two in this study.
Fig 264. Weekly load profile of Elzenhof with controlled charging
Fig 265. Daily load profile of Elzenhof with controlled charging
Fig 266. Weekly grid power flow at the main 50kv/10kv transformer of Elzenhof with controlled charging

SCHIPHOL THE GROUNDS 2030 331
9.1.2.3.3 Smart Charging
Fig 267. Weekly load profile of Elzenhof with smart charging providing V2G function
Fig 268. Daily load profile of Elzenhof with smart charging providing V2G function
Fig 269. Weekly grid power flow at the main 50kv/10kv transformer of Elzenhof with smart charging providing V2G function
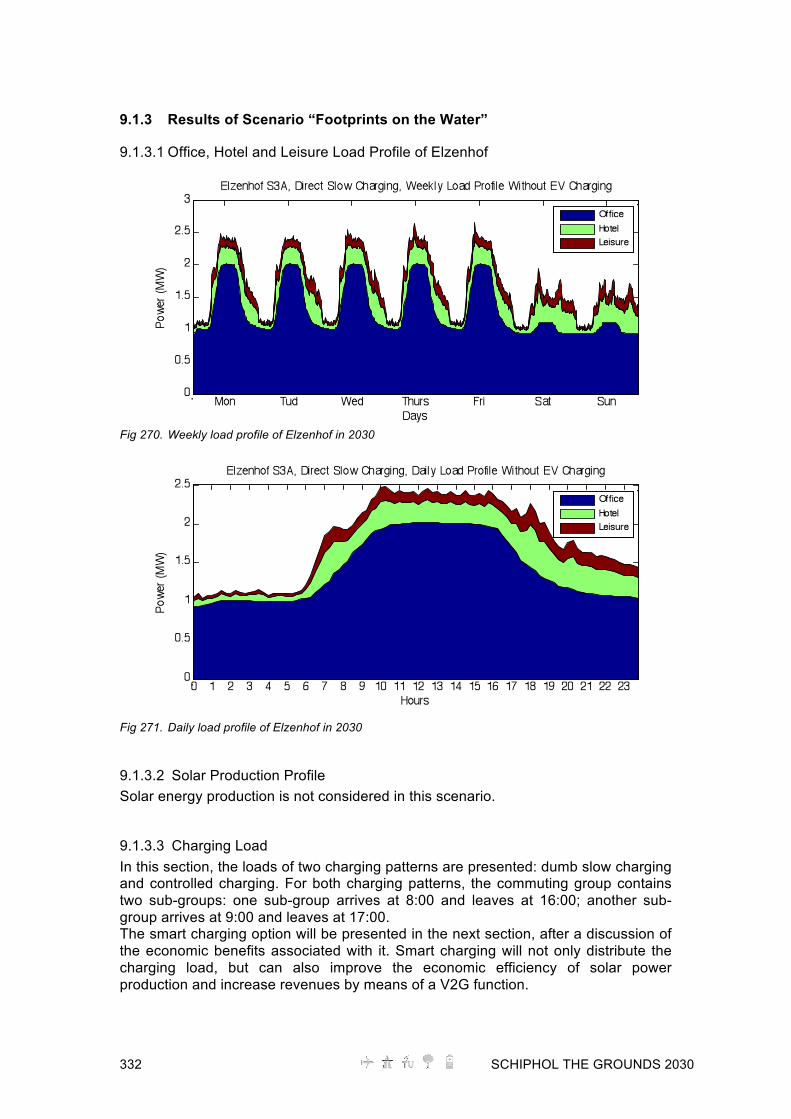
332 SCHIPHOL THE GROUNDS 2030
9.1.3 Results of Scenario “Footprints on the Water”
9.1.3.1 Office, Hotel and Leisure Load Profile of Elzenhof
Fig 270. Weekly load profile of Elzenhof in 2030
Fig 271. Daily load profile of Elzenhof in 2030
9.1.3.2 Solar Production Profile Solar energy production is not considered in this scenario.
9.1.3.3 Charging Load In this section, the loads of two charging patterns are presented: dumb slow charging and controlled charging. For both charging patterns, the commuting group contains two sub-groups: one sub-group arrives at 8:00 and leaves at 16:00; another sub-group arrives at 9:00 and leaves at 17:00. The smart charging option will be presented in the next section, after a discussion of the economic benefits associated with it. Smart charging will not only distribute the charging load, but can also improve the economic efficiency of solar power production and increase revenues by means of a V2G function.

SCHIPHOL THE GROUNDS 2030 333
9.1.3.3.1 Dumb slow charging In the dumb slow charging option, the EVs are directly charged after being used, without consideration of the grid limitation. The load of dumb slow charging shows a high power peak, due to the simultaneous charging of many EVs.
Fig 272. EV/PHEV direct-slow charging weekly load profile in 2030
Fig 273. EV/PHEV direct-slow charging daily load profile in 2030
Fig 274. Weekly grid power flow at the main 50kv/10kv transformer of Elzenhof with dumb charging

334 SCHIPHOL THE GROUNDS 2030
9.1.3.3.2 Controlled Charging In the controlled charging option, the charging of EVs is distributed across the possible charging period. For the commuting (daytime parking) group, the charging time is between 8:00–17:00 o’clock. Fast charging is considered with limited fast charging stations, which were assumed to be two in this study.
Fig 275. Weekly load profile of Elzenhof with controlled charging
Fig 276. Daily load profile of Elzenhof with controlled charging
Fig 277. Weekly grid power flow at the main 50kv/10kv transformer of Elzenhof with controlled charging

SCHIPHOL THE GROUNDS 2030 335
9.1.3.3.3 Smart Charging
Fig 278. Weekly load profile of Elzenhof with smart charging providing V2G function
Fig 279. Daily load profile of Elzenhof with smart charging providing V2G function
Fig 280. Weekly grid power flow at the main 50kv/10kv transformer of Elzenhof with smart charging providing V2G function

336 SCHIPHOL THE GROUNDS 2030
9.2 Appendix D Standards for EVs The standards for EV/PHEVs connecting with the power grid are provided in this section. The international principle standards concerning EV/PHEVs are listed in Table 48. Table 48. Standards concerning EV/PHEVs
IEC 61851 Electric vehicle conductive charging system IEC 61000 Electromagnetic compatibility NF EN 60309 Plugs, socket-outlets and couplers for industrial purposes NF EN 60245 Rubber insulated cables NEC 625 Electric vehicle charging system
SAE J1772, 1773 Electric vehicle conductive and inductive charging SAE J2293 Energy transfer system for electric vehicles CISPR 14 et 22 Electromagnetic compatibility and radio disturbance for household
appliances NFC 15-100 Low voltage electricity supply systems NFC 14-100 Low voltage connectors IEEE 1547 Interconnecting distributed resources with the electric power system