Testing the use of a ‘questionnaire survey instrument’to investigate public perceptions of...
24
ORIGINAL PAPER Testing the use of a ‘questionnaire survey instrument’ to investigate public perceptions of tsunami hazard and risk in Sydney, Australia Deanne Bird Dale Dominey-Howes Received: 21 December 2006 / Accepted: 24 July 2007 / Published online: 6 November 2007 Ó Springer Science+Business Media B.V. 2007 Abstract The Indian Ocean tsunami (IOT) of December 2004 has demonstrated that the coasts of Australia are vulnerable to tsunami flooding. As a consequence of the IOT, the Australian Federal Treasurer announced in 2005 that the Bureau of Meteorology and Geoscience Australia will jointly develop and implement the Australian Tsunami Warning System. Effective response to tsunami warnings is highly dependent on public awareness and perception of tsunami hazard and risk. At present, no efforts have been made to investigate and publish public awareness of tsunami hazard and risk and as such, emer- gency managers have little idea of the likely challenges to effecting appropriate tsunami risk management. We develop a short questionnaire survey instrument and trial that instrument in order to investigate its suitability for generating information about the per- ceptions of tsunami hazard and risk in the Sydney region. We found that the design, layout and format of the questionnaire were suitable for our purpose and should be useful for generating information appropriate to emergency management agencies tasked with the responsibility of developing tsunami education campaigns and risk mitigation strategies in Australia. However, certain limitations, such as individual question design and format, should be considered before a much larger survey of various stakeholders is conducted. Keywords Tsunami risk Á Sydney Á Public perception Á Risk mitigation Á Questionnaire survey instrument Á Questionnaire structure D. Bird (&) Department of Physical Geography, Macquarie University, North Ryde, Sydney, NSW 2109, Australia e-mail: [email protected] D. Dominey-Howes Risk Management Research Group, School of Safety Science, University of New South Wales, Sydney 2052, Australia e-mail: [email protected] 123 Nat Hazards (2008) 45:99–122 DOI 10.1007/s11069-007-9172-8
-
Upload
independent -
Category
Documents
-
view
1 -
download
0
Transcript of Testing the use of a ‘questionnaire survey instrument’to investigate public perceptions of...

ORI GIN AL PA PER
Testing the use of a ‘questionnaire survey instrument’to investigate public perceptions of tsunami hazardand risk in Sydney, Australia
Deanne Bird Æ Dale Dominey-Howes
Received: 21 December 2006 / Accepted: 24 July 2007 / Published online: 6 November 2007� Springer Science+Business Media B.V. 2007
Abstract The Indian Ocean tsunami (IOT) of December 2004 has demonstrated that the
coasts of Australia are vulnerable to tsunami flooding. As a consequence of the IOT, the
Australian Federal Treasurer announced in 2005 that the Bureau of Meteorology and
Geoscience Australia will jointly develop and implement the Australian Tsunami Warning
System. Effective response to tsunami warnings is highly dependent on public awareness
and perception of tsunami hazard and risk. At present, no efforts have been made to
investigate and publish public awareness of tsunami hazard and risk and as such, emer-
gency managers have little idea of the likely challenges to effecting appropriate tsunami
risk management. We develop a short questionnaire survey instrument and trial that
instrument in order to investigate its suitability for generating information about the per-
ceptions of tsunami hazard and risk in the Sydney region. We found that the design, layout
and format of the questionnaire were suitable for our purpose and should be useful for
generating information appropriate to emergency management agencies tasked with the
responsibility of developing tsunami education campaigns and risk mitigation strategies in
Australia. However, certain limitations, such as individual question design and format,
should be considered before a much larger survey of various stakeholders is conducted.
Keywords Tsunami risk � Sydney � Public perception � Risk mitigation �Questionnaire survey instrument � Questionnaire structure
D. Bird (&)Department of Physical Geography, Macquarie University, North Ryde,Sydney, NSW 2109, Australiae-mail: [email protected]
D. Dominey-HowesRisk Management Research Group, School of Safety Science, University of New South Wales,Sydney 2052, Australiae-mail: [email protected]
123
Nat Hazards (2008) 45:99–122DOI 10.1007/s11069-007-9172-8
1 Introduction and aims
The Indian Ocean tsunami (IOT) disaster of December 2004 was significant not just
because of the number of lives lost but because it demonstrated that large, regionally
destructive tsunami are not confined to the Pacific Ocean. For countries with coastal
landscape areas bordering the Indian Ocean (including Australia), the effects of the IOT
provided a stark ‘wake-up call’ concerning the actual threat posed by tsunami—a hazard
not fully realised until now.
As a consequence of the IOT, the Australian Federal Treasurer announced in 2005
that the Bureau of Meteorology (BoM) and Geoscience Australia (GA) would jointly
develop and implement the Australian Tsunami Warning System (ATWS) (Geoscience
Australia 2005). GA and the BoM will co-ordinate the detection of tsunamigenic
events, monitor tsunami as they approach Australia and undertake forecast assess-
ments of probable tsunami impacts (Greenslade et al. 2007). These agencies will
evaluate what type (if any) of information and/or warning messages should be issued.
When required, the BoM will release initial warning messages to State or Territory
emergency service organisations and the media through the Bureau’s regional offices.
Messages will also be passed to EMA’s National Emergency Management Coordi-
nation Centre (NEMCC) (Sullivan 2006). Where required, the BoM Regional Offices
will issue detailed warning messages to the SES and the public. Meaningful public
response to any evacuation order is partly dependent on the clarity and accuracy of
those orders; the time available prior to tsunami arrival; the efficiency of the coor-
dinating emergency services and significantly, upon the public’s understanding and
perception of (tsunami) hazard and risk (Hurnen and McClure 1997; Johnston and
Benton 1998; Anderson-Berry 2003; Dominey-Howes and Minos-Minopoulos 2004;
Johnston et al. 2005). Therefore, having a clear understanding of the public’s
awareness and perception of tsunami is a vital element in developing hazard education
programmes and risk management procedures (Hurnen and McClure 1997; Johnston
and Benton 1998; Gough and Hooper 2003). In order to obtain information about
what the public understands in relation to a particular hazard type, it is necessary to
design and execute appropriate information gathering techniques such as questionnaire
surveys (McGuirk and O’Neill 2005; Parfitt 2005).
In light of the introduction, the aims of this article are to:
(1) Provide a short overview of the tsunami hazard and risk to, and exposure within, the
Sydney region, Australia;
(2) Briefly review the importance of public awareness and perception of hazard and
risk and consider the role of education in the mitigation of risk and
vulnerability;
(3) Develop a short questionnaire survey instrument and trial that instrument in order to
investigate its suitability for generating information about the perceptions of tsunami
hazard and risk in the Sydney region;
(4) Report the findings of this trial; and to,
(5) Consider the significance of our results to future studies of tsunami risk in
Australia and the emergency management community and make recommenda-
tions to improve our understanding of public awareness of tsunami hazard and
risk.
100 Nat Hazards (2008) 45:99–122
123

2 Identifying tsunami hazard, risk and exposure in the Sydney coastal region
Tsunami affecting Australia since European occupation have all been rather small, causing
little in the way of damage (Risk Frontiers 1995; Rynn and Davidson 1999; Dominey-
Howes 2007). In contrast, geological research since the late 1980’s suggests that the coast
of SE Australia has been repeatedly impacted by palaeo-(prehistoric) tsunami—some of
them very large (Bryant 2001; Bryant and Nott 2001; Bryant and Young 1996; Bryant
et al. 1992a, b; Kelletat and Scheffers 2003; Nott 1997, 2003a, b, 2004; Young and Bryant
1992; Young et al. 1995, 1996). In fact, Bryant and Nott (2001) report tsunami flood
heights south of Sydney to heights in excess of 100 m above sea level (m asl) with waves
sweeping as much as 10 km inland.
Whilst much more research needs to be conducted on the evidence for the reported
palaeo-tsunami in order to increase our confidence in their occurrence and likely effects
(Dominey-Howes 2007; Dominey-Howes et al. 2006), it is at least clear that historic
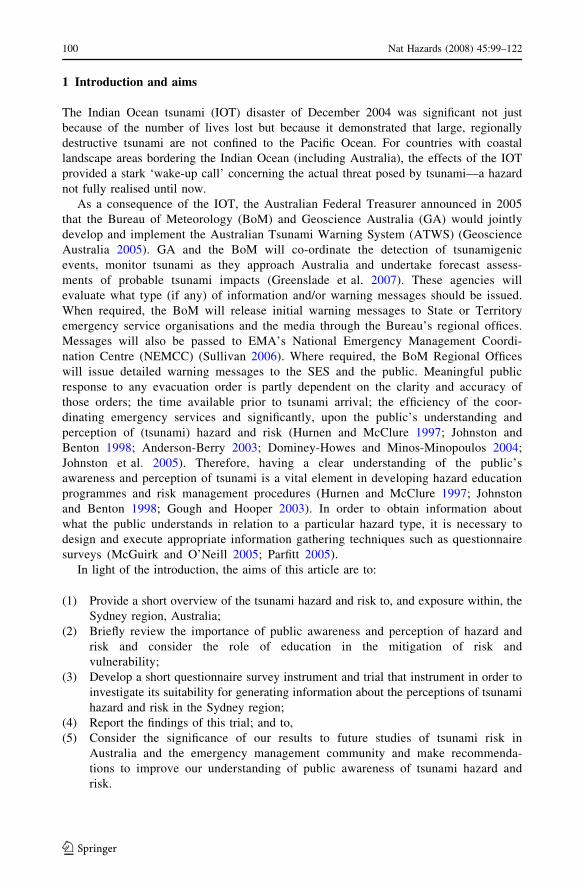
tsunami have inundated the eastern seaboard (Rynn and Davidson 1999). Work by Gu-
siakov (2005) is useful in defining regions within the Pacific that can generate tsunami
potentially damaging to eastern Australia. Gusiakov examined the total number of earth-
quakes with a magnitude of Ms C 7.0 and a depth h \ 100 km that occurred within the
Pacific basin between 1901 and 2000. He then compared these events with those that
generated a tsunami. This allowed him to calculate a Tsunami Efficiency ratio (TE%) for
each tsunamigenic region. Gusiakov’s tsunamigenic regions of the Pacific are shown in
Fig. 1. The TE% ratios are shown in Table 1.
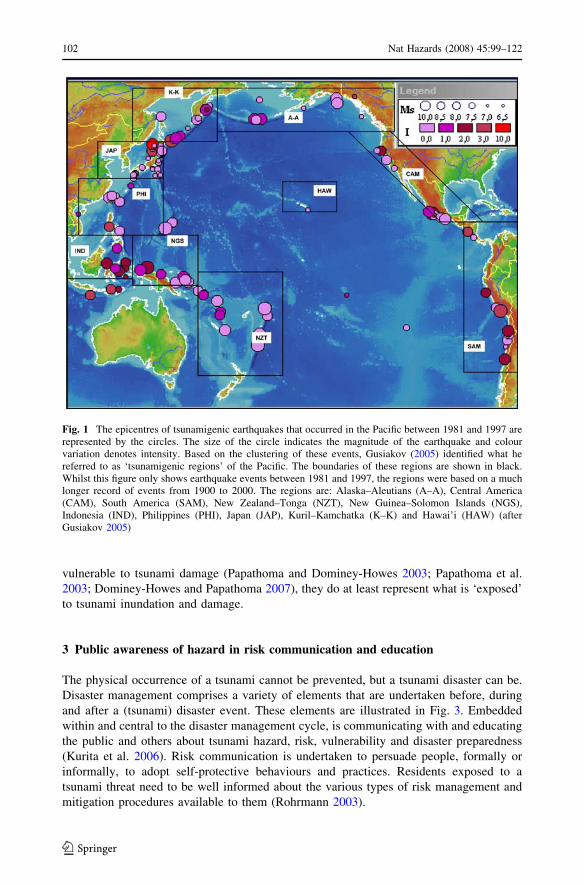
South America is the region most efficient at generating tsunami (followed by Indonesia
and the Philippines). New Zealand–Tonga and the Kuril–Kamchatka regions are least
efficient at generating tsunami. There are however, two significant limitations to using
these data. First, the analysis of events between 1901 and 2000 do not adequately reflect
the total cumulative tsunami risk for that period because the tsunamigenic events only
relate to earthquakes and do not include other mechanisms such as volcanic eruptions and
submarine sediment slides (Dominey-Howes and Keating 2005). Second, the approach
used by Gusiakov may not properly reflect the long-term earthquake-tsunami risk (i.e.
longer than 100 year period) within different regions of the Pacific because his analysis is
only based on a short time series of data from 1901 to 2000. It may be that over longer time
periods, other geographic regions dominate in terms of their tsunamigenic recurrence.
However, at the present time, the work of Gusiakov (2005) is the most comprehensive (and
publicly available) analysis of tsunamigenicity in the Pacific so we use his ‘tsunamigenic
regions’ in our study. Table 2 details return periods of tsunami for selected areas around
the Pacific. From Fig. 1 and Tables 1 and 2, it is apparent that Sydney is at risk from
tsunami generated in many of these regions—particularly those across the Pacific. Indeed,
the 1960 Chile tsunami and the 1964 Alaska tsunami both affected the NSW coast
including Sydney generating wave heights at shore of more than 1 m (Opper and Gissing
2005; Dominey-Howes 2007).
Approximately 330,000 people in New South Wales live within 1 km of the ocean or a
coastal river and at an elevation of no more than 10 m asl (Molino Stewart 2005; Chen and
McAneney 2006). More than 20% of these people are over the age of 65 years (Opper and
Gissing 2005). Within the Greater Sydney region specifically, there are a total of
*2.5 million addresses (residential, commercial, industrial etc) and of these, 46,000 are
located\1 km from the coastline and at an elevation of\3 m asl (Fig. 2) (Risk Frontiers
2005; Chen and McAneney 2006). Whilst these 46,000 addresses are not uniformly
Nat Hazards (2008) 45:99–122 101
123
vulnerable to tsunami damage (Papathoma and Dominey-Howes 2003; Papathoma et al.
2003; Dominey-Howes and Papathoma 2007), they do at least represent what is ‘exposed’
to tsunami inundation and damage.
3 Public awareness of hazard in risk communication and education
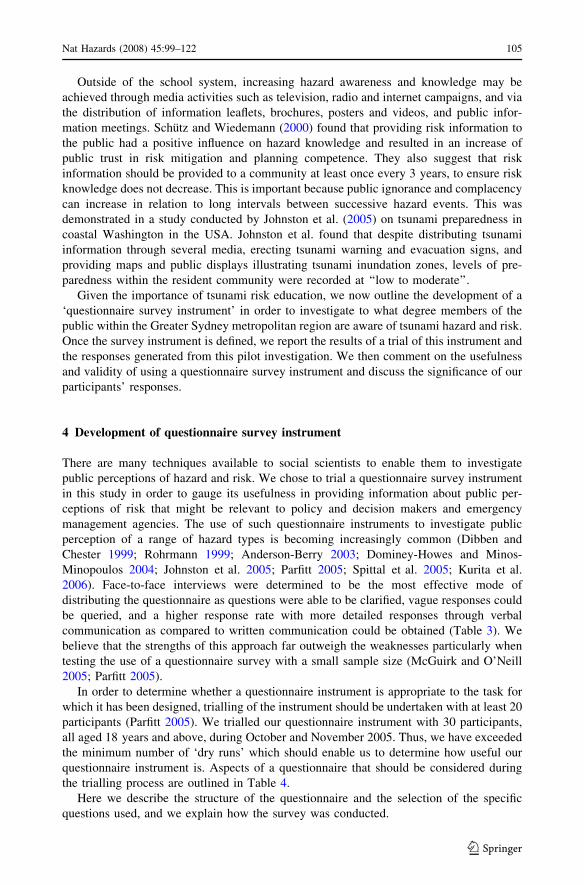
The physical occurrence of a tsunami cannot be prevented, but a tsunami disaster can be.
Disaster management comprises a variety of elements that are undertaken before, during
and after a (tsunami) disaster event. These elements are illustrated in Fig. 3. Embedded
within and central to the disaster management cycle, is communicating with and educating
the public and others about tsunami hazard, risk, vulnerability and disaster preparedness
(Kurita et al. 2006). Risk communication is undertaken to persuade people, formally or
informally, to adopt self-protective behaviours and practices. Residents exposed to a
tsunami threat need to be well informed about the various types of risk management and
mitigation procedures available to them (Rohrmann 2003).
Fig. 1 The epicentres of tsunamigenic earthquakes that occurred in the Pacific between 1981 and 1997 arerepresented by the circles. The size of the circle indicates the magnitude of the earthquake and colourvariation denotes intensity. Based on the clustering of these events, Gusiakov (2005) identified what hereferred to as ‘tsunamigenic regions’ of the Pacific. The boundaries of these regions are shown in black.Whilst this figure only shows earthquake events between 1981 and 1997, the regions were based on a muchlonger record of events from 1900 to 2000. The regions are: Alaska–Aleutians (A–A), Central America(CAM), South America (SAM), New Zealand–Tonga (NZT), New Guinea–Solomon Islands (NGS),Indonesia (IND), Philippines (PHI), Japan (JAP), Kuril–Kamchatka (K–K) and Hawai’i (HAW) (afterGusiakov 2005)
102 Nat Hazards (2008) 45:99–122
123
Risk communication and education may take several forms but education through the
school curriculum and effective home-based preparedness are closely linked (Johnston
et al. 2005). For example, a risk perception and preparedness survey conducted by Ronan
et al. (2001) on school children revealed that those who had been involved in hazard
education programs displayed more stable risk perceptions, reduced hazard-related fears
and demonstrated an increased awareness of important hazard-related protective behav-
iours compared to non hazard-educated children. Following hazard education, children are
likely to interact and educate their parents on hazard issues, in turn, increasing home-based
preparedness (Ronan et al. 2001; Johnston et al. 2005). The importance of hazard edu-
cation in schools was highlighted in Thailand during the 2004 IOT when a 10-year-old
British girl saved hundreds of lives by recognising the on-coming tsunami because of the
recession of coastal water from Phuket beach—a clear physical sign of a tsunami which
she had learnt about at school (King and Gurtner 2005).
Table 1 Total number of earthquakes (EQ) (Ms C 7.0 and depth, h \ 100 km) and tsunami (TS) in eachregion (between 1901 and 2000), and the tsunami generating efficiency (TE%) of these earthquakes (afterGusiakov 2005)
Region Earthquake(EQ)
Tsunami(TS)
Tsunami efficiency(TE) %
South America 122 102 84
Indonesia 86 68 79
Philippines 73 55 75
New Guinea–Solomon Islands 130 86 64
Central America 112 62 55
Japan 255 123 48
Alaska–Aleutians 108 49 46
Kuril–Kamchatka 150 68 45
New Zealand–Tonga 162 62 38
Hawaiia 3 13 100
a Hawai’i has experienced many locally generated tsunami but only three far-field tsunami of earthquakeorigin, which skews the data. The TE is 100% which says little about the efficiency of earthquake generatingtsunami in the Hawai’i region
Table 2 Tsunami frequency/recurrence intervals for selected geographic regions based upon the publishedliterature (after Dominey-Howes and Keating 2005)
Region Tsunami frequency Reference
Kamchatka 1 large event per 1,000 yearsor 1 event every 30 years
Pinegina et al. (2003)
Chile 1 large event every 200 years Salgado et al. (2003)
Cairns, Australia 1 event every 600 years Nott (1997)
Japan 1 major event every 500 years Nanayama et al. (2003)
Hawai’i 1 event every 30 years Dudley and Lee (1998)
Cascadia, NW USA 6 major events in 3,000 years Hutchinson and McMillan (1997)
Note: For Kamchatka, Chile, Australia and Japan, the frequency is calculated from the records of near-field(local) tsunami only. For Hawai’i, the frequency is calculated from the records of both near-field and far-field tsunami
Nat Hazards (2008) 45:99–122 103
123
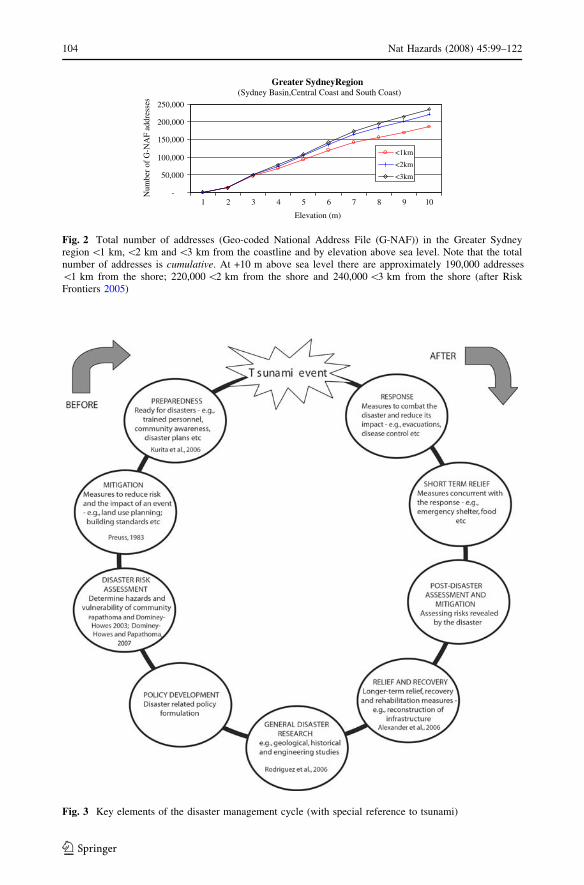
Fig. 3 Key elements of the disaster management cycle (with special reference to tsunami)
Greater SydneyRegion(Sydney Basin,Central Coast and South Coast)
-
50,000
100,000
150,000
200,000
250,000
1 2 3 4 5 6 7 8 9 10
Elevation (m)
Num
ber
of G
-NA
F ad
dres
ses
<1km
<2km
<3km
Fig. 2 Total number of addresses (Geo-coded National Address File (G-NAF)) in the Greater Sydneyregion \1 km, \2 km and \3 km from the coastline and by elevation above sea level. Note that the totalnumber of addresses is cumulative. At +10 m above sea level there are approximately 190,000 addresses\1 km from the shore; 220,000 \2 km from the shore and 240,000 \3 km from the shore (after RiskFrontiers 2005)
104 Nat Hazards (2008) 45:99–122
123
Outside of the school system, increasing hazard awareness and knowledge may be
achieved through media activities such as television, radio and internet campaigns, and via
the distribution of information leaflets, brochures, posters and videos, and public infor-
mation meetings. Schutz and Wiedemann (2000) found that providing risk information to
the public had a positive influence on hazard knowledge and resulted in an increase of
public trust in risk mitigation and planning competence. They also suggest that risk
information should be provided to a community at least once every 3 years, to ensure risk
knowledge does not decrease. This is important because public ignorance and complacency
can increase in relation to long intervals between successive hazard events. This was
demonstrated in a study conducted by Johnston et al. (2005) on tsunami preparedness in
coastal Washington in the USA. Johnston et al. found that despite distributing tsunami
information through several media, erecting tsunami warning and evacuation signs, and
providing maps and public displays illustrating tsunami inundation zones, levels of pre-
paredness within the resident community were recorded at ‘‘low to moderate’’.
Given the importance of tsunami risk education, we now outline the development of a
‘questionnaire survey instrument’ in order to investigate to what degree members of the
public within the Greater Sydney metropolitan region are aware of tsunami hazard and risk.
Once the survey instrument is defined, we report the results of a trial of this instrument and
the responses generated from this pilot investigation. We then comment on the usefulness
and validity of using a questionnaire survey instrument and discuss the significance of our
participants’ responses.
4 Development of questionnaire survey instrument
There are many techniques available to social scientists to enable them to investigate
public perceptions of hazard and risk. We chose to trial a questionnaire survey instrument
in this study in order to gauge its usefulness in providing information about public per-
ceptions of risk that might be relevant to policy and decision makers and emergency
management agencies. The use of such questionnaire instruments to investigate public
perception of a range of hazard types is becoming increasingly common (Dibben and
Chester 1999; Rohrmann 1999; Anderson-Berry 2003; Dominey-Howes and Minos-
Minopoulos 2004; Johnston et al. 2005; Parfitt 2005; Spittal et al. 2005; Kurita et al.
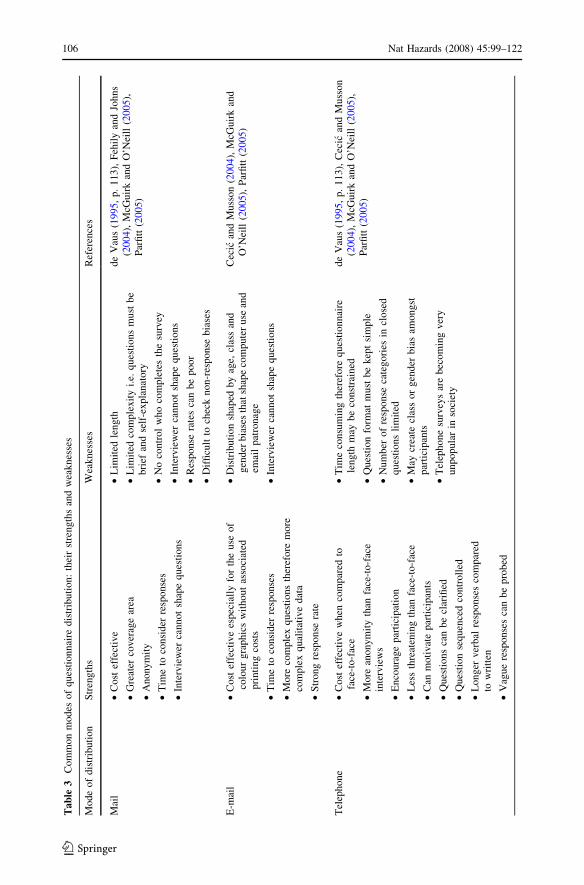
2006). Face-to-face interviews were determined to be the most effective mode of
distributing the questionnaire as questions were able to be clarified, vague responses could
be queried, and a higher response rate with more detailed responses through verbal
communication as compared to written communication could be obtained (Table 3). We
believe that the strengths of this approach far outweigh the weaknesses particularly when
testing the use of a questionnaire survey with a small sample size (McGuirk and O’Neill
2005; Parfitt 2005).
In order to determine whether a questionnaire instrument is appropriate to the task for
which it has been designed, trialling of the instrument should be undertaken with at least 20
participants (Parfitt 2005). We trialled our questionnaire instrument with 30 participants,
all aged 18 years and above, during October and November 2005. Thus, we have exceeded
the minimum number of ‘dry runs’ which should enable us to determine how useful our
questionnaire instrument is. Aspects of a questionnaire that should be considered during
the trialling process are outlined in Table 4.
Here we describe the structure of the questionnaire and the selection of the specific
questions used, and we explain how the survey was conducted.
Nat Hazards (2008) 45:99–122 105
123
Ta
ble
3C
om
mo
nm
od
eso
fq
ues
tio
nn
aire
dis
trib
uti
on
:th
eir
stre
ngth
san
dw
eak
nes
ses
Mo
de
of
dis
trib
uti
on
Str
eng
ths
Wea
kn
esse
sR
efer
ence
s
Mai
l•
Cost
effe
ctiv
e
•G
reat
erco
ver
age
area
•A
no
nym
ity
•T
ime
toco
nsi
der
resp
on
ses
•In
terv
iew
erca
nn
ot
shap
eq
ues
tion
s
•L
imit
edle
ng
th
•L
imit
edco
mp
lexit
yi.
e.q
ues
tio
ns
mu
stb
eb
rief
and
self
-ex
pla
nat
ory
•N
oco
ntr
ol
wh
oco
mp
lete
sth
esu
rvey
•In
terv
iew
erca
nn
ot
shap
eq
ues
tio
ns
•R
espo
nse
rate
sca
nb
ep
oo
r
•D
iffi
cult
toch
eck
no
n-r
espo
nse
bia
ses
de
Vau
s(1
99
5,
p.
11
3),
Feh
ily
and
Joh
ns
(20
04),
McG
uir
kan
dO
’Nei
ll(2
00
5),
Par
fitt
(20
05)
E-m
ail
•C
ost
effe
ctiv
ees
pec
iall
yfo
rth
euse
of
colo
ur
gra
ph
ics
wit
ho
ut
asso
ciat
edp
rin
tin
gco
sts
•T
ime
toco
nsi
der
resp
on
ses
•M
ore
com
ple
xq
ues
tion
sth
eref
ore
mo
reco
mp
lex
qu
alit
ativ
ed
ata
•S
tro
ng
resp
on
sera
te
•D
istr
ibu
tio
nsh
aped
by
age,
clas
san
dg
end
erb
iase
sth
atsh
ape
com
pu
ter
use
and
emai
lp
atro
nag
e
•In
terv
iew
erca
nn
ot
shap
eq
ues
tio
ns
Cec
ican
dM
uss
on
(20
04),
McG
uir
kan
dO
’Nei
ll(2
00
5),
Par
fitt
(20
05)
Tel
eph
on
e•
Cost
effe
ctiv
ew
hen
com
par
edto
face
-to
-fac
e
•M
ore
anonym
ity
than
face
-to-f
ace
inte
rvie
ws
•E
nco
ura
ge
par
tici
pat
ion
•L
ess
thre
aten
ing
than
face
-to-f
ace
•C
anm
oti
vat
ep
arti
cip
ants
•Q
ues
tions
can
be
clar
ified
•Q
ues
tion
sequen
ced
contr
oll
ed
•L
on
ger
ver
bal
resp
on
ses
com
par
edto
wri
tten
•V
agu
ere
spo
nse
sca
nb
ep
rob
ed
•T
ime
con
sum
ing
ther
efo
req
ues
tio
nn
aire
len
gth
may
be
con
stra
ined
•Q
ues
tio
nfo
rmat
mu
stb
ek
ept
sim
ple
•N
um
ber
of
resp
onse
cate
gori
esin
close
dq
ues
tio
ns
lim
ited
•M
aycr
eate
clas
so
rg
end
erb
ias
amon
gst
par
tici
pan
ts
•T
elep
ho
ne
surv
eys
are
bec
om
ing
ver
yu
np
op
ula
rin
soci
ety
de
Vau
s(1
99
5,
p.
11
3),
Cec
ican
dM
uss
on
(20
04),
McG
uir
kan
dO
’Nei
ll(2
00
5),
Par
fitt
(20
05)
106 Nat Hazards (2008) 45:99–122
123

Ta
ble
3co
nti
nu
ed
Mo
de
of
dis
trib
uti
on
Str
eng
ths
Wea
kn
esse
sR
efer
ence
s
Fac
e-to
-fac
e•
Co
mple
xq
ues
tion
sca
nb
eas
ked
•C
anm
oti
vat
ep
arti
cip
ants
•L
on
ger
ver
bal
resp
on
ses
com
par
edto
wri
tten
•Q
ues
tions
can
be
clar
ified
•Q
ues
tion
sequen
ced
contr
oll
ed
•V
agu
ere
spo
nse
sca
nb
ep
rob
ed
•V
isual
pro
mp
tsca
nb
eu
sed
•L
ong
ques
tionnai
res
sust
ained
•H
igh
resp
on
sera
tes
•C
ost
ly
•T
ime
con
sum
ing
•S
pat
iall
yre
stri
cted
•A
nsw
ers
may
be
filt
ered
or
cen
sore
d
•In
terv
iew
er’s
pre
sen
cem
ayaf
fect
resp
on
ses
de
Vau
s(1
99
5,
p.
11
3),
Feh
ily
and
Joh
ns
(20
04),
McG
uir
kan
dO
’Nei
ll(2
00
5),
Par
fitt
(20
05)
Nat Hazards (2008) 45:99–122 107
123

4.1 Selection of questions and structure of the questionnaire
In line with other surveys concerned with the public understanding of hazard and risk, we
collected classification data about our participants. Such data included age, level of edu-
cation and how far participants live from the coast. We then developed a series of questions
designed to gauge the participants specific awareness and understanding of what tsunami
are, their causes, the regions from which tsunami might originate, their likely impacts and
effects, whether or not participants are aware of any warning systems, and finally, how
important participants believe tsunami are in comparison to other natural hazards that
affect the Sydney region. Some of the questions allowed for an open-ended response in
order to gain qualitative data on the participant’s knowledge and perceptions. Other
questions sought quantitative data for easy analysis and interpretation. To avoid restricting
or guiding responses to closed questions with an ordinal selection, the option ‘other, pleasespecify’ was offered where applicable. A copy of the entire questionnaire is provided in the
Appendix. However, only selected questions will be analysed in this article.
4.2 Undertaking the trial questionnaire survey
We conducted face-to-face interviews with permanent residents only. We restricted our
study to permanent residents since local authorities and emergency management organi-
sations will owe a duty of care to their primary stakeholders in the first instance, and we
wished to make the investigation as straight forward as possible. Within this group of
permanent residents we included Local Government professional officers. These
Table 4 Aspects of a questionnaire that should be considered during the trial process
Aspect Description Reference
Question designand format
• Were the questions understoodby the participants?
Campbell and Machin (2000), Kitchin and Tate(2000), Collin (2003), Punch (2003), Fehilyand Johns (2004), McGuirk and O’Neill(2005), Parfitt (2005)
• Do any questions need rewording?
• Should any questions be omittedfrom the survey?
• Were the questions sequenced inan appropriate manner?
• Did any questions require the useof prompts?
Questionnairelength
• How long did the interviews take? Kitchin and Tate (2000), Collin (2003),Punch (2003), Fehily and Johns (2004),McGuirk and O’Neill (2005), Parfitt (2005)
• Was the length appropriate for theparticipants?
Questionnaireoutput
• Was the data recorded in anappropriate format for analysis?
Campbell and Machin (2000), Kitchinand Tate (2000), Collin (2003), Fehilyand Johns (2004), McGuirk and O’Neill(2005), Parfitt (2005)
• Was the coding scheme appropriatefor multiple responses?
Classificationquestions
• Were any problems encounteredwith the classification questions?
Altman (1991), Kitchin and Tate (2000),Parfitt (2005)
• Is the classification data necessaryfor the analysis?
Aims of thesurvey
• Did the questionnaire fulfil theaims of the investigation?
Kitchin and Tate (2000), Collin (2003),McGuirk and O’Neill (2005)
108 Nat Hazards (2008) 45:99–122
123
participants hold positions in environmental, engineering and risk insurance related fields.
We sought the awareness and perceptions of this ‘captive group’ because we expected that
they would have a high level of tsunami awareness because of their professional duties and
responsibilities.
Our participants were recruited through a purposive ‘snow-ball’ sampling technique
where potential participants were suggested by personal acquaintances that had an interest
in the region and hazard, i.e. only local residents and professional officers living in Sydney.
We contacted these potential participants by telephone in order to (1) confirm their will-
ingness to participate and (2) that they were indeed a permanent resident of Sydney. Once
these parameters were confirmed, we agreed a date, time and place in which to undertake
the questionnaire interview. The Local Government professional officers were recruited to
the study via direct approach from the Executive Secretariat of the Sydney Coastal
Councils Group (SCCG) who facilitated introductions for us. All participants were required
to sign Human Ethics approvals and were provided with information about the nature and
purpose of the study.
5 Results
We divide our results in to two sections. First we describe our experience of conducting
the questionnaire survey paying attention to problems and challenges that arose during the
interview process. Second we present a short summary of our actual findings of the
public’s understanding of hazard and risk.
5.1 Use of the questionnaire instrument
In general, the questionnaire took 20–30 min to complete which was in line with partic-
ipants’ expectations and acceptable to them. During the interviews, we encountered no
problems with regard to the design, format and layout of the questionnaire. However, some
questions did require some clarification from us. For example, we had to provide better
definitions of some terminology for tsunamigenic mechanisms and had to explain what was
meant by the importance of tsunami in comparison to other hazards in Sydney. Addi-
tionally, we found that we were leading the participants by providing them with the
answers to the different tsunamigenic mechanisms.
The questionnaire was relatively straightforward and did not require significant coding
of answers during the analysis phase. The only difficulty that arose with respect to the
classification data was the need to provide a map for participants to determine how far they
lived from the coast.
Due to the purposive sampling technique all participants had an interest in the topic and
therefore, there was no non-response error. However, one participant did not answer a
question due to a lack of knowledge. This question was handled as a ‘‘don’t know’’
response and therefore is included in our analysis.
5.2 Results of the trial questionnaire survey
Table 5 provides a quick look summary of our participants’ key characteristics derived
from questions 1, 3 and 8 whilst Table 6 provides a summary of their responses to
Nat Hazards (2008) 45:99–122 109
123

questions 10, 12, 13, 17, 20, 23, 24 and 26–33. Additionally, participant responses to
questions 11, 16, 19 and 25 will be presented.
It can be seen that the age distribution of our participants is fairly even and 37% live
B2 km from the coast. Furthermore, 67% have a bachelor and/or higher degree qualifi-
cation. Our participants are ‘well educated’—10 of the council officers and 10 of the
general public hold university level qualifications. Since we only trialled the questionnaire
with a ‘modest’ sample group and our participants are rather homogenous (i.e. well edu-
cated), we have combined the results of both subsets into a single dataset for ease of
analysis rather than treat them separately.
About 83% of participants said that they had heard of tsunami prior to the 2004 IOT
although, their knowledge about tsunamigenic mechanisms was quite variable (Table 6).
More than 80% of participants believe that Sydney is at risk from future tsunami inun-
dation. Participants provided a wide variety of definitions for a tsunami, most stating that it
is ‘‘a huge wave’’ or ‘‘tidal wave’’ (Question 11). Other definitions included for example:
‘‘a natural disaster consisting of a series of waves’’, ‘‘mass of water displaced due to largeshock’’, ‘‘storm surge after a cyclone’’, ‘‘unnaturally large wave originating from tectonicactivity’’, and ‘‘movement of plates under the ocean creating a wave surge which escalatestowards the coast’’.
When the participants were prompted to look at the tsunamigenic regions shown in
Fig. 2 and listed in Question 16, 87% indicated that they believe New Zealand–Tonga is
the region most likely to generate a tsunami damaging to Sydney. None identified South
America. About 20% of the group thought they knew when the last significant tsunami to
affect Sydney occurred (which was actually in the 1960’s). A total of 17% (of the 20%)
cited the 1960’s and the remaining participants listed ‘‘before European settlement’’. Those
who correctly mentioned the 1960’s as the date of the last Sydney tsunami were over the
age of 51 years.
About 47% of participants believe that ‘‘death and injury of people’’ are likely to be the
greatest effects of a tsunami in Sydney (Question 19). Justifications included: ‘‘everythingelse can be built or replaced; can’t put a price on life’’, ‘‘a lot of people live in the lowlying zone; doubt if government will evacuate fast enough as people are not prepared’’,
‘‘loss of life is a stronger measure of danger than bricks and mortar’’ and ‘‘based on IndianOcean tsunami there was a mass loss of life which was very disturbing’’. Furthermore,
impacts on ‘‘critical infrastructure’’ and impacts on ‘‘lifelines’’ were each cited as likely to
have the greatest affect on Sydney following a tsunami. Those who stated ‘‘critical
Table 5 Quick-look summary of selected key characteristics of our participants
What is your age group?
18–30 years old 31–50 years old 51+ years old
33% 40% 27%
What is the highest level of education you have completed?
Year 10 Year 12 TAFE or TradeCert./Diploma
AdvancedDiploma
University Bachelorsdegree
Postgraduatequalification
3% 10% 7% 13% 17% 50%
How far from the coast do you live?
0 \ 2 km 2 \ 5 km 5 \ 10 km 10+ km
37% 7% 27% 30%
110 Nat Hazards (2008) 45:99–122
123

Tab
le6
Qu
ick
-lo
ok
sum
mar
yo
fso
me
spec
ific
surv
eyq
ues
tion
s
Qu
esti
on
Res
po
nse
Q.
10
Had
you
hea
rdo
fts
unam
ipri
or
toth
eIn
dia
nO
cean
tsunam
ion
Dec
ember
26
2004?
Yes
83%
No
17%
Q.
12
Wh
ich
of
the
foll
ow
ing
do
yo
uth
ink
can
gen
erat
ea
tsun
ami?
(Yo
um
aych
oo
seas
man
yas
yo
uli
ke)
Yes
No
•ea
rth
quak
e1
00
%0
%
•su
baq
ueo
us
vo
lcan
icer
up
tio
ns
87
%1
3%
•su
baq
ueo
us
sed
imen
tsl
ides
67
%3
3%
•m
eteo
rite
/ast
ero
idst
rik
es6
0%
40
%
•su
bae
rial
vo
lcan
icer
up
tio
ns
50
%5
0%
•su
bae
rial
sed
imen
tsl
ides
40
%6
0%
Q.
13
Do
you
thin
kth
eS
ydney
regio
nco
uld
be
affe
cted
by
ats
unam
i?Y
es83%
No
13%
Don’t
know
4%
Q.
17
Do
yo
uk
no
ww
hen
the
last
tsu
nam
iaf
fect
edth
eS
ydn
eyre
gio
n?
Yes
=2
0%
Ify
es,
wh
en?
Corr
ect
=1
7%
Q.
20
Do
you
know
whet
her
ats
unam
iw
arnin
gsy
stem
exis
tsfo
rth
eS
ydney
regio
n?
Yes
20%
No
33%
Don’t
know
47%
Q.
23
Ifyou
answ
ered
no
or
don’t
know
do
you
thin
kS
ydney
nee
ds
ats
unam
iw
arnin
gsy
stem
?Y
es75%
No
17%
Don’t
know
8%
Q.
24
Ifa
tsu
nam
iw
asto
stri
ke
the
Sy
dn
eyre
gio
nw
hat
do
yo
uth
ink
the
max
imu
mfl
oo
dh
eigh
tco
uld
be?
10
+m
=4
3%
Q.
26–33
Ho
ww
ould
you
rate
the
import
ance
of
tsunam
iri
skas
ahaz
ard
inS
ydney
com
par
edto
:Im
port
ant
•b
ush
fire
13
%
•d
rou
gh
t1
7%
•h
ail
sto
rm3
3%
•se
ver
ew
inds
43
%
•li
gh
tnin
gst
rik
e4
7%
•ri
ver
flo
od
43
%
•co
asta
lst
orm
flo
od
47
%
•ea
rth
quak
e6
0%
Nat Hazards (2008) 45:99–122 111
123

infrastructure’’ justified their views with qualifications such as: ‘‘hard to coordinateactivities’’, and ‘‘most difficult to replace and time consuming; vital for ensuring recov-ery’’. Whilst participants who stated ‘‘lifelines’’ said ‘‘long term carry on effects’’, ‘‘can’tsurvive without water and most of Sydney’s water is coastal’’ and ‘‘cause a lot of death andillness in people if sewer or water is out’’.
About 20% of the group indicated that they do know a tsunami warning system exists,
whereas 33% stated that there is no warning system and 47% do not know if a tsunami
warning system exists. Of the participants who stated that there is no tsunami warning
system or that they do not know, 75% believe Sydney does need a warning system whilst
17% do not. The remaining 8% were uncertain.
About 43% of participants think that the next tsunami to affect Sydney could have a
maximum run-up or flood height of more than 10 m asl and 97% believe the next tsunami
could affect Bondi (Question 25). Only 13% of participants believe that bushfire hazard is
just as important in the Sydney region as tsunami. Interestingly 60, 47 and 47% of par-
ticipants believe tsunami to be just as important as earthquake, coastal storm flood and
lightning strike respectively (Table 6).
6 Discussion and recommendations
Whilst our study represents the first analysis of perception of tsunami risk in Australia—
something that will likely be of interest to emergency management agencies, we do rec-
ognise that certain aspects of the questionnaire pose limitations. However, we feel that the
data generated are significant for two reasons: (1) the purpose of this study was to test the
use of a ‘questionnaire survey instrument’ as a means to investigate public perception of
tsunami hazard and (2) the ‘pattern’ of our findings are similar to other studies of hazard
perceptions (Dominey-Howes and Minos-Minopoulos 2004; Johnston et al. 2005) partic-
ularly, tsunami awareness (Kurita et al. 2006).
6.1 Discussion of the usefulness of the questionnaire survey instrument
Although we did not encounter any specific issues with the design, format and layout of the
questionnaire, it is clear that these aspects need to be carefully considered. A well-
structured questionnaire that flows from one topic to the next keeps the participant inter-
ested and avoids confusion. However, despite having a well-structured questionnaire, some
of our questions needed clarification whilst others appeared to lead our participants. For
example, confusion arose over the terminology used to describe tsunamigenic mechanisms.
This was overcome through clarification by the interviewer. Furthermore, we actually
listed all possible tsunamigenic mechanisms for the participants and simply asked if they
thought these processes might generate tsunami. We suspect that if we had merely asked,
‘‘what mechanisms generate tsunami?’’ participants would have scored much lower. As
such, we believe that the way in which we asked this question has given us a skewed
response rate. Future studies should try to avoid guiding participant responses.
We did not ask participants ‘why’ they think what they do. For example, we did not ask
them why they think Sydney is at risk from future tsunami inundation. We are therefore,
uncertain if it is because of the 2004 IOT media coverage or some other explanation.
Future research should incorporate the opportunity for participants to provide information
that justifies their views and knowledge, if they are willing to spend the extra time.
112 Nat Hazards (2008) 45:99–122
123

However, the researcher needs to carefully consider the length of the questionnaire and the
expected time commitment required from each participant. We found that 20 min was an
appropriate time commitment for most participants whilst others were willing to commit
more than 30 min.
We provided a map of the Sydney region to assist participants to think about which
areas they believe might be inundated during a tsunami. Whilst conducting the interviews
however, it became apparent that this map was also useful to our participants to enable
them to determine how far they live from the coast. The use of visual prompts is another
advantageous aspect of face-to-face interviews making our approach preferable to others
such as telephone interviews (Parfitt 2005).
Our sample size, although adequate for trialling a questionnaire, is insufficient for
drawing any solid conclusions based on participants’ responses and future work should
seek to encompass a much larger sample group. For example, if future research targeted the
population living within 1 km of the ocean or a coastal river and at an elevation of
\3 m asl (i.e. approximately 330,000 people) then based on Gomm (2004, p. 88) and
Raosoft, Inc (2004) a minimum sample size of 381–384 would be necessary. This is the
minimum sample size required to give a 5% margin of error with a confidence level of 95%
for a dichotomous variable. If more variables are added and/or responses need to be
analysed in classification classes then a larger sample size would be necessary (Gomm
2004, p. 89).
To add further depth to perception studies diverse populations can be targeted. For
example, school aged children could be interviewed to better understand the potential role
and effectiveness of curricula in delivering hazard education and mitigation strategies.
Furthermore, in iconic coastal areas of Australia like Bondi, large numbers of local and
international visitors utilise the environmental and social services provided by these
locations. Consequently, analysis of their perceptions should be undertaken so as to more
effectively integrate their needs in to future tsunami disaster planning. We suggest that
interviews should be conducted with other important ‘captive’ groups such as the State
Emergency Services, police, fire and ambulance services in order to investigate their level
of tsunami awareness since they will be on the front line of dealing with an emergency.
In order to be able to gauge whether perception of tsunami risk changes with time as a
consequence of government risk mitigation activities, it will be necessary to conduct
follow-up surveys at regular intervals and specifically after public education initiatives in
order to highlight those areas that require further attention.
The necessity to undertake such detailed surveys has become painfully clear following
the Solomon Islands tsunami of 2nd April 2007. This tsunami triggered the first Tsunami
Warning Alert for the eastern seaboard of Australia. The mechanics of the detection and
monitoring of the tsunami were highly effective. Whilst the Bureau of Meteorology issued
the Tsunami Bulletin very soon after the tsunami being triggered and the NSW State
Emergency Services’ State Tsunami Disaster Management Plan swung in to action, a lack
of public understanding and confusion about the warning alerts, combined with media
commentary resulted in significant confusion and public misunderstanding throughout
coastal New South Wales and Queensland (Sydney Morning Herald 2007).
6.2 Discussion of findings from our participants in the trial survey
The majority (63%) of our participants live more than 2 km from the coast. In Sect. 2 of
this article, we set the scene by describing exposure of people and addresses located less
Nat Hazards (2008) 45:99–122 113
123

than 1 km from the ocean. However, given that 63% of our participants live more than
2 km from the coast, they may have less knowledge about tsunami because it represents
less of a threat to their daily lives. Evidence to support this ‘assumption’ is presented
below. Of particular note is the very high proportion of participants (67%) with bachelor
degrees. This is significantly above the average of 10.1% for the New South Wales pop-
ulation (ABS 2001).
The percentage of participants (83%) that stated they had heard of tsunami prior to the
2004 IOT is rather high although a significant percentage of them hold university quali-
fications reflecting a group of highly educated people who may have studied or read about
natural hazard processes. Anderson-Berry (2003) noted that a ‘well educated’ sample
group might be more skilled at searching for and acquiring information. However, many
participants incorrectly defined a tsunami by using the generic media term ‘‘tidal wave’’.
This variable understanding of the basic science is further illustrated by the mixed
knowledge of tsunamigenic mechanisms. The high recognition of earthquakes as a tsun-
amigenic mechanism (Table 6) is not thought to be significant as the tsunami was widely
quoted as being the result of the world’s second most powerful earthquake. However,
participants are generally unaware that other mechanisms such as subaerial volcanic
eruptions and subaerial sediment slides are also tsunamigenic (Table 6). It is interesting to
note that whilst 87 and 67% of permanent residents recognise that subaqueous volcanic
eruptions and subaqueous sediment slides respectively, are tsunamigenic mechanisms, the
former is unlikely to generate tsunami threatening to the Sydney region. There does exist a
potential however, for subaqueous sediment slides off the continental shelf of New South
Wales to occur and this risk has not been fully quantified (Cummins, pers. comm. 2006).
Therefore, the fact that participants recognise this potential tsunami risk is noteworthy and
may indicate a capacity to act appropriately during a possibly disastrous event. However,
Anderson-Berry (2003) and King et al. (2006) argue that even though residents may
demonstrate general hazard knowledge this does not necessarily prove an adequate
understanding of the hazard that will ultimately transfer into hazard preparedness.
More than 80% of our participants believe Sydney is at risk from future tsunami
inundation. When provided with a map that included tsunamigenic zones of the Pacific,
87% of permanent residents incorrectly identified New Zealand–Tonga as the most likely
region to generate a tsunami damaging to Sydney rather than South America. This may
reflect a belief that ‘proximity to source’ controls tsunami magnitude and intensity rather
than offshore bathymetry, coastal configuration, onshore topography and surface rough-
ness. This is an important issue (for the emergency services) to overcome since the public
may be less likely to respond to an evacuation notice given for a tsunami generated off the
South American coast than they might a tsunami generated in the New Zealand–Tonga
region.
The last significant tsunami (wave height C1 m) in the Sydney region occurred in the
1960’s. About 20% of participants stated that they knew this. However, only 17% of the
20% were correct. Interestingly, those participants who were accurate are all 51 years of
age and older—old enough to remember that event. Age and its relationship to experience
and perception have been noted in other studies of risk perception (see for example,
Dominey-Howes and Minos-Minopoulos 2004; Gregg et al. 2004).
About 47% of participants stated that they believe that the most significant effects of a
future tsunami in Sydney will be ‘‘death and injury of people’’. They qualified their views
with the importance of human life and by making reference to the high exposure and
vulnerability of the population located within likely inundation zones. One participant
noted their concern that the ‘government’ will not be able to respond effectively in a future
114 Nat Hazards (2008) 45:99–122
123

tsunami disaster. Whilst we expected that references to death and injury would be com-
mon, we were more surprised to hear participants refer to damage to critical infrastructure
and lifelines. They explained their concern about damage to critical infrastructure due to its
value in the recovery process following a natural disaster whilst their fear of damage to
lifelines was attributable to the long-term effects on society. Such observations were also
noted by King and Gurtner (2005).
The concern of our participants with death and injury may relate to the fact that so many
are uncertain about the existence of a warning system. We are somewhat surprised to learn
that 17% of participants do not believe that Sydney needs a tsunami warning system but
97% believe Bondi (an iconic Sydney ocean-side municipal area) could be affected by the
next event and 43% think that tsunami will have a maximum flood height (run-up) of more
than 10 m asl.
When participants were asked to consider how important they think tsunami are as a
hazard to Sydney compared with other hazard types, they provided a mixed response. This
is probably not a surprise given that the Sydney region is affected by more common
hazards such as bushfire, drought and hail.
7 Conclusion
The coasts of Australia are at risk from tsunami inundation. Significant efforts are under
way to develop and deploy an operational Australian Tsunami Warning System. Whilst
such a warning system is a vital component of keeping Australia safe from tsunami, it does
not automatically guarantee lives will be saved. Just as important as the warning system is
an educated public that understands and is aware of the hazard and risk and trusts official
warning notices and follows evacuation orders. This was clearly illustrated by the sig-
nificant confusion and misunderstanding following the issue of tsunami warning alert
messages on 2nd April 2007 along the east coast of Australia.
This article has reported on the development and trial of a questionnaire survey
instrument to investigate public perceptions of tsunami in the Sydney region, Australia.
Our experience suggests that such a survey instrument is a potentially valuable tool for
gathering information about what the public understands and that the data generated by a
suitable large survey would be useful for emergency managers in designing public edu-
cation campaigns. However, we note that there are certain aspects of questionnaire design,
layout and question selection that need to be carefully considered to ensure maximum
value of this approach. We recommend that a more in-depth survey, with a much larger and
broader sample size, should be conducted in order to provide more reliable data for
emergency managers. Not withstanding the obvious limitations of this study, our results
may have important implications for those authorities tasked with the responsibility of
developing tsunami hazard education programmes and tsunami risk mitigation strategies in
Australia.
Acknowledgements Many thanks to Geoff Withycombe, Executive Officer of the Sydney CoastalCouncils Group Inc for introductions to Council Officers. All participants are thanked for their willingnessto be involved in this study. Keping Chen from Risk Frontiers is thanked for providing the data used toconstruct Fig. 2. Kevin McCracken from the Department of Human Geography, Macquarie University isthanked for guidance on using the ABS data. We would like to thank two anonymous reviewers and thejournal Editor for very helpful comments on an earlier draft of this article.
Nat Hazards (2008) 45:99–122 115
123
Appendix
Survey Questionnaire:
‘Public perception of tsunami risk in the Sydney region’
1. Age:
<18
19-30
31-50
50+
2. Where do you live? _________________________________________
3. How far from the coast do you live?
0-2 km
2-5 km
5-10 km
10+ km
4. How long have you lived at this address? ________________________
5. How long have you lived in Sydney? ____________________________
6. In which country have you lived the longest? __________________
7. What language do you usually speak at home? ___________________
8. What is the highest level of education you have completed?
Some schooling
High school – Year 10
High school – Year 12
TAFE or Trade Certificate/Diploma
Advanced Diploma
University Degree
Postgraduate Qualification
Other, please specify:________________________________
9. What is your occupation? ____________________________________
10. Had you heard of tsunami prior to the Indian Ocean tsunami on December 26 2004?
116 Nat Hazards (2008) 45:99–122
123

11. How would you define a tsunami?
12. Which of the following do you think can generate a tsunami? (You may choose as many as you like)
EarthquakeVolcanic eruption (above the sea)Volcanic eruption (below the sea)Landslide (above the sea)Landslide (below the sea)Meteorite or asteroid strike into the seaOther, please specify________________________________
13. Do you think the Sydney region could be affected by a tsunami?Yes No Don’t know
14. From what local and distant geographic areas could a tsunami come from that affects the Sydney region?
15. Do you think the Sydney region could be affected by a tsunami generated from the following areas? (You may choose as many as you like)
South AmericaCentral AmericaAlaskaHawaiiKuril-KamchatkaJapanPhilippinesIndonesiaNew Guinea-Solomon IslandsNew Zealand-Tonga
16. From the regions selected in question 15 rank them in order from the most likely (1) to the least likely to affect the Sydney region?
South AmericaCentral AmericaAlaskaHawaiiKuril-Kamchatka
Nat Hazards (2008) 45:99–122 117
123
Japan
Philippines
Indonesia
New Guinea-Solomon Islands
New Zealand-Tonga
17. Do you know when the last tsunami affected the Sydney region?
Yes No Don’t know
If yes, when? _____________________________________________
18. Do you think a tsunami affecting the Sydney region could have any of the following effects? (You may choose as many as you like)Human Impacts:
Death and injury of people
Damage and destruction to homes and businesses
Damage and destruction to critical infrastructure e.g. ports, harbours, cities
Damage and destruction to critical lifelines e.g. water, gas, electricity
Damage and destruction to communication networks and infrastructure
Damage and destruction to transport networks and infrastructure
Impacts on agriculture
Impacts on coastal tourism
Other, please specify:________________________________
Biophysical Impacts:
Impacts on beaches
Impacts on sand dunes
Impacts on estuaries and lagoons
Impacts on submarine plants and animals
Impacts on coastal plants and animals
Other, please specify:________________________________
19. Which of the above do you think will have the greatest impact on the Sydney region and why?
118 Nat Hazards (2008) 45:99–122
123

20. Do you know whether a tsunami warning system exists for the Sydney region?
Yes No Don’t know
21. If you answered yes, did you know prior to the Indian Ocean tsunami of December 2004?
Yes No
22. If you answered yes to question 20 are you aware of the emergency procedures you need to follow?
Yes No
23. If you answered no or don’t know to question 20 do you think Sydney needs a tsunami warning system?
Yes No
24. If a tsunami was to strike the Sydney region what do you think the maximum flood height could be?
0 – 1 m
1 – 2 m
2 – 5 m
5 – 10 m
10+ m
Don’t know
A tsunami would not strike Sydney
25. If a tsunami was to strike the Sydney region which suburbs (out of the list below) do you think will be affected?
Manly
Bondi
Sydney City
Drumoyne
Hunters Hill
Parramatta
Pennant Hills
Windsor
Warragamba
Blue Mountains
Don’t know
A tsunami would not strike Sydney
26. How would you rate the importance of tsunami risk as a hazard in Sydney compared to bushfires?
Not important
Nat Hazards (2008) 45:99–122 119
123

Important
27. How would you rate the importance of tsunami risk as a hazard in Sydney compared to drought?
Not important
Important
28. How would you rate the importance of tsunami risk as a hazard in Sydney compared to hail storms?
Not important
Important
29. How would you rate the importance of tsunami risk as a hazard in Sydney compared to severe winds?
Not important
Important
30. How would you rate the importance of tsunami risk as a hazard in Sydney compared to lightning strikes?
Not important
Important
31. How would you rate the importance of tsunami risk as a hazard in Sydney compared to river floods?
Not important
Important
32. How would you rate the importance of tsunami risk as a hazard in Sydney compared to coastal storm floods?
Not important
Important
33. How would you rate the importance of tsunami risk as a hazard in Sydney compared to earthquakes?
Not important
Important
References
Altman DG (1991) Practical statistics for medical research. Chapman and Hall, LondonAnderson-Berry LJ (2003) Community vulnerability to tropical cyclones: Cairns 1996–2000. Nat Hazards
30:209–232Australian Bureau of Statistics (ABS) (2001) http://www.abs.gov.au/websitedbs/d3310114.nsf/home/Census
%20data, accessed 4th April 2007Bryant EA (2001) Tsunami—The underrated hazard. Cambridge University Press, United Kingdom
120 Nat Hazards (2008) 45:99–122
123

Bryant EA, Young RW, Price DM (1992a) Evidence of tsunami sedimentation on the Southeastern coast ofAustralia. J Geol 100:753–765
Bryant EA, Young RW, Price DM, Short SA (1992b) Evidence for Pleistocene and Holocene raised marinedeposits, Sandon Point, New South Wales. Austr J Earth Sci 39:481–493
Bryant EA, Young RW (1996) Bedrock-sculpturing by tsunami, South coast New South Wales, Australia.J Geol 104:565–582
Bryant EA, Nott J (2001) Geological indicators of large tsunami in Australia. Nat Hazards 24:231–249Campbell MJ, Machin D (2000) Medical statistics. John Wiley and Sons, Ltd, New YorkCecic I, Musson R (2004) Macroseismic surveys in theory and practice. Nat Hazards 31:39–61Chen K, McAneney J (2006) High-resolution estimates of Australia’s coastal population. Geophys Res Lett
33, doi:10.1029/2006GL026981Collin D (2003) Pretesting survey instruments: an overview of cognitive methods. Qual Life Res 12:
229–238de Vaus DA (1995) Surveys in social research. Allen & Unwin, AustraliaDibben C, Chester DK (1999) Human vulnerability in volcanic environments: the case of Furnas, Sao
Miguel, Azores. J Volcanol Geotherm Res 92:133–150Dominey-Howes D (2007) Geological and historical records of Australian tsunami. Mar Geol 239:99–123Dominey-Howes D, Minos-Minopoulos D (2004) Perceptions of hazard and risk on Santorini. J Volcanol
Geotherm Res 137:285–310Dominey-Howes D, Keating B (2005) Tsunami risk in the Asia-Pacific region. In: Britton N (ed) Catas-
trophe insurance—challenges for insurers in the Asia-Pacific region. Proceedings of a conferencesponsored by Aon Re Australia Ltd., Southwood Press Ltd
Dominey-Howes D, Papathoma M (2007) Validating a tsunami vulnerability assessment model (the PTVAModel) using field data from the 2004 Indian Ocean tsunami. Nat Hazards 40:113–136
Dominey-Howes D, Humphreys G, Hesse P (2006) Tsunami and palaeotsunami depositional signatures andtheir potential value in understanding the late-Holocene tsunami record. Holocene 16:1095–1107
Dudley W, Lee M (1998) Tsunami! 2nd edn. Hawai’i University PressFehily AN, Johns AP (2004) Designing questionnaires for nutrition research. Nutr Bull 29:50–56Geoscience Australia (2005) http://www.ga.gov.au/urban/geohazardupdates/tsunami/#tews, accessed 14th
April 2006Gomm R (2004) Social research methodology—a critical introduction. Palgrave MacMillan, ChinaGough J, Hooper G (2003) Communicating about risk issues. http://www.europe.canterbury.ac.nz/conferences/
tech2004/tpp/Gough%20and%20Hooper_paper.pdf, accessed 6th October 2005Greenslade D, Simanjuntak M, Burbidge D, Chittleborough J (2007) A first-generation real-time tsunami
forecasting system for the Australian region. BMRC Research Report 126, Bureau of Meteorology, p 75Gregg C, Houghton B, Paton D, Swanson D, Johnston D (2004) Community preparedness for lava flows
from Mauna Loa and Hualalai volcanoes, Kona, Hawai’i. Bull Volcanol 66:531–540Gusiakov V (2005) Tsunami generation potential of different tsunamigenic regions in the Pacific. Mar Geol
215:3–9Hurnen F, McClure J (1997) The effect of increased earthquake knowledge on perceived preventability of
earthquake damage. Australas J Disaster Trauma Stud 3:ISSN: 1174–4707Hutchinson I, McMillan A (1997) Archaeological evidence for village abandonment associated with Late
Holocene earthquakes at the northern Cascadia Subduction Zone. Quat Res 48:79–87Johnston D, Benton K (1998) Volcanic hazard perception in Inglewood, New Zealand. Australas J Disaster
Trauma Stud 2:ISSN: 1174–4707Johnston D, Paton D, Crawford GL, Ronan K, Houghton B, Burgelt P (2005) Measuring tsunami pre-
paredness in coastal Washington, United States. Nat Hazards 35:173–184Kelletat D, Scheffers A (2003) Chevron-shaped accumulations along the coastlines of Australia as potential
tsunami evidences? Sci Tsunami Hazards 2(1):174–187King D, Gurtner Y (2005) After the wave: a wake up warning for Australian coastal locations. Aust J Emerg
Manage 20:4–9King D, Goudie D, Dominey-Howes D (2006) Cyclone knowledge and household preparation—some
insights from Cyclone Larry. Aust J Emerg Manage 21:52–59Kitchin R, Tate NJ (2000) Conducting research in human geography: theory, methodology and practice.
Pearson Education Limited, Harlow, EnglandKurita T, Nakamura A, Kodama M, Colombage S (2006) Tsunami public awareness and the disaster
management system of Sri Lanka. Disaster Prevent Manage 15:92–110McGuirk PM, O’Neill P (2005) Using questionnaires in qualitative human geography. In: Hay I (ed)
Qualitative research methods in human geography. Oxford University Press, Australia
Nat Hazards (2008) 45:99–122 121
123
Molino Stewart (2005) Is Australia ready for its next 40 m high tsunami? Floodplain Manager. MolinoStewart 1:1–7
Nanayama F, Furukawa R, Satake K, Soeda Y, Shigeno K (2003) Holocene tsunami deposits from largetsunamis along the Kuril subduction zone, Northeast Japan. Eos Trans AGU, Digital Abst 84:OS22B-1155
Nott J (1997) Extremely high-energy wave deposits inside the Great Barrier Reef, Australia: determining thecause-tsunami or tropical cyclone. Mar Geol 141:193–207
Nott J (2003a) The importance of prehistoric data and variability of hazard regimes in natural hazard riskassessment—examples from Australia. Nat Hazards 30:43–58
Nott J (2003b) Waves, coastal boulder deposits and the importance of the pre-transport setting. Earth PlanetSci Lett 210:269–276
Nott J (2004) The tsunami hypothesis—comparisons of the field evidence against the effects, on the WesternAustralian coast, of some of the most powerful storms on Earth. Mar Geol 208:1–12
Opper S, Gissing A (2005) Anticipating Waves of Destruction—Preparing the New South Wales tsunamiemergency management state plan. State emergency services. Available at: http://www.ses.nsw.gov.au/infopages/2276.html
Papathoma M, Dominey-Howes D (2003) Tsunami vulnerability assessment and its implications for coastalhazard analysis and disaster management planning, Gulf of Corinth, Greece. Nat Hazards Earth Syst Sci3:733–744
Papathoma M, Dominey-Howes D, Zong Q, Smith D (2003) Assessing tsunami vulnerability, an examplefrom Heraklion, Crete. Nat Hazards Earth Syst Sci 3:377–389
Parfitt J (2005) Questionnaire design and sampling. In: Flowerdew R, Martin D (eds) Methods in humangeography. Pearson Education Limited, England
Pinegina K, Bourgeois J, Bazanova L, Melekestev I, Braitseva O (2003) A millennial-scale record ofHolocene tsunamis on the Kronotsky Bay coast, Kamchatka, Russia. Quat Res 59(1):36–47
Punch KF (2003) Survey research. The basics. Sage Publications, LondonRaosoft, Inc (2004) Sample size calculator. http://www.raosoft.com/samplesize.html, accessed 4th April
2007Risk Frontiers (1995) The Australian Tsunami database. Unpublished Report, 4 volumesRisk Frontiers (2005) Newsletter. http://www.riskfrontiers.com/nhq/images/Seminar05.pdf, accessed 13th
April 2006Rohrmann B (1999) Community-based fire preparedness programmes: an empirical evaluation. Australas
J Disaster Trauma Stud 1:ISSN: 1174–4707Rohrmann B (2003) The utility of the World-Wide-Web for fire preparedness of residents. Aust J Emerg
Manage 18:20–28Ronan KR, Johnston DM, Daly M, Fairley R (2001) School children’s risk perception and preparedness:
a hazards education survey. Aust J Disaster Trauma Stud 1:ISSN: 1174–4707Rynn J, Davidson J (1999) Contemporary assessment of tsunami risk and implication for early warnings for
Australia and its island territories. Sci Tsunami Hazards 17:107–125Salgado I, Annaliese E, Atwater B, Massanobu S, Custernas M (2003) Recurrence of giant earthquakes
inferred from tsunami sand sheets and subsided soils in South-Central Chile. Geol Soc Am Annu MeetDigital Abstracts. 238–26
Schutz H, Wiedemann PM (2000) Hazardous incident information for the public: is it useful? AustralasJ Disaster Trauma Stud 2:ISSN: 1174–4707
Spittal MJ, McClure J, Siegert RJ, Walkey FH (2005) Optimistic bias in relation to preparedness forearthquakes. Australas J Disaster Trauma Stud 1:ISSN: 1174–4707
Sullivan M (2006) The Australian Tsunami Warning System—an Emergency Management Perspective.Unpublished paper, Emergency Management Australia, 6 pp
Sydney Morning Herald (2007) ‘‘Grab the cat—chaos as residents head for the hills’’ and, ‘‘Pacific tsunamipanic’’. Articles at: http://www.smh.com.au, accessed 3rd April 2007
Young R, Bryant E (1992) Catastrophic wave erosion on the southeastern coast of Australia: impact of theLanai tsunami ca. 105 ka? Geology 20:199–202
Young R, Bryant E, Price D (1995) The imprint of tsunami in Quaternary coastal sediments of southeasternAustralia. Bulgar Geophys J 21:24–32
Young R, Bryant E, Price D (1996) Catastrophic wave (tsunami?) transport of boulders in the southern NewSouth Wales, Australia. Z Geomorph NF 40:191–207
122 Nat Hazards (2008) 45:99–122
123