
An integrated systems biology approach to investigate ...
180
An integrated systems biology approach to investigate transcriptomic data of thyroid carcinoma May 2019 Master's thesis Master's thesis Marie Gulla 2019 Marie Gulla NTNU Norwegian University of Science and Technology Faculty of Natural Sciences Department of Biotechnology and Food Science
-
Upload
khangminh22 -
Category
Documents
-
view
0 -
download
0
Transcript of An integrated systems biology approach to investigate ...

An integrated systems biologyapproach to investigatetranscriptomic data of thyroidcarcinoma
May 2019
Mas
ter's
thes
is
Master's thesis
Marie Gulla
2019M
arie Gulla
NTNU
Nor
weg
ian
Univ
ersi
ty o
fSc
ienc
e an
d Te
chno
logy
Facu
lty o
f Nat
ural
Sci
ence
sDe
part
men
t of B
iote
chno
logy
and
Foo
d Sc
ienc
e


An integrated systems biology approachto investigate transcriptomic data ofthyroid carcinoma
Marie Gulla
Biotechnology MBIOT5Submission date: May 2019Supervisor: Eivind AlmaasCo-supervisor: André Voigt
Norwegian University of Science and TechnologyDepartment of Biotechnology and Food Science


An integrated systems biology approach to investigatetranscriptomics data of thyroid carcinoma
Marie Gulla
May 15, 2019

“ I can appreciate the beauty of a flower. At the same time, I see much more about the flower(..). I could imagine the cells in there, the complicated actions inside, which also have abeauty. I mean it’s not just beauty at this dimension, at one centimeter; there’s also beautyat smaller dimensions, the inner structure, also the processes. (...) The science knowledgeonly adds to the excitement, the mystery and the awe of a flower. It only adds. ”
Richard Feynman

Abstract
Driven by the development of innovative approaches to quantify gene expression levels acrosslarge numbers of samples, differential transcriptome analysis is emerging as a powerfulstrategy to interrogate the complex interplay of genes accountable for malignancies. TheCSD method is a correlation-based method to systematically classify differential geneticassociations, facilitating identification of dissimilar interactions driving pathogenesis. In thiswork, we have used the CSD framework for analyzing gene correlation for thyroid carcinoma(THCA) patients. THCA is the most common endocrine cancer type. These tumoursfrequently resist standard treatments and are thus associated with poor clinical outcome.By using publicly available samples from The Cancer Genome Atlas, the transcriptomiclandscape was investigated by contrasting these to normal thyroid expression profiles. TheCSD method successfully pinpointed several interesting gene pairs in networks enrichedfor processes linked to carcinogenic behaviour. Examination of gene interactions revealedrelevant gene groups driving aberrant signaling and regulatory cascades. Looking into wellconnected network regions identified hubs coordinating destructive information processing,likely responsible for deteriorated mechanisms needed to combat tumor progression. Probinggene associations characterized by transition into abnormal character resulted in potentialnovel prognostic markers of thyroid carcinoma.
In the second part, robustness and potential method improvements to the CSD frameworkwere assessed. Quality control investigation demonstrated that obtaining consistent analysisresults required proper data pre-processing, including batch effect correction. A fundamentalstep in correlation-based methods for differential studies, is quantifying gene-pair relation-ships from gene expression data. Here, we explored three alternatives to the conventionalinference algorithm. First, weighted topological overlap (wTO) with soft thresholding wasapplied. This provided a robust computation, also giving meaningful results in the case oflow sample sizes and appeared to produce biologically meaningful modular structures. Thesecond method was based on computing the mutual information (MI) as a more far-reachingsimilarity measurement. Although it was more dependent on larger sample sizes, it eluci-dated numerous novel relevant gene pairs not captured by Spearman or wTO. Motivated byachieving a computational reduced footprint allowing applicability to larger data sets, thelast alternative involved a simplified version of CSD omitting variance estimation. Whilemaybe offering some false positives, the relaxed condition will produce useful result setseven for very large transcriptomic data. For quality assessment, gene interactions identifiedby any of the similarity measures, were analyzed with regard to biological function andsignificance. Alternative similarity measures augment the outcomes of the original CSDmethod, and yield candidate genes which may contribute to deciphering the pathogenesisof THCA.


Sammendrag
Som følge av store framskritt i teknologi og innovativ tenkning har det blitt mulig å måleuttrykk av gener og hvordan dette uttrykket varierer over store grupper mennesker. Sam-menligning av genuttrykk gjør det mulig å forske på komplekse sammenhenger mellomgenuttrykk og sykdom. CSD-metoden er et rammeverk for å undersøke systematiske for-skjeller i genetiske interaksjoner som er nyttig for å identifisere forskjellene som forårsakersykdomsutvikling. I første del av denne oppgåven har vi sett på genuttrykk målt i skjold-bruskjertelen ved kreft. Skjortbrukskjertelkreft er den mest forekommende krefttypen blantde endokrine kjertlene. Det er en vanskelig kreft å bekjempe med nåværende behandlinger,og fører derfor ofte med seg dårlige sykdomsprognoser. På The Cancer Genome Atlas begenuttrykksprøver lasted ned og benyttet for å studere genuttrykksprofilen for denne kreft-typen ved å sammenligne disse med prøver fra sunt vev. Med CSD-metoden greide vi å finnemange interessante genetiske korrelasjoner som framstilte et system med overpresentasjonfor kreftrelaterte prosesser. Ved å se nærmere på disse, identifiserte vi potensielle kilder tilfeil i reguleringen av genuttrykk, for bland annet gener som er viktige i å koordinere ulikecellulære funksjoner som syntes å oppføre seg unormalt. Komparativ analyse av genuttrykkresulterte i nye kandidatgener som markører for skjoldbruskkjertelkreft.
I den andre delen av oppgaven forsøkte vi å undersøke robustheten til CSD-metoden og finnemulige forbedringspotensialer. Kvalitetskontroll, inkludert korreksjon for kilder til forstyr-relser bland målinger i datasettene, viste seg å være viktig for å forsikre pålitelighet blantresultatene. En grunnleggende del av analysemetoder basert på samenfallende mønster i gen-uttrykk er å beregne korrelasjoner mellom uttykksmålingene. Her ble tre nye alternativerfor å gjøre dette utforsket. Først ble vektet topologisk overlapp benyttet, og resulterte i etrobust likhetsmål også for mindre datasett. Dette var spesielt nyttig for å finne interessantegrupperinger av korrelerte gener. Den andre metoden var å beregne gjensidig informasjon,og besto i å implementere estimering av entropi. Denne viste seg å være mer avhengig avtilstrekkelig antall målepunkter men bidro til å belyse nye viktige genetiske interaksjonersom ikke de tidligere fremgangsmåtene fanget opp. En siste alternativ metode var en for-enklet versjon av CSD-metoden, motivert av redusert beregningstid for anvendelse på storemengder genuttrykksmålinger. Dog denne lettere framgangsmetoden kan være preget avnoen false positiver, vil den være nyttig i anvendelse på store sett med genuttrykksmålin-ger. For å evaluere kvaliteten til de utviklede metodene så vi på deres evne til å fremhevebiologisk relevante genetiske interaksjoner. Alternative likhetsmål som utvidelser til CSD-metoden økte kunnskapen om skjoldbruskkjertelkreft og dro fram nye geninteraksjoner somkan bidra til å forstå sykdommen bedre samt å utvikle nye behandlinger i fremtiden.


Preface
The work presented in this thesis was conducted at the Department of Biotechnology andFood Sciences at the Norwegian University of Science and Technology (NTNU) under thesupervision of professor Eivind Almaas. It concludes my Master of Science degree in Biotech-nology where I have specialized in Systems Biology.
I would first like to express my gratitude to my supervisor, professor Eivind Almaas, for hisencouragement and valuable help throughout this work, in the form of shared insights, chal-lenges, and feedback. Professor Eivind Almaas introduced me into this area and providedexcellent supervision throughout this project has been indispensable. To my co-advisor An-dré Voigt I will express my sincere gratitude for taking great interest in my project, teachingme linux commands, debugging, and for all fruitful comments on my work. He offered in-valuable guidance, explanations of the CSD framework, and explaining whatever questionsI might have. Thanks to both for constantly being available and responding to questionseven in weekends and late evenings and giving me comment on this thesis. I would also liketo acknowledge the support and encouragement from the fellow students of the NetworkSystems biology group, especially Martina, Emil, and Snorre. It has been a great team tobe a part of.
I would also like to thank some fellow students for setting aside time. To Håkon Hukkelåsfor answering questions related to Python programming, to Jakob Pettersen for all helpin working out programming challenges, and in particular employing the magic of parallelR. Madelene, I look up to you and thank you deeply for being my best friend and for theencouraging post-it notes you leave for me in our apartment. Thank you to my best friendsMagnhild, Åsa, Victoria, Ragnhild, and Marianne. You have made these past five yearsmy best. To all my friends and classmates who have provided a fun and inspiring workenvironment. Thanks also to the bad spring weather in Trondheim this year, making itpossible to complete this work without being too annoyed about sacrificed outdoor activities.
Lastly I want to thank my parents and family for all support and encouragement, especiallyby brother Jan for teaching me Latex. To my dog Simba for believing in me. And last butnot least, a warm thanks to my boyfriend Matias, for his love, patience and for lighteningup my everyday.
Marie GullaMay 2019
vii


Contents
Preface vii
List of figures xiii
List of tables xvii
Nomenclature and notation xix
1 Introduction 11.1 Complexity of Biological Systems . . . . . . . . . . . . . . . . . . . . . . . . . 11.2 Aims and objectives of this thesis . . . . . . . . . . . . . . . . . . . . . . . . . 3
2 Theoretical background 52.1 Thyroid cancer . . . . . . . . . . . . . . . . . . . . . . . . . . . . . . . . . . . 52.2 Microarray technology . . . . . . . . . . . . . . . . . . . . . . . . . . . . . . . 72.3 RNA sequencing . . . . . . . . . . . . . . . . . . . . . . . . . . . . . . . . . . 72.4 RNA-seq data processing . . . . . . . . . . . . . . . . . . . . . . . . . . . . . 9
2.4.1 Normalization methods and expression level modelling . . . . . . . . . 92.5 Network theory . . . . . . . . . . . . . . . . . . . . . . . . . . . . . . . . . . . 10
2.5.1 Adjacency matrix . . . . . . . . . . . . . . . . . . . . . . . . . . . . . . 112.5.2 Node degree . . . . . . . . . . . . . . . . . . . . . . . . . . . . . . . . . 122.5.3 Degree distributions . . . . . . . . . . . . . . . . . . . . . . . . . . . . 132.5.4 Paths and betweenness centrality . . . . . . . . . . . . . . . . . . . . . 142.5.5 Eigenvector centrality . . . . . . . . . . . . . . . . . . . . . . . . . . . 152.5.6 Clustering . . . . . . . . . . . . . . . . . . . . . . . . . . . . . . . . . . 152.5.7 Network assortativity . . . . . . . . . . . . . . . . . . . . . . . . . . . 16
2.6 Similarity measures . . . . . . . . . . . . . . . . . . . . . . . . . . . . . . . . . 172.6.1 Spearman rank correlation coefficient . . . . . . . . . . . . . . . . . . 192.6.2 Mutual information . . . . . . . . . . . . . . . . . . . . . . . . . . . . 192.6.3 Weighted topological overlap . . . . . . . . . . . . . . . . . . . . . . . 222.6.4 Overlap coefficient . . . . . . . . . . . . . . . . . . . . . . . . . . . . . 23
2.7 Gene co-expression networks . . . . . . . . . . . . . . . . . . . . . . . . . . . . 232.8 Differential gene co-expression networks . . . . . . . . . . . . . . . . . . . . . 252.9 The CSD Method . . . . . . . . . . . . . . . . . . . . . . . . . . . . . . . . . . 27
2.9.1 Sub-sampling algorithm for variance estimation . . . . . . . . . . . . . 302.9.2 Node homogeneity . . . . . . . . . . . . . . . . . . . . . . . . . . . . . 31
2.10 Network medicine . . . . . . . . . . . . . . . . . . . . . . . . . . . . . . . . . . 322.10.1 Disease modules . . . . . . . . . . . . . . . . . . . . . . . . . . . . . . 33
2.11 Statistics . . . . . . . . . . . . . . . . . . . . . . . . . . . . . . . . . . . . . . 33
ix

2.11.1 Hypothesis testing . . . . . . . . . . . . . . . . . . . . . . . . . . . . . 332.11.2 Testing and correcting for multiple comparisons . . . . . . . . . . . . . 34
3 Methodology 373.1 CSD Analysis on Thyroid Cancer . . . . . . . . . . . . . . . . . . . . . . . . . 37
3.1.1 Data set collection . . . . . . . . . . . . . . . . . . . . . . . . . . . . . 373.1.2 Data set integration . . . . . . . . . . . . . . . . . . . . . . . . . . . . 383.1.3 Pre-processing procedure . . . . . . . . . . . . . . . . . . . . . . . . . 393.1.4 Differential co-expression analysis workflow . . . . . . . . . . . . . . . 393.1.5 Box-plots . . . . . . . . . . . . . . . . . . . . . . . . . . . . . . . . . . 413.1.6 Node homogeneity analysis . . . . . . . . . . . . . . . . . . . . . . . . 413.1.7 Gene ontology enrichment analysis . . . . . . . . . . . . . . . . . . . . 413.1.8 Community detection . . . . . . . . . . . . . . . . . . . . . . . . . . . 423.1.9 Detection of disease genes and potential disease modules . . . . . . . . 42
3.2 Method study and development . . . . . . . . . . . . . . . . . . . . . . . . . . 433.2.1 Alternative methods for data pre-processing . . . . . . . . . . . . . . . 433.2.2 Testing the effect of pre-processing strategies . . . . . . . . . . . . . . 463.2.3 Parallel programming . . . . . . . . . . . . . . . . . . . . . . . . . . . 463.2.4 Development of CSD framework with wTO . . . . . . . . . . . . . . . 473.2.5 Development of CSD framework with mutual information . . . . . . . 493.2.6 CSD framework with alternative Spearman’s ρ . . . . . . . . . . . . . 513.2.7 Comparison of alternative similarity measures . . . . . . . . . . . . . . 51
4 Results & Analysis: Application to Thyroid Cancer Expression Data 554.1 Construction of differential gene co-expression network . . . . . . . . . . . . . 554.2 Degree Distribution . . . . . . . . . . . . . . . . . . . . . . . . . . . . . . . . 584.3 Hubs and assortativity . . . . . . . . . . . . . . . . . . . . . . . . . . . . . . . 584.4 Network homogeneity . . . . . . . . . . . . . . . . . . . . . . . . . . . . . . . 634.5 Biological process enrichment analysis . . . . . . . . . . . . . . . . . . . . . . 654.6 Disease gene identification . . . . . . . . . . . . . . . . . . . . . . . . . . . . . 704.7 Investigation of network modules . . . . . . . . . . . . . . . . . . . . . . . . . 74
4.7.1 GO biological process enrichment analysis of modules . . . . . . . . . 77
5 Results & Analysis: MethodDevelopment 815.1 Effect of pre-processing methods . . . . . . . . . . . . . . . . . . . . . . . . . 815.2 Weighted topological overlap as similarity measure . . . . . . . . . . . . . . . 85
5.2.1 GO enrichment analysis . . . . . . . . . . . . . . . . . . . . . . . . . . 885.2.2 The behaviour of network hubs . . . . . . . . . . . . . . . . . . . . . . 885.2.3 THCA-associated genes . . . . . . . . . . . . . . . . . . . . . . . . . . 91
5.3 Expanding the CSD framework with mutual information . . . . . . . . . . . . 925.3.1 The behaviour of hubs . . . . . . . . . . . . . . . . . . . . . . . . . . . 935.3.2 THCA-associated genes . . . . . . . . . . . . . . . . . . . . . . . . . . 94
x

5.4 Comparison of co-expression measures . . . . . . . . . . . . . . . . . . . . . . 985.4.1 Network construction . . . . . . . . . . . . . . . . . . . . . . . . . . . 985.4.2 Sample size robustness . . . . . . . . . . . . . . . . . . . . . . . . . . . 1045.4.3 Homogeneity . . . . . . . . . . . . . . . . . . . . . . . . . . . . . . . . 1065.4.4 Identification of disease genes . . . . . . . . . . . . . . . . . . . . . . . 111
6 Discussion 1136.1 Application to thyroid cancer . . . . . . . . . . . . . . . . . . . . . . . . . . . 1136.2 Method development . . . . . . . . . . . . . . . . . . . . . . . . . . . . . . . . 119
7 Conclusion & Outlook 127
Bibliography 131
Appendix A Disease genes 143A.1 Thyroid cancer associated genes in CSD network . . . . . . . . . . . . . . . . 143A.2 Thyroid cancer-associated genes in wTO-network . . . . . . . . . . . . . . . . 145A.3 Thyroid cancer associated genes in MI-network . . . . . . . . . . . . . . . . . 146A.4 Thyroid cancer associated genes in CSD-VAR-network . . . . . . . . . . . . . 146A.5 Thyroid cancer associated genes identification chart . . . . . . . . . . . . . . 146
Appendix B Auxillary material from method development section 149B.1 Hubs in wTO-network . . . . . . . . . . . . . . . . . . . . . . . . . . . . . . . 149B.2 GO process enrichment of all genes in the wTO-network . . . . . . . . . . . . 151B.3 Node degree distribution for weighted topological overlap-based CSD network 152B.4 Hubs in MI-network . . . . . . . . . . . . . . . . . . . . . . . . . . . . . . . . 152B.5 Node degree distribution for mutual information-based CSD network . . . . . 154B.6 THCA-associated genes from Analysis 0 . . . . . . . . . . . . . . . . . . . . . 154B.7 Node degree distribution for CSD network based on CSD-VAR . . . . . . . . 155
xi


List of figures
2.1 The figure shows a small network of four nodes and four links, in which thethe top one shows four proteins and their connections and the bottom is asimple graph representation of the network. Taken from [1]. . . . . . . . . . . 11
2.2 Diagram showing the mutual information and entropy. The figure shows therelationship between the two variables A and B and their entropies H(A|B)and H(B|A). The mutual information I(A;B) is the sum of the individualentropies minus the joint [2]. . . . . . . . . . . . . . . . . . . . . . . . . . . . 21
2.3 Diagram showing the regions of differential co-expression properties of gene-pair interactions inferred with the CSD method. For a given pair of genestheir co-expression value measured by the Spearman correlation coefficientfor condition 1 and condition 2 is denoted ρ1 and ρ2 respectively. The plotillustrates the different co-expression relationships between ρ1 and ρ2. Theseare categorized as either C-, S- or D-scores depending on the kind or rela-tionship. C-scores (blue) describe conserved co-expression, with similar signand both strong correlation. S-scores (green) describe specific cases where norelationship between co-expression values exist, with opposing strong valuesand opposite correlation signs. D-scores (red) describe differentiated caseswhere both co-expression values have strong values but different correlationsigns [3]. . . . . . . . . . . . . . . . . . . . . . . . . . . . . . . . . . . . . . . . 28
3.1 Illustration of work-flow for differential gene co-expression analysis with theCSD framework developed in [3]. . . . . . . . . . . . . . . . . . . . . . . . . . 40
3.2 Illustration of alternative pre-processing steps. . . . . . . . . . . . . . . . . . 443.3 Illustration of the implementation of four alternative similarity measures to
the CSD method. . . . . . . . . . . . . . . . . . . . . . . . . . . . . . . . . . . 53
4.1 Plot showing CSD-network inferred with an importance level 10−5 on the dataset with intermediate filtering process, Analysis 2, consisting of 20,657 genes.Inferred network consists of 1,516 nodes and 3,612 edges. Edges are colouredby type of interaction between the two compared conditions. Conserved linksare blue, differentiated links are red and specific links are green. Node size isproportional to node degree. . . . . . . . . . . . . . . . . . . . . . . . . . . . . 57
4.2 Plot showing degree distribution on a log-log scale for the CSD-network ofAnalysis 2, data set with 20,657 genes. Both axes are on logarithmic scale.The red line represents the function for the approximated power law fitted tothe data points. It’s expression is given in the top right corner. . . . . . . . . 58
xiii

4.3 Visualization of the hubs of the CSD-network for Analysis 2, identical to thatin Fig. 4.1. The links are coloured according to link type, C-links are blue,S-links are green, and D-links are red. Hubs (degree k ≥ 40) are enlarged andtheir respective names and positions in the network are indicated by arrows. . 62
4.4 Box plot of network homogeneity for Analysis 2 network in Fig. 4.1 binned bynode degree. Red bars correspond to the median of H, and the green squaresdenote the mean H. The top and bottom ends of the boxes represent first andthird quartile (25th percentile and 75th percentile) respectively. The ends ofthe whiskers represent the minimum and maximum values of H for the givendegree. . . . . . . . . . . . . . . . . . . . . . . . . . . . . . . . . . . . . . . . . 64
4.5 Venn diagram showing the mixing of differential co-expression types betweenthe nodes in the network shown in Fig. 4.1. Blue circles contain the numberof conserved links, green circles contain the number of specific links and thered circles contain the number of differentiated links, and their shared areasquantify the number of mixed interactions between the three types found inthe network. . . . . . . . . . . . . . . . . . . . . . . . . . . . . . . . . . . . . . 65
4.6 Illustration of CSD network for Analysis 2 with 22 thyroid-cancer genes iden-tified as DEGs showed as enlarged nodes. This network is identical to that inFig. 4.1. Thyroid-cancer genes are highlighted by name and arrows indicatetheir positions in the network. Edges between nodes are coloured by typeof interaction between the conditions, conserved links are blue, differentiatedlinks are red and specific links are green. . . . . . . . . . . . . . . . . . . . . . 73
4.7 Plot showing communities in the differential gene co-expression network de-tected by the Louvain community detection algorithm [4]. Numbers on thefigure denote the module number from Table 4.7 for each module respectively.Each community is coloured differently so that all gene nodes within the samecommunity have the same colour. Edges between nodes are coloured by typeof interaction between the conditions, conserved links are blue, differentiatedlinks are red and specific links are green. . . . . . . . . . . . . . . . . . . . . 76
5.1 Venn-diagram of the distribution of common and unique inferred genetic as-sociations between Analysis 0, Analysis 1, and Analysis 2. Comparison ofnetworks inferred with importance value p = 10−5 created with the CSD-method. . . . . . . . . . . . . . . . . . . . . . . . . . . . . . . . . . . . . . . . 83
5.2 Plot of relative compliance between the three alternatively pre-processed datasets An.0, An.1, and An.2, in respect to identical content of nodes identifiedas hubs. Ratio of compliance among hubs is quantified with the overlapcoefficient in sets of genes with increasing degree cutoffs, which increasesalong the x-axis. Increasing compliance increases along the y-axis. All threeversions of the data set are compared to each other as indicated in the legend,and respective degree of overlap in each comparison is indicated with a crossin the plot. . . . . . . . . . . . . . . . . . . . . . . . . . . . . . . . . . . . . . 85
xiv

5.3 Differential co-expression network inferred with CSD-method implementationwith weighted topological overlap (wTO) for Analysis 1, with importancelevel is 10−5. The network consists of 770 genes and 4831 edges. Interactionsare of all types, C-scores are colored blue, S-scores are green, and D-scoresare red. Thyroid cancer-associated genes are highlighted with enlarged nodesize and tagged by name. . . . . . . . . . . . . . . . . . . . . . . . . . . . . . 87
5.4 Extrapolated run-time complexity plot for mutual information computationof similarity matrix for differential co-expression network inference. Perfor-mance is illustrated as time elapsed as a function of log(n), n = number ofvariables (data set size). . . . . . . . . . . . . . . . . . . . . . . . . . . . . . . 92
5.5 Differential co-expression network inferred with CSD-method implementationwith foundation in mutual information as similarity measure. Importancelevel is 10−5. Interactions are of all types, C-scores are colored blue, S-scoresare green, and D-scores are red. Thyroid-cancer genes are tagged by nameand highlighted with enlarged node size. . . . . . . . . . . . . . . . . . . . . . 97
5.6 Differential co-expression network inferred with original CSD-implementationbased Spearman’s rank correlation coefficient. Interactions are of all types,C-scores are colored blue, S-scores are green, and D-scores are red. Nodedegree distribution is included in the left corner of the figure. . . . . . . . . . 101
5.7 For network 1: Differential co-expression network inferred with CSD-methodimplementation with Spearman’s rank correlation coefficient without variancecorrection (CSD-VAR). Interactions are of all types, C-scores are coloredblue, S-scores are green, and D-scores are red. Node degree distribution isincluded in the left corner of the figure. Thyroid cancer-associated genes arehighlighted by enlarged node size and tagged by gene name. . . . . . . . . . . 103
5.8 Robustness analysis plot for the four different similarity measures appliedfor differential co-expression analysis for data sets of a fabricated decreas-ing sample size. The overlap coefficient quantifies the degree of overlap be-tween inferred gene associations in the networks from the sub-sample and thefull set. The four different similarity measures compared are the Spearmancorrelation coefficient, the Spearman correlation coefficient without variancecorrection, weighted topological overlap and mutual information. a) Associ-ations are of all types, C-, S-, and D. b) Associations are of conserved type(C-links). c) Associations are of specific type (S-links). d) Associations areof differentiated type (D-links). . . . . . . . . . . . . . . . . . . . . . . . . . 106
5.9 Plot showing homogeneity sorted by node degree for network constructedwith Spearman’s rank correlation coefficient (CSD) as similarity measure.The network is inferred from the data-set from Analysis 1 with an importancevalue p = 10−5. . . . . . . . . . . . . . . . . . . . . . . . . . . . . . . . . . . . 108
xv

5.10 Plot showing homogeneity sorted by node degree for network constructed withSpearman’s rank correlation coefficient without variance correction (CSD-VAR) as similarity measure. The network is inferred from the data-set fromAnalysis 1 with an importance value p = 10−5. . . . . . . . . . . . . . . . . . 108
5.11 Plot showing homogeneity sorted by node degree for network constructedwith weighted topological overlap (wTO) as similarity measure.The networkis inferred from the data-set from Analysis 1 with an importance value p = 10−5.109
5.12 Plot showing homogeneity sorted by node degree for network constructedwith mutual information (MI) as similarity measure. The network is inferredfrom the data-set from Analysis 1 with an importance value p = 10−5. . . . . 109
5.13 Venn diagram showing the relative quantities of genes involved in each typeof interaction. Red circles contain the number of differentiated links, bluecircles the conserved links and the green circles the number of specific typelinks. The networks are all inferred from the data-set from Analysis 1 withan importance value p = 10−5. . . . . . . . . . . . . . . . . . . . . . . . . . . 110
B.1 Neighborhood connectivity as function of node degree illustration on log-log-plot for differential co-expression network inferred with CSD based on thesimilarity measure weighted topological overlap. Importance value of p = 10−5.152
B.2 Degree distribution plot for the CSD network based on mutual information assimilarity measure. The importance level for the network is 10−5 and the axesof the plot are on a log-log-scale. The red fitted line shows the approximationof the node degree distribution with a power law function. . . . . . . . . . . . 154
B.3 Degree distribution plot on a log-log-scale for the network inferred with al-ternative Spearman’s correlation coefficient not corrected for variation in cor-relation measures, termed CSD-VAR. The importance level for the networkis 10−5. The red fitted line shows the approximation of the node degreedistribution with a power law function. . . . . . . . . . . . . . . . . . . . . . . 156
xvi

List of tables
4.1 Genes in the CSD-network with degree over 40, categorized as network hubs.k denotes the node degree, kt is the number of link of type t ∈ (C, S,D)for each hub. H = homogeneity. Cv = clustering coefficient. Row colourdescribes the predominant link type for each hub respectively, blue if C-links,green if S-links and red if D-links. . . . . . . . . . . . . . . . . . . . . . . . . . 59
4.2 Biological processes sorted by their fold enrichment identified by GO enrich-ment analysis based on all the differentially expressed genes of the CSD-network. 67
4.3 Diseases associated with the differentially expressed genes of the CSD-networkidentified with GO analysis, with the highest associated gene counts and theirrespective p-values and fold enrichment. Disease instances are sorted by thenumber of genes from the network mapping to the disease on GAD [5]. . . . . 68
4.4 Top genes sorted by betweenness centrality and their node degrees . . . . . . 694.5 Top genes sorted by eigenvector centrality and their node degrees . . . . . . . 694.6 Genes in the CSD-network associated with thyroid cancer identified with
GO analysis. The type denotes the predominant link type among a gene’sassociations (t∈(C,S,D)). *IP3 = inositol 1,4,5-trisphosphate. . . . . . . . . . . 70
4.7 Network modules with highest number of genes, their average degree, averagebetweenness centrality and average clustering coefficient. . . . . . . . . . . . . 75
4.8 Table of the enriched KEGG pathways associated with Module 5, the largestmodule of the CSD network, identified by DAVID. The pathways are sortedby p-value. "benjamini" = Benjamini corrected p-value. . . . . . . . . . . . . 78
4.9 Over-represented biological processes associated with module number 0 of theCSD network as identified by GO, sorted by fold enrichment. . . . . . . . . . 78
4.10 Over-represented biological processes associated with module number 7 of theCSD network as identified by GO sorted by fold enrichment. . . . . . . . . . 79
4.11 Table of the 16 top over-represented biological processes associated with mod-ule number 34 of the CSD network as identified by GO sorted by fold enrich-ment. . . . . . . . . . . . . . . . . . . . . . . . . . . . . . . . . . . . . . . . . 79
5.1 Network parameters for the networks inferred on the basis of four differ-ent importance values, each generated for data sets subject to different pre-processing strategies. . . . . . . . . . . . . . . . . . . . . . . . . . . . . . . . . 82
5.2 Table of network parameters for the networks based on WTO and and onSpearman’s correlation coefficient, both with p = 10−5. . . . . . . . . . . . . . 86
5.3 Table of GO enriched processes for the network hubs of the wTO-network. . . 895.4 Table of thyroid cancer-associated genes uniquely identified from functional
annotation analysis of the wTO-network, sorted by degree. . . . . . . . . . . 91
xvii

5.5 Table of network parameters for the networks based on mutual information(MI) and on Spearman’s correlation coefficient ρ, both with p = 10−5. . . . . 93
5.6 Table of thyroid cancer-associated genes uniquely identified from functionalannotation analysis of the DEGs from MI-network. . . . . . . . . . . . . . . . 95
5.7 GO functional enrichment analysis results for the CSD-network based on mu-tual information as similarity measure. The importance level for the networkis 10−5. Enriched processes are sorted by fold enrichment. . . . . . . . . . . . 96
5.8 Assessment of relative ability in disease-gene identification for all three alter-native similarity measures compared to the baseline CSD method . . . . . . . 111
A.1 Summary of THCA-genes identified as differentially co-expressed by the CSDnetworks based on the four different similarity measurements experimentedwith in Chapter 5. . . . . . . . . . . . . . . . . . . . . . . . . . . . . . . . . . 147
B.1 Hub genes in wTO-network identified as differentially expressed with degreek ≥ 40. Predominant link type t∈(C.S.D), clustering coefficient C, and be-tweenness centrality CB are given for each gene respectively. . . . . . . . . . 150
B.2 Enriched processes of the wTO-network . . . . . . . . . . . . . . . . . . . . . 151B.3 Hubs of the CSD network inferred with an importance value of p = 10−5 based
on the similarity measure mutual information. Hub genes are sorted by theirrespective degree k. Predominant link type t∈(C.S.D), clustering coefficient C,and betweenness centrality CB are given for each gene respectively. . . . . . . 153
B.4 Table of additional THCA-associated genes identified in network for Analysis0. Type denotes the predominant link type among a gene’s associations(t∈(C,S,D)). . . . . . . . . . . . . . . . . . . . . . . . . . . . . . . . . . . . . . . 155
xviii

Nomenclature and notation
Abbreviations
DEG Differentially expressed geneDCG Differentially co-expressed geneDGC Differential gene co-expression networkDGCN Differential gene co-expression networkGO Gene ontologyTHCA Thyroid carcinomaC, S,D Conserved, Specific, DifferentiatedH Node homogeneity in link type distributionk Node degree, equal to number of links attached to the nodep Importance levelkC,S,Dp Threshold value for C-, S-, and D-score in network inferenceρ Spearman’s ranked correlation coefficient
Comparison of similarity measures
CSD Conventional CSD-framework with basis in ρCSD-V AR CSD with ρ without correction for internal variance in ρwTO CSD based on weighted topological overlap transformation of ρMI CSD based on the mutual information
xix


Chapter 1
Introduction
1.1 Complexity of Biological Systems
Cells can be best understood as complex systems. Each of the thirty-seven trillion cellsthat make up the human body are complex machines utilizing elaborate schemes of or-chestrated genetic transcription to create a self-maintainable structure that responds to itssurroundings and contributes to the performance of a multi-cellular living organism. Onthe single cell level - as well as the multi-cellular level - integration of information ensurescorrect cellular conduct in different situations. Internal information is stored in the DNA,which is the blueprint for making proteins and other functional molecules necessary for thesurvival of the cell. Thousands of nucleotides constituting the genetic code are copied andtranslated into proteins each minute, and even at these astounding velocities it happensvirtually without errors. External information is received through its membrane and theproper signalling responses are mediated through extremely speedy transduction pathwaystransmitting information through the cell to the fitting target. Before a second has passed,thousands of molecules have been synthesized and complexes have been assembled by elab-orate molecular factories. Matter flows in and out of the cell as it fuels its exquisite showof complex life in nature’s most minuscule entity.
But the cell is also matter that dances. Perhaps the ultimate characteristic of a livingsubstance, is that it does not obey precise laws but its activities are associated with noise.Stochastic fluctuations within a cell makes it phenotypically different from its surroundingcells, even though they may share identical DNA. Cells are under strong thermal noise, andin the dense soup of molecules that fills the cell macro-molecular complexes spontaneouslyassemble to perform a task and dissolve and vanish without effort when the work is done.The existence of randomness reflects the intrinsic complexity of the cell. Complexity inbiology does not have any operational definition and cannot be captured by any commonmeasure, because it refers to all structural, functional and hierarchical complexity [6].
In spite of this, scientists have attempted to develop generalizable principles on the conduct
1

1.1. COMPLEXITY OF BIOLOGICAL SYSTEMS
of living systems. Living systems were first studied by breaking them down to manageablepieces that could be understood, but this changed during the 20th century with scientificemphasis on whole indivisible behaviour. It became evident that the structure of the en-tire system as a whole orchestrated the behaviour of its components. This lead to thedevelopment of high-throughput experimental technology providing the necessary level ofcomprehensive and detailed information [7]. Because biology has evolved to perform specifictasks, it became apparent that the style of biological models was not haphazard but indeeddescribing a function. Resulting from the last 30 years of growth in processing power, stor-age capacity and interdisciplinary collaboration; systems biology emerged as a quantitativeintegration of interacting molecular components in a dynamic system made possible by in-creasing computational power. System biology models the converging patterns of cellularcircuitry that obey some framework enough for it to be expressed mathematically and therecognition of networks in biology [8].
Integrative thinking is the foundation for the field of network biology. Biology has slowlybeen unraveled by combining mathematical tools with high-quality experimental data toconstruct and simulate data-driven networks. Networks are employed to model complexbiological systems because it captures the complexity of the system and facilitates detailedanalysis of the its structure and the characteristics of its components in a stable yet dynamicmanner.
Most cells must constantly monitor and fine-tune the genes it expresses and the levels ofgenetic transcript it produces. The genetic products - the RNA molecules and proteins -perform tasks that are both necessary for the ordinary cellular life and to respond to unfore-seeable obstacles and challenges. During its entire life cycle, the cell needs to synthesize anddo maintenance of its building blocks, manage the quality of its machinery, and make surethere is constant flow through its energy-producing metabolism by both taking up nutrientsand flushing out waste products. The model properties representing different cell statesare determined by the gene-expression profiles, indicating which genes are actively beingtranscribed and to which degree. The large number of cell states and their reproducibilityby mathematical models attest to the existence of molecular programs ensuring reliableexecution [9]. It is also a description of the cells in their true functional states, not theirfunctional capacity, given merely by their genetic make-up.
In contrast, gene expression analysis illuminates the cells accurate phenotypic behaviour.Cells of the human body contain around 20 thousand genes. The 1000 Genomes ProjectConsortium found that 99.4% of the genome in humans is the same [10]. Yet there aremillions of differences between any two people. Phenotypes are variations in the outsideappearance resulting from many factors within the genetic makeup; like polymorphisms andvariations in gene expression levels. Investigating variances between people has lead to majordiscoveries in medicine and continues to help us learn more about human health and disease.From a gene in the DNA is expressed in the nucleus of a human cell, transcribed into RNA,processed into messenger RNA (mRNA), transported and translated (if protein-coding) intoamino acids and folded into functional proteins, there are several potential things that may
2

1.2. AIMS AND OBJECTIVES OF THIS THESIS
go wrong and several sites of regulatory interacting ensuring genetic expression of optimallevels. Through evolution, robust machinery have evolved that control the quantity andquality of information flowing from the genetic material into expressed genes and hinderany erroneous events within the process of genetic expression from permeating into thecellular system. Small fluctuations within this cellular quality-control machinery give riseto phenotype variation. However, some errors might occur and slip through the machineryas well. Incorrect level of genetic expression from a normal gene, or expression of a genewith mutations, could ultimately lead to malignancies in the cells [11].
Gene expression analysis have been extremely useful for investigation of human phenotypesand diseases. Analysis of variation in this fine-tuned flow of genetic information aims todeduce how aberrant gene expression and disruption in the regulatory machinery may leadto malignancies. Many human diseases are manifestations of disordered genetic interplayin specific tissues. Genes that may cause diseases would be expressed at abnormal levelsin the tissues where these defects cause pathogenesis. The underlying complexity of ge-netic regulation is highly embedded in natural regulation of the entire organism [12]. Geneexpression analysis investigates correlations among expression levels between genes and isthus a great tool to examined genetic interplay in detail. As quantitative measures, geneexpression levels are well suited for co-expression analysis, where their correlated expressionlevels characterize the underlying patterns of transcriptional regulation. Juxtaposition ofco-expression analyses from gene expression measurements originating from cells of differentnature, enables comparison of the regulatory schemes and expression patterns descriptiveof each condition and facilitates contrasting properties from each condition. Comparingco-expression profiles based on gene expression measurements from healthy and sick per-sons thus allows for the investigation of abnormal events related to transcription, and whichdifferentiated behaviour is likely to drive damaging processes to the system. A systems’ bi-ology approach thus provides insight into disease-related processes and their characteristics.This knowledge may guide better therapeutic approaches and the development of predictiveand preventative medicine [13].
1.2 Aims and objectives of this thesis
This thesis has two underlying goals that are complementary to each other. The first isto get acquainted with and employ the established CSD-framework to perform a detaileddifferential co-expression analysis. This part focused on using gene expression measurementsobtained from The Cancer Genome Atlas of patients diagnosed with thyroid carcinoma tocontrast underlying cellular processes by comparing the co-expression correlations with thoseof normal persons. The objective was to perform an in depth investigation of central playersand the underlying mechanisms these were involved in characteristic of thyroid cancer. Inaddition, network analysis tools were employed to identify network neighborhoods thatcould represent disease modules which could reveal novel patterns driving the pathogenicitywithin the transcriptomic system in thyroid cancer.
3
1.2. AIMS AND OBJECTIVES OF THIS THESIS
The second part aimed to contribute to the the CSD-framework with method development.This section aimed to integrate several tools of bioinformatics and systems biology in acongruent pipeline to produce reliable information from experiments across different databases. Expanding the range of alternative similarity measures forming the basis of differ-ential gene co-expression analysis was an intriguing quest which motivated development ofefficient ways to incorporate new similarity measures into the CSD-framework. This pipelineneeds to manage data-sets across cohorts, formats and programming languages. The influ-ence these had on the results needed to be examined as well, in order to evaluate whichpotential benefits to the original CSD-framework these provided.
This master thesis has two major research goals that will be reflected in the presented workand the organization of the thesis paper. These are as follows:
1. Perform a comprehensive study of differentially co-expressed genes between healthyindividuals and those that suffer from thyroid carcinoma, discover relevant gene mod-ules, and explore interesting co-expressed genes that represent novel candidates forprognostic genes of thyroid cancer.
2. Integrate several tools to improve the current CSD-framework and inspect the qual-ity of those. I intent to develop work-flows for application of alternative similaritymeasures and to evaluate their limitations and potentially important benefits.
4

Chapter 2
Theoretical background
This chapter will introduce the topics investigated and the theoretical foundations of meth-ods utilized for data analysis in this thesis. Most of the topics explained in this sectionwill provide the basis for understanding the strategies employed - especially for performingdifferential gene co-expression analysis, which is the main agenda of this master thesis.
Concepts from systems and network biology are mostly obtained from two books, Networkscience by Albert Lázló-Barabási [1] and A first course in systems biology by Eberhard o.Voit [2]. The reader is encouraged to look into these works for more detailed information.The CSD method for inferring differential gene co-expression networks developed by Voigtet. al. [3] is the first description of this method and the source of the information providedabout it here.
2.1 Thyroid cancer
Thyroid cancer is a common endocrine malignancy, which has one of the highest increasesin incidence globally among all cancer types [14]. Thyroid cancer incidence has persistentlyincreased on a global scale. Papillary thyroid carcinoma is reported to be the most commontype of cancer to have a documented increased incidence rate [15]. The most commonhistologically different thyroid cancers originate in either follicular or parafollicular cells.Papillary thyroid carcinoma (PTC) and follicular thyroid cancer (FTC) are the two typesof well-differentiated thyroid cancers. PTC and FTC has the highest prevalence among thethyroid cancers [16]. PTC lesions are quite varied and can occur anywhere in the thyroidgland. Typical lesions are 2-3 cm in average size, are firm and have an invasive appearance.The nuclei of cells with PTC are typically clear and oval, are larger and contain morehypodense chromatin than normal and overlap with another [17]. The cancer tumoursmay invade the lymphatic system and lead to multifocal lesions and regional lymph nodemetastases [18]. In the cases where the thyroid cancer invades the vascular system, it isassociated with a more aggressive disease and higher incidence of recurrence [19]. FTC
5

2.1. THYROID CANCER
differs from PTC by not sharing these nuclear features, and is typically characterized bypresence of capsular or vascular invasions. FTC is more likely to spread to other tissuesbecause it more readily invades blood vessels [20].
Among the differentiated thyroid cancer types, papillary thyroid carcinoma has increasedthe most, approximately 3-fold between 1988 and 2002. Almost all of this rising incidenceconsisted of cancers measuring 2 cm or smaller [21]. The treatment of differentiated thyroidcancer normally includes risk assessment by neck imaging followed by surgery to removetumor tissue. For non-metastatic tumor nodes, a lobectomy has been shown to be associatedwith long-term survival [14].
Genetic studies of thyroid cancer have shown that many types harbour genetic changes af-fecting signaling pathways, which shift the correct regulation of growth and cell proliferation[22]. Several factors affect the risk of developing thyroid cancer, such as dietary iodine andexposure to radiation. Radiation has been shown to induce apoptosis, cell cycle arrest andcancer in the thyroid gland [23]. Thyroid cancer, as well as other thyroid endocrine diseases,may arise from radiation-induced damage to thyroid follicles. Nuclear bombs have causedthyroid cancer in survivors of the bombing in Japan during World War II. After the nuclearplant explosion in the former USSR nuclear radiation lead to thyroid cancer in utero andin small children.
The tumor suppressor genes p53, encodes a family of proteins involved in thyroid cancerdevelopment, and are targets for novel therapeutic strategies [24, 25] Recent research hasalso shown that some specific genetic variations are related to an early onset of autoimmunethyroid diseases, indicating that the immune systems plays an important role in thyroiddisease pathology[26].
Tumor gene expression profiling brings new insight into cancer pathophysiology and con-tributes to better understanding the molecular basis of the malignancy. Often, many func-tions in the cancer cells are similar, if not equal, to normal cells of the same tissue. Whenmost cellular properties are retained, discriminating among cancerous and normal tissuebecomes a difficult task. This makes both discovery and proper diagnosis of the cancerchallenging. Thyroid cancer, especially, is expected to be less effectively distinguished fromnon-transformed tissue compared to other malignant tumours because its gene expressionprofile lacks obvious carcinogetic characteristics [27]. An additional complicating aspect ofthyroid carcinoma is that carcinogetic cells are usually intermingled with normal cells, sothat quantitative associations may vary even inside the same tumour tissue. Although thy-roid carcinoma is clinically heterogeneous, some studies of micro-array expression profileshave found distinct clustered profiles [28], motivating further studies of the characteristicthyroid cancer expression profile.
6

2.2. MICROARRAY TECHNOLOGY
2.2 Microarray technology
Cells constantly need to regulate their gene expression levels in order to meet the demandsof an ever-changing environment. Different challenges are met by transcription of a genewho’s gene product has the desired function. The cell responds to external signals by lettinginformation flow from its peripheral signal receptors into its nucleus, where a transcriptionalregulator mediates the appropriate is translated into a cellular response. This genetic re-sponse is in the form of messenger RNA (mRNA). The genetic transcripts leave the nucleusso that they may perform various tasks in the cell, either as they are or after being trans-lated into protein [29]. To ensure optimal quality and functionality of the cell’s machinery,specific genes are transcribed so that new molecules can replace old ones and the correctamount of each gene product is available. The transcripts thus regulate which processes aretaking place and tells us a great deal about what the cell is responding to [30].
The motive for developing the microarray was to create a technology that could take asnapshot of the transcriptional status in a cell at a given time to frame which mRNAs havebeen made and at which levels. The aim of the assay is to quantitatively evaluate RNAabundances. Because they are key intermediates between genes and gene products, theyare very informative. This is referred to as the cell’s transcriptome and is measured byreverse transcriptions of cell sample mRNAs into cDNA molecules with the simultaneousincorporation of marker molecules - either with radioactive or fluorescent labels. These areapplied to a microarray, a membrane on which probes for the DNA-sequences of the organismare attached. These probes are immobilized at fixed positions and allow multiple samplecDNA molecules from the cell to hybridize to each probe, for quantitative measures foreach gene of interest. Sample cDNA only hybridizes to the array fragment if the sequencesare complementary, and detection of label intensity for each probe spot thus makes thistechnology an accurate assay of gene transcript quantification for living cells. These arraysare commonly used to measure the gene-expression patterns of human cells from varioussick tissues. The information can thus be used to study the transcriptomic manifestationsof diseases [31, 32].
2.3 RNA sequencing
High-throughput screening of patients is a process generating large quantities of informationof diverse types. It is employed in both basic and applied research to facilitate analysis ofgenes and their function, global genomic expression and regulation [33]. For an integrateddata analysis, data of good quality is needed. Hybridization-based micro-arrays are effectivein providing an expression snapshot of known genes and have been a robust and reliablemethod for expression analysis for many years. They are, however, insensitive to spliceisoforms and are less suited to discover unknown genes, and may thus not capture genesthat may in fact be significantly associated with a specific phenotype. The development of
7

2.3. RNA SEQUENCING
next-generation sequencing provided a deeper and more quantitative view of gene expression,alternative splicing and allele-specific expression [34]. Gene co-expression networks can bereconstructed from gene expression data from micro-array or RNA-sequencing technology.RNA-sequencing enables more comprehensive analysis of the transcriptome and has thusbecome widely used for generation of gene expression data in recent times [35].
Next-generation sequencing of mRNA is termed RNA sequencing (RNA-seq) and is a tech-nique for detailed transcript identification and quantification. RNA-seq data reflect a bio-logical systems repertoire of RNA molecules at a given time. For the well-annotated genomeof Homo Sapiens, all transcripts may be mapped to a genetic region directly. The number ofreads mapping to the target gene are measured with the read count, which is linearly relatedto the transcript abundance [36]. The method typically consists of isolation of RNA extractfrom a cell or tissue population, converting the mRNA to cDNA with reverse transcriptases,preparing and sequencing this cDNA-library on a sequencing platform. RNA-seq relies onshort sequenced nucleotide reads mapping to a genome assembly. Illumina has dominatedthe sequencing industry with its sequencing by synthesis approach, in which clonal ampli-fication of molecules enable quantitative measures of expression with very low sequencingerror rates. Illumina sequencing has advanced greatly and is now able to sequence over500 base pairs from the same mRNA-fragment [35]. Compared to micro-arrays, it has beendemonstrated to identify multiple more true positive differentially expressed genes betweendifferent tissues[33].
RNA-seq offer many beneficial aspects to the expression technology. One of the biggestadvantages by using RNA-seq it that the expression of a huge amount of genes can bequantified, even some 70 thousand non-coding RNAs, recently annotated genes encodinglong interfering non-coding RNA-molecules (lincRNAs). Because lincRNAs may have a rolein human diseases [37] and cancer [38], using RNA-seq data offer a possibility to include thesein the analysis. Moreover, RNA sequencing provide major benefits for genetic accuracy. Thistechnology has very high resolution and higher accuracy for transcripts of low-abundancy[39]. It can distinguish genetic paralogues [40] and detect detect structural variations inthe genome that was not previously possible, like genetic fusions and alternative mRNAsplicing events [41]. However, determination of expression levels for different splice variantsof the same mapped exon may remain challenging, limiting the co-expression analysis onsplice-variant level. To perform co-expression analysis with splice variants, one needs todistinguish all possible splice variants for one gene instead of mapping these together. Whilethis method preserves information about the co-expression of different transcripts encodedby the same gene, the size of the square co-expression data matrix and subsequently theneeded computational capacity drastically increases. The most common practise for RNA-seq co-expression networks is therefore to merge the expression data for overlapping geneisoforms and construct a co-expression network at genetic resolution [11]. Co-expressionnetwork reconstruction from RNA-seq data have higher functional connectivity if there areenough samples, and attain higher quality compared to micro-arrays with same number ofsamples mainly when the sequencing depth cut-off is 10 million reads per sample [42].
8

2.4. RNA-SEQ DATA PROCESSING
2.4 RNA-seq data processing
Gene expression quantification data obtained with RNA-seq needs further bio-informaticprocessing. Data needs to be both aligned and assembled. Firstly, the mRNA expressiondata needs to be aligned to the genome of the organism of which the gene expression ismeasured. All nucleotide sequences of the mRNA raw reads generated with RNA-seq arecompared to the sequence of the annotated genome and mapped to a region if the sequencesare identical. This process converts unaligned reads to all aligned reads [43].
Quality control is performed to assess potential issues in the expression data. To mention afew, FastQC, RSeQC, and QoRTs are all excellent tools for QC that detect possible defectsor low quality in the read data. FastQC has a extensive range of control measures, andmay also be used to obtain data on the prevalence of splicing effects [44]. Data is alignedto a reference genome for a given organism in the form of a GTF-file. These files detailedinformation on the genetic material the organism expresses, like its position in the genomeand which strand of the DNA-molecule it resides on. One of the most widely used toolsfor RNA-seq read mapping is STAR [45]. This tool is compiled with a gcc c++ compiler.It uses a large amount of memory but can map reads around 50 times faster than otherequivalent programs. Also, it is readily used to detect novel splice variants [11].
Second, after raw read alignment the mapped reads need to be quantified at each geneticregion. Aligned genomic data files, typically .bam- of .sam-files, are further processed withread-counting tools to produce a precise quantification of expression levels at each geneticloci. Gene expression quantification data requires a suitable set of data processing tools[43]. For quantification HTseq [46] is a very common tool. It is a Python framework forhigh-throughput transcriptome profiling data. This tool assigns processed read counts basedon aligned reads from STAR, and produces RNA-seq expression level quantification data. Agreat benefit of using HTseq is the application of its pre-processing tool which is especiallysuited for differential expression calling. In this case, the reads are not normalized, becausenormalized transcript values should be used only within the context of the entire genetic setand not across experiments or cohorts [47]. Instead, expression levels are in counts-format,which is the raw number of reads aligned to each gene. This makes expression data incounts-format well suited for subsequent differential analysis [47].
2.4.1 Normalization methods and expression level modelling
RNA-seq data is made up up gene counts aligned to a genome which needs to be corrected forpossible sources of measurement biases. These can be positive correlations between gene sizeand read count and variable sequencing depths [48]. Read counts sampled from a fixed setof genes would follow a multinomial distribution, originally approximated by the Poissondistribution [49] but has recently been replaced by the negative binomial distribution toaddress the underestimation of variation with Poisson [50].
9

2.5. NETWORK THEORY
Count-based methods for modeling expression data with the purpose of identifying differ-entially expressed genes is challenged by potential dependence between samples and over-dispersion. Expression data generated with RNA-seq have been modeled with Poissonmodels, which is appropriate for technical replicates. In many cases there is over-dispersionpresent in the data, which has lead to the frequent use of the negative binomial model forgene expression patterns [51].
2.5 Network theory
Network science is the most important theoretic foundation for understanding models ofcomplex biological systems. Modelling biology with networks is a structural and quanti-tative representation of the system. These computational models may describe processesat all cellular levels; gene regulation, signal transduction, entire energetic metabolism andeven complete tissues or whole organisms [52]. Perturbing the network to simulate variouschallenges the system may encounter shows a great deal about its properties that may onlybe elucidated when the system is described as a whole. Visualizing the complex system as anetwork graph is usually done by giving each component connections to each other based ontheir level of interaction, each component is represented with a node and their connectionsare edges between them [1].
Yet, most important for the success of employing networks in biology, is that it enablesmathematical modeling and computations on a system too large to draw and inspect withone’s eyes. In the field of graph theory, many tools have been developed to extract importantproperties of networks, so that even those containing thousands and billions of connectionscan be investigated. Characterization of network properties and the effect these have on thebiological system may elucidate aspects of it not available through other forms of analysis.Network science has thus become invaluable in the desire of identifying the true governingprinciples of complex biological systems in nature [2].
The principal representation of a network is with a graph, in which nodes may be connectedby edges and edges may exist only between a set of nodes. A network typically consists of acollection of interacting elements tied together by the elements’ pair-wise interconnectivity.The set of items in the networked system represent the functional components and edgesbetween them represent an existing connection between these components. When represent-ing a dynamic system as a network its structures are defined by the components, the nodes,independent of their interpretation. The number of nodes N in the network is referred toas its size. The number of edges in the network, L, is the total number of interconnectionsbetween the nodes [1]. Fig. 2.1 shows and example of a simple network with four nodesconnected by four links.
10

2.5. NETWORK THEORY
Figure 2.1: The figure shows a small network of four nodes and four links, in which the the topone shows four proteins and their connections and the bottom is a simple graph representation ofthe network. Taken from [1].
Random graphs are graphs artificially created by making a set of nodes and randomlyassigning edges between them based on a probability of connection p. Such random networkmodels were first studied by mathematicians Pál Erdős and Alfréd Rényi and are calledErdős-Rényi networks. Many forms of network characterization are performed by comparinga real network to a artificial network created with a random network model of a similarsize[1].
2.5.1 Adjacency matrix
In its simplest form, a network can be summarized in an adjacency matrix if it is fullyspecified. The adjacency matrix is a two-dimensional matrix given by all its componentsand contains the attribute of all pairwise combinations. In the adjacency matrix Aij , eachelement aij quantifies a connectivity between the components i and j. The elements in thematrix hold information about whether or not there is a connection between the elements,thus represented as an edge in the network.
For an undirected network, Aij is symmetric, e.g. aij = aji. The opposite is true for directednetworks, in which the edges between nodes are directional and Aij may be unsymmetrical.Networks can differ in an additional way, they can take on either binary values or weightedvalues. A weighted network have weights assigned on it’s edges, in this case the elementsof the adjacency matrix may take any value. A common procedure when constructingnetworks from a weighted adjacency matrix is to use a hard threshold, as in Eqn. 2.23.This transforms a weighted Aij into a matrix with binary values describing whether theelement aij is over (1) or under (0) the required threshold. Conversely, the matrix elements
11

2.5. NETWORK THEORY
of unweighted networks have either 0 or 1 as values. The concentrated way of representinga system permits many different methods of linear algebra analysis. In this thesis, networkswill be generated as results from the method development and application of software to thedata under study. Unless otherwise stated, networks will be unweighted and undirected.
In biological networks, nodes in the network represent molecular or biological entities andare connected by edges if they have a common property or a shared connection. Theseconnections link together nodes if they interact in some way, like molecular interactionsaffecting each other’s properties and activity, enzymes responding to the same signal orchemical bonds tying together molecules into large complexes. The network is a useful andversatile tool that can describe a wide variety of structures, and becomes a map describingbehaviour in different situations and the interplay of its components [1].
Network representation of complex systems have been applied to a wide variety of dis-ciplines. Everything from gene regulation, protein-protein interactions and kinetics, thecomplete metabolism of various organisms, cell-to-cell signalling in all ranges of single-celled networks to multi-cellular tissue networks. By reconstructing the biological systemin a network, it’s connectivity and structure can be used to answer questions about ability,robustness and the course of information flow between its components. The representa-tion of a dynamic biological system in a static graph is advantageous because of its degreeof simplicity compared to a temporally changing network of fully regulated dynamic sys-tems. Analysis of the biological network can then be performed by applying graph theoreticmathematics to analyse the system’s structural features [53].
The elements of the adjacency matrix can represent many different entities in differentsettings, be it genes, micro-RNAs, proteins or neurons in the brain. A common assumptionis that the collection of elements within any network representation are of identical type inrespect to the system. Homogeneous elements represents a common format of informationin the system, encoding various types of interactions. These can be co-expressed genes,transcriptional regulators, enzyme complexes or synaptic links. In many cases, it is thereforepractical to study these independently on a detailed level. But networks may also consist ofmultiple such layers, in order to create a fuller description of information flow in a biologicalsystem.
2.5.2 Node degree
An important characteristic of a node is its degree, denoted ki. The degree representsthe number of associated edges connected to the given node in undirected networks andoppositely, in directed networks, the degree of a node will be defined as either in-degree orout-degree [2].
12

2.5. NETWORK THEORY
The average degree in a network is defined as
〈k〉 =inf∑k=0
kP (k) (2.1)
where pk is the proportion of nodes with degree k, given by the degree distribution, seeequation 2.2 below.
2.5.3 Degree distributions
The distribution of the node degrees in a network is an important characteristic [2]. Thedegree distribution P(k) is a measure of node degree value frequencies in the network as awhole. P(k) is given by
P (k) = mk/m (2.2)
where m is the total number of nodes and mk is the number of nodes with degree k. Itis a function that shows the proportion of nodes having degrees on a scale of degrees k,from zero to the highest possible degree of that network. The sum of all values of P(k)equals one. This distribution thus describes the probability that any random node will havedegree equal to k [1]. For random graphs the degree distributions usually has a narrow bellshape, given by its binomial degree distribution with low degree of variance. In this case,the majority of nodes in the graph have a degree that is close to the average node degree[2].
The exact degree distribution of Erdős-Rényi (random) networks,
p(k) =(N − 1k
)pk(1− p)N−1−k (2.3)
depends on the probability that k links are present, pk, the probability that the remaining(N − 1 − k) links are not present, (1 − p)N−1−k, and the total number of combinationsa number of k links may be selected from the total N − 1 links a node can have,
(N−1k
).
Because real networks are sparse, the average degree is much smaller than number of nodes,so random network models approximate this trait by the Poisson distribution for when〈k〉 << N . This degree distribution is given by pk = e−〈k〉 〈k〉
k
k! , and only depends on theparameter 〈k〉, which makes it a preferred formula for many calculations [1].
In networks describing real biological systems, it has been found that the degree distributionvary widely. It may follow a straight line when plotted on a logarithmic scale. This describesa system in which a very limited number of nodes have a large degree, few have a degreeclose to the average, and most will have very low degrees. Here the P(k) follows a power-lawdistribution,
P (k) = k−γ (2.4)
in which the slope −γ is negative. A network whose degree distribution show these charac-
13

2.5. NETWORK THEORY
teristics is referred to as a scale-free network, because there exist no "typical" node degreeand a common "scale" of degree among genes is lacking.
One interesting aspect of this general scale-free property in most kinds of real networks isthat it demonstrates that biological networks are not organized randomly [3]. The scale-free property in real networks has been found to emerge as a result of a process calledpreferential attachment, which entails that the number of nodes is not fixed, and any newnode is added will have links with preference to nodes that already have many neighbors [1].This growth mechanism, which is well applicable to a genetic network are added by geneticduplication and functional divergence, will typically lead to a γ that may range from smallvalues towards infinity [3].
In many networks, both those representing biology and random graphs, there are numerousnodes with relatively low number of neighbors while some of them have many. Nodes witha disproportional huge number of links are termed hubs. The presence of hubs is one ofthe major traits that distinguish real scale-free networks from random networks. In fact, ina scale-free network the probability of a hub being present is several orders of magnitudehigher than in a comparable random network [1].
2.5.4 Paths and betweenness centrality
Distances in a network are measures of how far away its components are from each other.The distance between two nodes, called path length, is a relative measure of how many linksa path between the pair contains. There are often many alternative paths between twonodes in a network. The shortest path d is defined as the path containing the fewest linksthat connect the nodes in a pair. In undirected networks, dij = dji. Oppositely, the longestpath between any two nodes of a network is termed the network diameter [1].
Betweeness quantifies the number of shortest paths between node pairs of a network thatgo through a link (i, j). A link with high betweenness is a link through which a lot ofinformation flows between nodes located further away from each other [1]. When looking ata specific node, the fraction of shortest paths that pass through it defines the betweennesscentrality of the given node. It is defined as
CB(n) =n∑ij
dij,ndij
(2.5)
for all possible pairs of nodes ij from all the N nodes in the network, where dij is thenumber of shortest paths between nodes i and j and dij,n is the number of shortest pathsgoing through node n, assuming i 6= j 6= n [54]. Node betweenness centrality thus representshow important the node is for the spread of information through the network and reflectwhich role the node plays in controlling associations between distant nodes [55].
14

2.5. NETWORK THEORY
2.5.5 Eigenvector centrality
Like the betweenness centrality measures how important a node is for the shortest pathsthrough a network, the eigenvector centrality measures a node’s importance by accentuatingnodes with connections to other important nodes. A node’s eigenvector centrality is thus ameasure of how many neighbors it is linked to, where each link to a neighbor is weighted bythe centrality of this neighbor node.
Using the adjacency matrix A = (ai,j), the eigenvector centrality xn of node n can becomputed. It is defined as:
xn = 1λ
∑k
ak,ixk (2.6)
where λ 6= 0 is a constant. In matrix form this is: λx = xA. The eigenvector centralityvector x is identical to the left-hand eigenvector of A associated with the eigenvalue λ [56].
The eigenvector centrality score for node n is computed by determining the principal eigen-vector of each node using the m×m adjacency matrix Aij , given by [56]:
CEV (n) = a1ix1 + a2ix2 + ...+ amix1 (2.7)
As this value is computed, if a node has a connection to a node of high eigenvector centralityscore, this high-scoring node will contribute more than the low-scoring nodes to the eigen-vector centrality of the first node. The resulting centrality measure a node’s "influence" inthe network [57].
2.5.6 Clustering
In a network the edges may be distributed differently between local regions. Computingand comparing properties of local and global edge patterns can provide meaningful informa-tion. These structural properties of one network neighborhood may vary greatly from otherneighborhoods in the same network. Some neighborhoods are so tightly interconnected withthemselves that they forms a clique almost entirely separated from the rest of the network.Quantification of such local structural properties of the cliquishness of a neighborhood ismeasured by the clustering coefficient [58].
The local clustering coefficient was first defined by Watts and Strogatz, and represent thelikeliness that two network nodes which both share a common neighbor are also connectedto each other, forming a closed triangle [59]. In a network neighborhood where a vertex(node) n has a total of kn neighbors, there may be found a maximum of (kn(kn−1)/2 edgesbetween these vertices. For a node n in an undirected network, the clustering coefficient
Cn = kn(kn(kn − 1))/2 = 2kn
kn(kn − 1) (2.8)
where k is the degree of node n, defined in Cn ∈ [0, 1].
15

2.5. NETWORK THEORY
As long as there are a significant number of nodes with shared neighbors that are alsoconnected to each other, the clustering coefficient for a node in this cluster will be non-zero and increase with the number of closed triangles it takes part in [60]. Cn denotes thefraction of all possible links that actually exist in a specific local region of the network ofall of the theoretically possible ones. If this maximum number of edges between nodes ina cluster really are present, all n neighbors are connected to each other. In this case theclustering coefficient becomes one, because all links allowed in the neighborhood do exist.The clustering thus is a measure of the extent to which nodes are connected to each otherin a closed clique [59].
For a complete undirected network, the average clustering coefficient is the average of allclustering coefficient of the network nodes,
C = 1N
N∑i=1
Cn (2.9)
where N is the number of nodes in the network the clustering is averaged over [58]. Theclustering coefficient will depend on interconnectedness in various cliques, and thus somewill contain interconnected nodes with high clustering coefficients and others lower.
2.5.7 Network assortativity
Assortativity in a network is defined as the correlation of degree between connected nodes.When the majority of nodes of high degree tend to be connected to other nodes of highdegree, the network has assortative properties. In assortative networks, hubs associate withother hubs and avoid low-degree nodes. If there is no correlation between the degree of a nodeand the degree of its neighbors, the network does not show any assortative characteristics.Conversely, if there is a tendency of hubs to avoid connecting to other hubs, so that thenetwork mainly consist of hubs connected to many small-degree nodes, the network hasdissassortative properties. For any given node to randomly choose the nodes it links to, theprobability of that nodes of degrees k and k′ in a network with L links is given by
pk,k′ = kk′
2L . (2.10)
Assortativity is thus a measure of how much the number of links between node i of degreek and node j of degree k′ deviate from Eq. (2.6). The trend of node assortativity in thenetwork as a whole is found in eij , the degree correlation matrix. For a randomly chosenlink in the network the degree correlation denotes the probability of then observing a linkbetween a node of degree i and a node of degree j [1].
This gives a degree correlation function and its approximation:
kn,n(k) = 1ki
N∑j=1
Aijkj ≈ akµ (2.11)
16

2.6. SIMILARITY MEASURES
where µ < 0 is a dissassortative network, µ = 0 is a neutral network, and µ > 0 is anassortative network.
2.6 Similarity measures
The elucidation of functional relationships is the overall goal of differential co-expressionanalysis of transcriptional data between conditions. From matrices of expression data, co-expressed genes are identified and grouped together. This bundling is produced by assigningrelationships between genes based on a measure of similarity in their expression levels acrossmultiple samples. The chosen similarity measure can have a large impact on the results of theanalysis. Often genetic relationships may be measured with the Pearson or Spearman rankcorrelation measures. As an extension to these methods, similarity measures that are non-linear have also been employed in co-expression recently. The information-theoretic measuremutual information has been used to detect non-linear relationships between data sets thatare not manifested in correlations [61]. Since this thesis later on exemplifies concepts ofdata analysis using gene expression measurements, genes are thought of as objects and maylater be referred to as random variables of a data set.
The ability to infer real and meaningful relationships between genes in a complex networkdepends on the correlation detection methods used to calculate the degrees of associationsbetween variables. Inherent to all co-expression networks, connections between genes mustbe based on a appropriate similarity measure. Based on the same set of expression data,network inference on the basis of different similarity measures may lead to very differentgenetic relationships [62]. Different similarity measures may elucidate various regularities inthe transcriptomic data: simple positive correlations may identify patterns of co-regulatedgenes, correlation also including negative values may deduce patterns of antagonisticallytuned processes, and mutual information may detect non-linear more complex genetic rela-tionships between genes. Choosing an appropriate similarity measure thus becomes impor-tant for the success of the network inference [63].
Given two real-valued sequences of measurements x = {xi : i = 1, ..., n} and y = {yi : i =1, ..., n} the similarity is a measure of dependency between the sequences. It is defined asa metric of similarity producing a higher value as the dependency between the comparedvariables increases if it satisfies the following criteria:
1. Limited range: f(x, y) ≤ 1 for all x, y 6= 0
2. Reflexitivity: f(x, y) = 1 if an only if x = y
3. Symmetry: f(x, y) = f(y, x)
A similarity measure of 1 is the largest possible value representing perfect similarity betweenthe variables, and a similarity of zero is the lowest possible value and represents the caseof no similarity. Hence, they are directly applicable as values of the adjacency matrix Aij
17

2.6. SIMILARITY MEASURES
of which each element aij hold information of associations between variables i and j. Innetworks it is interesting to look at all pairwise similarities between all combinations ofcomponents, denoted in the similarity matrix S = [fij ]. For a gene-expression matrix
Xij =
x1,1 x1,2 ... x1,n
x2,1 x2,2 ... x2,n
... ... ... ...
xm,1 x2,2 ... xm,n
with m variables and n observations the similarity matrix Sij is defined as
Sij =
f(x1,1,i, x1,1,j) f(x1,2,i, x1,2,j) ... f(x1,m,i, x1,m,j)f(x2,1,i, x2,1,j) f(x2,2,i, x2,2,j) ... f(x2,m,i, x2,m,j)
... ... ... ...
f(x1,m,i, x1,m,j) f(x2,m,i, x2,m,j) ... f(xm,m,i, xm,m,j)
where reflexivity of the similarity metric f(x, y) implies that the diagonal of Sij is 1 andit’s symmetry implies that all entries in the matrix are symmetric over the diagonal axis,assuming all entries in X are non-zero.
To infer negative correlation, a dissimilarity metric is utilized for measuring opposing trendsin observations between random variables. Here, a strong negative correlation representsthe case where two variables are increasing and decreasing in value opposite of each other.A high negative correlation results from an increase in value for one variable indicatesa reduction in the other variable. A low negative correlation means that if one variableincreases there might be some degree of reduction in the other, but not substantial. Thedissimilarity is close to zero when two variables become less dependent, and except frombeing defined in the number space [0,-1] it satisfies the same properties as the similaritymetric [64].
Statistical correlation is a measure of dependence between two variables. It gives two piecesof information: The strength of the relationship and the direction of the relationship. Thecorrelation value lies on a continuous scale between -1 and 1, any value close to either of theselimits indicate strong correlation in any of the two directions. Correlation-based similaritymeasures are attractive candidates when dealing with large amounts of data because theyare easily calculated and because the value can also be negative, it is able to distinguishbetween positive and negative relationships [65].
Comparison of high trough-put data by similarity measures to infer biological causality isnot a straightforward task. Often there are a large number of quantified analytes and smallsample sizes, so pairwise associations become spurious. This makes a true biological sig-nal hard to identify. The probing of statistical associations found with various similaritymeasures needs to follow formal methods of causal inference [66]. High similarity of expres-sion between two genes is formalized by a similarity metric, either by measuring linear or
18

2.6. SIMILARITY MEASURES
non-linear dependence. To investigate interacting molecules, which are gene products, thegene expression profiles for a common set of genes between two compared conditions arecompared - the guilt-by-association heuristic assumes two gene products share regulatoryregime if they have similarities in expression profiles [67]. Similarity thus aims to identifyco-regulation among genes because it has been shown to indicate functional similarity aswell [68].
2.6.1 Spearman rank correlation coefficient
In co-expression studies, perhaps the most widely used similarity metric is the Pearson cor-relation coefficient which measures the degree of relationship between two linearly relatedvariables [65]. A similarity measure that relates to the typical Pearson correlation coeffi-cient is the Spearman rank correlation. This is calculated by replacing the observationsby their ranked values and then computing the Pearson correlation coefficient of the ranks.Spearman’s rho is given by
ρij = cov(R(xi), R(yi))σR(xi)σR(yi)
(2.12)
where R(xi) and R(yi) represent the ranks of variables xi and yi, cov denotes the covariance,and σ is the standard deviation [69]. This is equivalent to calculating
ρij = 1− 6∑ni=1[R(xi), R(yi)]2
n(n2 − 1) (2.13)
This metric does not carry any assumptions about the distribution of the variable observa-tions due to the needed conversion of all observations for each variable into ranks, but iscomputationally slower than the Pearson correlation [70]. Nevertheless, because outlier val-ues for a random variable will bias the correlation coefficient when this variable is comparedto others, minimization of spurious outcomes is important. Spearman’s rank correlationcoefficient is less sensitive to outliers within data than the Pearson correlation coefficient.Spearman’s correlation measures the extent of a monotonic relationship between two vari-ables with less sensitivity to noise and occlusion [64].
2.6.2 Mutual information
Detection of genetic relationships based on mutual information (MI) can be done withestimation of the entropy between two genes. Computing mutual information between theRNA expression pattern for all gene pairs is done by estimation of the entropy of theexpression pattern for each gene pair individually [71]. This produces a symmetric matrixof mutual information for all possible gene pairs in the data-set.
Mutual information is an information-theoretic measure that quantifies a statistical depen-dence between two random variables. Entropy measures how much information one canhave about one variable, given information about the other. Given entropy knowledge of
19
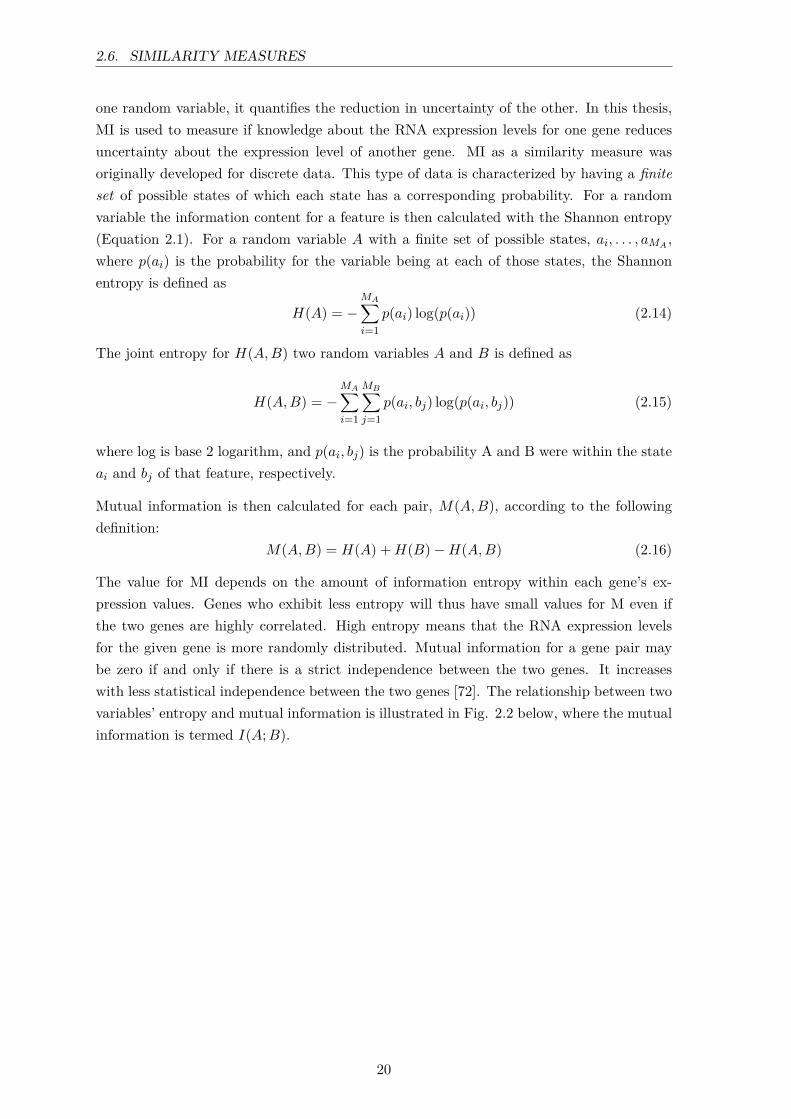
2.6. SIMILARITY MEASURES
one random variable, it quantifies the reduction in uncertainty of the other. In this thesis,MI is used to measure if knowledge about the RNA expression levels for one gene reducesuncertainty about the expression level of another gene. MI as a similarity measure wasoriginally developed for discrete data. This type of data is characterized by having a finiteset of possible states of which each state has a corresponding probability. For a randomvariable the information content for a feature is then calculated with the Shannon entropy(Equation 2.1). For a random variable A with a finite set of possible states, ai, . . . , aMA
,where p(ai) is the probability for the variable being at each of those states, the Shannonentropy is defined as
H(A) = −MA∑i=1
p(ai) log(p(ai)) (2.14)
The joint entropy for H(A,B) two random variables A and B is defined as
H(A,B) = −MA∑i=1
MB∑j=1
p(ai, bj) log(p(ai, bj)) (2.15)
where log is base 2 logarithm, and p(ai, bj) is the probability A and B were within the stateai and bj of that feature, respectively.
Mutual information is then calculated for each pair, M(A,B), according to the followingdefinition:
M(A,B) = H(A) +H(B)−H(A,B) (2.16)
The value for MI depends on the amount of information entropy within each gene’s ex-pression values. Genes who exhibit less entropy will thus have small values for M even ifthe two genes are highly correlated. High entropy means that the RNA expression levelsfor the given gene is more randomly distributed. Mutual information for a gene pair maybe zero if and only if there is a strict independence between the two genes. It increaseswith less statistical independence between the two genes [72]. The relationship between twovariables’ entropy and mutual information is illustrated in Fig. 2.2 below, where the mutualinformation is termed I(A;B).
20

2.6. SIMILARITY MEASURES
Figure 2.2: Diagram showing the mutual information and entropy. The figure shows the rela-tionship between the two variables A and B and their entropies H(A|B) and H(B|A). The mutualinformation I(A;B) is the sum of the individual entropies minus the joint [2].
Entropy is computed using discrete probabilities. But estimation of mutual informationfor random variables that are not discrete is not so simple. This is the case for geneexpression data, which can take any value on a continuous scale given by the experimentalsetting and data processing programs determining any arbitrary unit of measured expression.Because the equations for estimation of entropy assumes knowledge about probabilities forthe variables independently and the joint distribution (Eq. 2.1), for continuous data theseunknown probability distributions have to be estimated.
Because mutual information is a measure based on entropy, it can largely be affected bysmall fluctuations in expression measurements because of biological noise. Because thissimilarity measure was developed for discrete data, continuous data is usually partitionedinto discrete intervals. To ensure that estimations of mutual information is not confoundedby biological or measurement randomness and noise, the continuous data is often dividedinto a large set of bins. Then the probabilities are estimated for each interval the expressiondata is binned to based on a computed relative frequency of data points in each of thesebins;
p̂(ai) = 1N
∑k
θi(xu) (2.17)
and the joint probability is calculated analogously with a two-dimensional histogram. Thisis the most straightforward approach. Because each data point is drawn from the datawithout replacement and assigned to a bin, noise in the data will affect which bin eachdata point is assigned to. Another limitation to the binning approach is referred to as thefinite size effect, stating that MI estimated from a finite set will fluctuate around a highervalue than the ’true’ value [73]. This results in approximation logarithms of probabilities bylogarithms of frequency ratios, and an estimation of I(X,Y ) by Ibinned(X,Y ). This methodis thus prone to be biased by the arbitrarily chosen borders of each bin and over-estimatingthe MI [74].
Instead of binning the data an alternative method to estimate the entropies can be applied
21

2.6. SIMILARITY MEASURES
instead. This method is based on k-nearest neighbours statistics and is adaptive, beingincreasingly accurate for data sets of higher sample size. This method uses the averageranked distance to the k-nearest neighbour to estimate H(A), H(B) and H(A,B) separatelyas a method to infer the MI [75].
In contrast to conventional similarity measures, MI does not assume any linear relationshipsbetween the data. It provides a general measurement for dependencies in the data, makingit very suited as similarity measure between genes that may all share responses but ofopposing nature [76]. Some papers have shown that there is little difference between MIand the Pearson correlation measure [76, 77], but it has also been shown to outperformthem in differentiation among clustering solutions [62].
2.6.3 Weighted topological overlap
The topological overlap of two nodes (genes) in a network is a measure of interconnectivityrelative to the other nodes in network as a whole [78]. Equation for the weighted topologicaloverlap measure:
wTOij =∑k |aikakj |+ |aij |
min(ki, kj) + 1− |aij |(2.18)
in which k is the connectivity of a node and equals the sum of the weighted connectionsfrom a node to all its neighbors. The connectivity is defined as
kij =n∑j=1|aij | (2.19)
In the denominator of this equation, 1 − aij makes it mathematically unfeasible for thetopological over matrix values to take negative values and in unweighted networks this valuecan only take the maximal value of wij = 1 if every neighbor of node i are all connectedto node j, or node i is directly connected to node j. Conversely, wij = 0 is only possible ifboth nodes i and j are unlinked and they do not have any shared neighbors. To include thepossibility of negatively correlated genes measured with wTO, the sign of the correlationvalue is multiplied with the wTO-value:
wTO,Fij = sign(aij)wTOij (2.20)
The topological over matrix is, like the adjacency matrix, a symmetrical matrix in whichall values along it’s diagonal are zero, i.e. wij = wji and wii = 0.
When weighted topological overlap is used as a similarity measure in gene co-expressionstudies, correlation measures for all pair-wise gene combinations are used to calculate theweighted topological overlap. It has recently been suggested to threshold the correlation
22
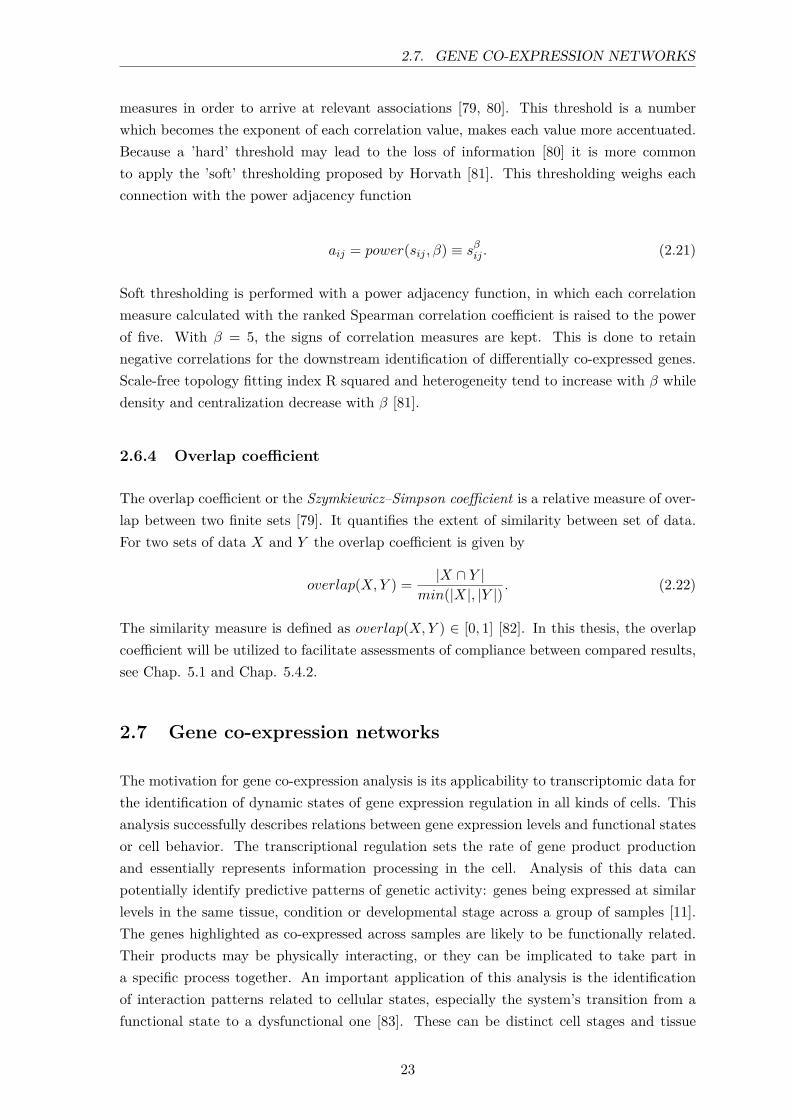
2.7. GENE CO-EXPRESSION NETWORKS
measures in order to arrive at relevant associations [79, 80]. This threshold is a numberwhich becomes the exponent of each correlation value, makes each value more accentuated.Because a ’hard’ threshold may lead to the loss of information [80] it is more commonto apply the ’soft’ thresholding proposed by Horvath [81]. This thresholding weighs eachconnection with the power adjacency function
aij = power(sij , β) ≡ sβij . (2.21)
Soft thresholding is performed with a power adjacency function, in which each correlationmeasure calculated with the ranked Spearman correlation coefficient is raised to the powerof five. With β = 5, the signs of correlation measures are kept. This is done to retainnegative correlations for the downstream identification of differentially co-expressed genes.Scale-free topology fitting index R squared and heterogeneity tend to increase with β whiledensity and centralization decrease with β [81].
2.6.4 Overlap coefficient
The overlap coefficient or the Szymkiewicz–Simpson coefficient is a relative measure of over-lap between two finite sets [79]. It quantifies the extent of similarity between set of data.For two sets of data X and Y the overlap coefficient is given by
overlap(X,Y ) = |X ∩ Y |min(|X|, |Y |) . (2.22)
The similarity measure is defined as overlap(X,Y ) ∈ [0, 1] [82]. In this thesis, the overlapcoefficient will be utilized to facilitate assessments of compliance between compared results,see Chap. 5.1 and Chap. 5.4.2.
2.7 Gene co-expression networks
The motivation for gene co-expression analysis is its applicability to transcriptomic data forthe identification of dynamic states of gene expression regulation in all kinds of cells. Thisanalysis successfully describes relations between gene expression levels and functional statesor cell behavior. The transcriptional regulation sets the rate of gene product productionand essentially represents information processing in the cell. Analysis of this data canpotentially identify predictive patterns of genetic activity: genes being expressed at similarlevels in the same tissue, condition or developmental stage across a group of samples [11].The genes highlighted as co-expressed across samples are likely to be functionally related.Their products may be physically interacting, or they can be implicated to take part ina specific process together. An important application of this analysis is the identificationof interaction patterns related to cellular states, especially the system’s transition from afunctional state to a dysfunctional one [83]. These can be distinct cell stages and tissue
23

2.7. GENE CO-EXPRESSION NETWORKS
phenotypes perhaps associated with a disease. Expression data across dysfunctional statescan thus shed light upon predictive genetic responses involved in orchestrating the molecularmechanisms a disease requires to propagate in the biological network. Applications of co-expression studies already at the micro-array period in the 1990s began to show that specificgroups of samples could be described by their common sets of gene transcript levels [84].
The input to co-expression networks can be data from RNA sequencing analysis. Tran-script fragments are sequenced and matched to the human genome, testing which genesare active and at which level they are being transcribed. Transcription data-sets presentsgene expression levels across multiple samples per gene as a vector. Each element in thevector correspond to a read number; this is the abundance of a gene’s transcript detectedper sample. The complete set of samples, stored as elements in the vectors, is a collectionof gene expression measurements in the same tissue. The mRNA abundances for one geneis thus contained in each vector, and the complete set of vectors for all genes constitute theentire set of data for an expression profile across the patient cohort [85].
Gene co-expression networks are employed to associate genes to biological processes in orderto discriminate among genes according to relation types between them. In these networks thenodes represent genes and links between them represent synchronization in their expression.A co-expression network will enhance patterns of genes behaving in similar ways. Systemmodeling of co-expression patterns for genes improves our understanding of this process. Ita great tool to investigate intra-cellular molecular pathways, which essentially regulate allmajor cellular events, because it is designed to detect various co-occurring transcriptionalprofiles. These similarities in expression become descriptive of the data condition, e.g. thedisease, from with the transcription network originates [85].
Construction of a gene co-expression network has two main parts: First, estimation of co-expression though a similarity measure s(i, j). Similarity between expression levels for pairsof genes is measured with a statistical measure, e.g. Pearson’s or Spearman’s correlationcoefficients. The similarity scores are stored in the similarity matrix S = [sij ]. Inferredrelations over a certain threshold for correlation are kept as indications of significant non-random properties of synchronized behaviour. As a convention the similarity matrix isconverted into an adjacency matrix A = [aij ] in which all diagonal elements are set tozero. It is common to use the signum function implementing a ’hard threshold’ τ to excluderelations with low significance. The signum function is given by [81]
aij = signum(sij , τ) ≡
0 sij ≥ τ
1 sij < τ(2.23)
Correlation is informative because it implies predictive behaviour of variable levels of geneexpression. Second, these remaining associations form a list of gene-pairs used to find theof adjacency matrix. This matrix represents similarity scores for genes as rows and samplesin columns [86]. Similarity matrices built upon correlations are symmetric and will this will
24

2.8. DIFFERENTIAL GENE CO-EXPRESSION NETWORKS
result in inference of undirected networks [84].
Co-expression analysis provides great benefits to research in molecular biology. In additionto integrating omics-data into a higher-order structure it can be used to elucidate modularstructures. Modular network structures are neighborhoods of nodes that on average orconnected to each other to a higher degree than to that of the rest of the network nodes.Co-expression networks have a great ability to group together genes that associate by varioussorts of genetic interactions into modules. Some of these segregated gene groups may alsobe likely to share similarities in biological function. The network community provides adescription of the local patterns of interactions among it’s components. Modular structureshave been shown to be evolutionary conserved and converging evolution of transcriptionnetworks of different species to contain modules of similar structure support the concept ofbiologically meaningful modular structures [87]. Local dense neighborhoods of co-expressionnetworks are potential functional modules, thus analysis of these may lead to discoveries ofnovel molecular interactions and functional groups in biological networks [88].
There are several ways to perform analysis of modular structures in networks. Most arebased on grouping nodes in communities based on a higher internal interconnectedness rel-ative to that outside the potential community. Because there are potentially many possibleways of partitioning a network into smaller communities, there are various algorithms toperform this optimization problem. In this thesis networks are partitioned into communitiesby the Louvain-algorithm [4] implemented in the Python-package networkx [89].
The process in which normal cells develop into cancerous cells is exceedingly complex. Yetthere are certain aspects characteristic of oncogenic processes that are key to differentiatenormal versus carcinogenic cells. By studying the differential gene expression patterns ofthyroid carcinoma, a deeper understanding of the genetic interactions and alterations in thecellular network can be reached [90]. Results from this analysis will potentially pinpointindividual genes and groups of genes that play important roles in the complex regulation ofcellular function that differ between normal and carcinogenic tissues.
2.8 Differential gene co-expression networks
There is huge interest in comparison of RNA-sequencing data between various conditions.This type of study is termed differential expression analysis and aims to identify differen-tially expressed genes. Differentiated expression profiles are patterns of genetic transcrip-tional levels across many samples that have significant dissimilarities. Expression vectorscontaining measured levels of a gene for a set of samples may remain unchanged when com-pared to expression levels from the same gene measured in a different sample group. Butfor some genes there may be no similarity in expression between the sample groups at all.By comparing the expression profiles from two experimental conditions it becomes possibleto elucidate which expression patterns are best characterizing the discordance. Differentialco-expression identifies gene pairs with correlated expression profiles with specificity to a
25

2.8. DIFFERENTIAL GENE CO-EXPRESSION NETWORKS
given condition. When identifying these variances among expressed genes, it becomes inter-esting which role they have and what effect this difference has in relation to the two samplegroups. They represent the two compared conditions. Some of the difference between theconditions can then be attributed to their particular expression profiles [11].
Construction of a differential gene co-expression network has the same initial steps as agene co-expression network. Gene expression profiles are organized as vectors for whichgenetic pairwise co-expression is measured through a similarity measure, and from this dataa selection of the most significant associations are drawn, yielding an adjacency matrixA = [aij ] for each condition. This part is performed analogously as when constructing geneco-expression networks described in the previous section. Typically, the two different data-sets analyzed represent a positive and negative in respect to a condition being investigated.They must contain expression vectors for an equal set of genes. Then they are comparableand can be employed to associate the characteristic expression patterns of specific genes tothe condition under study.
Following there is an additional third step to achieve a quantitative comparison of expressionprofiles between the different sets of data. The co-expression scores from one transcriptomicdata-set are compared to co-expression scores from different data-set. This step aims toidentify the genetic sources of variation between the two sets of samples. This producesthe similarity matrix of gene expression between the two data-sets. This is either done bycreating a network from the adjacency matrix from each condition and comparing them, orby constructing a co-expression network from a new mutual adjacency matrix representingthe compared property of the co-expression. In networks constructed by the latter methodeach value in the new adjacency matrix represents the change in co-expression patternbetween the conditions. Hence, every pair of genes in the network sharing a connection hasa link representing the differentiated co-expression.
Because gene expression must be highly specific to maintain the optimal energy use andfunctional requirements of the cell, the patterns of expression is indicative of function. Forexample, differential gene analysis between different tissues will highlight tissue-specifictranscription profiles for some genes. These genes then will be especially important for thefunction of the tissue [91]. Tissue-specificity in differential co-expression networks also actas a natural filtering method to ensure that genes that are functionally more similar areincluded in the potential differentially expressed genes identified.
Analogously, differential gene expression between tissues representing specific phenotypesrelate genetic expression patterns to phenotypic properties [92]. Many diseases have somespecific gene expression abnormalities [93]. Employing differential gene co-expression onthe study of diseases is very useful because it may identify significantly altered expressionof genes specifically in the tissue the disease affects. The resulting network will thus beenriched in genes that mediate the sickness’ network perturbation, and effectively point outthe molecular characterization of the condition [84].
Lasty, a major benefit of differential gene co-expression analysis is to identify modular
26

2.9. THE CSD METHOD
structures within the network related to the onset of a specific phenotype - specifically inthe application to study diseases. By studying communities within differential co-expressionnetworks disease modules may be identified. These are statistically likely to be related to adisease if it’s gene components are perturbed, for instance mutations and expression changes[88].
2.9 The CSD Method
The CSD framework has been developed by André Voigt and Eivind Almaas at the Depart-ment of Biotechnology and Food Science at NTNU [3]. The CSD method is a method forgenerating differential gene co-expression networks (DGCNs) highlighting internal distinc-tions of co-expression types. The method consists of a set of software programs for makingan entire network representation of a DGCN discriminating among three different types ofco-expression. In this network nodes represent genes and edges between them represent aconserved or changed value of co-expression for the given gene pair. A gene pair with highinter-sample correlation and low variance is more likely to be co-expressed. Edges thus re-flect perturbations in expression patterns resulting from a condition-specific transcriptomicprofile. By imposing expression patterns in this way, more information from co-expressionmeasures can be used to recognize proper relations between conditions and detect expressionprofiles characteristic of a particular tissue state.
The analysis is based on assessing differences in pair-wise gene expression found betweentwo data-sets representing expression profiles. First the similarity measure for every pair ofthe total set of N genes present in the two expression files are calculated separately. Thesimilarity measure holds quantitative information of similarity in expression levels for thegene pair i, j with respect to a condition k. This measure is calculated with Spearman’srank correlation coefficient, ρij,k. This measure can either show no correlation (ρij,k equalsor is close to zero), positive correlation (ρij,k equals or is close to 1), or negative correlation(ρij,k equals or is close to -1).
The next step is to quantify the difference between the two conditions represented by the ex-pression data cohorts. The CSD method compared to other co-expression analysis methodsdiffers in that it incorporates information from co-expression measures between two condi-tions j, k to prevail meaningful categories of differential expression patterns: the conserved(C), specific (S) and diverging (D) patterns of expression. Figure 2.3 shows a schematicexplanation of the three types of co-expression categories. Discrimination between differenttypes of co-expression refines the methodology in order to get a more comprehensive under-standing of the mechanisms involved in the sickness. These types of expression relationshipsbecome the link attributes in the resulting differential co-expression network [3].
• Conserved (C) expression relationships represents situations in which a significantsimilarity of expression found in both data-sets. This means that the gene expressionscorrelation is found commonly in both conditions with the same sign.
27

2.9. THE CSD METHOD
• Specific (S) expression relationship represents a pair of genes for which only one andnot both conditions is characterized by strong correlation of any type. Here, thecorrelation coefficient value for the gene pair is high for one conditions, whilst for theother condition the value is or is close to zero.
• Differentiated (D) expression relationship represents co-expression that differentiatesfor a gene pair across sample cohorts. In this case the correlation is strong in bothconditions, but the sign of correlation is not equal.
Figure 2.3: Diagram showing the regions of differential co-expression properties of gene-pairinteractions inferred with the CSD method. For a given pair of genes their co-expression valuemeasured by the Spearman correlation coefficient for condition 1 and condition 2 is denoted ρ1and ρ2 respectively. The plot illustrates the different co-expression relationships between ρ1 andρ2. These are categorized as either C-, S- or D-scores depending on the kind or relationship.C-scores (blue) describe conserved co-expression, with similar sign and both strong correlation.S-scores (green) describe specific cases where no relationship between co-expression values exist,with opposing strong values and opposite correlation signs. D-scores (red) describe differentiatedcases where both co-expression values have strong values but different correlation signs [3].
This refined categorization of co-expression relationship between conditions makes the CSDmethod a powerful tool to identify condition-specific patterns. By imposing co-expressionvalues between functional and dysfunctional states, it compares the transcriptional prop-erties that causes it to be pathological and also highlights the types of relationships thesetranscription patterns have between the conditions. Edges of the network will reflect geneticinteractions that have changed between a normal and impaired state, which in turn can beused to expose by which means the disorder manifests in the network and leads to the dis-eased state. The CSD method accommodates these node-relation changes in the networkedges with the goal to highlight conditional changes resulting from a disease. The C, S, or
28
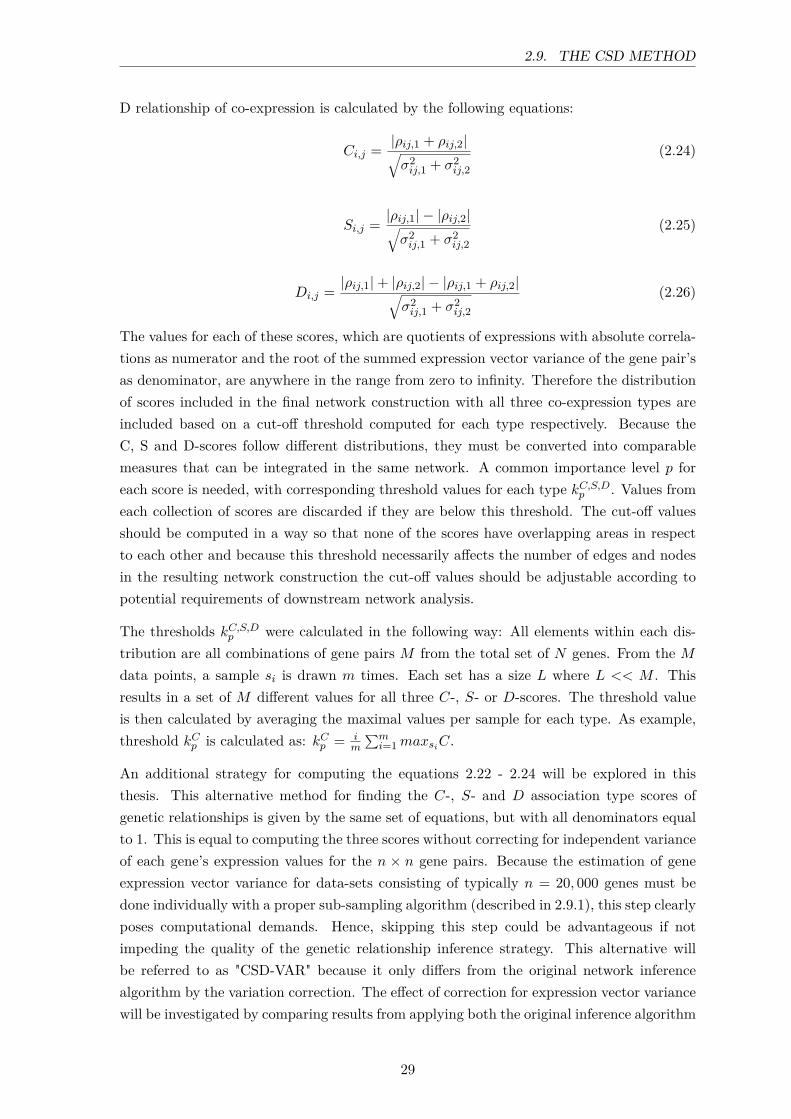
2.9. THE CSD METHOD
D relationship of co-expression is calculated by the following equations:
Ci,j = |ρij,1 + ρij,2|√σ2ij,1 + σ2
ij,2(2.24)
Si,j = |ρij,1| − |ρij,2|√σ2ij,1 + σ2
ij,2(2.25)
Di,j = |ρij,1|+ |ρij,2| − |ρij,1 + ρij,2|√σ2ij,1 + σ2
ij,2(2.26)
The values for each of these scores, which are quotients of expressions with absolute correla-tions as numerator and the root of the summed expression vector variance of the gene pair’sas denominator, are anywhere in the range from zero to infinity. Therefore the distributionof scores included in the final network construction with all three co-expression types areincluded based on a cut-off threshold computed for each type respectively. Because theC, S and D-scores follow different distributions, they must be converted into comparablemeasures that can be integrated in the same network. A common importance level p foreach score is needed, with corresponding threshold values for each type kC,S,Dp . Values fromeach collection of scores are discarded if they are below this threshold. The cut-off valuesshould be computed in a way so that none of the scores have overlapping areas in respectto each other and because this threshold necessarily affects the number of edges and nodesin the resulting network construction the cut-off values should be adjustable according topotential requirements of downstream network analysis.
The thresholds kC,S,Dp were calculated in the following way: All elements within each dis-tribution are all combinations of gene pairs M from the total set of N genes. From the Mdata points, a sample si is drawn m times. Each set has a size L where L << M . Thisresults in a set of M different values for all three C-, S- or D-scores. The threshold valueis then calculated by averaging the maximal values per sample for each type. As example,threshold kCp is calculated as: kCp = i
m
∑mi=1maxsiC.
An additional strategy for computing the equations 2.22 - 2.24 will be explored in thisthesis. This alternative method for finding the C-, S- and D association type scores ofgenetic relationships is given by the same set of equations, but with all denominators equalto 1. This is equal to computing the three scores without correcting for independent varianceof each gene’s expression values for the n × n gene pairs. Because the estimation of geneexpression vector variance for data-sets consisting of typically n = 20, 000 genes must bedone individually with a proper sub-sampling algorithm (described in 2.9.1), this step clearlyposes computational demands. Hence, skipping this step could be advantageous if notimpeding the quality of the genetic relationship inference strategy. This alternative willbe referred to as "CSD-VAR" because it only differs from the original network inferencealgorithm by the variation correction. The effect of correction for expression vector variancewill be investigated by comparing results from applying both the original inference algorithm
29
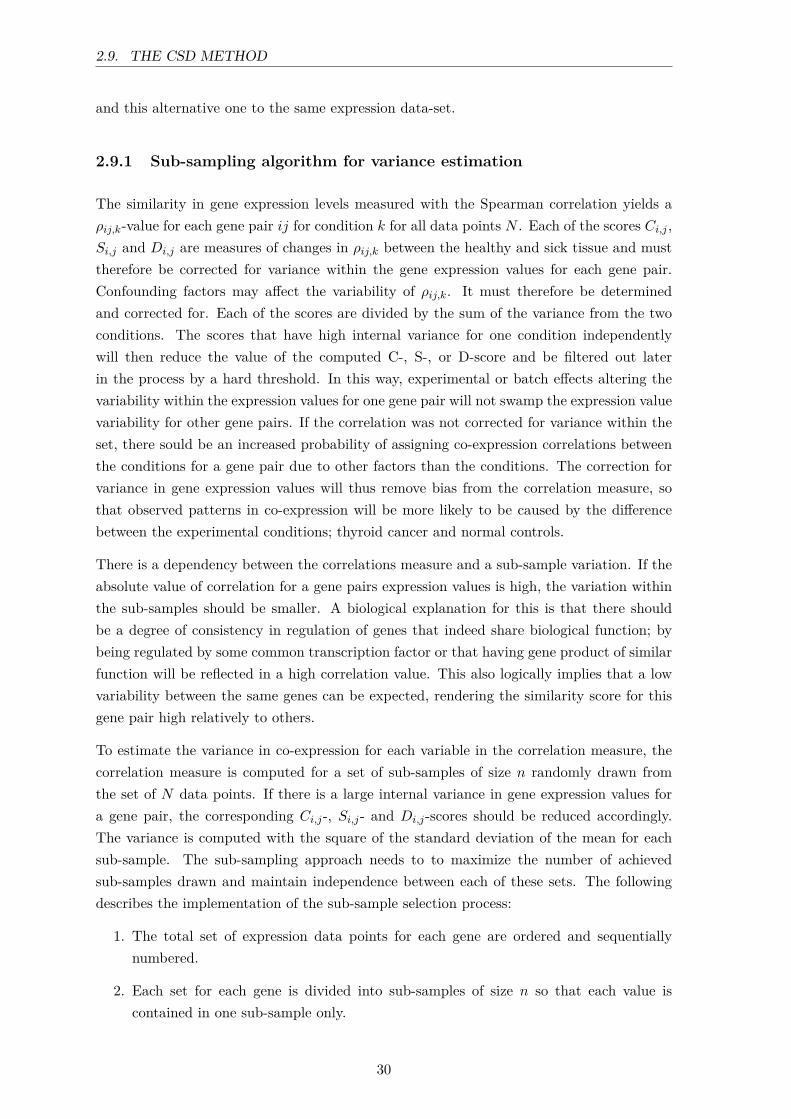
2.9. THE CSD METHOD
and this alternative one to the same expression data-set.
2.9.1 Sub-sampling algorithm for variance estimation
The similarity in gene expression levels measured with the Spearman correlation yields aρij,k-value for each gene pair ij for condition k for all data points N . Each of the scores Ci,j ,Si,j and Di,j are measures of changes in ρij,k between the healthy and sick tissue and musttherefore be corrected for variance within the gene expression values for each gene pair.Confounding factors may affect the variability of ρij,k. It must therefore be determinedand corrected for. Each of the scores are divided by the sum of the variance from the twoconditions. The scores that have high internal variance for one condition independentlywill then reduce the value of the computed C-, S-, or D-score and be filtered out laterin the process by a hard threshold. In this way, experimental or batch effects altering thevariability within the expression values for one gene pair will not swamp the expression valuevariability for other gene pairs. If the correlation was not corrected for variance within theset, there sould be an increased probability of assigning co-expression correlations betweenthe conditions for a gene pair due to other factors than the conditions. The correction forvariance in gene expression values will thus remove bias from the correlation measure, sothat observed patterns in co-expression will be more likely to be caused by the differencebetween the experimental conditions; thyroid cancer and normal controls.
There is a dependency between the correlations measure and a sub-sample variation. If theabsolute value of correlation for a gene pairs expression values is high, the variation withinthe sub-samples should be smaller. A biological explanation for this is that there shouldbe a degree of consistency in regulation of genes that indeed share biological function; bybeing regulated by some common transcription factor or that having gene product of similarfunction will be reflected in a high correlation value. This also logically implies that a lowvariability between the same genes can be expected, rendering the similarity score for thisgene pair high relatively to others.
To estimate the variance in co-expression for each variable in the correlation measure, thecorrelation measure is computed for a set of sub-samples of size n randomly drawn fromthe set of N data points. If there is a large internal variance in gene expression values fora gene pair, the corresponding Ci,j-, Si,j- and Di,j-scores should be reduced accordingly.The variance is computed with the square of the standard deviation of the mean for eachsub-sample. The sub-sampling approach needs to to maximize the number of achievedsub-samples drawn and maintain independence between each of these sets. The followingdescribes the implementation of the sub-sample selection process:
1. The total set of expression data points for each gene are ordered and sequentiallynumbered.
2. Each set for each gene is divided into sub-samples of size n so that each value iscontained in one sub-sample only.
30

2.9. THE CSD METHOD
3. The first data point in each sub-sample is used as initiating data point, n∗, for buildinga new sub-sample. Iterating through the data points, new points are added only ifthey have not co-occurred in a sub-sample with any of the other data points in thisnew set.
4. Step 3 is repeated so that each new set contains a unique combinations of data pointsof size n.
5. When there exist no new unique combination of data points initiation with n∗ tocreate a sub-sample, step 3 is repeated using n∗ = n∗ + 1 as the new initiating datapoint.
6. The process is finished when there exist no more valid sub-samples of size n that canbe created and n∗ = N .
To ensure meaningful calculation of Spearman correlation, a large number of sub-sampleswith as many data points in each sample should be selected. In addition, because the Spear-man correlation loses accuracy for smaller sub-sample sizes, there should also be consistencybetween the chosen sub-sample size for each experimental condition.
2.9.2 Node homogeneity
Any node in a network can be described by it’s composition of associations to its neighbornodes of different types. In a co-expression network constructed with the CSD framework,the three different link types are C, S and D-links. These make up the three possiblecategories of types in the link type distribution attributed to a node i. This distribution istermed the node homogeneity, Hi, and is given by:
Hi =∑
t∈(C,S,D)(kt,iki
)2 (2.27)
where kt,1 denote the number of links of type t ∈ (C, S,D) respectively and ki is the nodedegree. The homogeneity describes the node’s interaction type properties. It quantifieswhether a node (gene) for which co-expression correlations are predominantly of one singletype, or rather with close to equal amounts of links of types t ∈ (C, S,D).
The first case represents a homogeneous gene, which will associate with other genes in onlyone way for both of the studied conditions. An non-homogeneous gene will have a set oflinks of heterogeneous types. The links will then be of more than one type and none of thetypes relatively dominant compared to the others. This gene’s expression associates withother gene’s patterns in a variety of ways depending on the neighbor gene.
31

2.10. NETWORK MEDICINE
2.10 Network medicine
For many diseases the cause can be mutations or smaller changes in the DNA. The ge-netic material is a very specific sequence, 3 billion nucleotides long, distributed on the 42molecules of nucleic acid that lies within the nucleus of every cell in the human body. Thesenucleotides’ special sequence encode genes; these are the cell’s instructions for synthesizingfunctional molecules, and they are the result of millions of years of evolution. Alterationsdisrupt genes and limit the cell’s ability to behave properly. Cells then express proteins thatbehave abnormally, driving the development of the diseased phenotype [91]. For example,a mutation in a any one of 50 genes encoding retinal proteins may cause the disease retinalpigmentosa [94]. The damaged gene is translated into a protein that doesn’t function prop-erly and ultimately lead to vision loss. The genes that encode proteins that are needed tobuild the retina are especially active in the cells of the retinal tissue. Regulation of genetictranscription is essential for normal cell function. This ensures that in a normal retina, cellsare producing photo receptors for the retina and not - for instance - collagen for the growthof hair-fibres. It is generally acknowledged that specific tissues have increased expressionof the genes encoding proteins that carry out reactions essential for the functionality of thegiven tissue [12].
One might then assume that these altered tissue-specific genes are expressed and damagingexclusively their functional tissues. But this does not always hold true, and complicate thesimple dogma of gene-cause-disease associations [92]. Any inherited mutation or geneticvariation associated with disease exists in every cell of the human body, not just in thetissue in which the disease is typically manifested. Many genes linked to diseases are in factexpressed in multiple tissues throughout the human body, most of which not manifestingthe functional abnormalities linked to the disease. This must mean that either the genesdoes have malignant effects in other tissues that are either masked or hindered in makingharmful outcomes, or the gene cannot mediate the diseased phenotype on its own. If thegene cannot single-handedly make a tissue abnormal itself, it must depend on other factorsto manifest the sickness. In other words, the expression of a gene associated to a diseasedoes not explain the full mechanism of pathology in a tissue: The gene is not exclusivelyexpressed in this tissue yet only portray the disease here [91].
This is why biological network analysis becomes a powerful tool in investigating humandiseases. Analysis of disease-specific networks thus makes it possible to elucidate the char-acteristics of the genes that do manifest disease in specific tissues and the mechanisms bywhich it plays out its tissue-specific role. Comparison of genetic networks of normal and sicktissue will show the differences between the functional paths in which the genes interact. Itwill potentially also show why some genes cause pathophysiological changes in a single tissuewhile other affect multiple tissues. The goal is to identify gene network sub-clusters thatbundle specifically in specific regions and depend on the integral expression of other genemembers of the sub-graph relevant for the molecular mechanism of disease manifestation.The partners in a cluster like this will depend on the tissue. Also, the effects in tissues other
32

2.11. STATISTICS
than the tissues in which the disease-associated genes usually are expressed most can beanalyzed similarly; its internal structures compared to the disease-specific tissue. This willshow why other tissues are less - or not at all - affected by genes associated with disease.
Network analysis of differential co-expression networks representing diseases have also beenused to identify particularly interesting modular structures. These networks have demon-strated that genes encoding proteins related by distinct types of similarity tend to interactwith each other. These may be found grouped together in network clusters [92]. Networkclusters like these can be enriched for genes encoding products with similar functions, calledfunctional modules. Recently, an even more interesting type of cluster has been hypothesizedas well.
2.10.1 Disease modules
A disease module is the manifestation of a disease in a network mechanistically linked to aparticular disease phenotype [88]. In a differential co-expression network it is a sub-networkstructure containing multiple disease-associated genetic entities. A great application of thistheory is that a gene already linked to a disease can be used to identify novel disease-associations for other genes if they are found in this first gene’s network neighborhood [95].Analysis of these modules and their engagement in the network may be employed to identifythe mechanisms carrying out the pathological phenotype. Also, in tissue-specific networkthey can potentially expose why certain genes manifest diseased phenotypes in some tissuesbut not in others [92].
To identify disease-modules within a differential gene-expression network, there are somecriteria set for the network analysis: First of all, the network represents the genetic inter-actions in a tissue the disease is manifested. Disease-associated genes are highly connectedand localized in the same neighborhood of the genetic network, forming this disease module.When expressed in other tissues, these genes have other interactions and are segregated intoother regions or the genetic network. In a network representation of the tissue the diseasetypically affects the most, the module’s integrity determines the cellular outlook character-istic for the given disease [88].
2.11 Statistics
2.11.1 Hypothesis testing
A hypothesis formulating an assertion is tested with the procedure hypothesis testing, inwhich two potential hypothesis are tested against each other. A hypothesis could be thata parameter of a population has a certain value, forming the alternative hypothesis H1.The null hypothesis H0 would then be the presumed value for the parameter. To determinewhich hypothesis is true, computing a critical value of H0 is used to deduce rejection and
33
2.11. STATISTICS
acceptance regions. These define limits to the test statistic. If it is in the reject region, H0
is rejected for the alternative hypothesis H1 [96].
For example, when comparing gene expression patterns looking for correlated behaviour,the alternative hypothesis is that two genes are correlated and share a linear relationship.Testing this hypothesis is done by comparing their correlation coefficient with that of astrictly uncorrelated patterns with similar parameters. If the difference is within the accep-tance region for H0 it is kept and the alternative hypothesis is rejected. But if the differencebetween the correlation coefficient for the two genes is located in the reject region for H0 thisindicates that their patterns are significantly more similar than entirely uncorrelated andthe alternative hypothesis H1 is accepted on the basis of the observed relationship betweenthe gene expression profiles.
Hypothesis testing needs a significance level α to find thresholds for accepting or rejecting thenull hypothesis. The significance level represents the rejection region of the null hypothesis.The p-value in this example represents the probability of observing correlations betweenactually non-correlated patterns, that is observing significant values of correlation by chance.A p-value below 0.05 is considered to be significant, because it is lower than the significancelevel. An even lower p-value is a highly significant indication of true correlation. If thep-value is lower than 0.05, more than 95% of the time correlation coefficients betweenthese genes would result from significantly correlated gene expression patterns. The nullhypothesis can then be rejected in favor of the alternative one, because the p-value is lowerthan the significance level α = 0.05.
When carrying out hypothesis testing the probability of rejecting a null hypothesis that istrue is equal to α. A test resulting in a rejected true null hypothesis is termed a type I error,or a false positive result. If the alternative hypothesis is true but rejected it is called a typeII error, or a false negative result. Following the same example, a false positive result whenperforming gene co-expression analysis would be to infer relationships between genes that inreality share no common biological behaviour in terms of transcription or regulation. A falsenegative represents the case where no association is inferred between genes that actuallyhave correlated transcriptional behaviour.
2.11.2 Testing and correcting for multiple comparisons
When comparing large gene-expression data sets for pairwise correlations it becomes a hugeset of simultaneous hypothesis tests, referred to as multiple comparisons. The probabilityof type I error increases with the number of comparisons tested at the same time. Thus, isbecomes important to perform proper correction methods to account for this effect [97].
One common way of controlling type I error is with the false discovery rate (FDR) whichmeasures the expected ratio of incorrectly rejected null hypothesis among all rejected hy-pothesis done during multiple comparisons. When performing comparisons of multiple geneexpression profiles testing for significant correlations, accepting a maximum of 5% false pos-
34

2.11. STATISTICS
itive assigned relationships between genes the FDR would be set to 5%. There are differentstrategies to control for the FDR. Here, the Benjamini-Hochberg method and the Bonferronimethod will be described briefly [97].
The Benjamini-Hochberg method is named after Benjamini and Hochberg who developedthis technique in 1995 [98]. Individual p-values are ranked in ascending order and comparedto the critical value
i
m×Q
where i is the rank, m is the number of tests, and Q is the FDR, .e.g. 0.05. All test withp-values smaller than and up to p < (1/m)Q will be considered significant.
Another method of correcting for error rates is the Bonferroni correction. This approachcontrols the FDR by the error rate for the complete set of tests, referred to as the familywiseerror rate. The critical significance value becomes lower than α. Then if for all the multipletests the null hypothesis H0 holds true given this lower α, the probability of having at leastone false positive in the family of tests due to chance is 0.05. The Bonferroni correction isdone by dividing the critical value by the number of tests. For example, for a set of 100tests for which α = 0.05, the new critical value becomes 0.05/100 = 0.0005, being the newp-value threshold for accepting a test as significant [99].
35


Chapter 3
Methodology
3.1 CSD Analysis on Thyroid Cancer
The first aim of the research topic for this thesis was application of differential gene co-expression analysis of thyroid carcinoma. This section will describe the data pre-processingand implementation of the CSD method to infer differential co-expression networks. Thestrategies for extracting information from these networks in the aspect of disease investiga-tion will be described in detail.
3.1.1 Data set collection
The gene expression data for healthy tissue used in the analyses of this thesis was down-loaded from NIH Genotype-Tissue Expression (GTEx) Consortium V7, in fully processedand filtered single-tissue gene expression matrices in .bed-format [100]. The Genotype-Tissue Expression (GTEx) program is a multi-center effort to generate genomic and tran-scriptomic profiling data for more than 50 tissue sites from hundreds of autopsies [100]. Thesamples were collected from healthy human patients’ thyroid gland tissue. The data setconsisted of a series of 399 samples of gene expression data based on the GENCODE 19transcript model. Gene-level quantification of expression in transcript per million (TPM)values were produced with RNA-SeQC v1.1.8 [101] for gene-level expression quantification.Transcript-level quantification was calculated with RSEM v1.2.22 [102].
The gene expression data of thyroid carcinoma was collected from the Thyroid Cancerproject (THCA) from The Cancer Genome Atlas [103]. Expression data from thyroid pri-mary tumor tissue diagnosed with various types of thyroid carcinoma were identified andaccessed through the GDC Data Portal. In total 504 HTSeq-count expression files weredownloaded.
In the THCA project there was also expression data available from solid normal tissue col-lected from the same patients with thyroid cancer, but these 70 data samples were excluded
37

3.1. CSD ANALYSIS ON THYROID CANCER
from the analysis. A total of 504 expression files in HTSeq-format were downloaded andassembled into a large data set with gene expression data for 60,483 mapped reads.
The data set used in this analysis had the following composition: 355 patients were diag-nosed with Papillary adenocarcinoma. 102 patients were diagnosed with Papillary thyroidcarcinoma, 38 of which with the follicular variant and 9 with the columnar cell variant. 135samples of the data set were from male patients and 352 were from female patients.
3.1.2 Data set integration
Because the data from TCGA was divided in separate files for each patient, the data wascollapsed into one complete data set for all patients in the cohort. On TCGA the expressiondata from the THCA-project contained transcriptomic data from patients diagnosed withthyroid carcinoma, but not all of the samples originated from carcinogenic thyroid tissue.From the clinical data downloaded with the expression-files, the 66 transcriptome files inbenign tissue (from the same thyroid cancer patients) were identified. This clinical data-filewas used as a template for reading in the correct transcriptomic files, so that expressionfiles for benign tissue were omitted, and the remaining 504 files from carcinogenic thyroidtissue was included in this study. The transcriptome files of solid normal tissue that wereavailable on TCGA originated from patients in the THCA-cohort, these were matched tissuesamples from the same patients but in healthy tissue. Exclusion of these files was basedon the intention of keeping the cancer patients and healthy control patients statisticallyindependent. In this way, there are no shared patients in the two compared groups of thestudy and there is virtually complete independence between them.
For differential co-expression analysis the two data sets should ideally consist of the sameset of identifiers for the same genes and a similar set of genes. One challenge when usingdata sets from different databases is that there may be ID conflict between the sets anddifferences in data set compositions. Both the normal control data from GTEX and theTHCA-data from TCGA had Ensemble identifiers. But, in order for the results of thedifferential gene co-expression analysis to be easy to interpret, all gene IDs were convertedto the official gene symbols.
The script for this conversion was written in Python, converting all Ensemble gene IDs intothe official gene symbol, based on the GENCODE annotation version 38 [104]. Even thoughthere are some ID mapping services available online, these did not handle isomers in thedesired way. In the expression data more than one instance of the same gene was representedbecause the same gene may have several different transcripts depending on splicing eventsand these mapped to different probes accordingly.
To address this, both data from THCA-patients and healthy controls, gene expression datafrom multiple probes were collapsed into a single unique value for the common gene name.Transcription isoforms originating from the same gene but with various lengths were con-verted into one gene expression value for all probes. This was done by calculating an average
38

3.1. CSD ANALYSIS ON THYROID CANCER
value per patient for the same gene and this average was kept. This averaged the expressionlevels for transcripts of different lengths. After this was done, all expression vectors pergene had an equal amount of elements as the number of patients in each of the cohorts,504 for the THCA-patients and 399 for the healthy controls. This process was chosen bothbecause of easy data set quality and version control later in the process, but also because adifferential co-expression analysis at single-gene resolution was sufficient.
Then the two data sets were filtered to contain a common set of genes, and for the down-stream analysis the expression value vectors for the common set of 24,753 genes were in-cluded in the transcriptome data files for both thyroid cancer patients and the healthycontrols.
3.1.3 Pre-processing procedure
The general agenda of the pre-processing was to remove batch effects across RNA seq datadata from different sources. This quality control wok-flow consisted of multiple steps. AllEnsemble IDs were converted to official gene symbols. Gene expression data for the thy-roid cancer patients was normalized and filtered the sick tissue in as recommended in [105].Expression values originally in raw reads format were filtered to include only genes withexpression values > 6 reads in at least 20 % of samples. These reads were scaled to upper75%-quantile library scale resulting in transcript per million-units (TPM). Only values over0.1 TPM in at least 20% of samples were kept. This thresholded for a change in expressionlevel set to log|foldchange| ≥ 2. TPM values were corrected for gene length and convertedto TMM with edgeR [50]. Lastly, the expression levels for each gene were transformed acrosssamples with an inverse normal transform. The R-package edgeR was used because it imple-ments possible bias sources into the statistical model to perform an integrated normalization[43].
As last part of the pre-processing, the two data sets from normal and THCA tissues werefiltered to contain the same set of genes, and thus the common set consisted of 24753 genesin each set. The healthy GTEX data with 399 samples and the 504 samples THCA datafrom TCGA were used in all analysis of this thesis.
3.1.4 Differential co-expression analysis workflow
The CSD framework developed by Voigt and Almaas [3] is written i C++. The codecomputes pairwise correlation values for all pairs of genes and estimates variance for eachgene’s expression vector. The latest version of this code converted all values into ranks asa first step and then computed correlations for these ranked values instead of convertingone by one expression value into a ranked value before computing the correlation to othergenes. This is a faster implementation than the original, which is available on GitHub [106].Spearman correlation coefficient is the similarity applied to calculate correlation between
39

3.1. CSD ANALYSIS ON THYROID CANCER
normal_x
sick_x
1. FindCorr-AndVar
RhoNorm
3. Create-NetworkRhoSick
2. FindCSD
UsableCValues
UsableSValues
UsableDValues
AllValues
CNetwork
SNetwork
DNetwork
CSDSelection
Figure 3.1: Illustration of work-flow for differential gene co-expression analysis with the CSDframework developed in [3].
differentially expressed genes between the healthy patients’ thyroid tissue and malignantthyroid gland tissue.
The expression data from patients with thyroid cancer and the healthy thyroid tissue ex-pression data was used to generate differential gene co-expression networks. The pairwiseSpearman correlation coefficients were computed for each data set independently as a firststep. This was done by compiling the C++ code and filling in the correct name of the input-file, specifying how many genes and samples the data set consisted of. A third parameterthat was altered was the number of samples per sub-sample used to calculate the variance.This was set to 8 if the sample size was higher than 50. This code utilizes the sub-samplingalgorithm described in the theoretic background to estimate variance, which should haveat least 7 samples in each sub-sample group to estimate achieve three-digit accuracy of theSpearman correlation [3]. This is step 1 in Fig. 3.1, called "FindCorrAndVar".
The output from this first part generated co-expression for each separate condition. Thesewere files with each gene pair and it’s correlation value and variance. The next part wasto use a Python script to compare these two correlation files from the two conditions andcalculate all C-, S- and D-values. This refers to the Python-script "FindCSD" in step 2 inFig. 3.1. This was done by specifying the names of the out-put from the previous step asinput and reading in one line per gene-pair ij, corresponding ρij-value and σ2
ij-value percondition and calculating these three scores based on this information.
As a third step these C, S, and D-values are used as input as the last Python script whichgenerates four networks, each for the three interaction-types and one aggregate networkcontaining all the interactions of all three types. This is the Python-script "CreateNetwork"in step 3 in Fig. 3.1. The interactions included in these four networks are exclusivelythose who are above the computed threshold importance level for each interaction type,kC,S,Dp . This code uses a parameter called selSize which is equal to 1/(desired p-value). Thethreshold is set to average maximum of the C-, S- and D-scores individually, drawn from arandom subsample of size 1/p where p is the importance level. Elements from the complete
40

3.1. CSD ANALYSIS ON THYROID CANCER
set are selected with replacement [3]. Because each data set has approximately 20,000 geneswith around 400 or 500 samples, the entire set of gene pairs is n∗n−1
2 and the sub-samplesets were of size 1/p. Thus, given a importance level of 10−5 this is around 0.001% of thetotal set of gene pairs. From healthy and thyroid cancer co-expression data differentialco-expression networks were inferred on the basis of four different values for selSize yieldingnetworks based on importance values 10−4, 10−4.5, 10−5, and 10−5.5. Resulting networkswere visualized in Cytoscape [107] for inspection and analysis.
3.1.5 Box-plots
Box-plot are graphical representations of data in which multiple relevant properties for eachsample are included in the visualization. It is a graphical tool which characterises thedistribution of the numerical data with percentiles, means, medians, and minimal/maximalvalues. A box in the plot represents a sample, the length of this box is the inter-quartilerange covering the central 50% from the first quartile to the third, while whiskers may beextended out from each box to the minimal and maximal of the values. On a vertical boxthe mean, given by the second quartile, is indicated with a horizontal line inside it. Themedian of the data and any outlier points may be also be indicated in the plot [108].
3.1.6 Node homogeneity analysis
The homogeneity in the complete network was investigated by calculating the homogeneityscore for each of the genes in the network with Eq. 2.27. The homogeneity for each nodedepended on its distribution of links of the three different types; conserved, specific ordifferentiated. For all genes in the network the homogeneity was calculated and then thesevalues were sorted by the node degree. Then the homogeneity was plotted as a function ofnode degree. The result from this analysis is shown in Fig. 4.4. Here all homogeneity-scoresare shown in box plots. For each node degree the spread of the collection of homogeneity-scores determines the length of the boxes, its length along the vertical axis represent thefirst ad the third quartiles of homogeneity-scores. The maximum and minimum values areindicated by the whiskers extending out from the top and bottom of the boxes respectively.For the homogeneity-scores per node degree the median and the mean values were computed,these are also included in the box plot. Red horizontal lines denote the median and thegreen bars the mean.
3.1.7 Gene ontology enrichment analysis
Gene ontology (GO) biological process enrichment analysis was performed for the completedifferential gene co-expression network inferred with the CSD method. This was doneto assay the differentially co-expressed genes (DEGs) between thyroid cancer and healthypersons for enrichment of biological processes. In the network the genes were denoted by
41

3.1. CSD ANALYSIS ON THYROID CANCER
their official gene names. Converting these back to Ensemble IDs resulted in a higherability of the GO enrichment tools to map the gene names to their genetic databases, andwas therefore done for all sets of genes before performing the GO enrichment analysis. Theenrichment analysis was performed using the tool DAVID [109] and the GO EnrichmentAnalysis powered by PANTHER [110].
The results from biological enrichment analysis provide lists of biological processes withsignificant enrichment for the set of differentially expression genes it is given. The test asksif there among the DEGs are more members of any biological or functional pathway thanwhat would be expected in a uniform random selection of genes. It is thus a statisticalapproach to identify over-representation taking differential expression into account [68].The list usually provides test significance level, false discovery rates, and the Bonferronicorrelation coefficients for each identified biological process. GO enrichment analysis is amethod of testing which biological function a group of genes are involved in. The analysiswill use the protein-coding genes from the queried gene list to find the pathways these genes’products take part in and thus map the characteristic behaviour for the group of genes inthe organism [68].
3.1.8 Community detection
Investigation of module functionality and potential disease associations was performed bynetwork community detection of the network constructed based on CSD. This was doneby implementing the Python communities package which employs the Louvain-algorithmto find communities [4]. Community detection was done by using the package’s function"best partition". Each module was written out to a file and from this file the moduleaffiliation for each gene symbol was stored as attributes. Lastly the nodes in the moduleswere coloured by their module affiliation in order to investigate module partitioning of thenetwork. Results are presented in Fig. 4.7. Network community detection is a tool thataim to identify functional modules, which may potentially aid in the identification of diseasemodules. Resulting modules were examined for presence of disease-associated genes.
3.1.9 Detection of disease genes and potential disease modules
The functional annotation tool PANTHER [110] was used to identify genes in the differentialgene co-expression network associated with thyroid carcinoma. These were recognized asDEGs based on the CSD method for network inference with importance level p = 10−5. Ofthe 7224 DEGs from the CSD network of Analysis 2, 1308 Ensemble IDs were successfullymatched with the Gene Association Database [111]. Of these 22 genes were identified asthyroid cancer-associated with a p-value = 8.4 ∗ 10−5 and Benjamini corrected p-value =0.065.
Examination of genes associated to thyroid cancer was an integral part of the general aimof this thesis. The investigation of them could potentially elucidate novel knowledge about
42

3.2. METHOD STUDY AND DEVELOPMENT
thyroid carcinoma. In addition, the relative quantities of these disease genes in networkneighborhoods could identify cliques with a communal association to thyroid carcinoma aswell. These network neighborhoods could be strong indicators of functional - hence a diseasemodule. To this end, network clusters were examined for presence of these genes. Lastly,the ability to identify such genes could act as a robust way of quantitative assessment ofdifferent similarity measures as basis for differential gene co-expression analysis.
3.2 Method study and development
The second main objective of this thesis was to study and expand the methodologies forperforming differential gene co-expression analysis. First, the effect of proper pre-processingwas examined. Second, new implementations of different similarity measures were devel-oped. In this method development part, novel similarity measures were introduced in away maintaining most of the originally CSD framework. By not changing too many con-stituents of the work-flow, quality control is more easily feasible and comparison of resultsgenerated with these alternative strategies will have higher validity. Faster implementationof weighted topological overlap was attempted and the mutual information was developedas a new similarity measure as foundation for the CSD framework. Also, a simpler ver-sion of Spearman’s correlation coefficient was examined. The effect on the differential geneco-expression analysis outcomes was explored for each similarity measure.
The transcriptomic data used in this section was identical to that collected in Chap. 3.1.1and integrated into a data set as described in Chap. 3.1.2.
3.2.1 Alternative methods for data pre-processing
Pre-processing methods have an important impact on the quality of the data provided asinput for co-expression analysis. Various methods for modeling of transcriptomic data andpre-processing for differential expression analysis address statistical challenges differently.An illustration of these pre-processing strategies in provided in Figure 3.2. The initial step ofthe pre-processing process common to all alternatives was to convert Ensemble IDs to officialgene symbols, see step 1 in Fig. 3.2. After this, three somewhat different filtering procedureswere performed as part of quality control of the expression data, resulting in three distinctdata sets of thyroid cancer transcription data. All of these were both used in the CSDworkflow after pre-processing. Here blue boxes represent processes implemented in Pythonand green boxes represent processes implemented in R. The two filtering processes differed byfiltering stringency. All processes were to a certain degree replications of the normalizationmethod already applied on the healthy control transcriptomic data downloaded from GTEX.
43

3.2. METHOD STUDY AND DEVELOPMENT
sick
normal
1. Ensemblename
conversion
1. Ensemblename
conversion
Analysis 1: Stringent filtering
Analysis 2: Soft filtering
Analysis 0: No filtering 4. Keepcommon
genes
2b. Filter< 6 readsin > 20%
4. Keepcommon
genes
3b. Filter< 0.1 TPMin > 20%
2c. Filter< 1 CPM in
two libs
4. Keepcommon
genes
3c.ConversionTPM - TMM
25k
55k
25/16/21k
25k
16k
21k
sick_1
normal_0/1/2
sick_0
sick_2
gene length kB
Figure 3.2: Illustration of alternative pre-processing steps.
The first step of the of cancer pre-processing was to filter out low read-count genes fromthe data, see step 2b in Fig. 3.2. All read count values per gene that had less than 6raw read counts for more than 20 % of the samples were identified. This corresponded togenes whose expression value vector had more than 100 instances of the value zero. Thesewere removed from the data set. The next step was to normalize the transcriptome data.Normalization of the RNA-seq raw count values was done by further implementing the samemethod with which the healthy RNA-seq data from GTEX had been normalized accordingto their expression preparation procedure [112]. This included both conversion of the rawgene counts into reads per kilobase, then transcript per million values and normalizationusing the R package edgeR [50]. The workflow will be described in detail in the followingsection.
First, conversion of the raw gene counts from RNA-seq data was done by conversion toread per kilobase-values (RPK) an scaling into transcript per million (TPM). Gene lengthsfor all genes were obtained by querying sets of genes on GeneALaCart [113] or computingthe length from GENCODE annotation files, which included start and end position onthe chromosome, se bottom process in Fig. 3.2. Gene lengths in kilobases for each genewere calculated and stored in a dictionaries for each of these sources. Because of varioustranscription lengths from the same gene, each source held multiple gene length values foreach gene which were all stored in a list. But in order to convert transcriptomic data intoRPK values, one single gene length was needed. Thus, the best alternative gene length fromall transcription versions had to be found. For a set of 100 random genes, their lengths wereassayed manually against the UniGene NCBI database to find which value was closest tothe reference length. From this it was found that the best estimate of true gene length was
44

3.2. METHOD STUDY AND DEVELOPMENT
obtained by keeping the maximal value of gene length in case multiple values were foundper gene. Then these gene length-dictionaries were merged to hold only one set of uniquegenes with one maximal gene length value for each of them. The total gene length in thiscollection was 62,910. All transcriptomic data in the thyroid cancer data set was dividedby it’s per gene length in kilobases, to yield RPK-values.
Second, all RPK values per sample were counted and divided by one million, which produceda set of per million-scaling factors. Third, all RPK values were divided by the per million-scaling factors to yield expression values in TPM units. As a final step, the values were alsotransformed with a inverse normal transform function. These last steps were performed inR. As mentioned above, this conversion process was done exclusively for the thyroid cancerdata, because this was in raw read count units when downloaded.
The two data sets used in the differential co-expression analysis were different in that thenormal data from GTEx was pre-processed and the data from TCGA was not. In orderto compare effects of doing pre-processing and normalization at a later stage, a controlanalysis was first performed in which the data sets were run through the CSD frameworkwithout any pre-processing as a negative control for testing pre-processing effects. This dataset consisted of 24,753 genes and will be referred to as Analysis 0. After loading in thethyroid cancer expression data into R, the filtering procedures were done in two differentways. As mentioned above, all genes who’s values were less than 6 raw read counts in morethan 20 % of samples were removed. After loading this data into edgeR, it was used toconvert the raw reads into "count per million". Then one version of the thyroid cancer datawas filtered identically as the healthy control data from GTEx and the other version of thethyroid cancer data was filtered according to edgeR’s published recommended pipeline fordifferential analysis.
The first filtering strategy was a complete replication of all filtering step performed in thepre-processing method for the GTEX database. In this case, the expression vectors weretransformed into TPM-units and filtered with a cutoff of 0.1 TPM in at least 20 % ofsamples, see step 3b in Fig. 3.2. This filtering process resulted in a data set of 16,728 genes(original data set size reduced by 32%). This version of the data set will be referred to asAnalysis 1.
Because this filtering stringency resulted in the loss of 32% of the thyroid cancer data, thesick was pre-processed in a second way. Here, the normalization and filtering of contentwas done as recommended in the guidelines in a published paper presenting a workflowfor differential gene co-expression with edgeR [105]. Expression data were required to havea "count per million"-value of at least 1 in at least two libraries, see step 2c in Fig. 3.2.Filtering CPM values rather than raw count values was to avoid favoring genes that areexpressed in larger libraries. After the exclusion of genes with expression values below thiscriteria, the expression values were converted to TPM units, see step 3c in Fig. 3.2. Thiswas a less stringent filtering threshold than implemented by GTEX and resulted in 20,657genes in the data set (original data set size reduced by 17%). This version of the data set
45
3.2. METHOD STUDY AND DEVELOPMENT
will be referred to as Analysis 2.
Gene expression data from thyroid tissue of patients with thyroid carcinoma and healthy con-trol subjects were used to generate a CSD network based on the method described in Chap.2.9. The same workflow described in 3.1.4 was applied for Analysis 1 and Analysis 2. Thisresulted in four networks inferred on the basis if four importance values 10−4, 10−4.5, 10−5
and 10−5.5 for both Analysis 1 and Analysis 2.
3.2.2 Testing the effect of pre-processing strategies
In this thesis the role of proper data pre-processing was investigated by comparing dif-ferential networks from three different methods for pre-processing. The aim of this partwas to examine the effect of alternative work-flows mainly differing in filtering cutoffs forlow-count genes. All together, this resulted in three alternative ways of constructing differ-ential co-expression analysis with normal expression data from GTEX and cancer expressiondata from the TCGA data-base . First, differential co-expression networks were generatedfor each alternative data set; Analysis 0 as negative control for filtering low count genes,Analysis 1 with identical pre-processing as the GTEx healthy data, and Analysis 2 withless stringent filtering as recommended by [105]. The four cut-off values used for networkinference for each the three sets respectively were 10−4, 10−4.5, 10−5, and 10−5.5. In total12 network were created. These were compared in several ways.
Networks were analyzed using the Cytoscape tool Network Analyzer [114]. Network metricswere gathered and presented in Table 5.1. The relative quantities of identical differentialco-expression associations between the three analyses were computed. This measured theextent to which they resulted in similar differentially expressed genes, while taking intoaccount the various interaction types genes could associate by. The effect of the three pre-processing methods on the contents related to biological function was investigated. Theoverlap coefficient was used to quantify the degree of overlap in the genes identified asnetwork hubs between the analyses with correction for different sizes of the sets. Thisquantification was performed by selecting degree cut-offs for genes of k ≥ 10, 20, 30, 40, andk ≥ 50 separately for each analysis and compare each of them against each other. Resultsfrom this examination of hubs is presented in Figure 5.2. Lastly, the three analyses wereassayed for ability to identify disease-associated genes as DEGs included in the networks.Results were compared between the three and formed a qualitative measure of inferrednetwork success.
3.2.3 Parallel programming
When performing computations on large sets of data, like gene-expression data sets consist-ing of several thousand genes and hundreds of samples, the computational load becomes ex-ceedingly large. Some processes implemented in the serial way can take longer to finish thanis acceptable in the scope of a project time frame. By parallelization of computer programs,
46

3.2. METHOD STUDY AND DEVELOPMENT
computations may be run simultaneously. This reduces the total elapsed computation timeneeded, making it very well suited for e.g. correlations among genes in transcriptomic data.
To reduce the time span of a larger computational process of a script or program, imple-menting it in parallel is a way of separating the process into smaller entities, which thenall can be run at the same time. Each of the processes a larger process is divided into areoften distributed on the available computational processing units (CPUs) on a computer.Parallel computing relies on structuring a script or program to perform this computationaldelegation so that the parallelized processes are managed appropriately for effectivenessand success of the program’s purpose. Distribution of input and output must be handledin the program in a way that facilitates rapid access and utilization of information acrossprocessors. Management of processes is important to ensure synchronization of processesfor maximization of program speed. Implementation of parallelized programs can be doneeither by multi-processing, where each process is entirely separate from each other, of bymulti-threading, where each thread may share information with others. Either type of par-allel processing will only perform faster compared to programs implemented in serial if theyare run on computer with hardware supporting parallelization [115].
In this thesis, parallel programming is both implemented in programs written in the pro-gramming languages python and in R.
3.2.4 Development of CSD framework with wTO
Weighted topological overlap (wTO), as discussed in section 2.6.3 was developed by Ravasz[78]. It is a similarity measure shown to capture biologically relevant associations betweengenes in differential co-expression networks. The current available Python-script developedby André Voigt had a run-time complexity of O(n3). For large data sets of 24,753 genesthis would result in O(n3) = 15 trillion calculations. With this run-time performance it’sapplicability to transcriptomic data where n ≈ 25, 000 is limited and proves impractical.
The original implementation of the script created an instance of a NetworkX [89] graph,which is a two-dimensional dictionary. The weighted sum of each gene’s links to it’s neigh-bors was computed by iteration through a double for-loop over this graph-object. For-loopsmay be too slow for a huge number of iterations, especially when the loops are double andthe number of iterations required on each iteration layer is big. This implementation wasthus improved upon by making the first layer of iteration parallelized. In the parallelizedversion of the script the outer layer of this double for-loop was separated into separate pro-cesses. Each of these processes had independent instances of the NetworkX-graph over whicha single-layered for-loop computed the weighted sum of links for each node in the graph ob-ject. As each process needed a copy of the entire network to iterate through, the memoryusage was extremely high. In stead of applying multi-processing, re-writing the script withmulti-threading was done to improve the implementation. After running the multi-threadedPython-script for computing wTO for the differential co-expression network for almost 800
47

3.2. METHOD STUDY AND DEVELOPMENT
hours, it became clear that it would not finish within reasonable time. This could be dueto computational overhang when multiple threads are trying to read information from oneshared global variable.
As alternative strategy, the R-package wTO developed by Gysi et. al. [116] was employed.The approach to use the weighted topological overlap as basis for the CSD framework wasfirst to do soft thresholding of the co-expression data, then applying the R-package wTO totransform the correlation to wTO, and lastly to bring this output back to a format fit forthe CSD framework for network inference. This was done to both sets of expression datafrom thyroid cancer patients and healthy controls.
As an initial step before computing the wTO, soft thresholding was applied to the pairwisegene correlation values. This is applied to accentuate larger values of correlations amongthe many correlation values, while preserving the continuous nature of the co-expressionmeasures. This also reduces the effect of noise in the gene expression values on the pairwisegene correlations, and is a biologically motivated criterion resulting in gene co-expressionnetworks of scale-free topology [117].
Specifically, a continuous measure to assess their connection strength is used:
aij = sβij (3.1)
where β is the thresholding parameter. High values β will force low similarity towards zerowhilst accentuating higher similarities. Here a value of β = 5 was selected to both maintaina scale-free network topology and retain the signs of correlation values.
The file containing the soft thresholded correlation values consisted of n2 values for a dataset of size n. This information was written independently for each gene pair on one line ofthe file. The input for the R-package wTO needed to be in matrix format, thus a Pythonscript was written to do this conversion. So from the gene-pair correlation value file ananalogous correlation matrix was written containing the identical information but in matrixformat, together with a list of all the n genes in the data set. This correlation matrix-fileand the file with a list of gene names were read into R, in which the correlation matrix wasstored as a data-frame for which the gene names were set as row- and column-names.
In the equation for weighted topological overlap (Eqn. 2.14) the connectivity of each nodeis computed, which is the sum of all weighted links connected to the node. In a signednetwork, there may be weight attributes of both negative and positive signs among the linksa node has, which results in a cancelling affect in the node connectivity. To compute thereal connectivity for the signed network, the absolute values of each weighted link is usedto find this connectivity. This is ensured by setting the function parameter sign = ’abs’ forthe wTO()-function.
When this function was done running, the output matrix containing all wTO-values weremultiplied with the signs of the correlation values. By letting these signs be the sign ofthe wTO, no node connectivity was potentially cancelled in the process of computation.
48

3.2. METHOD STUDY AND DEVELOPMENT
This method of preserving the sign of the co-expression measures (which is crucial to CSDmethod), addresses a major limitation in the original investigation of using wTO for simi-larity measure within the CSD framework [118], as observed in [119].
As a final step, a Python-script was written which converted this wTO-matrix back into afile with individual pair-wise genes and their wTO-value. Even though this workflow as a bitback-and-forth this enables the same variance estimation and network inference algorithmsto be applied to the correlation matrix based on wTO. As already explained, there wasmotivation for expanding the alternative similarity measures available providing the basisof the CSD method for differential gene co-expression analysis - whilst keeping most of therobust network inference strategy integral.
This strategy worked well for large correlation-matrices, considerable computation timewas still needed but at least computation of the wTO finished and the differential gene co-expression networks were generated. Results are presented in Chapter 5.2. This method wasapplied to both transcription data sets pairs of healthy controls and thyroid cancer patients,i.e. Analysis 1 (with stringent expression value-filtering, consisting of 16,728 genes) andAnalysis 2 (with looser cut-off, consisting of 20,657 genes). For each of these two versionsthe identical sub-sampling algorithms was used to generate differential gene co-expressionnetworks also for sub-samples of sizes 200, 100 and 50 random samples from the total setto investigate this similarity measure properties at low data set sample size. Results fromthe robustness analysis are found in Chapter 5.4.2.
3.2.5 Development of CSD framework with mutual information
One of the major aims of this thesis was to expand the range of different similarity measuresforming the basis of CSD framework and potentially improve cluster analysis of differentiallyco-expressed genes. The linear similarity measure Spearman’s rank correlation coefficientis employed in the standard way for calculation of pairwise gene associations. Thus, theintroduction of a more general similarity measure capturing a wider range of associationpatterns was interesting to develop. Mutual information (MI) was chosen because it is amore general measure of similarity, capturing both linear and non-linear correlation patterns- a measure that potentially could capture new significant correlations between genes[61].
MI is based on the Shannon entropy, which was initially developed for discrete data, formeasuring degree of independence between systems with a finite set of possible states [120].To compute MI, the estimation of probabilities for each state is not straightforward when thedata has an unlimited number of possible states. This is true for transcriptomic data, whichare experimental measurements recorded on a continuous scale. For these the probabilitydistributions are not known and need to be estimated. Thus, expression values must bediscretized, usually by binning the values into discrete entities with histograms. Binningof continuous data is prone to systematic error [121], and thus various other estimationmethods exist for computing mutual information.
49

3.2. METHOD STUDY AND DEVELOPMENT
The estimation method used in the R-package parmigene finds an estimate of MI from theaverage distance for k-nearest neighbors averaged over all values for a variable instead ofbinning the metrics. This algorithm find a distance to k number of nearest neighbors in atwo-dimensional joint space for a variables as a first step, and this calculated distance isused to find metrics at a distance strictly less than this average distance in the individualsub-space for the given variable. This is done to both variables in a pair for which MI is tobe estimated. The MI for the two variables is generalized into higher dimensions by findingthe maximum norm ∣∣∣∣z − z′∣∣∣∣ = max
∣∣∣∣x− x′∣∣∣∣, ∣∣∣∣y − y′∣∣∣∣ (3.2)
based on the space spanned by each of the two variables X, Y and Z = (X,Y ). Thedistance between zi to its k neighbor is calculated, which is the maximal distance betweenthese points on the individual subspace of variable X and Y . Neighboring point for the Z-subspace are ranked according to the distance ||z − z′|| and metrics less than this distanceare included. This algorithm is used to discretize the metric into units for which the jointprobability distribution can be computed.
In on a comparison done on various estimators for MI as similarity measure for transcrip-tional regulatory network inference [122] found the network inference algorithm "CLR" in-cluded in the R-package parmigene [123] to be the best performing inference algorithmcompared to many others. This study also found the estimation method of MI to be ro-bust. The function in this package for estimation of MI was based on a k-nearest neighborestimator. This MI estimator have minimal bias and is adaptive to yield high resolutionestimates when there are numerous measurements [75].
The first implementation of the code composed of first calculating MI between all gene pairsin the transcriptomics data set as a first step and then converting this matrix into the pair-wise text-format which is input for the variance estimation script from the CSD framework.Estimation of variance could then be done in the exact same way as for the the genecorrelations computed with Spearman’s correlation coefficient. By keeping as many scriptsof the existing CSD workflow as possible was an important goal of this MI development partin order to keep sources or error minimal and maintain comparable results.
Instead of this computationally inefficient implementation, a vectorized version which couldrun in parallel was written using the parmigene R-package with k-nearest neighbor algo-rithms for MI estimation. First the expression-matrices for cancer and healthy patients wasbootstrapped to estimate the variance in MI, an equal amount of samples as in the full setwas drawn randomly for each bootstrap with replacement. This operation was ran in par-allel 20 times to yield 20 matrices of MI-values between all gene pairs in the transcriptomicdata set. The variance in MI for each pair was estimated on the basis of these 20 MI-values.The results from the parallel processing was stored in a list and split into separate lists forcancer and normal condition afterwards. These lists were combined into three-dimensionalarrays for which the vectorized average could be computed. Each MI-value was multipliedwith the sign of the correlation respective value. Then each of the C-, S- and D-scores were
50

3.2. METHOD STUDY AND DEVELOPMENT
calculated and the output was written in the same format as for the analogous from thecorrelation-based CSD framework. In this way the Python script which selects a significantsubset of interactions based on a computed cut-off value for significance to be included inthe inferred network was applicable on the output from the MI-code written in R.
Each of the 20 parallels in this R-program used the function knnmi.all() to estimate theMI for the transcriptomic data with k=10 nearest neighbors. Each parallel was assignedto available cores on the computer. To address some initial memory usage challenges, thecluster types were set to type "FORK" in order for each of them to automatically contain allenvironment variables necessary for computation. This reduced memory usage and made thecode feasible. For the smallest data set consisting of 16,728 genes, the entire computationtime was 603 hours. This code was also applied to random sub-sets of the complete dataset, which were generated with the same sampling method as for conventional CSD analysis.Generation of differential gene co-expression values for these smaller transcription data setswas performed identically as for the full set, by running multiple estimations of MI withthe package parmigene in parallel. This generated differential co-expression values for allgene-pairs. The CSD framework for co-expression variance estimation and network inferencebased on four importance levels p = 10−4, 10−4.5, 10−5 and 10−5.5 was applied as a last step.Results are presented in Chapter 5.3.
3.2.6 CSD framework with alternative Spearman’s ρ
To investigate the role of variance correction in the nominator of the expressions for C-, S-and D-scores, an alternate version Python scripts calculating C-, S-, and D-scores was alsocreated. In this version, differential co-expression networks are generated in a similar wayexcept for the calculation of C-, S- and D-scores which are done without the variance in thenominator of the expressions. The variance is set to 1 for all these gene-pairs. Pair-wisegenetic interaction differences and cut-offs for each score are computed in the same way asfor the original implementation of the CSD framework.
This alternative version of Spearman’s ranked correlation coefficient was motivated by thepotentially valid exclusion of the variance estimation procedure described in 2.9.1. This isthe most time-consuming part of the CSD framework. The same strategy of construction ofdifferential co-expression networks for the full data set and smaller sub-sample expressionsets was applied when using this alternate version of Spearman’s rank correlation coefficientas well. This resulted in four networks, a full set and three sub-sample sets, for boththe transcriptomic data of more and less stringent filtering, analyzed with the alternatecorrelation coefficient.
3.2.7 Comparison of alternative similarity measures
The four alternative similarity measures as basis for co-expression computations were com-pared in the aspect of their success as foundation for generation of biological meaningful
51

3.2. METHOD STUDY AND DEVELOPMENT
differential gene co-expression networks with high validity and robustness.
Networks for each of the four similarity measures were inferred with four importance levelseach (p = 10−4, 10−4.5, 10−5 and 10−5.5) with the CSD framework. These will be referredto by the following terms based on the similarity measure as basis for CSD:
• CSD: Spearman’s ranked correlation coefficient ρ
• CSD-VAR: Spearman’s ranked correlation coefficient ρ without correction for variancein ρij for gene pair i, j
• wTO: weighted topological overlap
• MI: mutual information
The role of the similarity measures were examined by comparison of network characteristics.Network Analyzer [114] was used to extract relevant network parameters descriptive ofnetwork quality.
In order to compare the resulting networks generated on the basis of these different similaritymeasures in a quantitative way, their robustness for small sample-size was studied. Thesample size will be denoted on the x-axis of the resulting comparison plots. For all categoriesof similarity measures applied, smaller random subsets from the expression data were made.Maximum number of samples corresponded to the entire data sets of both conditions, 504with thyroid cancer and 399 normal controls. This was used as reference to compare thesub-sets with. Smaller sets were constructed by selecting a identical number of randomsamples from the thyroid cancer or normal data sets, and writing new test data-files withthese sample sizes. For each data set a sub-sample of 200, 100 and 50 were made so thatthe smaller sets were contained in the bigger. The expression values for all genes for thesesample-selections were included in the test-sets, constructing gene expression files of 200, 100and 50 samples for both thyroid cancer and normal control transcriptomic data. The dataset this analysis was performed on was Analysis 1, consisting of 16,728 genes. This effectivelysimulated low sample size. The same differential gene co-expression analysis workflow wasapplied to all these collections of sub-samples of transcriptomic data for thyroid cancerand the healthy control patients. The importance level for each of the inferred networkswas 10−5. The ratio of the inferred interactions of the sub-sets that were also containedin the full set was quantified with the overlap coefficient. This was done analogously fornetworks based on the four alternative similarity measures to precisely quantify robustnessto (simulated) low sample-size. Plots comparing the four similarity measures’ robustness ispresented in Chapter 5.4.2.
52

3.2. METHOD STUDY AND DEVELOPMENT
Lege
nd
:
Pyt
ho
np
roce
ss
C++
pro
cess
Rp
roce
ss
Au
tho
rco
ntr
ibu
tio
n
wTO
_no
rm_m
atri
xw
TO_s
ick_
mat
rix
sick
no
rmal
1. E
nse
mb
len
ame
con
vers
ion
1. E
nse
mb
len
ame
con
vers
ion
4.K
eep
com
mo
nge
nes
25
k
55
k
2+3
. Filt
er
sick
5.F
ind
Co
rr-
An
dV
ar7
.Fin
dw
TO6
. So
ftth
resh
old
ing:
Rai
seρ
toρ
5
rho
No
rm_m
atri
xrh
oSi
ck_m
atri
xrh
oN
orm
_sig
nrh
oSi
ck_s
ign
no
rmal
Rh
oN
orm
Rh
oSi
ck
10
.Cre
ate-
Net
wo
rk9
.Fin
dC
SD
Usa
ble
CV
alu
esU
sab
leSV
alu
esU
sab
leD
Val
ues
AllV
alu
es
CN
etw
ork
SNet
wo
rkD
Net
wo
rkC
SDse
lect
ion
Rh
oN
orm
Rh
oSi
ck
8.A
pp
lysi
gnan
d f
orm
atw
TO
Rp
acka
ge:
wto
[wto
]w
TO
sick
no
rmal
1. E
nse
mb
len
ame
con
vers
ion
1. E
nse
mb
len
ame
con
vers
ion
4.K
eep
com
mo
nge
nes
25
k
55
k
2+3
. Filt
er
sick
5.F
ind
Co
rr-
An
dV
ar7
.Cre
ate-
Net
wo
rk6
.Fin
dC
SD
Usa
ble
CV
alu
esU
sab
leSV
alu
esU
sab
leD
Val
ues
AllV
alu
es
CN
etw
ork
SNet
wo
rkD
Net
wo
rkC
SDSe
lect
ion
no
rmal
Rh
oN
orm
Rh
oSi
ck
CSD
5a.
Fin
dC
orr
sick
no
rmal
1. E
nse
mb
len
ame
con
vers
ion
1. E
nse
mb
len
ame
con
vers
ion
4.K
eep
com
mo
nge
nes
25
k
55
k
2+3
. Filt
er
sick
no
rmal
Rh
oN
orm
Rh
oSi
ck
7.C
reat
e-N
etw
ork
6.F
ind
CSD
Usa
ble
CV
alu
esU
sab
leSV
alu
esU
sab
leD
Val
ues
AllV
alu
es
CN
etw
ork
SNet
wo
rkD
Net
wo
rkC
SDSe
lect
ion
5b
.Se
tva
r=1
CSD
-VA
R
sick
no
rmal
1. E
nse
mb
len
ame
con
vers
ion
1. E
nse
mb
len
ame
con
vers
ion
4.K
eep
com
mo
nge
nes
25
k
55
k
2+3
. Filt
er
sick
5.F
ind
MI-
An
dM
IVar
7.C
reat
e-N
etw
ork
6. S
plit
Usa
ble
CV
alu
esU
sab
leSV
alu
esU
sab
leD
Val
ues
AllV
alu
es
CN
etw
ork
SNet
wo
rkD
Net
wo
rkC
SDse
lect
ion
no
rmal
CSD
_MI
Rp
acka
ge:
par
mig
ene
[kn
nm
i]
MI
Figure3.3:
Illustrationof
theim
plem
entatio
nof
four
alternativesim
ilarit
ymeasuresto
theCSD
metho
d.
53

3.2. METHOD STUDY AND DEVELOPMENT
Another way of comparison was to compare the network homogeneity. Box-plots of networkhomogeneity were generated for networks built upon each similarity measure and compared.This was done with the intent of examining how similarity measure related to the segregationof the various categories of changed transcriptional behaviour.
A last, but very important comparison of the similarity measures was to investigate theirrelative ability to identify thyroid cancer-associated genes. DEGs from networks based oneach of the four similarity networks were converted to Ensemble IDs to maximize likelihoodof the IDs to map to the GAD database [111]. This assay was performed with the PANTHERtool [83] and resulted in the number of thyroid cancer-associated genes present in each ofthe four networks, numbers of which were subsequently applied to assess the four similaritymeasures’ ability to infer biologically informative differential gene co-expression networks.
54

Chapter 4
Results & Analysis: Application toThyroid Cancer Expression Data
This chapter features an analysis of the differential co-expression networks constructed basedon the transcripomic data of thyroid gland tissue from patients suffering from thyroid carci-noma and healthy controls. The differential co-expression networks were generated with theCSD framework. The goal was to use these networks for biological analysis of how thyroidcancer is manifested on gene co-expression patterns. These results may contribute to theelucidation of changed patterns in molecular mechanisms relevant for the pathogenicity thisdisease.
4.1 Construction of differential gene co-expression network
A differential gene co-expression network was constructed from the transcriptomic data setfor thyroid gland tissue from thyroid cancer patients and healthy control persons. The CSD-method was employed to construct a network of genetic interactions. The data set consistedof gene expression measurements of 20,657 genes with 504 samples from patients with thyroidcarcinoma and 399 healthy control persons. All gene expression samples were measured inthyroid gland tissue. The resulting network represents a significant selection of gene-pairsand their associations. With an importance level of 10−5 the CSD-method resulted ina network consisting of 1516 nodes (genes) and 3612 edges (gene-pair associations). Thenetwork has 303 C-links, 340 S-links and 873 D-links. As a general observation, this indicatesthat many of the inferred associations between gene expression patters are behaving in adifferentiated manner between thyroid tissue with cancer and normal tissue. There are manygenes which have a strong anti-correlated transcriptional pattern when the tissue changesfrom healthy to thyroid cancer.
The network is visualized in Cytoscape [107] in Fig. 4.1. Networks using four differentimportance levels were generated. With the intention of creating networks suitable for
55

4.1. CONSTRUCTION OF DIFFERENTIAL GENE CO-EXPRESSION NETWORK
analysis, an importance level resulting in a network of appropriate size was chosen. Thosegenerated for 10−4 or 10−4.5 had an enormous amount of nodes (6593 and 3535 respectively)and that for 10−5.5 was perhaps small (694 nodes). Hence, the importance level 10−5 resultedin a network of desired size and density facilitating analysis.
The network consists of five bigger components with more than 40 nodes. The majorityof nodes are found in three largest network components. The largest component is madeup by 827 nodes (55%) and there are two smaller ones of 113 (7 %) and 101 (6%) genesrespectively. The remaining 475 nodes are either in groups with a few nodes or just two ina pair.
Many of the links between genes in the largest connected component are differentiatedand specific associations. The differentiated links are most numerous, and represent strongco-expression relations of genes to their neighbors which change sign when the conditionchanges. The specific links are strong strong co-expression relations which are completelycondition dependent; for one condition they are strong and for the other there is no co-expression similarity to the neighbor genes no more. There are some occurrences of con-served associations as well, but the majority of links are differentiated and many are specific.
The topology of the largest component is interesting. It has two clear groupings with denserregions, forming almost two separate communities within this component. Between thesetwo parts of the largest connected component there are some nodes linking them together.In the largest connected component the topological network structure is quite dichotomous,there are clear central regions of high interconnectivity but also presence of hubs linking tolow-degree nodes and avoiding each other. In both of these dense communities in the largestcomponent there are particularly interconnected neighborhoods and may indicate segrega-tion of genes encoding molecules involved in different biological functions and potentiallydistinct cellular phenotypes [84].
56
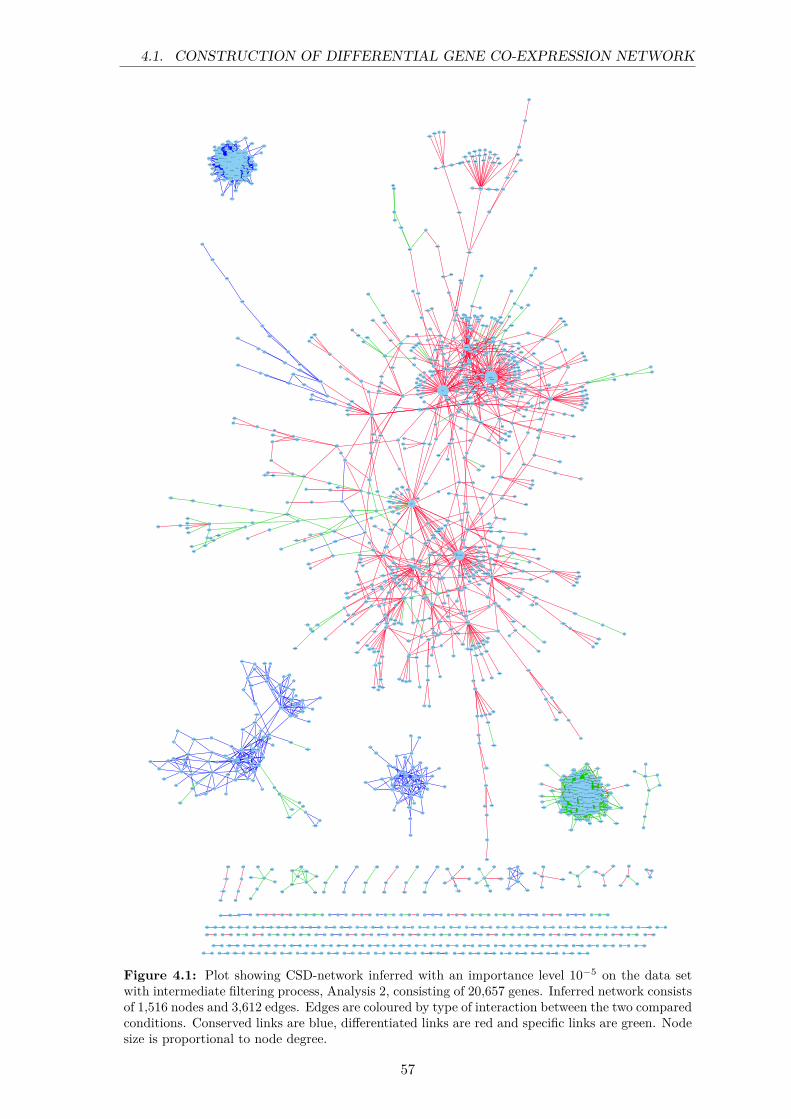
4.1. CONSTRUCTION OF DIFFERENTIAL GENE CO-EXPRESSION NETWORK
KCNN4
NDFIP1
MGAT3
BEAN1ANXA2
SPOCK2
SLC27A6
MUC1
LAMC2
ST6GALNAC5
EVA1A
CXCL16
TCTA
ACOT9
PPRC1
GATAD2ACDK19
CIRBP-AS1
CACNB4PLXNC1
SEMA4F
LRG1
ABHD1
OSMR
MAP3K6
RNASEH1
SLC20A1
AL049838.1
ALDH1A1
AMOT
ZMYND12
FN1FLNA
PDIA3
RASA1MACF1
TSTA3
SEC23ARNF40
AC124045.1
TMEM63A
MRPL14
TBC1D30
TXNRD1
MON1B
NT5DC2
POC1B
TMPO
CEP170B
KIF1BP
GSR
CIAO1
PCAT19
RNF123
RPRD1A
FEM1B
CLTC
SPOPL
RPA1
PRKAR2A
PSMD4
UBQLN1
ERH
DHX8
MRPL27
KBTBD4
SRP72
CHUK
COPA
NUP133
AL591895.1
NUTF2
PTPN11VPS35
WDR92
PIR
ASPA
BAZ2AC3orf18
AP001830.1
KIF6
NAMPT
SH3BGR
DSC2
INPP4A
C16orf89
DYNC1I2
DSG2ACVR1
MORN2DSP
DHRS7B
WDR26
CCDC183
NDUFC2
GGA3
NDUFA8
ERLIN1
EFL1
TTC3
MYH10
FBLN7
EPRS
ABCB6
TMEM98
ALDH2
SLIT2
GSN
PPIB
NTHL1
LTBP3CAND1
SERPINA1SFTPB
TMEM92
STAT3UBE3C
DIAPH1
ABHD14AFAM104B MBOAT1
EMC3
FIGNL1
XPR1
UBQLN2
ITPR3
UBAP2L
MCMBP
GLS2
ZNF702P
AGFG1
RAB11FIP1
PRKDC
IDH3A
MICAL3
CYB5RL
NDUFV2
CCDC159
EIF5APSMB4
GTF3C4
TGFBRAP1
WASHC5NIPA2
CNOT1
AC009812.1EIF3A
ACLY
ZNF747
SEC23B
DNAJC11
ALG11
HEATR5A
GNS
DHTKD1
SLC31A1
ZFYVE9
MAN1A2B3GALT6
DNAJC14
MAPK1IPPK
NOMO2
CLCN3
ZNF655
NUP98
PRRC1
ACBD3 RFNG
EXOSC4LRRC29
TGS1CTR9
DHX9
TRIP12
CHMP4BP1
TBC1D14
MSANTD4
ATXN1L
UTP14C
LUC7L
MTF1
SMG8
ZNF41
REST
PIKFYVE KAT6A
ZNF81
PSMB3
PSMA2
SPTLC1 CUL3
HNRNPUL2
HAUS7
CHAMP1
RAVER1
PSMC4
IPO9
COPB2
PFDN6
FAM91A1
IARS
HHLA3
NCBP1
CCDC24
DIS3
FAM98C
TMF1PARK7
GORASP2
DAG1
SMURF1
PSMD2
LBHD1
SMIM7
ELP6
PSME3
RECQL
NCBP2-AS2
NDUFB9
NDUFS3
EMC4
PSMB6
CUL4A
KLHDC9
ATP6V0A2
DM1-AS
CCDC102A
TNFSF12
SDHAF2
RTL6
BAZ1BMORC3
ERCC5
NFX1
TRAPPC1
SMC5
ATP5J
UQCR11
DMAP1
HSD17B10
ETFB
MRPL54
DCLRE1B
PRADC1
ERC1
UQCRQ
ATP5O
ATP5L
PSMC3
MANBAL
SOD1
C19orf70
ATP5E
ATP5J2
COX6B1
NDUFA13
COX6A1
NDUFS6
ATP5ME
NDUFA1
COX6C
COX4I1
LLGL1
ELOB
NDUFB7
LRRC45
NDUFB1
ROMO1
NDUFA2
SIRT4
C2CD3
AP1G1
AIMP2
PSMD1
EIF4G1
ENY2
SEC16A
KPNA1
SLC24A1
PSMC5 KMT2D
DHX36NDUFA9
HARS
NUP153
PSMD13
ATP2A2
TMEM208
HP1BP3
NBPF1
IBTK
PLEKHM3
MRPS18C
NCOR1PGP
FAM208B
TALDO1
KIAA0232WRN
YTHDF3
UTP23ZC3H12C
NDUFS1
SF3B4
IPO4
SUCLG2-AS1
DCAF1
SON
SEC24C USP12QTRT2
ADRM1PIK3R4
C1orf35 KLHL11
CTBP1
GFM1
TMEM42
RBCK1
MFSD14A
CCS
WAPL
USP8
INO80B
RNF111 SLKRP9P
WDR44
EP400
MINDY2
SNRPB2
IMP3
PTGES2
WDR3
CUTC
ARID1A
GPRASP2
PHF1
TUT1
DDX21
LARP4
AC074212.1
CNNM4
ALG3
MRPL32
XPO5
MPP7
TAF5L
EVC
SNRPA1
PPOXSSBP1
RALGAPB BEND5DDX18
FBXO38
XRN2
INVSUBE3B
NOP16
TSTD2PSMB1
FKBP8
PTRH2
PAXIP1-AS2
GSPT1
CSNK1A1POLR2B
PLAA
PIK3C3
RPRD1BRAB3GAP2
PCYT1A
BGLAPCLPX
GTF3C2CLINT1DLST
SLC25A46
SEC24AGAMT
HSD11B1L
TCEA2
ZNF800
MED14
LRRC37A17PAC003072.1
TRAPPC10
CS
TRAPPC8
ALKBH2
SELENOI
MRPL20
LEMD3
GABPB1
ARFGEF2
ABT1
SEC23IP
DHX15
ATP5IF1
LPCAT3
RPUSD2
TOMM40CYP51A1
FBXW2
AHCYL1
SLC25A24
SMARCA5
FAM160B1
POLR1C
CTD-2132N18.4
SCYL2
PSMA3
GART
G3BP1
UFD1
WDR43
MTMR1
NIT2
CSNK2BAC084036.1
MTOR
ZGLP1
IGKV1-16
IGHA1
IGHV3-21
IGHJ3
IGHG2
IGHV5-51
IGKV2-28
IGLV2-8
CD79A
IGHA2IGLV1-47
IGHV3-49
IGLV1-51
IGKV1-17
IGHV1-24
MZB1
IGHV1-69
IGKV1D-39
IGHV3-48
IGKV1-9IGLV3-25
IGLC2
IGLV3-10
ATP5H
IGHM
ATP5G1
COX7B
IGKV1-12IGHV3-53
IGHV1-46
IGKV2-30
IGLV3-21IGHV4-39
IGLV3-19
IGHV3-15
IGKV1-8IGHV3-11
IGHV3-74
IGKV3-11
IGLC3
IGHV4-59
IGHG3
IGHG1IGHV3-30
IGLV2-11 IGLV2-14
IGHV4-34
IGHV1-2
IGKV4-1
IGHV4-55
IGHV1-18
IGHV2-5
IGHV3-33
IGKV1-5
IGLV3-1
IGKV3-20
IGKV3-15
IGLV1-40
JCHAIN
IGHV3-23IGKV1-6
IGHV4-61
IGKV3D-20
IGKV1-39
IGLV2-23
IGHGPIGHV3-7
IGKV1-27
IGKJ5
IGLV1-44
IGHV4-31
IGLV6-57
DMTF1LAT
CROCCP3
APBB3
EIF4A1
SLC25A3
HSF4
MYH7B
COQ6
KAT2A
RBM25
L3HYPDH
AC090589.3HNRNPH1
KRBOX4
CNTD1
KRR1P1EBLN2
FNBP4
AL049552.1 AL928654.3AL355075.2
WSB1
SRSF11KHDC4
PLA2G4BAL158152.1
AC010761.1TCERG1
NKTRCREBZF
HNRNPU-AS1
CCNL1
TMEM182
KPTN
RPP25L
OSER1-AS1
RCCD1
ATG16L2 DNASE1
UBE2Q2P1 ABHD16ASNX15AC005104.1
AKAP8
MYCBP2
MKLN1
IREB2
NEK4
DMXL1
LZIC
UBR1
CNPY3
AC008870.2
DCAF16
FLNB
ISYNA1
MIA3
ZNF252PPSMD6
BPTF
FUBP3
SCAF8
BIRC6
SOS1RANBP2
TUBB4B
HHAT
OPA1CYHR1
PDE12
SPAG9
MEDAG LYRM7
FSTL3 AC002546.1
FLRT1
FAM201ASLC1A5
SGMS2
MRPS23
AC037459.2
PTPRF
POLR3C
LENG9
HSP90B1
ABTB2
MMP15
IL13RA1
BTBD11
IGSF9
AOC2
PROS1
NAXD
CC2D1B
LUCAT1 FAM111A-DTMT1M
UAP1
C16orf96
CYSRT1DDX52
MYL12B
CFAP53
ANKLE2
C2orf73
CDK2
FBXO15
LINC00886
GARNL3
SERPINB8
STAC
MEX3C
MAP1LC3A
HSPA5MICAL2
UST
TCEANCMIR22HG
BAIAP3TMEM79 TMEM218
KEAP1PRPS1
QRICH2
NXN
KRT19
TMPRSS4
ELF3
AHNAK2
CYP2S1
TNFSF9
CD55SNX1
SRP14-AS1
WDR55
AC015726.1
SUPT16H
CHPF2
ERCC6
LINC00852PPL
B3GNT3 PERP
SRGAP3S100A2 BCDIN3D
KCNQ3
CHST14ITPKC
TSN
ELAC1CALR
DOCK9
RBM17
ITGA3
FAM167A
IGFBPL1
LINC02001
DGAT2
VAMP8
TBC1D8-AS1WWOXGABRB2
GATM
AF131216.3
MATN2
NCSTN
HMBOX1 ANKRD46
SLC4A4
SGMS1
MARC2
CCL5
P2RY10
SH2D1A
SP140
ZBP1
ARHGAP9
CYTIP
ITK
PSTPIP1
CTLA4
ICOS
GBP5
PTPRC
PTPN22
PTPN7
CCR5
CD3D
TRAC
SIRPG
CD48
ITGAL
CD5TRBC2
SLAMF7
ZAP70
CD7
CD247
CD6
TPD52L1IVD
TCIM
AP3M2
ISM1
ACACB
ARHGAP10
CLEC2B
DIO1
PRIMA1
MCCC2
TACC2MDKCPT2
PRKACB
AFF2
CLIP3
RXRG
TRAF3IP3
CD3G
IL2RG
CD3E
CD2
CD52
BAIAP2
NR2F1-AS1
CCDC148
CAP1
TPO
SCML2
DRAM1 A2M-AS1
NECAB3RAVER2
CCDC87
OSGIN1
NUCB2
SUSD4
HSD17B3
ENTPD2TECTB
IRAK1
FAM43A
BCL2
LSR
PAPSS1
MPPED2
ZDHHC11BAC120498.3
IQCH
C16orf74
DPY19L2
CASC2
DICER1-AS1
SPXTNRC6C-AS1
LOH12CR2PLS3
C20orf96
CCDC146
MBOAT2SLC17A5
ECE1AL390726.5
SPINT1
ZNF781
MAPKAPK3
MYD88CASC1
RYR2
RNF157-AS1
SF3B3
OCIAD2
GCSH
L3MBTL4
HGD
CYB561
SLC7A6
BTBD17TG
MLEC
SFN
FBXL5
IQGAP2
MAGT1
CANX
AP000442.2
FUCA1
SLC39A11 C6orf89
ESAMTEX261
ATIC
SLC34A2
PTPRE
DCSTAMP
ERG
GIMAP8
MTMR11 CDHR3
IQCH-AS1
BCL9SPATS2L
IDS
PKM
SLC27A4
AMZ2P1MSMO1
PFKFB3
PYGB
NCOA4
PIGBOS1
KSR1
FAM155B
ITPR1
MRO
POU2F3
ITPR1-DT
GPAM
PHF20L1
USP16
MROH6
TBCEL
RANBP10C19orf66
ZADH2
MAGEF1
EDNRBRAD51B
CALCOCO2
S100A4
PC
LPGAT1
IRS1
CASC15
METTL7A
CTH
AC006978.1
DHRS3
OLFML2B
LIMA1
F2RL1
DUSP5
CDCP1
SYTL2
SLC25A29
USP3-AS1
ATP1B2
ANXA3
SMTN
XKR4
FAM84B
FAS
GSTM2
CAPSLRIMBP2
CLEC3B
TMEM204
NRIP2
CRABP2
FHL1
SCN4B
ADGRV1CDC42EP3
SYBUKLF15
STAT4PTGS2
ADIPOR2
MMP11
BHLHE40
KY
TNFRSF12A
IL1RL1 RAD23B
AL357055.3
FAM111A
CLCF1
HNRNPFNPTXR
FUT2
AL359504.2
DLGAP4
HIF1A
BAG3
SDC4
PI4K2A
TUBB6
AC010186.2
LDLR
FAM129B
AC062029.1
AC009041.2EPHB3
PLRG1
MAPT
C11orf80
AC108471.2
AXIN2
SNX22DNAJC3-AS1
QDPR
SLC35B1DOCK5
NNMT
LINC01886
SLC25A37
EPHA10 WDR86-AS1
NELFCD
AC010980.1
TFCP2L1
ACVR1BME1
AC141930.1
CFAP54
SCNN1A
BCL2L1
VEPH1
AC005041.1TGFA
C12orf76
ZFYVE19
LINC00612
ARAP1
SGK1
TNNI2
CCR1
AIF1
HCK
SIGLEC9
CD163
VSIG4
FOLR2
MS4A4A
RPS24
RPL7A
RPL5
RPL15
RPL4
RPL22
RPL36A
RPL38
SLAMF6
PCED1B-AS1PLCB2
IKZF1
BIN2
NCF4
TNFSF13BSASH3WAS
TLR8
CYBB
MYO1F
CD37
CORO1A
PARVG
NCKAP1L
TBXAS1
DOCK2
HAVCR2
BTK
ARHGAP30
CD86
APOBR
CYTH4
LAIR1
CD33
CSF1R
RNASE6
C3AR1
C1QB
C1QC
LRRC25
C1QA
MS4A6A
LINC02289 ACE PGGHG AC136475.3ARHGAP27P1-BPTFP1-KPNA2P3AC132812.1AFDN
XRCC5 FH IL24 FCMR MCM10FHOD3ZDHHC9 DDX39BSTK36DIO3PTNDIO3OSNOD1DYNLRB1EEF1A1 TM9SF2
ABCC3PLEKHJ1ABRAXAS2WACAC004847.1
TMEM119DLL4TMEM150CDNAJB11MANFDONSONMCM4DUSP22
GJB3OPN3 AC084033.3 CPAMD8 AC060834.1AC109361.2RARS MYO1GAC007388.1PRR29AC023301.1NETO1AC025594.2
RPL6EVI2B EVI2A PEG10 ENO3 NEXN ENDOD1EXO1
ARMCX6OTOSASAP2HEATR1ASPH
KIAA1522MTAPLAS1LUBL4ALGALS3METMFGE8 S100A8 JAML
FLT4 PODXL AFAP1L1HBA1HBA2HBBHPS4MIEF1ISY1DSG1 MKI67KRT1 KIF18B CKAP2LKRT13 KRT2RHCG
ARL6IP6RBM12ARMC5PATL1HYAL2B3GALT5B3GALT5-AS1BIRC2TANC1BTN3A1BTN3A3CAMK2N1
NDRG2MFSD5PPP1R14BP3MID2TMPPEMRFAP1L1PHAXMTPAP
ST8SIA4 NRIP1 CAMSAP1 SMIM3CASP12CCDC144A
NPY1R PLAUR NFE2L3 WDFY3-AS2OSGEP NPY5RSNAPC2TCTEX1D2 SLC26A4-AS1TBC1D5 SLC26A4TMEM176ATMEM176BVN1R81P
PFN1CHTF8TRMT112COBLSERGEFCOL4A1COL4A2COLCA1DBR1 FOXP3 LGMNCSTAMCM2 CYB5D2ZNF227 COLCA2COMPLAMP5CREB1REV3LCSNK1ENIF3L1CST6
P3H4VARS TAF11PHF13
USP32P1CCDC94TRMT61ACCL22
AC018638.4AC108010.1AC012254.3ZNF248AP001486.2BHLHE40-AS1LCN6C15orf52 AC018638.2 ZNF714SLC26A7 DCBLD2 CCL17MRC1CD300LFEPHA4
MCEMP1CD34PCDH12CDC42BPBNFKBIBCDRT1DNAAF1CFL1
PON2TBCERFFLTXNRPL7RPS3ASGSM2ZMIZ2
MYH2
ACTA1
CKM
TNNT1MYBPC1
MYL1
AC027281.1
ITFG2-AS1
AC005725.1
AC002070.1
AL355353.1
HIST2H2BC
AC011450.1AP003096.1
AC010207.1
AC116533.1
AC027307.2
AL031768.1
AL031663.2
AC016727.1
AC005288.1
AC015971.1
ANKRD18A
SNORD109A
AC112198.2
HLA-B SULT1A2 HIST1H4I TBC1D15HLA-FISCA2 MPHOSPH8 HNRNPRMYO10
SMG9AL359853.1FAM163AALDH3B1F11RANGPTL1EHD2ANKRD11 ZFP69BAFF4ZFP64AKT3KLHDC3AL031710.1CCND1AL359752.1
FOXJ3SETD2FXR1GDPD3GATA2KCNE3GGCT
ARF6 GOLGA4 EXOSC1APOOLRASGEF1BARIH1 ARHGAP18CFLARASXL2
PLEKHA6GNA14PDLIM4GTF2IMFAP3HAND2HAND2-AS1HINT3
SMG1
CHD9AL450326.1
SAP30BP
PIK3R2
TRIM58
PPIP5K2
VPS13B
SNRPN
AC009093.1
COL10A1
COL11A1
CINP
LSM10
FAF1 AURKAIP1 LMAN2NCF1 FARP1HSD11B1PRRC2B
USP37 PABPN1NCF1C TMEM164 ZNF593THBS2
SPNRPS19BP1
LCAT LDHB MRPL12NCF1B SLAMF8SEM1
SERPINF2
HLA-DRA
RNF31
HLA-DOA
HLA-DRB1
HLA-DQA1PEX16
SDF2L1
LPAR5
NGEF
MTURN
CRELD2
MAPK13
ERBB3
FBXL14
VCANSEC61B
PYGM
WISP1TAB3
HLA-DPB1 OPHN1
CD74
HLA-DPA1
RNF25
RARRES1
SERPINF1
C1S
C1R
CCR7
TNFAIP8L2
PILRA
TYROBP
ITGB2LAPTM5
PIK3R5
SNX20
CD84
CD53
LCP1
DOK2
SELPLG
ITGAM
ACVRL1
EMCN
MYCT1
RASIP1
LDB2
PRSS3
TSFM
FZD4
RPARP-AS1
AC234775.3
GPR75
SNF8
GNG11
FHIT
C1orf115
HMCES
BATF
LSP1
SPI1 TFEC
FCER1G NCF2
PRSS1
CTRB1
CPA2
CTRB2
REG1A
GP2
REG1B
SPINK1
TNS3CPA3 SAA1CNIH3 SAA2UBASH3BTPSAB1EXOSC9 ALOX5S100A10CATSPER1MXRA8AC008764.2 TPSB2 SNAI2CXCL1 MT1HGEMOLFML1 EPB41L1 KRT4LIN7A NWD1MT1FMT1GRPL36 BANF1SARNP EIF4G2RPLP2 RPS15RPLP1
FAU
UBA52
RPL12
RPS27
RPL19
RPL13A
RPL27
RPL24
RPL35
RPL18
RPS20
RPL29
RPS3
RPL34
RPL31RPL23
RPL37A
RPL11
RPS6
RPL14
RPL37
RPS15A
RPL27A
RPL35A
RPS11
RPS14
RPL32
RPS8
RPS7
RPL30
RPS25
RPS21RPL26
RPS23
RPL7P9 AC013268.1
AC116407.1
AC009065.2
PRKG1
RPSAP58
RCAN2ZNF430
RPL14P1
AC215219.1
ROR1
AC017104.1AC090673.1
MALAT1AC024896.1
SPATA13
AC078881.1DUXAP8AC145124.1
AC026877.1
AC007611.1AC009831.1
SNORA33
AC092287.1
TIMM10B
AL121761.1AC004980.1AP002490.1
AC130689.1
AL158151.1AP006222.1
AC099778.1
AC073343.2
SNHG28
EMG1
MB
AL365277.1
NRAP
GOLGA8M
MATR3
AC007204.2
MYH1
AL391650.1AL121992.1
AL139396.1
AC139530.1AP002495.1
AC008536.1
CYB561D2
RGS5
AC067735.1AC004492.1AC079834.2
SCARNA6
AL133410.1
LINC01481
AC091178.1
AC090559.1
AC107068.1
AL162511.1
RPL10P9
AC004520.1AC010329.1
AL590764.1
AC018690.1
MIR145
AC005229.1
AC097639.1
AL355388.1
AP004242.1
AC018450.1AP001992.1
AC007773.1
AC010203.1AC093788.1
AC023157.1
AC119674.1
RPS27AP16
HAR1AAL357060.1
AC034236.2
AC090825.1
AC106795.1AC034236.1
AC004943.1
AC139149.1AC019205.1
COG8
AL135791.1
AL009174.1
AL133260.1
AC078785.1 PGAM1P8 AL590235.1
AC013731.1 AC007842.1
AL132780.1AC104825.1
AC078864.1
LINC01936
AC011477.1
AC118344.1PDE5A
Figure 4.1: Plot showing CSD-network inferred with an importance level 10−5 on the data setwith intermediate filtering process, Analysis 2, consisting of 20,657 genes. Inferred network consistsof 1,516 nodes and 3,612 edges. Edges are coloured by type of interaction between the two comparedconditions. Conserved links are blue, differentiated links are red and specific links are green. Nodesize is proportional to node degree.
57

4.2. DEGREE DISTRIBUTION
4.2 Degree Distribution
The node degree distribution is a very important aspect of network analysis. It depicts thedistribution of nodes with various degrees in the network and thus describes how complexthe network structure is. In the differential gene co-expression network constructed the nodedegree distribution follows a power law, given by the equation y = 524x−1.5. The correlationvalue of the fitted line is R = 0.998 (R2 = 0.887). The degree distribution on a logarithmicscale is shown in Fig. 4.2.
Figure 4.2: Plot showing degree distribution on a log-log scale for the CSD-network of Analysis2, data set with 20,657 genes. Both axes are on logarithmic scale. The red line represents thefunction for the approximated power law fitted to the data points. It’s expression is given in thetop right corner.
This good fit between the power law-function and the data on a logarithmic scale indicatesthat the network is complex and scale free[1]. As is evident of the degree distribution thereis a small number of nodes with very high degree while the vast majority of nodes havevery few neighbors. The degree distribution indicates that there co-exists nodes of very lowand very high degree in the network, being a characteristic of scale-free networks. This isvery different from networks generated by random network models, which have a networktopology characterized by an excess of nodes with comparable degree and no hubs. In scale-free networks such as this differential co-expression network, the hubs often have importantmetabolic roles. The low degree exponent of the network γ = −1.5 argues that the hubs arevery central to the functionality of the thyroid tissue.
4.3 Hubs and assortativity
Hubs are defined as highly connected nodes, a loose definition which makes it expedient toset a limit to the degree of nodes which will be included in the definition as gene hubs inthe inferred network. A limit of k ≥ 40 produced a list of 22 genes with degree 40 or higher.
58

4.3. HUBS AND ASSORTATIVITY
These correspond to the top 1.5 % of nodes in the network by degree. These high-degreenodes, the network hubs, can clearly be observed in several areas of the network in Fig.4.1. These hubs are biologically interesting because they represent genes which co-expresswith a very high number of other genes - indicative of functional importance. Table 4.1shows the network hubs sorted by degree and some of their associated properties, includinginformation about the local clustering coefficient for each hub. Each row is coloured by thetype of link most typical for the given hub, blue rows are hubs with predominantly C-links,green for S-links and red for D-links.
Table 4.1: Genes in the CSD-network with degree over 40, categorized as network hubs. k denotesthe node degree, kt is the number of link of type t ∈ (C, S,D) for each hub. H = homogeneity. Cv
= clustering coefficient. Row colour describes the predominant link type for each hub respectively,blue if C-links, green if S-links and red if D-links.
Name k kC kS kD H Cv
MICAL3 59 0 0 118 1.0 0EVC 54 0 0 108 1.0 0IGLC3 52 104 0 0 1.0 0.45IGKV1-5 50 100 0 0 1.0 0.48FAM111A-DT 49 0 0 98 1.0 0IGHV3-30 48 96 0 0 1.0 0.5IGHG1 48 96 0 0 1.0 0.5IGKV3-20 47 94 0 0 1.0 0.5JCHAIN 47 94 0 0 1.0 0.5IGHG3 46 92 0 0 1.0 0.5IGKV4-1 45 90 0 0 1.0 0.5IGKV3-11 45 90 0 0 1.0 0.6IGLV1-40 44 88 0 0 1.0 0.5IGHA1 43 86 0 0 1.0 0.6AC097639.1 42 0 84 0 1.0 0.3AL121992.1 42 0 82 2 0.95 0.3AL009174.1 41 0 78 4 0.90 0.2AC034236.1 41 0 76 6 0.86 0.2AP004242.1 40 0 78 2 0.95 0.3MALAT1 40 0 72 8 0.82 0.3AC067735.1 40 0 80 0 1.0 0.3IGHV5-51 40 80 0 0 1.0 0.6AMOT 40 0 6 74 0.86 0
We can observ that hubs with predominance of C-links have a substantially higher clusteringcoefficient than the average clustering coefficients for the network. Their co-expressionassociations remain intact between the studied conditions. C-dominated hubs with highclustering coefficients are likely to be found in well-defined cliques in the network where
59
4.3. HUBS AND ASSORTATIVITY
mostly all neighbors are linked to each other [78]. Tightly interconnected clusters like thesemay form due to functional similarity. Their components are often vital for the integrity ofthe cellular behaviour, thus some are evolutionary conserved [124]. This testifies that theC-type network hubs may have essential roles in the cell which a are not changed in thyroidcarcinoma. Conversely, the D-dominated hubs all have clustering coefficients of zero. Thesehave numerous associations to other genes which switch sign between the studied conditions.These are likely to play a part in mediating the diseased phenotype in the thyroid tissue.
The gene with highest degree is the gene MICAL3, which is a protein-coding gene. Itencodes a microtubule associated monooxigenase involved in microtubule filament disas-sembly functions in the cell by depolymerization. It is important for cellular processes,such as organization of the cytoskeleton and cell division. It is found in the largest networkcomponent in an especially densely interconnected region. The position of gene MICAL3 isindicated with an arrow in Fig. 4.3. It is a completely homogeneous gene, with associationsto other genes of exclusively differentiated type. This hub has a very important functionin the cell, and it’s transcriptional behaviour is oppositely signed between thyroid cancerand normal tissue. This indicates that the co-expression pattern of this gene with all itsneighbors changes significantly in thyroid cancer cells and the patterns of interactions ofthis microtubule monooxigenase with its neighbors’ gene products is completely reversed.
EVC encodes the "Ellis-van Creveld syndrome protein", which is essential for signalingpathways involved in cell differentiation. It has been shown to stimulate thyroid cancer cellmotility and invasiveness [125]. This gene is completely homogeneous; it always co-expresseswith other genes oppositely between thyroid cancer and normal tissue. The last hub in thetable, AMOT, is also a gene which protein product is involved in cytoskeletal organization[126]. The average betweenness centrality in the network is 〈CB〉 = 0.074. Both of thesegenes have a slightly higher betweenness centrality than most other hubs in the network,CB(EV C) = 0.4 and CB(AMOT ) = 0.3. EVC and AMOT are both located in the outerregions of the two main community-like structures of the largest connected component inthe network, indicated by arrows in Figure 4.3.
All the genes who’s names begin with "IG" are immunoglobulin genes encoding antibodies,proteins that recognise antigens and important participants in the immune system. Thesehubs are marked with names and arrows to their location in the small network component inthe top left of Fig. 4.3. There are exclusively conserved type associations in this component,indicating that co-expression patterns among these genes are similar in thyroid cancer andnormal tissue. The structure is separated from the rest of the gene co-expression network,which also indicated that these genes form a functional module associated with normalimmunity functions.
FAM111A-DT is a divergent transcript of the gene FAM111A. This transcript version en-codes a long non-coding RNA-molecule. This gene is found in the largest network compo-nent, see Fig. 4.3. Mutation in this gene may cause disruption of thyroid gland function,like reduced parathyroid hormone production in the hypoparathyroid cells leading to im-
60

4.3. HUBS AND ASSORTATIVITY
paired skeletal development [127]. The transcript has exclusively differentiated interactionsto other genes in the network. The correlation in expression with all other genes it asso-ciates with completely reverses when going from normal thyroid tissue to cancerous. Thismay indicate that this long RNA-molecule is an antisense transcript of the FAM111A-genespromoter region, and may act as a gene expression regulator [128]. Many long non-codingRNA molecules have recently been shown to have important roles in cell differentiation [129]and are linked to development of cancer [130].
The hubs AC097639.1, AL121992.1, AL009174.1 and AP004242.1 are genes encoding man-nosidases, a class of proteins involved with the degradation of the endoplasmatic reticulum(ER). These genes are found in the very interconnected component with many hubs onthe lower right of Fig. 4.3. This component consists mainly of specific (green) links, butalso have some differentiated (red) links. The gene MALAT1 is also in this tight cluster.In thyroid tissue with carcinoma it has been shown that the expression level of MALAT1determines pro-apoptotic pathways in thyroid cancer cells and may trigger their death[131].
61

4.3. HUBS AND ASSORTATIVITY
MICAL3
EVC
FAM111A-DT
AMOT
IGHG1
IGLC3
IGKV3-11
IGKV3-20
IGKV4-1JCHAIN
IGKV1-5
IGHV3-30
IGLV1-40
IGHA1
IGHG3
IGHV5-51
AC097639.1
AL009174.1
AL121992.1AC034236.1 MALAT1
AP004242.1
AC067735.1
Figure 4.3: Visualization of the hubs of the CSD-network for Analysis 2, identical to that in Fig.4.1. The links are coloured according to link type, C-links are blue, S-links are green, and D-linksare red. Hubs (degree k ≥ 40) are enlarged and their respective names and positions in the networkare indicated by arrows.
62

4.4. NETWORK HOMOGENEITY
4.4 Network homogeneity
Nodes in the network in Figure 4.1 associated with each other in many different ways. Therewere some variations in the distribution of association types for some genes, while for thevast majority the distribution of link types was narrower. These were dominated by specificinteraction types and thus homogeneous in respect to associations. Node homogeneity-scores(H-score) calculated for all nodes sorted according to degree is presented in a box-plot inFig. 4.4. This box plot is for the CSD-network based on Analysis 2, the intermediatestringency for expression vector filtration, consisting of 20,657 genes. The importance levelof the network is 10−5. The homogeneity score (H-score) is quantified as a function ofdegree, and the distribution of H-scores for all nodes of a given degree is described by theproperties of the box in the plot.
Network homogeneity analysis gave insight into the homogeneity of individual genes as wellas the whole network. A node with one neighbor must have a H-score of 1 and a nodewith two neighbors can either have a H-score of 1 or 0.5, thus low-degree nodes in terms ofhomogeneity start to be interesting from k = 3. The distribution of link attributes betweengenes from Fig. 4.4 shows that for the majority of nodes their H-score means, the greensquares, and their H-score median is found around H ≥ 0.9. This trend is independent ofdegree. This shows that the genes in the network interact with their neighbors mostly ofone single co-expression type.
Nodes of lower degree, 3 < k ≤ 20 have a predisposition for a specific type of interaction,but there are also some which do not. All of the squares denoting the means are foundabove H = 0.9, while the long whiskers of the box plots report that there are some cases ofvery low homogeneity. Because the degree of some of the nodes is very low here this is notso surprising, but the same long whiskers are indicated even for some nodes of high degreetoo. For nodes with k = 25 or k = 28 the homogeneity is a lot lower. Hence, there are someoccurrences of genes with well-mixed interactions also.
There are several interesting nodes of intermediate degree and low degree of link-homogeneity.An example is CALR, which is a gene of lower degree that encodes calreticulin and has twoC-links and three D-links. Calreticulin is often located in the endoplasmatic reticulumwhere it is involved in protein folding ensuring that new proteins are folded correctly. It hasthree D-links to the following genes: MAPKAPK3, which encodes a MAP kinase-activatedprotein kinase, which regulates many other functions of other proteins in response to stress,SPINT1, which encodes a protein that inhibits other proteins from degrading misfoldedproteins, and DSC2, which encodes a transmembrane glycoprotein and who’s reduced ex-pression levels is associated with cancer (all this information is from the UniGene database).This demonstrates that genes with heterogeneous link distribution may be very informativein highlighting sites of transition form abnormal activity of important regulators of cellularactivity which could provide new knowledge about the transcriptional changes characteristicof a studied phenotype.
63

4.4. NETWORK HOMOGENEITY
Figure 4.4: Box plot of network homogeneity for Analysis 2 network in Fig. 4.1 binned by nodedegree. Red bars correspond to the median of H, and the green squares denote the mean H. The topand bottom ends of the boxes represent first and third quartile (25th percentile and 75th percentile)respectively. The ends of the whiskers represent the minimum and maximum values of H for thegiven degree.
The network hubs with high degrees are generally more homogeneous. Most of the hubs, asalso evident in Table 4.1 have close to or maximal scores for node homogeneity. As can beseen in the box plot there are also a substantial number of nodes of intermediate degree thattend to have relatively homogeneous neighborhoods with mostly interaction of one type.
The venn-diagram in Fig. 4.5 shows the summed number of interaction types and the com-binations of their mixed types found for all nodes in the network. There are no nodes withall three different link-types, and very few nodes with mixed interactions types. There aresubstantially more interactions of differentiated type than conserved. If a gene does havemore than one interaction type, it most often has both differentiated and specific links atthe same time. Together, Fig. 4.4 and Fig. 4.5 imply that there is a high degree of nodehomogeneity in the network in general. This results in visually clear regions of nodes in-terconnected with principally one type of link, either C-, S-, or D-links. A high averagehomogeneity-level can be interpreted as a general tendency of genes to fall under one typeof transcriptional regulation instead of many at the same time. Nodes being regulated bythe same transcription regulator will be likely to associate with each other in typically oneway, i.e. one type of (coloured) link. Transcriptional regulators may also be present in thesehomogeneous regions themselves. Some potential candidates of this are the network hubs,which are extremely homogeneous (see Table 4.1). Indeed, weakly bound transcriptional
64

4.5. BIOLOGICAL PROCESS ENRICHMENT ANALYSIS
Figure 4.5: Venn diagram showing the mixing of differential co-expression types between thenodes in the network shown in Fig. 4.1. Blue circles contain the number of conserved links, greencircles contain the number of specific links and the red circles contain the number of differentiatedlinks, and their shared areas quantify the number of mixed interactions between the three typesfound in the network.
regulators contribute significantly to overall transcription in eukaryotes and are highly con-served [132]. Weak specificity of transcriptional regulators ensure robustness to mutationsin their target genes. Weak-affinity transcription factor are essential for efficiency in medi-ating a change in transcription of a high number of genes rapidly to meet the constantlydemands of cellular life [133]. Regions in the CSD-network with high average homogeneityand predominance of one link-type consist of nodes that correlate in transcription levels, andare thus likely to consist of genes being regulated by the same transcriptional regulators.
4.5 Biological process enrichment analysis
The differential co-expression network was investigated for enrichment of biological processesboth for the complete graph and specific groups of nodes (genes). The results from thisanalyses shows the characteristic cellular processes the differentially expressed gene groupare involved in. The result thus provided important information about which roles the geneshave in the thyroid gland cells and if these functional roles segregated with the networkneighborhoods. GO enrichment analysis for the whole CSD-network identified biologicalprocesses which are central in normal thyroid gland tissue but also may be indicative ofmalignant cellular behaviour.
GO functional enrichment analysis was performed on the differentially expressed genes inthe CSD-network. This differential gene co-expression network with all link types C-, S-and D-links consisted of 1516 genes. Of these 1273 mapped to unique PANTHER geneIDs. Table 4.2 is a list of the biological processes enriched the most from the entire set of
65

4.5. BIOLOGICAL PROCESS ENRICHMENT ANALYSIS
differentially expressed gene in the network, sorted by the fold enrichment of the process inreference to a healthy human. The table shows that there is enrichment for many biologicalprocess that relate to the immune system. CD4-positive or CD8-positive alpha beta T celllineage commitment is a process in which alpha beta developing T-cell commit into CD4+or CD8+ lineage. Thymic antigen-presenting cells (APCs) use the major histocompatibilitycomplex (MHC) to embed antigens which the alpha beta T-cells recognise with their antigenreceptors. This processed is referred to as positive selection, while negative selection refersto recognition of self. This leads to skewed cellular fates for the T-cell and they maydevelop into regulatory T cells of differentiation [134]. The antigens connected to MHCsare thus important for orchestrating T-cell differentiation. MHC-genes are processed in theendoplasmatic reticulum (ER).
Table 4.2 also reports enrichment in process related to the ER and transport of proteinsto the cell surface. SRP-dependent cotranslational protein targeting to the membrane is aprocess in which the signal recognition particle (SRP) is utilized to deliver proteins beingtransported from the ER after post-translational processing to the membrane [135]. Certainimmune system pathways are normally involved in the process of producing and secretingthyroid hormone. Thyroid autoantigens like thyroglobulin, thyroid peroxidase, and the areTSH receptor are neccessary for the proper maturation of thyroid hormones [136]. Enrich-ment in associated pathways is thus not surprising . And exactly due to this dependency ofthe immune system and thyroid functionality makes it vulnerable to genetic mutations inor altered expression of the genes encoding proteins involved. The fact there is a clear dom-inance of differentiated links in this network (see Fig. 4.5) suggest that there is abnormalconduct of pathways of the immune system in thyroid cancer.
66

4.5. BIOLOGICAL PROCESS ENRICHMENT ANALYSIS
Table 4.2: Biological processes sorted by their fold enrichment identified by GO enrichmentanalysis based on all the differentially expressed genes of the CSD-network.
GO biological process FE p-valuePositive thymic T cell selection 10.5 3.6e-5Negative thymic T cell selection 9 2.5e-4SRP-dependent cotranslational proteintargeting to membrane 8.34 4.6e-25T-helper cell lineage commitment 8.25 1.1e-3Synapse pruning 8.25 1.1e-3Renal filtration 8.25 3.5e-4Positive regulation of RNA polymerase IItranscriptional preinitiation complex assembly 8.3 1.1e-3Regulation of humoral immune system process activation 7.75 2.7e-26CD4-positive or CD8-positive,alpha-beta T cell lineage commitment 7.7 1.6e-4Establishment of protein localizationto endoplasmic reticulum 7.53 6.6e-25Protein targeting to ER 7.5 6.0e-24Nuclear-transcribed mRNA catabolic process,nonsense-mediated decay 7.29 7.6e-25Protein folding in endoplasmic reticulum 7.22 2.1e-4Fc receptor mediated stimulatory signaling pathway 6.72 2.2e-24Fc epsilon receptor signaling pathway 6.39 2.1e-28Humoral immune response mediated by immunoglobin 6.36 2.9e-26Mitochondial ATP synthesis coupled proton transport 6.29 1.6e-4Toll-like receptor 9 signaling pathway 6.19 1.1e-3Antigen processing and presentation of exogenouspeptide antigen via MHC class I, TAP-dependent 5.8 7.0e-11
In Table 4.3 the disease annotations identified for 873 of the 1308 (67%) genes mapping tothe Genetic Association Database [5] are listed. The number of genes from the network thatassociated with a disease category are listed as "mapped genes." Fold enrichment is abbre-viated by FE. The table provides and overview of the main disease-associations discoveredin the full CSD-network by its composition of significant differentially expressed genes. Allresults presented are given with a corrected significance level for multiple comparison andonly results with a false discovery rate less than 0.05 are included. All sicknesses are sortedby the number of mapped genes respectively.
The diseases associated with differentially expressed genes from the CSD-network charac-
67

4.5. BIOLOGICAL PROCESS ENRICHMENT ANALYSIS
Table 4.3: Diseases associated with the differentially expressed genes of the CSD-network identifiedwith GO analysis, with the highest associated gene counts and their respective p-values and foldenrichment. Disease instances are sorted by the number of genes from the network mapping to thedisease on GAD [5].
Disease term Mapped genes p-value FE
Acquired Immunodeficiency Syndrome 88 1.0e-6 1.99Myocardial Infarction 37 0.031 1.42Prostate cancer 33 0.083 1.329Asthma 31 0.061 1.38Longevity 29 0.064 1.40Plasma HDL cholesterol (HDL-C) levels 21 0.019 1.73Celiac disease 19 1.0e-5 2.53Diabetes type 1 19 0.005 2.05Thyroid cancer 18 1.0e-5 2.96Drug-related genes 18 0.015 1.88Diabetes type 1 15 0.077 1.63Systemic lupus erythematosus 14 0.042 1.83Cognitive trait 13 0.012 2.26Aging/ Telomere Length 13 0.013 2.24Rheumatoid Arthritis 13 0.038 1.92Diabetes Mellitus Type 1 12 0.015 2.28Systemic Scleroderma 10 1.0e-5 6.41Cardiomyopathy 10 1.0e-5 4.89Lymphoma 10 0.006 2.93
terize a system with strong enrichment of malignant cellular processes. There is indicationof a combined role of both the immune system and cancer. The most relevant of these thatcategorize as diseases of the immune system are Aquired Imunodeficiency Syndrome (AIDS),asthma, celiac disease, diabetes, lupus, rheumatoid arthritis, and scleroderma. Enrichmentsfor several types of cancer; cancers of the prostate, thyroid and lymphoma (blood lympho-cyte cancer) are present. This disease-association enrichment seen in relation to Table 4.2and Table 4.6 support the proposed interplay of the immune system and thyroid cancerresponsible for its potentially invasive properties. Several genes of Table 4.6 are related tothe enriched immune system pathways in Table 4.2 and are co-expressing in differentiated orspecific manner relative to that of normal thyroid cells. The reversed and condition-specifictranscriptional pattern in carcinogenic tissue compared to normal thyroid argues that thegenetic interactions are systematically changed.
Table 4.4 shows the top ten genes in the network sorted by betweenness centrality. Aninteresting fact is that these genes also have relatively high degrees, and many of themare also listed as hubs in Tab. 4.1. Genes with high betweenness centrality have abilityof monitoring communication between nodes in different regions of the network [55]. This
68

4.5. BIOLOGICAL PROCESS ENRICHMENT ANALYSIS
indicates that the hubs are very important for flow of information in the cell and likely actas key regulators of cellular activity.
In Table 4.5 the top ten genes sorted by eigenvector centrality are presented. Eigenvectorcentrality is used as an auxiliary quantification of how representative a gene is of the be-haviour of it’s immediate neighborhood collectively. Genes of high eigenvector centralityare influential in the network, meaning that they are connected to a high number of alsowell-connected genes. These gene then are likely to be very central players in the dynamicinterplay of genes in the network and may be essential for regulation and synchronizationof cellular pathways.
Table 4.4: Top genes sorted by betweenness centrality and their node degrees
Gene name Betweenness centrality Degree
EVC 0.106 54AMOT 0.074 40FAM111A-DT 0.065 49MICAL3 0.038 59BCL2L1 0.037 24WDR55 0.034 12DAG1 0.034 20PCYT1A 0.030 5AC008870.2 0.028 4PLRG1 0.027 19
Table 4.5: Top genes sorted by eigenvector centrality and their node degrees
Gene name Eigenvector centrality Degree
IGLC3 0.203 52IGHG1 0.202 48IGKV1-5 0.200 50IGHV3-30 0.198 48IGKV3-20 0.197 47IGHG3 0.193 46JCHAIN 0.192 47IGKV3-11 0.192 45IGLV1-40 0.189 44IGHA1 0.184 43
69

4.6. DISEASE GENE IDENTIFICATION
4.6 Disease gene identification
Table 4.6 lists the 22 genes identified by DAVID as thyroid cancer-associated genes, theirrespective degree k, dominant link type t ∈ (C, S,D), and the average shortest path length toother nodes in the network, denoted d̄i for node i. These disease associated genes representgenes that have mapped to the Gene Association Database (GAD) [5] which related genesto specific diseases. The names of the differentially co-expressed genes were converted backto Ensemble IDs before submitting the GO query, while official gene symbols are used toname the genes in the table. Most of these genes had very low degrees and high averageshortest path to other genes in the network, hence few of them were found in denser networkneighborhoods but rather between them. The majority of the thyroid cancer genes interactedwith other genes in exclusively differentiated manner, and many also had specific type linksto neighbor genes.
Table 4.6: Genes in the CSD-network associated with thyroid cancer identified with GO analysis.The type denotes the predominant link type among a gene’s associations (t∈(C,S,D)). *IP3 = inositol1,4,5-trisphosphate.
Symbol Gene name k Type d̄i Module
TPO thyroid peroxidase 12 D 5.50 5ITGB2 Integrin β2 subunit 6 C 3.15 7HLA-DRB1 major histocomp. complex, class II, DR beta 1 5 C 1.67 45IRS1 Insulin receptor substrate 1 4 D 5.60 5FN1 Fibronectin 1 4 S 5.27 5CCL5 C-C motif chemokine ligand 5 4 C 3.82 2STAT3 signal transducer and activator of transcr. 3 4 D 4.52 5ITGA3 Integrin subunit alpha 3 3 S 6.00 5TG thyroglobulin 3 D 5.98 5ITPR3 IP3* receptor type 3 3 D 5.48 5ITPR1 IP3* receptor type 1 2 D 7.84 5MATN2 matrilin 2 2 D 6.64 5ADGRV1 Adhesion G protein-coupled receptor V1 2 D 6.26 5TRIP12 thyroid hormone receptor interactor 12 2 D 5.87 0HLA-DQA1 major histocomp. complex, class II, DQ alpha 1 2 C 1.67 45S100A10 Calcium binding protein 2 S 1.33 5NCOA4 nuclear receptor coactivator 4 1 D 8.23 5FAS Fas cell surface death receptor 1 D 7.58 5DIO1 Deiodinase, iodothyronine type I 1 D 7.36 5MAPK1 mitogen-activated protein kinase 1 1 D 6.29 0SLC26A4 Solute carrier family 26 member 4 1 C 1.00 1LGALS3 Galectin 3 1 S 1.00 -
70

4.6. DISEASE GENE IDENTIFICATION
The genes identified in the differentially co-expression network as thyroid cancer-associatedgenes were mostly co-expressed in a differentiated or specific manner. This means that theco-expression of these genes in relation to genes they normally share close transcriptionalbehaviour with is completely reversed, which is manifested as red differentiated links in thenetwork. The disease-associated genes were also often linked by specific type associationto other genes, meaning that their transcriptional co-expression patterns are normally notfound in thyroid tissue suddenly form in cancerous tissue or that normal co-expressionpatterns are lost. Most of these genes had very important roles in the regulation of cellcycle and thus their aberrant expression is likely to cause cancerous cell behaviour. Theirbiological roles associated mostly with the immune system or with cellular proliferation andlife cycle regulation.
The THCA-associated genes are of paramount importance for both the differential geneco-expression analysis of thyroid carcinoma and for the comparison of different similaritymeasures’ performance. They will thus be listed in A.1 together with information abouttheir biological function and associations. An illustration of the disease genes in the CSD-network are given in Figure 4.6. Here the disease genes are indicated with enhanced nodesize.
The largest connected component of the CSD-network contained the highest number ofTHCA-associated genes. Here many of them were found in between denser network regions,and as seen in Table 4.6 some were characterized by very high average paths. This meansthat these are forming connections between different functional modules, implicating thatthese THCA-genes act as regulators of cellular function whose aberrant conduct communi-cate the wrong signals to the cell. Examples of such THCA-genes are TPO, ITPR3, FN1,STAT3, and IRS1.
TPO is found in the largest connected network component and interacts in opposite mannerbetween the studied conditions. It is essential for thyroid hormone synthesis and a prognosticmarker of thyroid cancer. It’s differentiated expression levels has been related to the tumordevelopment into invasive or indolent tumor sub-types [137].
ITPR3 encodes a receptor for inositol 1,4,5-trisphosphate, which regulates the release ofcalcium from the endoplasmatic reticulum into the intracellular space.
FN1 encodes fibronectin, and has four specific type links. Fibronectin 1 is involved with cellmigration and metastasis. It is connected to one of largest network hubs AMOT. Throughthe condition-specific interaction with AMOT, abnormal correlations between genes thatregulate cell migration and cytoskeletal organization appear, which could be responsible forthyroid cancer invasiveness. This supports the suggested prognostic determinant propertyof aggressive thyroid cancer [138].
STAT3 belong to a family of genes, the STAT kinase family, which are transcriptionalregulators. STAT3 correlated with other genes in a reversed manner between the studiedcondition. This indicates that it regulated transcription oppositely in thyroid cancer and
71

4.6. DISEASE GENE IDENTIFICATION
the normal case, which indicates this it could be responsible for inhibition of apoptosis andtumor cell proliferation [139].
IRS1 is normally expressed at high levels in the thyroid. Here, it is D-linked to fourneighbors, and through its neighbor USP3-AS1 these genes form a branch protruding outfrom the giant connected component where all co-expression associations are differentiatedbetween normal and carcinogenic tissue.
72

4.6. DISEASE GENE IDENTIFICATION
MAPK1
TRIP12
STAT3
ITPR3
TPO
ITPR1
IRS1
ADGRV1
FAS
FN1
ITGA3
NCOA4
TG
MATN2
CCL5
ITGB2
S100A10 SLC26A4 HLA-DQA1 HLA-DRB1
LGALS3
DIO1
Figure 4.6: Illustration of CSD network for Analysis 2 with 22 thyroid-cancer genes identified asDEGs showed as enlarged nodes. This network is identical to that in Fig. 4.1. Thyroid-cancer genesare highlighted by name and arrows indicate their positions in the network. Edges between nodesare coloured by type of interaction between the conditions, conserved links are blue, differentiatedlinks are red and specific links are green.
.73

4.7. INVESTIGATION OF NETWORK MODULES
4.7 Investigation of network modules
Modules in the differential co-expression networks were investigated. Analyses with dif-ferential expression of human transcriptomic data often identify gene modules which areconsistently expressed across many different samples of transcriptomic data. Such networkneighborhoods are often dense and enriched for genes encoding proteins with general cellmaintenance functions involved in regulation of the cell cycle, immune responses, extra-cellular matrix, and stress responses. But because misregulation of these processes aredrivers of carcinogenic pathways, modules with enrichment for these processes in combi-nation to high prevalence of differentiated and specific co-expression types will potentiallydistinguish dysfunctional cliques acting as disease modules.
Another strong motivation for module investigation was the attempt to find the thyroidcancer-associated genes from Chapter 4.6 listed in Table 4.6. The relative distribution ofthese disease genes was sought out in the modules in the pursuit of disease-associated cliquesin the networks.
The Louvain algorithm implemented in Python [4] was employed for network communitydetection. The community detection was performed using its "best partition" functionality,as described in section 3.1.8. The outcome of this algorithm was 156 modules in the CSDnetwork. Of these, there were 51 modules consisting of more than two genes investigatedfurther. Table 4.7 shows these modules and Fig. 4.7 illustrated the partitioning of themodules in distinct areas of the differential co-expression network. In Table 4.7 the modulenumber and the number of genes in each of them are listed. Also the average degree, 〈k〉,the average betweenness centrality CB and the clustering coefficient C for the genes in themodule is provided.
74

4.7. INVESTIGATION OF NETWORK MODULES
Table 4.7: Network modules with highest number of genes, their average degree, average between-ness centrality and average clustering coefficient.
Module #genes 〈k〉 CB C
5 358 2.57 0.0021 0.0040 310 3.10 0.0020 0.0004 113 20.1 4.81e-5 0.28511 69 21.9 2.25e-5 0.7297 60 5.40 0.0001 0.41634 55 2.67 0.0012 0.0496 42 5.29 2.77e-5 0.39014 42 2.14 0.0017 0.0009 41 1.98 0.0016 0.0002 32 4.78 9.11e-5 0.46591 21 2.38 0.0015 0.13021 9 3.56 2.42e-6 0.49626 9 2.11 0.0001 0.25978 9 2.00 5.23e-6 0.00024 7 1.71 2.37e-6 0.00031 7 1.71 1.87e-6 0.00045 7 3.71 9.97e-7 0.73896 7 1.71 1.87e-6 0.00035 5 1.60 1.74e-6 0.00042 5 1.60 1.05e-6 0.000
75

4.7. INVESTIGATION OF NETWORK MODULES
911
91 340
14
5
2
7
26
621 4
78
Figure 4.7: Plot showing communities in the differential gene co-expression network detected bythe Louvain community detection algorithm [4]. Numbers on the figure denote the module numberfrom Table 4.7 for each module respectively. Each community is coloured differently so that allgene nodes within the same community have the same colour. Edges between nodes are colouredby type of interaction between the conditions, conserved links are blue, differentiated links are redand specific links are green.
76

4.7. INVESTIGATION OF NETWORK MODULES
4.7.1 GO biological process enrichment analysis of modules
The following tables present the most highly enriched biological processes identified byusing the GO tool PANTHER [110] with the differentially expressed genes from the mostrelevant network modules. All values in tables listing biological process enrichment identifiedby PANTHER have a statistically significant enrichment (false discovery rate (FDR) P <0.05), and exclusively results with over a ten fold enrichment for these biological processes arelisted. For some modules, GO enrichment analysis did not produce in any significant resultsassociated with the genes constituting the module. These will not be further examined inthe GO enrichment analysis of the network modules.
Module number 5: The largest module in the differential gene co-expression network withall link types consisted of 358 nodes. This module has a central placement in the network,as can be seen in Fig. 4.7 where the nodes of the module have bright green color. Thismodule constitute approximately half of the largest connected component and forms a cleardivision in it. Within this module there are two types of links, specific and differentiated.The vast majority is specific. This indicates that co-expression relations between nodes inthis module are likely to rooted in the studied condition; thyroid carcinoma.
GO enrichment analysis of the genes in this module identified 341 of the genes (95,3%).Of these 341 mapped IDs, 71 (20.8%) mapped to the OMIM database and 130 to KEGGpathways. The Table 4.8 shows enrichment for biological processes related to the genes ofthis module. The enriched processes show an interesting combination of thyroid hormonesynthesis, carcinogenic processes, and immune responses possibly related to blood sugar(insulin/glucagon levels).
An interesting fact was that the functional enrichment mapped a substantial number ofgenes from this module to the OMIM database [140] and identified significant enrichment forthyroid cancer-related genes, with p-value = 4.04×10⁻⁶, fold enrichment = 0.004 (bonferronicorrected p-value = 0.003 and FDR = 0.006). This module had the highest number ofthyroid cancer-associated genes present, a total of 14 disease-genes out of the 22 (64 %)in Tab. 4.6 were found here. This is a strong indication that this module may actuallyrepresent a disease module.
Module number 0: The second largest module in the network consisted of 310 nodes,of which 293 mapped to the GO database. This module is coloured in purple in Fig.4.7 and is found at the upper region of the large connected component. Table 4.9 listspathway enrichment for genes of this module. Many of the enriched processes are involvedin transcriptional or translational regulation. High fold enrichment of the processes areindicative of a clear functional clustering within this module. Two disease modules werefound within this module, TPO and MAPK1.
Module 7: This module is found at the left of Fig. 4.7 in the second largest networkcomponent. The nodes belonging to this module are coloured green. Each of the identifiedGO biological processes have over a 50 fold enrichment. It should be notes that this module
77

4.7. INVESTIGATION OF NETWORK MODULES
Table 4.8: Table of the enriched KEGG pathways associated with Module 5, the largest moduleof the CSD network, identified by DAVID. The pathways are sorted by p-value. "benjamini" =Benjamini corrected p-value.
KEGG pathway p-value benjamini
Metabolic pathways 1.3E-3 2.5E-1Thyroid hormone synthesis 1.9E-3 1.9E-1Small cell lung cancer 5.1E-3 3.0E-1Aldosterone-regulated sodium reabsorption 5.8E-3 2.7E-1Glucagon signaling pathway 1.0E-2 3.6E-1Pathways in cancer 1.5E-2 4.2E-1Insulin resistance 1.6E-2 3.8E-1Proteoglycans in cancer 3.4E-2 6.0E-1
Table 4.9: Over-represented biological processes associated with module number 0 of the CSDnetwork as identified by GO, sorted by fold enrichment.
GO biological process Fold enrichment
Autophagy of peroxisome 43.00G-quadruplex DNA unwinding 30.71COPII-coated vesicle cargo loading 22.05Pos. regulation of cytoplasmic translation 21.50Regulation of histone ubiquitination 21.50Proteasomal ubiquitin-independent protein catabolic process 14.33Regulation of mRNA 3’-end processing 13.27Tricarboxylic acid cycle 11.94
had an interesting profile of biological process enrichment even though all gene-pair co-expression associations are of conserved type. The enriched biological process of this nodeare related to the immune response. The genes of this module show a high level of functionalclustering. One thyroid cancer-related gene, ITGB2, belonged to this module.
Module 34: This module is found at the left in Figure 4.7, coloured in yellow. It consistsof 55 genes which are loosely bound in the largest connected component of the network.It’s average degree is low but the betweenness centrality CB = 0.0012 is high compared tosome other modules of similar size. of the largest connected component of the network in adark green-blue colour. It is predominantly composed of nodes interacting in differentiatedmanner (red D-links) between the two studied conditions. GO enrichment analysis resultsare listed in Table 4.11, where 16 GO biological processes with over 20 fold enrichment areincluded. These processes show that genes in this module are involved with many importantregulatory processes, and may act as bridges connecting different cellular pathways. Thevariety in pathways enriched in this module advocate such a role.
78

4.7. INVESTIGATION OF NETWORK MODULES
Table 4.10: Over-represented biological processes associated with module number 7 of the CSDnetwork as identified by GO sorted by fold enrichment.
GO biological process Fold enrichment
Pos. reg. of hippocampal neuron apoptotic process > 100Pos. reg. of type I hypersensitivity > 100Pos. reg. of type III hypersensitivity > 100Pos. reg. of prostaglandin-E synthase activity > 100Vertebrate eye-specific patterning > 100Complement-mediated synapse pruning > 100Pos. reg. of microglial cell mediated cytotoxicity > 100Pos. reg. of neutrophil degranulation > 100Neg. reg. of dopamine metabolic process > 100Pos. reg. of microglial cell activation 88.97Microglial cell activation 80.88Respiratory burst 67.78Pos. reg. of interleukin-4 production 61.89Pos. reg. of B cell differentiation 59.31Macrophage activation involved in immune response 59.31
Table 4.11: Table of the 16 top over-represented biological processes associated with modulenumber 34 of the CSD network as identified by GO sorted by fold enrichment.
GO biological process Fold enrichment
Sequestering of calcium ion > 100Pos. reg. of oxidative stress-induced intrinsic apoptotic signaling pathway > 100Bundle of His cell-Purkinje myocyte adhesion involved in cell communication > 100Protein folding in endoplasmic reticulum > 100Mitochondrial ATP synthesis coupled proton transport 54.54Cristae formation 36.94Reg. of cellular amino acid metabolic process 36.36Antigen processing, presentation of exogenous peptideantigen via MHC class I, TAP-dependent 35.16Mitochondrial electron transport, NADH to ubiquinone 31.16Reg. of hematopoietic stem cell differentiation 28.88Substantia nigra development 24.90Reg. of transcription from RNA pol. II promoter in response to hypoxia 41.66NIK/NF-kappaB signaling 23.56Mitochondrial respiratory chain complex I assembly 23.14Negative regulation of G2/M transition of mitotic cell cycle 21.45SCF-dependent proteasomal ubiquitin-dependent protein catabolic process 20.98
79


Chapter 5
Results & Analysis: MethodDevelopment
The main aim of this chapter is present the outcomes of the method development part ofthis master thesis. First, this chapter will compare outcomes resulting from different pre-processing alternatives in the aspect of their quality and influence on their outcomes ondifferential co-expression analysis. Second, comparisons of differential gene co-expressionbased on four different similarity measures will be presented. These results were generatedfrom the four different work-flows presented in Figure 3.2.7. The aim is to elucidate dif-ferences rooted in similarity measures between the inferred networks. In the investigationof both the roles of pre-processing and similarity measures, assessment of quantitative andqualitative properties will be performed.
5.1 Effect of pre-processing methods
The effect of pre-processing was investigated by producing three different combinations ofnormalized thyroid cancer data sets. Refer to Figure 3.2 for illustration. Networks ofdifferentially co-expressed genes were constructed for each of these three data sets withalternative pre-processing:
• ANALYSIS 0 (An.0) : Converting ensemble gene IDs to official gene symbols only.Expression data sets were filtered to contain a common set as in both normal andthyroid cancer transcriptomic sets. Size: 24,753 gene expression vectors.
• ANALYSIS 1 (An.1) : Same as for An.0., but included removal of any gene who’sraw count vector for all samples has less than 6 reads for more than 20% of samples.Reads were upper 75%th-quantile library scaled and genes who’s TPM-values are lessthan 0.1 for more 20 % of samples are excluded. Units converted to TMM values withthe R-package edgeR. Lastly, an inverse normal transform was applied. Size: 16,728gene expression vectors.
81

5.1. EFFECT OF PRE-PROCESSING METHODS
• ANALYSIS 2 (An.2) : Similar first step as for An.0. Count values were converted toCPM values with edgeR, and exclusively genes who’s CPM values were more than 1in both libraries were retained. Reads were upper 75%th-quantile library scaled andan inverse normal transform was applied. Size: 20,657 gene expression vectors.
The effect of proper pre-processing and quality control was explored by comparing the net-works resulting from differential gene co-expression (DGCE) analysis using the CSD frame-work with these three sets of transcriptomic data. In each of them the normal transcriptomicdata is identical because it was already normalized when accessed and downloaded. Thethree different strategies for pre-processing - consisting of both gene filtration and expressionlevel normalization - were performed on the data downloaded from TCGA to look into thepossible outcomes on a differential co-expression analysis.
For each variation of pre-processing method the corresponding data set was used to infer net-works with the CSD-framework on the basis of four importance values; p = 10−4, 10−4.5, 10−5,and p = 10−5.5. The network parameters of the resulting four differential co-expression net-works for each analysis is listed in Table 5.1. The size of the data set in each analysisis listed under each of the three sets. The importance level p is the common importancelevel used to estimate threshold values XC,S,D
p for each of the association type scores inorder to map them in a comparable scale [3]. Genes and edges correspond to the numberof genes and edges in the networks respectively, 〈k〉 is the average degree, C is the averageclustering coefficient. d̄ is the average shortest path length in the network and the powerlaw parameters a and b are constants from a fitted power law function to the log-log plot ofthe networks’ degree distributions given by y = axb.
Table 5.1: Network parameters for the networks inferred on the basis of four different importancevalues, each generated for data sets subject to different pre-processing strategies.
Analysis: size p Genes Edges 〈k〉 C Diam. d̄ Power law
An.0 : 24,753
10−4 6826 50303 14.7 0.12 15 4.2 a = 7089, b = -1.710−4.5 4289 16960 7.9 0.10 19 4.8 a = 3975, b = -1.810−5 2285 4954 4.4 0.08 16 5.0 a = 1375, b = -1.810−5.5 1179 1665 2.8 0.06 16 5.6 a = 639, b = -1.9
An.1 : 16,728
10−4 4700 24301 10.3 0.12 13 4.8 a = 3146, b = -1.610−4.5 2695 8292 6.2 0.10 22 6.4 a = 1525, b = -1.710−5 1313 2442 3.7 0.07 23 3.7 a = 646, b = -1.710−5.5 587 804 2.7 0.09 14 5.2 a = 277, b = -1.7
An.2 : 20,657
10−4 6593 32569 9.9 0.10 18 4.9 a = 4170, b = -1.610−4.5 3535 11709 6.6 0.10 16 6.1 a = 1343, b = -1.510−5 1516 3612 4.8 0.11 18 6.4 a = 524, b = -1.510−5.5 694 1213 3.5 0.1 23 7.0 a = 330, b = -1.6
82

5.1. EFFECT OF PRE-PROCESSING METHODS
Figure 5.1: Venn-diagram of the distribution of common and unique inferred genetic associationsbetween Analysis 0, Analysis 1, and Analysis 2. Comparison of networks inferred with importancevalue p = 10−5 created with the CSD-method.
From these network parameters it becomes apparent that the data sets were somewhat dif-ferent depending on the pre-processing applied. In terms of the number of genes includedin the network as significant differentially expressed genes (DEGs) there were clear distinc-tions between the studied conditions. Except for the importance value 10−4, An.1 and An.2appear more similar to each other than either of them seem to be compared with An.0. Forp = 10−4 in An.2 the network consists of approximately the same number of genes comparedto An.0, but An.2 has a lot fewer edges. The networks of An.0 are systematically also more"efficient" in terms of a lower average shortest path. For most importance values it has lowerd̄ than the networks of the other analyses. This may however be attributed to the higherrelative number of edges found here than in e.g. An.2 with the same number of genes.
Figure 5.1 depicts the relative amount of gene co-expression patterns shared between thedifferent analyses in a venn-diagram. It shows how many of the links are exclusively foundin each of them separately and how many are in common sets. Fig. 5.1 illustrates a highersimilarity in identified differential gene association composition between An.1 and An.2 thaneach of these two has in relation to An.0 separately. An.1 and An.2 share 36% more geneassociations than An.0 and An.2, reporting a higher compliance among genes identified asDEGs between the two studied conditions for data sets with more similar pre-processing.
The exceptionally high number of gene associations in An.0 may be an artefact of the co-expression network inference method based on raw RNA-seq data. In the thyroid cancer dataset in An.0 there were several occurrences of genes who’s expression vectors contained highpercentage of zero-instances. This happens in RNA-seq transcription quantification whensome genes’ expression are unique to one condition and highly expressed for this condition.The sequencing sensitivity for other gene probes of the sample will thus be decreased and thedata may become skewed [50]. Hence, this is not a weakness of differential gene co-expressionas strategy to compare transcriptional patterns between carcinogenic and healthy tissue butrather a limitation of the RNA-sequencing technology. Consequently, many of these low-count genes become highly correlated with each other and have potential to be inferred as
83

5.1. EFFECT OF PRE-PROCESSING METHODS
DEGs when compared to transcription profiles from a set of samples representing a differentcondition. RNA-seq is thus prone to yield false positive rates in co-expression analysis whennot accounting for expression profiles rich in zero-instances.
The potential effects of the pre-processing method of the RNA-seq data on the networkstructure and its components was also interesting. These were investigated by testing thesimilarities of the network hubs between the three analyses. For each of them their geneswere sorted by degree and sets of genes over a certain degree cut-off were compared betweenthem. Then the overlap coefficient of the content in each compared set was calculated inorder to find a measure of similarity corrected for different sizes of the sets. Overlap study ofhub sets between the three different analyses, for five different cut-off values for node degreewas performed and results are presented in Figure 5.2. For each value along the x-axis theoverlap coefficient is shown between two sets with a cross, for all three combinations ofcompared analyses. The overlap coefficient quantifies how many genes are found in bothnetworks for a certain degree-threshold. This essentially compares the composition of hubsin the three networks and measure how many of the hubs are common.
The highest overlap coefficients of hubs between analyses indicated in Fig. 5.2 are foundamong An.1 and An.2. These are both analyses with pre-processing applied and seem tohave several characteristics that are more similar than with the non-processed set An.0. Thelowest scores of overlap are consistently observed between An.0 and An.2. This is not verysurprising given the difference between them; An.0 with no filtering for low-count genes andAn.0 with the strictest filtering of these.
A final assessment of effect of pre-processing procedure consisted of testing differences ofthe analyses in identifying thyroid cancer-associated genes. Here, associations betweendifferentially expressed genes from all three alternatives An.0, An.1 and An.2 were usedto query the functional enrichment tool PANTHER [110]. All queries were done basedon networks of importance value p = 10−5. This resulted in positive results for An.0. Theoriginal list of thyroid cancer-associated DEGs from Table 4.6 are based on An.2. The querydid not yield any results for An.1, most likely because of lower size. But for An.0, whichwas the largest data set, 15 new thyroid cancer-associated genes were identified. There arelisted in Table B.4. Most of the disease-genes were linked to their neighbors by specific ordifferentiated links. Some of the disease genes that were not in a pair, hence with k 6= 1 andd̄ 6= 1, had high values for average shortest path d̄. These could have important functions inthe cell mediating information from various regions of the network, potentially as regulatorsof transcription. The fact that these new thyroid cancer genes were obtained by the dataset with no quality control of data does not necessarily show that proper quality control isnot needed, but it does support performing differential gene co-expression with the CSD-framework in parallel for multiple variations of the same data set if possible as they may beable to discover different associations and disease-related genes.
84

5.2. WEIGHTED TOPOLOGICAL OVERLAP AS SIMILARITY MEASURE
Figure 5.2: Plot of relative compliance between the three alternatively pre-processed data setsAn.0, An.1, and An.2, in respect to identical content of nodes identified as hubs. Ratio of complianceamong hubs is quantified with the overlap coefficient in sets of genes with increasing degree cutoffs,which increases along the x-axis. Increasing compliance increases along the y-axis. All threeversions of the data set are compared to each other as indicated in the legend, and respectivedegree of overlap in each comparison is indicated with a cross in the plot.
5.2 Weighted topological overlap as similarity measure
Because the implementation of the python-script for calculation of weighted topologicaloverlap measure had potential to be faster, an attempt to improve it was done. To reducecomputation time the improvement of the program consisted of developing a parallelized im-plementation of the script. Both implementation with multi-processing and multi-threadingwere attempted but did not result in a faster implementation.
Instead, the R-package wTO developed by Gysi et. al. [116] was used to transform theco-expression data to weighted topological overlap-measures with soft thresholding withthresholding parameter β = 5 and the signed version of wTO. This procedure was performedto co-expression matrices of both normal and thyroid cancer transcriptomic data, and theoutput was successfully used to infer a differential co-expression network with the CSD-method.
Figure 5.3 shows the resulting CSD-network based on wTO inferred with importance level10−5. The networks generated on the basis of weighted topological overlap as similaritymeasure generated networks with high ability of discrimination of genes involved in co-
85

5.2. WEIGHTED TOPOLOGICAL OVERLAP AS SIMILARITY MEASURE
expression patterns of the three association-types; conserved, differentiated, and specific.Visualization of the network with Cytoscape [107] clearly grouped network componentsaccording to distinct differential co-expression category. This is supportive of literatureclaiming that the topological overlap measure produces meaningful biological clusters ofnodes in this type of networks [65].
The structure of this network was interesting. In Fig. 5.3 it can clearly be seen that thenetwork is almost completely partitioned according to association type, with segregationof conserved, differentiated, and specific links in definite clusters. Table 5.2 lists networkproperties of this network, the number of genes and edges, average degree 〈k〉, clusteringcoefficient (C), diameter and average shortest path d̄. It also provides corresponding infor-mation about a network inferred by the same importance value p = 10−5 based on Spear-man’s rank correlation coefficient. The wTO-network also has a relatively smaller diameterand average shortest path compared to the ρ-based network. From comparison of data inTable 5.2 it is evident that the wTO-measure produces networks of higher interconnectivity- i.e. with higher average degree and higher average clustering coefficient.
Table 5.2: Table of network parameters for the networks based on WTO and and on Spearman’scorrelation coefficient, both with p = 10−5.
Sij Genes Edges 〈k〉 C Diam. d̄ Power lawwTO 770 4831 12.6 0.27 11 3.5 a = 190, b = -1.2ρ 1516 3612 4.8 0.11 18 6.4 a = 524, b = -1.5
Another interesting observation is that this network had disassortative tendencies, especiallyin the second largest component consisting of predominantly specific type links and denseregions of tightly interconnected nodes with mostly conserved type links. This componentis on the bottom left of Figure 5.3. The largest component consisting of virtually onlydifferentiated type links, on the other hand, had more assortative tendencies. A high ratioof high-degree nodes were found linked directly to each other. The average neighborhoodconnectivity as a function of degree reported presence of numerous genes with both highdegree and high average neighborhood connectivity, see Figure B.1. As this figure showsthere was no positive linear trend, thus the network does not have assortative structure eventhough some components were more assortative than others.
86

5.2. WEIGHTED TOPOLOGICAL OVERLAP AS SIMILARITY MEASURE
SNX19
SDHC
NCOA4
TRIP12
TRIP11
Figure 5.3: Differential co-expression network inferred with CSD-method implementation withweighted topological overlap (wTO) for Analysis 1, with importance level is 10−5. The networkconsists of 770 genes and 4831 edges. Interactions are of all types, C-scores are colored blue,S-scores are green, and D-scores are red. Thyroid cancer-associated genes are highlighted withenlarged node size and tagged by name.
87

5.2. WEIGHTED TOPOLOGICAL OVERLAP AS SIMILARITY MEASURE
5.2.1 GO enrichment analysis
Functional enrichment of all genes of the wTO-based network was done to get a betterunderstanding of processes taking place in thyroid tissue that might be eriched relatedto the DEGs. The functional analysis result was obtained by enrichment analysis withPANTHER [110]. The wTO-network was significantly enriched for around 200 biologicalprocesses and the ones with the highest fold change are included in Table B.2. We canobserve that there is indication of DEGs involved in pathways related to immunity, antibody-mediated phagocytosis, immunoglobin production and signaling, and signaling through theFc receptor. Many of the same processes in this table are similar to those that were enrichedfor the standard CSD-network based on Spearman’s correlation coefficient.
The Fc receptors are important regulators of the immune system. They are found on the cellsurface where they interact with antibodies. Some of these bind to immunoglobulins, whichcauses them to induce phagocytosis. They are also involved with recognition of antibodieson the surface of abnormal cells to target and destruct cancer cells. The humoral immunesystem is regulated by these Fc receptors, and malignant alterations in their behaviour isassociated with autoimmunity and inflammation [141]. Altered expression of Fc-receptorsare speculated to play an important role in autoimmune thyroid diseases like Hashimoto’sthyroiditis [142]. In this complex interplay of immunity in cancer there are many processesthat require integral functionality of numerous components. Among the DEGs in TableB.2 there are many representatives of this system. There is high enrichment in processeswhere different Fc-receptors are involved in signaling cascades and mediating phagocytosis.Enrichment in immunoglobulin immune response are also present and highly enriched. Ulti-mately, these are strong indicators of striking high activation in the conduct of the immunesystem. An important fact about papillary thyroid carcinoma (PTC) is that it is remarkablyinnocuous. In PTC the high ability of the humoral immune response to detect and targetthe carcinogenic cells contribute to the quiescent nature of these tumors [143]. However,other types of thyroid cancer are characterized by invasive and aggressive behaviour [144].In Table B.2 there is also a 8.98 fold enrichment of proteasomal degradation. This couldbe a symptom of a disrupted endoplasmatic reticulum (ER) unable to process and processproteins correctly because of chronic inflammation. Chronic ER stress is characteristic ofseveral autoimmune thyroid diseases [145]. In thyroid tissue with these conditions there isthus reason to believe that this could mediate the impediment of the immune system andlead to a more invasive thyroid carcinoma [131, 146] .
5.2.2 The behaviour of network hubs
To further screen for DEGs implicated in , looking into hubs. A list of the network’s hubsis given in Table B.1. The most highly connected hub genes in the wTO-network had overtwice as many neighbors compared to hubs in the ρ-based network. There are 18 commonhubs among the genes with k > 40 between these networks. However, the largest hubs
88

5.2. WEIGHTED TOPOLOGICAL OVERLAP AS SIMILARITY MEASURE
in the wTO-network had degrees three times as high as in the ρ-network. There were teninstances of genes with k > 100, which is extremely high given that this network has halfthe size and just a third more edges.
Table 5.3: Table of GO enriched processes for the network hubs of the wTO-network.
GO biological process FEGlomerular filtration >100Positive reg. of respiratory burst >100Reg. of complement activation 96.7Humoral immune response activation 84.4Fc-gamma receptor signalingpathway involved in phagocytosis 82.3Proteasomal ubiquitin-independentprotein catabolic process 74.1Fc-epsilon receptor signaling pathway 67.8B cell receptor signaling pathway 58.4
Table 5.3 present the enriched processes of hubs in the wTO-network, generated by GOenrichment analysis with the biological enrichment tool PANTHER [110]. Very high enrich-ment in glomerular filtration indicates that the thyroid tissue performs selective filtrationof the blood [147], which is a normal function of thyroid tissue [16].
Many hubs in Table B.1 are genes encoding various proteins of the immunoglobulin fam-ily. These have numerous associations of conserved type. These immunoglobulin proteinsthus seem to be expressed at normal levels in relation to others in both carcinogenic andnormal thyroid gland tissue. Exceptions are IGKV1OR2-108 and IGLV1-50, which have69 and 58 S-links in the network respectively. These highly connected genes encode pro-teins of immunoglobulins. They are listed as non-functional in the UniGene database, buttheir specific genetic associations suggest that the have shifted behaviour significantly inthe transcriptional network. Mutations in genes encoding immunoglobin kappa (IGK) andimmunoglobin lambda (IGL) are related to blood lymphocyte cancer [148]. An importantobservation about these immunoglobulin-encoding genes is that they are found in betweena dense region of conserved type link-dominated neighborhood and a regions of specific typelink-dominated neighborhood. Several are heterogeneous in respect to link type distribution.These hubs are co-expressing with some neighbors in a conserved way and other in a specificway. Specificity of the links indicate that co-expression patterns present in one condition isnot in the other. It is thus reasonable to assume that the normal transcriptional regulation ofthese is significantly altered in thyroid cancer. These immunoglobulin-encoding genes couldharbour physical changes themselves, causing them to interact with other cellular proteinsdifferently. These changes could be a result of mutations in these hub genes or abnormalpost-translational processing. Another possible explanation is that the transcriptional reg-ulatory system controlling the expression levels of these genes are behaving abnormally aswell. Together with the exceedingly high enrichment of pathways related to the immune
89

5.2. WEIGHTED TOPOLOGICAL OVERLAP AS SIMILARITY MEASURE
system in Table 5.3, this could suggest that potential mutations in the immunoglobulin-coding genes could be mediating pathogenic functionality of the immunoglobulin proteinsdriving carcinogenic processes in the thyroid tissue.
The biggest hub is the gene SP140 which is a gene encoding a component of the nuclear body(NB). This is highly expressed in cells involved with host defence [149] and is connected to110 other genes by specific type links, indicating that it has abnormal co-expression patterns.SP140 is found in the transition between the network region dominated by specific-type (S-links) links and conserved-type (C-link) links. SP140 in homogeneously linked by S-linksbut many of its neighbors are heterogeneous mixes of S- and C-type dominated hubs. Theseare the immunoglobulin-coding hub genes mentioned above.
Other enriched processes, like complement activation and regulation of the humoral immuneresponse are enriched to a similar high degree. Many of the hubs involved in pathwaysrelated to immunity are linked to other DEGs by specific type links. TRAC encodes aT-cell receptor alpha constant protein which is an essential specific antigen-receptor. Thisgene has mostly S-links, which could be an indication of mutation. Genetic alterations ofTRAC are related to immunodeficiency [150]. In the transcriptomic network TRAC has 110links to other genes and these associations change significantly from normal to carcinogenicthyroid specimens. The consequences of aberrant behaviour in these genes will thus affectthe cellular immune system-related behaviour tremendously.
The enrichment in proteasomal protein catabolism can most likely be rooted in alteredtranscriptional pattern of the hub PSMA3. It encodes the Proteasome subunit alpha type-3, a protein that mediates ubiquitin-independent degradation of proteins in the cell [151].Abnormal high levels of misfolded protein could be a result of the reduced functionality of theendoplasmatic reticulum in thyroid cancer cells [131]. In the network this hub has exclusivelydifferential links, indicating that it’s associations to other genes is opposite between thestudied conditions. The important role in degradation of damaged and misfolded proteinscould be altered, causing retardation of the cell’s ability to maintain homeostasis. Thereare also other processes that testify of loss of homeostasis. The second process of Table5.3 is a over hundred-fold enrichment in respiratory burst. It is a process that is relatedto innate immune system of self-induced apoptosis [152]. The network hub XRN2 encodesa 5’-3’ exoribonuclease 2, which is a transcriptional terminator. The last hub in TableB.1 is the gene Cluster of Differentiation 53 (CD53), which encodes a cell-surface antigenthat contribute to tumor cell survival [153]. All of the hubs PSMA3, XRN2 and CD53have abnormal activity in the transcriptomic network. PSMA3 and XRN2 associate withother DEGs oppositely between normal and cancerous thyroid tissue and CD53 associatespecifically to one condition. This is a strong indication that these very central players inthe genetic network have a significantly altered transcriptional correlation with other genesin carcinogenic thyroid tissue and are likely to be involved in the conduct of deleteriouspathways ultimately leading to a cancerous cell fate.
90

5.2. WEIGHTED TOPOLOGICAL OVERLAP AS SIMILARITY MEASURE
5.2.3 THCA-associated genes
Querying the DEGs from the network based on wTO as similarity measure resulted in iden-tification of thyroid-cancer associated genes. Table 5.4 lists the thyroid-cancer associatedgenes identified with the wTO-network. Three additional THCA-genes were identified as aresult of applying wTO as similarity measure for co-expression analysis. Total number ofTHCA-associated genes from this network was 5. There two genes NCOA4 and TRIP12were identified in both the wTO-network and the standard CSD-network. In the wTO-network all five THCA-associated genes were found in the largest connected component,with exclusively differentiated type links. Both TRIP11 and TRIP12 were closely bound tothe hubs PSMA3 and XRN2. The biological role of these genes in pathogenesis of thyroidcarcinoma will be elaborated in A.2.
The ability of identifying biologically relevant DEGs is employed as a measure of successfor the network inference method in this thesis. Here, basing the network on wTO resultedin five THCA-associated genes, three of which were not identified by the standard CSD-method. This implies that this network is biologically meaningful and that it is able tohighlight genes that are significantly altered in carcinogenic thyroid gland tissue comparedto normal tissue. It is anyhow substantially less successful compared to the CSD-network, asit only identified 5 THCA-associated genes which under 25%. An interesting fact though, isthat all of these were different. This indicates that transforming the correlation to weightedtopological overlap changes the content of genetic interactions that will be included in theinferred network.
Table 5.4: Table of thyroid cancer-associated genes uniquely identified from functional annotationanalysis of the wTO-network, sorted by degree.
Gene symbol Gene name k t∈(C,S,D)
TRIP12 Thyroid hormone receptor interactor 12 11 DNCOA4 nuclear receptor coactivator 4 9 DSDHC Succinate dehydrogenase complex subunit C 1 DSNX19 Sorting nexin 19 2 DTRIP11 Thyroid hormone receptor interactor 11 1 D
91

5.3. EXPANDING THE CSD FRAMEWORK WITH MUTUAL INFORMATION
5.3 Expanding the CSD framework with mutual information
The main goal of this software development part was to develop an implementation andinvestigate the use of mutual information as an alternative similarity measure to Spearman’sranked correlation coefficient. As the mutual information is a more far-reaching similaritymeasure taking to account non-liner correlations it was interesting to compare results fromnetworks constructed on the basis of this this alternative similarity measure. This sectionwill first investigate quantitative properties of employing mutual information as similaritymeasure and a qualitative survey of it’s influence of biological meaningfulness.
The application of mutual information as similarity measure for co-expression analysis wasdeveloped in a parallelized R-script, for rapid computation time performance. Given thatit needed to handle large data sets of twenty thousand variables in each dimension of atwo-dimensional array of expression vectors, parallelization was imperative. The programimplemented in parallel successfully computed the similarity matrix from the expressiondata so that the CSD-network inference workflow was applicable to the output from thisprogram. The code was run on a computer with 48 cores for both An.1 and An.2. Therun-time performance was assayed for An.1 (16,728 genes) by storing elapsed computationtimes for several smaller sets from the complete one. Results are presented in Figure 5.4.The curve for the run-time complexity shows that the implementation of the script showsa near exponential growth in computational time depending on data set size. This makesthis method challenging in terms of required computational power for large data sets.
Figure 5.4: Extrapolated run-time complexity plot for mutual information computation of sim-ilarity matrix for differential co-expression network inference. Performance is illustrated as timeelapsed as a function of log(n), n = number of variables (data set size).
The resulting differential gene co-expression network comparing thyroid cancer normal thy-roid tissue generated by the CSD-method was substantially different in structure comparedto the standard ρ-based network. Figure 5.5 illustrates the inferred network. Data fromthe MI-network is given in Table 5.5. With the same importance value used to infer thenetwork, p = 10−5, the MI-based network had larger size but fewer edges. The network didnot contain one dominant component consisting of the majority of genes, as was observed
92

5.3. EXPANDING THE CSD FRAMEWORK WITH MUTUAL INFORMATION
for both the ρ- and the wTO-based networks. The MI-network consisted of 532 groups ofwhich 387 were separate pairs of two. The largest component consisted of 319 genes andseveral other components of intermediate size were also present.
Table 5.5: Table of network parameters for the networks based on mutual information (MI) andon Spearman’s correlation coefficient ρ, both with p = 10−5.
Sij Genes Edges 〈k〉 C Diam. d̄ Power lawMI 2106 2367 2.2 0.05 16 5.8 a = 848, b = -1.9ρ 1516 3612 4.8 0.11 18 6.4 a = 524, b = -1.5
The MI-based network had lower average degree and average clustering coefficient than theρ-based network. In Figure B.2 the degree distribution for the network is shown a log-scale.The degree distribution’s approximated power-law function y = 848x−1.9 had a very highfit to the data (R = 0.998, R2 = 0.913). A degree exponent close to -2 and a scale-freenetwork structure are typical for metabolic networks [1], suggesting that the differentialco-expression network is a reasonable representation of the underlying transcriptome profilein the thyroid cells. The strategy for correction of variance in MI-scores between expressionvectors and importance level thresholding for network inference was identical to that ofnetworks based on ρ and wTO as similarity measure. The discordant structure observedhere compared to the very interconnected networks based on ρ and wTO are thus likely tobe rooted in the mutual information as similarity measure.
5.3.1 The behaviour of hubs
There were only 25 DEGs in this network with k > 20. These are listed in B.3. Many ofthe hubs in this network are genes encoding immunoglobulins or genes encoding proteinsinvolved in immune system processes. These are mostly interacting with other genes byconserved links and are homogeneous. These then are likely to be regulated normally inboth conditions. Other hubs were dominated by specific type links.
The hub RPS17 encodes ribosomal protein S17-like and is connected to many other riboso-mal protein-encoding genes. These are associating by S-links, indicating that their associa-tion is specific for either sick or healthy persons. Many of it’s neighbors are also ribosomeprotein-coding but not homogeneous and mark the transition from conserved associationsand specific. This suggests that there could be some general regulatory machinery acting onall of the S-linked ribosomal proteins and thus take significant control of all of these gene’sexpression levels. The hub USP34 encodes a peptidase that has an important role in port-translational protein modification. Mutations in this gene has a documented correlation tocancer progression and cancer cell survival [154], this gene has exclusively S-links. AnotherS-link dominated hub is the gene MFAP3, which encodes a microfibril-associated proteinimportant for regulation of several other genes through phosphorylation of signal proteinssuch as EGFR and ERK2 which upon this regulation mediate cancer metastasis and poor
93

5.3. EXPANDING THE CSD FRAMEWORK WITH MUTUAL INFORMATION
clinical outcome [155]. Aberrant behaviour in these hubs is thus likely to cause changesin the expression levels of other genes, as is seen in the high number of other genes thesecorrelate with. Specific links report that going from one condition to the other results in asudden correlation between thees genes.
The specific type-links between these hubs clearly demonstrate that the associations betweenribosomal proteins, port-translational processor proteins and signal kinases are correlationwith many other in a condition-specific context. These may be subject to abnormal trans-lational regulation that only occurs in one condition or they themselves could be regulatingother abnormally. This condition-specificity is rooted in the differences between healthyand thyroid cancer-patients, and is thus likely to represent one of the manifestations ofmalignant associations between genes in the transcriptomic network.
5.3.2 THCA-associated genes
GO-enrichment analysis of the entire gene set resulted in identification of eleven new thyroidcancer associated-genes, listed in table 5.6. Of the 18 genes from this network resulting fromfunctional annotation analysis identified thyroid cancer-associated genes, the ten genes inthis table were unique to the MI-based network. All of these genes had low degrees and eitherassociated with their neighbors by specific or differentiated type links. The transcriptionalpattern of these genes thus correlated with their neighbors’ in a condition-specific manneror associated with reversed sign of correlation.
GO-enrichment of the entire network resulted in enrichment of similar biological processesas those enriched for the networks based on ρ and wTO. GO-enrichment analysis of hubs didnot result in any significantly enriched processes. The results from the functional annotationanalysis with highest fold enrichment are listed in Table 5.7. Processes involved in theimmune system were highly enriched. From the functional enrichment it can be observedthat the investigated thyroid transcriptome patterns have abnormal increase in activityrelated to antigen processing, T-cell selection, and humoral immune response regulation.
94

5.3. EXPANDING THE CSD FRAMEWORK WITH MUTUAL INFORMATION
Table 5.6: Table of thyroid cancer-associated genes uniquely identified from functional annotationanalysis of the DEGs from MI-network.
Gene symbol Gene name k t∈(C,S,D)
FN1 fibronectin 1 8 SCCL5 C-C motif chemokine ligand 5 3 CITGB2 Integrin subunit beta 2 3 CITPR1 inositol 1,4,5-triphosphate receptor 1 3 DTPO Thyroid peroxidase 3 DARRB2 Arrestin beta 2 1 SDIO1 iodothyronine deiodinase 1 1 DGSTP1 glutathione S-transferase pi 1 1 DITGA1 Integrin subunit alpha 1 1 SITGA3 integrin subunit alpha 3 2 DHLA-DQA1 major histocompatibility complex, class II, DQ alpha 1 1 SLGALS3 galectin 3 2 SMLH1 MutL homolog 1 1 DNCOA4 nuclear receptor coactivator 4 1 DPLAU Plasminogen activator, urokinase 1 SPRKAR1A Protein kinase type I reg. subunit alpha 2 DS100A10 S100 calcium binding protein A10 1 SSDHB Succinate dehydrogenase complex subunit B 2 DSDHC succinate dehydrogenase complex subunit C 2 DSLC26A4 solute carrier family 26 member 4 1 CSNX19 Sorting nexin 19 1 DTCF12 Transcription factor 12 2 STG thyroglobulin 1 DTRIP11 Thyroid hormone receptor interactor 11 2 STRIP12 thyroid hormone receptor interactor 12 1 S
95

5.3. EXPANDING THE CSD FRAMEWORK WITH MUTUAL INFORMATION
Table 5.7: GO functional enrichment analysis results for the CSD-network based on mutualinformation as similarity measure. The importance level for the network is 10−5. Enriched processesare sorted by fold enrichment.
GO biological process FESRP-dependent cotranslational protein targeting to membrane 8.5Positive thymic T cell selection 8.1mRNA catabolic process, nonsense-mediated decay 7.5Translational initiation 7.5Pos. reg. of interleukin-2 biosynthetic process 6.9Reg. of humoral immune response 6.5Complement activation, classical pathway 6.4Fc-gamma receptor signaling pathway, phagocytosis 6.3Reg. of antigen processing and presentation 5.8
96

5.3. EXPANDING THE CSD FRAMEWORK WITH MUTUAL INFORMATION
S100A10CCL5
FN1
ITGA3
ARRB2
ITGA1
ITPR1
HLA-DQA1ITGB2
TPOTG
TRIP12
TRIP11
TCF12
SDHB SLC26A4 LGALS3 NCOA4 DIO1 PLAU GSTP1 PRKAR1A SDHC SNX19MLH1
Figure 5.5: Differential co-expression network inferred with CSD-method implementation withfoundation in mutual information as similarity measure. Importance level is 10−5. Interactions areof all types, C-scores are colored blue, S-scores are green, and D-scores are red. Thyroid-cancergenes are tagged by name and highlighted with enlarged node size.
97

5.4. COMPARISON OF CO-EXPRESSION MEASURES
5.4 Comparison of co-expression measures
The following section will present results from comparison of the different networks inferredwith the CSD-framework based on four similarity measures. An illustration of how thesealternatives differ is given in Figure 3.2.7. The results demonstrates the effect varioussimilarity measures forming the foundation for co-expression analysis have on the inferrednetworks. All networks have been inferred from the identical data set of thyroid cancerexpression data from TCGA and healthy control from GTEX measured in thyroid gladtissue.
Results for networks constructed with four different similarity measures are basis for theCSD-framework for differential co-expression network inference. Similarity measures areused to calculate the values for the correlation matrix, from which the network adjacencymatrix is inferred with the CSD-framework. These four strategies are abbreviated in thefollowing manner:
• CSD: Spearman’s rank correlation coefficient. As original implementation of CSD-framework
• CSD -VAR : Spearman’s rank correlation coefficient without variance correction.
• wTO : Weighted topological overlap. Computed by topological overlap matrix trans-form of correlation matrix based on Spearman’s rank correlation coefficient, softthresholded using β = 5.
• MI : Mutual information inferred with parmigene, where the variance of MI estimationper gene-pair of an association is based on 20 replicates.
Comparison of Spearman correlation and mutual information: In both of these measures,in which two gene’s expression values X and Y are random variables, each of the similarityscores contains a point-wise measure of the distance of the two random variables fromindependence. They are both expressed as a distance between the random variables’ jointprobability mass functions (PMF) p(x)p(y) from the product of the variables’ marginalPMF’s. For the correlation measure, this distance is in the form of ranked gene expressionlevels and for the MI difference in the form of logarithms. The similarity measures differin that the correlation create a weighted sum of the product of the two random variables,while the MI measure what independence between the variables - or, rather, a lack thereof- does to their joint probability.
5.4.1 Network construction
For both versions of transcriptomic data sets preprocessed in different ways, each of themwere used to generate differential co-expression networks with the CSD-method with differ-ent cut-off values. The table of page 100 shows the network parameters for each of them.Both data sets consisted of 504 thyroid cancer samples and 399 normal controls. Analysis 1
98

5.4. COMPARISON OF CO-EXPRESSION MEASURES
is the data set with identical pre-processing of both the thyroid cancer and healthy controltranscriptomic data with strict filtration. This set consists of 16,728 genes. In Analysis 2the thyroid cancer data had been less strictly filtered, and contained 20,657 genes.
Genes and edges correspond to the number of genes and edges in the networks respectively,〈k〉 is the average degree, Cv is the average clustering coefficient. The importance level p isthe common importance level used to estimate threshold values XC,S,D
p for each of the scoresin order to map them in a comparable scale [3]. The table also lists the network diameter(Diam.), density, average shortest path, and the variables of the degree distribution fittedpower law, who’s expression is given by y = axb. The variables a and b are listed, togetherwith the R and R2 values for the evaluated power law fit to the data.
99

5.4. COMPARISON OF CO-EXPRESSION MEASURES
Ana
lysis
1p
Genes
Edges〈k〉
Cv
Diam.
Densit
yPa
thPo
wer
law
CSD
10−
44700
24301
10.341
0.116
130.002
4.788
a=
3146.7.b=
-1.590.R
=0.978.R
2=
0.926
10−
4.5
2695
8292
6.154
0.095
220.002
6.363
a=
1525.1.b=
-1.667.R
=0.998.R
2=
0.894
10−
51313
2442
3.72
0.074
230.003
3.72
a=
646.39.b=
-1.716.R
=0.997.R
2=
0.927
10−
5.5
587
804
2.739
0.085
140.005
5.221
a=
277.7.
b=
-1.737
.R
=0.999.R
2=
0.913
CSD
-VAR
10−
45118
26327
10.288
0.106
160.002
4.997
a=
3373.2.b=
-1.584.R
=0.977.R
2=
0.932
10−
4.5
2945
9031
6.133
0.093
200.002
6.383
a=
1878.1.b=
-1.799.R
=0.985.R
2=
0.928
10−
51448
2725
3.764
0.080
190.003
5.964
a=
704.51.b=
-1.720.R
=0.998.R
2=
0.922
10−
5.5
647
806
2.491
0.064
160.004
5.335
a=
315.88.b=
-1.835.R
=1.R
2=
0.895
wTO
10−
42093
24650
23.555
0.166
140.011
3.668
a=
294.18.b=
-1.062.R
=0.996.R
2=
0.764
10−
4.5
1207
9729
16.121
0.134
100.013
3.237
a=
169.61.b=
-1.026.R
=0.998.R
2=
0.8
10−
5608
2659
8.747
0.155
90.014
3.195
a=
142.73.b=
-1.174.R
=0.997.R
2=
0.861
10−
5.5
325
812
4.997
0.184
180.015
3.570
a=
86.579.b=
-1.239.R
=0.990.R
2=
0.841
MI
10−
48683
22653
5.218
0.051
170.001
6.146
a=
5783.8.b=
-1.825.R
=0.980.R
2=
0.927
10−
4.5
4623
7517
3.252
0.050
230.001
8.781
a=
2371.0.b=
-1.882.R
=0.998.R
2=
0.936
10−
51807
2775
3.071
0.065
260.002
8.604
a=
721.71.b=
-1.766.R
=1.R
2=
0.902
10−
5.5
356
303
1.702
0.035
70.005
2.883
a=
202.39.b=
-2.153.R
=0.999.R
2=
0.921
Ana
lysis
2p
Genes
Edges〈k〉
Cv
Diam.
Densit
yPa
thPo
wer
law
CSD
10−
46593
32569
9.880
0.101
180.001
4.921
a=
4170.9.b=
-1.589.R
=0.985.R
2=
0.920
10−
4.5
3535
11709
6.625
0.104
160.002
6.065
a=
1343.2.b=
-1.511.R
=0.998.R
2=
0.912
10−
51516
3612
4.765
0.105
180.003
6.391
a=
524.47.b=
-1.523
.R
=0.998.R
2=
0.887
10−
5.5
694
1213
3.496
0.100
230.005
6.970
a=
330.1.
b=
-1.636.R
=0.996.R
2=
0.937
CSD
-VAR
10−
46618
38881
11.750
0.124
130.002
4.769
a=
3950.5.b=
-1.526.R
=0.985.R
2=
0.921
10−
4.5
3621
13359
7.379
0.114
210.002
6.258
a=
1760.5.b=
-1.559.R
=0.995.R
2=
0.931
10−
51594
4194
5.262
0.123
150.003
5.858
a=
686.24.b=
-1.569.R
=1.0.R
2=
0.924
10−
5.5
719
1360
3.783
0.125
130.005
3.783
a=
344.7.
b=
-1.630.R
=0.998.R
2=
0.943
wTO
10−
42824
27498
19.475
0.172
120.007
3.916
a=
433.13.b=
-1.121.R
=0.996.R
2=
0.698
10−
4.5
1419
14248
20.082
0.181
160.014
3.979
a=
130.06.b=
-0.938.R
=0.968.R
2=
0.576
10−
5770
4831
12.548
0.274
110.016
3.547
a=
190.01.b=
-1.169.R
=0.993.R
2=
0.844
10−
5.5
430
1241
5.772
0.333
100.013
3.385
a=
100.18.b=
-1.233.R
=0.977.R
2=
0.774
MI
10−
45406
10405
3.849
0.040
260.001
8.264
a=
1381.2.b=
-1.632.R
=0.995.R
2=
0.852
10−
4.5
2405
3725
2.986
0.045
310.001
9.424
a=
485.03.b=
–1.542.R
=0.985.R
2=
0.866
10−
5980
1156
2.359
0.057
60.002
2.348
a=
240.53.b=
-1.591.R
=0.973.R
2=
0.865
10−
5.5
396
382
1.929
0.047
80.005
3.048
a=
139.86.b=
-1.750.R=0.991.R
2=
0.889
100

5.4. COMPARISON OF CO-EXPRESSION MEASURES
Figure 5.6 illustrates the standard CSD-network inferred with the data set of Analysis 1.The thyroid cancer expression data set was preprocessed identically as the healthy thyroidexpression-data from GTEx had already had been pre-processed. The importance value ofthe network was 10−5.
MT1M
SYT12
SUSD4
C16orf74
QRICH2
MSMO1
SDC4
ELK1
EIF4G2
ESAM
EBAG9
HDHD2
OCIAD2 C6orf89
GCSH
SOD1
DYNLRB1
MAPKAPK3SPINT1
TG
TM9SF2
UGGT1
PGK1
EIF3A
PSMA2
POLR1A
CYB561
MLEC
DMAP1
AQR
G3BP2
NDUFS6
KCNQ1
TEX261
BANF1
ATP5E
COX6B1UQCRQ
COX6C
LDHA
ATG16L2
HNRNPAB
APBB3
GNL2
DMTF1
CROCCP3
ARHGAP33
LAT
EIF4A1
PLA2G4B
MAN1A2
ATP5J
MFSD1
USP8
NDUFB10
PARK7
SF3A1
ATRN
EPHA10
PHKB
MYL12B EIF4G3
CANX
NDUFA1
ATP5J2
MAGT1
VAMP8
COX6A1
UQCR11
NDUFB7
SMC5
ANAPC11
FAM160B1
SARNP
PRPS1
IGHM
IGLV1-44IGHV3-21
IGLC3
IGHG2
IGHV1-69
IGKV3-11
IGHV3-7
IGHV3-23
IGHV1-46
IGLV6-57
MZB1
IGLV3-25
IGHV4-59
IGKV1-16
IGKV1-6
IGHV3-30
IGHG3
IGLV2-23
IGKV4-1IGLV1-40
IGHV4-34
IGHV1-18
IGHA1IGLV2-14
IGHV5-51
IGHV4-39
IGHV4-61
IGHV3-33
IGLV3-19
IGLV2-11
IGHA2
IGHV3-15
IGLV2-8
IGKV3-20
IGKV1-5
IGHJ3
IGLV1-47
IGHV3-48
IGKV1-17
IGKV1-39
IGKV3-15IGHV3-11
IGKV1-12
IGHG1
IGLC2
IGLV3-1IGLV3-21
IGHGP
IGKV3D-15
IGLV1-51
CHPF2
DHDDS
AC090505.1
ANKRD37
ME1
KLHDC9
RNASEH1
ZGLP1
RNF4
DHX15
TMEM182
FBXW2
HSD11B1LSTRN
TCEA2
NDUFA13 ZNF800
ABHD14A
AGFG1
CHADL
AREL1
TNFSF12
CXCL17
SLC25A37 WDR86-AS1
TMEM79
AC009041.2PLRG1
TCEANC
SGK1
ZADH2
DOCK5
NFX1
USP16
SLC25A46
OPHN1
ZZEF1
ATP6V0A2
RNF31
ABCE1
PCYT1A
PEX16
QRICH1
SLC30A6
WDR36
TMEM42
EVC
WDR26
XPO5
PHF20L1
RNF25
ZFYVE19
MROH6
CUL4ADIS3
CTD-2132N18.4
RANBP10
IARS
ITGA2
WDR55
SPECC1
GABRB2
VPS16
KCNQ3
LINC00852
AHNAK2
GRHL3
ALOX5
PTPRE
TNFSF9
ST6GALNAC5MUC1
PTPRU
ABTB2
CYP2S1
NXN
LOX
DRAM1
PERP
CD55
B3GNT3
TMPRSS4
STAC
DSC2
FN1
ELF3
FBXO15
CCL20
UST
ACVR1OSMR
MICAL2
FLNA
MORN2
TEAD1
ANXA3
RAD18
SNHG15
SLC34A2 PTPRF
RAB11FIP1
TIMM17B
RASA1
MRPS17
DOCK9
MICALCL
CNPPD1IGF2R
MACF1
XPR1
PEF1PCDHAC2
RAVER2
IQCH-AS1
L3MBTL4
A2M-AS1
RNF157-AS1
SFTPC
NR2F1-AS1
MBOAT2
MVP
MYD88
DPY19L2
NDUFS3
NDUFA8
ELP6
DAG1
PPIB
NDUFC2
HSD17B10
CALR
FAM3C2
LAMC2
SMIM7
HGD
MT1A
ISM1
TCTA
PDIA3
NAMPT
TPD52L1 TPO
ERLIN1
SLC20A1
CDK2
QDPR
ITPR3
LOH12CR2
PPRC1
AMOTSERPINB8
VWA5A
CHST14
FAM104B
OCEL1
SLC17A5
DSP
BCL2L1
METTL7APTGS2
GPR153
STAT4
IRS1
KLF15
SYBU TECTB
ZMYND12
C3orf18
ANKLE2
GGA3
DSG2
AKAP8
KRBOX4
FLRT1
SEMA4F
FUT2
ZNF248
DNASE1
L3HYPDH
KAT2A
SRP14-AS1CALCOCO2
ADCY7
AXIN2
EDNRB
DYNC1I2
ISY1
TRAF7
MIEF1
ITCHSLC35E1
HIST1H4I
PSMD2
MCMBPNUP133
KIAA1109
LTN1
B3GALNT2
CLASP2
BTBD7
DHRS7B
PSMA6
ZC3H12C
SEC24A
PDE12
POLR2B
CTBP1
ZNF747
SF3B3STAT3
UBQLN1
SUPT16H
CHUK
ERH MBOAT1
RP9P
USP9X
TGS1
LRRC29
LPCAT3
TFIP11
UTP23
SMC1A
RFNG
MICAL3
HPS6
UBE3C
EMG1
SRP72PSMC3
PRMT5
PSMD1
NUP98
CSNK1A1
NOMO2
TRAPPC1
SDHC
PRADC1
LCMT2
SLC25A24
ARPC4
EPRS
TRIP11
GSPT1 PCDH1PSMA4
XRCC6
WDR82
CYP51A1
SMARCA5
HNRNPH2
KIAA0232
NOLC1
SPTY2D1 DHX9PSMC4
PSMD11
PLD6
SRP54
IPO9
PSMD7
PSMB1
CLPX
GTPBP4
SEC16A MIR22HG
WRN
FBXO38
GSR
DDX18
SPIN1RECQL
MRPL32
MIEN1
DDX21
DIAPH1TUT1
G3BP1
CUL3
DHX8
PAFAH1B1
AP1G1
CS
NDUFA7
PSMD6
ORMDL2
ACBD3
PPP1R3E
TAF5L
SPTLC1 CCS
RPUSD2
SNRPA1
C1QBP ATP5C1LARP4
CIAPIN1 THUMPD3
PIK3C2ATUBA1C
GORASP2
DNAJC14
WDR44
ATP6V1A
SMG8SDHAF2
KIDINS220
BAZ1B
RAVER1
PSMB6
CDC5L
GNA13
GART
KMT2D
NDUFV2
SEC23IP
DHX36
IDH3A
RALGAPB
ARFGEF2
POC1B
TMF1
FUBP3
TSR1
XRN2
CNNM4
VPS4B
CCDC159
ATF6
GPR75
PRKDC
LEMD3
MRPL27
POLR1C
TOMM40
PTPN11
INVS
PIK3C3
GTF3C4
HEATR1GAMT
TRAPPC8
GIGYF2PSMC1
PCM1 DARS2
ALKBH2 ZNF770
PSMD13
TSTD2
EMC1
COPB2
MRPS22
PPM1G
MAGOH
PSME3 MED14
XPO4
RNF40
ERC1GPATCH2LHUWE1
KLHL9
C10orf12
RBL2
CCDC117
KIF2A
DDX46
PARGEXOSC4
MKLN1
PNO1IPPK
APAF1
SMG6
GADD45GIP1UBR4
ALG11
DMXL1
ACADSB
GNL3L
RP11-159G9.5
IPO4
WNK1
LRRC37A16P
HACE1
SNRPG
SEC24C
CHM
NCOR1
SOS1
TBC1D5VPS13B
PPP1R14BP3
AKAP11
CCDC12
TSFM
TCF12
SLK SURF4
EIF5A
EIF2S1
RPL19
RPL37
RPL27
RPL38
UBA52
RPL36A
FBXL4
RPL22
CHTF8
RPL15
RPS8
RPL5
RPL4
ZFP91
RPL18
RPS3
RPL35RPL13A
RPL14
RPL29
RPS20
RPS7
SMARCAD1FAM169A
BPTF
PLEKHM3
BAZ2A
TAF2
FAM208B
RPL30
RPL11RPS6
RPL35A
RPL31
RPS15A
RPL37A
RPS25
RPS24
RPS11
RPL27A
RPL23
RPL32
RPL7A
ZC3H13
TRMT112
MBTPS2SPOPL
NPAT
USP1
C19orf53
EIF3L
PHF3
RABEP1
UBE4ACUL5
MID2 GOLGB1
ACAP2
GOSR1
SMC3
FEM1B
AIMP2
HINT3
VPS18
TBC1D15NFKBIB
CDC42BPB
PPM1A
KDM1B
DIP2B
PANK3
LRRC58
DCAF10
PDPK1
APOOL
GOLGA4
WDR7
KIAA2026
ASH1L
DENND4C
SEC24B
M6PR
MTMR6
SF3B4
BOD1L1
MTDH
FBXW11
PSMB3
DCAF7 MTORTGFBRAP1
USP37
NDUFA9WDR3
NOP16MRPL47
MCUR1
ALG3
BBX
PSMA5
COPB1
TRAPPC10
LZIC
MRPL20
HK1
RRAGAKBTBD4
FKTN
CCDC71
DDX28
CLK3
NDUFS1
PSMB4SSBP1
NUP153
PTRH2
ADRM1
PIK3R4
PSMA3
NEK1
TRIP12ABT1
EIF4G1
NCOA4
RTCB
PSMB2
PMM2
NIPA2
DDX1
CDC40
NARSSCAPER
ARID1A
TP53BP1
NUS1P1
TRRAP
PIAS1
SHPRH
AFF4
FAM160A1
HBP1
GALNT4
ROMO1PSENEN
KIF1B
PHC3DYNC1LI2
ZNF699
PET100
SERF2
USP34
POLR2J
PIK3CA
ZNF292
SMG1
ANKRD17
XRN1
DPP8
MYCBP2
OTUD4
FAM208A
LSM10
C8orf59PRRC2B
ASAP2
ZNHIT1
CNPY2NBN
ERCC6L2
B3GALT6
PSMD4
MRPL55
LRRC59
SDAD1
ACBD4
GNE
FBXL18
HNRNPUL2
DNAJC11
RGP1
REST
TRMT61B
ZFYVE9
SEC23B
GNSCEP350
NAA10
PPP1R14B
MAP3K2
DOCK7MRPS18C
HMOX2
TALDO1
MFSD5
SON
ANKRD18EPMFAP3
HECTD1
CAPRIN1
ARIH1
CRYBG3
NHSL2
NSD1
APC
FOXJ3
TSTA3
ASPH
MRPL14MON1B
TXNRD1
HYAL2
ZBTB1
YLPM1POLR2I
SCAF11
ZNF41
DPM3
HEATR5B
STX17
ATXN1L
LRBA
ZBED6
MTF1
SETD2
CCNT1POMK
RAPH1
SCAF8
TAOK1
ZNF81
UTP14C
NUFIP2
UBL5
BTBD8REV3L
TAF1
CHD9
KLHL11
KAT6A
CNOT1
ADNP2
TMEM208
GCC2
ZRANB1
ASXL2
MED1
BIRC6
ARID1B
GTF2I
UBXN7
POM121
NCOA2
PJA2
ALMS1
TBC1D14
PBRM1
KDM5A
NFAT5
NACA
TMEM219
RNF169USP32
TAB3
RNF111
GFM1
ANAPC1
KDM3B
CTR9
NBEAL1
IREB2
IMP3
PIKFYVE
SLC31A1
NDUFB8
UBR1
PSMC5
FBXO11
ACLYGBF1
SMCR8
CSNK2BPA2G4
IPO7
VPS41
VCPRPRD1B
USP12
NEK4
MPP7
VPS35BRMS1
GLS2
KPNA1
NCBP1
IARS2
NEMF
WDR92
RNASET2
TUBB4B
C19orf70
CDC123
XRCC5
DOLK
C6orf136EP400
CLINT1
HP1BP3
SPAG9
RCCD1
MAPK1
APPBP2
OPA1WDR43
LRRC37A17P
UBE3BYTHDF3
SCYL2
H2AFY
SNRNP200
CLTC
AHCYL1
URB2 ALG5
ZC3H14
PLAA
C6orf47
TBCKPDHB
NBPF1
OSBP
FHL1
CDC42BPG
PLAUR
KRT19
NFE2L3
IVL
KCNN4
ADAMTS14
ADIPOR2
CFH
COL8A1
CEACAM6
AC015726.1
MACC1
NELFCD
IDS
ENDOD1
SLC35F2
PPL
MAP3K5
C16orf89
DCSTAMP
PROS1
MET
SPTBN2
ERBB3
PODNL1
DIO3OS
NNMT
COL11A1
VCAN
COL1A1
ACVR1B
OMD
CDHR3
RUNX1CCDC146
CCNA1
RIC8B
ITGA3
CXCL16
ANXA2
DICER1-AS1
SFRP4
SERPINF1
PODN
DPT
MSC
OGN
ADRA2A
PRELP
COL10A1
COA3
SNRPN
ITPRIPL2
THBS2
WISP1
LDLR
LYST
LIPHTMEM117
CINP
TBC1D2 ITGB1
SGMS2
EVA1A
RCAN2
PDE5A
ZNF430
EPHA4
NCKAP1NPY1R MEX3CCOMP ABRAXAS2 NCF1C19orf71CUTC
NPY5R LAMP5 WAC FZR1 NCF1CRPRD1A ZSCAN16-AS1 TRNAU1APPHF1 HSPA7IMMT MPHOSPH8PARGP1HADHB SRXN1 UBE2I
CDCP1TMSB10 EML1 PSMD12 FKBP2 BEND5 CYB5D1 CRELD2 PHF13 HLA-B CAMK2N1 ACADL COL1A2
S100A11SYTL2 GABPB1SNIP1 HCFC1 SMIM3 COL3A1VARS TNIKSDF2L1 HLA-FFAM89B
MGST1MRPS31P5ACAA2 CAP1 HNRNPRFCGR2CGALE
TRIM58 EXO1MCM10
HLA-DOA
DTL GEMFBXL14
PIK3R2 SNAI2
NID1
HLA-DRA
CD74
SPOCK1
HLA-DPB1
AOX1HLA-DPA1
HLA-DRB1
HLA-DQA1TCF19
OLFML1ZFP64
LAMA2SLC35A4
BHLHE40
AC114730.3
LY6G5B
FAM111A
SLC4A4
BHLHE40-AS1
SRPRB
SGMS1
ACACB
RAD23B FKBP1A
FAM84B STAG3L5P
DDX39BDUSP5
CD1A
FUCA1S100B
WWOX
ACBD5 SDF2C18orf32CACNB4 AP3M2ARMCX6CRLF1 LUCAT1ELMO1
IER3IP1PLXNC1 OSGIN1CLEC2B CPEB4TMEM59L OTOS TM9SF1RTKN TXNMYH10 RPS3A SLC26A4-AS1LCN6 PAPSS1 PFN1
ACTA1 COL4A1SLC27A6ANKFY1 CCDC148FHALDH2 LLGL1SLC26A4C15orf52 NUCB2RPL7 RFFL CFL1
ECE1TNNT1 COL4A2NTHL1 SPOCK2ARFGEF1 KIAA0391
AC027601.1 DUSP22 NOD1PRSS53
SIPA1L2
S100A2CYYR1 KRT15ZNF714 WSB1ZNF510 PDLIM4
TCERG1
HNRNPH1
MATR3
SNX15SRSF11
NKTR
RBM25 HNRNPU-AS1
UBE2Q2P1
MRC1
CCL13
SFTPB
CCL17
RETNTMEM92
CD1E
CXCL5
ZNF148 STX16 AFAP1L1 S100A10VN1R81P ITGB4GNA14
AIF1
TREM2
LAPTM5
LY86
FCER1G
TYROBP
HCK
SLC37A2
MSR1
BCL2A1
FOLR2
CD163
CSTA
ALOX5AP
LSP1
HCLS1
BATF
ITGAL
TLR8
TBXAS1OLR1
MS4A6ALRRC25
MS4A4AVSIG4
C3AR1
C1QB
ITGAX
C1QC
C1orf162
GPR34C1R
CXCR6
C1S
IFNG
CSF1R
CCR7
RNASE6
LAIR1
CYBB
HK3FERMT3
SIGLEC9
C1QA
TNNI2
TNFAIP8L2
CD7
CD33
ADAM8
PILRA
GNA15
AFF2MARS2
MANFCPT2
GJC1
P2RY6ZNF593UTP3 TSPAN3RGS5
WDR46
TPSAB1 CD34
RXRGCPA3PCDH12
PRIMA1
ASPM TPSB2RPL6 ENTPD2S100A8GON4L CAMSAP1 MT1F BCL6BLUC7L
ACP5ZFP69BRRM2 SMURF1EEF2MT1H
MYO15B
FAM168B PTPN22 RPL13COL6A3 GRB7 HBA2TMEM176ABIRC2 CST6CXCL10DDX47DONSON
MT1GMKI67 NRIP1EEF1G
EEF1A1
S100A9
CSDE1
HAUS7GPS2DNAJB11AURKAIP1 FOXP3
TACC2LAMP2
SCN4B
LGMNCXCL11TTLL3MCM4HBBTMEM176BMAPKAPK5-AS1RPS15SNRPB2 TGFB3 PTPRCTMPRSS6
SLAMF7
SIT1
CD3G
CD48
CCR5
SP140
CD5
TRBC2
CD247
CCL5
IL2RG
PTPN7
CD2
CD3ECD3D
IKZF1
TRAC
TRAF3IP3
IL7R
TNFSF13B
MPEG1TFEC
CD37
BIN2
EVI2B
CORO1A
EVI2A
CRABP2
LCP1
SASH3
WAS
CD84
SNX20
SELPLG
DOCK2
ITGB2
NCKAP1LBTK
HAVCR2
CD53
CD86
ITGAM
PIK3R5
ARHGAP30
SPI1
PARVG
MYO1F
PCED1B-AS1
PSTPIP1
CYTH4
STARD8
CLEC3B
KDR
TBXA2R
ARHGAP9FLT4
TMEM204
PODXL
NDUFA4L2
BTNL9
TMEM88
PC
POU2F3
CLDN1
MRO
ITPR1
LAD1
SPARCL1
MYCT1
GNG11
ACVRL1
FZD4
LDB2
EMCN
GIMAP6
LRRC70
GIMAP8
NGEF
EBF3
MTURN
GTF3C1
Figure 5.6: Differential co-expression network inferred with original CSD-implementation basedSpearman’s rank correlation coefficient. Interactions are of all types, C-scores are colored blue,S-scores are green, and D-scores are red. Node degree distribution is included in the left corner ofthe figure.
101
5.4. COMPARISON OF CO-EXPRESSION MEASURES
Figure 5.7 presents the network inferred with the CSD-framework with the alternative equa-tions for the gene association-scores conserved (C), specific (S), and differentiated (D). Herethese gene-pair relation scores are not corrected for (divided by) the variation in the cor-relation value for the two genes in the pair. The network presented is inferred with animportance value of 10−5. The node degree distribution is presented in B.3, where a redline indicates the approximated power-law function to the empirical data points.
102

5.4. COMPARISON OF CO-EXPRESSION MEASURES
IRS1
DIO1
TP0
TG
SDHC
NCOA4
ITPR1
MATN2
HLA-DRB1
HLA-DQA1
S100A10
SLC26A4
ITGB2
CCL5
TRIP11
TCF12
TRIP12
STAT3
MAPK1
PIK3CA
CDYL
ITPR3
FN1
ITGA3
Figure 5.7: For network 1: Differential co-expression network inferred with CSD-method imple-mentation with Spearman’s rank correlation coefficient without variance correction (CSD-VAR).Interactions are of all types, C-scores are colored blue, S-scores are green, and D-scores are red.Node degree distribution is included in the left corner of the figure. Thyroid cancer-associatedgenes are highlighted by enlarged node size and tagged by gene name.
103

5.4. COMPARISON OF CO-EXPRESSION MEASURES
5.4.2 Sample size robustness
The network robustness analysis aimed to elucidate differences in constructed CSD-networksoriginating from the similarity measure applied as the elementary step of the differential geneco-expression (DGCE) analysis. The similarity measure Sij quantifies the degree of simi-larity in expression values between two genes in the input transcriptomic data files, herethe network robustness dependent of similarity measures was tested. Four alternative simi-larity measures were employed and their effects on the networks were tested by robustnessanalysis, as explained in detail in Chapter 3.2.7. The aim of this section in to test thefidelity of a low sample-size based DGCE network compared to the network based on allsamples, and use this information to compare robustness of the four similarity measures.The size of the simulated sample size, constructed with random selection of samples fromthe whole data set, increases along the x-axis. Three random sub-sets were constructedfrom the gene expression data set of sizes 50 (samples), 100, and 200, for which DGCEnetworks were constructed for each of the four similarity measures. The maximum numberof samples were 504 samples from the thyroid cancer data set and 399 healthy persons, thisset acted as baseline for assessing the sub-samples’ performance. The results presented inFigure 5.8 illustrate how a small sample size of transcriptomic data set affects the qualityof the inferred CSD-network.
The four similarity measures under investigation is the Spearman’s ranked correlation co-efficient (CSD), the Spearman’s ranked correlation coefficient without variance correction(CSD-VAR), weighted topological overlap (wTO), and mutual information. The resultsfrom robustness analysis of each of them is divided into four sub-plots. Each of the foursub-plots contains either all (a) or one (b-d) type of differential gene association, of the linktypes conserved (C), differentiated (D) and specific (S). For each similarity measure, thereare DGCE networks constructed on the basis of 50, 100 and 200 samples, and the over-lap in terms of identical gene co-expression relationships (links) among them is quantifiedwith the overlap coefficient. For the standard differential co-expression networks based onSpearman’s correlation coefficient (CSD), the overlap in link content between the full setwith the replicas based on 50, 100 and 200 samples are indicated with blue crosses in Fig.5.8. The same measurements done for CSD-VAR and it’s three sub-sample-based DGCEnetworks are indicated with red crosses. The analogous for wTO is marked green, and forMI the markers are yellow.
The y-axis represents the overlap-coefficient range from 0 to 1. A cross in the plot corre-sponds to the overlap coefficient in link content between the DGCE network based of thesize indicated on the x-axis compared to the full set. The placement of the cross in the ver-tical direction is proportional to the number of common inferred links in the network basedon fewer samples compared to the network based on the maximum number of samples. Inthis way the markers denote how fast the performance of each similarity measure dependson sample size in the data. The overlap coefficient marker for the whole sets is indicatedin Fig. 5.8 by a black cross with overlap coefficients of 1. This cross is common for all
104

5.4. COMPARISON OF CO-EXPRESSION MEASURES
similarity measures, because it is the reference for all of their sub-sets individually and thushas full overlap with itself (overlap coefficient = 1).
The robustness assessment in Fig. 5.8 shows that for wTO, networks based on decreasingnumber of samples had overall higher fidelity to the full set, in terms of similar link content,than any other similarity measure. From plot a) is is clear that networks based on wTO hasthe highest degree of overlap in inferred gene-pair associations of all types between the fullset and all sub-sample networks ranging from size 200 to 50. Here it can also be observedthat CSD-VAR performs better than conventional CSD. Mutual information performs theworst, with the most rapid decline in overlap coefficient for smaller sample sizes of datacompared to the full set.
In plot b), it is apparent that the conserved type link is more robust to small sample sizethan the other association scores, specific in plot c) and differentiated in plot d) respectively.Additionally, wTO is the similarity measure showing the highest level of resilience to lowsample size. However, CSD-VAR comes close in terms of performance. It should be notedthat the very low overlap coefficient between sub-sample of size 200 for CSD is an anomaly.This could be caused by two alternative events. Either it can be caused by a randomenrichment of expression values of low value from the included samples of the 200-sampleset, which could be excluded in the final network inference step of the CSD framework.Alternatively, it could be caused by an error in the program pipeline re-shuffling the randomselection of samples chosen to constitute this sub-set. Anyhow, the two other sub-samplesfor CSD support the observation that conventional CSD performs worse than both wTOand CSD-VAR in terms of C-type association overlap. Standard CSD performs better thanMI here also.
The plot in c) shows that S-type links are very sensitive to sample size. It is immediatelyobvious that specific type links are less robust than conserved links, because all overlapcoefficients for every alternative similarity measure declines rapidly. This plot illustratesonce again that the similarity in inferred significant gene associations in networks basedon wTO are the least sensitive to decreasing sample size. The difference between CSD andCSD-VAR seems to be less pronounced, while MI is still the least resilient similarity measure.The last plot, plot d), shows that the general lack of robustness is even more pronounced inassociations of differentiated type. Here, all similarity measures performs relatively similar.The first observation of wTO outperformed by another similarity measures is found forsub-samples of size 100 in this plot, where both standard CSD and CSD-VAR is somewhatmore robust than wTO. MI performs the worst, differentiated associations in CSD networksbased on MI are especially dependent of sample size, this MI as similarity measure suffersfrom limited robustness in it’s applicability to data sets.
105

5.4. COMPARISON OF CO-EXPRESSION MEASURES
Figure 5.8: Robustness analysis plot for the four different similarity measures applied for dif-ferential co-expression analysis for data sets of a fabricated decreasing sample size. The overlapcoefficient quantifies the degree of overlap between inferred gene associations in the networks fromthe sub-sample and the full set. The four different similarity measures compared are the Spearmancorrelation coefficient, the Spearman correlation coefficient without variance correction, weightedtopological overlap and mutual information. a) Associations are of all types, C-, S-, and D. b)Associations are of conserved type (C-links). c) Associations are of specific type (S-links). d)Associations are of differentiated type (D-links).
5.4.3 Homogeneity
The following figures will show homogeneity results for networks constructed with fourdifferent similarity measures as basis for the CSD framework for differential co-expressionnetwork inference. All of them are constructed on the basis of CSD networks inferred withimportance threshold p = 10−5. For all of the four following figures the following applies:Red bars correspond to the median of H, and the green squares denote the mean H. The topand bottom ends of the boxes represent first and third quartile (25th percentile and 75thpercentile) respectively. The ends of the whiskers represent the minimum and maximumvalues of H for the given degree.
Figure 5.9 illustrates the homogeneity sorted by node degree in a box-plot for the standardCSD network based on Spearman’s ranked correlation coefficient. Here all low-degree nodeswith k ≥ 10 and higher-degree nodes with k ≤ 30 have very high degree of homogeneityin distribution of association types. Intermediate degree-nodes are more heterogeneous.Some outliers are found for degrees k = 24, k = 25, k = 35, k = 43, where homogeneity is
106
5.4. COMPARISON OF CO-EXPRESSION MEASURES
substantially lower.
Figure 5.10 is the analogous box-plot for the CSD network based on Spearman’s correlationwithout correlation-variance correction. It is sorted by node degree, which increases alongthe x-axis. This plot shows that there is a high average degree of homogeneity in geneassociation type distribution for nodes of similar degree. For intermediate node degrees,such as k = 22, 30, 43 there are more degree of association type mixing. This indicates thatthese nodes could represent genes that are involved in transcriptional regulation mechanismsacross several pathways and thus have several associations of different types to their neighborgenes.
Figure 5.11 is a homogeneity box-plot sorted by node degree for the CSD-network basedon weighted topological overlap binned by node degree. Here the level of homogeneity fornodes of similar degree appears to be strongly related and follow an asymptotic line towardsan H-score between 0.9 and 1.0. The length and whiskers of the boxes are very short forassociation type distributions for node degrees above 40. This indicates that there are lessoutliers, and an approximately uniform level of homogeneity for the highest-degree nodesin the wTO-network. This well reflects the high degree of segregation between networkcomponents characterized by one single association type in the wTO-based CSD network,as clearly illustrated in Fig. 5.3.
The last homogeneity plot in Figure 5.12, is the box-plot of homogeneity scores sortedby node degree for the MI-based CSD network. This box-plot report of a high degree ofheterogeneity in association type distribution for nodes of identical degree among the lesshighly connected nodes. Here, there are numerous red bars (denoting the medians) which arelow. Vertically long boxes also demonstrate a larger range between first and third quartilesof the values for each node degree. In this network nodes of degree k > 20 are substantiallymore homogeneous than those with degree k ≤ 20. Above this degree nodes are hubs andvirtually homogeneous.
Venn-diagram showing the relative quantities of genes involved in each type of interactionis presented in Figure 5.13. This figure contains four Venn-diagrams containing informationabout the relative quantities of genes involved in each type of interaction as inferred by thefour alternative similarity measures.
107

5.4. COMPARISON OF CO-EXPRESSION MEASURES
Figure 5.9: Plot showing homogeneity sorted by node degree for network constructed with Spear-man’s rank correlation coefficient (CSD) as similarity measure. The network is inferred from thedata-set from Analysis 1 with an importance value p = 10−5.
1 10 20 30 40 50 60
1.00
0.50
0.60
0.70
0.80
0.90
Figure 5.10: Plot showing homogeneity sorted by node degree for network constructed with Spear-man’s rank correlation coefficient without variance correction (CSD-VAR) as similarity measure.The network is inferred from the data-set from Analysis 1 with an importance value p = 10−5.
108

5.4. COMPARISON OF CO-EXPRESSION MEASURES
Figure 5.11: Plot showing homogeneity sorted by node degree for network constructed withweighted topological overlap (wTO) as similarity measure.The network is inferred from the data-set from Analysis 1 with an importance value p = 10−5.
Figure 5.12: Plot showing homogeneity sorted by node degree for network constructed withmutual information (MI) as similarity measure. The network is inferred from the data-set fromAnalysis 1 with an importance value p = 10−5.
109

5.4. COMPARISON OF CO-EXPRESSION MEASURES
Figure 5.13: Venn diagram showing the relative quantities of genes involved in each type ofinteraction. Red circles contain the number of differentiated links, blue circles the conserved linksand the green circles the number of specific type links. The networks are all inferred from thedata-set from Analysis 1 with an importance value p = 10−5.
110

5.4. COMPARISON OF CO-EXPRESSION MEASURES
5.4.4 Identification of disease genes
The similarity measures were finally assessed by their ability to infer DEGs with biologicalrelevance. This was quantified by the presence of thyroid cancer-associated genes among theDEGs in the inferred networks. For each network based on the three new similarity measures,the number of thyroid cancer-associated present were computed and corrected for differentnetwork sizes. This represents the relative performance in this assessment. In addition, itwas interesting to examine whether any similarity measure was able to exclusively identifyany differential co-expression patterns with these disease-genes, hence eventual unique iden-tifications were quantified as well. The result of this final assessment is presented in Table5.8.
Table 5.8: Assessment of relative ability in disease-gene identification for all three alternativesimilarity measures compared to the baseline CSD method
Parameter CSD CSD-VAR wTO MISize 1313 1448 608 1807THCA genes 22 24 5 25Rel. performance 0.00167 0.00165 0.00822 0.01384THCA genes common - 19 2 14THCA genes new - 5 3 11
Note however, that the focus of all these CSD networks as foundation for differential geneco-expression analysis is to identify significant correlations among pairs of genes, and not toidentify individual DEGs. Therefore we cannot expect that all or even the most prominentDEGs for thyroid cancer to be pin-pointed by these techniques for generation of differentialgene co-expression networks. Co-expression networks aim to capture more complex biolog-ical processes by characterizing gene interactions. This is based on the assumption thatpathways of cellular life is orchestrated by the interplay of many components.
111


Chapter 6
Discussion
6.1 Application to thyroid cancer
The first aim of this thesis was to identify inclinations for transcriptional alteration whenstudying expression data from thyroid cancer patients and comparing them to those ofhealthy persons. As presented in the results of Chapter 4, the outcome of applying differ-ential gene co-expression analysis on transcriptomic data provided important new insightson the transcriptional network, the most important genes and the most biologically rele-vant clusters of genes. The CSD framework on this data proved to be very applicable andpromote identification of dysregulated pathways of relevance to the disease under study.
Thyroid cancer is a clinically heterogeneous carcinoma and the most common malignantglandular tumor in iodine-sufficient countries [18]. Thyroid cancer is a type of cancer with-out standard Mendelian inheritance properties, yet it has the highest relative risk of first-degree relatives [156]. This motivates an investigation of genetic interplay characteristicsto this disease. Here, differential co-expression network analysis in the CSD framework wasemployed to study the co-expression profiles of 504 samples of thyroid tissue diagnosed withcancer against 399 normal controls. Their expression patterns were used to detect signif-icant associations between differentially expressed genes (DEGs). These resulting DEGsshowed discordant correlations in expression between the conditions, indicating several ab-normalities in gene expression patterns in carcinogenic thyroid tissue. Some of the DEGswere successfully identified as disease genes by query in the Gene Association Database[5]. The transcriptomic networks resulting from the CSD analysis were scale-free and goodrepresentations of the complex cellular system. This was both an indication of validity ofthe methods employed in this thesis and the results were supportive of recent literature ofmolecular mechanisms related to thyroid cancer pathogenicity.
The primary mean of identifying significant pattern changes between DEGs was throughthe application of the CSD framework for differential co-expression network inference. TheCSD analysis is an analysis of genetic interactions. It aims to elucidate different types
113

6.1. APPLICATION TO THYROID CANCER
of changes in correlation between expression levels of genes. By highlighting significantlycorrelated, anti-correlated and condition-specific relationships between expression levels ofgenes, large regions of the networks with altered transcriptional profiles were identified.A great benefit of the CSD method is that it facilitates biological interpretation becauseit readily distinguishes between three different types of transcriptional correlation. Themethod incorporates variance correction and importance levels to ensure significance andstatistical quality of the inferred relationships between genes in the network. Applicationof this framework on the co-expression data resulted in networks for which the degreedistribution closely followed power-laws and displayed hierarchical structures. This showedthat the CSD networks were good representations of complex biological systems.
A central theory of network biology is that cellular functions are organized in hierarchicalstructures [78]. The sought for central players and modular structures within the network istherefore reasonable because they these are likely to harbour important functions in the cell.The CSD network successfully produced networks which highlighted important genes who’sassociation with others were likely to have large impacts on the thyroid cell transcriptionalsystem, many such genes were hubs in the CSD network (Table 4.1). There were manyhomogeneous S- and D-type hubs. Hubs are important in the transcriptomic network andassociated with disease when mutated or misregulated. The organizational importance ofhubs in networks supports their biological significance of network architectures [80]. Thisis further supported by the fact that many hubs were found between denser regions, asdemonstrated in Table 4.4. Some of the hubs were key regulators of cell division, motility andinvasive behaviour. Mutation or misregulation in some hubs have previously been linked tothyroid carcinoma. In addition, genes involved in the immune system also appeared as hubsin the network. Increased degradation of the ER by highly-connected mannosidases may bea potential mechanism by which ER stress may perturb the entire transcriptomic systemand cause parthenogenesis in cells of the thyroid. Both the hubs and the CSD networks ingeneral were highly enriched for genes and processes descriptive of abnormalities within thesystem (Table 4.2). This affirms the assumptions that biologically meaningful co-expressionpatterns were present and successfully captured in these differential co-expression networks.
The outcomes of biological process enrichment was two-fold. Firstly, it was a potent tool forinvestigation of characteristic behaviours for groups of DEGs. Enrichment provided manyinteresting insights into the interplay of processes taking place in thyroid tissue related tothyroid cancer as reported by [131]. Enrichment made it possible to establish a high degreeof quality of the inferred network.
In autoimmune thyroid diseases, the misregulation of immune components degrading theproteins in the ER of thyroid cells cause inflammation which is linked to development andprogression of cancer. Alteration in regulation of ER-associated mannosidases may driveinflammation of the ER and contribute to tumor progression in thyroid gland tissue [145].Interestingly, the difference between healthy and carcinogenic co-expression patterns weredrastically different for most hubs. Their altered interaction pattern are thus likely totake part in driving aberrant cellular pathways ultimately leading to a diseased phenotype.
114

6.1. APPLICATION TO THYROID CANCER
Actually, the ability to segregate between the two studied conditions in the network washigh. This was found from investigation of network and hub association type homogeneity.This altogether supported the validity of the differential gene co-expression networks inferredwith the CSD framework.
Extremely high fold enrichment was observed for processes of the endoplasmatic reticulum(ER) and the immune system. High fold enrichment of processes related to the (ER) couldbe attributed to the functional importance of the ER in secretory cells, as extended ER isa typical trait of thyroid cells secreting thyroid hormones. But the extreme fold enrichmentof the process on the basis of DEGs can also report presence of abnormal chronic stress inthe ER and loss of immune system integrity, previously related to thyroid cancer [131].
Immunosupression may result in an abnormal immune system which does not effectivelyrecognise and trigger immune responses targeted for cancer cell. This alteration of the im-mune system is complex and can be mediated by many of the enriched biological processesidentified in Table 4.2. Here, high fold enrichment of processes involved with selection anddevelopment of T-cells, regulation of humoral immune system processes, immunoglobulinand antigen functionality and those high enrichment of processes related to the ER sup-port the documented relation between suppressed immune system, chronic ER stress andcarcinogenesis of secretory tissue [125].
Biological processes relating to T-cells of the immune systems are numerous. Pathwaysof the immune systems are normally enriched in thyroid gland tissue, because of theirinvolvement in production and regulation of thyroid hormone. Thyroglobulin is a thyroidauto-antigen which provides a matrix in which the synthesis of thyroid hormones take place[136] and variations in the amino acid sequence of this antigen is associated with autoimmunethyroid disease [157]. When thyroid hormone stimulates its receptor in thyroid tissue, thetissue expresses a sodium/iodide symporter (NIS) which imports iodine from the bloodstream needed for thyroid hormone synthesis. In some tissues of differentiated thyroid,NIS fails to be correctly placed on the cell surface but localizes in the cytoplasm of the cell[146]. Intracellular retention of NIS have been demonstrated to support cell migration [158].Because there is significant fold enrichment of immunity related processes reported by thedifferentially expressed genes, there is indication of abnormal activation and behaviour ofgenes involved in antigen and immune system pathways in the carcinogenic thyroid tissue.This is supportive of proposed mechanisms by which thyroid cancer may become so invasive[125]. Differential expression analysis and functional enrichment facilitated detailed insightsinto the molecular mechanisms of thyroid carcinoma.
Immunosupression may result in an abnormal immune system which does not effectivelyrecognise and trigger immune responses targeted for tumor cells. This sub-optimal alter-ation of the immune system is complex and can be mediated by many of the enrichedbiological processes identified in Table 4.2. Here, high fold enrichment of processes involvedwith selection and development of T-cells, regulation of humoral immune system processes,immunoglobulin and antigen functionality and the high enrichment of processes related to
115

6.1. APPLICATION TO THYROID CANCER
the ER support the documented relation between suppressed immune system, chronic ERstress and carcinogenesis of secretory tissue [125]. Many of the genes found in the networkare genes of which altered genetic sequence of expression regulation are associated withthyroid cancer, as presented in Table 4.6. As is evident from the low connectivity of thesegenes, they do not co-express with many other genes. This suggests that they may havedistinct functional properties within the cell and that their own transcription levels are notregulated collectively with several others. These genes are indeed involved in very specifictasks in processes which are very influential of the cell fate. Many of them are regulatorsof programmed cell death, or apoptosis, regulators of proliferation, cancer cell motility andinvasiveness [159].
This disease analysis also aimed to examine the presence of informative content in the net-work as well as gene modules consisting of genes with significant relation to the disease.The resulting CSD networks differentiated well between the transcriptional interaction pat-terns in thyroid gland tissue between persons with thyroid cancer and healthy persons. Theinferred significant change among genetic associations between the conditions produced sev-eral disease-associations, in which both sicknesses of the immune system and cancer werepresent (Table 4.3). These sicknesses could be traced to network regions dominated by dif-ferentiated or specific changes in gene associations. Hence, by contrasting the differences inco-expression, previously uncharacterized information about disease-specific transcriptomicpatterns thus became apparent.
The 22 disease-associated DEGs have profound importance for the thyroid cell vitality,see the list in A.1. They roughly cluster into two groups. One major group are cell cycleregulators involvement in programmed cell death, differentiation, transcriptional regulation,and cancer metastasis. An interesting observation that in persons diagnosed with thyroidcancer, their BRAF-gene frequently has been found to harbour genetic alternations and thethyroid tumors of these patients have a tendency of aggressive properties.[18].
The other group consists of genes with major influence in immune system recognition,regulation and conduct of humoral immune responses. Immunosupression may result in anabnormal immune system which does not effectively recognise and trigger immune responsestargeted for cancer cell. This alteration of the immune system is complex and can bemediated by many of the enriched biological processes identified in Table 4.2. High foldenrichment of processes involved with selection and development of T-cells, regulation ofhumoral immune system processes, immunoglobulin and antigen functionality and those ofprocesses related to the ER was observed. This is in support of the documented relationbetween suppressed immune system, chronic ER stress and carcinogenesis of secretory tissue[145]. These general observations are likely to be representative of the outcomes in theanalysis of this thesis. The differential co-expression patterns for the disease-genes weresignificantly shifted when going from normal transcription patterns to that of thyroid cancer.The ability of the CSD framework to elucidate these differential co-expression categories wasa major benefit facilitating biological interpretation. Ultimately, there was strong evidencefor their collective aberrant behaviour driving the molecular pathogenesis.
116

6.1. APPLICATION TO THYROID CANCER
A similar property to immune disease-associated genes is that the cancer-associated cellsare also dominated by differential and condition-specific manners of co-expression to othergenes. Many of the disease-associated genes are characterized by high average shortest pathlengths to other genes. Some of them, e.g. FAS, ADGRV1, DIO1, ITPR1, ITGA3, MATN2,and NCOA4 have very high average shortest paths and are all found in less dense areas ofthe network making connections between neighborhoods that are far apart. These genesmay be influential in transmission of information in the cell; connecting cellular processestogether in order to orchestrate a synchronized behaviour. The reversal or sudden presenceof co-expression profiles of these genes and others is clear from their predominantly differen-tiated or specific type links. Strong changes into opposite signed correlation in transcriptionwith other genes and condition-dependency in other strong correlation in transcription issuggestive of an vastly altered regime of cell transcriptional regulation. The change in in-formation flow facilitated by these genes acting abnormally may thus start to act as sourcesof cancer manifestation in the cell. Changes in transcriptional profile relationships likethese are descriptive of dysfunctional behaviour with large deleterious consequences on themetabolic network of the thyroid cells.
A healthy thyroid gland is a highly specialized secretory tissue with very specific processesfor synthesis and regulation of thyroid hormone in the human body. Many genes are nor-mally expressed here at high levels for the proper function of the thyroid. To distinguishrelationships between DEGs with malignant characteristics, investigation of specific genesand modules for association to thyroid cancer was pursued. Biological process enrichmentanalysis was employed to search for disease-modules. This had to be a network clique withhigh enrichment for thyroid cancer-associated genes as DEGs who’s transcriptional discor-dance was related to carcinoma. The Louvain-algorithm was employed to partition thenetwork into community-like structures, and the results showed that many of these modulessegregated together with regions of common link types, i.e. regions with genes of similarcategory of association change between the studied conditions (Fig. 4.7). The modulesdominated by differentiated and specific type links were investigated further, because as-sociations between the gene-pairs in these either had opposite signs between the comparedconditions, or the associations were present in only one conditions exclusively. There isopposite correlation in these genes’ transcriptional level between thyroid cancer and nor-mal persons, as indicated by the differentiated (red) links. This reversal is likely to have atremendous impact on cells, where shift in regulation of genes involved with the ER maylead to inflammation and carcinogenic behaviour in the thyroid tissue.
The identified thyroid-cancer associated DEGs formed a basis for both investigation ofmolecular pathogenesis of thyroid cancer, and as means of qualitative assessment of net-work inference results. As explained in Chapter 5.4.4, the purpose of the differential geneco-expression networks generated with the CSD method was to describe correlations ofgenes, and not highlight the most DEGs per say. It should be expected that certain in-ferred DEGs in the CSD networks will coincide with individually identified THCA-associatedgenes. These disease genes were thus especially interesting and were looked for in commu-
117

6.1. APPLICATION TO THYROID CANCER
nities of the network as well. Several identified network modules contained thyroid-cancergenes. The largest of them, module 5 and module 34 were promising candidates as a diseasemodules.
Several modules were abnormally enriched for processes of the immune system activationand regulation, inflammation and ER stress, and programmed cell-death (Tables 4.8, 4.9,4.10, 4.11). These modules are likely manifestations of the carcinogenic phenotype andthe genetic association patterns observed among them, virtually only differentiated andspecific type links, are supportive of this observation. The genetic interactions in thesemodules are descriptive of a significant difference of transcription level correlation betweenthen that portray malignant regulation of genes or genetic alterations causing anomalies inthe transcriptional regulatory system. Especially interesting is module number 34. Herethere is an extremely high enrichment of calcium-ion sequestering, this happens when theendoplasmatic reticulum (ER) is under stress and may lead the mitochondria to induceprogrammed cell death [160]. This exact process has over a hundred fold enrichment in thismodule, and all genes involved are interacting with differentiated links. Antigens are alsoproduced and processed in the ER. In addition, pathways related to the immune response,such as antigen processing and presentation through the MCH (major histocompatibilitycomplex) protein, have abnormal high enrichment and support this observation. Moreover,protein folding catabolism and response to hypoxia are symptoms of malfunctioning ERas well. These two in combination are often activated at the same in tumor cell [161].Lastly, the NIK/NF-kappaB signaling process is involved with regulation of cell survival andinflammation. Activation of this pathway has been reported to mediate pro-inflammatorysignals in the cell and antiaptototic pathways [162]. This could hinder programmed celldeath in tumour cell and lead to tumor progression.
The CSD method proved to yield biologically meaningful and informative differential geneco-expression networks which readily identified gene pairs for which correlation in transcrip-tomic levels were significantly different between the two studied conditions. An importantaspect of this method is that it’s agenda is to investigate the differential correlation of pairsof genes, and not the differential co-expression of separate genes. An important limitationto this method is therefore that it may miss some genes that are significantly differentiallyexpressed between conditions because these do not necessarily co-express with other genesto a high enough degree to be included in the inferred network after the importance valuethreshold is applied. Biologically there are several ways a gene could have relevance to aspecific phenotype whilst lack a high transcription correlation pattern with other genes.This could result from transcriptional regulation of high specificity. Transcription factorswith high affinity for their target gene sequence will bind and regulate only their targets,which could be only one or a small set of genes. These will thus not correlate so muchwith the transcriptional levels with other genes because they are separately regulated byan independent regulatory system. Another explanation could be that a DEG could havea very specific role in the cell. Perhaps it is involved in one single biological pathway andif any genetic alteration events should take place in this gene, it would then perform ab-
118

6.2. METHOD DEVELOPMENT
normally and mediate a diseased phenotype downstream its designated pathway withoutdirectly correlating in transcription levels with many other genes. As demonstrated in sec-tion 2.1, the union of CSD network analysis of gene-pair transcriptional correlation patternswas a good foundation for the subsequent investigation of important DEGs associated withrelevant biological processes or diseased phenotypes. Employing an integrated analysis ofthe gene expression profile correlation in the thyroid tissue transcriptomic network com-bined with investigation of interesting genes together resulted in important insights into thepathogenicity of thyroid cancer.
6.2 Method development
The second main aim of this thesis was to develop potential methodological improvementsthat could be applied to the original implementation of the CSD method for differential co-expression network inference. Several aspects of the differential co-expression analysis werestudied in detail. This was a great way to gain knowledge in multiple different bioinformaticstools and computer science, as well as the requirements needed to develop and integrate newalternative improvements into an established workflow.
The differences of transcriptomic data sets resulting from different pre-processing were ex-plored. Comparisons of pre-processing effect on transcriptomic data have shown to affectboth the connectivity and the compliance of central genes in the inferred networks. Thecomparison was done on alternative procedures in filtering out low-count genes and batch ef-fect correction. As the results in this section have pointed out, differential gene co-expressionnetwork inference is a strong tool when provided data of high quality. It is not howeverrobust to skewed data and technical artifacts, which will have an effect on the inferred net-works. When provided a data set of raw count data with potentially high levels of noiseand batch effects, an inferred differential co-expression may result in some false gene asso-ciations. Given that the raw counts from RNA-seq transcriptomic quantification are verydependent of sequencing depth and gene length this might lead to technical bias in theresults.
As demonstrated, lack of pre-processing resulted in a network with systematically highernumber of edges and consequently higher average degrees and shorter distances betweennodes in the networks. Because these properties may originate from transcriptomic datawhich is offset toward the high condition-specific expression for some genes, it seems likelythat some of the inferred associations in these networks are more likely to be falsely identi-fied. The two other analyses, An. 1 and An. 2 are less likely to suffer from such distortions.The comparison of differential gene co-expression networks on the basis of different quality-control procedures were compared by their qualitative content; the overlap of hubs andability to infer thyroid cancer-associated genes as DEGs. From the first comparative studythe compliance of central network genes were highest among networks based on the strictestquality control. Anyway, zero quality control which loosened the gene co-expression exclu-
119

6.2. METHOD DEVELOPMENT
sion process produced a larger network with uniquely identified thyroid cancer-associatedgenes. Comparisons of pre-processing effect on transcriptomic data have shown to affectboth the connectivity and the compliance of central genes in the inferred networks. Aspointed out, lack of pre-processing resulted in a network with systematic increased numberof edges and consequently higher average degrees and shorter distances between nodes inthe network based on a set of rational networks.
In addition to the already established CSD workflow based on Spearman’s rank correlationcoefficient, three additional alternative similarity measures as choices to base this methodon were developed. These were all employed to construct differential gene co-expressionnetworks with foundation in all four alternative similarity measures. An important applica-tion of the expansion of the standard CSD network with respect to similarity measures, wasthat the influence each of them had on the resulting differential gene co-expression networkscould be evaluated both with graph theoretic tools and biological interpretation.
Firstly, the weighted topological overlap was incorporated into the CSD workflow. Cre-ating a faster and more optimized software was attempted to speed up and expand somealgorithms forming the basis of differential gene co-expression analysis. Initial difficulties im-plementing multi-threading for the computation of weighted topological overlap were mostlikely due to improper scheduling and large computational overhand. Alternative measureswere used to infer networks with CSD on the basis of weighted topological overlap anyway.The network based on weighted topological had interesting structural organization. Becausea high ratio of hubs were connected to other hubs, the network had resemblance of assor-tative tendencies. Most biological networks have dissassortative behaviour, increasing theirstability and robustness [163]. Assortative network properties may be masked by structuraldissassortativity rooted in their scale-free property [1], and for many biological networksthere have been reported dichotomous degree correlation patterns [164]. A differential tran-scriptome network with these characteristics depict a robust and molecular interplay yet it’swell connected structure ensures that information flows faster and more efficiently betweendifferent regions. Another interesting structural feature was that the gene-pair associationstypes segregated into well-defined regions of the network. Homogeneous network neighbor-hoods indicated that the wTO was able to emphasize and distinguish the various types ofassociations regimes among gene pairs in the network.
The network based on weighted topological overlap had very interesting hubs. They hadsubstantially higher degrees in this network than the hubs in the standard CSD network.Here, there were 65 genes who’s degree was larger than 40 - which is three times as manythan in the standard network. Table B.1 shows that the network hubs are extremely enrichedfor important cell pathways already associated to the pathogenicity of autoimmune thyroiddisease and thyroid cancer [131, 145]. Many hubs were found in the network componentscharacterized by specific type associations to other genes, indicating the most central playersin the transcriptional network are behaving very differently in thyroid glands with cancercompared to healthy tissue.
120

6.2. METHOD DEVELOPMENT
Some thyorid cancer-associated genes had different connections in the wTO-network thanin the conventional CSD network. A good example of this is the gene S100A10. This isfound in a small network component consisting of four genes connected by specific typelinks; S100A10, ALOX5, CATSPER1 and MXRA8. These four genes encode proteins thathave various roles in immune system processes: S100A10 protein regulates phosphorylationof ANXA3 which is target for tyrosine-specific kinases, ANXA3 is directly linked to thegene ADGRV1 also identified as a thyroid cancer gene in the table. ALOX5 protein isresponsible for biosynthesis of proinflammatory leukotrienes [165], CATSPER1 protein is acalcium channel which is important for regulation of calcium storage in the endoplasmaticreticulum. MXRA8 is a pro-inflammatory protein involved in regulation of cell proliferationand the hedgehog signaling pathway, a pathway suggested to stimulate thyroid cancer cellmotility and invasive behaviour [125]. In the normal CSD network this had only one neighborwhereas in the wTO-network the same gene formed an interesting module together withothers of high relevance for the studied disease.
All together these results suggests that weighted topological overlap as similarity measureproduced a highly integrated network with very interconnected cores consisting of clusterswhere genes of similar biological functionality form associations. The network segregatedwell between types of differentiated transcriptomic behaviour. The network hubs representgenes with important roles in organization of cellular processes in the cell. The misregulationobserved in the transcriptomic shift during thyroid carcinoma are likely to be explanatoryof thyroid cancer pathogenesis.
The second major development part of this thesis was the successful development of thesoftware for mutual information-based network inference with the CSD method. A betterimplementation of parallelized programming was realized for the estimation of mutual infor-mation (MI) as an alternative to the ranked correlation coefficient. Computing differentialgene co-expression measures on the basis of MI performed well and generated networkscharacteristic of complex biological systems, although it’s structure was substantially differ-ent from the other CSD networks (Fig. 5.5). This strategy nevertheless generated rationalnetworks which provided new insights into the condition under study.
Analysis of enriched processes among the DEG associations in the MI-based CSD networkwas very interesting, these showed enrichment of yet additional pathways of the immunesystem and of translational regulation. Enrichment of translational initiation can be char-acteristic of loss of proper cell cycle regulation, indicative of abnormal correlation amongthe associated genes [159]. In addition, enrichment of nonsense-mediated decay (NMD) canalso be a symptom of loss of homeostasis and strong cellular stress levels. Enrichment ofthis pathway can be rooted in abnormally high transcriptional activity and it may leadto increase in proteins of malignant functionality. The NMD pathway is a mechanism oftranscriptional damage-control where aberrant transcripts containing non-sense mutationsare targeted and degraded, which in some cases may result in deleterious gain-of-functionproperties of the transcripts if they are translated into proteins[166]. In the ER proteins areprocessed after translation, but under strong stress it’s performance is obstructed leading
121

6.2. METHOD DEVELOPMENT
to unfolded protein response (UPR). When the ER is chronically stressed, as is typical ofautoimmune thyroid disease, NMD is inhibited by UPR [167]. This promotes pathogenesisof autoimmunity and is linked to cancer development and progression [145]. Ultimately,these transcriptome process enrichment on the basis of mutual information are novel inthe scope of this thesis, and are supportive of the proposed relation between auto-immunethyroid disease and carcinogenic behaviour [131, 136].
Differential co-expression analysis of biological data is always based on a similarity mea-sure as fundamental strategy to elucidate patterns of coinciding expression of genes acrossmultiple samples. Therefore the chosen similarity measure has an important effect on theresulting co-expression profiles generated. The results from Chapter 5 testify that the sim-ilarity measure had a large influence on the outcome of the analysis. The most importantquantitative assessment of the alternative similarity measures was done by robustness anal-ysis, results for which is presented in Figure 5.8. The synthetic low sample size simulateddifferential gene co-expression results from applying the CSD workflow based on the foursimilarity measures CSD, CSD-VAR, wTO, and MI. The overlap coefficient quantified thedegree of fidelity in gene associations inferred in sets of decreasing sample size compared tothe baseline CSD network inferred from the full data set. This plot shows several importantdifferences between the four similarity measures.
First, the plot shows that wTO performs the best in this robustness comparison. It provedto be the least dependent on sample size across link type. This supports recent observationsin [118], where the topological overlap similarly performs well in overlap tests for data setsof decreasing sample size. This effect could be rooted in the approach by which the wTOassimilates information from neighboring nodes for a gene pair into the value of this gene-pair’s association. In this way, it takes into account topological features of the nodes in theclose vicinity of a pair of correlated genes, which is less likely to be as sensitive to noise as thesimple correlation value itself would be. In the plots in Fig.5.8, the overlap coefficient datapoints for wTO are higher than those from conventional CSD and CSD-VAR. This indicatesthat wTO applied as similarity measures provides important benefits when studying geneexpression data of limited sample size. It also improves the relative fidelity performance ofdifferential gene co-expression networks inferred with the CSD framework.
Second, the figure shows that in this analysis MI is very sensitive to decreasing sample sizeand is thus most applicable to data sets of adequate size. As clearly seen by the yellowcrosses in plots of Fig. 5.8, for all types of gene association relationships, either conserved,differentiated or specific, the MI-based networks has the lowest fidelity of inferred links tothe reference network. This could be due to the fact that the variance in mutual informationbetween two random variables follows an asymptotic function dependent of the number ofrandom variables (genes). It is thus recommended to estimate the minimal number ofsamples needed for accurate estimation of the mutual information based on the numberof genes in the data set, and utilize data sets fitting these requirements for differentialco-expression network generation [168].
122

6.2. METHOD DEVELOPMENT
Another explanation of the poor sample-size robustness performance of the MI in this thesisis that in the interest of time, computation was performed with only 20 bootstrappedversions for estimation of variance of the MI. This variance was used for correction ofeach gene-pair association score, and thus could alter the inferred associations substantially.Hence, observations done on the performance of MI in this thesis are speculative and anin-depth investigation with higher number of bootstrapped MI-scores and multiple data-sets of even larger baseline sample-size is needed. Third, CSD-VAR performs better forlower sample size than conventional CSD. Here, the less stringent inference threshold couldexplain a higher probability of retaining similar inferred gene associations even in smallersets, because in general more of any association are included in the network. This couldsupport the application of both methods in the case of expression data set of small samplesize, but also in any case if limited time is available. Because the CSD-VAR skips the mosttime-consuming step of the CSD workflow, these results are promising for differential geneco-expression analysis of large amounts of data or testing purposes.
Fourth, Fig. 5.8 demonstrate that there is a pronounced difference in robustness of inferredgene correlations of the different types. Plot d) shows that especially differentiated typelinks are less overlapping in networks based on gene expression data of decreasing samplesize, whereas conserved associations are the most overlapping. This is likely to be rooted inthe difference in how these association type scores are computed.
All together, all these results report a general relation between data set sample size and theoverlap of inferred associations compared to a larger reference set. Some general observa-tions were that wTO performs well even for small data sets and the quality of MI is moredependent on sample size. Even though these were quite noticeable trends the validity ofthe comparison is limited because it is based on one single set of data from each conditionand the reference data set did not contain an exceedingly large number of samples either.
The major qualitative examination and validation strategy of CSD networks based on al-ternative similarity measures was facilitated through inspection of their respective abilityto identify thyroid cancer-associated genes. This analysis was done for all four alternativesimilarity measures and the results are summarized in Table 5.8. Implementation of theCSD method without variance-correction resulted in the largest set of thyroid-associatedgenes identified among the correlating DEGs. This could be due to the looser requirementof including associations in this network inference strategy, because it does not divide theassociation scores by the variance in correlation. Thus, all values for C-, S-, or D-scoresfor any pair of genes are higher and the resulting network was larger compared to the con-ventional CSD method. Even though this could result in a higher ratio of falsely positivecorrelations between pairs of genes identified as significant, it proved to have a very highability to include relevant genes for the studied condition. With the significantly reducedcomputation time needed for CSD-VAR compared to normal CSD, observed high level ofability to identify disease-related genes in the CSD-VAR network is promising. This trade-off suggests that analysis of a transcriptomic data set with both CSD and CSD-VAR couldbe advantageous depending on the research goal.
123

6.2. METHOD DEVELOPMENT
The weighted topological overlap as similarity measure for CSD network identified few thy-roid cancer-associated genes and all of them overlapped with THCA-associated genes iden-tified by networks based on other similarity measures. In this aspect, the wTO did notperform so well. This effect is likely be due to the aforementioned possibility that someTHCA-associated genes have limited transcriptional correlation with other genes, and arenot typically the most strongly correlated with other genes. Indeed, in networks inferred onthe basis of all alternative similarity measures have indications of THCA-associated genesin less densely connected network neighborhoods and the majority are of low degree (SeeFig. 4.6 for CSD, Fig. 5.7 for CSD-VAR, Fig. 5.3 for wTO, and Fig. 5.5 for MI). Itcould also indicate that wTO similarity measure is more likely to miss important genes oflower degree, because it accentuates genes with high-degree by weighting it’s links by thesummed number of interactions. As seen in Table 4.6, most THCA-associated genes wereof low-degree. This means that even genes of low degree can have a huge influence of thecellular system’s performance and resulting also the phenotype of the organism.
It should be noted that the MI-based CSD network performed perhaps the best in the quali-tative assessment where the ability to include THCA-associated genes among the significantgene correlations was examined. Table A.1 summarizes the four method’s ability to identifydifferentially co-expressed genes in the CSD networks and supports this observation. Basingthe CSD framework on this novel implementation of MI as similarity measure, resulted inthe largest set of identified THCA-associated genes overall. But as Table A.1 shows, notonly did it find the highest number of disease-genes, it also found the highest number ofdisease-genes not included in those from the other networks. As is given in Table 5.8, theMI resulted in the highest uniquely identified THCA-genes, it found 11 unique genes re-lated to thyroid cancer with significant relationships to transcription levels of other genes.Conversely, the CSD-VAR also identified many THCA-associated genes, but as apparentin the table there was substantial overlap between conventional CSD and CSD-VAR. TheMI-network identified over twice as many unique THCA-genes, some of which were notincluded in any network based on other similarity measures. These are listed in A.3 andare involved with regulation of gene expression, homeostasis and inflammation, antioxidantproteins, and tumor cell proliferation and migration. Many of the disease-associated geneswere associating with other genes in the transcriptional network in differentiated or spe-cific manner, indicating that the expression levels of these genes were significantly alteredbetween the studied conditions. This indicates that the MI as similarity measure does cap-ture different forms of associations than the correlation-based methods and expanded themolecular insight into thyroid carcinoma. Conclusively, the results from the qualitative as-sessment of the similarity measures’ effects on the inferred networks demonstrated that bothmutual information and the simplified version of CSD did indeed identify unique thyroidcancer-associated genes among significant associations of DEGs. These were not previouslyincluded in the networks generated based on the standard CSD method and provided newimportant insight into the transcriptional traits of pathogenesis of thyroid cancer.
Although the results of this section may seem persuasive, there are some limitations to the
124

6.2. METHOD DEVELOPMENT
research strategy. Obviously, all conclusions drawn on the quality of the similarity mea-sures are restricted to their performance for the data set investigated in this particularthesis. They were only applied to one empirical data set of TGCA data for thyroid cancerand GTEx data for normal tissue. Investigation of performance of various similarity simi-larity measures should be done on multiple sets from multiple studied condition in order todraw valid evaluations. The similarity measures have been compared among each other byboth qualitative and quantitative means. The similarity measure investigation was thus anattempted comparison on the basis of this single data set and condition under study.
A potential confounding factor in the disease analysis of this thesis became apparent throughthe analysis of enriched processes associated to the CSD networks. The data set from theThe Cancer Genome Atlas contained transcriptomic files measured in thyroid tissue ofpatients diagnosed with various kinds of thyroid carcinoma. The complete collection ofavailable gene expression data was downloaded from there in order to obtain the largestsample size as possible. As explained in section 3.1.1, this data set consisted of predomi-nantly transcriptomic data from thyroid adenocarcinoma, but there were also several filesfrom patients diagnosed with other types of thyroid cancer. This could be the origin ofsome observed indications of conflicting observations among results from biological processenrichment analysis. In some cases, such as in section 5.2.1, there were indications of im-peded immune system functionality, which was related to published literature linking thisto invasive properties of some thyroid cancer sub-types. At the same time, there were alsoindications of immune system activation in other biological process enrichment results. Thiswas indicative of an immune system perhaps properly recognising and in combat with thetumor cells in the thyroid tissue. Papillary thyroid carcinoma is an innocuous thyroid can-cer type, for which these characteristics reflect tumor-induced immune system activation.In addition, certain important differentially co-expressed genes have documented influenceon which characteristics the thyroid cancer develops, such as STAT3, FN1 and AMOT. Asexample, STAT3, is linked to many cancer types and it’s expression levels are predictive oftumor aggressiveness or quiescent nature [139]. These DCGs pinpoint promising areas ofthe CSD network to look for novel prognostic markers, but their respective co-expressioncorrelations to other genes may be subject to ambiguous underlying transcriptomic signals.The mixed nature of pathogenicity of these tumours affected the outcomes in the analysesof biological process enrichment, and is also likely to perplex other aspects of the differentialgene co-expression analysis more difficult to detect. Thus, it should be noted that rathercomposing a thyroid cancer transcription data set of one single sub-type of thyroid carci-noma, would improve the reliability and validity of the observed transcriptional changes inthe system. A more homogeneous profile of pathogenic perturbation would be more ben-eficial because it could be more accurately quantified by gene co-expression analysis andinvestigated. This wold improve the legitimacy of biological interpretations based on thepatterns in the CSD network, as well as any potential new important insights or clinicalapplications.
A second major limitation to this study is the lack of independence between the two main
125

6.2. METHOD DEVELOPMENT
agendas of this thesis. The first section assumes that there is a significant amount oftrue differentially expressed genes between thyroid cancer and normal thyroid tissue. Theelaborations and examinations in the second part is then necessarily based on this sameassumption. If this should prove to be an invalid assumption, all the demonstrations in thesecond part of the thesis will lose ground. The comparisons of alternative similarity measuresrequires the assumed significant difference between the transcriptomic data. If this was thecase, this empirical data set is not fitted for neither differential gene co-expression analysis orfor comparison of similarity measure performance. It should be noted that there are severalobservation of those elaborated in the Results section of this thesis that affirm the assumeddifferential expression between thyroid cancer and normal thyroid tissue. Conclusively, thisis in support of the demonstrated differences among the similarity measures investigated inthis thesis.
126

Chapter 7
Conclusion & Outlook
Two sets of gene expression measurement data from thyroid cancer patients and normal con-trols were compared by differential gene co-expression analysis with the CSD framework.The goal of this part was to perform an in-depth investigation of differentially co-expressedgenes between thyroid cancer and normal tissue of the thyroid. The CSD framework suc-cessfully produced biologically meaningful representations of comparative gene correlationsbetween the two conditions. Several of the hubs that co-expressed with other genes predomi-nantly in differentiated manner between normal and cancer tissue, had interesting molecularroles and were found between denser network regions, mediating information flow from var-ious corners of the network. The largest hub, MICAL3, and the hub AMOT, are bothinvolved with regulation of cell division, EVC regulates cell differentiation, the long non-coding RNA molecule encoded by FAM111A-DT is likely to regulate the expression level ofseveral genes. The fact that these had reversed associations with their neighbor genes fromone condition to the other and the documented essential role they play in central pathwaysof the cell suggested that these hubs could potentially be novel candidates as prognosticmarkers of thyroid carcinoma.
Investigations of heterogeneous nodes in respect to association type distribution identi-fied genes marking regions where many genes stopped correlating with normal patterns(conserved links) and started correlating in reversed or condition-specific manner. Inves-tigation of link-type heterogeneous nodes such as CALR, pin-pointed sites of abnormalgene co-expression in genes taking part in cellular processes descriptive of a malfunctioningsystem. GO enrichment analysis reported significant enriched of biological processes thathave previously been documented to be anomalously regulated in thyroid carcinoma. Thisdemonstrated that link distribution of nodes could be employed to identify genes with highrelevance to the disease under study. The work presented in this section will hopefully con-tribute to novel knowledge and point towards novel directions for relevant biological studiesof predispositions for thyroid carcinoma.
In the second major part of this thesis the foundation for the CSD framework was inves-tigated, both effects of passing expression data through different pre-processing work-flows
127

and basing the framework of various similarity measures. The goal was to expand the foun-dation for the established framework for differential gene co-expression analysis, the similar-ity measure, and look into what influence this had on the aspects of differential co-expressionnetwork quality and potential biological merits gained by any alternative similarity measure.
Because differential gene co-expression analysis requires that RNA-quantification from dif-ferent experimental should be compared directly, it is recommended to perform sample biasand batch effects correction. Network construction of multiple versions of the same dataset with various degrees of filtering and normalization procedures applied, resulted in net-works of relatively different character. Comparison of network parameters and content,such as similarity in genes identified as network hubs and overlap of inferred significant geneassociations (links), was quantified among the three differently pre-processed sets. Thisconfirmed that pre-processing has pronounced effects on the outcome in the differentialgene co-expression network. The inferred CSD networks showed that proper pre-processing,including correction for gene lengths and differences in RNA-seq library composition, asbasis for differential gene co-expression analysis with the CSD network will yield resultswith high-quality suitable for comparative studies. Fortunately, applying these additionalpre-processing steps were relatively straightforward, supporting the use of recommendedpipelines to address the computational challenges associated with RNA-seq transcriptomicdata.
The established CSD method for differential gene co-expression analysis was expanded topotentially elucidate a wider range of genetic associations, beyond those captured by theSpearman correlation coefficient. These alternatives were realized either by applying alreadyexisting tools for calculation of similarity measures and adapting them into the tool chain, orby writing scripts for quick computation of novel measures to expand the possible strategiesfurther.
The implementation of the weighted topological overlap (wTO) was motivated by the factthat this similarity measure was developed to produce high-quality similarity measurementsbetween genes, especially applicable for differential gene co-expression analysis. The CSDnetworks constructed which were based on wTO accentuated relevant genetic correlationsby incorporating properties of each gene-pair’s connections to their respective neighbors.Adding this topological information as an improvement to the standard correlation to infergene associations, generated networks which organized the transcriptomic system hierarchi-cally into biological meaningful modular structures. These brought interesting new aspectsto the outcomes of the biological process enrichment analysis of the disease under study.Comparisons of fidelity of the wTO-based networks inferred with the CSD method showedthat it was the most resilient to simulated low sample-size. Compared to mutual informa-tion (MI), Spearman’s rank correlation, and the latter without internal variance correction,wTO performed best in respect to inferring similar gene correlations as the reference set.Because it systematically improved the CSD networks robustness performance, applyingthis transformation of weighted topological overlap measure from the Spearman correlationmeasures could potentially enhance the quality of these differential co-expression networks
128

further especially when few experimental measurements from either conditions are available.
As alternative to linear detection methods for inferring genetic correlations, the mutualinformation (MI) has recently been used to measure similarity in gene co-expression pat-terns in the pursue of detecting other association patterns than merely those measured bycorrelation. The MI quantifies the degree of statistical dependence between genes expres-sion vectors based on entropy. In the work of this thesis, an algorithm implementationof this alternative non-linear similarity measure into the established CSD framework wasincorporated in a stream-lined way. Implementing it in parallelized manner allowed esti-mation of MI for gene expression data of large sizes with relatively low execution time.This new workflow facilitated unraveling of novel important components of the complextranscriptomic machinery regulating cellular behaviour.
Assuming that disease-associated genes would coincide as significantly co-expressed withother genes in thyroid tissue as a result of deliberate regulatory mechanisms or physical geneinteractions, CSD networks generated on the alternative similarity measures were comparedby their relative ability to identify disease-associated genes as significantly co-expressedwith other genes. The respective ratios of thyroid cancer-associated genes (THCA-genes)present in CSD networks were identified by Gene Ontology analysis and served as a meansof qualitative evaluation, in lack of a validated reference differential co-expression networkcharacterizing the transcriptome of thyroid cancer. Employing MI resulted in uniquelyidentified THCA-associated genes as significantly co-expressed in the CSD network. Thisenhanced ability of the MI is likely to be rooted in the theoretical foundation for inferringsignificant relationships with MI, which is based on a completely separate estimation methodthan the correlation-based ones. On the other hand, CSD networks based on this more far-reaching similarity measure were more dependent of sample size. Based on the results ofthis thesis, the applicability of MI as similarity measure required that the gene expressiondata has an adequate number of samples and that the MI-based implementation of the CSDframework should be run with more than 20 bootstrap samples of the gene expression data.
Several suggestions to future work apply for the first aim of this thesis, the disease investi-gation part. Investigations performed on the CSD network on node homogeneity resulted inidentification of several interesting heterogeneous genes, in respect to their link type distribu-tions. These marked the transitions from normal to diseased patterns in the transcriptomicnetwork and are promising candidates of disease genes. Experimental investigations of thebiological functions and effect of erroneous regulation in these heterogeneous genes couldpotentially reveal strong relevance to the disease under study. The same applies to modularstructures and hub genes in these networks. Especially network hubs that were dominatedby specific links or differentiated links were extremely enriched for cellular processes descrip-tive of malignant regulatory behaviour. The hubs’ expression levels significantly correlatedwith numerous other genes, suggesting an aberrant regulatory role in the cells which wouldbe very interesting to investigate further.
As for the method development part, application of the weighted topological overlap mea-
129

sure improved the fidelity of the CSD networks and provide a useful improvement, especiallywhen studying gene expression data sets of limited sample size. The developed software forapplication of the non-linear similarity measure mutual information utilized of a differ-ent strategy of inferring interesting co-expression relationships, allowing a wider range ofknowledge to be extracted from the CSD network. It thus provides a method for expandedinvestigation of cellular mechanisms underlying specific phenotypes and diseases. Because itproved to be sensitive to sample size, it’s applicability is dependent on estimating a requiredminimal sample size given the number of genes and basing the differential co-expression net-works on data sets of adequate size.
Further research is needed in order to fully characterize the complex interplay of eventsdriving carcinogenic development of thyroid cells into cancer cells. Analysis of the transcrip-tional associations which correlated in condition-specific and differentiated manner betweenthe normal and cancer tissue could be a next step towards deciphering which componentsare mediating the abnormal regulatory profiles altering the cellular behaviour. Biologicalvalidations of the inferred associations present in the CSD network and the nature of thecorrelation types would be interesting to study as well. Some of the detected modular struc-tures in the network comprised defined neighborhoods with integrated genetic expressionassociations that are likely to represent disease modules. It would be interesting to studythese further with both systems biology approaches and experimental validations to exam-ine how the expression associations of these genes manifest regulatory mechanisms in thecell leading to disease pathogenicity. This knowledge could elucidate how these associationscould potentially be restored back to their normal states, so that the complex interplay ofgene associations could be made more resilient to aberrant behaviour of certain componentsand resolve disease-associated genetic interplay ultimately curing the disease.
130

Bibliography
[1] A.-L. Barabási and M. Pósfai, Network science (Cambridge University Press, Cam-bridge, 2016), ISBN 9781107076266 1107076269.
[2] E. Voit, A First Course in Systems Biology (Garland Science, 2017), ISBN9780815345688.
[3] A. Voigt, K. Nowick, and E. Almaas, PLOS Computational Biology 13, e1005739(2017), ISSN 1553-7358.
[4] V. Blondel, J.-L. Guillaume, R. Lambiotte, and E. Lefebvre, Journal of StatisticalMechanics: Theory and Experiment 2008 (2008), ISSN 1742-5468, copyright 2008Elsevier B.V., All rights reserved.
[5] K. G. Becker, K. C. Barnes, T. J. Bright, and S. A. Wang, Nature genetics 36, 431(2004), ISSN 1061-4036.
[6] C. Adami, BioEssays 24, 1085 (2002), ISSN 1521-1878.
[7] A. Trewavas, The Plant cell 18, 2420 (2006), ISSN 1040-4651.
[8] H. V. Westerhoff and B. O. Palsson, Nature Biotechnology 22, 1249 (2004).
[9] A. M. Arias and P. Hayward, Nature Reviews Genetics 7, 34 (2006), ISSN 1471-0064.
[10] . G. P. Consortium, A. Auton, L. D. Brooks, R. M. Durbin, E. P. Garrison, H. M.Kang, J. O. Korbel, J. L. Marchini, S. McCarthy, G. A. McVean, et al., Nature 526,68 (2015), ISSN 1476-4687.
[11] S. van Dam, U. Võsa, A. van der Graaf, L. Franke, and J. P. de Magalhães, Briefingsin bioinformatics 19, 575 (2018), ISSN 1477-4054.
[12] K. Lage, N. T. Hansen, E. O. Karlberg, A. C. Eklund, F. S. Roque, P. K. Donahoe,Z. Szallasi, T. S. Jensen, and S. Brunak, Proceedings of the National Academy ofSciences of the United States of America 105, 20870 (2008), ISSN 1091-6490.
[13] L. Hood, J. R. Heath, M. E. Phelps, and B. Lin, Science 306, 640 (2004), ISSN0036-8075, 1095-9203.
[14] N. Howlader, http://seer.cancer.gov/csr/1975_2008/ (2011).
131

BIBLIOGRAPHY
[15] J. J. Wiltshire, T. M. Drake, L. Uttley, and S. P. Balasubramanian, Thyroid 26, 1541(2016), pMID: 27571228.
[16] M. Xing, Nature reviews. Cancer 13, 184 (2013), ISSN 1474-1768.
[17] Z. W. Baloch, V. A. LiVolsi, S. L. Asa, J. Rosai, M. J. Merino, G. Randolph, P. Vielh,R. M. DeMay, M. K. Sidawy, and W. J. Frable, Diagnostic cytopathology 36, 425(2008).
[18] V. A. LiVolsi, Modern pathology : an official journal of the United States and Cana-dian Academy of Pathology, Inc 24 Suppl 2, S1 (2011), ISSN 1530-0285.
[19] R. E. Gardner, R. M. Tuttle, K. D. Burman, S. Haddady, C. Truman, Y. H. Sparling,L. Wartofsky, R. B. Sessions, and M. D. Ringel, Archives of Otolaryngology–Head &Neck Surgery 126, 309 (2000).
[20] H. J. Kim, J.-Y. Sung, Y. L. Oh, J. H. Kim, Y.-I. Son, Y.-K. Min, S. W. Kim, andJ. H. Chung, Head & neck 36, 1695 (2014), ISSN 1097-0347.
[21] A. T. A. A. G. T. on Thyroid Nodules, D. T. Cancer, D. S. Cooper, G. M. Doherty,B. R. Haugen, B. R. Hauger, R. T. Kloos, S. L. Lee, S. J. Mandel, E. L. Mazzaferri,et al., Thyroid : official journal of the American Thyroid Association 19, 1167 (2009),ISSN 1557-9077.
[22] M. E. Cabanillas, D. G. McFadden, and C. Durante, Lancet (London, England) 388,2783 (2016), ISSN 1474-547X.
[23] E. Albi, S. Cataldi, A. Lazzarini, M. Codini, T. Beccari, F. S. Ambesi-Impiombato,and F. Curcio, International journal of molecular sciences 18 (2017), ISSN 1422-0067.
[24] L. Manzella, S. Stella, M. Pennisi, E. Tirrò, M. Massimino, C. Romano, A. Puma,M. Tavarelli, and P. Vigneri, International journal of molecular sciences 18, 1325(2017).
[25] D. Grimm, International journal of molecular sciences 18 (2017), ISSN 1422-0067.
[26] R.-H. Song, Q. Wang, Q.-M. Yao, X.-Q. Shao, L. Li, W. Wang, X.-F. An, Q. Li, andJ.-A. Zhang, International journal of molecular sciences 17 (2016), ISSN 1422-0067.
[27] M. Eszlinger, K. Krohn, and R. Paschke, The Journal of Clinical Endocrinology &Metabolism 86, 4834 (2001).
[28] Y. Huang, M. Prasad, W. J. Lemon, H. Hampel, F. A. Wright, K. Kornacker,V. LiVolsi, W. Frankel, R. T. Kloos, C. Eng, et al., Proceedings of the NationalAcademy of Sciences 98, 15044 (2001).
[29] F. H. CRICK, Symposia of the Society for Experimental Biology 12, 138 (1958), ISSN0081-1386.
132

BIBLIOGRAPHY
[30] F. JACOB and J. MONOD, Journal of molecular biology 3, 318 (1961), ISSN 0022-2836.
[31] S. M. Yoo, J. H. Choi, S. Y. Lee, and N. C. Yoo, Journal of microbiology and biotech-nology 19, 635 (2009), ISSN 1017-7825.
[32] T. I. Lee and R. A. Young, Cell 152, 1237 (2013), ISSN 1097-4172.
[33] J. C. Marioni, C. E. Mason, S. M. Mane, M. Stephens, and Y. Gilad, Genome research18, 1509 (2008), ISSN 1088-9051.
[34] K. R. Kukurba and S. B. Montgomery, Cold Spring Harbor protocols 2015, 951(2015), ISSN 1559-6095.
[35] G. K. Marinov, Briefings in functional genomics 16, 326 (2017), ISSN 2041-2657.
[36] A. Mortazavi, B. A. Williams, K. McCue, L. Schaeffer, and B. Wold, Nature methods5, 621 (2008), ISSN 1548-7105.
[37] M. A. Garcia-Blanco, A. P. Baraniak, and E. L. Lasda, Nature biotechnology 22, 535(2004), ISSN 1087-0156.
[38] G. Jin, J. Sun, S. D. Isaacs, K. E. Wiley, S.-T. Kim, L. W. Chu, Z. Zhang, H. Zhao,S. L. Zheng, W. B. Isaacs, et al., Carcinogenesis 32, 1655 (2011), ISSN 1460-2180.
[39] W. Ge, X. Ma, X. Li, Y. Wang, C. Li, H. Meng, X. Liu, Z. Yu, S. You, and L. Qiu,Leukemia research 33, 948 (2009), ISSN 1873-5835.
[40] R. S. Sekhon, R. Briskine, C. N. Hirsch, C. L. Myers, N. M. Springer, C. R. Buell,N. de Leon, and S. M. Kaeppler, PloS one 8, e61005 (2013), ISSN 1932-6203.
[41] H. Richard, M. H. Schulz, M. Sultan, A. Nürnberger, S. Schrinner, D. Balzereit,E. Dagand, A. Rasche, H. Lehrach, M. Vingron, et al., Nucleic acids research 38,e112 (2010), ISSN 1362-4962.
[42] S. Ballouz, W. Verleyen, and J. Gillis, Bioinformatics (Oxford, England) 31, 2123(2015), ISSN 1367-4811.
[43] A. Conesa, P. Madrigal, S. Tarazona, D. Gomez-Cabrero, A. Cervera, A. McPherson,M. W. Szcześniak, D. J. Gaffney, L. L. Elo, X. Zhang, et al., Genome biology 17, 13(2016), ISSN 1474-760X.
[44] S. W. Wingett and S. Andrews, F1000Research 7, 1338 (2018), ISSN 2046-1402.
[45] A. Dobin, C. A. Davis, F. Schlesinger, J. Drenkow, C. Zaleski, S. Jha, P. Batut,M. Chaisson, and T. R. Gingeras, Bioinformatics (Oxford, England) 29, 15 (2013),ISSN 1367-4811.
[46] S. Anders, P. T. Pyl, and W. Huber, Bioinformatics (Oxford, England) 31, 166 (2015),ISSN 1367-4811.
133

BIBLIOGRAPHY
[47] M.-A. Dillies, A. Rau, J. Aubert, C. Hennequet-Antier, M. Jeanmougin, N. Servant,C. Keime, G. Marot, D. Castel, J. Estelle, et al., Briefings in bioinformatics 14, 671(2013), ISSN 1477-4054.
[48] P. P. Labaj, G. G. Leparc, B. E. Linggi, L. M. Markillie, H. S. Wiley, and D. P. Kreil,Bioinformatics 27, i383 (2011).
[49] S. Sun, M. Hood, L. Scott, Q. Peng, S. Mukherjee, J. Tung, and X. Zhou, Nucleicacids research 45, e106 (2017), ISSN 1362-4962.
[50] M. D. Robinson and A. Oshlack, Genome Biology 11, R25 (2010), ISSN 1474-760X.
[51] A. Rau and C. Maugis-Rabusseau, Briefings in Bioinformatics 19, 425 (2017), ISSN1477-4054.
[52] O. Wolkenhauer, C. Auffray, O. Brass, J. Clairambault, A. Deutsch, D. Drasdo, F. Ger-vasio, L. Preziosi, P. Maini, A. Marciniak-Czochra, et al., Genome medicine 6, 21(2014), ISSN 1756-994X.
[53] G. A. Pavlopoulos, M. Secrier, C. N. Moschopoulos, T. G. Soldatos, S. Kossida,J. Aerts, R. Schneider, and P. G. Bagos, BioData mining 4, 10 (2011), ISSN 1756-0381.
[54] L. C. Freeman, Journal of Sociometry 40, 35 (1977).
[55] M. J. Newman, Social Networks 27, 39 (2005), ISSN 0378-8733.
[56] D. Iacobucci, R. McBride, and D. L. Popovich, Journal of Social Structure 18 (2017),ISSN 1529-1227.
[57] J. Golbeck, in Analyzing the Social Web, edited by J. Golbeck (Morgan Kaufmann,Boston, 2013), pp. 25 – 44, ISBN 978-0-12-405531-5.
[58] W. D. Schank, T, Journal of Graph Algorithms and Application 9, 265 (2005).
[59] D. J. Watts and S. H. Strogatz, Nature 393, 440 (1998), ISSN 1476-4687.
[60] M. E. J. Newman, D. J. Watts, and S. H. Strogatz, Proceedings of the NationalAcademy of Sciences of the United States of America 99 Suppl 1, 2566 (2002), ISSN0027-8424.
[61] C. O. Daub, R. Steuer, J. Selbig, and S. Kloska, BMC bioinformatics 5, 118 (2004),ISSN 1471-2105.
[62] I. Priness, O. Maimon, and I. Ben-Gal, BMC bioinformatics 8, 111 (2007), ISSN1471-2105.
[63] P. D’haeseleer, S. Liang, and R. Somogyi, Bioinformatics (Oxford, England) 16, 707(2000), ISSN 1367-4803.
134

BIBLIOGRAPHY
[64] A. A. Goshtasby, Similarity and Dissimilarity Measures (Springer London, Lon-don, 2012), pp. 7–66, ISBN 978-1-4471-2458-0, URL https://doi.org/10.1007/
978-1-4471-2458-0_2.
[65] L. Song, P. Langfelder, and S. Horvath, BMC Bioinformatics 13, 328 (2012), ISSN1471-2105.
[66] R. O. Ness, K. Sachs, and O. Vitek, Journal of Proteome Research 15, 683 (2016),pMID: 26731284.
[67] F. Markowetz and R. Spang, BMC Bioinformatics 8, S5 (2007), ISSN 1471-2105.
[68] M. Ashburner, C. A. Ball, J. A. Blake, D. Botstein, H. Butler, J. M. Cherry, A. P.Davis, K. Dolinski, S. S. Dwight, J. T. Eppig, et al., Nature genetics 25, 25 (2000),ISSN 1061-4036.
[69] C. Spearman, The American journal of psychology 100, 441 (1987), ISSN 0002-9556.
[70] R. W. Conners and C. A. Harlow, IEEE transactions on pattern analysis and machineintelligence 2, 204 (1980), ISSN 0162-8828.
[71] A. J. Butte and I. S. Kohane, Pacific Symposium on Biocomputing. Pacific Symposiumon Biocomputing pp. 418–429 (2000), ISSN 2335-6928.
[72] C. O. Daub, J. Kurths, J. Selbig, J. Weise, and R. Steuer, Bioinformatics 18, S231(2002), ISSN 1367-4803.
[73] W. Li, Journal of Statistical Physics 60, 823 (1990), ISSN 1572-9613.
[74] Y.-I. Moon, B. Rajagopalan, and U. Lall, Phys. Rev. E 52, 2318 (1995).
[75] A. Kraskov, H. Stögbauer, and P. Grassberger, Phys. Rev. E 69, 066138 (2004).
[76] G. S. Michaels, D. B. Carr, M. Askenazi, S. Fuhrman, X. Wen, and R. Somogyi,Pacific Symposium on Biocomputing. Pacific Symposium on Biocomputing pp. 42–53(1998), ISSN 2335-6928.
[77] R. Steuer, J. Kurths, C. O. Daub, J. Weise, and J. Selbig, Bioinformatics (Oxford,England) 18 Suppl 2, S231 (2002), ISSN 1367-4803.
[78] E. Ravasz, A. L. Somera, D. A. Mongru, Z. N. Oltvai, and A.-L. Barabási, Science297, 1551 (2002), ISSN 0036-8075.
[79] G. S. Davidson, B. Wylie, and K. Boyack (2001), pp. 23–30.
[80] S. L. Carter, C. M. Brechbühler, M. Griffin, and A. T. Bond, Bioinformatics (Oxford,England) 20, 2242 (2004), ISSN 1367-4803.
[81] S. Horvath, Weighted Network Analysis: Applications in Genomics and Systems Biol-ogy, SpringerLink : Bücher (Springer New York, 2011), ISBN 9781441988195.
135

BIBLIOGRAPHY
[82] M. K. Vijaymeena and K. Kavitha, Machine Learning and Applications: An interna-tional Journal (MLAIJ) 3, 4 (2016).
[83] L. D. Thomas, D. Vyshenska, N. Shulzhenko, A. Yambartsev, and A. Morgun,F1000Research 5, 2740 (2016), ISSN 2046-1402.
[84] E. K. S. Joseph Loscalzo, Albert-László Barabási, Network Medicine: Complex Sys-tems in Human Disease and Therapeutics (Harvard University Press, Cambridge,2017).
[85] A. Oshlack, M. D. Robinson, and M. D. Young, Genome biology 11, 220 (2010), ISSN1474-760X.
[86] E. A. R. Serin, H. Nijveen, H. W. M. Hilhorst, and W. Ligterink, Frontiers in plantscience 7, 444 (2016), ISSN 1664-462X.
[87] A.-L. Barabási and Z. N. Oltvai, Nature Reviews Genetics 5, 101 (2004), ISSN 1471-0064.
[88] A.-L. Barabási, N. Gulbahce, and J. Loscalzo, Nature reviews. Genetics 12, 56 (2011),ISSN 1471-0064.
[89] A. A. Hagberg, D. A. Schult, and P. J. Swart, in Proceedings of the 7th Python inScience Conference, edited by G. Varoquaux, T. Vaught, and J. Millman (Pasadena,CA USA, 2008), pp. 11 – 15.
[90] Y. Yang, L. Han, Y. Yuan, J. Li, N. Hei, and H. Liang, Nature communications 5,3231 (2014).
[91] C. S. Greene, A. Krishnan, A. K. Wong, E. Ricciotti, R. A. Zelaya, D. S. Himmelstein,R. Zhang, B. M. Hartmann, E. Zaslavsky, S. C. Sealfon, et al., Nature Genetics 47,569 (2015).
[92] A. Sharma, J. Menche, C. C. Huang, T. Ort, X. Zhou, M. Kitsak, N. Sahni,D. Thibault, L. Voung, F. Guo, et al., Human molecular genetics 24, 3005 (2015),ISSN 1460-2083.
[93] K.-I. Goh, M. E. Cusick, D. Valle, B. Childs, M. Vidal, and A.-L. Barabási, Proceed-ings of the National Academy of Sciences of the United States of America 104, 8685(2007), ISSN 0027-8424.
[94] S. Ferrari, E. Di Iorio, V. Barbaro, D. Ponzin, F. S. Sorrentino, and F. Parmeggiani,Current genomics 12, 238 (2011), ISSN 1875-5488.
[95] Z. Tu, C. Argmann, K. K. Wong, L. J. Mitnaul, S. Edwards, I. C. Sach, J. Zhu, andE. E. Schadt, Genome research 19, 1057 (2009), ISSN 1088-9051.
[96] Hypothesis Testing (Springer New York, New York, NY, 2008), pp. 250–252, ISBN978-0-387-32833-1.
136
BIBLIOGRAPHY
[97] S.-Y. Chen, Z. Feng, and X. Yi, Journal of thoracic disease 9, 1725 (2017), ISSN2072-1439.
[98] Y. Benjamini and Y. Hochberg (1995), pp. 289–300.
[99] J. Simes, Biometrika 73, 751 (1986).
[100] J. Lonsdale, J. Thomas, M. Salvatore, R. Phillips, E. Lo, S. Shad, R. Hasz, G. Walters,F. Garcia, N. Young, et al., Nature Genetics 45, 580 (2013), ISSN 1546-1718.
[101] D. S. DeLuca, J. Z. Levin, A. Sivachenko, T. Fennell, M.-D. Nazaire, C. Williams,M. Reich, W. Winckler, and G. Getz, Bioinformatics (Oxford, England) 28, 1530(2012), ISSN 1367-4811.
[102] B. Li and C. N. Dewey, BMC Bioinformatics 12, 323 (2011), ISSN 1471-2105.
[103] C. G. A. R. Network, J. N. Weinstein, E. A. Collisson, G. B. Mills, K. R. M. Shaw,B. A. Ozenberger, K. Ellrott, I. Shmulevich, C. Sander, and J. M. Stuart, Naturegenetics 45, 1113 (2013), ISSN 1546-1718.
[104] J. Harrow, A. Frankish, J. M. Gonzalez, E. Tapanari, M. Diekhans, F. Kokocinski,B. L. Aken, D. Barrell, A. Zadissa, S. Searle, et al., Genome research 22, 1760 (2012),ISSN 1549-5469.
[105] Y. Chen, A. Lun, and G. Smyth, F1000Research 5 (2016).
[106] y. . . p. . G. j. . G. h. . https://github.com/andre-voigt/CSD. c. . c. André Voigt,title = CSD.
[107] P. Shannon, A. Markiel, O. Ozier, N. S. Baliga, J. T. Wang, D. Ramage, N. Amin,B. Schwikowski, and T. Ideker, Genome research 13, 2498 (2003), ISSN 1088-9051.
[108] M. Krzywinski and N. Altman, Points of significance: visualizing samples with boxplots (2014).
[109] D. W. Huang, B. T. Sherman, and R. A. Lempicki, Nucleic acids research 37, 1 (2009),ISSN 1362-4962.
[110] P. D. Thomas, M. J. Campbell, A. Kejariwal, H. Mi, B. Karlak, R. Daverman,K. Diemer, A. Muruganujan, and A. Narechania, Genome research 13, 2129 (2003),ISSN 1088-9051.
[111] J. Pontius, L. Wagner, and G. Schuler, Technical Report, National Center for Biotech-nology Information (2004).
[112] GTExThe GTEx Portal, Documentation (2014), data retrieved from GTEx Documen-tation Single-Tissue eQTL Analysis.
[113] GeneALaCartGeneCards Bacth Queries, Genecards batch queries (2019), data re-trieved from GeneALaCart.
137

BIBLIOGRAPHY
[114] Y. Assenov, F. Ramírez, S.-E. Schelhorn, T. Lengauer, and M. Albrecht, Bioinformat-ics (Oxford, England) 24, 282 (2008), ISSN 1367-4811.
[115] V. Kumar, A. Grama, A. Gupta, and G. Karypis, Introduction to parallel computing.Design and analysis of algorithms, vol. 2 (1994).
[116] D. M. Gysi, A. Voigt, T. d. M. Fragoso, E. Almaas, and K. Nowick, BMC Bioinfor-matics 19, 392 (2018), ISSN 1471-2105.
[117] B. Zhang and S. Horvath, Statistical applications in genetics and molecular biology4, Article17 (2005), ISSN 1544-6115.
[118] A. Voigt and E. Almaas, BMC Bioinformatics 20, 58 (2019), ISSN 1471-2105.
[119] A. Voigt, Ph.D. thesis, Norwegian University of Science and Technology, Faculty ofNatural Sciences, Department of Biotechnology and Food Science (2018), iSBN 978-82-326-3422-4, Doctoral Thesis at NTNU, 2018:316.
[120] C. E. Shannon, Bell system technical journal 27, 379 (1948).
[121] L. Paninski, Neural Computation 15, 1191 (2003).
[122] J. Ish-Horowicz and J. Reid, bioRxiv (2017).
[123] G. Sales and C. Romualdi, parmigene: Parallel Mutual Information estimation forGene Network reconstruction. (2012), r package version 1.0.2.
[124] S. Wuchty, Z. N. Oltvai, and A.-L. Barabási, Nature Genetics 35, 176 (2003), ISSN1546-1718.
[125] A. J. Williamson, M. E. Doscas, J. Ye, K. B. Heiden, M. Xing, Y. Li, R. A. Prinz,and X. Xu, Oncotarget 7, 10472 (2016), ISSN 1949-2553.
[126] B. Troyanovsky, T. Levchenko, G. Månsson, O. Matvijenko, and L. Holmgren, TheJournal of cell biology 152, 1247 (2001), ISSN 0021-9525.
[127] S. Unger, M. W. Górna, A. Le Béchec, S. Do Vale-Pereira, M. F. Bedeschi,S. Geiberger, G. Grigelioniene, E. Horemuzova, F. Lalatta, E. Lausch, et al., Americanjournal of human genetics 92, 990 (2013), ISSN 1537-6605.
[128] C. Lepoivre, M. Belhocine, A. Bergon, A. Griffon, M. Yammine, L. Vanhille,J. Zacarias-Cabeza, M.-A. Garibal, F. Koch, M. A. Maqbool, et al., BMC Genomics14, 914 (2013), ISSN 1471-2164.
[129] A. Fatica and I. Bozzoni, Nature Reviews Genetics 15, 7 (2014).
[130] B. D. Adams, C. Parsons, L. Walker, W. C. Zhang, and F. J. Slack, The Journal ofclinical investigation 127, 761 (2017).
[131] L. Zhang, X. Cheng, S. Xu, J. Bao, and H. Yu, Medicine 97, e11095 (2018), ISSN1536-5964.
138

BIBLIOGRAPHY
[132] A. Tanay, Genome research 16, 962 (2006), ISSN 1088-9051.
[133] I. Sela and D. B. Lukatsky, Biophysical journal 101, 160 (2011), ISSN 1542-0086.
[134] L. Klein, B. Kyewski, P. M. Allen, and K. A. Hogquist, Nature reviews. Immunology14, 377 (2014), ISSN 1474-1741.
[135] Y. Nyathi, B. M. Wilkinson, and M. R. Pool, Biochimica et Biophysica Acta (BBA) -Molecular Cell Research 1833, 2392 (2013), ISSN 0167-4889, functional and structuraldiversity of the endoplasmic reticulum.
[136] S. M. McLachlan and B. Rapoport, Endocrine reviews 35, 59 (2014), ISSN 1945-7189.
[137] Y. Caballero, E. M. López-Tomassetti, J. Favre, J. R. Santana, J. J. Cabrera, andJ. R. Hernández, Thyroid research 8, 12 (2015), ISSN 1756-6614.
[138] M. Sponziello, F. Rosignolo, M. Celano, V. Maggisano, V. Pecce, R. F. De Rose,G. E. Lombardo, C. Durante, S. Filetti, G. Damante, et al., Molecular and cellularendocrinology 431, 123 (2016), ISSN 1872-8057.
[139] N. Sosonkina, D. Starenki, and J.-I. Park, Cancers 6, 526 (2014), ISSN 2072-6694.
[140] M. Ito, S. Nakagawa, K. Mizuguchi, and T. Okumura, in Current Approaches inApplied Artificial Intelligence, edited by M. Ali, Y. S. Kwon, C.-H. Lee, J. Kim, andY. Kim (Springer International Publishing, Cham, 2015), pp. 120–130, ISBN 978-3-319-19066-2.
[141] P. M. Hogarth and G. A. Pietersz, Nature Reviews Drug Discovery 11, 311 (2012).
[142] C. Zhao, Y. Gao, N. Yu, T. Li, Y. Zhang, H. Zhang, G. Lu, Y. Gao, and X. Guo,Molecular and cellular endocrinology 477, 103 (2018), ISSN 1872-8057.
[143] S. D. Lucas, A. Karlsson-Parra, B. Nilsson, L. Grimelius, G. Åkerström, J. Rastad,and C. Juhlin, Human Pathology 27, 1329 (1996), ISSN 0046-8177.
[144] N. Tsuchida, M.-A. Ikeda, Y. Ishino, M. Grieco, and G. Vecchio, International journalof oncology 50, 2043 (2017), ISSN 1791-2423.
[145] S. Rahman, A. Archana, A. T. Jan, D. Dutta, A. Shankar, J. Kim, and R. Minakshi,Frontiers in immunology 10, 344 (2019), ISSN 1664-3224.
[146] T. Kogai and G. A. Brent, Pharmacology & therapeutics 135, 355 (2012), ISSN 1879-016X.
[147] M. J. Holechek, Nephrology nursing journal : journal of the American NephrologyNurses’ Association 30, 285 (2003), ISSN 1526-744X.
[148] K. Stamatopoulos, C. Belessi, A. Hadzidimitriou, T. Smilevska, E. Kalagiakou,K. Hatzi, N. Stavroyianni, A. Athanasiadou, A. Tsompanakou, T. Papadaki, et al.,Blood 106, 3575 (2005), ISSN 0006-4971.
139

BIBLIOGRAPHY
[149] D. B. Bloch, S. M. de la Monte, P. Guigaouri, A. Filippov, and K. D. Bloch, TheJournal of biological chemistry 271, 29198 (1996), ISSN 0021-9258.
[150] N. V. Morgan, S. Goddard, T. S. Cardno, D. McDonald, F. Rahman, D. Barge,A. Ciupek, A. Straatman-Iwanowska, S. Pasha, M. Guckian, et al., The Journal ofclinical investigation 121, 695 (2011), ISSN 1558-8238.
[151] M. Yano, Y. Koumoto, Y. Kanesaki, X. Wu, and H. Kido, Biomacromolecules 5, 1465(2004), ISSN 1525-7797.
[152] C. Dahlgren and A. Karlsson, Journal of immunological methods 232, 3 (1999), ISSN0022-1759.
[153] M. Yunta and P. A. Lazo, Oncogene 22, 1219 (2003), ISSN 0950-9232.
[154] Z. Gu, C. Lin, J. Hu, J. Xia, S. Wei, and D. Gao, Biological & pharmaceutical bulletin42, 573 (2019), ISSN 1347-5215.
[155] X. Lou, B. Kang, J. Zhang, C. Hao, X. Tian, W. Li, N. Xu, Y. Lu, and S. Liu,Biochimica et Biophysica Acta (BBA) - Molecular Basis of Disease 1842, 1423 (2014),ISSN 0925-4439.
[156] D. E. Goldgar, D. F. Easton, L. A. Cannon-Albright, and M. H. Skolnick, Journal ofthe National Cancer Institute 86, 1600 (1994), ISSN 0027-8874.
[157] Y. Ban, D. A. Greenberg, E. Concepcion, L. Skrabanek, R. Villanueva, and Y. Tomer,Proceedings of the National Academy of Sciences of the United States of America 100,15119 (2003), ISSN 0027-8424.
[158] C. Lacoste, J. Hervé, M. Bou Nader, A. Dos Santos, N. Moniaux, Y. Valogne, R. Mon-tjean, O. Dorseuil, D. Samuel, D. Cassio, et al., Cancer research 72, 5505 (2012), ISSN1538-7445.
[159] P. Kotsantis, L. M. Silva, S. Irmscher, R. M. Jones, L. Folkes, N. Gromak, and E. Pe-termann, Nature Communications 7, 13087 (2016).
[160] A. Deniaud, O. Sharaf el dein, E. Maillier, D. Poncet, G. Kroemer, C. Lemaire, andC. Brenner, Oncogene 27, 285 (2008), ISSN 1476-5594.
[161] E. R. Pereira, K. Frudd, W. Awad, and L. M. Hendershot, The Journal of biologicalchemistry 289, 3352 (2014), ISSN 1083-351X.
[162] A. Loverre, P. Ditonno, A. Crovace, L. Gesualdo, E. Ranieri, P. Pontrelli, G. Stal-lone, B. Infante, A. Schena, S. Di Paolo, et al., Journal of the American Society ofNephrology : JASN 15, 2675 (2004), ISSN 1046-6673.
[163] M. E. J. Newman, Phys. Rev. E 67, 026126 (2003), URL https://link.aps.org/
doi/10.1103/PhysRevE.67.026126.
140

BIBLIOGRAPHY
[164] D. Hao and C. Li, PLOS ONE 6, 1 (2011), URL https://doi.org/10.1371/
journal.pone.0028322.
[165] N. C. Gilbert, S. G. Bartlett, M. T. Waight, D. B. Neau, W. E. Boeglin, A. R. Brash,and M. E. Newcomer, Science (New York, N.Y.) 331, 217 (2011), ISSN 1095-9203.
[166] Y.-F. Chang, J. S. Imam, and M. F. Wilkinson, Annual review of biochemistry 76,51 (2007), ISSN 0066-4154.
[167] A. E. Goetz and M. Wilkinson, Cellular and molecular life sciences : CMLS 74, 3509(2017), ISSN 1420-9071.
[168] M. A. Gil, Applied Mathematics and Computation 30, 125 (1989), ISSN 0096-3003.
[169] Y. Wang, Y. Shen, S. Wang, Q. Shen, and X. Zhou, Cancer letters 415, 117 (2018),ISSN 1872-7980.
[170] A. V. Rozhkova, M. V. Zinovyeva, A. V. Sass, I. B. Zborovskaya, S. A. Limborska,and L. V. Dergunova, Molekuliarnaia biologiia 48, 395 (2014), ISSN 0026-8984.
[171] R. Bellelli, G. Federico, A. Matte’, D. Colecchia, A. Iolascon, M. Chiariello, M. San-toro, L. De Franceschi, and F. Carlomagno, Cell reports 14, 411 (2016), ISSN 2211-1247.
[172] X. Ma, Z. He, L. Li, D. Yang, and G. Liu, Oncotarget 8, 77761 (2017), ISSN 1949-2553.
[173] S. Washizuka, K. Iwamoto, C. Kakiuchi, M. Bundo, and T. Kato, Neuroscience re-search 63, 199 (2009), ISSN 0168-0102.
[174] L. Fagerberg, B. M. Hallström, P. Oksvold, C. Kampf, D. Djureinovic, J. Odeberg,M. Habuka, S. Tahmasebpoor, A. Danielsson, K. Edlund, et al., Molecular & cellularproteomics : MCP 13, 397 (2014), ISSN 1535-9484.
[175] E. D. Accordi, P. Xekouki, B. Azevedo, R. B. de Alexandre, C. Frasson, S. M. Gantzel,G. Z. Papadakis, A. Angelousi, C. A. Stratakis, V. S. Sotomaior, et al., Europeanthyroid journal 5, 94 (2016), ISSN 2235-0640.
[176] G. Kallifatidis, D. K. Smith, D. S. Morera, J. Gao, M. J. Hennig, J. J. Hoy, R. F.Pearce, I. R. Dabke, J. Li, A. S. Merseburger, et al., Molecular cancer therapeutics18, 801 (2019), ISSN 1538-8514.
141


Appendix A
Disease genes
List of thyroid cancer-associated genes (THCA-genes) identified as differentially expressedgenes (DEGs) in the CSD networks generated in the development part of this thesis. Thesource of information about genetic functions is the UniGene Database [111], otherwisecitations are provided. The relatedness of these genes to thyroid cancer is documentedby the Gene Association Database [5]. The lists provides information about each gene’sbiological function and may provide information about which genes it is connected to alongwith the corresponding link types. The links represent associations between DEGs inferredby the CSD framework, which are either conserved, specific or differential between thestudied conditions (thyroid cancer vs. normal).
The first list is based on the THCA-genes in Table 4.6 and support the results in Chapter 4.The two following lists are based on results from Chapter 5. A.2 lists relevant information forTHCA-genes for the network based on weighted topological overlap as similarity measurefrom Table 5.4. A.3 lists information about THCA-genes from the mutual information-based CSD network. Each lists of these latter ones will exclusively list the THCA-genesuniquely identified by their respective methods if not already identified by a network basedon Spearman correlation as similarity measure. Lastly, Table A.1 contains informationabout which THCA-associated genes were found by which alternative CSD methods fromChapter 5.
A.1 Thyroid cancer associated genes in CSD network
• TPO encodes thyroid peroxidase, a membrane bound protein, which is needed forproper production of thyroid hormones [137].
• ITGB2 encodes information for one sub-unit of the β2. Integrin proteins are involvedin regulation of cellular adhesion and signal transmission pathways controlling cellgrowth and proliferation. Also involved in immune system as important cell-membraneconstituents of leukocytes for recognition of signs of inflammation.
143

A.1. THYROID CANCER ASSOCIATED GENES IN CSD NETWORK
• HLA-DRB1 encodes a histocompatibility antigen, where it plays a central role inhumman immunity processes by presenting peptides of extracellular proteins.
• IRS1 encodes an insulin receptor and has normally high expression in the thyroid.
• FN1 encodes fibronectin-1 protein needed for cellular expansion, migration and differ-entiation.
• The gene CCL5 encodes a secreted protein involved in immunoregulatory and inflam-matory processes.
• STAT3 is connected to network hubs AMOT and EVC by differentiated links. Thegene protein is reported to mediate crosstalk between the immune system and cancers,modulating cancer growth through immunosupression [169].
• ITGA3 encodes a integrin protein who’s expression is linked to cancer metastasis. Itis connected to FN1 by a S-link.
• Thyroglobin encoded by TG is D-linked and also found in the large connected com-ponent of the network. It is expressed at high levels in the thyroid, where it forms asubstrate for synthesis of thyroid hormone.
• ITPR3 has normally ubiquitous expression in the thyroid, its protein is a regulatorof calcium release receptor found in the ER. In the network is has only differentiatedtype links.
• ITPR1 encodes a receptor of the inositol 1,4,5-trisphosphate signal molecule, andregulates calcium release from the endoplasmatic reticulum. It has two differentiatedtype links, like FN1 it is connected to the high-degree gene AMOT.
• MATN2 is D-linked to FUCA1, who’s expressed protein causes growth and survivalof thyroid cancer cells and is involved in their invasive behaviour [144]. The otherneighbor of MATN2 is SGMS1, encoding a sphingomyeling synthase also related tocancerous cell behaviour [170]. MATN2 itself encodes matrilin, a protein found infilamentous networks.
• ADGRV1 encodes a G-protein coupled receptor which binds calcium. It associateswith two S-links to ANXA3 and BCL2L1. The latter is a high-degree gene encoding aprotein found in the outer mitochondrial membrane where it takes part in regulationof programmed cell death pathways.
• TRIP12, Thyroid hormone receptor interactor 12, is associated directly with the hubof highest degree MICAL3 with a differentiated type link. TRIP12 found in the largestconnected network component.
• HLA-DQA1 is a genes that codes for a protein of the major histocompatibility complexclass II, and is central to the immune system in the recognition of antigen-presentingcells.
144

A.2. THYROID CANCER-ASSOCIATED GENES IN WTO-NETWORK
• S100A10 encodes a calcium binding protein which is involved with cell cycle progres-sion and differentiation.
• NCOA4 encodes a cargo receptor mediating ferritin degradation [171]. It is D-linkedto the gene PIGBOS1, which is gene that transcribes into a long non-coding RNAmolecule related to cancer [172].
• FAS encodes the "Fas cell surface death receptor" protein which regulates programmedcell death. It has also been related to diseases of the immune system.
• DIO1 is linked to TPD52L1 by a differentiated link, its neighbor encodes a pro-tein involved in cell proliferation and calcium signaling. It also positively regulatesMAP3K5/ASK1-induced apoptosis.
• MAPk1 is D-linked to NDUFV2 which codes for the mitochondrial complex 1 subunitessential for mitochondrial function [173]. MAPK1 itself codes for a MAP kinase,known to be involved in regulation of cellular processes such as differentiation, prolif-eration of transcriptional regulation. It is normally ubiquitously expressed in thyroidglandular tissue [174].
• SLC26A4 codes for a protein called pendrin. It’s function is to transport ions acrossthe cell membrane and regulate proper balance of ions inside the cytoplasm. It hasespecially high basal transcription levels in the thyroid gland and inner ear. In thethyroid pendrin is related to transport iodide into thyroid glandular cells needed forthyroid hormone production. In the network SLC26A4 has degree 1 and is connectedto SLC26A4-AS1 by a conserved link.
• LGALS3 has one specific link to the proto-oncogene MET, a receptor tyrosine ki-nase. LGALS3 encodes a galectin binding protein with numerous functions includingapoptosis, immune system processes, cellular adhesion and regulation of T-cells.
A.2 Thyroid cancer-associated genes in wTO-network
• SDHC is a gene that codes for the C sub-unit of succinate dehydrogenase, which hasbeen investigated for relation to development of thyroid cancer [175].
• SNX19 encodes the sorting nexin-19, which is involved with intracellular vesicle trans-port.
• TRIP11 encodes the Thyroid hormone receptor interactor 11 is a protein-coding genewho’s protein product usually associated with the Golgi apparatus and is though tobe involved in it’s structural organization around the centrosome.
145

A.3. THYROID CANCER ASSOCIATED GENES IN MI-NETWORK
A.3 Thyroid cancer associated genes in MI-network
• ARRB2 expressed the gene beta-arrestin-2. This functions in regulation of G-proteinreceptor activity and it’s expression levels is linked to several types of cancer [176].
• GSTP1 translates into a glutathione S-transferase, which mediates kinase regulationin response to cell-matrix adhesion, proliferation and inflammatory processes.
• ITGA1 codes for integrin alpha-1. This protein is involved with process regulatingcellular growth.
• MLH1 DNA mismatch repair protein Mlh1 is a gene involved with the DNA mismatchrepair machinery. Aberrant methylation of this gene is related to BRAF mutations inpatients with thyroid carcinoma.
• PLAU codes for the urokinase-type plasminogen activator. This activator mediatescleavage of plasminogen to yield active plasmin. Together the activity of these areinvolved in cell proliferation and migration.
• PRKAR1A is a protein kinase-encoding gene. The gene product, type I-alpha reg-ulatory subunit, is a cAMP-dependent regulatory unit of kinases involved in cAMPsignal cascades.
• SDHB encodes for the C sub-unit succinate dehydrogenase. This is involved in themitochondrial complex II, which is involved in the electron transport chain supplyingubiquinone.
• TCF12 as a gene that codes for the transcription factor 12, which is facilitates acti-vation of transcription.
A.4 Thyroid cancer associated genes in CSD-VAR-network
• CDYL expression produces the chromodomain Y-like protein. This is needed forproper regulation of epigenetic processes and acts as a co-repressor of transcription.
• PIK3CA encodes for the protein phosphoinositide-3-kinase (PI3K). It plays an impor-tant in regulation of signaling processes of cell growth, motility and morphology.
A.5 Thyroid cancer associated genes identification chart
146

A.5. THYROID CANCER ASSOCIATED GENES IDENTIFICATION CHART
Table A.1: Summary of THCA-genes identified as differentially co-expressed by the CSD networksbased on the four different similarity measurements experimented with in Chapter 5.
Gene name CSD wTO MI CSD-VARADGRV1 XARRB2 XCCL5 X X XCDYL XDIO1 X X XFAS XFN1 X X XGSTP1 XHLA-DQA1 X X XHLA-DRB1 X XIRS1 X XITGA1 XITGA3 X X XITGB2 X X XITPR1 X X XITPR3 X XLGALS3 X XMAPK1 X XMATN2 X XMLH1 XNCOA4 X X X XPIK3CA XPLAU XPRKAR1A XS100A10 X X XSDHB XSDHC X X XSLC26A4 X X XSNX19 X XSTAT3 X XTCF12 X XTG X X XTPO X X XTRIP11 X X XTRIP12 X X X X
147

Appendix B
Auxillary material from method de-velopment section
B.1 Hubs in wTO-network
149

B.1. HUBS IN WTO-NETWORK
Table B.1: Hub genes in wTO-network identified as differentially expressed with degree k ≥ 40.Predominant link type t∈(C.S.D), clustering coefficient C, and betweenness centrality CB are givenfor each gene respectively.
Name k t∈(C.S.D) C CBSP140 110 S 0.144 0.234TRAC 110 S 0.183 0.181IGKV3-20 109 C 0.225 0.051IGHG1 99 C 0.269 0.022IGKV4-1 99 C 0.269 0.020IGLC3 97 C 0.263 0.016IGKV1-5 96 C 0.284 0.016IGKV3-11 90 C 0.315 0.010IGHG3 86 C 0.338 0.009IGKV3-15 79 C 0.382 0.006IGHV3-23 77 C 0.395 0.006IGLV2-14 76 C 0.404 0.005IGKV1OR2-108 69 S 0.311 0.088IGHA1 63 C 0.404 0.003IGLV1-40 61 C 0.522 0.002IGLV1-50 58 S 0.374 0.008MZB1 57 C 0.509 0.002XRN2 56 D 0.000 0.246IGHV5-51 56 C 0.575 0.002IGHV3-30 55 C 0.585 0.002PSMA3 51 D 0.000 0.170LSP1 51 S 0.008 0.203CD53 50 S 0.005 0.186PSMA2 47 D 0.000 0.115MICAL3 41 D 0.000 0.071
150

B.2. GO PROCESS ENRICHMENT OF ALL GENES IN THE WTO-NETWORK
B.2 GO process enrichment of all genes in the wTO-network
Table B.2: Enriched processes of the wTO-network
GO biological process FE P-valueComplement activation, classical pathway 12.39 1.13e-52Phagocytosis, recognition 11.76 2.20e-32Regulation of complement activation 11.49 7.23e-34Complement activation 11.49 5.52e-52Immune response-regulating cell surface receptorsignaling pathway involved in phagocytosis 10.71 1.18e-35Fc-gamma receptor signaling pathway involved in phagocytosis 10.71 1.18e-35Fc receptor mediated stimulatory signaling pathway 10.56 2.23e-35Fc-gamma receptor signaling pathway 10.4 4.17e-35immunoglobulin mediated immune response 10 1.05e-47B cell mediated immunity 9.9 1.91e-47regulation of humoral immune response 9.86 3.02e-31B cell receptor signaling pathway 9.82 1.83e-29Fc-epsilon receptor signaling pathway 9.8 1.08e-39phagocytosis, engulfment 9.62 1.41e-28Immunoglobulin production 9.04 2.80e-30plasma membrane invagination 8.98 1.75e-27Proteasomal ubiquitin-independentprotein catabolic process 8.98 3.97e-06membrane invagination 8.54 1.11e-26production of molecular mediator of immune response 7.92 5.89e-28Fc receptor signaling pathway 7.9 6.45e-39
151
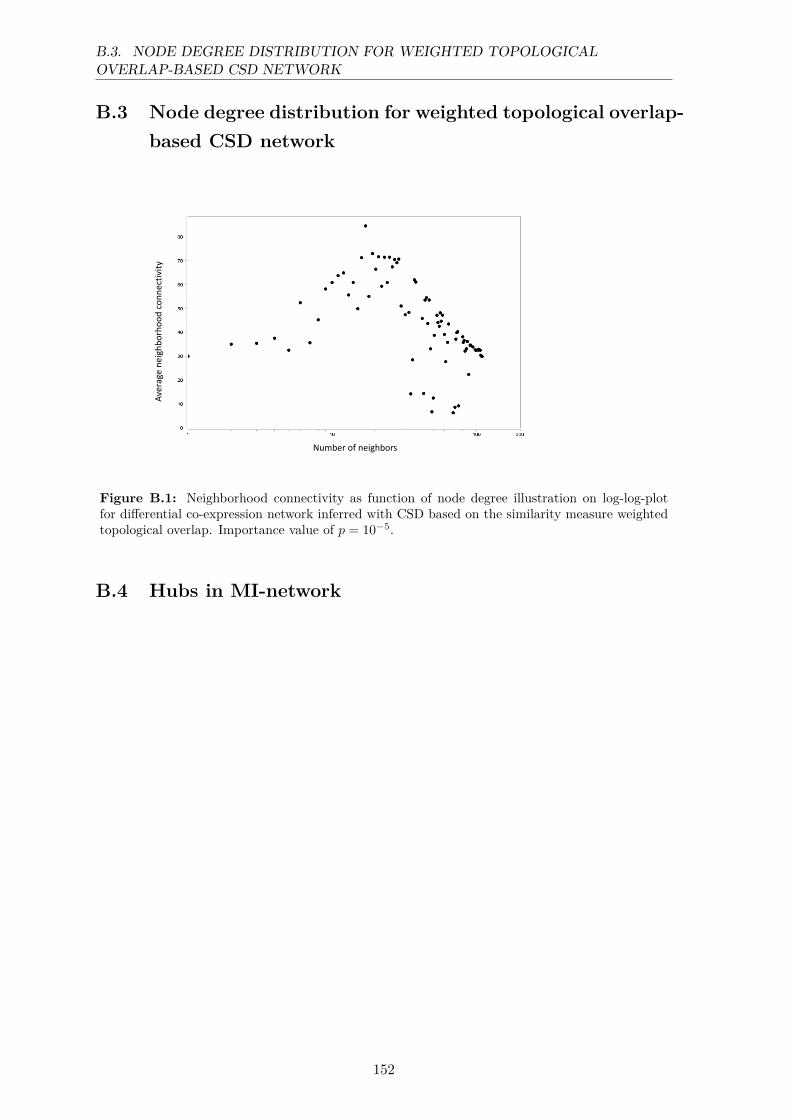
B.3. NODE DEGREE DISTRIBUTION FOR WEIGHTED TOPOLOGICALOVERLAP-BASED CSD NETWORK
B.3 Node degree distribution for weighted topological overlap-based CSD network
Number of neighbors
Ave
rage
ne
igh
bo
rho
od
co
nn
ect
ivit
y
Figure B.1: Neighborhood connectivity as function of node degree illustration on log-log-plotfor differential co-expression network inferred with CSD based on the similarity measure weightedtopological overlap. Importance value of p = 10−5.
B.4 Hubs in MI-network
152

B.4. HUBS IN MI-NETWORK
Table B.3: Hubs of the CSD network inferred with an importance value of p = 10−5 based onthe similarity measure mutual information. Hub genes are sorted by their respective degree k.Predominant link type t∈(C.S.D), clustering coefficient C, and betweenness centrality CB are givenfor each gene respectively.
Name k t∈(C.S.D) C CBIGKV3-20 36 C 0.317 0.083IGHG1 36 C 0.317 0.081RPS17 34 S 0.071 0.143IGLV2-14 34 C 0.270 0.126IGKV3-11 33 C 0.352 0.074IGKV1-5 32 C 0.361 0.071IGHGP 30 C 0.347 0.069IGLC3 28 C 0.347 0.045LSP1 27 S 0.043 0.258IGKV4-1 27 C 0.362 0.022IGKV3-15 27 C 0.410 0.038MZB1 24 C 0.522 0.019IGHV4-39 24 C 0.348 0.042IGHG3 24 C 0.4028 0.0334IGHV4-59 23 C 0.3878 0.035TRBV28 22 S 0.1088 0.191IGHV3-21 22 C 0.351 0.032IGLV1-51 21 C 0.400 0.030IGHV4-34 21 C 0.338 0.024USP34 20 S 0.084 0.086MFAP3 20 S 0.095 0.249IGLC2 20 C 0.463 0.014IGHV1-18 20 C 0.305 0.020IGHG2 20 C 0.437 0.015
153

B.5. NODE DEGREE DISTRIBUTION FOR MUTUAL INFORMATION-BASED CSDNETWORK
B.5 Node degree distribution for mutual information-basedCSD network
Figure B.2: Degree distribution plot for the CSD network based on mutual information as sim-ilarity measure. The importance level for the network is 10−5 and the axes of the plot are on alog-log-scale. The red fitted line shows the approximation of the node degree distribution with apower law function.
B.6 THCA-associated genes from Analysis 0
154

B.7. NODE DEGREE DISTRIBUTION FOR CSD NETWORK BASED ON CSD-VAR
Table B.4: Table of additional THCA-associated genes identified in network for Analysis 0. Typedenotes the predominant link type among a gene’s associations (t∈(C,S,D)).
Gene symbol Genes Name k d̄ TypeITGB2 integrin subunit beta 2 9 3.3 CIFNAR1 class II cytokine receptor gene 5 4.1 SSDHB Succinate Dehydrogenase Complex Iron Sulfur Subunit B 3 8.0 CSNX19 Sorting Nexin 19 3 5.3 DPMS2 PMS1 homolog 2, mismatch repair system component 3 4.6 SSMAD4 SMAD family member 4 2 5.8 SSDHC Succinate Dehydrogenase Complex Subunit C 2 5.0 STRIP11 Thyroid Hormone Receptor Interactor 11 1 5.9 SMLH1 mutL homolog 1 1 5.3 SBRAF B-Raf proto-oncogene 1 4.8 SARNT aryl hydrocarbon receptor nuclear translocator 2 1 1 SCDYL Chromodomain Y Like protein coding gene 1 1 SRAF1 Raf-1 proto-oncogene 1 1 SSLC26A4 solute carrier family 26 member 4 1 1 CSDHD Succinate Dehydrogenase Complex Subunit D 1 1 C
B.7 Node degree distribution for CSD network based onCSD-VAR
155

B.7. NODE DEGREE DISTRIBUTION FOR CSD NETWORK BASED ON CSD-VAR
Figure B.3: Degree distribution plot on a log-log-scale for the network inferred with alternativeSpearman’s correlation coefficient not corrected for variation in correlation measures, termed CSD-VAR. The importance level for the network is 10−5. The red fitted line shows the approximationof the node degree distribution with a power law function.
156