Term p
29
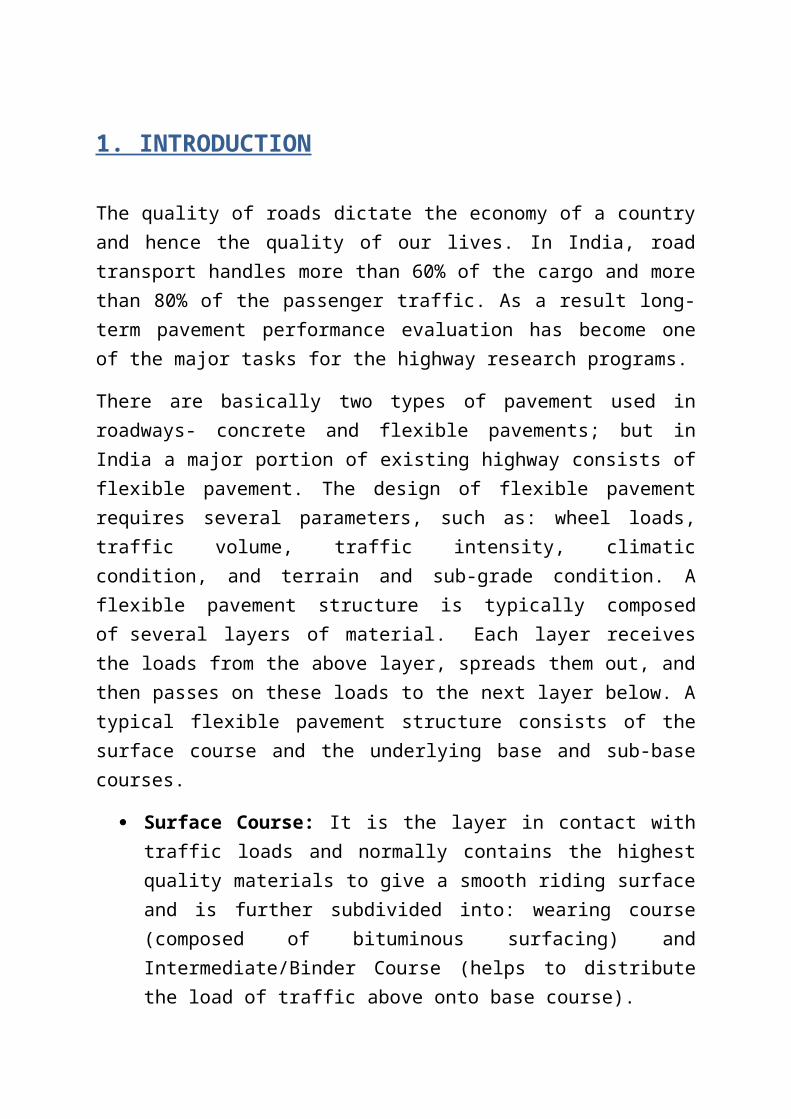
1. INTRODUCTION The quality of roads dictate the economy of a country and hence the quality of our lives. In India, road transport handles more than 60% of the cargo and more than 80% of the passenger traffic. As a result long- term pavement performance evaluation has become one of the major tasks for the highway research programs. There are basically two types of pavement used in roadways- concrete and flexible pavements; but in India a major portion of existing highway consists of flexible pavement. The design of flexible pavement requires several parameters, such as: wheel loads, traffic volume, traffic intensity, climatic condition, and terrain and sub-grade condition. A flexible pavement structure is typically composed of several layers of material. Each layer receives the loads from the above layer, spreads them out, and then passes on these loads to the next layer below. A typical flexible pavement structure consists of the surface course and the underlying base and sub-base courses. Surface Course: It is the layer in contact with traffic loads and normally contains the highest quality materials to give a smooth riding surface and is further subdivided into: wearing course (composed of bituminous surfacing) and Intermediate/Binder Course (helps to distribute the load of traffic above onto base course).
Transcript of Term p
1. INTRODUCTION
The quality of roads dictate the economy of a countryand hence the quality of our lives. In India, roadtransport handles more than 60% of the cargo and morethan 80% of the passenger traffic. As a result long-term pavement performance evaluation has become oneof the major tasks for the highway research programs.
There are basically two types of pavement used inroadways- concrete and flexible pavements; but inIndia a major portion of existing highway consists offlexible pavement. The design of flexible pavementrequires several parameters, such as: wheel loads,traffic volume, traffic intensity, climaticcondition, and terrain and sub-grade condition. Aflexible pavement structure is typically composedof several layers of material. Each layer receivesthe loads from the above layer, spreads them out, andthen passes on these loads to the next layer below. Atypical flexible pavement structure consists of thesurface course and the underlying base and sub-basecourses.
Surface Course: It is the layer in contact withtraffic loads and normally contains the highestquality materials to give a smooth riding surfaceand is further subdivided into: wearing course(composed of bituminous surfacing) andIntermediate/Binder Course (helps to distributethe load of traffic above onto base course).
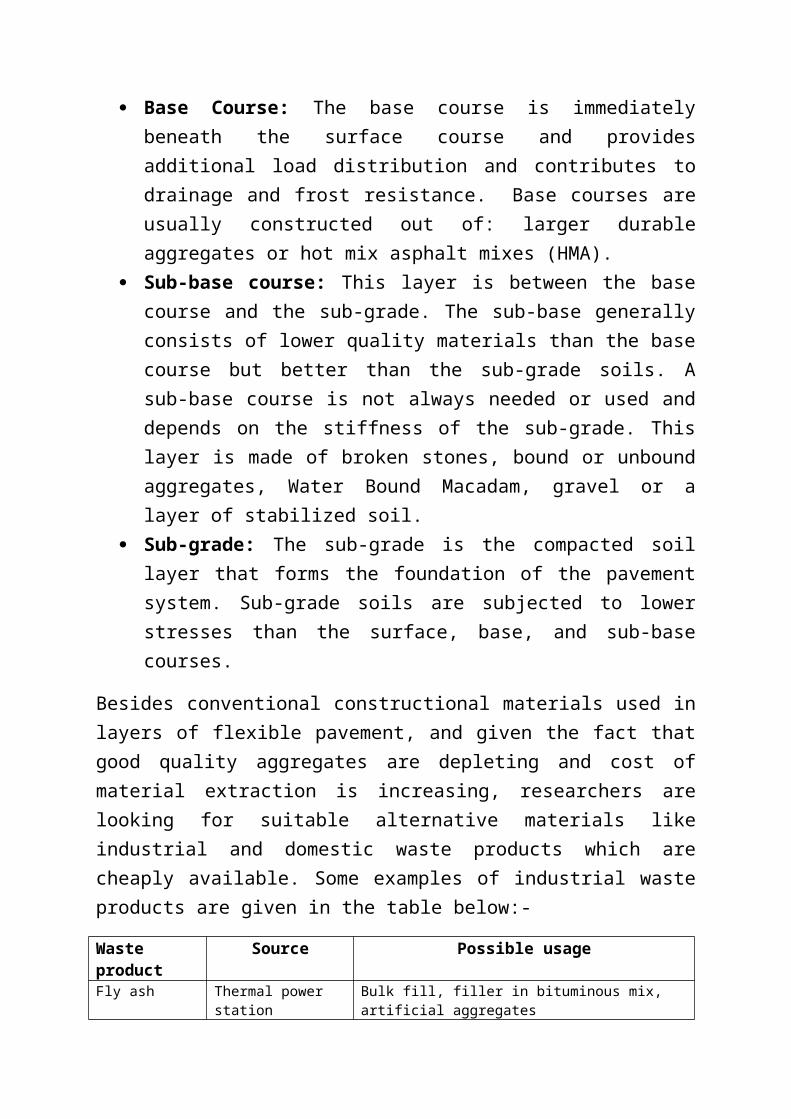
Base Course: The base course is immediatelybeneath the surface course and providesadditional load distribution and contributes todrainage and frost resistance. Base courses areusually constructed out of: larger durableaggregates or hot mix asphalt mixes (HMA).
Sub-base course: This layer is between the basecourse and the sub-grade. The sub-base generallyconsists of lower quality materials than the basecourse but better than the sub-grade soils. Asub-base course is not always needed or used anddepends on the stiffness of the sub-grade. Thislayer is made of broken stones, bound or unboundaggregates, Water Bound Macadam, gravel or alayer of stabilized soil.
Sub-grade: The sub-grade is the compacted soillayer that forms the foundation of the pavementsystem. Sub-grade soils are subjected to lowerstresses than the surface, base, and sub-basecourses.
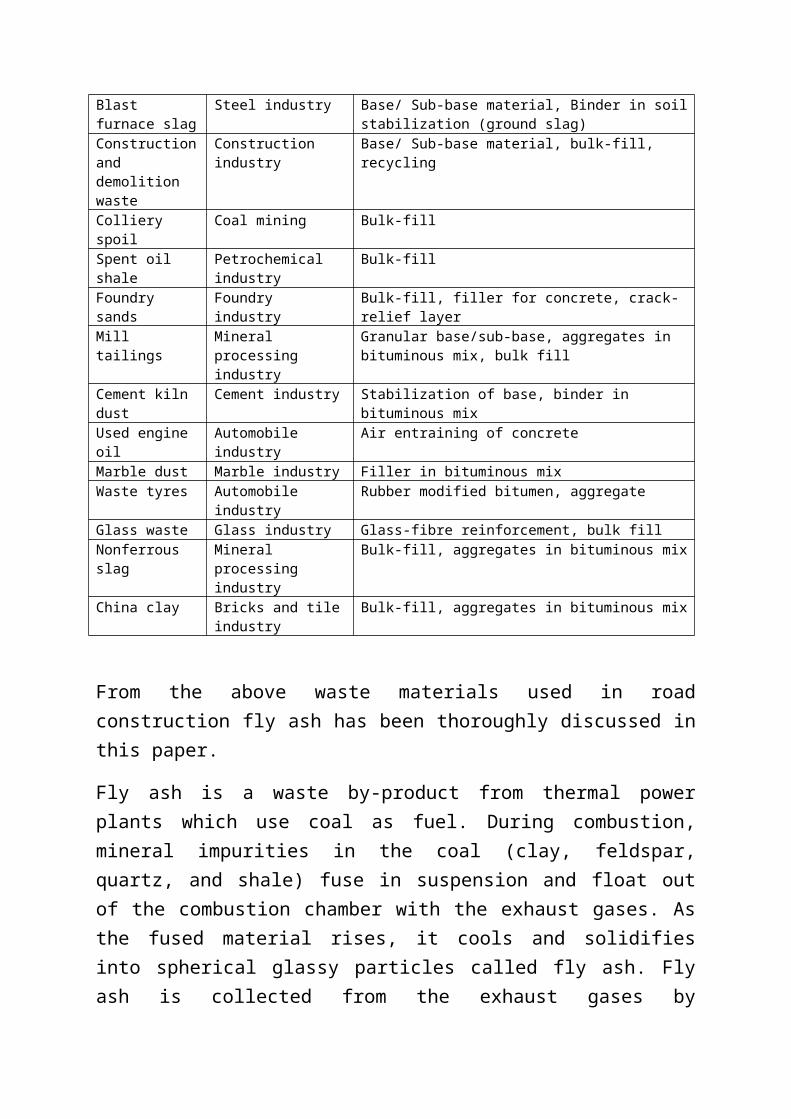
Besides conventional constructional materials used inlayers of flexible pavement, and given the fact thatgood quality aggregates are depleting and cost ofmaterial extraction is increasing, researchers arelooking for suitable alternative materials likeindustrial and domestic waste products which arecheaply available. Some examples of industrial wasteproducts are given in the table below:-
Waste product
Source Possible usage
Fly ash Thermal power station
Bulk fill, filler in bituminous mix, artificial aggregates
Blast furnace slag
Steel industry Base/ Sub-base material, Binder in soilstabilization (ground slag)
Constructionand demolition waste
Construction industry
Base/ Sub-base material, bulk-fill, recycling
Colliery spoil
Coal mining Bulk-fill
Spent oil shale
Petrochemical industry
Bulk-fill
Foundry sands
Foundry industry
Bulk-fill, filler for concrete, crack-relief layer
Mill tailings
Mineral processing industry
Granular base/sub-base, aggregates in bituminous mix, bulk fill
Cement kiln dust
Cement industry Stabilization of base, binder in bituminous mix
Used engine oil
Automobile industry
Air entraining of concrete
Marble dust Marble industry Filler in bituminous mixWaste tyres Automobile
industryRubber modified bitumen, aggregate
Glass waste Glass industry Glass-fibre reinforcement, bulk fillNonferrous slag
Mineral processing industry
Bulk-fill, aggregates in bituminous mix
China clay Bricks and tileindustry
Bulk-fill, aggregates in bituminous mix
From the above waste materials used in roadconstruction fly ash has been thoroughly discussed inthis paper.
Fly ash is a waste by-product from thermal powerplants which use coal as fuel. During combustion,mineral impurities in the coal (clay, feldspar,quartz, and shale) fuse in suspension and float outof the combustion chamber with the exhaust gases. Asthe fused material rises, it cools and solidifiesinto spherical glassy particles called fly ash. Flyash is collected from the exhaust gases by
electrostatic precipitators or bag filters whereascoarse ash particles referred to as bottom ash orslag, fall to the bottom of the combustion chamber.
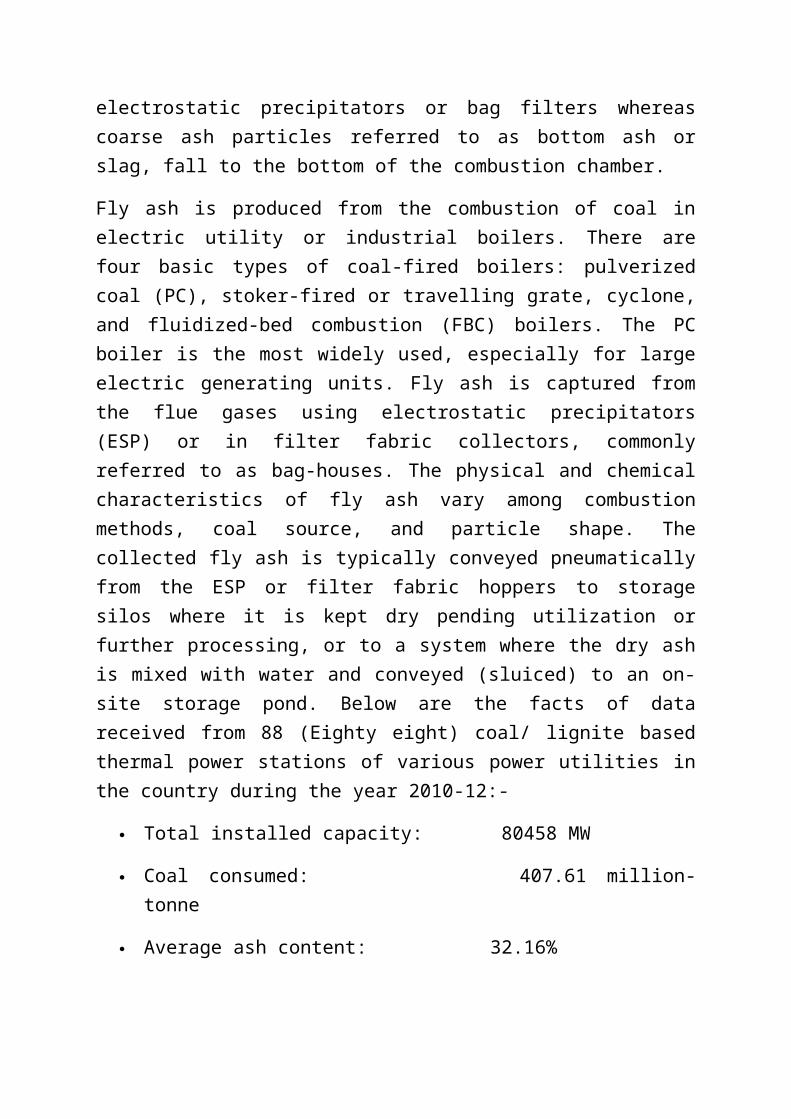
Fly ash is produced from the combustion of coal inelectric utility or industrial boilers. There arefour basic types of coal-fired boilers: pulverizedcoal (PC), stoker-fired or travelling grate, cyclone,and fluidized-bed combustion (FBC) boilers. The PCboiler is the most widely used, especially for largeelectric generating units. Fly ash is captured fromthe flue gases using electrostatic precipitators(ESP) or in filter fabric collectors, commonlyreferred to as bag-houses. The physical and chemicalcharacteristics of fly ash vary among combustionmethods, coal source, and particle shape. Thecollected fly ash is typically conveyed pneumaticallyfrom the ESP or filter fabric hoppers to storagesilos where it is kept dry pending utilization orfurther processing, or to a system where the dry ashis mixed with water and conveyed (sluiced) to an on-site storage pond. Below are the facts of datareceived from 88 (Eighty eight) coal/ lignite basedthermal power stations of various power utilities inthe country during the year 2010-12:-
Total installed capacity: 80458 MW
Coal consumed: 407.61 million-tonne
Average ash content: 32.16%
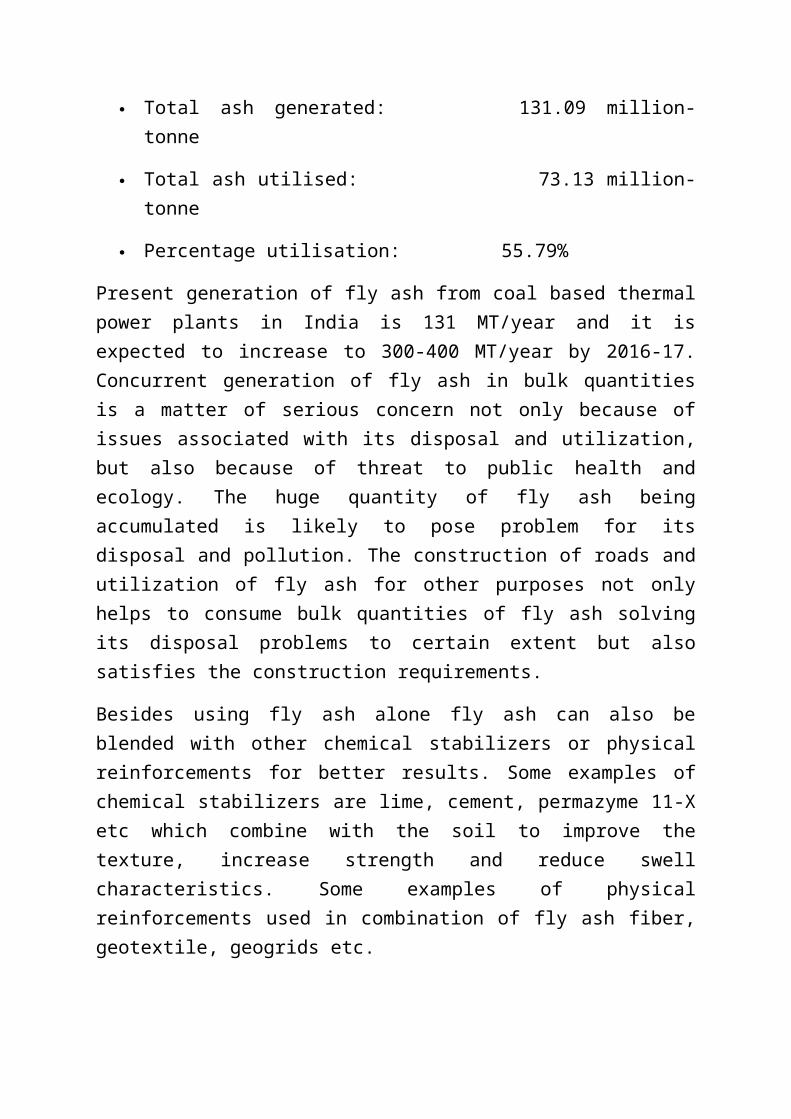
Total ash generated: 131.09 million-tonne
Total ash utilised: 73.13 million-tonne
Percentage utilisation: 55.79%
Present generation of fly ash from coal based thermalpower plants in India is 131 MT/year and it isexpected to increase to 300-400 MT/year by 2016-17.Concurrent generation of fly ash in bulk quantitiesis a matter of serious concern not only because ofissues associated with its disposal and utilization,but also because of threat to public health andecology. The huge quantity of fly ash beingaccumulated is likely to pose problem for itsdisposal and pollution. The construction of roads andutilization of fly ash for other purposes not onlyhelps to consume bulk quantities of fly ash solvingits disposal problems to certain extent but alsosatisfies the construction requirements.
Besides using fly ash alone fly ash can also beblended with other chemical stabilizers or physicalreinforcements for better results. Some examples ofchemical stabilizers are lime, cement, permazyme 11-Xetc which combine with the soil to improve thetexture, increase strength and reduce swellcharacteristics. Some examples of physicalreinforcements used in combination of fly ash fiber,geotextile, geogrids etc.

2. LITERATURE REVIEW
2.1 FLY ASH CLASSIFICATION
American Society for Testing and Materials (ASTM)Specification C 618 has classified fly ash as eitherclass C or class F based on its chemical composition.The differences between these two classes are basedon the amount of Calcium, Silicon, Aluminium, & Ironcontent in ash.
Class F fly ash
Class F ashes are typically derived from bituminousand anthracite coals and consist primarily ofaluminosilicate glass, with quartz, mullite, andmagnetite. Class F fly ashes are also known as lowcalcium fly ash and has less than 10 percent calciumoxide.
Class C fly ash
Class C ashes are generally derived from sub-bituminous coals and consist primarily of calciumaluminosulphate glass, as well as quartz, tri-calciumaluminate, and free lime. Class C ash is alsoreferred to as high calcium fly ash because ittypically contains more than 20 percent calciumoxide.
The sample oxides analyses of fly ashes are given asfollows:-
Compounds Class F fly ash Class C fly ash
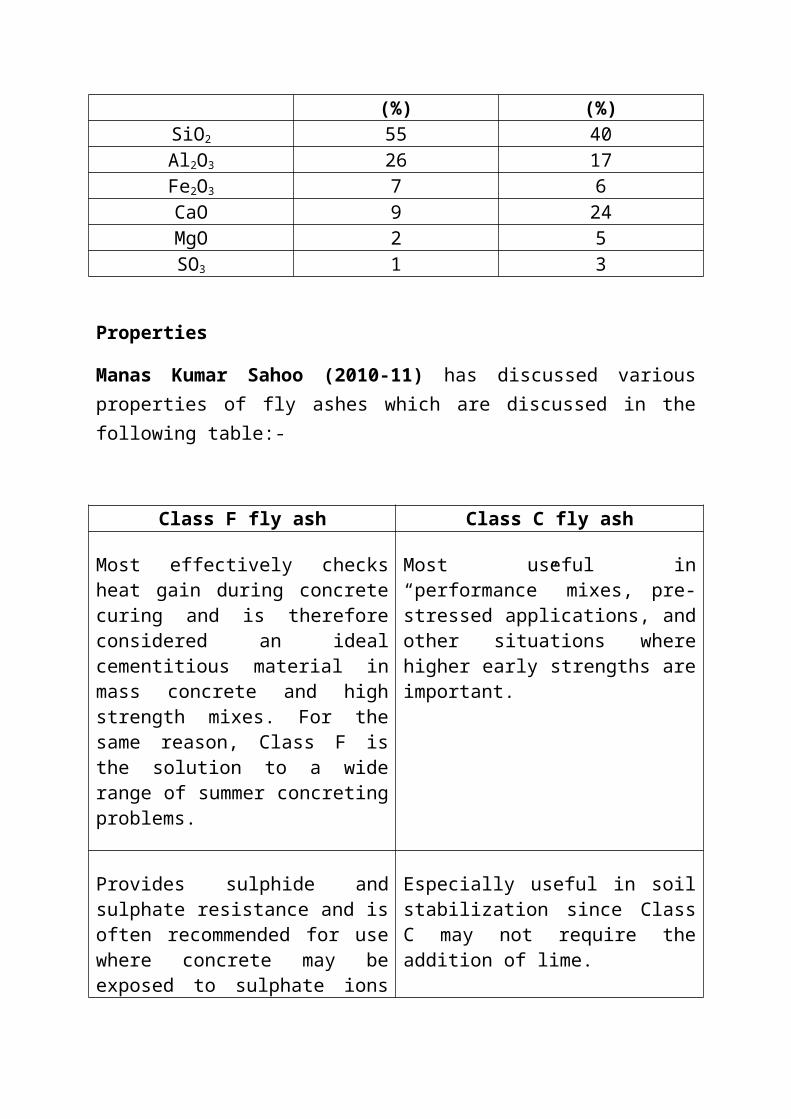
(%) (%)SiO2 55 40Al2O3 26 17Fe2O3 7 6CaO 9 24MgO 2 5SO3 1 3
Properties
Manas Kumar Sahoo (2010-11) has discussed variousproperties of fly ashes which are discussed in thefollowing table:-
Class F fly ash Class C fly ash
Most effectively checksheat gain during concretecuring and is thereforeconsidered an idealcementitious material inmass concrete and highstrength mixes. For thesame reason, Class F isthe solution to a widerange of summer concretingproblems.
Most useful in“performance” mixes, pre-stressed applications, andother situations wherehigher early strengths areimportant.
Provides sulphide andsulphate resistance and isoften recommended for usewhere concrete may beexposed to sulphate ions
Especially useful in soilstabilization since ClassC may not require theaddition of lime.
in soil and ground water.
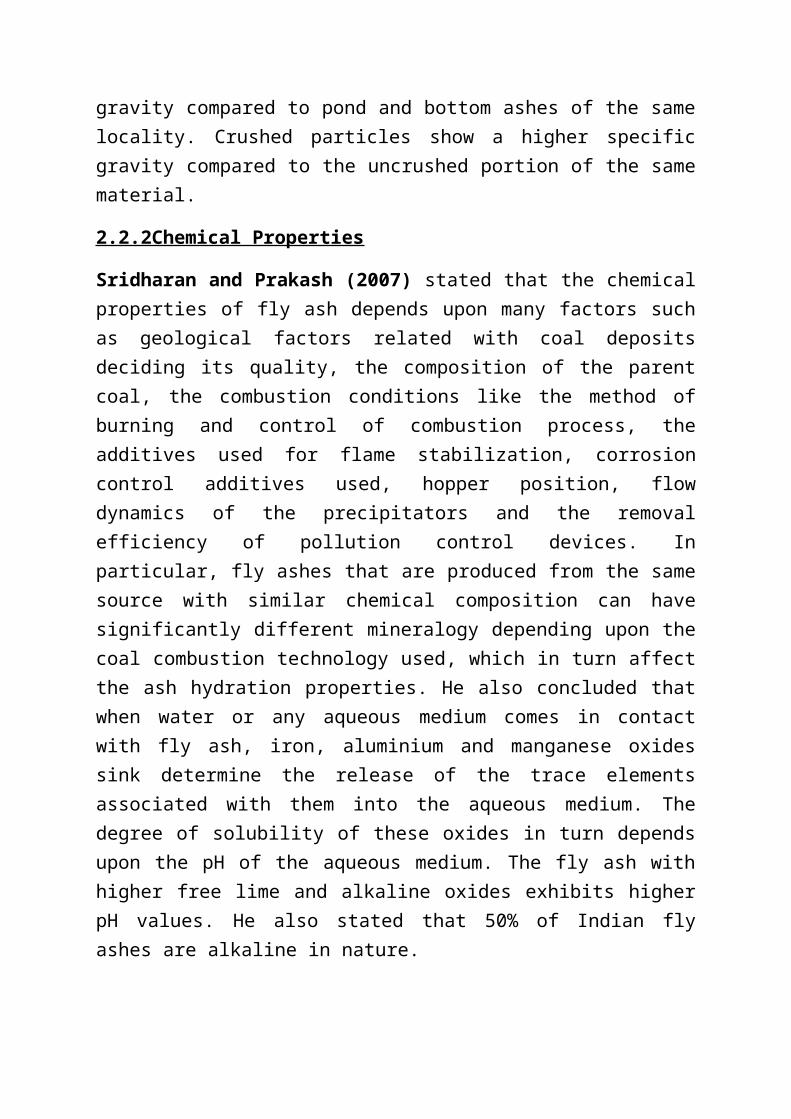
2.2 GEOTECHNICAL PROPERTIES OF FLY ASH
2.2.1 Physical Properties
Rehsi and Garg (1988) have made a critical assessmentof the different physical properties of Indian flyashes. The particles of the fly ashes were angular aswell as irregular.
Pandian et al. (1998) reported that the range ofspecific gravity varies from 1.46 to 2.66 for Indianfly ashes.
Sridharan and Prakash (2007) have reported that thespecific gravity of Indian fly ashes varies in therange of 1.66 to 2.55.
Gray and Lin (1972) reported that the variation ofspecific gravity of the fly ash is the result of acombination of many factors such as gradation,particle shape and chemical composition.
Manas Kumar Sahoo (2010-11) has reported that thevariation of specific gravity of coal ash is due tomany factors such as gradation, particle shape andchemical composition. It is known that coal ashcomprises mainly glassy cenospheres and some solidspheres. The reason for a low specific gravity couldeither be due to the presence of large number ofhollow cenospheres, or the variation in the chemicalcomposition, in particular iron content, or both. Inmost of the cases, fly ash has higher specific
gravity compared to pond and bottom ashes of the samelocality. Crushed particles show a higher specificgravity compared to the uncrushed portion of the samematerial.
2.2.2Chemical Properties
Sridharan and Prakash (2007) stated that the chemicalproperties of fly ash depends upon many factors suchas geological factors related with coal depositsdeciding its quality, the composition of the parentcoal, the combustion conditions like the method ofburning and control of combustion process, theadditives used for flame stabilization, corrosioncontrol additives used, hopper position, flowdynamics of the precipitators and the removalefficiency of pollution control devices. Inparticular, fly ashes that are produced from the samesource with similar chemical composition can havesignificantly different mineralogy depending upon thecoal combustion technology used, which in turn affectthe ash hydration properties. He also concluded thatwhen water or any aqueous medium comes in contactwith fly ash, iron, aluminium and manganese oxidessink determine the release of the trace elementsassociated with them into the aqueous medium. Thedegree of solubility of these oxides in turn dependsupon the pH of the aqueous medium. The fly ash withhigher free lime and alkaline oxides exhibits higherpH values. He also stated that 50% of Indian flyashes are alkaline in nature.
Roode (1987) reported that loss on ignition isgenerally equal to the carbon content.
Throne and Watt (1965) observed that the amount ofSiO2 or SiO2+ Al2O3 present in fly ash influences thepozzolonic activity for a longer period of time.
Minnick (1959) has reported that a relatively highpercentage of carbon decreases the pozzolonicactivity.
Torrey (1978) reports that fly ash collected byelectrostatic precipitators (ESP) has 38% more CaOand 58% less carbon than ash collected by mechanicalcollectors. Moreover the former is finer than thelatter.
Sen Gupta, 1991; Erol et al., 2000; Singh and Kolay,2002; Pandian, 2004; Sridharan and Prakash, 2007;Ahmaruzzaman, 2010 have stated that the mineralogicalcomposition of fly ash, which depends on thegeological factors related to the formation anddeposition of coal, its combustion conditions, can beestablished by X-ray diffraction (XRD) analysis.Quartz and mullite are the major crystallineconstituents of low calcium fly ash (CaO < 5%),whereas high-calcium fly ash (CaO > 15%) consists ofquartz, C3A, CS and C4AS.
Manas Kumar Sahoo (2010-11) has reported that thepresence of soluble solids is an important aspectduring examination since the water soluble solidsgreatly influence the engineering properties. Thesolubility of nutrient elements such as calcium,
sulphur, phosphorus, magnesium, iron, potassium andmanganese affect the crop yield to a great extent.The solids generally range between 400 and 17600 ppmfor fly ashes, 800 and 3600 ppm for pond ashes, and1400 and 4100 ppm for bottom ashes. He also statedthat the strength of fly ash generally increases withtime due to pozzolanic reactions. For Pozzolanicreactions reactive silica and free lime contents arenecessary. Lime reactivity is a property that dependson the proportion of reactive silica in coal ash. Thepozzolanic reactivity of Indian fly ashes rangesbetween 11.4 and 52.90 kg/cm2. The lime reactivity isgenerally high for coal ashes with high silicacontent. Fly ash has high lime reactivity as comparedto bottom and pond ashes.
2.2.3 Engineering Properties
Krishna, 2001; Pandian, 2004 stated that thecompacted unit weight of the material depends on theamount and method of energy application, grain sizedistribution, plasticity characteristics and moisturecontent at compaction.
Moulton (1978) as well as Sridharan et al. (2000)observed the variation of dry density with moisturecontent for fly ashes is less compared to that for awell-graded soil, both having the same median grainsize.
Toth et al. (1988) reported that Soils normally haveair void content ranging between 1 and 5% at maximumdry density, whereas fly ash contains 5 to 15%. Thehigher void content could tend to limit the buildup
of pore pressures during compaction, thus allowingthe fly ash to be compacted over a larger range ofwater content.
Gatti and Tripiciano (1981) carried out compactiontests on coal ashes collected from Vado Ligure PowerPlant, Italy and obtained maximum dry density variedbetween 11.4kN/m3 and 45kN/m3 with the correspondingoptimum moisture contents ranging between 28% and36%.
DiGioia et al. (1986) provided typical standardProctor compaction curves for Western PennsylvaniaClass F fly ash. They found that the maximum drydensity ranged from 11.9 to 18.7 kN/m3 and optimumwater content ranged from 13 to 32%.
Sridharan et al., 2001; Das and Yudhbir, 2006;Sridharan and Prakash, 2007 stated that Indian flyashes have been observed to have maximum dry densityin the range 8.9 to 13.8 kN/m3 and optimum moisturecontent in the range 17.9 to 62.3% from standardProctor compaction test.
Shenbaga and Gayathri (2004) reported that the valuesof coefficient of permeability of fly ashes were inthe same range as those of non-plastic silts. Theyreported the permeability of fly ashes produced frombituminous coals is in the range of 1×10⁻⁵ to 3×10⁻⁶
cm/s. The compacted fly ash deposits, therefore,would be moderately permeable.
Pandian and Vesperman et al., 1985; Balasubramonian,1999; Sridharan and Prakash, 2007 reported that the
permeability of ash depends on its grain sizedistribution, degree of compaction and pozzolanicactivity. The permeability of Indian fly ashes is inthe range of 8×10^-6 cm/s to 1.87×10^-4 cm/s.
Gray and Lin (1972) observed that the unconfinedcompressive strength (UCS) increased from 390 to 900kPa at 7 days curing and 400 to 1200 kPa at 90 dayscuring of British fly ashes compacted at Proctor’smaximum dry densities.
Yudhbir and Honjo (1991) reported that the UCS of flyash increased exponentially with the free limecontent. They also reported the carbon content in flyashes reduced the strength. This could be attributedto the lower frictional resistance of carbonparticles at the inter particle level.
Ghosh and Subbarao (2006) stated that the class-F flyash achieved unconfined compressive strength of 126kPa at 7 days, 137 kPa at 28 days and 172 at 90 dayscuring
Chavali Rama Vara Prasad et al. conducted anexperiment to explore the possibility of stabilizingclay by using fly ash in combination with sand. Thesoil used in the study was locally available clayeysoil and local sand and according to ISclassification system, the soil was classified asclay with medium plasticity (CI)and sand was obtainedfrom Beas river bed which can be classified as poorlygraded sand (SP). The geotechnical properties ofvarious materials used in the study are shown in thetable below:-
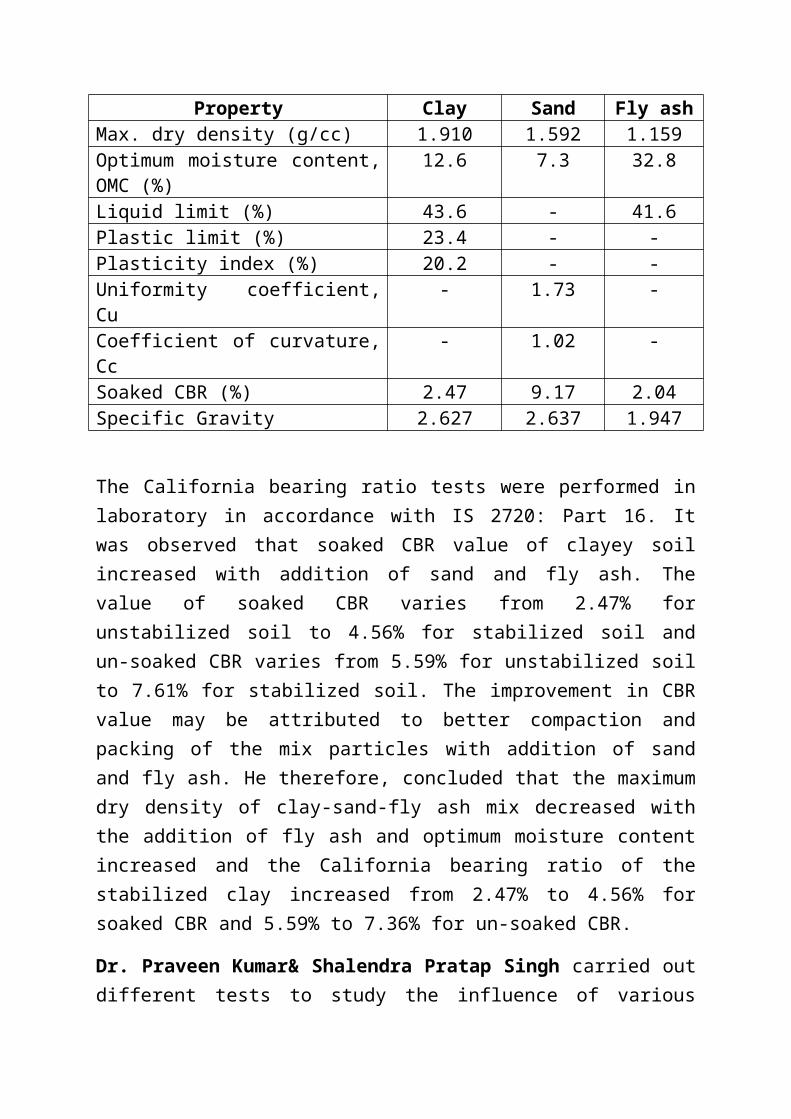
Property Clay Sand Fly ashMax. dry density (g/cc) 1.910 1.592 1.159Optimum moisture content,OMC (%)
12.6 7.3 32.8
Liquid limit (%) 43.6 - 41.6Plastic limit (%) 23.4 - -Plasticity index (%) 20.2 - -Uniformity coefficient,Cu
- 1.73 -
Coefficient of curvature,Cc
- 1.02 -
Soaked CBR (%) 2.47 9.17 2.04Specific Gravity 2.627 2.637 1.947
The California bearing ratio tests were performed inlaboratory in accordance with IS 2720: Part 16. Itwas observed that soaked CBR value of clayey soilincreased with addition of sand and fly ash. Thevalue of soaked CBR varies from 2.47% forunstabilized soil to 4.56% for stabilized soil andun-soaked CBR varies from 5.59% for unstabilized soilto 7.61% for stabilized soil. The improvement in CBRvalue may be attributed to better compaction andpacking of the mix particles with addition of sandand fly ash. He therefore, concluded that the maximumdry density of clay-sand-fly ash mix decreased withthe addition of fly ash and optimum moisture contentincreased and the California bearing ratio of thestabilized clay increased from 2.47% to 4.56% forsoaked CBR and 5.59% to 7.36% for un-soaked CBR.
Dr. Praveen Kumar& Shalendra Pratap Singh carried outdifferent tests to study the influence of various
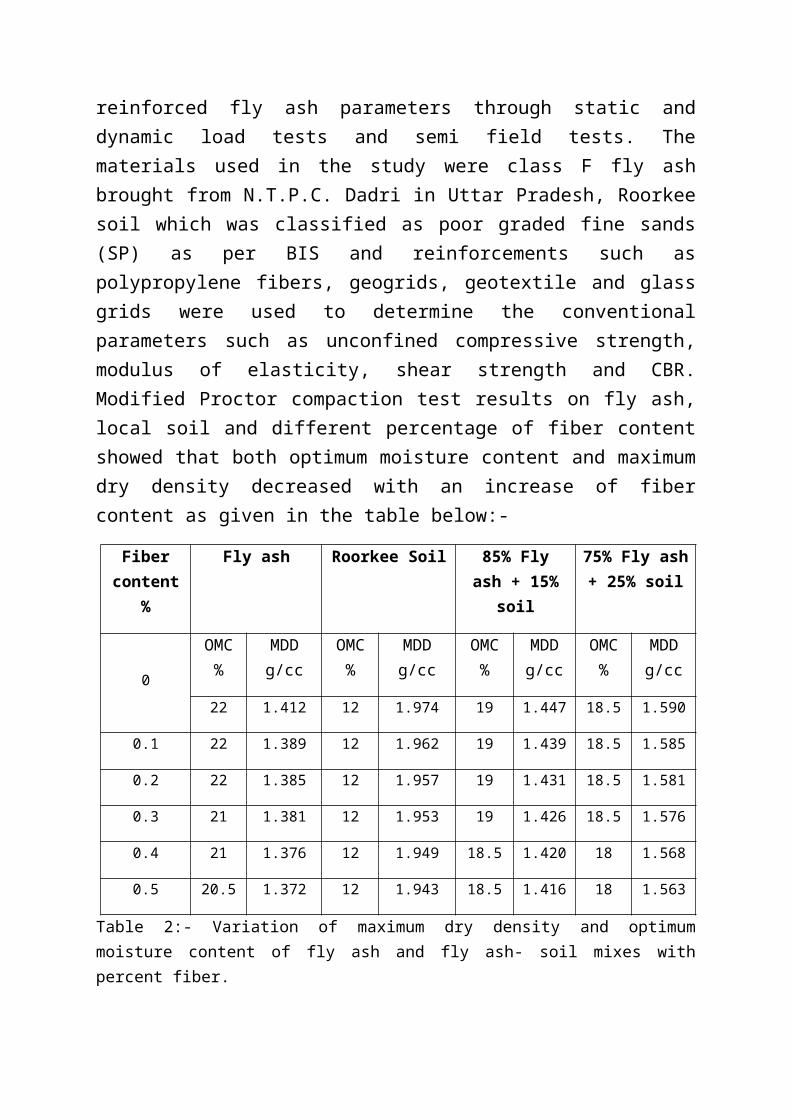
reinforced fly ash parameters through static anddynamic load tests and semi field tests. Thematerials used in the study were class F fly ashbrought from N.T.P.C. Dadri in Uttar Pradesh, Roorkeesoil which was classified as poor graded fine sands(SP) as per BIS and reinforcements such aspolypropylene fibers, geogrids, geotextile and glassgrids were used to determine the conventionalparameters such as unconfined compressive strength,modulus of elasticity, shear strength and CBR.Modified Proctor compaction test results on fly ash,local soil and different percentage of fiber contentshowed that both optimum moisture content and maximumdry density decreased with an increase of fibercontent as given in the table below:-
Fibercontent
%
Fly ash Roorkee Soil 85% Flyash + 15%
soil
75% Fly ash+ 25% soil
0
OMC%
MDDg/cc
OMC%
MDDg/cc
OMC%
MDDg/cc
OMC%
MDDg/cc
22 1.412 12 1.974 19 1.447 18.5 1.590
0.1 22 1.389 12 1.962 19 1.439 18.5 1.585
0.2 22 1.385 12 1.957 19 1.431 18.5 1.581
0.3 21 1.381 12 1.953 19 1.426 18.5 1.576
0.4 21 1.376 12 1.949 18.5 1.420 18 1.568
0.5 20.5 1.372 12 1.943 18.5 1.416 18 1.563
Table 2:- Variation of maximum dry density and optimummoisture content of fly ash and fly ash- soil mixes withpercent fiber.
Unconfined compressive strength (UCS) tests showedthat strength at failure increases with increase infiber reinforcement. At aspect ratio 100, thestrength increased from 1.62 kg/cm2 to 2.43 kg/cm2
with an increment in fiber content from 0.1 % to0.4%. It was concluded that the improvement inunconfined compressive strength is due to skinfriction between fiber and fly ash.
Triaxial tests were conducted to study the behaviourof reinforced fly ash and soil-fly ash mixtures. Itwas found that deviator stress at failure increasedmore with increase in fiber content upto 0.3 % at aparticular cell pressure after which the gain indeviator stress reduced. It was concluded that theincrease in deviator stress may be due to sheartransfer mechanism, which has been induced by theinclusion of fibers. It was further concluded thatdeviator stress were increased with increase inaspect ratio linearly up to 100, after that it becamenon-linear. However, gain in strength is lower forthe aspect ratio greater than 100.

Fig 2:- Variation of Failure Stress with % fiber Fig3:- Deviator Stress at different fiber content in UCS teston fly ash content of flyash with AR 100
CBR tests were conducted and it was observed thatvalues of fly ash, fly ash +15% soil and fly ash +25% soil were less than 15% which is required inrural road sub-bases and hence reinforcement was mustin fly ash.
Material Soaked UnsoakedFly ash 8.5% 20.2%
Fly ash + 15%soil
10.2% 23.2%
Fly ash + 25%soil
14.6% 29.6%

Table 3:- CBR value of fly ash
It was found that CBR of fly ash increased withincrease in percentage of fiber content at aparticular aspect ratio as shown in the table below;but increments were more up to 0.3% fiber content.
Aspectratio
60 60 80 80 100 100 120 120
Fibercontent
Soaked
Un-soaked
Soaked
Un-soaked
Soaked
Un-soaked
Soaked
Un-soaked
0.1 9.7 23.6 10.2 26.8 11.9 30.7 12.3 31.90.2 15.4 26.4 17.2 30.2 19.5 33.4 20.6 34.60.3 19.1 30.3 21.8 34.4 24.3 38 25.6 39.50.4 22.9 33.6 25.2 37.8 27.6 42.6 28.7 43.90.5 26.8 39.8 29.5 43.6 31.8 47.7 32.2 48.5
Table 4:- Variation of CBR value of fly ash with fiber content
Felix N. Okonta et al. carried out research oncompaction and strength of lime-fly ash stabilizedcollapsible residual sand. The materials used werefreshly quartered samples of Berea sand mixed with 4%and 8% lime as stabilizers and 0%, 6%, 12% and 18%fly ash as additive by weight of the dry soil; whichwere compacted and cured for 7 days, 28 days and 56days. At different stages of curing, some sampleswere tested to determine their Unconfined CompressionStrength (UCS) and California Bearing Ratio (CBR).The UCS results are given as follows:-
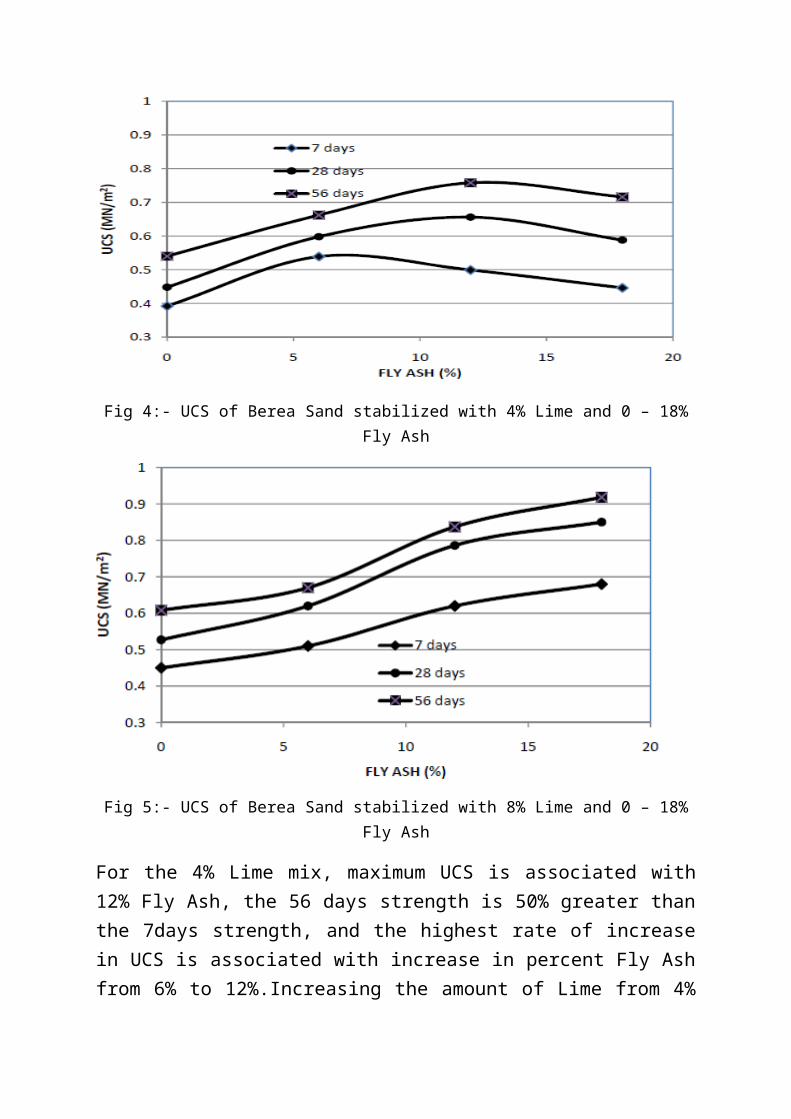
Fig 4:- UCS of Berea Sand stabilized with 4% Lime and 0 – 18%Fly Ash
Fig 5:- UCS of Berea Sand stabilized with 8% Lime and 0 – 18%Fly Ash
For the 4% Lime mix, maximum UCS is associated with12% Fly Ash, the 56 days strength is 50% greater thanthe 7days strength, and the highest rate of increasein UCS is associated with increase in percent Fly Ashfrom 6% to 12%.Increasing the amount of Lime from 4%
to 8% result in increase in UCS with increasingamount of Fly Ash for the curing periods adopted.
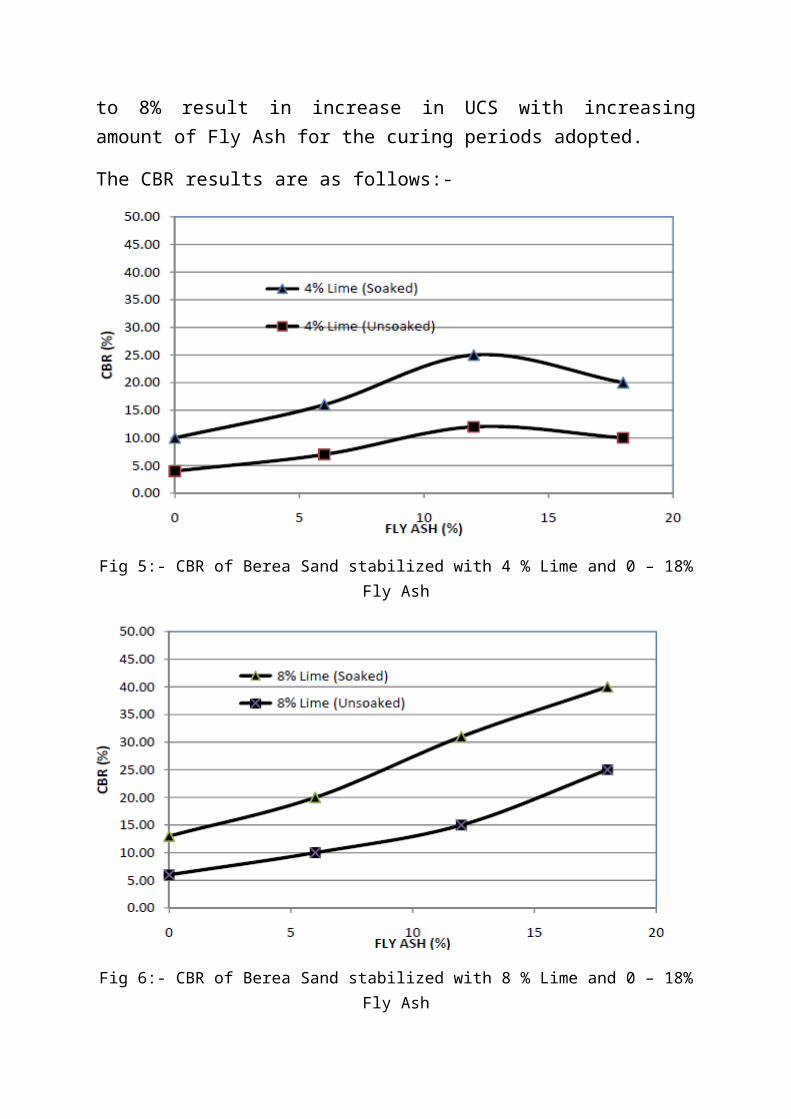
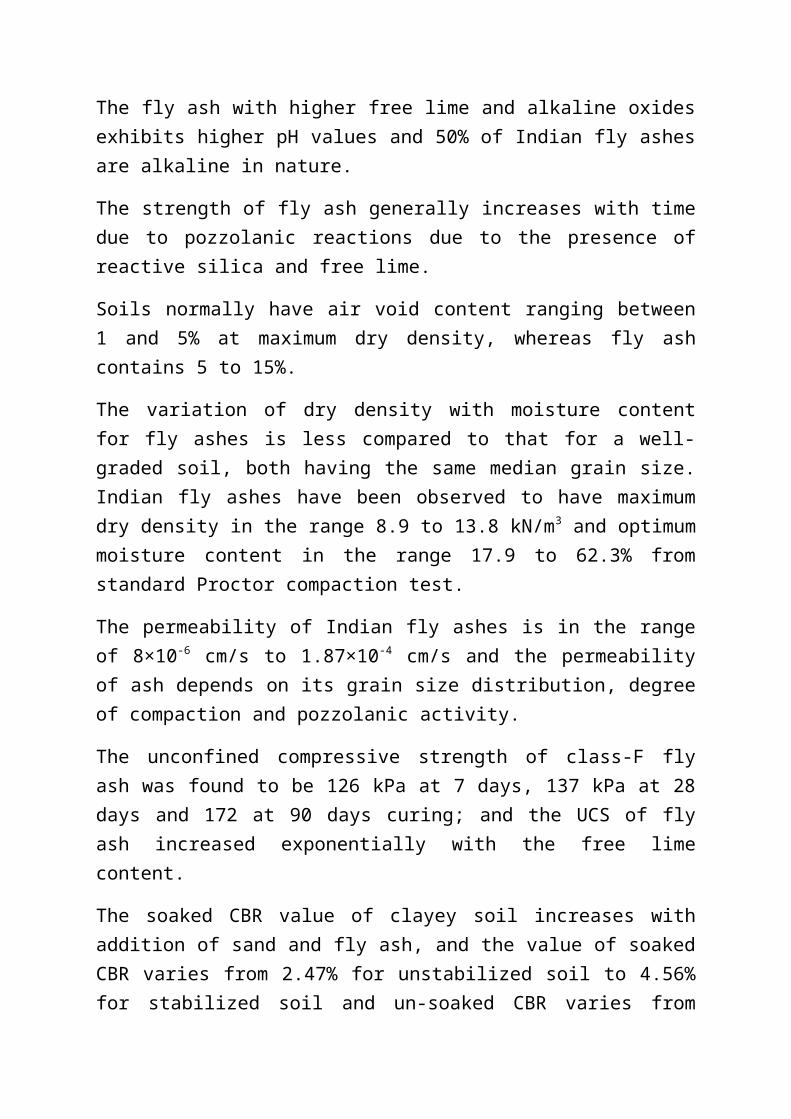
The CBR results are as follows:-
Fig 5:- CBR of Berea Sand stabilized with 4 % Lime and 0 – 18%Fly Ash
Fig 6:- CBR of Berea Sand stabilized with 8 % Lime and 0 – 18%Fly Ash

The CBR of samples with 4% lime that were testedafter seven days of soaking increases with theaddition of Fly Ash up to 12%, above which the valuebegins to decrease, while the result of the 8% Limemixes shown in Fig. 6 indicate continuous increase inCBR with the addition of Fly ash. For the respectivepercentages of Fly ash additives, the CBR of the 8 %Lime mixes is higher than that of the 4% Lime mixes.
2.3 SUMMARY OF LITERATURE REVIEW
The specific gravity of Indian fly ashes varies inthe range of 1.46-2.66 and the variation results dueto the combination of many factors such as gradation,particle shape and chemical composition.
The major crystalline constituents of low calcium flyash (CaO < 5%) are quartz and mullite, whereas high-calcium fly ash (CaO > 15%) consists of quartz, C3A,CS and C4AS.
The fly ash with higher free lime and alkaline oxidesexhibits higher pH values and 50% of Indian fly ashesare alkaline in nature.
The strength of fly ash generally increases with timedue to pozzolanic reactions due to the presence ofreactive silica and free lime.
Soils normally have air void content ranging between1 and 5% at maximum dry density, whereas fly ashcontains 5 to 15%.
The variation of dry density with moisture contentfor fly ashes is less compared to that for a well-graded soil, both having the same median grain size.Indian fly ashes have been observed to have maximumdry density in the range 8.9 to 13.8 kN/m3 and optimummoisture content in the range 17.9 to 62.3% fromstandard Proctor compaction test.
The permeability of Indian fly ashes is in the rangeof 8×10⁻⁶ cm/s to 1.87×10⁻⁴ cm/s and the permeabilityof ash depends on its grain size distribution, degreeof compaction and pozzolanic activity.
The unconfined compressive strength of class-F flyash was found to be 126 kPa at 7 days, 137 kPa at 28days and 172 at 90 days curing; and the UCS of flyash increased exponentially with the free limecontent.
The soaked CBR value of clayey soil increases withaddition of sand and fly ash, and the value of soakedCBR varies from 2.47% for unstabilized soil to 4.56%for stabilized soil and un-soaked CBR varies from

5.59% for unstabilized soil to 7.61% for stabilizedsoil.
Modified Proctor compaction test results on fly ash,local soil and different percentage of fiber contentshowed that both optimum moisture content and maximumdry density decreased with an increase of fibercontent.
Unconfined compressive strength (UCS) tests onreinforced fly ash showed that strength at failureincreases with increase in fiber reinforcement. Ataspect ratio 100, the strength increased from 1.62kg/cm2 to 2.43 kg/cm2 with an increment in fibercontent from 0.1 % to 0.4%.
Triaxial tests were conducted on reinforced fly ashand soil-fly ash mixtures. It was found that deviatorstress at failure increased more with increase infiber content upto 0.3 % at a particular cellpressure after which the gain in deviator stressreduced.
Soaked CBR tests of fly ash, fly ash + 15% soil, andfly ash +25% soil gave results of 8.5%, 10.2%, and14.6% respectively while unsoaked CBR test resultswere 20.2%, 23.2%, and 29.6%. It was also found thatCBR of fly ash increased with increase in percentageof fiber content at a particular aspect ratio; butincrements were more up to 0.3% fiber content.
The UCS of Berea sand with 4% lime, and 12% fly ashcured for 7 days gave result of 0.51 MN/m2; while the56 days strength was 0.76 MN/m2 which was 50% greater

than 7 days strength. With increasing the amount ofLime from 4% to 8% result in increase in UCS withincreasing amount of Fly Ash for the curing periodsadopted.
The soaked CBR test of samples with 4% lime and 12%fly ash gave result of 25% while the unsoaked CBRtest gave result of 14%. Similarly, the soaked CBRtest of samples with 8% lime and 12% fly ash gaveresult of 32% while unsoaked CBR test gave result of15% and the value kept on increasing with an increasein fly ash content.
3. OBJECTIVE AND SCOPE OF WORK
3.1 OBJECTIVE:
To study the effect of lime stabilizer with or without fly ash on conventional pavement/embankment materials.
3.2 SCOPE OF WORK:
1. To fulfil the above objective the different typesof materials to be collected are as follows:-
Soil- Moorum, sand, clay/silt Additive- Fly ash
Stabilizer- Lime
2. Preparation of different samples with varyingcontents such as lime, moorum, sand, clay/silt andfly ash.
3. To conduct routine tests on all materials/samples.
4. To conduct Proctor compaction test andconsequently Triaxial/UCS test.
5. Analysis of results:-
To compare with standard published value To find the optimum proportioning
4. REFERENCE
Yudhbir, and Honjo, Y. (1991): “Application of Geotechnical Engineering to Environmental Control”, Theme lecture 5, 9 ARC Bangkok, Thailand, Vol.2, 431-469.
Kumar, V. (2006): “Fly ash: A resource for sustainable development’, Proc. of the International Coal Congress & Expo, 191-199.
Pandian, N.S. (2004): “Fly Ash Characterization with reference to Geotechnical Applications”, Journal of Indian Institute of Science, Vol. (84), 189-216.
Pandian, N.S. and Balasubramonian, S. (1999): “Permeability and consolidation behavior of fly ashes”, Journal of Testing and Evaluation, JTEVA, Vol. (27),No.5, 337-342.
Gray, D.H and Lin, Y.K. (1972): “Engineering properties of compacted Fly Ash”, Proceedings, ASCE, Journal of the SMFE, Vol.98, No.SM4, pp: 361-380.
http://ethesis.nitrkl.ac.in/2460/1/ B.tech_thesis_by_manas_Kumar_Sahoo,107MN017.pdf
Arora S. and Aydilek A.H., Class F fly-ash-amended soils as highway base materials, Journal of Materials in Civil Engg. ASCE 17 (2005): pp. 640-649.
ASTM, Specification for coal fly ash and raw or calcined natural pozzolan for use in concrete. in: Annual book of ASTM standards, concrete and aggregates, American. Society for Testing Materials, Philadelphia, vol. 04.02. C618-08, 2008.
Chugh Y.P. and Mohanty S., A field demonstration of an unstabilised F-Fly ash-based road subbase, in Proc. of Fly ash India 2005, Fly ash Utilisation Programme, TIFAC, DST, New Delhi, 2005, pp. VIII 3.1-3.16.
Das S.C. and Prakashi S., Behaviour of lime stabilized Titagarh PFA through laboratory tests,IE (I). Journal of civil, 70 (1990): pp. 181-186.
Das S.K. and Yudhbir, Geotechnical properties of low calcium and high calcium flyash, Journal of Geotechnical and Geological Engineering, 24 (2006): pp. 249-263.
Ghosh A. and Subbarao C., Hydraulic conductivity and leachate characteristics of stabilized fly ash, Journal of Environmental Engg., ASCE, 124 (1998): pp. 812-820.
Mishra M.K. and Rao K.U.M., Geotechnical Characterisation of Fly ash Composites for Backfilling Mine Voids. Journal of Geotech and Geol Engg., 24 (2006): pp. 1749-1765.
Pandian N. S., Rajasekhar C. and Sridharan A.,(1995). Fly ash-lime systems for the retention oflead ions, in: Proc. of Indian Geotechnical conference, Bangalore, 1 (1995): pp.219-222.
Prabakar J., Dendorkar N. and Morchhale R.K., Influence of fly ash on strength behavior of typical soils, Journal of Construction and Building Materials, 18 (2004): pp.263-267.
Sen Gupta J., Characterization of Indian coal ashand its utilization as building material, in: Proc. Int. Conf. on Environmental Impact of Coal Utilization from Raw Materials to Waste Resources(K. C. Sahu, ed.), Indian Institute of Technology, Bombay, 1991: pp.165-184.
Siddharthan R., Norris G.M. and Epps J.A., Use ofFWD data for pavement material characterization and performance, Journal of Transport Engg., ASCE, 117 (1991): pp.660-678.
Sridharan A. and Prakash K., Geotechnical Engineering Characterization of Coal Ashes, 1st ed., S.K. Jain for CBS Publishers, New Delhi, 2007.
http://ethesis.nitrkl.ac.in/4463/1/ Ph.D_Thesis__Banita_Behera__modified.pdf

http://www.irc.org.in/ENU/knowledge/archive/ Technical%20Papers%20for%20Irc%20Journals/Reinforced%20Fly%20Ash%20Sub-Bases%20in%20Rural%20Roads.pdf
ASTM E 1861, Structural Guide for the Use of Coal Combustion By- Products in Structural Fills, American Society for Testing and Materials, West Conshohocken, Pennsylvania
http://www.ijirset.com/upload/february/23_Comparative %20Study.pdf