CHAPTER 1 Tension and Compression 1.1 Internal Effects of ...
Upload
khangminh22Category
view
0download
0
01-Oct-18
1
CB251 Testing of materials
Tension TestDr. Karim Helmy
Universal Testing Machine
Fixed head
Movable head

01-Oct-18
2
Tension Test Specimens
Tension Test Setup
Wedge gripsElectrical resistance strain gauge

01-Oct-18
3
Test Data
• Record Load and extension, either manually or automatically
• Either the load – extension or stress-strain curves are plotted and useful data are obtained from the curves regarding the material properties and behavior
Stress Strain Curve (Mild Steel)
σpl
σel
σY

01-Oct-18
4
Engineering Stress & True Stress
• Engineering stress– Force divided by the original area of cross section
(F/A0)
• True stress– Force divided by the smallest area at that load
(F/Amin)– After necking the dimensions for the smallest area
must be measured during the test
True stress
• Before necking Amin could be calculated assuming constant volume
• 𝐴 𝐿 = 𝐴𝐿
• 𝜎 = =
• 𝜎 =∆
= +∆
• 𝜎 = 1 +∆
= 𝜎(1 + 𝜖)
01-Oct-18
5
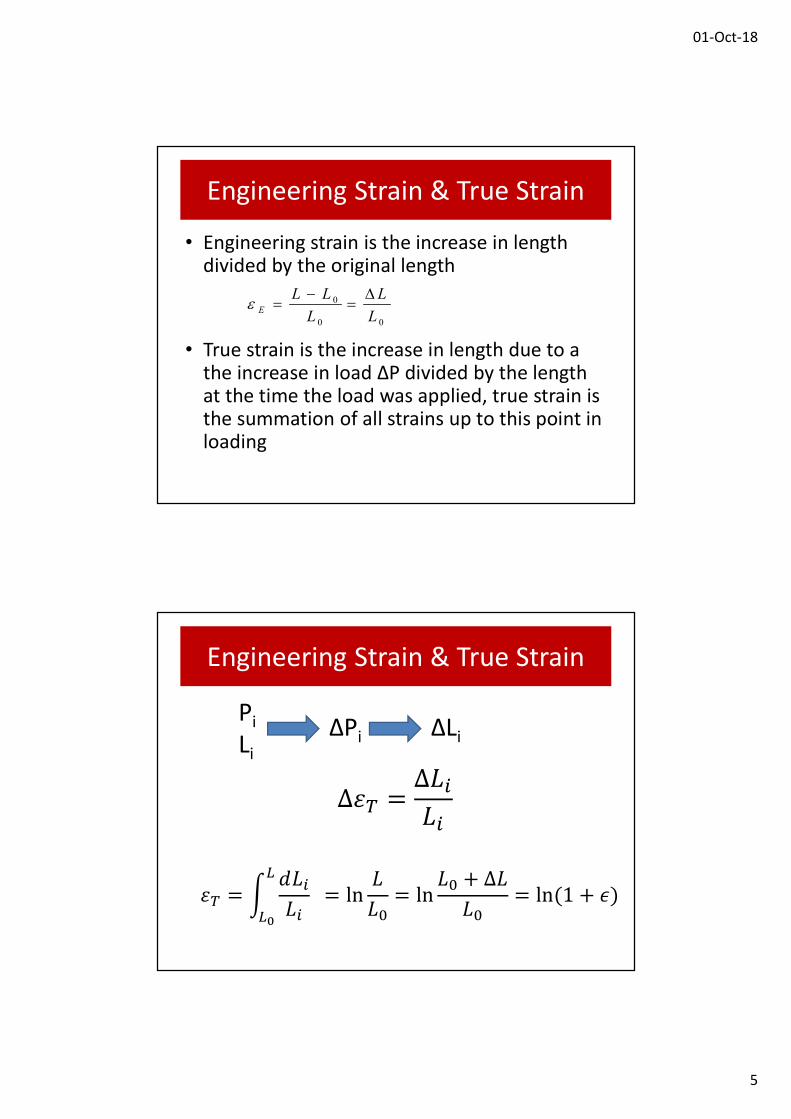
Engineering Strain & True Strain
• Engineering strain is the increase in length divided by the original length
• True strain is the increase in length due to a the increase in load ΔP divided by the length at the time the load was applied, true strain is the summation of all strains up to this point in loading
00
0
L
L
L
LLE
Engineering Strain & True Strain
PiLi
ΔPi ΔLi
𝜀 =𝑑𝐿
𝐿 = ln
𝐿
𝐿= ln
𝐿 + ∆𝐿
𝐿= ln(1 + 𝜖)

01-Oct-18
6
Engineering Stress-Strain curve Vs.True Stress-Strain curve
Types of Materials (Ductile)
σ
ε
σ
ε

01-Oct-18
7
Types of Materials (Semi-ductile)
σ
ε
σ
ε
Types of Materials (Brittle)
% Elongation < 5%σ
ε
σ
ε

01-Oct-18
8
Information Obtained From Tension Tests
• Percentage elongation– ΔLf/L0 x 100– Gives an indication to the ductility of the material
• Area reduction
– × 100
– Can also be used as an indication of material ductility• Strength
– Ultimate strength σU- maximum force per cross section area.– Yield strength σY- force at yield point per cross section area.
Information Obtained From Tension Tests
• Stiffness resistance of material to deform under load while in elastic state.– Stiffness is usually measured by the Modulus of
Elasticity “E” (E=σ/ε) Within the Elastic range

01-Oct-18
9
Modulus of Elasticity Types
Initial Modulus EiTangent Modulus Et
Secant Modulus Es
Et
Es
Ei
Resilience
• The ability of a material to absorb energy when deformed elastically and to return it when unloaded
• Energy is the product of force and displacement
el
r LPU0

01-Oct-18
10
ResilienceP
ΔLΔLel
Pel
Ur
elelr LPU 2
1
Modulus of Resilience
• Is the amount of energy that could be absorbed elastically by the material per unit of volume
elelel
r LA
LP
V
LPu
000
EEEu Yelel
elelelr
22
2
1
2
1
2
1
2
1
01-Oct-18
11
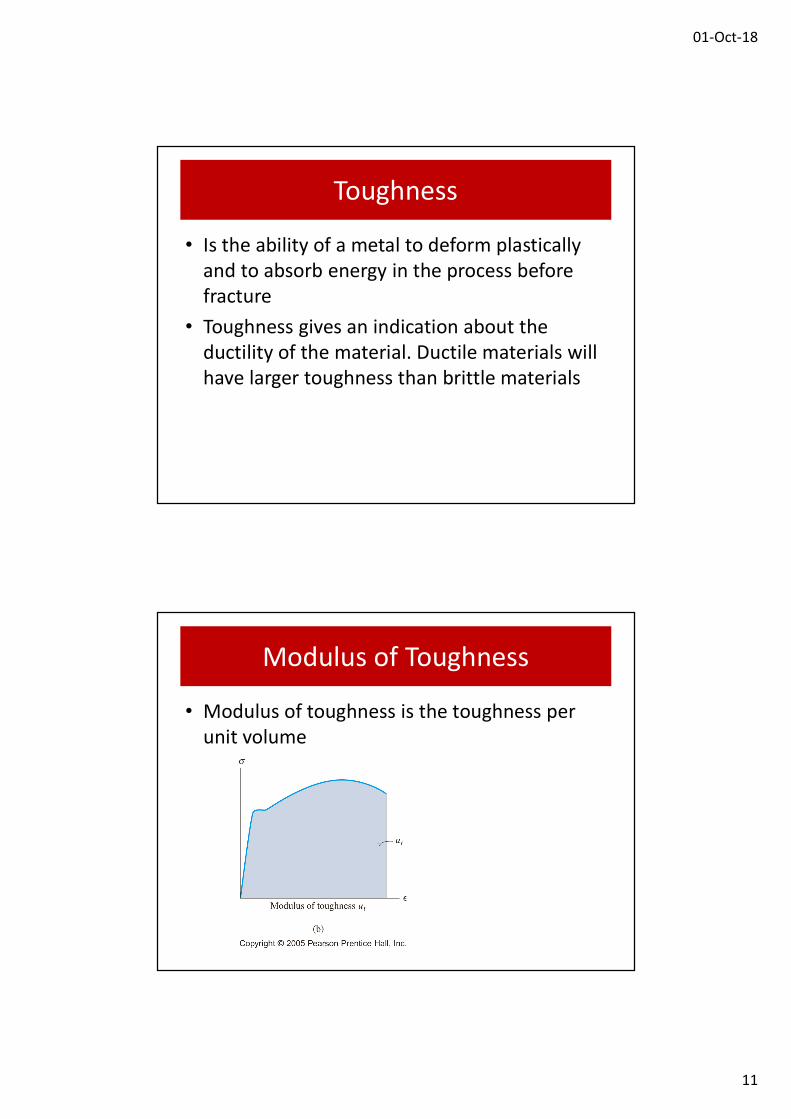
Toughness
• Is the ability of a metal to deform plastically and to absorb energy in the process before fracture
• Toughness gives an indication about the ductility of the material. Ductile materials will have larger toughness than brittle materials
Modulus of Toughness
• Modulus of toughness is the toughness per unit volume

01-Oct-18
12
Resilience and ToughnessLoad -deformation curve
Resilience Area under curve up to the elastic limit (yield point is normally used because the elastic limit is usually hard to determine)
ToughnessArea under the entire curve
Stress - strain curve
Modulus of Resilience Area under curve up to the elastic limit (yield point is normally used because the elastic limit is usually hard to determine)
Modulus of ToughnessArea under the entire curve
÷ volume
x volume
Strain Hardening

01-Oct-18
13
Proof Stress
• For materials with no definite yield point the proof stress is used instead
• The stress that will cause a specified small, permanent extension of a tensile test piece (0.1-0.2%)
• Commonly the stress to produce 0.2% extension for steel
Proof Stress
Proof Stress σY

01-Oct-18
14
Effect of Carbon Content
Effect of Temperature
σ
ε
Temperature increase
Increase in tmperature above 250 causes increase in

01-Oct-18
15
Effect of Test Speed
• Increasing the rate of loading increases the strength and decreases the ductility for ductile materials while having no effect on brittle materials
Failure Shapes
Ductile cup and cone failureSemi ductile shorter neck
Brittle failure

01-Oct-18
16
Failure ShapesBrittle Semi ductile Ductile
Commercial tension test
• May not be fully Instrumented test• For materials with yield point yield load could be
obtained when the load fluctuates and in this case the elongation could not be measured
• For materials without yield the specimen must be instrumented at least until the specimen undergoes significant deformation beyond the proof stress, the instruments could then be removed to avoid damage at failure
• Ultimate load is recorded to obtain the ultimate stress• The percentage elongation is obtained by measuring
the length of the specimen after failure

01-Oct-18
17
Steel Specifications (2007)Steel Grade Min Yield of proof
stress (N/mm2)Min ultimate stress (N/mm2)
Min percentage elongation
240/350 240 350 20
280/450 280 450 18
360/520 360 520 12
400/600 400 600 10
Steel Specifications (2017)Steel Grade Min Yield of proof
stress (N/mm2)Min ratio of ultimate stress to yield or proof stress
Min percentage elongation
B240C-P 240 1.15 20
B240D-P 240 1.25 22
B400C-R 400 1.15 14
B400WR 400 1.15 14
B350DWR 350 1.25 17
B350DWR 400 1.25 17
B350DWR 420 1.25 16

01-Oct-18
18
Stress strain curve (Cast Iron)
Stress Strain Curve (Rubber)

01-Oct-18
19
Stress Strain Curve (Concrete)
Copyright © 2022 FDOKUMEN