Temporal variability and community composition of zooplankton at station L4 in the Western Channel:...
23
Temporal variability and community composition of zooplankton at station L4 in the Western Channel: 20 years of sampling DAMIEN ELOIRE 1,2 *, PAUL J. SOMERFIELD 1 , DAVIDV. P. CONWAY 3 , CLAUDIA HALSBAND-LENK 1 , ROGER HARRIS 1 AND DELPHINE BONNET 2 1 PLYMOUTH MARINE LABORATORY , PROSPECT PLACE, THE HOE, PLYMOUTH, DEVON PL13DH, UK, 2 LABORATOIRE ECOSYSTE ` ME LAGUNAIRE, UMR 5119, CNRS – UNIVERSITE ´ MONTPELLIER II – IRD – IFREMER, CC093, PLACE EUGE ` NE BATAILLON, 34095 MONTPELLIER CEDEX 05, FRANCE AND 3 MARINE BIOLOGICAL ASSOCIATION OF THE UNITED KINGDOM, CITADEL HILL, THE HOE, PLYMOUTH, DEVON PL12PB, UK *CORRESPONDING AUTHOR: [email protected] Received July 28, 2009; accepted in principle December 22, 2009; accepted for publication January 13, 2010 Corresponding editor: Mark J. Gibbons Zooplankton community composition and diversity have been analysed for the period 1988–2007 at the coastal station L4 off Plymouth in the Western Channel. The seasonal cycle of the total zooplankton was characterized by two peaks. The total zooplankton abundance did not show any long-term trend and its interann- ual variations were not directly related to changes in environmental conditions. However, different periods of change in total zooplankton abundance were observed that appeared to be consistently related to changes in sea surface temp- erature (SST) and wind. The number of taxa (22) contributing 80–90% of the total zooplankton abundance was consistent over the 20 years and their cumulative contribution to the community showed only small interannual variations. A signifi- cant long-term increase in species richness of the copepod community was detected and its maximum annual value was significantly related to annual average SST. There was evidence of long-term changes: numbers of Oncaea spp., Cirripede larvae, Calanus helgolandicus and Chaetognaths have increased, whereas numbers of Pseudocalanus elongatus, Temora longicornis, Acartia clausi, Evadne nordmanni, Appendicularians, Podon spp. and Ctenocalanus vanus have decreased. The use of indicator species to monitor hydroclimatic changes in the Western Channel is discussed. KEYWORDS: zooplankton; community structure; long-term series; L4; Western Channel INTRODUCTION The importance of zooplankton for marine ecosystem functioning is widely recognized and zooplankton long- term series ( .10 years) provide crucial information to better understand ecosystem dynamics and make global comparisons in order to tackle key issues such as climate change (Perry et al., 2004; Richardson, 2008). Since 1988, a plankton time series has been maintained at the monitoring station L4 in the Western Channel off Plymouth (UK), a region with both cold temperate and warm temperate species and where a large number of historical studies have been carried out (Southward doi:10.1093/plankt/fbq009, available online at www.plankt.oxfordjournals.org. Advance Access publication February 18, 2010 # The Author 2010. Published by Oxford University Press. All rights reserved. For permissions, please email: [email protected] JOURNAL OF PLANKTON RESEARCH j VOLUME 32 j NUMBER 5 j PAGES 657 – 679 j 2010 at Plymouth Marine Laboratory on April 13, 2010 http://plankt.oxfordjournals.org Downloaded from
-
Upload
independent -
Category
Documents
-
view
0 -
download
0
Transcript of Temporal variability and community composition of zooplankton at station L4 in the Western Channel:...

Temporal variability and communitycomposition of zooplankton at station L4in the Western Channel: 20 yearsof sampling
DAMIEN ELOIRE1,2*, PAUL J. SOMERFIELD1, DAVID V. P. CONWAY3, CLAUDIA HALSBAND-LENK1, ROGER HARRIS1
AND DELPHINE BONNET2
1PLYMOUTH MARINE LABORATORY, PROSPECT PLACE, THE HOE, PLYMOUTH, DEVON PL1 3DH, UK, 2
LABORATOIRE ECOSYSTEME LAGUNAIRE, UMR 5119,CNRS – UNIVERSITE MONTPELLIER II – IRD –IFREMER, CC093, PLACE EUGENE BATAILLON, 34095 MONTPELLIER CEDEX 05, FRANCE AND
3MARINE
BIOLOGICAL ASSOCIATION OF THE UNITED KINGDOM, CITADEL HILL, THE HOE, PLYMOUTH, DEVON PL1 2PB, UK
*CORRESPONDING AUTHOR: [email protected]
Received July 28, 2009; accepted in principle December 22, 2009; accepted for publication January 13, 2010
Corresponding editor: Mark J. Gibbons
Zooplankton community composition and diversity have been analysed for theperiod 1988–2007 at the coastal station L4 off Plymouth in the Western Channel.The seasonal cycle of the total zooplankton was characterized by two peaks. Thetotal zooplankton abundance did not show any long-term trend and its interann-ual variations were not directly related to changes in environmental conditions.However, different periods of change in total zooplankton abundance wereobserved that appeared to be consistently related to changes in sea surface temp-erature (SST) and wind. The number of taxa (22) contributing 80–90% of thetotal zooplankton abundance was consistent over the 20 years and their cumulativecontribution to the community showed only small interannual variations. A signifi-cant long-term increase in species richness of the copepod community wasdetected and its maximum annual value was significantly related to annualaverage SST. There was evidence of long-term changes: numbers of Oncaea spp.,Cirripede larvae, Calanus helgolandicus and Chaetognaths have increased, whereasnumbers of Pseudocalanus elongatus, Temora longicornis, Acartia clausi, Evadne nordmanni,Appendicularians, Podon spp. and Ctenocalanus vanus have decreased. The use ofindicator species to monitor hydroclimatic changes in the Western Channel isdiscussed.
KEYWORDS: zooplankton; community structure; long-term series; L4; WesternChannel
I N T RO D U C T I O N
The importance of zooplankton for marine ecosystemfunctioning is widely recognized and zooplankton long-term series (.10 years) provide crucial information tobetter understand ecosystem dynamics and make globalcomparisons in order to tackle key issues such as
climate change (Perry et al., 2004; Richardson, 2008).Since 1988, a plankton time series has been maintainedat the monitoring station L4 in the Western Channel offPlymouth (UK), a region with both cold temperate andwarm temperate species and where a large number ofhistorical studies have been carried out (Southward
doi:10.1093/plankt/fbq009, available online at www.plankt.oxfordjournals.org. Advance Access publication February 18, 2010
# The Author 2010. Published by Oxford University Press. All rights reserved. For permissions, please email: [email protected]
JOURNAL OF PLANKTON RESEARCH j VOLUME 32 j NUMBER 5 j PAGES 657–679 j 2010 at P
lymouth M
arine Laboratory on April 13, 2010
http://plankt.oxfordjournals.orgD
ownloaded from
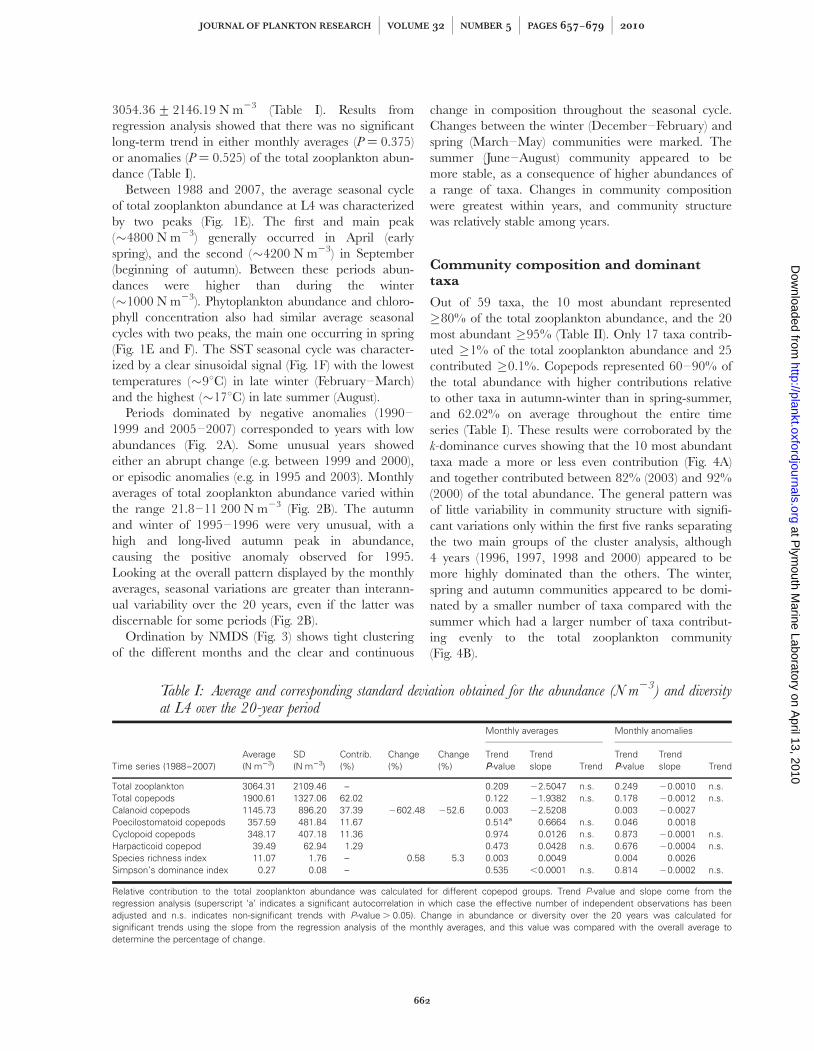
et al., 2005). Station L4, with an average depth of 55 m,is affected by highly variable meteorological conditionsand dominating wind from the south-west (Smyth et al.,2010). The station is continually affected by the tide(Pingree, 1980) and is influenced by estuarine outflowfrom Plymouth Sound and by oceanic waters from thesouth-west. The water column is weakly stratified frommid-April to September and mixed during the winter(Pingree et al., 1976, 1978; Holligan and Harbour, 1977;Holligan et al., 1984). The minimum surface tempera-ture is observed in March (9.18C), the maximum inAugust (16.48C) and a warming of around 0.68C perdecade has been seen over the last two decades (Smythet al., 2010). Spring diatom and autumn dinoflagellateblooms are the main features in the seasonal cycle ofthe phytoplankton community (Harvey et al., 1935;Widdicombe et al., 2010).
Published studies on zooplankton at L4 have focusedon particular species or groups, especially calanoidcopepods (Bautista and Harris, 1992), Calanus helgolandi-
cus (Pond et al., 1996; Irigoien and Harris, 2003; Bonnetet al., 2005; Hirst et al., 2007), Centropages typicus (Bonnetet al., 2007), but also Appendicularians (Acuna et al.,1995) and Chaetognaths (Russell, 1935; Bonnet et al.,2010), while the seasonal variation and parallel changesoccurring in the whole plankton community have beendescribed from October 1992 to January 1994(Rodrıguez et al., 2000).
In many studies, the North Atlantic Oscillation(NAO) has been suggested to be a main driver ofchanges in the plankton community of the easternNorth Atlantic Ocean and adjacent shelf-seas(Fromentin and Planque, 1996; Edwards et al., 2002;Piontkovski et al., 2006), by influencing meteorologicalconditions and affecting plankton populations directlyand/or indirectly (Beaugrand et al., 2000). Previousstudies have suggested that the NAO (Irigoien et al.,2000; Irigoien and Harris, 2003), changes in the windregime (Irigoien et al., 2000) and also advection (Russell,1935; Irigoien and Harris, 2003) can affect the planktoncommunity at L4. In addition, several studies havedemonstrated how key species can be used to monitorchanges in plankton communities at L4 and in sur-rounding regions (Russell, 1935; Southward, 1984;Villate et al., 1997; Beaugrand et al., 2002; Bonnet andFrid, 2004), for example indicating the influence ofdifferent water masses.
While previous investigations have described the tem-poral variability of some species and groups at L4, forthe first time in this paper we look in detail at seasonal,interannual and long-term variations in overall meso-zooplankton community structure and diversity over the20 years, 1988–2007, and link these variations to
environmental descriptors. The purpose of this study isto identify (i) long-term changes in zooplankton com-munity structure and (ii) environmental factors and keyspecies that might have a major role in controlling thezooplankton dynamics.
M E T H O D
Zooplankton sampling
Station L4 (508150N, 48130W) is located in coastalwaters 7.5 nautical miles (�13.9 km) south-west offPlymouth. Since March 1988, zooplankton sampleshave been collected weekly, weather permitting, by ver-tical net hauls from the sea floor to the surface using aWP2 net with a mesh-size of 200 mm and a mouth areaof 0.25 m2 (UNESCO, 1968). Two hauls are succes-sively taken at approximately mid-morning and thesamples are preserved and stored in 5% formalin.Zooplankton are later sub-sampled, counted and ident-ified under a microscope in the laboratory. Subsamplesare extracted using a Folsom splitter and a Stempelpipette, to identify separately large and small organisms.Subsamples contain around 200–400 individuals.Abundances in the two hauls taken on each samplingdate are averaged to reduce the variability related to thesampling. Abundance is expressed as numbers of organ-isms per cubic meter (N m23).
The entire set of zooplankton samples is stored at thePlymouth Marine Laboratory and available for furthertaxonomic analysis. The complete zooplanktonabundance data set, as well as graphical displays ofthe temporal variations of the different species andgroups identified, are available on the Western ChannelObservatory website: http://www.westernchannelobservatory.org.uk/. Zooplankton identification is to thelowest taxonomic level possible, but some groups, mero-plankton in particular, are only identified to major taxo-nomic groups. The dominant copepods are generally welldiscriminated to genus or species levels and to life-historystages for species of particular interest, such as Calanus
helgolandicus.
Additional data
Other environmental and biological measurements aretaken simultaneously with the zooplankton sampling.Sea surface temperature (SST in 8C) has been measuredsince the beginning of the time series using amercury-in-glass thermometer immersed in a stainlesssteel bucket of surface water.
JOURNAL OF PLANKTON RESEARCH j VOLUME 32 j NUMBER 5 j PAGES 657–679 j 2010
658
at Plym
outh Marine Laboratory on A
pril 13, 2010 http://plankt.oxfordjournals.org
Dow
nloaded from

Since 1992, sea surface water samples (10 m depth)collected with a Niskin bottle have been used to deter-mine abundance and biomass of phytoplankton andmicrozooplankton (Widdicombe et al., 2010), as well aschlorophyll concentrations.
Atmospheric data used in this study, wind speed (inm s21) and direction from West to East (W/E) andSouth to North (S/N), are part of the ECMWFERA-40 Re-Analysis data available from http://badc.nerc.ac.uk/data/ecmwf-e40/ and were provided by theEuropean Centre for Medium-Range Weather Forecasts(ECMWF 1995) through the British Atmospheric DataCentre. Raw data for the NAO index were obtainedfrom the Climatic Research Unit website (http://www.cru.uea.ac.uk/). The index is based on the differencebetween the normalized sea level pressure overGibraltar and that over Southwest Iceland. The winterNAO index is calculated by averaging the values of theNAO index from December to March (Hurrell, 1995;Beaugrand and Reid, 2003). Data for the Gulf StreamNorth Wall (GSNW) position index were obtained fromArnold Taylor’s website hosted by Plymouth MarineLaboratory (http://web.pml.ac.uk/gulfstream/). Theindex is the first principal component of the monthlymean position of the North Wall of the Gulf Stream(Taylor and Stephens, 1980).
Data manipulation
The level of taxonomic analysis has generally been con-sistent over the 20 years, owing to the restricted numberof analysts who have counted the L4 samples. Only forcopepods and cladocerans has identification to genus orspecies level been consistent, and all the other zooplank-ton species have been recorded as broad taxonomicgroups. Nevertheless, a taxonomic homogenization ofthe data set was undertaken to ensure data consistency. Ataxonomic list of the 243 species and groups identifiedsince the beginning of the time series was created, withinformation on 19 taxonomic levels, from kingdom tolife-history stages (e.g. male, female, adult, juvenile andlarval stages). The aim of the homogenization was tokeep as much detail as possible, while respecting the con-sistency of the taxonomy. Data on certain groups such ascopepod nauplii were removed, as they were too small tobe accurately sampled. For each species or group, theminimum taxonomic level of identification that was con-sistent from January 1988 to December 2007 was deter-mined. Some species and groups were rare and/orunderestimated due to the sampling method used andthe expertise of the analysts, so these were pooled tohigher taxonomic levels. Following these procedures, 59distinct categories at different taxonomic levels were
retained for the analysis, of which 32 were found on �20% of the sampling dates over the entire time series.Here we use the terms “taxon” and “taxa” not in thestrict sense, but to refer to these categories which includespecies and specific groups of organisms.
Numerical and statistical analysis
Total zooplankton abundances were determined foreach month between January 1988 and December2007. Gaps occurred in January and February 1988,which were interpolated with the average abundancefor that month over the rest of the time series, andAugust 2000 which was interpolated using the averageof the previous and following month. The average sea-sonal cycle of each time series was determined usingmonthly averages over sampled years. Annual anomalieswere obtained by averaging monthly anomalies, whichin turn were calculated using monthly abundances.Monthly abundance anomalies of each month of thetime series were obtained by subtracting the overallaverage over the entire time series for a given monthfrom the observed monthly value, using the formula:
x0m;y ¼xm;y � �xm
sðxmÞ
where m is the month (m: 1 ¼ January, 2 ¼ February, . . . ,12 ¼ December) and y the year; x0m;y is the monthlyanomaly of month m in year y; xm,y is the monthly averageabundance of month m in year y; �xm is the average abun-dance and s(xm) the standard deviation, of month m overthe entire time series. Thus, a positive anomaly meansthat the observed value was higher than the overallaverage for that month, and vice versa. The ranking oftotal monthly zooplankton abundances was obtained bysorting the monthly averages over the entire time seriesrather than within each year, meaning that each monthwas ranked without reference to the year in which itoccurred.
Variations in zooplankton community abundanceswere analysed using a non-parametric multivariatemethod. Abundances of each taxon were averagedwithin each month of each year. Inter-sample simi-larities were calculated using the Bray–Curtis coeffi-cient and visualized using non-metric multidimensionalscaling (NMDS) ordination. This technique produces aplot in a predefined number of dimensions (in our studytwo) in which samples are represented by points, anddistances between points preserve the rank order ofsimilarities between samples in the similarity matrix(Clarke and Warwick, 2001).
D. ELOIRE ET AL. j TWENTY YEARS OF ZOOPLANKTON SAMPLING AT STATION L4
659
at Plym
outh Marine Laboratory on A
pril 13, 2010 http://plankt.oxfordjournals.org
Dow
nloaded from

The average abundance of each taxon over the entiretime series (1988–2007) was obtained using monthlyaverages. Their relative contribution to the total zoo-plankton was calculated and then used to determine theranking of each taxon and the cumulative sum of thepercentage of the total zooplankton abundance at eachrank. Trends for the monthly anomalies and averageswere obtained by applying a type I linear model. Priorto testing the significance of the trend slope, a Durbin–Watson test to detect autocorrelation in the residuals ofthe regression analysis was performed (MacKenzie andKoster, 2004). When autocorrelation was present, theeffective number of independent values used in the sig-nificance testing was adjusted using the formula:
neff � nt1� r1
1þ r1
where neff is the effective number of independentobservations; nt is the total number of observations andr1 is the lag-1 temporal autocorrelation coefficient(Quenouille, 1952; Pyper and Peterman, 1998; Santeret al., 2000). Finally, a Student’s t-test was used to deter-mine whether the slope of the linear model was signifi-cantly different from 0. For each significant trend (P �0.05), the overall change over the 20-year period wasestimated and then compared to the overall average,using the slope from the regression analysis of themonthly averages.
Correlation between time series was investigatedusing the Spearman rank correlation coefficient r, againadjusted to account for autocorrelation. The effectivenumber of independent observations was adjusted whennecessary using the formula:
neff � ntð1þ 2r1r01 þ 2r2r02 þ � � �Þ
where neff is the effective number of independentobservations; nt is the total number of observations; r1and r01 are the lag-1 temporal autocorrelation coefficientof the two series, r2 and r02 are the lag-2 autocorrelationsof the two series, and so on (Quenouille, 1952; Hayset al., 1993; Pyper and Peterman, 1998).
The dominance structure of the zooplankton com-munity was described using k-dominance curves, wherethe cumulative percentage of each taxon is plottedagainst its respective rank (Lambshead et al., 1983;Clarke, 1990). A cluster analysis, using the groupaverage linkage method, was applied to a matrix ofdifferences between dominance curves. The most domi-nant taxa were defined as those that appeared at leastonce in the top 10 of the monthly relative contribution
ranking. Using this definition, the 22 most dominanttaxa were selected and their relative contributions to thetotal zooplankton community were calculated for eachmonth and year. Ranking of the monthly abundanceswas achieved by sorting the time series of monthlyaverages of the abundances of each dominant taxon.
Two diversity indices, species richness and Simpson’sdominance index, referred to here as richness index andSimpson index, respectively, were calculated using abun-dances of the species or genera of copepods. We usedthis restricted group because including wide taxonomiccategories (e.g. Appendicularians and Chaetognaths) willnot represent the complexity of the community and maybias the estimation of diversity indices. The two indiceswere calculated for each sample date using the followingequations:
Richness index:
S ¼XS
i¼1
n0i
Simpson index:
l ¼XS
i¼1
niðni � 1ÞSðS � 1Þ
where ni is the number of individuals found in the i-thtaxon and S is the total number of taxa in the sample.The average seasonal cycle, the monthly ranking,annual anomalies and trends were estimated for eachdiversity index.
The cumulative sums technique was used to detectlocal changes in the annual average of each biological andenvironmental factor. This simple method also allows anassessment of the intensity and duration of these changes(Ibanez et al., 1993, Beaugrand et al., 2003, Conversi et al.,2009). A reference value, here the overall average of thetime series, is subtracted from each value in the originaltime series to produce a new time series of residuals.These are then progressively pooled, each element beingsummed to the previous, to calculate the cumulative sum.
R E S U LT S
Total zooplankton abundance
The monthly averages of total zooplankton abundancewere highly variable between 1988 and 2007 (Fig. 1A).Temporal variations did not show any clear long-termpattern; however, a seasonal signal of a 1-year periodwas discernable. The overall average abundance was
JOURNAL OF PLANKTON RESEARCH j VOLUME 32 j NUMBER 5 j PAGES 657–679 j 2010
660
at Plym
outh Marine Laboratory on A
pril 13, 2010 http://plankt.oxfordjournals.org
Dow
nloaded from

Fig. 1. Monthly average time series (A–D) and seasonal cycle (E and F) of total zooplankton, total phytoplankton, chlorophyll and SST.
D.
EL
OIR
EE
TA
L.j
TW
EN
TY
YE
AR
SO
FZ
OO
PL
AN
KT
ON
SA
MP
LIN
GA
TS
TA
TIO
NL
4
661
at Plymouth Marine Laboratory on April 13, 2010 http://plankt.oxfordjournals.org Downloaded from
3054.36+ 2146.19 N m23 (Table I). Results fromregression analysis showed that there was no significantlong-term trend in either monthly averages (P ¼ 0.375)or anomalies (P ¼ 0.525) of the total zooplankton abun-dance (Table I).
Between 1988 and 2007, the average seasonal cycleof total zooplankton abundance at L4 was characterizedby two peaks (Fig. 1E). The first and main peak(�4800 N m23) generally occurred in April (earlyspring), and the second (�4200 N m23) in September(beginning of autumn). Between these periods abun-dances were higher than during the winter(�1000 N m23). Phytoplankton abundance and chloro-phyll concentration also had similar average seasonalcycles with two peaks, the main one occurring in spring(Fig. 1E and F). The SST seasonal cycle was character-ized by a clear sinusoidal signal (Fig. 1F) with the lowesttemperatures (�98C) in late winter (February–March)and the highest (�178C) in late summer (August).
Periods dominated by negative anomalies (1990–1999 and 2005–2007) corresponded to years with lowabundances (Fig. 2A). Some unusual years showedeither an abrupt change (e.g. between 1999 and 2000),or episodic anomalies (e.g. in 1995 and 2003). Monthlyaverages of total zooplankton abundance varied withinthe range 21.8–11 200 N m23 (Fig. 2B). The autumnand winter of 1995–1996 were very unusual, with ahigh and long-lived autumn peak in abundance,causing the positive anomaly observed for 1995.Looking at the overall pattern displayed by the monthlyaverages, seasonal variations are greater than interann-ual variability over the 20 years, even if the latter wasdiscernable for some periods (Fig. 2B).
Ordination by NMDS (Fig. 3) shows tight clusteringof the different months and the clear and continuous
change in composition throughout the seasonal cycle.Changes between the winter (December–February) andspring (March–May) communities were marked. Thesummer (June–August) community appeared to bemore stable, as a consequence of higher abundances ofa range of taxa. Changes in community compositionwere greatest within years, and community structurewas relatively stable among years.
Community composition and dominanttaxa
Out of 59 taxa, the 10 most abundant represented�80% of the total zooplankton abundance, and the 20most abundant �95% (Table II). Only 17 taxa contrib-uted �1% of the total zooplankton abundance and 25contributed �0.1%. Copepods represented 60–90% ofthe total abundance with higher contributions relativeto other taxa in autumn-winter than in spring-summer,and 62.02% on average throughout the entire timeseries (Table I). These results were corroborated by thek-dominance curves showing that the 10 most abundanttaxa made a more or less even contribution (Fig. 4A)and together contributed between 82% (2003) and 92%(2000) of the total abundance. The general pattern wasof little variability in community structure with signifi-cant variations only within the first five ranks separatingthe two main groups of the cluster analysis, although4 years (1996, 1997, 1998 and 2000) appeared to bemore highly dominated than the others. The winter,spring and autumn communities appeared to be domi-nated by a smaller number of taxa compared with thesummer which had a larger number of taxa contribut-ing evenly to the total zooplankton community(Fig. 4B).
Table I: Average and corresponding standard deviation obtained for the abundance (N m23) and diversityat L4 over the 20-year period
Time series (1988–2007)Average(N m23)
SD(N m23)
Contrib.(%)
Change(%)
Change(%)
Monthly averages Monthly anomalies
TrendPP-value
Trendslope Trend
TrendPP-value
Trendslope Trend
Total zooplankton 3064.31 2109.46 – 0.209 22.5047 n.s. 0.249 20.0010 n.s.Total copepods 1900.61 1327.06 62.02 0.122 21.9382 n.s. 0.178 20.0012 n.s.Calanoid copepods 1145.73 896.20 37.39 2602.48 252.6 0.003 22.5208 0.003 20.0027Poecilostomatoid copepods 357.59 481.84 11.67 0.514a 0.6664 n.s. 0.046 0.0018Cyclopoid copepods 348.17 407.18 11.36 0.974 0.0126 n.s. 0.873 20.0001 n.s.Harpacticoid copepod 39.49 62.94 1.29 0.473 0.0428 n.s. 0.676 20.0004 n.s.Species richness index 11.07 1.76 – 0.58 5.3 0.003 0.0049 0.004 0.0026Simpson’s dominance index 0.27 0.08 – 0.535 ,0.0001 n.s. 0.814 20.0002 n.s.
Relative contribution to the total zooplankton abundance was calculated for different copepod groups. Trend P-value and slope come from theregression analysis (superscript ‘a’ indicates a significant autocorrelation in which case the effective number of independent observations has beenadjusted and n.s. indicates non-significant trends with P-value . 0.05). Change in abundance or diversity over the 20 years was calculated forsignificant trends using the slope from the regression analysis of the monthly averages, and this value was compared with the overall average todetermine the percentage of change.
JOURNAL OF PLANKTON RESEARCH j VOLUME 32 j NUMBER 5 j PAGES 657–679 j 2010
662
at Plym
outh Marine Laboratory on A
pril 13, 2010 http://plankt.oxfordjournals.org
Dow
nloaded from
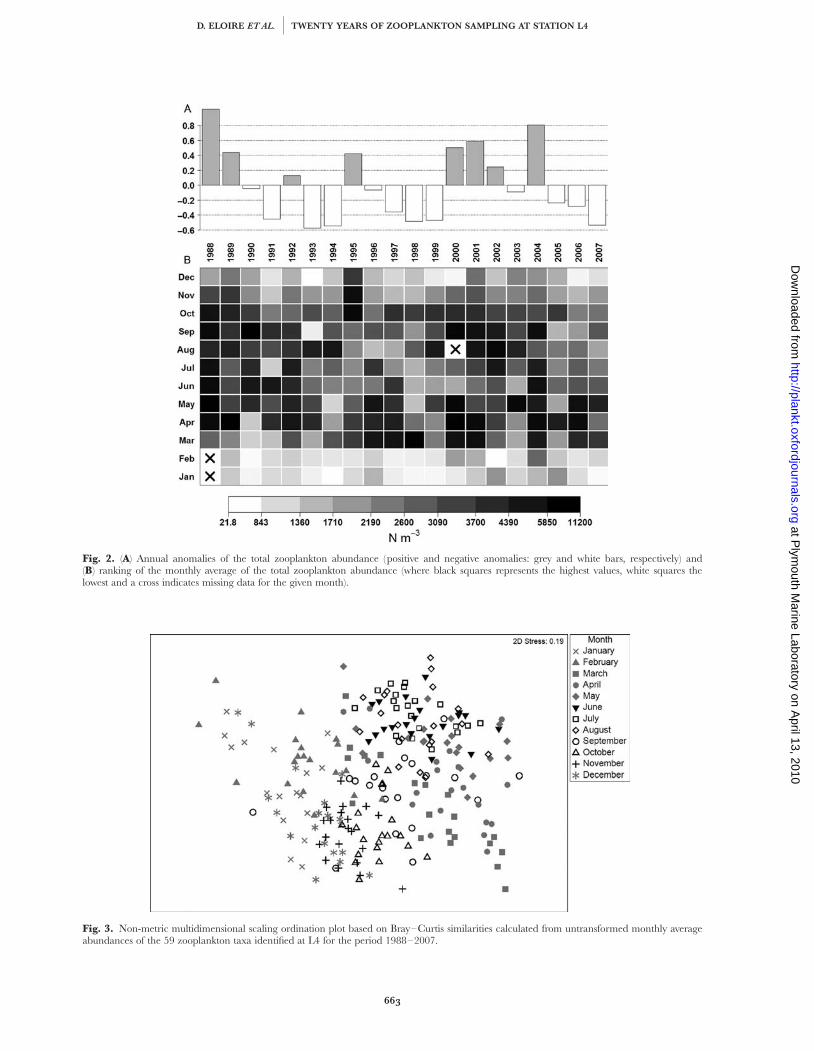
Fig. 2. (A) Annual anomalies of the total zooplankton abundance (positive and negative anomalies: grey and white bars, respectively) and(B) ranking of the monthly average of the total zooplankton abundance (where black squares represents the highest values, white squares thelowest and a cross indicates missing data for the given month).
Fig. 3. Non-metric multidimensional scaling ordination plot based on Bray–Curtis similarities calculated from untransformed monthly averageabundances of the 59 zooplankton taxa identified at L4 for the period 1988–2007.
D. ELOIRE ET AL. j TWENTY YEARS OF ZOOPLANKTON SAMPLING AT STATION L4
663
at Plym
outh Marine Laboratory on A
pril 13, 2010 http://plankt.oxfordjournals.org
Dow
nloaded from

Table II: Ranking, average abundance (N m23) and corresponding standard deviation, the relative contribution to the total zooplanktonabundance and cumulative sum of the percentage obtained for each one of the 59 taxa identified at L4 over the 20-year period
RankTaxon time series (1988–2007)
Average(N m23)
SD(N m23)
Contrib.(%)
Cum. Contrib.(%)
Change(N m23)
Change(%)
Monthly averages Monthly anomalies
TrendPP-value
Trendslope Trend
TrendPP-value
Trendslope Trend
1 Pseudocalanus elongatus 391.77 447.88 12.83 12.83 2255.85 265.3 0.011 21.0705 0.026 20.00202 Oncaea spp. 357.59 481.84 11.71 24.55 0.514a 0.6664 n.s. 0.046 0.00183 Oithona spp. 348.17 407.18 11.41 35.95 0.974 0.0126 n.s. 0.873 20.0001 n.s.4 Paracalanus parvus 341.66 372.02 11.19 47.15 0.305a 20.6034 n.s. 0.123 20.0014 n.s.5 Cirripede larvae 301.12 879.78 9.86 57.01 0.190 1.0907 n.s. 0.006 0.00256 Temora longicornis 266.31 418.87 8.72 65.74 0.057 20.7534 n.s. 0.001 20.00307 Evadne nordmanni 163.60 373.94 5.36 71.09 0.051 20.6890 n.s. 0.003 20.00278 Acartia clausi 161.63 310.92 5.29 76.39 2288.10 2178.3 ,0.001 21.2054 ,0.001 20.00549 Ditrichocorycaeus anglicus 82.72 115.40 2.71 79.10 0.517a 0.1185 n.s. 0.795 0.0002 n.s.10 Appendicularians 77.61 119.68 2.54 81.64 0.136 20.1689 n.s. 0.007 20.002411 Echinoderm larvae 76.23 228.90 2.50 84.14 0.239 0.2550 n.s. 0.622 0.0004 n.s.12 Calanus helgolandicus 71.00 88.95 2.33 86.47 41.53 58.5 0.038 0.1738 ,0.001 0.003713 Podon spp. 54.88 109.76 1.80 88.26 257.18 2104.2 0.021 20.2392 0.014 20.002214 Bivalve larvae 52.35 124.71 1.71 89.98 0.567a 0.1393 n.s. 0.408 0.0007 n.s.15 Siphonophores 50.41 77.50 1.65 91.63 0.823 20.0165 n.s. 0.427 0.0007 n.s.16 Gastropods 41.88 98.44 1.37 93.00 0.266 20.1036 n.s. 0.469 20.0007 n.s.17 Euterpina acutifrons 36.20 61.13 1.19 94.19 0.814 0.0136 n.s. 0.108 20.0015 n.s.18 Chaetognaths 30.36 43.16 0.99 95.18 23.18 76.4 0.017 0.0970 0.001 0.002919 Polychaetes 29.08 31.63 0.95 96.13 0.953 0.0017 n.s. 0.482 20.0006 n.s.20 Clausocalanus spp. 25.77 61.62 0.84 96.98 0.734 0.0198 n.s. 0.951 20.0001 n.s.21 Ctenocalanus vanus 17.80 47.68 0.58 97.56 262.80 2352.8 ,0.001 20.2628 ,0.001 20.006522 Centropages typicus 17.77 39.52 0.58 98.14 0.334 20.0362 n.s. 0.039 20.001923 Hydromedusae 17.63 31.97 0.58 98.72 224.36 2138.2 0.001 20.1019 0.038 20.001924 Decapod larvae 14.75 13.56 0.48 99.20 0.241 0.0151 n.s. 0.157 0.0013 n.s.25 Fish eggs and larvae 10.06 60.70 0.33 99.53 0.891 20.0079 n.s. 0.208 0.0011 n.s.26 Amphipods 2.48 4.84 0.08 99.61 0.800 20.0012 n.s. 0.680 0.0004 n.s.27 Metridia lucens 2.46 10.19 0.08 99.70 0.236a 20.0222 n.s. 0.679 20.0004 n.s.28 Clytemnestra spp. 1.94 6.40 0.06 99.76 4.68 241.2 0.001 0.0196 ,0.001 0.004029 Subeucalanus crassus 1.64 4.87 0.05 99.81 3.05 186.4 0.005 0.0128 ,0.001 0.003530 Euphausiids 1.09 2.82 0.04 99.85 1.47 134.1 0.021 0.0061 0.010 0.002331 Doliolids 0.82 9.82 0.03 99.88 0.094 0.0155 n.s. 0.012 0.002032 Cephalopods 0.78 5.93 0.03 99.90 0.064 0.0104 n.s. 0.016 0.001833 Microsetella spp. 0.73 2.21 0.02 99.93 0.975 0.0001 n.s. 0.757 0.0003 n.s.34 Candacia armata 0.71 1.98 0.02 99.95 1.02 143.0 0.022 0.0043 0.010 0.002335 Centropages chierchiae 0.35 2.59 0.01 99.96 0.79a 0.0012 n.s. 0.427 0.0005 n.s.36 Temora stylifera 0.21 2.97 0.01 99.97 0.429 0.0022 n.s. 0.047 0.001237 Centropages hamatus 0.16 0.96 0.01 99.97 0.797 0.0002 n.s. 0.502 0.0005 n.s.38 Paraeuchaeta hebes 0.16 1.04 0.01 99.98 0.68 425.0 0.004 0.0028 ,0.001 0.003739 Hemichordates 0.10 0.59 ,0.01 99.98 20.33 2312.6 0.014 20.0014 0.085 20.0011 n.s.40 Isias clavipes 0.09 0.47 ,0.01 99.98 20.33 2383.5 0.002 20.0014 ,0.001 20.002341 Microcalanus pygmaeus 0.08 0.82 ,0.01 99.99 0.590 20.0004 n.s. 0.440 0.0005 n.s.42 Isopods 0.05 0.25 ,0.01 99.99 0.22 408.6 ,0.001 0.0009 ,0.001 0.005043 Anomalocera pattersoni 0.05 0.29 ,0.01 99.99 0.301 20.0003 n.s. 0.733 0.0003 n.s.
JOU
RN
AL
OF
PL
AN
KT
ON
RE
SE
AR
CHj
VO
LU
ME32j
NU
MB
ER5j
PA
GE
S657
–679j
2010
664
at Plymouth Marine Laboratory on April 13, 2010 http://plankt.oxfordjournals.org Downloaded from

On
ly22
taxaappeared
amon
gth
e10
most
abundan
ttaxa
inan
ym
onth
through
outth
etim
eseries,
repre-sen
ting
together�
95%on
averageof
the
totalcom
mu-
nity,
and
their
joint
contribution
overth
eyear
remain
edfairly
stable(F
ig.4A
and
B).
Th
em
ajorityof
these
taxacon
tributed�
0.1%of
the
totalzooplan
ktonabun
dance
(Table
II).T
hese
taxaw
erem
ainly
copepods,but
alsoin
cludeda
num
berof
meroplan
ktonic
organism
s(e.g.
Cirripede
larvae,E
chin
odermlarvae
and
Bivalve
larvae)w
hich
were
abundan
tin
spring,
summ
eran
dautum
n,
respectively(F
ig.5).
Th
etem
poralvariation
san
dseason
alsuccession
ofth
em
eroplankton
atL
4are
describedin
more
detailby
High
fieldet
al.(H
ighfield
etal.,
2010).T
he
win
tercom
mun
ityw
asm
ainly
Fig.
4.T
he
k-domin
ancecurves
ofth
ezooplan
ktoncom
mun
itystructure:
(A)
interan
nual
variationan
dcorrespon
ding
dendrogram
(eachcurve
isrepresen
tedw
ithth
ecolour
and
line
typeof
the
groupit
comes
from),
and
(B)
the
seasonal
variationfor
eachseason
wh
erew
inter
isfrom
Decem
berto
February,sprin
gis
fromM
archto
May,
summ
eris
fromJun
eto
August
and
autumn
isfrom
Septem
berto
Novem
ber,an
dth
ek-dom
inan
cecurve
fora
comm
unity
with
aneven
structureis
alsodisplayed
(blackdash
edcurve).
44 Calocalanus spp. 0.04 0.51 ,0.01 99.99 0.085 0.0008 n.s. 0.002 0.001645 Cephalochordates 0.04 0.28 ,0.01 99.99 0.17 454.6 0.006 0.0007 0.001 0.002346 Parapontella brevicornis 0.04 0.31 ,0.01 99.99 0.160 20.0004 n.s. 0.575 0.0003 n.s.47 Mysids 0.03 0.14 ,0.01 99.99 0.578 0.0001 n.s. 0.011 0.002048 Calanoides carinatus 0.03 0.42 ,0.01 99.99 0.240 0.0005 n.s. 0.023 0.001649 Ctenophores 0.03 0.27 ,0.01 99.99 0.468 20.0002 n.s. 0.026a 0.003250 Scolecithricella minor 0.03 0.29 ,0.01 99.99 20.13 2483.9 0.038 20.0006 0.024 20.001451 Trachymedusae 0.03 0.25 ,0.01 99.99 20.12 2457.1 0.035 20.0005 0.007 20.001452 Solmaris corona 0.01 0.21 ,0.01 99.99 0.172 20.0003 n.s. 0.708 20.0001 n.s.53 Siphonostomatoids 0.01 0.14 ,0.01 99.99 0.487 0.0001 n.s. 0.206 0.0007 n.s.54 Ischnocalanus spp. 0.01 0.10 ,0.01 99.99 20.06 2558.7 0.006 20.0003 0.004 20.001355 Cumacea 0.01 0.13 ,0.01 99.99 0.545 0.0001 n.s. 0.721 0.0002 n.s.56 Diaixis hibernica 0.01 0.06 ,0.01 99.99 0.887 ,0.0001 n.s. 0.418 0.0004 n.s.57 Nematodes ,0.01 0.03 ,0.01 99.99 0.791 ,0.0001 n.s. 0.794 0.0001 n.s.58 Labidocera wollastoni ,0.01 0.01 ,0.01 99.99 0.01 388.2 0.019 ,0.0001 0.007 0.001459 Ascidians ,0.01 ,0.01 ,0.01 100.00 0.950 ,0.0001 n.s. 0.930 ,0.0001 n.s.
Taxa highlighted in light grey are the rare and/or underestimated taxa due to the sampling methods used and the expertise of the analysts: these taxa appear on less than 20% of the L4 sample datesover the entire time series. Trend P-value and slope come from the regression analysis (superscript ‘a’ indicates a significant autocorrelation in which case the effective number of independentobservations has been adjusted and n.s. indicates non-significant trends with P-value . 0.05). Change in abundance over the 20 years was calculated for significant trends using the slope from theregression analysis of the monthly averages, and this value was compared with the overall average to determine the percentage of change.
D.
EL
OIR
EE
TA
L.j
TW
EN
TY
YE
AR
SO
FZ
OO
PL
AN
KT
ON
SA
MP
LIN
GA
TS
TA
TIO
NL
4
665
at Plymouth Marine Laboratory on April 13, 2010 http://plankt.oxfordjournals.org Downloaded from
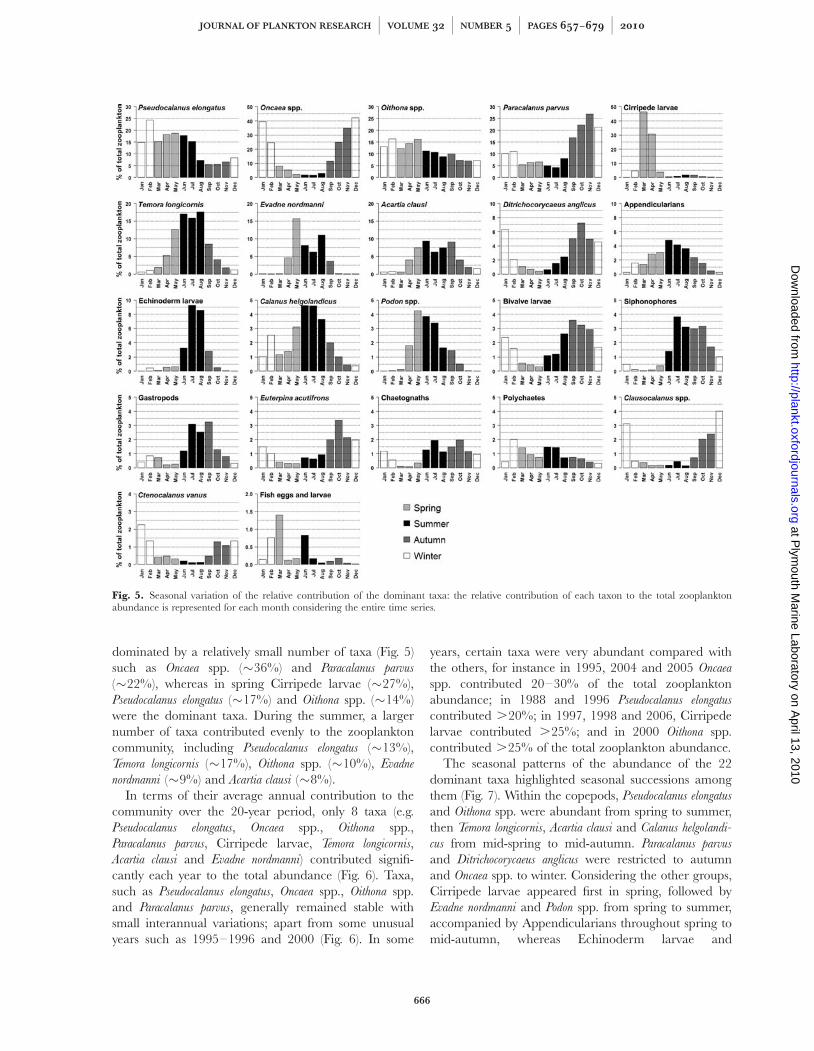
dominated by a relatively small number of taxa (Fig. 5)such as Oncaea spp. (�36%) and Paracalanus parvus
(�22%), whereas in spring Cirripede larvae (�27%),Pseudocalanus elongatus (�17%) and Oithona spp. (�14%)were the dominant taxa. During the summer, a largernumber of taxa contributed evenly to the zooplanktoncommunity, including Pseudocalanus elongatus (�13%),Temora longicornis (�17%), Oithona spp. (�10%), Evadne
nordmanni (�9%) and Acartia clausi (�8%).In terms of their average annual contribution to the
community over the 20-year period, only 8 taxa (e.g.Pseudocalanus elongatus, Oncaea spp., Oithona spp.,Paracalanus parvus, Cirripede larvae, Temora longicornis,Acartia clausi and Evadne nordmanni) contributed signifi-cantly each year to the total abundance (Fig. 6). Taxa,such as Pseudocalanus elongatus, Oncaea spp., Oithona spp.and Paracalanus parvus, generally remained stable withsmall interannual variations; apart from some unusualyears such as 1995–1996 and 2000 (Fig. 6). In some
years, certain taxa were very abundant compared withthe others, for instance in 1995, 2004 and 2005 Oncaea
spp. contributed 20–30% of the total zooplanktonabundance; in 1988 and 1996 Pseudocalanus elongatus
contributed .20%; in 1997, 1998 and 2006, Cirripedelarvae contributed .25%; and in 2000 Oithona spp.contributed .25% of the total zooplankton abundance.
The seasonal patterns of the abundance of the 22dominant taxa highlighted seasonal successions amongthem (Fig. 7). Within the copepods, Pseudocalanus elongatus
and Oithona spp. were abundant from spring to summer,then Temora longicornis, Acartia clausi and Calanus helgolandi-
cus from mid-spring to mid-autumn. Paracalanus parvus
and Ditrichocorycaeus anglicus were restricted to autumnand Oncaea spp. to winter. Considering the other groups,Cirripede larvae appeared first in spring, followed byEvadne nordmanni and Podon spp. from spring to summer,accompanied by Appendicularians throughout spring tomid-autumn, whereas Echinoderm larvae and
Fig. 5. Seasonal variation of the relative contribution of the dominant taxa: the relative contribution of each taxon to the total zooplanktonabundance is represented for each month considering the entire time series.
JOURNAL OF PLANKTON RESEARCH j VOLUME 32 j NUMBER 5 j PAGES 657–679 j 2010
666
at Plym
outh Marine Laboratory on A
pril 13, 2010 http://plankt.oxfordjournals.org
Dow
nloaded from

Fig. 6. Interannual variation of the relative contribution of the dominant taxa: the relative contribution of each taxon to the total zooplankton abundance is represented for each year of the timeseries (black bars represent years when the taxon was part of the 10 dominant taxa and grey bars represent when it was not).
D.
EL
OIR
EE
TA
L.j
TW
EN
TY
YE
AR
SO
FZ
OO
PL
AN
KT
ON
SA
MP
LIN
GA
TS
TA
TIO
NL
4
667
at Plymouth Marine Laboratory on April 13, 2010 http://plankt.oxfordjournals.org Downloaded from
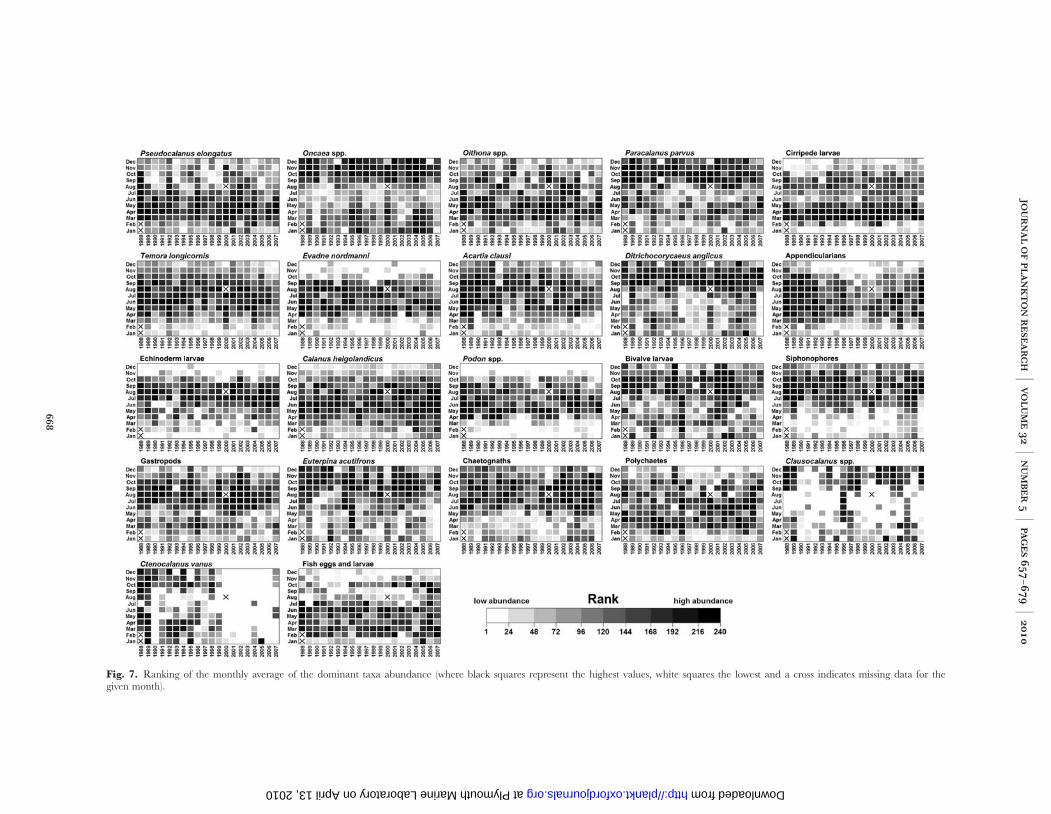
Fig. 7. Ranking of the monthly average of the dominant taxa abundance (where black squares represent the highest values, white squares the lowest and a cross indicates missing data for thegiven month).
JOU
RN
AL
OF
PL
AN
KT
ON
RE
SE
AR
CHj
VO
LU
ME32j
NU
MB
ER5j
PA
GE
S657
–679j
2010
668
at Plymouth Marine Laboratory on April 13, 2010 http://plankt.oxfordjournals.org Downloaded from

Chaetognaths occurred from summer to autumn andBivalve larvae arrived only in autumn.
There was also evidence of long-term changes inabundance of some of the dominant taxa (Table III).For instance, results of the regression analysis based onthe monthly anomalies (Table II), suggested that Calanus
helgolandicus, Chaetognaths, Cirripede larvae and Oncaea
spp. increased in abundance, whereas Acartia clausi,Ctenocalanus vanus, Temora longicornis, Evadne nordmanni,Appendicularians, Pseudocalanus elongatus and Podon
spp. decreased over the 20-year period. For some ofthese taxa (i.e. Acartia clausi, Calanus helgolandicus,Chaetognaths, Ctenocalanus vanus, Pseudocalanus elongatus
and Podon spp.), the trend displayed by the monthlyaverages was also significant; thus, we were able to esti-mate the magnitude of these changes (Table II).
Diversity
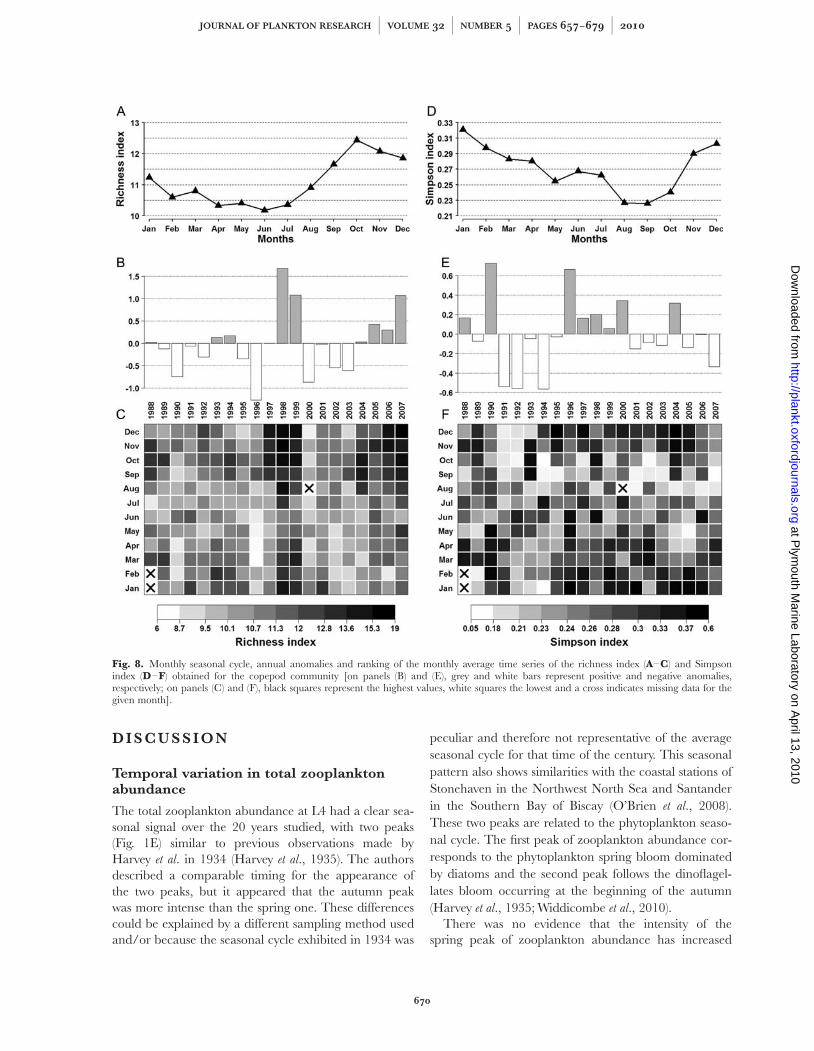
The average seasonal cycle of the richness index for thecopepod community showed only small variations withthe highest values (�12.5) in autumn and the lowest(�10.2) in summer (Fig. 8A). The annual anomaliesshowed years with high positive (e.g. 1998, 1999 and2007) or negative (e.g. 1990, 1996, 2000, 2002 and2003) anomalies (Fig. 8B). The ranking of the monthlyaverages varied little without any clear seasonal or long-term pattern and only some unusual periods of lowvalues in 1996, 2000 and 2002–2003, and high valuesin 1997–1999, 2004 and 2006–2007 (Fig. 8C).However, a significant positive long-term trend (slope ¼0.0049, P ¼ 0.003) was estimated for the richness of thecopepod community (Table I).
The Simpson index for the copepod community waslower (�0.23) in autumn and higher (�0.32) in winter(Fig. 8D). The annual anomalies for the copepod com-munity showed a long period (1995–2002) of positiveanomalies and 2 years with a high positive anomaly(e.g. 1990 and 2004) (Fig. 8E). Several years had highnegative anomalies (e.g. 1991, 1992, 1994 and 2007).The ranking of the monthly averages showed a very
heterogeneous pattern (Fig. 8F), but generally most ofthe highest values were in winter and the lowest inautumn, except for 2 years (1991 and 1992) when thelowest values were during the winter period. The long-term trend for the Simpson index was not significant(P ¼ 0.535) (Table I).
Cumulative sums
The cumulative sums of the zooplankton abundance(Fig. 9) indicate four periods delimited by three majorchanges, which occurred in 1990/1991, 1999/2000and 2004/2005, and four minor changes (i.e. 1994/1995, 1995/1996, 2002/2003 and 2003/2004). Asexpected, the results of the cumulative sums for thetotal copepods abundance were very similar to those forthe total zooplankton. Considering the cumulative sumsof the other biological and environmental parameters, anumber of similarities appeared between the timing ofchanges for these parameters and those described pre-viously for the total zooplankton abundances(Table IV).
Changes were seen in some variables that were notshown by the cumulative sums of the total zooplankton.For instance, in 1991/1992 Temora longicornis,Gastropods and Polychaetes exhibited a change in theircumulative sums, whereas changes occurred in 1996/1997 for the Cirripede larvae and the richness index. In2000/2001, Ditrichocorycaeus anglicus, Bivalve larvae,Gastropods, Euterpina acutifrons and Clausocalanus spp., aswell as the W/E wind, the NAO index and winterNAO index, showed a change. In 2001/2002, Calanus
helgolandicus, Chaetognaths and Cirripede larvae exhib-ited a change in their cumulative sums. Finally, anotherchange was also noticeable in 2005/2006 for Oncaea
spp., Paracalanus parvus, Ditrichocorycaeus anglicus and theGSNW position index. Another noticeable result fromthe cumulative sums was the similarity in the timingand duration of changes for Calanus helgolandicus andChaetognaths.
Table III: Long-term trend of the 22 dominant taxa obtained from the regression analysis using themonthly anomalies over the period 1988–2007
Positive trend Negative trend
P-value � 0.001 Calanus helgolandicusa; Chaetognathsa Temora longicornis; Acartia clausia; Ctenocalanus vanusa
P-value � 0.01 Cirripede larvae Evadne nordmanni; AppendiculariansP-value � 0.05 Oncaea spp. Pseudocalanus elongatusa; Podon spp.a
non-significant trend Oithona spp.; Paracalanus parvus; Ditrichocorycaeus anglicus; Echinoderm larvae; Bivalve larvae; Siphonophores;Gastropods; Euterpina acutifrons; Polychaetes; Clausocalanus spp.; Fish eggs and larvae
The categories are based on the trend sign, positive or negative, and the associated P-value.aIndicates that the trend displayed by the monthly average abundances was also significant for this taxon, with a P-value � 0.05.
D. ELOIRE ET AL. j TWENTY YEARS OF ZOOPLANKTON SAMPLING AT STATION L4
669
at Plym
outh Marine Laboratory on A
pril 13, 2010 http://plankt.oxfordjournals.org
Dow
nloaded from
D I S C U S S I O N
Temporal variation in total zooplanktonabundance
The total zooplankton abundance at L4 had a clear sea-sonal signal over the 20 years studied, with two peaks(Fig. 1E) similar to previous observations made byHarvey et al. in 1934 (Harvey et al., 1935). The authorsdescribed a comparable timing for the appearance ofthe two peaks, but it appeared that the autumn peakwas more intense than the spring one. These differencescould be explained by a different sampling method usedand/or because the seasonal cycle exhibited in 1934 was
peculiar and therefore not representative of the averageseasonal cycle for that time of the century. This seasonalpattern also shows similarities with the coastal stations ofStonehaven in the Northwest North Sea and Santanderin the Southern Bay of Biscay (O’Brien et al., 2008).These two peaks are related to the phytoplankton seaso-nal cycle. The first peak of zooplankton abundance cor-responds to the phytoplankton spring bloom dominatedby diatoms and the second peak follows the dinoflagel-lates bloom occurring at the beginning of the autumn(Harvey et al., 1935; Widdicombe et al., 2010).
There was no evidence that the intensity of thespring peak of zooplankton abundance has increased
Fig. 8. Monthly seasonal cycle, annual anomalies and ranking of the monthly average time series of the richness index (A–C) and Simpsonindex (D–F) obtained for the copepod community [on panels (B) and (E), grey and white bars represent positive and negative anomalies,respectively; on panels (C) and (F), black squares represent the highest values, white squares the lowest and a cross indicates missing data for thegiven month].
JOURNAL OF PLANKTON RESEARCH j VOLUME 32 j NUMBER 5 j PAGES 657–679 j 2010
670
at Plym
outh Marine Laboratory on A
pril 13, 2010 http://plankt.oxfordjournals.org
Dow
nloaded from

Fig. 9. Cumulative sums and corresponding residuals of each biological and environmental factor (vertical solid lines separate periods of change in total zooplankton abundance, and verticaldashed lines indicate other possible changes occurring in the plankton community). The spring and autumn abundances represent the yearly average of the total zooplankton abundances fromMarch to May and from August to October, respectively.
D.
EL
OIR
EE
TA
L.j
TW
EN
TY
YE
AR
SO
FZ
OO
PL
AN
KT
ON
SA
MP
LIN
GA
TS
TA
TIO
NL
4
671
at Plymouth Marine Laboratory on April 13, 2010 http://plankt.oxfordjournals.org Downloaded from

significantly over the 20-year time series. However, thecorrelation between the total zooplankton and thediatoms abundance in March over the 20 years wasnegative and significant (r ¼ 20.62, P ¼ 0.02),suggesting either the existence of a close relationshipbetween the two plankton communities and/or differentways of responding to a common factor. More than45% of the total zooplankton abundance in March wascomposed of Cirripede larvae (Fig. 5) and this groupshowed a significant positive long-term trend in itsmonthly anomalies (Tables II and III). An increase ofthe zooplankton population in spring, such as Cirripedelarvae, could have a top-down effect on the phytoplank-ton by increased grazing (Harvey et al., 1935). There islittle information available regarding Cirripede larvaeand their ecology, especially on the impact this groupcould have on the plankton community. Nevertheless, astudy investigating the size of particles selected by cope-pods and Cirripede larvae suggested that the two
grazers can compete because of their similarity in foodselection (Barlow and Monteiro, 1979). However, zoo-plankton grazing is not the only reason for the observeddecrease of the phytoplankton spring bloom intensity,changes in water column conditions and nutrients havealso a significant impact on the phytoplankton commu-nity structure (Widdicombe et al., 2010).
In contrast, the pattern observed in the cumulativesums of the autumn abundances (Fig. 9) suggests thatthe intensity of the autumn peak decreased over the twoperiods 1988–1999 and 2004–2007, probably drivenby the decreases among some dominant taxa (e.g.Temora longicornis, Acartia clausi, Evadne nordmanni andAppendicularians), which are usually abundant duringthis time of the year (Table III, Figs 5 and 7). Themaximum autumn abundance of the total zooplanktonwas negatively and significantly (r ¼ 20.47, P ¼ 0.04)correlated to the average autumn SST over the 20years. The long-term trend of the monthly anomalies of
Table IV: Summary of results obtained from the analysis of the cumulative sums of each biological andenvironmental parameter
1990/1991 94/95 95/96 1999/2000 02/03 03/04 2004/2005
Total zooplankton 33 � � 33 � � 33
Total copepods 33 � � 33 � � 33
Richness index 33 �Simpson index � 33
Spring abundances 33 33 �Autumn abundances 33 �SST 33 � 33 �W/E wind �S/N wind �Wind speed 33 33
GSNW position index � 33 �NAO index �Winter NAO index �Pseudocalanus elongatus � 33 � 33
Oncaea spp. � �Oithona spp. 33 33
Paracalanus parvus 33 33
Cirripede larvaeTemora longicornis 33 33
Acartia clausi 33
Evadne nordmanni �Ditrichocorycaeus anglicus �Appendicularians �Echinoderm larvaeCalanus helgolandicusPodon spp.Bivalve larvae � � 33
Siphonophores � 33
Gastropods � 33
Euterpina acutifrons � 33
ChaetognathsPolychaetes � 33
Clausocalanus spp. � 33
Ctenocalanus vanusFish eggs and larvae
Periods of change were defined for the total zooplankton and included three main changes (bold crosses) and four minor changes. Similar changesoccurring in the cumulative sums of others factors were indicated.
JOURNAL OF PLANKTON RESEARCH j VOLUME 32 j NUMBER 5 j PAGES 657–679 j 2010
672
at Plym
outh Marine Laboratory on A
pril 13, 2010 http://plankt.oxfordjournals.org
Dow
nloaded from

SST was positive and significant (slope ¼ 0.0002, P ¼
0.003), especially in September (slope ¼ 0.08, P ¼
0.02). The key environmental factor allowing thestart of autumn phytoplankton production is the break-down of summer stratification, resulting in the redistribu-tion of nutrients in the water column close to the surface(Smyth et al., 2010). With increasing temperatures, strati-fication might be maintained longer and the autumnphytoplankton bloom may be limited by nutrientdepletion and in turn be delayed and less intense.
The analysis of the current time series revealed thatthe seasonal cycle of the total zooplankton abundancewas generally consistent from 1 year to another and thisvariability was typically greater than interannual vari-ations. In addition, the 20-year time series did notdisplay any significant long-term trend, but this resultcould have been the sum of compensatory long-termchanges occurring in the community. The use of monthlyaverages also removes changes that occur at a smallertemporal scale, but we chose this temporal frequency toreduce the number of gaps in our time series. It may bethat 20 years of data may still not be sufficient to detect asignificant change at L4 and a number of years ofadditional sampling might allow one to be detected.
Temporal variation in diversity andcommunity composition
It is clear that the composition and structure of thecommunity varied through the year with a more diverseand evenly distributed community in summer and onestrongly dominated by just a few species during winter(Figs 4, 5 and 8). However, the community at L4appeared relatively stable over the 20 years except forfew atypical years, and only variations in the rank of themost dominant taxa and small changes in compositionof the less dominant taxa were visible. This was consist-ent with what has been already described at L4 in thepast (Digby, 1950). The species richness displayed het-erogeneous and small variations in both seasonal andinterannual pattern, but showed a significant positivelong-term trend, indicating a small increase in thenumber of copepod taxa identified at L4. This latterresult, even if significant, has to be interpreted with careas it could be due to the improvement of the taxonomicexpertise over the 20-year period. Unfortunately, we didnot have enough information to test and verify thishypothesis. In contrast, the Simpson index, which givesinformation on the dominance of the community, didnot show any significant long-term trend. Its seasonalvariation was in general, but not always, more impor-tant than its interannual variability due to the abruptchange of the index between autumn and winter.
The most abundant taxa at L4 (Table II) were alsofound to be the most abundant at different locations inthe coastal waters of the North Atlantic region (O’Brienet al., 2008). At five long-term stations (Gulf of StLawrence, Iceland, Northern Skagerrak, NorthwestNorth Sea, Northwest Iberian Peninsula), Pseudocalanus
spp. and Oithona spp. appeared among the 10 mostdominant taxa at all of them, Acartia spp. at four, Temora
longicornis and Appendicularians at three and Oncaea spp.and Cirripede larvae at two (O’Brien et al., 2008). Theproportion of the dominant copepods Acartia spp.,Oithona spp., Oncaea spp., Paracalanus parvus, Clausocalanus
spp. and Pseudocalanus elongatus also showed similaritieswith a recent study in the Gulf of Trieste (Conversiet al., 2009). However, these authors observed a shifttowards smaller copepod species in the communityduring the period 1970–2005. Such a shift has notbeen observed at L4.
There was evidence for long-term changes in thenumbers of some of the dominant taxa. Oncaea spp.,Cirripede larvae, Calanus helgolandicus and Chaetognathshave increased whereas Pseudocalanus elongatus, Temora
longicornis, Acartia clausi, Evadne nordmanni,Appendicularians, Podon spp. and Ctenocalanus vanus havedecreased over the 20-year period (Tables II and III).Similar patterns have been observed for some of thesespecies and groups elsewhere, such as increases in abun-dance of Calanus helgolandicus in the North Atlantic andNorth Sea (Planque and Fromentin, 1996; Beaugrand,2003) and declines in Temora longicornis in the NortheastAtlantic (Kane and Prezioso, 2008).
Of the 22 dominant taxa, 4 increased significantly inabundance and 7 decreased (Tables II and III). Thosetaxa which increased showed a range of seasonal cycles:Oncaea spp. was abundant in autumn and winter,Cirripede larvae in March and April, Calanus helgolandi-
cus in spring and summer and Chaetognaths in summerand autumn. Consequently, different factors may influ-ence their increase. On the other hand, taxa showing anegative trend had similar seasonal patterns. Temora
longicornis, Acartia clausi, Evadne nordmanni, Podon spp. andAppendicularians are all abundant from spring to theend of the summer, and thus they may be affected bythe same factor(s) and/or competition for similarresources. However, no relationship was found betweenthese taxa and any of the environmental parametersmeasured.
Some taxa, such as Cirripede larvae or Oncaea spp.,contributed significantly to the community during shortperiods of the year (spring and winter, respectively;Fig. 5). Others, such as Pseudocalanus elongatus or Oithona
spp. contributed evenly all year round. These obser-vations have already been well documented at L4, for
D. ELOIRE ET AL. j TWENTY YEARS OF ZOOPLANKTON SAMPLING AT STATION L4
673
at Plym
outh Marine Laboratory on A
pril 13, 2010 http://plankt.oxfordjournals.org
Dow
nloaded from

the same taxa in 1933 (Harvey et al., 1935) and for thecopepod species only in 1947 (Digby, 1950), althoughover periods of a year only. Their results were similar tothose from the 20-year period in this study, suggestingthat the contributions of these taxa to the seasonal suc-cession may not have changed significantly in the past70 years.
Cirripede larvae are an important group since theyare very abundant at L4 during the spring period(Figs 5 and 7) and their increasing abundance couldhave an impact on the community by increasing com-petition for food and the grazing pressure during thespring bloom, as suggested in a previous study inSouthampton water (Barlow and Monteiro, 1979).Likewise, the increasing abundance of the winter domi-nant species Oncaea spp. may have a strong impact onthe small number of other winter taxa, as diversityreaches its lowest value during winter. The increasingabundances of both taxa might have an effect on thediversity of the zooplankton community if these changesin dominance persist.
Possible relations between zooplanktonat L4 and environmental conditions
Although the NAO index and SST have already beenused in other studies to demonstrate the linkagesbetween the long-term changes in the plankton commu-nity and the North Atlantic and Western Channelclimate (Southward et al., 1995; Fromentin and Planque,1996; Beaugrand et al., 2000; Irigoien et al., 2000), at L4total zooplankton abundance did not show such arelationship whereas phytoplankton did, at least duringthe period 1993–1999 (Irigoien et al., 2000).Zooplankton have a more complicated linkage withclimate, since the possible pathways by which the NAOmay affect ecological processes vary and affect theenvironment and biology at different levels (Ottersenet al., 2001). Since L4 is a spatially confined coastalstation subject to a variety of influences such as freshwater input from the estuary and anthropogenic influ-ences such as fishing (Smyth et al., 2010), links withclimate indices may be weak compared those furtheroffshore, where climate and currents are likely to be theonly environmental parameters affecting the zooplank-ton community. Linkages between the NAO, SST anddiversity (Table V) may be explained by the fact that ahigh NAO pattern will increase air temperature andwesterly wind stress, which in turn will increase the SSTand flow of water coming from the west (Fromentin andPlanque, 1996; Irigoien et al., 2000; Irigoien and Harris,2003), favouring an increase in zooplankton community
diversity due to the increase of the number of speciesadvected into the region.
Results from the cumulative sums provide evidencesupporting hypotheses as regards the existence of linksbetween zooplankton and the environment. Differentperiods of change in the total zooplankton were relatedto changes occurring in some of the dominant taxa andin environmental conditions (Table IV, Fig. 9). Eachmain change visible in the total zooplankton over the20 years occurred at the same time as a change in theSST and wind. For the most obvious change, between1999 and 2000, the majority of the dominant taxa andenvironmental factors were affected. In contrast, minorchanges occurring between 1994 and 1996 affectedonly a few dominant taxa (e.g. Pseudocalanus elongatus andOncaea spp.). These were related to changes in the NAO,but no changes were visible in total zooplankton.Therefore, changes in the abundance of some of thedominant taxa, in response to changes in the environ-mental conditions, did not necessarily correspond tochanges in total zooplankton. In addition, changes intotal zooplankton were not consistently related tochanges in the same dominant taxa. Thus, it is difficultto relate changes in total zooplankton to changes in oneenvironmental parameter or one of the dominant taxa,as each taxon may respond differently to change inenvironmental conditions with different degrees ofresponse.
The environmental conditions, SST and wind, aswell as the food resources, for instance the phytoplank-ton, must play major roles in controlling directly orindirectly the total zooplankton abundance at L4, butmore evidence is needed to investigate linkages andmechanisms. We did not find any direct relationshipbetween the NAO and the zooplankton, but otherstudies have provided evidence of a link between thephytoplankton and the NAO (Irigoien et al., 2000) or
Table V: Correlation coefficient between thewinter NAO index, annual average SST,annual average abundances of fourzooplankton taxa and annual maximum of thespecies richness calculated for the period 1988to 2007, using the Spearman rank correlation(P-values � 0.05)
Spearman rank correlation coefficient winter NAO index SST
Temora longicornis 20.45Cirripede larvae 20.45Podon spp. 0.47Clausocalanus spp. 20.45Subeucalanus crassus 20.49Maximum richness index 0.46
JOURNAL OF PLANKTON RESEARCH j VOLUME 32 j NUMBER 5 j PAGES 657–679 j 2010
674
at Plym
outh Marine Laboratory on A
pril 13, 2010 http://plankt.oxfordjournals.org
Dow
nloaded from

the SST and the NAO (Fromentin and Planque, 1996).The NAO may indirectly affect zooplankton abundanceby influencing the winter conditions and thus perhapsthe preconditioning of the spring population and itsresponse to the spring bloom. This was suggested bythe positive and significant (r ¼ 0.47, P ¼ 0.04) corre-lation we found between the winter NAO index and thespring temperature at L4. Nevertheless, pathways bywhich hydroclimatic factors control zooplankton abun-dance and community composition are complex andnumerous, as are the interactions between the par-ameters. Furthermore, mixing, river runoff and tidemight also play an important role in controlling theplankton community at L4.
Zooplankton indicators at L4
The concept of indicator species has many applications.It has been used in the Western Channel and NorthSea to characterize species indicative of particular watermasses (Russell, 1935; Southward, 1963, 1984; Bonnetand Frid, 2004), whereas in the Bay of Biscay it wasused for rare/unusual species appearing occasionally orconsistently, depending on the hydroclimatic conditions(Villate et al., 1997; Lindley and Daykin, 2005; Valdeset al., 2007). In past studies, it has already beensuggested that copepod species such as Temora stylifera
and Acartia clausi could be key species for monitoringclimate changes affecting the Bay of Biscay and thenorth-eastern Atlantic Ocean (Villate et al., 1997;Lindley and Daykin, 2005; Valdes et al., 2007). Theincrease in abundance of these copepod species wasrelated to temperature, but also to the hydrologicalcharacteristics of the region. Of these species, onlyAcartia clausi was abundant at L4. Its abundancedeclined significantly over time (Tables II and III) butits abundance did not show a significant correlationwith the environmental factors used in our analysis.Temora stylifera showed a significant increase over the 20years studied (Table II), although this result can be criti-cized as the species was one of the taxa that may havebeen underestimated by the analysts. However, its con-generic species, Temora longicornis, was abundant at L4and showed both a significant decrease over time(Tables II and III) and a significant negative correlationwith the SST (Table V), a pattern which has also beenobserved in the Northeast Atlantic (Kane and Prezioso,2008). Temora longicornis is a boreal species(Halsband-Lenk et al., 2002, 2004) and the increase intemperature at L4, 0.68C per decade (Smyth et al.,2010), may not favour it.
The NAO index exhibited a significant negative trend(slope ¼ 20.004, P ¼ 0.02) in its monthly values over
the 20-year period. Cirripede larvae, Podon spp. andSubeucalanus crassus were significantly correlated to thewinter NAO index (Table V) and all displayed a signifi-cant trend in their monthly anomalies (Table II)suggesting that the NAO may be an indicator of factorscontrolling their abundance, such as the degree ofclimate driven influx of waters coming from the southand west. However, it is difficult to explain such arelationship. Previous studies have already tried toaddress this issue, but their conclusions were ambiva-lent. For instance, the abundance of Centropages typicus
was positively related to the NAO in the eastern NorthSea and negatively in the Celtic Sea and Bay of Biscay(Reid and Planque, 2000). It is likely that uncertaintiesin interpretation reflect the complex interactions amongspecies life cycles, variability in local productivity andfood availability, and changes in seasonal patterns ofadvection.
A number of taxa present at L4 showing significantvariability may also be considered as indicators. Paststudies have shown that patterns in abundance ofspecific taxa, such as Calanus helgolandicus, Chaetognathsand Echinoderm larvae, were related to hydroclimaticchanges in seas surrounding the Western Channel. Inthe present study, Calanus helgolandicus showed a signifi-cant positive trend with a marked increase in abun-dance since 1994 (Table II, Fig. 6). This species hasbeen intensively studied during recent years, especiallywith respect to its link with its congener Calanus finmarch-
icus and climate change over the North Atlantic(Fromentin and Planque, 1996; Planque and Fromentin,1996; Beaugrand, 2003; Bonnet et al., 2005; Helaouetand Beaugrand, 2007). In contrast to two other studiesthat link the increase in abundance of Calanus helgolandi-
cus with changes in the hydroclimatic environment(Fromentin and Planque, 1996; Beaugrand, 2003), norelationship was found with SST or the winter NAOindex at L4, supporting the idea that it may be advec-tion, stratification of the water column and/or mortalitythat are the main factors controlling the population, ashas been previously suggested for Calanus helgolandicus atL4 (Irigoien and Harris, 2003; Bonnet et al., 2010).
Chaetognaths are planktonic predators and can havean important impact on the plankton communitythrough top-down control, especially on copepods(Williams and Collins, 1985; Roff et al., 1988; Nicholasand Frid, 1999). They have been observed in the labora-tory feeding on Acartia clausi (Frid et al., 1994) or in situ
on Calanus helgolandicus (Bonnet et al., 2010). The impor-tance of Chaetognaths as indicators has been high-lighted in past studies. For example, Russell (Russell,1935) determined that the presence of each of twospecies of Sagitta in the Western Channel indicated
D. ELOIRE ET AL. j TWENTY YEARS OF ZOOPLANKTON SAMPLING AT STATION L4
675
at Plym
outh Marine Laboratory on A
pril 13, 2010 http://plankt.oxfordjournals.org
Dow
nloaded from

water bodies with different origins. Sagitta setosa occursin waters in the Channel, whereas Sagitta elegans is amore oceanic species and its presence indicates waterwith a western, or oceanic, origin. Their temporal vari-ations were used to explain changes in the planktoncommunity observed in the Western Channel duringthe last century (Russell, 1935; Southward, 1963, 1984;Øresland, 1986). At L4, most Chaetognaths were Sagitta
setosa over the 20-year time series, and we did notobserve any change in the species composition.Chaetognaths were abundant throughout the summerand autumn (Fig. 5) and exhibited a positive significanttrend over the time series (Tables II and III). Because oftheir abundance, Chaetognaths may have a role in thecontrol of copepod population numbers during thesummer/autumn, as has been suggested for Calanus
helgolandicus (Bonnet et al., 2010). Enhanced predation byChaetognaths could be a factor explaining the decreasein the autumn peak of total zooplankton abundance.The factors influencing the abundance of Chaetognathscould be diverse: advection and temperature havealready been used to explain interannual variationsand autumn densities and thus predation impact(Nicholas and Frid, 1999). However, we have not foundany correlation between the abundance of this taxonand SST, and do not have sufficient information onadvection at L4.
A temporal link has already been observed betweenthe SST, the NAO index and the abundance ofEchinoderm larvae in the North Sea CPR samples(Kirby et al., 2007, 2008), but we did not find such arelationship at L4. Echinoderm larvae did not show asignificant trend in monthly average abundances overthe time series (Table II), but they have significantlyincreased during summer. Average abundances in Juneshowed a significant positive trend (slope ¼ 17.2, P ¼
0.02). This was the time of the year that they were mostabundant, representing 10–40% of the total zooplank-ton abundance depending on the year. This coincidedwith the timing of the most significant temperatureincrease over the 20 years, since June was the monthwith the highest significant positive trend in SST(slope ¼ 0.08, P ¼ 0.02). For meroplankton larvae, timespent in the plankton is a period of high mortality andan increase in temperature can improve larval survivalby reducing this time through increased developmentrates (Kirby et al., 2007).
Rare species are also important indicators, butbecause they are rare we cannot analyse their data withthe same accuracy and confidence as for the dominantspecies. In this category at L4, Temora stylifera, Centropages
chierchiae or Penilia avirostris could be considered poten-tially important indicator species in future studies.
Penilia avirostris was recorded in the L4 samples for thefirst time in September 2008. This species has not beenrecorded in the Western Channel before, but is com-monly found in the Bay of Biscay, southern North Seaand Baltic Sea. The presence of the species could berelated to a change in the climate conditions during thisyear. Increased autumn SSTs were found to be favour-able for Penilia avirostris in the North Sea and Baltic Sea(Johns et al., 2005), warmer conditions contributing tothe survival success of its resting eggs, and facilitating itsspread. The NAO index was negative for six consecutivemonths in 2008, from April to September, with anaverage index of 21.8 for that period. This led to lesswesterly winds and a relatively mild autumn in 2008.A change in the dominant wind could have affected theorigin of the waters at L4 and favoured the presence ofwaters coming from the eastern part of the Channel,which are influenced by the southern North Sea wherethis species has become more and more abundant(Johns et al., 2005).
S U M M A RY
The data and results presented in this study provideinformation on the zooplankton community at L4 overthe period 1988–2007:
(i) The seasonal cycle did not show a significantdifference to that described at L4 in the past, butwe observed variability and potential changes inthe intensity of peaks during the spring and theautumn periods.
(ii) The total zooplankton abundance did not show anylong-term trend, but this might change in the futureif the decreasing tendency observed for the lastyears of the time series continues, thus we need tomaintain sampling to extend our time series.
(iii) The community structure remained stable withoutradical changes in the composition of the dominanttaxa, but long-term trends were highlighted overthe 20-year period as well as changes in diversityrelated to changes in environmental conditions.
(iv) It was unclear which environmental parameterwas driving zooplankton abundance over the20-year period, but SST, wind and/or the NAOwere related to temporal variations of some domi-nant taxa and diversity measures.
(v) Plankton indicator species will be key factors inmonitoring future changes in the plankton ecosys-tem of the Western Channel in relation to environ-mental and climate variations.
JOURNAL OF PLANKTON RESEARCH j VOLUME 32 j NUMBER 5 j PAGES 657–679 j 2010
676
at Plym
outh Marine Laboratory on A
pril 13, 2010 http://plankt.oxfordjournals.org
Dow
nloaded from

The analysis of the current time series showed thatthe seasonal pattern was generally, but not always, con-sistent from 1 year to another. Interannual variation intotal zooplankton, community composition and diver-sity were typically of a lesser magnitude than variabilityrelated to seasonal changes in environmental conditions.Compared to oceanic waters, where communities mightonly respond to variations due to climate changes,coastal waters are influenced by many factors, especiallyfactors induced by human activities, that can alterplankton community in different ways. The extension ofthe long-term plankton time series at L4 is importantfor monitoring the plankton ecosystem in the WesternChannel and further analyses on the data set are in pro-gress. We also need to extend the range of in situ datacollected, and perhaps to increase the frequency of thesampling, to better understand processes taking place inthe plankton community and relate their temporal vari-ations to changes in environmental conditions.
AC K N OW L E D G E M E N T S
We wish to thank the crews of the Plymouth MarineLaboratory’s RV Plymouth Quest and the MarineBiological Association’s RV Sepia, the scientists whohave collected samples at L4 since 1988 and the peoplewho have analysed the samples and compiled and orga-nized data. We are grateful to the two anonymousreviewers for their comments which substantiallyimproved the final version of the manuscript. We thankDavid Johns for his comments on the manuscript andTim Smyth for assistance. We would like to thank theEuropean Centre for Medium Range Weather Forecastswho supplied the initial atmospheric data and theBritish Atmospheric Data Centre for provision of theECMWF ERA-40 data. We acknowledge the support ofthe UK Natural Environment Research Councilthrough the Oceans 2025 strategic researchprogramme.
F U N D I N G
This work was funded by a doctoral fellowship to D.E.from the EU Marie Curie EST projectMETAOCEANS (MEST-CT-2005-019678), part ofPML and ECOLAG Core Programs.
R E F E R E N C E S
Acuna, J. L., Bedo, A. W., Harris, R. P. et al. (1995) The seasonal suc-cession of appendicularians (Tunicata: Appendicularia) offPlymouth. J. Mar. Biol. Assoc. UK, 75, 755–758.
Barlow, J. P. and Monteiro, J. D. C. (1979) Selective grazing by zoo-plankton populations in Southampton Water. Mar. Biol., 53,335–344.
Bautista, B. and Harris, R. P. (1992) Copepod gut contents, ingestionrates and grazing impact on phytoplankton in relation to size struc-ture of zooplankton and phytoplankton during a spring bloom. Mar.
Ecol. Prog. Ser., 82, 41–50.
Beaugrand, G. (2003) Long-term changes in copepod abundance anddiversity in the north-east Atlantic in relation to fluctuations in thehydroclimatic environment. Fish. Oceanogr., 12, 270–283.
Beaugrand, G. and Reid, P. C. (2003) Long-term changes in phyto-plankton, zooplankton and salmon related to climate. Global Change
Biol., 9, 801–817.
Beaugrand, G., Ibanez, F. and Reid, P. C. (2000) Spatial, seasonal andlong-term fluctuations of plankton in relation to hydroclimatic fea-tures in the English Channel, Celtic Sea and Bay of Biscay. Mar.
Ecol. Prog. Ser., 200, 93–102.
Beaugrand, G., Ibanez, F., Lindley, J. A. et al. (2002) Diversity of cala-noid copepods in the North Atlantic and adjacent seas: speciesassociations and biogeography. Mar. Ecol. Prog. Ser., 232, 179–195.
Beaugrand, G., Ibanez, F. and Lindley, J. A. (2003) An overview ofstatistical methods applied to CPR data. Prog. Oceanogr., 58,235–262.
Bonnet, D. and Frid, C. (2004) Seven copepod species considered asindicators of water-mass influence and changes: results fromNorthumberland coastal station. ICES J. Mar. Sci., 61, 485–491.
Bonnet, D., Richardson, A., Harris, R. et al. (2005) An overview ofCalanus helgolandicus ecology in European waters. Prog. Oceanogr., 65,1–53.
Bonnet, D., Harris, R., Lopez-Urrutia, A. et al. (2007) Comparativeseasonal dynamics of Centropages typicus at seven coastal monitoringstations in the North Sea, English Channel and Bay of Biscay. Prog.
Oceanogr., 72, 133–148.
Bonnet, D., Lindeque, P. and Harris, R. (2010) Sagitta setosa predationon Calanus helgolandicus in the English Channel. J. Plankton Res., 32,725–737.
Clarke, K. R. (1990) Comparisons of dominance curves. J. Exp. Mar.
Biol. Ecol., 138, 143–157.
Clarke, K. R. and Warwick, R. M. (2001) Change in Marine Communities:
An Approach to Statistical Analysis and Interpretation, 2nd edn. Primer-ELtd, Plymouth, UK.
Conversi, A., Peluso, T. and Fonda-Umani, S. (2009) Gulf of Trieste: achanging ecosystem. J. Geophys. Res., 114, C03S90. doi:10.1029/2008JC004763.
Digby, P. S. B. (1950) The biology of the small planktonic copepods ofPlymouth. J. Mar. Biol. Assoc. UK, 29, 393–438.
ECMWF. (1995) The description of the ECMWF/WCRP level III-AGlobal Atmospheric Data Archive.
Edwards, M., Beaugrand, G., Reid, P. C. et al. (2002) Ocean climateanomalies and the ecology of the North Sea. Mar. Ecol. Prog. Ser.,239, 1–10.
Frid, C. L. J., Newton, L. C. and Williams, J. A. (1994) The feedingrates of Pleurobrachia (Ctenophora) and Sagitta (Chaetognatha), withnotes on the potential seasonal role of planktonic predators in thedynamics of North Sea zooplankton communities. Neth. J. Aquat.
Ecol., 28, 181–191.
Fromentin, J.-M. and Planque, B. (1996) Calanus and environment inthe eastern North Atlantic. II. Influence of the North Atlantic
D. ELOIRE ET AL. j TWENTY YEARS OF ZOOPLANKTON SAMPLING AT STATION L4
677
at Plym
outh Marine Laboratory on A
pril 13, 2010 http://plankt.oxfordjournals.org
Dow
nloaded from

Oscillation on C. finmarchicus and C. helgolandicus. Mar. Ecol. Prog. Ser.,134, 111–118.
Halsband-Lenk, C., Hirche, H.-J. and Carlotti, F. (2002) Temperatureimpact on reproduction and development of congener copepodpopulations. J. Exp. Mar. Biol. Ecol., 271, 121–153.
Halsband-Lenk, C., Carlotti, F. and Greve, W. (2004) Life-history strat-egies of calanoid congeners under two different climate regimes: acomparison. ICES J. Mar. Sci., 61, 709–720.
Harvey, H. W., Cooper, L. H. N., Lebour, M. V. et al. (1935) Planktonproduction and its control. J. Mar. Biol. Assoc. UK, 20, 407–442.
Hays, G. C., Carr, M. R. and Taylor, A. H. (1993) The relationshipbetween Gulf Stream position and copepod abundance derivedfrom the Continuous Plankton Recorder Survey: separating biologi-cal signal from sampling noise. J. Plankton Res., 15, 1359–1373.
Helaouet, P. and Beaugrand, G. (2007) Macroecology of Calanus fin-
marchicus and C. helgolandicus in the North Atlantic Ocean and adja-cent seas. Mar. Ecol. Prog. Ser., 345, 147–165.
Highfield, J. M., Eloire, D., Conway, D. V. P. et al. (2010) Seasonaldynamics of meroplankton assemblage at L4. J. Plankton Res., 32,681–691.
Hirst, A. G., Bonnet, D. and Harris, R. P. (2007) Seasonal dynamicsand mortality rates of Calanus helgolandicus over two years at a stationin the English Channel. Mar. Ecol. Prog. Ser., 340, 189–205.
Holligan, P. M. and Harbour, D. S. (1977) The vertical distributionand succession of phytoplankton in the western English Channel in1975 and 1976. J. Mar. Biol. Assoc. UK, 57, 1075–1093.
Holligan, P. M., Harris, R. P., Newell, R. C. et al. (1984) Vertical distri-bution and partitioning of organic carbon in mixed, frontal andstratified waters of the English Channel. Mar. Ecol. Prog. Ser., 14,111–127.
Hurrell, J. W. (1995) Decadal trends in the North Atlantic Oscillation:regional temperatures and precipitation. Science, 269, 676–679.
Ibanez, F., Fromentin, J. M. and Castel, J. (1993) Application de lamethode des sommes cumulees a l’analyse des series chronologiquesen oceanographie. Comptes Rendus de l’Academie des Science de Paris,
Sciences de la Vie/Life Sciences, 316, 745–748.
Irigoien, X. and Harris, R. P. (2003) Interannual variability of Calanus
helgolandicus in the English Channel. Fish. Oceanogr., 12, 317–326.
Irigoien, X., Harris, R. P., Head, R. N. et al. (2000) North AtlanticOscillation and spring bloom phytoplankton composition in theEnglish Channel. J. Plankton Res., 22, 1367–2371.
Johns, D. G., Edwards, M., Greve, W. et al. (2005) Increasing preva-lence of the marine cladoceran Penilia avirostris (Dana, 1852) in theNorth Sea. Helgol. Mar. Res., 59, 214–218.
Kane, J. and Prezioso, J. (2008) Distribution and multi-annual abun-dance trends of the copepod Temora longicornis in the US NortheastShelf Ecosystem. J. Plankton Res., 30, 619–632.
Kirby, R. R., Beaugrand, G., Lindley, J. A. et al. (2007) Climate effectsand benthic-pelagic coupling in the North Sea. Mar. Ecol. Prog. Ser.,330, 31–38.
Kirby, R. R., Beaugrand, G. and Lindley, J. A. (2008)Climate-induced effects on the meroplankton and the benthic-pelagic ecology of the North Sea. Limnol. Oceanogr., 53, 1805–1815.
Lambshead, P. J. D., Platt, H. M. and Shaw, K. M. (1983) The detec-tion of differences among assemblages of marine benthic speciesbased on an assessment of dominance and diversity. J. Nat. Hist.,17, 859–874.
Lindley, J. A. and Daykin, S. (2005) Variations in the distributions ofCentropages chierchiae and Temora stylifera (Copepoda: Calanoida) in thenorth-eastern Atlantic Ocean and western European shelf waters.ICES J. Mar. Sci., 62, 869–877.
MacKenzie, B. R. and Koster, F. W. (2004) Fish production andclimate: sprat in the Baltic Sea. Ecology, 85, 784–794.
Nicholas, K. R. and Frid, C. L. J. (1999) Occurrence of hydromedu-sae in the plankton off Northumberland (western central NorthSea) and the role of planktonic predators. J. Mar. Biol. Assoc. UK,79, 979–992.
O’Brien, T. D., Lopez-Urrutia, A., Wiebe, P. H. et al. (2008) ICESZooplankton Status Report 2006/2007. ICES Cooperative Research
Report No. 292, 168 pp.
Øresland, V. (1986) Temporal distribution of size and maturity stagesof the chaetognath Sagitta setosa in the western English Channel.Mar. Ecol. Prog. Ser., 29, 55–60.
Ottersen, G., Planque, A., Belgrano, A. et al. (2001) Ecological effectsof the North Atlantic Oscillation. Oecologia, 128, 1–14.
Perry, R. I., Batchelder, H. P., Mackas, D. L. et al. (2004) Identifyingglobal synchronies in marine zooplankton populations: issues andopportunities. ICES J. Mar. Sci., 61, 445–456.
Pingree, R. D. (1980) Physical Oceanography of the Celtic Sea andthe English Channel. In Banner, F. T., Collins, B. and Massie, K. S.(eds), The Northwest European Shelf Seas: The Sea-bed and the Sea in
Motion. Elsevier, Amsterdam, 638 pp.
Pingree, R. D., Holligan, P. M., Mardell, G. T. et al. (1976) The influ-ence of physical stability on spring, summer and autumn phytoplank-ton blooms in the Celtic Sea. J. Mar. Biol. Assoc. UK, 56, 845–873.
Pingree, R. D., Holligan, P. M. and Mardell, G. T. (1978) The effectsof vertical stability on phytoplankton distributions in the summer onthe northwest European Shelf. Deep-Sea Res., 25, 1011–1028.
Piontkovski, S. A., O’Brien, T. D., Fonda-Umani, S. et al. (2006)Zooplankton and the North Atlantic oscillation: a basin-scale analy-sis. J. Plankton Res., 28, 1039–1046.
Planque, B. and Fromentin, M. (1996) Calanus and environment inthe eastern North Atlantic. I. Spatial and temporal patterns ofC. finmarchicus and C. helgolandicus.. Mar. Ecol. Prog. Ser., 134, 101–109.
Pond, D., Harris, R., Head, R. et al. (1996) Environmental and nutri-tional factors determining seasonal variability in the fecundity andegg viability of Calanus helgolandicus in coastal waters off Plymouth,UK. Mar. Ecol. Prog. Ser., 143, 45–63.
Pyper, B. J. and Peterman, R. M. (1998) Comparison of methods toaccount for autocorrelation in correlation analyses of fish data.Can. J. Fish. Aquat. Sci., 55, 2127–2140.
Quenouille, N. H. (1952) Associated Measurements. Butterworths, 241 pp.
Reid, C. and Planque, B. (2000) Long-term planktonic variations andthe climate of the North Atlantic. In Mills, D. (ed.), The Ocean Life of
Atlantic Salmon: Environmental and Biological Factors Influencing Survival.Fishing News Books, Oxford, pp. 153–169.
Richardson, A. J. (2008) In hot water: zooplankton and climatechange. ICES J. Mar. Sci., 65, 279–295.
Rodrıguez, F., Fernandez, E., Head, R. N. et al. (2000) Temporalvariability of viruses, bacteria, phytoplankton and zooplankton inthe western English Channel off Plymouth. J. Mar. Biol. Assoc. UK,80, 575–586.
Roff, J. C., Middlebrook, K. and Evans, F. (1988) Long-term variabil-ity in North Sea zooplankton off the Northumberland coast:
JOURNAL OF PLANKTON RESEARCH j VOLUME 32 j NUMBER 5 j PAGES 657–679 j 2010
678
at Plym
outh Marine Laboratory on A
pril 13, 2010 http://plankt.oxfordjournals.org
Dow
nloaded from

productivity of small copepods and analysis of trophic interactions.J. Mar. Biol. Assoc. UK, 68, 143–164.
Russell, F. S. (1935) On the value of certain plankton animals as indi-cators of water movements in the English Channel and North Sea.J. Mar. Biol. Assoc. UK, 20, 309–331.
Santer, B. D., Wigley, T. M. L., Boyle, J. S. et al. (2000) Statistical sig-nificance of trends and trend differences in layer-average atmos-pheric temperature time series. J. Geophys. Res., 105, 7337–7356.
Smyth, T. J., Fishwick, J. R., Al-Moosawi, L. et al. (2010) A broadspatio-temporal view of the Western English Channel observatory.J. Plankton Res., 32, 581–601.
Southward, A. J. (1963) The distribution of some plankton animals inthe English Channel and approaches. III. Theories about long-termbiological changes, including fish. J. Mar. Biol. Assoc. UK, 43, 1–29.
Southward, A. J. (1984) Fluctuations in the “indicator” ChaetognathsSagitta elegans and Sagitta setosa in the Western Channel. Oceanol. Acta,7, 229–239.
Southward, A. J., Hawkins, S. J. and Burrows, M. T. (1995) Seventyyears’ observations of changes in distribution and abundance of zoo-plankton and intertidal organisms in the Western English Channel inrelation to rising sea temperature. J. Therm. Biol., 20, 127–155.
Southward, A. J., Langmead, O., Hardman-Mountford, N. J. et al.(2005) Long-term oceanographic and ecological research in theWestern English Channel. Adv. Mar. Biol., 47, 1–105.
Taylor, A. H. and Stephens, J. A. (1980) Latitudinal displacements ofthe Gulf Stream (1966 to 1977) and their relation to changes intemperature and zooplankton abundance in the NE Atlantic.Oceanol. Acta, 3, 145–149.
UNESCO (ed.) (1968) Monographs on Oceanographic Methodology:
Zooplankton Sampling. United Nations, Paris.
Valdes, L., Lopez-Urrutia, A., Cabal, J. et al. (2007) A decade ofsampling in the Bay of Biscay: what are the zooplankton time seriestelling us? Prog. Oceanogr., 74, 98–114.
Villate, F., Moral, M. and Valencia, V. (1997) Mesozooplanktoncommunity indicates climate changes in a shelf area of the innerBay of Biscay throughout 1988 to 1990. J. Plankton Res., 19,1617–1636.
Widdicombe, C. E., Eloire, D., Harbour, D. et al. (2010) Long-termphytoplankton community dynamics in the Western EnglishChannel. J. Plankton Res., 32, 643–655.
Williams, R. and Collins, N. R. (1985) Chaetognaths and ctenophoresin the holoplankton of the Bristol Channel. Mar. Biol., 85, 97–107.
D. ELOIRE ET AL. j TWENTY YEARS OF ZOOPLANKTON SAMPLING AT STATION L4
679
at Plym
outh Marine Laboratory on A
pril 13, 2010 http://plankt.oxfordjournals.org
Dow
nloaded from