GE Sensing & Inspection Technologies Transport ® PT878 Portable Liquid Ultrasonic Flowmeter
Upload
khangminh22Category
view
3download
0
Technologies for sensing bicycles and their
application at metropolitan intersections
CURTIN-MONASH
ACCIDENT RESEARCH CENTRE
Faculty of Health Sciences
Curtin University
Hayman Road
Bentley WA 6102
Dr Michelle Hobday
March 2019

ii
CURTIN-MONASH ACCIDENT RESEARCH CENTRE
DOCUMENT RETRIEVAL INFORMATION
__________________________________________________________________________
Report No. Project No. Date Pages ISBN
RR 19-02 19-02 RSC March 2019 50+ N/A
____________________________________________________________________
Title
Technologies for sensing bicycles and their application at metropolitan intersections
_____________________________________________________________________
Author(s)
Dr Michelle Hobday
___________________________________________________________________________
Performing Organisation
Curtin-Monash Accident Research Centre (C-MARC)
Faculty of Health Sciences
Curtin University
Hayman Road
BENTLEY WA 6102
Tel: (08) 9266-2304
www.c-marc.curtin.edu.au
___________________________________________________________________________
Sponsor
Road Safety Commission
Level 1, 151 Royal Street
East Perth WA 6004
___________________________________________________________________________
Abstract
This report examined methods of improving safety for cyclists at intersections, with particular
emphasis on sensing technologies. Bicycle sensing can either be active (push button) or passive
(e.g., inductive loop sensors, video, radar or LiDAR). The timing and co-ordination of traffic
signals, and the geometric design and pavement markings of roads can also be used to promote
cyclist safety. The characteristics of cyclist crashes at intersections were examined for the
period 2008 to 2017 and high risk intersections were identified and ranked, using the KSI
metric. Notably, only two of the highest risk intersections were signalised, so sensing
technology at intersections, which can impact on timing of signals, would only be appropriate
at these intersections. Signalising the remaining intersections, and installing sensing technology
such as appropriately designed and positioned inductive coil sensors, should be considered for
the remaining intersections.
Keywords
Crash, Road Safety, Bicycle safety, Safe System approach, Intersections
___________________________________________________________________________
Disclaimer
This report is disseminated in the interest of information exchange. The views expressed here
are those of the authors and not necessarily those of Curtin University or Monash University.
___________________________________________________________________________

iii
TABLE OF CONTENTS
LIST OF TABLES ................................................................................................................... v
LIST OF FIGURES ................................................................................................................ vi
LIST OF MAPS ...................................................................................................................... vii
EXECUTIVE SUMMARY ................................................................................................... viii
1 INTRODUCTION ................................................................................................................ 14
1.1 Aims 15
2 METHODS ........................................................................................................................... 16
2.1 Study Design .................................................................................................................. 16 2.2 Review of literature ....................................................................................................... 16 2.3 Crash analysis data requirements ................................................................................... 16
2.3.1 Crash Data ............................................................................................................ 16 2.4 Statistical analysis .......................................................................................................... 17
2.5 Recommendations .......................................................................................................... 17 2.6 Ethics approval .............................................................................................................. 18
3 LITERATURE REVIEW ..................................................................................................... 19 3.1 Bicycle sensing at intersections ..................................................................................... 19
3.1.1 Active detection .................................................................................................... 19 3.1.2 Passive detection .................................................................................................. 20
3.2 Sensing technology on the bicycle and other motorised vehicles ................................. 23
3.2.1 Bicycle detection systems designed for intersections and to prevent crashes ...... 23
3.2.2 Radar .................................................................................................................... 23 3.2.3 LiDAR .................................................................................................................. 24 3.2.4 Combination systems ........................................................................................... 24
3.2.5 RFID (Radio frequency identification) ................................................................ 25 3.3 Advanced driver assistance systems on motor vehicles which can detect bicycles ...... 25
3.4 Cooperative systems ...................................................................................................... 25 3.5 The use of traffic signals to improve cyclist safety ....................................................... 26
3.5.1 Optimising signal timing and sequencing for bicycles......................................... 26
3.5.2 Demanding bicycle phases ................................................................................... 27 3.6 Road features at or approaching intersections ............................................................... 28
3.6.1 Pavement markings .............................................................................................. 28
3.6.2 Regulatory signage ............................................................................................... 30
3.6.3 Reduced kerb radius ............................................................................................. 31 3.6.4 Width of lane ........................................................................................................ 31 3.6.5 Raised bicycle crossings ....................................................................................... 31 3.6.6 Protected (‘Dutch-style’) intersection design ....................................................... 31 3.6.7 Roundabouts ......................................................................................................... 31
4 RESULTS ............................................................................................................................. 33 4.1 Overview ........................................................................................................................ 33 4.2 Descriptive statistics ...................................................................................................... 33 4.3 High-risk intersections ................................................................................................... 39
4.3.1 Cyclist KSI metric ................................................................................................ 39

iv
4.3.2 Intersections with bicycle fatalities ...................................................................... 43
5 RECOMMENDATIONS FOR INDIVIDUAL HIGH-RISK INTERSECTIONS .............. 46 5.1 Welshpool Road East and Lesmurdie Road, Lesmurdie ............................................... 46
5.2 Marmion Avenue and Marina Boulevard, Clarkson ...................................................... 47 5.3 Marmion Avenue, Anchorage Drive and Neerabup Road, Heathridge ......................... 50 5.4 Ardross Street and Macrae Road, Applecross ............................................................... 52 5.5 South Perth Esplanade and Mends Street, South Perth ................................................. 54 5.6 Wellington Street and George Street, Perth ................................................................... 56
5.7 South Street and Marine Terrace, South Fremantle ....................................................... 58 5.8 Beeliar Drive and Wentworth Parade, Success.............................................................. 59 5.9 Conclusion ..................................................................................................................... 61
6 REFERENCES ..................................................................................................................... 62

v
LIST OF TABLES
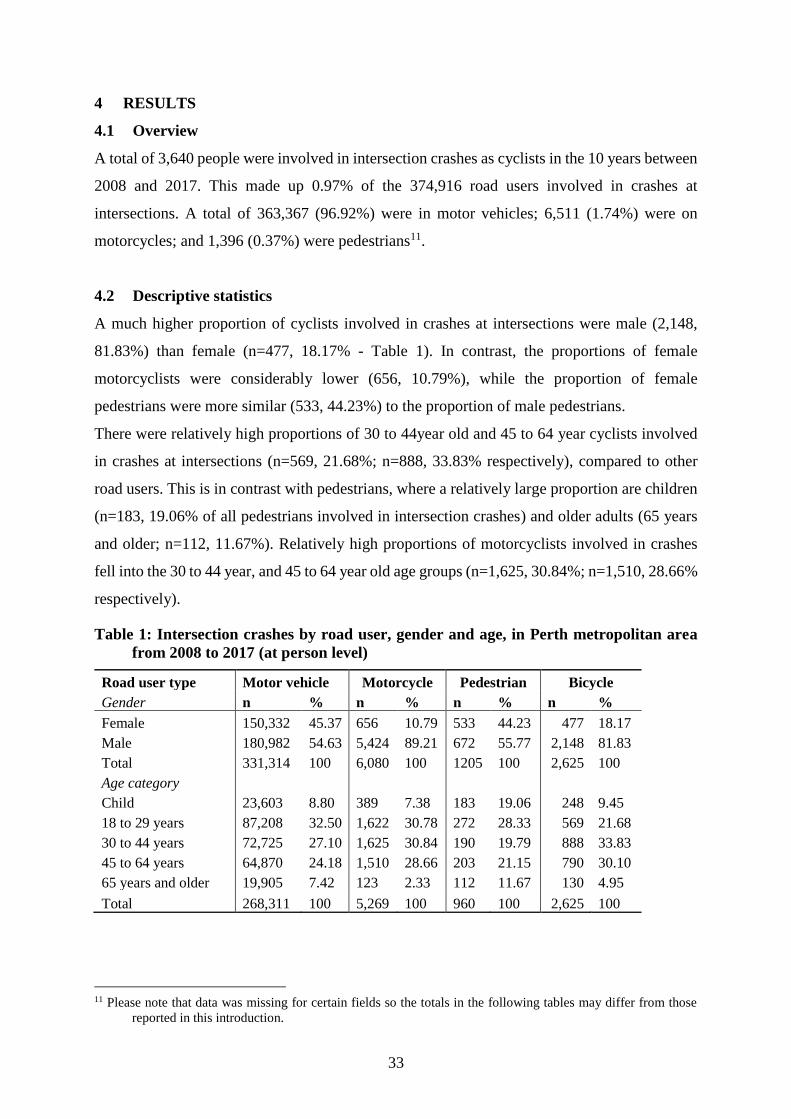
Table 1: Intersection crashes by road user, gender and age, in Perth metropolitan area from
2008 to 2017 (at person level) .......................................................................... 33
Table 2: Intersection crashes by road user and road characteristics, in Perth metropolitan area
from 2008 to 2017 (at crash level) .................................................................... 35
Table 3: Intersection crashes involving cyclists by gender and age, in Perth metropolitan area
from 2008 to 2017 (at person level) ................................................................. 36
Table 4: Intersection crashes involving cyclists by crash severity, gender and age, in Perth
metropolitan area from 2008 to 2017 (at person level) .................................... 37
Table 5: Intersection crashes involving cyclists by crash severity and time of crash, in Perth
metropolitan area from 2008 to 2017 (at crash level)....................................... 38
Table 6: Intersections with cyclist crashes ranked by cyclist KSI metric, in Perth metropolitan
area from 2013 to 2017 ..................................................................................... 40
Table 7: Intersections with cyclist fatalities, in Perth metropolitan area from 2013 to 2017 .. 44

vi
LIST OF FIGURES
Figure 1: Intersection crashes by road user and year, in Perth metropolitan areas from 2008 to
2017 (at crash level) ......................................................................................... 34
Figure 2: Welshpool Road and Lesmurdie Road, Lesmurdie .................................................. 47
Figure 3: Marmion Avenue and Marina Boulevard, Clarkson ................................................. 49
Figure 4: Marmion Avenue, Anchorage Drive and Neerabup Road, Heathridge .................... 51
Figure 5: Ardross Street and MacRae Road, Applecross ......................................................... 53
Figure 6: South Perth Esplanade and Mends Street, South Perth ............................................ 55
Figure 7: Wellington Street and George Street, Perth .............................................................. 57
Figure 8: South Street and Marine Terrace, South Fremantle .................................................. 58
Figure 9: Beeliar Drive and Wentworth Parade, Success ........................................................ 60

vii
LIST OF MAPS
Map 1: Map of Perth metropolitan area indicating intersections with a cyclist KSI metric of 2
or more (red circle) between 2013 and 2017. ................................................... 41
Map 2: Map of inner Perth metropolitan area indicating intersections with a cyclist KSI metric
of 2 or more (red circle12) between 2013 and 2017 .......................................... 42
Map 3: Map of Perth metropolitan area indicating intersections with any cyclist fatalities (blue
triangle) between 2008 and 2017 ...................................................................... 45

viii
EXECUTIVE SUMMARY
Introduction
Cycling is being encouraged in Western Australia, both as a means of transport (‘active
transportation’) and a recreational activity. In addition to the health benefits of cycling, it is an
economical mode of transport, both for the individual and in terms of public infrastructure, and
uses less space than motor vehicles (Pucher and Buehler, 2008). The anticipated increases in
the number of cyclists and the cumulative distance travelled by them, plus the challenges of
sensing bicycles as autonomous vehicles develop, may lead to increases in crashes and injuries
involving cyclists unless changes to speed and infrastructure are made to reduce conflicts with
other road users (Wegman et al., 2012).
Method
The aims of the study are to
a) review literature on technologies relating to the safety of bicycles when approaching
intersections and,
b) to make recommendations with respect to the technologies’ applicability and ability to
reduce cyclist crashes at intersections in Perth metropolitan area.
The objectives of this part of the study were to:
1. Identify literature relating to bicycle sensing technology available on the market or
being trialled within and outside of Australia;
2. Undertake a review of this literature
3. Review and analyse crash data relating to cyclists (compared to pedestrians, motor
vehicle drivers and motorcyclists) over the last 10 years at intersections in metropolitan
Perth.
4. Identify the intersections where cyclists are at most risk;
5. Make recommendations with respect to:
• the application of the technology at these intersections (how difficult/easy would
it be to implement, who are the stakeholders); and
• the anticipated effectiveness of these treatments on crashes involving cyclists.

ix
Review of literature
Multiple sources were used to undertake a review of literature up to the beginning of 2019.
These included the websites of government, and road safety information organisations.
In addition, grey literature (primarily technical reports and conference papers) and published,
peer-reviewed journal articles were sourced.
Crash analysis data requirements
Crash Data: Ten years of crash data (2008 to 2017) was extracted from the Integrated Road
Information System (IRIS), for the Perth metropolitan area. Unit record information was
required for each person involved in each crash. Crashes were flagged as involving cyclists,
pedestrians, motorcyclists and motor vehicle drivers and occurring at intersections.
Analysis
Crash data were summarised according to road user type by demographic details (age and sex)
of the road user, time and year of the crash and conditions at the crash.
High-risk intersections for cyclist crashes were identified using the KSI (killed or serious
injury1) metric. The most recent five years of data (2013 to 2017) were used in this analysis.
The metric represents the total number of KSI crashes plus the factored-up medical crashes
(Main Roads, 2016). Intersections where any cyclist fatalities occurred over the total study
period (2008 to 2017) were also identified.
Recommendations
The intersections with the highest cyclist KSI metric (eight intersections) were examined more
closely for possible factors which might affect cyclists’ safety and their risk of a crash, using
Google Maps and Nearmap. Recommendations for improved safety were then made, based on
these findings and the literature review.
1 A killed or serious injury (KSI) crash is defined as a road crash that resulted in at least one person being either
killed (“killed immediately or died within 30 days of the day of the road crash as a result of the crash”) or seriously
injured (“admitted to hospital as a result of the road crash and who does not die from injuries sustained in the
crash within 30 days of the crash”). KSI crashes therefore include all fatal and hospitalisation crashes.

x
Literature Review
Bicycle sensing at intersections
Bicycle sensing can either be active or passive. Active detection requires the road user to
activate the signal, usually a push button. Facilities need to be provided so on-road cyclists can
safely access these. Supplementary signage should be provided to alert cyclists to the need to
activate the signal.
Passive detection of cyclists at intersections may be through inductive loop detectors, video or
other methods of detection. Inductive loop detectors are embedded in the road and connect to
the traffic control system so that traffic phases adapt as vehicles arrive at an intersection.
Inductive loop detectors need to be designed and positioned to maximise detection of bicycles,
and ideally a bicycle detector symbol should be painted at the most sensitive place on the
pavement. Video detection needs to be adapted for cyclists due to their small size compared to
a motor car, but high speed compared to a pedestrian. Other methods of passive detection
include using microwave radar and piezo-detectors.
Other forms of sensing technology are mounted on the bicycle or other vehicles. These tend to
be part of systems, where a sensing device, using radar or LiDAR, sends messages to another
unit or small computer to alert the driver or cyclist of the presence and speed of an approaching
road user. More advanced systems included advanced driver assistance systems which detect
vulnerable road users to alert drivers and avoid crashes, and cooperative systems (between
vehicles, or vehicles and infrastructure).
The use of traffic signals to improve cyclist safety
The timing of traffic signals or coordination of several intersections can be adjusted to improve
the traffic flow and safety of cyclists. Bicycle signal lanterns can also be used to reduce conflict
between motor vehicles and bicycles. Demanding bicycle phases, such as auto-introduction or
early starts may be used in areas with high cyclist volumes to improve safety.
Road features at or approaching intersections
Pavement markings to improve the safety of cyclists at intersections. These include bike boxes
(or bicycle storage areas), hook turn storage boxes, advanced cycle lanes, merge and weave
area redesign and other markings. These areas can be painted (‘Emerald Green’ in Australia) to
increase their visibility.

xi
Regulatory signage can be used to alert motorists to the presence of cyclists and to encourage
them to yield to cyclists, particularly in high conflict areas. They can also be used to direct
cyclists.
Other aspects of road design that can be used to improve cyclist safety are reducing the kerb
radius (to slow down turning vehicles) and matching the width of a lane on the approach and
through the intersections. Raised bicycle crossings and protected intersection designs may also
improve safety.
Results
Descriptive statistics
A total of 3,640 people were involved in intersection crashes as cyclists in the 10 years between
2008 and 2017. This made up 0.97% of the 374,916 road users involved in crashes at
intersections. Of these, 363,367 (96.92%) were in motor vehicles; 6,511 (1.74%) were on
motorcycles; and 1,396 (0.37%) were pedestrians2. A much higher proportion of cyclists
involved in crashes at intersections were male (n=2,148, 81.83%) than female (n=477, 18.17%).
There were relatively high proportions of 30 to 44year old and 45 to 64 year cyclists involved
in crashes at intersections (n=569, 21.68%; n=888, 33.83% respectively), compared to other
road users.
A relatively high proportion of crashes involving cyclists occurred at three way intersections
(n=331, 48.53%), compared to at roundabouts (n=150, 21.99%) and at four-way intersections
(n=197, 28.89%).
The highest proportion of cyclist crashes at intersections were property damage only crashes
(n=1,565, 47.37%). Those aged 65 years and older were involved in relatively higher
proportions of fatal crashes (35.71%) and crashes leading to hospitalisation (6.14%), compared
to other age groups.
The highest proportion of cyclist intersection crashes resulting in fatalities relative to less
serious crashes occurred between 06h00 and 09h59 (n=5, 35.71%) and between 10h00 and
15h59 (n=6, 42.86%). In terms of absolute numbers, the highest number of fatalities for cycling
intersection crashes occurred over the middle of the day (10h00 to 15h59, n=6), and highest
2 Please note that data was missing for certain fields so the totals in the following tables may differ from those
reported in this introduction.

xii
number of hospitalisation and medical treatment crashes were between 06h00 and 09h59
(n=230 and n=453 respectively.)
High-risk intersections
Twenty-five intersections had a cyclist KSI metric of two or more (covering the period 2013 to
2017). Of these, eight had cyclist KSI metrics of above two. Of these eight highest risk
intersections, only two were signalised. Five of these intersections were three way intersections,
two were roundabouts and the remaining one was a four way intersection.
Fourteen cyclist fatalities occurred, one at each of 14 intersections between 2008 and 2017.
Recommendations for high risk intersections for cyclists
Recommendations are made for the eight intersections with a cyclist KSI metric of more than
2 between 2013 and 2017:
1. Welshpool Road East and Lesmurdie Road, Lesmurdie
This unsignalised three way intersection had the highest cyclist KSI metric in the Perth
metropolitan area between 2013 and 2017. Measures should be taken to improve the visibility
of cyclists. Signalisation of this intersection should be considered.
2. Marmion Avenue and Marina Boulevard, Clarkson
This three way intersection is unsignalised. It has the joint second highest KSI metric. The
intersection requires improved footpaths on the west side of Marmion Avenue, and facilities to
improve the safety of cyclists turning into Marina Boulevard: either signalisation with cyclist
sensing or a grade separated path for cyclists.
3. Marmion Avenue, Anchorage Drive and Neerabup Road, Heathridge
This unsignalised high-speed roundabout has the joint second highest cyclist KSI metric in the
Perth metropolitan area. Facilities such as active sensing and signalisation of crossings, and
grade-separated paths for cyclists, would improve safety for cyclists (and pedestrians).

xiii
4. Ardross Street and Macrae Road, Applecross
This single lane roundabout, where two 50km/h roads intersect, is the next highest risk
intersection for cyclists. Alerts to cyclists of the higher risk of this intersection (such as flashing
signs activated by sensors) would assist in increasing the safety of this roundabout.
5. South Perth Esplanade and Mends Street, South Perth
This unsignalised, three way intersection is situated close to the South Perth foreshore (favoured
by recreational cyclists) and the Mends Street Jetty (for the ferry). The intersection could be
improved by a dedicated cycle path north of the Boulevard or by signalisation with a cyclist-
specific phase, which could be activated by a passive sensor.
6. Wellington Street and George Street, Perth
This four way intersection is signalised, with inductive loops under the vehicle lanes. It is
suggested that crossing facilities be provided for cyclists (and pedestrians) on the east/west side
of the intersection.
7. South Street and Marine Terrace, South Fremantle
This site is a three way intersection which is not signalised. Facilities for cyclists and
pedestrians have improved near this intersection in recent years, but better facilities should be
provided for cyclists travelling straight along Marine Terrace, who come into conflict with
turning motor vehicles.
8. Beeliar Drive and Wentworth Parade, Success
This four way intersection is signalised. It is located close to larger intersection. Both
intersections are provided with a wide variety of facilities for motor vehicles and other road
users. It is suggested that the two intersections’ facilities be re-evaluated as a system, and
changes made accordingly.

14
1 INTRODUCTION
Cycling is being encouraged in Western Australia, both as a means of transport (‘active
transportation) and a recreational activity. Cycling differs from motorised transport (including
motor vehicles and motorcycles) in that it does not produce noise or air pollution. Cycling uses
no motor fuel (for example, petrol or electric batteries) as the energy is produced directly by
the cyclist’s body, in the form of cardiovascular exercise3 (Pucher and Buehler, 2008). As a
result, cycling improves physical fitness and reduces respiratory disease at a population level
(Stevenson et al., 2016). Research has found that the health benefits of cycling are largest in
older people (Woodcock et al., 2014). In addition to the health benefits of cycling, it is an
economical mode of transport, both for the individual and in terms of public infrastructure, and
uses less space than motor vehicles (Pucher and Buehler, 2008).
The Transport @ 3.5 million Cycling Network Plan aims to develop routes to provide links
between important locations in Perth (Department of Transport Western Australia and Main
Roads Western Australia, 2016). The plan develops guidelines to develop Perth into a “…great
cycling city…”. The plan explicitly states that safety is a priority and describes the importance
of routes incorporating shared paths and low speed (30km/h) roads.
Cyclists are a priority group identified in the Government of Western Australia’s current road
safety strategy “Towards Zero” (Office of Road Safety, 2009). Cyclists have been identified
as a high priority group because they are vulnerable road users and are at higher risk of traffic
crashes because they are unprotected by an external device that would “absorb energy in a
collision” (pp. 1, Constant and Lagarde, 2010). The anticipated increases in the number of
cyclists and the cumulative distance travelled by cyclists, plus the challenges of sensing bicycles
as autonomous vehicles develop, may lead to increases in crashes and injuries involving cyclists
unless changes to speed and infrastructure are made to reduce conflicts with other road users
(Wegman et al., 2012). An additional challenge is the identification of bicycles (and
pedestrians) by autonomous vehicles and the prioritisation of different road users by
autonomous vehicles (Awad et al., 2018). Autonomous vehicles may be better able to negotiate
quieter back streets, which tend to be used by cyclists to avoid motorised traffic, which could
also increase risk to cyclists (Richards, 2018).
3 The exception to this is an electric bike. Electric bikes do, however, also allow cyclists to get cardiovascular
exercise.

15
1.1 Aims
The aims of the study are to
a) review literature on technologies relating to the safety of bicycles when approaching
intersections and,
b) to make recommendations with respect to the technologies’ applicability and ability to
reduce cyclist crashes at intersections in Perth metropolitan area.
The objectives of this part of the study were to:
1. Identify literature relating to bicycle sensing technology available on the market or
being trialled within and outside of Australia;
2. Undertake a review of this literature
3. Review and analyse crash data relating to cyclists (compared to pedestrians, motor
vehicle drivers and motorcyclists) over the last 10 years at intersections in metropolitan
Perth.
4. Identify the intersections where cyclists are at most risk;
5. Make recommendations with respect to:
• the application of the technology at these intersections (how difficult/easy would it be
to implement, who are the stakeholders); and
• the anticipated effectiveness of these treatments on crashes involving cyclists.

16
2 METHODS
2.1 Study Design
This study consisted of three parts:
1. A literature review;
2. A retrospective population-based crash data analysis of the Perth metropolitan area between
2008 and 2017, and selection of the highest risk intersections for cyclists;
3. Analysis of the highest risk intersection and provision of recommendations, based on the
study findings, the literature and policy in other jurisdictions.
2.2 Review of literature
Multiple sources were used to undertake a review of literature up to early 2019. These included
government documents, commercial organisations involved in developing sensing technology
and intelligent road design, road safety information websites, grey literature (primarily
technical reports and conference papers) and published, peer-reviewed journal articles.
Grey and peer-reviewed literature were obtained by searching Google Scholar, ResearchGate
and various library databases. The search terms to be searched include the following:
“intelligent intersections”, “automated intersections”, “bicycle sensor”, “bicycle detect*”.
Furthermore, publications of authors who had published widely in the area or had a significant
publication relevant to the topic, and publications citing or cited by relevant articles were also
assessed.
2.3 Crash analysis data requirements
2.3.1 Crash Data
Ten years of crash data was extracted from the Integrated Road Information System (IRIS),
maintained by Main Road Western Australia. Crash data was used for the period 1 January
2008 to 31 December 2017 for the Perth metropolitan area. Unit record information was
required for each person involved in each crash, including: accident number; accident type; sex,
age; road user type (e.g., pedestrian, cyclist, motorcyclists, motor vehicle driver); date, time,
and location details (including geocoding data) of the crash; all collected information on the
nature and circumstance of the crash; and severity of the crash based on the most severe injury
recorded for an involved road user. Crashes were flagged as involving cyclists, pedestrians,
motorcyclists and motor vehicles: using the ‘U-type’ (vehicle type) variable for bicycles,
motorcycles and motor vehicles, for example the U-type code for bicycles is 9, and the RUM

17
code for pedestrian crashes (98 or 1 to 9); and occurring at intersections (using ‘accident type’
variable).
2.4 Statistical analysis
Crash data were summarised according to road user type by demographic details (age and sex)
of the road user, time and year of the crash and conditions at the crash.
High-risk intersections for cyclist crashes were identified using the KSI (killed or serious
injury4) metric. The KSI metric is a measure of crash density or collective risk, calculated over
a five year period. The most recent five years of data (2013 to 2017) were used in this analysis.
The metric represents the total number of KSI crashes plus the factored-up medical crashes
(Main Roads, 2016). Intersections were ranked using the KSI metric for cyclist crashes only.
Equation 1: KSI metric
𝐾𝑆𝐼 𝑚𝑒𝑡𝑟𝑖𝑐(𝑓𝑜𝑟 𝑐𝑦𝑐𝑙𝑖𝑠𝑡 𝑐𝑟𝑎𝑠ℎ𝑒𝑠 𝑎𝑡 𝑎𝑛 𝑖𝑛𝑡𝑒𝑟𝑠𝑒𝑐𝑡𝑖𝑜𝑛) =
∑ [𝑁𝑜. 𝑜𝑓 𝐾𝑆𝐼 𝑐𝑟𝑎𝑠ℎ𝑒𝑠(𝑓𝑜𝑟 𝑐𝑦𝑐𝑙𝑖𝑠𝑡 𝑐𝑟𝑎𝑠ℎ𝑒𝑠 𝑎𝑡 𝑡ℎ𝑒 𝑖𝑛𝑡𝑒𝑟𝑠𝑒𝑐𝑡𝑖𝑜𝑛) + 𝑆𝑒𝑣𝑒𝑟𝑖𝑡𝑦 𝐼𝑛𝑑𝑒𝑥 ×𝑧
𝑁𝑜. 𝑜𝑓 𝑚𝑒𝑑𝑖𝑐𝑎𝑙 𝑐𝑟𝑎𝑠ℎ𝑒𝑠(𝑓𝑜𝑟 𝑐𝑦𝑐𝑙𝑖𝑠𝑡 𝑐𝑟𝑎𝑠ℎ𝑒𝑠 𝑎𝑡 𝑡ℎ𝑒 𝑖𝑛𝑡𝑒𝑟𝑠𝑒𝑐𝑡𝑖𝑜𝑛)]
where
𝑆𝑒𝑣𝑒𝑟𝑖𝑡𝑦 𝐼𝑛𝑑𝑒𝑥
= 𝑁𝑢𝑚𝑏𝑒𝑟 𝑜𝑓 𝐾𝑆𝐼 𝑐𝑟𝑎𝑠ℎ𝑒𝑠 𝑎𝑡 𝑖𝑛𝑡𝑒𝑟𝑠𝑒𝑐𝑡𝑖𝑜𝑛𝑠 𝑖𝑛𝑣𝑜𝑙𝑣𝑖𝑛𝑔 𝑐𝑦𝑐𝑙𝑖𝑠𝑡𝑠
𝑁𝑢𝑚𝑏𝑒𝑟 𝑜𝑓 𝐶𝑎𝑠𝑢𝑎𝑙𝑡𝑦 𝑐𝑟𝑎𝑠ℎ𝑒𝑠 𝑎𝑡 𝑖𝑛𝑡𝑒𝑟𝑠𝑒𝑐𝑡𝑖𝑜𝑛𝑠 𝑖𝑛𝑣𝑜𝑙𝑣𝑖𝑛𝑔 𝑐𝑦𝑐𝑙𝑖𝑠𝑡𝑠
Intersections where any cyclist fatalities occurred over the whole study period (2008 to 2017)
were also identified.
2.5 Recommendations
The intersections with the highest cyclist KSI metric were examined more closely for possible
factors which might affect cyclists’ safety and their risk of a crash. This part of the study
included the eight intersections with a cyclist KSI metric of more than 2. Google Maps and
Nearmap were used to examine these intersections. Data on the current safety provisions for
cyclists (including any sensors) were acquired from Main Roads Western Australia.
Recommendations were then made, based on these findings and the literature review.
4 A killed or serious injury (KSI) crash is defined as a road crash that resulted in at least one person being either
killed (“killed immediately or died within 30 days of the day of the road crash as a result of the crash”) or seriously
injured (“admitted to hospital as a result of the road crash and who does not die from injuries sustained in the
crash within 30 days of the crash”). KSI crashes therefore include all fatal and hospitalisation crashes.

18
2.6 Ethics approval
Ethics approval was obtained from the Curtin Human Research Ethics Committee. Approval
was granted on 8 August 2018. The approval number for the project is HRE2018-0513.

19
3 LITERATURE REVIEW
With an increase in interest in cycling, a range of solutions have been developed to improve the
safety of cyclists including at intersections. These include sensing technologies, the use of
traffic signal phases and timing, and geometric design of roads at and approaching intersections.
3.1 Bicycle sensing at intersections
Bicycle detection for cyclists aims to facilitate safe, comfortable and convenient intersection
crossing for cyclists, while minimising delays. Bicycle detection devices may either ‘call’ a
phase or prolong a phase to allow a cyclists travel through an intersection (Sundstrom and
Nabors, 2014b).
There are two main types of calls to the traffic signal controller: locking calls and non-locking
calls (Strachan and Van Den Dool, 2017). A locking call occurs when a vehicle or bicycle either
travels over or remains on a detector for a pre-determined period of time: a demand is registered,
which places a locking call for the phase. The demand is cancelled once the signal group has
run in a nominated phase(s). Detection of additional vehicles may extend the phase. In contrast,
a non-locking call is registered when a vehicle (or bicycle) is detected within the detection zone,
but cancelled once the vehicle moves out of the zone. Locking calls are the preferred option for
the detection of bicycles, as the smaller size of bicycles makes them more difficult to detect and
it is easier for a bicycle to (inadvertently) leave the detection zone (Strachan and Van Den Dool,
2017).
3.1.1 Active detection
Active detection requires the road user to activate a signal, usually with a push button (Strachan
and Van Den Dool, 2017). It is appropriate when cyclists use a footpath (Sundstrom and Nabors,
2014b), but problematic when they use the carriageway as it is difficult to access the push button
designed for those using the footpath. The push button device should be located so that the
cyclist is not required to dismount or be rerouted onto the footpath. Grab rails (handrails) or
bicycle boxes5 may be required to ensure that on-road cyclists can easily access the device
safely (Van den Dool et al., 2014). Cyclists should be alerted to the need to activate the signal
by supplementary signage (Sundstrom and Nabors, 2014b).
5 Bicycle boxes are stop lines located at the head of traffic (that is, in front of stationary motorised vehicles).
STANDARDS AUSTRALIA 2018. Manual of uniform traffic control devices part 9: bicycle facilities.
Sydney, New South Wales: SAI Global Limited..
20
3.1.2 Passive detection
Certain intersections require road users to be passively detected in order to call a green light
(Sundstrom and Nabors, 2014b). The detectors at these intersections should be designed to
accommodate cyclists.
Inductive loop detectors
The most common detection technology is the (inductive) loop detector, which connects to the
(traffic control) centralised computer system via the traffic signal controller to control traffic
phases and optimise traffic flow6. Inductive loops consist of coiled wire, embedded in the road,
and an electronics unit on the side of the road which creates a magnetic field around the loops.
As a vehicle passes through the magnetic field, the resonant frequency of the loop increases,
alerting the detector to the vehicle’s presence (Hamilton et al., 2013). While it was designed for
motor vehicles, it can be adapted to detect cyclists as well (Sundstrom and Nabors, 2014b).
The design of loop detectors needs to account for the amount of metal in bicycles. An inductive
loop can detect any electrically conductive material (including aluminium); it does not need to
be ferromagnetic (Shanteau, 2008). However, a bicycle with no metal (for example, a carbon
fibre frame) cannot be detected.
The shape and position of the loop, the sensitivity setting and the position of the bicycle over
the loop should be adjusted to maximise detection of bicycles (BikeWalk NC, 2018). For
example, the quadrupole loop shape is more effective in detecting bicycles as the dipole loop
shape may fail to detect bicycles in the centre of the loop (BikeWalk NC, 2018). Ideally there
should be a bicycle detector symbol over to guide the cyclists where to stop, unless the loop is
as wide as the lane (Shanteau, 2008, NZ Transport Agency, 2019). Ideally the loops should
span the width of the lane (Espada, 2016).
Inductive loops can be located at the stop line (where there is a separate stop line for cyclists,
or general lane) or before the stop line (allowing time for the green phase to commence) if
6 In Western Australia, the traffic control system used is SCATS, the Sydney Coordinated Adaptive Traffic System
BLAKE, P. 2013. Best practice study on the use of Intelligent Transport Systems (ITS) standards in traffic
management. Sydney, Australia: Austraods., a responsive plan selective system HAMILTON, A.,
WATERSON, B., CHERRETT, T., ROBINSON, A. & SNELL, I. 2013. The evolution of urban traffic
control: changing policy and technology. Transportation Planning and Technology, 36, 24-43..

21
cyclists are unlikely to turn off the road before the intersection (NZ Transport Agency, 2019).
Inductive loops located at a general stop line need to be placed so that cyclists ride over them
by default to ensure detection (NZ Transport Agency, 2019). Inductive loops located at a
separate stop line for cyclists should be marked at the most sensitive areas with painted diamond
symbols and cycle symbols on the pavement.
Inductive loops can also be used to activate a sign to show if a bicycle has been detected or to
alert drivers of the presence of a cyclists in areas with poor visibility (including narrow bridges
and tunnels) (NZ Transport Agency, 2019). Various types of active feedback devices have been
trialled to cue cyclists that they have been detected (Okimoto, 2015, Boudart et al., 2015). The
City of Portland, Oregon, trialled a traffic signal feedback device at an intersection with an
inductive loop, a bicycle push button, a bicycle detector pavement marking, and a bicycle phase
for northbound cyclists. A feedback device that displayed a small, blue light when a cyclist was
correctly positioned over the loop detector (over the pavement marking) was mounted on the
bicycle signal. This alerted the cyclist that their call for a green light had been registered. Video
data was collected and analysed during daylight hours, before installation of the device, after
installation of the device and after an instructional sign about the purpose of the device was
installed. Following installation, more cyclists used the detection provided by the induction
loop (with pavement marking) – an increase from 15% of cyclists before installation to 20%
after installation and 49% after the information board was added (Boudart et al., 2017),
representing a statistically significant increase (Okimoto, 2015). Further work is being done
trialling the installation of a “WAIT” sign, surrounded an illuminated ring of tick marks when
a cyclist is detected. The number of tick marks illuminated will indicate how long until the
green light is due (Okimoto, 2015).
Piezo-detectors
Piezo-detectors are an additional option to detect bicycles (Taylor et al., 2017). These materials
change electrical characteristics when deformed by pressure (that is, the bicycle creates the
deformation). This can either cause a change in resistance (piezo-resistive sensor) or generate
a charge (piezoelectric sensor). The former is more effective at detecting a bicycle at very low
speeds (or when stationary) (Taylor et al., 2017).
Microwave radar
Radar (radio detection and ranging) operates on the radio-frequency spectrum to detect the
position and movement of objects (Shladover et al., 2010, BikeWalk NC, 2018). Microwave

22
radar not only detects the metal body of a car but also the water in a person’s body, so it can be
used to detect cyclists and pedestrians successfully (BikeWalk NC, 2018). Devices using this
technology are mounted on a structure above the roadway, and aim to detect cyclists to modify
signal timing, thereby giving cyclists more time to cross intersections (BikeWalk NC, 2018,
Espada, 2016). However, microwave detection only registers a moving vehicle and has a limited
range of view for detection (Austroads Inc., 2000). It does have the advantage of not requiring
the bicycle to have sufficient metal, for example, to trigger an induction coil.
An example of a commercially available microwave sensor is the MS Sedco INTERSECTOR
Microwave Motion and Presence Sensor. The INTERSECTOR is able to discriminate between
bicyclists and motor vehicles arriving at intersections (and is able to detect if a vehicle has two,
four or more wheels), and allows longer minimum green phases for cyclists to clear wide
intersections. A 2010 analysis found that the INTERSECTOR produced approximately 30%
false negatives and 37% false positive detections in a sample urban application (Shladover et
al., 2010). However, it has subsequently been approved for use by the California Department
of Transportation as of 2017 and has been piloted in Minnesota successfully. It can be retrofitted
without digging up the road at an existing intersection, a big advantage over technologies such
as inductive coils.
Video detection
Video-based detection of a bicycle is similar as video-based detection of a car or motorcycle;
however, the smaller size of the bicycle means that the bicycle and cyclist occupy a smaller
number of pixels (BikeWalk NC, 2018). Furthermore, cyclists can be more challenging to detect
than pedestrians because of their higher speed and the changing appearance of bicycles on
camera depending on the angle of viewing (Cho et al., 2010). Possible object detection methods
include: Aggregated Channel Features (ACF - Dollár et al., 2014), Deformable Part Models
(DPM - Felzenszwalb et al., 2010, Cho et al., 2010), Region-based Convolutional Neural
Networks (R-CNN - Girshick et al., 2014, Foroozandeh Shahraki, 2017), Fast R-CNN (FFCN
- 6) and SP-FRCN (FRCN with stereo proposal from the stixel world - Li et al., 2016). Li and
colleagues (2016) showed that all solutions had high performance in the easy-to-detect subset
of the cyclist dataset, with the SP-FTVN outperforming FRCN. However, for video where
cyclists are at lower resolution and from various angles, performance was less consistent and
further research into detection methods is required.

23
One video-based detection commercial option is Traficon’s Video Image Processor (VIP)
which interfaces with cameras that provide data on traffic (including queue length and vehicle
speed) as well as information on the presence of vehicles approaching or stationery at
intersections – it is distributed by ATC in Australia. It uses a highly tuned CMOS
(complementary metal oxide semiconductor) sensor couple, with algorithms that detect a
vehicle’s presence within the sensor’s field of vision.
3.2 Sensing technology on the bicycle and other motorised vehicles
Sensing technology can also be attached to the bicycle directly. This is not necessarily specific
to intersections but senses other vehicles at all locations. These technologies have the advantage
that cyclists are not relying on all cars having bicycle sensors (Jeon and Rajamani, 2016).
However, they rely on the cyclist taking defensive action as the vehicle will not necessarily be
aware of the bicycle.
3.2.1 Bicycle detection systems designed for intersections and to prevent crashes
An example of a bicycle detection system for intersections is the EMTRAC Bicycle-Detection
System. This includes a mobile app which recognises when the cyclist is within a defined
detection zone and notifies the traffic controller through the EMTRAC Priority Detector which
have been installed at selected intersections or using the (US) NTCIP (National Transportation
Communications for Intelligent Transportation System Protocol7). The data centre provides a
transfer point for the detection data between the mobile phone and the Priority Detectors.
3.2.2 Radar
An example of this is the Garmin Varia Bike Radar System. This radar warning system has a
range of 140 metres behind the bicycle and consists of two parts. The tail light attaches to the
seat post, and the head unit attaches to the handle bars. The tail light brightens and flashes to
7 NTCIP is a “family of standards that provides both the rules for communicating (called protocols) and the
vocabulary (called objects) necessary to allow electronic traffic control equipment from different manufacturers
to operate with each other as a system.” NEMA, ITE & AASHTO. 2018. NTCIP: About [Online]. Available:
https://www.ntcip.org/about/ [Accessed 19 December 2018].. In Australia, ITS (Intelligent Transport Systems)
Australia is an organisation to support members (including Main Roads Western Australia as a corporate gold
member) informed, represented and supported on intelligent transport systems. While NTCIP is used in some
jurisdictions in Australia, Main Roads Western Australia uses the RTA suite of protocols (for field services such
as variable message signs or VMS) and SCATS (Sydney Coordinated Adaptive Traffic System) to manage signal
phases at traffic signals ROSS, C. 7 January 2019. RE: RE: Query about NTCIP. Type to WOOLLEY, M. &
HOBDAY, M, BLAKE, P. 2013. Best practice study on the use of Intelligent Transport Systems (ITS) standards
in traffic management. Sydney, Australia: Austraods., rather than a ‘family’ of integrated standards which work
between computers and all ITS components, such as the traffic control system, traffic information, re-routing VMS
and the public transport system .

24
notify the traffic that a cyclist is ahead. The head unit (or compatible cycling computer) can
indicate the proximity of and the approach speed of these vehicles.
3.2.3 LiDAR
LiDAR is similar to radar but uses laser pulses (light amplification by simulated emission of
radiation) instead of radar to measure the distance to a target. Wallich describes such a device
that senses the distance of an approaching vehicle and displays this on a strip of coloured LEDs
(2015). It does not, however, provide information about the speed of the approaching vehicles
and requires the cyclists to look at the display (thus distracting them from the road). An example
used PulsedLight’s LiDAR-Lite, which has a range of 40 metres and an accuracy of 2.5cm to
create a sensor attached to the back of a bicycle. This is wired to a series of LEDs attached to
the handlebars, which indicate to the cyclist the approach of other vehicles. More recently,
Blankenau and colleagues (2018) have developed a bicycle-mounted system using a LiDAR
module, in combination with a camera, stepper motor and small computer to improve safety at
the rear. The system was effective in measuring distance to a stationery vehicle, but less so with
dynamic testing, where multiple vehicles were detected. The authors identified that the system
required better computational power, and linking of the sensor and recognition software to
reduce the false vehicle positives.
3.2.4 Combination systems
Jeon and Rajamani (2016) developed an instrumented bicycle to prevent side and rear crashes.
To prevent side crashes, the authors designed a sonar sensor transmitter, attached to the side of
the bicycle to detect and track cars turning, while cyclists were in a car’s blind spot. This
connects to a receiver (Hamilton et al., 2013), allowing for detection of both the distance and
angular orientation of the tracked car (Jeon and Rajamani, 2016). To prevent rear end crashes,
both lateral and longitudinal positions were tracked using a laser sensor (the PulsedLight
LiDAR-Lite), with a longer range of 35m, on a rotating platform (Jeon and Rajamani, 2016).
Rear targets are identified using a clustering methods.
An alternative low-cost collision warning system using laser, ultrasonic sensors and mass
vibrators was described by Van Brummelen and colleagues (2016). The device, attached behind
the seat, contains a LiDAR sensor which calculates both the distance and velocity of an
approaching vehicle. The device also contains two ultrasonic sensors to sense direction. Using
the collected data, a fuzzy rule-based inference system (FIS) calculates crash risk, sending a

25
signal to the eccentric mass vibrators on the bicycles handlebars. This provides feedback
through the vibration of the handlebars (haptic feedback), thus avoiding the cyclist from taking
their eyes from the road (van Brummelen et al., 2016). The system also signals an LED vehicle
warning light, to alert approaching vehicles to the proximity of the cyclist. A trial of the device
on seven cyclists showed that they intuitively understood the haptic feedback and benefitted
from minimal training on the system (van Brummelen et al., 2016).
3.2.5 RFID (Radio frequency identification)
An example of this is the Cycle Alert. This is an HGV (heavy goods vehicle, that is, a truck of
3,500kg or more) blind spot detection system. The system consists of three parts:
a) A cycle tag: mounted on the bicycle helmet or person. It transmits when moving so that
vehicles’ sensors can detect it, and stops when stationary for a while.
b) A side unit: a wireless unit attached to the vehicle side, with a battery life of up to 10
years.
c) A cab unit: which receives the signal strength from the cycle tag via the side unit. If the
signal strength reaches a threshold, an audible alert sounds and the cab unit displays the
cycle position (front, left, right or back) on a small screen.
3.3 Advanced driver assistance systems on motor vehicles which can detect bicycles
Advanced driver assistance systems (ADAS) can be useful in prevent or mitigating intersection
crashes between cars and vulnerable road users, including cyclists. Habibovic and Davidsson
(2011) found that reduced visibility, low awareness and poor comprehension were the most
common contributing factors to crashes with vulnerable road users. They therefore suggested
that an ADAS should assist drivers to observe vulnerable road users and assist their ability to
predict future potential incidents. Applicable technologies include the collision warning system,
or collision avoidance system (using radar or LiDAR sensors), with auto brake and cyclist and
pedestrian detection. The technology requires that enough of the cyclist’s body or bicycle be
visible to the camera.
3.4 Cooperative systems
Cooperative systems are those where a vehicle communicates wirelessly with one of the
following: i) another vehicle (V2V – vehicle-to-vehicle); ii) with road infrastructure (V2I –
vehicle-to-infrastructure); and iii) from road infrastructure (I2V – infrastructure-to-vehicle)
(CVIS, 2010). The systems use wireless communications, for example, the mobile phone

26
network so that vehicles (fitted with on-board units, routers and antennae) can communicate
with each other or suitable equipped road infrastructure. Applications can be designed for
intersections to alert drivers of cyclists and pedestrians when turning, and to maintain local
traffic control (CVIS, 2010). Cooperative systems are still being developed and deployed. One
issue with their widespread use is the number of stakeholders who need to be involved, ranging
from vehicle manufacturers to software develops to local and national road authorities, and
private road users. Ultimately, vehicle-to-everything (V2X) technology needs to be developed,
where cyclists are better detected by motor vehicles. Progress is being made, for example by
Volvo using a bicycle app, Strava, sensors on the motor vehicle, a cloud-based network and a
connected bicycle helmet.
3.5 The use of traffic signals to improve cyclist safety
3.5.1 Optimising signal timing and sequencing for bicycles
Traffic signals are used at intersections improve the flow of traffic, reduce congestion and meet
the needs of all road users for safe intersection use (Sundstrom and Nabors, 2014c). By either
adjusting timing at each intersection, or by adjusting the coordination of signals at a series of
intersections, these goals can be achieved (Sundstrom and Nabors, 2014c). This includes traffic
signals to direct the use of pedestrian crossings. Cyclists may use pedestrian signals (generally
activated by a push button) and pedestrian crossings, or they may share the road with motorised
vehicles and so use traffic signals geared towards those road users.
Additional signal timing can be introduced, particularly at high-speed locations and where
crossing distances are long (Sundstrom and Nabors, 2014c). Possibilities at individual
intersections include adjustments to:
a) Minimum green intervals8: a recommended minimum of six seconds for bicycles
(Strachan and Van Den Dool, 2017);
b) Intergreen phases9: VicRoads state that bicycles in an exclusive bicycle phase should
have three seconds of yellow time and an all red time based on intersection geometry
and an assumed design speed of 20km/h (Vicroads, 2016).
Another possibility is coordinating signals to create a ‘green wave’ (consisting of a minimum
of three intersections), where vehicles get a green indication and do not have to break or stop if
8 The minimum green intervals is the first timed part of the green intervals, based on the number of vehicles
queuing and if pedestrians are crossing in this phase. 9 The intergreen phase is the period of red and yellow indication.

27
vehicles are travelling at a specific speed (informed by bicycle speeds). This has the additional
benefit of reduced motor vehicle speeds (Strachan and Van Den Dool, 2017) and less noise
pollution and energy use (from reduced breaking and acceleration).
Alternatively, the use of separate bicycle lanterns can reduce conflicts between bicycles and
motor vehicles. Bicycle lanterns (also known as bicycle signals or signal heads) contain a
bicycle image which may consist of two phases (red and green) or three phases (red, yellow
and green) in Australia (Strachan and Van Den Dool, 2017). The lanterns should be located so
they are clearly visible to arriving bicycles, with appropriate detection, and have adequate
clearance so bicycles have time to clear an intersection before conflicting movements receive a
green signal. When bicycles and pedestrians share the same crossing location, the crossings can
be separated (but remain adjacent), which allows bicycles a longer green period (and shorter
flashing red period), as their faster speed (than pedestrians) can be taken into account (Van den
Dool et al., 2014).
Other options could include the use of ‘priority movement repetition’ (multiple phases for
cyclists within the traffic signal cycle) and for bicycle signal phases to operate twice during a
signal cycle (known as double cycling - Van den Dool et al., 2014).
3.5.2 Demanding bicycle phases
This section is largely based on the Australian Bicycle Council report Traffic Signal Features
for Bicycles (Strachan and Van Den Dool, 2017).
A permanent demand request ensures that a traffic signal phase will operate even if the detector
is not activated (a permanent demand phase). This is always applied for the main traffic phase
but may be applied to create a permanent demand for bicycle phases, in certain situations. These
include peak hours, along high cycle volume routes, where several bicycles use the phase each
time (Strachan and Van Den Dool, 2017).
Auto-introduction is used for pedestrians at the start of a signal phase if pedestrian volume is
high and traffic phases are long. Strachen and Van den Dool suggest that this could be used at
high bicycle volume segregated areas (Strachan and Van Den Dool, 2017).

28
‘Stretch Walks’ can be nominated: unused time from proceeding phases are used in a pedestrian
walk phase. Similarly ‘Stretch Bicycle’ phases could be considered (Strachan and Van Den
Dool, 2017).
Early starts, also known as a ‘leading bicycle interval’ (LBI), give cyclists a head start by
allowing a few seconds of green time before motor vehicle get a green light, allowing cyclists
to change lanes or turn without conflict (Strachan and Van Den Dool, 2017, Sundstrom and
Nabors, 2014a).
Advanced detection, used in some European countries, uses inductive loop detectors in advance
of an intersection, rather than at the stop line, to created demand for a bicycle phase (Strachan
and Van Den Dool, 2017). This reduces the delay for bicycles arriving at intersections.
Co-Introduction is where demand from either a pedestrian or cyclist can generate demand for
either (Strachan and Van Den Dool, 2017). It is appropriate with pedestrians’ and cyclists’
travel paths and their traffic signals are adjacent to each other, and where cyclists are not
travelling at high speeds (Sundstrom and Nabors, 2014a).
3.6 Road features at or approaching intersections
3.6.1 Pavement markings
Many treatments include the painting of pavements in combination with other features. Lanes,
sections of lanes or crossover areas may be painted, usually blue or green. The Australian
Standards stipulate that the colour of pavement be ‘Emerald Green’ (G13 - Standards Australia,
2018). The use of colour is optional and should be limited to areas of potential conflict such as
bike boxes and entry to roundabouts (Standards Australia, 2018). While some international
studies have not shown any beneficial effect from coloured markings, others have found that
driver behaviour improves (for example, Hunter et al., 2000, Warner et al., 2017) while other
have found safety benefits of coloured cycle facilities (Turner et al., 2011).
Bike Boxes (advanced stop lines, ASL)
Bicycle storage areas (also known as bike boxes or advanced stop lines) are stop lines located
at the head of traffic (in front of motorised vehicles), that is, in advance of motorised vehicle
stop lines (Standards Australia, 2018, Mead et al., 2014). This gives priority to cyclists over
motor vehicles at intersections, and reduces the conflict between cyclists and motor vehicles

29
(Mead et al., 2014). They may work in conjunction with a bicycle lane on the left side of the
main vehicle lane. Bike boxes are often painted (Turner et al., 2011). The Australian Standard
specifies ‘Emerald Green’ as the appropriate colour and that the bicycle symbol should be
marked in the bike box (Standards Australia, 2018). Dill et al. found that bike boxes affected
behaviours that could improve safety (Dill et al., 2012). A study in Adelaide and Christchurch
found that coloured bike boxes were more effective in reducing crashes than unpainted bike
boxes (Turner et al., 2011).
Hook turn storage box
This is a form of safe storage area facilitating a ‘hook turn’10, an alternative way for cyclists to
turn right at signalised intersections which is suitable if a cyclist has to cross multiple lanes to
turn (Standards Australia, 2018). It includes a small bicycle symbol and a ‘hook’ pavement
arrow to show cyclists where to stop and wait for the turn.
Advanced cycle lanes
Advanced cycle lanes, or bicycle stop lines are bicycle lanes which extend beyond the vehicular
stop line by a minimum of 2m. This gives the cyclists a head start at the beginning of the green
signal phase if the line is clear of cross traffic or a marked pedestrian crossing (Standards
Australia, 2018).
Merge and weave area redesign
Merge and weave areas can be developed where there is a bicycle lane with a merging segment,
because motorist have to cross the bicycle lane to enter the left turning lane (in Australia) (Mead
et al., 2014). The merging segment may be unpainted, or painted green or blue, and be with or
without signage. Research has shown that this is associated with significantly lower yielding to
cyclists by motorists, but reduced motor vehicle/bicycle conflicts (Mead et al., 2014).
Other intersection pavement markings
Other options include: dotted bike lane extensions; elephants’ feet markings (parallel to
crossing markings to indicate that cyclists do not need to dismount to cross roads); bicycle
symbols (for example, to indicate the beginning and end of bike lanes, with the words “LANE”
or “LANE END”); the no-bicycles pavement symbol; and sharrows (shared road markings).
10 Hook turns: A cyclist turning right at an intersection should move into the leftmost lane. On the green light, the
cyclist moves forward, staying on the far left until reaching the far side of the intersection. When the traffic
signal of the road into which the cyclist is turning changes to green, the cyclist turns right into the road.

30
3.6.2 Regulatory signage
These include signs instructing motorists to yield to cyclists and may include pictograms. The
Australian Standards (Standards Australia, 2018) state the sign number, size, design, wording
and correct usage of all signs relating to cyclists. The preferred practices of Main Roads
Western Australia regarding bicycle directional signs [for cyclists on principal shared paths
(PSPs)] are set out in Part C: Technical Guideline - Bicycle Directional Signs (Main Roads
Western Australia, 2016). Further signage relating to the use of bicycle lanes is provided in the
Main Roads Exclusive Lane Series: MR-RE (Category 1.1.7) (Main Roads Western Australia,
2018) and the Cycling Series: MR-GC (Main Roads Western Australia, 2019a), including
instructions for motorists and cyclists to “share the road”.
A simulator study in Oregon, USA, of 28 drivers found that bicycle yielding signs improved
the visual attention of drivers (Warner et al., 2017). A study in Portland, Oregon, used blue
pavement marking and signage (consisting of the wording “YIELD TO BIKES” with a yield
sign, an arrow and bicycle on a road, p. 110) in conflict areas near intersections (Hunter et al.,
2000). This consisted of 10 bicycle-motor vehicle weaving areas near intersections. Video
footage of the cyclists before and after the treatment (20 hours for each location) was analysed.
The footage included 846 cyclists in the before period, and 1,021 cyclists in the after period.
The observations found that more cyclists followed the recommended marked path and more
motorists yielded to cyclists in the after period. However, significantly fewer cyclists turned
their head to the rear to scan for approaching motor vehicles after the pavement was painted
blue. In addition, significantly fewer cyclists used hand signals to indicate their movement
through the conflict area. The rate of conflicts per 100 entering bicyclists decreased from 0.95
in the before period to 0.59 in the after period.
A before and after study in Denmark examined the effects of blue painted cycle crossings at
intersections (Jensen, 2008). The study, which controlled for long-term crash trends, found that
a single blue painted crossing reduced the number of all intersection crashes by 10%, while two
and four blue painted crossings increased the number of intersection crashes by 23% and 60%
respectively. These effects were larger for injury crashes. The researchers noted that
intersections with one blue crossing tended to have fewer arms (and lower traffic volumes) than
intersections with two or four blue bike crossings. The researchers suggest that a single blue
cycle crossing provides a ‘warning message’ to drivers, making them more aware of cyclists.
This warning message was less effective when there are more blue crossings, with motorists

31
focusing less on traffic signals as there are more rear-end crashes and crashes resulting from
running red lights.
3.6.3 Reduced kerb radius
Reducing the size of the kerb radius may slow down turning vehicles, allowing more time for
motorists to see cyclists and avoid a collision, and reducing the severity of a crash if it does
occur (Warner et al., 2017). Warner and colleagues (2017) in a driving simulator study, found
a 4% reduction in mean vehicle velocity during high to moderate risk incidents (defined as a
time-to-collision of 1.5 seconds or less).
3.6.4 Width of lane
Turner and colleagues, in a before and after study of 102 signalised intersections in
Christchurch and Adelaide, found that the width of the kerbside approach lane or total width of
the cycle lane and adjacent traffic lane had a larger impact on safety than where the cycle lane
was marked in the space (2011). If a bicycle lane is used at intersections, its width should match
the bicycle lane width on the approach to the intersection (Aumann and Whitehead, 2017).
3.6.5 Raised bicycle crossings
Gårder and colleagues (1998) did a before and after study of 44 intersections examining the
effect of raised bicycle crossings (4 to 12 cm above road level) compared to other intersection
types, adjusting for traffic volume. The study showed that while there was an increase of 8% in
crash frequency, the bicycle volume through the intersections increased by 50%. The authors
concluded that this might equate to a safety improvement following the intervention.
3.6.6 Protected (‘Dutch-style’) intersection design
Protected intersections include a range of geometric and traffic engineering treatments to
improve the visibility and safety of cyclists (Warner et al., 2017). Warner and colleagues found
that while protected intersections with islands positively affected driver behaviour, the addition
of green painted pavement markings had no additional effect on driver behaviour (2017).
3.6.7 Roundabouts
The requirements to improve safety at roundabouts differ to those of other intersection types.
Some research has shown poorer safety records for cyclists at multi-lane roundabouts compared
to signalised intersections, while studies specifically examining the installation of single-lane

32
roundabouts did not find an increase in cyclist crashes (Brude, 2000). In these cases, safety can
be improved by including a separated bicycle lane – that is, a lane separated by a kerb or other
physical barrier (Schoon and van Minnen, 1994, Reynolds et al., 2009) or a grade-separated
path (Daniels et al., 2009).
33
4 RESULTS
4.1 Overview
A total of 3,640 people were involved in intersection crashes as cyclists in the 10 years between
2008 and 2017. This made up 0.97% of the 374,916 road users involved in crashes at
intersections. A total of 363,367 (96.92%) were in motor vehicles; 6,511 (1.74%) were on
motorcycles; and 1,396 (0.37%) were pedestrians11.
4.2 Descriptive statistics
A much higher proportion of cyclists involved in crashes at intersections were male (2,148,
81.83%) than female (n=477, 18.17% - Table 1). In contrast, the proportions of female
motorcyclists were considerably lower (656, 10.79%), while the proportion of female
pedestrians were more similar (533, 44.23%) to the proportion of male pedestrians.
There were relatively high proportions of 30 to 44year old and 45 to 64 year cyclists involved
in crashes at intersections (n=569, 21.68%; n=888, 33.83% respectively), compared to other
road users. This is in contrast with pedestrians, where a relatively large proportion are children
(n=183, 19.06% of all pedestrians involved in intersection crashes) and older adults (65 years
and older; n=112, 11.67%). Relatively high proportions of motorcyclists involved in crashes
fell into the 30 to 44 year, and 45 to 64 year old age groups (n=1,625, 30.84%; n=1,510, 28.66%
respectively).
Table 1: Intersection crashes by road user, gender and age, in Perth metropolitan area
from 2008 to 2017 (at person level)
Road user type Motor vehicle Motorcycle Pedestrian Bicycle
Gender n % n % n % n %
Female 150,332 45.37 656 10.79 533 44.23 477 18.17
Male 180,982 54.63 5,424 89.21 672 55.77 2,148 81.83
Total 331,314 100 6,080 100 1205 100 2,625 100
Age category Child 23,603 8.80 389 7.38 183 19.06 248 9.45
18 to 29 years 87,208 32.50 1,622 30.78 272 28.33 569 21.68
30 to 44 years 72,725 27.10 1,625 30.84 190 19.79 888 33.83
45 to 64 years 64,870 24.18 1,510 28.66 203 21.15 790 30.10
65 years and older 19,905 7.42 123 2.33 112 11.67 130 4.95
Total 268,311 100 5,269 100 960 100 2,625 100
11 Please note that data was missing for certain fields so the totals in the following tables may differ from those
reported in this introduction.

34
The number of crashes at intersections has varied by road user over the 10 years between 2008
and 2017 (Figure 1). Cyclist intersection crashes peaked in 2009 (133 crashes) before gradually
dropping. Intersection crashes involving motor vehicles and motorcycles have declined in the
last two years to levels below 2008 and 2009. Pedestrian intersection crashes have remained
fairly steady at relatively low levels compared to those of other road users, but were at their
highest levels in 2013 (129 crashes).
Figure 1: Intersection crashes by road user and year, in Perth metropolitan areas from
2008 to 2017 (at crash level)
A relatively high proportion of crashes involving cyclists occurred at three way intersections
(n=331, 48.53%), compared to 21.99% (n=150) at roundabouts and 28.89% (n=197) at four-
way intersections (Table 2). Among motor vehicle only crashes, a higher proportion occurred
at four way intersections (n=72,793, 47.04). Among motor cycle crashes and crashes involving
pedestrians, higher proportions occurred at three way intersections (n=1,732, 46.95%; n=491,
48.00% of the respective road user crashes). Most intersection crashes involving bicycles
occurred on straight sections of road (n=481, 85.28%). Most crashes involving motor vehicles
occurred on straight sections (n=114,641, 79.03%) while relatively more crashes involving
motorcycles occurred on a curve (n=954, 27.69% of all road user crashes). Relatively more
intersection crashes involving cyclists, pedestrians and motorcyclists occurred on the crest of a
hill compared to motor vehicles (cyclists: crest of hill: n=12, 2.71% and slope: n=129, 23.98%
compared to motor vehicles: crest of hill: n=2,510, 1.76% and slope: n=22,169, 15.56%).
Similar proportions of crashes involving cyclists and motor vehicles only occurred at dawn and
dusk (cyclists: n=46, 6.86% and motor vehicles only: n=8,998, 5.94%), while relatively few
occurred during the night-time hours. A relatively high proportion of cyclist and pedestrian
0
50
100
150
200
250
300
350
400
450
500
0
2,000
4,000
6,000
8,000
10,000
12,000
14,000
16,000
18,000
20,000
2008 2009 2010 2011 2012 2013 2014 2015 2016 2017
Nu
mb
er o
f o
ther
cra
shes
Nu
mb
er o
f m
oto
r ve
hic
le c
rash
es
Crash year
Motor vehicle
Motorcycle
Pedestrian
Bicycle

35
crashes occurred in speed zones up to 40km/h (n=12, 4.29% and n=30, 5.61% respectively) and
these proportion dropped relative to the proportion of motor vehicle only crashes as the speed
limit increased.
Table 2: Intersection crashes by road user and road characteristics, in Perth metropolitan
area from 2008 to 2017 (at crash level)
Road user Motor vehicle Motorcycle Pedestrian Bicycle
Road feature n % n % n % n %
Four-way intersection 72,793 47.04 1,177 31.84 433 42.33 197 28.89
Three way intersection 63,907 41.30 1,732 46.85 491 48.00 331 48.53
Intersection >3 legs 234 0.15 4 0.11 1 0.10 0 0.00
Roundabout 16,038 10.36 754 20.39 82 8.02 150 21.99
Median opening 1,426 0.92 22 0.60 1 0.10 2 0.29
Other 346 0.22 8 0.22 15 1.47 2 0.29
Road alignment
Curve 30,428 20.97 954 27.69 136 14.53 83 14.72
Straight 114,641 79.03 2,491 72.31 800 85.47 481 85.28
Road grade
Level 117,809 82.68 2,666 78.69 700 82.55 397 73.79
Crest of hill 2,510 1.76 77 2.27 23 2.71 12 2.23
Slope 22,169 15.56 645 19.04 125 14.74 129 23.98
Light conditions
Daylight 118,355 78.19 2,625 73.14 702 70.13 530 78.99
Dawn or dusk 8,998 5.94 227 6.32 40 4.00 46 6.86
Dark street, lights on 23,660 15.63 729 20.31 244 24.38 93 13.86
Dark streets, other 346 0.23 8 0.22 15 1.50 2 0.30
Speed limit
Up to 40km/h 912 1.82 20 1.09 30 5.61 12 4.29
>40km/h to 60km/h 48,233 96.13 1,289 70.32 426 79.63 266 95.00
>60km/h to 90km/h 240 0.48 495 27.00 79 14.77 1 0.36
>90km/h 790 1.57 29 1.58 0 0.00 1 0.36

36
Overall, males involved in cyclist intersection crashes make up 81.83% (2,148) of the 2,625
persons involved in these crashes with gender recorded (Table 3). Most of those involved in
these crashes were between 30 and 64 years (n=1,678, 63.92%). However, there were lower
proportions of females between 30 and 44 years (n=151, 31.65% compared to males: n=737,
34.31%) and between 45 and 64 years (n=126, 26.41% compared to males: n=664, 30.91%).
Although the number of child female cyclists involved in intersection crashes was much lower
than males (49 compared to 199 respectively), child female cyclists made up a higher proportion
of all female cyclists in intersection crashes than child male cyclists (10.27% and 7.58%
respectively). The gender differences were reversed at cyclist intersection crashes among those
aged 65 years or more (males: n=116, 5.40%; females: n=14, 2.94%).
Table 3: Intersection crashes involving cyclists by gender and age, in Perth metropolitan
area from 2008 to 2017 (at person level)
Age category Child 18 to 29 years 30 to 44 years 45 to 64 years 65 years+ Total
Gender n % n % n % n % n % n %
Female 49 19.76 137 24.08 151 17.00 126 15.95 14 10.77 477 18.17
Male 199 80.24 432 75.92 737 83.00 664 84.05 116 89.23 2,148 81.83
Total 248 100 569 100 888 100 790 100 130 100 2,625 100

37
The highest proportion of cyclist crashes at intersections were property damage only crashes
(n=1,565, 47.37% - Table 4). A higher proportion of this intersection crash type involved males
(83.83%) than females (16.17%). In contrast, female cyclists made up relatively higher
proportions of intersection crashes resulting in hospitalisation (n=125, 20.29% of all female
cyclist crashes compared to males: n=491, 79.71% of all male cyclist crashes) and medical
treatment (n=218, 19.66% compared to males: n=891, 80.34%). Children were involved in
relatively higher proportions of those intersection cyclist crashes leading to hospitalisations
(child hospitalisations: 11.05%, compared to the overall proportion of children in cyclist
crashes: 9.67%). Those aged 65 years and older were involved in relatively higher proportions
of fatal crashes (35.71%) and crashes leading to hospitalisation (6.14%), compared to other age
groups.
Table 4: Intersection crashes involving cyclists by crash severity, gender and age, in Perth
metropolitan area from 2008 to 2017 (at person level)
Crash severity Fatal Hospital
Medical
treatment
Property
damage Total
n % n n % n % n %
Gender
Female 1 7.14 125 20.29 218 19.66 253 16.17 597 18.07
Male 13 92.86 491 79.71 891 80.34 1312 83.83 2,707 81.93
Total 14 100 616 100 1,109 100 1565 100 3,304 100
Age category
Child 1 7.14 63 11.05 98 9.81 94 8.84 256 9.67
18 to 29 years 3 21.43 118 20.70 204 20.42 250 23.52 575 21.73
30 to 44 years 4 28.57 175 30.70 346 34.63 368 34.62 893 33.75
45 to 64 years 1 7.14 179 31.40 299 29.93 313 29.44 792 29.93
65 years and
older 5 35.71 35 6.14 52 5.21 38 3.57 130 4.91
Total 14 100 570 100 999 100 1,063 100 2,646 100
The highest number of intersection crashes involving cyclists occurred between Tuesday and
Thursday (Tuesday: 644, Wednesday: 642, Thursday: 614 – Table 5). The highest number of
fatal intersection crashes involving cyclists occurred on Tuesdays, Fridays and Saturdays (n=3
on each day). The highest proportion of intersection crashes involving a hospitalisation
occurred on a Wednesday (n=107, 17.86%), while the highest proportion of medical treatment
crashes were on a Tuesday (n=200, 17.87%).
The highest number of intersection crashes involving cyclists occurred in February and March
(n=345 and n=363 respectively). The highest proportion of these crashes involving

38
hospitalisations occurred in March (n=64, 10.68%) and April (n=63, 10.52%). The highest
proportion of these crashes requiring medical treatment were in March (n=123, 10.99%).
The highest proportion of cyclist intersection crashes resulting in fatalities and hospitalisations
relative to less serious crashes occurred between midnight and 05:59 (n=1, 7.14%) and between
10:00 and 15:59 (n=6, 42.86%). In terms of absolute numbers, the highest number of fatalities
for cycling intersection crashes occurred over the middle of the day (10:00 to 15:59, n=6), and
highest number of hospitalisation and medical treatment crashes were between 06:00 and 09:59
(n=230 and n=453 respectively.)
Table 5: Intersection crashes involving cyclists by crash severity and time of crash, in
Perth metropolitan area from 2008 to 2017 (at crash level)
Crash severity Fatal Hospital
Medical
treatment Property damage Total
Day of week n % n % n % n % n %
Sunday 2 14.29 60 10.02 81 7.24 121 6.61 264 7.41
Monday 1 7.14 89 14.86 154 13.76 258 14.10 502 14.09
Tuesday 3 21.43 102 17.03 200 17.87 339 18.52 644 18.08
Wednesday 0 0.00 107 17.86 197 17.61 338 18.47 642 18.02
Thursday 2 14.29 94 15.69 186 16.62 332 18.14 614 17.24
Friday 3 21.43 84 14.02 179 16.00 246 13.44 512 14.37
Saturday 3 21.43 63 10.52 122 10.90 196 10.71 384 10.78
Month of crash
January 0 0.00 33 5.51 83 7.42 128 6.99 244 6.85
February 2 14.29 57 9.52 111 9.92 175 9.56 345 9.69
March 3 21.43 64 10.68 123 10.99 173 9.45 363 10.19
April 1 7.14 63 10.52 87 7.77 148 8.09 299 8.39
May 2 14.29 55 9.18 102 9.12 186 10.16 345 9.69
June 1 7.14 58 9.68 98 8.76 147 8.03 304 8.53
July 1 7.14 44 7.35 80 7.15 108 5.90 233 6.54
August 1 7.14 42 7.01 76 6.79 130 7.10 249 6.99
September 0 0.00 38 6.34 89 7.95 161 8.80 288 8.09
October 1 7.14 48 8.01 87 7.77 177 9.67 313 8.79
November 1 7.14 51 8.51 91 8.13 150 8.20 293 8.23
December 1 7.14 46 7.68 92 8.22 147 8.03 286 8.03
Hour of crash
Midnight to 5h59 1 7.14 24 4.10 30 2.71 49 2.69 104 2.95
6h00 to 9h59 5 35.71 230 39.25 453 40.96 646 35.49 1334 37.83
10h00 to 15h59 6 42.86 127 21.67 243 21.97 473 25.99 849 24.08
16h00 to 19h59 1 7.14 182 31.06 329 29.75 599 32.91 1111 31.51
20h00 to 23h59 1 7.14 23 3.92 51 4.61 53 2.91 128 3.63

39
4.3 High-risk intersections
High risk intersections were identified in two ways: intersections with the highest cyclist KSI
between 2013 and 2017, and intersections with a cyclist fatality between 2007 and 2013.
4.3.1 Cyclist KSI metric
The cyclist crash risk of Perth metropolitan intersections was ranked by the cyclist KSI metric
(calculating using the years 2013 to 2017). This included eight intersections with a cyclist KSI
of above two, and 25 intersections with a KSI of 2 and above (Table 6). The intersection with
the highest cyclist KSI was at Welshpool Road East and Lesmurdie road, Lesmurdie (cyclist
KSI=4.88).
Only two of the top eight intersections were signalised, while six of the remaining 16 high risk
intersections were signalised; a total of eight of the 24 intersections with a cyclist KSI of two
and above were signalised. Of the top eight high risk intersections, five were three way
intersections, two were roundabouts and the remaining one was a four way intersection. Of the
16 intersections with a cyclist KSI of two, six were four way intersections, six were three way
intersections, three were roundabouts and one was an interchange.
Maps 1 and 2 indicate to location of the intersections with cyclist KSIs of 2 or more.

40
Table 6: Intersections with cyclist crashes ranked by cyclist KSI metric, in Perth metropolitan area from 2013 to 2017
Rank Int No1 Fatal2
Hosp3 Med4
KSI
metric Intersection name Suburb Intersection type Sig5
1 45290 0 3 5 4.88 Welshpool Rd East & Lesmurdie Rd Lesmurdie 3+ way intersection No
2 60447 0 3 1 3.75 Marmion Av & Marina Bvd Clarkson 3+ way intersection No
2 60456 0 3 1 3.75 Marmion Av & Anchorage Dr & Neerabup Rd Heathridge Roundabout No
4 47253 0 2 3 3.2 Ardross St & Macrae Rd Applecross Roundabout No
4 54469 0 2 3 3.2 South Perth Esp & Mends St South Perth 3 way intersection No
6 46983 0 3 0 3 Stock Rd & Cawston Rd Attadale 3 way intersection No
6 50569 0 2 2 3 Wellington St 124 0116 - H016 & Wellington St & George St Perth 4+ way intersection Yes
8 43139 0 2 1 2.67 South St & Marine Tce South Fremantle 3+ way intersection No
8 70729 0 2 1 2.67 Beeliar Dr & Wentworth Prd Success 3+ way intersection Yes
9 47170 0 2 0 2 Preston Point Rd & Durdham Cr Bicton 3+ way intersection No
9 55863 0 2 0 2 Duke St & Sackville Tce Scarborough Roundabout No
9 39628 0 2 0 2 Welshpool Rd East & Roe Hwy Nth Bound Off & On Welshpool Interchange Yes
9 4336 0 2 0 2
Wanneroo Rd & Newcastle St & Charles St On - Mitchell Fwy
Sth Bound & Mitchell Fwy Nth Bound West Perth 4+ way intersection Yes
9 54437 0 2 0 2 Mill Point Rd & Queen St South Perth 3 way intersection No
9 46642 0 2 0 2 Clarinda Av & Hennessy Av Orelia 3 way intersection No
9 51213 0 2 0 2 Jersey St & Salvado Rd West Wembley 4 way intersection Yes
9 55009 0 2 0 2 Beach Rd & Davallia Rd & Okely Rd (North) Carine 4+ way intersection Yes
9 43729 0 2 0 2 Nicholson Rd & Yale Rd & Garden St Thornlie Roundabout No
9 47720 0 2 0 2 The Strand & Nisbet Rd Applecross 3 way intersection No
9 55559 0 2 0 2 Karrinyup - Morley Hwy & Grand Prom Dianella 4+ way intersection Yes
9 50862 0 2 0 2 Bourke St & Loftus St North Perth 4 way intersection Yes
9 68322 0 2 0 2 Canning Hwy & Andrew Rd East Fremantle 4+ way intersection No
9 48922 0 2 0 2 Wellington St & Palmerston St Mosman Park Roundabout No
9 47306 0 2 0 2 Burke Dr & Carroll Dr Attadale 3 way intersection No 1`Int No: Intersection number 2Fatal: Fatal crashes 3Hosp: Crashes with injury resulting in hospitalisation 4Med: Crashes with injury requiring medical treatment but not hospitalisation 5Sig: Signalised intersection

41
Map 1: Map of Perth metropolitan area indicating intersections with a cyclist KSI metric
of 2 or more (red circle12) between 2013 and 2017.
12 Larger red circles indicate intersections with higher cyclist KSI metrics

42
Map 2: Map of inner Perth metropolitan area indicating intersections with a cyclist KSI
metric of 2 or more (red circle12) between 2013 and 2017

43
4.3.2 Intersections with bicycle fatalities
Intersection where any cyclist fatality had occurred between 2008 and 2017 were also identified
(14 fatalities at 14 different intersections -Table 7). Notably one intersection with a fatal cycle
crash (Eric Street and Broome Street, Cottesloe) also had one hospitalisation cycle crash and
three medical treatment crashes over the study period. A further three intersections had also had
either one hospitalisation cycle crash (North Beach Road and Mews Entrance, Gwelup), or one
medical treatment cyclist crash (Dorothy Street and Hicks Street, Gosnells, and Princess Road
and Broadway, Nedlands). (Note that because these intersections included crashes which
occurred between 2008 and 2017, none of these crashes were included in Table 6 as having the
highest cyclist KSI metrics, which by definition only used the latter five years of data, 2013 to
2017).
All intersections with a cyclist fatality are displayed in Map 3, with a blue triangle indicating
any intersection with cyclist fatality between 2008 and 2017.

44
Table 7: Intersections with cyclist fatalities, in Perth metropolitan area from 2013 to 2017
Intersection
Number Intersection name Suburb Intersection type1 Signalised
Speed
limit
Crash
Year
82300 Reid Hwy West Bnd Off And On Ramps & Mirrabooka Av Mirrabooka Interchange Yes 80 2008
50141 Princess Rd & Broadway2 Nedlands Roundabout No 50 2009
172320 North Beach Rd & Mews Ent2 Gwelup 3+ way intersection No 60 2010
57496 Westview St (North) & Crabbe Pl Karrinyup 3 way intersection No 50 2012
42737 Eric St & Broome St3 Cottesloe Roundabout No 50 2013
39613 Kewdale Rd & Dowd St West Welshpool 4+ way intersection Yes 70 2014
138650 Tonkin Hwy & Thomas Rd Oakford 3+ way intersection Yes 80 2014
76013 Moore Dr & Christchurch Tce Currambine 3+ way intersection No 80 2014
4143 Patterson Rd & Ennis Av East Rockingham 3+ way intersection Yes 80 2014
11621 Toodyay Rd & Reen Rd Gidgegannup 3 way intersection No 100 2015
34975 Mclarty Rd & Old Coast Rd & Leeward Ent Halls Head Roundabout No 60 2016
43847 Dorothy St & Hicks St2 Gosnells Roundabout No 60 2016
155433 Connolly Dr & Swavesey Av Butler 3+ way intersection No 50 2016
33590 Fishermans Rd & Mayfield Rd Coolup 3 way intersection No 110 2017 13+ and 4+ intersections indicate more complex intersections of their respective type 2Intersection also had either a hospitalisation or medical treatment crash 3Intersection also one hospitalisation
crash and three medical treatment crashes

45
Map 3: Map of Perth metropolitan area indicating intersections with any cyclist fatalities
(blue triangle) between 2008 and 2017

46
5 RECOMMENDATIONS FOR INDIVIDUAL HIGH-RISK INTERSECTIONS
The following section examines each of the eight intersections with cyclist KSI metrics of more
than two and makes recommendations for methods to improve their safety, based on the
literature review13.
5.1 Welshpool Road East and Lesmurdie Road, Lesmurdie
This intersection (Figure 2) has the highest cyclist KSI metric (2013 to 2017) of all intersections
in Perth, with three crashes involving hospitalisations and five crashes resulting in medical
treatment. It is not signalised and is classified as a three way intersection. However, it is
relatively complex, with Welshpool Road (speed limit 70km/h) having turning lanes in both
directions, and the two carriageways being separated by concrete medians. Lesmurdie Road
has a speed limit of 60km/h. Welshpool Road East has an average traffic volume of 12,424 per
day (Monday to Sunday, 2015/16) near the intersection (Main Roads Western Australia,
2019b).
There are no footpaths or other facilities for pedestrians or cyclists who choose to stay off the
carriageways. There is a cycle lane on the approach to the intersection which is unpainted and
has a separate crossing across Lesmurdie Road. The cycling lane originates partway along the
approaching turning lane, creating problems for cyclists who prefer to cycle on the far left of
the carriageway because of the high speeds of motor vehicles on Welshpool Road East. Cyclists
are then required to cross left-turning traffic in order to enter the emerging cycle lane. A further
issue is the left turn out of Lesmurdie Road into Welshpool Road East. Motorists may turn out
of this 60km/h road into the higher speed Welshpool Road East quickly, which may lead to
them focusing on vehicles coming from the westerly direction, and not ‘seeing’ cyclists (‘look
but did not see’).
This intersection is used by cyclists on training rides in the Perth Hills, with seven of the eight
hospitalisation and medical crashes occurring on a Saturday or Sunday morning between
6:30am and 8:30am. (Notably the other medical crash also occurred early in the morning, but
on a Wednesday. The property damage only crashes at this intersection mainly occurred on a
Saturday and all occurred between 6am and 8:30am). Cyclists on training rides tend to be more
experienced with good observational skills and knowledge of motor traffic.
13 All images in the following section were sourced from either NearMap or Google Maps.
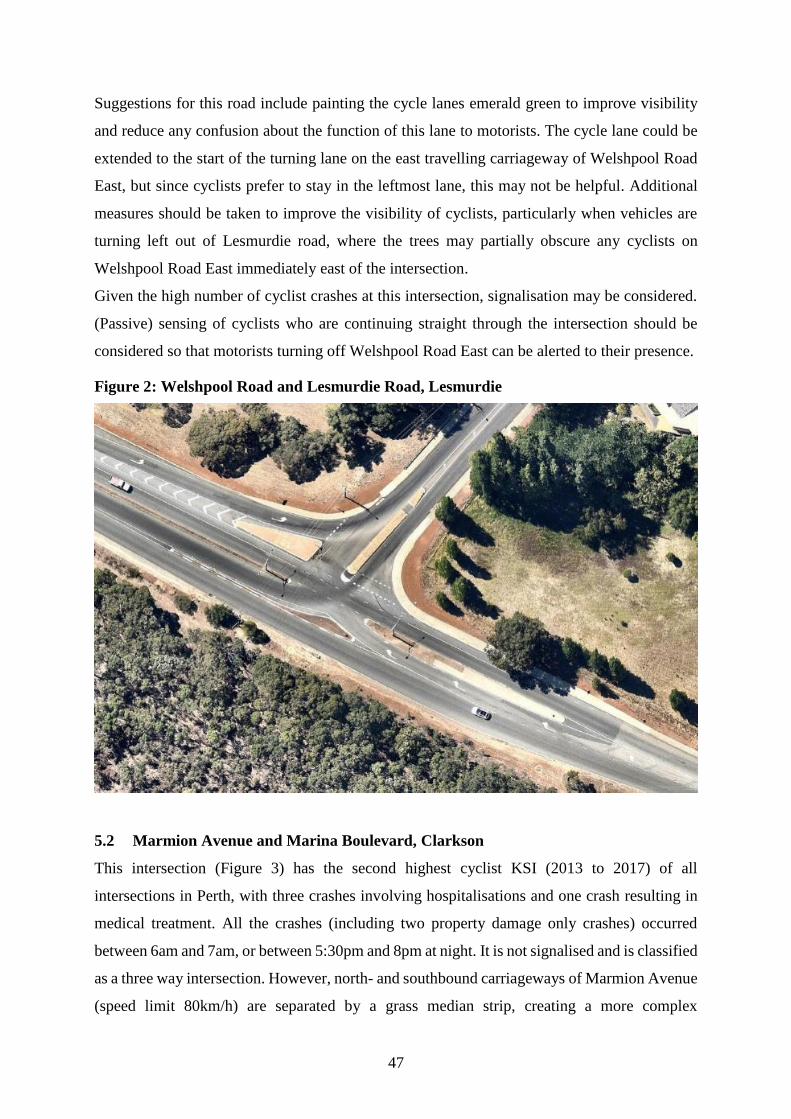
47
Suggestions for this road include painting the cycle lanes emerald green to improve visibility
and reduce any confusion about the function of this lane to motorists. The cycle lane could be
extended to the start of the turning lane on the east travelling carriageway of Welshpool Road
East, but since cyclists prefer to stay in the leftmost lane, this may not be helpful. Additional
measures should be taken to improve the visibility of cyclists, particularly when vehicles are
turning left out of Lesmurdie road, where the trees may partially obscure any cyclists on
Welshpool Road East immediately east of the intersection.
Given the high number of cyclist crashes at this intersection, signalisation may be considered.
(Passive) sensing of cyclists who are continuing straight through the intersection should be
considered so that motorists turning off Welshpool Road East can be alerted to their presence.
Figure 2: Welshpool Road and Lesmurdie Road, Lesmurdie
5.2 Marmion Avenue and Marina Boulevard, Clarkson
This intersection (Figure 3) has the second highest cyclist KSI (2013 to 2017) of all
intersections in Perth, with three crashes involving hospitalisations and one crash resulting in
medical treatment. All the crashes (including two property damage only crashes) occurred
between 6am and 7am, or between 5:30pm and 8pm at night. It is not signalised and is classified
as a three way intersection. However, north- and southbound carriageways of Marmion Avenue
(speed limit 80km/h) are separated by a grass median strip, creating a more complex

48
intersection. In addition, each of these carriageways consists of at least two lanes [plus turning
lanes into Marina Boulevard (speed limit 60km/h) from both directions.] Marmion Avenue has
an average of 27, 859 vehicles per day (Monday to Sunday, 2018/9) (Main Roads Western
Australia, 2019b).
There are limited footpaths on Marmion Road, making it difficult for cyclists to travel safely
outside the northbound carriageway. Good quality shared or cyclist footpaths should be
provided on the west side of Marmion Avenue, especially as it approaches from the south.
Unlike the previous intersection, the bicycle lane between the turning lane for Marmion Avenue
northbound and the other two lanes commences together with the turning lane. This would mean
that cyclists travelling on the far left of the carriageway (as preferred by many cyclists14) would
have to cross turning traffic if continuing straight along Marmion Avenue. One option to
improve safety is to provide a flashing light (triggered by an active sensor when as a cyclist
approaches) to warn motorists that the cyclist will be crossing the turning lane, just prior to it
turning into Marina Boulevard.
Further, there are no ‘on-road’ cyclist facilities on the Marmion Avenue southbound. As a
result, cyclists turning into Marina Boulevard, travelling on the left side of the carriageway,
have to cross several lanes of traffic to turn. To improve the safety of cyclist turning here, a
grade separated path or signalisation (with cyclist sensing) is required.
14 In some states in the US, cyclists are legally required to use the far right of the lane (equivalent to the far left in
Australia) unless it is unsafe to do so. The New Zealand Road rules state that cyclists should keep "'as near
as practicable' to the left side of the roadway'. These rules may have affected cycling culture in Australia.
Further, given the much slower speeds of cyclists (and their physical vulnerability), it makes sense to
cyclists to stay on the far left (in Australia) of the lane. The practice of ‘taking the lane’ or ‘claiming the
lane’ (riding in the centre of a lane) is less popular.

49
Figure 3: Marmion Avenue and Marina Boulevard, Clarkson

50
5.3 Marmion Avenue, Anchorage Drive and Neerabup Road, Heathridge
This intersection (Figure 4) has the joint 2nd highest cyclist KSI (2013 to 2017) of all
intersections in Perth, with three crashes involving hospitalisations and one crash resulting in
medical treatment. All these crashes, and the single property damage only crash, occurred
during day-time hours. The intersection is a double-lane roundabout (Figure 4), with the
approach roads having speed limits of 60km/h (Anchorage Road), 70km/h (Neerabup Road)
and 80km/h (Marmion Avenue), so it would be considered a high-speed roundabout. At the
entry to the roundabout, Anchorage Road has an average of 15,001 motor vehicles per day
(Monday to Sunday, 2017/18) (Main Roads Western Australia, 2019b).
The approach and departure roads of Anchorage Road contain bicycle lanes that terminate
shortly before the roundabout carriageway. The roundabout has separate (off-road) shared
unpainted concrete pathways (for pedestrians and cyclists). One of these commences on the
approach to the roundabout, so that on-road cyclists have the option of exiting the road prior
the roundabout. Each leg has a crossing for pedestrians, but no facilities such as a push button-
activated signalisation or zebra crossing, despite the high speeds of the approach roads. The
entry and exit lanes of each leg are separated by a raised median, which creates a refuge island
for pedestrians and cyclist not using the carriageway. Given the double-lanes in the roundabouts
and high speeds on the approach, grade separation of the cyclist route would be the ideal method
to improve the safety of this intersection for cyclists15. Signalisation of the crossings for
pedestrians and cyclists not using the carriageway, with active sensing (a push button) would
improve safety.
15 Grade separation (underpasses or overpasses) is safer than an on-road cycle lane, with lower delay and
inconvenience to cyclists than traditional off-road paths. DANIELS, S., BRIJS, T., NUYTS, E. & WETS,
G. 2009. Injury crashes with bicyclists at roundabouts: influence of some location characteristics and the
design of cycle facilities. J Safety Res, 40, 141-8, CAMPBELL, D., JURISICH, I. & DUNN, R. 2012.
Improved multi-lane roundabout designs for urban areas. Auckland: NZ Transport Agency.

51
Figure 4: Marmion Avenue, Anchorage Drive and Neerabup Road, Heathridge

52
5.4 Ardross Street and Macrae Road, Applecross
This intersection, a single-lane roundabout without signalisation, was the location of two
crashes resulting in hospitalisation and three crashes resulting in medical treatment. Both
Ardross Street and Macrae Road have speed limits of 50km/hour. There is no traffic volumes
available close to this intersection. The diameter of the central island is approximately six
metres, which is smaller than is optimal (Aumann, 2015). Although there are refuge islands
within the entry/exits of each leg, there are no formal crossing points for pedestrians and cyclist
not travelling within the carriageway. However, footpaths are absent or partially absent on two
of the approaches to the roundabout (see Figure 5).
The north and south sides of Ardross road have a black bicycle symbol within a yellow diamond
on the pavement approaching the intersection (a warning sign indicating that Ardross Road will
be crossing a road encouraging the presence of bicycles). Bicycle symbols are present in both
directions on the pavement of Macrae Road (north-east side of the roundabout). Macrae Road
is parallel to Canning Highway. The bicycle symbols on the pavement of Macrae Road function
to encourage cyclists to use this route, rather than the much busier Canning Highway. As a
result, the volume of cyclists is probably unexpectedly high in this suburban street. The
recorded crashes all occurred between 7am and 8:30am, and 5pm and 7pm, throughout the
week, possibility indicating that these cyclists are commuters.
The signage for motorists is good. Flashing signage alerting cyclists that this is a higher risk
intersection may be effective in increasing their focus on their safety. These signs could be
activated by passive sensing of approaching cyclists.

53
Figure 5: Ardross Street and MacRae Road, Applecross

54
5.5 South Perth Esplanade and Mends Street, South Perth
This intersection had with two crashes involving hospitalisations and three crashes resulting in
medical treatment between 2013 and 2017. These crashes, and the five additional property only
crashes, occurred throughout the week, between 8am and 7pm. It is classified as an unsignalised
three way intersection, with both approach roads having a speed limit of 50km/h (see Figure 6).
The South Perth Esplanade has speed humps starting approximately 25m to 30m from the entry
point to each side of the intersection. On the opposite site to the terminating Mends street is a
narrow section of the South Perth Foreshore, with two car parks close by, entrance to shared
paths adjacent to the Swan River (so recreational cyclists may enter via this intersection) and
the Mends Street Jetty, the embarkation point for the ferry to Elizabeth Quay.
Although there are no motor vehicle traffic volumes available near the intersection, there were
1,127 cyclists16 travelling on the cycle paths on the nearby non-motorised section of the South
Perth Esplanade (Main Roads Western Australia, 2019b). The intersection could be signalised
using a separate phase for cyclists at high cyclist volume times. These could be detected by
passive sensing. Further, a dedicated cycle path on the north side of South Perth Esplanade
would improve the safety of this area used by many residents of Perth for recreational cycling.
16 Bicycle counts for the South Perth Esplanade (Sir James Mitchell Park) were obtained from the Main Roads
Western Australia Trafficmap online tool.
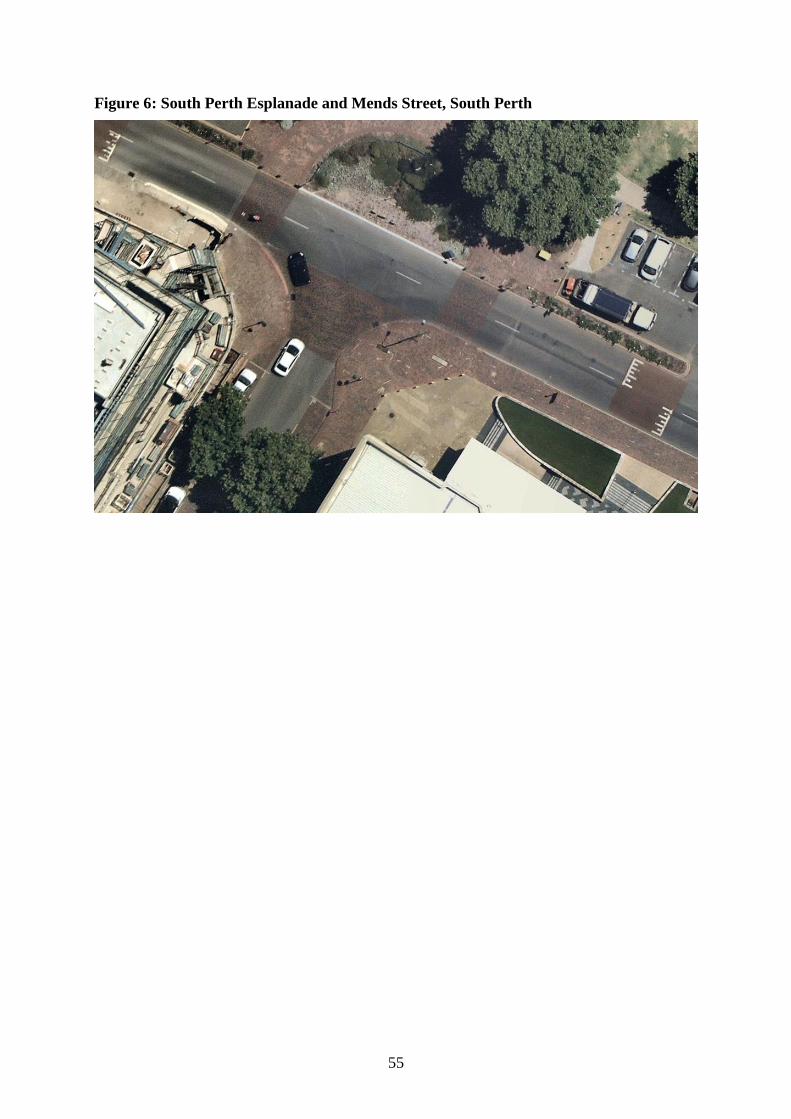
55
Figure 6: South Perth Esplanade and Mends Street, South Perth

56
5.6 Wellington Street and George Street, Perth
This intersection, located in the Perth CBD, was the site for two crashes involving
hospitalisation and two crashes involving medical treatment (Figure 8). These crashes, and the
three property only crashes, all occur between Monday to Thursday between 7am and 8am, and
4pm and 5:30pm, suggesting commuter cyclists were involved. This is a complex four way
intersection, involving multiple lanes (including turning lanes) in each carriageway, freeway
overpasses, reducing visibility of the east side of the intersection, and high volumes of traffic.
Wellington Street, west of the intersection, has a steep upward slope towards the west, slowing
cyclists down, which makes them vulnerable when sharing the road with motorists. In contrast,
cyclists travelling east downhill on Wellington Street tend to travel at relatively high speeds,
reducing their ability to respond rapidly to hazards.
This is the only intersection of the top eight high-risk cyclist intersections which is signalised.
The vehicle lanes contain inductive loops. George Street has a painted shared two-lane footpath
on one side of the road (including both cyclist and pedestrian symbols), and a divided median
in Wellington Street which allows vulnerable road users to cross it in multiple stages. The
pedestrian/cyclist crossings are signalised. Both roads have speed limits of 50km/h. The
east/west side of the intersection has no facilities for pedestrian/cyclist crossings. It is
recommended that the facilities on this side of the intersection are improved, through the
provision of footpaths and crossing points.

57
Figure 7: Wellington Street and George Street, Perth
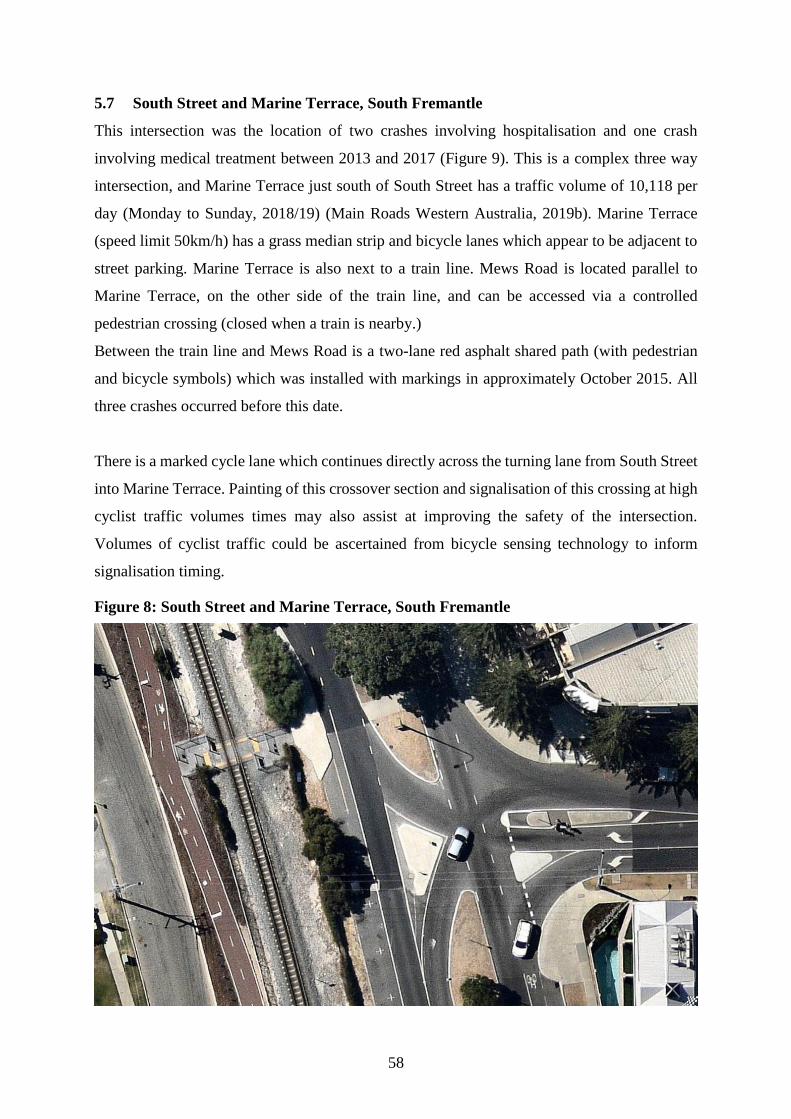
58
5.7 South Street and Marine Terrace, South Fremantle
This intersection was the location of two crashes involving hospitalisation and one crash
involving medical treatment between 2013 and 2017 (Figure 9). This is a complex three way
intersection, and Marine Terrace just south of South Street has a traffic volume of 10,118 per
day (Monday to Sunday, 2018/19) (Main Roads Western Australia, 2019b). Marine Terrace
(speed limit 50km/h) has a grass median strip and bicycle lanes which appear to be adjacent to
street parking. Marine Terrace is also next to a train line. Mews Road is located parallel to
Marine Terrace, on the other side of the train line, and can be accessed via a controlled
pedestrian crossing (closed when a train is nearby.)
Between the train line and Mews Road is a two-lane red asphalt shared path (with pedestrian
and bicycle symbols) which was installed with markings in approximately October 2015. All
three crashes occurred before this date.
There is a marked cycle lane which continues directly across the turning lane from South Street
into Marine Terrace. Painting of this crossover section and signalisation of this crossing at high
cyclist traffic volumes times may also assist at improving the safety of the intersection.
Volumes of cyclist traffic could be ascertained from bicycle sensing technology to inform
signalisation timing.
Figure 8: South Street and Marine Terrace, South Fremantle

59
5.8 Beeliar Drive and Wentworth Parade, Success
This intersection was the site for two crashes involving hospitalisation and one crash involving
medical treatment (Figure 10). This is a signalised complex three way intersection. Both roads
have raised medians separating the two carriageways.
Green painted bicycle lanes have been installed on the approach to the intersection which
terminate adjacent to the motor vehicle stop line on all three legs of the intersection. These
share inductive loops with the lanes to their left. Cycle lanes on Beeliar Drive westbound and
Wentworth Parade northbound are situated between turning lanes and straight travel lanes.
Since cyclists tend to prefer to travel as far to the left as possible, these may not be used
optimally. Pedestrian (and cyclist) crossings (zebra crossings for turning lanes and signalised
crossings at the major road crossings) are provided. These connect to the shared two-lane red
asphalt paths (with pedestrian and cyclist symbols). The colour was added to these shared paths
in mid-2014. Only one crash has occurred since this change. No footpaths are provided on the
northern side of the intersection (along the north side of Beeliar Drive).
Notably, there is another even more complex intersection immediately east (Beeliar Drive and
Midegooroo Avenue). Both intersections have multiple facilities. It is recommended that the
two intersections be analysed as a system, rather than individually, to assess how best to
improve cyclist (and other vulnerable road user) safety.

60
Figure 9: Beeliar Drive and Wentworth Parade, Success

61
5.9 Conclusion
This report examined methods of improving safety for cyclists at intersections, with particular
emphasis on sensing technologies. The characteristics of cyclist crashes at intersections were
examined and high risk intersections were identified and ranked, according to the number of
crashes with fatal, hospitalisation and medical treatment injuries resulting from these crashes.
Notably, only two of the highest risk intersections were signalised, so sensing technology at
intersections, which can impact on timing of signals, would only be appropriate at these
intersections. Signalising of the remaining intersections, and installing sensing technology such
as appropriately designed and positioned inductive coil sensing, should be considered for the
remaining intersections. Signal timing should be adapted to take into account the needs of on-
road and off-road cyclists. Additional cyclist facilities, such as off-road cycling paths and well-
placed cyclist lanes, should also be considered. The intersections identified consist of a mixture
of both state and local roads, so both Main Roads Western Australia and the relevant local
government authorities need to be consulted when considering any changes.
The future of cyclist safety may lie in communication between vehicles and infrastructure
(connected vehicles). However, currently connected and autonomous motor vehicles struggle
to detect bicycles (Richards, 2018). Technologies which can be attached to bicycles are
developing to enable sensing of vehicles. These may provide options for individual cyclists
who travel during higher volume times, such as commuter cyclists, to improve their safety.
However, long-term solutions are developing which enable the detection of bicycles by motor
vehicles and communication between these vehicle types and road infrastructure (V2X or
vehicle-to everything).

62
6 REFERENCES
AUMANN, P. 2015. Guide to road design part 4B: roundabouts. 3rd ed. Sydney, Australia:
Austroads.
AUMANN, P. & WHITEHEAD, M. 2017. Guide to road design part 4: intersections and
crossings: general. Sydney, Australia: Austroads.
AUSTROADS INC. 2000. Pedestrian and cyclist safety — comparison of pedestrian and
bicycle accidents in New South Wales,Victoria and Queensland Sydney.
AWAD, E., DSOUZA, S., KIM, R., SCHULZ, J., HENRICH, J., SHARIFF, A.,
BONNEFON, J.-F. & RAHWAN, I. 2018. The Moral Machine experiment. Nature,
563, 59-64.
BIKEWALK NC. 2018. Bicycle detection at traffic signals [Online]. Available:
https://www.bikewalknc.org/bicycle-detection-at-traffic-signals/ [Accessed 16
October 2018].
BLAKE, P. 2013. Best practice study on the use of Intelligent Transport Systems (ITS)
standards in traffic management. Sydney, Australia: Austraods.
BLANKENAU, I., ZOLOTOR, D., CHOATE, M., JORNS, A., HOMANN, Q. & DEPCIK,
C. 2018. Development of a Low-Cost LIDAR System for Bicycles. SAE Technical
Paper.
BOUDART, J., LIU, R., KOONCE, P. & OKIMOTO, L. 2015. Assessment of Bicyclist
Behavior at Traffic Signals with a Detector Confirmation Feedback Device.
Transportation Research Record: Journal of the Transportation Research Board, 61-
66.
BOUDART, J. P. E., FOSTER, N. A., KOONCE, P. P. E., MAUS, J. & OKIMOTO, L. 2017.
Improving Bicycle Detection Pavement Marking Symbols to Increase Comprehension
at Traffic Signals. Institute of Transportation Engineers. ITE Journal, 87, 29-34.
BRUDE, U. 2000. What roundabout design provides the highest possible safety? Nordic Road
and Transport Research, 12, 17-21.
CAMPBELL, D., JURISICH, I. & DUNN, R. 2012. Improved multi-lane roundabout designs
for urban areas. Auckland: NZ Transport Agency.
CHO, H., RYBSKI, P. E. & ZHANG, W. Vision-based bicycle detection and tracking using a
deformable part model and an EKF algorithm. Intelligent Transportation Systems
(ITSC), 2010 13th International IEEE Conference on, 2010. IEEE, 1875-1880.
CONSTANT, A. & LAGARDE, E. 2010. Protecting vulnerable road users from injury. PLoS
Medicine, 7, 1-4.
CVIS 2010. Cooperative urban mobility.
DANIELS, S., BRIJS, T., NUYTS, E. & WETS, G. 2009. Injury crashes with bicyclists at
roundabouts: influence of some location characteristics and the design of cycle
facilities. J Safety Res, 40, 141-8.
DEPARTMENT OF TRANSPORT WESTERN AUSTRALIA & MAIN ROADS WESTERN
AUSTRALIA 2016. Cycling Network Plan: Transport @ 3.5 Million. Perth.
DILL, J., MONSERE, C. M. & MCNEIL, N. 2012. Evaluation of bike boxes at signalized
intersections. Accid Anal Prev, 44, 126-34.
DOLLÁR, P., APPEL, R., BELONGIE, S. & PERONA, P. 2014. Fast feature pyramids for
object detection. IEEE Transactions on Pattern Analysis and Machine Intelligence,
36, 1532-1545.
ESPADA, I. 2016. Guide to traffic management part 9: traffic operations. 3rd ed.
FELZENSZWALB, P. F., GIRSHICK, R. B., MCALLESTER, D. & RAMANAN, D. 2010.
Object detection with discriminatively trained part-based models. IEEE transactions
on pattern analysis and machine intelligence, 32, 1627-1645.

63
FOROOZANDEH SHAHRAKI, F. 2017. Cyclist Detection, Tracking, and Trajectory
Analysis in Urban Traffic Video Data. 10617092 M.S., University of Nevada, Las
Vegas.
GÅRDER, P., LEDEN, L. & PULKKINEN, U. 1998. Measuring the safety effect of raised
bicycle crossings using a new research methodology. Transportation Research
Record: Journal of the Transportation Research Board, 64-70.
GIRSHICK, R., DONAHUE, J., DARRELL, T. & MALIK, J. Rich feature hierarchies for
accurate object detection and semantic segmentation. Proceedings of the IEEE
conference on computer vision and pattern recognition, 2014. 580-587.
HABIBOVIC, A. & DAVIDSSON, J. 2011. Requirements of a system to reduce car-to-
vulnerable road user crashes in urban intersections. Accident Analysis & Prevention,
43, 1570-1580.
HAMILTON, A., WATERSON, B., CHERRETT, T., ROBINSON, A. & SNELL, I. 2013.
The evolution of urban traffic control: changing policy and technology.
Transportation Planning and Technology, 36, 24-43.
HUNTER, W., HARKEY, D., STEWART, J. & BIRK, M. 2000. Evaluation of Blue Bike-
Lane Treatment in Portland, Oregon. Transportation Research Record: Journal of the
Transportation Research Board, 1705, 107-115.
JENSEN, S. U. 2008. Safety effects of blue cycle crossings: A before-after study. Accident
Analysis & Prevention, 40, 742-750.
JEON, W. & RAJAMANI, R. A novel collision avoidance system for bicycles. 2016
American Control Conference (ACC), 6-8 July 2016 2016. 3474-3479.
LI, X., FLOHR, F., YANG, Y., XIONG, H., BRAUN, M., PAN, S., LI, K. & GAVRILA, D.
M. A new benchmark for vision-based cyclist detection. Intelligent Vehicles
Symposium (IV), 2016 IEEE, 2016. IEEE, 1028-1033.
MAIN ROADS 2016. Road Trauma Risk Analysis: guideline. Perth: Main Roads Western
Australia.
MAIN ROADS WESTERN AUSTRALIA 2016. Part C: Technical Guideline - Bicycle
Directional Signs. Perth.
MAIN ROADS WESTERN AUSTRALIA 2018. 1.1 Regulatory Signs - Category 1. Perth:
Main Roads Western Australia.
MAIN ROADS WESTERN AUSTRALIA 2019a. 1.3 Guide Signs - Category 1. Signs Indext.
Perth.
MAIN ROADS WESTERN AUSTRALIA 2019b. Trafficmap. Main Roads Western
Australia.
MEAD, J., MCGRANE, A., ZEGEER, C. & THOMAS, L. 2014. Evaluation of bicycle-
related roadway measures: a summary of available research. Pedestrian and Bicycle
Information Center.
NEMA, ITE & AASHTO. 2018. NTCIP: About [Online]. Available:
https://www.ntcip.org/about/ [Accessed 19 December 2018].
NZ TRANSPORT AGENCY. 2019. Cycle detection [Online]. Available:
https://www.nzta.govt.nz/walking-cycling-and-public-transport/cycling/cycling-
standards-and-guidance/cycling-network-guidance/designing-a-cycle-
facility/intersections-and-crossings/signalised-intersections/cycle-detection/ [Accessed
2019 15 January].
OFFICE OF ROAD SAFETY 2009. Towards Zero. Road Safety Strategy to Reduce Road
Trauma in Western Australia 2008 - 2020. Perth, Australia: State Government of
Western Australia.

64
OKIMOTO, L. Blue light special: improving bicycle infrastructure with active feedback
devices. 2015 ITE Western District Annual Meeting, 19-22 Julay 2015 Las Vegas,
Nevada. 6.
PUCHER, J. & BUEHLER, R. 2008. Making cycling irresistible: Lessons from the
Netherlands, Denmark and Germany. Transport Reviews, 28, 495-528.
REYNOLDS, C. C., HARRIS, M. A., TESCHKE, K., CRIPTON, P. A. & WINTERS, M.
2009. The impact of transportation infrastructure on bicycling injuries and crashes: a
review of the literature. Environ Health, 8, 47.
RICHARDS, C. 2018. Will life be better in the saddle when no-one's behind the wheel?
Cycling in the age of driverless cars. APPS Policy Forum [Online]. Available:
https://www.policyforum.net/will-life-better-saddle-no-ones-behind-wheel/.
ROSS, C. 7 January 2019. RE: RE: Query about NTCIP. Type to WOOLLEY, M. &
HOBDAY, M.
SCHOON, C. & VAN MINNEN, J. 1994. Safety of roundabouts in The Netherlands. Traffic
Engineering and Control, 35, 142-148.
SHANTEAU, R. M. Bicycle detection at traffic actuated signals. AB 1581 Subcommittee of
the California Traffic Control Devices Committee, 4 March 2008.
SHLADOVER, S. E., SHARAFSALEH, A., CHEONG, A., SPRING, J. & LEUNG, K. 2010.
Bicycle detection and operational concept at signalized intersections. Phase 2B: testing
a bicyclist detection system.
STANDARDS AUSTRALIA 2018. Manual of uniform traffic control devices part 9: bicycle
facilities. Sydney, New South Wales: SAI Global Limited.
STEVENSON, M., THOMPSON, J., DE SÁ, T. H., EWING, R., MOHAN, D., MCCLURE,
R., ROBERTS, I., TIWARI, G., GILES-CORTI, B., SUN, X., WALLACE, M. &
WOODCOCK, J. 2016. Land use, transport, and population health: estimating the
health benefits of compact cities. The Lancet, 388, 2925-2935.
STRACHAN, R. & VAN DEN DOOL, D. 2017. Traffic Signal Features for Bicycles.
Sydney, Australia.
SUNDSTROM, C. & NABORS, D. 2014a. Bicycle signal heads. Bikesafe. Bicyclel Safety
Guide and Countermeasure Selection System. Federal Highway Administration, U.S
Department of Transportation.
SUNDSTROM, C. & NABORS, D. 2014b. Bike-activated signal detection. Federal Highway
Administration, U.S. Department of Transportation.
SUNDSTROM, C. & NABORS, D. 2014c. Optimizing signal timing for bicycles. Federal
Highway Administration, U.S. Department of Transportation.
TAYLOR, S., GIANG, C., CHAU, P. & AUMANN, P. 2017. Cycling aspects of Austroads
guides. 3rd ed. Sydney.
TURNER, S., SINGH, R., ALLATT, T. & NATES, G. 2011. Effectiveness and selection of
treatments for cyclists at signalised intersections. Austroads.
VAN BRUMMELEN, J., EMRAN, B., YESILCIMEN, K. & NAJJARAN, H. Reliable and
low-cost cyclist collision warning system for safer commute on urban roads. 2016
IEEE International Conference on Systems, Man, and Cybernetics (SMC), 9-12 Oct.
2016 2016. 003731-003735.
VAN DEN DOOL, D., MURPHY, J. & BOTROSS, S. 2014. Cycling infrastructure: Selected
case studies. Sydney: Austraods.
VICROADS 2016. Traffic Engineering Manual. Volume 3 - additional network standards and
guidelines. Guidance on bicycle and pedestrian treatements at roundabouts. 1st1 ed.
Melbourne, Victoria: Victoria State Government.
WALLICH, P. 2015. An early-warning system for your bike. IEEE Spectrum, 52, 22-23.

65
WARNER, J., HURWITZ, D. S., MONSERE, C. M. & FLESKES, K. 2017. A simulator-
based analysis of engineering treatments for right-hook bicycle crashes at signalized
intersections. Accident Analysis and Prevention, 104, 46-57.
WEGMAN, F., ZHANG, F. & DIJKSTRA, A. 2012. How to make more cycling good for
road safety. Accid Anal Prev, 44.
WOODCOCK, J., TAINIO, M., CHESHIRE, J., O’BRIEN, O. & GOODMAN, A. 2014.
Health effects of the London bicycle sharing system: health impact modelling study.
BMJ : British Medical Journal, 348, g425.
Copyright © 2022 FDOKUMEN