Using Remote Sensing and Spatial Information Technologies to Detect and Map Two Aquatic Macrophytes
10
J. Aquat. Plant Manage. 37: 1999. 71 Using Remote Sensing and Spatial Information Technologies to Detect and Map Two Aquatic Macrophytes J. H. EVERITT 1 , C. YANG 1 , D. E. ESCOBAR 1 , C. F. WEBSTER 2 , R. I. LONARD 3 AND M. R. DAVIS 1 ABSTRACT This paper describes the light reflectance characteristics of waterhyacinth [ Eichhornia crassipes (Mort.) Solms] and hy- drilla [ Hydrilla verticillata (L. F.) Royle] and the application of airborne videography with global positioning system (GPS) and geographic information system (GIS) technolo- gies for distinguishing and mapping the distribution of these 1 USDA/ARS Integrated Farming and Natural Resources Unit, 2413 E. Highway 83, Weslaco, TX 78596. E-mail:[email protected] 2 Region 15 Water Program, Texas Natural Resource Conservation Com- mission, 1804 W. Jefferson, Harlingen, TX 78550 3 Biology Department, University of Texas-Pan American, Edinburg, TX 78539. Received for publication February 2, 1999 and in revised form March 2, 2000. 4 Trade names are included for the benefit of the reader and do not imply endorsement of or a preference for the product listed by the United States Department of Agriculture. two aquatic weeds in waterways of southern Texas. Field re- flectance measurements made at several locations showed that waterhyacinth generally had higher near-infrared (NIR) reflectance than associated plant species and water. Hydrilla had lower NIR reflectance than associated plant species and higher NIR reflectance than water. Reflectance measure- ments made on hydrilla plants submerged below the water surface had similar spectral characteristics to water. Waterhy- acinth and hydrilla could be distinguished in color-infrared (CIR) video imagery where they had bright orange-red and reddish-brown image responses, respectively. Computer anal- ysis of the imagery showed that waterhyacinth and hydrilla infestations could be quantified. An accuracy assessment per- formed on the classified image showed an overall accuracy of 87.7%. Integration of the GPS with the video imagery per- mitted latitude/longitude coordinates of waterhyacinth and hydrilla infestations to be recorded on each image. A portion of the Rio Grande River in extreme southern Texas was flown with the video system to detect waterhyacinth and hyd- J. Aquat. Plant Manage. 37: 71-80
-
Upload
independent -
Category
Documents
-
view
0 -
download
0
Transcript of Using Remote Sensing and Spatial Information Technologies to Detect and Map Two Aquatic Macrophytes
J. Aquat. Plant Manage.
37: 1999. 71
Using Remote Sensing and Spatial Information Technologies to Detect and Map Two
Aquatic Macrophytes
J. H. EVERITT
1
, C. YANG
1
, D. E. ESCOBAR
1
, C. F. WEBSTER
2
, R. I. LONARD
3
AND M. R. DAVIS
1
ABSTRACT
This paper describes the light reflectance characteristicsof waterhyacinth [
Eichhornia crassipes
(Mort.) Solms] and hy-drilla [
Hydrilla verticillata
(L. F.) Royle] and the applicationof airborne videography with global positioning system(GPS) and geographic information system (GIS) technolo-gies for distinguishing and mapping the distribution of these
1
USDA/ARS Integrated Farming and Natural Resources Unit, 2413 E.Highway 83, Weslaco, TX 78596. E-mail:[email protected]
2
Region 15 Water Program, Texas Natural Resource Conservation Com-mission, 1804 W. Jefferson, Harlingen, TX 78550
3
Biology Department, University of Texas-Pan American, Edinburg, TX78539. Received for publication February 2, 1999 and in revised form March2, 2000.
4
Trade names are included for the benefit of the reader and do notimply endorsement of or a preference for the product listed by the UnitedStates Department of Agriculture.
two aquatic weeds in waterways of southern Texas. Field re-flectance measurements made at several locations showedthat waterhyacinth generally had higher near-infrared (NIR)reflectance than associated plant species and water. Hydrillahad lower NIR reflectance than associated plant species andhigher NIR reflectance than water. Reflectance measure-ments made on hydrilla plants submerged below the watersurface had similar spectral characteristics to water. Waterhy-acinth and hydrilla could be distinguished in color-infrared(CIR) video imagery where they had bright orange-red andreddish-brown image responses, respectively. Computer anal-ysis of the imagery showed that waterhyacinth and hydrillainfestations could be quantified. An accuracy assessment per-formed on the classified image showed an overall accuracy of87.7%. Integration of the GPS with the video imagery per-mitted latitude/longitude coordinates of waterhyacinth andhydrilla infestations to be recorded on each image. A portionof the Rio Grande River in extreme southern Texas wasflown with the video system to detect waterhyacinth and hyd-
J. Aquat. Plant Manage.
37: 71-80
72
J. Aquat. Plant Manage.
37: 1999.
rilla infestations. The GPS coordinates on the CIR videoscenes depicting waterhyacinth and hydrilla infestations wereentered into a GIS to map the distribution of these two nox-ious weeds in the Rio Grande River.
Key words:
light reflectance, aerial videography, hydrilla,
Hydrilla verticillata
, waterhyacinth,
Eichhornia crassipes
.
INTRODUCTION
Aquatic macrophytes are important components of wet-land communities because they play a crucial role in provid-ing food and shelter for animals as well as regulating thechemistry of the open water (Mclaughlan 1974, Frodge et al.1990). These plants may be free-floating or rooted in bottomsediment and may be submersed or protrude from the water(Patterson and Davis 1991). Although aquatic macrophytesare beneficial, some species can hinder human activity. Theyclog reservoirs, reducing water availability for human needs.Also, the proliferation of aquatic macrophytes affect recre-ational activities, obstructing boat navigation and reducingaccess to the shoreline, especially in protected areas such ascoves (Narumalani et al. 1997).
Waterhyacinth and hydrilla are two exotic aquatic macro-phytes that often invade and clog waterways. Waterhyacinthis a floating species that has been called the “world’s worstweed” (Cook 1990). It is a native of South America that isnow found in many tropical and subtropical areas of theworld. Waterhyacinth is believed to have been introduced in-to the United States in the mid 1880s in Louisiana (Tabitaand Woods 1962). It is now found from Virginia to Floridaand west to Texas and Missouri; it also occurs in California(Correll and Correll 1972). Populations may double in sizeevery 6 to18 days. Through the process of transpiration, therate of water lost to the atmosphere in areas inundated withwaterhyacinth may be 4 to 5 times that in areas with open wa-ter (Mitchell 1976).
Hydrilla is a submersed species that is probably native tothe warm regions of Asia (Cook and Luond 1982). It is now acosmopolitan species that occurs in many areas of the world,including Europe, Asia, Africa, Australia, South America,and North America (Langeland 1996). Hydrilla was first dis-covered in the United States in Florida in 1960 (Blackburn etal. 1969) and has since spread throughout the eastern sea-board states as well as California, Arizona, and Washington(Schmitz 1990, Langeland 1996). Once established in a sys-tem, hydrilla can alter the environment detrimentally byreplacing native aquatic vegetation and affecting fish popula-tions (Barnett and Schneider 1974, Colle and Shireman1980, Langeland 1996). Hydrilla also interferes with move-ment of water for drainage and irrigation purposes and re-duces boating access, thus reducing recreational use of thewater body (Langeland 1996).
The value of remote sensing for assessing and managingwetlands is well established (Carter 1982, Tiner 1997). Plantcanopy reflectance measurements have been used to differ-entiate among wetland plant species (Best et al. 1981) andaerial photography has been used extensively to remotelydistinguish plant species and communities in wetland envi-ronments (Seher and Tueller 1973, Howland 1980, Carter1982, Martyn 1985). More recently, airborne videography
has also proven useful for assessing wetlands (Mackey et al.1987, Sersland et al. 1995).
Aerial videography and global positioning system (GPS)technology have been integrated and shown to be usefultools for detecting and mapping weed species on rangelandsand brush species in riparian areas (Everitt et al. 1994, 1996).Latitude/longitude data provided by the GPS were enteredinto a geographic information system (GIS) to map noxiousplant populations over extensive areas.
Over the past few years hydrilla and waterhyacinth have in-creased in abundance in south Texas waterways, includingthe Rio Grande River. The objectives of this study were: (1)to determine the plant canopy light reflectance characteris-tics of hydrilla and waterhyacinth to facilitate their detectionin aerial videography and (2) to demonstrate the effective-ness of airborne videography, GPS, and GIS technologies fordetecting and mapping hydrilla and waterhyacinth infesta-tions in waterways in southern Texas.
MATERIALS AND METHODS
This study was conducted on several waterways in south-ern Texas. Study sites included the Rio Grande River in theLower Rio Grande Valley (LRGV), a pond near San Benito inthe LRGV, the Frio River near Tilden, the Atascosa Rivernear Pleasanton, and Lake Texana near Edna. Field reflec-tance measurements, aerial videography, and ground truthobservations were conducted for this study.
Reflectance measurements were made at four sites:Brownsville, San Benito, Tilden, and Pleasanton, Texas. Mea-surements were made at the different sites on several datesduring 1998 to characterize the spectral characteristics of theplant species over the summer growing season. Reflectancemeasurements were made on 10 randomly selected plant can-opies of each species or species mixture and water surfaceswith a Barnes
4
modular multispectral radiometer (Robinsonet al. 1979). Measurements were made in the visible green(0.52-0.60
µ
m), visible red (0.63-0.69
µ
m), and near-infrared(NIR) (0.76-0.90
µ
m) spectral bands with a sensor that had a15-degree field-of-view placed 1 to 1.5 m above each plant orwater target. A small boat was used to approach those targetslocated in the water. Reflectance measurements were madebetween 1100 and 1500 hours central standard time undersunny conditions. Radiometric measurements were correctedto reflectance using a barium sulfate standard. Overheadphotographs were obtained of plant canopies and water mea-sured with the radiometer to help interpret reflectance data.
Reflectance measurements were made at a site on the RioGrande near Brownsville on July 1 and September 14, 1998.Measurements were made on hydrilla, waterhyacinth, waterstargrass [
Heteranthera dubia
(Jacq.) MacM.], guineagrass(
Panicum maximum
Jacq.), deep water (> 1.0 m), and shallowwater (clear) (< 0.3 m). Water stargrass is an aquatic speciesthat grows in association with hydrilla and waterhyacinth,whereas guineagrass is a common terrestrial species growingalong the river bank. With the exception of water stargrass,measurements were made on these species on both dates. Aninsufficient number of water stargrass plants were availablefor measurements in September. For the July date, reflec-tance measurements were also made on totally submerged
J. Aquat. Plant Manage.
37: 1999. 73
hydrilla plants at three depths: 2.5 to 7.5 cm, 7.5 to 15.0 cm,and 15.0 to 30.0 cm. These criteria were selected based onobservations of hydrilla growth status in the field. Hydrillaplants at depths greater than 30 cm were not taken into con-sideration because they generally were not discernible.
Spectral measurements were made on waterhyacinth, Ber-mudagrass [
Cynodon dactylon
(L.) Pers.], and water (turbid)at the San Benito study site on June 23, 1998. Measurementswere made at the Pleasanton study site on June 24 and Sep-tember 2, 1998. For the June date, measurements were madeon waterhyacinth, Bermudagrass, black willow (
Salix nigra
Marsh.), and water (turbid). In September, measurementswere made on waterhyacinth, Bermudagrass, black willow,mixed herbaceous species (grasses, sedges, and broad-leavedherbs), and water (turbid). Bermudagrass, black willow, andmixed herbaceous species were common terrestrial speciesat the respective study sites. Mixed herbaceous species werenot available in June at Pleasanton due to drought condi-tions. No turbidity measurements were made on the water.
For the Tilden study site, reflectance measurements weremade on June 24, 1998. Measurements were made on hydril-la (primarily on the surface), Bermudagrass, mixed herba-ceous species, black willow, dryland willow (
Baccharis neglecta
Britt.), and water. Bermudagrass, mixed herbaceous species,black willow, and dryland willow were common terrestrialspecies at the Tilden site.
Aerial video imagery was taken with a three-camera multi-spectral digital video imaging system (Everitt et al. 1995) anda single camera color video system (Everitt et al. 1996). Themultispectral system was comprised of three charge-coupleddevice (CCD) aligned cameras, a computer, a color encoder,and a super-VHS recorder. The cameras are visible/NIR (0.4-1.1
µ
m) light sensitive. Two of the cameras are equipped withvisible yellow-green (0.555-0.565
µ
m) and red (0.623-0.635
µ
m) filters, respectively, while the third camera had a NIR(0.845-0.857
µ
m) filter. All of the cameras had fixed lenseswith 17 mm focal lengths. The alignment of these cameras toacquire real-time registered CIR imagery has been previouslydescribed by Everitt et al. (1991).
The computer is a 486 DX 50 system that has an imagegrabbing board (640
×
480 pixel resolution) and a 1000-mega-byte storage capacity hard drive. The NIR, red, and yellow-green image signals from the cameras are subjected to theRGB inputs, respectively, of the grabbing board in the com-puter and also the RGB inputs respectively, of the color encod-er. This permits the simultaneous acquisition of both digitaland analog real-time color-infrared (CIR) composite imagery.The digital imagery is stored in the computer hard drive,while the analog imagery is recorded on the super-VHS re-corder. The hard drive can store 1000 CIR composite images.Multispectral imagery was acquired of the Rio Grande Riverfrom its mouth at Boca Chica to Falcon Dam near Roma, Tex-as on June 26 and August 25, 1998. Imagery was also acquiredof the Edna and Tilden study sites on August 11, 1998, and thePleasanton site on September 2, 1998. Additional imagery wasalso taken of an area near Brownsville on September 3, 1998.Imagery was acquired at altitudes above ground level rangingfrom 460 to 1525 m (0.35 to 1.20 m ground pixel sizes).
The color video system was comprised of a normal colorcamera and a super-VHS recorder. The camera was equipped
with a fixed lens having a 17 mm focal length. Normal colorvideo imagery was obtained of the Rio Grande from BocaChica to Falcon Dam on August 26-27, 1998. Imagery was ob-tained at an altitude above ground level of 275 m and had aground pixel size of 0.23 m.
A Cessna (model 404) airplane, equipped with a cameraport in the floor, was used for obtaining the video imagery.All imagery was acquired between 1100 and 1530 hours un-der sunny conditions.
A CIR composite digital video image of a portion of theRio Grande 13 km west of Brownsville infested with hydrillaand waterhyacinth was used for computer classification andaccuracy assessment. The image was acquired on September3, 1998. The image was subjected to pixel line correction andimage to image registration using Adobe Photoshop and Im-age Pro Plus software, respectively. For the image registrationprocess, the red band was used as the base image to rectifythe other two bands. The image was also georeferenced usingErdas Imagine software (Version 8.3). The CIR composite im-age was subjected to an Iterative Self-Organizing Data Analy-sis (ISODATA) which performs unsupervised classificationson the basis of specified iterations and recalculates statisticsfor each iteration (Erdas, Inc. 1997). The ISODATA tech-nique uses minimum spectral distance to assign a cluster foreach selected pixel. With a specified number of arbitrarycluster means, the technique repetitively processes them inwhich new means shift toward the means of the clusters inthe data. Each unsupervised classification completed in thisstudy created four classes from four data iterations at a 0.99%convergence threshold (the maximum percentage of pixelscluster assignments go unchanged between iterations). Theclasses consisted of water, hydrilla, waterhyacinth, and ripari-an vegetation. For accuracy assessment of the classification,65 points were assigned to the four classes in a stratified ran-dom pattern. The geographic coordinates of these pointswere determined and a Trimble GPS Pathfinder Pro XRS sys-tem was used to navigate to these points in ground truthing.Both a producer’s and user’s accuracy were calculated. Theproducer’s accuracy (measure of omission error) is the totalnumber of correct points in a category divided by total num-ber of points of that category as derived from the referencedata (ground truth data). The user’s accuracy (measure ofcommission error) is the total number of correct points in acategory divided by total number of points of that category asderived from the classification data (map data).
An Omnistar (model 3000L) differential GPS and Horita(model GPT-50) real-time GPS video/digital captioner/inter-phaser was integrated with the video systems. The GPS acquiredthe latitude/longitude coordinate data of the aircraft loca-tion over the scene of interest, while the video interphasertransferred and superimposed the GPS data at the bottom ofthe video scene. The accuracy of the GPS was approximately
±
20 m from the center coordinates of each video scene.Personal computer MapInfo-GIS software was used to gen-
erate a regional map of the LRGV that included Cameron,Hidalgo, Starr, and Willacy Counties and a detail map of aportion of Cameron County. MapInfo uses StreetWorkswhich is a street display mapping product that provides cov-erage of U.S. streets, highways, city and town boundaries, arealandmarks, point locations, and water features. StreetWorks
74
J. Aquat. Plant Manage.
37: 1999.
is based on U.S. Census Bureau TIGER (Topologically Inte-grated Geographic Encoding and Referencing) 95 data thatincludes street-level detail to the local level. The TIGER map-based system was constructed using USGS 1:100,000 scaledigital line graph maps. These maps were produced to geo-graphically map hydrilla and waterhyacinth infestations inthe Rio Grande using the airborne video survey GPS data.
Ground truth surveys were conducted at sites where aerialvideography was obtained. Observational data recorded wereplant species, density, cover, soil type, and water condition. Asmall boat was used to conduct some of the ground surveys.Low altitude (75-150 m) aerial reconnaissance was also con-ducted at many sites to verify the presence of hydrilla and wa-terhyacinth.
Green, red, and NIR ground reflectance data for the plantspecies and water parameters from the various study siteswere analyzed using analysis of variance techniques. Dun-can’s multiple range test was used to separate means at the0.05 probability level (Steel and Torrie 1980).
RESULTS AND DISCUSSION
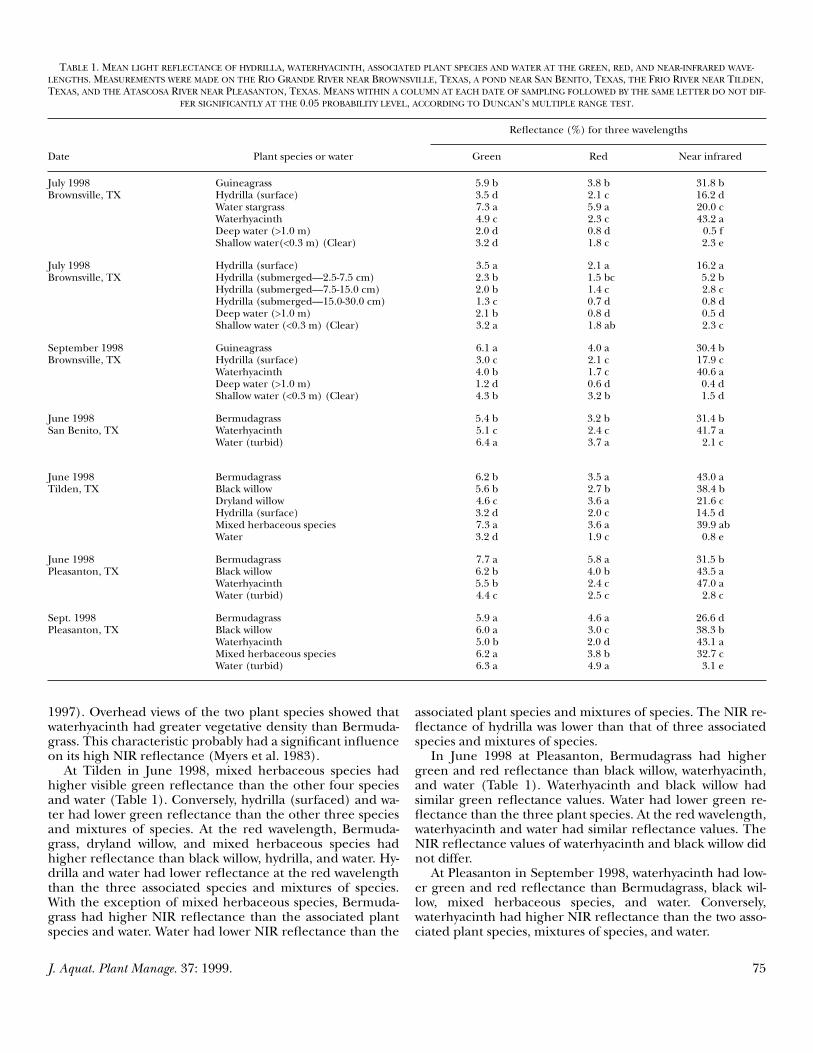
Reflectance measurements
. At Brownsville in July 1998, waterstargrass had higher reflectance than the other three plantspecies, deep water, and shallow water at the visible greenwavelength (Table 1). It also had higher visible red reflec-tance than the other plant species and water. The green andred reflectance values of guineagrass were higher than thoseof waterhyacinth, hydrilla, and the two water parameters.The green reflectance value of waterhyacinth was significant-ly different (p = 0.05) than those of the other plant speciesand water parameters. Hydrilla, deep water, and shallow wa-ter had similar green reflectance values. At the red wave-length, hydrilla, waterhyacinth, and shallow water hadsimilar reflectance values. Deep water had lower reflectanceat the red wavelength than the plant species and shallow wa-ter. Visible reflectance in vegetation is primarily affected byplant pigments (Myers et al. 1983, Gausman 1985). Waterstargrass had yellow-green leaves and guineagrass had lightgreen leaves, whereas waterhyacinth and hydrilla had darkgreen and deep dark green leaves, respectively. The darkergreen foliage of waterhyacinth and hydrilla reflected lessgreen light and absorbed more red light than the lightergreen foliage of water stargrass and guineagrass (Gausman1985). Chlorophyll in the water contributed to its dark color,thus causing lower visible reflectance values.
Waterhyacinth had higher NIR reflectance than the otherplant species and water parameters at the Brownsville site in Ju-ly 1998. Conversely, deep water had lower NIR reflectance thanthe four plant species and shallow water. Shallow water hadhigher NIR reflectance than deep water, but lower NIR reflec-tance than the plant species. Among the plant species, hydrillahad lower NIR reflectance than the other three species. Near-infrared reflectance in vegetation is highly correlated withplant density (Myers et al. 1983, Everitt et al. 1986). An over-head view of the plant species showed that waterhyacinth hadgreater leaf density and fewer gaps in its canopy than the otherspecies, while hydrilla had more gaps and breaks in its canopy.
A large percentage of the hydrilla plant biomass is belowthe water surface and, therefore cannot be adequately mea-
sured with the radiometer sensor. The very low NIR reflec-tance of both shallow and deep water was attributed to theirstrong absorption of NIR light (Wiesnet et al. 1997). Al-though the low NIR reflectance of hydrilla was contributedto significantly by its open canopy, the integration of waterwith the canopy absorbed a large percentage of the NIR light(Myers et al. 1983, Everitt et al. 1989). Like hydrilla, waterstargrass is also a submersed species with the majority of itsbiomass below the water surface. This characteristic contrib-uted to the relatively low NIR reflectance of water stargrass.
Since hydrilla plants are mostly below the water surface,we further studied the reflectance of this aquatic weed at theBrownsville site (July 1998) at the surface and submerged atdifferent depths (Table 1). Surfaced hydrilla plants and shal-low water had higher visible green reflectance than hydrillaplants submerged at three depths and deep water. Hydrillaplants submerged at 2.5-7.5 cm, those submerged at 7.5-15.0cm, and deep water had similar reflectance values at thegreen wavelength. Hydrilla submerged at 15.0-30.0 cm hadlower green reflectance than the other hydrilla and water pa-rameters. At the red wavelength, surfaced hydrilla had high-er reflectance than submersed plants at all three depths. Thered reflectance of shallow water did not differ from that ofsurfaced hydrilla and hydrilla submerged at 2.5-7.5 cm. Hyd-rilla submerged at 2.5-7.5 cm and that submerged at 7.5-15.0cm had similar red reflectance values. The reflectance valuesof hydrilla submerged at 15.0-30.0 cm and deep water didnot differ at the red wavelength. Submersed plants had aprogressively darker color as their depth below the water sur-face increased which caused them to absorb more of the visi-ble green and red light, thus giving them low reflectancevalues at these wavelengths (Carter 1982, Gausman 1985).
At the NIR wavelength, surfaced hydrilla plants had high-er reflectance than plants submerged at three depths andthe two water parameters (Table 1). Hydrilla submerged at2.5-7.5 cm had lower NIR reflectance than surfaced hydrillaplants and higher NIR reflectance than plants submerged at7.5-15.0 cm and 15.0-30.0 cm, and the two water parameters.The NIR reflectance of hydrilla submerged at 7.5-15.0 cm didnot differ from that of shallow water. Hydrilla submerged at15.0-30.0 cm and deep water had similar NIR reflectance values.
Visible and NIR reflectance values of guineagrass, hydril-la, waterhyacinth, and the two water parameters in Septem-ber 1998 at Brownsville followed a similar trend to those inJuly (Table 1). The visible green reflectance of hydrilla dif-fered from that of the other two species and water parame-ters. Waterhyacinth and shallow water had similar greenreflectance values. The red reflectance values of hydrilla andwaterhyacinth were similar, but they differed from those ofguineagrass and the two water parameters At the NIR wave-length, waterhyacinth had higher reflectance than the othertwo species and water parameters. Hydrilla had lower NIR re-flectance than waterhyacinth and guineagrass and higherNIR reflectance than the two water parameters. In June 1998at San Benito, waterhyacinth had lower visible reflectancethan water and Bermudagrass at both the green and redwavelengths (Table 1). At the NIR wavelength, waterhyacinthhad higher reflectance than Bermudagrass and water. Thewater was turbid which probably caused it to have higher visi-ble reflectance than the two plant species (Wiesnet et al.
J. Aquat. Plant Manage.
37: 1999. 75
1997). Overhead views of the two plant species showed thatwaterhyacinth had greater vegetative density than Bermuda-grass. This characteristic probably had a significant influenceon its high NIR reflectance (Myers et al. 1983).
At Tilden in June 1998, mixed herbaceous species hadhigher visible green reflectance than the other four speciesand water (Table 1). Conversely, hydrilla (surfaced) and wa-ter had lower green reflectance than the other three speciesand mixtures of species. At the red wavelength, Bermuda-grass, dryland willow, and mixed herbaceous species hadhigher reflectance than black willow, hydrilla, and water. Hy-drilla and water had lower reflectance at the red wavelengththan the three associated species and mixtures of species.With the exception of mixed herbaceous species, Bermuda-grass had higher NIR reflectance than the associated plantspecies and water. Water had lower NIR reflectance than the
associated plant species and mixtures of species. The NIR re-flectance of hydrilla was lower than that of three associatedspecies and mixtures of species.
In June 1998 at Pleasanton, Bermudagrass had highergreen and red reflectance than black willow, waterhyacinth,and water (Table 1). Waterhyacinth and black willow hadsimilar green reflectance values. Water had lower green re-flectance than the three plant species. At the red wavelength,waterhyacinth and water had similar reflectance values. TheNIR reflectance values of waterhyacinth and black willow didnot differ.
At Pleasanton in September 1998, waterhyacinth had low-er green and red reflectance than Bermudagrass, black wil-low, mixed herbaceous species, and water. Conversely,waterhyacinth had higher NIR reflectance than the two asso-ciated plant species, mixtures of species, and water.
T
ABLE
1. M
EAN
LIGHT
REFLECTANCE
OF
HYDRILLA
,
WATERHYACINTH
,
ASSOCIATED
PLANT
SPECIES
AND
WATER
AT
THE
GREEN
,
RED
,
AND
NEAR
-
INFRARED
WAVE-LENGTHS
. M
EASUREMENTS
WERE
MADE
ON
THE
R
IO
G
RANDE
R
IVER
NEAR
B
ROWNSVILLE
, T
EXAS
,
A
POND
NEAR
S
AN
B
ENITO
, T
EXAS
,
THE
F
RIO
R
IVER
NEAR
T
ILDEN
, T
EXAS
,
AND
THE
A
TASCOSA
R
IVER
NEAR
P
LEASANTON
, T
EXAS
. M
EANS
WITHIN
A
COLUMN
AT
EACH
DATE
OF
SAMPLING
FOLLOWED
BY
THE
SAME
LETTER
DO
NOT
DIF-FER
SIGNIFICANTLY
AT
THE
0.05
PROBABILITY
LEVEL
,
ACCORDING
TO DUNCAN’S MULTIPLE RANGE TEST.
Date Plant species or water
Reflectance (%) for three wavelengths
Green Red Near infrared
July 1998Brownsville, TX
GuineagrassHydrilla (surface)Water stargrassWaterhyacinthDeep water (>1.0 m)Shallow water(<0.3 m) (Clear)
5.9 b3.5 d7.3 a4.9 c2.0 d3.2 d
3.8 b2.1 c5.9 a2.3 c0.8 d1.8 c
31.8 b16.2 d20.0 c43.2 a
0.5 f2.3 e
July 1998Brownsville, TX
Hydrilla (surface)Hydrilla (submerged—2.5-7.5 cm)Hydrilla (submerged—7.5-15.0 cm)Hydrilla (submerged—15.0-30.0 cm)Deep water (>1.0 m)Shallow water (<0.3 m) (Clear)
3.5 a2.3 b2.0 b1.3 c2.1 b3.2 a
2.1 a1.5 bc1.4 c0.7 d0.8 d1.8 ab
16.2 a5.2 b2.8 c0.8 d0.5 d2.3 c
September 1998Brownsville, TX
GuineagrassHydrilla (surface)WaterhyacinthDeep water (>1.0 m)Shallow water (<0.3 m) (Clear)
6.1 a3.0 c4.0 b1.2 d4.3 b
4.0 a2.1 c1.7 c0.6 d3.2 b
30.4 b17.9 c40.6 a0.4 d1.5 d
June 1998San Benito, TX
BermudagrassWaterhyacinthWater (turbid)
5.4 b5.1 c6.4 a
3.2 b2.4 c3.7 a
31.4 b41.7 a2.1 c
June 1998Tilden, TX
BermudagrassBlack willowDryland willowHydrilla (surface)Mixed herbaceous speciesWater
6.2 b5.6 b4.6 c3.2 d7.3 a3.2 d
3.5 a2.7 b3.6 a2.0 c3.6 a1.9 c
43.0 a38.4 b21.6 c14.5 d39.9 ab0.8 e
June 1998Pleasanton, TX
BermudagrassBlack willowWaterhyacinthWater (turbid)
7.7 a6.2 b5.5 b4.4 c
5.8 a4.0 b2.4 c2.5 c
31.5 b43.5 a47.0 a2.8 c
Sept. 1998Pleasanton, TX
BermudagrassBlack willowWaterhyacinthMixed herbaceous speciesWater (turbid)
5.9 a6.0 a5.0 b6.2 a6.3 a
4.6 a3.0 c2.0 d3.8 b4.9 a
26.6 d38.3 b43.1 a32.7 c3.1 e

76 J. Aquat. Plant Manage. 37: 1999.
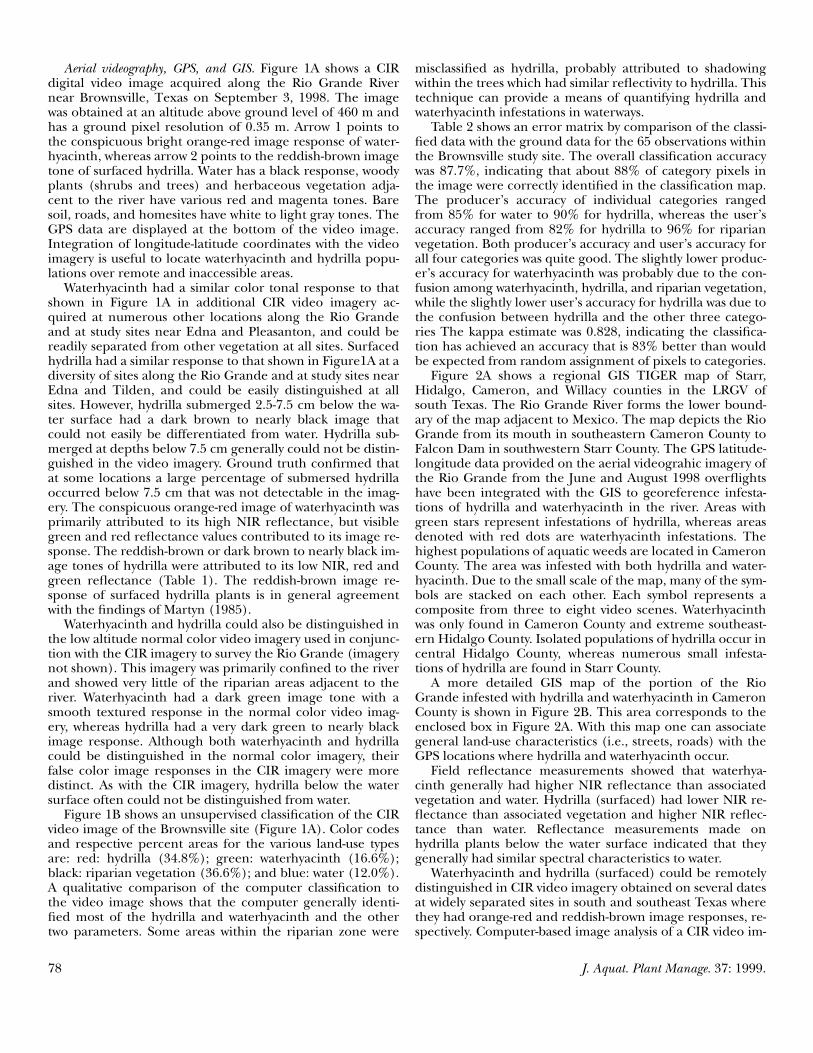
Figure 1. Color-infrared digital video image (A) of a portion of the Rio Grande River near Brownsville, Texas infested with waterhyacinth and hydrilla. Arrow1 points to the conspicuous orange-red response of waterhyacinth, whereas arrow 2 points to the reddish-brown tonal response of hydrilla. The image wasobtained on September 3, 1998. The GPS data are shown at the bottom of the image. Unsupervised computer classification (B) of the Rio Grande and itsadjacent perimeter. Color codes for the various land-use types are: red: hydrilla; green: waterhyacinth; black: riparian vegetation; and blue: water.
J. Aquat. Plant Manage. 37: 1999. 77
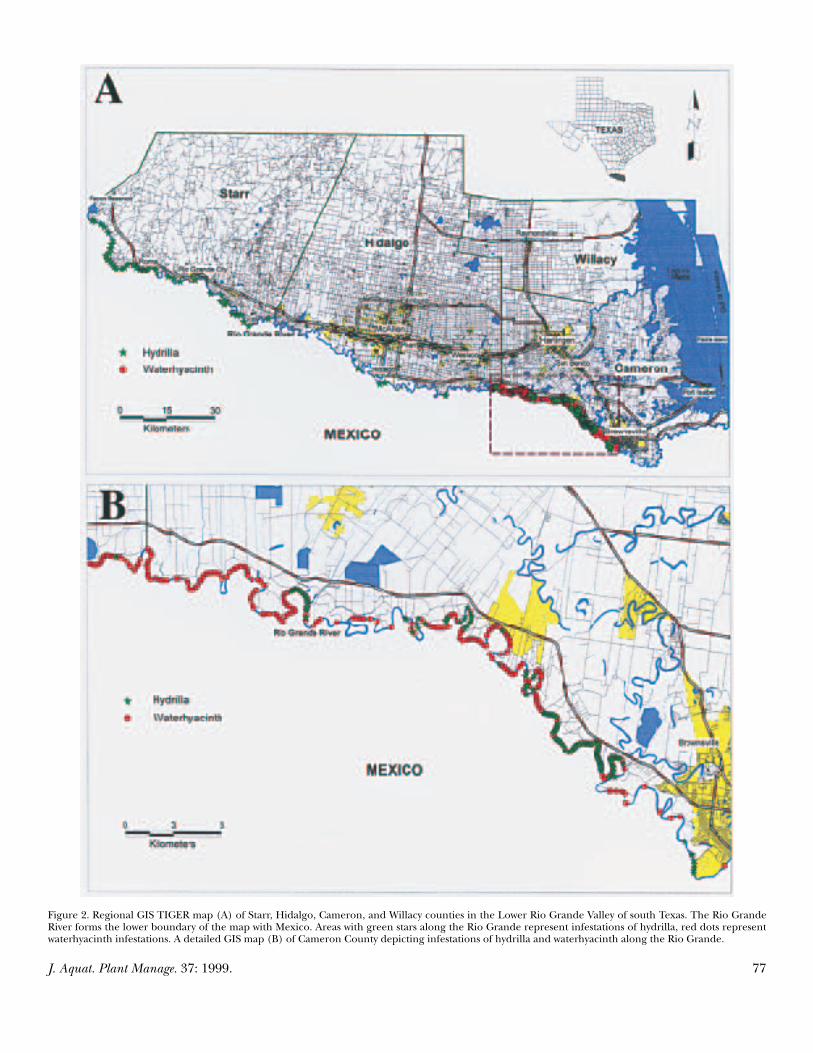
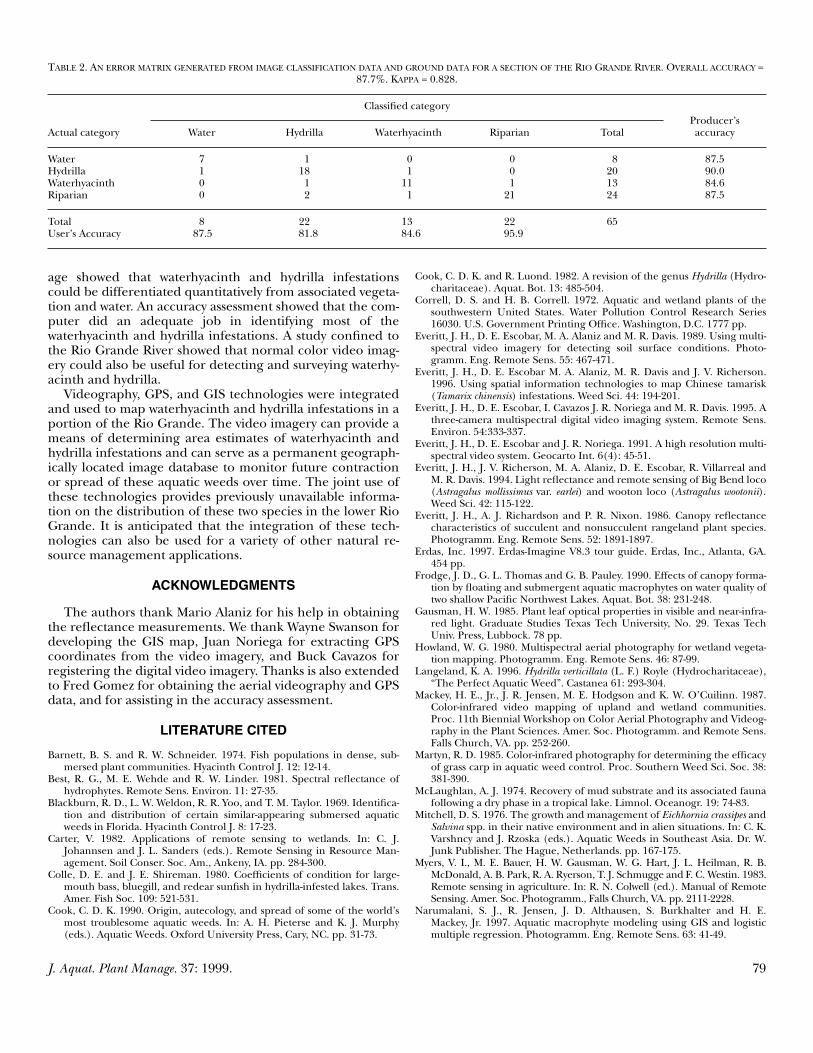
Figure 2. Regional GIS TIGER map (A) of Starr, Hidalgo, Cameron, and Willacy counties in the Lower Rio Grande Valley of south Texas. The Rio GrandeRiver forms the lower boundary of the map with Mexico. Areas with green stars along the Rio Grande represent infestations of hydrilla, red dots representwaterhyacinth infestations. A detailed GIS map (B) of Cameron County depicting infestations of hydrilla and waterhyacinth along the Rio Grande.
78 J. Aquat. Plant Manage. 37: 1999.
Aerial videography, GPS, and GIS. Figure 1A shows a CIRdigital video image acquired along the Rio Grande Rivernear Brownsville, Texas on September 3, 1998. The imagewas obtained at an altitude above ground level of 460 m andhas a ground pixel resolution of 0.35 m. Arrow 1 points tothe conspicuous bright orange-red image response of water-hyacinth, whereas arrow 2 points to the reddish-brown imagetone of surfaced hydrilla. Water has a black response, woodyplants (shrubs and trees) and herbaceous vegetation adja-cent to the river have various red and magenta tones. Baresoil, roads, and homesites have white to light gray tones. TheGPS data are displayed at the bottom of the video image.Integration of longitude-latitude coordinates with the videoimagery is useful to locate waterhyacinth and hydrilla popu-lations over remote and inaccessible areas.
Waterhyacinth had a similar color tonal response to thatshown in Figure 1A in additional CIR video imagery ac-quired at numerous other locations along the Rio Grandeand at study sites near Edna and Pleasanton, and could bereadily separated from other vegetation at all sites. Surfacedhydrilla had a similar response to that shown in Figure1A at adiversity of sites along the Rio Grande and at study sites nearEdna and Tilden, and could be easily distinguished at allsites. However, hydrilla submerged 2.5-7.5 cm below the wa-ter surface had a dark brown to nearly black image thatcould not easily be differentiated from water. Hydrilla sub-merged at depths below 7.5 cm generally could not be distin-guished in the video imagery. Ground truth confirmed thatat some locations a large percentage of submersed hydrillaoccurred below 7.5 cm that was not detectable in the imag-ery. The conspicuous orange-red image of waterhyacinth wasprimarily attributed to its high NIR reflectance, but visiblegreen and red reflectance values contributed to its image re-sponse. The reddish-brown or dark brown to nearly black im-age tones of hydrilla were attributed to its low NIR, red andgreen reflectance (Table 1). The reddish-brown image re-sponse of surfaced hydrilla plants is in general agreementwith the findings of Martyn (1985).
Waterhyacinth and hydrilla could also be distinguished inthe low altitude normal color video imagery used in conjunc-tion with the CIR imagery to survey the Rio Grande (imagerynot shown). This imagery was primarily confined to the riverand showed very little of the riparian areas adjacent to theriver. Waterhyacinth had a dark green image tone with asmooth textured response in the normal color video imag-ery, whereas hydrilla had a very dark green to nearly blackimage response. Although both waterhyacinth and hydrillacould be distinguished in the normal color imagery, theirfalse color image responses in the CIR imagery were moredistinct. As with the CIR imagery, hydrilla below the watersurface often could not be distinguished from water.
Figure 1B shows an unsupervised classification of the CIRvideo image of the Brownsville site (Figure 1A). Color codesand respective percent areas for the various land-use typesare: red: hydrilla (34.8%); green: waterhyacinth (16.6%);black: riparian vegetation (36.6%); and blue: water (12.0%).A qualitative comparison of the computer classification tothe video image shows that the computer generally identi-fied most of the hydrilla and waterhyacinth and the othertwo parameters. Some areas within the riparian zone were
misclassified as hydrilla, probably attributed to shadowingwithin the trees which had similar reflectivity to hydrilla. Thistechnique can provide a means of quantifying hydrilla andwaterhyacinth infestations in waterways.
Table 2 shows an error matrix by comparison of the classi-fied data with the ground data for the 65 observations withinthe Brownsville study site. The overall classification accuracywas 87.7%, indicating that about 88% of category pixels inthe image were correctly identified in the classification map.The producer’s accuracy of individual categories rangedfrom 85% for water to 90% for hydrilla, whereas the user’saccuracy ranged from 82% for hydrilla to 96% for riparianvegetation. Both producer’s accuracy and user’s accuracy forall four categories was quite good. The slightly lower produc-er’s accuracy for waterhyacinth was probably due to the con-fusion among waterhyacinth, hydrilla, and riparian vegetation,while the slightly lower user’s accuracy for hydrilla was due tothe confusion between hydrilla and the other three catego-ries The kappa estimate was 0.828, indicating the classifica-tion has achieved an accuracy that is 83% better than wouldbe expected from random assignment of pixels to categories.
Figure 2A shows a regional GIS TIGER map of Starr,Hidalgo, Cameron, and Willacy counties in the LRGV ofsouth Texas. The Rio Grande River forms the lower bound-ary of the map adjacent to Mexico. The map depicts the RioGrande from its mouth in southeastern Cameron County toFalcon Dam in southwestern Starr County. The GPS latitude-longitude data provided on the aerial videograhic imagery ofthe Rio Grande from the June and August 1998 overflightshave been integrated with the GIS to georeference infesta-tions of hydrilla and waterhyacinth in the river. Areas withgreen stars represent infestations of hydrilla, whereas areasdenoted with red dots are waterhyacinth infestations. Thehighest populations of aquatic weeds are located in CameronCounty. The area was infested with both hydrilla and water-hyacinth. Due to the small scale of the map, many of the sym-bols are stacked on each other. Each symbol represents acomposite from three to eight video scenes. Waterhyacinthwas only found in Cameron County and extreme southeast-ern Hidalgo County. Isolated populations of hydrilla occur incentral Hidalgo County, whereas numerous small infesta-tions of hydrilla are found in Starr County.
A more detailed GIS map of the portion of the RioGrande infested with hydrilla and waterhyacinth in CameronCounty is shown in Figure 2B. This area corresponds to theenclosed box in Figure 2A. With this map one can associategeneral land-use characteristics (i.e., streets, roads) with theGPS locations where hydrilla and waterhyacinth occur.
Field reflectance measurements showed that waterhya-cinth generally had higher NIR reflectance than associatedvegetation and water. Hydrilla (surfaced) had lower NIR re-flectance than associated vegetation and higher NIR reflec-tance than water. Reflectance measurements made onhydrilla plants below the water surface indicated that theygenerally had similar spectral characteristics to water.
Waterhyacinth and hydrilla (surfaced) could be remotelydistinguished in CIR video imagery obtained on several datesat widely separated sites in south and southeast Texas wherethey had orange-red and reddish-brown image responses, re-spectively. Computer-based image analysis of a CIR video im-
J. Aquat. Plant Manage. 37: 1999. 79
age showed that waterhyacinth and hydrilla infestationscould be differentiated quantitatively from associated vegeta-tion and water. An accuracy assessment showed that the com-puter did an adequate job in identifying most of thewaterhyacinth and hydrilla infestations. A study confined tothe Rio Grande River showed that normal color video imag-ery could also be useful for detecting and surveying waterhy-acinth and hydrilla.
Videography, GPS, and GIS technologies were integratedand used to map waterhyacinth and hydrilla infestations in aportion of the Rio Grande. The video imagery can provide ameans of determining area estimates of waterhyacinth andhydrilla infestations and can serve as a permanent geograph-ically located image database to monitor future contractionor spread of these aquatic weeds over time. The joint use ofthese technologies provides previously unavailable informa-tion on the distribution of these two species in the lower RioGrande. It is anticipated that the integration of these tech-nologies can also be used for a variety of other natural re-source management applications.
ACKNOWLEDGMENTS
The authors thank Mario Alaniz for his help in obtainingthe reflectance measurements. We thank Wayne Swanson fordeveloping the GIS map, Juan Noriega for extracting GPScoordinates from the video imagery, and Buck Cavazos forregistering the digital video imagery. Thanks is also extendedto Fred Gomez for obtaining the aerial videography and GPSdata, and for assisting in the accuracy assessment.
LITERATURE CITED
Barnett, B. S. and R. W. Schneider. 1974. Fish populations in dense, sub-mersed plant communities. Hyacinth Control J. 12: 12-14.
Best, R. G., M. E. Wehde and R. W. Linder. 1981. Spectral reflectance ofhydrophytes. Remote Sens. Environ. 11: 27-35.
Blackburn, R. D., L. W. Weldon, R. R. Yoo, and T. M. Taylor. 1969. Identifica-tion and distribution of certain similar-appearing submersed aquaticweeds in Florida. Hyacinth Control J. 8: 17-23.
Carter, V. 1982. Applications of remote sensing to wetlands. In: C. J.Johannsen and J. L. Sanders (eds.). Remote Sensing in Resource Man-agement. Soil Conser. Soc. Am., Ankeny, IA. pp. 284-300.
Colle, D. E. and J. E. Shireman. 1980. Coefficients of condition for large-mouth bass, bluegill, and redear sunfish in hydrilla-infested lakes. Trans.Amer. Fish Soc. 109: 521-531.
Cook, C. D. K. 1990. Origin, autecology, and spread of some of the world’smost troublesome aquatic weeds. In: A. H. Pieterse and K. J. Murphy(eds.). Aquatic Weeds. Oxford University Press, Cary, NC. pp. 31-73.
Cook, C. D. K. and R. Luond. 1982. A revision of the genus Hydrilla (Hydro-charitaceae). Aquat. Bot. 13: 485-504.
Correll, D. S. and H. B. Correll. 1972. Aquatic and wetland plants of thesouthwestern United States. Water Pollution Control Research Series16030. U.S. Government Printing Office. Washington, D.C. 1777 pp.
Everitt, J. H., D. E. Escobar, M. A. Alaniz and M. R. Davis. 1989. Using multi-spectral video imagery for detecting soil surface conditions. Photo-gramm. Eng. Remote Sens. 55: 467-471.
Everitt, J. H., D. E. Escobar M. A. Alaniz, M. R. Davis and J. V. Richerson.1996. Using spatial information technologies to map Chinese tamarisk(Tamarix chinensis) infestations. Weed Sci. 44: 194-201.
Everitt, J. H., D. E. Escobar, I. Cavazos J. R. Noriega and M. R. Davis. 1995. Athree-camera multispectral digital video imaging system. Remote Sens.Environ. 54:333-337.
Everitt, J. H., D. E. Escobar and J. R. Noriega. 1991. A high resolution multi-spectral video system. Geocarto Int. 6(4): 45-51.
Everitt, J. H., J. V. Richerson, M. A. Alaniz, D. E. Escobar, R. Villarreal andM. R. Davis. 1994. Light reflectance and remote sensing of Big Bend loco(Astragalus mollissimus var. earlei) and wooton loco (Astragalus wootonii).Weed Sci. 42: 115-122.
Everitt, J. H., A. J. Richardson and P. R. Nixon. 1986. Canopy reflectancecharacteristics of succulent and nonsucculent rangeland plant species.Photogramm. Eng. Remote Sens. 52: 1891-1897.
Erdas, Inc. 1997. Erdas-Imagine V8.3 tour guide. Erdas, Inc., Atlanta, GA.454 pp.
Frodge, J. D., G. L. Thomas and G. B. Pauley. 1990. Effects of canopy forma-tion by floating and submergent aquatic macrophytes on water quality oftwo shallow Pacific Northwest Lakes. Aquat. Bot. 38: 231-248.
Gausman, H. W. 1985. Plant leaf optical properties in visible and near-infra-red light. Graduate Studies Texas Tech University, No. 29. Texas TechUniv. Press, Lubbock. 78 pp.
Howland, W. G. 1980. Multispectral aerial photography for wetland vegeta-tion mapping. Photogramm. Eng. Remote Sens. 46: 87-99.
Langeland, K. A. 1996. Hydrilla verticillata (L. F.) Royle (Hydrocharitaceae),“The Perfect Aquatic Weed”. Castanea 61: 293-304.
Mackey, H. E., Jr., J. R. Jensen, M. E. Hodgson and K. W. O’Cuilinn. 1987.Color-infrared video mapping of upland and wetland communities.Proc. 11th Biennial Workshop on Color Aerial Photography and Videog-raphy in the Plant Sciences. Amer. Soc. Photogramm. and Remote Sens.Falls Church, VA. pp. 252-260.
Martyn, R. D. 1985. Color-infrared photography for determining the efficacyof grass carp in aquatic weed control. Proc. Southern Weed Sci. Soc. 38:381-390.
McLaughlan, A. J. 1974. Recovery of mud substrate and its associated faunafollowing a dry phase in a tropical lake. Limnol. Oceanogr. 19: 74-83.
Mitchell, D. S. 1976. The growth and management of Eichhornia crassipes andSalvina spp. in their native environment and in alien situations. In: C. K.Varshncy and J. Rzoska (eds.). Aquatic Weeds in Southeast Asia. Dr. W.Junk Publisher. The Hague, Netherlands. pp. 167-175.
Myers, V. I., M. E. Bauer, H. W. Gausman, W. G. Hart, J. L. Heilman, R. B.McDonald, A. B. Park, R. A. Ryerson, T. J. Schmugge and F. C. Westin. 1983.Remote sensing in agriculture. In: R. N. Colwell (ed.). Manual of RemoteSensing. Amer. Soc. Photogramm., Falls Church, VA. pp. 2111-2228.
Narumalani, S. J., R. Jensen, J. D. Althausen, S. Burkhalter and H. E.Mackey, Jr. 1997. Aquatic macrophyte modeling using GIS and logisticmultiple regression. Photogramm. Eng. Remote Sens. 63: 41-49.
TABLE 2. AN ERROR MATRIX GENERATED FROM IMAGE CLASSIFICATION DATA AND GROUND DATA FOR A SECTION OF THE RIO GRANDE RIVER. OVERALL ACCURACY = 87.7%. KAPPA = 0.828.
Actual category
Classified categoryProducer’saccuracyWater Hydrilla Waterhyacinth Riparian Total
WaterHydrillaWaterhyacinthRiparian
7100
11812
01
111
001
21
8201324
87.590.084.687.5
TotalUser’s Accuracy
887.5
2281.8
1384.6
2295.9
65

80 J. Aquat. Plant Manage. 37: 1999.
Patterson, G. G. and B. A. Davis. 1991. Distribution of aquatic macrophytesin 15 lakes and streams in South Carolina. U.S. Geological Survey, Wash-ington, D.C., Publ. 89-4132. 58 pp.
Robinson, B. F., M. E. Bauer, D. P. DeWitt, L. F. Silva and V. C. Vanderbilt.1979. Multiband radiometer for field use. Measurements of Optical Radi-ations, SPIE Vol. 196, SPIE, Bellingham, WA. pp. 8-15.
Schmitz, D. C. 1990. The invasion of exotic aquatic and wetland plants intoFlorida: History and efforts to prevent new introductions. Aquatics12(3): 6-24.
Seher, J. S. and P. T. Tueller. 1973. Color aerial photos for marshland. Photo-gramm. Eng. 39: 489-499.
Sersland, C. A., C. A. Johnston and J. Bonde. 1995. Assessing wetland vegeta-tion with GIS-linked color video image mosaics. Proc. 15th Biennial
Workshop on Videography and Color Photography in Resource Assess-ment. Amer. Soc. Photogramm. and Remote Sens. Bethesda, MD. pp. 53-62.
Steel, R. G. D. and J. H. Torrie. 1980. Principles and procedures of statistics.McGraw-Hill, New York. 481 pp.
Tabita, A. and J. W. Woods. 1962. History of waterhyacinth control in Flor-ida. Hyacinth Control J. 1: 19-23.
Tiner, R. W. 1997. Wetlands. In: W. R. Philipson (ed.). Manual of Photo-graphic Interpretation. Amer. Soc. Photogramm. and Remote Sens.Bethesda, MD. pp. 475-494.
Wiesnet, D. R., C. R. Wagner and W. D. Philpot. 1997. Water, snow, and ice.In: W. R. Philipson (ed.). Manual of Photographic Interpretation, 2ndEdition, Amer. Soc. Photogramm. and Remote Sens. Bethesda, MD. pp.257-267.