Teaching multiplication facts during physical education
189
Northern Illinois University Northern Illinois University Huskie Commons Huskie Commons Graduate Research Theses & Dissertations Graduate Research & Artistry 2017 Teaching multiplication facts during physical education : the Teaching multiplication facts during physical education : the effects on third-grade student academic development and on effects on third-grade student academic development and on teacher perception teacher perception William Dale McGuire Follow this and additional works at: https://huskiecommons.lib.niu.edu/allgraduate-thesesdissertations Recommended Citation Recommended Citation McGuire, William Dale, "Teaching multiplication facts during physical education : the effects on third- grade student academic development and on teacher perception" (2017). Graduate Research Theses & Dissertations. 5239. https://huskiecommons.lib.niu.edu/allgraduate-thesesdissertations/5239 This Dissertation/Thesis is brought to you for free and open access by the Graduate Research & Artistry at Huskie Commons. It has been accepted for inclusion in Graduate Research Theses & Dissertations by an authorized administrator of Huskie Commons. For more information, please contact [email protected].
-
Upload
khangminh22 -
Category
Documents
-
view
0 -
download
0
Transcript of Teaching multiplication facts during physical education

Northern Illinois University Northern Illinois University
Huskie Commons Huskie Commons
Graduate Research Theses & Dissertations Graduate Research & Artistry
2017
Teaching multiplication facts during physical education : the Teaching multiplication facts during physical education : the
effects on third-grade student academic development and on effects on third-grade student academic development and on
teacher perception teacher perception
William Dale McGuire
Follow this and additional works at: https://huskiecommons.lib.niu.edu/allgraduate-thesesdissertations
Recommended Citation Recommended Citation McGuire, William Dale, "Teaching multiplication facts during physical education : the effects on third-grade student academic development and on teacher perception" (2017). Graduate Research Theses & Dissertations. 5239. https://huskiecommons.lib.niu.edu/allgraduate-thesesdissertations/5239
This Dissertation/Thesis is brought to you for free and open access by the Graduate Research & Artistry at Huskie Commons. It has been accepted for inclusion in Graduate Research Theses & Dissertations by an authorized administrator of Huskie Commons. For more information, please contact [email protected].

ABSTRACT
TEACHING MULTIPLICATION FACTS DURING PHYSICAL EDUCATION:
THE EFFECTS ON THIRD-GRADE STUDENT ACADEMIC
DEVELOPMENT AND ON TEACHER PERCEPTION
William Dale McGuire, Ed.D.
Department of Leadership, Educational Psychology and Foundations
Northern Illinois University, 2017
Rosita Lopez and Stephen Tonks, Co-Directors
This quasi-experimental study examines the academic effects that an interdisciplinary
program, Hopscotch Math, has on the development of multiplication facts knowledge of 3rd-
grade English-speaking and Spanish-speaking bilingual students. This study also examines
teacher perception with regard to Hopscotch Math’s effects on students’ academic progress and
on students’ behavioral changes with regard to multiplication facts development.
The researcher used three research groups, each comprising approximately 23 subjects.
One group received the entire Hopscotch Math program; a second group received the Hopscotch
Math program less the movement-based portion of the program; and the third group served as the
control group and received no intervention. Students in all research groups took three 50-
question multiplication facts tests at three different points in the study: one pre-intervention, one
mid-intervention, and one post-intervention. The interventions lasted approximately 8 weeks.
The researcher also conducted two round-table question-and-answer sessions with the teachers
whose students were the research subjects in this study: one mid-intervention and one post-
intervention. The researcher asked questions with regard to teacher perceptions toward
Hopscotch Math’s academic effectiveness and its effect on student behaviors.
From a quantitative perspective, the researcher was ultimately interested in Hopscotch
Math’s overall academic effectiveness. Pairwise comparisons resulted in one comparison that

showed significance (p= 0.0267). This comparison was between the full Hopscotch Math group
and the control group. This same comparison had the highest effects size (r=0.2801) of all the
pairwise comparisons, but is still categorized as a small effect size. From a qualitative
perspective, the responses to the questions asked during the two round-table question-and-answer
sessions were generally positive. Results indicate that Hopscotch Math, when used in its
entirety, can be an effective tool for teaching basic multiplication facts to elementary-aged
students.

NORTHERN ILLINOIS UNIVERSITY
DEKALB, ILLINOIS
MAY 2017
TEACHING MULTIPLICATION FACTS DURING PHYSICAL EDUCATION:
THE EFFECTS ON THIRD-GRADE STUDENT ACADEMIC
DEVELOPMENT AND ON TEACHER PERCEPTION
BY
WILLIAM DALE MCGUIRE
©2017 William Dale McGuire
A DISSERTATION SUBMITTED TO THE GRADUATE SCHOOL
IN PARTIAL FULFILLMENT OF THE REQUIREMENTS
FOR THE DEGREE
DOCTOR OF EDUCATION
DEPARTMENT OF LEADERSHIP, EDUCATIONAL PSYCHOLOGY
AND FOUNDATIONS
Doctoral Co-Directors:
Rosita Lopez and Stephen Tonks

ACKNOWLEDGEMENTS
I am forever indebted to many individuals for the selfless giving of their time, expertise,
and resources to this project. I would first like to thank my dissertation committee members for
their unwavering support and encouragement. Thank you to my dissertation co-chair, Dr. Rosita
Lopez, for her wonderful personality. Aside from the contribution of her expertise to this
project, it was her sense of humor and relentless positive encouragement that was the driving
force that instilled in me a believe that this project would not only be finished, but it would be
good, and its result will have positive academic effects on student learning that might not
otherwise be realized. I am thankful to co-chair, Dr. Stephen Tonks, for his insight and
suggestions for making this research study pertinent to today’s educational setting, and to Dr.
Ximena Burgin for her expertise and patience in helping me create a strong research design.
I am grateful to Dr. Michelle Xia and her staff of statistical consultants. Their work in
analyzing this study’s data and their patience in explaining the complicated statistical results is
greatly appreciated. The service they provided was invaluable, and I commend the thoughtful
efforts they provided.
I am indebted to Drs. Stephen and Theresa Cone for the insightful conversations we had
with regard to setting up effective interdisciplinary physical education lesson plans. Their book,
Interdisciplinary Elementary Physical Education (2nd ed.), helped to guide the fail-proof lessons

iii
used in this study. I am also indebted to Paul Schroeder, whose book Hopscotch Math was the
inspiration for this study and the foundation on which this study was built.
A warm thank-you goes to my principal, Mrs. Jennifer Hilliard, and to my assistant
principal, Mrs. Kathleen Algrim, for providing me with the support that was needed to make this
project a success. I am grateful for their unquestionable belief in the cognitive, psychomotor,
and affective benefits that physical education can provide to all students.
A very special thank-you goes to the teachers whose students were part of this research.
They are truly supportive, caring, and selfless people. I am forever beholden to Mr. Timothy
Strohecker, Mrs. Paulina Cisneros, Mrs. Janet Roschmann, Ms. Stacy Stawinoga, and Mrs.
Carrie Stringer for exhaustively presenting the research interventions of this study. Another very
special thank-you goes to my friend and fellow teacher, Mrs. Abigail Madere, who graciously,
and without hesitation, offered her support by way of accepting the roles of translator,
proofreader, and moral supporter. She performed masterfully in all her roles.
Lastly, I give a heartfelt thank-you to the students who were part of this study. Their
enthusiasm and effort were nothing short of excellent. They should be proud to know that their
foundational efforts are paving the way for the future academic success of many a student to
come.

DEDICATION
I am nothing without my family. I am eternally indebted to my family for the support
and sacrifices they made throughout the attainment of this degree. I thank God every day that
they are, and have been, a part of my life.
I dedicate this work, in part, to my beautiful wife, Julie Ann. No one has sacrificed more
than she has. You are selfless, understanding, and supportive. Without you, none of this would
have been possible. Thank you for letting me dream. I love you, Bug.
I also dedicate this work to my amazing daughters, Ashley Nicole, Madeline Nicole, and
Elizabeth Nicole. Thank you for the sacrifices you have endured and for the love and support
you have unconditionally provided me with so that I, too, could endure and ultimately triumph. I
love you, Babydoll, Princess, and Libby Lou.
Lastly, I dedicate this work to my parents, Wayne and Bonnie. From an early age they
instilled in me the notion that with enough passion and effort, success is never out of reach.
More importantly, they relentlessly reminded me that gaining success without keeping one’s
faith and character will only result in a joyless void. Your guidance has made all the difference.
It is greatly appreciated and will never be forgotten. I love you, pop, and miss you deeply every
day. I love you, momma, and thank you for being my rock.

TABLE OF CONTENTS
Page
LIST OF TABLES ................................................................................................................. xi
LIST OF FIGURES ............................................................................................................... xii
LIST OF APPENDICES ........................................................................................................xiii
Chapter
1. INTRODUCTION ..................................................................................................... 1
Statement of the Problem ........................................................................................... 1
Purpose of the Study .................................................................................................. 1
Background Information ............................................................................................ 2
Mathematics in the United States .................................................................. 2
The Effects of Physical Activity .................................................................... 4
Interdisciplinary Learning .............................................................................. 7
Research Questions .................................................................................................... 9
Hypotheses ................................................................................................................. 10
Conceptual Framework .............................................................................................. 10
Methodology .............................................................................................................. 12
Problem Selection .......................................................................................... 13
Participants ..................................................................................................... 13
Research Design............................................................................................. 14
Qualitative Measures, Instrumentation, and Data Analysis ............... 14

vi
Chapter Page
Quantitative Measures, Instrumentation, and Data Analysis .............15
Collective Analysis of Qualitative and Quantitative Data .................16
Procedures ......................................................................................................16
Pre-intervention Procedures ...............................................................16
Intervention Assignment ....................................................................17
Intervention Procedures .....................................................................19
Mid-intervention Procedure ...............................................................20
Post-intervention Procedures .............................................................21
Limitations of the Study.............................................................................................22
Delimitations of the Study .........................................................................................24
Definition of Terms....................................................................................................24
Organization of the Dissertation ................................................................................26
2. LITERATURE REVIEW ..........................................................................................27
Historical Background of Academic Reform ............................................................28
Mathematics in the United States and Illinois ...........................................................31
The Effects of Physical Activity ................................................................................34
Physical Activity in America .........................................................................34
Overall Effects of Physical Activity ..............................................................35
Obesity ...............................................................................................35
Stress and Anxiety .............................................................................36
Depression..........................................................................................37
Cognitive Functioning .......................................................................38

vii
Chapter Page
Academic Performance ......................................................................39
Conceptual Framework ..............................................................................................44
Interdisciplinary Learning ..............................................................................44
Interdisciplinary Physical Education .................................................45
Hopscotch Math .................................................................................51
3. METHODOLOGY ....................................................................................................54
Introduction ................................................................................................................54
Description of the Population ....................................................................................54
Sample........................................................................................................................56
Research Questions and Hypotheses .........................................................................56
Hypotheses .................................................................................................................57
Research Method .......................................................................................................58
Needs Assessment ..........................................................................................58
University IRB Procedures ............................................................................59
Review to Conduct Research Procedures at Research Site ...........................59
Pre-intervention Procedures ...........................................................................60
Design Overview .......................................................................................................62
Assumptions of Qualitative and Quantitative Designs ..................................63
Qualitative Research Component ..................................................................64
Narrative Approach ............................................................................65
Instrumentation ..................................................................................65
Interview Schedule and Procedures ...................................................66

viii
Chapter Page
Data Collection Procedure .................................................................67
Data Analysis .....................................................................................68
Validity and Reliability ......................................................................68
Quantitative Research Component ................................................................68
Quasi-Experimental Design ...............................................................69
Matching-only Pre-test-post-test Control Group Design ...................69
Time-series Design ............................................................................70
Instrumentation ..................................................................................70
Data Collection Procedures ................................................................71
Validity and Reliability ......................................................................72
Data Analysis .....................................................................................72
Quasi-Experimental Research Design ...........................................................72
Data Collection and Analysis.............................................................73
Validity and Reliability ......................................................................73
Summary ....................................................................................................................74
4. RESULTS ..................................................................................................................75
Introduction ................................................................................................................75
Organization of Data Analysis ...................................................................................76
Research Questions and Associated Hypotheses .......................................................78
Presentation of Descriptive Characteristics with Analysis of Data ........................... 79
Demographics ............................................................................................................ 80
Research Question #1 ................................................................................................ 82

ix
Chapter Page
Covariance Parameter Estimates.....................................................................83
Type 3 Tests of Fixed Effects .........................................................................84
Solution for Fixed Effects ...............................................................................86
Least Squares Means.......................................................................................88
Differences of Least Squares Means...............................................................88
Checking for Model Assumptions ..................................................................91
Average Scores and Score Changes on Basic Multiplication Facts Tests ......91
Discussion of Findings Regarding Research Question #1 ..............................96
Research Question #2 .................................................................................................97
Type 3 Tests of Fixed Effects .........................................................................98
Solution for Fixed Effects ...............................................................................99
Least Squares Means......................................................................................100
Differences of Least Squares Means..............................................................102
Checking for Model Assumptions .................................................................103
Average Scores and Score Changes on Basic Multiplication Facts Tests .....103
Discussion of Findings Regarding Research Question #2 .............................107
Research Question #3 ................................................................................................108
Interview Questions .......................................................................................109
Mid-Intervention Teacher Responses ................................................110
Mid-Intervention Interview Discussion .............................................111
Post-Intervention Teacher Responses ................................................112
Post-Intervention Interview Discussion .............................................113

x
Chapter Page
Discussion of Findings Regarding Research Question #3 .............................113
Discussion Regarding the Combined Quantitative and Qualitative Results ..............115
Summary ....................................................................................................................115
5. FINDINGS, CONCLUSIONS, AND IMPLICATIONS ...........................................116
Introduction ................................................................................................................116
Summary of the Findings ...........................................................................................119
Implications for Practice ............................................................................................122
Cognitive Domain ..........................................................................................123
Affective Domain...........................................................................................124
Psychomotor Domain.....................................................................................126
Recommendations for Research ................................................................................127
Cognitive Domain ..........................................................................................127
Affective Domain...........................................................................................128
Psychomotor Domain.....................................................................................130
Conclusions ................................................................................................................132
REFERENCES ..........................................................................................................134
APPENDICES ...........................................................................................................142

LIST OF TABLES
Table Page
1. The Matching-only Pre-Test-Post-Test Control Group Design ................................. 15
2. The Matching-only Pre-Test-Post-Test Control Group Design Used In
Conjunction With Time-series Design...................................................................... 70
3. Covariance Parameter Estimates................................................................................. 84
4. Type 3 Tests of Fixed Effects ..................................................................................... 85
5. Solution for Fixed Effects ........................................................................................... 87
6. Least Squares Means.................................................................................................. .89
7. Differences of Least Squares Means........................................................................... 90
8. Type 3 Tests of Fixed Effects ..................................................................................... 98
9. Solution for Fixed Effects .......................................................................................... .99
10. Least Squares Means..................................................................................................101
11. Differences of Least Squares Means..........................................................................102

LIST OF FIGURES
Figure Page
1. Residuals for difference ..................................................................................................… 92
2. Results of the multiplication facts tests for all groups ....................................................… 93
3. Residuals for overall difference .........................................................................................104

LIST OF APPENDICES
Appendix Page
A. HOPSCOTCH MATH MULTIPLICATION EXAM (SCHROEDER, 2012) ...........143
B. CONSENT FORM FOR PARENTS/GUARDIANS OF MINORS AND
ASSENT FORM FOR STUDENT SUBJECTS .........................................................146
C. LETTER TO PRINCIPALS ........................................................................................152
D. PRINCIPAL CONSENT FORM FOR RESEARCH PARTICIPATION ..................155
E. 3RD GRADE TEACHER CONSENT FORM FOR RESEARCH
PARTICIPATION .......................................................................................................158
F. PE TEACHER CONSENT FORM FOR RESEARCH PARTICIPATION................162
G. LETTER TO PARENTS/GUARDIANS ....................................................................165
H. DAY-BY-DAY SCHEDULE OF LESSONS FOR THE TWO INTERVENTION
GROUPS .....................................................................................................................168
I. STUDENT ASSENT FORM........................................................................................171

CHAPTER 1
INTRODUCTION
Statement of the Problem
Many students in the United States struggle at mathematics (National Assessment of
Educational Progress [NAEP], 2013a). All students are kinesthetic learners to some degree and
can learn through movement and experimentation (Gardner, 1983). Unfortunately, many
students who learn well through movement and experimentation may not be given adequate
opportunities to learn in this style that could ultimately create academic success in mathematics.
The researcher contends that if students are given an opportunity to receive extra practice toward
learning basic multiplication facts through a specifically prescribed kinesthetic approach to
learning, namely Hopscotch Math (Schroeder, 1998), then academic success with regard to basic
multiplication facts development will be realized.
Purpose of the Study
The purpose of this study was to look at the academic effectiveness of teaching students
basic multiplication facts during physical education class through a specific kinesthetic
movement, hopscotching, by using an interdisciplinary approach to teaching physical education
called Hopscotch Math (Schroeder, 1998). Hopscotch Math is a prescribed program to help
teach third- through fifth-grade students learn basic multiplication and division facts, in part,

2
through movement and pattern recognition. The student subjects in this study took a pre-
intervention multiplication facts test, a mid-intervention multiplication facts test, and a post-
intervention multiplication facts test to help analyze this program’s effectiveness. Mathematics,
more specifically multiplication facts development, was chosen as the focus of this study due to
the less than adequate collective scores of students on the mathematics section of recent Illinois
Standard Achievement Tests (ISAT) and through teacher interviews.
The researcher conducted a quasi-experiment study using both a combination of
qualitative and quantitative designs. The researcher qualitatively conducted two periodic and
equally spaced interviews with the teachers whose students were the subjects of this research.
The interviews, one mid-intervention and one post-intervention, were used to record the
teachers’ perceptions toward their students’ academic progress during the interventions, and
more specifically, with regard to basic multiplication facts development. This information was
used, in conjunction with the results of the quantitative Hopscotch Math (Schroeder, 2012)
testing (Appendix A), to look for the emergence of common results between the two research
methods being used in this study. Ultimately, this information gave the researcher a better
understanding of the effectiveness of the Hopscotch Math (Schroeder, 1998) program.
Background Information
Mathematics in the United States
The scores of U.S. teenagers in reading and science on the 2012 Program for
International Student Assessment (PISA) were average compared to 64 other countries and
economies that participate in this assessment (Layton, 2013). Unfortunately, their scores were

3
below average in math. Our nation’s younger population is not performing well internationally
either. Fourth-grade students in the United States lag behind international students regarding
mathematics and science (Rich, 2012). This trend with regard to mathematics has been observed
for many years. When comparing the results from the 2006 Program for International Students
Assessment (PISA) by the highest-achieving math students from the United States to those
students from the world’s leading industrial nations, it may be seen that the students from the
United States are performing well below their international counterparts (Hanushek, Peterson, &
Woessmann, 2010) and this pattern has not changed much since the PISA test was first given in
2000 (Layton, 2013). Rich (2012) expressed that countries with superior math and science skills
are increasingly thriving in the global economy and that the lag among American students could
be a cause for concern with regard to continued U.S. global economic competitiveness.
In 2013, nearly 187,000 fourth graders and 170,000 eighth graders from across the United
States participated in the 2013 National Assessment of Educational Progress in mathematics
(NAEP, 2013a). This assessment is given nationally every two years. Students answered
questions that were designed to measure their knowledge with regard to five mathematics
content areas: number properties and operations; measurement; geometry; data analysis,
statistics, and probability; and algebra. Results were compared to performance standards set by
the National Assessment Governing Board. The terms basic, proficient, and advanced were used
at both grade 4 and grade 8 to describe performance levels of the students. The results of this
study showed that Illinois students are seemingly not faring well nationally in mathematics when
compared to students from other states and jurisdictions (NAEP, 2013b). In fact, in 2013, 39
states and other jurisdictions (District of Columbia and U.S. Department of Defense schools)

4
scored higher on the 4th-grade math assessment than Illinois did (NAEP, 2013b). This has been
the trend with Illinois since 2003, which was the first year that all the states, the District of
Columbia, and the Department of Defense schools participated in the assessment. In 2011, 32
states and other jurisdictions performed better than Illinois; in 2009, 33 performed better; in
2007, 33 performed better; in 2005, 38 performed better; and in 2003, 33 performed better
(NAEP, 2013c).
The Effects of Physical Activity
The power of learning through movement is well documented and has many
physiological and psychological benefits. In 2010, the Centers for Disease Control and
Prevention (CDC) performed a study that used nine databases to ultimately gather 43 articles in
an effort to examine the association between school-based physical activity, including physical
education class, and academic performance, which included cognitive skills and attitudes,
academic behaviors, and academic achievement (CDC, 2010). There were 251 associations
between physical activity and academic performance. Of these 251 associations, 50.5% were
positive, 48% were not significant, and only 1.5% were negative. Within the study, there were
14 articles that were specific to physical education and academic achievement. From these 14
articles, the CDC stated that an increase in time in physical education class showed a positive
relationship in 11 of the articles, while three of the articles showed no relationship. None of the
articles showed a negative relationship. The report made it very clear that an increased time in
physical education does not have a negative relationship on academic performance. This report
suggested implications for schools and school policy and highly recommended the
implementation of these suggestions. What follows are a few of the implications and

5
recommendations. The CDC stated there is substantial evidence that physical activity can help
academic achievement, including grades and standardized test scores. The CDC also stated that
physical activity can have an impact on cognitive skills, attitudes, and academic behavior, all of
which are important components of improved academic performance. The components of
improved academic performance include enhanced concentration and attention as well as
improved classroom behavior. With regard to school-based physical education, the CDC
mentioned that schools should consider maximizing the academic benefits of their students by
increasing the amount of time students spend in physical education class or by adding
components to increase the quality of physical education class such as increased time or days per
week and/or added trained instructors.
Physical activity has many other direct and indirect physiological and psychological
benefits. According to the publication “2008 Physical Activity Guidelines for Americans: Be
Active, Healthy, and Happy!” (U.S. Department of Health and Human Services, 2008), regular
physical activity builds healthy bones and muscles, improves muscular strength and endurance,
reduces the risk of developing chronic disease risk factors, improves self-esteem, and reduces
stress and anxiety. It is well documented that physical activity and cognitive skills develop
through a dynamic interaction. Research has shown that physical movement can affect the
brain’s physiology by increasing cerebral capillary growth, blood flow, oxygenation, production
of neurotrophins, growth of nerve cells in the hippocampus, neurotransmitter levels,
development of nerve connections, density of neural network, and brain tissue volume
(Rosenbaum, Carlson, & Gilmore, 2001; Trudeau & Shephard, 2008). These physiological
changes may be associated with improved attention; improved information processing, storage,
6
and retrieval; enhanced coping; enhanced positive affect; and reduced sensations of craving and
pain (Rosenbaum et al., 2001; Trudeau & Shephard, 2008).
Though the physiological, psychological, and educational benefits of physical activity are
clear, school administrators face increasing challenges in allotting time for physical education
class and physical activity, in general. Many school administrators are attempting to increase
instructional time for math, English, and science in an effort to improve standards-based test
scores (Wilkins et al., 2003). As a result, physical education classes and recess times are often
lessened or—worse yet—eliminated during the school day (CDC, 2008). The CDC (2008)
reported that in 2007 only 53.6% of U.S. high school students reported that they attended
physical education class on one or more days in an average week of school, and only 30%
reported that they had daily physical education class. In 2006, only 4% of elementary schools
and 8% of middle schools in the United States provided daily physical education or its equivalent
for all students in all grades (Lee, Burgeson, Fulton, & Spain, 2007). Unfortunately, only 17.1%
of U.S. high school students (CDC, 2010) and only 26% of children ages 5 and 10 (Y-USA,
2011) meet the current recommendations of 60 minutes of physical activity per day.
Thomas Jefferson once said, “A strong body makes the mind strong.” Schools are a
perfect place for students in the United States to meet the national daily physical activity
recommendations (body) as well their state’s academic requirements (mind), and the physical
education setting is the perfect forum to combine both body and mind into single lessons to
accomplish this task. In this age where physical education programs are being cut back or
eliminated, the combining of subjects like math, language arts, or science with physical
7
education through an effective interdisciplinary physical education program could be physical
education’s saving grace. Research has repeatedly shown that physical activity positively affects
academic performance, but researchers need to continue to prove the importance of physical
education toward the development of each student’s psychomotor (kinesthetic), cognitive, and
affective domains so that administrators and school boards will finally realize that what is best
for every student is a holistic approach to learning where all academic disciplines have value, not
the least of which is physical education. In fact, the researcher contends that physical education
through an interdisciplinary approach is a crucial component to the improvement of academic
test scores.
Interdisciplinary Learning
Every day across this nation, teachers are unselfishly attempting to make each of their
students’ learning experiences valuable, yet unobtrusive. Making lesson plans that foster each
student’s capabilities and learning styles is a huge task in itself, and unfortunately this task can
be overwhelming, if not impossible. Realistically, a teacher cannot teach every lesson every day
to every student in a way that is best for every student. Teachers can, though, find learning
styles that capture a large population of their students, which, in turn, can provide for efficient
and effective learning. One learning style that encompasses a large population of students is the
kinesthetic learning style (Gardner, 1983).
Children love to move and explore their environment. Moving puts the brain of the
learners in the optimal position for them to learn (Ratey, 2008). Most students learn well
through kinesthetic activities (Gardner, 1983) and until the age of approximately 11, children

8
learn inductively through play (Piaget, 1969). As educators, creating an unobtrusive
environment where a student feels safe, where students feel free to make mistakes without
consequences, and where students understand that success is a product of effort, is imperative
with regard to creating self-efficacy and, ultimately, academic success (Bandura et al., 1996).
That being said, getting students at the elementary schools moving while learning in an
unobtrusive environment simply seems to make sense. When better for all these conditions to be
met than during physical education class?
The last few years have shown an increased interest in interdisciplinary physical
education. Interdisciplinary physical education has gained the attention of not only physical
educators, but of classroom teachers and administrators alike. Many years ago, earlier
researchers in the area of interdisciplinary learning through movement were struggling to
convince anyone who would listen about the positive impact that physical activity has on
academic success. Theresa Purcell Cone, Peter Werner, Stephen L. Cone, and Amelia Woods
(1998) were such researchers. Many years ago they were very clear that interdisciplinary
physical education can be used to enhance students’ learning of abstracted concepts in other
subject areas. Today with the mounting research showing the positive effects that physical
activity and physical education have on academic achievement, and with the pressures put on
schools to perform on standardized tests, it would be wise for school administrators to seriously
consider implementing interdisciplinary physical education as a valuable tool to supplement
learning.

9
Research Questions
The study was guided by the following research questions:
1. Is there a significant difference among 3rd-grade-level students receiving the
Hopscotch Math intervention, 3rd-grade-level students receiving the Hopscotch Math
intervention less the hopscotching portion of the program, and 3rd-grade-level
students in the Control group, when comparing pre-intervention tests, mid-
intervention tests, and post-intervention tests? (ANCOVA)
2. Does teaching multiplication facts to 3rd grade level students through the
interdisciplinary physical education movement approach to teaching multiplication
facts called Hopscotch Math show improvement on the Hopscotch Math
Multiplication Exam compared to a 3rd grade level student group receiving the same
program, less the kinesthetic hopscotching component of this program, and a 3rd
grade level student group receiving no extra practice (Control group)? (ANCOVA)
3. Did the classroom teachers whose students are the subjects of this study notice an
atypical increased rate of improvement toward multiplication facts development?
(teacher interview responses and anecdotal records confirm or refute analysis)
Hypotheses
The following hypotheses were tested:

10
Ho (Null Hypothesis): There is no statistical difference among 3rd grade level students
receiving the interventions and 3rd grade level students in the Control group, when
comparing pre-intervention tests, mid-intervention tests, and post-intervention tests.
Hα (Alternate Hypothesis): There is a statistical difference among 3rd grade level students
receiving the interventions and 3rd grade level students in the Control group, when
comparing pre-intervention tests, mid-intervention tests, and post-intervention tests.
Conceptual Framework
The researcher used a conceptual design for learning that is presented in a book entitled
Interdisciplinary Elementary Physical Education: Connecting, Sharing, Partnering (2nd ed.), by
Theresa Purcell Cone, Peter Werner, and Stephen L. Cone (2009). Interdisciplinary education is
defined as an integration of two or more subject areas with the goal of fostering valuable learning
in each subject area. The authors argue that interdisciplinary education allows students to gain
multiple perspectives that, in turn, will allow them to be successful in an ever-changing world.
The authors offer procedures and strategies to help the reader create practical, interdisciplinary
learning experiences through kinesthetic movements. Ultimately, the authors contend that
academic success can be realized due to the application of this approach.
While following the interdisciplinary design presented by Cone et al. (2009), the
researcher used a specific interdisciplinary approach to teaching physical education called
Hopscotch Math (Schroeder, 1998). Hopscotch Math is a prescribed program that uses the
kinesthetic movement of hopscotching, as well as student learning logs, prescribed direct

11
instruction lessons, and flashcard practice to help develop multiplication and division facts
knowledge.
As stated earlier, interdisciplinary education is an integration of two or more subject areas
with the goal of fostering valuable learning in each subject area (Cone et al., 2009).
Interdisciplinary learning allows learning to take place through connection and convergence
rather than divergence and differentiation. Interdisciplinary learning experiences enhance and
enrich what students are learning by: encouraging critical thinking skills, motivating students by
making learning fun and meaningful, giving students an opportunity to recognize and accept
multiple perspectives on varying concepts, and allowing students to demonstrate a transfer of
knowledge from one learning context to another (Cone et al., 2009).
Cone et al. (2009) offer a couple of recommendations regarding the creation and
implementation of interdisciplinary, activity-based lessons. One recommendation is to use one
or a combination of more than one of the three models for implementing a successful
interdisciplinary program. The three models are connecting, sharing, and partnership.
Respectively, the models move progressively from simple to more complex. These models are
intended only to assist teachers with clarifying their intent and objectives for using an
interdisciplinary approach to teaching and are not inflexible, but instead can be used as a loose
guide for integrating meaningful lessons. The authors even indicate it is common that
overlapping models are necessary in order to meet student needs.
Another recommendation offered by Cone et al. (2009) is to use the following strategies
for developing an interdisciplinary learning experience: review curricular guides and scope and

12
sequence; select content; gather content information; decide on the interdisciplinary teaching
model(s); create lesson plans, including specific activities; determine scheduling, materials,
equipment, organization, and facilities; and decide how to assess the students’ learning. These
strategies are not prescribed to be used in any particular order. The researcher used these
strategies to create the interdisciplinary physical education learning experiences within the
Hopscotch Math (Schroeder, 1998) program. A detailed description of the use of these strategies
can be seen in Chapter 2.
Interdisciplinary teaching provides students an opportunity to acquire skills and
knowledge by looking at information from a variety of perspectives. All academic disciplines
are deemed valuable and their integrity is maintained through the careful planning and
implementation of each lesson. The researcher diligently followed the theoretical models as
prescribed by the models’ authors—Cone, Werner, and Cone (2009)—when implementing the
Hopscotch Math (Schroeder, 1998) program. Ultimately, it was the researcher’s hope that all
students would benefit from this prescribed interdisciplinary approach to learning.
Methodology
The researcher conducted a quasi-experimental study in an attempt to better understand
student learning with regard to multiplication facts development. The researcher used a
prescribed interdisciplinary intervention program, Hopscotch Math (Schroeder, 1998), which is
specifically designed to help third- through fifth-grade students learn basic multiplication and
division facts through varied activities like flashcard practice, worksheets, student learning logs,
and the kinesthetic movement of hopscotching. The researcher also conducted interviews with
13
the teachers of the student subjects, as well as asked these teachers to keep anecdotal records
throughout the research, in an attempt to better understand the phenomenon in question. The
results are reported in Chapter 4 of this paper.
Problem Selection
The researcher met with the school principal where the research was to be conducted to
review the previous years’ Illinois Standard Achievement Tests (ISAT) via the Illinois
Interactive Report Card (IIRC). The principal and researcher looked at the overall results of the
ISAT and determined that the subject area to be used for the research would be mathematics
because the assessment results were a cause for concern. The researcher then conducted three
meetings with teachers to determine which specific aspect of mathematics should be the focus of
this study. The first meeting was with all the fourth grade teachers at the school in which the
research was to be conducted. The second meeting was with all the fifth grade teachers at the
school in which the research was to be conducted. The third meeting was with all the third grade
teachers at the school in which the research was to be conducted. After lengthy discussion, it
was determined unanimously in all three meetings that multiplication facts knowledge should be
the focus of this study.
Participants
The student subjects in this study came from a small northern Illinois town. The school
at which they attended is a K-5 elementary school of about 550 students. The participants in this
study came from two non-bilingual (English) third-grade classrooms and two bilingual (Spanish)
third-grade classrooms at this school. Parental consent/student assent forms (Appendix B) were

14
sent home to the approximately 75 third grade students from these three different classes. The
researcher was hopeful that at least 95% of the assent forms would be returned allowing for
participation by the student. This would result in cell sizes of approximately 23 students per cell.
Ultimately, these were the approximate numbers that were attained.
Research Design
Within this quasi-experimental study, the researcher used both qualitative and
quantitative methods and approaches found within each method to help gather understanding of
the interventions presented. The researcher also used method-appropriate instrumentation and
measurement tools to assess the effectiveness of the research.
Qualitative Measures, Instrumentation, and Data Analysis
The researcher used a narrative approach (oral history, specifically) in an attempt to gain
an understanding of the phenomenon in question (Fraenkel & Wallen, 2009). The researcher
conducted interviews with the teachers whose students were the subjects of this research. A mid-
intervention interview and a post-intervention interview were conducted with each teacher. The
researcher also asked these teachers to keep written anecdotal records throughout the entirety of
the research. The interviews and the anecdotal records were then analyzed through a process
called triangulation through convergence (Fraenkel & Wallen, 2009). With this method, the
researcher analyzed all aspects of the qualitative data and looked for common themes to emerge.
The results will be reported in Chapter 4.

15
Quantitative Measures, Instrumentation, and Data Analysis
The researcher used a quasi-experimental design (Fraenkel & Wallen, 2009) because
random sampling was not a possibility. The principal of the study site school assigns students to
classrooms based on several variables including, but not limited to, behavior, academics, parent
requests, and random assignment. Because of the way the student subjects were put into their
groups, a matching-only pre-test-post-test control group design (Fraenkel & Wallen, 2009)
protocol was used. Because this research called for a pre-intervention multiplication facts
assessment, a mid-intervention multiplication facts assessment, and a post-intervention
multiplication facts assessment, time-series design (Fraenkel & Wallen, 2009) was used to
account for the use of repeated measures. Ultimately, an ANCOVA (analysis of covariance) was
used to analyze all three test results of the three research groups at three different testing times.
These results were attained through the use of SAS software (SAS Institute, 2010) and are
reported in Chapter 4 of this paper. Table 1 illustrates the quantitative design.
Table 1
The Matching-Only Pre-test-Post-test Control Group Design
Used In Conjunction With Time-Series Design (Fraenkel & Wallen, 2009)
____________________________________________________________________
Group 1 M O₁ X₁ O₂ X₁ O₃
___________________________________
Group 2 M O₁ X₂ O₂ X₂ O₃ ___________________________________
Control Group M O₁ C O₂ C O₃
____________________________________________________________________
M= subjects in each group have been matched on certain variables; not randomly assigned to the groups
O₁= pre-test, O₂= mid-intervention test, O₃= post-test (O₁ and O₃ are exactly the same tests; O₂ has the exact same questions as O₁ and O₃ but in a random, rearranged order)
X₁= treatment 1, X₂= treatment 2, C=control group

16
Collective Analysis of Qualitative and Quantitative Data
The researcher looked at both the qualitative and the quantitative results collectively.
The research used the same triangulation through convergence (Fraenkel & Wallen, 2009) used
in the qualitative portion of this research to attain collective results. In this case, the researcher
looked for common words, phrases, themes, ideas, and results to emerge. Ultimately, these
collective results helped the researcher better understand the effectiveness of the intervention
program Hopscotch Math (Schroeder, 1998). The collective results are reported in Chapter 4.
Procedures
Pre-intervention Procedures
All the materials needed for the execution of this study were compiled by the researcher
before the start of the study. These materials included creating hopscotching patterns on the
gymnasium floor, assembling Student Learning Logs for every student subject with an
intervention, creating multiplication facts flashcards, creating copies of worksheets, and
assembling all lesson plans and materials/equipment needed for each lesson.
The researcher sent out parental consent/student assent forms (Appendix B) for
parents/guardians of minors and for the student subjects, as well. A question-and-answer
meeting for the parents/guardians was held the week after the parental consent/student assent
forms went out to the parents/guardians. Parents were notified of the question-and-answer
meeting via a letter home (Appendix C) and by a mass phone message, otherwise known as a
“phone blast.” The researcher was available to the parents/guardians of the student subjects any
time before, during, or after the research study via phone or scheduled meeting. The researcher
17
could be reached at the school at which the research was conducted. Those parental
consent/student assent forms (Appendix B) that were returned with permission to conduct
research with their child/ward were collected and securely stored within a locked safe. To
protect the anonymity of students who participated in this study, the researcher did not use the
students’ names throughout the research, but instead assigned each student subject a specific
identification number that only the researcher had access to. The third-grade students who were
not part of this study were excluded from every aspect of the study. The physical education
lessons used as part of this research were conducted by a certified physical education instructor
other than the researcher and took place during the student subjects’ regular physical education
class. This instructor attained in-depth knowledge with regard to this research study and was
trained with regard to lesson administration.
Consent forms also needed to be signed by and gathered from the principal, the third-
grade teachers who were part of this study, and the physical education teacher providing the
interventions (Appendices D, E, and F, respectively) before research could start.
Intervention Assignment
The principal of the school at which the study was conducted assigned incoming third-
grade students to four different classrooms for the start of the school year. Two of the
classrooms were bilingual (Spanish) and two were traditional English-speaking classrooms. The
principal assigned students to classrooms based on several variables including, but not limited to,
behavior, academics, parent requests, and random assignment. The researcher was therefore
unable to use true random sampling to assign students to research groups. With regard to

18
physical education class, which is the setting where this research was conducted, two classes
were combined in one gymnasium at the same time and taught together through a team teaching
model. There were two third-grade physical education sections taught during a school day.
During both of the third-grade physical education sections, one traditional third-grade English-
speaking class was combined with one bilingual (Spanish) third-grade class. In order to create
the three research groups, the researcher asked the school principal to take one of the third-grade
physical education sections and randomly assign students to two of the three research groups.
Selection was not true random selection, though, in that the two interventions groups created
from this particular physical education section were first divided into groups with equal student
representation from both English-speaking and bilingual (Spanish) classrooms, and from both the
male and female genders. After this division, names were randomly assigned to two of the three
research groups. One group from this section was given the full Hopscotch Math (Schroeder,
1998) intervention and the other was the Control group. The researcher’s team teacher taught the
intervention group and the researcher taught the Control group. Teaching spaces were divided
by a drop-down curtain located at the center of the gymnasium.
To create the third research group, the researcher had the school principal perform the
same assignment procedure with the second third-grade physical education section as with the
first section. After the creation of two separate groups from within the second third-grade
physical education section, the researcher had the school principal randomly assign one of those
groups as the third and final intervention group. This intervention group received the Hopscotch
Math (Schroeder, 1998) intervention without the kinesthetic portion of the program. The other
group created from this second section of third-grade physical education was not part of this

19
research study. The researcher’s team teacher taught the intervention group from this physical
education section and the researcher taught the group that was not part of the research study.
Depending on the week, two to three lessons within the Hopscotch Math program were
taught per week to the two intervention groups. The interventions lasted approximately eight
weeks. The two intervention groups received their intervention during their regular physical
education class. The third group (Control group) received no intervention, but instead received
their normal prescribed physical education curriculum. All three research groups received a pre-
intervention multiplication facts exam, a mid-intervention multiplication facts exam, and a post-
intervention multiplication facts exam.
Intervention Procedures
A day-by-day account of the 18 lessons taught to the two intervention groups follows
(hopscotching not practiced by one of the intervention groups):
Day one: hand out Student Learning Logs and teach the lesson entitled, “What is
multiplication?”
Day two: teach 3s pattern, activity for 3s, hopping 3s, flashcards for 3s, assign 3s
worksheet
Day three: teach 4s pattern, picture/phrase for 4s, hopping 4s, flashcards for 4s and
3s, assign 4s worksheet
Day four: review day, hopping 3s and 4s pattern, flashcards for 3s and 4s, journal
pages 3s and 4s, grade Student Learning Logs
Day five: 2s pattern; activity for 2s; hopping 2s; flashcards for 2s, 3s, and 4s; journal
page 2s; assign 2s worksheet
Day six: 5s pattern; activity for 5s; hopping 5s; flashcards for 5s, 2s, 3s, and 4s;
journal page 5s; assign 5s worksheet

20
Day seven: 9s pattern; teach trick for 9s; hopping 9s; flashcards for 2s, 3s, 4s, 5s, and
9s; assign 9s worksheet
Day eight: review day; hopping 2s, 3s, 4s 5s, and 9s; flashcards for 2s, 3s, 4s, 5s, and
9s; journal page 9s; grade Student Learning Logs
Day nine: teach “shortcut” lesson for remaining multiplication patterns
Day ten: give mid-intervention multiplication facts assessment
Day eleven: 8s pattern; hopping 8s; flashcards for 8s, 2s, 3s, 4s, 5s, and 9s; 8s
worksheet
Day twelve: review day; hopping 8s and 9s; flashcards for 2s, 3s, 4s, 5s, 8s, and 9s;
journal page 8s; grade Student Learning Logs
Day thirteen: 6s pattern; picture/phrase for 6s; hopping 6s; flashcards for 6s, 2s, 3s,
4s, 5s, 8s, and 9s; assign 6s worksheet
Day fourteen: review day; hopping 2s, 3s, 4s, 5s, 6s, 8s, and 9 with emphasis on 6s,
8s, and 9s; flashcards for 2s, 3s, 4s, 5s, 6s, 8s, and 9s; journal page 6s, grade Student
Learning Logs
Day fifteen: 7s pattern, mental math and explanation, hopping 7s, all flashcards,
assign 7s worksheet
Day sixteen: review day; hopping all patterns with emphasis on 6s, 7s, 8s, and 9s;
flashcards 2s-9s, journal page 7s, grade Student Learning Logs
Day seventeen: review day by practicing multiplication facts with the aid of hopping
patterns, phrases, pictures, flashcards, and peer tutoring
Day eighteen: post-intervention multiplication facts assessment
Mid-intervention Procedures
Approximately four weeks into the intervention, the researcher interviewed the teachers
whose students were the subjects of this research study. This was the mid-intervention interview
and was done with all the participating teachers present. The researcher asked these teachers the
following questions: “What have you noticed with regard to overall student academic progress

21
with regard to multiplication facts development since the start of this study?” and “What attitude
or behavioral changes have you noticed with regard to multiplication facts development since the
start of this study?” The researcher made written anecdotal notes of this interview. These notes
were kept securely in a locked safe until they were analyzed after the study ended.
Approximately four weeks into the intervention, the researcher also administered the
mid-intervention multiplication facts test to all three research groups. This test had the same
exact questions as the pre- and post-intervention multiplication facts test but the questions were
arranged in a different, random order. The researcher rearranged the test questions because only
four weeks had passed since the pre-intervention multiplication facts test and the researcher did
not want any student subject to have any chance of recalling the specific question order from the
pre-intervention multiplication facts test. This would be a threat to the reliability and validity of
the tests. The mid-intervention multiplication facts tests were kept secure in a locked safe with
the pre-intervention tests. After the post-intervention tests had been taken, all three
multiplication facts tests were compared and analyzed.
Post-intervention Procedures
A post-intervention multiplication facts test (Appendix A) was given to all three research
groups. After the post-intervention multiplication facts exam, the researcher met with the
teachers whose students were the student subjects in this study and interviewed these teachers for
the second time. The researcher asked these teachers the same two questions that were asked in
the mid-intervention interview: “What have you noticed with regard to overall student academic
progress with regard to multiplication facts development since the start of this study?” and

22
“What attitude or behavioral changes have you noticed with regard to multiplication facts
development since the start of this study?” The researcher again made written anecdotal notes of
this interview. These notes were used independently, as well as collectively with the mid-
intervention interview, to analyze the qualitative portion of this quasi-experimental research
study. The collective results were also used in unison with the quantitative results to see if there
were emerging commonalities that could assist the researcher with explaining the effectiveness
of the Hopscotch Math (Schroeder, 1998) intervention program.
Unneeded data was destroyed via paper shredder. All records and documents were stored
in the school principal’s locked safe. All records and documents will be destroyed via paper
shredder after the 3-year post-study time frame. The researcher offered a post-study meeting
with parents to share the results of the study. Parents were notified of the question-and-answer
meeting via a letter home (Appendix G) and by a mass phone message, otherwise known as a
“phone blast.”
Limitations of the Study
1. The student subjects in this study were third-grade students only; therefore, the results
cannot be generalized to other grade levels.
2. The sample sizes were less than 30 student subjects per group; therefore, the results
cannot be generalized with any population.
3. The selection of research groups was not done using true random sampling; therefore,
results cannot be generalized with any population. The principal of the school at which

23
the study was conducted assigns students to classes based on many factors including
behavior, academics, and random selection.
4. The Hopscotch Math (Schroeder, 2012) Multiplication Exam (Appendix A) was the only
instrument used to quantitatively measure academic achievement in this study; therefore,
the results cannot be generalized to other instruments that measure academic
achievement. Because the researcher wanted to study the effectiveness of this particular
program, the researcher only used the prescribed assessment within the program.
5. Teacher-reported anecdotal records and interviews almost always contain sources of bias;
therefore, the results cannot be generalized with other populations. Though the teachers
were experts in their field and provided valuable insight for this study, the researcher is
aware that innate biases exist within all human beings.
6. Physical activity is not the only entity that can affect student academic achievement;
other variables that the researcher was unable to control for, and that can affect student
academic achievement, include, but are not limited to: nutrition, sleep, emotional state,
and quality of life. Because the researcher wanted to study the effectiveness of a
particular prescribed intervention program, the researcher only used the prescribed
assessments.
7. The length of this study was only eight weeks long; therefore, results from this single
study cannot be generalized to any population. Because the researcher wanted to study
the effectiveness of a particular prescribed intervention program, the researcher followed
the prescribed implementation protocol.
24
Delimitations of the Study
1. There was only one participating elementary school from northern Illinois in this study;
therefore, the results cannot be generalized for other schools. The researcher felt that
consistency with the implementation of the prescribed intervention was imperative and
had concerns regarding the potential negative effects from poor interrater reliability.
2. Though the researcher did not present the intervention lessons, the researcher is a
physical education teacher at the school where the research was conducted, thus certain
biases may be present; therefore, the results cannot be generalized with other populations.
3. There was a very limited diversity amongst the student subjects; therefore, the results
cannot be generalized into other education settings.
Definition of Terms
For the purposes of this study, the following definitions were utilized:
Connected Model—An interdisciplinary approach to learning in which one subject area is
used to augment or supplement the learning experience in another area.
Convergence—An analytical research method used to highlight similar findings between
qualitative and quantitative results.
Hopscotch Math—An interdisciplinary program that uses kinesthetic movement as well
as other elements to help students in 3rd through 5th grade learn multiplication and division math
facts.

25
Interdisciplinary—A method of teaching that presents content, skills and thinking
process, and assessments through exploring the connections between two or more academic
areas in an effort to maximize learning.
Interdisciplinary Physical Education—Where physical education curricula incorporate
other academic disciplines into lessons in an attempt to enhance all disciplines involved.
Kinesthetic Learners—People who learn one or more disciplines well through movement.
Matching-Only Pre-Test-Post-Test Control Group Design—A Quantitative research
method used for grouping pre- and post-test subjects when random Int is not an option.
Narrative Approach—A qualitative research method that allows the researcher to gain an
overall picture of teaching and learning efficiency and effectiveness through the eyes of the
research participants. Data are often collected through subjective techniques.
Oral History—A form of the Narrative method of qualitative research used to gather
information from research subjects through conversation/dialogue.
Partnership Model—A model of teaching where there is an equal representation of two or
more subject areas within a single lesson, lessons, or unit. The skills, topics, and concepts from
all combined subject areas are blended so that learning takes place simultaneously in all subject
areas. This method also requires that teachers meet with colleagues to plan and team-teach.
Quasi-Experimental—A research approach with concerns regarding internal validity, in
that randomized groups are not able to be used.
Shared Model—An interdisciplinary approach to teaching that emphasizes the linkage of
similar topics, concepts, or skills from two or more subject areas that are taught collaboratively
with another teacher.

26
Student Learning Logs—One part of the Hopscotch Math program where students record,
in writing, information regarding their experiences with learning multiplication and division
facts.
Team Teaching—Coordinated approach to teaching by a team of teachers working
together.
Time-Series Design—A research method used when a researcher wants to use repeated
measures during a study.
Triangulation—A research analysis process that requires the researcher to take the
analyzed data from two different portions of a research study and then analyze these two sets of
data collectively to search for common themes.
Organization of the Dissertation
This dissertation is made up of five chapters. Chapter 1 has presented the problem
statement, purpose of the study, background information, research questions, hypotheses,
conceptual framework, methodology, limitations and delimitations of the study, and definition of
terms. Chapter 2 will present a review of the literature that entails related literature deemed
relevant to the study. Chapter 3 describes the methodology used to conduct the study. Chapter 4
presents an analysis of the findings, including the qualitative, quantitative, and combination of
qualitative and quantitative statistical data and how they relate to the effectiveness of the
Hopscotch Math (Schroeder, 1998) intervention program. Chapter 5 presents a summary of the
findings, implications for practice, and recommendations for further research.

CHAPTER 2
LITERATURE REVIEW
The existing literature regarding physical activity and its effects on student learning
supplied the basis for this study. This study used published literature, online resources, and
testimony from experts in their respective fields to defend the hypothesis that a positive
relationship exists between structured physical activity and multiplication facts development.
The main focus of this research study was to see how physical activity, provided
specifically through an interdisciplinary approach to teaching physical education, affects
academic achievement, specifically multiplication facts development, in elementary-aged
students. Interdisciplinary teaching has only recently come to the forefront of education. The
pressures on educators to raise student academic achievement scores has led experts in the field
of education to find new and effective ways to satisfy the high academic demands of local, state,
and national officials. Interdisciplinary physical education is one such approach, though in its
infancy, that has shown promise in delivering such academic success. Ultimately, the researcher
hoped to show how interdisciplinary physical education can be a reliable approach toward
students gaining multiplication facts knowledge.
From a historical perspective, there is an indirect connection between educational reform
and interdisciplinary physical education. This chapter provides a linear account of this
connection starting with the federal government intervening with public school reform and

28
ending with research on the physiological effects of physical activity, including its effects on
learning, and how this research has lead physical education teachers to use interdisciplinary
approaches to physical education in an attempt to assist classroom teachers with student
academic learning, including mathematics, and more specifically, with multiplication facts
development.
Historical Background of Academic Reform
Academic accountability in education within the United States has been around for many
decades and has existed in many forms. Early in President Ronald Reagan’s presidency, the
United States Department of Education, under the Secretary of Education T. H. Bell, recognized
that students within the United States of America were failing to meet the national need for a
competitive workforce and it was time for the federal government to take action to rectify the
situation and hold the educational system accountable for its failure. In 1981, Secretary Bell
created the National Commission on Excellence in Education and charged this commission with
defining the problems afflicting American education and to provide solutions to these problems.
In April of 1983, the commission released A Nation at Risk: The Imperative for Educational
Reform (National Commission on Excellence in Education, 1983). The commission’s findings
were alarming. It was noted that the average SAT scores had dropped by more than 50 points in
the verbal section of the test and by almost 40 points in the mathematics section between the
years 1963 and 1980. This report also mentioned that only one-third of the same 17-year-olds
could solve math problems requiring several steps and that about 13% of these students were
functionally illiterate. It certainly appeared that something needed to be done if the United States
was to reclaim dominance with regard to global commerce.
29
The commission concluded that the declines in America’s educational performance were
mainly the result of inadequacies in the way the educational process was conducted. The
commission listed four important aspects of the educational process that needed to be addressed
in order to help solve the problem. They were content, expectations, time, and teaching.
Generally speaking, the commission first felt the curriculum was not challenging enough and
needed to be revamped. Second, the commission felt that the expectations regarding student
knowledge at the end of their educational careers needed to be elevated. Third, the commission
felt American students spent too little time on schoolwork, time spent in the classroom and on
homework was often used ineffectively, and schools were not doing enough to help students
develop efficient study skills. And last, the commission felt teaching quality was suffering
because of an inability of the educational system to attract potentially exemplar teachers which,
in turn, could help with the flailing education system. The federal government provided fiscal
support for the reforms but made it very clear that they were holding educators and elected
officials responsible for providing the means necessary to achieve the reforms, including
supplemental fiscal support. In the end, the federal government was unable to effectively
oversee and monitor the reform, and the reform failed miserably.
Accountability reform continued in a different form in the 1990s. This decade saw
President Bill Clinton sign into law the Goals 2000: Educate America Act in March of 1994
(United States Department of Education, 2000). Goals 2000 started the standards-based
educational movement. The movement was based on the principles of outcomes-based
education and included, in part, the following goals: all children will start school ready to learn;
the high school graduation rate will increase to at least 90%; all 4th, 8th, and 12th grade students

30
will demonstrate competency over challenging subject matter including math, science, history,
and geography, to name a few; all students will be prepared to be responsible citizens and
productive employees in our nation’s modern economy; all schools will promote partnerships
that will increase parental involvement in order to promote the social, emotional, and academic
growth of children; all schools will be free of drugs and violence; and the United States students
will be first in the world in mathematics and science achievement.
For many of the same reasons that A Nation at Risk failed, Goals 2000 failed miserably,
as well. Though it was unable to meet its goals, it did leave a lasting impression on education, in
that standards-based education and academic accountability were here to stay and the pressures
on teachers to produce globally elite students would only continue to build. In the near future,
accountability was to become monitored and consequences were to be strictly enforced. The age
of true accountability was about to emerge.
On January 8, 2002, President George W. Bush reauthorized the Elementary and
Secondary Education Act in the form of the No Child Left Behind Act of 2001 (NCLB, 2002).
NCLB, as it is commonly known, like Goals 2000, supported standards-based education reform
based on the premise that individual outcomes can be improved by setting high standards and
establishing measureable goals. States were charged with creating their own assessments of
basic skills in order to receive federal funds. NCLB demanded that states gradually improve
their academic outcomes and that by the year 2014 all students must meet their state standards.
If anytime during this Act’s existence a school should fail, commonly known as not making
Adequate Yearly Progress (AYP), a remediation plan would be enacted. Remediation plans

31
become progressively more severe the longer a school or school district failed to meet AYP.
Needless to say, the pressure on teachers to get their students to pass standardized state tests was
heavy. Unfortunately, school districts and teachers began to spend disproportionate amounts of
time teaching the skills to be tested and less on arguably equally important skills found in other
subject areas. It was at this time that reading and mathematics started taking up most of the
classroom instructional time.
Mathematics in the United States and Illinois
In a December 11, 2012 New York Times article, author Motoko Rich reported on how
U.S. students are academically closing the gap internationally but still lag behind in mathematics
and science. In the article, Rich reported on the recent results from two very common
international assessments, the Trends in International Mathematics and Science Study (TIMSS)
and the Progress in International Reading Literacy Study (PIRLS). The results were
discouraging. The United States ranked 11th in fourth-grade math, 9th in eighth-grade math, 7th in
fourth-grade science, and 10th in eighth-grade science. Only 7 percent of students from the
United States reached the advanced level in eighth-grade math compared to 48 percent in
Singapore and 47 percent in South Korea. Rich (2012) observed that countries with superior
math and science skills are increasingly thriving in the global economy and warned that the lag
among American students could be a cause for concern.
Hanushek et al. (2010) prepared a paper entitled “U.S. Math Performance in Global
Perspective: How well does each state do at producing high-achieving students?” under the
auspices of Harvard’s Program on Education Policy and Governance & Education Next, the

32
Taubman Center for State and Local Government, and the Harvard Kennedy School. The
authors analyzed the 2006 results of another well-known international assessment tool, the
Program for International Students Assessment (PISA). Hanushek et al. (2010) came to
conclusions that were very similar to Motoko Rich’s by expressing that the percentages of high-
achieving math students in the U.S. are below those of many of the world’s leading industrial
nations. Incidentally, Hanushek et al. (2010) reported that Illinois, the state in which this
research takes place, ranked 25th out of the 50 states and was well below the national average
when looking at the percentages of all students that reached the advanced level.
At a national level, in 2013, about 187,000 fourth-graders and 170,000 eighth-graders
participated in the 2013 National Assessment of Educational Progress (NAEP) in mathematics
(NAEP, 2013a). Students answered questions designed to measure their knowledge with regard
to five mathematics content areas: number properties and operations; measurement; geometry;
data analysis, statistics, and probability; and algebra. Performance standards were set by the
National Assessment Governing Board. This board provided a context for interpreting student
performance on the NAEP, based on the recommendations from panels of educators as well as
from members of the public. The levels basic, proficient, and advanced were used at both grade
4 and grade 8 to show how well students should perform at the respective grade levels.
The trends with 4th-grade students and 8th-grade students were very similar in every
category reported. Both grade 4 and grade 8 showed a 1-point gain in overall scores from 2011
to 2013 (NAEP, 2013d). Scores for grade 4 were 28 points higher in 2013 than in 1990 and 22
points higher in 2013 than in 1990 for grade 8 (NAEP, 2013d). Students performing at or above

33
the proficient level and at the advanced level were higher in 2013 than in any of the previous
assessment years, starting in 1990 (NAEP, 2013e). The numbers report improvement but
certainly can be misleading. In fact, the United States is at a standstill with regard to academic
improvement in mathematics and is still lagging behind internationally, as well (Hanushek et al.,
2010).
The student subjects used in this research study were in 3rd grade and were from Illinois.
Because of this, the researcher will henceforth report regarding this general age group from
Illinois. In 2013, the National Center for Educational Statistics (NCES) reported that the average
mathematics score of 4th-grade public-school students in Illinois was 239 (NAEP, 2013f). The
national average was 241. Though Illinois is not significantly different from the national average
regarding 4th-grade mathematics, this doesn’t mean that 4th-grade students in Illinois are
performing at a proficient level. Actually, the percentage of students in Illinois who performed
at or above the NAEP proficient level was 39% in 2013 (NAEP, 2013f). In addition, only 78%
of 4th-grade students in Illinois performed at or above the basic level (NAEP, 2013f).
Illinois has shown steady improvement from 2000 to 2009. According to the NCES, in
the year 2000 the average 4th-grade mathematics score was 223 (NAEP, 2013f). In the year
2009, the average 4th-grade mathematics score was 238. In the year 2000, 63% of 4th-grade
students in Illinois were at or above the basic level in mathematics. In 2009, 80% of 4th-grade
students were at or above the basic level in mathematics. In the year 2000, 20% of 4th-grade
students in Illinois were at or above the proficient level in mathematics. In 2009, 38% of 4th-
grade students were at or above the proficient level in mathematics. From 2000 to 2009, large

34
improvements in 4th-grade test scores were evident. From 2009 to 2013, though, overall scores
in mathematics have remained virtually the same, 238 and 239, respectively. Unfortunately, the
vast improvement from 2000 to 2009 has leveled off and reached a standstill, leaving room for
different ideas and new interventions to be considered in an attempt to increase the academic
success of young students in the United States. The researcher contends that teaching
interdisciplinary physical education is one such approach that could make a lasting impression
on education.
The Effects of Physical Activity
Being physically active on a regular basis produces many positive effects.
Unquestionably, one’s overall wellness is greatly improved with regular physical activity. With
regular physical activity one’s physiological health is improved, one’s emotional and
psychological health is improved, and one’s cognitive functioning and ability to learn is
improved (Ratey, 2008). Unfortunately, even though these positive effects are known, the habit
of daily exercise does not seem to be the national norm and has yet to be part of the daily
schedules of most Americans. Americans of all ages, elementary school students included, can
be well served by daily physical activity. More specific to this research, such daily physical
activity could be an important catalyst to positive academic gain.
Physical Activity in America
A Physical Activity Council (2014) report states that 28% of Americans six years old and
older are physically inactive. According to the U.S. Department of Agriculture (2010), less than
5% of American adults participate in 30 minutes or more of daily physical activity. More

35
alarming, the National Association for Sport and Physical Education reports that only one out of
every three children is active on a daily basis (NASPE, 1999). Children are continuing their
trend of spending less time playing and moving. In fact, whether in front of the television, the
computer, or their cell phones, children now spend more than seven and a half hours a day in
front of a screen (Rideout, Foehr, & Roberts, 2010). Schools can help get kids back to being
active and ultimately help with their overall wellness. To do this, recess and physical education
should be a part of a school’s daily schedule. Unfortunately, only 6 states require physical
education in every grade, K-12 (NASPE & American Heart Association, 2012), and only Illinois
mandates that there be daily physical education (Illinois State Board of Education, 2014).
Overall Effects of Physical Activity
Physical activity leads to good health (Strauss & Young, 2001). The U.S. Department of
Health and Human Services (1996) reports that regular physical activity reduces high blood
pressure, reduces the risk of diabetes, reduces feelings of depression and anxiety, helps control
body weight, helps maintain healthy bones, muscles, and joints, and promotes psychological
well-being. Physical activity also is linked to lowered risks of obesity, increased cardiovascular
fitness, and academic achievement (DeBate, Gabriel, Zwald, Huberty, & Zhang, 2009).
Obesity
The Aerobics and Fitness Association of America (AFAA) (2011) defines obesity as a
condition where one’s level of excess body fat increases the risk of disease. Obesity is a rapidly
increasing problem in the United States and other industrialized countries (Ogden et al., 2006).
Obesity can lead to many chronic health problems including hypertension, hyperlipidemia,

36
diabetes, degenerative arthritis, certain cancers, reduced life expectancy, and early death (Pi-
Sunyer, 2002).
It is projected that by 2030, half of all adults in the United States will be classified as
obese (Wang, McPherson, Marsh, Gortmaker, & Brown, 2011). More alarming is the fact that
since the 1970s the prevalence of obesity for children ages 6 to 11 years old has quadrupled from
4% to 20% (U.S. Department of Agriculture, 2010). This trend needs to be stopped and it needs
to be stopped early in the lives of our children because overweight adolescents have a 70%
chance of becoming overweight or obese adults (Headley et al., 2004). Physical activity is
crucial in order to prevent childhood obesity (Dubbert, 2002) and there is no better place to
provide organized sessions of physical activity than in our nation’s schools. Mandatory recess
and physical education class would be a way to make this happen.
Stress and Anxiety
Chronic stress leads to many physiological and psychological problems. Stress causes
positive and realistic thoughts to become less accessible, and eventually the chemistry within the
brain can lead one to the malevolent feelings of anxiety, stress, and depression (Ratey, 2008;
U.S. Department of Health and Human Services, 1996). Exercise is one potent antidote to stress
(Ratey, 2008). On a cellular level, the brain activity caused by exercise generates molecular by-
products that damage cells, but under normal conditions, repair mechanisms leave these cells
hardier and ready to face future stressful situations. The neurons get broken down just like
muscles cells and because of this stress they become more resilient to future stress.

37
In 2004, a researcher from the University of Southern Mississippi tested to see if exercise
affected anxiety sensitivity. There were 54 college-student subjects. They all had generalized
anxiety disorder and they all had elevated anxiety sensitivity scores. Half of the student subjects
exercised on a treadmill at 60%-90% of their maximum heart rate and half exercise by walking
on a treadmill at approximately 50% of their maximum heart rate. Both research groups reduced
anxiety sensitivity as a result of their exercising. The group that exercised more rigorously,
though, showed a quicker and more effective reduction in anxiety sensitivity (Ratey, 2008).
Simply put, exercising leads to a reduction in stress, an improvement of emotional state,
and helps one function comfortably (Steinberg et al., 1998). Regarding this research study,
lower levels of anxiety are associated with higher academic performance in the classroom
(Flook, Repetti, & Ullman, 2005).
Depression
According to Ratey (2008), over time, anxiety can lead to depression. Depression is
strongly associated with a lack of serotonin production in the brain. Exercise, on the other hand,
increases levels of serotonin. That being said, exercise is simply one of the best treatments for
anxiety and depression. Unlike many antidepressants, exercise does not selectively adjust the
chemistry of the brain. Instead, it adjusts the entire brain’s chemistry, restoring it to normal
signaling.
A 2000 study by researchers Dimeo, Bauer, Varahram, Proest, and Halter (2001)
indicates that exercise is very powerful in reducing depression in children. Another study by
Columbia University published in 2003 surveyed 8093 people and found that there is an inverse

38
relationship between exercise and depression (Ratey, 2008). Depression is a horrible,
debilitating disease, even with children. Schools can do their part in alleviating childhood
depression, in part, by providing many physical activity opportunities for all students.
Cognitive Functioning
Cereboost (2014) defines cognitive function as cerebral activities that lead to knowledge,
including all means and mechanisms of acquiring information. Essentially, cognitive
functioning is the process of learning.
Cognitive research shows that cognitive functioning is positively associated with physical
activity (Illinois Public Health Institute, 2013). Physical activity positively impacts cognitive
functioning during childhood and continues its impact throughout adulthood (Ratey and Loehr,
2011). Exercise improves learning on three levels: first, it optimizes one’s mind-set to improve
alertness, attention, and motivation; second, it prepares and encourages nerve cells to bind to one
another, which is the cellular basis for logging in new information; and third, it spurs the
development of new nerve cells from stem cells in the hippocampus (Ratey, 2008). Moreover,
exercise increases levels of serotonin, norepinephrine, and dopamine, which are important
neurotransmitters that traffic in thoughts and emotions (Ratey, 2008).
In a 2003 meta-analytical study, Sibley and Etnier quantitatively combined and examined
the results of studies pertaining to physical activity and cognition in children. The studies that
met the inclusion criteria were coded based on design and descriptive characteristics, subject
characteristics, activity characteristics, and cognitive assessment method. Effect sizes from 44
studies were included in the analysis. The overall effect size was 0.32, which was significantly

39
different from zero. It was concluded that there is a significant positive relationship between
physical activity and cognitive functioning in children.
There is also a positive relationship between the amount of movement one participates in
and cognitive functioning (Emery, Shermer, Hauck, Hsiao, & MacIntyre, 2003). Davis et al.
(2007) support this by claiming that higher doses of physical activity (40 minutes) was
associated with significantly better cognitive performance than lower doses (20 minutes), as
measured by their standard scores for planning, which is a test of executive functioning. This
positive relationship between amount of movement and cognitive functioning, coupled with the
research stating that physical fitness and physical activity have been linked to positive cognition
and concentration in the classroom (Etnier et al., 1997), would only lend itself to the logic that
daily physical activity can help to optimize learning.
Academic Performance
The results from a study by Grissom (2005) showed that there is a relationship between
fitness and academic achievement, in that, as one improved, so did the other. Exercise sets the
stage for learning (Ratey, 2008). Cottrell, Northrup, and Wittberg (2007) showed a significant
relationship between children’s cardiorespiratory risks, such as fitness index, blood pressure, and
weight, and reading/language arts, mathematics, and science test scores. To keep these risks in
check, and to increase overall academic achievement, it only seems logical to get children
exercising on a daily basis.
The pressures being put on educators to increase reading/language arts and math scores
on standardized tests has led much of the existing research on physical activity and academic

40
performance to focus on these two disciplines. With regard to reading/language arts, there was a
study reported in a 2007 study by German researchers. These researchers found that people learn
vocabulary 20% faster following exercise than they did before exercise (cited in Ratey, 2008).
In another study, Davis et al. (2011) looked at executive functioning scores and mathematics
achievement with regard to exercise. The researchers found that a substantial dose of regular,
vigorous exercise for overweight children (heart rates over 150 beats per minute) can positively
affect executive functioning scores and mathematics achievement.
There are skeptics who want clarification regarding exercise’s effects on academic
achievement. On such study (Eveland-Sayers, Farley, Fuller, Morgan, & Caputo, 2009)
discloses that there are, indeed, benefits associated with physical fitness. They claimed, though,
that the association between fitness and academic achievement remained to be clarified,
especially in young children. The researchers set up a study consisting of 134 third-, fourth-, and
fifth-grade students. The student subjects were asked to run a mile, to perform a curl-ups test, to
perform a sit and reach test, and to have their body mass index calculated. The subjects then
took the math and reading/language arts tests found within the Terra-Nova achievement test.
The results showed a negative association (p<.01) between the one-mile run and math scores (r=-
.28). The results also showed a positive relationship (p<.05) between muscular fitness and math
scores (r=.20). It was concluded that there is a possible link between specific components of
physical fitness and academic achievement in elementary school children.
Another study that shows unclear, marginal results regarding physical activity’s positive
relationship on academic performance comes from a 2008 study (Carlson et al.) where the

41
researchers looked at how the amount of physical activity affected academic performance. This
longitudinal study used kindergarten through fifth-grade student subjects to examine the effects
of the amount of time spent engaged in physical activity on reading and mathematics
achievement. The results showed that girls with 70-300 minutes per week of physical education
had small but significant academic benefits in reading and mathematics achievement, compared
with girls enrolled in 0-35 minutes per week of physical education. There was no significant
finding among boys in the study.
Though there are studies and skeptics that seek clarification as to the true effects of
physical activity on academic performance, there is much more research to support the positive
relationship between physical activity and academic performance than there exists to discount
the positive relationship. Fitness levels have been shown to be a strong predictor of academic
success. Srikanth, Petrie, Greenleaf, and Martin (2012) conducted a study on middle school
students and found that of the following three factors considered in the study—effect of social
support, self-esteem, and cardiorespiratory fitness—cardiorespiratory fitness was the only factor
that correlated with higher scores on reading and math tests. An Illinois study found that
students’ fitness levels, as measured by the FitnessGram® (Cooper Institute for Aerobics
Research, 1999), were positively correlated to academic achievement, based on the Illinois
Standards Achievement Test, especially in the content areas of mathematics and science
(Castelli, Hillman, Buck, & Ervin, 2007). In another 2007 study (Davis et al.), researchers
found that aerobic training through games that require more complex motor activities, such as
running games and soccer, increases prefrontal cortex activity and improved performance on

42
tasks requiring executive functioning as well as having a marginal positive effect on
mathematical achievement.
The FitnessGram® (Cooper Institute for Aerobics Research, 1999), mentioned
previously, has been at the heart of the research regarding physical activity and academic
achievement. FitnessGram® is a battery of tests that measure aerobic capacity, muscular
strength, muscular endurance, flexibility, and body composition. In a 2011 study (Van Dusen,
Kelder, Kohl, Ranjit, & Perry), it was found that all of the FitnessGram®’s health-related
components except body mass index (body composition) were positively associated with
academic performance. Measures of cardiovascular fitness were found to have the highest
connection to cognition. Bass, Brown, and Laurson (cited in Illinois Public Health Institute,
2013), used FitnessGram® in a separate study. The results of this study show that student
subjects who were in their Healthy Fitness Zone for cardiorespiratory fitness were six time more
likely to be in the “meets” or “exceeds” categories on the Illinois Standards Achievement Test
(ISAT) in reading than were students who were not in the Healthy Fitness Zone.
A positive relationship seems to exist between the amount and intensity of exercise and
academic performance. According to Coe, Pivarnik, Womack, Reeves, and Malina (2006), there
is a positive relationship between vigorous physical activity and higher academic achievement in
the classroom, based on grades. In a separate three-year longitudinal study reported in 2009
(Donnelly et al.), researchers looked at the effectiveness of PAAC (Physical Activity Across the
Curriculum) on body mass index (BMI) and academic achievement. Generally speaking, PAAC
is a program where classroom teachers take periodic movement breaks throughout the school

43
day. The results of the study showed that 90 minutes per week of moderate to vigorous physical
activity delivered by classroom teachers is what is recommended for optimal academic
achievement, but 75 minutes or more will also show significant increases in academic
achievement. In short, there was a positive, direct relationship between the amount of minutes of
physical activity logged per week and the level of academic achievement.
The effects of physical activity on learning linger on well past the end of a movement
session. Kubesch et al. (2009) showed that a single 30-minute physical education class led to an
improvement in the ability to focus, and that physical education should be scheduled before
important subjects like mathematics and not at the end of the day. Budde, Voelcher-Rehage,
Pietrabyk-Kendziorra, Ribeiro, and Tidow (2008) supported this finding when they showed that
children showed higher attention levels at the end of physical education lessons versus at the
beginning due to the arousal hypothesis, which relates attention to increases in cerebral blood
volume and excited cerebellum and frontal cortex. A study by Gallotta et al. (2012) showed that
immediately following traditional physical education classes and coordinative physical education
classes, 8- to 11-year-old students displayed higher working speeds and higher concentration
scores. In short, at the end of an exercise session, the brain is primed for learning.
Joyce, Graydon, McMorris, and Davranche (2009) report on the residual effects on
cognition from aerobic physical activity. The residual benefits of acute steady-state moderate
intensity exercise on cognitive performance can range from 30 minutes after exercise up to 52
minutes after exercise in 13- to 14-year- old children. In another study, Hillman, Snook, and
Jerome (2003) show the benefits in decision making (shorter P3 latency and larger P3 amplitude)

44
following acute exercise on tasks requiring cognition control during inhibitory tasks. These
benefits remained for 48 minutes after stopping exercising. Hillman et al. (2009) and Pontifex,
Saliba, Raine, Picchietti, and Hillman (2013) both claim in separate studies that improvements in
academic achievement occur for approximately one hour after stopping acute bouts of exercise.
Though there seem to be ample amounts of research to support the positive relationship
between physical activity and academics, skeptics still remain who want more empirical data to
prove this positive relationship. The researcher in this study hopes to add to the growing support
that there is a positive relationship between physical activity and academic achievement. More
specifically, the researcher hopes to show that the component of physical activity, found within
the interdisciplinary program Hopscotch Math (Schroeder, 1998), has a positive effect on
multiplication facts development in 3rd-grade students.
Conceptual Framework
Interdisciplinary Learning
Tailoring lessons to a student’s capabilities is something that teachers should strive to
reach every day in class. Although many try to reach this goal, it seldom happens. Continually
attempting to help students through their academic difficulties and always thinking about what
one can to do to make each student learn best is a way to help promote positive self-efficacy
(Pajares, 2006). Self-efficacy is a person’s belief of their capabilities toward specific content
and, when present, is a huge component of academic success (Fast et al., 2010; Multon, Brown,
& Lent, 1991), in general, as well as in mathematics specifically (Bandura et al., 1996; Pajares,
2006). Children love to move and explore their environment. Moving puts the brain of the

45
learners in the optimal position for them to learn (Ratey, 2008). As stated earlier, most students
learn well through kinesthetic activities (Gardner, 1983) and until the age of approximately 11,
children learn inductively through play (Piaget, 1969). Educators can be, and should be, the
major force behind the creation of environments that are learner friendly and of tasks by which
all children find meaning. Environments where success is a product of effort are places where
self-efficacious behaviors from students will emerge and academic success will follow (Bandura
et al., 1996). Giving elementary school students opportunities to learn while engaged in physical
activity and while they are within an unobtrusive environment simply seems to make sense. The
researcher contends that there may be no better place or time for these conditions to be met than
in a gymnasium during a structured physical education class.
Interdisciplinary Physical Education
The researcher used a theoretical design for learning that is presented in a book entitled
Interdisciplinary Elementary Physical Education: Connecting, Sharing, Partnering (2nd ed.), by
Theresa Purcell Cone, Peter Werner, and Stephen L. Cone (2009). The authors posit that
through interdisciplinary education, students gain multiple perspectives to be successful in an
ever-changing world. Within the book, the authors introduce the reader to procedures and
strategies to help the reader create practical, interdisciplinary learning experiences through active
learning which, in turn, will lead to academic success.
Interdisciplinary education is defined as an integration of two or more subject areas with
the goal of fostering valuable learning in each subject area (Cone et al., 2009). There are many
ways this can be accomplished. The disciplines may be conjoined by the creation of a central

46
theme, highlighting any issue or problem or topic, or by provoking curiosity in a certain
experience, to name a few (Jacobs, 1989). Drake and Burns (2004) propose that children’s
interest in this environment is not subject specific, but instead crosses many disciplines.
Teachers can effectively foster learning by organizing the curriculum around common themes,
concepts, and skills across disciplines. This approach is different than a discipline-based
approach to learning, in that it attempts to connect the disciplines through points of attachment
(Drake and Burns, 2004). Interdisciplinary learning puts on display the power of learning
through connection and convergence rather than divergence and differentiation. Ultimately,
interdisciplinary learning experiences enhance and enrich what students learn by encouraging
critical thinking skills such as analysis, synthesis, and evaluation; by motivating students because
the learning is fun and meaningful; by increasing the ability to recognize and accept multiple
perspectives; and by demonstrating transfer of knowledge from one learning context to another
(Cone et al., 2009).
Cone et al. (2009) are clear with their format to assist in the creation and implementation
of interdisciplinary, activity-based lessons. Tarnowski (cited in Wilcox, 1994) reports that the
interdisciplinary nature of children’s own play should be the model for planning and teaching.
Cone et al. (2009) seem to display this same philosophy and it is evident in their format for
creating interdisciplinary learning success through movement.
Cone et al. (2009) share three models for implementing a successful interdisciplinary
physical education program. These models can also be used as guides for implementing
successful interdisciplinary learning in general. The models function on a spectrum from simple

47
to complex. The three models are Connected, Shared, and Partnership. All models assist
teachers with clarifying their intent and objectives for using an interdisciplinary approach to
teaching. The authors make it clear, as well, that no model is definite and inflexible, but instead
can be used as a loose guide for integrating lesson that are filled with meaning and purpose. In
fact, it is common that one may need to overlap or adapt the models to meet the needs of one’s
students.
The Connected Model is the simplest model and was the one used for this research study.
According to Cone et al. (2009), the Connected Model takes content from one subject area and
uses it to supplement the learning experience in another subject area. One subject is usually the
focus and another is used to supplement the learning experience. In the case of this study, the
researcher used the prescribed Hopscotch Math (Schroeder, 1998) program which employs, in
part, the kinesthetic movement of hopscotching to help students learn basic multiplication facts.
In other words, hopscotching “connects” physical activity to the attainment of mathematics
knowledge.
The second model presented by Cone et al. (2009) is the Shard Model. The Shared
Model links similar topics, concepts, or skills from two or more subject areas and is taught
collaboratively with another teacher. If this were the model being used in this study, the
classroom teachers whose students were the subjects of this study would use only a part or
segment of the Hopscotch Math (Schroeder, 1998) program in the classroom. Hopscotching, for
example, could be used in the classroom in an attempt to attain multiplication facts knowledge.

48
In other words, hopscotching would be a “shared” activity taking place in the gymnasium during
physical education class and in the classroom, as well.
Lastly, the Partnership Model (Cone et al., 2009) provides a strategy for complex
unification of content from two or more subject areas and has equal representation of each
subject area. A team-teaching approach is often used with this model. If this were the model
being used in this study, the classroom teachers whose students were the subject of this study
would be working as teammates with the physical education teacher to fully implement the
Hopscotch Math (Schroeder, 1998) program, giving equal emphasis to physical activity as to
multiplication facts development. The physical education program as well as the classrooms
would be teaching the Hopscotch Math program in such a way that both teaching environments
reflect the program as a whole, giving equal emphasis to both disciplines. In other words, the
physical education teacher and the classroom teacher “partner” with each other so that both
learning environments help to fully implement the Hopscotch Math program as prescribed,
giving an equal emphasis to physical activity as to multiplication facts development.
Cone et al. (2009) offer the following strategies for developing an interdisciplinary
learning experience: review curricular guides and scope and sequence; select content; gather
content information; decide on the interdisciplinary teaching model(s); create lesson plans,
including specific activities; determine scheduling, materials, equipment, organization, and
facilities; and decide how to assess the students’ learning. These strategies are not prescribed to
be used in any particular order. The researcher used these strategies to create the
interdisciplinary physical education learning experiences within the Hopscotch Math (Schroeder,

49
1998) program. As previously mentioned, the researcher used the Connected Model, but with
the liberty afforded to the researcher by Cone et al. (2009), and adapted it to fit the intention of
the research. What follows are the prescribed strategies and how the researcher used these
strategies to prepare for the implementation of the Hopscotch Math (Schroeder, 1998) program.
The first strategies used to guide the researcher were to select content and to gather
content information. The researcher did this by meeting with the principal to determine in which
academic discipline the students performed poorly during the previous years’ ISATs. It was
determined that the mathematics was a cause for concern, and thus it became the selected content
for this model. The researcher then met with all 3rd-, 4th-, and 5th-grade teachers to determine
what specific math concept would be the focus of the research. It was decided that
multiplication facts development would be the focus. During this meeting, the teachers
enlightened the researcher as to the foundational importance of students learning their basic
multiplication facts. This information was used to figure out what prescribed program would be
used as an intervention for the study. In the case of this study, this information aided the
researcher in choosing Hopscotch Math (Schroeder, 1998) as the intervention to be used to teach
students basic multiplication facts.
The researcher also needed to decide on the interdisciplinary teaching model(s) to use.
Because of the dynamics of the research, it was determined that the best fit would be to use the
Connected Model (Cone et al., 2009). In short, the Connected Model fit best because Hopscotch
Math (Schroeder, 1998) is a supplement to teaching multiplication facts and the classroom

50
teachers were only lightly active with regard to the involvement of the implementation of this
program.
Another strategy used was to review curricular guides and scope and sequence. The
researcher followed the curricular guidelines and the scope and sequence prescribed within the
Hopscotch Math (Schroeder, 1998) program. A day-to-day agenda can be found in Appendix H.
Creating lesson plans with specific activities is another strategy. As mentioned
previously, Hopscotch Math (Schroeder, 1998) was used and the lesson plans for this program
had already been created within the program. The researcher followed these lesson plans.
Appendix H details the day-to-day lesson content.
Determine scheduling, materials, equipment, organization, and facilities are yet more
strategies needed to create effective interdisciplinary learning experiences. Regarding this study,
no special attention was needed with regard to scheduling and facilities because the research was
conducted during the students’ normal physical education class. Materials and equipment were
minimal. The materials needed, such as multiplication exams, flashcard, worksheets, and student
learning logs, were created before the study began. Organization of the research fell into line
with the prescribed structure found within the Hopscotch Math (Schroeder, 1998) program.
A critical strategy that is important to the integrity to this research was to decide how to
assess student learning. This assessment ultimately helped in determining the effectiveness of
the interventions. The researcher assessed student learning by using the prescribed
Multiplication Exam (Appendix A) found within the Hopscotch Math (Schroeder, 2012)
program. It must be noted that the researcher used the 2012 version of Hopscotch Math

51
multiplication assessment instead of the 1998 version of Hopscotch Math simply because it was
validated by EdGate Correlation Services, LLC (Schroeder, 2012). The multiplication
assessment used in the 1998 version is exactly the same as the 2012 version but was not
validated by EdGate Correlation Services. It must also be noted that the reason the researcher
used the 1998 version of the Hopscotch Math program instead of the 2012 version is because the
1998 version offered a more kinesthetic approach to learning multiplication facts.
Interdisciplinary teaching allows teachers a unique opportunity to deliver important skills
and knowledge to their students from a new and different perspective. The integrity of all
subject areas involved within this approach is carefully maintained through careful planning and
implementation. The researcher carefully followed the theoretical models as prescribed by the
models’ authors (Cone et al., 2009) when implementing the Hopscotch Math (Schroeder, 1998)
program. In the end, it was the hope of the researcher that all students would benefit
tremendously from the prescribed interdisciplinary approach to learning.
Hopscotch Math
Hopscotch Math (Schroeder, 1998), as stated in the previous section, was the specific
interdisciplinary program used during the physical education classes where this study was
conducted. For the quantitative portion of this quasi-experimental study, the researcher used the
Hopscotch Math program for developing basic multiplication facts knowledge in an attempt to
determine if extra practice toward learning multiplication facts through kinesthetic movement,
hopscotching specifically, helps students learn multiplication facts compared to students that

52
receive the Hopscotch Math program without the kinesthetic hopscotching portion of the
prescribed program and to students within the Control group.
The Hopscotch Math (1998) program is set up so that there are twenty lesson days within
the program. These lessons include hopscotching, multiplication flashcard practice, student
learning logs, prescribed direct instruction lessons, and worksheets as part of the program. Due
to the comparative nature of the research, one intervention group was prescribed the Hopscotch
Math (Schroeder, 1998) program in its entirety, one intervention group was prescribed the
Hopscotch Math program without the hopscotching portion of the program, and the third group
was the Control group and did not receive an intervention.
The researcher’s team teacher modeled both the hopscotching and the multiplication
flashcard practice research in an attempt to show through vicarious experience (Bandura, 1997)
the importance of these two intervention activities. This, in theory, helps develop self-efficacy
within the student subjects. All twenty lesson days do not have to be taught in twenty continuous
school days and some of the twenty lesson days are optional. The researcher’s team teacher
taught 2-3 lessons per week, depending on the school district calendar, and ultimately only
taught 18 of the lessons. The other two lessons prescribed in Hopscotch Math (Schroeder, 1998)
are optional. Lessons lasted approximately 30 minutes. Before the interventions began, the
researcher gave a baseline, pre-intervention multiplication facts assessment to all three research
groups. Approximately four weeks after the interventions started, the researcher gave the mid-
intervention multiplication facts assessment. Finally, approximately eight weeks after the
interventions started, the researcher gave the post-intervention multiplication facts assessment.

53
Lastly, before the researcher started the interventions, all lesson plans were created, all
Student Learning Logs were created, all hopscotch stations were created, and all flashcards were
created. A day-by-day account of the eighteen lessons taught to the two intervention groups can
be found in Appendix H.
Educators must understand that their classrooms are filled with diverse learning styles
and that student learning will be compromised when they are limited to activities that are not
compatible with their preferred learning styles. Kids love to play. Howard Gardner (1983) adds
that all students are kinesthetic learners to some degree and can learn through movement and
experimentation. This researcher aimed to show that if students are allowed an opportunity to
learn basic multiplication facts by way of game play and movement practice, namely
hopscotching, then nearly all students will experience some level of academic success.

CHAPTER 3
METHODOLOGY
Introduction
The researcher conducted a quasi-experimental study in an attempt to gather a better
understanding of student learning with regard to multiplication facts development. Several
research questions were proposed in Chapter 1. From a quantitative perspective, two research
questions were generated, and from a qualitative perspective, one research question was
generated. It was the researcher’s hope that when the quantitative and the qualitative data were
analyzed, a clear understanding of the effectiveness of giving students extra practice toward
learning basic multiplication facts through an interdisciplinary approach to teaching physical
education would emerge.
Description of the Population
The sample for this study was taken from a combination of a medium-size northern
Illinois city and a small northern Illinois town. According to City-Data.com (2014b), the
population of the medium-size city in 2012 was 43,842, and according to City-Data.com
(2014a), the population of the small town in 2012 was 4,318. Regarding the medium-size city,
the average household size was 2.4 people. The median household income was $33,767. The
estimated median house or condo value was $154,586. Race statistics show that 69.2% of people
were white alone, 12.5% were Hispanic, 12.2% were black alone, 3.9% were Asian alone, 1.9%

55
were two or more races, 0.1% were other race alone, .08% were American Indian alone, and
.05% were native Hawaiian and other Pacific Islander alone. Regarding the small town, the
median age was 29.5 years. The average household size was 3.0 people. The median
household income was $60,628. The estimated median house or condo value in 2012 was
$148,446. Race statistics show that 78.6% of people were white alone, 12.3% were Hispanic,
5.4% were black alone, 1.7% were Asian alone, 1.7% were two or more races, 0.2% were
American Indian alone, and .05% were other race alone.
There were eleven public schools in the school district that encompassed the elementary
school at which the research was conducted. There was one high school, two middle schools,
and eight elementary schools. The high school was grades 9-12. The middle schools were
grades 6-8. The elementary schools were either pre-kindergarten through fifth grade or
kindergarten through fifth grade.
According to the 2013-2014 Illinois Report Card (2014), the school district was
composed of 53.7% white students, 16.5% black students, 22.9% Hispanic students, 1.9% Asian
students, 0.5% American Indian students, 4.5% two or more races students, and 0% Pacific
Islander students. There were 53.9% low income students within the school district.
Instructional spending in this community was $6,812 per student (state average: $7,094) and
operational spending was $12,167 per student (state average: $12,045). The average class size
was 25 students (state average: 21). On the state achievement tests, the students were slightly
lower than the state average in both reading and math.

56
Sample
The sample for this study was approximately 68 third-grade students taken from a
kindergarten through fifth grade elementary school. Due to the sample size (68) and the number
of groups (3), each sample cell for this study was theoretically made up of approximately 23
students. Due to anticipated disallowance because of participation, sickness, and mobility,
amongst other unforeseen reasons, the sample cell size was predicted to be smaller. It was
anticipated that each cell size would be approximately 23 students. The principal placed each
student into one of the four 3rd- grade classrooms based on many variables. The process
inevitable made for a fairly consistent demographic make-up, especially with regard to
academics and behaviors. One third (one half of the first section of physical education) of the
research subjects received all the practice components within the intervention Hopscotch Math
(Schroeder, 1998) program, including extra practice toward learning multiplication facts from
kinesthetic hopscotching. One third (one half of the second section of physical education) of the
research subjects received the intervention of Hopscotch Math but without hopscotching. Lastly,
one third (the other half of the first section of physical education) of the research subjects did not
receive an intervention but served as the Control group instead.
Research Questions and Hypotheses
The study was guided by the following research questions:
1. Is there a significant difference among 3rd-grade-level students receiving the
Hopscotch Math intervention, 3rd-grade-level students receiving the Hopscotch Math
intervention less the hopscotching portion of the program, and 3rd-grade-level

57
students in the Control group, when comparing pre-intervention tests, mid-
intervention tests, and post-intervention tests? (ANCOVA)
2. Does teaching multiplication facts to 3rd-grade-level students through the
interdisciplinary physical education movement approach to teaching multiplication
facts called Hopscotch Math show improvement on the Hopscotch Math
Multiplication Exam compared to a 3rd-grade-level student group receiving the same
program, less the kinesthetic hopscotching component of this program, and a 3rd-
grade-level student group receiving no extra practice (Control group)? (ANCOVA)
3. Did the classroom teachers whose students are the subjects of this study notice an
atypical increased rate of improvement toward multiplication facts development?
(teacher interview responses and anecdotal records confirm or refute analysis)
Hypotheses
The following hypotheses were tested:
Ho (Null Hypothesis): There is no statistical difference among 3rd-grade-level students
receiving the interventions and 3rd-grade-level students in the Control group, when
comparing pre-intervention tests, mid-intervention tests, and post-intervention tests.
Hα (Alternate Hypothesis): There is a statistical difference among 3rd-grade-level
students receiving the interventions and 3rd-grade-level students in the Control group,
when comparing pre-intervention tests, mid-intervention tests, and post-intervention tests.

58
Research Method
Needs Assessment
While searching for a research topic, the researcher met with the principal at the
elementary school where the research was conducted in order to determine which in academic
discipline the students performed poorly during the previous years’ standardized state tests. It
was determined that mathematics scores were problematic, and math thus became the selected
academic discipline to be investigated for this study.
The researcher then scheduled three 30-minute meetings, with all the 3rd-grade teachers,
4th-grade teachers, and 5th-grade teachers, respectively. The meetings were held before a normal
school day in an attempt to determine a more specific research topic regarding mathematics. The
researcher came to the interviews with two questions: “What seems to be a continuous academic
hurdle to learning regarding math in your classroom?” and “If your students could understand
one foundational mathematical concept to help move your math curriculum along efficiently and
effectively, what would it be?” After the group discussions, the teachers from all three groups
unanimously decided that they would like the students to have a better understanding of basic
multiplication facts. Terms, phrases, and concepts that were frequently mentioned during the
interviews were recorded. Common terms, phrases, and concepts were: powers of 10,
exponents, decimals and whole number relationship, and all fractions. All of these mathematical
concepts were discussed with regard to their relationship to multiplication facts. The teachers
were clear that the concepts associated with these terms, phrases, and concepts cannot be learned

59
efficiently and effectively without first having basic multiplication facts knowledge. Because of
these interviews, multiplication facts development became the dependent variable of this study.
University IRB Procedures
Prior to conducting research, the researcher needed to complete several requirements.
The researcher needed to complete the minimal risk in research training protocol through the
Collaborative Institutional Training Initiative (CITI). The researcher then created a parental
consent/student assent letter (Appendix B) to be sent home to all the potential student subjects
for this study. This parental consent/student assent letter explained the research in detail.
Prior to conducting research, the researcher also needed to defend the researcher’s
dissertation proposal. After the successful defense of the dissertation proposal, the researcher
needed to complete the Application for Institutional Review of Research and submit it to the
university’s Institutional Review Board (IRB). After receiving approval from the IRB, the
researcher was able to proceed to the next step of the process, which was to gain approval to
conduct research from the school district in which the research would be conducted.
Review to Conduct Research Procedures at Research Site
After gaining approval from the university IRB, the researcher obtained, filled out, and
then submitted all the necessary paperwork that was requested by the school district in which the
research was to be conducted. This information was to be submitted to the Research Review
Committee by May 1st, 2015. Upon receiving approval from the school district’s Research
Review Committee, the researcher was then able to collect data.

60
Pre-intervention Procedures
Before the research began, the researcher conducted a meeting with the four 3rd- grade
teachers whose students would be the subjects of this study, to give them a detailed breakdown
of the study. During this meeting, the teachers were asked to keep written anecdotal records for
the duration of this study with regard to their students’—as well as their own—behavioral and
academic attitudes and perceptions toward multiplication facts development. This meeting also
served as a question and answer session so that the teachers could gain a complete understanding
of the research.
Approximately two weeks before the interventions began, the researcher handed out the
parental consent/student assent forms (Appendix B). The parental consent/student assent forms
were required to be returned one week before the interventions begin. Those who did not
participate in the study were given alternate activities to do during class. These alternate
activities were the same activities that the school’s 4th- and 5th-grade students did during that
day’s physical education class. They were taught by the researcher. Those students who did
participate in the study were given an identification number in order to keep their names and
information confidential and anonymous. The students who did participate in the study were
also given a separate Student Assent Form (Appendix I) during physical education class that was
read to them and that they signed if they still wanted to be part of the research. This was done to
independently assure the researcher that each student wanted to be a part of this research study.
Before the researcher started the interventions, consent forms from the principal
(Appendix D), the 3rd- grade teachers (Appendix E), and the physical education teacher that gave

61
the interventions (Appendix F) were signed. All documents and records are being kept in a
locked safe within the school principal’s office.
The researcher also communicated with the parents/guardians of the student subjects
regarding research details. The researcher offered a question-and-answer session for the
parents/guardians after school one night before the research began. This question-and-answer
night took place approximately two weeks before the interventions started. The researcher let it
be known to the parents/guardians that the researcher would be available by phone to answer any
questions before the research began, during the course of the research, and after the research had
concluded. Lastly, the researcher offered an evening session for the parents/guardians of the
research subjects where the researcher presented the research results. This session also served as
a question-and-answer session. This session took place approximately two months after the
conclusion of the research.
The Hopscotch Math (Schroeder, 1998) program, the interdisciplinary physical education
program used in this research, is set up so that there are twenty lesson days within the program.
The Hopscotch Math program uses the kinesthetic activity of hopscotching, flashcard practice,
student learning logs, prescribed direct instruction lessons, and worksheets to help develop
multiplication facts knowledge. All twenty lesson days do not have to be taught on twenty
continuous school days, and some of the twenty lesson days are optional. The researcher’s team
teacher taught 2-3 lessons per week, depending on the school district calendar, and taught 18 of
the 20 possible lessons. The other two lessons prescribed in Hopscotch Math were optional.
Lessons lasted approximately 30 minutes. Before the researcher started the interventions, all

62
lesson plans were created, all student learning logs were created, all hopscotch stations were
created, all worksheets were copied, and all flashcards were created. For a detailed day-to-day
agenda, see Appendix H.
All research documents and records used in this research that could compromise a student
subject’s identity and confidentiality, including the signed parental consent/student assent forms
and the separate Student Assent Form (See Appendices B and I), are being stored in a designated
locked safe in the principal’s office which is located at the research site. These documents will
be destroyed via paper shredder after the 3-year post-study time frame.
Design Overview
The researcher performed a quasi-experimental study in which a qualitative and a
quantitative approach was used both independently and collectively in an attempt to find
valuable understanding regarding multiplication facts development within all four 3rd-grade
elementary school classrooms. The qualitative approach used was narrative approach (Fraenkel
& Wallen, 2009) and the quantitative approach used was quasi-experimental.
The narrative approach (Fraenkel & Wallen, 2009) allowed the researcher to gain an
overall picture of teaching and learning efficiency and effectiveness through the eyes of the
teachers whose students were the subjects of this study. This happened through analyzing
written anecdotal records kept by the teachers throughout the study and through analyzing
content gathered from the two teacher interviews. Through these analyses, the emergence of
frequently used words, phrases, concepts, and ideas helped the researcher formulate a reliable
and valid representation of the effects of the interventions used in this research study.

63
The represented quantitative portion of the research was quasi-experimental design
(Fraenkel & Wallen, 2009). Quasi-experimental design was used because random assignment
was not an option with this research because the school principal assigned students to their
classes based on academic records, behavioral records, parent requests, gender, and random
assignment. Written multiplication facts tests were given pre-intervention, mid-intervention, and
post-intervention, all in an attempt to help the researcher formulate a reliable and valid
representation of the effects of the interventions used for this study.
Ultimately, triangulation through convergence (Fraenkel & Wallen, 2009) combined the
qualitative and quantitative portions of the quasi-experimental study for an overall understanding
of this study. This was done through the use of the convergence (Fraenkel & Wallen, 2009)
method. This method was used to highlight similar findings between qualitative and quantitative
results. Within this process, the researcher took the already analyzed data gathered from the
qualitative portion of the research and the already analyzed data gathered from the quantitative
portion of the research and analyzed the two sets of already analyzed data to see if there were
consistencies between the results of the two portions of the study.
Assumptions of Qualitative and Quantitative Designs
According to Fraenkel and Wallen (2009), qualitative and quantitative researchers have
differing philosophical assumptions. The researcher for this study feels that all assumptions
from both types of research have merit and can, in the end, provide a deeper understanding of the
research topic. Therefore, the researcher believes both can coexist in one study and therefore
used both in the form of a quasi-experimental research approach.

64
According to Fraenkel and Wallen (2009), the following differing philosophical
assumptions of quantitative and qualitative researchers exist. With quantitative research, there
exists some reality that is independent of us and is waiting to be discovered scientifically by
figuring out the nature of reality and how it works. On the other hand, with qualitative research,
the individuals who experience the research situation construct their own reality. That being
said, realities exist in the form of multiple mental constructs.
With quantitative research, researchers can potentially make accurate statements about
the way the world really exists. With qualitative research, research produces alternative visions
of what the world is like. In addition, quantitative research makes it possible for the researcher
to stand apart from which is being researched. With qualitative research it is impossible for the
researcher to stand apart from the individuals being studied.
Furthermore, quantitative research produces facts and values that are obviously distinct
from each other. Qualitative research produces facts and values that are inextricably intertwined.
Lastly, with regard to quantitative research, the purpose of educational research is to explain and
predict relationships. The ultimate goal is the development of laws that make prediction
possible. On the other hand, with regard to qualitative research, the purpose of educational
research is to gather an understanding of what things mean to others. Generalizing laws is not
possible.
Qualitative Research Component
There is a plethora of qualitative research designs. Some design examples are narrative
approach, Phenomenology, Grounded Theory, Case Studies, Ethnographic, and Historical

65
Research (Fraenkel & Wallen, 2009). The approaches to qualitative research can be extensive,
especially when combining sub-types of each design as well as when a researcher combines
qualitative with quantitative. With regard to this study, the qualitative portion of the research
used the narrative approach. The purpose of the qualitative portion of this research was for the
researcher to gain a more holistic impression of teaching and learning, in that the research would
let a more complete picture develop throughout the study. This complete picture was described
by the teachers of the student subjects, in part, through written anecdotal records kept throughout
the study and shared during the mid-intervention teacher interview and the post-intervention
teacher interview. These results were analyzed by the researcher immediately following the end
of the interventions. The hope was that the whole phenomenon under study will be understood
as a complex system that is greater than the sum of its parts.
Narrative Approach
From a qualitative viewpoint, the researcher used the narrative approach. This method
studies the life experiences of individuals as told to and recorded by the researcher (Fraenkel &
Wallen, 2009). More specifically, the researcher used a form of narrative approach called oral
history (Fraenkel & Wallen, 2009). Oral history consists of gathering the reflections of events
and the causes and effects of these events from one individual or several individuals (Plummer,
1983).
Instrumentation
For the qualitative portion of this research study, the researcher used two basic
instruments to help gather data and information. First, the researcher asked the teachers of the

66
student subjects to keep written anecdotal records of their students’ as well as their own
academic and behavioral attitudes and perceptions toward multiplication facts during the
duration of the study. Second, the researcher conducted interviews. There were two teacher
interview sessions, where two questions were asked. The questions at the first interview were
the exact questions asked at the second interview. Those questions were: “What have you
noticed with regard to overall student academic progress with regard to multiplication facts
development since the start of this study?” and “What attitude or behavioral changes have you
noticed with regard to multiplication facts development since the start of this study?”
Interview Schedule and Procedures
There were two interviews conducted with the teachers of the student subjects. The
interviews were whole group interviews where the interview questions were asked to the whole
group of teachers. All teachers were given a chance to answer the questions asked. Any teacher
could respond multiple times to the same question. The researcher did not go on to the next
question until all teachers had said all they wanted to say about the question at hand. Thus, there
was no definite time limit to these interviews, although the researcher reserved 30 minutes for
each interview.
The first interview was mid-intervention. It was conducted approximately four weeks
after the start of the study. The second interview was post-intervention and took place
approximately eight weeks after the start of the study. The anecdotal records kept by the
teachers would ultimately be analyzed by the researcher, as would the researcher’s recorded
responses of the teachers in response to the interview questions asked. The anecdotal records
67
kept by the teachers during the duration of the study could be used by the teachers to help them
answer the questions asked during the interview sessions.
Data Collection Procedure
The researcher met with the teachers of the student subjects before the study began. The
teachers were asked to keep written anecdotal records to help the researcher gain an
understanding of the effectiveness of the interventions. The researcher then conducted a mid-
intervention interview with the same teachers four weeks from the inception of the study using
two open-ended questions to gather knowledge of student academic progress and student attitude
changes regarding multiplication facts development. The researcher then conducted one post-
intervention interview using the same open-ended questions as the mid-intervention interview in
an attempt to further understand student academic progress and student attitude changes
regarding multiplication facts development. The post-intervention interview occurred eight
weeks after the inception of the study. The first of the two open-ended questions that was asked
to the teachers was in regard to the teachers’ perceptions toward student academic progress,
specifically toward multiplication facts development. The second open-ended question was
geared toward the teachers’ perceptions of students’ attitude/behavior changes regarding
multiplication facts development.
To create the interview questions, the researcher kept in mind the following:
assumptions, motives, reasons, goals, and values (Fraenkel & Wallen, 2009). The first question
was, “What have you noticed with regard to overall student academic progress with regard to
multiplication facts development since the start of this study?” The second question was, “What

68
attitude or behavioral changes have you noticed with regard to multiplication facts development
since the start of this study?”
Data Analysis
The data that was collected regarding the qualitative portion of this research was in the
form of written anecdotal records and interview question responses from the teachers whose
students were the subjects of this study. The researcher anecdotally recorded the answers to the
interview questions. The researcher then analyzed these data by looking for the emergence of
common words, thoughts, themes, concepts, and ideas. This process is called triangulation
through convergence (Fraenkel & Wallen, 2009).
Validity and Reliability
With regard to the qualitative portion of this research, the method that was used by the
researcher to show validity and reliability was credibility (Fraenkel & Wallen, 2009). Credibility
with regard to the qualitative portion of this research comes directly from the teachers. Teachers
are assumed to be the experts in their field and therefore encompass not only instrument validity
and reliability, but internal validity, as well (Fraenkel & Wallen, 2009).
Quantitative Research Component
There is a plethora of quantitative research designs, as well. They range from
experimental to single-subject to correlational to causal-comparative to survey (Fraenkel &
Wallen, 2009). The approaches to quantitative research can be extensive, especially when
combining two or more quantitative approaches. Research designs can be made even more

69
extensive by combining quantitative with qualitative research. In the end, a researcher must be
diligent when deciding which overall research design is to be used so that the best, most
accurate, valid, and reliable results can be reported. With regard to this study, the quantitative
portion of the research used a quasi-experimental design.
Quasi-Experimental Design
From a quantitative viewpoint, the researcher used a quasi-experimental design (Fraenkel
& Wallen, 2009) because random assignment could not be used. Random assignment was not an
option with this research study because the school principal assigns students to their classes
based on academic records, behavioral records, parent requests, gender, and random assignment.
The school principal assigned students to four separate 3rd-grade classes which served as the
three research groups for this study. There were two types of quasi-experimental designs used in
combination with regard to this research. They were matching-only pre-test-post-test control
group design (Fraenkel & Wallen, 2009) and time-series design (Fraenkel & Wallen, 2009).
Matching-only Pre-test-post-test Control Group Design
When random assignment is not possible, matching can be used to create research
groups. Matching is when matching on certain variables is possible but there is no assurance on
others. As stated earlier, the principal matched using the variables of academic records,
behavioral records, parent requests, gender, and random assignment.

70
Time-series Design
When a researcher wants to use more than a pre-test and a post-test to check for variance
during the course of a study, that researcher could use repeated measures. In this study the
researcher wanted to check for variance between the research groups before the interventions
started, approximately halfway through the interventions, and after the interventions concluded.
Because of these circumstances, a time-series design (Fraenkel & Wallen, 2009) was used in
conjunction with the matching-only pre-test-post-test control group design (Fraenkel & Wallen,
2009). Table 2 shows a representation of the quantitative design.
Table 2
The Matching-Only Pre-test-Post-test Control Group Design
Used in Conjunction with Time-Series Design (Fraenkel & Wallen, 2009)
____________________________________________________________________
Group 1 M O₁ X₁ O₂ X₁ O₃
___________________________________
Group 2 M O₁ X₂ O₂ X₂ O₃ ___________________________________
Control Group M O₁ C O₂ C O₃
____________________________________________________________________
M= subjects in each group have been matched on certain variables; not randomly assigned to the groups
O₁= pre-test, O₂= mid-intervention test, O₃= post-test (O₁ and O₃ are exactly the same tests; O₂ has the exact same
questions as O₁ and O₃ but in a random, rearranged order)
X₁= treatment 1, X₂= treatment 2, C=control group
Instrumentation
With regard to the quantitative portion of this research, the researcher used two different
assessments. The first assessment was a 50-question multiplication exam that used a
combination of two whole numbers, 1-10, to create the equations. This assessment (Appendix

71
A) is the assessment prescribed for use within the Hopscotch Math (Schroeder, 2012) program
for learning multiplication facts. The first assessment was given to all the student subjects,
including the Control group, at the beginning of the research study and before the interventions
began. This assessment was used as the baseline for the quantitative portion of the research.
The same assessment was used at the end of the research study when the interventions had
ended. The second assessment was given halfway through the intervention, approximately four
weeks after the start of the study. The second assessment was also a 50-question multiplication
exam using a combination of two whole numbers, 1-10, to create the equations. It used the exact
same questions as the first and last assessments but the questions were arranged in a different
order. The second assessment was created by the researcher in order to account for any student
who might remember some pattern from the first assessment, which in turn could potentially
contaminate the validity and reliability of the assessments.
Data Collection Procedures
The baseline multiplication facts assessment was given before the interventions began.
Four weeks after the interventions began, the second multiplication facts assessment was given.
Approximately eight weeks after the interventions began, the final assessment (same as the
baseline) was given.
The students took the tests during their normal physical education class. The student subjects
received a multiplication facts test and a pencil and were asked to find a personal space away
from any other student. The students were reminded to look at only their test to assure valid
research results.

72
Validity and Reliability
The multiplication facts assessment (Appendix A) that was used for this study was sent
by the publisher of Hopscotch Math (Interaction Publishers and Social Studies School Service;
Schroeder, 2012) to EdGate Correlation Services, LLC. EdGate utilizes the professional
experience of subject-area experts and controlled vocabulary to align content for each client to
any standard that the client wishes to use for comparison. Similar to the qualitative portion of
this research, EdGate uses credibility to show validity and reliability (Fraenkel & Wallen, 2009).
Credibility with regard to the quantitative portion of this research comes directly from the
subject-area experts hired by EdGate. They are assumed to be the experts in the field and
therefore encompass not only instrument validity and reliability, but internal validity as well
(Fraenkel & Wallen, 2009).
Data Analysis
The multiplication facts pre-intervention, mid-intervention, and post-intervention tests
were analyzed using an ANCOVA through the SAS software program (SAS Institute, 2010).
The results from the analyses are reported in Chapter 4.
Quasi-Experimental Research Design
The ultimate goal of this quasi-experimental research study was for the researcher to find
a holistic description and explanation of the complex phenomenon in question. To do this the
researcher used qualitative and quantitative research methods individually and collectively.

73
Data Collection and Analysis
As previously reported, both the qualitative portion and the quantitative portion of this
quasi-experimental research design have their own instrument to collect data and their own
method for analyzing their specific data. Because of the nature of this particular quasi-
experimental approach, an analysis technique was needed in order to compare both the
qualitative and the quantitative results. The researcher used triangulation through convergence
(Fraenkel & Wallen, 2009) to make this comparison. This process required the researcher to
take the analyzed data from the qualitative portion of the research and the analyzed data from the
quantitative portion of the research and then examine these two analyses collectively to search
for common themes.
Validity and Reliability
To collectively analyze the results of both the qualitative and quantitative results of this
study, the researcher made an assessment of validity through cross-checking (Fraenkel &
Wallen, 2009) sources of information. Cross-checking is a process used within triangulation
through convergence (Fraenkel & Wallen, 2009), as described in previous sections of this paper.
Cross-checking (Fraenkel & Wallen, 2009) involved examining the qualitative results of the
interviews along with the quantitative results of the multiplication facts tests. This approach
helped to confirm (cross-validate) relationships that emerged between the interviews and the
multiplication facts tests, in that a single interpretation of a phenomenon was the result of the
analysis. It must be noted, though, if the relationships did not converge on a single interpretation
of the phenomenon, the reasons for lack of convergence must be reported so that, in the future,

74
they could be investigated. The results from the triangulation through convergence (Fraenkel &
Wallen, 2009) method provided a more encompassing explanation of the complex phenomenon
in question. In Chapter 4, the study results, along with corresponding discussion, are reported
quantitatively through a combination of statistical analyses and qualitatively through narrative
form.
Summary
Through this quasi-experimental study, the researcher aimed to gather a better
understanding of student learning with regard to multiplication facts development. It was the
researcher’s hope that when the quantitative and the qualitative data were analyzed separately, as
well as collectively, a clear understanding would emerge regarding the effectiveness of giving
students extra practice toward learning basic multiplication facts by way of the interdisciplinary
approach to teaching physical education known as Hopscotch Math (Schroeder, 1998). Chapters
4 and 5 will help one to understand the effectiveness of this research and they will also shed light
on the encouraging potential that this research and similar research studies could have on
increasing student learning by using an interdisciplinary approach to teaching physical education.

CHAPTER 4
RESULTS
Introduction
The purpose of this study was to look at the academic effectiveness of teaching students
basic multiplication facts during physical education class through a specific kinesthetic
movement, hopscotching, by using an interdisciplinary approach to teaching physical education
called Hopscotch Math (Schroeder, 1998). Unfortunately, many a student struggles to learn
basic multiplication math facts simply because of the way in which this information is presented.
All students, to some degree, are kinesthetic learners and can learn through movement and
experimentation (Gardner, 1983). Sadly, many students who learn better or best through
movement and experimentation are not given an opportunity to learn in this style, which could
ultimately lead to academic success in the learning of multiplication facts. The researcher
contends that if students are given opportunities to learn basic multiplication facts through the
Hopscotch Math program, then academic success with regard to basic multiplication facts
development will be realized.
The researcher conducted a quasi-experimental study using both qualitative and
quantitative data collection. The researcher quantitatively used a prescribed multiplication and
division fact development program, Hopscotch Math (Schroeder, 1998), which collectively used
student learning logs, flashcard practice, and hopscotching to help with student attainment of

76
multiplication facts knowledge. There were three research groups. One group received the full
intervention. One group received the full intervention less the hopscotching portion, and one
group was the control which received no intervention at all. The quantitative part of this study
used a 50-problem basic multiplication facts test before the interventions began, a 50-problem
multiplication facts test (same questions, but rearranged) mid-intervention, and a 50-problem
basic multiplication facts test (same as the pre-interventions test) following the intervention.
The researcher qualitatively used 3rd-grade teachers as field experts to describe their
observations of their students who were part of this study, during the course of the research
project. These teacher-described observations, recorded in written form by the researcher, were
created through a mid-intervention round-table discussion (interview) and through a post-
intervention round-table discussion (interview). Both round-table discussions were prompted by
the same two questions. The first question was, “What have you noticed with regard to overall
student academic progress with regard to multiplication facts development since the start of this
study?” The second question was, “What attitude or behavioral changes have you noticed with
regard to multiplication facts development since the start of this study?”
Organization of Data Analysis
The quantitative data and analysis of the quantitative data will be presented first. The
qualitative data and the analysis of the qualitative data will be presented second. Lastly, the
combined quantitative and qualitative data and their analyses will be discussed collectively.
The presentation of quantitative data will be performed with descriptive statistics using
tables and narratives to explain the data represented by the tables. Research Question #1 and
77
Research Question #2 are addressed using this presentation. The data that was analyzed comes
directly from three 50-problem basic multiplication facts tests. The publisher of Hopscotch Math
(EdGate Correlation Services; Schroeder, 2012) uses credibility to show the validity and
reliability (Fraenkel & Wallen, 2009) of this 50-problem basic multiplication facts test
(Appendix A). Credibility, in this case, comes directly from the subject-area experts hired by
EdGate. The pre-intervention test and the post-intervention test are exactly the same test. The
mid-intervention test contains the exact problems that exist in the pre- and post-intervention
tests, but the order of the problems was changed. A linear mixed model was used to analyze the
data and to address Research Question #1. This mixed model was used to model the
improvements in the two half-periods. To address Research Question #2 with only one measure
per student, an ANCOVA (analysis of covariance), which is a general linear model blending
ANOVA (analysis of variance) and regression, was used to model the improvement from the
pre-test to the post-test. SAS software (SAS Institute, 2010) was used to analyze data
statistically. Research Questions #1 and #2 are directly related to the null hypothesis and
alternative hypothesis used in this research. Research Question #3 is not.
The presentation of the qualitative data will be performed with descriptive statistics via a
narrative form. Research Question #3 is addressed with this presentation. This narrative will
describe the analysis of the 3rd-grade teacher responses to the mid-intervention and post-
intervention open-ended interview questions. The researcher analyzed this data by looking for
the emergence of common words, thoughts, themes, concepts, and ideas and then coding them
into three different categories. This information will simply be coded as positive, negative, and
neutral. This process is called triangulation through convergence (Fraenkel & Wallen, 2009).
78
The method that was used to show validity and reliability is credibility (Fraenkel & Wallen,
2009), which comes directly from the experts in the field, who in this case were the 3rd-grade
teachers whose students were used as subjects for this research.
The presentation of the combined qualitative and quantitative data will be performed with
descriptive statistics via a narrative form. The researcher analyzed the qualitative data and the
quantitative data collectively by looking for the emergence of common results. This process is
called triangulation through convergence (Fraenkel & Wallen, 2009). No specific research
question or hypothesis is directly related to this presentation.
Research Questions and Associated Hypotheses
This study used three research questions, one null hypothesis, and one alternate
hypothesis to guide the research. Only the first and second research questions were directly
associated to the null hypothesis and alternate hypothesis. Due to the qualitative nature of the
third research question, significance is not able to be determined.
The first research question reads, “Is there a significant difference among 3rd-grade-level
students receiving the Hopscotch Math intervention, 3rd-grade-level students receiving the
Hopscotch Math intervention less the hopscotch portion of the program, and 3rd-grade-level
students in the Control group, when comparing pre-intervention tests, mid-intervention tests, and
post-intervention tests?”
The second research question reads, “Does teaching multiplication facts to 3rd-grade-level
students through the interdisciplinary physical education movement approach to teaching

79
multiplication facts called Hopscotch Math show improvement on the Hopscotch Math
Multiplication Exam compared to a 3rd-grade-level student group receiving the same program,
less the kinesthetic hopscotching component of this program, and a 3rd-grade-level student group
receiving no extra practice (Control group)?”
The third research question reads, “Did the classroom teachers whose students are the
subject of this study notice an atypical increased rate of improvement toward multiplication facts
development?”
The null hypothesis reads, “There is no statistical difference among 3rd-grade-level
students receiving the interventions and 3rd-grade-level students in the Control group, when
comparing pre-intervention tests, mid-intervention tests, and post-intervention tests.” The
alternate hypothesis reads, “There is a statistical difference among 3rd-grade-level students
receiving the interventions and 3rd-grade-level students in the Control group, when comparing
pre-intervention tests, mid-intervention tests, and post-intervention tests.”
Presentation of Descriptive Characteristics with Analysis of Data
The researcher will break down and discuss the results of the analysis of the research data
as it pertains to each research question. The discussion of the demographic data will be in
narrative and in table form. The researcher will disclose the type of statistical analysis that was
utilized for each research question, followed by a discussion of the relationship between each
research question and its related hypothesis, if there was a related hypothesis. Ultimately, a
discussion will be given which reviews the resulting data from the statistical analysis pertaining

80
to that particular research question and if these results either support rejection or retention of the
related hypothesis, if there was a related hypothesis.
Demographics
There were 68 third-grade student subjects at the start of this research. Of these 68
students, 31 came from two bilingual classes and 37 came from two English-speaking
classrooms. The intervention group that received the full intervention consisted of 10 bilingual
students and 13 English-speaking students. The intervention group that received the full
intervention, less the hopscotching portion, consisted of 10 bilingual students and 12 English-
speaking students. This number changed after the pre-intervention test. One student moved and
did not take the mid-intervention test or the post-intervention test. Another student took the mid-
intervention test but not the post-intervention test. The student that took only the pre-
intervention test was female and from the bilingual classroom. The student that missed only the
post-intervention test was male and from the bilingual classroom. The Control group consisted
of 11 bilingual students and 12 English-speaking students.
The Full intervention group consisted of 12 female students and 11 male students.
Within this group, 5 female students came from a bilingual classroom and 7 female students
came from an English-speaking classroom. Within this same group, 5 male students came from
a bilingual classroom and 6 male students came from an English-speaking classroom.
The full intervention group, less hopscotching, consisted of 11 female students and 11
male students. Within this group, 4 female students came from a bilingual classroom and 7
female students came from an English-speaking classroom. Within this same group, 6 male

81
students came from a bilingual classroom and 5 male students came from an English-speaking
classroom.
The Control group consisted of 10 female students and 13 male students. Within this
group, 4 female students came from a bilingual classroom and 6 female students came from an
English-speaking classroom. Within this same group, 7 male students came from a bilingual
classroom and 6 male students came from an English-speaking classroom.
There were four classrooms and four classroom teachers involved in this research. Two
teachers came from bilingual classrooms and two teachers came from English-speaking
classrooms. The classroom receiving the full intervention came to physical education class from
9:00 a.m. until 9:30 a.m. The full intervention group, less hopscotching, came to physical
education class from 9:30 a.m. until 10:00 a.m. The Control group came to physical education
class from 9:30 a.m. until 10:00 a.m.
One bilingual teacher was in her 19th year of teaching, all of which had been as a
bilingual teacher, but this was her first year at the 3rd-grade level. The other bilingual teacher
was in her 2nd year of teaching, all of which had been as a bilingual teacher and all of which had
been at the 3rd-grade level. One English-speaking classroom teacher was in her 22nd year of
teaching, all of which had been as an English-speaking classroom teacher. It was her 5th year of
teaching at the 3rd-grade level. The other English-speaking classroom teacher was in her 21st
year of teaching, all of which had been as an English-speaking classroom teacher. It was her 4th
year of teaching at the 3rd-grade level.
.

82
Research Question #1
Essentially, this question asks if there are any improvements of the intervention scores
over time, specifically over two separate time periods; and, are there any differences amongst the
intervention groups. One must disclose all variables in order to account for baseline differences.
This is why we get a beginning score and this is what accounts for differences in scores at the
beginning. After this, comparisons can be done with people of the same profile. The
independent variables/covariates were: period (1 or 2), beginning score (start of research),
gender (male or female), classroom type (English/bilingual), and intervention group (Control,
Full, Less Hopscotching). The dependent variable was the difference in score of the 50-problem
basic multiplication facts test when looking at individual independent variables.
To help clarify, Period 1 is the time period from the baseline test to the mid-intervention
test and Period 2 is the time period from the mid-intervention test to the post-intervention test.
Periods 1 and 2 are ½ periods. For Period 1, the baseline score is the score from the beginning of
the research and the mid-intervention score is the score used to compare to the baseline score to
note differences in scores. For Period 2, the baseline score is the mid-intervention score and the
post-intervention score is the score used to compare to the baseline score (mid-intervention) to
note differences in scores. The results discussion to follow shows the results from both ½ terms.
There was a test for interaction between Periods 1 and 2 and the three intervention groups
(Control, Full, and Less Hopscotching). This was done through regression analysis using SAS
software (SAS Institute, 2010). This test for interaction showed no significance, meaning that
the treatment difference is the same for both periods. In other words, this analysis seems to

83
indicate the interventions worked the same (were consistent) with Period 1 as with Period 2;
hence, only Period 2 data will be discussed with the assumption that Period 1 represents the same
results.
Since scores are quantitative and there are two periods of measurement for the same
student, a mixed model was used with repeated observations for the students. Also, the
researcher specifies a compound symmetry (CS) structure for the covariance matrix. A
compound symmetry structure is commonly used in the analysis of repeated measures, which
this research has. It is also a covariance matrix where it is assumed that the variance is the same
for the two periods. The repeated part is due to the fact that each student has two observations.
In addition, since there are 3 three missing observations, meaning some of the students only have
one improvement score (e.g., Period 2 improvement score is missing), a mixed model has the
ability to deal with these missing data.
Covariance Parameter Estimates
Table 3 shows the estimated covariance parameters for the Period 1 and Period 2
improvements. The covariance was obtained from the linear mixed model using SAS software
(SAS Institute, 2010).
This particular parameter gives a covariance matrix of [34.7 −5.4−5.4 34.7
]. This means the
correlation coefficient for the improvement in the two periods is negative. A negative parameter
means students who have a larger average improvement in Period 1 have a smaller improvement

84
in Period 2. This makes sense because the closer one’s score is to 50 (maximum score), the less
room there is for improvement.
Table 3
Covariance Parameter Estimates
Covariance Parameter Estimates
Covariance Parameter Subject Estimate
Compound Symmetry (CS) Student Number -5.4372
Residual 40.1635
Type 3 Tests of Fixed Effects
Table 4 shows the significance (p-value) of each of the fixed effects. The researcher used
SAS software to help analyze the data (SAS Institute, 2010).
To clarify, the f-value (ratio of two mean square values) is the sum of squares of the
numerator divided by the sum of squares of the denominator and is used as the standard one
compares to. The p-value is the value that shows if there is significance or not. The value is
used broadly to show significance is .05 or smaller, meaning that if the null hypothesis is true,
there is only a 5% chance of observing the current data. The p-value for Period is 0.0136, so the

85
period is significant in explaining the improvement. Period 1 has a higher improvement than
Period 2, but the effect of the intervention group (difference between any of the two groups) is
the same for Period 1 and Period 2 (since an earlier test on the interaction term is not significant).
The p-value for Gender is 0.8452 and hence is not significant in explaining improvement. The p-
value for Classroom Type is 0.5120 and hence is not significant in explaining improvement. The
p-value for Intervention Group is 0.0556, which is slightly greater than 0.05, hence is
approaching significance with regard to explaining the improvement.
Table 4
Type 3 Tests of Fixed Effects
Type 3 Tests of Fixed Effects
Effect
Numerator
Degrees of Freedom
Denominator
Degrees of Freedom
F-Value
Pr>F
(p-value)
Period 1 59.3 6.47 0.0136
Beginning Score 1 62.7 35.56 <.0001
Gender 1 50.2 0.04 0.8452
Classroom Type 1 51.5 0.44 0.5120
Intervention Group 2 49 3.07 0.0556

86
Solution for Fixed Effects
Table 5, in addition to p-values, gives the estimated differences (Estimate column) for
each of the variables. The researcher used SAS software to help analyze the data (SAS Institute,
2010).
Important data from this table can be used to show the effectiveness of the interventions.
It is important to note that the Less Hopscotching intervention group is used as the baseline
group for comparative reasons via SAS software (SAS Institute, 2010), the statistical analysis
software used in this research. Ideally, one would want the Estimate, which is the score
difference between Period 1 and Period 2, to be high and the Standard Error, which is the
variability in the Estimate, otherwise known as “noise,” to be small. The p-value (significance)
is based on the ratio of these two. If the ratio is large, then the result is good.
For Period 1, the parameter Estimate is 2.8597, so there is less scope of improvement
(2.8597 less) in Period 2 than in Period 1. This is significant, showing a value of 0.0136. The
parameter Estimate corresponding to Beginning Score is -0.2470, which is obviously negative,
so there is less scope of improvement for students with a higher beginning score. For example, if
one’s beginning score out of 50 was 37, then, on average, one scoring 36 on the beginning score
will have an improvement of 0.2470 points more than one scoring 37; and, one scoring 38 on the
beginning score will have .2470 points less improvement than one scoring 37. This 0.2470
figure is consistent as scores increase or decrease by one on the beginning score.

87
Table 5
Solution for Fixed Effects
Solution for Fixed Effects
Effect
Gender
Classroom Type
Intervention Group
Period
Estimate
Standard Error
DF
t Value
Pr>|t|
Intercept 10.7191 2.0851 67.6 5.14 <.0001
Period 1 2.8597 1.1245 59.3 2.54 0.0136
Period 2 0 . . . .
Beginning Score -0.2470 0.04142 62.7 -5.96 <.0001
Gender F 0.1938 0.9876 50.2 0.20 0.8452
Gender M 0 . . . .
Classroom Type Bilingual-
Spanish
-0.6843 1.0363 51.5 -0.66 0.5120
Classroom Type English 0 . . . .
Intervention Group Control -1.8406 1.1674 49.2 -1.58 0.1213
Intervention Group Full Intervention
0.9307 1.1700 49.4 0.80 0.4301
Intervention Group Less
Hopscotching
0 . . . .
There was a difference between the Less Hopscotching intervention group and the
Control intervention group. The Less Hopscotching intervention group showed more scope of
improvement (1.8406 points) when compared to the Control group, but the p-value was 0.1213,
and thus not significant. There was also a difference between the Less Hopscotching
intervention group and the Full intervention group. The Full Intervention group showed more
scope of improvement (0.9307 points) than the Less Hopscotching intervention group, but the p-

88
value was 0.4301, and thus not significant. Regarding the other two Effect comparisons, Gender
and Classroom Type, no significance was shown.
Least Squares Means
Table 6 is used only to compare average improvement scores between Period 1 and
Period 2 for all the Effect variables. All other data, including p-values, are for testing whether
the average for each group is zero and thus are not useful for the main analysis. The researcher
used SAS software (SAS Institute, 2010) to help analyze the data.
Overall, the Estimate (average improvement score) corresponding to Period 1 was 5.2439
points and the Estimate corresponding to Period 2 was 2.3843 points. As expected, the
improvement in Period 1 was greater than in Period 2. The Estimate corresponding to the Full
intervention group was 5.0481. The Estimate corresponding to the Less Hopscotching
intervention group was 4.1174. The Estimate corresponding to the Control group was 2.2768.
Differences of Least Squares Means
Table 7 displays the results of each compared Effect by showing each comparison’s
difference of improvement between Period 1 and Period 2. The researcher used SAS software
(SAS Institute, 2010) to help analyze the data.
When looking at the Effect comparison between Gender M and Gender F, and when
looking at the Effect comparison between Classroom Type Bilingual-Spanish and Classroom
Type English, the difference of improvements did not show significance (p-values of 0.8452 and
0.5120, respectively).

89
When looking at the pairwise Effect comparisons between the three Intervention Groups:
Control group and Full intervention group, Control group and Less Hopscotching intervention
group, and Full intervention group and Less Hopscotching intervention group, only the Control
group and Full intervention group comparison showed significance, with a p-value less than
0.05. The p-value of this comparison was 0.0186. The p-value of the Control group and Less
Hopscotching intervention group comparison was 0.1213 and the p-value of the Full intervention
group and Less Hopscotching intervention group comparison was 0.4301.
Table 6
Least Squares Means
Least Squares Means
Effect Gender Classroom
Type
Intervention Group Period Estimate Standard
Error
DF t Value Pr>|t|
Period 1 5.2439 0.7369 125 7.12 <.0001
Period 2 2.3843 0.7349 125 3.24 0.0015
Gender F 3.9110 0.7021 50.6 5.57 <.0001
Gender M 3.7172 0.6675 48.7 5.57 <.0001
Classroom Type Bilingual (Sp) 3.4719 0.7478 51.3 4.64 <.0001
Classroom Type English 4.1562 0.6546 49.3 6.35 <.0001
Intervention Group
Control 2.2768 0.8036 48.5 2.83 0.0067
Intervention Group
Full Intervention 5.0481 0.8020 48.5 6.29 <.0001
Intervention
Group
Less Hopscotching 4.1174 0.8540 50.2 4.82 <.0001

90
Table 7
Differences of Least Squares Means
Differences of Least Squares Means
Effect Gender Classroom
Type
Intervention
Group
Period Gender Classroom
Type
Intervention
Group
Period Estimate Standard
Error
DF t
Value
Pr > |t|
Period 1 2 2.8597 1.1245 59.3 2.54 0.0136
Gender F M 0.1938 0.9876 50.2 0.20 0.8452
Classroom
Type
Bilingual-
Spanish
English -0.6843 1.0363 51.5 -0.66 0.5120
Intervention
Group
Control Full
Intervention
-2.7713 1.1380 48.6 -2.44 0.0186
Intervention
Group
Control Less
Hopscotching
-1.8406 1.1674 49.2 -1.58 0.1213
Intervention
Group
Full
Intervention
Less
Hopscotching
0.9307 1.1700 49.4 0.80 0.4301

91
Checking for Model Assumptions
Figure 1 shows four charts that check for normality. If results of a study show that an
assumption(s) was met, then normality is present. The researcher used SAS software (SAS
Institute, 2010) to help analyze the data. The researcher also checked for model assumptions.
Figure 1 shows the results of this check. The residual plot displayed in Figure 1 visually and
numerically shows that the model satisfied the desired assumptions. The residuals (difference of
observed and predicted from model) seem to follow a normal distribution; therefore, the model
assumption is good.
Average Scores, Score Changes, and Standard Deviation on Basic Multiplication Facts Tests
Figure 2 displays the average scores of all three research groups (Control group, Less
Hopscotching intervention group, and Full intervention group) on all three 50-question basic
multiplication facts tests (pre-intervention, mid-intervention, and post-intervention). It displays
the score changes from the pre-intervention test to the mid-intervention test (Period 1) for all
three research groups. It displays the score change from the mid-intervention to the post-
intervention test (Period 2) for all three research groups. It also displays the score changes from
the pre-intervention test to the post-intervention test for all three research groups. The letter “n”
represents the number of subjects within each group. The letters “SD” represent the standard
deviation.
The following discussion is written to describe the results displayed in Figure 2. The
average score for the Control group on the pre-intervention multiplication facts test was 29.174
problems correct out of 50 (n= 23; SD= 14.057). The average score for the Less Hopscotching

92
Figure 1. Residuals for difference.

93
Figure 2. Results of the multiplication facts tests for all groups.
29.174
31.913
34.217
26.818
34.61935.65
29.304
37.17438.652
0
5
10
15
20
25
30
35
40
45
Pre-Intervention Mid-Intervention Post-Intervention
Sco
re o
ut
of
50
Test
Results of the 50-Question Basic Multiplication Facts Tests
Control
Less Hopscotching
Full Intervention
n= number of subjects
SD= standard deviation
Score Changes: Pre- to Post-
+5.043 +8.832 +9.348 +2.739 +7.801 +7.869
Period 1
Period 2
+2.304 +1.031 +1.479
Period 2 Score Changes:
Mid- to Post-
Period 1 Score Changes: Pre- to Mid-

94
intervention group on the pre-intervention multiplication facts test was 26.818 out of 50 (n=22;
SD= 16.329). The average score for the Full intervention group on the pre-intervention
multiplication facts test was 29.304 out of 50 (n= 23; SD=13.333).
The average score for the Control group on the mid-intervention multiplication facts test
was 31.913 out of 50 (n=23; SD= 11.098). The average score for the Less Hopscotching
intervention group on the mid-intervention multiplication facts test was 34.619 out of 50 (n=21;
SD= 14.365). The average score for the Full intervention group on the mid-intervention
multiplication facts test was 37.174 out of 50 (n=23; SD= 7.667).
The average score for the Control group on the post-intervention multiplication facts test
was 34.217 out of 50 (n= 23; SD= 10.904). The average score for the Less Hopscotching
intervention group on the post-intervention multiplication facts test was 35.650 out of 50 (n= 20;
SD= 14.328). The average score for the Full intervention group on the post-intervention
multiplication facts test was 38.652 out of 50 (n= 23; SD=8.653).
The mean score of improvement for the Control group for Period 1 (pre-intervention to
mid-intervention) was 2.739 points. The mean score of improvement for the Less Hopscotching
intervention group for Period 1 was 7.801points. The mean score of improvement for the Full
intervention group for Period 1 was 7.869 points.
The mean score of improvement for the Control group for Period 2 (mid-intervention to
post-intervention) was 2.304 points. The mean score of improvement for the Less Hopscotching
intervention group was 1.031points. The mean score of improvement for the Full intervention
group was 1.479 points.

95
The mean score of improvement for the Control group from the pre-intervention 50-
questions multiplication facts test to the post-intervention 50-questions multiplication facts test
was 5.043 points. The means scores of improvement for Less Hopscotching intervention group
and the Full intervention group, respectively, were 8.832 and 9.348.
The researcher calculated effect sizes to help determine student academic gain due to
particular interventions by doing pairwise comparisons of both intervention groups and the
Control group. The researcher used the data from Table 7 (Differences in Least Squares Means)
and inserted this data into the formula 𝑟 = √𝑡2
(𝑡2+𝑑𝑓)⁄ to calculate effects sizes. This is a
Pearson’s r, but in ANCOVA it is calculated differently than the correlation for two continuous
variables (SAS Institute, 2010). In this analysis, the pre-intervention scores were compared to
the post-intervention scores.
The effect size corresponding to the Control group versus the Less Hopscotching
intervention group when using the formula r=square root of ((-1.58) ^2)/ ((-1.58) ^2+49.2) was
0.2197. The effect size corresponding to the Control group versus the Full intervention group
when using the formula r=square root of ((-2.44) ^2)/ ((-2.44) ^2+48.6) was 0.3304. The effect
size corresponding to the Full intervention group versus the Less Hopscotching intervention
group when using the formula r=square root of ((0.80) ^2)/ ((0.80^2+49.4) was 0.1131. With
regard to effect sizes when using Pearson’s r, a value of 0.10 up to a value of 0.29 is widely
viewed to be a small effect size (Cohen, 1988). A value of 0.30 up to a value of 0.49 is widely
viewed to be a medium effect size (Cohen, 1988). A value of 0.50 and above is widely viewed
to be a large effect size (Cohen, 1988). That being said, the Full intervention group, when

96
compared to the Control group, showed a medium effect size (r=0.3304). This comparison
showed the largest effect size. The Less Hopscotching intervention group, when compared to the
Control group, showed a small effect size (r=0.2197). The Full intervention group, when
compared to the Less Hopscotching intervention group, showed a small effect size (r=0.1131).
Due to the small and medium effect sizes found, the power analysis of .55 is not sufficient to
assert the validity of the null hypothesis as power is not equal to or great than .80 (Cohen, 1988).
Discussion of Findings Regarding Research Question #1
The results with regard to Research Question #1 provide valuable information. Figure 2
shows the results of the mid-intervention test and the post-intervention test taken by all three
research groups. Regarding Period 1 (pre-intervention to mid-intervention) mean improvement
scores, the Control group improved 2.739 points, the Less Hopscotching intervention group
improved 7.801 points, and the Full intervention group improved 7.869 points. Regarding
Period 2 (mid-intervention to post-intervention) mean improvement scores, the Control group
improved 2.304 points, the Less Hopscotching intervention group improved 1.031 points, and the
Full intervention group improved 1.479.
When pairwise comparisons from Table 7 were made between the three intervention
groups relative to mean improvement scores, the only comparison that showed significance
(p=0.0186) was between the Control group and the Full intervention group. When effects sizes
were calculated, the highest effect size was from the comparison between the Full intervention
group and the Control group (r=0.3304). This effect size value showed a medium effect size,
which would need to be at least 0.30 (Cohen, 1988) to be categorized as a medium effect size.

97
According to Fraenkel and Wallen (2009), effect size is a useful tool when one wants to assess
the magnitude of a difference between the means of two groups, but it does not, in and of itself,
answer the question of how large this difference must be in order to be considered important.
This is why this researcher reported means and significance results to help better understand the
overall outcomes of this research study. That being said, the data results analyzed regarding
Research Question #1 seem to indicate that there is significant mean score improvement over
time (Period 1 and Period 2) when comparing the Control group to the Full intervention group.
Hence, one rejects the null hypothesis when looking at this particular comparison. All other
comparisons, pairwise, failed to reject the null hypothesis.
Research Question #2
Essentially, this question seeks to compare the improvement in scores of all three
intervention groups when comparing the results of each group’s pre-intervention 50-problem
multiplication test to each group’s post-intervention 50-problem multiplication test.
One must disclose all variables in order to account for baseline differences. This is why
we get a baseline score and this is what accounts for differences in scores of the pre-intervention
multiplication test. After this, comparisons can be done with people of the same profile. The
independent variables/covariates were: baseline score (start of research), gender (male or
female), classroom type (English/bilingual), and intervention group (Control, Full, Less
Hopscotching). The dependent variable was the difference in score of the 50-problem basic
multiplication facts test when looking at individual independent variables. Because there is only

98
one quantitative measure for each student, an ANCOVA was used to analyze the results (SAS
Institute, 2010).
Type 3 Tests of Fixed Effects
Table 8 shows the significance (p-value) of each of the fixed effects. The researcher used
SAS software (SAS Institute, 2010) to help analyze the data.
Table 8
Type 3 Tests of Fixed Effects
Type 3 Tests of Fixed Effects
Effect
Numerator
Degrees of Freedom
Denominator
Degrees of Freedom
F-Value
Pr>F
(p-value)
Baseline Score 1 60 34.49 <.0001
Gender 1 60 0.23 0.6301
Classroom Type 1 60 0.26 0.6104
Intervention Group 2 60 2.63 0.0807
To clarify, the f-value (ratio of two mean square values) is the sum of squares of the
numerator divided by the sum of squares of the denominator and is used as the standard one
compares to. The p-value is the value that shows if there is significance or not. The value to
show significance is .05 or smaller, meaning that if the null hypothesis is true, there is only a 5%
chance of observing the current data. The p-value for Gender is 0.6301 and hence is not
significant in explaining improvement. The p-value for Classroom Type is 0.6104 and hence is

99
not significant in explaining improvement. The p-value for Intervention Group is 0.0807, which
is slightly greater than 0.05, so is close to significant in explaining the improvement.
Solution for Fixed Effects
Table 9, in addition to p-values, gives what the estimated differences (Estimate column)
are for each of the variables. The researcher used SAS software (SAS Institute, 2010) to help
analyze the data.
Table 9
Solution for Fixed Effects
Solution for Fixed Effects
Effect Gender Classroom
Type
Intervention
Group
Estimate Standard
Error
DF t Value Pr>|t|
Intercept 18.4806 2.8401 60 6.51 <.0001
Baseline Score -0.3620 0.06165 60 -5.87 <.0001
Gender F 0.8030 1.6587 60 0.48 0.6301
Gender M 0 . . . .
Classroom Type Bilingual-
Spanish
-0.9040 1.7650 60 -0.51 0.6104
Classroom Type English 0 . . . .
Intervention Group Control -2.7921 1.9551 60 -1.43 0.1584
Intervention Group Full Intervention 1.4504 1.9521 60 0.74 0.4604
Intervention Group Less Hopscotching 0 . . . .
Important data from this table can be used to show the effectiveness of the interventions.
It is important to note that the Less Hopscotching intervention group is used as the baseline

100
group for comparative reasons via SAS (SAS Institute, 2010), the statistical analysis software
used in this study.
The parameter Estimate corresponding to Baseline Score is -0.3620, which is obviously
negative, so there is less scope of improvement for students with a higher beginning score. For
example, if one’s baseline score out of 50 was 37, then, on average, one scoring 36 on the
Baseline Score will have an improvement of 0.3620 points more than one scoring 37; and, one
scoring 38 on the Baseline Score will have 0.3620 points less improvement than one scoring 37.
This 0.3620 figure is consistent as scores increase or decrease by one on the Baseline Score.
Figure 3 shows that there was a difference in mean improvement scores between the Less
Hopscotching intervention group and the Control group. The Less Hopscotching intervention
group showed more scope of improvement (2.7921 points) when compared to the Control group,
but the p-value was 0.1584, and thus not significant. There was also a difference between the
Less Hopscotching intervention group and the Full intervention group. The Full intervention
group showed more scope of improvement (1.4504 points) than the Less Hopscotching
intervention group, but the p-value was 0.4604, and thus not significant. Regarding the other
two Effect comparisons, Gender and Classroom Type, no significance was shown.
Least Squares Means
Table 10 is used only to compare average improvement scores between the Baseline
Score (pre-intervention) and the Post-Intervention Score. All other data, including p-values, are
not useful for the main analysis. The researcher used SAS software (SAS Institute, 2010) to help
analyze the data.

101
Table 10
Least Squares Means
Least Squares Means
Effect Gender Classroom
Type
Intervention Group Estimate Standard
Error
DF t Value Pr>|t|
Gender F 8.0610 1.1838 60 6.81 <.0001
Gender M 7.2580 1.1094 60 6.54 <.0001
Classroom Type Bilingual (Sp) 7.2075 1.2707 60 5.67 <.0001
Classroom Type English 8.1115 1.0952 60 7.41 <.0001
Intervention
Group
Control 5.3147 1.3291 60 4.00 0.0002
Intervention
Group
Full Intervention 9.5571 1.3285 60 7.19 <.0001
Intervention Group
Less Hopscotching 8.1068 1.4402 60 5.63 <.0001
The Estimate corresponding to the Full intervention group was 9.5571. The Estimate
corresponding to the Less Hopscotching intervention group was 8.1068. The Estimate
corresponding to the Control group was 5.3147. These Estimate figures show the amount of
improvement from the Baseline Score to the Post-Intervention Score for each Intervention
Group. These Estimate numbers indicate that the Full intervention group had the greatest score
improvement during this period, the Less Hopscotching intervention group had the next best
improvement score, and the Control group had the least score improvement of the three groups
analyzed.

102
Differences of Least Squares Means
Table 11 displays the results of each compared Effect by showing each comparison’s
difference of improvement between the Baseline Score (pre-interventions) and the Post-
Intervention Score. The researcher used SAS software (SAS Institute, 2010) to help analyze the
data.
Table 11
Differences of Least Squares Means
Differences of Least Squares Means
Effect Gender Classroom
Type
Intervention
Group
Gender Classroom
Type
Intervention
Group
Estimate Standard
Error
DF T
Value
Pr > |t|
Gender F M 0.8030 1.6587 60 0.48 0.6301
Classroom
Type
Bilingual-
Spanish
English -0.9040 1.7650 60 -0.51 0.6104
Intervention
Group
Control Full
Intervention
-4.2424 1.8786 60 -2.26 0.0276
Intervention
Group
Control Less
Hopscotching
-2.7921 1.9551 60 -1.43 0.1584
Intervention Group
Full Intervention
Less Hopscotching
1.4504 1.9521 60 .074 0.4604
When looking at the Effect comparison between Gender M and Gender F, and when
looking at the Effect comparison between Classroom Type Bilingual-Spanish and Classroom
Type English, the difference of improvements did not show significance (p-values of 0.6301 and
0.6104, respectively).
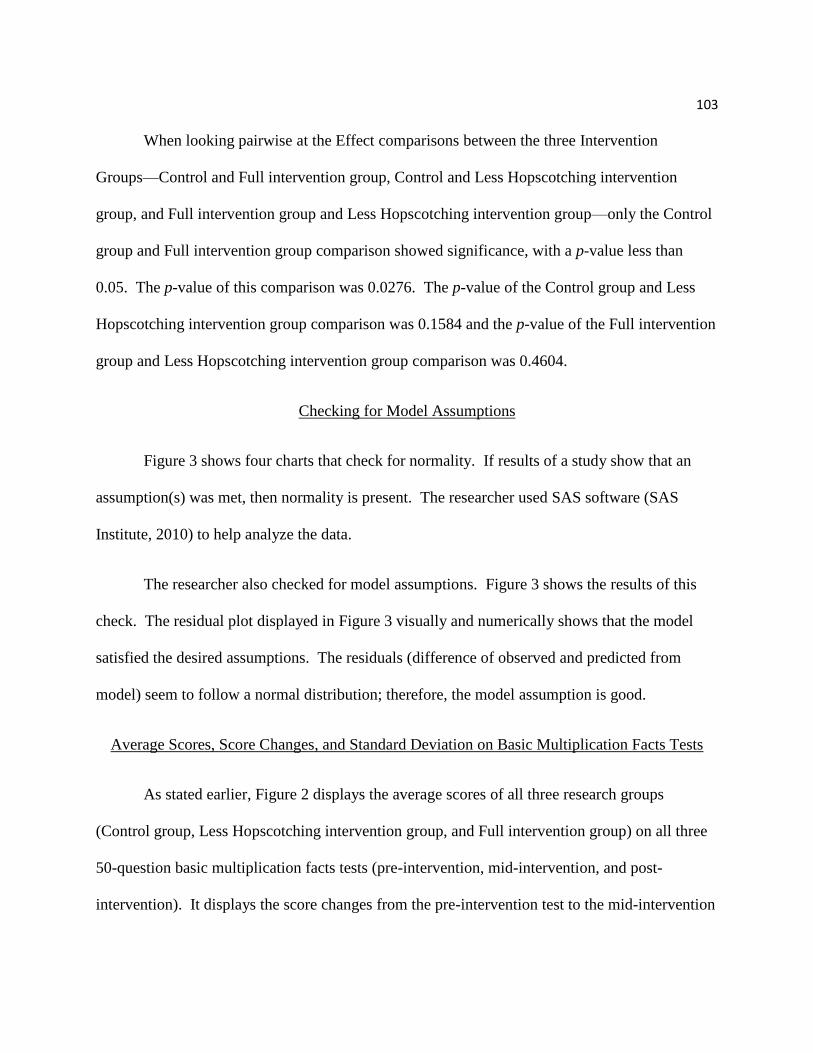
103
When looking pairwise at the Effect comparisons between the three Intervention
Groups—Control and Full intervention group, Control and Less Hopscotching intervention
group, and Full intervention group and Less Hopscotching intervention group—only the Control
group and Full intervention group comparison showed significance, with a p-value less than
0.05. The p-value of this comparison was 0.0276. The p-value of the Control group and Less
Hopscotching intervention group comparison was 0.1584 and the p-value of the Full intervention
group and Less Hopscotching intervention group comparison was 0.4604.
Checking for Model Assumptions
Figure 3 shows four charts that check for normality. If results of a study show that an
assumption(s) was met, then normality is present. The researcher used SAS software (SAS
Institute, 2010) to help analyze the data.
The researcher also checked for model assumptions. Figure 3 shows the results of this
check. The residual plot displayed in Figure 3 visually and numerically shows that the model
satisfied the desired assumptions. The residuals (difference of observed and predicted from
model) seem to follow a normal distribution; therefore, the model assumption is good.
Average Scores, Score Changes, and Standard Deviation on Basic Multiplication Facts Tests
As stated earlier, Figure 2 displays the average scores of all three research groups
(Control group, Less Hopscotching intervention group, and Full intervention group) on all three
50-question basic multiplication facts tests (pre-intervention, mid-intervention, and post-
intervention). It displays the score changes from the pre-intervention test to the mid-intervention

104
test (Period 1) for all three research groups. It displays the score change from the mid-
intervention to the post-intervention test (Period 2) for all three research groups. It also displays
the score changes from the pre-intervention test to the post-intervention test for all three research
groups. The letter “n” represents the number of subjects within each group. The letters “SD”
represent the standard deviation.
Figure 3. Residuals for overall difference.
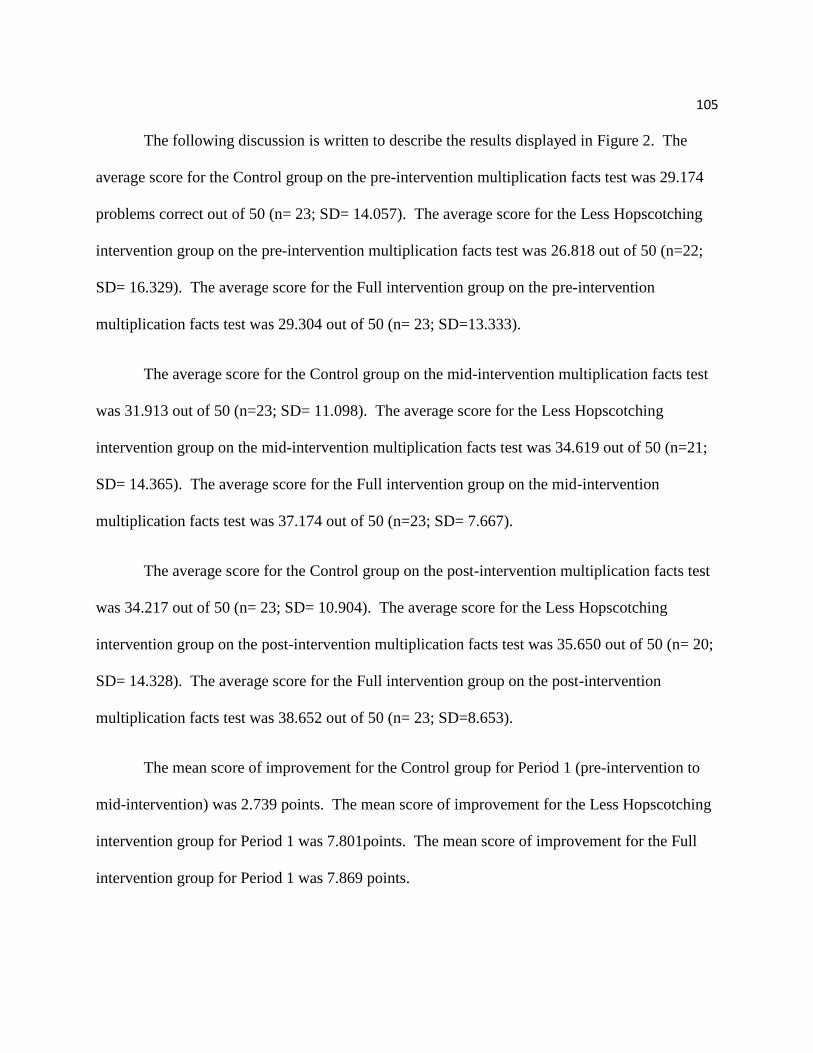
105
The following discussion is written to describe the results displayed in Figure 2. The
average score for the Control group on the pre-intervention multiplication facts test was 29.174
problems correct out of 50 (n= 23; SD= 14.057). The average score for the Less Hopscotching
intervention group on the pre-intervention multiplication facts test was 26.818 out of 50 (n=22;
SD= 16.329). The average score for the Full intervention group on the pre-intervention
multiplication facts test was 29.304 out of 50 (n= 23; SD=13.333).
The average score for the Control group on the mid-intervention multiplication facts test
was 31.913 out of 50 (n=23; SD= 11.098). The average score for the Less Hopscotching
intervention group on the mid-intervention multiplication facts test was 34.619 out of 50 (n=21;
SD= 14.365). The average score for the Full intervention group on the mid-intervention
multiplication facts test was 37.174 out of 50 (n=23; SD= 7.667).
The average score for the Control group on the post-intervention multiplication facts test
was 34.217 out of 50 (n= 23; SD= 10.904). The average score for the Less Hopscotching
intervention group on the post-intervention multiplication facts test was 35.650 out of 50 (n= 20;
SD= 14.328). The average score for the Full intervention group on the post-intervention
multiplication facts test was 38.652 out of 50 (n= 23; SD=8.653).
The mean score of improvement for the Control group for Period 1 (pre-intervention to
mid-intervention) was 2.739 points. The mean score of improvement for the Less Hopscotching
intervention group for Period 1 was 7.801points. The mean score of improvement for the Full
intervention group for Period 1 was 7.869 points.

106
The mean score of improvement for the Control group for Period 2 (mid-intervention to
post-intervention) was 2.304 points. The mean score of improvement for the Less Hopscotching
intervention group was 1.031points. The mean score of improvement for the Full intervention
group was 1.479 points.
The mean score of improvement for the Control group from the pre-intervention 50-
questions multiplication facts test to the post-intervention 50-questions multiplication facts test
was 5.043 points. The means scores of improvement for Less Hopscotching intervention group
and the Full intervention group, respectively, were 8.832 and 9.348.
The researcher calculated effect sizes to help determine student academic gain due to
particular interventions by doing pairwise comparisons of both intervention groups and the
Control group. The researcher used the data from Table 11 (Differences in Least Squares
Means) and inserted this data into the formula 𝑟 = √𝑡2
(𝑡2+𝑑𝑓)⁄ to calculate effects sizes. This
is a Pearson’s r, but in ANCOVA it is calculated differently than the correlation for two
continuous variables (SAS Institute, 2010). In this analysis, the pre-intervention scores were
compared to the post-intervention scores.
The effect size corresponding to the Control group versus the Less Hopscotching
intervention group when using the formula r=square root of ((-1.43) ^2)/ ((-1.43) ^2+60) was
0.1815. The effect size corresponding to the Control group versus the Full intervention group
when using the formula r=square root of ((-2.26) ^2)/ ((-2.26) ^2+60) was 0.2801. The effect

107
size corresponding to the Full intervention group versus the Less Hopscotching intervention
group when using the formula r=square root of ((0.74) ^2)/ ((0.74^2+60) was 0.0951.
With regard to effect sizes when using Pearson’s r, a value of 0.10 up to a value of 0.29 is
widely viewed to be a small effect size (Cohen, 1988). A value of 0.30 up to a value of 0.49 is
widely viewed to be a medium effect size (Cohen, 1988). A value of 0.50 and above is widely
viewed to be a large effect size (Cohen, 1988). That being said, the Full intervention group,
when compared to the Control group, showed a small effect size (0.2801). This comparison
showed the largest effect size of all the pairwise comparisons. The Less Hopscotching
intervention group, when compared to the Control group, showed a small effect size (0.1815).
The Full intervention group, when compared to the Less Hopscotching intervention group,
showed a small effect size (0.0951). Due to the small and medium effect sizes found, the power
analysis of .55 is not sufficient to assert the validity of the null hypothesis as power is not equal
to or great than .80 (Cohen, 1988).
Discussion of Findings Regarding Research Question #2
The results with regard to Research Question #2 provide valuable information. Figure 2
shows the results of the pre-intervention test and the post-intervention test taken by all three
research groups. Regarding this intervention period (pre-intervention to post-intervention), the
mean improvement scores of the Control group improved 5.043 points, the Less Hopscotching
intervention group improved 8.832 points, and the Full intervention group improved 9.348
points.

108
When pairwise comparisons from Table 11 were made between the three intervention
groups relative to mean improvement scores, the only comparison that showed significance
(p=0.0276) was between the Control group and the Full intervention group. When effects sizes
were calculated, the highest effect size was from the comparison between the Full intervention
group and the Control group (0.2801). This effect size value nearly showed a medium effect
size, which would need to be at least 0.30 (Cohen, 1988). According to Fraenkel and Wallen
(2009), effect size is a useful tool when one wants to assess the magnitude of a difference
between the means of two groups, but it does not, in and of itself, answer the question of how
large this difference must be in order to be considered important. This is why this researcher
reported means and significance results to help better understand the overall outcomes of this
research study. That being said, the data results analyzed regarding Research Question #2 seem
to indicate that there is significant improvement over the intervention time period that was from
the pre-intervention multiplication facts test until the post-intervention multiplication facts test.
Hence, one rejects the null hypothesis when looking at this particular comparison. All other
comparisons, pairwise, failed to reject the null hypothesis.
Research Question #3
Research Question #3: Did the classroom teachers whose students are the subject of this
study notice an atypical increased rate of improvement toward multiplication facts development?
Though this question seeks to gain insight toward academic progress, the researcher, as part of
the qualitative portion of this research, also includes insight toward student behavioral attitudes,
as it relates to learning multiplication facts. This behavioral information, along with the

109
academic information, will be described via the results of two separate interviews which were
conducted with the 3rd-grade teachers whose students were the subjects of this research study.
The presentation of the qualitative data will be performed with descriptive statistics via a
narrative form. This narrative will describe the analysis of the 3rd-grade teacher responses to the
mid-intervention and post-intervention open-ended interview questions. The researcher analyzed
this data by looking for the emergence of common words, thoughts, themes, concepts, and ideas.
This information was simply coded as positive, negative, and neutral. This process is called
triangulation through convergence (Fraenkel & Wallen, 2009). The method that was used to
show validity and reliability is credibility (Fraenkel & Wallen, 2009), which comes directly from
the experts in the field, which in this case were the 3rd-grade teachers whose students were used
as subjects for this research study.
The four 3rd-grade classroom teachers who were part of this research were asked two
questions approximately 4 weeks into the intervention and they were also asked the same
questions after the 8-week intervention period. The first question was with regard to student
academic changes and the second question was with regard to student attitude and behavioral
changes.
Interview Questions
The two questions asked during the mid-intervention and post-intervention sessions of
the 3rd-grade teachers whose students were the subjects of this research were, “What have you
noticed with regard to overall student academic progress with regard to multiplication facts
development since the start of this study?” and “What attitude or behavioral change have you

110
noticed with regard to multiplication facts development since the start of this study?” Each
response to the question asked will be followed by a rating of positive, negative, or neutral.
Mid-Intervention Teacher Responses
Question #1 (academic in nature): “What have you noticed with regard to overall student
progress with regard to multiplication facts development since the start of this study?”
Responses (paraphrased):
1. Since this is my first year teaching 3rd grade, I really have nothing to compare it to.
(NEUTRAL)
2. The students have a new math program this year so it’s hard to compare academics from
this year to last year. (NEUTRAL)
3. They spend more time on math, especially with the finger hopscotching. (POSITIVE)
4. Students seem more willing to raise their hands than before…it could be more
confidence. (POSITIVE)
5. With regard to math/multiplication time during class, students have mentioned many
times that “we learned that in PE.” (POSITIVE)
6. Many times within the classroom, students have mentioned that they do that
(multiplication) in PE, too. (POSITIVE)
7. Most students enjoy the workbooks. (POSITIVE)
8. Students who don’t get the workbooks (student learning logs) want them…maybe the
novelty of them? (POSITIVE)
9. Some students don’t want to do the workbooks (student learning logs). (NEGATIVE)
10. Students are given even more time to work on student learning logs because they want to
work on them. (POSITIVE)
11. We have added the workbooks to our morning work time. (NEUTRAL)
12. We added workbooks to our Literacy Centers. (NEUTRAL)
Question #2 (behavioral in nature): “What attitude or behavioral changes have you
noticed with regard to multiplication facts development since the start of this study? Responses
(paraphrased):

111
1. More confidence with others. (POSITIVE)
2. Love multiplication since we started. (POSITIVE)
3. More motivated to use facts and not use table chart to help. (POSITIVE)
4. Challenge themselves not to use table chart to help. (POSITIVE)
5. Love to do the workbooks, especially the dot-to-dot coloring pages. (POSITIVE)
6. With the new math series (from Everyday Math to My Math) we use coloring sheets
more and the kids like this. Hopscotch Math has the coloring sheets, also. (POSITIVE)
7. The new series focuses on math facts and this year’s students seem to grasp the facts
more quickly than with past students that used Everyday Math, which didn’t focus on
math fact development as much. (NEUTRAL)
Mid-Intervention Interview Discussion
With regard to Question #1 from the mid-intervention interview, there were 7 “positive”
responses, 1 “negative” response, and 4 “neutral” responses. Since response ratings were not all
the same, nothing can be reported as definite. The majority of the responses to Question #1,
though, were positive, with only one response being negative. That being said, the results seem
to indicate that the subjects’ teachers being interviewed shared the general opinion that the
Hopscotch Math (Schroeder, 1998) program was having to some degree an atypical, yet positive
academic effect on the student subjects.
With regard to Question #2 from the mid-intervention interview, there were 6 “positive”
responses, 0 “negative” responses, and 1 “neutral” response. Since response ratings were not all
the same, nothing can be reported as definite. The majority of the responses to Question #2,
though, were positive, with there being zero negative responses. That being said, the results
seem to indicate that the subjects’ teachers being interviewed shared the general opinion that the
Hopscotch Math (Schroeder, 1998) program was having a positive behavioral effect on the
student subjects.

112
Post-Intervention Teacher Responses
Question #1 (academic in nature): “What have you noticed with regard to overall student
progress with regard to multiplication facts development since the start of this study?” It is
important to note that the teachers of the subjects used in this study were not given the academic
results of the pre-intervention, mid-intervention, and post-intervention multiplication tests until
after the post-intervention interview. Responses (paraphrased):
1. Excited about math…use math games on Chromebooks to assist in learning. (POSITIVE)
2. Define improvement in math facts. (POSITIVE)
3. Try without using charts, then double-check answers with charts. (POSITIVE)
4. Overall, multiplication facts development is obvious, but overall math development still
seems to be a struggle…no obvious improvement there. (POSITIVE-only looked at
multiplication facts development)
5. Many students still enjoy the workbooks (student learning logs). (POSITIVE)
6. Some students never got into the workbooks (student learning logs). (NEGATIVE)
7. They seem to use table charts less. (POSITIVE)
Question #2 (behavioral in nature): “What attitude or behavioral changes have you
noticed with to multiplication facts development since the start of this study? Responses
(paraphrased):
1. The new math series stays with concepts longer; this could be another reason for
multiplication facts development success. (NEUTRAL)
2. Problem solving is harder with the new program. (NEUTRAL)
3. Students more confident with new program…more class participation since the beginning
of the year. (POSITIVE)
4. Many students still enjoy the workbooks (student learning logs). (POSITIVE)
5. Some students never got into the workbooks (student learning logs). (NEGATIVE)

113
Post-Intervention Interview Discussion
With regard to Question #1 from the post-intervention interview, there were 6 “positive”
responses, 1 “negative” response, and 0 “neutral” responses. Since the response ratings were not
all the same, nothing can be reported as definite. The majority of the responses to Question #1,
though, were positive, with only one response being negative. That being said, the results seem
to indicate that the subjects’ teachers being interviewed shared the general opinion that the
Hopscotch Math (Schroeder, 1998) program was having to some degree an atypical, yet positive
academic effect on the student subjects.
With regard to Question #2 from the post-intervention interview, there were 2 “positive”
responses, 1 “negative” response, and 2 “neutral” responses. The Question #2 results seem
ambiguous due to the low number of responses and due to the number of responses in each
category being similar. That being said, no indications can be made with regard to the
Hopscotch Math (Schroeder, 1998) program’s behavioral effect on the student subjects.
Discussion of Findings Regarding Research Question #3
The findings with regard to Research Question #3 provided no definite answer. Though
there is no definite answer to Research Question #3, it must be noted that before the research
began, the researcher was of the definite opinion that all four teachers whose classes were part of
this research were very optimistic and excited about this research. This was made evident during
the face-to-face discussions between the researcher and the teachers whose students would be
part of this study. During the mid-intervention interview, it is the researcher’s opinion that this
positive attitude certainly remained. Their answers to the questions asked during this mid-

114
intervention interview seem to support that they maintained positive attitudes, as well. During
the post-intervention interview, it is the researcher’s opinion that the teachers’ positive attitudes
were still evident and they were all encouraged by the data results. Their answers to the
questions during this post-intervention interview, overall, seem to support that they maintained
positive attitudes, as well.
It must be noted that the researcher feels that during the interviews there was no specific
anecdotal evidence that clearly defined which intervention group or groups were being talked
about. It is the researcher’s opinion that the teachers’ responses pertained to their classes as a
whole. Never during either interview does the researcher specifically recall any academic or
behavioral comparisons being made between any of the intervention groups, especially
comparisons regarding the Control group’s performance compared to the other intervention
groups’ academic or behavior performances.
After qualitatively analyzing the collective response results from the mid-intervention
and post-intervention teacher interviews, there does seem to be an indication that there was some
level of atypical, yet positive academic gain regarding multiplication facts development due to
the Hopscotch Math (Schroeder, 1998) program’s use.
Research Question #3 is academic in nature; therefore, no behavior analysis regarding the
mid-intervention and post-intervention teacher interviews will be reported in this section other
than what the reading interprets as a result of reading all interview question responses. The null
hypothesis and alternative hypothesis are not associated in any way with Research Question #3
and hence there is no report regarding their relationship in this section.

115
Discussion Regarding the Combined Quantitative and Qualitative Results
When one collectively analyzes the results of the qualitative and quantitative sections of
this quasi-experimental research, the Hopscotch Math (Schroeder, 1998) program, when used in
its entirety, seems to have a positive effect on the development of multiplication facts by 3rd-
grade students when these students are exposed to this program for 18 relatively evenly spaced ½
hour sessions spanning 8 weeks.
Summary
All students, to some degree, are kinesthetic learners and can learn through movement
and experimentation (Gardner, 1983). The collective results of this study, as detailed in this
chapter, seem to indicate that when Hopscotch Math (Schroeder, 1998) is used in its entirety, and
when taught during physical education class, can be an effective method for teaching students
basic multiplication facts.
As a result of this research study, the researcher is hopeful that many an educator will
discover this approach, find value in it, utilize it, and ultimately celebrate the successes it brings
to those countless students who formerly struggled to learn basic multiplication facts via
traditional methods of teaching.

CHAPTER 5
FINDINGS, CONCLUSIONS, AND IMPLICATIONS
Chapter 5 has five sections. These five sections are: Introduction, Summary of the
Findings, Implications for Practice, Recommendations for Research, and Conclusion.
Introduction
The purpose of this study was to look at the academic effectiveness of teaching students
basic multiplication facts during physical education class through a specific kinesthetic
movement, hopscotching, by using an interdisciplinary approach to teaching physical education
called Hopscotch Math (Schroeder, 1998). Undeniably, many students struggle with learning
basic multiplication math facts. One major reason for this struggle is students are not being
presented this information in a way that allows learning to take place efficiently and effectively.
All students, to some degree, are kinesthetic learners and can learn through movement (Gardner,
1983). The researcher contends that if students are given opportunities to learn basic
multiplication facts through the Hopscotch Math program (Schroeder, 1998), a program that
allows learning through movement, then academic success with regard to basic multiplication
facts development will be realized.
The researcher conducted a quasi-experimental study. The researcher quantitatively used
a prescribed multiplication and division fact development program, Hopscotch Math (Schroeder,
1998), which collectively used student learning logs, flashcard practice, and hopscotching to help

117
with student attainment of multiplication and division facts knowledge. This research study
focused only on the multiplication portion of this program. There were three research groups.
One group received the full intervention. One group received the full intervention less the
hopscotching portion, and one group was the control which received no intervention at all. The
quantitative part of this study used a 50-problem basic multiplication facts test (Appendix A)
before the interventions began, a 50-problem multiplication facts test (same questions, but
rearranged) mid-intervention, and a 50-problem basic multiplication facts test (same as the pre-
interventions test).
The researcher qualitatively used 3rd-grade teachers as field experts to describe their
observations of their students who were part of this study during the course of the research
project. These teacher-described observations, recorded in written form by the researcher, were
created through a mid-intervention round-table discussion (interview) and through a post-
intervention round-table discussion (interview). Both round-table discussions were prompted by
the same two questions. The first question was, “What have you noticed with regard to overall
student academic progress with regard to multiplication facts development since the start of this
study?” The second question was, “What attitude or behavioral changes have you noticed with
regard to multiplication facts development since the start of this study?”
This study used three research questions, one null hypothesis, and one alternate
hypothesis to guide the research. Only the first and second research questions were directly
associated to the null hypothesis and alternate hypothesis. Due to the qualitative nature of the
third research question, significance is not able to be determined. The first research question

118
reads, “Is there a significant difference among 3rd-grade-level students receiving the Hopscotch
Math intervention, 3rd-grade-level students receiving the Hopscotch Math intervention less the
hopscotch portion of the program, and 3rd-grade-level students in the Control group, when
comparing pre-intervention tests, mid-intervention tests, and post-intervention tests?”
The second research question reads, “Does teaching multiplication facts to 3rd-grade-level
students through the interdisciplinary physical education movement approach to teaching
multiplication facts called Hopscotch Math show improvement on the Hopscotch Math
Multiplication Exam compared to a 3rd-grade-level student group receiving the same program,
less the kinesthetic hopscotching component of this program, and a 3rd-grade-level student group
receiving no extra practice (Control group)?”
The third research question reads, “Did the classroom teachers whose students are the
subject of this study notice an atypical increased rate of improvement toward multiplication facts
development?”
The null hypothesis reads, “There is no statistical difference among 3rd-grade-level
students receiving the interventions and 3rd-grade-level students in the Control group, when
comparing pre-intervention tests, mid-intervention tests, and post-intervention tests.” The
alternate hypothesis reads, “There is a statistical difference among 3rd-grade-level students
receiving the interventions and 3rd-grade-level students in the Control group when comparing
pre-intervention tests, mid-intervention tests, and post-intervention tests.”

119
Summary of the Findings
The results of this study indicate that when Hopscotch Math (Schroeder, 1998) is used in
its entirety, and when taught during physical education class, it can be an effective method for
teaching students basic multiplication facts.
The results with regard to Research Question #1 produced Period 1 (pre-intervention to
mid-intervention) mean improvement scores. With regard to Period 1, the Control group
improved 2.739 points, the Less Hopscotching intervention group improved 7.801 points, and the
Full intervention group improved 7.869 points. It also produced Period 2 (mid-intervention to
post-intervention) mean improvement scores. With regard to Period 2, the Control group
improved 2.304 points, the Less Hopscotching intervention group improved 1.031 points, and the
Full intervention group improved 1.479.
When pairwise comparisons were made between the three intervention groups relative to
mean improvement scores, the only comparison that showed significance (p=0.0186) was
between the Control group and the Full intervention group. When effects sizes were calculated,
the highest effect size was from the comparison between the Full intervention group and the
Control group (r=0.3304). This effect size value showed a medium effect size. That being said,
the data results analyzed regarding Research Question #1 seem to indicate that there is
significant mean score improvement over time (Period 1 and Period 2) when comparing the
Control group to the Full intervention group. Hence, one rejects the null hypothesis when
looking at this particular comparison. All other pairwise comparisons failed to reject the null
hypothesis.

120
The results with regard to Research Question #2 produced mean improvement scores
from the period starting with the pre-intervention multiplication facts test and ending with the
post-intervention multiplication facts test. Regarding this intervention period (pre-intervention
to post-intervention), the mean improvement scores of the Control group improved 5.043 points,
the Less Hopscotching intervention group improved 8.832 points, and the Full intervention group
improved 9.348 points.
When pairwise comparisons were made between the three intervention groups relative to
mean improvement scores, the only comparison that showed significance (p=0.0276) was
between the Control group and the Full intervention group. When effects sizes were calculated,
the highest effect size was from the comparison between the Full intervention group and the
Control group (0.2801). This effect size value nearly showed a medium effect size, which would
need to be at least 0.30 (Cohen, 1988). That being said, the data results analyzed regarding
Research Question #2 seem to indicate that there is significant improvement over the
intervention time period that was from the pre-intervention multiplication facts test until the
post-intervention multiplication facts test. Hence, one rejects the null hypothesis when looking
at this particular comparison. All other pairwise comparisons failed to reject the null hypothesis.
The findings with regard to Research Question #3 provided no definite answer to this
question. Although there is no definite answer to Research Question #3, it must be noted that
before the research began, the researcher was of the definite opinion that all four teachers whose
classes were part of this research were very optimistic and excited about this research study.
This was made evident during the face-to-face discussions between the researcher and the
121
teachers whose students would be part of the study. During the mid-intervention interview, it is
the researcher’s opinion that this positive attitude certainly remained. Their answers to the
questions asked during this mid-intervention interview seem to support that they maintained
positive attitudes, as well. During the post-intervention interview, it is the researcher’s opinion
that the teachers’ positive attitudes were still evident and they were all encouraged by the data
results. Their answers to the questions during this post-intervention interview seem to support
that they maintained positive attitudes, as well. It must be noted that the researcher feels that
during the interviews there was no specific anecdotal evidence that clearly defined which
intervention group or groups were being talked about. It is the researcher’s opinion that the
teachers’ responses pertained to their classes as a whole. Never during either interview does the
researcher specifically recall any academic or behavioral comparisons being made between any
of the interventions groups, especially comparisons regarding the Control group’s performance
compared to the other intervention groups’ academic or behavior performances.
After qualitatively analyzing the collective response results from the mid-intervention
and post-intervention teacher interviews, there does seem to be an indication that there was some
level of atypical, yet positive academic gain regarding multiplication facts development due to
the Hopscotch Math (Schroeder, 1998) program’s use.
Research Question #3 is academic in nature; therefore, no behavior analysis regarding the
mid-intervention and post-intervention teacher interviews will be reported in this section other
than what the reading interprets as a result of reading all interview question responses. The null
122
hypothesis and alternative hypothesis are not associated in any way with Research Question #3
and hence there is no report regarding their relationship in this section.
Implications for Practice
As a result of this research, many cognitive, affective, and psychomotor domain learning
benefits were realized. The results suggest the potential for positive and effective implications
for students learning regardless of age, gender, culture, or socioeconomic status.
Though this research was conducted using a small 3rd-grade-level student sample of a
certain population, the results suggest the potential of being replicated by any age group, any
gender, any culture, or any socioeconomic group of students. As a result of this particular
research study, school district superintendents, principals, teachers, and parents alike now have a
learning option for students that does not create anxiety or apprehension, but instead is fun and
healthy, and has a positive academic effect on multiplication facts development.
The researcher hopes to share the positive results of this study with school administrators
and educators of all types, including school board members, school principals, classroom
teachers, physical education teachers, teacher specialists, and parents. This disclosure can be
made via school board meetings, staff meetings, PTA meetings, professional journals, and
profession development conferences, to name a few options.
What follows are specific implications with regard to each of the three domains of
learning (Bloom, Engelhart, Furst, Hill, & Krathwohl, 1956; Harrow, 1972; Krathwohl, Bloom,
& Masia, 1964). The three domains of learning are the cognitive domain (mental

123
skills/knowledge), the affective domain (feelings/emotion), and the psychomotor domain
(physical skills).
Cognitive Domain
From a cognitive perspective, the researcher contends that because of the positive
academic results of this research study, students will be able to find success with advanced math
topics which require multiplication facts development as a foundation. Without this foundational
multiplication facts development, the understanding of these advanced math topics is very
difficult.
The Illinois State Board of Education (2016), otherwise known as ISBE, lists its “New
Illinois Learning Standards for Mathematics Incorporating the Common Core” via their official
website, http://www.isbe.net. Specifically, these math standards can be found directly at
http://www.isbe.net/common_core/pdf/Math_common_core_standards.pdf. The website breaks
down the learning standards for math by displaying a table that breaks down each standard by
first displaying the associated grade level associated with a particular standard, then by
displaying the mathematics strand/s associated with the corresponding standard, then by
displaying the standard number and its associated subcategory, and lastly by displaying the
particular standard’s descriptor via text.
It was discovered through roundtable conversations with all 3rd-grade classroom teachers
whose students were part of this research study, as well as with several 4th- and 5th-grade teachers
from the school at which the research was conducted, that all the strands of mathematics that are
covered throughout the school year require the basic understanding of math facts, and more

124
specifically require the basic understanding of multiplication facts when looking specifically at
the 3rd-, 4th-, and 5th-grade curricula. These strands of mathematics are: operations and algebraic
thinking, number and operations in base 10, measurement and data, geometry, number and
operations-fractions, rations and proportional relationships, number system, expressions and
equations, statistics and probability, and algebra.
Affective Domain
From an affective perspective, the researcher contends that if students experience success
through a kinesthetic approach to learning multiplication facts, then self-efficacy toward
multiplication facts development can be realized. This will, in turn, serve as the permanently
established foundation for future success regarding the learning of advanced math topics.
Self-efficacy is the personal belief in one’s ability to succeed at a specific task and is
based in the broader context of Bandura’s Social Cognitive Theory (1986), and is an imperative
component of academic success (Fast et al., 2010; Multon et al., 1991). Self-belief does not
necessarily ensure success, but self-disbelief assuredly spawns failure (Bandura, 1997). Setting
goals, increasing interest, being strongly committed, sustaining effort, quickly recovering from a
failure, and reducing stress are characteristics of people who present a high level of self-efficacy.
On the other hand, people with low self-efficacy doubt their capabilities, have low aspirations,
demonstrate weak commitment, give up quickly when facing obstacles or adverse outcomes, and
are slow to recover from failures.
Bandura (1997) claims that mastery experience, one of the four tenets of self-efficacy, is
the most important and meaningful tenet that can be experienced if one is to realize self-efficacy.

125
The successful completion of a task raises efficacy beliefs, while the failure of a task lowers
efficacy beliefs. If efficacy has been established, though, an occasional failure will have a
minimal, if any, negative effect on efficacy (Bandura, 1997). This occasional failure is often
thought of as the result of some coincidental situational factor such as fatigue or lack of effort.
Early family and school influences and experiences have a highly impressionable and lasting
effect on the development of mastery experiences.
Schunk and Pajares (2002) are clear, though, that no amount of efficacy will produce
competent performance when requisite skills and knowledge are lacking. Teachers can help
account for this, however, by designing instruction so that students sense an incremental and
progressive mastery of tasks (Pintrich & Zusho, 2002). With regard to this research, the infusion
of mastery experiences is evident. The research design used in this study incorporates scaffold
experiences that will allow for the incremental mastery of basic multiplication facts, thus
allowing for a favorable opportunity for student subjects to develop self-efficacy beliefs.
It is important to note that the deliberate, careful use of the three other tenets of self-
efficacy, vicarious experience (modeling), verbal persuasion (praise and positive feedback), and
physiological states (internal feelings of anxiety, stress, or fear), are important, as well, when
developing self-efficacy. That being said, deliberate, careful consideration was taken toward the
use of all four tenets of self-efficacy during this research study.
126
Psychomotor Domain
From a psychomotor perspective, the researcher contends that physical skill development
is not compromised in any way as a result of incorporating other academic disciplines into
typical activities used during physical education class.
During the course of a school year, many physical skills are introduced, practiced, and
incorporated into many an activity during physical education class. When one incorporates
another discipline—math, for example—and more specifically multiplication facts development,
into a typical physical education activity, the students can still receive the same amount of
repetitive practice used to refine a particular skill as would otherwise be given. For example, if a
physical education teacher were teaching beginning volleyball setting form, that teacher might
have students use balloons to work on the skill of setting form by challenging students to
continually hit a balloon up into the air for a predetermined number of hits or for a
predetermined amount of time. When incorporating multiplication facts development into this
same activity, a teacher might have a student call out to a partner one number per hit of the
balloon in the order of that particular number’s pattern. For example, with a 2’s pattern, the
student would call out, “two” with one’s first hit, “four” with one’s second hit, “six” with one’s
third hit, and so on until the student reaches the number twenty. One’s partner would hold a card
with the answer key of that particular number’s multiplication pattern in order to check for
accuracy. Each partner could be given two or three attempts to accomplish this task before
changing roles.

127
As one can see, the only difference between practicing a skill without the incorporation
of another discipline and the practice of a skill with the incorporation of another discipline is the
calling out of a number between each hit. A major implication to this approach is that it can be
used with almost any individual skill that is developed during the course of a school year without
compromising typical skill development.
Recommendations for Research
The subsequent recommendations for research are presented with regard to the following
three learning domains: cognitive domain (Bloom et al., 1956), affective domain (Krathwohl et
al., 1964), and psychomotor domain (Harrow, 1972). Each of these learning domains will serve
as a categorical heading under which its related recommendations for research will be presented.
Cognitive Domain
This research was conducted using 3rd-grade students as research subjects. Slightly more
than half of these student subjects were Caucasian and from an English-speaking classroom.
Slightly less than half of the students were Hispanic and from a bilingual classroom where
Spanish was the secondary language spoken. Because this researcher analyzed a limited number
of variables, the researcher would like to expand this research study by seeing replications of this
study where comparative results are expanded and analyzed based on several independent
variables such as varying grade levels, genders, cultures, and socioeconomic status.
The researcher would also like to see this study replicated using a larger sample size. A
school-district-wide study, a statewide study, or even a nationwide study would be such studies

128
that would provide large enough cell size samples to draw conclusions that are less likely to be
repudiated.
The researcher would also like to see research conducted that analyzes the academic
effects that kinesthetic-based learning has on a variety of academic disciplines such as science,
reading, and social studies. Such research would be very difficult and time consuming, however.
Such research would require creative, restless, charismatic teachers or researchers with a desire
to create and teach exciting, movement-based lessons without the fear of experiencing initial
failures. With perseverance, these pioneering teachers could ultimately create a learning option
for students that does not create anxiety or apprehension, but instead is fun and healthy, and has
a positive academic effect on whatever academic discipline, or strand of a particular academic
discipline, is being researched.
Affective Domain
With regard to the affective domain of learning, the researcher would like to see this
research study replicated, but with a change of focus. The new focus would be on the effects that
kinesthetic-based learning has on self-efficacy. Though individual studies could be conducted
on each of the four tenets of self-efficacy (mastery experiences, vicarious experience, verbal
persuasion, and physiological states; Bandura, 1997), the researcher would like to see studies that
specifically focus on the self-efficacy tenet of physiological states (internal feelings of anxiety,
stress, or fear). From a foundational level, the reason for focusing on this tenet is that the
researcher feels learning will always be a struggle if a student walks into a classroom with
anxiety, fear, and/or apprehension toward the learning environment or toward the material be

129
presented. All four tenets of self-efficacy would be incorporated within such a research study,
but only physiological states monitored.
This potential study could be conducted where the researcher monitors: student subjects’
attitudes and perceptions toward their classroom climate, and student subjects’ attitudes and
perceptions toward the classroom tasks being presented to them. Specifically, one could
categorize “classroom climate” into the following three categories: comfort, order, and
acceptance. For optimal learning to take place, students need to feel comfort within the
classroom, order needs to have been established within the classroom, and the students need to
feel accepted in the classroom by the teacher and the other students alike. Specifically, as well,
one could categorize “classroom tasks” into the following three categories: clarity, ability, and
value. Students need to be clear about what they are being asked to do. Students also need to
feel like they have the ability to do the tasks presented before them. Lastly, the students need to
feel that there is value in the tasks they are asked to perform.
Such research could use an inventory of questions that would be used to analyze students’
attitudes and perceptions toward the classroom climate, with a series of specific questions that
focus on each of the following categories of classroom climate: comfort, order, and acceptance.
The same inventory would be used to analyze students’ attitudes and perceptions toward
classroom tasks, with a series of specific questions that focus on each of the following categories
of classroom task: clarity, ability, and value. This inventory could be given to the students
before the study begins, halfway through the study, and after the study has concluded. The

130
inventories could even be given to the parents of the student subjects in an attempt to see if there
are attitude changes at home.
Psychomotor Domain
It is stating the obvious that skill development is a major part of a physical education
curriculum. The researcher would like research to be conducted in an attempt to find out if
adding the challenge of reciting multiplication patterns during the practice of a specific physical
skill leads to a faster development of that skill’s appropriate form when compared to a research
group not receiving the extra challenge of multiplication facts recitation but still given the same
amount of practice time. For this to happen, research would need to be conducted where
pairwise comparisons regarding the development of a specific physical skill are made between a
Control group that receives no intervention, a research group that receives a specific amount of
practice time toward the development of that specific physical skill, and a research group that
receives the same amount of specified practice time toward the development of the same
physical skill as the other research group that receives an intervention, but in addition,
incorporates multiplication facts development within the specified practice time. Take the
physical skill of volleyball setting, for example. The research group that adds multiplication
facts development to its practice time would need a partner to monitor multiplication pattern
accuracy, via a pattern card. The student subjects within this research group take turns
attempting to correctly recite a specific multiplication pattern, all the while keeping correct
volleyball setting form. With each hit of the ball, the next number in that particular pattern is
called out. If the multiplication pattern is not followed or if correct volleyball setting form is
lost, partners would change roles.

131
Another research idea incorporates the element of tempo when combining the
development of multiplication facts and the development of physical skills. During this research
study, it was disclosed to the researcher that the student subjects would often hesitate when
hopscotching on the blank hopscotch template. The blank hopscotch template was used to
monitor student progress toward mastering a specific number’s multiplication pattern. Students
would stop and count by ones until they arrived at the correct number that fell in that particular
pattern. The students were frequently reminded not to count and to keep moving. This
discovery is what led to the researcher’s desire to replicate the current study, replacing
hopscotching with tempo-based activities as the kinesthetic activity. These tempo-based
physical activities could include jump roping, pogo sticking, or keeping balloons or balls in the
air by using volleyball or soccer skills, to name a few. Ultimately, the researcher would like to
examine the effectiveness of the use of tempo-based kinesthetic activities during multiplication
pattern recitation.
Lastly, the researcher would suggest that research could be conducted by adding the
element of balance during the recitation of multiplication facts recitation. This potential research
would be very similar to the proposed tempo-based research. One difference would be that the
element of tempo is removed and balance takes its place. Another difference would be the skills
that would be practiced. Balance-based activities could include balancing foam noodles on a
body part, walking a tight rope, or spinning a basketball one one’s finger. Ultimately, the
researcher would like to examine the effectiveness of the use of balance-based kinesthetic
activities during multiplication pattern recitation.

132
Conclusions
Academic success should be within the reach of all students, regardless of whether they
are English Language Learners or traditional English-speaking learners; regardless of whether
they are in academically talented programs or in special education programs; and regardless of
whether they are young boys attending a small rural school or young girls attending a large
financially strapped metropolitan public school. The researcher is adamant that educators can
and should make every effort to ensure that every student’s educational experience, as a whole,
is positive. Traditional teaching methods do not always allow for such an experience to
transpire, especially for those students who do not learn well through traditional teaching
methods. What happens instead is self-efficacy is compromised and a lack of general confidence
in one’s academic abilities soon follows. Ultimately, one’s educational experience could turn
out to be a negative experience where one’s academic potential is never realized. Differentiating
instruction provides better learning opportunities for all students. The researcher contends that
differentiated instruction by way of learning through movement can better help a large majority
of students to unobtrusively realize their academic potential.
All students, to some degree, are kinesthetic learners and can learn through movement
and experimentation (Gardner, 1983). Unfortunately, many a student who learns effectively
through kinesthetic movement activities may not be given opportunities to learn in this style,
which could powerfully bolster their self-efficacy toward many a specific learning task, and
ultimately give them the confidence and tools necessary to become successful students overall.

133
Specifically, the researcher contends that if students are given an opportunity to receive
extra practice toward learning basic multiplication facts through a specifically prescribed
kinesthetic approach to learning, namely Hopscotch Math (Schroeder, 1998), then academic
success with regard to basic multiplication facts development will be realized.
The collective results of this study, as detailed in Chapters 4 and 5, seem to indicate that,
when taught during physical education class and used in its entirety, Hopscotch Math
(Schroeder, 1998) can be an effective method for teaching students basic multiplication facts. As
a result of this study, the researcher is hopeful that many an educator will discover this approach,
find value in it, utilize it, improve on it, and ultimately celebrate the successes it brings to those
countless students who formerly struggled to learn basic multiplication facts via traditional
methods of teaching. Who knows? It could be the door to success that would not have been
opened otherwise.

REFERENCES
Aerobics and Fitness Association of America (AFAA). (2011). Personal fitness training: Theory
& practice (2nd ed.). Sherman Oaks, CA: Author.
Bandura, A. (1986). Social foundations of thought and actions: A social cognitive theory.
Englewood Cliffs, NJ: Prentice-Hall.
Bandura, A. (1997). Self-efficacy: The exercise of control. New York, NY: Freeman.
Bandura, A., Barbaranelli, C., Caprara, G. V., & Pastorelli, C. (1996). Multifaceted impact of
self-efficacy beliefs on academic functioning. Child Development, 67(3), 1206-1222.
Bloom, B. S. (Ed.), Engelhart, M. D., Furst, E. J., Hill, W. H., & Krathwohl, D. R. (1956).
Taxonomy of educational objectives: The classification of educational goals. Handbook
I: Cognitive domain. New York, NY: David McKay.
Budde, H., Voelcher-Rehage, C., Pietrabyk-Kendziorra, S., Ribeiro, P., & Tidow, G. (2008).
Acute coordinative exercise improves attentional performance in adolescents.
Neuroscience Letter, 441(2), 219-223.
Carlson, S. A., Fulton, J. E., Lee, S. M., Maynard, L. M., Brown, D. R., Kohl, H. W. III, &
Dietz, W. H. (2008). Physical education and academic achievement in elementary school:
Data from the Early Childhood Longitudinal Study. American Journal of Public Health,
98(4), 721-727.
Castelli, D. M., Hillman, C. H., Buck, S. M., & Erwin, H. E. (2007). Physical fitness and
academic achievement in third- and fifth-grade students. Journal of Sport & Exercise
Psychology, 29(2), 239-252.
Centers for Disease Control and Prevention (CDC). (2008). Youth risk behavior surveillance—
United States, 2007. Morbidity and Mortality Weekly Report: Surveillance Summaries,
57(SS-04), 1-131.
Centers for Disease Control and Prevention (CDC). (2010). The association between school-
based physical activity, including physical education, and academic performance.
http://www.cdc.gov/healthyyouth/health_and_academics/pdf/pa-pe_paper.pdf
135
Cereboost. (2014). What are cognitive functions? http://www.cereboost.com/cognitive-function/
City-Data.com (2014a). Cortland, Illinois. http://www.city-data.com/city/Cortland-Illinois.html
City-Data .com (2014b). DeKalb, Illinois. http://www.city-data.com/city/DeKalb-Illinois.html
Coe, D. P., Pivarnik, J. M., Womack, C. J., Reeves, M. J., & Malina, R. M. (2006). Effect of
physical education and activity levels on academic achievement in children. Medicine &
Science in Sports & Exercise, 38(8), 1515-1519.
Cohen, J. (1988). Statistical power analysis for the behavioral sciences (2nd ed.). Hillsdale, NJ:
Erlbaum.
Cone, T. P., Werner, P., Cone, S. L., & Woods, A. M. (1998). Interdisciplinary teaching through
physical education. Champaign, IL: Human Kinetics.
Cone, T. P., Werner, P., & Cone, S. L. (2009). Interdisciplinary elementary physical education:
Connecting, sharing, partnering (2nd ed.). Champaign, IL: Human Kinetics.
Cooper Institute for Aerobics Research. (1999). FITNESSGRAM® Test Administration Manual
(2nd ed.). Champaign, IL: Human Kinetics.
Cottrell, L. A., Northrup, K., & Wittberg, R. (2007). The extended relationship between child
cardiovascular risks and academic performance measures. Obesity (Silver Spring),
15(12), 3170-3177.
Davis, C. L., Tomporowski, P. D., Boyle, C. A., Waller, J. L., Miller, P. H., Naglieri, J. A., &
Gregoski, M. (2007). Effects of aerobic exercise on overweight children’s cognitive
functioning: A randomized controlled trial. Research Quarterly for Exercise and Sport,
78(5), 510-519.
Davis, C. L., Tomporowski, P. D., McDowell, J. E., Austin, B. P., Miller, P. H., Yanasak, N. E.,
Allison, J. D., & Naglieri, J. A. (2011). Exercise improves executive function and
achievement and alters brain activation in overweight children: A randomized controlled
trial. Health Psychology, 30(1), 91-98.
DeBate, R. D., Gabriel, K. P., Zwald, M., Huberty, J., & Zhang, Y. (2009). Changes in
psychosocial factors and physical activity frequency among third- to eighth-grade girls
who participated in a developmentally focused youth sport program: A preliminary study.
Journal of School Health, 79(10), 474-484.

136
Dimeo, F., Bauer, M., Varahram, I., Proest, G., & Halter, U. (2001). Benefits from aerobic
exercise in patients with major depression: A pilot study. British Journal of Sports
Medicine, 35(2), 114-117.
Donnelly, J. E., Greene, J. L., Gibson, C. A., Smith, B. K., Washburn, R. A., Sullivan, D. K.,
DuBose, K., Mayo, M. S., Schmelzle, K. H., Ryan, J. J., Jacobsen, D. J., & Williams, S.
L. (2009). Physical activity across the curriculum (PAAC): A randomized controlled trial
to promote physical activity and diminish overweight and obesity in elementary children.
Preventative Medicine, 49(4), 336-341.
Drake, S. M., & Burns, R. C. (2004). Meeting standards through integrated curriculum.
Alexandria, VA: Association for Supervision and Curriculum Development.
Dubbert, P. M. (2002). Physical activity and exercise: Recent advances and current challenges.
Journal of Consulting and Clinical Psychology, 70(3), 526-536.
Emery, C. F., Shermer, R. L., Hauck, E. R., Hsiao, E. T., & MacIntyre, N. R. (2003). Cognitive
and psychological outcomes of exercise in a 1-year follow-up study of patients with
chronic obstructive pulmonary disease. Health Psychology, 22(6), 598-604.
Etnier, J. L., Salazar, W., Landers, D. M., Petruzzello, S. J., Han, M., & Nowell, P. (1997). The
influence of physical fitness and exercise upon cognitive functioning: A meta-analysis.
Journal of Sport & Exercise Psychology, 19, 249-277.
Eveland-Sayers, B. M., Farley, R. S., Fuller, D. K., Morgan, D. W., & Caputo, J. L. (2009).
Physical fitness and academic achievement in elementary school children. Journal of
Physical Activity and Health, 6(1), 99-104.
Fast, L. A., Lewis, J. L., Bryant, M. J., Bocian, K. A., Cardullo, R. A., Rettig, M., & Hammond,
K. A. (2010). Does math self-efficacy mediate the effect of the perceived classroom
environment on standardized math test performance? Journal of Educational Psychology,
102(3), 729-740.
Flook, L., Repetti, R. L., & Ullman, J. B. (2005). Classroom social experiences as predictors of
academic performance. Developing Psychology, 41(2), 319-327.
Fraenkel, J. R., & Wallen, N. E. (2009). How to design and evaluate research in education (7th
ed.). New York, NY: McGraw-Hill Higher Education.
Gallotta, M. C., Guidetti, L., Franciosi, E., Emerenziani, G. P., Bonavolonta, V., & Baldari, C.
(2012). Effects of varying type of exertion on children’s attention capacity. Medicine &
Science in Sport & Exercise, 44(3), 550-555.

137
Gardner, H. (1983). Frames of mind: The theory of multiple intelligences. New York, NY: Basic
Books.
Grissom, J. B. (2005). Physical fitness and academic achievement. Journal of Exercise
Physiology Online, 8(1), 11-25.
Hanushek, E. A., Peterson, P. E., & Woessmann, L. (2010). U.S. math performance in global
perspective: How well does each state do at producing high-achieving students?
http://www.hks.harvard.edu/pepg/PDF/Papers/PEPG10-19_HanushekPeterson
Woessmann.pdf
Harrow, A. J. (1972). The taxonomy of psychomotor domain: A guide for developing behavioral
objectives. New York, NY: David McKay.
Headly, A. A., Ogden, C. L., Johnson, C. L., Carroll, M. D., Curtin, L. R., and Flegal, K. M.
(2004). Overweight and obesity among US children, adolescents, and adults, 1999-2002.
Journal of the American Medical Association, 291(23), 2847-2850.
Hillman, C. H., Pontifex, M. B., Raine, L. B., Castelli, D. M., Hall, E. E., & Kramer, A. F.
(2009). The effect of acute treadmill walking on cognitive control and academic
achievement in preadolescent children. Neuroscience, 159(3), 1044-1054.
Hillman, C. H., Snook, E. M., & Jerome, G. J. (2003). Acute cardiovascular exercise and
executive control function. International Journal of Psychophysiology, 48, 307-314.
Illinois Public Health Institute (2013). Illinois enhances P. E. task force: Research summary:
Exploring the link between physical activity, fitness and cognitive function.
http://www.isbe.net/EPE/pdf/reports-webinars/iphi-epetf-rpt0313.pdf
Illinois Report Card. (2014). Dekalb CUSD 428. Retrieved December 28, 2014, from
http://www.illinoisreportcard.com/ District.aspx?Districtid=16019428026
Illinois State Board of Education (ISBE). (2014). Enhanced physical education in Illinois.
Retrieved December 27, 2014, from http://www.isbe.net/EPE/default.htm
Illinois State Board of Education (ISBE). (2016). New Illinois learning standards for
mathematics incorporating the common core. http://www.isbe.net/common_core/pdf/
Math_common_core_standards.pdf
Jacobs, H. H. (1989). Interdisciplinary curriculum: Design and implementation. Alexandria, VA:
Association for Supervision and Curriculum Development.

138
Joyce, J., Graydon, J., McMorris, T., & Davranche, K. (2009). The time course effect of
moderate intensity exercise on response execution and response inhibition. Brain and
Cognition, 71(1), 14-19.
Krathwohl, D. R., Bloom, B. S., & Masia, B. B. (1964). Taxonomy of educational objectives:
The classification of educational goals. Handbook II: Affective Domain. New York:
David McKay.
Kubesch, S., Walk, L., Spitzer, M., Kammer, T., Lainburg, A., Heim, R., & Hille, K. (2009). A
30-minute physical education program improves students’ executive attention. Mind,
Brain, and Education, 3(4), 235-242.
Layton, L. (2013). U.S. students lag around average on international science, math and reading
test. http://www.washingtonpost.com/local/education/us-students-lag-around-average-on-
international-science-math-and-reading-test/2013/12/02/2e510f26-5b92-11e3-a49b-
90a0e156254b_story.html
Lee, S. M., Burgeson, C. R., Fulton, J. E., & Spain, C. G. (2007). Physical education and
physical activity: Results from the School Health Policies and Programs Study 2006.
Journal of School Health, 77, 435-463.
Multon, K. D., Brown, S. D., & Lent, R. W. (1991). Relation of self-efficacy beliefs to academic
outcomes: A meta-analytic investigation. Journal of Counseling Psychology, 38(1), 30-
38.
National Assessment of Educational Progress (NAEP). (2013a). Summary data tables: 2013
mathematics. http://www.nationsreportcard.gov/reading_math_2013/files/Tech_
Appendix_Math.pdf
National Assessment of Educational Progress (NAEP). (2013b). How are states performing?
Retrieved December 30, 2014, from http://www.nationsreportcard.gov/ reading_math_
2013/#/state-performance
National Assessment of Educational Progress (NAEP). (2013c). 2013 mathematics assessment
report card: Summary data tables with additional detail for average scores and
achievement levels for states and jurisdictions. http://www.nationsreportcard.gov/
reading_math_ 2013/files/Results_Appendix_Math.pdf
National Assessment of Educational Progress (NAEP). (2013d). Top stories in NAEP
mathematics 2013. Retrieved December 26, 2014, from http://www.nationsreportcard.
gov/math_2013/

139
National Assessment of Educational Progress (NAEP). (2013e). Are higher and lower
performing students making gains? Retrieved December 26, 2014, from
http://www.nationsreportcard.gov/reading_math_ 2013/#/gains-percentiles
National Assessment of Educational Progress (NAEP). (2013f). The nation’s report card:
mathematics 2013 state snapshot report. http://www.nces.ed.gov/nationsreportcard/
subject/publications/stt2013/pdf/2014465IL4.pdf
National Association for Sport and Physical Education (NASPE). (1999). The fitness equation:
Physical activity + balanced diet = fit kids. Reston, VA: Author.
National Association for Sport and Physical Education/American Heart Association. (2012).
2012 Shape of the Nation report: Status of physical education in the USA. http://www.
shapeamerica.org/advocacy/son/2012/upload/2012-Shape-of-Nation-full-report-web.pdf
National Commission on Excellence in Education. (1983). A nation at risk: The imperative for
educational reform: A report to the Nation and the Secretary of Education, United States
Department of Education. Washington, DC: Author.
No Child Left Behind (NCLB) Act of 2001, Pub. L No. 107-110, § 115, Stat 1425 (2002).
Ogden, C. L., Carroll, M. D., Curtin, L. R., McDowell, M. A., Tabak, C. J., & Flegal, K. M.
(2006). Prevalence of overweight and obesity in the United States, 1999-2004. The
Journal of the American Medical Association, 295(13), 1549-1555.
Pajares, F. (2006). Self-efficacy beliefs during adolescence: Implications for teachers and
parents. In F. Pajares & T. Urdan (Eds.), Adolescence and education. Vol. 5: Self-efficacy
beliefs of adolescents (pp. 339-367). Greenwich, CT: Information Age.
Physical Activity Council. (2014). 2014 participation report. http://www.physicalactivitycouncil.
com/PDFs/current.pdf
Piaget, J. (1969). Psychology of intelligence. Totowa, NJ: Littlefield, Adams.
Pintrich, P. R., & Zusho, A. (2002). The development of academic self-regulation: The role of
cognitive and motivational factors. In A. Wigfield & J. S. Eccles (Eds.), Development of
achievement motivation (pp. 249-284). San Diego, CA: Academic Press.
Pi-Sunyer, F. X. (2002). The obesity epidemic: Pathophysiology and consequences of obesity.
Obesity Research; 10(Suppl. 2), 97S-104S.
140
Plummer, K. (1983). Documents of life: An introduction to the problems and literature:
Grounded theory procedures and techniques (2nd ed.). Newbury Park, CA: SAGE.
Pontifex, M. B., Saliba, B. J., Raine, L. B., Picchietti, D. L., & Hillman, C. H. (2013). Exercise
improves behavioral, neurocognitive, and scholastic performance in children with
attention-deficit/hyperactivity disorder. The Journal of Pediatrics, 162(3), 543-551.
Ratey, J. J. (2008). Spark: The revolutionary new science of exercise and the brain. New York,
NY: Little, Brown.
Ratey, J. J., & Loehr, J. E. (2011). The positive impact of physical activity on cognition during
adulthood: A review of underlying mechanisms, evidence and recommendations. Reviews
in Neurosciences, 22(2), 171-185.
Rich, M. (2012). U.S. students still lag globally in math and science, tests show. http://www.
nytimes.com/2012/12/11/education/us-students-still-lag-globally-in-math-and-science-
tests-show.html
Rideout, V. J., Foehr, U. G., & Roberts, D. F. (2010). Generation m2: Media in the lives of 8- to
18- year olds. Menlo Park, CA: Henry J. Kaiser Family Foundation.
Rosenbaum, D. A., Carlson, R. A., & Gilmore, R. O. (2001). Acquisition of intellectual and
perceptual-motor skills. Annual Review of Psychology, 52(1), 453-470.
SAS Institute. (2010). SAS proprietary software, version 9.3. Cary, NC: Author.
Schroeder, P. (1998). Hopscotch math: An interaction unit with hopscotch patterns for learning
multiplication and division facts. Fort Atkinson, WI: Interaction Publishers.
Schroeder, P. (2012). Hopscotch math: An interaction unit with hopscotch patterns for learning
multiplication and division facts. Culver City, CA: Interaction Publishers.
Schunk, D. H., & Pajares, F. (2002). The development of academic self-efficacy. In A. Wigfield
& J. S. Eccles (Eds.), Development of achievement motivation (pp. 15-31). San Diego,
CA: Academic Press.
Sibley, B. A., & Etnier, J. L. (2003). The relationship between physical activity and cognition in
children: A meta-analysis. Pediatric Exercise Science, 15, 243-256.
Srikanth, S., Petrie, T., Greenleaf, C., & Martin, S. (2012, August). Physical fitness and
academic performance: A longitudinal investigation. Paper presented at the American
Psychological Association annual conference, Orlando, FL.

141
Steinberg, H., Nicholls, B. R., Sykes, E. A., LeBoutillier, N., Ramlakhan, N., Moss, T. P., &
Dewey, A. (1998). Weekly exercise consistently reinstates positive mood. European
Psychologist, 3(4), 271-280.
Strauss, K., & Young, J. (2001). Active kids, healthy minds. NEA Today, 20(2), 36.
Trudeau, F., & Shephard, R. J. (2008). Physical education, school physical activity, school sports
and academic performance. International Journal of Behavioral Nutrition and Physical
Activity 5(10). doi: 10.1186/1479-5868-5-10
United States Department of Education (2000). Educate America Act of 1994, 20 U.S.C.A. §
5801 et seq. Goals 2000: Educate America Act, P.L. (103-227).
U.S. Department of Agriculture. (2010). Dietary guidelines for Americans, 2010. http://www.
cnpp.usda.gov/dietaryguidelines.htm
U.S. Department of Health and Human Services (1996). Physical activity and health: A report of
the Surgeon General. Atlanta, GA: U.S. Department of Health and Human Services,
Centers for Disease Control and Prevention, National Center for Chronic Disease
Prevention and Health Promotion. http://www.cdc.gov/nccdphp/sgr/pdf/execsumm.pdf
U.S. Department of Health and Human Services. (2008). 2008 physical activity guidelines for
Americans: Be active, healthy, and happy! http://www.health.gov/paguidelines/pdf/
paguide.pdf
Van Dusen, D. P., Kelder, S. H., Kohl, H. W. III, Ranjit, N., & Perry, C. L. (2011). Associations
of physical fitness and academic performance among schoolchildren. The Journal of
School Health, 81(12), 733-740.
Wang, Y. C., McPherson, K., Marsh, T., Gortmaker, S. L., & Brown, M. (2011). Health and
economic burden of the projected obesity trends in the USA and the UK. The Lancet,
378(9793), 815-825.
Wilcox, E. (1994). An interview with Susan M. Tarnowski. Teaching Music, 2(2), 44.
Wilkins, J. L. M., Graham, G., Parker, S., Westfall, S., Fraser, R. G., & Tembo, M. (2003). Time
in the arts and physical education and school achievement. Journal of Curriculum
Studies, 35(6), 721-734.
Y-USA. (2011). YMCA’s family Health Snapshot. http://www.ymca.net/sites/default/ files/
pdf/20110413-survey.pdf

APPENDICES

APPENDIX A
HOPSCOTCH MATH MULTIPLICATION EXAM (SCHROEDER, 2012)

144

145

APPENDIX B
CONSENT FORM FOR PARENTS/GUARDIANS OF MINORS AND
ASSENT FORM FOR STUDENT SUBJECTS

147
CONSENT FORM FOR PARENTS/GUARDIANS OF MINORS AND
ASSENT FORM FOR STUDENT SUBJECTS
Your child is invited to participate in a research study entitled, The Effects on Student Academic Development and Teacher Perception as a Result of Teaching 3rd Grade Students Multiplication
Facts Through An Interdisciplinary Approach to Teaching Physical Education being conducted by
William McGuire a doctoral candidate at Northern Illinois University. The specific focus of this
research is to see if any significant, positive academic effects occur as a result of teaching basic
multiplication facts through the physical activity of hopscotching.
Your child could be in one of three research groups. The school principal will randomly assign students to
research groups. Two of the groups will be given an intervention while a third group will serve as the
control. A fourth group will be created but will not be part of the research. One of the two intervention
groups will receive the intervention called Hopscotch Math in its entirety. Hopscotch Math is a program that
uses hopscotching, flashcard practice, worksheets, and student learning logs in an attempt to enhance
multiplication facts development through pattern recognition. The second intervention group will receive the
same program without the hopscotching portion of the program. The third group is the control group and will
receive no intervention. Interventions will be used two to three times per week for approximately 8 weeks.
The interventions will start on January 25th, 2016, and will end on March 18th, 2016.
The study is looking to see how getting extra practice with basic multiplication facts by moving and learning
at the same time effects the scores on a 50 question multiplication test using numbers 1 through 10 in
combination. There will be a pre-test, a mid-intervention test, and a post-test given in order to analyze each
intervention’s effectiveness. All three groups will take all three tests. The school principal will administer all
three tests.
The school principal will randomly assign student identification numbers to the student subject since names
will not be used in this study. Only the principal will know which name corresponds to which student
identification number. All records will be kept in a locked safe in the principal’s office for 3 years. After the
3 year period, all record will then be destroyed by the school principal.
Your child’s classroom teacher will be observing and taking notes regarding their students’ academic
behaviors during the research. Your child’s classroom teacher will also have your child respond to 8 writing
prompts throughout the research. Though the classroom teacher will be responding to your child’s written
response, the writing prompts relating to this research will in no way be used to grade your child. Your
child’s teacher will also take part in two round-table discussions with the researcher and the other 3rd grade
teachers. One meeting will be four weeks after the start of the interventions and the last meeting will be
approximately eight weeks after the start of the interventions. Though your child’s teacher knows which
research group each of their students is in, your child’s name will never be disclosed during the round-table
meetings. Only generalizations regarding specific research groups will be discussed. In fact, individual
names will never be discussed during this research.
With the exception of the student subjects responding to 8 writing prompts in their regular classroom, this
research will be conducted during your child’s normal physical education class. If your child does not
participate in this study, you child will have PE class at their normal PE time, but will be taught by another
physical education instructor who will be teaching content that has nothing to do with this research. If
your child is part of this research, your child’s results on the multiplication tests will not in any way affect
your child’s PE grade or math grade.

148
There are no foreseeable risks and/or discomforts that your child could potentially experience during this
study. The benefit(s) your child could personally receive from participating in this study is that your child
could better understand basic multiplication facts which could then help your child understand more
advanced math topics. If this program is found effective, your child and all students in the future could
benefit from this program being used regularly.
Although Northern Illinois University policy does not provide for compensation for treatment of any injuries
that may result from participation in research activities, this does not mean you waive any legal rights you or
your child has as a result of participation in this study.
Information obtained during this study may be published in scientific journals or presented at scientific
meetings, but any information which could identify your child will be kept strictly confidential.
Participation in this study is voluntary. Your decision and your child’s decision to participate or not to
participate in this research will not negatively affect you or your child. Your child will be asked if he or
she wants to participate in this study before the research begins and will be free to stop participating in
this research at any time without penalty or prejudice.
Any questions about the study should be addressed to William McGuire at (815) 754-2360 or send an
email to [email protected]. You may also contact Dr. Rosita Lopez (dissertation chairperson) at
(815) 753-9336 or send her an email at [email protected] or [email protected].
If you wish further information regarding your rights or your child's rights as a research subject, you may
contact the Office of Research Compliance at Northern Illinois University at (815) 753-8588.
Please read, sign, and date the consent form below if you choose to allow your child to participate in this
research. Also, please discuss the research with your child. After this discussion, have your child sign and
date the assent form below if he or she wants to participate in the research. Return ONLY the bottom
portion of this page to Cortland School by January 20th, 2016.
-----------------------------------------------------------------------------------------------------------------------------
CONSENT: I agree to allow my child to participate in this research study and acknowledge that
I have received a copy of this consent form.
Signature of Parent/Guardian Date
ASSENT: My child’s signature below signifies that I, parent/guardian, have discussed the scope of this
research with my child and that my child agrees to be a subject in this research.
_______________________________________________________________________
Student Subject Signature Date

149
APPENDIX B (Spanish Version)
FORMULARIO DE CONSENTIMIENTO PARA PADRES/TUTORES DE MENORES DE
EDAD Y FORMULARIO DE ACUERDO DEL ESTUDIANTE COMO PARTICIPANTE
Su niño/a ha sido invitado/a para participar en un estudio de una investigación titulada, Los Efectos en
el Desarrollo Académico del Estudiante y la Percepción del Maestro como un Resultado de Enseñar
las Tablas de Multiplicar a los Estudiantes de 3er grado Mediante un Enfoque Interdisciplinario para la Enseñanza de educación física conducido por William McGuire un candidato para conseguir su
doctorado en Northern Illinois University. El enfoque específico de ésta investigación es para ver si se
producen efectos académicos significativos y positivos como resultado de la enseñanza de operaciones
básicas de multiplicación a través de la actividad física del juego llamado el avión.
Su niño/a podría estar en uno de los tres grupos de investigación. La directora de la escuela asignará a los
estudiantes en los grupos de investigación. A dos de los grupos se le dará una intervención mientras que el
tercer grupo de control no recibirá intervención. Se creará un cuarto grupo pero no será parte de la
investigación. Uno de los dos grupos de intervención recibirá la intervención llamada Hopscotch Math,
matemáticas en su totalidad. Hopscotch Math es un programa que usa el juego llamado el avión, práctica con
tarjetas, hojas de trabajo, y el estudiante tendrá un registro con el intento de mejorar el desarrollo de las tablas
de multiplicación a través de un reconocimiento de patrones. El segundo grupo de intervención recibirá el
mismo programa pero sin la parte del juego el avión. El tercer grupo es el grupo de control y no recibirá
intervención. Las intervenciones serán dos o tres veces por semana aproximadamente por 8 semanas. Las
intervenciones empezarán el 25 de enero, 2016, y terminará el 18 de marzo, 2016.
El estudio está buscando ver cómo conseguir práctica adicional con operaciones básicas de multiplicación
mediante el movimiento y aprender al mismo tiempo afecta la calificación en una prueba de multiplicación de
50 preguntas usando los números del 1 al 10 en combinación. Habrá una prueba antes, una prueba a mediados
de la intervención, y una prueba después con el fin de analizar la eficiencia de cada intervención. Los tres
grupos harán todas las tres pruebas. La directora de la escuela administrará todas las tres pruebas.
La directora de la escuela asignará al azar los números de identificación a los estudiantes participantes porque
no se usarán los nombres de los estudiantes. Solamente la directora va a saber que nombre le corresponde a que
número de identificación del estudiante. Todo el historial se quedará guardado dentro de una caja de seguridad
en la oficina de la directora por el periodo de 3 años, todo el historial serán desechados por la directora de la
escuela.
La maestra de su niño/a también estará observando y tomando notas sobre los comportamientos académicos de
sus estudiantes durante la investigación. También ella hará que su hijo/a dé una respuesta escrita sobre 8 temas
mediante la investigación. Aunque la maestra del estudiante va a responder a las respuestas escritas de los
estudiantes, los temas relacionados con esta investigación no serán usados para la calificación de su hijo/a. La
maestra de su hijo también será parte de dos diálogos en una mesa redonda con el investigador y las otras
maestras de tercer grado. Se hará una junta cuatro semanas después de que empiecen las intervenciones y la
última junta será aproximadamente ocho semanas después del comienzo de las intervenciones. Aunque la
maestra de su hijo/a conozca a cual grupo de investigación pertenece su estudiante, el nombre de su hijo/a
nunca será mencionado durante el dialogo en las juntas de la mesa redonda. Solamente se hablará en general al

150
respecto de los grupos específicos. De hecho, nunca se mencionarán los nombres individuales durante esta
investigación.
Con la excepción de las respuestas de los estudiantes participantes a los 8 temas de escritura en su salón
normal, esta investigación será conducida durante la clase normal de educación física de su hijo/a. Si su niño/a no participa en este estudio, él/ella tendrán la clase de educación física en su tiempo normal,
pero será por otro instructor de educación física que estará enseñando algo que no tiene nada que ver con ésta
investigación. Si su niño/a es parte de ésta investigación, los resultados de las pruebas de multiplicación de
él/ella de ninguna manera afectará la calificación de educación física o de matemáticas.
No se ven posibles riesgos y/o incomodidades de que su niño/a posiblemente podría tener durante esta
investigación. Los beneficio(s) que personalmente podrían recibir por participar en ésta investigación es que
su niño/a entendería mejor las tablas básicas de multiplicación lo que le ayudaría a su niño a entender más
temas avanzados de matemáticas. Si este programa se encuentra eficaz, su niño/a y todos los estudiantes en
el futuro podrían beneficiarse de este programa para usarse regularmente.
Aunque la política de la Universidad de Northern Illinois no provee compensación por un tratamiento de
algunas heridas que podrían resultar de la participación en las actividades de la investigación, esto no significa
que pueda perder sus derechos legales como un resultado de la participación de este estudio.
La información obtenida durante ésta investigación puede ser publicada en revistas científicas o presentada en
reuniones científicas, pero cualquier información que pueda identificar a su niño/a será estrictamente
confidencial.
La participación en ésta investigación es voluntaria. Su decisión y la de su niño/a para participar o no
participar en esta investigación no los afectará negativamente. A su niño/a se le preguntará previamente
antes de que comience la investigación si quiere participar en ésta investigación y será libre de dejar de
participar en la investigación en cualquier tiempo sin ser penalizado o perjudicado.
Si tiene algunas preguntas sobre la investigación deberá preguntar a William McGuire al número
(815) 754-2360 ó mandar un correo electrónico a [email protected]. También puede contactar a la
Dra. Rosita Lopez (dissertation chairperson) al número (815) 753-9336 ó mandar un correo electrónico
a [email protected] o [email protected].
Si usted desea más información sobre sus derechos o de su niño/a como un participante de una investigación,
puede contactar a la oficina Office of Research Compliance localizada en la Universidad de Northern Illinois
al número (815) 753-8588.
Por favor lea, firme y escriba la fecha abajo en el formulario de consentimiento si usted le da permiso a su
niño/a de participar en la investigación. También, por favor hable sobre la investigación con su niño/a.
Después de hablar con él/ ella tiene que firmar y poner la fecha en la parte de abajo donde dice acuerdo, si él o
ella quiere participar en la investigación. SOLAMENTE regrese la siguiente parte de la hoja a la Escuela
Cortland antes del 20 de enero, 2016.
------------------------------------------------------------------------------------------------------------------

151
CONSENTIMIENTO: Yo estoy de acuerdo en darle permiso a mi niño/a para que sea participante en ésta
investigación y admito que he recibido una copia de este formulario de consentimiento.
Firma del Padre/ Tutor Fecha
ACUERDO: La firma de mi niño/a significa que yo, el padre/tutor, he hablado sobre ésta investigación con
él/ella y está de acuerdo en ser participante de ésta investigación.
_______________________________________________________________________
Firma del Estudiante Participante Fecha

APPENDIX C
LETTER TO PRINCIPALS

153
January 6, 2016
Third Grade Parents/Guardians:
Mr. McGuire, one of our physical education instructors at Cortland Elementary School, and the third
grade teachers are excited to share with you that your child will have an opportunity to be part of a
research project by Mr. McGuire that uses hopscotching during their regular physical education class to
help students learn their multiplication facts through pattern recognition. The third grade teachers at
Cortland Elementary School appreciate that their students could be getting extra practice with learning
multiplication facts because this extra practice could allow students to more quickly understand their
multiplication facts which could then allow students to better understand more complex math topics.
We would like you to join us on Tuesday, January 12th at 6:30 pm, in the Cortland Elementary School
cafeteria, where Mr. McGuire will give a detailed presentation describing his research. A question and
answer session will follow. Your child may come along, as well, but during the presentation your child
will be asked to go into the gymnasium where your child can shoot baskets, play catch with friends, or
jump rope. Parents can join their child in the gymnasium after Mr. McGuire’s presentations for a few
minutes of family game time. Families may stay until 7:30 pm.
In the very near future, Mr. McGuire will be sending home a Consent/Assent form which would give
your child permission to be part of this study. We are looking for 100% participation from our 3rd grade
students so when you receive this Consent/Assent form please sign it and return it to school
immediately. If you have any questions please do not hesitate to call Mr. McGuire at the school at 815-
754-2360.
Sincerely yours,
Mrs. Hilliard, Principal Mr. McGuire, PE Instructor Ms. Cisneros, 3rd Grade Teacher Mrs. Roschmann, 3rd Grade Teacher Ms. Stawinoga, 3rd Grade Teacher Mrs. Stringer, 3rd Grade Teacher

154
APPENDIX C (SpanishVersion)
6 de enero, 2016
Padres/ Tutores de tercer grado:
El maestro McGuire, uno de los maestros de educación física de la Escuela Cortland, y los maestros de
tercer grado están emocionados de compartir con usted que su hijo/a tendrá la oportunidad de formar
parte de un proyecto de investigación por el maestro McGuire, que usará el juego de la rayuela (un
juego donde se dibujan cuadros en el piso y los niños saltan de un cuadro a otro) durante su clase
normal de educación física, para ayudar a los estudiantes a aprender las tablas de multiplicar por medio
de un patrón. Las maestras de tercer grado de la Escuela Cortland, aprecian que sus estudiantes puedan
tener más práctica con el aprendizaje de las tablas de multiplicar porque esta práctica les permite a los
estudiantes que las comprendan rápidamente, después les podría ayudar a tener un mejor
entendimiento en los temas de matemáticas más complejos.
Nos gustaría que se reunieran el martes 21 de enero a las 6:30 pm, en la cafetería de la Escuela
Cortland, donde el maestro McGuire dará una presentación detallada para describir su proyecto de
investigación. Habrá una sesión de preguntas y respuestas. Puede traer a su niño/a también, pero
durante la presentación su niño/a tendrá que irse al gimnasio dónde él/ella podrán tirar el balón a la
canasta, jugar con los amigos, o brincar la cuerda. Los padres pueden reunirse con su niño/a en el
gimnasio después de la presentación del maestro McGuire para un juego familiar por unos minutos
hasta las 7:30 pm.
En un futuro cercano, el maestro McGuire mandará a casa un formulario de consentimiento/ acuerdo en
el cual usted dará permiso a su niño/a para ser parte de este estudio. Estamos esperando el 100% de
participación de nuestros estudiantes de 3er grado, así que cuando usted reciba el formulario de
consentimiento/acuerdo por favor fírmelo y regréselo a la escuela inmediatamente. Si tiene algunas
preguntas por favor no dude en llamar al maestro McGuire al número de escuela 815-754-2360.
Atentamente,
Mrs. Hilliard, Directora Mr. McGuire, Maestro de Educación Física Ms. Cisneros, Maestra de 3er Grado Mrs. Roschmann, Maestra de 3er Grado Ms. Stawinoga, Maestra de 3er Grado Mrs. Stringer, Maestra de 3er Grado

APPENDIX D
PRINCIPAL CONSENT FORM FOR RESEARCH PARTICIPATION

156
CONSENT FORM FOR RESEARCH PARTICIPATION (Principal)
You, as the principal of the research school, are invited to participate in a research study entitled,
The Effects on Student Academic Development and Teacher Perception as a Result of Teaching
3rd Grade Students Multiplication Facts Through An Interdisciplinary Approach to Teaching
Physical Education being conducted by William McGuire a doctoral candidate at Northern
Illinois University. The specific focus of this research is to see if any significant, positive
academic effects occur as a result of teaching basic multiplication facts through the physical
activity of hopscotching.
The students in your school’s third grade classes could be in one of three research groups. Two of the
groups will be given an intervention while a third group will serve as the control. A fourth group will
be created but will not be part of the research. One of the two intervention groups will receive the
intervention called Hopscotch Math in its entirety. Hopscotch Math is a program that uses hopscotching,
flashcard practice, worksheets, and student learning logs in an attempt to enhance multiplication facts
development through pattern recognition. The second intervention group will receive the same program
without the hopscotching portion of the program. The third group is the control group and will receive
no intervention. Interventions will be used two to three times per week for approximately 8 weeks. The
start of the research is January 6th, 2016, but the actual interventions will not start until January 25th,
2016, and will end on March 18th, 2016.
The study is looking to see how getting extra practice with basic multiplication facts by moving and
learning at the same time affects the scores on a 50-question multiplication test using numbers 1 through
10 in combination. There will be a pre-test, a mid-intervention test, and a post-test given in order to
analyze each intervention’s effectiveness. All three groups will take all three tests.
As part of this research, you will randomly select 3rd grade students subjects to be in the research groups.
You will also create random student identification numbers for each student subject in order to keep
their anonymity. You will be the only person who knows this information. You will administer the pre-,
mid-, and post-intervention multiplication tests given to the student subjects. Before giving the tests to
the student subjects you will write their student research identification number on the top of their tests.
Names will not be used. You will also store all multiplication test, consent forms, and anecdotal records
in the schools safe for a minimum of 3 years.
This research will be conducted during your students’ normal physical education class. If any of your
students do not participate in this study, these students will have PE class at their normal PE time, but
will be taught by another physical education instructor who is not a part of administering the research
intervention and who will be teaching content that has nothing to do with this research. For the
students that are part of this research, their results on the multiplication tests will not in any way affect
their PE grade or math grade.
There are no foreseeable risks and/or discomforts that you or your students could potentially
experience during this study. The benefit(s) your students could personally receive from participating
in this study is that your students could better understand basic multiplication facts which could then
help your students understand more advanced math topics. If this program is found effective, your
students and all students in the future could benefit from this program being used regularly.

157
Although Northern Illinois University policy does not provide for compensation for treatment of any
injuries that may result from participation in research activities, this does not mean you waive any legal
rights you or your students have as a result of participation in this study.
Information obtained during this study may be published in scientific journals or presented at scientific
meetings, but any information which could identify you or your students will be kept strictly
confidential.
Participation in this study is voluntary. Your decision to participate or not to participate in this
research will not negatively affect you in any way. Let it be known, as well, that your students will
be asked if they want to participate in this study before the research begins and will be free to stop
participating in this research at any time without penalty or prejudice.
Any questions about the study should be addressed to William McGuire at (815) 754-2360 or
send an email to [email protected]. You may also contact Dr. Rosita Lopez (dissertation
chairperson) at (815) 753-9336 or send her an email at [email protected] or
If you wish further information regarding your rights as a research participant, you may contact the
Office of Research Compliance at Northern Illinois University at (815) 753-8588.
Please read, sign, and date the consent form below if you choose to participate in this research. Return
ONLY the bottom portion of this page to Cortland School by January 20th, 2016.
--------------------------------------------------------------------------------------------------------------
CONSENT: I agree to participate in this research study and acknowledge that
I have received a copy of this consent form.
--------------------------------------------------------------- -----------------------------
Signature of School Principal Participant Date
Reference:
Schroeder, P. (1998). Hopscotch math: An interaction unit with hopscotch patterns for learning
multiplication and division facts. Fort Atkinson, WI: Interaction Publishers, Inc.

APPENDIX E
3RD GRADE TEACHER CONSENT FORM FOR RESEARCH PARTICIPATION

159
CONSENT FORM FOR RESEARCH PARTICIPATION (3rd Grade Teacher)
You, as a teacher of 3rd grade students, are invited to participate in a research study entitled, The
Effects on Student Academic Development and Teacher Perception as a Result of Teaching 3rd
Grade Students Multiplication Facts Through An Interdisciplinary Approach to Teaching
Physical Education being conducted by William McGuire, a doctoral candidate at Northern
Illinois University. The specific focus of this research is to see if any significant, positive
academic effects occur as a result of teaching basic multiplication facts through the physical
activity of hopscotching.
The students in your class could be in one of three research groups. Two of the groups will be given an
intervention while a third group will serve as the control. A fourth group will be created but will not be
part of the research. One of the two intervention groups will receive the intervention called Hopscotch
Math in its entirety. Hopscotch Math is a program that uses hopscotching, flashcard practice,
worksheets, and student learning logs in an attempt to enhance multiplication facts development through
pattern recognition. The second intervention group will receive the same program without the
hopscotching portion of the program. The third group is the control group and will receive no
intervention. Interventions will be used two to three times per week for approximately 8 weeks. The
start of the research is January 6th, 2016, but the actual interventions will not start until January 25th,
2016, and will end on March 18th, 2016.
The study is looking to see how getting extra practice with basic multiplication facts by moving and
learning at the same time affects the scores on a 50-question multiplication test using numbers 1 through
10 in combination. There will be a pre-test, a mid-intervention test, and a post-test given in order to
analyze each intervention’s effectiveness. All three groups will take all three tests.
As part of this research, you will be asked to observe and take notes regarding your students’ academic
behaviors during the research. Though you will know which of you students are in the different research
groups, you will be asked not to report out with regard to individual students, but instead to report out
with regard to the individual research groups as a whole. You will also be asked to take part in a mid-
intervention and post-intervention round-table discussion with your 3rd grade teacher colleagues and the
researcher. Again, discussion will pertain to individual research groups, not individual students. The
round-table meetings will not be audio or video recorded, but instead the researcher will be taking
written notes. These round-table discussions will be held before school from 7:30 a.m. until 8:00 a.m.
There will be two questions asked. These questions will be: “What have you noticed with regard to
overall student academic progress with regard to multiplication facts development since the start of this
study?” and “What attitude or behavior changes have you noticed with regard to multiplication facts
development since the start of this study?” The researcher will be looking for common themes that
develop as a result of these round-table discussions. Lastly, eight times during this research you will be
asked to replace your normal daily writing prompt for the students who are part of this research with a
writing prompt given to you by the researcher. This writing assignment will be recorded in each
student’s Student Learning Logs (Schroeder, 1998). You will be looking at the student responses to
these prompts and will be making written comments to each individual student, but these prompt
responses cannot be used to determine student classroom grades.

160
Aside from the student observation notes taken by you and the student writing samples created during
your class time, the research will be conducted during your students’ normal physical education class.
If any of your students do not participate in this study, these students will have PE class at their
normal PE time, but will be taught by another physical education instructor who will be teaching
content that has nothing to do with this research. For the students that are part of this research, their
results on the multiplication tests will not in any way affect their PE grade or math grade.
There are no foreseeable risks and/or discomforts that you or your students could potentially
experience during this study. The benefit(s) your students could personally receive from participating
in this study is that your students could better understand basic multiplication facts which could then
help your students understand more advanced math topics. If this program is found effective, your
students and all students in the future could benefit from this program being used regularly.
Although Northern Illinois University policy does not provide for compensation for treatment of any
injuries that may result from participation in research activities, this does not mean you waive any legal
rights you or your students have as a result of participation in this study.
Information obtained during this study may be published in scientific journals or presented at scientific
meetings, but any information which could identify you or your students will be kept strictly
confidential.
Participation in this study is voluntary. Your decision to participate or not to participate in this
research will not negatively affect you in any way. Let it be known, as well, that your students will
be asked if they want to participate in this study before the research begins and will be free to stop
participating in this research at any time without penalty or prejudice.
Any questions about the study should be addressed to William McGuire at (815) 754-2360 or
send an email to [email protected]. You may also contact Dr. Rosita Lopez (dissertation
chairperson) at (815) 753-9336 or send her an email at [email protected] or
If you wish further information regarding your rights as a research participant, you may contact the
Office of Research Compliance at Northern Illinois University at (815) 753-8588.
Please read, sign, and date the consent form below if you choose to participate in this research. Return
ONLY the bottom portion of this page to Cortland School by January 20th, 2016.
------------------------------------------------------------------------------------------------------------------
CONSENT: I agree to participate in this research study and acknowledge that
I have received a copy of this consent form.
------------------------------------------------------ -----------------------------
Signature of Teacher Participant Date

161
Reference:
Schroeder, P. (1998). Hopscotch math: An interaction unit with hopscotch patterns for learning
multiplication and division facts. Fort Atkinson, WI: Interaction Publishers, Inc.
APPENDIX F
PE TEACHER CONSENT FORM FOR RESEARCH PARTICIPATION

163
CONSENT FORM FOR RESEARCH PARTICIPATION (PE Teacher)
You, as a physical education teacher of 3rd grade students, are invited to participate in a research
study entitled, The Effects on Student Academic Development and Teacher Perception as a
Result of Teaching 3rd Grade Students Multiplication Facts Through An Interdisciplinary
Approach to Teaching Physical Education being conducted by William McGuire a doctoral
candidate at Northern Illinois University. The specific focus of this research is to see if any
significant, positive academic effects occur as a result of teaching basic multiplication facts
through the physical activity of hopscotching.
The students in your class could be in one of three research groups. Two of the groups will be given an
intervention while a third group will serve as the control. A fourth group will be created but will not be
part of the research. One of the two intervention groups will receive the intervention called Hopscotch
Math in its entirety. Hopscotch Math is a program that uses hopscotching, flashcard practice,
worksheets, and student learning logs in an attempt to enhance multiplication facts development through
pattern recognition. The second intervention group will receive the same program without the
hopscotching portion of the program. The third group is the control group and will receive no
intervention. Interventions will be used two to three times per week for approximately 8 weeks. The
start of the research is January 6th, 2016, but the actual interventions will not start until January 25th,
2016, and will end on March 18th, 2016.
The study is looking to see how getting extra practice with basic multiplication facts by moving and
learning at the same time affects the scores on a 50-question multiplication test using numbers 1 through
10 in combination. There will be a pre-test, a mid-intervention test, and a post-test given in order to
analyze each intervention’s effectiveness. All three groups will take all three tests.
As part of this research, you will be trained by the researcher on how to specifically administer
Hopscotch Math: An interaction unit with hopscotch patterns for learning multiplication and division
facts (Schroeder, 1998). This includes direct instruction, flashcard practice, worksheets, and
hopscotching.
This research will be conducted during your students’ normal physical education class. If any of your
students do not participate in this study, these students will have PE class at their normal PE time, but
will be taught by another physical education instructor who will be teaching content that has nothing
to do with this research. For the students that are part of this research, their results on the
multiplication tests will not in any way affect their PE grade or math grade.
There are no foreseeable risks and/or discomforts that you or your students could potentially
experience during this study. The benefit(s) your students could personally receive from participating
in this study is that your students could better understand basic multiplication facts which could then
help your students understand more advanced math topics. If this program is found effective, your
students and all students in the future could benefit from this program being used regularly.
Although Northern Illinois University policy does not provide for compensation for treatment of any
injuries that may result from participation in research activities, this does not mean you waive any legal
rights you or your students have as a result of participation in this study.

164
Information obtained during this study may be published in scientific journals or presented at scientific
meetings, but any information which could identify you or your students will be kept strictly
confidential.
Participation in this study is voluntary. Your decision to participate or not to participate in this
research will not negatively affect you in any way. Let it be known, as well, that your students will
be asked if they want to participate in this study before the research begins and will be free to stop
participating in this research at any time without penalty or prejudice.
Any questions about the study should be addressed to William McGuire at (815) 754-2360 or
send an email to [email protected]. You may also contact Dr. Rosita Lopez (dissertation
chairperson) at (815) 753-9336 or send her an email at [email protected] or
If you wish further information regarding your rights as a research participant, you may contact the
Office of Research Compliance at Northern Illinois University at (815) 753-8588.
Please read, sign, and date the consent form below if you choose to participate in this research. Return
ONLY the bottom portion of this page to Cortland School by January 20th, 2016.
--------------------------------------------------------------------------------------------------------------
CONSENT: I agree to participate in this research study and acknowledge that
I have received a copy of this consent form.
------------------------------------------------------ -----------------------------
Signature of Teacher Participant Date
Reference:
Schroeder, P. (1998). Hopscotch math: An interaction unit with hopscotch patterns for learning
multiplication and division facts. Fort Atkinson, WI: Interaction Publishers, Inc.

APPENDIX G
LETTER TO PARENTS/GUARDIANS

166
May 18, 2016
Dear Parents/Guardians:
The research entitled, The Effects on Student Academic Development and Teacher
Perception as a Result of Teaching 3rd Grade Students Multiplication Facts Through An
Interdisciplinary Approach to Teaching Physical Education, that was conducted during your
child’s PE class has concluded and was analyze by NIU’s Statistical Consulting Services, a
Division of the Statistics Department within the College of Liberal Arts and Sciences.
I would like to provide an opportunity for the parents/guardians of all 3rd grade students
to be briefed on the results of this study, regardless if your child was in the study or not. If your
child was part of this research and was in one of the intervention groups, your child’s individual
results can be disclosed to you, as well.
Please join me in the Cortland School cafeteria on Tuesday, May 24th at 6:00 pm to find
out the result of this study. This meeting should only last about 10 minutes, but I would be
happy to stay after this meeting to answer any question you might have.
Sincerely,
Mr. McGuire

167
APPENDIX G (Spanish Version)
18 de mayo, 2016
Queridos Padres/Tutores:
El estudio titulado, Los efectos en el desarrollo académico del estudiante y la percepción de maestro como un resultado de enseñar las tablas de multiplicación en tercer grado a través de una manera interdisciplinaria de enseñar la educación física, que fue conducido durante la clase de educación física de su hijo/a ha concluído y fue analizado por los servicios de consultación estadística de NIU, una división del departamento estadístico dentro del Colegio de ciencias y artes liberales.
Quisiera proveerles una oportunidad para los padres/tutores de todos los estudiantes de tercer grado de ser informados acerca de los resultados de este estudio, si su hijo/a fue parte del estudio o no. Si su hijo/a fue parte del estudio y estuvo en uno de los grupos de intervención, los resultados individuales de su hijo/a también serán dados a conocer.
Por favor reúnanse conmigo en la cafetería de la Escuela Cortland el martes, 24 de mayo a las 6:00 pm para saber el resultado de este estudio. Esta reunión debe durar 10 minutos, pero estaría a gusto de quedarme después para contestar cualquier pregunta que pudieran tener.
Atentamente,
Mr. McGuire

APPENDIX H
DAY-BY-DAY SCHEDULE OF LESSONS FOR THE
TWO INTERVENTION GROUPS
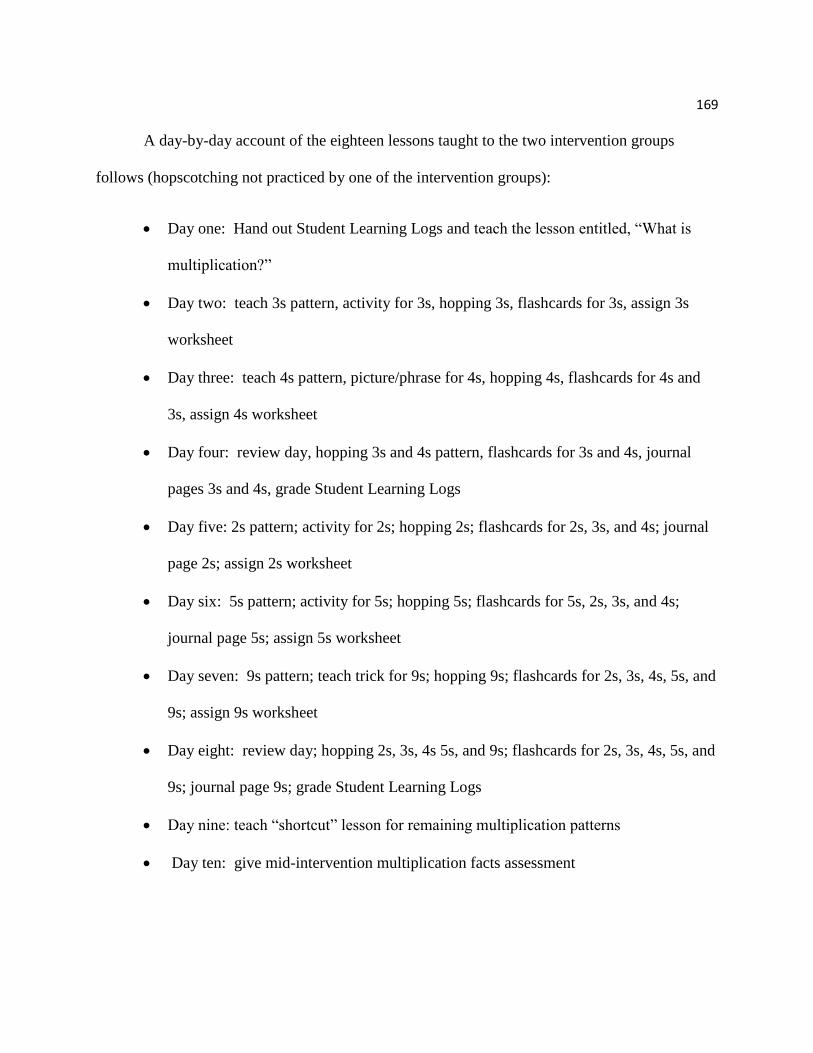
169
A day-by-day account of the eighteen lessons taught to the two intervention groups
follows (hopscotching not practiced by one of the intervention groups):
Day one: Hand out Student Learning Logs and teach the lesson entitled, “What is
multiplication?”
Day two: teach 3s pattern, activity for 3s, hopping 3s, flashcards for 3s, assign 3s
worksheet
Day three: teach 4s pattern, picture/phrase for 4s, hopping 4s, flashcards for 4s and
3s, assign 4s worksheet
Day four: review day, hopping 3s and 4s pattern, flashcards for 3s and 4s, journal
pages 3s and 4s, grade Student Learning Logs
Day five: 2s pattern; activity for 2s; hopping 2s; flashcards for 2s, 3s, and 4s; journal
page 2s; assign 2s worksheet
Day six: 5s pattern; activity for 5s; hopping 5s; flashcards for 5s, 2s, 3s, and 4s;
journal page 5s; assign 5s worksheet
Day seven: 9s pattern; teach trick for 9s; hopping 9s; flashcards for 2s, 3s, 4s, 5s, and
9s; assign 9s worksheet
Day eight: review day; hopping 2s, 3s, 4s 5s, and 9s; flashcards for 2s, 3s, 4s, 5s, and
9s; journal page 9s; grade Student Learning Logs
Day nine: teach “shortcut” lesson for remaining multiplication patterns
Day ten: give mid-intervention multiplication facts assessment

170
Day eleven: 8s pattern; hopping 8s; flashcards for 8s, 2s, 3s, 4s, 5s, and 9s; 8s
worksheet
Day twelve: review day; hopping 8s and 9s; flashcards for 2s, 3s, 4s, 5s, 8s, and 9s;
journal page 8s; grade Student Learning Logs
Day thirteen: 6s pattern; picture/phrase for 6s; hopping 6s; flashcards for 6s, 2s, 3s,
4s, 5s, 8s, and 9s; assign 6s worksheet
Day fourteen: review day; hopping 2s, 3s, 4s, 5s, 6s, 8s, and 9 with emphasis on 6s,
8s, and 9s; flashcards for 2s, 3s, 4s, 5s, 6s, 8s, and 9s; journal page 6s, Grade Student
Learning Logs
Day fifteen: 7s pattern, mental math and explanation, hopping 7s, all flashcards,
assign 7s worksheet
Day sixteen: review day; hopping all patterns with emphasis on 6s, 7s, 8s, and 9s;
flashcards 2s-9s, journal page 7s, grade Student Learning Logs
Day seventeen: review day by practicing multiplication facts with the aid of hopping
patterns, phrases, pictures, flashcards, and peer tutoring
Day eighteen: post-intervention multiplication facts assessment

APPENDIX I
STUDENT ASSENT FORM

172
Student Assent Form
Mr. McGuire has informed me about his research which is about learning
multiplication facts through hopscotching and I agree to be part of his research.
I understand that I could be put into one of four groups. I understand that
all four groups do different things and that only one group does hopscotching.
I understand that I can stop being part of this research whenever I want. I
understand that if I stop being part of this research I will have PE class during my
regular PE time but with another PE teacher who is teaching PE content that
doesn’t have to do with Mr. McGuire’s research.
________________________________ __________________
Student Subject Signature Date

173
APPENDIX I (Spanish Version)
Formulario de Acuerdo del Estudiante
El maestro McGuire me ha informado sobre su Proyecto de investigación lo
cual es sobre el aprendizaje de las tablas de multiplicar a través del juego avión y
yo estoy de acuerdo en participar en esta investigación.
Yo entiendo que me podrían poner en uno de los cuatro grupos. Entiendo
que todos los cuatro grupos hacen diferentes cosas y que solamente uno de los
grupos hace el juego del avión.
Yo entiendo que puedo dejar de ser parte de esta investigación cuando
quiera. Entiendo que si dejo de ser parte de esta investigación tendré la clase de
educación física durante mi tiempo regular pero con otro maestro de educación
física que está enseñando el contenido de educación física que no tiene que ver
con la investigación del maestro McGuire.
________________________________ __________________
Firma del Estudiante Participante Fecha