Teachers' Education, Classroom Quality, and Young Children's Academic Skills: Results From Seven...
23
Teachers’ Education, Classroom Quality, and Young Children’s Academic Skills: Results From Seven Studies of Preschool Programs Diane M. Early, Kelly L. Maxwell, and Margaret Burchinal University of North Carolina at Chapel Hill Soumya Alva Westat Inc. Randall H. Bender RTI International Donna Bryant, Karen Cai, and Richard M. Clifford University of North Carolina at Chapel Hill Caroline Ebanks Institute of Education Sciences, U.S. Department of Education James A. Griffin National Institute of Child Health and Human Development, NIH Gary T. Henry University of North Carolina at Chapel Hill Carollee Howes University of California at Los Angeles Jeniffer Iriondo-Perez RTI International Hyun-Joo Jeon University of California at Los Angeles Andrew J. Mashburn University of Virginia Ellen Peisner-Feinberg University of North Carolina at Chapel Hill Robert C. Pianta University of Virginia Nathan Vandergrift University of North Carolina at Chapel Hill Nicholas Zill Westat Inc. In an effort to provide high-quality preschool education, policymakers are increasingly requiring public pre- school teachers to have at least a Bachelor’s degree, preferably in early childhood education. Seven major studies of early care and education were used to predict classroom quality and children’s academic outcomes from the educational attainment and major of teachers of 4-year-olds. The findings indicate largely null or contradictory associations, indicating that policies focused solely on increasing teachers’ education will not suffice for improving classroom quality or maximizing children’s academic gains. Instead, raising the effect- iveness of early childhood education likely will require a broad range of professional development activities and supports targeted toward teachers’ interactions with children. In the United States, 4-year-olds increasingly are being served in programs specifically designed to improve their school-readiness skills. This increasing focus on early learning skills for 4-year-olds is due in part to research in two areas. First, evidence ranging from studies of brain development to evaluations of preschool programs points to the importance of high-quality early childhood experiences in provid- ing the foundation for later school success (NICHD Early Child Care Research Network, 2005; National Research Council and Institute of Medicine, 2000; Peisner-Feinberg et al., 2001). Exposure to high- quality care appears especially important for at-risk children’s later school success (Burchinal et al., 2000; Campbell, Ramey, Pungello, Sparling, & Miller- r 2007 by the Society for Research in Child Development, Inc. All rights reserved. 0009-3920/2007/7802-0013 After the first three authors, all authors contributed equally to this project and are listed in alphabetical order. The national Early Head Start Research and Evaluation Project was funded by the Administration for Children and Families Child Development, March/April 2007, Volume 78, Number 2, Pages 558 –580
Transcript of Teachers' Education, Classroom Quality, and Young Children's Academic Skills: Results From Seven...

Teachers’ Education, Classroom Quality, and Young Children’s Academic
Skills: Results From Seven Studies of Preschool Programs
Diane M. Early, Kelly L. Maxwell, andMargaret Burchinal
University of North Carolina at Chapel Hill
Soumya AlvaWestat Inc.
Randall H. BenderRTI International
Donna Bryant, Karen Cai,and Richard M. Clifford
University of North Carolina at Chapel Hill
Caroline EbanksInstitute of Education Sciences, U.S. Department of
Education
James A. GriffinNational Institute of Child Health and Human
Development, NIH
Gary T. HenryUniversity of North Carolina at Chapel Hill
Carollee HowesUniversity of California at Los Angeles
Jeniffer Iriondo-PerezRTI International
Hyun-Joo JeonUniversity of California at Los Angeles
Andrew J. MashburnUniversity of Virginia
Ellen Peisner-FeinbergUniversity of North Carolina at Chapel Hill
Robert C. PiantaUniversity of Virginia
Nathan VandergriftUniversity of North Carolina at Chapel Hill
Nicholas ZillWestat Inc.
In an effort to provide high-quality preschool education, policymakers are increasingly requiring public pre-school teachers to have at least a Bachelor’s degree, preferably in early childhood education. Seven majorstudies of early care and education were used to predict classroom quality and children’s academic outcomesfrom the educational attainment and major of teachers of 4-year-olds. The findings indicate largely null orcontradictory associations, indicating that policies focused solely on increasing teachers’ education will notsuffice for improving classroom quality or maximizing children’s academic gains. Instead, raising the effect-iveness of early childhood education likely will require a broad range of professional development activities andsupports targeted toward teachers’ interactions with children.
In the United States, 4-year-olds increasingly arebeing served in programs specifically designed toimprove their school-readiness skills. This increasingfocus on early learning skills for 4-year-olds is due inpart to research in two areas. First, evidence rangingfrom studies of brain development to evaluations ofpreschool programs points to the importance of
high-quality early childhood experiences in provid-ing the foundation for later school success (NICHDEarly Child Care Research Network, 2005; NationalResearch Council and Institute of Medicine, 2000;Peisner-Feinberg et al., 2001). Exposure to high-quality care appears especially important for at-riskchildren’s later school success (Burchinal et al., 2000;Campbell, Ramey, Pungello, Sparling, & Miller-
r 2007 by the Society for Research in Child Development, Inc.All rights reserved. 0009-3920/2007/7802-0013
After the first three authors, all authors contributed equally tothis project and are listed in alphabetical order.
The national Early Head Start Research and Evaluation Projectwas funded by the Administration for Children and Families
Child Development, March/April 2007, Volume 78, Number 2, Pages 558 – 580

Johnson, 2002; Peisner-Feinberg et al., 2001;Reynolds, Temple, Robertson, & Mann, 2002;Schweinhart, 2004). Second, research has shown thatchildren from low-income families and childrenof color enter school with significantly fewer skillsthan their more advantaged and White peers (Lee &Burkam, 2002; McLanahan, 2005; Phillips, Brooks-Gunn, Duncan, Klebanov, & Crane, 1998; Stipek &Ryan, 1997).
In response to both these trendsFthe emphasis onthe early years, especially for children’s later schoolsuccess, and recognition that all children do not startschool on an equal footingFstates are increasinglyfunding programs to provide an early educationalexperience for 4-year-olds. For instance, in 2004–2005, over 800,000 children, mostly 4-year-olds, wereenrolled in state-funded prekindergarten, represent-ing 17% of the nation’s 4-year-olds and a 20% increasefrom 2001 – 2002. In 2004 – 2005 states spent 2.84 bil-lion dollars on prekindergarten initiatives (Barnett,Hustedt, Robin, & Schulman, 2005). Furthermore, thefederal government serves approximately 500,0004-year-olds through Head Start (U.S. Department ofHealth and Human Services, 2006). State and federalprograms for 4-year-olds aim to provide an educa-tional experience at a level of quality high enough tochange children’s developmental trajectory mean-ingfully. Policymakers and administrators establishprogram standards, such as teacher qualifications,
that are intended to ensure high-quality experiencesfor participating children.
Teacher qualifications have been identified as animportant correlate of classroom quality (Burchinal,Cryer, Clifford, & Howes, 2002; de Kruif, McWilliam,Ridley, & Wakely, 2000; Howes, Whitebook, & Phil-lips, 1992; NICHD ECCRN, 2002; Scarr, Eisenberg, &Deater-Deckard, 1994). Policymakers and programadvocates sometimes prioritize teacher qualificationsas a key strategy for ensuring that programs posi-tively affect children’s skills. Policies that mandatecertain levels of educational attainment are contro-versial because they are expensive to the public.Teacher salaries are one of the largest expenditures forany education program (Cost, Quality, & Child Out-comes Study Team, 1995; U.S. Department of Educa-tion, IES, 2004; Table 161) and salaries are closelylinked to educational requirements. Thus, policy-makers face the difficult task of identifying and set-ting teacher qualification standards high enough toproduce high-quality classrooms with the desiredchild outcomes and yet not so high that programscannot afford to pay the needed salaries or cannotrecruit enough teachers who meet the standards.
Teachers’ Education and Classroom Quality
Increasingly, early childhood advocates are callingfor all teachers of 3- and 4-year-olds to have at least a
(ACF), U.S. Department of Health and Human Services, undercontract 105-95-1936 to Mathematica Policy Research, Princeton,NJ, and Columbia University’s Center for Children and Families,Teachers College, in conjunction with the Early Head Start Re-search Consortium. The Consortium consists of representativesfrom 17 programs participating in the evaluation, 15 local researchteams, the evaluation contractors, and ACF.
The Head Start Family and Child Experiences Survey (FACES)was funded by the ACF, U.S. Department of Health and HumanServices, under task order 03Y00318101D to contract GS23F8144Hto Westat, Rockville, MD.
The Georgia Early Childhood Study (GECS) was funded in partby the UPS Foundation, National Institute for Early EducationResearch (NIEER), which is generously funded by the Pew Char-itable Trusts, and Bright from the Start: Georgia Department ofEarly Care and Learning.
The Evaluation of the North Carolina More at Four Prekinder-garten Program was funded by the North Carolina Department ofHealth and Human Services under contract #2090002872.
The Multi-State Study of Pre-Kindergarten was supported by theEducational Research and Development Center Program, PR/Award Number R307A60004, administered by the Institute of Ed-ucation Sciences (IES), U.S. Department of Education. The State-Wide Early Education Programs (SWEEP) Study was supported bythe NIEER, The Pew Charitable Trusts, and the Foundation forChild Development.
The National Institute of Child Health and Human Development(NICHD) Study of Early Child Care and Youth Development
(SECCYD) is directed by a Steering Committee and supported bythe NICHD through a cooperative agreement (U10), which calls forscientific collaboration between the grantees and the NICHD staff.No official support or endorsement by NICHD, NIH, or the U.S.Department of Health and Human Services is intended or shouldbe inferred.
Support for the analysis of data from the PCER was provided bythe IES, U.S. Department of Education, through a contract (ED-01-CO-0052/0004) to RTI International. The views expressed in thispaper are those of the authors and do not represent the views of theU.S. Department of Education. James Griffin worked for the IES,U.S. Department of Education, and served as the Preschool Cur-riculum Evaluation Research (PCER) Program Project Officer whenthe data reported here were collected and analyzed. This articlewas coauthored by James Griffin in his private capacity.
Finally, the authors would like to thank the Foundation for ChildDevelopment for partial support of the preparation of this manu-script, including a meeting to discuss preliminary findings.
The authors are grateful for the help of the many children,parents, teachers, administrators, and field staff who participatedin these studies, as well as several colleagues who reviewed anearlier version of this paper. The views expressed in this paper arethose of the authors and do not represent the views of the fundingagencies.
Correspondence concerning this article should be addressed toDiane M. Early, FPG Child Development Institute, CB 8040, Uni-versity of North Carolina at Chapel Hill, Chapel Hill, NC 27599.Electronic mail may be sent to [email protected]
Teachers’ Education in Preschool Programs 559
Bachelor’s degree, often also including a major inearly childhood education or state certification toteach this age group (Barnett, 2003; Barnett et al.,2005; National Research Council, 2001; Trust forEarly Education, 2004). Many public prekindergar-ten programs are following this recommendation.According to the National Institute for EarlyEducation Research (NIEER; Barnett et al., 2005),17 of 38 states with prekindergarten programsrequire that all lead teachers hold a Bachelor’sdegree, and another 12 states require a Bachelor’sdegree for at least some of their prekindergartenteachers. Furthermore, 27 states require that theteachers have specialized training in early childhoodeducation.
This push for every preschool teacher to have aBachelor’s degree in early childhood education isbased on two lines of past research: (1) studies,generally from community-based child-care settings;linking teachers’ education to classroom quality, and(2) research linking early care and education class-room quality to children’s academic gains. Logically,if programs are interested in children’s academicgains, improving teachers’ education seems to be areasonable place to start.
In the child-care literature, most research indicatesthat higher levels of teachers’ education are linked tohigher global quality in center-based care (Burchinalet al., 2002; de Kruif, et al., 2000; Howes et al., 1992;NICHD ECCRN, 2002; Scarr et al., 1994). However,one study of state-funded prekindergarten, usingsome of the data included in the current project,found largely null associations (Early et al., 2006)and other research is not entirely conclusive. Forinstance, using data from the Cost, Quality, andOutcomes study, both Blau (2000) and Phillipsen,Burchinal, Howes, and Cryer (1997) found that levelof teachers’ education was associated with quality inuncontrolled models; however, once a host of parent-and center-level variables known to be linked toquality were added to the model, the associationwith teachers’ education disappeared. Likewise,Phillips, Mekos, Scarr, McCartney, and Abbott-Shim(2001) found significant, positive zero-order correl-ations between teachers’ level of education andclassroom quality and between teacher training inearly childhood education and classroom quality.However, these effects disappeared for preschoolerswhen hierarchical multiple-regression models con-trolled for regulatory stringency, regulatory compli-ance, group size, and ratio. Thus, the relationbetween teachers’ education and quality classroomsis sometimes evident only when simple analysistechniques are utilized, and the relationship weakens
when a more complex model is used. This is possiblydue to the fact that teachers’ education tends to becorrelated with these other important predictors ofclassroom quality, making it difficult to tease themapart. It may be that some type of selection is takingplace, possibly in the form of more highly educatedteachers choosing to work in higher quality settings(Hamre & Bridges, 2004).
Tout, Zaslow, and Berry (2005) recently completeda review of the research examining links betweenearly childhood teachers’ education and classroomquality. They concluded that higher levels ofteacher education, especially education that focuseson early childhood development, are generallylinked to higher quality, but that there is insufficientresearch addressing ‘‘thresholds’’ to supporta specific cut point. In other words, whereas theexisting literature generally indicates that moreeducation may be beneficial, there is no conclusiveevidence that a teacher with a Bachelor’s degreeor any other specific level of education will produceor ensure a high-quality classroom or children’slearning.
The lack of common definitions of education andtraining, coupled with the use of different controls indifferent studies, severely limit our ability to drawstraightforward conclusions from the existing earlychildhood literature (Maxwell, Feild, & Clifford,2005; Tout et al., 2005). The current study aims toaddress this problem by asking the same set ofquestions, using the same set of definitions andcontrols, across a number of large data sets. Usingthis strategy, we can be confident that any differen-ces in findings are not due to differences in definitionor methodology. The study approach allows us totest the direct effects of teacher education on class-room quality and children’s skills using a value-added specification.
Purpose
The goal of the current project was to consider thelinks between teachers’ education, specifically edu-cational degree and major, and two important out-comesFclassroom quality as well as children’sacademic skills in the year before kindergarten entry.To answer the research questions with the greatestdegree of confidence, we conducted a series ofcommon analyses using comparable data from sevenmajor studies. Thus, unlike past research in this areathat has used different definitions, different meth-odologies, and different statistical approaches, theanswers derived from the current analyses aredirectly comparable to one another.
560 Early et al.

Research Questions
In light of the mixed evidence from past researchand rapidly expanding public early education pro-grams, it is important to answer some basic ques-tions with regard to teachers’ education and major.Policymakers want to know what set of policiesregarding teachers’ education and major are mostlikely to lead to high-quality classrooms wherechildren make meaningful academic gains. Policy-makers are not in a position to interpret the subtletiesof various types of education and training. For ex-ample, whereas researchers may suspect that de-grees from some colleges and universities are morevaluable than others, policymakers are not likely torequire that all teachers have degrees from a limitedpool of schools. Likewise, whereas recent changes inteacher preparation programs may have increasedthe value of some degrees, policymakers cannot re-quire that all teachers be recent graduates. Highlynuanced information about the precise types of in-struction, experiences, and skills teachers shouldhave would be of great interest to the early child-hood field and should be examined to improvequality and outcomes. However, policymakers arenot likely to request or use this detailed informationin promoting child development through early ed-ucation programs. The goal of this project, then, is toanswer questions that policymakers who are settingstandards for early childhood programs might ask.
This project uses data from multiple studies toanswer three questions:
(1) Does the educational degree of lead teachersrelate to observed classroom quality andchildren’s academic skills using a value-addedspecification? And, more specifically, doteachers with a Bachelor’s degree or higherhave classrooms of higher quality or childrenwho learn more during the prekindergartenyear?
(2) Among lead teachers whose highest degreewas in early childhood education or childdevelopment, does the level of the highestdegree predict classroom quality and/or chil-dren’s academic skills using a value-addedspecification?
(3) Among teachers whose highest degree is aBachelor’s, does a major in early childhoodeducation or child development predict betterquality or greater academic skills than a majorin another field of education or a noneduca-tion major, controlling for baseline skill levelsusing a value-added specification?
Originally, we intended to test the value ofan early childhood major among Associate’s degree-level teachers as well (parallel to question 3). How-ever, no study had enough variance in teacher majoramong the Associate’s level teachers to conductmeaningful analyses.
Method
Participating Studies
The goal of this project was to analyze severallarge data sets using similarly defined variables andequivalent model specification to answer a commonset of questionsFan analysis strategy we call ‘‘rep-licated secondary data analysis.’’ This techniqueinvolves selecting studies that contain similar infor-mation, gathered in the same way, and using com-mon analysis protocols across data sets so that anydifferences in relations among the variables are at-tributable to the sample or study circumstances, ra-ther than to different data collection strategies,variable operationalizations, or analysis techniques.All participating studies had to meet three criteria:(1) contain data about teachers’ education, (2) con-tain observed classroom quality data, and (3) containdirect assessments of children’s academic skillsduring the 4-year-old year, plus pretest data thatcould be used to control for prior child functioning.In addition, five of seven studies are statisticallyrepresentative because each is based on a samplethat was randomly selected to represent a knownpopulation. The first three authors identifiedeight studies that met these criteria; seven of theeight participated. These studies were not designedor conducted jointly, and therefore some differencesexist in available variables; nonetheless, these sevenare sufficiently similar that we believe any differencesin findings must be attributed to differences in sam-ples, rather than methodology or analysis strategy.
Several safeguards were put in place to ensurethat the data were analyzed consistently acrossstudies. The first and second authors reviewed eachstudy’s questionnaire and interview protocols andselected the appropriate questions for specifying theteacher education and major variables. Each studywas provided with a set of specific instructions forcreating the needed analysis and control variables,handling missing data, and specifying the models.Furthermore, each study was provided with a sam-ple SAS code that could be modified to ensure thatanalyses were conducted identically. Analyses forthree of the studies (More at Four [MAF], NationalCenter for Early Development and Learning
Teachers’ Education in Preschool Programs 561
[NCEDL], and NICHD) were conducted by the sameindividual. Data analysts for the other four studieswere in regular contact with the project’s lead dataanalyst (the manuscript’s third author). After initialanalyses were completed, each study’s data analystsand principal investigators participated in a 2-dayface-to-face meeting to discuss preliminary findings,analysis strategies, appropriate interpretation of thefindings, and next steps. The first author carefullyreviewed all data tables, checking for internal con-sistency. Analyses were rerun whenever inconsist-encies were discovered.
Study Descriptions
Table 1 briefly describes the seven participatingstudies.
Early Head Start (EHS) Follow-Up
The primary purpose of the EHS study was toassess the effectiveness of the EHS program. Low-income families and children who were eligible forEHS were selected from 17 sites, when their infantswere o12 months old. Participating children wereborn between July 1996 and September 1998. Thesefamilies and children were randomly assigned toreceive EHS services or to a control condition. Thechildren were followed every year from birth to 3years of age and then follow-up data were collectedagain immediately before beginning kindergarten.Data for the current analyses came from the follow-up wave, just before kindergarten entry (controllingfor assessments at 3 years of age). At that time, thechildren were no longer in their randomly assignedsetting and were attending a variety of early care andeducation settings (including 45% Head Start). Thecurrent analyses included children from both theEHS and control conditions. The two groups werecombined because participation in the experimentaltreatment (EHS vs. control) had ended more than ayear earlier, the teachers participating in the currentwave of the study were not affiliated with EHS, andthe role of earlier experiences is not a question ofinterest for the current analyses. For more detailsabout the EHS methodology, see Administration forChildren and Families (2002).
Head Start Family and Child Experiences Survey (FACES2003)
The primary purpose of the FACES 2003 studywas to describe the quality of Head Start programs ina nationally representative sample, toward the goal
of implementing a system of program performancemeasures and improving accountability for HeadStart programs. The sample comprising this longi-tudinal data set consisted of 63 randomly selectedHead Start programs, stratified by census region,percent minority, and urbanicity. As in earlier FACEScohorts from 1997 and 2000, FACES 2003 featuredfour phases of data collection and followed 3- and 4-year-old Head Start children from program entrythrough the spring of kindergarten. The currentanalyses are restricted to children who were 4 yearsold in Spring 2004 and include children’s assess-ments from the fall (2003) and spring (2004) of theirfirst year of Head Start. For more information on thisstudy and its methodology, see Zill and Resnick(2005) and Zill et al. (2003).
Georgia Early Care Study (GECS)
This study sought to examine the experiences anddevelopment of children attending public and pri-vate preschool in Georgia. The sample includes 128classrooms and 630 children, representing all full-day, full-year preschools in Georgia, including HeadStart, Georgia Pre-K, and private programs. To selectthe sample, counties were stratified by the number of4-year-olds and four to eight counties were selectedper strata. Georgia Pre-K, Head Start, and privatepreschools were then selected within each countyfrom complete lists obtained from the three agenciesthat administered each program. Within each se-lected site, one classroom was selected at random.Five children in each participating classroom wererandomly selected for participation from the chil-dren whose parents consented to have their childparticipate. The current analyses include child as-sessments from the fall and spring of the preschoolyear. For more details on this study, see Henry et al.(2003, 2004).
More at for (MAF) Evaluation
The primary purpose of the MAF Evaluation studywas to examine the quality of the program and out-comes for children participating in MAF, a statewideprekindergarten initiative for at-risk 4-year-olds inNorth Carolina. The classroom quality sample in-cluded 233 classrooms, randomly selected over twoprogram years from all those in operation across thestate. A subsample of 98 of these classrooms wasrandomly selected for child assessments, and thosechildren participating in the MAF program withinthese classrooms were recruited for the study. A totalsample of 785 children was included across the 2 years
562 Early et al.

Tab
le1
Stu
dyD
escr
ipti
ons
EH
SFA
CE
SG
EC
SM
AF
NC
ED
LN
ICH
DP
CE
R
Cla
ssro
om
sam
ple
887
310
128
233
721
639
76
Ch
ild
sam
ple
887
1041
630
785
2966
639
667
Yea
rq
ual
ity
and
po
stte
stco
llec
ted
2001
–20
03
(th
ree
coh
ort
s)
2004
2002
2002
–20
03an
d
2003
–20
04
2001
(Mu
lti-
Sta
te
Stu
dy
of
Pre
-K)
2004
(SW
EE
P)
1995
–19
9620
02–
2003
Po
pu
lati
on
anal
ysi
s
sam
ple
rep
rese
nts
Ch
ild
ren
wh
o
had
bee
nin
EH
SE
val
uti
on
Stu
dy
as
infa
nts
or
tod
dle
rs
4-y
ear-
old
chil
dre
n
enro
lled
inth
eir
firs
ty
ear
of
Hea
d
Sta
rtin
Fal
l20
03
Fu
ll-d
ay,
full
-yea
r
pre
sch
oo
l
par
tici
pan
tsin
Geo
rgia
incl
ud
ing
Hea
dS
tart
,G
eorg
ia
Pre
-Kan
dp
riv
ate
pro
gra
ms
MA
F(N
ort
h
Car
oli
na’
sst
ate-
fun
ded
pre
kin
der
gar
ten
pro
gra
m)
par
tici
pan
ts
Sta
tefu
nd
ed
pre
kin
der
gar
ten
clas
sro
om
san
d
chil
dre
nin
11
par
tici
pat
ing
stat
es
Ch
ild
ren
atth
e10
loca
tio
ns
acro
ss
the
Un
ited
Sta
tes
wh
ow
ere
ince
nte
r-
bas
edca
reth
ey
ear
bef
ore
kin
der
gar
ten
.
Co
ho
rt1
con
tro
lg
rou
p
chil
dre
nat
sev
en
loca
tio
ns
acro
ssth
e
Un
ited
Sta
tes
Per
cen
tH
ead
Sta
rt
Cla
ssro
om
s(%
)
4510
022
1516
947
Per
cen
tin
stat
e
pre
kin
der
gar
ten
(%)
NA
NA
5410
010
08
46
Per
cen
th
ou
sed
in
pu
bli
csc
ho
ols
(%)
NA
NA
1859
61N
A50
Mea
nch
ild
(SD
)ag
e
(mo
nth
s)at
Tim
e1
37.1
0(1
.41)
47.9
8(4
1.64
)55
.57
(3.4
9)54
.00
(3.4
5)55
.44
(3.8
4)36
(NA
)56
.17
(4.0
7)
Mea
nch
ild
(SD
)ag
e
(mo
nth
s)at
Tim
e2
62.3
6(3
.84)
53.5
0(4
0.98
)62
.47
(3.4
9)60
.96
(3.4
2)60
.60
(3.8
4)55
.53
(1.0
3)60
.63
(3.9
6)
Not
e.E
HS
5E
arly
Hea
dS
tart
;FA
CE
S5
Fam
ily
and
Ch
ild
Ex
per
ien
ces
Su
rvey
;G
EC
S5
Geo
rgia
Ear
lyC
hil
dh
oo
dS
tud
y;
MA
F5
Mo
reat
Fo
ur;
NA
5in
form
atio
nn
ot
avai
lab
le;
NC
ED
L5
Nat
ion
alC
ente
rfo
rE
arly
Dev
elo
pm
ent
and
Lea
rnin
g;
NIC
HD
5N
atio
nal
Inst
itu
teo
fC
hil
dH
ealt
han
dH
um
anD
evel
op
men
t;P
CE
R5
Pre
sch
oo
lC
urr
icu
lum
Ev
alu
atio
nR
esea
rch
.H
ead
Sta
rt,
stat
ep
rek
ind
erg
arte
n,
and
ho
use
din
pu
bli
csc
ho
ols
are
no
tm
utu
ally
excl
usi
ve
du
eto
ble
nd
edfu
nd
ing
stre
ams
and
var
iati
on
sin
stat
ein
itia
tiv
es.
Teachers’ Education in Preschool Programs 563

from these 98 classrooms. The current analysesinclude child assessment data from the fall and springof their MAF prekindergarten year and MAF class-room quality data that were gathered mid-year. Forfurther details about the methodology for these stud-ies, see Peisner-Feinberg and Maris (2005a, 2005b).
National Center for Early Development and Learning(NCEDL)
NCEDL conducted two studies of state-fundedprekindergarten: the Multi-State Study of Pre-Kin-dergarten and Study of State-Wide Early EducationPrograms (SWEEP). The goals and methodologies ofthe two studies were largely similar; therefore, theyhave been combined for the current analyses. Bothstudies sought to describe state-funded prekinder-garten programs in states that had large, well-es-tablished programs. In all, 11 states participated.In each state, sites were randomly selected fromlists provided by the states of sites providingstate-funded prekindergarten. Then, in each site, oneclassroom serving primarily 4-year-olds was selectedat random. Within each classroom, four childrenwho were old enough to attend kindergarten thefollowing year were selected. The current analysesinclude children’s assessments from the fall andspring of the prekindergarten year. For further de-tails about the methodologies for these studies, seeEarly et al. (2005).
Study of Early Child Care and Yolk Development(NICHD SECCYD)
This study was designed to examine the rela-tionship between child-care experiences and char-acteristics and children’s developmental outcomes.The participating children were a conditional ran-dom sample selected shortly after birth during hos-pital visits at 10 locations across the United States.Data were collected in whatever care and educationsetting the children attended. The current analysesinclude child assessments from 36 and 54 months.For more information on this study’s methodology,see NICHD SECC (n.d.).
Preschool Curriculum Evaluation Research Program(PCER) Program
The PCER Program was designed to conductsmall-scale efficacy evaluations of available pre-school curricula that had not been rigorously eval-uated. PCER began in 2002 when the IES in the U.S.Department of Education awarded grants to seven
researchers to implement several widely usedpreschool curricula, with Research Triangle Institute(RTI) International serving as the national evaluationcoordinator. The evaluations were conducted using acommon assessment protocol and a randomizedexperimental design. Participating classrooms orschools were randomly assigned to intervention orcontrol conditions. Only children assigned tothe control group classrooms for the pilot study(2002 – 2003) are represented in these analyses. Formore information regarding this project, see PCERProject (n.d.).
Variable Specification
Each study created a series of identical variablesto be included in analyses.
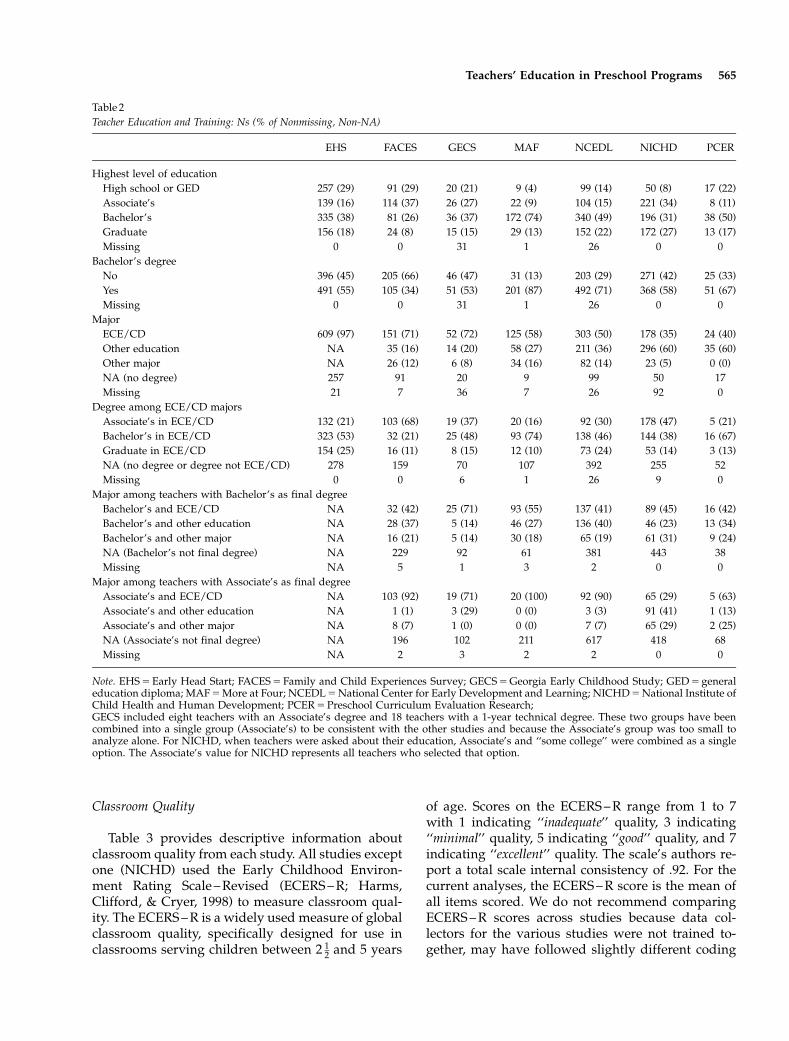
Teachers’ Education and Training
Distributions for all teachers’ education andtraining variables for each study are presented inTable 2.
Highest level of education. A four-level variable wascreated to specify the highest degree attained by thelead teacher. No study contained enough teacherswith less than a high school degree to create a sep-arate category; hence, those teachers were excludedfrom the analyses. The four levels were specified asfollows: (1) High school degree or general educationdiploma (GED). This category includes people whohave taken some college or technical courses but havenot received a postsecondary degree. (2) Associate’sdegree. (3) Bachelor’s degree. This category includespeople who have taken some graduate courseworkbut have not received a graduate degree. (4) Graduatedegree. Graduate is defined as any postbaccalaureatedegree such as MA, MEd, EdD, or PhD.
Bachelor’s degree. A two-level variable (Bachelor’svs. no Bachelor’s) was created in which the Bach-elor’s group includes all teachers with a Bachelor’sor Graduate degree as their highest level of educa-tion. The no-Bachelor’s group includes all teacherswith a high school diploma/GED or Associate’sdegree.
Major. A three-level variable was created to de-scribe the lead teacher’s major when she/he receivedher/his highest degree. The three categories were: (1)early childhood education or child development(ECE/CD), (2) any other education major, suchas elementary or special education, and (3) non-education major, including any field outside ofeducation such as psychology, sociology, biology, orbusiness.
564 Early et al.
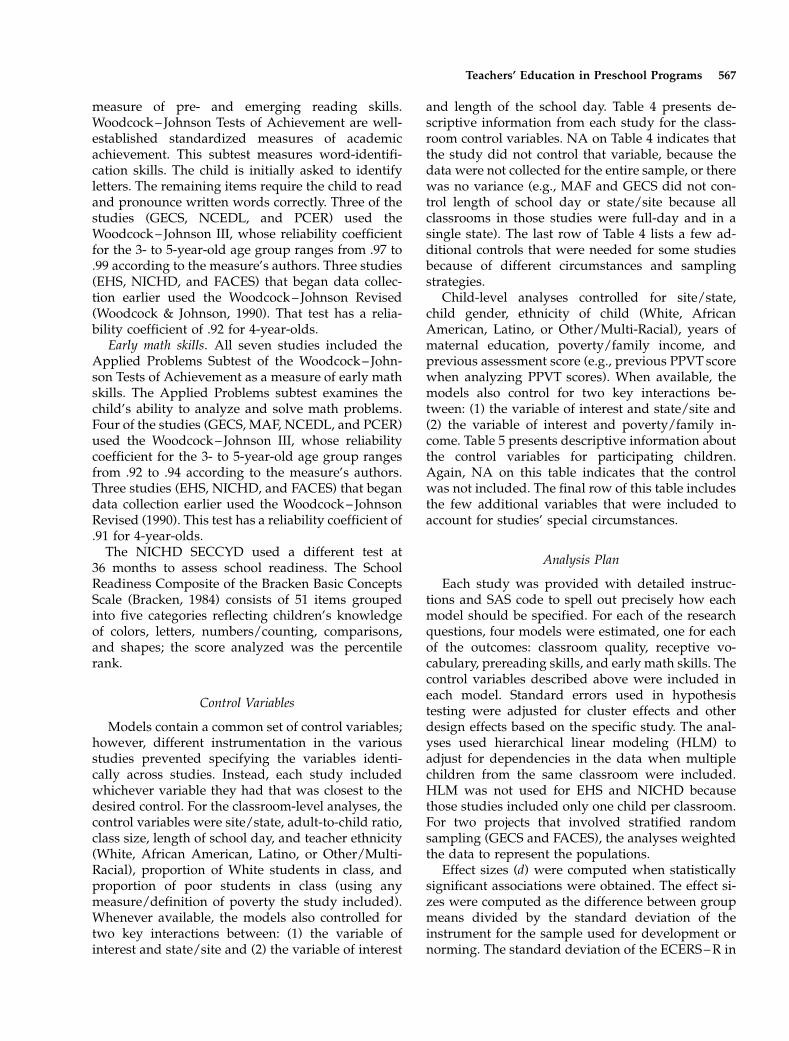
Classroom Quality
Table 3 provides descriptive information aboutclassroom quality from each study. All studies exceptone (NICHD) used the Early Childhood Environ-ment Rating Scale – Revised (ECERS – R; Harms,Clifford, & Cryer, 1998) to measure classroom qual-ity. The ECERS – R is a widely used measure of globalclassroom quality, specifically designed for use inclassrooms serving children between 2 1
2 and 5 years
of age. Scores on the ECERS – R range from 1 to 7with 1 indicating ‘‘inadequate’’ quality, 3 indicating‘‘minimal’’ quality, 5 indicating ‘‘good’’ quality, and 7indicating ‘‘excellent’’ quality. The scale’s authors re-port a total scale internal consistency of .92. For thecurrent analyses, the ECERS – R score is the mean ofall items scored. We do not recommend comparingECERS – R scores across studies because data col-lectors for the various studies were not trained to-gether, may have followed slightly different coding
Table 2
Teacher Education and Training: Ns (% of Nonmissing, Non-NA)
EHS FACES GECS MAF NCEDL NICHD PCER
Highest level of education
High school or GED 257 (29) 91 (29) 20 (21) 9 (4) 99 (14) 50 (8) 17 (22)
Associate’s 139 (16) 114 (37) 26 (27) 22 (9) 104 (15) 221 (34) 8 (11)
Bachelor’s 335 (38) 81 (26) 36 (37) 172 (74) 340 (49) 196 (31) 38 (50)
Graduate 156 (18) 24 (8) 15 (15) 29 (13) 152 (22) 172 (27) 13 (17)
Missing 0 0 31 1 26 0 0
Bachelor’s degree
No 396 (45) 205 (66) 46 (47) 31 (13) 203 (29) 271 (42) 25 (33)
Yes 491 (55) 105 (34) 51 (53) 201 (87) 492 (71) 368 (58) 51 (67)
Missing 0 0 31 1 26 0 0
Major
ECE/CD 609 (97) 151 (71) 52 (72) 125 (58) 303 (50) 178 (35) 24 (40)
Other education NA 35 (16) 14 (20) 58 (27) 211 (36) 296 (60) 35 (60)
Other major NA 26 (12) 6 (8) 34 (16) 82 (14) 23 (5) 0 (0)
NA (no degree) 257 91 20 9 99 50 17
Missing 21 7 36 7 26 92 0
Degree among ECE/CD majors
Associate’s in ECE/CD 132 (21) 103 (68) 19 (37) 20 (16) 92 (30) 178 (47) 5 (21)
Bachelor’s in ECE/CD 323 (53) 32 (21) 25 (48) 93 (74) 138 (46) 144 (38) 16 (67)
Graduate in ECE/CD 154 (25) 16 (11) 8 (15) 12 (10) 73 (24) 53 (14) 3 (13)
NA (no degree or degree not ECE/CD) 278 159 70 107 392 255 52
Missing 0 0 6 1 26 9 0
Major among teachers with Bachelor’s as final degree
Bachelor’s and ECE/CD NA 32 (42) 25 (71) 93 (55) 137 (41) 89 (45) 16 (42)
Bachelor’s and other education NA 28 (37) 5 (14) 46 (27) 136 (40) 46 (23) 13 (34)
Bachelor’s and other major NA 16 (21) 5 (14) 30 (18) 65 (19) 61 (31) 9 (24)
NA (Bachelor’s not final degree) NA 229 92 61 381 443 38
Missing NA 5 1 3 2 0 0
Major among teachers with Associate’s as final degree
Associate’s and ECE/CD NA 103 (92) 19 (71) 20 (100) 92 (90) 65 (29) 5 (63)
Associate’s and other education NA 1 (1) 3 (29) 0 (0) 3 (3) 91 (41) 1 (13)
Associate’s and other major NA 8 (7) 1 (0) 0 (0) 7 (7) 65 (29) 2 (25)
NA (Associate’s not final degree) NA 196 102 211 617 418 68
Missing NA 2 3 2 2 0 0
Note. EHS 5 Early Head Start; FACES 5 Family and Child Experiences Survey; GECS 5 Georgia Early Childhood Study; GED 5 generaleducation diploma; MAF 5 More at Four; NCEDL 5 National Center for Early Development and Learning; NICHD 5 National Institute ofChild Health and Human Development; PCER 5 Preschool Curriculum Evaluation Research;GECS included eight teachers with an Associate’s degree and 18 teachers with a 1-year technical degree. These two groups have beencombined into a single group (Associate’s) to be consistent with the other studies and because the Associate’s group was too small toanalyze alone. For NICHD, when teachers were asked about their education, Associate’s and ‘‘some college’’ were combined as a singleoption. The Associate’s value for NICHD represents all teachers who selected that option.
Teachers’ Education in Preschool Programs 565

rules, and use of the scale in some settings involvesomitting some items.
The NICHD Study used the Observational Recordof the Caregiving Environment (ORCE). The ORCEwas designed specifically for the NICHD SECCYDto assess the quality of caregiver – child interactionexperienced by individual children. It measures carethat is attentive and appropriately responsive, ex-presses positive affect and affection, is not exces-sively restrictive or intrusive, and offers activitiesbelieved to promote children’s cognitive and socialdevelopment. Observations of child-care qualitywere made during a single half-day when the childwas 54 months of age. The quality measure used forthe current project is the positive caregiving ratingcomposite, the mean of 4-point ratings of caregivers’sensitivity/responsivity, stimulation of cognitivedevelopment, intrusiveness (reflected), and detach-ment (reflected). Detailed descriptions of the ORCEassessments can be found in NICHD SECC (n.d.),including coding definitions, training procedures,internal consistency, and interobserver agreement.
Children’s Academic Skills
Table 3 provides descriptive information for eachmeasure of children’s academic skills for each study.
Receptive language. All studies included a measureof receptive vocabulary. Six studies used the Pea-
body Picture Vocabulary Test, 3rd ed. (PPVT; Dunn& Dunn, 1997), and one study (NICHD) used thePreschool Language Survey (PLS). The PPVT is a testof receptive vocabulary that relates to other mea-sures of language, literacy, and academic achieve-ment (Chow & McBride-Chang, 2003; Dunn & Dunn,1997). Children are shown a set of four pictures andasked to select the picture that best represents themeaning of a word spoken by the examiner. Ac-cording to the scale’s authors, the a coefficient of allthe items on this scale ranges from .92 to .98, with amedian reliability of .94, and test – retest reliability isreported as ranging from .85 to .90.
The NICHD SECCYD administered the ReynellDevelopmental Language Scale (RDLS; Reynell,1991) at 36 months and the Preschool Language Scale(PLS-3; Zimmerman, Steiner, & Pond, 1979) at 54months. The RDLS is composed of two 67-item scalesthat assess verbal comprehension and expressivelanguage; Cronbach’s as 5 .93 and .86. The PLS-3measures a range of language behaviors, includingvocabulary, morphology, syntax, and integrativethinking, grouped into two subscales: AuditoryComprehension and Expressive Language; Cron-bach’s as 5 .89 and .92.
Prereading skills. Six of the seven studies (all ex-cept MAF) included the Letter – Word Identificationsubtest of the Woodcock – Johnson Tests of Achieve-ment (Woodcock, McGrew, & Mather, 2001) as a
Table 3
Descriptive Information About Outcome Variables
EHS FACES GECS MAF NCEDL NICHD PCER
M SD M SD M SD M SD M SD M SD M SD
ECERS – R Total 5.29 1.13 4.20 0.84 4.32 0.93 5.02 0.74 3.80 0.81 NA 3.42 1.06
Receptive language standard scores
Time 1 82.91 16.09 84.48 11.01 92.38 15.90 85.42 17.91 94.00 15.01 NA 89.83 15.61
Time 2 92.31 14.44 86.19 11.68 96.54 14.50 89.57 16.20 96.29 14.31 101.20 19.79 93.78 14.42
Prereading standard scores (Woodcock – Johnson Letter – Word Identification)
Time 1 NA 94.73 16.50 102.28 15.43 NA 101.24 16.05 NA 101.58 14.98
Time 2 90.38 15.03 99.86 15.62 103.77 13.37 NA 102.92 14.08 100.59 13.39 101.73 14.30
Math standard scores (Woodcock – Johnson Applied Problems)
Time 1 NA 88.95 18.07 96.51 14.43 93.02 14.50 98.42 13.66 NA 94.50 15.29
Time 2 88.31 17.85 92.58 14.16 98.30 13.31 93.98 13.24 99.11 12.85 105.06 15.22 97.32 13.80
Note. EHS 5 Early Head Start; FACES 5 Family and Child Experiences Survey; GECS 5 Georgia Early Childhood Study; MAF 5 More atFour; NCEDL 5 National Center for Early Development and Learning; NICHD 5 National Institute of Child Health and Human Devel-opment; PCER 5 Preschool Curriculum Evaluation Research.NICHD used the ORCE quality composite (M 5 12.17, SD 5 2.18) rather than the ECERS – R to measure classroom quality. NICHD usedthe Preschool Language Survey (PLS) as its measure of receptive language and the Reynell Developmental Language Scale (M 5 100.13,SD 5 15.68) as the Time 1 control for the receptive language test. At Time 1, NICHD did not administer the Woodcock – Johnson; theBracken Basic Concepts Scale (M 5 9.47, SD 5 2.78) was used as the Time 1 control for the prereading test. At Time 1, EHS did notadminister the Woodcock – Johnson; the 36-month PPVT (M 5 82.91, SD 5 16.09) was used as the Time 1 control for the prereading test andthe Bayley Mental Index at 36 months (M 5 91.12, SD 5 12.20) was used as the Time 1 control for math. For NCEDL, the WJ Letter – Wordwas only included in the SWEEP study.
566 Early et al.
measure of pre- and emerging reading skills.Woodcock – Johnson Tests of Achievement are well-established standardized measures of academicachievement. This subtest measures word-identifi-cation skills. The child is initially asked to identifyletters. The remaining items require the child to readand pronounce written words correctly. Three of thestudies (GECS, NCEDL, and PCER) used theWoodcock – Johnson III, whose reliability coefficientfor the 3- to 5-year-old age group ranges from .97 to.99 according to the measure’s authors. Three studies(EHS, NICHD, and FACES) that began data collec-tion earlier used the Woodcock – Johnson Revised(Woodcock & Johnson, 1990). That test has a relia-bility coefficient of .92 for 4-year-olds.
Early math skills. All seven studies included theApplied Problems Subtest of the Woodcock – John-son Tests of Achievement as a measure of early mathskills. The Applied Problems subtest examines thechild’s ability to analyze and solve math problems.Four of the studies (GECS, MAF, NCEDL, and PCER)used the Woodcock – Johnson III, whose reliabilitycoefficient for the 3- to 5-year-old age group rangesfrom .92 to .94 according to the measure’s authors.Three studies (EHS, NICHD, and FACES) that begandata collection earlier used the Woodcock – JohnsonRevised (1990). This test has a reliability coefficient of.91 for 4-year-olds.
The NICHD SECCYD used a different test at36 months to assess school readiness. The SchoolReadiness Composite of the Bracken Basic ConceptsScale (Bracken, 1984) consists of 51 items groupedinto five categories reflecting children’s knowledgeof colors, letters, numbers/counting, comparisons,and shapes; the score analyzed was the percentilerank.
Control Variables
Models contain a common set of control variables;however, different instrumentation in the variousstudies prevented specifying the variables identi-cally across studies. Instead, each study includedwhichever variable they had that was closest to thedesired control. For the classroom-level analyses, thecontrol variables were site/state, adult-to-child ratio,class size, length of school day, and teacher ethnicity(White, African American, Latino, or Other/Multi-Racial), proportion of White students in class, andproportion of poor students in class (using anymeasure/definition of poverty the study included).Whenever available, the models also controlled fortwo key interactions between: (1) the variable ofinterest and state/site and (2) the variable of interest
and length of the school day. Table 4 presents de-scriptive information from each study for the class-room control variables. NA on Table 4 indicates thatthe study did not control that variable, because thedata were not collected for the entire sample, or therewas no variance (e.g., MAF and GECS did not con-trol length of school day or state/site because allclassrooms in those studies were full-day and in asingle state). The last row of Table 4 lists a few ad-ditional controls that were needed for some studiesbecause of different circumstances and samplingstrategies.
Child-level analyses controlled for site/state,child gender, ethnicity of child (White, AfricanAmerican, Latino, or Other/Multi-Racial), years ofmaternal education, poverty/family income, andprevious assessment score (e.g., previous PPVT scorewhen analyzing PPVT scores). When available, themodels also control for two key interactions be-tween: (1) the variable of interest and state/site and(2) the variable of interest and poverty/family in-come. Table 5 presents descriptive information aboutthe control variables for participating children.Again, NA on this table indicates that the controlwas not included. The final row of this table includesthe few additional variables that were included toaccount for studies’ special circumstances.
Analysis Plan
Each study was provided with detailed instruc-tions and SAS code to spell out precisely how eachmodel should be specified. For each of the researchquestions, four models were estimated, one for eachof the outcomes: classroom quality, receptive vo-cabulary, prereading skills, and early math skills. Thecontrol variables described above were included ineach model. Standard errors used in hypothesistesting were adjusted for cluster effects and otherdesign effects based on the specific study. The anal-yses used hierarchical linear modeling (HLM) toadjust for dependencies in the data when multiplechildren from the same classroom were included.HLM was not used for EHS and NICHD becausethose studies included only one child per classroom.For two projects that involved stratified randomsampling (GECS and FACES), the analyses weightedthe data to represent the populations.
Effect sizes (d) were computed when statisticallysignificant associations were obtained. The effect si-zes were computed as the difference between groupmeans divided by the standard deviation of theinstrument for the sample used for development ornorming. The standard deviation of the ECERS – R in
Teachers’ Education in Preschool Programs 567

Tab
le4
Des
crip
tive
Info
rmat
ion
Abo
ut
Con
trol
Var
iabl
esin
Cla
ssro
om-L
evel
Mod
els
EH
SFA
CE
SG
EC
SM
AF
NC
ED
LN
ICH
DP
CE
R
Mea
n(S
D)
chil
d-t
o-a
du
lt
rati
o
NA
6.18
(2.0
0)10
.02
(2.1
9)6.
23(2
.58)
7.55
(3.3
5)8.
69(3
.95)
7.28
(2.5
9)
Mea
n(S
D)
clas
ssi
ze17
.50
(5.0
5)14
.38
(3.1
2)16
.82
(4.3
8)15
.99
(2.3
5)18
.50
(5.5
6)15
.49
(5.7
3)16
.32
(4.7
3)
Mea
n(S
D)
sch
oo
ld
ay
ho
urs
��4.
88(2
.04)
6.50
(0.0
0)N
A4.
58(2
.52)
4.86
(2.9
1)N
A
Mea
np
rop
ort
ion
po
or
in
clas
s
NA
NA
0.54
(0.3
7)N
A0.
58(0
.32)
NA
NA
Mea
np
rop
ort
ion
Wh
ite
in
clas
s
NA
NA
0.49
(0.3
7)0.
30(0
.29)
0.41
(0.3
7)N
AN
A
Tea
cher
’set
hn
icit
y,n
(%)
NA
Lat
ino
101
(12)
69(2
2)2
(2)
93(1
4)27
(4)
7(9
)
Afr
ican
Am
eric
an17
3(2
1)10
1(3
3)41
(34)
74(1
1)41
(6)
25(3
3)
Wh
ite
518
(63)
127
(41)
75(6
3)45
9(6
7)55
6(8
7)34
(45)
Oth
er/
mix
ed35
(4)
13(4
)1
(1)
55(8
)14
(2)
10(1
3)
Mis
sin
g60
09
421
0
Oth
erco
ntr
ols
Hea
dS
tart
ver
sus
no
t
GA
Pre
-Kv
ersu
s
Hea
dS
tart
ver
sus
pri
vat
e
%o
fM
AF
chil
dre
n
incl
ass;
sch
oo
l
yea
r
Pro
gra
mlo
cate
din
ap
ub
lic
sch
oo
l
ver
sus
no
t;fu
ll-
day
pro
gra
mo
r
no
t
Not
e.E
HS
5E
arly
Hea
dS
tart
;FA
CE
S5
Fam
ily
and
Ch
ild
Ex
per
ien
ces
Su
rvey
;G
EC
S5
Geo
rgia
Ear
lyC
hil
dh
oo
dS
tud
y;
MA
F5
Mo
reat
Fo
ur;
NA
5n
ot
avai
lab
lean
dth
eref
ore
no
tco
ntr
oll
ed;
NC
ED
L5
Nat
ion
alC
ente
rfo
rE
arly
Dev
elo
pm
ent
and
Lea
rnin
g;
NIC
HD
5N
atio
nal
Inst
itu
teo
fC
hil
dH
ealt
han
dH
um
anD
evel
op
men
t;P
CE
R5
Pre
sch
oo
lC
urr
icu
lum
Ev
alu
atio
nR
esea
rch
.‘‘
Pro
po
rtio
np
oo
rin
clas
s’’
sho
uld
no
tb
eco
mp
ared
acro
ssst
ud
ies
bec
ause
po
ver
tyd
efin
itio
ns
var
ied
;GE
CS
use
dw
het
her
or
no
tth
efa
mil
yh
adev
erre
ceiv
edT
AN
Fsi
nce
chil
d’s
bir
th,
NC
ED
Lu
sed
150%
of
fed
eral
po
ver
tyg
uid
elin
es.
EH
Sco
ntr
oll
edfu
ll-
ver
sus
hal
f-d
ay;
50%
of
clas
ses
wer
efu
lld
ay(i
.e.,
30o
rm
ore
ho
urs
per
wee
kin
stea
do
f‘‘
sch
oo
ld
ayh
ou
rs’’
;A
llM
AF
clas
ses
mee
tfo
ra
full
-day
sch
oo
l(6
–6.
5h
r).M
AF
on
lyco
llec
ted
dem
og
rap
hic
dat
ao
nM
AF
chil
dre
nan
dn
ot
on
oth
erch
ild
ren
inth
ose
clas
sro
om
s;‘‘
Mea
nP
rop
ort
ion
Wh
ite’
’in
dic
ates
the
per
cen
to
fM
AF
chil
dre
nin
each
clas
sro
om
wh
oar
eW
hit
e.��
Sim
ilar
var
iab
lew
asco
ntr
oll
ed.
568 Early et al.

Tab
le5
Des
crip
tive
Info
rmat
ion
Abo
ut
Con
trol
Var
iabl
esin
Chi
ld-L
evel
Mod
els
EH
SFA
CE
SG
EC
SM
AF
NC
ED
LN
ICH
DP
CE
R
Mal
e(%
)44
2(5
0)50
3(4
9)33
6(5
3)38
0(4
9)14
59(4
9)32
2(5
0)34
8(5
2)
Mo
ther
sw
ith
less
than
hig
hsc
ho
ol
edu
cati
on
(%)
542
(61)
310
(31)
66(1
4)N
A53
9(1
9)40
(6)
116
(20)
Po
or
(%)
��65
5(6
8)25
8(5
3)68
5(8
9)16
05(5
8)14
4(2
3)37
8(7
6)
Ch
ild
’set
hn
icit
yn
(%)
Lat
ino
218
(25)
346
(32)
14(2
)11
7(1
5)76
4(2
6)35
(5)
113
(18)
Afr
ican
Am
eric
an31
6(3
6)34
8(3
5)23
1(4
0)33
6(4
3)53
3(1
8)61
(10)
275
(44)
Wh
ite
325
(37)
224
(23)
283
(49)
273
(35)
1200
(41)
514
(80)
187
(30)
Oth
er/
mu
ltir
acia
l28
(3)
73(1
0)54
(9)
59(8
)40
1(1
4)29
(5)
55(9
)
Mis
sin
g0
5048
068
037
Oth
erco
ntr
ols
Hea
dS
tart
ver
sus
no
t
GA
Pre
-Kv
ersu
s
Hea
dS
tart
ver
sus
pri
vat
e
Sch
oo
ly
ear
Pro
gra
mlo
cate
din
ap
ub
lic
sch
oo
l
ver
sus
no
t;fu
ll-
day
pro
gra
mo
r
no
t
Not
e.E
HS
5E
arly
Hea
dS
tart
;FA
CE
S5
Fam
ily
and
Ch
ild
Ex
per
ien
ces
Su
rvey
;G
EC
S5
Geo
rgia
Ear
lyC
hil
dh
oo
dS
tud
y;
MA
F5
Mo
reat
Fo
ur;
NA
5n
ot
avai
lab
lean
dth
eref
ore
no
tco
ntr
oll
ed;
NC
ED
L5
Nat
ion
alC
ente
rfo
rE
arly
Dev
elo
pm
ent
and
Lea
rnin
g;
NIC
HD
5N
atio
nal
Inst
itu
teo
fC
hil
dH
ealt
han
dH
um
anD
evel
op
men
t;P
CE
R5
Pre
sch
oo
lC
urr
icu
lum
Ev
alu
atio
nR
esea
rch
.‘‘
Po
or’
’v
alu
essh
ou
ldn
ot
be
com
par
edac
ross
stu
die
sb
ecau
sep
ov
erty
def
init
ion
sv
arie
d;
FAC
ES
use
d10
0%o
ffe
der
alp
ov
erty
gu
idel
ines
,G
EC
Su
sed
wh
eth
ero
rn
ot
the
fam
ily
ever
rece
ived
TA
NF
sin
cech
ild
’sb
irth
,M
AF
use
dfr
ee/
red
uce
dp
rice
lun
chel
igib
ilit
y,N
CE
DL
use
d15
0%o
ffe
der
alp
ov
erty
gu
idel
ines
,N
ICH
Dan
dP
CE
Ru
sed
200%
of
fed
eral
po
ver
tyg
uid
elin
es.
EH
Sco
ntr
oll
edfa
mil
yin
com
e(M
5$1
,847
/m
on
th,
SD
5$1
,202
)ra
ther
than
po
ver
ty.
��S
imil
arv
aria
ble
was
con
tro
lled
.
Teachers’ Education in Preschool Programs 569
this sample is 1.0 and 15 for the PPVT, PLS, andWoodcock – Johnson scales. Typically, effect sizes ofo.30 are considered modest, .30 – .60 are consideredmoderate, and >.60 are considered large (Cohen,1988).
Missing data occurred in these longitudinal pro-jects due to attrition and failure to complete allassessments. Missing data were imputed usingmultiple imputation (Rubin, 1987; Schafer, 1997;Schafer & Graham, 2002) under the assumption thatmissing data were ignorably missing. Given themany measures of demographic, child, family, andclassroom measures, each study had sufficient in-formation to estimate missing data accurately. Weused Schafer’s recommended procedure, an iterativeE – M algorithm in which missing values for eachvariable are estimated iteratively using a logistic ormultiple regression from all the other variables usingthe data for individuals with observed values on thatvariable. The prediction model is used to predictmissing values, and random variability is added asthe missing data are predicted. The process is re-peated for each variable until the differences inpredicted values across iterations are miniscule. Foreach study, five data sets were created in which allobserved data are represented and missing data areestimated. Consequently, analyses were conductedfive times, using each of the five imputation datasets. The results of these analyses were combinedusing the recommended procedures of Schafer(1997). The test statistics and regression coefficientswere combined by averaging them across the fiveanalyses, and the standard errors for the coefficientswere combined by combining within- and between-model variability.
Results
Question 1: Degree
The first research question asked whether thehighest degree attained by the lead teacher predictedclassroom quality and children’s academic gains,with special focus on the value of a Bachelor’s de-gree. We conducted 27 analyses for this question (4outcomes � 7 studies, with MAF unable to test Let-ter – Word). As can be seen in Table 6, only 8 of these27 analyses provided any evidence of an association,and the direction was negative (i.e., more educationassociated with less positive outcome) for 2 of 8. Forclassroom quality, two studies (EHS and NICHD)found evidence that more educated teachers hadhigher quality classrooms and that quality washigher when teachers had a Bachelor’s degree. One
study, FACES, found that teachers with a Bachelor’sdegree had lower quality classrooms compared withteachers without a Bachelor’s. The remaining studiesfound no evidence supporting an association be-tween education and quality.
EHS found a linear association between qualityand teacher’s degree. Classrooms in which theteacher had a graduate degree had higher ECERS – Rscores than classrooms where the teacher had aBachelor’s degree (d 5 .65). Classrooms where theteacher had a Bachelor’s received higher ECERS – Rscores than classrooms where the teacher had anAssociate’s (d 5 .42) or a high school degree (d 5 .55).There was no difference in ECERS – R scores betweenclassrooms with an Associate’s versus high schoollevel teacher. In comparing all teachers with aBachelor’s degree or higher with those without aBachelor’s degree, EHS found evidence that qualitywas moderately higher when teachers had a Bach-elor’s (d 5 .45).
NICHD, using the positive caregiving compositefrom the ORCE, found that teachers with a graduatedegree had classrooms with moderately higherquality scores than teachers with a Bachelor’s(d 5 .44) or Associate’s degree (d 5 .47). Teacherswith a Bachelor’s degree, in turn, had substantiallyhigher quality classrooms than high school levelteachers (d 5 .68). There was no difference betweenthe classroom quality of teachers with Bachelor’sversus Associate’s degree or Associate’s versus highschool. For this reason, a smaller, but statisticallysignificant difference was observed when the teach-ers with and without a Bachelor’s degree werecompared (d 5 .23).
FACES also found a significant association be-tween teachers’ education and quality. Classroomswhere the teacher had a Bachelor’s degree or morewere rated lower on the ECERS – R than classroomswhere teachers did not have a Bachelor’s degree(d 5 � .26). The more refined comparison of the fourlevels of teacher degree was not statistically signifi-cant.
In addition, three of the seven studies reported asignificant interaction between education and site.The significant interaction in the EHS, NCEDL, andNICHD studies indicated that a stronger positiveassociation between education and quality was ob-tained in some sites, but a weaker and sometimesnegative association was obtained in other sites, withno clear pattern to the findings.
For academic outcomes, there was very limitedevidence of an association between teachers’ highestdegree and scores at the end of the 4-year-old year,controlling for previous skills and the other demo-
570 Early et al.

Tab
le6
Qu
esti
on1:
Edu
cati
onal
Deg
ree
asa
Pre
dict
orof
Qu
alit
yan
dC
hild
ren
’sO
utc
omes
EH
SFA
CE
SG
EC
SM
AF
NC
ED
LN
ICH
DP
CE
R
Cla
ssro
om
qu
alit
yE
CE
RS
–R
EC
ER
S–
RE
CE
RS
–R
EC
ER
S–
RE
CE
RS
–R
OR
CE
Tea
cher
Sen
siti
vit
yE
CE
RS
–R
Hig
hes
td
egre
eF
F(3
,88
6)
59
.42���
F(3
,297
)52.
22F
(3,1
27)5
0.95
F(2
,222
)50.
56F
(3,6
70)5
0.77
F(3
,58
9)
53.5
7�F
(3,5
3)5
0.15
Hig
hsc
ho
ol
M(S
E)
4.4
4(0
.19
)a4.
39(0
.16)
4.30
(0.3
4)N
A3.
85(0
.20)
10.4
4(0
.69)a
3.80
(0.6
5)
Ass
oci
ate’
sM
(SE
)4
.58
(0.2
8)a
4.16
(0.1
4)4.
41(0
.29)
5.03
(0.1
5)3.
58(0
.22)
11.8
6(0
.35)a
b3.
72(0
.90)
Bac
hel
or’
sM
(SE
)5
.06
(0.0
7)b
4.03
(0.0
7)4.
21(0
.08)
5.07
(0.0
5)3.
74(0
.08)
11.9
3(0
.21)b
3.60
(0.2
5)
Gra
du
ates
M(S
E)
5.8
0(0
.20
)c3.
71(0
.28)
4.21
(0.3
7)4.
93(0
.12)
3.84
(0.1
7)12.8
8(0
.39)c
3.18
(0.7
7)
Bac
hel
or’
sF
F(1
,88
6)5
24
.61���
F(1
,30
1)
55
.91�
F(1
,127
)52.
19F
(1,2
32)5
0.00
F(1
,692
)50.
38F
(1,5
89
)57
.40��
F(1
,61)
50.
12
No
M(S
E)
4.5
5(0
.14
)a4
.26
(0.1
0)a
4.38
(0.2
3)5.
04(0
.12)
3.85
(0.1
2)11
.51
(0.2
8)a
3.72
(0.5
6)
Yes
M(S
E)
5.0
6(0
.07
)b4
.04
(0.0
7)b
4.19
(0.0
8)5.
05(0
.05)
3.81
(0.0
8)12.0
1(0
.20)b
3.67
(0.1
9)
Rec
epti
ve
lan
gu
age
PP
VT
PP
VT
PP
VT
PP
VT
PP
VT
PL
SP
PV
T
Hig
hes
td
egre
eF
F(3
,855
)50.
83F
(3,2
90)5
0.42
F(3
,490
)50.
74F
(2,6
48)5
0.80
F(3
,224
7)5
1.65
F(3
,582
)50.
06F
(3,5
8)5
0.70
Hig
hsc
ho
ol
M(S
E)
90.0
0(2
.19)
86.3
2(1
.24)
96.9
2(1
.79)
NA
94.3
8(1
.43)
96.8
2(4
.52)
91.2
3(3
.89)
Ass
oci
ate’
sM
(SE
)89
.54
(2.6
4)86
.24
(1.0
8)94
.05
(1.5
8)94
.43
(4.3
3)92
.12
(1.5
0)97
.72
(2.3
7)93
.44
(3.5
8)
Bac
hel
or’
sM
(SE
)91
.08
(0.9
3)86
.26
(0.4
2)95
.12
(0.5
5)89
.55
(0.7
2)94
.14
(0.5
2)97
.97
(1.2
1)93
.59
(0.9
3)
Gra
du
ate
M(S
E)
94.3
7(2
.52)
85.0
8(2
.03)
93.9
7(2
.03)
86.3
2(2
.69)
95.3
7(1
.19)
98.6
0(2
.61)
96.2
3(2
.66)
Bac
hel
or’
sF
F(1
,855
)51.
44F
(1,2
92)5
0.29
F(1
,494
)51.
61F
(1,6
78)5
0.17
F(1
,225
0)5
2.66
F(1
,589
)50.
06F
(1,6
6)5
0.46
No
M(S
E)
89.9
4(1
.46)
86.0
9(0
.73)
94.4
7(1
.26)
88.1
2(2
.29)
93.2
9(0
.96)
97.5
0(1
.80)
92.1
8(2
.61)
Yes
M(S
E)
90.7
7(0
.84)
86.4
0(0
.39)
95.3
3(0
.56)
88.8
6(0
.72)
94.0
8(0
.47)
97.8
4(1
.11)
93.4
0(0
.84)
Pre
read
ing
WJ-
RW
J-R
WJ-
III
NA
WJ-
III
WJ-
RW
J-II
I
Hig
hes
td
egre
eF
F(3
,855
)50.
40F
(3,2
90)5
0.21
F(3
,49
0)
54
.31���
F(3
,14
66
)52
.78�
F(3
,582
)50.
14F
(3,5
8)5
2.8
5�
Hig
hsc
ho
ol
M(S
E)
88.4
1(2
.20)
99.2
8(1
.74)
98
.54
(2.2
6)a
101.
62(1
.84)
a10
2.04
(3.4
0)10
1.27
(3.3
5)a
Ass
oci
ate’
sM
(SE
)87
.60
(3.1
4)98
.85
(1.5
0)1
01
.19
(1.7
7)a
b10
0.44
(1.5
7)a
99.7
6(1
.82)
105.
56(3
.56)
a
Bac
hel
or’
sM
(SE
)89
.45
(0.9
4)99
.77
(0.5
8)1
03
.91
(0.6
1)b
102.
08(0
.67)
a10
0.88
(0.9
2)10
3.06
(0.8
6)a
Gra
du
ate
M(S
E)
91.5
3(3
.16)
100.
84(2
.72)
110
.00
(2.4
5)c
102.
11(1
.37)
a10
1.15
(1.9
8)10
6.98
(2.8
2)a
Bac
hel
or’
sF
F(1
,855
)51.
15F
(1,2
92)5
0.57
F(1
,49
4)5
11.3
9���
NA
F(1
,14
75
)54
.81�
F(1
,604
)50.
33F
(1,6
6)5
1.33
No
M(S
E)
88.3
3(1
.51)
99.9
8(1
.02)
10
0.3
9(1
.14
)a1
00
.78
(1.0
2)a
100.
12(1
.38)
104.
89(2
.56)
Yes
M(S
E)
89.5
1(0
.85)
99.6
7(0
.53)
10
3.8
2(0
.62
)b1
02
.20
(0.6
5)b
100.
73(0
.83)
102.
59(0
.74)
Mat
hW
J-R
WJ-
RW
J-II
IW
J-II
IW
J-II
IW
J-R
WJ-
III
Hig
hes
td
egre
eF
F(3
,855
)50.
65F
(3,2
90)5
0.75
F(3
,490
)50.
56F
(2,6
48)5
0.70
F(3
,22
47
)53
.55�
F(3
,582
)51.
99F
(3,5
8)5
0.59
Hig
hsc
ho
ol
M(S
E)
87.5
5(2
.49)
93.6
8(1
.68)
95.2
4(1
.99)
NA
95
.05
(1.2
7)a
109.
23(4
.12)
97.9
1(3
.33)
Ass
oci
ate’
sM
(SE
)84
.17
(3.7
2)91
.12
(1.3
1)98
.14
(1.5
4)88
.19
(4.4
7)9
8.8
0(1
.38
)ab
104.
65(2
.14)
97.8
9(3
.94)
Bac
hel
or’
sM
(SE
)87
.72
(1.1
5)92
.34
(0.5
4)97
.37
(0.5
9)92
.83
(0.7
3)9
7.9
9(0
.54
)b10
3.42
(1.0
8)98
.37
(0.8
5)
Gra
du
ate
M(S
E)
89.6
1(3
.97)
91.1
1(2
.52)
98.1
0(2
.21)
94.8
6(2
.82)
98
.30
(1.2
0)a
b98
.88
(2.3
6)10
0.75
(2.7
3)
Bac
hel
or’
sF
F(1
,855
)50.
94F
(1,2
92)5
0.24
F(1
,494
)50.
17F
(1,6
78)5
1.28
F(1
,22
50
)54
.27�
F(1
,60
4)
54.7
3�F
(1,6
6)5
0.01
No
M(S
E)
86.5
3(1
.73)
92.0
3(0
.91)
97.2
3(1
.03)
90.4
7(2
.45)
96
.90
(0.8
2)a
10
5.8
1(1
.62
)a98
.41
(2.5
4)
Yes
M(S
E)
87.7
8(1
.00)
92.4
1(0
.50)
97.4
0(0
.59)
92.6
9(0
.73)
98
.04
(0.4
9)b
10
3.1
0(1
.02
)b98
.24
(0.7
6)
Not
e.E
CE
RS
–R
5E
arly
Ch
ild
ho
od
En
vir
on
men
tR
atin
gS
cale
-Rev
ised
;E
HS
5E
arly
Hea
dS
tart
;FA
CE
S5
Fam
ily
and
Ch
ild
Ex
per
ien
ces
Su
rvey
;G
EC
S5
Geo
rgia
Ear
lyC
hil
dh
oo
dS
tud
y;
MA
F5
Mo
reat
Fo
ur;
NA
5n
ot
anal
yze
d(m
easu
ren
ot
incl
ud
edin
stu
dy,
too
litt
lev
aria
nce
or
sub
gro
up
too
smal
l);
NC
ED
L5
Nat
ion
alC
ente
rfo
rE
arly
Dev
elo
pm
ent
and
Lea
rnin
g;
NIC
HD
5N
atio
nal
Inst
itu
teo
fC
hil
dH
ealt
han
dH
um
anD
evel
op
men
t;P
CE
R5
Pre
sch
oo
lC
urr
icu
lum
Ev
alu
atio
nR
esea
rch
;P
PV
T5
Pea
bo
dy
Pic
ture
Vo
cab
ula
ryT
est.
Sig
nif
ican
tef
fect
sap
pea
rin
bo
ld.A
dju
sted
mea
ns
that
are
sig
nif
ican
tly
dif
fere
nt
fro
mo
ne
ano
ther
(po
.05)
hav
ed
iffe
ren
tsu
per
scri
pts
.Fo
rM
AF,
the
hig
hsc
ho
ol
gro
up
was
too
smal
lto
anal
yze
sep
arat
ely
and
hen
ceth
eyh
ave
bee
nd
rop
ped
for
the
‘‘h
igh
est
deg
ree’
’an
aly
ses
on
ly.
� po
.05,��
po.0
1,��� p
o.0
01.
Teachers’ Education in Preschool Programs 571
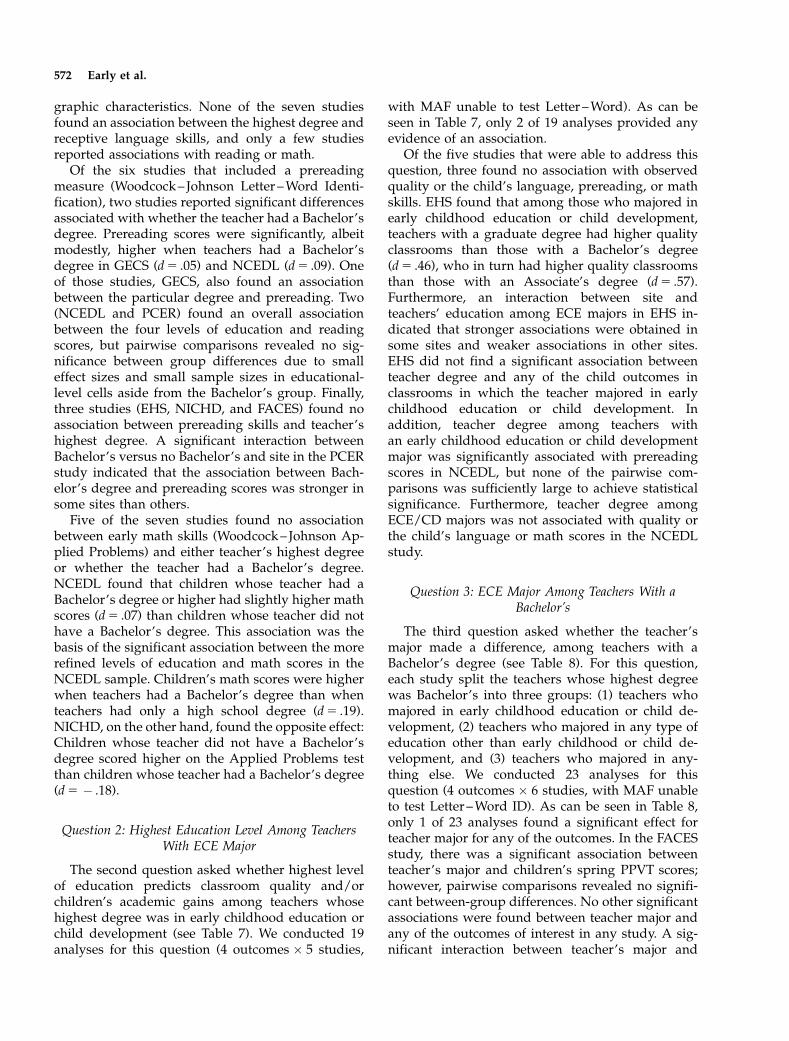
graphic characteristics. None of the seven studiesfound an association between the highest degree andreceptive language skills, and only a few studiesreported associations with reading or math.
Of the six studies that included a prereadingmeasure (Woodcock – Johnson Letter – Word Identi-fication), two studies reported significant differencesassociated with whether the teacher had a Bachelor’sdegree. Prereading scores were significantly, albeitmodestly, higher when teachers had a Bachelor’sdegree in GECS (d 5 .05) and NCEDL (d 5 .09). Oneof those studies, GECS, also found an associationbetween the particular degree and prereading. Two(NCEDL and PCER) found an overall associationbetween the four levels of education and readingscores, but pairwise comparisons revealed no sig-nificance between group differences due to smalleffect sizes and small sample sizes in educational-level cells aside from the Bachelor’s group. Finally,three studies (EHS, NICHD, and FACES) found noassociation between prereading skills and teacher’shighest degree. A significant interaction betweenBachelor’s versus no Bachelor’s and site in the PCERstudy indicated that the association between Bach-elor’s degree and prereading scores was stronger insome sites than others.
Five of the seven studies found no associationbetween early math skills (Woodcock – Johnson Ap-plied Problems) and either teacher’s highest degreeor whether the teacher had a Bachelor’s degree.NCEDL found that children whose teacher had aBachelor’s degree or higher had slightly higher mathscores (d 5 .07) than children whose teacher did nothave a Bachelor’s degree. This association was thebasis of the significant association between the morerefined levels of education and math scores in theNCEDL sample. Children’s math scores were higherwhen teachers had a Bachelor’s degree than whenteachers had only a high school degree (d 5 .19).NICHD, on the other hand, found the opposite effect:Children whose teacher did not have a Bachelor’sdegree scored higher on the Applied Problems testthan children whose teacher had a Bachelor’s degree(d 5 � .18).
Question 2: Highest Education Level Among TeachersWith ECE Major
The second question asked whether highest levelof education predicts classroom quality and/orchildren’s academic gains among teachers whosehighest degree was in early childhood education orchild development (see Table 7). We conducted 19analyses for this question (4 outcomes � 5 studies,
with MAF unable to test Letter – Word). As can beseen in Table 7, only 2 of 19 analyses provided anyevidence of an association.
Of the five studies that were able to address thisquestion, three found no association with observedquality or the child’s language, prereading, or mathskills. EHS found that among those who majored inearly childhood education or child development,teachers with a graduate degree had higher qualityclassrooms than those with a Bachelor’s degree(d 5 .46), who in turn had higher quality classroomsthan those with an Associate’s degree (d 5 .57).Furthermore, an interaction between site andteachers’ education among ECE majors in EHS in-dicated that stronger associations were obtained insome sites and weaker associations in other sites.EHS did not find a significant association betweenteacher degree and any of the child outcomes inclassrooms in which the teacher majored in earlychildhood education or child development. Inaddition, teacher degree among teachers withan early childhood education or child developmentmajor was significantly associated with prereadingscores in NCEDL, but none of the pairwise com-parisons was sufficiently large to achieve statisticalsignificance. Furthermore, teacher degree amongECE/CD majors was not associated with quality orthe child’s language or math scores in the NCEDLstudy.
Question 3: ECE Major Among Teachers With aBachelor’s
The third question asked whether the teacher’smajor made a difference, among teachers with aBachelor’s degree (see Table 8). For this question,each study split the teachers whose highest degreewas Bachelor’s into three groups: (1) teachers whomajored in early childhood education or child de-velopment, (2) teachers who majored in any type ofeducation other than early childhood or child de-velopment, and (3) teachers who majored in any-thing else. We conducted 23 analyses for thisquestion (4 outcomes � 6 studies, with MAF unableto test Letter – Word ID). As can be seen in Table 8,only 1 of 23 analyses found a significant effect forteacher major for any of the outcomes. In the FACESstudy, there was a significant association betweenteacher’s major and children’s spring PPVT scores;however, pairwise comparisons revealed no signifi-cant between-group differences. No other significantassociations were found between teacher major andany of the outcomes of interest in any study. A sig-nificant interaction between teacher’s major and
572 Early et al.

family poverty in the NCEDL study indicated thatafter adjusting for covariates, prereading scores weresimilar among children who were poor and thosewho were not poor if the teacher majored in earlychildhood education or child development; however,when the teacher did not major in any type of edu-cation (i.e., group 3 as outlined above), the childrenwho were not poor scored lower than the poorchildren.
Discussion
Using seven recent, major studies of classroom-based educational programs for 4-year-olds, theseanalyses, taken together, do not provide convincingevidence of an association between teachers’ educa-tion or major and either classroom quality or chil-dren’s academic gains. Most of the analyses yieldednull findings. Although there were some statisticallysignificant associations, no clear pattern emerged.For instance, two of the studies indicated that qualitywas higher when the teacher had a Bachelor’s degreeor more, one study indicated that quality was lowerwhen the teacher had a Bachelor’s degree or more,and four studies found no association. Although thequickFand incorrectFconclusion might be that
anybody can effectively teach preschool, we believethat the results from this study must be interpretedcautiously and that they raise more questions thananswers. We start the Discussion by considering afew possible reasons why we did not find evidenceof associations.
Why Did We Not Find Associations?
We expected to find associations between teach-ers’ education and both classroom quality and chil-dren’s outcomes. Generally, we (like the rest of thepublic) still think education should matter forteachers as well as for a host of other professions.Why did we not find evidence to confirm our belief?It is possible that the associations between teachers’education or major and either classroom quality orchildren’s academic gains do exist but that we didnot find evidence of associations because of limita-tions of the individual studies or this replicatedsecondary data analysis project. Although we rec-ognize the limitations of this work as described in alater section, we do not believe that the limitationsprevented us from finding associations. More likely,the lack of significant findings reflects the currentreality of the field. Three different reasons for the
Table 7
Question 2: Highest Degree as a Predictor of Quality and Children’s Outcomes Among Teachers Who Majored in Early Childhood Education or Child
Development
EHS FACES GECS MAF NCEDL NICHD PCER
Classroom quality F(2, 822) 5 5.80�� F(2, 299) 5 1.48 NA F(2, 125) 5 2.37 F(2, 314) 5 1.18 F(2, 338) 5 2.64 NA
Associate’s M(SE) 4.49 (0.24)a 4.33 (0.17) 5.11 (0.16) 3.90 (0.22) 11.10 (0.62)
Bachelor’s M(SE) 5.15 (0.07)b 4.04 (0.09) 5.03 (0.07) 3.92 (0.11) 12.94 (0.57)
Graduate M(SE) 5.67 (0.19)c 3.78 (0.29) 4.63 (0.18) 4.11 (0.20) 15.67 (2.55)
Receptive language F(2, 793) 5 1.82 F(2, 284) 5 0.28 NA F(2, 361) 5 1.23 F(2, 951) 5 2.24 F(2, 331) 5 0.02 NA
Associate’s M(SE) 88.42 (2.41) 86.92 (1.20) 95.87 (5.65) 92.47 (1.28) 97.28 (4.39)
Bachelor’s M(SE) 91.18 (0.90) 86.32 (0.42) 89.24 (1.00) 94.61 (0.67) 97.64 (3.57)
Graduate M(SE) 94.88 (2.51) 86.50 (2.10) 83.68 (3.52) 96.33 (1.55) 99.03 (16.95)
Prereading F(2, 793) 5 0.48 F(2, 284) 5 0.36 NA NA F(2, 551) 5 3.08� F(2, 331) 5 0.01 NA
Associate’s M(SE) 87.62 (2.86) 99.15 (1.65) 100.85 (1.85)a 102.24 (3.29)
Bachelor’s M(SE) 89.96 (0.93) 99.55 (0.57) 101.61 (0.98) a 103.38 (2.69)
Graduate M(SE) 91.60 (2.76) 101.41 (2.84) 99.92 (2.15)a 104.60 (12.83)
Math F(2, 793) 5 1.02 F(2, 284) 5 0.49 NA F(2, 361) 5 0.49 F(2, 951) 5 0.26 F(2, 331) 5 0.09 NA
Associate’s M(SE) 84.53 (3.31) 91.50 (1.44) 88.80 (5.85) 98.11 (1.48) 102.75(4.05)
Bachelor’s M(SE) 88.48 (1.11) 92.42 (0.54) 93.48 (0.99) 97.76 (0.74) 104.08 (3.28)
Graduate M(SE) 91.44 (3.45) 91.58 (2.57) 95.23 (3.50) 97.56 (1.69) 107.92 (15.65)
Note. EHS 5 Early Head Start; GECS 5 Georgia Early Childhood Study; FACES 5 Family and Child Experiences Survey; MAF 5 More atFour; NA 5 not analyzed (measure not included in study, too little variance, or subgroups that are too small); NCEDL 5 National Centerfor Early Development and Learning; NICHD 5 National Institute of Child Health and Human Development; PCER 5 Preschool Cur-riculum Evaluation Research.Significant effects appear in bold. Adjusted means that are significantly different from one another (po.05) have different superscripts.�po.05, ��po.01, ���po.001.
Teachers’ Education in Preschool Programs 573

lack of associations are considered below: the teacherpreparation system, support within programs, andmarket forces.
First, the teacher preparation system may nothave prepared teachers adequately to teach pre-schoolers. A recent review of K – 12 teachers’ edu-cation research suggests that the research base forcoursework, methods, and pedagogy in teacherpreparation programs is lacking (Cochran-Smith &Zeichner, 2005). This may also be true in the field ofearly childhood. Furthermore, the U.S. Departmentof Education has recently increased the standards forresearch on effective educational practices (Coalitionfor Evidence-Based Policy, 2003; Shavelson & Towne,2003). Findings from new research using thesehigher standards were probably not incorporatedinto the teacher preparation programs when themajority of these teachers were in school over 10years ago. Likewise, today’s more educated teachersmay have completed their university training at atime when math and prereading skills were deem-phasized for young children.
Along these same lines, some researchers in earlychildhood education believe that trusting, respectfulrelationships between children and adults form thebasis for much learning in early childhood, including
academic skills (see Espinosa, 2002; Hamre & Pianta,2005; National Research Council and Institute ofMedicine, 2000; Pianta, 1999, for reviews). If this istrue, it may be that this aspect of early childhooddevelopment has been underemphasized in earlychildhood teacher preparation programs, possiblyleaving teachers with content knowledge aroundacademic instruction, but lacking the needed skillsfor forming individual relationships that can serve asthe base for academic learning.
We could not directly test questions about thequality or content of the teacher preparation pro-grams because the studies in this project did notinclude the needed data. A careful, systematic pro-gram of research is needed to understand the impactof early childhood teacher preparation programs onteacher quality, classroom quality, and child out-comes, a conclusion reflected in recent federalfunding initiatives in early childhood (U.S. Depart-ment of Education, IES, 2005). Likewise, more fine-grained research is needed to address which aspectsof teachers’ attitudes, knowledge, and behaviorare affected by participation in higher education andin-service training. The field currently lacksinformation about what is taught in teacher prepar-ation and in-service programs, how that instruction
Table 8
Question 3: Major as a Predictor of Quality and Children’s Outcomes Among Teachers Whose Highest Degree is Bachelor’s
EHS FACES GECS MAF NCEDL NICHD PCER
Classroom quality NA F(2, 70) 5 0.07 F(1, 24) 5 0.16 F(2, 168) 5 0.23 F(2, 304) 5 1.52 F(2, 158) 5 0.49 F(2, 30) 5 0.12
ECE/CD M(SE) 4.10 (0.38) 4.21 (0.30) 5.04 (0.07) 3.92 (0.13) 3.55 (0.23) 3.5 (0.2)
Other Ed. M(SE) 4.06 (0.43) NA 5.08 (0.10) 3.88 (0.16) 3.61 (0.60) 3.6 (0.6)
Other M(SE) 4.06 (0.48) 4.34 (0.50) 5.12 (0.12) 4.18 (0.26) 3.30 (0.66) 3.3 (0.7)
Receptive language NA F(2, 70) 5 3.45� F(1, 31) 5 0.19 F(2, 510) 5 0.12 F(2, 1070) 5 0.14 F(2, 151) 5 1.38 F(2, 35) 5 0.33
ECE/CD M(SE) 87.74 (0.72)a 97.19 (1.46) 88.76 (0.98) 94.57 (0.78) 93.91 (0.92) 93.9 (0.9)
Other Ed. M(SE) 89.31 (1.86)a NA 92.14 (7.49) 94.62 (1.16) 92.89 (2.19) 92.9 (2.2)
Other M(SE) 90.57 (1.95)a 96.51 (2.50) 86.39 (4.67) 93.86 (3.22) 95.55 (3.03) 95.5 (3.0)
Prereading NA F(2, 70) 5 0.77 F(1, 31) 5 0.04 NA F(2, 815) 5 1.67 F(2, 151) 5 0.12 F(2, 35) 5 0.28
ECE/CD M(SE) 100.60 (1.08) 105.81 (1.81) 102.27 (0.95) 101.73 (0.85) 101.7 (0.9)
Other Ed. M(SE) 99.60 (2.78) NA 103.36 (1.34) 101.10 (2.36) 101.1(2.4)
Other M(SE) 103.79 (3.28) 106.06 (3.13) 100.26 (1.49) 101.25 (2.70) 101.3 (2.7)
Math NA F(2, 70) 5 0.29 F(1, 31) 5 1.64 F(2, 510) 5 0.13 F(2, 1070) 5 1.24 F(2, 151) 5 1.65 F(2, 35) 5 1.06
ECE/CD M(SE) 92.84 (1.07) 96.34 (1.43) 92.63 (0.97) 99.22 (0.92) 97.17 (0.83) 97.2 (0.8)
Other Ed. M(SE) 93.87 (2.79) NA 92.23 (7.67) 97.44 (1.40) 97.62 (2.25) 97.6 (2.3)
Other M(SE) 93.40 (3.20) 94.18 (2.53) 91.84 (4.73) 103.22 (3.84) 94.18 (2.80) 94.2 (2.8)
Note. EHS 5 Early Head Start; FACES 5 Family and Child Experiences Survey; GECS 5 Georgia Early Childhood Study; MAF 5 More atFour; NA 5 not analyzed (measure not included in study, too little variance, or subgroups too small); NCEDL 5 National Center for EarlyDevelopment and Learning; NICHD 5 National Institute of Child Health and Human Development; PCER 5 Preschool CurriculumEvaluation Research.Significant effects appear in bold. Adjusted means that are significantly different from one another (po.05) have different superscripts. ForGECS, ‘‘other field of education’’ (n 5 5) has been combined with ‘‘other’’(n 5 5) due to small group sizes.�po.05, ��po.01, ���po.001.
574 Early et al.

is delivered, and the mechanisms by which it trans-lates into classroom practice.
A second possible reason for the lack of associ-ations is that teachers may not receive sufficientsupport to implement effectively what they havelearned. Recent research suggests that entry-levelteachers often feel overwhelmed and wouldappreciate monitoring or coaching during thetransition from teacher preparation to actual teach-ing (Hart, Stroot, Yinger, & Smith, 2005). Althoughmany early childhood educators become teachersbefore finishing their education, the need forsupport as teachers attempt to implement what theylearn in school undoubtedly still applies. Further-more, perhaps teachers feel pressure to abandonwhat they were taught in their teacher educationprograms and adhere to the school’s standardsand teaching strategies once they complete theireducation.
A third possible explanation for these largelynull findings is that current market forces havestimulated at least a short-term ripple in the labormarket for early education teachers. These studiescontained large numbers of publicly funded class-rooms (i.e., state funded prekindergarten, federallysponsored Head Start). The higher wages andbenefits provided in publicly funded programs, ascompared with community-based child care, mayattract and retain the best and the brightest teacherswithout a Bachelor’s degree (i.e., an Associate’s de-gree or less) to the public system. On the other hand,the lower wages provided in prekindergartens ascompared with elementary schools may lead thehighest quality teachers with a Bachelor’s degree toteach older children and may lead to increasedturnover among those Bachelor’s-level teachers whoselect to work with prekindergartners. These con-tradictory market forces may be diminishing the linkbetween education and quality in early care andeducation settings.
Likewise, within school systems where mostteachers, even those at the prekindergarten level,have a Bachelor’s degree there may be factors thatencourage the best teachers to teach older children,leaving teachers with fewer skills in the prekinder-garten settings. School administrators may place thebest teachers in grades in which high-stakes ac-countability testing occurs. The best teachers mayalso seek and obtain teaching positions in highergrades because those grades do not rely on discre-tionary funding as prekindergarten often does.Therefore, there may be negative selection in teach-ing prekindergarten for the highly skilled Bachelor’sor higher level teachers.
Possible Misinterpretations of the Findings
These findings do not indicate that teacher qualityis unimportant. Teachers’ education and teacherquality are two separate albeit related constructs.Although teacher quality is sometimes defined inpolicy and the press solely as teachers’ level of ed-ucation, the concept of teacher quality is much larger,representing more than just education. Teacherquality encompasses a broad array of knowledge,skills, and behaviors. This project looked only atteachers’ formal education.
By definition, teachers who provide instructionthat leads to positive child outcomes are high-qualityteachers. Thus, identifying and supporting high-quality teachers is important. Appropriate deliveryof high-quality, stimulating preschool education ischallenging and requires a great deal of skill. Thesedata indicate that a policy of using teachers’ educa-tional attainment and/or major will not substitutefor selecting teachers with the skills needed to teachat this level.
Likewise, these findings do not mean that post-secondary education cannot produce high-qualityteachers or that none of the current teacher prepar-ation programs are adequately preparing teachers.These analyses average across many different highereducation programs that have produced today’searly childhood educators. Many of the teachers inthese studies received their degrees 10, 20, or even30 years ago and may have received little or nocoursework or supervised practica in teaching4-year-olds as part of their teacher preparation pro-grams. Furthermore, the studies included in thisproject were not designed to evaluate postsecondaryeducation and, therefore, did not include informa-tion about these teachers’ educational experienceslike course content, rigor, or field placements. We canassume, however, that the quality of higher educa-tion programs varied. Nevertheless, the results fromthis replicated secondary data analysis project sug-gest that a policy of requiring a certain degree ormajor will not substitute for the hard work of se-lecting high-quality teachers and supporting them ina way that will maximize their capacity.
Finally, these findings do not indicate that teach-ers’ education is unimportant. It is likely that therelationships among teachers’ education, classroomquality, and child outcomes in preschool programsare complex. A new set of detailed studies on pro-fessional development is needed to better under-stand the role of teachers’ education in themultifaceted early care and education system.In-depth information about course content, grades,
Teachers’ Education in Preschool Programs 575

supervised practica experience, in-service trainingexperiences (quantity, quality, and content), and on-the-job support, supervision and monitoring wouldbegin to answer some of the outstanding questions.Furthermore, additional research on curricula andinstructional practices is needed to ensure that pro-fessional development focuses on aspects of the earlychildhood program that are most likely to lead tomaximum gains for children.
From a practical perspective, teachers’ educationin prekindergarten programs remains important be-cause the Bachelor’s degree is the established entrypoint into the teaching profession within a publicschool setting. As prekindergarten programs are in-creasingly administered by public schools, one couldexpect prekindergarten teachers to meet the same orsimilar teachers’ education standards as required inthe K – 12 grades.
Study Limitations
This replicated secondary data analysis projecthad several strengths, including use of many highlyregarded, rigorously collected data sets; commonvariable definitions and data analysis procedures;and inclusion of extensive control variables. Ana-lyzed together, they allow us to address a timelyissue in the policy and research arenas withoutworrying that the findings are artifacts of differencesin definition or analysis.
Some limitations should be noted, however. Weselected these quality and child outcome measuresbecause they were contained in most of the data sets.In turn, the investigators responsible for collectingthe data selected these measures because: (1) theyhave been linked to other important outcomes (e.g.,PPVT predicts later school success), (2) they arewidely used in educational research and hencenorms and standards are readily available, (3) theycan be administered in a reasonably short period oftime, and (4) data collectors without an extensivebackground in assessment can learn to administerthem reliably. The ECERS – R was a particularly lo-gical choice of outcomes because it had been linkedto teachers’ education in previous research (see Toutet al., 2005 for a review) and five of the studies in thisproject have linked ECERS – R scores to children’soutcomes (Howes et al., 2005; Love et al., 2003;Mashburn, 2006; Peisner-Feinberg & Maris, 2005b;Zill et al., 1997, 2003).
Nonetheless, different yet equally important out-comes could be linked to teachers’ education ormajor. It is possible, for instance, that the benefitschildren experience from a highly educated teacher
can be seen only in children’s higher order thinkingskills or when application of knowledge is mea-sured. Likewise, while the ECERS – R is an excellentmeasure of global quality it has its own limitations.Many of the items are out of the control of the teacherand many of the types of instruction that today’searly childhood educators value are not measured ormeasured in only a single item (e.g., child engage-ment, literacy-rich environment).
Furthermore, these data sets did not include all ofthe information that would be of interest in an-swering the primary research questions. For in-stance, among Associate’s-level teachers, there wasinsufficient variance to consider the role of major.Additionally, there are some potentially importantaspects of teacher education and preparation thatcould not be included in these analyses because theywere measured inconsistently across the studies.Namely, teaching certification/licensure and qualityand quantity of ongoing in-service training maycontribute to classroom quality and children’s aca-demic gains, but could not be included in the presentanalyses. Likewise, information about coursework,grades, practica experiences, ongoing training, andsupport would allow for more detailed and nuancedanalyses. These data sets and analyses also lack de-tailed measures of instructional practices and teacherbehaviors that might be helpful in understanding thelinks between teacher education, teacher practices,and quality. Lastly, these findings apply only toclassroom-based programs for 4-year-olds. We didnot include data for classrooms for younger childrenand we did not include data from family child-carehomes.
Implications
These findings have important implications forresearchers, policymakers, and practitioners.
Teacher Quality is Complex
The results from this replicated secondary dataanalysis project demonstrate the limitations of aconceptualization of teacher quality that reliesheavily on teacher degree or major. This finding isin line with recent debates in the K – 12 literatureregarding whether the educational attainment anddegree status are the correct targets for effectivelyimproving student achievement (Whitehurst, 2002).A new era of research is needed to address thecomplexity of teacher quality. Researchers should gobeyond the easy-to-measure constructs of degreeand major to more fully understand teacher quality
576 Early et al.
and its relationship with classroom quality and childoutcomes. This recommendation is in keeping withthe recent American Educational Research Associa-tion (AERA) report summarizing research on teach-ers’ education in the K – 12 system (Cochran-Smith &Zeichner, 2005). New measures are needed to cap-ture adequately the quantity and quality of not onlyteacher education but also specific teacher behaviorsand instructional practices in the classroom that aretied to positive child outcomes.
Likewise, we encourage policymakers and prac-titioners to consider more than teachers’ education inensuring high-quality teachers. Factors such as in-dividual teacher’s skills, classroom practice, andbeliefs could also be taken into account in the hiringprocess. A comprehensive professional developmentsystem for preservice and in-service teachers couldprovide the knowledge, skills, and supports forteachers to provide a high-quality early educationexperience that can positively impact children’s de-velopment.
Teacher Quality is Only One Component of a LargerEducational System
Teachers do not work in a vacuum but instead arepart of a larger educational system. Classroomquality and positive child outcomes are influencedby a host of other system components. Even the mosthighly skilled teachers need, for example, adequatematerials, curricular support, skilled teaching as-sistants, and a physical setting that is appropriate tomeeting the needs of young children. Furthermore,they need administrators and supervisors who sup-port the use of instructional practices recognized asleading to positive development in young childrenand ongoing professional development throughmentoring, monitoring, and supervision (Howes,James, & Ritchie, 2003; Ramey & Ramey, 2005). Mostlikely, the impact of teacher quality on classroomquality and child outcomes is influenced by manyother components of the early care and educationsystem. We recommend that policymakers not em-phasize one component (e.g., teachers’ education) asmore important than others but instead supportpolicies that address multiple components of teacherquality and the factors that might influence quality,such as mentoring, monitoring and supervision, andaccreditation of teacher preparation programs.
Teacher Quality Needs to be More Precisely Defined
We do not have the research base to identify thespecific teacher attributes associated with high
classroom quality or positive child outcomes. Al-though the (National Association for the Educationof Young Children (2001; Hyson, 2003) has describedteacher competencies as part of their standards forprofessional preparation, additional work is neededto further describe these competencies in more detailand provide an evidence base for the relationshipbetween these competencies, quality programs, andgood outcomes for children (Hyson & Biggar, 2005).With a more precise description of what a ‘‘highlyqualified’’ preschool teacher knows and does,teacher preparation programs could more easilyalign their coursework and practica to these stand-ards and researchers could better study the effects ofteacher quality on classroom quality and child out-comes.
Conclusions
This project has addressed an important questionin the field of early childhood education: Are policiesthat increase the educational attainment of preschoolteachers likely to lead to increased classroom qualityor children’s academic gains? These data indicatethat such policies alone are unlikely to have sucheffects. Instead, teachers’ education must be consid-ered as part of a system of factors that contribute toteacher quality, which in turn is related to classroomquality and children’s gains. The findings should notbe interpreted as an indictment of the role of edu-cation in high-quality programs for 4-year-olds. Ra-ther, these findings can serve as a springboard thatmoves research and policy regarding the role ofteachers’ education and, more broadly, teacherquality to a new level that is increasingly multifa-ceted and nuanced.
Cochran-Smith and Zeichner (2005) in their AERAresearch panel report, make similar calls for re-searchers and policymakers to view teachers’ educa-tion more complexly in the K – 12 education system.The results from this project and the AERA researchpanel highlight the struggles shared across the edu-cation spectrum, from early care and education ofpreschoolers to higher education. We need moreprecise studies of specific types of preservice teacherpreparationFand how they interact with otherteacher and program characteristicsFto produce ahigh-quality educational experience for children.
References
Administration for Children and Families. U.S. Depart-ment of Health & Human Services. (2002, June). Makinga difference in the lives of infants and toddlers and their
Teachers’ Education in Preschool Programs 577

families: The impacts of Early Head Start, Volume I: Finaltechnical report. Retrieved December 16, 2005, from http://www.acf.hhs.gov/programs/core/ongoing_research/ehs/impacts_vol1/impacts_vol1.pdf
Barnett, W. S. (2003). Better teachers, better preschools: Studentachievement linked with teacher qualifications. PreschoolPolicy Matters (2). New Brunswick, NJ: National Institutefor Early Education Research.
Barnett, W. S., Hustedt, J. T., Robin, K. B., & Schulman, K.L. (2005). The state of preschool. 2005 state preschool year-book. New Brunswick, NJ: The National Institute forEarly Education Research. Retrieved June 21,2006, fromhttp://nieer.org/yearbook/
Blau, D. M. (2000). The production of quality in child-carecenters: Another look. Applied Developmental Science, 4,136 – 147.
Bracken, B. A. (1984). The Bracken basic concept scale. SanAntonio, TX: The Psychological Corporation.
Burchinal, M. R., Cryer, D., Clifford, R. M., & Howes, C.(2002). Caregiver training and classroom quality in childcare centers. Applied Developmental Science, 6, 2 – 11.
Burchinal, M. R., Roberts, J. E., Riggins, R., Zeisel, S. A.,Neebe, E., & Bryant, D. (2000). Relating quality of center-based child care to early cognitive and language devel-opment longitudinally. Child Development, 71, 339 – 357.
Campbell, F. A., Ramey, C. T., Pungello, E. P., Sparling, J., &Miller-Johnson, S. (2002). Early childhood education:Young adult outcomes from the Abecedarian Project.Applied Developmental Science, 6, 42 – 57.
Chow, B. W., & McBride-Chang, C. (2003). Promotinglanguage and literacy development through parent –child reading in Hong Kong preschoolers. Early Educa-tion and Development, 14, 233 – 248.
Coalition for Evidence-Based Policy. (2003). Identifying andimplementing educational practices supported by rigorousevidence: A user friendly guide. Retrieved February 22,2006, from http://www.ed.gov/rschstat/research/pubs/rigorousevid/index.html
Cochran-Smith, M., & Zeichner, K. M. (2005). Studyingteacher education: The report of the AERA panel on researchand teacher education. Mahwah, NJ: Lawrence ErlbaumAssociates.
Cohen, J. (1988). Statistical power analysis of the behavioralsciences (2nd ed.). Hillsdale, NJ: Erlbaum.
Cost, Quality, & Child Outcomes Study Team. (1995). Cost,quality, and child outcomes in child care centers, executivesummary (2nd ed.). Denver: Economics Department,University of Colorado at Denver.
de Kruif, R. E. L., McWilliam, R. A., Ridley, S. M., &Wakely, M. B. (2000). Classification of teachers’ inter-action behaviors in early childhood classrooms. EarlyChildhood Research Quarterly, 15, 247 – 268.
Dunn, L. M., & Dunn, L. M. (1997). Peabody picturevocabulary test (3rd ed.). Circle Pines, MN: AmericanGuidance Service.
Early, D., Barbarin, O., Bryant, B., Burchinal, M., Chang, F.,Clifford, R., et al. (2005). Pre-Kindergarten in eleven states:NCEDL’s Multi-State Study of Pre-Kindergarten and State-
Wide Early Education Programs (SWEEP) study. Retriev-ed December 1, 2005, from http://www.fpg.unc.edu/�ncedl/pdfs/SWEEP_MS_summary_final.pdf
Early, D. M., Bryant, D., Pianta, R., Clifford, R., Burchinal,M., Ritchie, S., et al. (2006). Are teachers’ educa-tion, major, and credentials related to classroomquality and children’s academic gains in pre-kindergarten? Early Childhood Research Quarterly, 21,174 – 195.
Espinosa, L. M. (2002). The connections between social-emotional development and early literacy. In Set forsuccess: Building a strong foundation for school readinessbased on the social-emotional development of young children(pp. 30 – 44). Kansas City, MO: The Ewing Marion Ka-uffman Foundation.
Hamre, B., & Pianta, R. C. (2005). Can instructional andemotional support in the first grade classroom make adifference for children at risk of school failure? ChildDevelopment, 76, 949 – 967.
Hamre, B. K., & Bridges, M. (2004). Early care and educationstaff preparation, quality, an child development: A review ofthe literature. Unpublished manuscript. University ofCalifornia at Berkeley.
Harms, T., Clifford, R. M., & Cryer, D. (1998). Early child-hood environment rating scale (Rev. ed.). New York:Teachers College Press.
Hart, P., Stroot, S., Yinger, R., & Smith, S. (2005). Meeting theteacher education accountability challenge: A focus on noviceand experienced teacher studies. Mount Vernon, OH:Teacher Quality Partnership.
Henry, G. T., Henderson, L. W., Ponder, B. D., Gordon, C.S., Mashburn, A., & Rickman, D. K. (2003). Report of thefindings from the Early Childhood Study: 2001 – 02. Atlanta,GA: Georgia State University, Andrew Young School ofPolicy Studies.
Henry, G. T., Ponder, B. D., Rickman, D. K., Mashburn, A.,Henderson, L. W., & Gordon, C. S. (2004). Evaluation ofthe implementation of the Georgia Pre-K Program: Report ofthe findings from the Early Childhood Study (2002 – 03).Atlanta, GA: Georgia State University, Andrew YoungSchool of Policy Studies.
Howes, C., Burchinal, M., Pianta, R., Bryant, D., Early, D.M., Clifford, R., et al. (2007). Ready to learn? Children’spre-academic achievement in pre-kindergarten programs.Manuscript submitted for publication. University ofCalifornia at Los Angeles.
Howes, C., James, J., & Ritchie, S. (2003). Pathways to ef-fective teaching. Early Childhood Research Quarterly, 18,104 – 120.
Howes, C., Whitebook, M., & Phillips, D. (1992). Teachercharacteristics and effective teaching in child care:Findings from the National Child Care Staffing Study.Child & Youth Care Forum. Special Issue: Meeting thechild care needs of the 1990s: Perspectives on day care: II, 21,399 – 414.
Hyson, M. (Ed.). (2003). Preparing early childhood profes-sionals: NAEYC’s standards for programs. Washington, DC:NAEYC.
578 Early et al.

Hyson, M., & Biggar, H. (2005). NAEYC’s standards forearly childhood professional preparation. In M. Zaslow& I. Martinez-Beck (Eds.), Critical issues in early childhoodprofessional development (pp. 283 – 308). Baltimore: PaulH. Brookes Publishing Co.
Lee, V., & Burkam, D. (2002). Inequality at the starting gate:Social background differences in achievement as children be-gin school. Washington, DC: Economic Policy Institute.
Love, J. M., Harrison, L., Sagi-Schwartz, A., van IJzendo-orn, M. H., Ross, C., Ungerer, J. A., et al. (2003). Childcare quality matters: How conclusions may vary withcontext. Child Development, 74, 1021 – 1033.
Mashburn, A. (2006). Quality of the social and physical envi-ronments in preschool programs and changes in children’sacademic, language and literacy skills. Manuscript submit-ted for publication. University of Virginia.
Maxwell, K. L., Feild, C. C., & Clifford, R. M. (2005). De-fining and measuring professional development in earlychildhood research. In M. Zaslow & I. Martinez-Beck(Eds.), Critical issues in early childhood professional devel-opment (pp. 21 – 48). Baltimore: Paul H. Brookes Pub-lishing Co.
McLanahan, S. (Ed.). (2005). School readiness: Closing ra-cial and ethnic gaps. The Future of Children, 15.
National Association for the Education of Young Children.(2001). Standards for early childhood professional preparation:Initial licensure programs. Retrieved November 19, 2005,from http://www.naeyc.org/faculty/pdf/2001.pdf
National Research Council (2001). Eager to learn: Edu-cating or preschoolers. Committe on Early ChildhoodPedagogy. B. T. Bowman, M. S. Donovan, & M. S. Burns,(Eds.), Commission on Behavioral and Social Sciences andEducation. Washington DC: National Academy Press.
National Research Council and Institute of Medicine.(2000). From neurons to neighborhoods: The science of earlychildhood development. Committee on Integrating theScience of Early Childhood Development. J. P. Shonkoff,& D. A. Phillips (Eds.), Board on children, youth, andfamilies, commission on behavioral and social sciencesand education. Washington, DC: National AcademyPress.
NICHD Early Child Care Research Network. (2002). Child-care structure ! Process ! Outcome: Direct and in-direct effects of child-care quality on young children’sdevelopment. Psychological Science, 13, 199 – 206.
NICHD Early Child Care Research Network. (2005). Earlychild care and children’s development in the primarygrades: Follow-up results from the NICHD Study ofEarly Child Care. American Educational Research Journal,42, 537 – 570.
NICHD SECC. (n.d.). The NICHD Study of Early Child Careand Youth Development. Retrieved November 23, 2005,from http://secc.rti.org/
PCER Project. (n.d.) Preschool Evaluation Curriculum Re-search Project. Retrieved January 6, 2006, from http://pcer.rti.org/
Peisner-Feinberg, E., Burchinal, M., Clifford, R., Culkin, M.,Howes, C., Kagan, S., et al. (2001). The relation of pre-
school child-care quality to children’s cognitive andsocial developmental trajectories through second grade.Child Development, 72, 1534 – 1553.
Peisner-Feinberg, E. S., & Maris, C. L. (2005a). Evaluation ofthe North Carolina More at Four Pre-kindergarten Program:Year 2 Report (July 1, 2002 – June 30, 2003). ChapelHill, NC: FPG Child Development Institute. Retri-eved December 19, 2005, from http://www.fpg.unc.edu/�mafeval/pdfs/MAF_Yr2_Rpt.pdf
Peisner-Feinberg, E. S., & Maris, C. L. (2005b). Evaluation ofthe North Carolina More at Four Pre-kindergarten Pro-gram: Year 3 Report (July 1, 2003 – June 30, 2004). ChapelHill, NC: FPG Child Development Institute. RetrievedDecember 19, 2005, from http://www.fpg.unc.edu/� mafeval/pdfs/MAF_Yr3_Rpt.pdf
Phillips, D., Mekos, D., Scarr, S., McCartney, K., & Abbott-Shim, M. (2001). Within and beyond the classroom door:Assessing quality in child care centers. Early ChildhoodResearch Quarterly, 15, 475 – 496.
Phillips, M., Brooks-Gunn, J., Duncan, G. J., Klebanov, P., &Crane, J. (1998). Family background, parenting practices,and the black/white test score gap. In C. Jencks & M.Phillips (Eds.), The black/white test score gap (pp. 103 –145). Washington, DC: Brookings.
Phillipsen, L. C., Burchinal, M. R., Howes, C., & Cryer, D.(1997). The prediction of process quality from structuralfeatures of child care. Early Childhood Research Quarterly,12, 281 – 303.
Pianta, R. C. (1999). Enhancing relationships between childrenand teachers. Washington, DC: American PsychologicalAssociation.
Ramey, S. L., & Ramey, C. T. (2005). Creating and sustain-ing a high-quality workforce in child care, early inter-vention, and school readiness programs. In M. Zaslow &I. Martinez-Beck (Eds.), Critical issues in early childhoodprofessional development (pp. 355 – 368). Baltimore: PaulH. Brookes Publishing Co.
Reynell, J. (1991). Reynell development language scales (U.S.ed.). Los Angeles: Western Psychological Association.
Reynolds, A. J., Temple, J. A., Robertson, D. L., & Mann, E.A. (2002). Age 21 cost-benefit analysis of the Title I ChicagoChild – Parent Centers. Madison, WI: Institute for Re-search on Poverty.
Rubin, D. B. (1987). Multiple imputation for non-response insurveys. New York: Wiley.
Scarr, S., Eisenberg, M., & Deater-Deckard, K. (1994).Measurement of quality in child care centers. EarlyChildhood Research Quarterly, 9, 131 – 151.
Schafer, J. L. (1997). Analysis of incomplete multivariate data.London: Chapman & Hall.
Schafer, J. L., & Graham, J. W. (2002). Missing data: Ourview of the state of the art. Psychological Methods, 7,147 – 177.
Schweinhart, L. J. (2004). The High/Scope Perry PreschoolProject through age 40: Summary, conclusions and frequentlyasked questions. Retrieved February 14, 2006, from http://www.highscope.org/Research/PerryProject/PerryAge40SumWeb.pdf
Teachers’ Education in Preschool Programs 579

Shavelson, R., & Towne, L. (2003). Scientific research in ed-ucation. National Research Council: National AcademyPress.
Stipek, D. J., & Ryan, R. R. (1997). Economically disad-vantaged preschoolers: Ready to learn but further to go.Developmental Psychology, 33, 711 – 723.
Tout, K., Zaslow, M., & Berry, D. (2005). Quality andqualifications: Links between professional developmentand quality in early care and education settings. In M.Zaslow & I. Martinez-Beck (Eds.), Critical issues in earlychildhood professional development (pp. 77 – 110). Balti-more: Paul H. Brookes Publishing Co.
Trust for Early Education. (2004, Fall). A policy primer: Qualitypre-kindergarten. Retrieved February 15, 2006, from http://www.trustforearlyed.org/docs/TEE-Primer4.pdf
U.S. Department of Education, Institute of Education Sci-ences. (2004). Digest for Education Statistics [Electronic ver-sion] Table 161. Retrieved February 13, 2006, fromhttp://nces.ed.gov/programs/digest/d04/tables/dt04_161.asp
U.S. Department of Education, Institute of Education Sci-ences. (2005). Notice inviting applications for grants tosupport education research for fiscal year (FY) 2006,Federal Register, 70(87), May 6, 2005.
U.S. Department of Health and Human Services , Ad-ministration for Children and Families, Office of HeadStart. (2006). Head Start Program Fact Sheet, Fiscal Year2006. Retrieved July 31, 2006, from http://www.acf.hhs.gov/programs/hsb/research/2006.htm.
Whitehurst, G. J. (2002). Scientifically based research onteacher quality: Research on teacher preparation and profes-
sional development. Presented to White House Conferenceon Preparing Tomorrow’s Teachers, March 5, 2002.Retrieved March 3, 2006, from http://www.ed.gov/admins/tchrqual/learn/preparingteachersconference/whitehurst.html
Woodcock, R. W., & Johnson, M. B. (1990). Woodcock –Johnson Psycho-Educational BatteryFRevised. Itasca, IL:Riverside Publishing.
Woodcock, R. W., McGrew, K. S., & Mather, N. (2001).Woodcock – Johnson-III Tests of Achievement. Itasca, IL:Riverside Publishing.
Zill, N., & Resnick, G. (2005). Emergent literacy of low-income children in Head Start: Relationships with childand family characteristics, program factors and class-room quality. In D. Dickinson & S. Neumann (Eds.),Handbook of early literacy research (Vol. II). New York:Guilford Publications.
Zill, N., Resnick, G., Kim, K., McKey, R. H., Clark, C., Pai-Samant, S., et al. (1997). Head Start FACES: Longitudinalfindings on program performance. Third progress report.Washington, DC: U.S. Department of Health and Hu-man Services, Administration for Children and Families.
Zill, N., Resnick, G., Kim, K., O’Donnell, K., Sorongon, A.,McKey, R. H., et al. (2003). Head Start FACES 2000: Awhole-child perspective on program performance. Fourthprogress report. Washington, DC: U.S. Department ofHealth and Human Services, Administration for Chil-dren and Families.
Zimmerman, I. L., Steiner, V. G., & Pond, R. E. (1979).Preschool Language Scale (PLS) (3rd ed.). San Antonio, TX:The Psychological Corporation.
580 Early et al.