
Teacher preparation for Universal Basic Education program in Nigeria using Information and...
299
nternational Handbook of Academic Research and Teaching ISSN 1940-1884 2009 Proceedings Published by: Intellectbase International Consortium . Volume 5
Transcript of Teacher preparation for Universal Basic Education program in Nigeria using Information and...

nternational Handbook of Academic Research and Teaching
ISSN 1940-1884
2009 Proceedings
Published by: Intellectbase International Consortium .
Volume 5

Conference Proceedings Spring 2009
PROGRAM COMMITTEE
Dr. David King Conference Chair
Dr. Jifu Wang Co-Chair
CONFERENCE ORGANIZERS & INTERNATIONAL AFFILIATES
United States Australia Europe
Mr. Cleveland Evans Mrs. Karina Dyer Mr. Kevin Kofi
Ms. Julie Post Mr. Graeme William Mr. Benjamin Effa
Mr. Ben Murray Ms. Michelle Joanne Ms. Christina Maame
Ms. Loria Hampton Mrs. Wendy Morrell Mr. Kenneth Obeng
ACADEMIC ASSOCIATES
Dr. Nitya Karmakar Australian Affiliate
Dr. Danka Radulovic European Affiliate
Dr. Peter Ross United States Affiliate
www.intellectbase.org
INTELLECTBASE INTERNATIONAL CONSORTIUM Academic Conference, Dallas, TX, Mar. 19-21, 2009
Intellectual Perspectives & Multi-Disciplinary Foundations

Published by Intellectbase International Consortium (IIC) Conference Committee: Intellectbase International Consortium, 1615 7th Ave N, Nashville, TN 37208, USA
ISSN (Print): 1940-1876 --------- Issued by the Library of Congress, Washington DC, USA ISSN (CD-ROM): 1940-1884 --------- Issued by the Library of Congress, Washington DC, USA
©2009. This volume is copyright to the Intellectbase International Consortium Academic Conferences. Apart from use as permitted under the Copyright Act of 1976, no part may be reproduced by any process without prior written permission.
EXECUTIVE EDITORIAL BOARD (EEB) AND REVIEWERS TASK PANEL (RTP)
Dr. Nesa L’Abbe Wu Dr. Jifu Wang
Eastern Michigan University, USA University of Houston Victoria, USA
Dr. Elizabeth Kunnu Dr. Regina Schaefer
Tennessee State University, USA University of La Verne, USA
Dr. Azene Zenebe Dr. Kehinde Alebiosu
Bowie State University, USA Olabisi Onabanjo University, Nigeria
Dr. Janet Forney Dr. Reza Vaghefi
Piedmont College, USA University of North Florida, USA
Dr. Kong-Cheng Wong Dr. Anita King
Governors State University, USA University of South Alabama, USA
Dr. Sloan T. Letman, III Dr. Lloyd V. Dempster
American Intercontinental University, USA Texas A & M University - Kingsville, USA
Dr. Dana Tesone Dr. Bijesh Tolia
University of Central Florida, USA Chicago State University, USA
Dr. Farhad Simyar Dr. Danka Radulovic
Chicago State University, USA University of Belgrade, Serbia
Dr. Frank Cheng Dr. Joel Jolayemi
Central Michigan University, USA Tennessee State University, USA
Dr. Stephen Kariuki Dr. John Elson
Nipissing University, Canada National University, USA
Dr. Rose Mary Newton Dr. Van Reidhead
University of Alabama, USA University of Texas-Pan American, USA
Dr. Babalola J. Ogunkola Dr. James (Jim) Robbins
Olabisi Onabanjo University, Nigeria Trinity Washington University, USA
Dr. Shahnawaz Muhammed Dr. Jeffrey (Jeff) Kim
Fayetteville State University, USA University of Washington, USA
Dr. Jiri Strouhal Dr. Dorothea Gaulden
University of Economics-Prague, Czech Republic Sensible Solutions, USA
Dr. Brett Sims Dr. Rafiuddin Ahmed
Grambling State University, USA James Cook University, Australia
Dr. Frank Tsui Dr. Jeffrey Siekpe
Southern Polytechnic State University, USA Tennessee State University, USA
Dr. Myna German Dr. David Davis
Delaware State University, USA The University of West Florida, USA

EXECUTIVE EDITORIAL BOARD (EEB) AND REVIEWERS TASK PANEL (RTP) (Continued)
Dr. Mary Montgomery Dr. Gerald Marquis
Jacksonville State University, USA Tennessee State University
Dr. John O'Shaughnessy Dr. John Tures
San Francisco State University, USA LaGrange College, USA
Dr. James Ellzy Dr. Peter Ross
Tennessee State University, USA Mercer University, USA
Dr. Vera Lim Mei-Lin Dr. Sandra Davis
The University of Sydney, Australia The University of West Florida, USA
Dr. Padmini Banerjee Dr. Demi Chung
Delaware State University, USA University of Sydney, Australia
Dr. Robin Latimer Dr. Denise Richardson
Lamar University, USA Bluefield State College, USA
Dr. Aditi Mitra Dr. Xuefeng Wang
University of Colorado, USA Taiyun Normal University, China
Dr. Michael Alexander Dr. Nitya Karmakar
University of Arkansas at Monticello, USA University of Western Sydney, Australia
Dr. Ademola Olatoye Dr. Greg Gibbs
Olabisi Onabanjo University, Nigeria St. Bonaventure University, USA
Dr. Rodney Davis Dr. Mahmoud Al-Dalahmeh
Troy University, USA University of Wollongong, Australia
Dr. Vivian Kirby Dr. Jeanne Kuhler
Kennesaw State University, USA Auburn University, USA
Dr. Andy Ju An Wang Dr. Mike Rippy
Southern Polytechnic State University, USA Troy University, USA
Dr. Tehmina Khan Dr. William Ebomoyi
Victoria University, Australia Chicago State University, USA
Dr. Dennis Taylor Dr. David White
RMIT University, Australia Roosevelt University, USA
Dr. Steven Watts Dr. Edilberto Raynes
Pepperdine University, USA Tennessee State University, USA
Dr. Kevin Barksdale Dr. Christian V. Fugar
Union University, USA Dillard University, USA
Dr. Nancy Miller Dr. George Romeo
Governors State University, USA Rowan University, USA
Dr. Werner Heyns Dr. William Root
Savell Bird & Axon, UK Augusta State University, USA
Dr. Robert Kitahara Dr. Harrison C. Hartman
Troy University – Southeast Region, USA University of Georgia, USA
Dr. Brandon Hamilton Dr. Natalie Weathers
Hamilton's Solutions, USA Philadelphia University, USA
Dr. William Cheng Dr. Linwei Niu
Troy University, USA Claflin University, USA
Dr. Taida Kelly Dr. Shikha Vyas-Doorgapersad
Governors State University, USA North-West University, South Africa

EXECUTIVE EDITORIAL BOARD (EEB) AND REVIEWERS TASK PANEL (RTP) (Continued)
Dr. Adnan Bahour Dr. Rena Ellzy
Zagazig University, Egypt Tennessee State University, USA
Dr. Avis Smith Dr. Burnette Hamil
New York City College of Technology, USA Mississippi State University, USA
Dr. Jianjun Yin Dr. Cheaseth Seng
Jackson State Univerrsity, USA RMIT University, Australia
Dr. Kathleen Quinn Dr. Kimberly Johnson
Louisiana State University, USA Auburn University Montgomery, USA
Dr. Josephine Ebomoyi Dr. Mumbi Kariuki
Northwestern Memorial Hospital, USA Nipissing University, Canada
Dr. Robert Robertson Dr. Sameer Vaidya
Southern Utah University, USA Texas Wesleyan University, USA
Dr. Gina Pipoli de Azambuja Dr. Pamela Guimond
Universidad de Pacifico, Peru Governors State University, USA
Dr. Debra Shiflett Dr. Denise de la Rosa
American Intercontinental University, USA Grand Valley State University, USA
Dr. Douglas Main Dr. Sushil Misra
Eastern New Mexico University, USA Concordia University, USA
Dr. Sonya Webb Dr. Angela Williams
Montgomery Public Schools, USA Alabama A&M University, USA
Dr. R. Ivan Blanco Dr. Yvonne Ellis
Texas State University – San Marcos, USA Columbus State University, USA
Dr. Randall Allen Dr. Sonal Chawla
Southern Utah University, USA Panjab University, India
Dr. Claudine Jaenichen Dr. Carolyn Spillers Jewell
Chapman University, USA Fayetteville State University, USA
Dr. Richard Dane Holt Dr. Joselina Cheng
Eastern New Mexico University, USA University of Central Oklahoma, USA
Dr. Barbara-Leigh Tonelli Dr. Kingsley Harbor
Coastline Community College, USA Jacksonville State University, USA
Dr. Tahir Husain Dr. Barbara Mescher
Memorial University of Newfoundland, Canada University of Sydney, Australia
Dr. Mohsen Naser-Tavakolian Dr. Alejandro Flores Castro
San Francisco State University, USA Universidad de Pacifico, Peru
Dr. Natalie Housel Dr. Khalid Alrawi
Tennessee State University, USA Al-Ain University of Science and Technology, United Arab Emirates
Intellectbase International Consortium and the Conference Program Committee express their sincere thanks to the following sponsors:
The Ellzy Foundation
Tennessee State University (TSU)
The King Foundation
International Institute of Academic Research (IIAR)


PREFACE
Intellectbase International Consortium (IIC) is a professional and academic organization dedicated to advancing and encouraging quantitative and qualitative, including hybrid and triangulation, research practices. This volume contains articles presented at the Spring 2009 Intellectbase International Consortium Conference in Dallas, TX, USA, March 19-21.
The conference provided an open forum for Academics, Scientists, Researchers, Engineers and Practitioners from a wide range of research disciplines. It is the second volume produced in a unique, peer-reviewed multi-disciplinary format and intellectual foundation (See back cover of the proceedings).
The theme of the proceeding is related to pedagogy, research methodologies, organizational practice, ethics, accounting,
management, leadership, policy and political issues, health-care systems, engineering, social psychology, eBusiness,
marketing, technology and information science. Intellectbase International Consortium promotes broader intellectual resources and exchange of ideas among global research professionals through a collaborative process.
Intellectbase International Consortium is responsible for publishing innovative and refereed research work on the following hard and soft systems related themes – Business, Engineering, Science, Technology, Management, Administration, Political and Social (BESTMAPS). The scope of the proceeding (IHART) includes: literature reviews and critiques, data collection and analysis, data evaluation and merging, research design and development, hypothesis-based creativity and reliable data interpretation.
To accomplish research assignment and knowledge sharing, Intellectbase will continue to publish a range of refereed academic journals, book chapters and conference proceedings, as well as sponsoring several annual academic conferences globally.
Senior, Middle and Junior level scholars are invited to participate and contribute one or several article(s) to the Intellectbase International conferences. Intellectbase welcomes and encourages the active participation of all researchers seeking to broaden their horizons and share experiences on new research challenges, research findings and state-of-the-art solutions.
SCOPE & MISSION
Promote the collaboration of a diverse group of intellectuals and professionals worldwide.
Bring together researchers, practitioners, academicians, and scientists across research disciplines globally - Australia, Europe, Africa, North America, South America and Asia.
Support governmental, organizational and professional research that will enhance the overall knowledge, innovation and creativity.
Build and stimulate intellectual interrelationships among individuals and enterprises who have an interest in the research discipline.
Present resources and incentives to existing and new-coming scholars who are or planning to become effective researchers or experts in a global research setting.
Promote and publish professional and scholarly journals, handbook, book chapters and other forms of refereed publications in diversified research disciplines.
Plan, organize, promote, and present educational prospects - conferences, workshops, colloquiums, conventions — for global researchers.

i
LIST OF AUTHORS
Last Name First Name Institution State Country
Alkadi Ihssan University of Louisiana at Lafayette LA USA
Alrawi Khalid Al-Ain University of Science and Technology United Arab Emirates
Anyachebelu Faith Nnamdi Azikiwe University Nigeria
Anyamene Ada Nnamdi Azikiwe University Nigeria
Ariff Mohamed Bond University QLD Australia
Arsiraphongphisit Oraluck Monash University VIC Australia
Boyarsky Laura Marywood University PA USA
Brown William A. Jackson State University MS USA
Campbell Michael Florida A&M University FL USA
Carnes William J. Metropolitan State College of Denver CO USA
Cheng Joselina University of Central Oklahoma OK USA
Cooner Donna Colorado State University CO USA
Crawford Constance J. Ramapo College of New Jersey NJ USA
Ebomoyi William Chicago State University IL USA
Ebomoyi Josephine Saint Xavier University and Northwestern Memorial Hospital IL USA
Ezeugbor C.O. Nnamdi Azikiwe University Nigeria
Fleming Kenton Southern Polytechnic State University GA USA
Gordon Jean Capella University MN USA
Griffin Thomas Nova Southeastern University FL USA
Holm James N. University of Houston-Victoria TX USA
Holt Richard Dane Veterans' Administration NM USA
Holt Rhonda New Mexico Christian Children's Home NM USA
Huang Yu-Wen Spalding University NY USA
Ilic Zoran University of Belgrade Serbia
Jain Ravi University of Massachusetts Lowell MA USA
Johnson Kimberly Auburn University Montgomery AL USA
Jung Sung-Chang Chonnam National University Korea
Kagochi John M. University of Houston-Victoria TX USA
Le Katie University of Louisiana at Lafayette LA USA
Lee Yong-Gyo University of Houston-Victoria TX USA
Lewis Janelle University of Houston - Victoria TX USA
Lipinski Charles Marywood University PA USA
Mace Lesley M. Auburn University Montgomery Al USA
Mansour George DeVry College of NY NY USA
Miller Peter Indiana Wesleyan University IN USA
Mintu-Wimsatt Alma Texas A & M University – Commerce TX USA

ii
LIST OF AUTHORS (CONTINUED)
Last Name First Name Institution State Country
Mitchell Ted University of Nevada NV USA
Mulig Liz University of Houston-Victoria TX USA
Myers Chris Texas A & M University – Commerce TX USA
Nwabueze Uche University of Houston - Victoria TX USA
Nwogbo V.N. Nnamdi Azikiwe University Nigeria
O'Connell Jr. Robert R. JSA Healthcare Corporation FL USA
Okorji P.N. Nnamdi Azikiwe University Nigeria
Olson Patrick C. National University CA USA
Papadopoulou Smaragda University of Ioannina Greece
Payne Carolyn S. Nova Southeastern University FL USA
Paz Veronica Nova Southeastern University FL USA
Perkins Terence Veterans' Administration NM USA
Phillips Jennifer Marywood University PA USA
Prasad Dev University of Massachusetts Lowell MA USA
Puri Yash R. University of Massachusetts Lowell MA USA
Pursley Sasha Black Hills State University SD USA
Radovanovic Dobrivoje University of Belgrade Serbia
Radulovic Danka University of Belgrade Serbia
Raynes Edilberto A. Tennessee State University TN USA
Root William C. Augusta State University GA USA
Schaeffer Donna M. Marymount University VA USA
Stellenwerf Anita Ramapo College of New Jersey NJ USA
Stevenson Cerissa Colorado State University CO USA
Stringer Donna University of Houston-Victoria TX USA
Strouhal Jiri University of Economics Prague Czech Republic
Summers David F. University of Houston-Victoria TX USA
Summers Cynthia University of Houston-Victoria TX USA
Thomas Mike Humboldt State University CA USA
Thornton Jr. John H. Kent State University OH USA
Timku Ladep University of Jos Nigeria
Tonelli Barbara-Leigh Coastline Community College CA USA
Wang Jifu University of Houston-Victoria TX USA
Whatley Rehana Oakwood University AL USA
Williams Michael Touro College NY USA
Yin Jianjun Jackson State University MS USA
Yu Peng University of Houston-Victoria TX USA

iii
LIST OF INSTITUTIONS, STATES AND COUNTRIES
Institution State Country
Al-Ain University of Science and Technology United Arab Emirates
Auburn University Montgomery Al USA
Augusta State University GA USA
Black Hills State University SD USA
Bond University QLD Australia
Capella University MN USA
Chicago State University IL USA
Chonnam National University Korea
Coastline Community College CA USA
Colorado State University CO USA
DeVry College of NY NY USA
Florida A&M University FL USA
Humboldt State University CA USA
Indiana Wesleyan University IN USA
Jackson State University MS USA
JSA Healthcare Corporation FL USA
Kent State University OH USA
Madonna University MI USA
Marymount University VA USA
Marywood University PA USA
Metropolitan State College of Denver CO USA
Monash University VIC Australia
National University CA USA
New Mexico Christian Children's Home NM USA
Nnamdi Azikiwe University Nigeria
Nova Southeastern University FL USA
Oakwood University AL USA
Ramapo College of New Jersey NJ USA
Saint Xavier University and Northwestern Memorial Hospital IL USA

iv
LIST OF INSTITUTIONS, STATES AND COUNTRIES (CONTINUED)
Institution State Country
Southern Polytechnic State University GA USA
Spalding University NY USA
Tennessee State University TN USA
Texas A & M University – Commerce TX USA
Touro College NY USA
University of Belgrade Serbia
University of Central Oklahoma OK USA
University of Economics Prague Czech Republic
University of Houston-Victoria TX USA
University of Ioannina Greece
University of Jos Nigeria
University of Louisiana at Lafayette LA USA
University of Massachusetts Lowell MA USA
University of Nevada NV USA
Veterans' Administration NM USA

TABLE OF CONTENT
LIST OF AUTHORS .............................................................................................................................................. I
LIST OF INSTITUTIONS, STATES AND COUNTRIES ...................................................................................... III
SECTION 1: BUSINESS & MANAGEMENT ........................................................................................................ 1
The Need for a New Accounting Variance Model to Evaluate Sales Performance
Mike Thomas and Ted Mitchell .................................................................................................................................... 2
Selecting Effective Types of Entrepreneurial Support Programs in Rural Communities
David F. Summers, Cynthia Summers and James N. Holm ...................................................................................... 12
How the Agency and Shareholder Theory Affect the Financial Statements?
Veronica Paz and Thomas Griffin .............................................................................................................................. 20
Stock Reissues: The Mirror Image of Repurchases?
Sung-Chang Jung, Yong-Gyo Lee and John H. Thornton Jr. .................................................................................... 26
Are Investors able to Effectively use the Vast Amounts of Information Available on Publicly Traded Companies? A Decision Theory Approach to Investor Information Analysis
Carolyn S. Payne ....................................................................................................................................................... 37
Share Price Reaction to Debt Issuance and Capital Structure in Australia
Oraluck Arsiraphongphisit, Mohamed Ariff and Dev Prasad ...................................................................................... 46
Crisis and Actions: How a Firm Surviving Challenges
Jifu Wang, Donna Stringer and Peng Yu ................................................................................................................... 59
Using Computer Analysis Software and Online Journaling to Collect and Integrate Mixed Methods Data: An Example Exploring the Journey Towards the Principalship
Cerissa Stevenson and Donna Cooner ...................................................................................................................... 66
Accounting for ―Night Clubs‖: Is it Really about True-and-Fair (or Rather Probable) View? Case of Czech Republic
Jiri Strouhal ................................................................................................................................................................ 72
Consumers‘ Intent to Purchase Niche Apparel Online: A Conceptual Model Alma Mintu-Wimsatt and Chris Myers ........................................................................................................................ 80
The Contingency Theory of Leadership: A Practical Perspective
William J. Carnes ....................................................................................................................................................... 83
An Examination of the Liquidity of Firms Around a Financial Crisis
Dev Prasad, Yash R. Puri and Ravi Jain.................................................................................................................... 90
Towards Strategic Management of Standards Activities in the International Business
Khalid Alrawi ............................................................................................................................................................ 100
Corporate Governance in America: New Rules of Engagement Uche Nwabueze and Janelle Lewis ......................................................................................................................... 114
Hybrid Networks and In-House Expertise
Donna M. Schaeffer and Patrick C. Olson ............................................................................................................... 125

The Effects of Corporate Social Responsibility (CSR) on Corporate Reputation via Stakeholder Responses and Company Practice Reviews
Yu-Wen Huang and George Mansour ...................................................................................................................... 126
The Acceptance of Peer Appraisals in a Virtual Work Team Setting: An Examination of Social Contextual Factors
Kimberly Johnson ..................................................................................................................................................... 127
Wasn‘t Me! How Identity Theft Affects the Accounting Profession
Liz Mulig ................................................................................................................................................................... 128
SECTION 2: SCIENCE & TECHNOLOGY ...................................................................................................... 129
Socio-Stigmatization of HIV/AIDS Status and the Cognitive Level of College-Age Students about HIV Transmission in Nigeria and United States
William Ebomoyi and Josephine I. Ebomoyi ............................................................................................................ 130
Tuberculosis in the United States: A Literature Review on Multi- and Extensively Drug-Resistant Robert R. O‘Connell, Jr. and Edilberto A. Raynes ................................................................................................... 136
Cognitive Abilities of Psychopath Killers Compared to the Abilities of Normal Non-Criminal Population
Danka Radulovic, Dobrivoje Radovanovic and Zoran Ilic ........................................................................................ 146
Gender Disparities in Prenatal Screening of Pregnant Mothers for Life Threatening Genetic Diseases
William Ebomoyi and Josephine I. Ebomoyi ............................................................................................................ 151
Computer Aided Engineering: An Undergraduate Course in Computer Aided Design and Analysis for Mechanical Engineering Technology Southern Polytechnic State University
Kenton Fleming ........................................................................................................................................................ 158
Virtual Private Network
Katie T. Le and Ihssan Alkadi .................................................................................................................................. 164
SECTION 3: EDUCATION & SOCIAL SCIENCES ......................................................................................... 180
the Academic Performance of College Students in Higher Education
Michael M. Campbell ................................................................................................................................................ 181
E-Teaching Business Archiecture with Innovative Technology in the MIS Virtual Classroom of the Twenty-First Century
Joselina Cheng ........................................................................................................................................................ 190
The Vanishing Middle School William C. Root ........................................................................................................................................................ 200
Impediments to Child‘s Right to Education in Nigeria: Implications for Child Development F. E. Anyachebelu, Ada Anyamene and Ladep Timku ............................................................................................ 204
Oral Language Acquisition with Children Having Language Difficulties in Learning Greek as a Second Language: The Uses of Creative Teaching Strategies in Multicultural Settings
Smaragda Papadopoulou ........................................................................................................................................ 210
Migration and Demand for New Housing in Alabama MSAs
John M. Kagochi and Lesley M. Mace ..................................................................................................................... 218
Kinship Care as a Valid Permanency Option Independent of Adoption or Legal Guardianship: A Review of the Literature and Proposal for Future Study
Richard Dane Holt, Terence Perkins and Rhonda Holt ............................................................................................ 227

Leadership Styles and Funding: An Analysis of California Juvenile Delinquency Prevention Programs Receiving Federal Grants
Barbara-Leigh Tonelli, Jean Gordon and Michael Williams ..................................................................................... 232
Teacher Preparation for Universal Basic Education Program in Nigeria Using Information and Communication Technology: Opportunities and Challenges
P.N. Okorji, V.N. Nwogbo and C.O. Ezeugbor ......................................................................................................... 237
The Motherland Calls: The 46th Taman Guards Aviation Unit in the Second World War Sasha Pursley .......................................................................................................................................................... 244
Feasibility Study of Offering Online Hybrid Courses to Graduate Students
Charles Lipinski, Laura Boyarsky and Jennifer Phillips ............................................................................................ 253
Faith Integration in the Discipline of Music
Peter Miller ............................................................................................................................................................... 273
Beyond Borders: A Yogic Approach to Language Learning and Teaching
Rehana K. Whatley .................................................................................................................................................. 276
Unfair At Any Cost: A Survey of the Student Population Make-up in Jackson Public Schools (MS) Jianjun Yin and William A. Brown ............................................................................................................................ 278
Is There a Correlation Between Cheating in Undergraduate Institutions and the Mess on Wall Street? Student Perceptions of Cheating in Today‘s Competitive Environment …..
Constance J. Crawford and Anita Stellenwerf .......................................................................................................... 279

A Commitment to Academic Excellence.
www.intellectbase.org
INTELLECTBASE INTERNATIONAL CONSORTIUM Intellectual Perspectives & Multi-Disciplinary Foundations
B E S T M A P S
MULTI-DISCIPLINARY
FOUNDATIONS &
PERSPECTIVES
EDUCATION
BUSINESS
SOCIAL
POLITICAL
ADMINISTRATION
MANAGEMENT
TECHNOLOGY
SCIENCE


SECTION 1
BUSINESS & MANAGEMENT
1


Mike Thomas and Ted Mitchell
2
THE NEED FOR A NEW ACCOUNTING VARIANCE MODEL TO EVALUATE SALES PERFORMANCE
Mike Thomas and Ted Mitchell Humboldt State University and University of Nevada
ABSTRACT
When providing performance evaluation information, accounting information systems often rely upon variance analysis.
Variances represent the differences between budgeted and actual performance. Our traditional model is based upon
arguments and assumptions made over fifty years ago when creating cost variance formulas for manufacturing environments.
Cost variance analysis decomposes a total variance into price and usage components. This two-variance model is a
simplification of a theoretic three-variance model, which also includes a joint variance. As variance analysis moves into new
fields, such as marketing, and new applications, such as non-financial performance measures, both models can produce
biased performance evaluation information. This paper demonstrates the errors that can result with both models. Historically,
both theoreticians and practitioners argued the errors were not relevant to manufacturing performance evaluation
applications. Thus, the two-variance model was accepted, and has become the only model taught in management and cost
accounting, as well as marketing, classes. This paper argues that the assumptions justifying the two traditional models do not
hold in marketing applications, and thus, a new variance model is needed to avoid the calculation errors resulting from our
traditional model. This new model, based upon the geometry of variance analysis, correctly calculates both the primary and
residual (joint) variances in all four economic scenarios. The model is illustrated in a traditional production cost example, and
in a common sales performance evaluation application.
Keywords: Management Accounting Systems, Cost Variances, Marketing Variances, Marketing Performance Evaluation
BACKGROUND AND LITERATURE REVIEW
Analyzing cost variances from budget is a primary performance evaluation model used in performance evaluation. The model, when applied to non-manufacturing evaluations, has been recently criticized, though, for being adapted to production cost control. While the adaptation was appropriate based upon assigned responsibilities in production environments, managerial marketing responsibilities require different variance calculations (Bentz and Lusch, 1980; Lehman, 2002). Marketing research now argues we need to re-visit the underlying geometry of variance analysis in search for a new variance model fitting their performance evaluation needs (Weber, 1996; Hulbert and Toy, 1977; Mitchell and Olsen, 2003). Figure 1 illustrates the geometry of variance analysis:
Figure 1: Areas of Primary Variance
To understand the primary variances, it is useful to imagine a rectangular tablet A, with the length of one side representing actual price and the length of the other side representing actual quantity. Tablet A‘s area represents the total actual cost, and includes Areas 1 and 3 in Figure 1. A second tablet, B, represents the total budgeted cost (Areas 1 and 2).
Price
0 QuantityQb = 4
Area 2 =
Primary Quantity Variance
Pb(Qa – Qb) = ($1)
Tablet A =
Actual total cost
Tablet B =
Budgeted total
costP Q
Qa = 3
Pa = $2
Pb = $1Area 1 =
PbQa = $3
Area 3 = Primary price variance
Qa(Pa – Pb) = $3

The Need for a New Accounting Variance Model to Evaluate Sales Performance
3
The two tablets overlap (Area 1). Area 2 is the primary quantity variance, and Area 3 is the primary price variance. In Figure 1, there is no residual or joint variance. The difference between the actual cost and the budgeted cost is equal to the sum of the two primary variances. Consider a different situation in Figure 2:
Figure 2: The Geometry of a Joint Variance
In Figure 2, actual cost is greater than budgeted cost. Area 1 represents the budgeted cost, Cb = PbQb. The sum of areas 1, 2, 3 and 4 represent the actual cost, Ca = PaQa. The difference between the two total costs, Ca – Cb, is the sum of areas 2, 3, and 4. In this case, Tablet B (budgeted cost) rests upon Tablet A (actual cost). Area 2 again represents the primary quantity variance; the change in cost caused by the change in quantity, while holding price constant at Pb = $1. Area 3 again represents the primary price variance; the change in cost caused by a change in the purchase price, when holding quantity constant at Qb = 3. In Figures 1 and 2, Area 2 is the same primary quantity variance with the same magnitude, and Area 3 is the same price variance with the same magnitude. The only difference between Figure 1 and 2 is the joint variance. Figure 1has no joint variance. In Figure 2, Area 4 represents the joint variance, and reflects the impact on cost of simultaneous changes in both price and quantity.
The Four Economic Cases
Figures 1 and 2 represent two of four possible economic scenarios: Case 1: Pa > Pb and Qa > Qb (Figure 2) Case 2: Pa > Pb and Qa < Qb (Figure 1) Case 3: Pa < Pb and Qa > Qb Case 4: Pa < Pb and Qa < Qb
Translating Geometry into Algebra
To apply variance analysis to manufacturing performance evaluation, Amerman (1953) created a three-variable algebraic model that includes the two primary variances and the joint variance:
1. Pb (Qa – Qb) = a primary quantity or volume variance (Area 2 in Figure 2), 2. Qb (Pa – Pb) = a primary price variance (Area 3 in Figure 2), and 3. (Qa – Qb)(Pa – Pb) = joint or residual variance (Area 4 in Figure 2).
(Subscripts: a = actual, b = budgeted)
About fifty years ago, accounting researchers debated the algebraic solutions (Amerman, 1953; Banerjee, 1953; Vance, 1950; Watson, 1960; Weber, 1963). While each researcher identified a flaw in the algebra, unique to a particular economic scenario, and proposed a solution, none investigated all four economic scenarios simultaneously. While Vance (1950) was the first to demonstrate how variance analysis produced different types of errors under different cases, Amerman (1953) and Banerjee (1953) were the first to formally classify the four possible economic scenarios. However, all of these early authors failed to notice the equations do not separate the joint variance from the primary variances in all four situations. Amerman (1953) applied the three-variance model to Case 1, but not to the other three cases. Banerjee (1953) criticized Amerman for the omission, but failed to note the inflated variances in his own three-variance solution. Watson (1960) also failed to note the problem of inflated variances in the three-variance model because he provided different numerical examples for each of the four cases. Thus, no general algebraic model resulted that can be universally applied. Instead, these researchers developed assumptions allowing their models to work in the limited scenario each identified. The two primary assumptions are: (1) small
Price
0 Quantity
Tablet A =
Actual total cost
= Areas 1 + 2 +
3 + 4
Pa = $2
Pb = $1
Qb = 3
Area 1 = Tablet B
Budgeted total cost
PbQb = $3
Area 3 = Primary price variance
Qb(Pa – Pb) = $3
Area 4 = Joint Variance
(Pa– Pb)(Qa– Qb) = $1
Area 2 =
Primary Quantity Variance
Pb(Qa – Qb) = $1
Qa = 4

Mike Thomas and Ted Mitchell
4
errors due to the allocation of small residual variances should be of little concern, and (2) the conventional two-variance solution provides the correct solution in most practical (manufacturing) cases (Amerman 1953).
Reasons for the General Acceptance of the Two-Variance Model
Amerman also derived a simplified two-variance model. Combining the primary price variance with the joint variance: Ca – Cb = Pb ∆Q + Qa ∆P. With the two-variance model, the price variance becomes $4 (compare to Figure 2‘s three-variance solution). Apparently, two related causes led to the general acceptance of the traditional two-variance model taught in our current Management and Cost Accounting texts. One was the first industrial revolution and the Scientific Management strategy developed to organize work in the new capital-intensive factories. Another was the emphasis on external financial reporting in this country. A fundamental leadership axiom of Scientific Management is the ―separation-of-duties‖ principle. Each department is organized as a separate ―functional silo‖ with a goal to minimize its production costs. Because each department operates independently from other departments, measuring efficiency through departmental cost variance reports dominated cost accounting after the first industrial revolution. Through the interaction with a related cause (i.e., this country‘s emphasis on external financial reporting), the algebraic approach became entrenched. To assure financial statements were accurate, auditors required report articulation through a transaction-based financial accounting system following generally accepted accounting principles. This resulted in the need for the product‘s ―cost‖ to be objectively verified through a transaction-based journal entry recording system. Because financial statements report costs by resource (materials, labor, and overhead, versus for example, reporting costs by activities), algebraic equations were needed to calculate and journalize resource cost variances. Through journalized cost-attaching, financial accountants could provide a fully absorbed product cost within a simple-to-install and operate system that also was simple to understand (Johnson and Kaplan, 1987). Most importantly, though, such a system satisfied external reporting requirements. Using the standard cost systems developed with Scientific Management, the need for a simple two-variance solution and journalized cost variances was reinforced, and the algebra of the flexible-budget became the accepted model. The three-variance model‘s joint variance also was difficult to calculate in the paper-and-pencil environments of the early and mid-twentieth century. Nor was it readily interpretable and assignable to a single department or manager, and it defied systematic journal entries. Thus, practical arguments were used to reject the three-variance model in favor of the workable two-variance approach in the flexible-budget model. Probably the most pervasive practical argument for the two-variance approach came from Amerman (1953), who stated that if standards are current and variances small, joint variances should be of little concern. Thus, arbitrarily attaching the joint variance to the primary price variance will not significantly distort the reported results. Other scholars have sought to design a compromise procedure maintaining the simplicity of the conventional two-variance model, but with a ―valid‖ method of allocating the joint variance. Weber (1963) presented a summary of the various allocation methods, but all the alternatives had some disadvantage. The most damning is the argument that all allocations are arbitrary, and without a normative basis for allocating the joint variance, no two-variance model can be theoretically justified. Its only justification is in practice. It is simple, and the joint variance has no obvious interpretation for production management.
Errors When Using the Two- and Three-Variance Models
Whether the joint variance is allocated or not, and whether the two-variance or three-variance model is used, in three of the four possible economic scenarios, both models yield erroneous results, as summarized in Table 1.
Table 1: Algebraic Variance Models‘ Errors
Pa > Pb Pa < Pb
Qa > Qb
Case 1
Case 3
3-variance model: 2-variance model:
None Price variance
3-variance model: 2-variance model:
Quantity & Joint Price & Quantity
Qa < Qb
Case 2
Case 4
3-variance model: 2-variance model:
Price & Joint None
3-variance model: 2-variance model:
Price, Quantity, & Joint Quantity

The Need for a New Accounting Variance Model to Evaluate Sales Performance
5
The three-variance model inflates at least one of the primary variances in three of the four cases. Also, it always generates a joint variance, and in Cases 2 and 3, this is wrong because no joint variance exists (area 4). For example, the three-variance solution in Case 1 provides the correct measurements for the primary variances. However, the price variance is inflated in Case 2, the quantity variance is inflated in Case 3, and both of the primary variances are inflated in Case 4. An inspection of the geometry demonstrates the source of the inflated variances is the inclusion of the joint variance. The two-variance model also inflates a primary variance in three of the four possible cases. Kloock and Schiller (1997) note this model arbitrarily allocates the joint variance to the price variance without any theoretical justification (although it was pragmatically justified in practice). Banerjee (1953, p. 352) noted the inflation problem in the two-variance model when he wrote, ―In all these (three) cases the method gives wrong results.‖ The calculations supporting Table 1 will be illustrated in the next section (Figures 3 – 6).
A NEW MODEL FOR VARIANCE ANALYSIS
If variance analysis is to be widely adopted outside the world of production control and cost accounting, a new model for calculating unbiased variances is needed. In marketing management, the standards and forecasts used in budgets are not as tight as they are in production. Inaccurate standards imply large variances, and large variances imply large joint variances, and large joint variances imply large potential errors due to inflated variances. The central problem is the lack of correspondence between the geometry and algebra of each case. The general solution is to have a different equation for each of the four cases. The use of four different equations to generate accurate measures of the primary variances is too awkward for practical use, however. Fortunately, all four have important properties in common, allowing for the creation of a single equation. The most important of these properties is all use the minimum potential value as the level to hold a variable constant when making independent changes in the other variable. The second property is all the independent changes in a variable are calculated in the conventional direction of budgeted value subtracted from actual value. The third property is all four equations can be defined as having a residual variance as long as the residual variance is always equal to zero in cases 2 and 3.
The “Minimum Potential Performance Budget” Solution
The decomposition equation correctly dealing with all four cases is a three-variance solution modeled on the common properties of the four distinct equations:
Ca – Cb = Px (Qa – Qb) + Qx (Pa – Pb) + r where:
C = total cost, Q = total quantity of material purchased, P = cost per unit of material purchased, Px (Qa – Qb) = the primary quantity or volume variance, Qx (Pa – Pb) = the primary price variance, r = Ca – Cb – Px (Qa – Qb) – Qx (Pa – Pb) = joint or residual variance unexplained by the independent changes Subscripts: a = actual, b = budgeted, x = minimum of a, b.
This equation correctly calculates the primary variances. In Cases 2 and 3, the definition of the primary variances ensures the residual variance will equal zero. In cases 1 and 4, the residual variance equals the joint variance, and the algebra is consistent with the geometry of each economic scenario. This can be seen by comparing the traditional variance models with the MPPB model in Figures 3 – 6:

Mike Thomas and Ted Mitchell
6
Figure 3: Case 1: Pa > Pb and Qa > Qb
The Geometric Solution: Price
0 Quantity
Tablet A =
Actual total cost
= Areas 1 + 2 +
3 + 4
Pa = $2
Pb = $1
Qb = 3
Area 1 = Tablet B
Budgeted total cost
PbQb = $3
Area 3 = Primary price variance
Qb(Pa – Pb) = $3
Area 4 = Joint Variance
(Pa– Pb)(Qa– Qb) = $1
Area 2 =
Primary Quantity Variance
Pb(Qa – Qb) = $1
Qa = 4
The Three-variance Solution:
Price Variance: Qb(Pa – Pb) = 3($2 $1) = $3 Quantity Variance: Pb(Qa – Qb) = $1(4 3) = $1 Residual Variance: (Qa – Qb)(Pa – Pb) = (4 3)($2 $1) = $1
The Two-variance Solution:
Price Variance: Qa(Pa – Pb) =4($2 $1) = $4* Quantity Variance: Pb(Qa – Qb) = $1(4 3) = $1
The Minimum Potential Performance Budget Solution:
Price Variance: Qmin(Pa – Pb) = 3($2 $1) = $3 Quantity Variance: Pmin(Qa – Qb) = $1(4 3) = $1 Residual Variance: (Ca – Cb) – [Qmin(Pa Pb)] – [Pmin(Qa Qb)] = $1
(Note: * and red amounts represent incorrect calculations)
Figure 4: Case 2: Pa > Pb and Qb > Qa
The Geometric Solution: Price
0 Quantity
Pa = $2
Pb = $1
Qa = 3
Area 1 =
PbQa = $3
Area 3 = Primary price variance
Qa(Pa – Pb) = $3
Qb = 4
Area 2 =
Primary Quantity Variance
Pb(Qa – Qb) = ($1)
Tablet A =
Actual total cost
Tablet B =
Budgeted total
cost
The Three-variance Solution:
Price Variance: Qb(Pa – Pb) = 4($2 – $1) = $4* Quantity Variance: Pb(Qa – Qb) = $1(3 – 4) = ($1) Residual Variance:
(Qa – Qb)(Pa – Pb) = (3 – 4)($2 – $1) = ($1)*
The Two-variance Solution:
Price Variance: Qa(Pa – Pb) = 3($2 – $1) = $3 Quantity Variance: Pb(Qa – Qb) = $1(3 – 4) = ($1)
The Minimum Potential Performance Budget Solution:
Price Variance: Qmin(Pa – Pb) = 3($2 $1) = $3 Quantity Variance: Pmin(Qa – Qb) = $1(3 4) = ($1) Residual Variance: (Ca – Cb) – [Qmin(Pa Pb)] – [Pmin(Qa Qb)] = $0
(Note: * and red amounts represent incorrect calculations)

The Need for a New Accounting Variance Model to Evaluate Sales Performance
7
Figure 5: Case 3: Pb > Pa and Qa > Qb
The Geometric Solution:
Price
0 QuantityQa = 4
Area 2 =
Primary Quantity Variance
Pa(Qa – Qb) = $1
Tablet A =
Actual total cost
Tablet B =
Budgeted total
cost
Pb = $2
Pa = $1
Qb = 3
Area 1 =
PaQb = $3
Area 3 = Primary price variance
Qb(Pa – Pb) = ($3)
The Three-variance Solution:
Price Variance: Qb(Pa – Pb) = 3($1 $2) = ($3) Quantity Variance: Pb(Qa – Qb) = $2(4 3) = $2* Residual Variance: (Qa – Qb)(Pa – Pb) = (4 3)($1 $2) = ($1)*
The Two-variance Solution:
Price Variance: Qa(Pa – Pb) =4($1 $2) = ($4)* Quantity Variance: Pb(Qa – Qb) = $2(4 3) = $2*
The Minimum Potential Performance Budget Solution:
Price Variance: Qmin(Pa – Pb) = 3($1 $2) = ($3) Quantity Variance: Pmin(Qa – Qb) = $1(4 3) = $1 Residual Variance: (Ca – Cb) – [Qmin(Pa Pb)] – [Pmin(Qa Qb)] = $0
(Note: * and red amounts represent incorrect calculations)
Figure 6: Case 4: Pb > Pa and Qb > Qa
The Geometric Solution: Price
0 Quantity
Tablet B =
Budgeted total
cost = Areas 1 +
2 + 3 + 4
Pb = $2
Pa = $1
Qa = 3
Area 1 = Tablet A
Actual total cost
PaQa = $3
Area 3 = Primary price variance
Qa(Pa – Pb) = ($3)
Area 4 = Joint Variance
(Pa– Pb)(Qb– Qa) = ($1)
Area 2 =
Primary Quantity Variance
Pa(Qa – Qb) = ($1)
Qb = 4
The Three-variance Solution:
Price Variance: Qb(Pa – Pb) = 4($1 $2) = ($4)* Quantity Variance: Pb(Qa – Qb) = $2(3 4) = ($2)* Residual Variance: (Qa – Qb)(Pa – Pb) = (3 4)($1 $2) = $1*
The Two-variance Solution:
Price Variance: Qa(Pa – Pb) =3($1 $2) = ($3) Quantity Variance: Pb(Qa – Qb) = $2(3 4) = ($2)*
The Minimum Potential Performance Budget Solution:
Price Variance: Qmin(Pa – Pb) = 3($1 $2) = ($3) Quantity Variance: Pmin (Qa – Qb) = $1(3 4) = ($1) Residual Variance: (Ca – Cb) – [Qmin(Pa Pb)] – [Pmin(Qa Qb)] = ($1)
(Note: * and red amounts represent incorrect calculations)

Mike Thomas and Ted Mitchell
8
EVALUATING SALES PERFORMANCE USING THE MPPB MODEL
One of the most important decisions salespeople make on a day-to-day basis involves the abandonment of prospects and the initiation of new contacts. Salespeople have limited amounts of time and must choose to continue the selling process with a current prospective customer, or drop the attempt and start a new lead with a new prospect. This is a very difficult task and many salespeople keep records of the number of prospects visited in a period and analyze their rate of sales-per-prospect contacted for clues about improvement. There are many variations of this problem. For example, sales per day, calls per prospect, conversion rates, and batting averages are different measures used to explore sales effectiveness. For the purpose of this paper we will concentrate on the rate of sales per prospect or potential account, and the number of accounts or prospects visited. The classic approach to the evaluation of salespeople involves the comparison of the individual‘s performance against a standard or quota. If the person‘s performance is deemed to be significantly above or below standard, an investigation into the causes of the specific deviation is initiated. The focus of the conventional comparison is the deviations in the actual inputs and activities (e.g., the difference in the number of days worked, number of prospects visited, sales per call, orders per lead, etc). To illustrate, Table 2 presents sales performances for four salespeople:
Table 2: The Performance of Four Salespeople
Juan Jill Soleil Yoshiko Quota
Sales, S
Difference from Quota
$468,750
+$168,750
$281,250
–$18,750
$281,250
–$18,750
$168,750
–$131,250
$300,000
Prospects Visited, N
Difference from Quota
75
+15 (20%)
75
+15 (20%)
45
–15 (–20%)
45
–15 (–20%)
60
Sales per Prospect R
Difference from Quota
$6,250
+$1,250
$3,750
–$1,250
$6,250
+$1,250
$3,750
–$1,250
60
This typical variance report provides measures of the deviations from quota. The overall measure of output is the sales revenue produced by each salesperson. The input measures are the total number of different prospects visited (N), and the rate of sales earned per prospect (R). Marketing management believes the number of prospects visited is a measure of effort or efficiency, and the average sales per prospect is a measure of effectiveness at converting leads into revenues (Spiro, et al., 2003). In evaluating performance, the marketing manager notes Juan and Jill have both worked harder than Soleil and Yoshiko by calling on more prospects. She also notes Juan and Soleil have worked more effectively than Jill and Yoshiko by producing more revenue per prospect. However, the manager finds nothing in the conventional performance evaluation report to help her establish which of the deviations from quota is having the largest impact on sales revenue. The report does not show how much revenue can be attributed to Juan‘s increase in sales effort, or how much revenue was lost because Yoshiko did not reach quota on the number of prospects visited.
Applying the MPPB Model to Marketing Variance Analysis
Using the MPPB model, the difference between actual revenue and quota, Sa–Sb, is decomposed into the sum of the two impacts due to input deviations:
Sa – Sb = Nm(Ra – Rb) +Rm(Na – Nb) + r
where:
S = total sales revenue R = rate of sales per prospect N = total number of prospects visited (leads processed) Nm (Ra – Rb) = the impact on sales due to deviation in sales per prospect Rm(Na – Nb) = the impact on sales due to deviation in visited-prospects r = residual impact not explained by the two individual deviations: r = Sa – Sb – Nm(Ra – Rb) – Rm(Na – Nb) Subscripts: a = actual, b = quota or budgeted, m = minimum of a, b

The Need for a New Accounting Variance Model to Evaluate Sales Performance
9
The results are illustrated in Table 3:
Table 3: An Analysis of the Impact Caused by Deviations from Quota
Juan Jill Soleil Yoshiko
Difference between actual and planned level of sales to be explained: Sa – Sb
$168,750 –$18,750 –$18,750 –$131,250
Efficiency impact (i.e., due to deviation from planned rate of prospects visited):
Rm(Na –Nb)
+15 visits
20%
$75,000
+ 15 visits
20%
$56,250
– 15 visits
–20%
–$75,000
– 15 visits
–20%
–$56,250
Effectiveness impact (i.e., due to deviation from the planned sales per prospect:
Nm(Ra–Rb)
+$1,250
25%
$75,000
–$1,250 –25%
–$75,000
+$1,250 25%
$56,250
–$1,250
–25%
–$56,250
Residual impact due to joint changes: r $18,750 $0 $0 –$18,750
The absence of any information on the dollar impact on revenue due to deviations in sales activities may lead some to conclude, erroneously, equal percentage changes for inputs imply equal impacts for outputs. For example, Juan‘s 20% positive variance in prospects visited increases his overall sales revenue by $75,000. But Jill‘s 20% improvement has a smaller ($56,250) impact on sales. Both Jill and Juan have the same size deviations in conventional report, but their deviations have different impacts on overall performance. Jill and Juan also missed their sales quota per prospect by the same amount, and may be misjudged to have performed equally. If their manager has the MPPB model results presented in Table 3, she can see the dollar impacts on overall performance due to the deviations in individual activities. The impact due to Jill‘s drop in sales per prospect is having a more serious impact on overall performance than Yoshiko‘s drop in sales per prospect. Both have a 25% deviation, but Jill‘s drop is having a $75,000 impact on revenues, compared to Yoshiko‘s impact of $56,250. Even if the traditional three-variance model is used, due to errors in how the variances are calculated, this information is not readily available for marketing management‘s use in performance evaluation, as seen in Table 4.
Table 4: Comparing Variance Models
Na > Nb Na < Nb
Ra > Rb
Case 1: Juan Case 3: Soleil
Variances Calls (N):
Sales (R):
Joint:
3-Variance Model $5,000(75 – 60) =
$75,000
60 × ($6,250 – $5,000)
= $75,000
($6,250 – $5,000) × (75 – 60) =
$18,750
MPPB Model $5,000(75 – 60) =
$75,000
60 × ($6,250 – $5,000)
= $75,000
$468,750 – $300,000 –
$75,000 – $75,000 = $18,750
Variances Calls (N):
Sales (R):
Joint:
3-Variance Model $5,000(45 – 60) =
($75 ,000)
60 × ($6,250 – $5,000)
= $75,000
($6,250 – $5,000) × (45 – 60) =
($18,750)
MPPB Model $5,000(45 – 60) =
($75,000)
45 × ($6,250 – $5,000) =
$56,250
$281,250 – $300,000 –
($75,000) – $56,250 = $0
Ra < Rb
Case 2: Jill Case 4: Yoshiko
Variances Calls (N):
Sales (R):
Joint:
3-Variance Model $5,000(75 – 60) =
$75,000
60 × ($3,750 - $5,000)
= ($75,000)
($3,750 – $5,000) × (75 – 60) =
($18,750)
MPPB Model $3,750(75 – 60) =
$56,250
60 × ($3,750 – $5,000)
= ($75,000)
$281,250 – $300,000 –
$56,250 – $75,000 = $0
Variances Calls (N):
Sales (R):
Joint:
3-Variance Model $5,000(45 – 60) =
($75,000)
60 × ($3,750 – $5,000)
= ($75,000)
($3,750 – $5,000) × (45 – 60) =
$18,750
MPPB Model $3,750(45 – 60) =
($56,250)
45 × ($3,750 – $5,000) =
($56,250)
$168,750 – $300,000 – ($56,250) – ($56,250) = ($18,750)

Mike Thomas and Ted Mitchell
10
Most performance evaluations take far more inputs into account than simply sales per prospect and number of leads serviced. The classic four-factor planning model found in most marketing texts involves days worked (D), calls per day (W), orders per call (B), and sales per order (Z) (Spiro, et al., 2003). Another advantage of the MPPB model is it can be easily expanded to account for more than two-variable situations. Using the MPPB model, the difference between actual and budgeted sales performance is written as:
Sa–Sb = ZmBmWm(Da–Db) + ZmBmDm(Wa–Wb) + ZmWmDm(Ba–Bb) + BmWmDm(Za–Zb) + r where:
Sa–Sb = difference between actual and planned sales performance ZmBmWm(Da–Db) = impact due to deviation from planned level of working days ZmBmDm(Wa–Wb) = impact due to deviation from planned rate of calls per day ZmWmDm(Ba–Bb) = impact due to deviation from planned level of orders per call BmWmDm(Za–Zb) = impact due to deviation from planned order size r = residual impact not explained by the impact of individual deviations
CONCLUSION
In marketing applications, the relative sizes of the primary variances are the primary symptoms of potential control problems (Mitchell and Olsen, 2003). The larger the primary variance, the greater the potential control problem. The need for unbiased measures of the primary variances is the justification for the MPPB model. The goal is to calculate the primary variances in a way that ensures the exclusion of the joint variances. The size of the errors by allocating the joint variance to one of the primary variances may be of little consequence when the standards are accurate and the variances are small, such as in production settings controlled by standard costing systems. But, when variance analysis is applied to non-production environments, the assumptions of good forecasts and small variances may not be valid, and a more accurate model, as proposed here, should be used. Accountants identified the miscalculations resulting from the three and two-variance models many years ago, but dismissed the potential inaccuracies due to residual variances as offering ―no reason for undue concern‖ (Amerman, 1953, p. 266). In more recent years, these models have received criticism for inappropriately affixing blame for deviations to departments and activities (Bentz and Lusch, 1980; Kloock and Schiller 1997). This paper proposes an alternative model based on the geometry of the four possible economic situations when comparing budgeted and actual results. This paper presents the inaccuracies in our current variance models. Both the two and three-variance models produce incorrect variances in three of the four possible economic situations that can result from comparing budgeted and actual performance. The correct analysis for each situation is geometrically demonstrated, and the MPPB equations derived from it. Current cost accounting pedagogy and practice is to ignore the joint variance, resulting in its inclusion in the price variance. Theoretic problems identified a half century ago are now resurfacing as real practical problems in performance evaluations. When applied outside of cost accounting environments (e.g., in marketing applications), the need to calculate unbiased measures of the primary variances, and isolating the joint variance, are even more important. It is hoped the proposed MPPB model in this paper can be easily adapted to situations in which unbiased measures are needed, such as in marketing performance evaluations.
REFERENCES
Amerman, G. (1953), The Mathematics of Variance Analysis, The Accounting Review (July), pp. 258-269. Banerjee, K. (1953), The Mathematics of Variance Analysis and the Possibilities of its Application, The Accounting Review
(October), pp. 351-363. Bentz, W. and R. Lusch (1980), Now You Can Control Your Product‘s Market Performance, Management Accounting
(January), pp. 17-25. Hulbert, J. and N. Toy (1977), A Strategic Framework for Marketing Control, Journal of Marketing (April), pp. 12-20. Johnson, H. T. and R. Kaplan (1987), Relevance Lost: The Rise and Fall of Management Accounting, Boston: Harvard
Business School Press. Kloock, J. and U. Schiller (1997), Marginal Costing: Cost Budgeting and Cost Variance Analysis, Management Accounting
Research (vol. 8), pp. 299-323.

The Need for a New Accounting Variance Model to Evaluate Sales Performance
11
Lehman, D. (2002), What‘s On Marketers‘ Minds?, Marketing Management (November/December), pp. 17-20. Mitchell, T. and H. Olsen ( 2003), Marketing Control: Exogenous Aspects of Price Variance, Journal of Business & Economics
Research (December), pp. 145-159. Spiro, R., W. Stanton and G. Rich (2003), Management of a Sales Force (11th edition, Boston: McGraw-Hill Irwin). Vance, L. (1950), The Fundamental Logic of Primary Variance Analysis, NACA Bulletin (January), pp. 620-632. Watson, R. (1960), Two-Variate Analysis, The Accounting Review (Vol. 35, no. 1), pp. 96-99. Weber, C. (1963), The Mathematics of Variance Analysis, The Accounting Review (July), pp. 534-539. Weber, M. (1996), A Framework for Analyzing Sources of Variance in the Supplier-Buyer Relationship: Determining the
Contribution of Buyer Planning and Supplier Performance to Total Variance, Journal of Marketing Theory & Practice (Spring), pp. 61-71.

David F. Summers, Cynthia Summers and James N. Holm
12
SELECTING EFFECTIVE TYPES OF ENTREPRENEURIAL SUPPORT PROGRAMS IN RURAL COMMUNITIES
David F. Summers, Cynthia Summers and James N. Holm University of Houston-Victoria
ABSTRACT
Entrepreneurship has become a critical component of economic growth in rural communities. In response, many community
leaders are willing, even eager to provide entrepreneurship support programs to help local entrepreneurs start and grow
businesses. However, selection of appropriate types of entrepreneurial support programs has often been poorly done and,
consequently, resulted in a waste of scarce community resources. The types of support programs selected have been done
almost on an ―idea of the month‖ basis with the latest fad idea being implemented. This type of selection process is often
ineffective and inefficient because the types of entrepreneurial support programs selected do not meet the needs of the
various types of entrepreneurs in the community. Communities must realize that not all entrepreneurs are the same and their
support program needs are determined by the stage of the entrepreneurial lifecycle in which the entrepreneur is operating.
This paper presents a four-step process for classifying and mapping existing entrepreneurs based on entrepreneurial
lifecycle, mapping existing community support assets, matching existing assets to needs of the various classifications of
community entrepreneurs, and finally selecting programs that filling the gaps between existing and needed assets. The
process is designed to make the selection of the types of community entrepreneurship support programs more effective and
efficient.
INTRODUCTION
Entrepreneurship is recognized as a critical component of economic development (e.g., Formaini, 2001; Holcombe, 2003; Wennekers & Thurik, 1999). While some recent research calls into question many of the widely-held beliefs that may overstate the economic impact of small firms (e.g. Shane, 2008), the critical role entrepreneurship plays in rural community economies is well documented (e.g., Dabson, 2007; Drabenscott, Novack, & Abraham, 2003; Drabenscott, 2006). In many small communities, entrepreneurial activity plays a much larger role in the economy than may be reflected in national statistics (Markley, 2007). Often, however, small rural communities are lacking significant numbers of the longer-established growing employer firms that fuel much of the national growth that is attributed to entrepreneurship. In fact, Autio (2005) analyzed data for the Global Entrepreneurship Monitor program that indicated High Expectancy Firms (HEF) defined as startup firms expecting to have 20 or more employees in 5 years make up less than 10 percent of all startups. Therefore, the odds of having significant numbers of these firms in small rural communities are not good. Consequently, all entrepreneurial activity in rural communities is important. Realizing the significance of entrepreneurial activity for economic growth especially in uncertain economic times, more and more rural community leaders, economic developers, and policy makers are interested in encouraging entrepreneurial activity in the community. This is especially true since attracting outside firms is becoming more difficult (Dabson, 2007). In response, many rural communities are looking for ways to encourage and support local entrepreneurs (Markley, Macke, & Luther, 2005; Walzer, Athiyaman, & Hamm, 2007; Hart, 2003). The problem arises when selecting specific entrepreneurial support systems to establish in the community. Too often it is an ―idea of the month‖ approach. A community leader, economic developer, or policymaker attends a conference, presentation, etc. and learns about the latest idea or entrepreneurship support program that is transforming xyz community. Immediately it becomes the idea or program that will solve his or her community‘s problems. Further complicating the issue is the uncertainty about whether governmental interventions can even positively impact entrepreneurial activity (Capelleras, Kevin, Greene, & story, 2008). In addition, all communities are different, and what will work in one community or region may or may not work in another (Minniti, 2008; Wagner & Sternberg, 2004). For example, Littleton, Colorado (pop. 40,646 - United States Census 2007 estimate) has developed an excellent program called Economic Gardening (Littleton Colorado, 2008) that helps growing businesses market themselves better. Littleton has a number of growing firms and is a suburb of Denver. It makes perfect sense to provide services that will help the local businesses market themselves more effectively to the large number of potential customers in the area. On the other hand, Sonora, Texas has a population of only 3,060 (United States Census 2007 estimate) and is over a 150 miles from the nearest

Selecting Effective Types of Entrepreneurial Support Programs in Rural Communities
13
large market, San Antonio. Economic Gardening may not be the best program for Sonora. What is needed is a systematic method for communities to use to sift through the myriad of good ideas and programs and find the appropriate ones. The purpose of this paper is to present a process to help rural communities select the appropriate types of entrepreneurial support systems. Most rural communities have limited resources to conduct extensive research or hire outside professionals to facilitate the selection process. Therefore, the paper presents a simple process that all communities can use to better select the appropriate types of entrepreneurial support systems.
DEVELOPING THE PROCESS
It is important to remember that the focus of this paper is not on establishing economic development strategy for rural communities, but on a process for selecting types of entrepreneurial support activities if entrepreneurship is deemed a part of the economic development strategy. Entrepreneurship is normally just part of a more comprehensive economic development strategy. For example, one of the most successful rural economic development strategy frameworks is Home Town Competitiveness (HTC) developed as a joint effort of the Heartland Center for Leadership Development, the Nebraska Community Foundation, and the RUPRI Center for Rural Entrepreneurship (HTC, 2008; Macke, 2007). The HTC framework focuses on four primary pillars of rural economic development – entrepreneurship, community philanthropy, youth engagement, and leadership development. For communities who use this framework (or a similar type of strategy framework) and choose to develop the community‘s entrepreneurship capacity, the paper describes how to select the appropriate types of entrepreneurial support activities. Another limitation on the scope of the paper is that it is not focused on specific entrepreneurial support programs. Numerous, successful, specific support activities are used in rural communities. For example, the Association for Enterprise Opportunity (2005) found 517 documented rural microenterprise programs operating in the United States in 2002. Large numbers of successful programs exist in many areas of enterprise development. Several case studies of successful development programs can be found in Clues to Rural Community Survival (Luther & Wall, 2008). The scope of the paper, however, is limited to the general evaluation process to determine the types of entrepreneurial support programs rather than the merits of any specific program. After employing the process described in the paper, community decision makers will be in a better position to select which specific programs fit their community. The entrepreneurial support system selection process is grounded on two assumptions. First, effective entrepreneurial support needs vary based on the stage of the entrepreneurial lifecycle that firms in the community are in (Lichtenstein & Lyons, 2001). Second, the most successful support systems build on existing community support assets (Kretzmann & McKnight, 1993; Loveridge, 2007). Consequently, the process involves four steps – 1) determining the type and quantity of entrepreneurs in the community, 2) inventorying the existing community support assets, 3) matching entrepreneurial support needs with existing assets, and 4) selecting support programs that build on existing assets or fill community asset shortages. Figure 1 provides a visual description of the process.
Figure 1: Selecting the Appropriate Type of Entrepreneurial Support System
Identifying The Quantity And Type Of Community Entrepreneurs
As indicated above, entrepreneurial support needs are determined by the stage in the entrepreneurial lifecycle that firms are in (Lichtenstein & Lyons, 2001). Figure 2 presents the entrepreneurial lifecycle and follows commonly accepted stages of growth (e.g., Bygrave 2004; Hisrich, Peters, & Shepherd, 2008). Phase 1 involves the conception of the business idea; Phase
Match entrepreneurial needs with existing support assets
Select support programs to fill the gap
between needs and existing assets
Determine the types of entrepreneurs in the community
Asset map existing community support assets

David F. Summers, Cynthia Summers and James N. Holm
14
2 is evaluation of the idea; in Phase 3, resources are gathered to start the business; and in Phase 4, the business grows. Business growth takes a variety of paths and can range from failure to the high-growth gazelle that makes headlines. In his recent book, The Illusions of Entrepreneurship, Scott Shane (2008, pp.64-68) compiled the results of several research sources into a concise and clear picture of firm growth.
Figure 2: The Business Development Lifecycle
Dr. Shane concluded that most new businesses are very ordinary, are not innovative, are tiny, do not intend to grow, lack a competitive advantage, and are home-based. In fact, Dabson (2007) posits that only 1 in 10 to 1 in 20 startup firms will have a significant economic impact. Figure 1 also highlights that some high-growth firms as well as larger lifestyle firms may expand or relocate at some point. Expanding and relocating firms have been the traditional target of most economic development efforts, but many rural communities do not currently have this type of firm or have the ability to attract them (Markley, Macke, & Luther, 2005) Therefore, for many rural communities, all entrepreneurial activity has a positive economic impact and should be encouraged. Finally, Figure 1 supports the notion that entrepreneurial firms need strong and business-supportive communities (Hustedde, 2007; Markley, Macke, & Luther, 2005). To facilitate the study of entrepreneurship, researchers have developed classifications for the various types of entrepreneurs. A Kellogg Foundation/CFED report on rural entrepreneurship used a five category classification system based on the entrepreneur‘s point in the lifecycle – aspiring, survival, lifestyle, growth, and serial (Dabson, Brian, Malkin, Mathews, Pate, & Stickle 2003). Aspiring entrepreneurs are those who are interested in starting a business and are the primary entrepreneur in Phase 1 of the lifecycle (see Figure 2). Survival entrepreneurs are already in business and are driven to supplement inadequate incomes or the lack of other employment opportunities and are a subsection of Phase 4. Lifestyle entrepreneurs start firms to support a certain lifestyle or live in a specific community and are found in Phase 4. Growth entrepreneurs are motivated to grasp opportunity and grow a business and represent another portion of Phase 4. In fact, many support activities are targeted at growth entrepreneurs. Serial entrepreneurs are individuals who start and sell multiple businesses over a period of years and could be found in all four phases of the lifecycle (Dabson, et al. 2003, pp. 23-24). A final type of entrepreneur identified in a Global Entrepreneurship Monitor 2005 Executive Report is a nascent entrepreneur (Minitti,
Idea
Assessing the Idea &
Preparing the Business Plan
Gathering the Resources
Open the Door
Results
Results
Time
Gazelle
High Potential
Lifestyle
Failure
Entrepreneur
Point of Conception
1
2
3 4
Points where the firm expands and/or
relocates
The Entire Process Rests on a Stable Foundation of Strong Business-Supportive Communities
Description of phases of the process and type of entrepreneur: Phase 1: Conception of the business idea - Aspiring Phase 2: Evaluation and development of the idea Phase 3: Gathering the resources Phase 4: Growth of the business - Survival, Lifestyle, Growth, Serial
Nascent

Selecting Effective Types of Entrepreneurial Support Programs in Rural Communities
15
Bygrave, & Autio, 2006). Nascent entrepreneurs are individuals who have committed resources to start a business and populate Phases 2 and 3. Figure 2 indicates the type of entrepreneurship at each phase of firm growth (see: Description of phases of the process and type of entrepreneur). Therefore, the first step for community leaders to take in selecting appropriate types of entrepreneurship support systems is to determine the type and quantity of entrepreneurs in the community. Community leaders must to start to identify individual entrepreneurs and classify them (Kretzmann & McKnight, 1993). A proven technique to identify entrepreneur types as well as community assets is asset mapping. The technique requires community-wide involvement and is based on taking advantage of the social networks in the community. In other words, community members identify other community members who are entrepreneurs. A good description of the asset mapping process can be found in Canadian Rural Partnership Asset Mapping:
A Handbook (Fuller, Guy, & Pletsch, 2007). Focus groups, individual interviews with all identified community leaders, interviews with existing entrepreneurs and business owners, and contacts with resource providers make up the foundation for asset mapping the entrepreneurs. The RUPRI Center for Rural Entrepreneurship (2008) has an extensive library of free downloadable assessment tools and instructions for conducting asset mapping of entrepreneurial activity. RPRI has also published a book titled Energizing Entrepreneurs (Markley, Macke, & Luther, 2005) that contains a complete set of entrepreneurial asset mapping tools. The results of entrepreneurial asset mapping allow community leaders to know how many of each type of entrepreneur are in their community. This information is vital before appropriate types of support activities can be determined. Additionally community leaders must know how entrepreneurs progress through the lifecycle in the community. Examples of the type of questions that must be answered include, ―Are there clusters of one or more types of entrepreneurs in the community, Do aspiring and nascent entrepreneurs eventually start businesses in the community, Are growth firms maximizing their potential, or do serial entrepreneurs continually start firms in the community?‖
Inventorying The Existing Community Support Assets
After mapping the existing entrepreneurs, community leaders need to inventory the community‘s existing support assets. An asset map of existing entrepreneurial support resources should be developed. Asset-based (another term for asset mapping) support initiatives have proven to be more effective than needs-based support programs (Hustedde, 2007; Kretzmann & McKnight, 1993; Mathie & Cunningham, 2003). The most important assets are the ones that are readily available and locally controlled (Hustedde, 2007). To facilitate asset mapping, several categorization schemes have been developed to help identify support assets. Energizing Entrepreneurs (Markley, Macke, & Luther, 2005) provides a three category scheme – business services, entrepreneurship programs, and capital programs. Business services could include accounting, legal, human resources, financing, production consulting, marketing and development, business transfer planning, or any other support service. Names and contact information for providers of the services would be developed. For example, the local Small Business Development Center (SBDC) may be on the provider list. Entrepreneurship programs could include mentor/peer networks, market development, technical assistance, business planning, management training, or other specialized programs. Capital programs would include micro-lending, revolving loan, commercial lenders, local business angels, venture capital, linkages to state and federal programs, plus any other source of capital in the community. A more comprehensive system is presented by Loveridge (2007, pp. 261-270). Leveridge proposes three categories – community and networks, finance and regulations, and training and mentoring systems. Each category is followed by an extensive set of questions that will guide the asset mapping process. Finally, a very extensive system was developed by the Aspen Institute (2007) that provides a workbook for mapping all types of community assets in addition to those that are entrepreneurship related. The end result of asset mapping is a complete listing of all entrepreneurial supportive assets in the community. Some of the existing assets will be available immediately, but some may need refinement or improvement. In addition, not all support assets will be necessary at the present time, but may be needed as businesses cluster or move through the lifecycle. For example, local angel financing may exist, but there may be a shortage of growth entrepreneurs with projects in need of angel funds. There, however, may be a future time when some firms become mature enough to need angels. Consequently, the next step is to match the type of entrepreneurial firms in the community with the available support assets.
Matching Entrepreneurial Support Needs With Existing Support Assets
The third step in the process of selecting effective entrepreneurial support systems is to match entrepreneurial support needs with existing assets. It is important to note that it is not the responsibility of community assets to develop entrepreneurs, but
David F. Summers, Cynthia Summers and James N. Holm
16
only to support entrepreneurs as they develop themselves (Lyons, Lichtenstein, & Kutzhanova, 2007). The development support needed for the different categories of entrepreneurs will obviously vary. For example, the financial needs of nascent entrepreneurs for startup and seed capital will be quite different than the needs of growth entrepreneurs for substantial expansion funds. The entrepreneurial makeup of every community will be different and, therefore, the types of entrepreneurial support required will be different. To match existing asset-based types of community support with community entrepreneurs, it may be wise to follow the methodology of economic development professionals when conducting business retention and expansion analysis. Successful, business retention and expansion initiatives systematically survey a significant sample of businesses to identify needs (Dickson, 2005; Morse & Inhyuck, 1997). The same technique can be used to match entrepreneurial needs with existing support assets. Often, focus groups, surveys, and individual interviews are used to simply ask the entrepreneurs identified as a result of mapping what support would be helpful (Blakely & Bradshaw, 2002). If the support assets exist, simply leverage the assets by linking community entrepreneurs with the existing support provider. If not, then the community may consider filling the gap.
Select Appropriate Support Programs
Once the first three steps of the process have been completed, the community can properly select effective types of support programs. Generally, programs should target the needs of the various types of entrepreneurs in the community, improve or leverage existing support assets, and/or fill the gaps where needed support assets do not exist or where outside control of the asset makes it questionable. For example, Littleton, Colorado appears to have a fairly substantial cluster of growth entrepreneurs. Therefore, Economic Gardening (Littleton, Colorado, 2008) which focuses on providing market research to community businesses is an appropriate support program. On the other hand, Sonora, Texas appears to have a cluster of lifestyle entrepreneurs who provide oilfield services to major oil companies. Programs to ensure a constant supply of qualified employees may be most helpful for Sonora. Both Littleton and Sonora could have clusters of other types of entrepreneurs in the community. Programs to support these and additional types of entrepreneur clusters would be appropriate. In addition to selecting programs that support existing entrepreneurs, programs based on existing support assets are most effective (Hustedde 2007). Whether it is something like Economic Gardening or building a qualified workforce, leveraging existing assets is best. Using existing marketing expertise in Littleton‘s case or working with local branches of state workforce agencies and/or area community colleges in Sonora‘s case provide the most effective support. Often the local support asset exists, but is not developed enough to be helpful. For example, there may be a community that is fortunate enough to have a cluster of growth firms in need of angel financing. Wealthy individuals live in the community who are interested in being angels, but they do not have the expertise. In essence, the community has an existing support asset that needs improvement. Interestingly the Kauffman Foundation (2008) provides a training program for those interested in being angels on the details of how to get started. Similar types of programs to upgrade existing assets would be appropriate support initiatives.
Gaps may exist between the support assets that exist and what are needed. For example, a community may have a cluster of nascent entrepreneurs in search of seed or startup financing. Local capital sources are not available for this type of investment. This situation may call for the creation of community micro-loan programs or revolving loan programs (Seidman, 2005). Filling gaps would be an appropriate community entrepreneurial support activity.
CONCLUSIONS AND IMPLICATIONS
Why Is A Process Important?
Many entrepreneurial support programs are misdirected and a waste of time, effort, and resources (Shane, 2008). In a time of economic uncertainty and scarce community resources, ineffective programs are unacceptable. Dr. Shane argues that the reason why many support programs are misdirected is that the economic impact of entrepreneurial firms is overstated. This paper agrees that many programs are misdirected and a waste of time, effort, and resources, but for a different reason. In many small rural communities, entrepreneurial activity does have a significant economic impact (e.g. Dabson, 2007; Drabenscott, Novack, & Abraham, 2003; Drabenscott, 2006; Markley, Macke, & Luther, 2005). The reason why many support programs are ineffective in rural communities, however, is that they do not support the community‘s entrepreneurial talent, are not founded on existing community entrepreneurial support assets, and/or do not address gaps between existing assets and needed assets.

Selecting Effective Types of Entrepreneurial Support Programs in Rural Communities
17
The four-step process presented in the paper may appear overly simplistic on the surface, but considering how many communities almost whimsically waste resources implementing the ―idea of the month,‖ a simple and effective evaluation process is needed. The steps are relatively easy to implement, and take few resources other than time and effort. Considering that rural community resources are often scarce for economic development projects, a low resource requirement is a positive.
In addition, the paper has a two-target audience – entrepreneurship scholars who focus attention on the individual firm and often overlook the broader context of firm development, and the community leader who must wisely invest community resources in programs that produce value for the community. All entrepreneurship scholars realize that firms do not grow in a vacuum and community support is critical, but many may not realize just how willing and even eager community leaders are to provide entrepreneurial support. Community leaders, on the other hand, are often at a loss as to what kind of support to provide. This paper provides a starting point for scholars and community leaders to begin discussions concerning what support is really most effective.
Implications And Limitations
The paper presents a simple concise process for communities to make better decisions concerning providing effective types of entrepreneurial support programs. Effective support programs address the needs of the different types of entrepreneurs in the community using existing support assets as the base starting point. Then by leveraging current assets, upgrading deficient existing assets, or providing new support assets to fill gaps, communities can make effective decisions concerning appropriate support programs to provide which, in turn, promotes the wise use of community resources. The focus of the paper is narrow, however. Providing entrepreneurial support is normally just part of a more comprehensive community development strategic plan that includes consideration of items such as current economic conditions, community infrastructure, quality of life, education, medical care, housing, environmental concerns, natural amenities, culture, and land use. Just providing entrepreneurial support programs is not enough. The paper takes the position that supporting all types of entrepreneurial activity in the community is positive. Some recent research may call that premise into question. Loveridge and Nizalov (2007) conducted a limited one-state study to determine the optimum distribution of firm size within a community. The results provided what may be called a ―rule of thumb‖ that if less than 20 percent of employment is found in firms with one to four employees, the community may benefit from increased support for startup stage entrepreneurs. More studies of this nature may help community leaders make even better decisions about what type of programs to provide. Finally, the paper does not address the design and implementation of specific support programs. The community has two basic choices – create a program from scratch or benchmark and ―modify to fit‖ programs from other communities. Creating programs from scratch will work, but benchmarking successful programs has been very popular and effective. There are almost countless agencies, organizations, foundations, conferences, and forums for sharing and learning about best practices. The Economic Development Administration, International Economic Development Council, Association of Small Business Development Centers, Global Consortium of Entrepreneurship Centers, Coleman Foundation, Kellogg Foundation, Kauffman Foundation, state economic development agencies, and the RUPRI Center for Rural Entrepreneurship are just a few examples of the many sources. The method the community deems appropriate is secondary to just getting started.
REFERENCES
Aspen Institute. (2007). Measuring community capacity building: A workbook-in-progress for rural communities (Version 3-96). Retrieved July 10, 2008 from Aspen Institute Web site: http://www.aspeninstitute.org/atf/cf/%7BDEB6F227-659B-4EC8-8F84-8DF23CA704F5%7D/Measuring%20Community%20Capactiy%20Building.pdf
Association for Enterprise Opportunity, (2005) Microenterprise fact sheet: Microenterprise development in the United States: An overview, Retrieved August 1, 2008. http://www.microenterpriseworks.org/microenterpriseworks/files/ccLibraryFiles/Filename/000000000276/fact%20sheet%20series%201.pdf
Autio, E. (2005). GEM high-expectation entrepreneurship 2005 summary report. London: Mazars, London Business School and Babson College. Retrieved August 10, 2008 http://www.gemconsortium.org/download/1219373690920/18436%20GEM%20summary.pdf
Blakely, J. E. & Bradshaw, T. K. (2002). Planning local economic development (3rd. ed.). Sage, Thousand Oaks, CA: Sage Bygrave, W. D. (2004). The entrepreneurial Process. In W. D. Bygrave, & A. Zacharakis, (eds.) The portable MBA in
entrepreneurship (3rd. ed) (pp. 1-27), Hoboken, NJ: John Wiley and Sons

David F. Summers, Cynthia Summers and James N. Holm
18
Capelleras, J., Kevin, M., Greene, F., & Storey, D. (2008). Do more heavily regulated economies have poorer performing new ventures? Evidence from Britain and Spain, Journal of International Business Studies. 39(4), 688-702.
Dabson, B. (2007). Entrepreneurship as rural economic development policy: A changing paradigm. In N. Walzer (ed.), Entrepreneurship and local economic development. (pp. 21-37) New York, NY: Lexington Books.
Dabson, B., Malkin, J., Mathews, A. Pate, K. & Stickle, S. (2003). Mapping rural entrepreneurship. Battle Creek, MI: W. K. Kellogg Foundation and Washington, DC, CFED.
Dickson, K. (2005). Pounding the pavement. Economic Development Journal. 4(4), 27-32. Drabenscott, M. (2006). Rethinking federal policy for regional economic development. Federal Reserve Bank of Kansas City,
Economic Review. First Quarter, 115-142. Drabenscott, M., Novack, N., & Abraham, B. (2003). Main streets of tomorrow: Growing and financing rural entrepreneurs – A
conference summary. Federal Reserve Bank of Kansas City. Economic Review. Third Quarter, 73-84. Formaini, R. L. (2001). The engine of capitalists process: Entrepreneurs in economic theory. Economic and Financial Review.
(4th quarter) Fuller, T., Guy, D., & Pletsch, C. (2007). Canadian rural partnership asset mapping: A handbook. AAFC Publication No.
2148/E, Government of Canada. Hart, D. (2003). Entrepreneurship policy: What it is and where it came from. In D. Hart (ed.), The emergence of
entrepreneurship policy: governance, Statt-ups, and growth in the U.S. knowledge economy. (pp. 3-19). Cambridge, UK: Cambridge University Press.
Hisrich, R. D., Peters, M. P., & Shepherd, D. A. (2008). Entrepreneurship (7th ed.). New York, NY: McGraw-Hill Irwin. Home Town Competitiveness (HTC). (2008). Home town competitiveness: A come-back/give-back approach to rural
community building. Retrieved July 24, 2008 from HTC Web site: http://www.htccommunity.org/ Holcome, R. G. (2003). Progress and entrepreneurship. The Quarterly Journal of Austrian Economics. 6(3), 3-26. Hustedde, R. (2007). What‘s culture got to do with it? Strategies for strengthening an entrepreneurial culture. In N. Walzer
(ed.), Entrepreneurship and local economic development. (pp. 39-58). New York, NY: Lexington Books. Kauffman Foundation. (2008). The power of angel investing. A program of the Ewing Marion Kauffman Foundation. Presented
at the John Cook School of Business St. Louis University, St. Louis, MO. Kretzmann, J., & McKnight, J. (1993). Building communities form the inside out: A path toward finding and mobilizing a
community‘s assets. Evanston, IL: Institute for Policy Research, Northwestern University. Lichtenstein, G. A., & Lyons. T. S. (2001). The entrepreneurial development system: Transforming business talent and
community economics. Economic Development Quarterly, 15(1), 3-20. Littleton Colorado, (2008). Economic Gardening. Retrieved July 24, 2008 from Littleton Colorado Web site:
http://www.littletongov.org/bia/economicgardening/ Loveridge, S, (2007). Getting starting in community-based entrepreneurship. In N. Walzer (ed.), Entrepreneurship and local
economic development. (pp. 255-273). New York, NY: Lexington Books. Loveridge, S., & Nizalov, D. (2007). Operationalizing the entrepreneurial pipeline theory: An empirical assessment of the
optimal size distribution of local firms. Economic Development Quarterly, 21(3), 244-262. Luther, V., & Wall, M. (2008). Clues to rural community survival. Lincoln, NE: Heartland Center for Leadership Development. Lyons, T. S., Lichtenstein, G. A., & Kutzhanova, (2007). What makes a successful entrepreneur? In N. Walzer (ed.),
Entrepreneurship and local economic development. (pp. 103-124). New York, NY: Lexington Books. Macke, D. (2007), Energizing entrepreneurs: Lessons from the field. In N. Walzer (ed.), Entrepreneurship and local economic
development. (pp. 211-231). New York, NY: Lexington Books. Markley, D. M. (2007). Building communities through entrepreneurship development: Financing entrepreneurs and
entrepreneurial support systems. In N. Walzer (ed.), Entrepreneurship and local economic development. (pp. 125-145). New York, NY: Lexington Books.
Markley, D., Macke, D., & Luther, V. B. (2005). Energizing entrepreneurs: Charting a course for rural communities. Lincoln, NE: RUPRI Center for Rural Entrepreneurship and Published by the Heartland Center for Leadership Development.
Mathie, A, & Cunningham, G. (2003). From clients to citizens: Asset-based community development as a strategy for community-driven development. Development in Practice, 13(5), 474-486.
Minniti, M. (2008). The role of government policy on entrepreneurial activity: Productive, unproductive, or destructive? Entrepreneurship Theory and Practice. 32(5). 779-790.
Minitti, M., Bygrave, W. D., & Autio, E. (2006). Global Entrepreneurship Monitor 2005 executive report. London: Babson College and London Business School.
Morse, G. N., & Inhyuck, H. (1997). How successful are business retention and expansion implementation efforts? Economic
Development Review, Spring, 8-13. RUPRI Center for Rural Entrepreneurship. (2008) Energizing entrepreneurs: Tools for practitioners. Retrieved July 27, 2008
from RUPRI Web site: http://www.energizingentrepreneurs.org/content/cr.php?id=4&sel=4

Selecting Effective Types of Entrepreneurial Support Programs in Rural Communities
19
Seidman, K. F. (2005). Economic development finance. Thousand Oaks, CA: Sage Publicaions. Shane, S. (2008). The illusions of entrepreneurship. New Haven, CT: Yale University Press. United State Census. (2007). Population estimates for 2007. Retrieved July 28, 2008 from U. S. Census Web site:
http://factfinder.census.gov/home/saff/main.html?_lang=en Wagner, J. & Sternberg, R. (2004). Start-up activities, individual characteristics, and the regional milieu: Lessons for
entrepreneurship support policies from German micro data. The Annals of Regional Science, 38(2). 219-240. Walzer, N., Athiyaman, A., & Hamm, G. F. (2007). Entrepreneurship and small business growth. In N. Walzer (ed.),
Entrepreneurship and local economic development. (pp. 59-79) New York, NY: Lexington Books. Wennekers, S. & Thurik, R. (1999). Linking entrepreneurship and economic growth. Small Business Economics, 13(1), 27-56.

Veronica Paz and Thomas Griffin
20
HOW THE AGENCY AND SHAREHOLDER THEORY AFFECT THE FINANCIAL STATEMENTS?
Veronica Paz and Thomas Griffin Nova Southeastern University
ABSTRACT
The purpose of this paper is to note how the Agency and Shareholder theory affects the financial reporting process. The
financial reporting process is defined by the level of service that the financial statements provide to shareholders and
stakeholders. By examining the Shareholder theory, and noting what impact the shareholders have on the financial
statements, one can start to examine how shareholders, stakeholders and agents influence the financial reporting process in
an organization and the agency conflicts that exist.
Keywords: Agency Theory, Shareholder Theory, Financial Statement
AGENCY THEORY
Definitions
The separation between owners and managers create an agency relationship. The agency relationship exists when one or more persons (the principal or principals) hire another person or persons (the agent or agents) as decision-making specialist to perform a service (Chen, 2008). Defining the agency problem as one of ensuring that management does not expropriate or waste financial suppliers‘ capital. ‗‗The separation of ownership from control produces a condition where the interests of owner and of ultimate manager may, and often do, diverge‘‘ (McIntyre, Murphy, & Mitchell, 2007). Jensen and Meckling note agency problems exist when mangers own less than 100% of the firm. With the less than 100% ownership managers can and will shift part of the cost associated with decisions made in their own interests and not necessarily in the best interests of the organization (Jassim, Dexter, & Sidhu, 1988). Boards of directors (BOD) are teams whose effectiveness can be accessed through group dynamic constructs in the organizational behavior literature (McIntyre et al., 2007). The Board of directors is an important institution for mitigating the agency problem that arises with absentee ownership. The agency problem in this context is that the interests of management may differ from the interests of the shareholders for whom they work and that management may make business decisions in response to the former rather than the latter. The role of the Board is, in part, to deal with this potential conflict of interest, and thus reduce agency costs (McIntyre et al., 2007). According to agency theorists, effective boards independently monitor strategic challenges facing a firm and evaluate management's performance in addressing these trials (Carpenter & Westphal, 2001). Agency theory also suggests that directors are motivated to engage in competent monitoring activity by the reputational effects of poor decisions (Carpenter & Westphal, 2001). Although agency theorists emphasize the board's role as an independent control mechanism, they also serve to provide ongoing advice to top managers on possible strategic changes. In such cases, boards serve as a strategic consultant to top managers, rather than or in addition to exercising independent control (Carpenter & Westphal, 2001).
Theory Building of Agency Conflicts
Presence of agency conflicts when shareholders have delegated governance responsibilities to a self-interested Board of Directors (BOD) has a bearing on the financial statements and it‘s preparation (Cyert, Kang, & Kumar, 2002). Agency conflicts occur when managers are motivated by power and control rather than maximizing stockholder wealth (Jensen, 2005). Agency conflicts are inherent in the process and the BOD is one of many monitoring functionalities that could help diminish the detrimental efforts of no supervision.

How the Agency and Shareholder Theory Affect the Financial Statements?
21
Risk Conflicts
Corporate governance has adopted an agency theory approach, focusing on resolving conflicts of interest between managers and shareholders. Accounting tries to implement and adopt the process of supervision and checks and balances with the uses of internal controls intended to ensure that management acts in accordance with the shareholder‘s interest. This divergence is mitigated by the Board of Directors.
SHAREHOLDER THEORY
Should maximizing shareholder wealth continue to be the singular purpose of American corporations, or should they be designed to accommodate and be held accountable for meeting the goals of multiple stakeholders (Kochan & Rubinstein, 2000)? To properly analyze these question definitions must be established prior to the analysis of the theory.
Definitions
The first task in developing the positive features of a shareholder theory is to define who stakeholders are and how a stakeholder firm differs from a conventional shareholder-wealth-maximizing firm (Kochan & Rubinstein, 2000). Stakeholders are defined subsequently followed by shareholders being defined. The Shareholder value theory is postulated prior to noting the realm in which the financial statements are used in conjunction with shareholder value.
Stakeholders
Investing in stakeholder management may be complementary to shareholder value creation and may indeed provide a basis for competitive advantage as important resources and capabilities may be created that differentiate a firm from competitors (Hillman & Keim, 2001). "A stakeholder in an organization is any group or individual who can affect or is affected by the achievement of the organization's objectives" (Jawahar & McLaughlin, 2001). Accounting theory posits that the goal of economic organizations is to maximize stockholders‘ wealth (Jassim et al., 1988). Adopting a 'narrow' definition of stakeholders in that we consider primary stakeholders as those stakeholders who bear some form of risk as a result of having invested some form of value in the firm. These stakeholders are those without whose participation in the corporation cannot survive. Primary stakeholder groups typically are comprised of capital suppliers or shareholders and investors, employees, customers, suppliers, and other resource suppliers, community residents, and the natural environment together with what is defined as the public stakeholder group: the government and communities that provide infrastructures and markets, whose laws and regulations must be obeyed, and to whom taxes and other obligations may be due (Jawahar & McLaughlin, 2001). Employees establish themselves as influential, definitive stakeholders by using their knowledge to improve organizational performance (Kochan & Rubinstein, 2000). All of these groups are collectively referred to as stakeholders of the organization and as such present an inherent agency conflict as noted earlier.
Shareholders
The publicly held American corporation thus stands at one extreme by operating under a set of legal rules and a deeply embedded ideology and power structure that reinforces the view that the purpose of the corporation is to maximize
shareholder wealth (Kochan & Rubinstein, 2000). The key distinction is that a stakeholder firm has multiple objectives rather than a single superior ordinate goal. Whether, however, a stakeholder firm achieves joint maximization of the different objectives (i.e., whether it is more efficient than a pure shareholder model because it both raises shareholder returns and achieves other stakeholder objectives), matches the shareholder returns of conventional firms and achieves other stakeholder objectives, or redistributes a portion of shareholder returns among different stakeholders is ultimately an empirical question, depending on the firm's performance and on how its profits are distributed (Kochan & Rubinstein, 2000). Therefore, organizations seek to maximize shareholder wealth through the use of the primary stakeholders.
History of Shareholder Value
The theory of shareholders value has evolved through years. In the early years of the nation, corporations were expected to exist for the public good. Over the course of the 1800s considerable theorizing and experimentation ensued with alternative organizational forms that sought to internalize the interests and objectives of different groups, such as consumer, producer, or worker (Kochan & Rubinstein, 2000). Gradually, shareholders gained property rights enforced by contracts and limited liability

Veronica Paz and Thomas Griffin
22
doctrines and managers who were held accountable for using the firm's resources to maximize shareholders' interests. Over time, management thus began to be viewed as the shareholders' agents. Given the importance of capital, within the firm financial specialists rose to the pinnacle of power (Kochan & Rubinstein, 2000).
Shareholder Value Theory-In Depth
Wood and Jones (1995) argue that stakeholder theory holds the key to understanding the structures and dimensions of business and society relationships. Normative stakeholder theory is that firms should attend to the interests of all their stakeholders not just their stockholders (Jawahar & McLaughlin, 2001). Descriptive stakeholder theory of the firm posits that the nature of an organization's stakeholders, their values, their relative influence on decisions and the nature of the situation are all relevant information for predicting organizational behavior (Jawahar & McLaughlin, 2001). The particular stakeholder or stakeholders with potential to meet those needs will be perceived as critical to organizational well-being, and their concerns and issues will be addressed proactively, or at least accommodated (Jawahar & McLaughlin, 2001). Central thesis of their theory is that stakeholder will be positively related to the cumulative number of stakeholder attributes of power, legitimacy, and urgency (Jawahar & McLaughlin, 2001).
Accounting Standards
Accounting Standards aim to do two things. First they aspire to reduce the number of options available to a company when it is selecting how it will calculate accounting transactions. Second, they seek to increase the disclosure of important information about a firm and its accounting policies (McCallig, 2007). When examining the quality of financial reporting, we keep in mind four different aspects of how accounting policies are chosen and applied: 1. Disclosure 2. Comparability (with other potential investments) 3. Complexity and 4. Changes (McCallig, 2007). The complexity of financial statements has grown exponentially as more accounting standards have been introduced. This complexity is a substantial barrier to investors and analyst understanding of firm results. Firms can change their accounting policies. Some of these changes are forced onto firms by changes in accounting standard and some are voluntary (McCallig, 2007). The financial statements of an organization should be transparent. The quality of the decisions made by these stakeholders is dependent on both the quality of financial information available to them and their understanding of the limitations of financial statements (McCallig, 2007). As such, agents must chose the method of accounting to properly depict the financial state of the organization. They may in turn choose a more favorable method for their own interests as opposed to the more conservative method in accounting. In this realm is when the board of directors and other internal control mechanisms will need to be maintained to ensure proper recording of the financial transactions and to mitigate the agency conflicts. Eroded public trust and investor confidence in financial reports and audit services lead to Congress responding by passing the Sarbanes-Oxley Act (SOX) in July 2002. Several other corporate governance reforms, including the Securities and Exchange Commission‘s (SEC) rules to implement provision of SOX, listing standards of national stock exchanges (NYSE, NASDAQ), and best practices by investor activist and professional organizational, were developed with the intent to restore public trust and investor confidence in public financial information (Crumbley, 2007). SOX is a type of corporate governance to mitigate agency conflict that could finds its way to toward the financial reports. Sarbanes-Oxley Act of 2002, was widely regarded as the most extensive US federal law related to corporate governance since the implementation of federal securities laws in 1933 and 1934 (Uzun, Szewczyk, & Varma, 2004). The oversight role of corporate boards with regard to their fiduciary duty to act in the best interest of corporations shareholders was the pinnacle of these rulings. Most of the attention has been focused on board of directors at companies that commit financial statement fraud (Uzun et al., 2004).
IMPACT ON FINANCIAL STATEMENTS
The financial statements of an entity are presented to the primary stakeholders and shareholders to monitor financial performance. As such the financial reports serve as a tool to the shareholders and stakeholders alike. Arthur Levitt former chairman of the Securities and Exchange Commission (SEC) noted in 1998: if ‗The bond between shareholders and the company is shaken; investors grow anxious; prices fluctuate for no discernible reasons and the trust that is the bedrock of our capital markets is severely tested (Anand, 2004). In 1999, he also stressed the importance of high quality information as the

How the Agency and Shareholder Theory Affect the Financial Statements?
23
lifeblood of strong, vibrant markets. Without it, investor‘s confidence erodes. Liquidity dries up. Fair and efficient markets simply cease to exists (McCallig, 2007). We as financial statement users rely on these reports of the firm to learn about the firm‘s performance and value.
Quality of Financial Reporting
If financial information is negative, shareholders can become dissatisfied with management. This dissatisfaction can result in a divestiture of their corporate holdings and a corresponding decrease in the value of the corporation‘s stock. As a result, management has an incentive to do whatever it can in preparing financial statements to meet earnings projections set by analysts and to affirm that management of the corporation has been performing well (Anand, 2004). This is but one example of how agency conflicts develop in the financial statements. Accounting serves as a ―checkup‖ that may be used by stakeholders to access this important aspect of a company‘s governance. (McCallig, 2007). Unfortunately, some critics contend that disclosures of accounting formation are an unnecessary expense for the corporation. Veblen explains, stockholder are interested only in information on their wealth and no need for information on the operation of the firm (Jassim et al., 1988). Information on the corporation should be disclosed whether positive or negative. A regular reporting cycle should be maintained to provide the information. The shareholder can decide what to do with the information but it should be available and hence will continue to provide for the examination of agency conflicts if the information is regularly disclosed.
Wall Street Expectations
The motivation to satisfy Wall Street earnings expectations is beginning to override long established precepts of financial reporting and ethical restraint. The quality of financial reporting relies on three things. 1. Generally Accepted Accounting Principles (GAAP) in force, 2. Willingness of boards of directors to apply GAAP properly in preparing their financial statements, and 3. Enforcement of GAAP by regulators and auditors (McCallig, 2007). Careful study of financial statements can yield great benefit for investors and analysts only if prepared according to GAAP and relevant account standards only if prepared free of agency conflicts and bias.
Transparency of Numbers
Fraud of stakeholders occurs when the company cheats. Fraud of financial reporting takes place when agents of the company misrepresent the company‘s financial condition (Uzun et al., 2004). Board independence is a necessary condition for effective governance. Audit committees are responsible for overseeing the financial reporting process and ensuring the objectivity of the external audit (Uzun et al., 2004).
Imhoff (2003) argues that in the US the financial reporting regimes, particularly through cash bonus and stock option plans based on accounting results, have presented managers with incentives to manipulate financial results and delay or conceal bad news. Window-dressing is employed to apparently exceed shareholders‘ expectations. Board members also are often compensated with stock options, which thereby can induce them to avoid recognizing or dealing with unfavorable corporate performance, and to mask unfavorable financial news (Parker, 2007).
However the external corporate reporting and governance relationship is not limited to financial compensation and results alone. As Bebbington (2004) explains, governance is about a suite of broad responsibilities at corporate level that extend to accountabilities that include corporate social and environmental impacts. These raise issues of accountability and reporting transparency that go beyond financial status and results (Parker, 2007).
Agency Costs of Financial Statements
Several agency costs are reflected in the financial statements. One form of agency costs is the cost of monitoring managers. The supervision of managers comes with a price of hiring and/or implementing a system to do so. A second cost is risk aversion on the part of managers. The shareholders have diversified portfolios of cost and with non diversified risk whereas manager are wholly invested with the firms for their employment are less risk taking (Easterbrook, 1984).
Agency costs as defined by Jensen are costs associated with cooperative efforts by human beings, arising when one entity, the principal hires another, and the agent to act for him or her. The agency costs are the sum of the contracting, monitoring

Veronica Paz and Thomas Griffin
24
and bonding costs undertaken to reduce the costs due to the conflicts of interest plus the ―residual loss‖ that occurs because it is generally impossibly to perfectly identify the agents interest with that of the principal (Jensen, 2005).
DISCUSSION
Corporation's survival and continuing success depends upon the ability of its management to create sufficient wealth, value, or satisfaction for all primary stakeholder groups. Additionally, "the economic and social purpose of the corporation is to create and distribute increased wealth and value to all its primary stakeholder groups, without favoring one group at the expense of others" (Jawahar & McLaughlin, 2001). The ultimate objective of corporate decisions is marketplace success. Firms contract with their managers and stakeholders on the basis of mutual trust and cooperation, they will have a competitive advantage over firms that do not (Jawahar & McLaughlin, 2001). The board of directors is at the apex of the decision making process in public corporations. Every major operational or strategic decision must go through the board (Kassinis & Vafeas, 2002). The board of directors is one of several internal governance mechanisms that are intended to ensure that the interest of shareholders and managers are closely aligned, and to discipline or remove ineffective management teams (Barnhart, Marr, & Rosenstein, 1994). Monitoring management performance is considered to be among the most fundamental of board duties. The board serves as shareholders‘ first line of defense against incompetent or abusive managers (Kerr, 1997). The defense strategy involves fighting against addressing a stakeholder's issues or completely withdrawing and ignoring the stakeholder (Jawahar & McLaughlin, 2001). The accommodation involved anticipating and accepting responsibility, respectively; both involve addressing stakeholder issues to enhance the interests of stakeholders (Jawahar & McLaughlin, 2001). The stake of the Board in the firm‘s financial success, and other such matters, the effectiveness of the Board will depend in part on how well the Board functions as a group (or as a team) to handle the complex tasks it faces (McIntyre et al., 2007). The board of directors is a solution to the agency problem and divergence. If they function in their appropriate role to stop the corruption and monitor the agency problems far fewer organization would result in overvaluing their firms and hence having to restate their financial reports. Organizations will pay more attention to and be more concerned with issues of stakeholder groups who control resources critical to the survival of an organization (Jawahar & McLaughlin, 2001). Stakeholders who are critical for survival have to be dealt with in a proactive manner or, at the very least, accommodated (Jawahar & McLaughlin, 2001). Contributing valued resources creates incentives for others to recognize a potential stakeholder, while putting resources at risk gives one a moral claim to stakeholder status. By developing longer-term relationships with primary stakeholders like customers, suppliers, and communities, as well as present and future employees, firms expand the set of value-creating exchanges with these groups beyond that which would be possible with interactions limited to market transactions. The emphasis is on the value that can be created by interactions, between firms and primary stakeholders, who are relational rather than transactional since transactional interactions can be easily duplicated and thus offer little potential for competitive advantage. Relationships involve investments by both (or multiple) parties and thereby include a time dimension. Reputation is important and fair dealing and moral treatment by both (or multiple) parties enhance the value of relationships (Hillman & Keim, 2001). Many scholars now argue that intangible, difficult-to-replicate resources must undergird the business processes if a firm is to outperform its rivals and create value for shareholders (Hillman & Keim, 2001). Good control systems and monitoring by intelligent people of integrity in a well designed governance system are always necessary for effective control of corporate agency problems (Jensen, 2005). Internal controls and proper checks and balances should be established within the accounting and financial reporting cycle to ensure transparency in the financial data. One of the major ways board of directors can help diminish the costs of agency problems is by taking responsibility for eliminating target based compensation systems and creating an environment of monitoring.
CONCLUSION
To summarize the agency theory holds a leg in the relationship between the board of directors and the management team. The shareholders also have an agency relationship. The shareholders can have an influence in the generation of the financial statement because the board and management want to report favorable results to maximize shareholder value. Also, management may have an incentive to report favorable results as well. Sarbanes Oxley and the board of directors server to mitigate the agency conflicts that are inherent in the process. Internal controls and monitoring should not be overlooked as these processes will also ensure accurate and transparent financial reporting.

How the Agency and Shareholder Theory Affect the Financial Statements?
25
REFERENCES
Anand, A. I. (2004). Shareholder Isolation and The Regulation of Auditors. Univeristy of Toronto Law Journal, 54(1), 44. Barnhart, S. W., Marr, M. W., & Rosenstein, M. a. S. (1994). Firm Performance and Board Composition: Some New Evidence.
Managerial and Decision Economics, 15(4), 12. Carpenter, M.A. & J.D. Westphal. (2001).The strategic context of external network ties: Examining the impact of director
appointments on board involvement in strategic decision making. Academy of Management Journal. 44(4), 639-660. Chen, Y. (2008). International Dual Listing: An Analytical Framework Based on Corporate Governance Theory. Journal of
American Academy of Business, 12(2), 8. Crumbley, Z. R. L. (2007). The Role of Forensic Auditing Techniques in Restoring Public Trust and Investor Confidence in
Financial Information Forensic Examiner, 16(1), 7. Cyert, R. M., Kang, S.-H., & Kumar, P. (2002). Corporate Governance, Takeovers, and Top-Management Compensation:
Theory and Evidence. Management Science,, 48(4), 21. Easterbrook, F. H. (1984). Two Agency-Cost Explanations of Dividends. The American Economic Review, 74(4), 11. Hillman, A. J., & Keim, G. D. (2001). Shareholder Value, Stakeholder Management, and Social Issues: What's the Bottom Line? Strategic Management Journal, 22(2), 23. Imhoff, E. A. (2003). Accounting quality, auditing, and corporate governance. Accounting Horizons, 17, 117-128. Jassim, A., Dexter, C. R., & Sidhu, A. (1988). Agency Theory: Implications for Financial Management Managerial Finance, 14,
5. Jawahar, I. M., & McLaughlin, G. L. (2001). Toward a Descriptive Stakeholder Theory: An Organizational Life Cycle Approach.
The Academy of Management Review, 26(3), 27. Jensen, M. C. (2005). Agency Costs of Overvalued Equity. Financial Management;, Sping 2005(34), 15. Kassinis, G., & Vafeas, N. (2002). Corporate Boards and outside Stakeholders as Determinants of Environmental Litigation.
Strategic Management Journal,, 23(5), 22. Kerr, L. K. J. L. (1997). The effects of outside directors and board shareholdings on the relation between Chief Executive
Compensation and Firm Performance. Accounting and Business Research, Vol. 37. No. 1. pp. 39-54. 2007, 27(4), 13. Kochan, T. A., & Rubinstein, S. A. (2000). TowardaStakeholderTheoryoftheFirm:TheSaturnPartnership. OrganizationScience,
11(4), 367. McCallig, J. (2007). AN ACCOUNTING CHECKUP: ACCOUNTING ANALYSIS AS A TOOL FOR BETTER GOVERNANCE.
Corporate Finance Review, 11(5), 14. McIntyre, M. L., Murphy, S. A., & Mitchell, P. (2007). The top team: examining board composition and firm performance.
Corporate Governance, 7(5), 16. Parker, L. D. (2007). Financial and external reporting research: the broadening corporate governance challenge. Accounting
and Business Research, Vol. 37. No. 1. pp. 39-54. 2007, 37(1), 17. Uzun, H., Szewczyk, S. H., & Varma, R. (2004). Board Composition and Corporate Fraud. Financial Analysts Journal, 60(3),
11. Wood, D. J. & Jones, R. E. (1995). Stakeholder mismatching: a theoretical problem in empirical research on corporate social
performance. International Journal of Organizational Analysis, 3(3), 229-267.
Sung-Chang Jung, Yong-Gyo Lee and John H. Thornton Jr.
26
STOCK REISSUES: THE MIRROR IMAGE OF REPURCHASES?
Sung-Chang Jung1, Yong-Gyo Lee2 and John H. Thornton Jr.3 Chonnam National University1, University of Houston–Victoria2 and Kent State University3
ABSTRACT
This study examines the reissues of the stocks previously repurchased, aka ‗reversed repurchases. Signaling hypothesis
suggests that market should respond positively to the repurchase because of stock undervaluation. Similarly, it is anticipated
that the market responds negatively to the reissue because of the reverse signaling that stocks were overvalued. Thus, this
study is an extension of signaling hypothesis developed in the context of repurchases to somewhat related context, i.e.,
reissues. Based on the belief that the signaling hypothesis alone may not explain the company‘s decision to reissue, we also
tested the conjecture that reissue decision may be motivated by the window of opportunity. Taking advantage of the data
available due to very unique regulatory and disclosure requirements on both repurchases and reissues in Korea, this study
empirically testes the motivation behind the reissues, which are believed to be the mirror image of repurchases.
Our results support both the signaling hypothesis (in repurchases samples) and reversed signaling hypothesis (in reissue
samples). Thus the notion that reissues are mirror image of the stock repurchases has some empirical supports. In addition,
our results indicated as expected that the market responses to the repurchases followed by the reissues are negative but
weaker than those of the repurchases without reversal. One interpretation of such finding is that the positive stock price
effects may be temporarily to some extent because it can be reversed with the reissues. We also found that the market
reaction to the announcement of the reissue for the first-time sample is significantly negative; however, there is a very limited
market reaction to the reissue announcement in multiple-times sample. As predicted, the magnitude of the information content
of the repetitive reissues is smaller than those of the first reissues. One notable finding is that while the reverse signaling
hypothesis better explains the motivations of the first-time reissues, but the window of opportunity hypothesis better explain
the motivation behind the reissues in non-first-time reissues.
Keywords: Stock Reissues, Stock Repurchases, (Reverse) Information Signaling, Window of Opportunity
INTRODUCTION
This study empirically tests whether the reissues are the mirror image of the stock repurchases that the firm executed previously. The impetus from this study is that the reissues are theoretical opposite of the repurchases. The stocks repurchased are commonly called as treasury stocks, and these treasury stocks can be reissued in the form of seasoned equity offerings in the United States and in the form of reverse repurchases in countries like Korea. Research of the type conducted in this study concerning a sequence of signals is important because corporate decisions and actions do not occur in isolation. Instead, today‘s decision forms a part of the ongoing history of the firm. Similarly, the market‘s reaction to an announcement should be conditioned on the prior announcements, particularly in the case where the firm is sending contradictory signals. There is a large body of literature studying the stock market reaction to the announcement by corporations of both open market stock repurchases and seasoned equity offerings. While several theories have been advanced to explain the market reaction to these two corporate actions, frequently these actions are considered to be signals by the management of the firm to the market. In the case of open market stock repurchases the signal is that management considers the stock to be undervalued, while in a seasoned equity offering the signal is that management considers the stock to be overvalued. Despite the fact that repurchase has been used for decades in the US, no empirical evidence has been reported on reissues in US market due to primarily the lack of data needed to test such conjecture. In the United States, for instance, the stocks once repurchased are available for reissues in the form of seasoned equity offerings, but the incidents of reissues cannot be identifiable in the US because disclosure was not required.

Stock Reissues: The Mirror Image of Repurchases?
27
Unlike in the United States, most of the European and Asian countries, who have allowed repurchases in early 1990s after a long period of prohibition, have placed significant restrictions on repurchases. Thanks to such tougher regulatory and disclosure rules, the data needed to test the hypothesis is available in some countries. Korea is one of those countries in which the disclosure on the incidents of reissues as well as repurchases is mandatory. Therefore, this study takes advantage of a unique regulatory environment in Korea to investigate how the market reacts to a sequence of opposite signals. In particular, we examine the situation where a firm first conducts an open market repurchase, and subsequently conducts a stock issue that effectively reverses the repurchase. The reissue provision allows Korean firms to in essence reverse some or all of a previously conducted repurchase through a reissue that is structured as virtually the mirror image of a repurchase. We are not aware of any other country in the world that has a regulatory provision similar to the reissue mechanism in Korea. Several aspects of the regulatory situation in Korea with regard to stock repurchases and reissues make this market uniquely suited for an analysis of the type we conduct. While the open market repurchase programs in Korea allowed in 1994 are in many ways similar to those in the United States, the Korean regulators place significant restrictions on the programs.1 For instance, the reissue must be completed within three months after the announcement. But there is a blackout period for reissue; the reissue must be at least six months after the completion of the preceding repurchases. The number of reissued shares must be no greater than the number of shares actually repurchased in the preceding repurchase. The regulations regarding the reissue process are essentially a mirror image of the repurchase process. The reissue must also be publicly announced and it too must be completed within three months. Again at the end of the reissue period the firm must disclose information about the reissue. Due to this unique regulatory structure we can accurately identify a sample of firms that announce, and actually conduct, an open market repurchase, and thereby presumably send a signal to the market that their stock is undervalued. These same firms then conduct a reissue that essentially reverses the repurchase, and thereby presumably send a signal to the market that their stock is overvalued. Thus, the objectives of this paper are threefold. First, this paper empirically tests if such reissue subsequent to repurchase (aka reverse repurchase) effectively reverses the repurchases. Reissue can be explained with the ‗(reverse) signaling hypothesis‘ suggested for repurchases should the reissue is a mirror image of repurchase. We conjecture in Hypothesis 1 (H1) that the market response to the announcement of a reissue should essentially be the mirror image of the response to a repurchase. Signaling hypothesis suggests that market should respond positively to the repurchase announcement because it signals that the value of the assets was undervalued. Thus, it is anticipated that the market responds negatively to the announcement of a reissue of the repurchased stocks and positively to the announcement of a precedent repurchase. Thus this study is an extension of signaling hypothesis developed in the context of repurchases to the context of reissues. Second, this study examines if the effects of the signaling hypothesis on stock price is permanent or temporary. This study, based on ex post data on subsequent reissues, compares the market response of the repurchases followed by reissues and repurchases without subsequent reissues. One alternative view on the change in stock price surrounding repurchase announcements is that the positive change in stock price is merely a mathematical reflection of a decrease in outstanding stocks. As the repurchased stocks (or treasury stocks) are not counted as outstanding, the number of shares outstanding will be decreased with repurchases, and as a result, the earnings per share (EPS) will be increased because of the formulas in which earnings are divided by the number of shares outstanding. To this extent, the stock price increase surrounding repurchase announcements are temporarily in the regime that repurchase can be reversible. Third, this study examines the market responses to the announcements of reissues differ with the frequency of the reissue. We test if the marker responses to the announcements of the first reissues differ from those announcements that repeat the cycle. We anticipate that the market response to the repetitive reissues should be smaller than those of the first-time samples. The market reaction to the announcement of the reissue for the first-time sample is significantly negative; however, there is a very limited market reaction to the reissue announcement in multiple-times sample.
REVIEW OF LITERATURE
Two lines of research appeared to be relevant to this paper - stock repurchases and seasoned equity offerings. The main empirical regularity in literature on stock repurchases is that the market reacts positively to the announcement of a repurchase
1 The repurchase program in Korea is very similar to the open-market repurchases in the United States and other countries around the world. There were no limits in
fraction of stocks can be repurchased, but the funds used for repurchase can only come from internally generated funds. Like the reissues, the repurchases must be completed within three months, which is substantially shorter than most other markets. For example, the time limit is 18 months in France, one year in Canada, one year in Japan, and three years or more In the United States. However, market reaction to the announcement of an open market repurchase is very similar to the response in other markets. For example, Jung et al (2005) report that an average cumulative abnormal return for (0,+5) is positive 2.74%, which is similar to the results reported in other markets.

Sung-Chang Jung, Yong-Gyo Lee and John H. Thornton Jr.
28
(e.g. Vermaelen, 1981; McNally, 1999; Ikenberry et al., 2000; Rao and Vermaelen, 2002; and, Oswald and Young, 2004). Previous studies find this pattern in the Korean market as well (e.g. Jung et al, 2005). The most frequently mentioned explanation is that a repurchase serves as a signal to the market that the managers of the firm believe that the stock of the firm is undervalued (Vermaelen, 1984; Persons, 1997; McNally, 1999). It is this explanation that is most relevant to our study. In contrast, the major finding in this literature concerning seasoned equity offerings is that the market reacts negatively to the announcement of an equity offering (e.g. Masulis and Korwar, 1986; and Bayless and Chaplinsky, 1996). The most frequently given explanation for these empirical results in the equity offering literature is again based on information signaling. In this case the announcement that the management of the firm believes the stock is overvalued. However, studies that involve sequential signals are still relatively rare. Examples include D‘Mello et al (2003b), who study stock splits followed by seasoned equity offerings; D‘Mello et al (2003a), who study sequences of seasoned equity offerings; and, Howell and Payne (2004), who study stock-based acquisitions followed by stock repurchases. Perhaps the study most closely related to our study is Billett and Xue (2004), who, among other things, study stock repurchases followed by seasoned equity offerings in the United States. Billett and Xue (2004) find that the market reaction to the announcement of a seasoned equity offering is significantly less negative when it is preceded by a repurchase announcement. They conclude that the repurchase announcement mitigates the adverse selection problem associated with issuing equity. Our study differs from Billett and Xue (2004) in that the equity offering in our sample serves only to reverse the original repurchase.
METHODS
Hypothesis
H1: (Reverse) Signaling Hypothesis. We suggest the reverse signaling hypothesis to explain the observed reissue behavior of Korean firms. According to signaling hypothesis, a firm conducts a repurchase when the stock is undervalued. It also states that as a result of repurchase announcement, the value moves up toward fair value. As the signaling hypothesis has received most wide support from studies dealing with stock repurchases in the United States and other countries, we posits that signaling hypothesis should explain in reverse form the reissue that reverses the stock repurchase. Considering that reissue is a mirror image of repurchase, reissue would provide a construct to test the validity of the signaling hypothesis in reverse direction. According to the reverse signaling hypothesis, a firm conducts a reissue if the stock is overvalued, and as a result of reissue, the value moves down toward fair value.
We conjecture in Hypothesis 1 that the market response to the announcement of a reissue should essentially be the mirror image of the response to a repurchase. Signaling hypothesis suggests that market should respond positively to the repurchase announcement because it signals that the value of the assets was undervalued. Thus, it is anticipated that the market responds negatively to the announcement of a reissue of the repurchased stocks and positively to the announcement of a precedent repurchase.
H2: Window of Opportunity Hypothesis. The difficulty with the reversal signaling hypothesis is finding a mechanism that would give the firm‘s manager an incentive to reduce the value of overvalued stock via reissue. However, we can think of two possible circumstances in which incentive for reissue prevail. First, firms with fluctuating cash needs would reissue to generate such cash needs. For instance, a firm conducts a repurchase to distribute excess cash, but due to changes in conditions the firm conducts a reissue to raise cash. In such circumstance, the decision to make is not rest on whether to reissue or not any more. The concern of the firm now shifts to the issue as to when the right time to execute reissue be. One justification for reissue therefore is that, the firm would reissue if they feel that the stock is fairly valued, if not overvalued, so there is no need to wait any further.
Second, a firm with growth opportunity would repurchase with reissue placed in plan. It may be particularly applicable when the firms anticipate substantial growth opportunities but the stock is significantly undervalued. Once the stock is close to fair value the firm reissues the acquired stock through repurchase to raise cash to fund growth opportunities. And this resulted in decline in value. This hypothesis is closest to hypotheses advanced in most of the United States based dual signaling literature, particularly Billett and Xue (2004).
But in most other cases, the signaling hypothesis alone may not explain the company‘s decision to reissues in general. We posit that signaling hypothesis can only explain the repurchases in most cases but it explain the reissues in a special circumstances in which decline in stock price would benefit the firm and its manager. It calls for alternative hypothesis that can explain the most reissues. For this, we constructed that the motivation of the firm to repurchase or reissue is to exploit the window of opportunity. Accordingly, we posit that stock price increase due to repurchases would be transitory in nature, not

Stock Reissues: The Mirror Image of Repurchases?
29
permanent, unless the repurchased stocks are permanently redeemed. In this line of reasoning one interesting research issue would be testing if the direction and magnitude of the stock price change be the same if such stock repurchase is not reversible.
Sample and Data
A typical event study methodology of Brown and Warner (1985) was used to assess the market reaction to the announcements of both reissues and repurchases. As the event date, we use the first disclosure date of the planned reissue and its matching repurchase. Korean firms are required to complete the repurchase as reissues within a three month period. At the end of the three month period, the firm must disclose information about the repurchase including the number of shares actually repurchased. Both repurchases and reissues were identified using the Security Market Daily provided by the Office of Disclosure of the Korea Stock Exchange. The event date is usually the date that the Board of Directors made the decision and the firm should begin to repurchase or reissue within three days after the disclosure. Daily stock returns data from the Korea Investors Service, Inc.‘s KIS-SMAT database were used. The estimation period for the market model was days (-240, -61). We compute Abnormal Returns (AAR%) and Cumulative Abnormal Returns (CAAR%) over 151-day period (-60, 90). Thus, in order to be included in the sample, the firms had to have daily stock return data for the period from 240 days prior to the announcement to 90 days after the announcement.
Table 1: Distribution of Repurchases and Reissues: by Year
1994 1995 1996 1997 1998 1999 2000 2001 2002 2003 Total
Number of Repurchases 57 52 92 133 93 56 115 56 74 61 789
Number of Reissues 1 11 23 27 23 51 21 28 50 43 279
Less: Non-first-time reissues 0 1 7 8 6 19 8 16 36 29 130
First-time Reissues 1 11 16 19 17 32 13 12 14 14 149
Our sample period covers the first ten years from 1994 to 2003 in which reissues and repurchases were allowed in Korea. We deleted reissues by firms from the financial services industry, since in Korea firms in the financial services industry are very heavily regulated. We also deleted announcements of preferred stock repurchases, thereby including only repurchases of common stock. As shown in Table 1, these sample selection procedures resulted in a sample of 279 reissues and 789 repurchases. Among the 293 reissues, we identified 149 first-time reissues, 149 matching pair of repurchases, and 130 repetitive (not first-time) reissues.
RESULTS
Reissues vs. Repurchases
The Table 2 shows the distributive statistics of the sample reissue firms used in this study. As shown in the table, the TFR (Total fraction of repurchase) and RTFR (Relative total fraction of repurchase) are 2.07% and 3.17% on average, respectively. The rates of the price change from the time of repurchase and the time of reissue are 12.47% and 4.18%, respectively, on average.
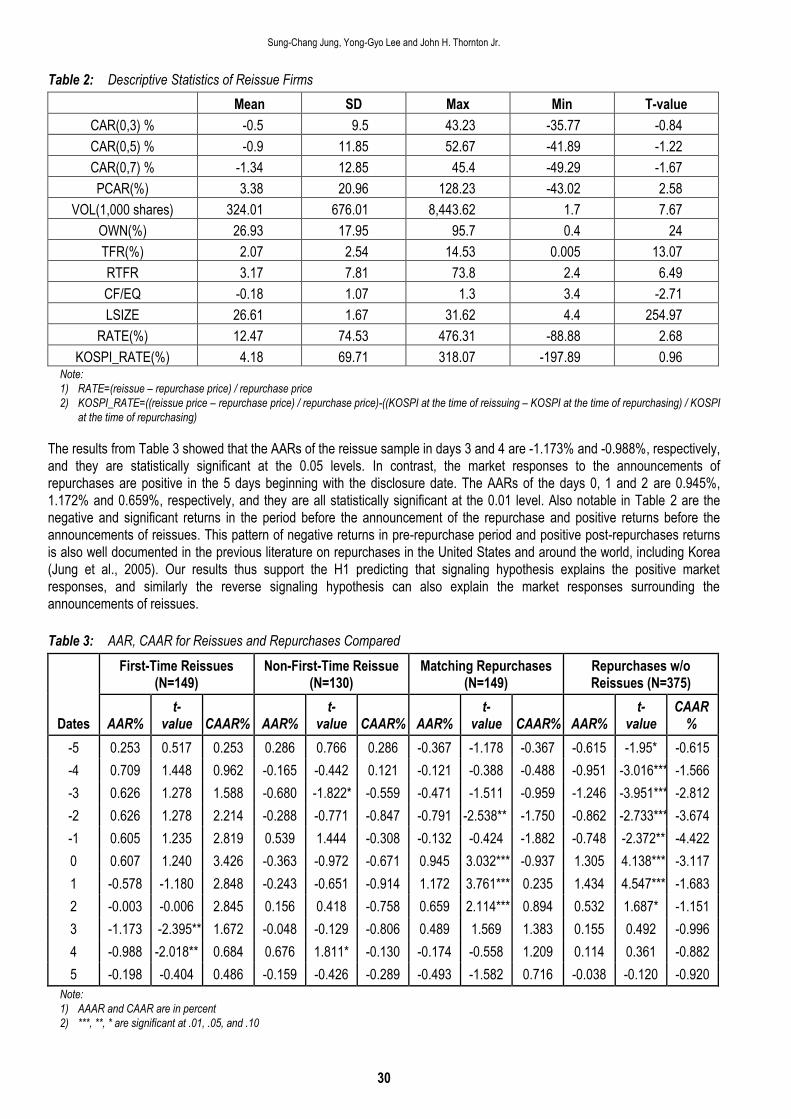
Sung-Chang Jung, Yong-Gyo Lee and John H. Thornton Jr.
30
Table 2: Descriptive Statistics of Reissue Firms
Mean SD Max Min T-value
CAR(0,3) % -0.5 9.5 43.23 -35.77 -0.84
CAR(0,5) % -0.9 11.85 52.67 -41.89 -1.22
CAR(0,7) % -1.34 12.85 45.4 -49.29 -1.67
PCAR(%) 3.38 20.96 128.23 -43.02 2.58
VOL(1,000 shares) 324.01 676.01 8,443.62 1.7 7.67
OWN(%) 26.93 17.95 95.7 0.4 24
TFR(%) 2.07 2.54 14.53 0.005 13.07
RTFR 3.17 7.81 73.8 2.4 6.49
CF/EQ -0.18 1.07 1.3 3.4 -2.71
LSIZE 26.61 1.67 31.62 4.4 254.97
RATE(%) 12.47 74.53 476.31 -88.88 2.68
KOSPI_RATE(%) 4.18 69.71 318.07 -197.89 0.96 Note:
1) RATE=(reissue – repurchase price) / repurchase price
2) KOSPI_RATE=((reissue price – repurchase price) / repurchase price)-((KOSPI at the time of reissuing – KOSPI at the time of repurchasing) / KOSPI
at the time of repurchasing)
The results from Table 3 showed that the AARs of the reissue sample in days 3 and 4 are -1.173% and -0.988%, respectively, and they are statistically significant at the 0.05 levels. In contrast, the market responses to the announcements of repurchases are positive in the 5 days beginning with the disclosure date. The AARs of the days 0, 1 and 2 are 0.945%, 1.172% and 0.659%, respectively, and they are all statistically significant at the 0.01 level. Also notable in Table 2 are the negative and significant returns in the period before the announcement of the repurchase and positive returns before the announcements of reissues. This pattern of negative returns in pre-repurchase period and positive post-repurchases returns is also well documented in the previous literature on repurchases in the United States and around the world, including Korea (Jung et al., 2005). Our results thus support the H1 predicting that signaling hypothesis explains the positive market responses, and similarly the reverse signaling hypothesis can also explain the market responses surrounding the announcements of reissues.
Table 3: AAR, CAAR for Reissues and Repurchases Compared
Dates
First-Time Reissues (N=149)
Non-First-Time Reissue (N=130)
Matching Repurchases (N=149)
Repurchases w/o Reissues (N=375)
AAR% t-
value CAAR% AAR% t-
value CAAR% AAR% t-
value CAAR% AAR% t-
value CAAR
%
-5 0.253 0.517 0.253 0.286 0.766 0.286 -0.367 -1.178 -0.367 -0.615 -1.95* -0.615
-4 0.709 1.448 0.962 -0.165 -0.442 0.121 -0.121 -0.388 -0.488 -0.951 -3.016*** -1.566
-3 0.626 1.278 1.588 -0.680 -1.822* -0.559 -0.471 -1.511 -0.959 -1.246 -3.951*** -2.812
-2 0.626 1.278 2.214 -0.288 -0.771 -0.847 -0.791 -2.538** -1.750 -0.862 -2.733*** -3.674
-1 0.605 1.235 2.819 0.539 1.444 -0.308 -0.132 -0.424 -1.882 -0.748 -2.372** -4.422
0 0.607 1.240 3.426 -0.363 -0.972 -0.671 0.945 3.032*** -0.937 1.305 4.138*** -3.117
1 -0.578 -1.180 2.848 -0.243 -0.651 -0.914 1.172 3.761*** 0.235 1.434 4.547*** -1.683
2 -0.003 -0.006 2.845 0.156 0.418 -0.758 0.659 2.114*** 0.894 0.532 1.687* -1.151
3 -1.173 -2.395** 1.672 -0.048 -0.129 -0.806 0.489 1.569 1.383 0.155 0.492 -0.996
4 -0.988 -2.018** 0.684 0.676 1.811* -0.130 -0.174 -0.558 1.209 0.114 0.361 -0.882
5 -0.198 -0.404 0.486 -0.159 -0.426 -0.289 -0.493 -1.582 0.716 -0.038 -0.120 -0.920
Note:
1) AAAR and CAAR are in percent
2) ***, **, * are significant at .01, .05, and .10
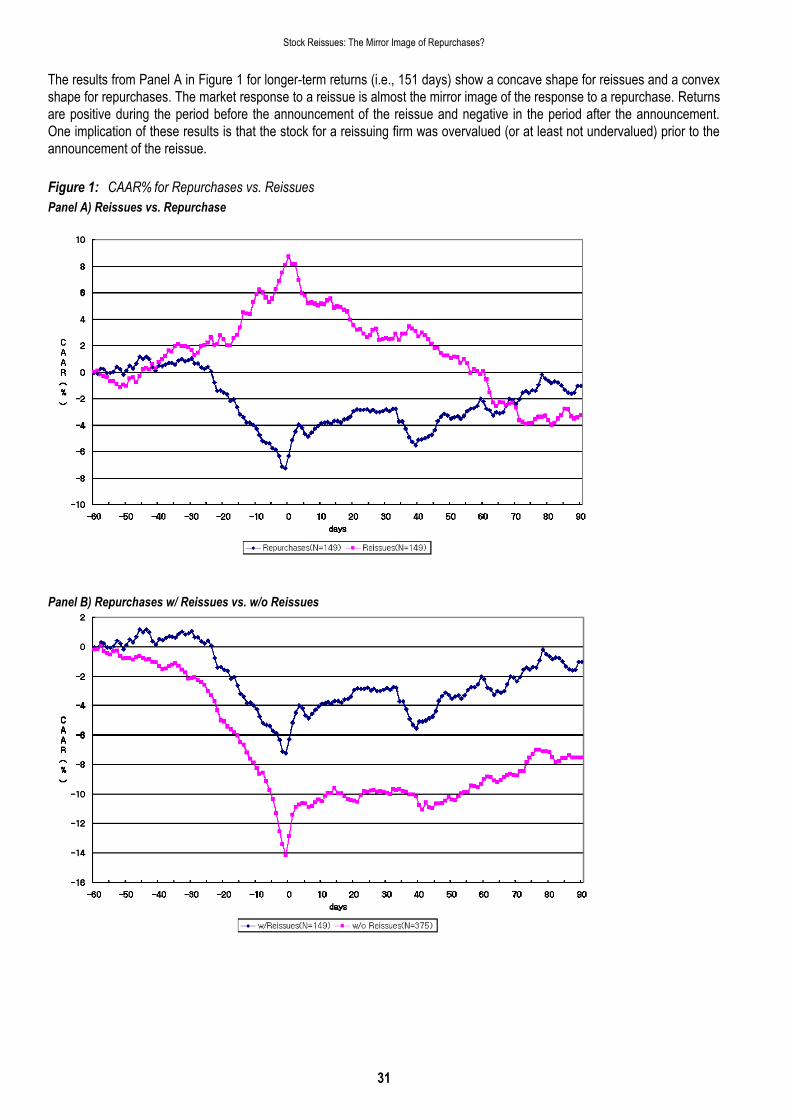
Stock Reissues: The Mirror Image of Repurchases?
31
The results from Panel A in Figure 1 for longer-term returns (i.e., 151 days) show a concave shape for reissues and a convex shape for repurchases. The market response to a reissue is almost the mirror image of the response to a repurchase. Returns are positive during the period before the announcement of the reissue and negative in the period after the announcement. One implication of these results is that the stock for a reissuing firm was overvalued (or at least not undervalued) prior to the announcement of the reissue.
Figure 1: CAAR% for Repurchases vs. Reissues
Panel A) Reissues vs. Repurchase
Panel B) Repurchases w/ Reissues vs. w/o Reissues

Sung-Chang Jung, Yong-Gyo Lee and John H. Thornton Jr.
32
Panel C) First-Time vs. Non-First-Time Reissues
Repurchases with Reissues vs. without Reissues
Table 3 also compares the announcement returns for repurchases subsequently followed by reissues to repurchases not followed by reissues.2 Repurchases that are followed by reissues show stronger effects than repurchases that are not followed by reissues. The results in Table 3 show that the AARs of the 3-day event window (0, 2) are positive with .001 level of statistical significance. Also notable in Table 2 are the negative and significant returns in the period before the announcement of the repurchase and positive returns after the announcements of repurchases. In other words, the disclosure effects of repurchases not followed by reissues are generally similar to those of the repurchases with subsequent reissues sample, although the magnitude is somewhat higher. The 4-day (0,3) CAARs are 3.385% in the sample without reissues versus 2.672% in the sample with reissues. Notably the CAARs in the period before announcement are more negative in the sample without reissues. In the (-20,-1) window the CAARs are -9.159% in the sample without reissues versus -5.902% in the sample without reissues. Panel B of Figure 1 provides a longer period comparison. For repurchases made by firms that later reverse some or all of their repurchase, the repurchase program seems to provide some help in boosting their stock price. The CAARs of the repurchase-reissue sample were negative 7% during the 60-day (-60, -1) pre-repurchase period. But because of the sharply positive returns over a few days immediately after the repurchases, the stock recovers most of the lost ground and shows close to zero returns for the entire period examined. These results indicate that the repurchases provide a very effective means to boost the stock price at least temporarily for firms that repurchased stock and subsequently reissued. The effects are similar in the sample without reissues, however the returns in the period before announcement are even more negative reaching -14% just before announcement. In conclusion, strong and statistically significant negative announcements effects of repurchases as posited in H2 were found in both samples. And as predicted in H2, much cleaner and stronger negative pre-announcements effects and positive post-announcements effects were found in repurchases with no reverse firms. One implication of this finding is that the positive market responses to the repurchase announcements in non-reverse firms are more permanent than those firms later reversed.
First-Time vs. Repetitive Reissues
Table 3 and the Panel C of Figure 1 compare the market response to first time reissues versus repetitive reissues. The market responses to first time reissues (FTI) are more negative than the non-first-time reissue samples (NFTI). The CAARs
2 It is important to note that in conducting this comparison we are conditioning on information that could not be known with certainty by the market at the time of the
repurchase. There are two reasons for making the comparison in spite of this limitation: 1) the comparison may shed light on ex ante differences between firms that reissue and firms that do not. 2) The market may be able to determine with reasonable accuracy firms that are likely to reissue.

Stock Reissues: The Mirror Image of Repurchases?
33
after the disclosure of the first reissue are -2.135% for 5-day window (0, 4). For repetitive reissues, the effects are not significant and smaller in magnitude, -0.498% for the 5-day window (0, 4). Another notable observation from the NFTI cases is that the CAARs in the pre-disclosure period are much less positive than for FTI group. In the (-20,-1) window the CAARs are 5.371% in the first time group versus only 1.339% in the repetitive group. That result is somewhat unexpected. One possible reason is that the negative signaling effects are influenced by the previous or ongoing reissue programs, which produced negative effects during the reissue period and thereafter. Note that there is no blackout period for a reissue prior to this repetitive reissue. The blackout period only applies to the repurchases. In conclusion, strong and statistically significant negative announcements effects as posited in H3 were found from first-time reissue sample, but only a weak empirical support is found in the non-first-time sample.
Determinants of Market Returns Associated with Reissues
According to the ‗Stock Reissue Plan‘ filed to the Korean SEC, the reasons for the first-time reissues (FTI) are quite different from the non-first-time reissues (NFTI). As a part of the hypothesis testing, we regress market returns against a number of proxy variables representing the hypothesized relationship suggested inn the previous literature. We believe that the determinants of the cross-sectional differences in FTRI are different from the NFTI. Accordingly, we report the cross-sectional regression results for each group separately.
Table 4: Cross-Sectional Regression: First-Time vs. Non-First Time Reissues
Panel A) First-Time Reissues
Intercept PCAR OWN TFR RFTR CF/EQ LSIZE F-Value R2 (Adj. R2)
CAR3
(0,3)
0.0816 (0.56 )
-0.0651* (-1.67)
-0.00015 (-0.29)
-0.2785 (-0.62)
0.0024 * (1.69)
0.0057 (0.93)
-0.0031 (-0.57)
1.28 (p=0.269)
0.0555 (0.0122)
-0.00012 (-0.00)
-0.0658* (-1.68)
-0.00012 (-0.23)
0.19565 (0.56)
0.0067 (1.10)
-0.00009 (-0.02 )
0.96 (p=0.446)
0.0350 (-0.0016)
0.0587 (0.42)
-0.0680* (-1.76)
-0.00014 (-0.27)
0.0018* (1.67)
0.0062 (1.02)
-0.0023 (-0.46)
1.47 (p=0.204)
0.0527 (0.0168)
0.0443 (0.31)
-0.00018 (-0.35)
0.0017 (1.52)
0.0080 (1.34)
-0.0018 (-0.36)
1.05 (p=0.385)
0.0305 (0.0014)
CAR3
(0,5)
0.10974 (0.64)
-0.0471 (-1.02)
-0.00042 (-0.67)
-0.7167 (-1.36)
0.0035** (2.05)
-0.0069 (-0.96)
-0.0041 (-0.66)
1.04 (p=0.402)
0.0455 (0.0018)
-0.0075 (-0.05)
-0.0481 (-1.04)
-0.00038 (-0.60)
-0.0364 (-0.09)
-0.0054 (-
0.74) 0.00007 (0.01 )
0.40 (p=0.851)
0.0147 (-0.0226)
0.0509 (0.31)
-0.0545 (-1.19)
-0.0004 (-0.63)
0.0020 (1.54)
-0.0056 (-0.79)
-0.0024 (-0.40)
0.87 (p=0.500)
0.0321 (-0.0046)
0.0393 (0.24)
-0.00043 (-0.68)
0.0019 (1.44)
-0.0041 (-0.59)
-0.0020 (-0.36)
0.74 (p=0.568)
0.0217 (-0.0078)

Sung-Chang Jung, Yong-Gyo Lee and John H. Thornton Jr.
34
Panel B) Repetitive Reissues
intercept PCAR OWN TFR RFTR CF/EQ LSIZE F-Value R2 (Adj. R2)
CAR3
(0,3)
-0.1783 (-1.24)
-0.0057 (-013)
0.00012 (0.29)
0.5814 (1.26)
-0.0005 (-0.35)
-0.0551** (-2.10)
0.0061 (1.14)
1.25 (p=0.2858
)
0.0634 (0.0127)
-0.1661 (-1.19)
-0.0366 (-0.08)
0.00012 (0.31)
0.4745 (1.38)
-0.0548**
(-2.10) 0.0056 (1.09 )
1.49 (p=0.198)
0.0623 (0.0205)
-0.1456 (-1.02)
0.0075 (0.17)
0.00020 (0.48)
0.00070 (0.65)
-0.0520** (-1.98)
0.0049 (0.94)
1.18 (p=0.323)
0.0500 (0.0076)
-0.1414 (-1.01)
0.00020 (0.49)
0.00071 (0.66)
-0.0522** (-2.00)
0.0048 (0.93)
1.48 (p=0.213)
0.0498 (0.0161)
CAR3
(0,5)
-0.2306 (-1.22)
-0.0542 (-0.93)
0.0011* (1.97)
0.9288 (1.53)
-0.0013 (-0.72)
-0.0726** (-2.11)
0.0071 (1.02)
2.23 (p=0.045)
0.1075 (0.0593)
-0.1974 (-1.08)
-0.0485 (-0.84)
0.00111** (2.01)
0.6377 (1.41)
-0.0718**
(-2.09) 0.0058 (0.87)
2.58 (p=0.03)
0.1033 (0.0633)
-0.1785 (-0.95)
-0.0329 (0.58)
0.0012** (2.20)
0.00056 (0.40)
-0.0677* (-1.96)
0.0053 (0.77)
2.18 (p=0.061)
0.0886 (0.0479)
-0.1968 (-1.07)
0.0012**
(2.18)
0.00053 (0.38)
-0.0671* (-1.95)
0.0060 (0.88)
2.66 (p=0.036)
0.0859 (0.0536)
Note:
1) *, ** and *** indicate statistical significance at the .10, .05 and .01 levels respectively.
2) The dependent variables, CAR (0,3) and CAR (0,5), are the cumulative abnormal returns for the indicated window around the announcement date of
a stock reissues
The regression results from Panel A of Table 4 show that PCAR and RTFR are significant in first-time reissue firms (FTI), but these two variables are not significant in non-first-time reissue firms (NFTI). Thus, it requires interpretation of the results on how the first time reissue is different from the second-time reissue. It appears to me that the clue is rested on the purpose (or motivation) of the reissue stated by those firms. First, the coefficient of the PCAR is negative and statistically significant in (0, 3) window periods across all three models. Negative coefficient indicates that the larger the PCAR (usually positive), the smaller the CAR (usually negative). In other words, the larger the increase in stock price prior to reissue, the greater the decline in stock price at the reissue announcements. Such results are consistent with the hypothesized relationship in this study; the magnitude of the PCAR (positive in value) is positively associated with the magnitude of CAR (negative in value). The ‗signaling hypothesis‘ in reissue context states that investors would interpret the manager‘s decision to reissue as bad news; managers wanted to reissue because the stock was over-valued or at least not under-valued. Thus, the effects of the signaling would be just opposite to those of repurchase, the reissue version of the signaling hypothesis gets some empirical supports. In conclusion, results from the FTI sample appear to support the hypotheses 1. That is, if the stock is fairly priced, the firm would want to reissue to enjoy the most benefits with boosted price. Similarly the firm may want to wait selling their treasury stocks until the stock price reached to its fair value unless they have emergent need for cash as in the case of shortage of working capital. However in NFTI sample firms, none of these variables representing the signaling hypothesis (H1) are statistically significant. As shown in Panel B of Table 4, the results indeed support the window of opportunity hypothesis (H2). Interesting enough, the variables like OWN and CF/EQ representing the H2 are significant in the regression from the NFTI firms. The statistically significant negative coefficients of CF/EQ and positive coefficients of OWN indicated that. With respect to CF/EQ, the results show that the CAR was decreased with the increase in CF/EQ. The decrease in CAR means it would be smaller in value (still negative but became lesser in value). In the repetitive reissue firms, the CAR of the firms with larger/smaller CF/EQ would be lesser/larger (stock price decreased more/lesser) at the announcements of reissue. The variable OWN, denoted as the fraction of shares held by the largest shareholder of the firm has a positive coefficient. In other words, the firms with higher/smaller OWN would have larger/smaller CAR (or less/more negative CAR).

Stock Reissues: The Mirror Image of Repurchases?
35
Thus, the regression results from the repetitive reissues (NFTI) did not support the signaling hypothesis (H1) but they instead supported the window of opportunity hypothesis (H2). One implication of this finding is that the reasons for reissues in repetitive reissues may be different from the first-time reissue firms.
SUMMARY AND CONCLUSIONS
In this paper we take advantage of unique regulatory conditions in the Korean market to examine the market reaction to two conflicting signals that are executed in sequence. Korean firms can first conduct an open market repurchase, and then after a waiting period, conduct a stock issue that effectively reverses the repurchase. Korean firms are required to publicly announce an open market repurchase, and complete the repurchase within a three month period. At the end of the three month period, the firm must disclose detailed information including the number of shares actually repurchased. Korean firms may also conduct a reissue that effectively reverses some or all of the repurchase. The regulations regarding the reissue process are essentially a mirror image of the repurchase process. The reissue must also be publicly announced and it too must be completed within three months. Again at the end of the reissue period the firm must disclose information about the reissue. Due to this regulatory structure we can accurately identify a sample of firms that announce, and actually conduct, an open market repurchase. These same firms then announce and conduct a reissue that essentially reverses the repurchase. A repurchase is generally considered to be a positive signal to the market, while an equity offering such as the reissue is generally considered to be a negative signal. Thus we examine a sample of firms that are sending opposing signals to the market. We find that the market reactions to the reissue announcements are essentially the mirror image of the reaction to the repurchase announcements. In other words, market reacts positively to the repurchase announcement and negatively to the reissue announcement. Thus, the market reacts to both signals in a reverse manner consistent with the existing literature, thus, H1 representing the signaling hypothesis (H1) is supported in both direction, i.e., positive in repurchases and negative in reissues. We also find that the market response to the announcement of the repurchase for firms that subsequently reissue the shares is similar to the response for a control sample of firms that do not conduct a subsequent reissue. In both groups the market responds positively to the announcement. However, the returns of the reversal sample are less negative during the period immediately before the repurchase announcement. Thus, we have some supports for the H2 representing the difference in market responses between repurchases followed by reissues (temporary effects) and repurchases without reverse (denoting permanent effects). We further divide our reversal sample into those firms that conduct their first repurchase/reissue cycle and those firms that repeat the cycle. We find that the market response to the reissue is somewhat different between the first-time and multiple-times samples. The market reaction to the announcement of the reissue for the first-time sample is significantly negative; however, there is little or no market reaction to the reissue announcement in multiple-times sample. With respect to the difference in motivations between first-time reissues (FTI) and repetitive reissues (NFTI), results from the partitioned sample suggest that reverse signaling hypothesis (H1) better explains FTI but the window of opportunity hypothesis (H2) better explain the reissues in NFTI group.
REFERENCES
Bayless, M., and S. Chaplinsky (1996). Is there a window of opportunity for seasoned equity issuance, Journal of Finance 51, 253-278.
Billett, M., and H. Xue (2004). Share repurchase and the need for external finance, SSRN working paper. Brown, S., and J. Warner (1985). Using daily stock returns: The case of event studies, Journal of Financial Economics 14, 3-
31. D‘Mello, R., O. Tawatnuntachai, and D. Yaman (2003a). Does the sequence of seasoned equity offerings matter? Financial
Management 32, 59-86. D‘Mello, R., O. Tawatnuntachai, and D. Yaman (2003b). Why do firms issue equity after splitting stocks? Financial Review 38,
323-350. Fried, Jesse M. (2005). Open market repurchases: Signaling or managerial opportunism? Theoretical Inquiries in Law 2, 865-
894. Howell, J., and J. Payne (2004). Mixed messages: Open-market repurchases following stock acquisitions, Financial Review
39, 367-387. Ikenberry, D., J. Lakonishok, and T. Vermaelen (2000). Stock repurchases in Canada: Performance and strategic trading,
Journal of Finance 55, 2373-2397.

Sung-Chang Jung, Yong-Gyo Lee and John H. Thornton Jr.
36
Jung, S., Y. Lee and J. Thornton (2005). An empirical comparison between operations of stabilization funds and stock repurchases in Korea, Pacific-Basin Finance Journal 13, 319-341.
Masulis, R., and A. Korwar (1986). Seasoned equity offerings: An empirical investigation, Journal of Financial Economics 15, 91-118.
McNally, W. J. (1999). Open market stock repurchase signaling, Financial Management 28, 55-67. Oswald, D., and S. Young (2004). What role taxes and regulation? A second look at open market share buyback activity in the
UK, Journal of Business Finance and Accounting 31, 257-292. Persons, J. (1997). Heterogeneous shareholders and signaling with share repurchases, Journal of Corporate Finance 3, 221-
249. Rao, P.R., and T. Vermaelen (2002). Regulation, taxes, and share repurchases in the United Kingdom, Journal of Business
75, 245-282. Vermaelen, T. (1981). Common stock repurchases and market signaling: An empirical study, Journal of Financial Economics
9, 139-183. Vermaelen, T. (1984). Repurchase tender offers, signaling, and managerial incentives, Journal of Financial and Quantitative
Analysis 19, 163-181.

Are Investors able to Effectively use the Vast Amounts of Information Available on Publicly Traded Companies? A Decision Theory Approach to Investor Information Analysis
37
ARE INVESTORS ABLE TO EFFECTIVELY USE THE VAST AMOUNTS OF INFORMATION AVAILABLE ON PUBLICLY TRADED COMPANIES? A DECISION
THEORY APPROACH TO INVESTOR INFORMATION ANALYSIS
Carolyn S. Payne Nova Southeastern University
ABSTRACT
The objective of this proposed study is to investigate whether an investor‘s decision style affects his/her ability to effect ively
use the vast amount of complex information available on publicly traded companies. In psychological research, the negative
effects associated with a decision maker attempting to process too much information is called information overload.
Information overload research has revealed that all persons will reach a point where they will reduce information intake while
still maintaining decision quality, but as stimuli continue to excess, decision quality will begin to degrade.
The accounting profession has the responsibility of providing information to the investing public that is useful in their decision
making process. As if that task were not difficult enough, the recent trend toward do-it-yourself investing further complicates
the process. Several accounting researchers have noted concern over these issues and the very difficult challenge facing
standard setters in the current environment. It has been suggested that the only hope that the standard setters and the
accounting profession has is to look to cognitive psychology for the key.
Decision style theory may shed some light on the problem of information overload. The theory holds that people can be
classified according to how they gather and use information in making decisions. The ability to predict information overload
before it happens would be invaluable to investors and standard setters. A synthesis of the information overload and decision
style theories applied to the use of accounting information by actual investors, could prove to be extremely beneficial to
accountants in designing information systems for users, but perhaps even more importantly it could prove useful to
accounting standard-setting bodies as they determine the optimal disclosure levels of publicly traded companies.
Prior to this study, this theory has not been applied to investors as they make decisions in an information rich environment.
The results of this study may be beneficial to standard setters and regulators as they establish financial reporting disclosures.
The study‘s findings may also facilitate the design of more effective decision aids tailored to the decision styles of investors.
Keywords: Stock Market Investing, Information Overload, Decision Style Theory
I. INTRODUCTION
The objective of this proposed study is to investigate whether an investor‘s decision style affects his/her ability to effectively use the vast amount of complex information available on publicly traded companies. In psychological research, the negative effects associated with a decision maker attempting to process too much information is called information overload. Information overload research has revealed several factors that appear to influence our demand for and use of information. This knowledge applied to the area of investor decision making could decrease the likelihood of information overload among investors and facilitate better investment decisions. Decision style theory helps us better understand how individuals gather and use information in their decision making processes. Prior to this study, this theory has not been applied to investors as they make decisions in an information rich environment. The results of this study may be beneficial to standard setters and regulators as they establish financial reporting disclosures. The study‘s findings may also facilitate the design of more effective decision aids tailored to the decision styles of investors. The Securities and Exchange Commission (SEC) is charged with ensuring that the investing public has adequate information with which to make sound decisions. The combined efforts of the SEC and the Financial Accounting Standards Board (FASB) have resulted in financial reporting disclosures that are often recognized as the most extensive in the world. Given this, the philosophy of the US securities regulators and standard setters appears to be that more disclosure is always better. However, researchers in cognitive psychology and other disciplines have found evidence to the contrary. For example, Schroder, Driver, and Streufert (1967) in their book Human Information Processing argue that too much information may lead

Carolyn S. Payne
38
to a decline in decision quality. Furthermore, studies in accounting literature have yielded mixed results about the ability of individuals to process large amounts of information, and the question of how much information is optimal in an investing context remains unanswered. A review of the information overload literature across the management disciplines, including accounting, reveals a gap in the research. Eppler and Mengis (2004) found that the main theme of accounting studies thus far has been the impact of overload on decision quality or accuracy for matters regarding budgeting decisions or predictions of bankruptcy. It appears that little consideration has been given to the external users of accounting information. Additionally, previous studies have used students as a proxy for decision makers rather than real investors. Bloomfield, Libby, and Nelson (2003) found that students tended toward anchoring in their analysis of companies. It is unclear whether this was because of inexperience or information overload. Iselin (1988) also found that experience had a significant effect on decision time and accuracy. The present study will address these limitations by examining authentic external financial statement users, using information pieces that they would typically use in their decision making, in an internet based experiment. Prior research has found complexity of the information as well as the cognitive complexity of the individual to be factors in the amount of information that can be processed before reaching overload. The fact that professional financial statement users continue to call for additional information seems to negate the need for this type of research. However, both accounting and psychological research have found that information users are not reliable judges of how much information is optimal. The open environment of accounting and the complexity of the information add to the likelihood of users experiencing information overload The widespread availability of free and cheap information on publicly traded companies along with the low cost of online stock trading has created a new investing environment. Barber and Odean (2001) have studied the trend of investors turning to online trading. In 1998, 37% of all retail (non-institutional) trading was done online and the number has grown and continues to grow. While the wealthy continue to seek the personal financial adviser, others are replacing the expert adviser with technology. The low transaction fee per online trade is very appealing to the investors sensitive to the high commissions. Barber and Odean (2001, 45) note ―A critical -and largely unexplored- research question is how this different environment affects the decision-making of investors.‖ The authors offer concern that this environment may bolster the overconfidence of online investors by providing an illusion of knowledge and control. They indicate that several studies have revealed that in the presence of large amounts of information, decision-makers‘ confidence in the accuracy of their decisions grows faster than their accuracy. It has been estimated that investors have three billion pieces of information available free of charge, 280 billion pieces if they are willing to pay. In a prior study Barber and Odean found that investors switching from phone-based to online trading tend to trade more actively and more speculatively than before. In yet another study, they found that investors, who trade more actively, tend to earn lower returns. Furthermore, Dreman (2004) lists information overload among other factors that cause investors to rely on affect or emotion including the errant decision-making in the IPO bubble. Therefore, it appears that investment decisions are not being made based on proper analysis of investment alternatives. Casey (1982) notes evidence from a number of disciplines that information overload is likely to occur if data loads are not managed. He further notes that if the decision accuracy of financial statements users is negatively affected by accounting information, then the role of the accountant will be devalued. As the number of novice investors winging it on their own continues to increase, standard-setters will continue in their struggle to provide relevant information in a format that they can use effectively. Standard setters have a difficult challenge in trying to meet the information needs of the professional analysts who want more and the novice investors who may be using what is already available to their own detriment. Koonce and Mercer (2005) advise that accounting researchers must look to cognitive psychology for the keys to addressing the financial reporting issues that we now face. The proposed study examines how investors behave in the current environment of information overload. The study draws on decision theory to help explain why individual behavior may vary from investor to investor.
Relevance and Significance
Though there has been very limited application of cognitive psychology to accounting information research, several accountants have recognized the need. Revsine (1970) was concerned about the complex and ever expanding dimensionality of accounting. He noted that ―statement users require abstract conceptual skills in order to perceive and develop the complex relationships among variables necessary for effective decision-making‖ (Revsine 1970, 707). He went on to say that it is difficult for accountants to implement an optimal environment for financial decision making, because they

Are Investors able to Effectively use the Vast Amounts of Information Available on Publicly Traded Companies? A Decision Theory Approach to Investor Information Analysis
39
do not know how complex the current environment is and how great the variety of users. Johnson (1970) pointed out that the only direct use of accounting is to forecast, and that if the information is not beneficial for forecasting, then we have lost some of the value of the profession. Others have questioned the very future of accounting unless we learn to understand the information needs of decision makers (Wheeler 1970). Braendle and Noll (2005) debated the necessity of additional mandatory disclosure especially the Sarbanes Oxley Act of 2002 (SOA). Recognizing that SOA was created because of information asymmetry between suppliers and users of financial information, they questioned whether investors could use the additional required information given their cognitive limitations and bounded rationality. The authors concluded instead that legislators should regulate and monitor the current information so as to ensure its accuracy rather than requiring more. These commentators seem to agree that better information is better than more information. Information overload has been a concern to some disciplines for a very long time. However, it appears that few accounting researchers have actually noted its existence and its affect on some users of accounting information. The increasing complexity of the current information rich investing environment and the trend of novice investors entering the field, seem to demand additional research. This study is important because it offers additional understanding of the factors contributing to information overload among investors. The remainder of this paper is organized as follows. Section II discusses the theory, the framework for the research, and proposed hypotheses. Section III outlines the experiment design and proposed methodology.
II. THEORY AND HYPOTHESES
This chapter discusses the literature relevant to decision style theory and information overload. Human information processing and the inverted U hypothesis are also discussed. A synthesis of these theories supported by prior research form the model for this study. Finally, the proposed hypotheses that will test the model are put forth.
Decision Style Theory
Decision style theory may shed some light on the problem of information overload. The theory holds that people can be classified according to how they gather and use information in making decisions. It may help us to understand when and how information overload happens for different people. The ability to predict information overload before it happens would be invaluable to investors in this information rich environment. Early decision theorists, McKenney and Keen (1974), created a model of cognitive style. They established that individuals differed in the way that they solved problems and that these differences lay in the way that they gathered and evaluated information. Through their research, they identified four styles based on two dichotomies, information gathering (perceptive or receptive) and information evaluation (systematic or intuitive): the perceptive thinkers, who focus on relationships; the receptive thinkers, who are more sensitive to the stimulus itself; the systematic thinkers, who approach a problem by structuring it in such a way that leads to a solution; and the intuitive thinkers, who avoid committing themselves to structure, preferring solution testing and trial-and-error. Building upon the theory of Schroder, et al. (1967), Driver and Mock (1975) pioneered the idea that not only was there is a difference in the amount of information used in the decision making process, but there is also a difference in the number of points of view the data supports (focus). The Driver and Mock model classifies humans into one of five basic styles: decisive, flexible, hierarchic, integrative, or systematic. The decisive style uses a minimal amount of data to form one opinion (unifocus). The flexible style also uses minimal data, but uses it to form more than one opinion (multifocus). The hierarchic style uses large amounts of data to arrive at one opinion. The integrative style uses large amounts of data to generate a multitude of opinions. Finally, the systematic style, which is a hybrid of the integrative and hierarchic, uses high amounts of information and prioritizes the alternatives. The model‘s description of the use of styles can be summarized as follows (Driver, Svensson, Amato and Pate 1996). Everyone has two styles: role style, which reflects how a person thinks he or she ought to behave, and operating style, which is the more natural of the styles. People can easily shift between role and operating styles. The operating style is prevalent when the person is unconcerned about their impact on others and disappears in the absence of concern for others. When pressure is very low or very high, people use a unifocus style. When pressure is moderate, they use a multifocus style. Most people have two styles, one for high/low load and one for moderate load. The most common operating style is decisive and the most common role style is hierarchic. Driver created the Integrative Style Test (IST) for classifying people according to their decision style(s). Alan Rowe and associates (Rowe and Mason 1987, Rowe and Boulgarides 1983), through their many observations of managers, enhanced the Driver model by redefining use of information as cognitive complexity and focus as value orientation. They theorized that the decision process ties together our ability to perceive information, to process that information, and to

Carolyn S. Payne
40
choose what we will do about our understanding of the information. The new model, the Cognitive-Contingency Decision Style model, indicates four decision styles, which are determined by classification into high cognitive complexity (thinking) or low cognitive complexity (action) and either task or people orientation. The analytical style requires verifying and understanding considerable amounts of data and acquires information by careful analysis (thinking and task orientation). The directive style uses limited data and is action and results oriented (action and task orientation). The conceptual style considers many options and future possibilities and acquires information by intuition and discussion with others (thinking and people orientation). Finally, the behavioral style focuses on people who acquire information by sensing, listening and interacting with others (action and people orientation). Alan Rowe created the Decision Style Inventory (DSI) as an instrument to determine a person‘s style. The DSI was created based on the classifications in the Cognitive-Contingency Decision Style Model. The styles are categorized according to their left brained (technical) orientation or their right brained (social) orientation and either tolerance for ambiguity or need for structure. The Cognitive-Contingency Decision Style model refines the role/operative style shifting of the Driver model to style dominance. The level of dominance for a style resembles a bell-shaped curve with the mean being the typical score for each style and levels of intensity being measured by standard deviation from the mean. For example, the mean for the directive style is 75 with a standard deviation of 15. Thus, the style is backup for individuals with scores from 68 to 82, dominant for scores 82 to 90, very dominant for scores from 90 and up, and least preferred for any scores under 68. The levels are defined as follows: least preferred – seldom used, backup –used when the occasion demanded, dominant – used frequently, and very dominant – used almost exclusively in most situations. Rowe and Mason (1987) have described decision style as the hidden factor in the success of managers. They posit that decision style can be used to predict a person‘s success in a particular environment. Additionally, they put forward that alignment of style with environment can be achieved by either passive or active means. Passive alignment is achieved by finding situations where the style and environment are aligned. Active alignment is achieved by changing the decision environment to fit one‘s style. The researchers found that persons reach a level that has been described as euphoric when their style is aligned with the task. However, they also found that an otherwise very competent person can fail in a situation where their style does not align with the task. They concluded that sustaining high performance demands alignment. For example, they found that people with a dominant behavioral and conceptual style simply abhor working with numbers and formulas. They also found that each style generally responds differently to stress. Some styles react by avoiding the situation, while others establish deadlines and plunge in. The Driver and Mock (1975) study was one of the first to test human information processing and decision styles in business decisions. The study consisted of a business game modeled in a manufacturing company. The subjects were 54 MBA students, most of whom had business or military experience. The researchers tested the subjects‘ decision styles and compared them to their use of information and decision speed. In this game, respondents chose the amount of performance feedback they would receive after each production and marketing decision. The authors found that Complex decision makers prefer and effectively use more complete feedback. They also found that Flexible decision makers prefer but are somewhat less able to use effectively moderate complex feedback. Finally, they found that Decisive decision makers become rapidly overloaded and are not able to effectively use complex feedback. They concluded that information load decreases decision speed, especially among Decisive decision makers. However, the researchers did conclude that when decision environments are less complex and rapid processing of information is needed, less complex decision styles outperform more complex styles. The important implications of this theory have been recognized by a great many authors in psychology and within the financial information realm. Though there are variations in the model, the basic theory remains intact. However, it is apparent that the evolution and testing of the models must continue.
Information Overload
Early research, by Schroder, Driver, and Streufert (1967), lead to their development of a model of human information processing. They found that a primary variable in the process is the complexity of the environment. They defined a complex environment as one that has excessively diverse and/or numerous dimensional units of information. The graph of this model resembles an inverted U with an optimal information-processing load being reached when the three components reach critical sum value at the top of the U. The model calls this increasing of environmental complexity development and the subsequent reduction in complexity that causes the tapering off of the U stress. The model is based on the theory that all individuals will process information in the same environment in the same way, but some will use more information than others. In sum, all

Are Investors able to Effectively use the Vast Amounts of Information Available on Publicly Traded Companies? A Decision Theory Approach to Investor Information Analysis
41
persons will reach a point where they will reduce information intake while still maintaining decision quality, but as stimuli continue to excess, decision quality will begin to degrade. This is what these researchers call information overload. Since this initial model, additional research has revealed the existence of other factors and a need for a more highly developed model. Many studies have supported the Schroder, et al. (1967) theory of information overload, confirming that that the performance of an individual correlates positively with the amount of information he or she receives – up to a certain point, then with continuing input rapidly declines. Schick, Gordon, and Haka. (1990) draw upon the work of organization theory to provide a definition of information overload. They determine that information overload occurs for an individual when ―the information processing demands on time to perform interactions and internal calculations exceed the supply or capacity of time available (information processing capacity, IPC) for such processing‖ (Schick et al. 1990, 206). They discovered two possible reasons for variation in IPC among individuals: variations in opinion and development of an improved way of thinking. They concluded that ―for an overloaded individual the major cost associated with obtaining more information may be the opportunity cost of the information ignored‖ (Schick et al. 1990, 207). They recognize that once an individual reaches overload ―a filtering rule becomes critical‖ (Schick et al. 1990, 207). Other researchers also have discovered this filtering agreeing that humans have cognitive limitations and that they will either omit (Vickery and Vickery 1987) or not effectively use (Stewart, Heideman, Moninger, and Reagan-Cirincione 1992) excess input. This is especially true if the assimilation of the information into the decision process requires more effort (Dietrich, Kachelmeier, Kleinmuntz and Linsmeier, 2001, Hunton 2002). In a survey of information overload literature, Edmunds and Morris (2000) found a common theme. It appears that commentators across disciplines are concerned that, in the flood of information available it is sometimes difficult to obtain useful, relevant information. Thus, the problem of having too much information may be that the wrong information gets filtered or ignored.
Summary
These studies have all advanced the research in the area of information overload, however much remains to be learned about decision making processes relative to accounting information. Several studies have studied the use of accounting information and shown support for the inverted U (Shields 1983) or at least information overload (Casey 1980, Snowball 1980, Iselin 1988, Chewning and Harrell 1990, Stocks and Tuttle 1998, Tuttle and Burton 1999, Bloomfield, Libby, and Nelson 2003). Shields (1983) also found demand for information to be a function of the quantity of information available. Chewning and Harrell (1990) found that it is possible to classify decision makers according to the amount of information they are able to effectively process. However, their study did not provide enough cues to induce information overload in all respondents. Stocks and Tuttle (1998) increased the number of cues to nine, but found that even nine cues may not be enough depending on the type of information supplied, whether it is numerical or categorical. Tuttle and Burton (1999) studied accounting students estimating the stock price of hypothetical companies. The researchers found that incentives may have caused respondents to incorporate considerably more cues into their decision than the six cue average. Iselin (1988) added information diversity and experience as factors to the decision making model. He found that both variables had a significant impact on decision accuracy. Based on his findings, he concluded that students are bad proxies for decision makers. Wright (1977) studied decision makers forecasting security price changes using real accounting information. He also noted problems with his student proxies. He found evidence of anchoring and cognitive bias. Bloomfield, Libby and Nelson (2003) studied students in a stock market experiment using real information that an investor might use in an investing decision. These researchers found that there was a tendency for over-reliance and filtering that may have been a result of information overload or just inexperience. Several of the studies used students for decision makers (Stocks and Tuttle 1998, Bloomfield, Libby, and Nelson 2003, Chewning and Harrell 1990, Tuttle and Burton 1999, Wright 1977), some noting possible problems with their results. Additional research is needed to address the limitations of these studies and provide additional understanding into the cause(s) of information overload. Decision style theory has shown some success in classifying individuals according to the way that they demand and process information. A synthesis of the information overload and decision style theories applied to the use of accounting information by actual investors, could prove to be extremely beneficial to accountants in designing information systems for users, but perhaps even more importantly it could prove useful to accounting standard-setting bodies as they determine the optimal disclosure levels of publicly traded companies.
The Research Model
This study proposes to synthesize the areas of information overload and decision style theory. Several information overload studies have shown that demand for information varies directly with the amount of information available. Additionally, several such studies have found correlation between amount of information demanded and decision accuracy. Decision style

Carolyn S. Payne
42
researchers have shown that more complex decision styles demand and are able to effectively use more complex information in their decision process (Driver and Mock 1975, Rowe and Mason 1987, Vasarhelyi, 1977). The work of Rowe and Mason has effectively shown that amount of information and time that decision-makers use in making decisions varies by decision style. Those with a higher tolerance for ambiguity (Analytic and Conceptual) will view more information and take longer to analyze it than their more structured counterparts (Directive and Behavioral). The Directive style has been found to make quick decisions using the least amount of information possible. Additionally, these researchers have found that styles with the left brain orientation (Analytical and Directive) are the best pattern of styles for finance decision making (Rowe and Mason 1987). Therefore, this research interjects decision style into the model and predicts that it is a factor not only in the amount of information demanded, but also decision accuracy. Additional exogenous variables are experience (Iselin, 1988) and decision time (Driver & Mock, 1975).
Hypotheses
This study will test the following hypotheses: H1A: Analytic and Conceptual decision styles will have a higher mean number of items viewed than Directive and Behavioral
styles. H1B: Analytic and Conceptual decision styles will have a higher mean amount of time viewing items than Directive and
Behavioral styles. H2A: Analytic and Directive decision styles will have a higher level of accuracy (smaller mean absolute difference in amount
invested compared with panel of experts mean) than Conceptual and Behavioral styles. H2B: Analytic and Directive decision styles will have a higher level of accuracy (greater mean total return on investment) than
Conceptual and Behavioral styles. H3: Analytic decision style will have the highest mean time in making an investment decision. H4: Directive decision style will have the shortest mean time in making an investment decision.
III. RESEARCH DESIGN AND METHODOLOGY
The hypotheses developed in the previous chapter will be tested using an experimental design. The objective of the experiment is to determine which styles demand more information and which styles make more accurate investment decisions given the information provided. Other studies have listed time and geographic constraints as limitations. This experiment seeks to eliminate those constraints. Based on the suggestion by Schick et al. (1990), this study will not impose any time constraints. Inadvertently, there could still be two types of time constraints. The first would be personal, for example, boredom and/or amount of personal time available. The other could be that the respondents may self-impose constraint because they know that they are being timed. Additionally, other studies have been conducted within one organization or geographic area. Solicitation to respondents will be conducted in such a way that a good geographic dispersion may be obtained. Because other experiments (Chewning and Harrell 1990) have found eight pieces of information insufficient to induce information overload for some respondents, this study extends that number to ten. The ten pieces have been chosen from suggestions by Fertakis (1969), Casey (1980), and Graham (2003). The results will reveal which pieces of information investors are using and how effectively they use them. Also, we will discover the most common decision style among investors and whether information use and accuracy vary with style.
Experimental Procedures
This experiment will be organized as follows. Respondents will be provided a web link to the experiment site where they will be given basic instructions on how the experiment will work. On the next screen respondents will be asked some demographic question. After completing the demographics, they will be presented with background information on a company which represents a potential investment opportunity. They will then choose from a menu of available information (balance sheets, statements of operations, statements of stockholders‘ equity, statements of cash flows, notes to the financial statements, analysts‘ estimates, the stock‘s current beta, historic stock prices and trading volumes, and various financial ratios) to view. They may view each piece of information as long as they would like and they may return to a piece as many times as they would like. They will then be required to enter a hypothetical investment amount from $0 to $10,000.00. The instructions will explain that their alternative investment is a 26 week T-Bill yielding 2.0% and that they should assume they are investing in a normal economy and a normal market. After the investment is entered, respondents will be asked to rank the information pieces that they viewed according to how much they influenced their investment decision. Finally, the

Are Investors able to Effectively use the Vast Amounts of Information Available on Publicly Traded Companies? A Decision Theory Approach to Investor Information Analysis
43
respondents will be asked to answer the 20 question DSI (Rowe and Boulgarides 1983), which will determine their level of intensity for each of the four decision styles. Their personal assessment information will be provided to them as a reward for having completed the experiment. The experiment software will track the amount of time between beginning and final decision, as well as which information was viewed and for how long. The experiment company is Amazon.com, Inc. The name was changed throughout all of the experiment data to Company, Inc. The company was chosen because it was stable and profitable throughout the financial reports and had no known external risk factors that might affect an investment decision. A pilot study will be conducted among faculty and staff at the local college as well as other educators and other professionals in the local area, for the purpose of determining reliability of the data. A minimum of 50 responses will be solicited for this study. These respondents will be asked to provide feedback on any problems they encountered with performance of the software or website and any problems they had understanding questions or instructions. The data collected will be analyzed for validity using Cronbach‘s alpha.
Subjects
Two hundred investors will be solicited from investor clubs and websites frequented by investors.
Dependent Variables
For hypotheses H1A, H3 and H4, the dependent variable is information demand. Information demand is measured two ways. The first measurement is the number of items viewed (1-10). The second measurement is the total amount of time spent viewing information items. For hypothesis H1B, the dependent variable is decision time. Decision time is measured by computer clock. It is the amount of time lapsed from the opening of the first information piece to the submission of the investment amount. For hypotheses H2A and H2B, the dependent variable is decision accuracy. Decision accuracy is measured two ways. The first accuracy measurement is the absolute value of the difference between investment amount and the mean of the panel of experts‘ investment amount. The smallest amount is the most accurate. The panel of experts will consist of at least six solicited investing or accounting experts (security registered representatives, stock brokers, CFPs, CPAs) with at least five years of investing experience. The second accuracy measurement is the amount of money the investment would have returned had it been real. Total return will be calculated as follows. The number of shares purchased is investment amount divided by market price. The change in market price from time of purchase to one year later plus dividends paid per share during the year, quantity times shares purchased gives return on the stock investment. The amount not invested in the stock ($10,000 minus amount invested) will yield a return of 2.0%. The return of both investments totaled gives the respondent‘s total return. The higher amount is the most accurate.
Independent Variables
The independent variable is the decision style of the respondent as measured by the Decision Style Inventory. A definition of decision style will be taken from Rowe and Mason (1987). It is one‘s style of thinking. It defines the type of information that a person prefers to use in decision making, whether they tolerate ambiguity well or require structure. It defines the type of decisions they prefer, whether they like task oriented or people oriented decisions. Decision style is the most preferred style as classified by the DSI, which is measured by the highest relative score on each of the four scales.
Instrument Validity
The instrument used to determine decision style will be Alan Rowe‘s DSI. The objective of the instrument authors in studying decision styles is to examine those factors that contribute to job success and in turn job satisfaction. In measuring a person‘s decision style the instrument determines one‘s preferences when responding to a series of 20 statements. These responses when scored can be used to identify the person‘s decision style (Ideation & Starbird, LTD, 1990). The instrument has been found to have well over 90% face validity when conducting follow-up interviews of respondents (Mann 1982, as cited in Ideation & Starbird, LTD, 1990). Furthermore, test-retest reliability has been reported at 70% (Rowe and Boulgarides 1983, as cited in Ideation & Starbird, LTD, 1990).

Carolyn S. Payne
44
This instrument was also chosen because of its high correlation with the very reliable Myers Briggs Type Indicator (MBTI). The MBTI is highly recognized as a valid instrument for testing personality types. Myers, McCaulley, Quenk, and Hammer (1998), writers of the MBTI manual, estimated that over 4,000 research studies, journal articles, and dissertations have used the instrument. In addition, several studies have used parts of the Jungian type preferences to successfully test decision styles (McKenney and Keen 1974, Henderson and Nutt 1980, Rowe and Mason 1987, Hunt, Krzystofiak, Meindl, and Yousry 1989). Rowe and Mason (1987) cross validated the two instruments and found parts of them to be highly correlated. The S/N dichotomy classifies peoples as to how they gather information and the T/F dichotomy classifies them as to how they use the information in the decision making process. These MBTI attributes align with the purpose of the DSI.
Data Collection and Analysis
Data will be collected in an SQL database by the experiment software directly from the respondents‘ input. After a sufficient number of respondents have completed the experiment, data analysis will begin. The data will be analyzed using SPSS software running various statistical tests. ANOVA will be used for hypothesis testing and various other statistical methods will be used for descriptive analysis.
REFERENCES
Agnew, J., and Szykman, L. 2005. Asset allocation and information overload: The influence of information display, asset choice, and investor experience. The Journal of Behavioral Finance, 6(2): 57-70.
Barber, B.,and Odean, T. 2001. The internet and the investor. Journal of Economic Perspectives, 15(1), 41-54. Bloomfield, R., Libby, R., and Nelson, M. 2003. Do investors overrely on old elements of the earnings time series?
Contemporary Accounting Research, 20(1), 1-31. Braendle, U., and Noll, J. 2005. A fig leaf for the naked corporation. Journal of Management and Governance, 9, 79-99. Casey, Jr., C. 1980. Variation in accounting information load: The effect on loan officers‘ predictions of bankruptcy. The
Accounting Review, 55(1), 36-49. -----. 1982. Coping with information overload: The need for empirical research. Cost and Management: 31-37. Chewning, Jr., E., and Harrell, A. 1990. The effect of information load on decision makers‘ cue utilization levels and decision
quality in a financial distress decision task. Accounting, Organizations, and Society, 15(6), 527-542. Dietrich, J., Kachelmeier, S., Kleinmuntz, D., and Linsmeier, T. 2001. Market efficiency, bounded rationality, and
supplemental business reporting disclosures. Journal of Accounting Research, 39(2): 243-268. Dreman, D. 2004. The influence of affect on investor decision-making. The Journal of Behavioral Finance, 5(2): 70-74. Driver, M., and Mock, T. 1975. Human information processing, decision style theory, and accounting information systems. The
Accounting Review, 50(3): 490-508. -----, Svensson, K., Amato, R., and Pate, L. 1996. A human information processing approach to strategic change. International
Studies of Management & Organization, 26(1): 41-58. Edmunds, A. & Morris, A. 2000. The problem of information overload in business organizations: A review of the literature.
International Journal of Information Management, 20: 17-28. Eppler, M., and Mengis, J. 2004. The concept of information overload: a review of literature from organization science,
accounting, marketing, MIS, and related disciplines. The Information Society, 20: 324-344. Fertakis, J. 1969. On communication, understanding, and relevance in accounting reporting. The Accounting Review, 44(4):
680-691. Graham, B. 2003. The intelligent investor (Rev. ed. comm. by J. Zweig). New York, NY: HarperCollins Publishers, Inc. Henderson, J., and Nutt, P. 1980. The influence of decision style on decision making behavior. Management Science, 26(4):
371-386. Hunt, R., Krzystofiak, F., Meindl, J., and Yousry, A. 1989. Cognitive style and decision making. Organizational Behavior and
Human Decision Processes 44: 436-453. Hunton, J. 2002. Blending information and communication technology with accounting research. Accounting Horizons, 16(1):
55-67. Ideation & Starbird, LTD. 1990. Decision style inventory theory, use, and validity, a professional supplement to the decision
style inventory program. Dumfries, VA: Author. Iselin, R. E., 1988. The effects of information load and information diversity on decision quality in a structured decision task.
Accounting, Organizations and Society, 147:164. Jacoby. J. 1984. Perspectives on information overload. The Journal of Consumer Research, 10(40), 432-435.

Are Investors able to Effectively use the Vast Amounts of Information Available on Publicly Traded Companies? A Decision Theory Approach to Investor Information Analysis
45
Jensen, R. 1970. Empirical evidence from the behavioral sciences: Fish out of water. The Accounting Review 45(3): 502-508. Johnson, O. 1970. Towards an ―Events‖ theory of accounting. The Accounting Review, 45(4): 641-653. Koonce, L., and Mercer, M. 2005. Using psychology theories in archival financial accounting research. Journal of Accounting
Literature, 24: 175-214 McKenney, J., and Keen, P. 1974. How managers‘ minds work. Harvard Business Review: 79-90. Myers, I., McCaulley, M., Quenk, N., and Hammer, A. 1998. The MBTI manual (3rd ed.). United States: Consulting
Psychologists Press, Inc. Revsine, L. 1970. Data expansion and conceptual structure. The Accounting Review, 45(4): 704-711. Rowe, A, and Boulgarides, J. 1983. Decision Styles - A Perspective. Leadership & Organization Development
Journal, 4(4): 3. Rowe, A. and Mason, R. 1987. Managing with style: A guide to understanding, assessing, and improving decision making.
San Fransisco, CA: Jossey-Bass Inc., Publishers. Schick, A., Gordon, L., & Haka, S. 1990. Information overload: A temporal approach. Accounting, Organizations and Society,
15(3): 199-220. Schroder, H., Driver, M., and Streufert, S. 1967. Human information processing. United States: Holt, Rinehart and Winston,
Inc. Shields, M. 1983. Effects of information supply and demand on judgment accuracy: Evidence from corporate managers. The
Accounting Review, 58(2): 284-303. Snowball, D. 1979. Information load and accounting reports: Too much, too little or just right? Cost and management: 22-28. -----. 1980. Some effects of accounting expertise and information load: An empirical study. Accounting, Organizations and
Society, 5(3): 323-338. Stewart, T., Heideman, K., Moninger, W., and Reagan-Cirincione, P. 1992. Effects of improved information on the
components of skill in weather forecasting. Organizational Behavior & Human Decision Processes, 53(2): 107-134. Stocks, M., and Tuttle, B. 1998. An examination of information presentation effects on financial distress prediction. Advances
in Accounting Information Systems, 6: 107-128. Tuttle, B., and Burton, F. G. 1999. The effects of a modest incentive on information overload in an investment analysis task.
Accounting, Organizations and Society, 24: 673-687. Wheeler, J. 1970. Accounting theory and research in perspective. The Accounting Review, 45(1): 1-10. Wright, W. 1977. Financial information processing models: An empirical study. The Accounting Review, 52(3): 676-689. Vasarhelyi, M. 1977. Man-Machine planning systems: A cognitive style examination of interactive decision making. Journal of
Accounting Research, 15(1): 138-153. Vickery, B. C., and Vickery, A. 1987. Information science in theory and practice. London: Butterworths.

Oraluck Arsiraphongphisit, Mohamed Ariff and Dev Prasad
46
SHARE PRICE REACTION TO DEBT ISSUANCE AND CAPITAL STRUCTURE IN AUSTRALIA
Oraluck Arsiraphongphisit1, Mohamed Ariff2 and Dev Prasad3 Monash University1, Bond University2 and University of Massachusetts Lowell3
ABSTRACT
This study expands the earlier research relating to the optimal capital structure propositions, by studying the impact of debt on
share prices as a result of the changes in the debt-equity ratio. This paper expects to expand our understanding by
postulating that there are actually 2 effects at work. The first is the signaling effect on share prices by announcement of 'debt'
as the chosen means of financing. The second effect being the movement of the firm's debt-equity ratio relative to its industry
median debt-equity ratio. It is argued that there would be an increase (decrease) in abnormal share returns when debt
financing moves capital structure of a firm closer to (away from) the industry median debt-equity ratio. The abnormal returns
observed at the disclosure time of debt issues are found to be significantly correlated with the capital structure changes. Thus,
this study expects to fill a gap in the literature by showing the relationship between capital structure changes and the
abnormal share returns at the time of debt issues. The results of this study is also expected to help policy makers at the
macro level,and at the firm level as they make decisions as to the appropriate means of financing while trying to shake off the
effects of the current financial crisis.
INTRODUCTION
This study expands the earlier research relating to the optimal capital structure propositions, by studying the impact of debt on share prices as a result of the changes in the debt-equity ratio. This paper expects to expand our understanding by postulating that there are actually 2 effects at work. The first is the signaling effect on share prices by announcement of 'debt' as the chosen means of financing. The second effect being the movement of the firm's debt-equity ratio relative to its industry median debt-equity ratio. It is argued that there would be an increase (decrease) in abnormal share returns when debt financing moves capital structure of a firm closer to (away from) the industry median debt-equity ratio. The study finds that abnormal returns observed at the disclosure time of debt issues are significantly correlated with the capital structure changes. Thus, this study expects to fill a gap in the literature by showing the relationship between capital structure changes and the abnormal share returns at the time of debt issues. The results of this study is also expected to help policy makers at the macro level,and at the firm level as they make decisions as to the appropriate means of financing while trying to shake off the effects of the current financial crisis. The remainder of the paper is structured as follows. The next section contains a brief restatement of literature on relevant capital structure theories and hypotheses. Thereafter, there are two sections: one concerned with data and research methodology followed by a section which summarizes the findings of the study. Finally, a conclusion of the study is provided in the last section. This study reports evidence in support of the hypotheses that the changes in capital structure – following debt issues – are correlated significantly with share price changes.
BACKGROUND AND LITERATURE REVIEW
The well-entrenched optimal capital structure theory of Modigliani-Miller (MM) suggests that a firm should gain/lose tax-shield value when its debt financing activities adjust its capital structure towards/away from its optimal leverage. Industry practitioners and institutional lenders generally use industry average or median debt-equity ratio as a proxy for the yet-specified optimal ratio for a firm. This practice is in fact found in U.S. studies by Hovakimian et al. [2001] and Flannery and Rangan [2006], reporting that firms tend to move their leverage toward a target ratio over time. Could this relative capital structure to industry be the optimal capital structure measure? Despite extensive studies on the effects of debt financing announcements on share value, little evidence exists to support a direct test since most employ standard event studies. There is as yet an attempt to relate the impact of debt announcements of a firm to its respective industry capital structure norm. This paper takes a different direction in research by using an idea of

Share Price Reaction to Debt Issuance and Capital Structure in Australia
47
relative capital structure, which is defined as changes in capital structure relative to industry median ratio arising from changes in debt financing decisions. Hull [1999] and Ariff and Lau [1996] examined this issue obliquely using ordinary rights issues, not debt issues. This idea is based on a view that, if capital rationing by fund providers is a hard constraint faced by management of a firm, it is arguably correct to assume that, at the time of financing decision disclosures, fund providers are likely to revalue the share prices of a firm based on a firm‘s capital structure relative to its industry capital structure. Such fund providers can be either stockholder at the time of equity offers or debt-holder at the time of debt issues. Therefore, debt-holders‘ views of a firm‘s capital structure quality are likely to result in changes in share prices as documented by Baker and Wurgler [2002] showing that capital structure decisions influence share prices in the U.S. This paper aims to observe if changes in capital structure relative to industry benchmark are in fact directly correlated with the well-documented announcement effects of debt financing. In essence, the paper reports whether markets perceive an industry median debt-equity ratio as a useful benchmark when evaluating a firm‘s value following its debt financing decision. Debt markets have increasingly been growing in the past decade. As the Australian share market is efficient and is the eighth largest capital market with a substantial number of debt issues, this market is ideal for this study. Also, no study exits on bond issue effect on share prices. To further understand an effect of debt level on share value, this paper also tests the extent to which measured level of changes in capital structure significantly affect share values, starting from 5 to 20 percent changes to capital structure. A regression analysis incorporating the effect of debt financing on leverage relative to industry benchmark, is also done to ensure the robustness of the findings.
Theoretical Perspectives
Several theories in the literature offer a mixed bag of directions for capital structure decisions. The optimal capital structure by Modigliani and Miller [1958; 1961] was welcomed by researchers, and frequently fuelled a debate as to whether capital structure would affect firm value. Pecking order was later introduced by Donaldson [1961]. It gained credibility and was extended by Myers [1984], Myers and Majluf [1984], and Miller and Rock [1985]. It suggests that managers prefer to finance projects employing retained earnings, debt, and equity in that order. Although these different financial policies and environment can determine a firm‘s capital structure, some evidence show that firms behave as if they have target capital structure over a period longer than a year and gradually move toward it (Shyam-Sunder and Myer, 19993; Titman and Tsyplakov, 2005; Kayhan and titman, 2007). A variation of the target capital structure concept so-called dynamic capital structure was also emphasized by Ozkan [2001]. Ozkan [2001] observed that firms have long-term target capital structure and tend to correct their capital structure relatively fast. The deviation from target capital structure may act as a predictor of whether a firm will prefer debt or equity in the future (Hovakimian et al. 2001). Directly relevant to this paper, there is an extensive body of literature examining share price reaction to security issues, particularly in the U.S. Most of these studies on straight debt issues have been conducted in the U.S. with results that are inconclusive. Interestingly, results obtained from European countries (Brounen and Eichholtz, 2001; Arrondo and Gomez-Anson, 2003) show that the market responds positively to straight debt announcements.
Optimal Capital Structure Theory
Optimal capital structure theory attributed to Modigliani-Miller paradigm suggests there exists an optimal leverage at which a firm obtains a maximum value by minimizing its weighted average costs of capital, given the market imperfections, among others, from tax-deductibility of interest costs from pre-tax incomes of firms. The proposition asserts that the value of a firm with tax-deductible interest is equal to the value of an all-equity firm as enhanced by the tax savings. That is,
DVV cUL ; where V is firm value, L represents a levered firm, U represents an unlevered firm, D is debt levels, and
c is the corporate tax rate.
By further modifying Modigliani and Miller‘s [1958] assumptions and by introducing the agency costs idea of Jensen and Meckling4 [1976], finance researchers have discovered that financial distress and bankruptcy costs may also provide an economic rationale for the existence of an optimal capital structure.5 If parties to the relationship are utility maximizers, the management may not act in the best interests of the principal, given the widespread separation of ownership and control of
3 Shyam-Sunder and Myer [1999] show a simple form of target adjustment model which is expressed in a regression model. ∆D it = a+bTA(Dit*-Dit-1)+eit, where Dit* is the
target debt level for firm i at time t. bTA is the target-adjustment coefficient, as a sample-wide constant. 4 Agency costs are defined by Jensen and Meckling [1976] as the costs incurred when the interests of managers are not aligned with those of stockholders and
bondholders. Thus, a firm with a diffuse capital structure is more likely to incur higher agency costs and hence have lower profitability than firms with less diffuse structures. 5 Interestingly, Black and Scholes‘ [1973] Option Theory could also be used to study this aspect of equity value as the call value of a debt-taking firm.

Oraluck Arsiraphongphisit, Mohamed Ariff and Dev Prasad
48
firms listed and traded in the share exchanges. Agency costs reflect a degree of a conflict of interest between parties, and affect equity prices negatively. Hence, the optimal value may be determined at the point where the total agency cost is the lowest. This is thus the final element in the equation. CostsAgencyPVCostsBankruptcyPVShieldsTaxPVVV UL (1)
The equation expresses the value of a levered firm in terms of the value of unlevered firms (Modigliani and Miller, 1958; 1963) adjusted for tax benefits (Miller, 1977), bankruptcy costs (Robicheck and Myers, 1966; Baxter, 1967), and agency costs (Jensen and Meckling, 1976). An important notion is that tax benefits initially increase as a firm takes on more debt (and move capital structure closer to the optimal level). Once a firm reaches a leverage position where the costs of using debt offsets its tax shield advantages, it appears to achieve the optimal capital structure with maximal firm value. Further increase in debt financing beyond the optimal ratio would increase the bankruptcy, agency costs and decrease the tax shield value. Thus, these financing decisions should devalue the share prices. Issuing equity that changes the leverage below the optimal ratio would similarly increase the cost of equity capital, thus devalue the share prices. Movements away from the optimum are deemed value-decreasing changes to capital structure while capital structure adjustments towards the optimal point are deemed value-increasing changes. It can be argued that, capital structure improvements via more equity funding may lead to improved valuation of a firm, and hence lead to a positive price effect. Despite a sound theory and extensive research on optimal capital structure, the literature is not helpful in specifying the level at which capital structure becomes optimal. Hence, there exists a need to specify the optimal point for market practitioners. Literature suggests that fund providers may use an industry average capital structure as the optimal target for a given industry thus a firm. Therefore, if the industry ratio is used as a benchmark for fund provider‘s decisions on optimality, it is feasible to employ a firm‘s capital structure relative to the capital structure of its industry to observe whether the market is indeed valuing the firm in the manner suggested by the theory. Many studies had attempted to explain the existence of optimal leverage. The most common tests are determination of whether capital structure can be explained by variables driving the trade-off between debt and equity and whether these variables are related negatively or positively to the levels of debt taken. The more relevant evidence to this research is studies related to industry effects. For example, Ariff and Lau [1996] report that debt-equity ratio is stable over time within industries unless affected by changes in tax or bankruptcy law and this ratio is approximately 0.40 to 0.65 in Atlantic countries and Australia and about 0.70 to 0.85 in East and South Asia. Leary and Roberts [2005] later show that firms rebalance their capital structure continuously in order to maintain leverage within an optimal range. Titman and Tsyplakov [2005] show that capital structure may vary over a relatively large range, depending on costs and benefits of debt financing while MacKay and Phillips [2005] document a slow adjustment toward industry means. Based on optimal capital structure theory, issuing debt is denoted as a movement toward the optimum. It follows that debt issues generally convey favourable news and result in positive share price reactions as they increase a firm‘s financial leverage, i.e. when the current leverage position is below the optimum. Despite extensive research, the classic optimal capital structure predictions have yet been directly verified, especially in Australian context. Studies largely revolve around identifying variables driving the trade-off between debt and equity or demonstrating the use of capital structure in different industries. A number of studies report evidence that firms appear to set a target leverage and either gradually or rapidly move towards it (e.g. Leary and Roberts, 2005; Flannery and Rangan, 2006; Kayhan and Titman, 2007). The evidence revealed not only that capital structure is different across industries (Love and Wickramanayake, 1996; Hall et al. 2000), but also that firms rely on industry leverage in designing their capital structure policies (Damodaran, 2001). Given these evidence, it can be implied that firms regard industry ratio as desirable capital structure. Although Ghosh and Cai [1999] find that firms tend to move toward their industry mean over time, a direct empirical test on optimal capital structure effect from debt based on this notion has not been attempted.
Signaling Theory
Signaling theory has been popular in the literature in an endeavor to explain market reaction to management decisions. This is needed to measure the extent of price change at the time a given financing decision is announced. The theory suggests that managers are privy to inside information and are thus at a considerable informational advantage compared to outsiders

Share Price Reaction to Debt Issuance and Capital Structure in Australia
49
regarding a firm‘s activities, thus its value, investment opportunities and so on. Given this informational advantage, Ross [1977] posits that managers have an incentive to convey information about their firm‘s prospect to the market through their financing activities. Later, Leland and Pyle [1977] posit that the level of share ownership retained by managers is a signal that managers are ‗willing to invest in their own project‘ and given that they have superior knowledge regarding future cash flows and prospects of the firm, the signal is positive (particularly given that they are potentially increasing their diversification risk by colloquially speaking ‗retaining all their eggs in one basket‘). Rational investors would thus perceive the level of managers‘ share ownership as a credible signal regarding a firm‘s quality (Masulis and Korwar, 1986). Negative share price responses are therefore predicted should managers issue new share, which in turn reduce their ownership portion of the firm. An alternative information asymmetry explanation is advanced by Miller and Rock [1985], namely implied cash flow change hypothesis. As in Ross [1977] and Leland and Pyle [1977], this hypothesis suggests that a firm‘s quality is associated with a firm‘s performance. It predicts that a firm tends to raise new funds when its cash flow is weakening. Thus, an unexpected new outside financing, either equity or debt, conveys bad news to the market as to the firm as facing cash flow problems and the risk of not meeting its future obligations as when they fall due. Unlike the previous signaling hypothesis, Miller and Rock [1985] predict a negative association between share price and either equity or debt offerings. In summary, asymmetric information theory generally predicts debt announcements are favorable and equity announcements are unfavorable news.
Research Hypotheses
Despite an extensive use of industry ratio as a benchmark both in academic teaching of corporate finance and industry practices, a direct test of relative capital structure changes on firm value is needed. Given the themes adopted in the brief review of the literature, the test hypotheses are as follows.
H1: There is a positive correlation between cumulative abnormal returns, CARs, (change in share value) and capital structure that moves closer to capital structure industry median, i.e. a firm increases its value if its capital structure moves closer to its industry median.
This is due to the firm gaining tax shield value, when moving from a low capital structure towards the optimum.
H2: There is a negative correlation between CARs (change in share value) and capital structure that moves away from capital structure industry median, i.e. a firm decreases its value if its capital structure moves away from its industry median.
In this case, the firm would lose tax shield value for increasing its capital structure from its near-optimal position before the debt financing. By grouping the sample of events into different levels of capital structure changes (more than 5 percent and 10 percent; more than 10 percent and 20 percent; and more than 20 percent) a further hypothesis is done as to whether the significant changes in share value, if any, accrue at one or more levels of capital structure changes.
H3: Changes in capital structure between more than 5 percent and more than 20 percent are significantly correlated with CARs associated with the changes, i.e. the debt financing decisions.
The maintained hypothesis is that all levels of changes in capital structure will have significant changes to the value of a firm, but some create a greater impact. The final test is on whether the theory-suggested seven variables are correlated with the observed abnormal returns. This is done as a joint test by regressing all seven variables against CARs.
H4: Firm-specific variables used in a regression test are all significantly correlated with the observed CARs (for the debt issue events). .
DATA AND METHODOLOGY
The test is designed to examine the relationship between capital structure changes from debt issue financing and firm value changes. In particular, the study attempts to determine whether the directional changes in capital structure level arising from

Oraluck Arsiraphongphisit, Mohamed Ariff and Dev Prasad
50
debt financing, relative to the industry benchmark, are related to firm value changes. If so, at what levels capital structure adjustments affect firm value. Doing that requires debt issue announcements.
Data and Variables
Firm specific data: The initial sample consisted of market announcements of 77 straight debt issues. These announcements were made by firms listed on the Australian Stock Exchange (ASX) and announced and issued these securities between 1991 and 2004. The timeframe in which the economy was relatively stable despite Asian crisis which affected Australian economy the least among Asia-pacific region. Announcements of interest must have a clear public disclosure date and must not concurrently have other potential confounding events such as dividends, earnings, etc. However, announcements made by firms over the first year of listing were excluded. In addition, only events that experienced at least a five percent change in capital structure were included in the study. For each observation, event date, daily share price and relevant market and financial data were collected. The primary source of data for event dates and market data were DatAnalysis, SIRCA, and Bloomberg databases. The financial data were collected from various sources, including Connect4, DatAnalysis, and Aspect Financial Analysis databases. To test the effect of different degree of capital structure changes arising from debt issues on firm value, the sample was later classified into three groups. These groups include those having percentage changes in capital structure between: (i) more than 5 percent and 10 percent; (ii) more than 10 percent and 20 percent; and (iii) more than 20 percent. Conventional theory and practice identify debt and equity as the only funding sources available to the firm, and the ratio between debt and equity is used to denote the long term capital structure of the firm. The use of financial items, including debt and equity items from financial statements of a firm is based on evidence that there is the relation between accounting numbers and security returns or firm value (Riff and Thompson, 1998; Nissim and Penman, 2003). The standard accounting measure designates leverage ratio as generally arising from either financing or operating activities. As this study focuses on capital structure, it therefore bases the ratio on a traditional view, i.e. leverage arises from financing activities. Consistent with prior studies, this study employs the ratio of debt to equity (D/E) as a proxy for capital structure or leverage of a firm. While debt is book value of all interest bearing debt, equity is measured by market capitalization of a firm. The interest bearing debt is typically bank loans, bonds, and commercial papers. It distinguishes financing liabilities from operating liabilities. The use of market capitalization as a proxy for the market value of equity is consistent with many previous studies (e.g. Ertimur et al., 2003; Copeland et al., 2004; Beaver et al., 2005). Debt-Equity industry ratio: Apart from collecting firm-specific data, this study requires the calculation of a debt-equity industry benchmark as Australian debt-equity industry ratio is not readily available. Since the median debt-equity ratio (MedDE) is commonly used as an industry capital structure ratio (Hull, 1999), it was also used as a proxy for an industry benchmark in this study. Consistent with the industry classification system currently employed by the ASX, this study used the Global Industry Classification Standard‘s (GICS) system to classify industry sectors. An industry thus consisted of all firms within the same industry sector. Financial information required for computing industry ratios were obtained from Aspect Financial Analysis, DatAnalysis, and Sirca commercial databases.
Test Models
The methodology used in this study was developed based on capital structure theory predictions, i.e. the effects of directional capital structure changes relative to the industry benchmark on firm value. The relationship between directional changes in capital structure and firm value is expressed in a regression equation as follows:
ititj
j
jiit eXbbZ 4
10
, (2)
where tiZ , is three-day CAR6 over the on-event window as a proxy for firm value change, 0ib is the intercept term which is
significant if the left out factors are important, is summation operator for j : 1, 2, 3, and 4 event types, tie , is the residual
6 The calculation of CARs was conducted within a standard event study framework as described in Brown and Warner [1980; 1985]. In this study, the market adjusted
returns are employed as abnormal returns.

Share Price Reaction to Debt Issuance and Capital Structure in Australia
51
term, jb is coefficients of independent dummy variables, and 1X , 2X , 3X , and 4X are dummy variables which are
explained in detail as follow. For each event, the respective D/E ratio was evaluated against a firm‘s respective industry benchmark and the direction of changes in capital structure relative to industry benchmark was identified. These directions could be classified into four groups according to optimal capital structure theory. These groups correspond with the dummy variables specified in the above regression. Exhibit 1 provides a graphical illustration of the dummy variables.
Exhibit 1: Directional Changes of Capital Structure Relative to Industry Median
1X and 2X represent firms whose capital structure moves away from industry benchmark while
3X and 4X represent those whose capital structure moves closer to industry benchmark.
Once events were classified into the above groups, the effect of a directional change in capital structure relative to the industry median (to overcome non-normality) of each observation, firm value were observed. This analysis was based on theoretical predictions derived from optimal capital structure theory, which posits that (please refer to Exhibit 1):
(i) An increase in D/E ratio away from the industry benchmark will decrease firm value (X1 and X2). (ii) An increase in D/E ratio closer to the industry benchmark will increase firm value (X3 and X4).
In other words, the first statement is considered value-decreasing activities whereas the second statement is deemed value-increasing activities. If the analysis proved that the event conformed to the theoretical prediction, a dummy variable of one was assigned to the observation. If the event was not as predicted by the theory, a dummy variable of zero was assigned. Based on the above explanation, X1 and X2: a dummy variable, takes value of 1 if an event is a value-decreasing capital structure adjustment event, i.e. an
event that increased D/E ratio away from the industry ratio and resulted in negative CARs, 0 otherwise, and X3 and X4: a dummy variable, takes value of 1 if an event is a value-increasing capital structure adjustment event, i.e. an
event that increased D/E ratio closer to the industry ratio and resulted in positive CARs, 0 otherwise. The regression was first performed employing the overall sample. To test whether different levels of capital adjustments affected firm value differently, the events were later classified into groups, varying between more than 5 percent and more than 20 percent according to their percentage change in D/E ratio as explained previously. Examination of the variables used in this study revealed that the measured values (mean, median and standard deviations) are approximately similar to those reported on these variables in this market. The regression was then performed on each group. The problem of heteroskedasticity was corrected by performing White‘s heteroskedasticity-corrected (HC) standard errors.
0
X1
Optimal Debt/Equity (Industry benchmark)
Debt/Equity
Firm value
X2
X3
X4
Value-decreasing group or ‗Away from‘ group
Value-increasing group or ‗Closer to‘ group

Oraluck Arsiraphongphisit, Mohamed Ariff and Dev Prasad
52
To identify firm-specific variables correlated with price changes, a cross-sectional regression analysis is performed. The measured changes in value over the entire test event and the three-day CARs of each group of events are regressed against factors known to influence CARs. The regression equation is expressed as follows:
TAXSHCTAFMRUNRUNVARISSIZECHCSCAR 76543210 (3)
where, CARs are the cumulative abnormal returns; CHCS are changes in a firm‘s financial leverage as measured by the amount of issuing firm‘s interest-bearing debt over market capitalization of a firm; ISSIZE is the planned proceeds (dollar amount) of each offer divided by the pre-announcement market capitalization of a firm; VAR is variance of daily share return over day -52 and -2; RUN is the common share return run-up over day -52 and -2 as measured by its CAR; MRUN is the market index return run-up over day -52 and -2 as measured by its CAR; CTAF is directional changes in a firm‘s capital structure – it is a dummy variable that takes value of 1 if the event is considered value increasing(ed) event, i.e. ratio of D/E of a firm moves closer to its respective industry median, 0 otherwise; and TAXSH is the planned proceeds of the offering multiplied by corporate tax rate corresponding to the year of each announcement.
CHCS, VAR, TAXSH, and CTAF are motivated by theoretical considerations and found in earlier separate studies as relevant. These variables are used as proxies to test capital structure related theories, including optimal capital structure, agency, and signaling hypotheses. While CHCS, TAXSH, and CTAF are expected to have positive correlation with CARs, VAR is expected to be negatively correlated with CARs. ISSIZE and RUN are used to control for firm characteristics, MRUN is used to control for the market condition effect. The significance of CARs in this study is tested using conventional t-test statistics discussed in Brown and Warner [1985] and Corrado and Zivney [1992]. The significance tests for CARs however are calculated slightly differently.7 The independent t-test statistic is used to test whether there are significant differences in the means of CARs over different windows between value-increasing and value-decreasing groups. The standard F-test is employed to test the significance of the overall model. .
RESULTS
Relative Capital Structure and Share Prices
Prior to tests of relative capital structure, CARs associated with the events were analyzed. Out of 77 events, 26 announcements were value-increasing events and 51 announcements were value-decreasing events. The CARs surrounding
the announcements of interest are presented in Exhibit 2.
Exhibit 2: Cumulative Abnormal Returns (CARs) Surrounding Straight Debt Announcements of Value-Increasing and Value-
Decreasing Firms
Cumulative Periods
Value-Increasing Group (26)
Value-Decreasing Group (51)
Value-Increasing Versus Value-Decreasing Group
CARs t- statistics CARs t- statistics Diff. between
CARs t-stat z-stat
-10,+10 0.705 0.594 1.473 1.196 -0.768 1.241 -0.522
-1,0 0.409 11.311*** 0.055 0.220 0.354 0.515 -0.619
-1,+1 1.085 2.292** 0.093 0.431 0.992 2.025** -1.820*
+2,+10 -0.109 -0.122 1.571 1.638 -1.681 -0.144 -0.189
***, **, and * indicate statistical significance at the 0.01, 0.05 and 0.1 levels, respectively.
The results show that firms in value-increasing group generally experienced positive and significant CARs two and three days around announcement day. CARs for the test periods of days -1 to 0 and days -1 to +1 show a statistically significant positive association between announcement of interest and market reaction. In particular, the CARs for these periods are positive at
7 The t-statistics of cumulative abnormal return for any specific interval is
CAR
lk
SEE
CAR ),( while CARSEE is equal to )var(AART , where CARSEE is the
standard error of estimates of CARs of observations within the event period, )var(AAR is variance of AAR, k is the beginning of the event period, l is the end of the
event period, and T is the event period or│k-l│+1.

Share Price Reaction to Debt Issuance and Capital Structure in Australia
53
0.409 and 1.085 percent, respectively. While the first interval is statistically significant at 0.1 level with t-value of 11.311, the latter two intervals are statistically significant at 0.05 levels with t-values of 2.292. However, CARs for the post-event period of days +2 to +10 is negative and not statistically significant. Although CARs for the same test period of the value-decreasing group are positive, they are not statistically significant. When observing the difference between the CARs of the two groups, both value-increasing and value-decreasing groups generally experience positive CARs around announcement day. However, CARs of the value-increasing group for small event periods of two and three day around the announcement day show a larger degree of positive market reactions to the announcements of interest than those of the value-decreasing group for the same periods. Also, it is noted that the strength of the sign for the period of days -1 to 0 is less profound than those for period of days -1 to +1. Specifically, CAR differences for the event periods of days -1 to 0 and -1 to +1 are 0.354 percent and 0.992 percent, respectively. However, only the latter interval is statistically significant. While the t-tests show that CARs differences between the value-increasing and value-decreasing groups for the period of days -1 to +1 is statistically significant at 0.05 level with t-value of 2.025, the z-tests indicate that the differences for this period is statistically significant at 0.10 level with z-values of -1.820. The results obtained from analysis of CARs of value-increasing and value-decreasing groups provide a good basis for further analysis employing relative capital structure approach. To examine the relationship between firm value and capital structure movements relative to a firm‘s respective capital structure industry ratio, the three-day CARs were regressed against dummy variables representing the association between theoretical predictions and directional changes in capital structure as explained in research methodology section. Exhibit 3 provides the results of testing the effects of directional changes in capital structure relative to industry benchmark on firm value
Exhibit 3: Effects of Different Degree Capital Structure Changes Relative to Industry Benchmark on Firm Value
Regressions were estimated for different groups of sample. To test the effect of different degree of capital structure changes on firm value, the sample was classified into three groups, according to levels of capital structure changes. These groups include those having percentage changes in capital structure between: (i) more than 5 percent and 10 percent; (ii) more than 10 percent and 20 percent; and (iii) more than 20 percent. The regression model is:
ititj
j
jiit eXbbZ 4
10
where, Zit is three-day CAR as a proxy for firm value; bi0 is the intercept term which is significant if the left out factors are important; is summation operator for j : 1, 2, 3, and 4 event types; eit is the residual term, bj is coefficients of independent dummy variables; X1 and X2 are dummy variables, take value of 1 if an event is a value-decreasing capital structure adjustment event, i.e. an event that increased D/E ratio away from the industry ratio and resulted in negative CARs, 0 otherwise; X3 and X4 are dummy variables, take value of 1 if an event is a value-increasing capital structure adjustment event, i.e. an event that increased D/E ratio closer to the industry ratio and resulted in positive CARs, 0 otherwise.

Oraluck Arsiraphongphisit, Mohamed Ariff and Dev Prasad
54
Event types Hypotheses
Results from different filters
A B C D
All sample (n = 77)
5%<∆D/E ≤10% (n = 22)
10%<∆D/E≤20% (n = 26)
>20% (n = 29 )
Model evaluation H0 = the
model is not significance.
Adjusted R2 0.219 -0.022 0.438 0.377
F value 8.122 0.984 7.499 5.039
Sig. 0.000*** 0.392 0.001*** 0.007***
X1: Value-decreasing group, i.e. D/E ratio moves away from Med
< 0 -0.424 -0.275 -0.586 -0.527
t-value -3.943 -1.240 -3.507 -3.099
Sig. 0.000*** 0.230 0.002*** 0.005***
X2: Value-decreasing group, i.e. D/E moves away from Med
< 0 -0.291 n/a -0.146 -0.475
t -value -2.820 n/a -0.946 -2.902
Sig. 0.006*** n/a 0.354 0.008***
X3: Value-increasing group, i.e. D/E moves closer to Med
> 0 0.048 0.096 0.220 -0.084
t -value 0.444 0.433 1.317 -0.503
Sig. 0.658 0.670 0.201 0.620
X4: Value-increasing group, i.e. D/E moves closer to Med
> 0 0.016 0.007 0.012 0.029
t -value 3.301 0.792 2.781 2.884
Sig. 0.001*** 0.438 0.011** 0.008***
***, **, and * indicate statistical significance at the 0.01, 0.05 and 0.1 levels, respectively.
Column A of Exhibit 3 shows that the model based on the overall sample of 77 observations is robust with an F value of 8.122 and adjusted R2 of 21.9 percent. The signs of coefficients show that X1 and X2 (value-decreasing groups) are negatively correlated with CARs whereas X3 and X4 (value-increasing groups) are positively correlated with CARs. The test parameters of these variables are statistically significant at 0.01 level with t-values of -3.943, -2.820, 0.444, and 3.301 for X1, X2, X3, and X4, respectively. These results are consistent with the optimal capital structure predictions in which a firm with a capital structure moving away from its relative optimal capital structure (industry median ratio) will experience a decrease in firm value and vice versa. This can be considered a direct test of the optimal capital structure theory and the results support hypotheses H1 and H2. To test whether different levels of capital adjustments affect firm value differently, the observations were classified into three groups, varying between more than 5 percent and more than 20 percent, according to their percentage change in D/E ratios as stated previously. Columns B to D of Exhibit 3 reveal test results for different degree of changes in capital structure. Although the sample size for each group appears to be small, it meets marginally the assumptions underlying the Central Limit Theorem.8 As can be seen from the exhibit, the relationship between capital structure adjustment and firm value is statistically significant when firms change their capital structure between more than 10 percent. Interestingly, however, adjustments of capital structure below 10 percent generally do not provide firms with statistically significant changes in their firm value. Noticeable, most of the firms listed on the ASX, raised a small proportion of funds, relative to their current capital structure, through debt, reflecting in changes mostly in between 5 percent and 20 percent changes in capital structure after debt issuance. Only 29 firms increased their capital structure through debt financing. This observation reflects a firm‘s caution about investor‘s common perception, i.e. firms with exceptionally high proportion of debt are risky and would become unattractive for investors to hold and trade. Thus, due to a limited number of firms raising a large proportion of fund via debt,
8 According to the Central Limit Theorem, the sampling distributions of means approach normal as the sample size increases and the sample size larger than 20 or 30 is
sufficient for the normal distribution to provide an acceptable approximation and allow for inference about population parameters (Tabachnick and Fidell, 2001; Studenmund, 2001).
Med
Med
Med
Med

Share Price Reaction to Debt Issuance and Capital Structure in Australia
55
this paper can only conclude that changing capital structure via debt financing more than 10 percent will affect firm value significantly. However, the sample size does not allow for a further test, i.e. at what extent of debt financing (beyond 20 percent change) where borrowings will no longer provide firms with statistically significant changes in their firm value. To conclude, the statistical significances of the models evident in columns C and D of Exhibit 3 support H3, i.e. changes in capital structure between more than 10 percent are significantly correlated with CARs associated with the debt financing decisions.
Firm-Specific Variables
In addition to heteroskedasticity check, the ensuing tests needed corrections for multicollinearity. The multicollinearity problem is handled by measuring the variance inflation factor (VIF).9 Exhibit 4 shows the results of cross-sectional regressions for straight debt announcements.
Exhibit 4: Cross-Sectional Regression Results
The regression model is:
TAXSHCTAFMRUNRUNVARISSIZECHCSCAR 76543210
where, CARs are the cumulative abnormal returns; CHCS are changes in a firm‘s financial leverage as measured by the amount of issuing firm‘s interest-bearing debt over market capitalization of a firm; ISSIZE is the planned proceeds (dollar amount) of each offer divided by the pre-announcement market capitalization of a firm; VAR is variance of daily share return over day -52 and -2; RUN is the common share return run-up over day -52 and -2 as measured by its CAR; MRUN is the market index return run-up over day -52 and -2 as measured by its CAR; CTAF is directional changes in a firm‘s capital structure – it is a dummy variable that takes value of 1 if the event is considered value increasing(ed) event, i.e. ratio of D/E of a firm moves closer to its respective industry median, 0 otherwise; and TAXSH is the planned proceeds of the offering multiplied by corporate tax rate corresponding to the year of each announcement. The regression models are estimated using OLS model. The tax shield is measured in dollar amounts whereas other values, except for the dummy variable, are measured in percentages. Panels A and B provide cross-sectional models of abnormal period return over days -10 and +10 and days -1 and +1, respectively.
(Constant) CHCS ISSIZE VAR RUN MRUN CTAF TAXSH
Panel A: CARs (-10,+10)
B -27.333 4.757 1.574 -0.049 0.225 -0.391 1.728 0.000
t-value -1.234 1.154 1.449 -1.872 3.396 -2.713 1.039 0.022
Sig. 0.224 0.256 0.155 0.068* 0.002*** 0.010*** 0.305 0.983
Adjusted R2 0.331
df 7
F-test 4.321
Sig. 0.001***
Panel B: CARs (-1,+1)
B -34.379 4.636 1.533 -1.564 0.102 0.086 2.316 0.000
t-value -2.774 2.475 2.143 -1.645 2.684 1.018 2.172 0.805
Sig. 0.008*** 0.018** 0.038** 0.108 0.011** 0.315 0.036** 0.426
Adjusted R2 0.168
df 7
F-test 2.352
Sig. 0.041**
***, ** and * indicate statistical significance at the 0.01, 0.05 and 0.1 levels, respectively.
Panel A of Exhibit 4 shows the regression results based on twenty-one-day (-10,+10) CARs as having significant fit of the model with F-value of 4.321 (p<.01) and an adjusted R2 value of 0.331. The signs of coefficients of the tested independent
9 According to Gujarati [2003], as a rule of thumb, the VIF value of more than 10 indicates the potential multicollinearity problem an the closer is the tolerant value, the
greater degree of multicollinearity. The VIF value in all models in this study, however, below the suggested level and the tolerant values are closer to 1. All independent variables were therefore remained in the regression models.

Oraluck Arsiraphongphisit, Mohamed Ariff and Dev Prasad
56
variables in the model are consistent with theoretical predictions, i.e. changes in a firm‘s capital structure, directional changes in a firm‘s capital structure, and tax shield are positively correlated with the CARs whereas variance of share returns is negatively correlated with the CARs. Among these variables, only the variance of share returns is significant in explaining the CARs with t-value of -1.872 (p<.1). Additionally, the model demonstrates that among the control variables, including issue size, share return ‗run-up‘ and market index return ‗run-up‘, share return ‗run-up‘ and market index return ‗run-up‘ are statistically significant with t-values of 3.396 (p<.01), and -2.713 (p<.01), respectively. The findings reported in Panel B of Exhibit 4 show a significant relation between the CARs and potential explanatory variables, given the F-value of 2.352 (p<.05) and an adjusted R2 value of 0.168. Similar to the model in Panel A, the sign of the tested coefficients are consistent with the hypothesized directions. Additionally, this model shows that directional changes in a firm‘s capital structure and directional changes in a firm‘s capital structure significantly influence variations in the CARs with t-values of 2.475 (p<.05) and 2.12 (p<.05), respectively. Additionally, two control variables, i.e. issue size and share return ‗run-up‘, are also significant in explaining the CARs with the t-values of 2.143 (p<.05) and 2.684 (p<.05), respectively. The regression results lend some support to the tested hypotheses. For instance, variance of share returns in the model based on twenty-one-day (-10,+10) shows significant relationship with CARs. Also, changes in a firm‘s capital structure and directional changes in a firm‘s capital structure in the model based on three-day (-1,+1) CARs contribute significantly to explaining the respective CARs. Although the signs of the coefficients for tax shield in both Models A and B are positive and consistent with theoretical prediction, this variable is not statistically significant in both models. This evidence is consistent with a study by Best [1997], who examined share price reaction to U.S. straight debt announcements in the context of default risk.
CONCLUSIONS
Although received theories suggest the existence of optimal capital structure, they have not specified the optimal level to-date. Academics and practitioners have relied heavily on industry mean or median as their benchmark. This study therefore aim to verify whether there exists the relationship between changes in capital structure relative to industry benchmark and the change in value of a firm; also, the extent to which changes in capital structure affect firm value. The research design is centered on the concept of relative capital structure by comparing a firm‘s debt-equity ratio to its respective industry median. The price impact is identified by measuring the cumulative abnormal returns at the time of capital structure changes. The results indicate that market participants appear to use information on changes in capital structure of firms at the time of announcements and also react quickly upon the information. The findings show that the observed share price effect is positive for firms whose capital structure moves closer to their industry median, and is negative for those whose capital structure moves away from industry median. Apart from the effects of pecking order or signaling hypotheses, abnormal gains/losses to firms documented in this paper, are consistent with the predictions of optimal capital structure theory and the tax-shield value gains and losses. Thus, the market appears to perceive the industry median as an appropriate capital structure benchmark. The significant difference between CARs of firms adjusting their capital structure closer to their benchmark and those of firms adjusting their leverage away from their benchmark further indicates market recognition of the benchmark, i.e. industry median debt-equity ratio. A regression analysis later confirms the robustness of this finding as it shows that markets perceive industry median debt-equity ratio as an important determinant of share value. These tests of effects of capital structure changes relative to industry benchmark, which is industry median in this study, yielded a direct test of optimal capital structure. The results of this study therefore could serve as a practical guideline on capital structure decisions at times of financing for Australian firms.
REFERENCES
Allen, D.E. "Further Australian Evidence on the Pecking Order Hypothesis." In: Bos, T., and T. A. Fetherston (Eds). Research in International Business and Finance, Studies in the Financial Markets of the Pacific Basin, 11, Part B. JAI Press: Greenwich, Conn. and London (1994), pp. 165-182.
Ariff, M., and K.C.H, Lau. "Relative Capital Structure and Firm Value." The International Journal of Finance, 8 (1996), pp. 391-410.
Baker, M., and J. Wurgler. "Market Timing and Capital Structure." The Journal of Finance, 57 (2002), pp. 1-32. Beaver, W.H., M.F. Mcnichols, and J-W. Rhie. "Have Financial Statements Becomes Less Informative? Evidience from the
Ability of Financial Ratio to Predict Bankruptcy." Review of Accounting Studies, 10 (2005), pp. 93-122.

Share Price Reaction to Debt Issuance and Capital Structure in Australia
57
Bradley, M., G.A. Jarrell, and E.H. Kim. "On the Existence of an Optimal Capital Structure: Theory and Evidence." Journal of Finance, 39 (1984), pp. 857-878.
Brown, S.J., and J.B. Warner. "Measuring Security Price Performance." Journal of Financial Economics, 8 (1980), pp. 205-258.
Brown, S.J., and J.B. Warner. "Using Daily Stock Returns: The Case of Event Studies." Journal of Financial Economics, 14 (1985), pp. 3-31.
Coase, R. "The Nature of the Firm." Economica, 4 (1937), pp. 386-405. Copeland, T., A. Dolgoff, and A. Moel. "The Role of Expectations in Explaning the Cross-Section of Stock Returns." Review of
Accounting Studies (2004), pp. 149-188. Corrado, C.J., and T.L. Zivney. "The Specification and Power of the Sign Test in Event Study Hypothesis Tests Using Daily
Stock Returns." Journal of Financial and Quantitative Analysis, 27 (1992), pp. 465-478. Damodaran, A. Corporate Finance: Theory and Practice. USA: John Wiley, 2001. Ertimur, Y., J. Livnat, and M. Martikainen. "Differential Market Reactions to Revenue and Expense Surprises." Review of
Accounting Studies, 8 (2003), pp. 185-211. Flannery, M.J., and K.P. Rangan. "Partial Adjustment toward Target Capital Structures." Journal of Financial Economics, 79
(2006), pp. 469-506. Galai, D., and R.W. Masulis. "The Option Pricing Model and the Risk Factor of Stock." Journal of Financial Economics, 3
(1976), pp. 53-81. Ghosh, A., and F. Cai. "Capital structure: New evidence of optimality and pecking order theory." American Business Review,
17 (1999), pp. 32-38. Gujarati, D.N. Basic Econometrics. Boston: McGraw Hill, 2003. Hall, G., P. Hutchinson, and N. Michaelas. "Industry Effects on the Determinants of Unquoted Smes' Capital Structure."
International Journal of the Economics of Business, 7 (2000), pp. 297-312. Hovakimian, A., G. Hovakimian, and H. Tehranian, H. "Determinants of Target Capital Structure: The Case of Dual Debt and
Equity Issues." Journal of Financial Economics, 71 (2004), pp. 517-540. Hovakimian, A., T. Opler, and S. Titman. "The Debt-Equity Choice." Journal of Financial Quantitative Analysis, 36 (2001), pp.
1-24. Hull, R.M. "Leverage Ratios, Industry Norms, and Stock Price Reaction: An Empirical Investigation of Stock-for-Debt
Transactions." Financial Management, 28 (1999), pp. 32-45. Jensen, M.C. "Agency Costs of Free Cash Flow, Corporate Finance, and Takeovers." American Economic Review, 76 (1986),
pp. 323-329. Jensen, M.C., and W.H. Meckling. "Theory of the Firm: Managerial Behavior, Agency Costs and Ownership Structure."
Journal of Financial Economics, 3 (1976), pp. 305-360. Kayhan, A., and S. Titman. "Firms' Histories and Their Capital Structure." Journal of Financial Economics, 83 (2007), pp. 1-32. Kraus, A., and R. Litzenberger. "A State-Preference Model of Optimal Financial Leverage." Journal of Finance (1973), pp.
911-922. Leary, M.T., M.R. Roberts. "Do Firms Rebalance Their Capital Structures?." Journal of Finance, 60 (2005), pp. 2575-2619. Leland, H.E., and D.H. Pyle. "Informational Asymmetries, Financial Structure, and Financial Intermediation." Journal of
Finance, 32 (1977), pp. 371-387. Love, R.W., and J. Wickramanayake. Industry Effects on the Capital Structure Decisions of Australian Companies. 9th
Australasian Banking and Finance Conference: Australia, 1996. Mackay, P., and G.M. Phillips. "How Does Industry Affect Firm Financial Structure?." Review of Financial Studies, 18 (2005),
pp. 1433-1466. Mackie-Mason, J.K. "Do Taxes Affect Corporate Financing Decisions?." Journal of Finance, 45 (1990), pp. 1471-1493. Masulis, R. The Debt/Equity Choice. U.S.A.: Ballinger Publishing Company, 1988. Modigliani, F., and M.H. Miller. "The Cost of Capital, Corporation Finance and the Theory of Investment." The American
Economic Review, 48 (1958), pp. 261-297. Myers, S.C. "Determinants of Corporate Borrowing." Journal of Financial Economics, 5 (1977), pp. 147-175. Myers, S.C., and N.S. Majluf, N.S. "Corporate Financing and Investment Decisions When Firms Have Information That
Investors Do Not Have." Journal of Financial Economics, 18 (1984), pp. 187-221. Prasad, D., G.D. Bruton, and A.G. Merikas. "An Empirical Study of the Capital Structure of Industries in the European
Community." Journal of International Financial Markets, Institutions and Money, 6 (1996), pp. 125-140. Rajan, R.G., and L. Zingales. "What Do We Know About Capital Structure? Some Evidence from International Data." Journal
of Finance, 50 (1995), pp. 1421-1460. Robichek, A., and S. Myers. "Problems in the Theory of Optimal Capital Structure." Journal of Financial and Quantitative
Analysis (1966), pp. 1-35.

Oraluck Arsiraphongphisit, Mohamed Ariff and Dev Prasad
58
Ross, S. "The Determination of Financial Structure: The Incentive Signaling Approach." Bell Journal of Economics, 8 (1977), pp. 23-40.
Smith, A. The Wealth of Nations. New York: Cannon, 1776. Smith, C.W.J., and J.B. Warner. "On Financial Contracting: An Analysis of Bond Covenants." Journal of Financial Economics,
7 (1979), pp. 117-161. Stulz, R. "Managerial Discretion and Optimal Financing Policies." Journal of Financial Economics, 26 (1990), pp. 3-27. Titman, S., and R. Wessels. "The Determinants of Capital Structure Choice." The Journal of Finance, 43 (1988), pp. 1-19. Welch, I. "Capital Structure and Stock Returns." Journal of Political Economy, 112 (2004), pp. 106-131.

Crisis and Actions: How a Firm Surviving Challenges
59
CRISIS AND ACTIONS: HOW A FIRM SURVIVING CHALLENGES
Jifu Wang, Donna Stringer and Peng Yu University of Houston, Victoria
ABSTRACT
How to survive and remain in competition in the marketplace when facing a firm crisis, and the modalities of managing such
crisis, has become a hot topic in both academic circles and the business executive world. In this article, we reviewed literature
on the corporate crises, and discussed some of the turnaround strategies to deal primarily with the firm restructuring issues,
using SCP as an example.
LITERATURE REVIEW
How to survive and remain in competition in the marketplace when facing a firm crisis, and the modalities of managing such crisis, has become a hot topic in both academic circles and the business executive world. The sources of corporate crises have been fervently debated and widely researched (Drysdale, 2000; Mako, 2001). A dominant theme is the poorly executed initiatives for liberalizing financial markets (Drysdale, 2000), though their effects outside the banking sector have not been adequately articulated. While the technology transfer deals often included technical training, and allowed the local firms to develop strong manufacturing skills with high quality levels, most recipient firms had limited in-house skills for continuous process and product development and for market expansion. Firms firms had to compete with not only other domestic firms, who also moved into similar businesses, but also with other firms in the region. The supply of prior generation technologies and know-how grew rapidly, as the equipment makers, Japanese firms (the regional leaders in new technologies), and the NIC competitors and partners of Japanese firms, all offered their older products and intellectual properties to the East Asian firms (Yoshida, 2001). However, the demand for the products made from these technologies grew slowly, or sometimes even declined, as the recipient firms lacked capability for developing new product uses and as the newer Western technologies drove the next-generation products. When the Asian firms rapidly expanded their prior generation capabilities, often as an intermediate step striving to gain organizational learning for advanced capabilities and technologies, their margins fell and the losses escalated. The debts used to finance the imports of technology, equipment, and training, became unsustainable, undermining, in turn, the health of the financial institutions that had extended loans to them (Mako, 2001). Several elements of the East Asian work culture system compounded the effects of the crises. The corporate governance systems in East Asia were grossly inadequate and allowed the growth in debt capital without confirming the viability of the projects (Mako, 2001). The fears of losing attractive technology transfer and foreign collaboration deals to the competitors meant that the firms rarely adopted a gradual expansion process, which would have allowed for the developmental learning and the generation of internal cash flows to fund additional investments. The large corporate groups and state-owned enterprises found few qualified parts and service vendors available to support the acquired manufacturing facilities. They invested vertically into development of components, assembly, and packaging, to realize the desired competitive advantages over the other regional competitors, thereby spreading their limited resources very thin. The vast majority of the family-owned firms, who sought to provide the ancillary components and product distribution services to the larger corporate groups, lacked capability for substantive innovations in either input or marketing sides. Monitoring of the loans in both cases was left to the banking sector, where personal relationships, corruption, government pressures and guarantees, and inadequate information guided the decision-making (Mako, 2001). Even as the expected fiscal revenue targets failed to materialize, the governments sought to bailout the failing institutions and to enhance social service expenditures, by taking additional domestic and international debts. These elements reached crisis proportions by 1997, destroying the confidence of the global investors, hindering national credit ratings, and raising risk-adjusted cost of capital (Haley, 2000; Mako, 2001). The turnaround strategies have involved at least some restructuring of the unsustainable debt (Haley, 2000). The firms have sold off non-core businesses and assets to retire high interest debt, restructured less profitable or loss-incurring businesses,

Jifu Wang, Donna Stringer and Peng Yu
60
and cut down on capital, research or labor costs, to enhance their earnings and debt-service capacity. Many have negotiated deals to convert fixed-interest debt into variable-returns equity, or to extend the terms of debt repayment, or to cut interest rate below the risk-adjusted cost of capital. The creditor-driven deals have relied on variants of the "London approach", designed by the Bank of England to deal with the UK recession of the mid-1970s (Mako, 2001). The approach seeks to avoid liquidation of viable debtors to minimize losses to creditors, by providing for continuing financial support (Mako, 2001). In addition to the financial restructuring, a renewed vision recognizing the significance of technology and innovation for continued success in a global knowledge-based economy has emerged (Yoshida, 2001). Information technology, especially as it relates to electronic commerce, is being seen as critical for rationalizing manufacturing processes and boosting revenues. The large Asian companies are investing more heavily in technology start-ups, and the governments are also stimulating venture capital to support diversified technology base including information technology and life sciences (Yoshida, 2001). Both corporations and governments are also joining ranks to develop public and private educational programs and specialized institutes, to fill the shortage of qualified personnel, promote IT literacy, and reduce the digital divide, and are wooing foreign-trained home nationals back from overseas for the leadership role. To recapitulate, both the roots of corporate crises and the turnaround strategies in Asia have involved a joint role of the government and the market forces. Over-ambitious goals and weak capability contributed to the crises, which the firms and the governments have sought to resolve through better organizational and technological development. While the literature offers us a general awareness of the crises and the turnaround options, there is an additional need to identify the specific sources of managerial concerns and modalities of the turnaround. We next look at how government policy and market dynamics contributed to crises at SCP Group in China, and the modalities of its turnaround strategies, for gaining a better understanding of the process dynamics. Market orientation captures organizational learning about all aspects of the environment to focus on both expressed and latent customer needs, and also directs attention to monitoring and learning from competitors' capabilities and plans (Kohli & Jaworski, 1990). However, using a sample of small and mid-sized firms in Thailand, Grewal and Tansuhaj (2001) show that the market orientation capabilities had a negative impact on the firms‘ performance after the East Asian crisis. The crisis reflects new, unique market situations. If the firms do not specifically develop ―strategic flexibility‖ to learn about and respond to new market situations, they are likely to be on the wrong side of the crisis (Grewal & Tansuhaj, 2001). A lack of understanding exists in the role of leadership influencing the turnaround efforts through management of strategic flexibility. McGrath & MacMillan (2000) and Gupta, MacMillan & Surie (2003) underscore the effectiveness of ―entrepreneurial leadership‖ for surviving and growing amidst volatile, hyper-competitive effects of globalization. Gupta, MacMillan, & Surie (2003) observe that the effective entrepreneurial leaders are able to enact both a scenario worthy of persistence, as well as a cast committed to the goal of strategic value creation. They identify five key roles of entrepreneurial leadership: (1) framing the challenge, (2) absorbing the paralyzing effects of uncertainty, (3) clearing the path for execution, (4) building commitment of the cast, and (5) specifying limits of action. These five key roles can broadly be mapped onto Khandwalla‘s adaptation modes (2002). In scenario enactment, the role of absorbing uncertainty is common; framing the challenge role involves an entrepreneurial mode, and clearing the path for execution calls for facilitating an access to differentiated expertise needed to pursue the framed challenge. Similarly, in cast enactment, the building commitment role can be facilitated using an employee-oriented mode, and integrative mechanisms such as shared values can be the vehicles for specifying limits of action. Taken together, scenario and cast enactment drive strategic flexibility by giving the firms agility and versatility to respond to the new market situations. In this article, we examine how entrepreneurial leadership aids in fostering strategic flexibility and thereby allows the technology-focused firm to overcome the crisis conditions resulting from poor management system. We embed our study in the East Asian context, and specifically in the Chinese market. China is not only the biggest emerging market exposed to globalization, but also has significant trade and investment linkages with the rest of the world, which makes adaptation even more challenging for Chinese firms. A case study is a valuable approach to understanding the firm-level responses to crisis and is adopted here as the research methodology.
NATURE OF CRISES AND STRATEGIC PROACTIVE ACTION:
In a cold and windy day on February 20, 1987, Yong-Xing Chen, the former deputy mayor at Shouguang County of Shandong Province, took office as a manager at Shouguang Paper Plant, which suffered a loss of 110 million dollars. This small paper plant was close to bankruptcy. According to Chen, the feeling he got when starting working in the plant was boring and

Crisis and Actions: How a Firm Surviving Challenges
61
suffocating: production was planned internally without considering the demand of the market; the plant relied on the state supply for raw materials; the amount of products was determined by state allocation and order without any marketing mechanism; in internal compensation, people get their wages, though very low, every month with no differentiation with inputs.
Having worked with the top management team in firm analysis, it was clear that the major factors causing the firm crisis are the lack of proper enterprise management system and the old "iron rice bowl" system in which people got equal pay no matter how much efforts and distribution people devoted.
Change of Compensation System
In our interview, Chen indicated that he had two choices at that time: change or die and he made up his mind on the first choice. In a night in April 1987, Chen called a meeting for managers at the middle and above level for the whole plant and solicited their commitment in breaking the "iron rice bowl" system. In the meeting the managers built consensus that they needed to change right away the three pillars for management system: personnel, labor and compensation. The follow-up implementation of the management change was to introduce the competition mechanism into the plant: people get their jobs only after showing the competency instead of relying on the old state cadre system in which people get their assignment of ranks before they come to the plant. Thus, the plant broke the three boundaries: the boundary separating national cadres and workers, the boundary differentiating tenured workers and contracted workers and the boundary of setting people apart simply by a diploma. In reforming the compensation system, the plant eliminated the old state equal pay system and salary, bonus and rewards are distributed based on outputs and contribution. As a result, four workers were promoted to the plant top management team because of their capabilities. Thirty two workers were promoted to middle level managerial positions and five incompetent managers were removed from their managerial positions. With the reform of With the transformation of the compensation system, the workers at the Shouguang Paper Plant turned the feeling of crisis into a sense of responsibility, thus showing unprecedented enthusiasm. They They re-launched the suspended "half-built" 1760 Project of paper machine network funded by a loan of more than 1000 million. After hard work and joint efforts of workers and managers, the paper machine network was finally successfully installed and tested and started to provide the paper products that the market demand. The paper plant survived. Three months after Chen took the office, the Shouguang Plant started to generate profit and from the second half of 1987, Shouguang embarked on the track of a virtuous circle for operation. By 1989, Shouguang achieve output of 2, 375 million dollars with 5.24 million dollars of profits. The paper plant was listed in the first place for its economic benefits on the province's 114 papermaking enterprises.
Change of Property Rights
Chen indicated in the interview that the reform of the three pillars of the compensation system could mobilize the enthusiasm of the people in the plant, but it can not fundamentally solve the operational mechanism of the management system, which came out of the old planning mode for the state-owned enterprises. To grow and develop the plant, it required a prompt reform of the management system to meet the market demand and this reform calls for transformation of property rights. 1993, the paper plant was permitted to be one of the first 50 pilot enterprises in Shandong Province to change their plant ownership. September that year, the plant successfully completed the share-holding system, and the Shandong Shouguang Paper (Group) Co., Ltd. (SSC) was set up, the first such an endeavor in China to transform state ownership to stock holding enterprise. To meet the requirements for the listing of enterprises in the stock market, SSC changed its name to Shandong Chenming Paper Holdings Ltd. (SCP) December 6, 1996. May 26, 1997 SCP was listed in Shenzhen Stock Exchange and raised 546 million yuan, with 10 times the price-earnings ratio. SSC has become the nation's first B-share listed companies in the paper industry. SCP seized the advantage that the State allowed some of the B-share listed companies to issue A-share shocks to the public on November 20, 2000 at the Shenzhen Stock Exchange and thus raise another 7, 000 million shares of 1.456 billion yuan.

Jifu Wang, Donna Stringer and Peng Yu
62
Within four years, SCP raised a total of 2 billion yuan of funds and thus provided sufficient fund for SCP to be engaged in large-scale transformation in technology.
Change of Organizational Culture and Management System
In order to build a group company with multiple competitive competences and succeed in the global competition, SCP adopted a low-cost expansion strategy in merging and acquiring state owned enterprises that we in financial and/or managerial difficulties. The key to SCP‘s success was that SCP has been able to acquire these firms and instill SCP‘s value and culture into these firms. In the last 10 years, the SCP has acquired and reorganized11 troubled state-owned enterprises, and thus created a well-known "SCP Phenomenon‖ in China that every acquired firm has been turned into a successful player later in the group. Chen, the chairman, recalled that most firms acquired were heavily in debt with chaotic enterprise management but their equipments and technology were advanced judged with international standard. They had great potential and rooms for future development. first step towards reform was the change of staffing. Chen advocated that managers who cannot do well in their job need to be removed from the leadership positions, which will be provided to those can. Chen requested the human resource department to make a detailed plan for optimizing staffing in accordance with the demand for organizational structure in each production department. , Workshop to optimize the portfolio. Those managers who failed the assessments of their leading capabilities and performance were asked to choose frontline manufacturing positions. Chen pointed out that a group enterprise needs sound and strict management to keep the firm on track. Otherwise, the subsidiary firms will be like the mess of without any combat effectiveness. People in most of the acquired firms were from the traditional state-owned enterprises with a deep-rooted concept of a planned economy. Only through scientific and strict manage systems, can these employees join their efforts and aligned their energy for organizational goals.
Change of Environment and Create Green Industry
When talking about protection of the environment since paper production generate huge amount of polluted water, Chen the group chairman, indicated that environmental protection is a "life project" and should give first priority because without hard efforts, the group enterprise will be difficult to survive. Chen also pointed out that the future SCP is not only for Chna, but also for the world. SCP must be equipped with global perspective for its strategic positioning so that SCP can seize new opportunities, meet new challenges, become one of the leading global papermaking enterprises. " Environmental protection is the most difficult problem facing the paper industry. has invested more than 10 billion dollars in its projects for treating polluted water before it was recycled or discharged. SCP has established comprehensive emission standards, and was the first one in the paper industry to obtain the ISO 14001 environmental certification. Chen is committed to SCP "green industry" concept, As of Environmental Protection's "life project" task. igorously develop a circular economy, relying on scientific and technological innovation and implementation for a cleaner production and waste exchange. SCP has initially achieved recycling and maximizing the utilization of reusable resources in its resources-products - reproduction recycle resources-based economy and has met the world‘s advanced consumption standards.
Globalization
Globalization is, in fact, the globalization of the market, and market globalization is actually equal to the globalization of competition. Thus, globalization is the process by which the world‘s economy is transformed from a set of national and regional markets into a set of markets that operate without regard to national boundaries. With greater freedom and choice come intensifying competition, diminishing control, accelerating product cycles, and deepening uncertainty. The new global economy is one in which most companies, unable to rely on patronage or position for protection, are permanently vulnerable. The scale of the global opportunities, the complexity of the competitive arena, and the relentless performance discipline imposed by the capital markets will force companies either to specialize and become world class and world scale in their chosen field, or exit. The top management team in SCP knew very well the significance of making changes from domestic producer to global player. In March 2005, Jiangxi Subsidiary of SCP started its successful production line with an annual output of 350,000 tons of lightweight coated paper. This plant is a joint venture with four international parties: SCP, the New Mau Lam of South Korea,

Crisis and Actions: How a Firm Surviving Challenges
63
Sappi of South Africa, and the International Financial Organization. SCP has the holding position. This move marked the beginning of its globalization efforts for SCP. This plant has attracted nearly on billion U.S. dollars of foreign investment capital, and thus further optimized SCP‘s product mix and collection. The significance of the joint efforts lies in the introduction of advanced international management system and operational modalities for the SCP‘s global conventions. October 28, 2005, Shandong Chenming Industrial Park witnessed the special ceremony for, specialty paper-stone-laying project, which is another joint venture between SCP and Aernuowei Andean from France. Aernuowei France is the world's largest specialty paper production enterprise. The investment of the joint venture was 590 million yuan with an expected annual output of 100,000 tons of specialty paper and with target sales income of 1.28 billion yuan. Project was completed in March 2007 for production. As the end of 2005, SCP‘s production increased to nearly four million tons, four times than that in 2000. The sales revenue and profits grew by seven times and three times respectively than those in the year 2000. SCP has kept the leadership position in the paper industry in China and now has been one of the top 50 global players in the global paper industry. Today SCP has a total asset of over 200 billion paper products with annual production capacity of nearly 400 million tons. SCP is the only holding group that issue both A and B stocks with convertible bonds of listed companies in the Chinese paper industry.
DISCUSSION
The experiences of SCP shed much light on the roots of a firm‘s crisis in China under the state planned system, and the challenges faced by the managers after the crisis. Under the central planning system, competition for markets, products, or prices was forbidden and people, capital, and natural resources were allocated according to the central plan. Managerial competences, technological innovations, competitive product offerings were discouraged and economic incentives were non-existent. In little more than one decade, these conditions were reversed in SCP, and under the leadership of Chen, the chairman, SCP is now competing in a global marketplace. Western executives should take note of China‘s evolving capabilities unleashed from the reform of management system from planned economy to market economy have had significant impact on competitive performance and market positions of the Chinese firms. Like SCP, the new Chinese companies are successfully adopting advanced management techniques and developing strategies that are putting them into the ranks of world competitors. While not all SOEs have been as successful in overcoming decades of central planning, bureaucratic government leadership, and poor internal information systems and controls, every manufacturing industry now has rich examples of successful SOE transformations. Challenges to build competitive product lines and to compete in local and international markets require such advanced management techniques. While SCP was a representative of the most successful of our sample, the remaining SOEs have also made similar strides. These SOEs have transformed their ―branch plant‖ operations to vibrant competitive organizations that are beginning to enter the global marketplace. To improve their capital structures, they have adopted modern corporate structures, convinced government ministries and banks to convert excessive debt into stock holdings with positions on the board of directors. Several firms have issued stock in Hong Kong and the US capital markets. Others have developed joint venture partners to provide additional capital, as well as needed know-how and market access. Several have improved financial structures by either spinning out operations into new joint ventures, merging with similar domestic operations, or selling assets for cash. To improve the basic cost structure, local and national governments are taking responsibility for healthcare and unemployment, thereby reducing some of the SOE welfare burdens. All of the corporations in this study concentrated their initial efforts on improving management capabilities. The following highlights are very significant in a better understanding of the Chinese situational factors that have such a great impact on firms‘ success factors. Managerial Challenges: The challenges faced by the managers of the distressed corporations, particularly in China, were
multifaceted. In addition to the financial restructuring issues already discussed in the literature review, following areas of concerns should be highlighted:

Jifu Wang, Donna Stringer and Peng Yu
64
Workforce: The Chinese firms had qualified workforce that had experience working in several different types of enterprises and that had been trained in the specifics of the equipment operation by leading international companies. However, there was an urgent need to redesign the compensation system and offer incentives for innovation, market development, and customer servicing, something that had not been feasible before the crises due to the political and welfare considerations.
Value Chain: The global market was moving towards a horizontal value chain in technology-intensive products, with specialist firms for product design, pure-play fabrication, and testing and packaging. But the Chinese firms had formed vertical linkages, equity-based as well as guanxi-based, and faced problems because of the mismatch in the capabilities of different partners. While most Chinese partners had capabilities most suitable for the lower-end, less complex, products, they faced political pressures to differentiate themselves and to move up the technology chain. The lower-end market itself was quite diverse, with variety of product applications, and few firms had access to requisite design, technical, and marketing know-how to cater to these diverse demands. Therefore, there was a need for defining clear strategic thrust, and to forge relevant alliances for servicing the lower-end markets - where the firms could be confident of positive cash flows for internally funded growth.
Corporate Governance: The Central and provincial governments played a dominant role in the strategic decision making for investments and product market scope. Even for the privately owned firms, the government controlled the strategies through its decisions on foreign exchange for equipment imports and through the loans given by the state-owned banks. The government policies were continuously changing, and frequently put the latecomers at an advantage over the early movers, as new, lower tax rates and faster loan delivery policies were instituted. The firms needed to take a progressive approach, focused on fast payback, so that they could benefit from the continuing liberalization.
Organization: The Chinese firms were engaged in all kind of activities without any concern about the external cost and true benefits of those activities. There was a need to focus limited financial and managerial resources on the core activities, and to break these into smaller modules so that market-focused and cost-effective capabilities may be built.
Market Volatility: The market itself was highly volatile, with short technology life cycles and rapid shifts in the cost-effectiveness of different national and regional producers. As the American, European and Japanese firms were developing new technologies, the specifications and standards for the components of the end products were rapidly changing. Using the older specifications and standards built-into the prior generation equipment, it was difficult for the Chinese firms to bag large share of any product market. The Chinese firms needed to develop flexible innovation skills for adapting their equipment to these new specifications, and for developing new customized products. Only then could they insure themselves from the competition based on the heavily discounted older designs, as well as from the quick availability of the newer designs even before the quality based on the older designs had been perfected.
IV. CONCLUSIONS
In this article, we reviewed literature on the corporate crises, and discussed some of the turnaround strategies to deal primarily with the firm restructuring issues. Thereafter, we studied the case of SCP in China, and highlighted additional strategic risks faced by the Chinese firms and the resulting managerial actions to successfully respond to both the internal and external challenges The firms in the emerging markets, such as China, face challenging conditions. They have to deal not only with the issues of concern to the leading firms in the international markets, but also with the constraints and adjustment pressures faced in their national and regional markets. To meet these challenges, they must give due recognition to the world-class turnaround models, which are rooted in the recognition, development, and exploitation of unique resources, core competencies, focused capabilities, and unassailable positions. They must also constantly invest into and fully exploit their physical capital, human capital, relational capital, and social capital, and make up for the inadequacies in their financial capital, technological know-how, and infrastructure resources. However, in addition, they should be appreciative of the local and regional servicing and marketing opportunities also. Several domestic firms in the emerging markets have acquired resources and know-how, based on both internal research as well as overseas purchases of equipment, product design, and technical packages. These firms tend to have very loose linkages with one another. They frequently have mutual distrust, because each believes that it could do better than the others provided it also had additional funds or relevant guanxi with the national authorities or the international vendors. Indeed, while most firms have acquired the necessary hardware (including the traded portion of the software), they have limited capability for customizing the acquired hardware for the specific national and regional needs. As such, they tend to depend on prior-generation designs, and suffer great uncertainty and losses as that demand is substituted with higher-end products or is saturated with large worldwide capacity investments. To avoid accentuating the competition, they may not even share true

Crisis and Actions: How a Firm Surviving Challenges
65
and full information on their operations with their customers and vendors. The internal accounting systems are left under-developed so that the employees might not jump the ship to the competitors. The poor transparency and organizational systems further complicates the strategic management process. A required formative input for sustainable turnaround is to forge strategic alliances with other domestic firms, who have required resources and regional infrastructure for providing complementary services. Instead of seeking contacts only for marketing, the firms should also seek complementary inputs from the other domestic firms, and on new revenue opportunities from providing their own group services for helping those firms meet their specific requirements. With such an approach, more productive initiatives would occur, and the time spent for waiting to see the market trends would be reduced. To conclude, a transformative turnaround may be realized through recognition of the value of the strategic option with respect to the development of technical services business oriented specifically towards the local and regional vendors. However, a focus on servicing the under-met needs of the local customers, at costs lower than the world-class levels, would be essential to actualize the upside value of this option.
REFERENCES
Drysdale, Peter (ed.) (2000); Reform and Recovery in East Asia: The Role of the State and Economic Enterprise, New York: Routledge.
Grewal, R. & Tansuhaj, P. (2001), ―Building organizational capabilities for managing economic crisis: the role of market orientation and strategic flexibility,‖ Journal of Marketing, 65(2): 67-80.
Gupta, V., Macmillan, I.C., and Surie, G. (2003). ―Entrepreneurial Leadership: Developing and Measuring a Cross-cultural Construct,‖ Journal of Business Venturing.
Haley, Usha C V (2000); "Corporate Governance and restructuring in East Asia: An overview," Seoul Journal of Economics, Seoul, 13(3): 225-251.
Kohli, A. K. & B. J. Jaworski (1990) "Market Orientation: The Construct, Research Propositions, and Managerial Implications," Journal of Marketing, 54 (April), 1-18.
McGrath, R.G. and MacMillan, I.C. (2000) The entrepreneurial mindset. Boston, Mass: Harvard Business School Press. Khandwalla, P.N. (2002); ―Effective organizational response by corporate to India's liberalization and Globalization,‖ Asia-
Pacific Journal of Management, 19(2/3): 423-438. Mako, William P. (2001); "Corporate Restructuring in East Asia: Promoting best practices" Finance & Development, 38(1): 2-
5. Yoshida, Phyllis G. (2001); "Asian economies striving to enhance innovation capabilities," Research Technology
Management, Washington, 44(1): 2-6.

Cerissa Stevenson and Donna Cooner
66
USING COMPUTER ANALYSIS SOFTWARE AND ONLINE JOURNALING TO COLLECT AND INTEGRATE MIXED METHODS DATA: AN EXAMPLE EXPLORING
THE JOURNEY TOWARDS THE PRINCIPALSHIP
Cerissa Stevenson and Donna Cooner Colorado State University
ABSTRACT
Using the complex context of principal preparation, this paper outlines the utilization of technology to integrate and conduct
mixed methods analysis. While mixed method studies are becoming more prominent in many disciplines, the feasibility of
conducting such research and integrating both data sets can be problematic. Researchers used the Statistical Package for
the Social Sciences (SPSS), NVivo 7, and an online journaling program, Journey Mapping, to conduct the research. Journey
Mapping was the instrument used to collect both the quantitative and qualitative data simultaneously. Longitudinal data were
collected over a two year period. Computer aided data analysis assisted in an in depth understanding of both quantitative and
qualitative data as well as the integration of the two. This comprehensive study has the potential to significantly contribute to
the understanding of preparing future principals. Results indicated that requiring guided reflective journaling throughout
principal internships clearly incorporates the broad knowledge outlined by the standards established for principals.
Keywords: Mixed Methods, Computer Aided Data Analysis, Principal Preparation
INTRODUCTION
The intent of this study was to learn about principal intern perceptions of their grasp of the identified state principal standards for Colorado. For decades principal preparation programs have been faced with criticism (Bridges, 1977; Cooper & Boyd, 1987; Crowson & McPherson, 1987; Griffiths, 1988; Levine, 2005; National Policy Board for Educational Administration, 1989), however, there continues to be a deficit of empirical evaluation of such programs. In a recent research synthesis of published research articles concerning the preparation of school leaders over the past ten years, only nine articles were considered empirical research with a quasi-experimental or qualitative design (Cooner, Dickmann, & Dugan, 2006). The remaining articles and reports in the database, 421 total, were merely descriptions of programs or philosophical essays. ―Murphy and Vriesenga [also] found that more than 2,000 articles on preparation had been published in leading school leadership journals from 1975-2002, but less than three percent were empirical studies‖ (as cited in Levine, 2005, p. 46).
Three components; standards, internship, and reflection, commonly included in principal preparation (Creighton, 2001; Milstein & Krueger, 1997; Williamson & Hudson, 2001; Murphy, Yff, & Shipman, 2000; Jackson & Kelley, 2002; Browne-Ferrigno & Muth, 2004; Williams, Matthes, Baugh, 2004), were examined in this study. Although complex, combining the three in one analysis has the potential to significantly inform the preparation of principals. Imploring a pragmatic worldview, researchers identified the need to use both qualitative and quantitative methods to answer the research questions (Tashakkori & Teddlie, 2003).Particularly because of the complexity of examining all three components of principal preparation. It was not believed one method would be sufficient. Green and Cracelli (1997) highlight the position of Patton (1988) and his belief that ―pragmatism…grounds its rationale for mixing methods in situational responsiveness and a commitment to an empirical perspective‖ (p.9).
Although utilizing mixed methods has become increasingly popular, the reality of conducting quality mixed studies can be difficult; particularly integrating the two forms of data (Bryman, 2007). Considerations for integration need to be made at the onset of a study. As an interviewee expressed in Bryman‘s 2007 study on barriers to integrating qualitative and qualitative research:
…when mixed methods project is set up in such a way that either the quantitative or the qualitative component provides the main point of orientation, it will be difficult to bring the findings together because the overall design was
not conceptualized in a sufficiently integrated way (p.14).
The purpose of this paper is to highlight the use of technology in the design and analysis of a mixed methods study, which aided in the balanced orientation of both forms of data and the integration of the two in the analysis. NVivo 7 and the

Using Computer Analysis Software and Online Journaling To Collect and Integrate Mixed Methods Data: An Example Exploring the Journey Towards the Principalship
67
Statistical Package for the Social Sciences (SPSS) for data analysis were utilized. The design and analysis is similar to Andrew, Salamonson, and Halcomb‘s (2008) research highlighted in their article, Integrating Mixed Methods Data Analysis
using NVivo: An example examining attrition and persistence of nursing students. Unique to this study, however, is the utilization of an online journaling site, Journey Mapping. This allowed for an equally substantial amount of quantitative and qualitative data to be collected concurrently over the duration of the academic school year; giving balance to both the quantitative and qualitative components of the research.
Reflection
Reflection was a key component of this inquiry. It was also the instrumentation utilized to collect the narrative data. Dewey (1933) defined reflection as ―an active persistent and careful consideration of any belief or supposed form of knowledge in the light of the grounds that support it and further consideration to which it tends.‖ Engaging in reflection has been identified as an exercise in learning and retaining information (Gilley & Maycunich-Gilley, 2003; hooks, 2003). When principal interns begin to conceptualize the role transformation from teacher to principal (Browne-Ferrigno & Muth, 2004), reflecting on the process is invaluable. Normore (2004) explains the importance of the reflective process in transitioning to the principalship: ―The transition from being a teacher to becoming an administrator is an intricate process of reflection and learning that requires socialization into a new community of practice and role identity‖ (p. 109). In a two-part phenomenological and case study methodological study Bingham (1995) ties in what he learned to do in his preparation program to his current work as a principal. He believes, ―(a) the scarcity of a principal‘s time for reflection is exceeded only by the need for it, and (b) the meaning of events is best understood by connecting present with past experience‖ (p. 203). If reflective practices once in the principalship are important, then engaging in reflective activities during training seems logical. ―Regular reflection in situ, in weekly seminars and individually, provides opportunities for interns to make sense out of their experience, comprehend and refine their practice and learn to know themselves in an administrative role‖ (Williams, Matthes, Baugh, 2004, p. 60). In an article on the need for self-analysis and reflection, Petire, Lindauer, and Tountasakis (2000), synthesize their teaching experiences with instruments designed to further self-awareness in preparing school leaders. Although they base the information on the literature as well, most of the citations are from the instrumentation used in their courses. The reflections, however, include that ―effective leaders need to understand themselves to be able to better make decisions and understand why people behave as they do‖ (p. 363). An earlier, more substantiated, examination of reflection indicates its importance for preparing school leaders (Short, 1997). Reflection, however, should not simply be free journal writing. The most significant strategies for meaningful reflection are, ―group reflection, reflective journals, reflective writings with in the classroom context, educational platforms, case studies, and reflection on personal and professional codes of ethics…the most useful approach to journal writing is the critical incident approach‖ (Short, 1997, p. 90). In her conclusion, Short also mentions the need for more systematic empirical research on reflection in principal preparation.
Journey Mapping
Reflection, however, has been difficult to monitor and assess (Cooner, Dickman, & Dugan, 2006). Journey Mapping (Kibel, 2004) is a resource that can help rectify the issues of assessment and data collection. Researcher Donna Westmoreland describes Journey Mapping as ―a real-time internet-based reporting system that promotes reflective practice and continuous learning for student‖ (2003, p.1). The Journey Mapping program allows for flexibility in questioning and analysis. Both quantitative and qualitative data can be collected. In this study principal interns logged on at regular intervals throughout their internship to an Internet journaling site, with the Journey Mapping framework, and responded to a set of open-ended questions and Likert type scaled questions.
DATA COLLECTION
Participants were trained on the Journey Mapping program during the summer session prior to their internship year. They were taught how to log on to the Internet site to complete a journal entry which contained open ended journal prompts and survey questions. Each participant was given an account and password to access his/her journal page. Demographic information (years of experience and gender) was entered for each designated participant as well. The first four guiding questions in the journal were open-ended and designed for qualitative analysis (Appendix A). The final questions were scaled and designed for quantitative analysis. The second section of the scaled questions asked participants to rate themselves on a 6-point Likert-type scale of their perceived knowledge of the eleven principal standards designated for Colorado:

Cerissa Stevenson and Donna Cooner
68
Foundations of Leadership Individualization of Instruction Resources
Contextual Understanding Management and Evaluation of Instruction School Site Safety and Maintenance
Planning and Organization Supervision of Personnel Parent and Community Involvement
Content Knowledge Instruction Supervision of Student Conduct
Participants entered scores bi-monthly during the first semester and monthly during the second semester (Appendix B). All information was given and stored electronically. Access was granted to the researcher for each individual journal. Journals were monitored for completion only. Once both academic years were completed analysis of data began.
PARTICIPANTS
Candidates from the principal preparation program at Colorado State University during the 2004-2005 and 2005-2006 academic years were included in the study. These principal licensure candidates were involved in their required yearlong 300-hour principal internship during the data gathering process. The majority of the principal interns were completing the internship in their home schools with their supervising principals serving as mentors. It was the responsibility of the principal intern and the mentor principal to ensure exposure to a variety of experiences that would lead to mastery of principal licensure standards. The entire available sample was used, which was comprised of three cohorts with a total of sixty students; 30 males and 30 females; 10 with 0-5 years of experience; 22 with 6-10 years of experience; 13 with 11-15 years of experience; and 15 with more than 15 years of experience. The equal number of males and females occurred by chance. N=30 for both the male and female groups, which is considered the appropriate approximate sample size for a study of this kind (Creswell, 2002). Grounded theory studies also often have 50-60 participants (Creswell & Plano-Clark, 2007). Because this approach is deductive rather than inductive, it is not a grounded theory study. The nature of the analysis however, and the large amount of narratives align with the grounded theory qualitative tradition. Although the entire available sample was used, it is not considered the population because similar programs exist and the study could be replicated at other locations.
QUANTITATIVE ANALYSIS
Scores from the Journey Mapping entries were imported into an excel spreadsheet prior to being imported into SPSS. The quantitative analysis for this inquiry was done using a non-experimental comparative approach using the SPSS program. The identified attribute independent variables were gender and years of teaching experience. Years of experience was coded into four levels: 1) 0-5 years, 2) 6-10 years, 3) 11-15 years, and 4) more than 15 years. Time when scores were analyzed: initially, mid-year, and finally, is the third independent variable. The dependent variable is standards acquisition scores from a six-point scale. The six-point scale (Appendix B) was labeled a through f. Each point was defined from the teaching and learning context where minimal exposure to being able to teach to others and considering oneself an expert are considered different degrees of learning. In a university classroom study on peer teaching, a significant advantage for the tutor was found. He/she who taught demonstrated greater understanding than those who did not (Annis, 1983). Annis also writes, ―a common saying is that the best way to learn something is to teach it‖ (p.39). This supports the wording assigned for letter values for the six-point scale. A 2 x 4 x 3 Mixed ANOVA (with repeated measures on the last factor) was utilized for this analysis; represented pictorially in figure one.

Using Computer Analysis Software and Online Journaling To Collect and Integrate Mixed Methods Data: An Example Exploring the Journey Towards the Principalship
69
Figure 1: 2 x 4 x 3 Mixed ANOVA
QUALITATIVE ANALYSIS
Narratives from the Journey Mapping entries were imported into NVivo. NVivo aided in the ability to code and mange the large amount of narrative data. Template analysis, a deductive coding strategy (University of Hudersfield, n.d.), was the approach used for analyzing the journal entries. The established codes prior to analysis were the principal standards. Themes emerged inductively as well and were identified throughout the coding process. Cross-case analysis was conducted with the multiple cases (three cohorts and two academic years) as well as gender and years of experience.
MIXED ANALYSIS
Finally matrices were created using NVivo 7 to quantify the qualitative data for mixed analysis with the scaled scores. The use of NVivo 7 for mixed analysis was guided by the workshop presented at the annual Mixed Methods Conference (Pare‘, 2007). NVivo 7 has a function where attributes can be coded and put into a matrix through conducting appropriate queries. This function was utilized to examine entries by differing years of experience and gender. Then the results were cross referenced with the initial quantitative results.
FINDINGS
The combination of quantitative and qualitative research for this study gave a deeper more nuanced understanding of the data. The quantitative results indicated a statistically significant difference for scores over time (initial to mid-year and mid-year to final). The temporal component for the narratives was, however, difficult to examine. The narratives did support, for the most part, the perceptions the interns indicated when they scored themselves on their knowledge of the standards. There was a statistically significant difference from initial to mid-year and mid-year to final scores. This indicated continued growth of participants‘ acquisition of standards throughout the program for all standards. Conducting the qualitative analysis, however, revealed some divergent results. The narratives, indicated interns needed more exposure to standards 3 and 9. As for gender and years of experience, there was no statistically significant difference found. Overwhelming practical significant differences were not found in the narratives for gender or for years of experience either. Considering all of the combinations, eleven individual standards under three categories; successes, challenges, and concerns, there were very few differences. There was a difference between males and females for standard 11. Entries from females had an emphasis on relationships and entries from males had an emphasis on resolving conflict. As for years of experiences, there were only differences for the greatest challenges. Two levels, 0-5 years and 11-15 years found the greatest challenge to be standard 8, Supervision of
Student Conduct. Those with 11-15 years of experience sometimes reflected on their experience to guide them through situations. Otherwise they had similar entries. Interns with 6-10 years of experience found standard 2, Contextual
Understanding, to be the greatest challenge. Their entries often reflected challenges with the district level. Standard 3, Planning and Organization, was the greatest challenge for those with more than 15 years of experience. The value of combining the quantitative and qualitative analysis is that a more specific explanation for the findings can be presented. The findings from the qualitative analysis were mostly convergent with the quantitative findings. The narratives,
Male
Female
0-5 Years
11-15
15+
6-10
Initial Mid-Year Final

Cerissa Stevenson and Donna Cooner
70
however, show a need for interns to have more exposure to standards 3and 9. The emphasis placed on the reflections for standard 11 differed between genders. Greatest challenges for the different levels of experience also differed.
DISCUSSION
With the amount of criticism and pressure principal preparation programs are currently facing, program evaluation is necessary; especially empirical inquiry of specific program components. Many educational leadership scholars have identified aspects of principal preparation to focus on: internships, standards and reflective journals are examples of significant components often mentioned in research. Brown-Ferringo and Rodney Muth report, ―preparing future school leaders requires that candidates be immersed in authentic learning activities that produce real products used by schools where the work is conducted‖ (2004, p. 476). Principal preparation programs have also integrated state and national standards into their curricula. Other than state licensure exams, assessing the acquisition of standards has been problematic. Using electronic journaling, such as Journey Mapping, to track learning over time, is a unique way to assess the acquisition of standards. The purpose of this study was to investigate the acquisition of skills to meet licensure standards during the principal internship experience via reflective journaling. The findings support the increased knowledge of standards throughout the authentic internship experience for the principal candidates. The scaled scores showed that almost an equal amount of perceived growth occurred during the fall semester as the spring semester. This evidence supports the need for a full academic-year long internship, because scores continued to increase during the second semester. Growth may, however, continue to increase if the internship time was increased beyond the year long experience. The evidence from the narratives also revealed the exposure interns were provided for the different standards. Overall the standards were identified throughout the reflective process. Interns needed more work, however, with standards 3, Planning and Organization, and 9, Resources.
Gender and years of experience did not factor significantly into the scores. This supports the readiness level of all participants. It also indicated that both men and women perceive themselves to be equally successful. ―Woman are currently underrepresented in educational leadership positions‖ according to Sherman (2005, p.711). Sherman also writes of the discrepancy between the percentage of women in principal licensure programs, and the number of women who pursue principal positions. This study suggests women are equally prepared for the role as men. The difference discovered among the narratives between males and females was only for one standard; 11, Parent and Community Involvement. The difference was not about competency of either gender rather it was in the different approaches used by them. Females mentioned building relationships more often, while males wrote about the political context of parent and community involvement and resolving conflicts with difficult parents. These results could help rectify the current scenario, through encouraging women to pursue position and by informing districts of the readiness level of female candidates. Those with varying levels of experience could also use this to their benefit. The program appears to equally prepare future principals with all levels of experience. Beyond the candidates using this for their benefit, programs such as CSU could use the data for recruitment and marketing. Clearly the scores and narratives reflect positively on the experiences offered through the program. Implications This comprehensive study has the potential to significantly contribute to the understanding of preparing future principals. Requiring guided reflective journaling throughout principal internships clearly integrates the broad knowledge outlined by the standards. All three components should be a part of principal preparation. The internship allows for authentic practice. Standards guide the practice to make sure it is well rounded. They also allow for the assessment of the variety of experiences afforded to the principal interns during their internship. Reflection integrates the two while requiring interns to think deeply about their experiences. More instruction, however, appears to be needed in the areas of resource management and planning and organizing. Gender and years of experience, should not be a factor for admission into programs. Males and females as well as those with different levels of experience are equally competent in their potential to become principals.
CONCLUSION
Utilizing available technology clearly contributes to the feasibility of conducting mixed analysis. Journey Mapping facilitated the concurrent collection of both quantitative and qualitative data over time. Importing this rich data set into SPSS and NVivo allows for not only quantitative and qualitative analysis, but the integration of the two. Further integration of the data could also aid in an even deeper understanding of principal preparation programs. Formatting the qualitative matrices numerically and importing the findings back into SPSS would tell us if the narrative findings were statistically significant. Adding focus groups or interviews to examine the divergent qualitative results from the quantitative findings would provide for deeper understanding of the results.

Using Computer Analysis Software and Online Journaling To Collect and Integrate Mixed Methods Data: An Example Exploring the Journey Towards the Principalship
71
REFERENCES
Andrew, S., Slamonson, Y., & Halcomb, E.J. (2008). Integrating mixed methods data analysis using NVivo: An example of examining attrition and persistence of nursing students. International Journal of Multiple Research Approaches, 2(1), 36-43.
Bingham, C.S. (1995). ‗Doing theory‘ and educational leadership. Journal of Instructional Psychology, 22 (3), 203-211. Bridges, E.M. (1977). The nature of leadership. In L.L. Cunningham, W.G. Hack, & R.O. Nystrand (Eds.), Educational
Administration (pp. 202-230). Berkely, C.A.: McCutchan Publishing Browne-Ferrigno, T., & Muth, R. (2004). Leadership mentoring in clinical practice: Role socialization, professional
development, and capacity building. Educational Administrative Quarterly, 40 (4), 468-494. Bryman, A. (2007). Barriers to integrateing quantitative and qualitative research. Journal of Mixed Methods Research, 1(1), 8-
22. Cooner, D, Dickman, E., & Dugan, J. (2006). Informing the knowledge base through funding: A research synthesis on
leadership preparation. Manuscript submitted for publication. Cooper, B.S. & Boyd, W.L. (1987). The evolution of training for school administrators. In J. Murphy & P. Hallinger (Ed.),
Approaches to administrative training in education (pp. 3-27). Albany: State University of New York Press. Creighton, T.B. (2001, November). Towards a leadership practice field: An antidote to an ailing internship experience. Paper
presented at the University Council of Educational Administration Convention, Cincinnati, OH. Creswell, J. (2002). Educational research: Planning, conducting, and evaluating quantitative and qualitative research. Upper
Saddle River, New Jersey: Pearson Education, Inc. Creswell, J.W. & Plano-Clark, V.L. (2007) Designing and conducting mixed methods research. Thousand Oaks, CA: Sage
Publications, Inc. Crowson, R.L. & McPherson, R.B. (1987). The legacy of the theory movement: Learning from the new tradition. In J. Murphy
& P. Hallinger (Ed.), Approaches to administrative training in education (pp. 3-27). Albany: State University of New York Press.
Gilley, J. & Maycunich-Gilley, A (2003). Strategically integrated HRD. Cambridge, MA: Perseus Griffiths, D.E.(1988). Administrative theory, in N. Boyan (ed.) Handbook of research on educational administration, pp. 27-51.
New York: Longman. Hooks, B. (2003). Teaching community a pedagogy of hope. New York: Routledge. Jackson, B., & Kelley, C. (2002). Exceptional and innovative programs in educational leadership. Educational Administration
Quarterly, 38 (2), 192-212. Kibel, B. (2004). Journey mapping: An overview. Retrieved July 17, 2007, from
http://www.pire.org/resultsmapping/previewafs.htm Levine, A. (2005). Educating school leaders. Retrieved January 30, 2006, from http://www.edschools.org/pdf/ESFinal313.pdf. Milstein, M. M., & Krueger, J. (1997). Improving educational administration preparation programs: What we have learned over
the past decade. Peabody Journal of Education, 72 (2), 100-117. Murphy, J., Yff, J. & Shipman, N. (2000). Implementation of the interstate school leaders licensure consortium standards.
International Journal of Leadership in Education, 3 (1), 17-39. Normore, A. (2004). Socializing school administrators to meet leadership challenges that doom all but the most heroic and
talented leaders to failure. International Journal of Leadership in Education 7 (2), 107-125. Pare‘, M.H. (2007). Using NVivo 7 for mixed methods analysis. Workshop presented at the annual Mixed Methods
Conference, Cambridge, UK. Petrie, G., Lindaur, P., & Tountasakis, M. (2000). Self analysis: A tool to enhance leader effectiveness. Education, 121 (2),
355-366. Short, P.M. (1997). Reflection in administration preparation. Peabody Journal of Education, 72 (2), 86-100. Tashakkori, A & Teddlie, C. (2003). Mixed methods handbook in social and behavioral research. Sage Publications:
Thousand Oaks, CA. University of Hudersfield, School of Human & Health Sciences, (n.d.). Template analysis. Retrieved November 9, 2006, from
http://www.hud.ac.uk/hhs/research/template_analysis/whatis.htm Westmoreland, D. (2003). Journey mapping: capturing students‘ transformative learning experiences and promoting growth
into an advanced practice role. Paper presented at the conference of Sigma Theta Tau International [electronic Version]. Williams, E.J., Matthews, J., & Baugh, S. (2004). Developing a mentoring internship model for school leadership: Using
legitimate peripheral participation. Mentoring and Tutoring; Partnership in Learning, 12 (1), 53-70. Williamson, R. & Hudson, M. (2001) The good, the bad, the ugly: Internships in principal preparation. National Council of
Professors of Educational Administration Annual Conference.

Jiri Strouhal
72
ACCOUNTING FOR “NIGHT CLUBS”: IS IT REALLY ABOUT TRUE-AND-FAIR (OR RATHER PROBABLE) VIEW? CASE OF CZECH REPUBLIC
Jiri Strouhal University of Economics Prague
ABSTRACT
The Czech government issued in July 2005 the Draft of Prostitution Regulation Act which legalises prostitution in the Czech
Republic. In this Act is defined the requirement of bookkeeping not only by the night clubs but also by all of the prostitutes.
This paper deals with the problem how to report such ―specific‖ services in the accounting of each of this by the members of the oldest craft. Study compares the situation of the employees of the night clubs (current situation) and the variant when the
prostitute is the tradeswoman (situation after adoption of this Act). The results of this study are little bit surprising from the
accounting point of view. In this branch there is not realised true-and-fair view, but rather true-and-probable view… Interesting field in this area may be also the voluntary based auditing. Why not, but the annual reports of the people carrying out the
prostitution could be the ―bestsellers‖ after that.
Keywords: Financial Reporting, Night Clubs, Prostitution
INTRODUCTION TO THE PROBLEM
We normally understand prostitution to mean the paid provision of services aimed directly at the satisfaction of sexual needs, if in the course of this there is direct physical contact between the person providing these services and the person using them. From the above definition it therefore emerges that prostitution does not include striptease or sex over the telephone, because these are not connected with health risks, public outrage or serious crime. At the present time around 20,000 persons carry out prostitution in the Czech Republic. In the world there exist at present three basic concepts for dealing with the problem of prostitution: To "ignore" prostitution legally and prosecute only certain behaviour accompanying it (tax evasions, drug-related crime,
violent crime, etc.), To define a certain framework for prostitution in which it is permitted and to prosecute any deviation from this framework (e.g. Austria, Holland, Hungary), and To forbid prostitution and prosecute in the case of the occurrence of such activity.
In Austria this "activity" has been regulated since 1984. The law here stipulates the lower age limit of persons engaged in prostitution, which it also restricts locally. It tolerates houses of prostitution on the assumption that they are properly declared and it gives communities the authority to cancel licences for the operation of houses of prostitution and prostitution. Persons carrying out prostitution are obliged to pay taxes and undergo regular medical examinations. Holland passed a separate law on prostitution in 1999 where the basic rules are stipulated for the operation of prostitution as one of the forms of enterprise. Prostitution is tolerated not only in houses of prostitution, but also in defined streets and further as the so-called escort service. Communities here have the possibility of deciding on matters of the establishing of houses of prostitution, permitting and forbidding prostitution. Penalties are stipulated by law for the spreading of sexually transmitted diseases and for prostitution outside the set areas. The observance of this law is then controlled by the vice squad. It is interesting that the owner of a house of prostitution is not regarded as a pimp. In the same year a law was passed in Hungary on organised crime, part of which is also the delimitation of the so-called prostitution tolerance zones. A prostituting person must be in possession of a medical authorisation, and the possibility of the existence of houses of prostitution is also not excluded. The Ministry of Health and the Ministry of Economy issue the licences. The above-mentioned law bans, however, the audio and visual advertising of the offer of prostitution.

Accounting for ―Night Clubs‖: Is it Really about True-and-Fair (or Rather Probable) View? Case of Czech Republic
73
CZECH ARRANGEMENT
The arrangement applying at present is the law for the persecution of sexually transmitted diseases of 1922, which was last amended in 1950. This law is restricted exclusively to banning the establishment and keeping of houses of ill repute and to the obligation of the state administration to establish institutions in which those "plying the trade of prostitution" are ensured temporary shelter and the opportunity for correction. In the year 2000 the law on municipalities was passed, which enables the regulation of prostitution so that it does not disturb public order in the community and is not in conflict with good morals and the protection of safety, health and property. The aim of the modification, which was submitted for approval by the Czech Government in 2005 was the introduction of a complex legal regulation that would on the one hand define the concept of prostitution and further regulate its execution. Among the main problems that should be resolved by the new regulation are in particular: Organised crime and involuntary prostitution, when a large group of persons is forced into prostitution by force by
criminal structures participating in the trafficking of human beings; The protection of persons aged between 15 and 18 years against prostitution and other forms of criminal vice as required by the international documents relating to the protection of human rights, or the protection of children's rights, which are part of our legal code; The ineffective attempt to regulate erotic establishments, their number, appearance and positioning and the control of their operation. This also concerns preventive health activity among persons carrying out prostitution; The insufficient possibility of regulating the prostitution offered in public spaces by means of generally binding orders that municipalities are authorised to issue by the law on municipalities; The temporary insolubility of the payment of contributions to health and social security and the payment of taxes and charges from the execution of prostitution; The ruining of the normal life of the citizens of certain towns through publicly offered prostitution, which has an unfavourable influence on public order and the moral upbringing of children and young people.
The draft of the law is based on the assumption that it is not realistic to ban prostitution effectively by a legal regulation as a certain social-pathological phenomenon. It is only possible to set certain rules by means of a legal regulation so that prostitution is not felt by the public to be a marked problem of public order and also so that it does not pose a serious health threat. The aim of the new legal modification is therefore: To separate legal and illegal voluntary prostitution and minimise the number of persons forced into prostitution; To establish the possibility of the protection of persons at risk from abuse and trafficking for the purpose of sexual
exploitation; To forbid the prostitution of persons under the age of 18 years; To set the conditions under which it will be possible to execute prostitution; To stipulate the rules for the operation of prostitution in places of public access and in buildings and places designated for this; To set the conditions under which it is possible to carry out prostitution as a business; To restrict the spreading of sexually transmitted and other infectious diseases through regular medical examinations of persons engaged in prostitution; To create the possibility of prosecution of persons who act in contravention of the proposed legal modification; To eliminate cases of disturbance of public order in connection with the execution of prostitution; To introduce and ensure the registration of persons legally engaged in prostitution; To restrict criminal and other illegal activity that is connected with prostitution (for instance trafficking in people, jeopardising the moral upbringing of the young, procurement, illegal production and possession of narcotic and psychotropic substances and poisons).
The "advantage" of this legal modification is the minimal financial demands on the state budget. The allocation of authorisation to carry out prostitution, the registration of persons engaged in prostitution, the withdrawal of authorisation for failure to meet the conditions for carrying out prostitution, archiving, etc. will certainly make certain demands on the time of workers in public administration, but not of a fundamental nature. These expenses should be covered by the incomes from administrative charges.

Jiri Strouhal
74
The bill does not make any special financial demands on the state budget. It may also be assumed that there will be no fundamental wage and personnel demands connected with the realisation of the legal modification concerned. The allocation of authorisation to carry out prostitution, the registration of persons engaged in prostitution, the withdrawal of authorisation for failure to meet the conditions for carrying out prostitution, archiving, etc. will make certain demands on the time of workers in public administration, but not of a fundamental nature. The expenses caused by the proposed legal amendment will be covered by the incomes from administrative charges.
Main Points of the new Act
Only a physical person disposing of authorisation to offer or carry out prostitution, which is medically fit to do so and in addition has valid confirmation of the validity of their medical fitness will be able to offer or carry out prostitution. In addition this person demonstrated authorisation by means of a licence. Municipalities may award the authorisations to carry out prostitution, doing so to applicants who have met the following conditions: The person is over 18 years old, The person is a state citizen of the Czech Republic or of a states whose citizens have the right to do business or carry
out economic activity in the CR under the same conditions as state citizens of the CR, The person is competent to take legal action, The person is medically fit, and The person has health insurance.
It will not be possible for foreigners to engage in prostitution, with the exception of citizens of the EU states and states on the basis of whose agreement the right is established to freedom to settle (see ruling of the European Court of Justice of 20.11.2001 in the matter of Jana and Others C-268/99. The main reason for the exclusion of other foreigners should be the effort to reduce the number of prostitutes in the Czech Republic, especially those from the countries of the former Eastern block and from the countries of the Near and Far East. It is with this latter group of persons that considerable safety risks are linked, as they are usually under the influence of criminal structures and serve as one of the sources for the financing of other illegal activities (e.g. drug-related crimes). Application for Allocation of Authorisation
In this application the applicant must give his/her name, date and place of birth and address of the place of permanent residence. If he/she is not a citizen of the CR, then he/she shall give in addition state citizenship and residential address in the CR (or else in another member country of the EU). To this application it will, of course, be necessary to attach: A document on health insurance or an officially certified copy of same, Assessment of medical fitness that must not be more than three months old, Extract from the criminal records, A document on the payment of the administration charge, and Two photographs, 35 x 45 mm, which correspond to the present appearance of the applicant.
This authorisation will subsequently be valid for the period of one year, with the provision that it can always be extended by a further year on the basis of an application. This extension will always be recorded in the licence. The validity of the licence will expire in the following cases: On expiry of its validity, On the date of the loss or theft of the licence, On the death of the holder or the declaration of the holder of authorisation as deceased, On the date of the coming into force of a court ruling by which the holder is declared guilty of the perpetration of a
criminal act, On the date of the coming into force of a court ruling by which the holder is deprived of competence to carry out legal acts or his/her competence to carry out legal acts is restricted, On expiry of the health insurance of the holder, For foreign state citizens in addition on the date of the coming into force of a ruling on cancelling the validity of visas for residence of over 90 days for the purpose of business, or the validity of a long-term residence permit.

Accounting for ―Night Clubs‖: Is it Really about True-and-Fair (or Rather Probable) View? Case of Czech Republic
75
Municipalities will in addition be able to confiscate this authorisation in the following cases: Its holder becomes permanently medically unfit to carry out prostitution, The authorisation was issued on the basis of incorrect or untruthful information, The authorisation contains changes or incorrect information carried out illegally, The authorisation is damaged in such a way that the signatures on it are illegible or its integrity is disrupted, There have been considerable changes in the appearance of the holder, or The holder requests this in person.
The permit should contain the following particulars: Designation of the municipal authority of the municipality that issued the permit or extended its validity, Date of issue, Date of expiry of the permit's validity through elapse of time, Registration number, Photograph of the holder, Imprint of the official stamp and signature of authorised official person.
As is evident at first glance, the name and surname of the holder will not be stated in the permit as protection against possible misuse (e.g. for purposes of blackmail). The certificate of medical fitness is also not a particular of the permit. This will, however, be marked in the licence regularly in the form of the stamp and signature of the doctor, where the validity of this certification will be for the period of one month. The holder of the permit will therefore have to visit the assessing doctor at regular monthly intervals. Prostitutes may change this doctor only once in the calendar year. Municipal authorities will keep records of the permits that contain the following information: Name of the permit holder, Date and place of birth of the permit holder, Permanent residential address, Registration number of permit, Photograph of the permit holder, Designation of the health insurance company where the permit holder is insured, State citizenship of the permit holder, Number of ID card or travel document of the permit holder, Date of awarding of the permit, date of extension of its validity and date of expiry, and Registration numbers of lost, stolen or invalid permits and the date of notification of loss or theft of permit. Rights and Responsibilities of the Permit Holder
The permit holder will be able to engage in prostitution only in an establishment, in premises that are determined for residence by the decision of the planning authority and that the person using the
services of the permit holder is authorised to use (escort service), or in non-residential premises that the person using the services of the permit holder is authorised to use. The permit holder is, however, obliged to present the permit at the request of the appropriate control body, the person using the services of the permit holder or the operator of the establishment and to also provide proof of identity at the request of the appropriate control body, to announce the loss or theft of the permit within 15 days to the municipal authority of the municipality that issued the permit or extended its validity, to notify the municipal authority of the municipality of changes recorded about it in the register of permits, doing so within 15 days of when the change occurred, to hand in the permit within 15 days of the end of the validity of the authorisation.

Jiri Strouhal
76
Operation of an Establishment
It will be possible to operate an establishment, but only on the basis of a permit issued by the municipality on whose territory this establishment will be situated. The Trade Act will then subsequently apply to this establishment. This is a notifiable free trade.
In the application for a permit a physical person must state the following: Name, possibly commercial firm, date and place of birth, address of place of permanent residence, place of business
and identification number, Address of establishment, Name, date and place of birth and address of place of permanent residence of responsible representative, if one has been appointed.
In the application for a permit a legal entity must state the following: Commercial firm, headquarters and identification number if one has been allocated, Names and addresses of permanent residence of persons who are statutory bodies, Name, date and place of birth and address of place of permanent residence of responsible representative, and Address of the establishment.
To the application for a permit the applicant must also attach a document demonstrating ownership or right of use of the buildings in which this is to be operated, or else the consent of the owner of the building to operation of the establishment. The municipality must not, of course, issue a permit in the case that the establishment would be situated in the immediate vicinity of a school, a children's playground, a church building, a public or private cemetery or a crematorium.
The period of validity of the permit is then 10 years from the date it comes into force. The validity of the permit will expire in the following cases: On the day of coming into force of a decision by which the operator of the establishment would be declared guilty of the
perpetration of an administrative offence, On the day of the expiry of the trade licence to operate the establishment, or On the day on which he ceased to meet the condition of good reputation stipulated for the operation of a trade through the following physical persons: o The responsible representative, o The person the operator of the establishment empowered to act in his name, o The person who, within the framework of the operator of the establishment, o carries out management or control activity or is a member of a body carrying out such activity within the
framework of the operator of the establishment, or o A member of a statutory body of the operator of the establishment, if the operator of the establishment is a legal
entity.
The operator of the establishment is obliged, before starting operation, to submit to the municipality that issued the permit the legal approval ruling through which the establishment is permitted. The operator of the establishment must not mark the establishment in a manner arousing public outrage, enable persons under the age of 18 years to enter the establishment, enable a person without a valid proof of the validity of the assessment of medical fitness to offer or implement
prostitution in the establishment.
The operator is further obliged to keep records of the permits of the persons carrying out prostitution in the establishment in which he records the registration number of the permit and the designation of the municipal authority of the municipality that awarded the permit or extended it. At the request of the appropriate control bodies the operator of the establishment is obliged to make these records available.
Administrative Offences
A physical person commits an offence in that he/she offers or carries out prostitution without valid authorisation, or seeks out prostitution in a place where the offering of prostitution is banned, or uses prostitution in a place where a
holder of authorisation is not entitled to carry out prostitution.

Accounting for ―Night Clubs‖: Is it Really about True-and-Fair (or Rather Probable) View? Case of Czech Republic
77
In the first case it is possible to impose a fine of up to 50,000 CZK, in the second case up to 15,000 CZK.
The holder of authorisation commits an administrative offence in that he/she: Does not notify the loss or theft of the licence, Does not notify a change in information, Does not hand in the permit after it expires, Offers prostitution in a public area or in places where he/she is not authorised to do so, Intentionally damages the permit or changes the information in it, or Offers or implements prostitution without valid proof of the validity of the assessment of medical fitness.
In the first three cases it is possible to impose a fine of up to 5,000 CZK, in the remaining cases up to 50,000 CZK.
The operator of an establishment commits an administrative offence in that he/she: Does not present a valid approval ruling for the permission of the establishment => fine up to 10,000 CZK, Designates the establishment in a manner causing public outrage => fine of up to 50,000 CZK, Enables persons under the age of 18 years to enter the establishment => fine of up to 200,000 CZK, Does not keep records of permits or keeps them with untruthful data => fine of up to 300,000 CZK, Enables the holder of a permit to offer or implement prostitution although this person does not have valid proof of
medical fitness => fine of up to 500,000 CZK, Enables a person without a valid permit to offer or implement prostitution in the establishment => fine of up to 1,000,000 CZK, Operates the establishment without valid authorisation => fine of up to 2,000,000 CZK.
The legislators see in this modification the possibility of imposing sanction not only on street prostitution, but also dwelling prostitution. In the case of dwelling prostitution it is also considered that it will be possible to uncover associated criminal activity (pimping, trafficking in people, etc.).
ACCOUNTING AND TAX ASPECTS
When summarizing previous researches in the way of accounting harmonisation, there were noticed two major aspects: the reliability and the correctness of the evaluation (e.g. Aisbitt, 2001; Emenyonu & Grey, 1992 and 1996; Herman & Thomas, 1995). Due to Alexander & Nobes (2004) the factors affecting the development of accountancy in a given country can be defined as follows: colonial and external influences, impact of capital providers, character of the legal system, impact of taxation and impact of the accounting profession. Beyond these aspects there shall be mentioned a set of conceptual approaches (Roberts et al., 2005; Choi & Meek, 2005; Radebaugh et al., 2006; Nobes & Parker, 2008; Elliot & Elliott, 2008) which emphasize a system of factors which are considered to be favorable or even determinant for the national accounting diversity. Also for the Czech Republic is considered the year 2002 as a very important. At that year the Council of European Union issued an order imposing an obligation on companies listed on European stock exchanges to structure their consolidated financial statements according to International Financial Reporting Standards (IFRS) starting with year 2005 at the latest. Otherwise there may be 27 different methods of financial reporting for listed companies in the EU (Whittington, 2005: 129). On the other hand it shall be stated that IFRS are not considered as an equivalent method for structuring financial statements in the Czech Republic and these standards are used as a framework for financial reporting only by listed and supranational companies. Other companies still use national accounting standards which are based on the combination of German and French model.
Problems Related to Analysed Topic Persons carrying out prostitution will be obliged to pay the income tax on physical persons, insurance for social security, the contribution to the state employment policy, keep the appropriate type of accounts, etc. Persons to whom a permit has been awarded have, on the basis of the Act on Administration of Taxes and Payments, the obligation to report to the tax administrator. In the case that they do not fulfil this, the tax administrator registers them ex offo.

Jiri Strouhal
78
Procedure is similar in the case of the obligation to report with regard to the appropriate social security administration. Prostitution may not be offered or executed in a labour-legal relationship.
Persons carrying out prostitution due to the above mentioned text should use the double-entry book-keeping. This accounting deals especially with the costs of material purchased and on the other hand with the revenues from the services provided.
In case that the person carrying out prostitution works in the night club (where due to the Act should not be the employee) also pay the rent for the room and the service fee to the owner (e.g. for keeping the records about these people). Nowadays is also the part of this contract the sentence about ―non providing of these services‖, but when this Act come into the force, there shouldn‘t be any problem with this fact. As we can see from the above mentioned text there are many questions in the way of the accounting and tax aspects. We could name here the TOP 10. Question 1 Is possible to make the appraisal of the person carrying out prostitution?
For example the plastic operation of this person could be recognised as an appraisal. There‘s the only problem how to record this fact into the accounting of the person carrying out prostitution. Question 2 Should the customers receive the bills or invoices?
Due to the Prostitution Act and the Cash Registers Act the customers really should receive the bills. It will be also necessary because of the accounting and tax rules. The only question is whether the people carrying out prostitution will issue the bills or not. Question 3 In case of providing the services for one customer for the period longer than one year, will be necessary to apply the rules for long-term contracts?
Under national accounting practices there is any difference for measurement of short-term and long-term contracts. On the other hand, when applying International Financial Reporting Standards (IFRS), from the IAS 18 (Revenues) point of view, it may be possible. The revenue shall be measured at the fair value of the consideration received. Question 4 Will be possible for the person carrying out the prostitution to keep the accounting under IFRS?
Due to national accounting practices, it will be possible. But from the Income Taxes Act point of view for the tax purposes, the profit should be counted under the Czech accounting principles. Question 5 Will be possible to trade the shares of the night clubs in the stock exchanges?
From the theoretical point of view it is possible but from the practical point of view probably not. But it depends on the regulation of each country. As one of the main problems could be mentioned the money laundering. Question 6 It’s real that the person carrying out the prostitution will be keeping the accounting providing the true-and-fair view?
Due to the answer on question number 2 it depends especially on the fact, whether they will really issue the bills and keep them onto the books or not. This question is also connected with the problem of auditing. Will be possible to audit these people (on their voluntary basis) or not? Author means that it is possible. But the annual reports of the people carrying out the prostitution could be the ―bestsellers‖ after that. Question 7 Shouldn’t be much easier to apply the rule of the flat tax or the annual licence fee?
The flat tax or annual licence fee are, from the author‘s point of view, probably more effective ways how to receive the receipts from the people carrying out the prostitution. But definitely it depends also on the quality of the accounting which will be provided be these people.

Accounting for ―Night Clubs‖: Is it Really about True-and-Fair (or Rather Probable) View? Case of Czech Republic
79
Question 8 Shall we apply on these services the basic or cut rate of VAT?
In case that the person carrying out the prostitution is the value added tax payer, we should apply the basic rate of VAT. Question 9 Will be possible for the night clubs to negotiate the contracts with the option clause?
Probably yes, but it should be mentioned in the negotiated contract. But we should remind that in this case the option clause has its own value and it should be measured and reported separately. There shall be also stated that these services still don‘t have a legal framework like employment contracts. Question 10 Will be possible for the person carrying out the prostitution to receive the “m” months’ wages in lieu of notice?
The main problem is that the person carrying out the prostitution should not be the employee of the night club. On the other hand, in case that the club would like to abort the valid contract, it depends on the rules of this contract.
CONCLUSION
From the accounting point of view this topic shall be treated as a reporting for services. On the other hand it shall be stated, that it will be probably difficult to receive the true-and-fair view, because the reliability and correctness of the information which shall be provided is very uncertain variable. According to these reasons it may be easier (with fulfilling of all requirements given by law) to apply the rule of annual licence fees for services like this, without the necessity of keeping of accounts by prostitutes. To prepare a legal framework for an area like this is a real challenge. It is a quite interesting point that as this Draft was issued in 2005, it‘s still not forced by Parliament.
REFERENCES
[1] Aisbitt, S. (2001) ―Measurement of Harmony of Financial Reporting within and between Countries: The Case of the Nordic Countries‖, European Accounting Review, vol. 10, no. 1: 22-51
[2] Alexander, D. & Nobes, C. (2004) ―Financial Accounting. An International Introduction‖, New York: Prentice Hall [3] Choi, F. D. S., Frost, C. A. & Meek, G. K. (2005) ―International Accounting‖, Upper Saddle River, New Jersey: Pearson
Education Inc. [4] Elliot, B. & Elliot, J. (2008) ―Financial Accounting and Reporting‖, Edinburgh: Pearson Education Inc. [5] Emenyonu, E. & Gray, S. (1992) ―EC Accounting Harmonisation: An Empirical Study of Measurement Practice in France,
Germany and the UK‖, Accounting and Business Research, vol. 23, no. Winter: 49-58 [6] Emenyonu, E. & Gray, S. (1996) ―International Accounting Harmonisation and the Major Developed Stock Market
Countries: An Empirical Study‖, International Journal of Accounting, vol. 31, no. 3: 269-280 [7] Herrmann, D. & Thomas, W. (1995) ―Harmonisation of Accounting Measurement Practices in the European Community‖,
Accounting and Business Research, vol. 25, no. 100: 253-265 [8] Nobes, C. & Parker, R. (2008) ―Comparative International Accounting‖, London: Prentice Hall [9] Radebaugh, L., Gray, S. & Black, E. L. (2006) ―International Accounting and Multinational Enterprises‖, New York: John
Wiley and Sons, Inc. [10] Roberts, C., Weetman, P. & Gordon, S. (2005) ―International Financial Reporting – A Comparative Approach‖, Edinburgh:
Pearson Education Inc. [11] Whittington, G. (2005) ―The Adoption of International Accounting Standards in the European Union‖, European
Accounting Review, vol. 14, no. 1: 127-153 [12] Draft of the „Regulation of the Prostitution― Act [13] Accounting Act No. 563/1991 [14] Decree No. 500/2002, which implements certain provisions of Act No. 563/1991, on Accounting, as amended, for
accounting entities that are entrepreneurs keeping double-entry accounting [15] Act on Administration of Taxes and Payments No. 337/1992 [16] Income Taxes Act No. 586/1992 [17] Value Added Tax Act No. 235/2004 [18] www.iasplus.com

Alma Mintu-Wimsatt and Chris Myers
80
CONSUMERS’ INTENT TO PURCHASE NICHE APPAREL ONLINE: A CONCEPTUAL MODEL
Alma Mintu-Wimsatt and Chris Myers Texas A & M University – Commerce
ABSTRACT
Two trends in the apparel industry are noteworthy. First, the apparel industry is experiencing sales levels reaching a plateau.
As a result, apparel companies are now focusing marketing efforts on niche markets as a means to counter industry sales
trends.
Second, sales of apparel products via the Internet are expected to grow. Consequently, it can be expected that sales of niche
apparel products via the Internet is also expected to grow. Given these 2 trends, this paper presents a conceptual model on
what factors are expected to influence consumers‘ intent to purchase niche apparel products online. The proposed model focuses on consumer experience as well as attitudes and their impact on purchase intentions. Keywords: Niche Apparel, Internet, Experience, Attitudes, Purchase Intentions
INTRODUCTION
As traditional apparel retailing becomes increasing competitive and sales levels remain stagnant, marketers are exploring non-traditional means to reach their target markets. The growth of online retailing has provided the apparel industry with additional avenues to reach the consumer. Studies have touted the growth of on-line shopping and the growing purchases of those with Internet access (Yoh et al., 2003). In fact, apparel products have been consistently ranked as one of the most frequently purchased items through the Internet (Seckler, 2001). In addition of Internet retailing, apparel customization has also become another means to effectively provide some spike when sales levels off. Apparel customization requires manufacturers and retailers to create and develop specific products for niche categories. These niche product categories or sub-categories offer many unique growth opportunities and strategies for a mature market like the apparel industry (Parrish et al., 2006b). Since the online retailing trend is expected to continue in the coming years and customized apparel growth is becoming more evident, it would be interesting to examine consumer behavior within the contexts of Internet shopping and niche apparel products. That is, what factors affect shoppers‘ intent to purchase niche apparel products via the Internet?
EXPLORING INTERNET SHOPPING FOR A NICHE APPAREL MARKET
Apparel Shopping and the Internet
The apparel industry, particularly in the United States, can be characterized as a mature market severely faced with intense competition from domestic and foreign companies (Parrish et al., 2006a). As a result, apparel companies have employed niche marketing strategies to help direct their business. According to Kotler (2003), niche markets focus on a narrow group of consumers with distinct needs. Often, these needs are addressed through specialized product offerings. As a result, distinct marketing programs are presented to accommodate the specific needs of a sub-segment (Linneman & Stanton, 1992). A plethora of research studies have been conducted on the consumer profiles of general Internet shoppers. For example, Donthu and Garcia (1999) and Swaminathan et al. (1999) analyzed unique characteristics of Internet shoppers and non-shoppers. However, research on Internet shopping specifically on niche markets has been sporadic. This gap in the literature

Consumers‘ Intent to Purchase Niche Apparel Online: A Conceptual Model
81
is unfortunate given that Parrish et al. (2006a) have found that the key to the success of niche apparel firms lies in the understanding of the consumer. This study explores the behavior patterns of consumers in the hospital gown market.
PROPOSED HYPOTHESES
Yoh et al. (2003) proposed that psychological factors such as attitudes; social normative factors; and prior experience explain consumers‘ intention to purchase apparel products via the Internet. They suggest that behavior intentions are driven by two underlying determinants: (1) attitude toward the object or behavior such as Internet shopping, and (2) an individual's perception of normative social pressure to perform or not perform the particular behavior. This is consistent with Fishbein and Ajzen‘s (1975) Theory of Reasoned Action. Additionally, Yoh et al. (2003) also utilized Roger‘s (1995) Theory of Innovation Adoption in their model. Prior experience with an innovation is essential in building how-to knowledge and enhancing trialability as well as observability of the innovation. Therefore, prior experience is important in the knowledge and early persuasion stages in the product adoption process. Attitudes. There have been many ways of conceptualizing attitudes. Attitude, in the extant literature, generally focuses on a predisposition to respond favorably or unfavorably to an object, event or other aspect of one‘s surroundings (Ajzen 1988). Kwon et al. (1991) and Schmid (1999) found that individuals tend to have favorable thoughts and actions toward objects with which they have knowledge and involvement, and this is true of Internet apparel shopping (Yoh et al, 2003). The levels of knowledge and involvement would easily extend to attitudes regarding the niche apparel industry for hospital gowns because these garments have minimal changes over a long period of time. Therefore, it would be reasonable to expect that a consumer who has positive attitudes towards Internet apparel shopping will have similar attitudes towards niche apparel shopping. As a result, we propose that: H1: A positive relationship exists between attitude toward Internet apparel shopping and attitude toward Internet niche
apparel shopping. Prior Experience. Prior experience relates to the compatibility of an innovation and the attainment of the appropriate knowledge and skill (Tornatzky & Klein, 1982). Due to the strong history of mail order sales (Schmid, 1999), the transition from other shopping methods such as catalog and network to the Internet has been relatively smooth (Lohse et al., 2000). As a result, consumers‘ previous non-store retailing experience as well as their receptiveness for Internet apparel shopping will probably carry over to their attitudes toward niche apparels. H2: A positive relationship exists between prior Internet shopping experience and attitude toward Internet niche apparel
shopping. Purchase Intentions. The purchase intentions or trialability of an innovation is related positively to its rate of adoption or prior experience. Several authors have suggested that innovations, such as Internet purchase intentions for niche apparel, will be adopted and implemented more often and more quickly if it can be tried on ways or traditions in which the consumer is accustomed (He et al., 2006). Internet retailers have attempted to make this possible as evidenced by the similarities between at-home (e.g., catalog and network) shopping methods and Internet shopping methods (O'Cass and Fenech, 2003). Given the recent changes in the marketplace, we hypothesize that: H3: A positive relationship exists between attitude toward Internet niche apparel shopping and Internet purchase intentions
for niche apparel. Similar to Yoh et al.‘s (2003) study, we suggest that within the context of the niche apparel industry of hospital gowns, attitudinal and experience variables will have a positive influence on purchase intentions. However, we somewhat deviate from Yoh‘s (et al. (2003) model and contend that in some niche product categories, such as hospital gowns, there is little or no social pressure involved in the decision process for consumers for these products (Kotler, 2003). There is minimal social pressure but a conscious effort to find or satisfy an internal motivation, not social acceptance or status, but uniqueness or individualism. Because consumers in niche markets have a distinct set of needs, they may be more willing to pay a premium price to the firm that best satisfies those distinct set of needs (Kotler 2003). H4: Prior Internet experience and attitude toward Internet niche apparel shopping will have a positive influence on Internet
purchase intentions for niche apparel.

Alma Mintu-Wimsatt and Chris Myers
82
CONCLUSION
The trends in the market place reinforce the importance of proposing a model on factors influencing consumers‘ purchase intentions of niche apparel products. This model can then serve as a springboard for empirically testing the proposed hypotheses as well as fill in some of the gaps in the extant literature.
REFERENCES
Donthu, N., & Garcia, A. (1999). The Internet shopper. Journal of Advertising Research, 39, 52-58. Fishbein, M., & Ajzen, I. (1975). Beliefs, attitude, intention, and behavior: An introduction to theory and research. Reading,
MA: Addison-Wesley. Kwon, Y., Paek, S. L., & Arzeni, M. (1991). Catalog vs. non-catalog shoppers of apparel: Perceived risks, shopping
orientation, demographics, and motivations. Clothing and Textiles Research Journal, 10(1), 13-19. Lohse, G. L., Bellman, S., & Johnson, E. J. (2000). Consumer buying behavior on the Internet: Findings from panel data.
Journal of Interactive Marketing, 14(1), 15-29. O'Cass, A., & Fenech, T. (2003). Web retailing adoption: Exploring the nature of internet users Web retailing behaviour.
Journal of Retailing and Consumer Services, 10, 81-94. Parrish, E., Cassill, N., Oxenham, W. (2006), Niche market strategy for a mature marketplace. Marketing Intelligence &
Planning, 24, 694. Parrish, E., Cassill, N., Oxenham, W. (2006), Niche market strategy in the textile and apparel industry, Journal of Fashion
Marketing & Management, 10, 420, Schmid, J. (1999, January). Reaching into retail. Catalog Age, 62, 59-60. Swaminathan, V., Lepkowska-White, E., & Rao, B. P. (1999). Browsers or buyers in Cyberspace? An investigation of factors
influencing electronic exchange. Journal of Computer-Mediated Communication, 5(2). [Online]. Available: http://www.ascusc.org/jcmc/vol5/issue2/swaminathan.html.

The Contingency Theory of Leadership: A Practical Perspective
83
THE CONTINGENCY THEORY OF LEADERSHIP: A PRACTICAL PERSPECTIVE
William J. Carnes Metropolitan State College of Denver
ABSTRACT
One of the challenges of being a leader in an organization is motivating workers to perform at an acceptable level. Leadership
is more than just a simple additional duty that a person must complete. Fred Fielder (1967) opines that leadership is a
necessary skill needed for controlling others in task accomplishment. Situational leadership focuses on the leader‘s ability to adjust his or her leadership style, depending upon the situation, and the commitment level of his or her followers. Situational
leadership seems easy to understand. How could one not believe that situational leadership is effective, even if the research
is lacking? After all, we generally understand that different employees require different leadership styles, and that we adapt
our leadership style to fit our constituents the best. This paper compares and contrasts various leadership theories along with
some of the criticisms of situational leadership theory. Through various informal interviews and some formal interviews, the
author expresses and provides some support for the use of situational leadership.
Keywords: Leadership, Theory, Situational, Contingency
INTRODUCTION
One of the challenges of being a leader in an organization is motivating workers to perform at an acceptable level and then try to get the employees to perform above that level. Leadership is the process of leaders influencing individuals or groups in goal attainment (Northouse, 2001, p. 3). ). Edwin Locke (1991, p.2) defines leadership as ―…the process of inducing others to take action toward a common goal.‖ Because leadership is a process, ―…it is not a trait or a characteristic that resides in the leader, but is a transactional event that occurs between the leader and his or her followers‖ (Northouse, 2001, p.3). It is relational in that without followers, leadership does not exist and it is a process in that before we can lead, we have to have something to do and someone to do it (Locke, 1991). According to Fred Fielder (1967), leadership is a necessary skill needed for controlling others in the accomplishment of their individual tasks. In his book, Ben Franklin‘s Twelve Rules of Management, Blaine McCormick (2000, p. 48) relates that, ―Influence is more important than victory.‖ He lists three steps leaders can follow in dealing with workers. (1) ―Know your reasons and yourself,‖ (2) ―Assume you might be wrong,‖ and (3) ―Listen to the other person‘s position, and clarify your understanding with questions‖ (McCormick, 2000, pp. 52-53). To be a good leader, one must know oneself. In knowing yourself, you need to have the knowledge and skills to adapt to a given situation. You must be able to assess your strengths and weaknesses, and then take the appropriate action to capitalize on your strengths and improve your weaknesses. It is very important to realize that you may not be correct all of the time. However, perhaps the most relevant piece is in listening to the other person‘s position. This is where the concept of Situational Leadership really comes into play. As a leader, we must know the position of our constituent, especially in relation to his or her willingness and ability to accomplish his or her assigned tasks. McCormick further asserts that leaders should, ―…stop feeling and start reasoning‖ (p. 86). Feeling is personal, while reasoning is intellectual. Eliminating feelings makes the leaders job easier because his or her constituents can understand reasoning far better than they can understand someone else‘s feelings. When we eliminate feelings in leadership, we are in essence becoming situational leaders; we are adapting to the situation. The following descriptions of various leadership theories provide a basis for the intended research.
Situational Leadership Theory
Situational leadership focuses on the situation in which the leader finds him or herself in relation to his or her followers. Different situations call for the leader to use different tactics (Northouse, 2001), contingent upon the readiness level of the followers (Robbins & Judge, 2008). This model focuses on supportive and directive behaviors of the leader, emphasizing the leader‘s role in delegating, supporting, coaching and directing (Blanchard, Zigarmi & Zigarmi, 1985). A leader should adjust

William J. Carnes
84
the degree of directing and supporting dependent upon the changing needs of his or her constituents (Northouse, 2001. An effective leader is one who can adapt his or her leadership style to the needs of the employees (Northouse, 2001). Directive behaviors transpire when the leader is telling the employees what to do, what goals to accomplish, and the methods of evaluating the employee‘s performance. Supportive behaviors, on the other hand, emerge when the leader is helping the employees to feel good about themselves and their performance, along with feeling good about their work and their coworkers (Northouse, 2001, p. 57). In essence, situational leadership tells leaders to treat each worker differently depending on the task, as well as on the willingness and readiness of the worker to accomplish the task. Leaders need to help his or her employees in developing the necessary skills to perform their job, thus developing confidence and commitment in their jobs (Northouse, 2001. p. 61).
Contingency Theory
The traditional leadership theory views leadership as one person having an unequal amount of power over another or group of others, than the others have over him or her to direct and control the actions of the others (Fielder, 1967). In developing his contingency theory, Fielder explains that, ―…the [new] theory postulates two major styles of leadership. One of these is a leadership style which is primarily task oriented, which satisfies the leader‘s need to gain satisfaction from performing the task. The other is primarily oriented toward attaining a position of prominence and toward achieving good interpersonal relations‖ (Fielder, 1967. p. 13). Interestingly, Fielder thought it necessary to explain the difference between a successful
leadership act and an effective leadership act.
A successful leadership act is defined as one which results in group action or some appropriate change in group
behavior. The effective leadership act results in a desired effect. A good leader-member relationship will lead to a
greater proportion of accepted or successful leadership acts, while a poor leader-member relationship will lead to a
relatively small proportion of successful leadership acts. However, the effectiveness of the leadership act is not
dependent upon the leader-member relations. Rather, it depends upon the appropriateness and wisdom of the
suggestion or the order which the leader has given (Fielder, 1967. p. 31). Measuring effort is subjective. For example, doing pushups and straining on purpose to give the illusion that you are trying demonstrates some subjectivity. The author recalls being in the Army and watching an individual doing pushups during a physical fitness test. After a while the individual started to shake, his face was turning red and veins were popping out from his face. He then collapsed stating that he could not do any more pushups. For all practical purposes, it appeared that the individual was trying hard to do more pushups, but had reached his physical limitation. In other words, he appeared to be putting forth great effort. However, the author later learned that the individual did not want to do more pushups and brought these physical characteristics on himself to make it appear that he was still trying. Therefore, it is sometimes difficult for leaders to know when effort is truly present, or if it is merely an illusion on the worker‘s part. Fielder‘s Contingency theory is based on two premises; that group effectiveness depends on having the proper match between a leader‘s style of leadership and the degree of control the leader has over the situation (Robbins & Judge, 2009). The degree of control includes (1) leader–member relations, which includes the degree of trust and confidence the workers have in the leader; (2) task structure, which is the amount of structure or non structure in the jobs the workers are performing; and (3) and position power, which is the degree of formal power the leaders has of his or her constituents (Robbins & Judge, 2009). The leader is in a more favorable position when he or she has a high amount of control, the workers have a lot of respect for the leader, and the tasks the workers perform are highly structured. The key to Fielder‘s Contingency Theory is that leaders are the most successful when we match the job to the leader‘s style (Robbins & Judge, 2009).
Path Goal Theory
Robert House (1971) indicates that worker motivation is a direct result of leaders assisting the worker in goal accomplishment. The leader can increase worker motivation by clarifying goals, clarifying the worker‘s path toward a reward or by increasing the value and desire of the reward. Path-goal theory assumes that leaders can change their behaviors to match the specific situation, where Fielder‘s Contingency Theory assumes that we change the leader to match the situation.
Expectancy Theory
Expectancy theory relates that motivation of individuals relies more on their own expectations than the leader‘s ability to adapt to any specific situation or contingency (Robbins & Judge, 2009). However, the expected rewards do come from the leader and the worker needs to see the value in the reward for him or her.

The Contingency Theory of Leadership: A Practical Perspective
85
The central concept of expectancy theories is that the force on an individual to engage in a specific behavior is a
function of (1) his expectations that the behavior will result in a specific outcome; and (2) the sum of the valences,
that is, personal utilities or satisfactions, that he derives from the outcomes. Thus according to this theory of
motivation, an individual chooses the behaviors he engages in on the basis of (1) the valences he perceives to be
associated with the outcomes of the behavior under consideration; and (2) his subjective estimate of the probability
that his behavior will indeed result in the outcomes (House, 1971, p. 322). For the expectancy to exist, the worker must have the knowledge, ability and experience to perform at the necessary level, which will result in the worker arriving at the desired outcome. The higher the value the workers place on the reward the more effort and motivation the worker is willing to put forth. The worker must feel that the effort put forth will result in the promised reward and he or she must value the reward. Otherwise, there is no motivation for the worker to try to accomplish the goal.
Equity Theory
Equity Theory is another factor in employee motivation. Developed by J. Stacey Adams, Equity Theory speculates that equity exists when an individual believes that the ratio of his or her outcomes to inputs is equal to another‘s (Daft, 2008). For example, consider a worker performing at what he or she regards as a high level of input in order to receive a specific reward, or output for his or her performance. If a second individual is putting forth less effort, or input, but is receiving the same reward, the first individual will see this and inequitable. Equity theory focuses more on individual perception of inputs to outputs than on the leader‘s style, but the leader is monitoring inputs and outputs of all the employees under his or her charge. Therefore, the follower might also perceive inequity with the leader because of the difference in inputs and outputs between similar coworkers.
Theory X and Theory Y
Douglas McGregor explores a different side of leadership with his presumptions of Theory X and Theory Y. Theory X is a management perspective that assumes employees are inherently lazy, have little ambition, dislikes work, and must be forced to put forth effort, while Theory Y assumes quite the opposite. (McGregor, 1960, pp. 33-34) Theory X supervision begets Theory X behavior and Theory Y supervision begets Theory Y behavior. In other words, the supervisor‘s leadership ability drives worker behavior. Therefore, McGregor‘s theory indicates that leadership is situational in that worker behavior is a direct reflection of the leader‘s actions. It is situational in this context based on the perception of the leader, rather than the willingness and ability of the follower. However, the willingness and ability of the follower has a direct co-relation to the style of the leader. In essence, McGregor‘s Theory X and Theory Y model seems to be more of a hybrid of the Contingency model. Theory X leadership is not situational as there is little relation between the leader and follower in terms of meeting the needs of the follower. It is all about the leader. Theory Y, however, is situational in that the leader is more adaptive to the follower. In other words, the Theory Y leader would have a much easier time adapting to the situation than would the Theory X leader. Conversely, McGregor acknowledges situational leadership in other areas as well. For example, in his paper On Leadership, McGregor made this observation:
Before coming to Antioch[,] I had observed and worked with top executives as an adviser in a number of
organizations. I thought I knew how they felt about their responsibilities and what led them to behave as they did. I
even thought that I could create a role for myself that would enable me to avoid some of the difficulties they
encountered. I was wrong! (McGregor, 1966a, p. 67) What McGregor was referring to was that he really did not know what these leaders were experiencing. He found himself in a position where he thought he could use a hands-off or laissez-faire approach to leadership, but found that he instead had to be very involved in what was going on at the University. In other words, he was a situational leader.
HYPOTHESIS
Situational leadership focuses on the leader‘s ability to adjust his or her leadership style depending upon the situation and the commitment level of his or her followers. If employees are relatively new to the job, or lack training, the leader needs to use a more directive, or coaching style. If the employees have been on the job for some time, are experienced and reliable, and the leader should use more of a supporting, or delegating style (Blanchard et al, 1985, p. 46). It is the author‘s intention to show that situational leadership theory may be the best style of leadership to use in motivating employees.

William J. Carnes
86
METHODS
Over several years, the author informally discussed various leadership styles and traits with leaders in many different leadership positions. The results of these informal discussions, led the author to conduct formal interviews with four leaders to gather anecdotal evidence on leadership theories. The author selected four leaders who had extensive leadership experience in business and either the military or a health care setting. In addition, each of these leaders is currently in high-level leadership positions at the University level. The reason for selecting these leaders is their current positions and their backgrounds. The author interviewed each of the four leaders at their respective offices. The author asked a series of interview questions of the leaders to determine how they adjust their leadership style to various situations.
The author first asked about how each of the leaders perceived the difference between leadership in the military, business or health care, as compared to academia; followed with questions comparing leadership and management, and the importance of being a follower before becoming a leader. The author then asked questions related to leader adaptation and how each of the leaders dealt with poor performers.
Leadership Questions
1. You have had leadership experience in both the military and in academia, or in academia and health care. How do you see the difference in how you have to approach people in the different arenas, because in the military you have more control? How do you see the difference in how you have to approach leadership between the military, in the education area, healthcare or in business?
2. Do you think we are becoming more managers as opposed to leaders? 3. Do you think that before you can be a leader, you have to be a good follower? 4. Do you think that the leader adapts to the subordinate, or does the subordinate adapt to the leader? 5. How do you deal with poor performers? Poor performers are inherent to every organization. You have stellar performers
and you have the ones who just do enough to get by, and then you have the ones who are not always up to standard. How do you deal with the latter?
6. One of the issues I have had in the past, being the subordinate, is when a leader would tell me that I am not performing up to standard, but could not tell what I needed to do in order to meet the standard. To me, that shows that you have a person in a leadership position that really is not a leader. At the same time I think that perhaps that is why some of the leaders have the central tendency to rate everybody down the middle. How can we develop these leaders? How can a leader learn what he or she needs to know to do these things, to tell those people what they need?
7. I think, no action at all is more the norm for the majority as we have an inherent laziness and that we get comfortable with the way we are doing things. How do we implement change in the organization, while keeping the employees motivated and on track?
8. Much of the literature today tends to focus on finding solutions, rather than placing blame. However, I think for the most part we talk a good game about finding solutions, but our actions are indicative of placing blame. How do we make a firm commitment to finding solutions and leaving the blame out of the equation, or do we need to do so?
Subjects
Leader 1 is a 58-year-old male. He spent nearly 30 years in the US Army retiring with the rank of Major. He has spent time teaching High School and is currently the Campus Director for a private University. This leader‘s selection was because of his extensive leadership experience in the military, business and academic arenas. His insight is valuable in supporting my hypothesis that leadership delivery differs in these areas, even if the leadership styles are the same.
Leader 2 is a 58-year-old male. He spent twenty-three years in the U. S. Army retiring with the rank of Lieutenant Colonel. He has performed various roles in the military and in academia, and is currently the Regional President of a private University. This leader‘s selection was because he has extensive leadership experience in the military, business and academic arenas. He has always seemed to be a fair leader and one who cares for the welfare and development of his subordinates. Therefore, his insight was invaluable in supporting the hypothesis that leadership delivery differs in these areas, even if the leadership styles are the same.
Leader 3 is a 61-year-old male. He spent three years in the U. S. Army leaving with the rank of Captain. He has performed various roles in the military, in Health Services Management and in academia, and is currently the Chair of the Health Sciences Program for a private University. The selection of this person was due to his extensive leadership experience in the military, health services and academic arenas. His insight would be valuable in supporting the author‘s hypothesis that leadership delivery differs in these areas, even if the leadership styles are the same.

The Contingency Theory of Leadership: A Practical Perspective
87
Leader 4 is a 58-year-old male. He spent the majority of his career in health care, and is a Medical Doctor and has a PhD in Medicine. He performed in various roles in the academia and health care arenas and currently performs as the Chair of Surgical Technology, as well as the Clinical Director for the School of Health Sciences. His selection was because of his extensive leadership experience in health care and academia.
RESULTS
Each of the leaders interviewed provided good examples of how they adjust their leadership style to the situation and to the individual abilities of his constituents. Initially, each leader stated that there was no difference in the leadership style used in the different areas. However, it became apparent during the interviews that each of them was adapting his style depending upon the willingness and ability of the subordinates, and the situation. In addition, the author informally interviewed many other military and civilian leaders finding similar results. For the most part, it seems apparent that a combination of the various styles is necessary for the leader to be effective. The leader adapts to the situation and employees (Situational Leadership Theory), matches the leader to the optimal situation (Contingency Theory), and must set clear expectations for his or her followers (Path Goal Theory).
DISCUSSION
As previously mentioned, Edwin Locke (1991, p.2) defines leadership as ―…the process of inducing others to take action toward a common goal.‖ In addition, we can define leadership as our attempt at influencing another person‘s performance (Blanchard et al, 1985). When a person is not meeting expectations, it is generally because he or she cannot, or will not perform at the acceptable standard. Blanchard, et al (p. 49) refers to this as competence and commitment problems. ‖Competence is a function of knowledge and skills, which can be gained from education, training, and/or experience. Commitment is a combination of confidence and motivation‖ (Blanchard et al, 1985, p. 49). The lack of confidence and motivation ties in with McCormick‘s comments on admitting you might be wrong and listening to the other person‘s position (p. 86). You have to demonstrate your own competence, while at the same time showing your confidence in your constituents. You can fix competence problems through training and commitment problems through motivation. However, as the leader, you must be able to identify which problem exists and then adapt the appropriate strategy to remedy the situation.
Criticisms of Situational Leadership
Northouse (2001, pp. 61-63) outlines six different criticisms that focus on the weaknesses of situational leadership in relation to Blanchard et al‘s research.
(1) There have not been enough studies on situational leadership to justify the findings. Although true, it seems obvious that most leaders do adjust to the situation. If a leader cannot adjust to the willingness and ability of his or her subordinates, the leader‘s ability to accomplish the mission is at risk.
(2) The ambiguity of the subordinate‘s development levels. The problem is that it is difficult to determine developmental levels. While true, the leader can tell if the constituent is performing the tasks to the standard. When this happens, then adjustments need to occur to get the worker to the proper level of development and performance.
(3) The ambiguity of the commitment level of the subordinates, as the authors do not clearly define the term commitment. Commitment is difficult to define due to its being a two-way process. The employee has to have commitment to the employer and the employer must have commitment to the employee. As employee‘s, we will only commit to those, and perform to the best of our ability for those who commit to us and willingly provide us with fair compensation for our efforts.
(4) The clarity, or lack there of, of how the leadership style relates to the subordinates development level. Leaders are not the only factor that comes into play with employee development. The employee also has some responsibility in his or her performance. However, the leader must ensure that the employee is performing at the acceptable standard.
(5) The models failure to address group leadership along with one-on-one leadership. Group leadership brings about a different scenario. The leader must keep the group together, while motivating the individuals within the group. If the individuals are willing and able to perform their tasks, group leadership becomes easier.
(6) The questionnaires used in the research focused only on asking the respondents to select the best leadership style for a particular work-related situation. Ergo, the questionnaire may have biased the responses due to their being no other choices. Although there is merit to these criticisms, there are still many supporters for situational leadership as well.
Support for Situational Leadership
Situational leadership seems obviously easy to understand. How could one not believe that situational leadership is effective, even if the research is lacking? After all, we generally understand that different employees require different leadership styles,

William J. Carnes
88
and that we adapt our leadership style that best fits the constituent. That is just as situational as the tasks the workers are performing, or the objectives the leader is looking to complete. Of course, the Theory X leader will use only one style for all workers, that being the authoritative style. The employees who are self-directed and intrinsically motivated will soon become disgruntled with this type of leader and will leave the place of employment, or if they are not strong enough, may lose their motivation and become the worker the Theory X leader prefers. On the other hand, workers are also at different developmental levels and thus require different approaches to leadership. (Blanchard et al, 1985, p. 60) It does not take much supervision to lead workers who demonstrate a high level of skill, but the rookie needs more direction. ―Successful leaders are those who can adapt their behavior to meet the demands of their own unique environment‖ (Hersey & Blanchard, 1974, p. 27). Interestingly, upon beginning to interview this sample of four leaders (Personal interviews with Leaders 1, 2, 3, & 4, 2007) and asking questions about how they might need to lead differently in the military, academia or health care settings, all responded the same; that there is no difference. However, during the interview, it was clear that they were all using situational leadership and found it necessary to adjust their leadership styles depending on the subordinate, the situation, or the tasks the subordinates were performing. Leader 2 (2007) summed it up best saying, ―…I think the military, civilian, or anything, if you know what you‘re doing, you give the guidance, you care about the people, and they know you care about the people, I don‘t think the leadership is much different.‖ One conclusion that might come from the interview is that all of the leaders felt their leadership styles were effective across the areas, but the specific situations dictated a change in venue. It did not matter if it was a military setting, an academic setting, or a health care setting the leadership style remained steady until a specific situation warranted another approach. Leader style changed on a case-by-case basis. This reinforces the fundamental definition of situational leadership (Blanchard et al, 1985) in that, leadership is something you do with your subordinates, rather than something you do to them. At no time did any of the leaders mention changing the leader to meet the situation; rather the leader‘s style would change. Leader 1 (2007) provided a story of a government organization he was in charge of that was going to downsize and merge with another organization out of state. He reinforced the importance of situational leadership and the need to be honest and up front with his constituents in what was going to happen. In addition, he kept them apprised of all changes and became the rumor control officer to help keep the employees aware and up to date. In the end, the transition was smooth and some of the workers who were reluctant to move initially, made the move to the new state when the change was complete. Leader 1‘s caring attitude and his willingness to adapt to the situation and the workers contributed to the overall success of the change. Additionally, his understanding the commitment and competence levels of his subordinates helped him in adapting to and addressing their individual needs. During the interviews, the author found some commonality in how the leaders approached leadership and performance. Blanchard et al outlined this commonality the best by stating, ―There are three parts to performance review: Performance Planning, Day-to-Day Coaching, and Performance Evaluation‖ (1985, p 86). All four leaders felt it important to establish a performance plan and set goals for every employee. They also felt that coaching is an ongoing process and without the coaching, a leader cannot hope to influence his or her employees to perform to their full potential. If the leader properly implements and manages the performance plan, performance evaluations should be positive. Another area all of the leaders agreed upon was in disciplining the poor performer. Each looked at establishing some type of performance improvement plan to aid the worker in improving his or her performance to an acceptable level. In addition, all of the leaders agreed that at some point, the best decision to make for the worker, the organization and the leader, is to let the person go. Termination is of course the last resort, but a resort that the leader cannot be afraid to take. Termination is a situation that the leader must be deal with.
Summary
Fielder‘s Contingency theory seems to focus more on adapting the situation to the leader, focusing more on the leader than on the follower. House‘s Path-Goal Theory focuses more on the leader taking the necessary steps to cause the follower to accomplish the goals set by the leader. Both focus on the needs of the leaders. Expectancy theory and equity theory both focus on the follower; how the follower perceives the work situation. Hersey and Blanchard‘s (1974) Situational Leadership Theory focuses on both the leader and the follower. Rather than adapting the situation to the leader, the leader is adapting to the situation; more specifically, the situation as it relates to the readiness and willingness of the subordinate.

The Contingency Theory of Leadership: A Practical Perspective
89
CONCLUSION
The most notable commonality was the relationship the leaders felt it necessary to develop with their subordinates. McGregor reinforces this philosophy in his paper, An Analysis of Leadership, stating, ―Leadership is a relationship‖ (McGregor 1966b, p. 73). McGregor (1966b, p. 73) further asserts that, leadership is not something that one owns. A leader cannot own leadership. Leadership by definition is ―…a complex relationship among…four major variables…characteristics of the leader, the followers, the organization and ―…the social, economic, and political milieu.‖ Again, leadership appears to be more situational and dependent upon the followers, than leader focused. It is also relational. Leaders need to understand that their leadership style or method of delivery may need adjusting based on the current situation. If the workers are at different levels of development, then different methods of leading are required (Blanchard et al, 1985, p. 60). The biggest difference found occurred in the interview with Leader 3. In his experience, in medical administration, he found that health care professionals were highly motivated and that there was little or no need for any corrective action and when needed it was generally initiated with only a suggestion from the leader. Because of their education and professional stature, they accepted corrections as a part of their everyday business. Therefore, leaders met little resistance when making suggestions (Leader 3, 2007). Although there may not be support for the original hypothesis as presented, it is clear that leaders do need to adapt to the situation. Therefore, situational leadership is crucial in any successful organization. The use of situational leadership may not be because of the specific situation, but the difference in the individuals with whom the leader is working that dictates its use. While the military, academia, or business leadership styles may be the same, the application to individuals still differs. Since this is an anecdotal study, to test the waters, the author finds sufficient evidence to expand the research in different ways. First, the author will create scenarios involving four or five different situations to present to the subject leaders in a future study. The author will then assess the responses of the leaders to determine if in fact they are using one of the contingency theories of leadership by changing their leadership style to fit the situation, or if the leader is merely stating how he or she wants to perform. It is possible that leaders state that they adapt to the situation, but in practice revert to either a Theory X or a Theory Y style (McGregor, 1961). Using the different scenarios, along with expanding the subject pool of leaders in the study should provide empirical evidence that leaders do adapt to the situation.
REFERENCES
Blanchard, K., Zigarmi, P. & Zigarmi, D. (1985). Leadership and the one minute manager: Increasing effectiveness through situational leadership. New York: William Morrow.
Daft, R. L. (2008). Management (8th Ed.). Mason, OH: Thomson South-Western Publishing. Fielder, F. E. (1967). A theory of leadership effectiveness. NY: McGraw-Hill. Hersey, P. & Blanchard, K. H. (1974). ―So you want to know your leadership style? Training and Development Journal. 28(2):
22. Retrieved October 21, 2008, from:. House, R. J. (1962). ―An experiment in the use of management training standards.‖ The journal of the Academy of
Management. 5(1): 76. Retrieved October 21, 2008, from: http://proquest.umi.com/pqdweb?did=952079&sid=1&Fmt=2&clientId=5728&RQT=309&VName=PQD.
House, R.J. (1971). ―A path goal theory of leader effectiveness.‖ Administrative Science Quarterly. 16(3): 321. Retrieved October 21, 2008, from: http://proquest.umi.com/pqdweb?did=952079&sid=1&Fmt=2&clientId=5728&RQT=309&VName=PQD.
Kouzes, J. M. & Posner, B. Z. (2002). The leadership challenge: 3rd Ed. San Francisco: Jossey-Bass. Locke, E. A. (1991). The Essence of Leadership: The four keys to leading successfully. New York: Lexington Books. McCormick, B. (2000). Ben Franklin‘s twelve rules of management: The founding father of American business solves your
toughest problems. Canada: Entrepreneur Press. McGregor, D. (1960). Human side of enterprise. New York: McGraw-Hill Book Company. McGregor, D. (1966). On leadership. In W. G. Bennis & E. H. Schein (Eds), Leadership and motivation: Essays of Douglas
McGregor. Cambridge, MA: The M.I.T. Press. McGregor, D. (1966). An analysis of leadership. In W. G. Bennis & E. H. Schein (Eds), Leadership and motivation: Essays of
Douglas McGregor. Cambridge, MA: The M.I.T. Press. Northouse, P. G. (2001). Leadership: Theory and Practice: 2nd Edition. Thousand Oaks: Sage Publications. Robbins, S. P. & Judge, T. A. (2009). Organizational Behavior (13th Ed.). Upper Saddle River: Pearson Prentice Hall.

Dev Prasad, Yash R. Puri and Ravi Jain
90
AN EXAMINATION OF THE LIQUIDITY OF FIRMS AROUND A FINANCIAL CRISIS
Dev Prasad, Yash R. Puri and Ravi Jain University of Massachusetts Lowell
ABSTRACT
There is a severe financial crisis that is plaguing the globe. The stock markets around the world continue to be in a downward
spin despite billions of dollars having been poured in or in the process of being poured in as Governments offer bailouts
mainly to financial institutions and some to firms. The 'liquidity' of banks and firms is being blamed as root cause of all
troubles for the current crisis.
Studies of the earlier 1997 Asian financial crisis also laid the blame on 'liquidity' along with other factors. However, there
appear to be only a few studies which have examined 'liquidity' at the firm level, mainly that of financial institutions, but these
have been limited to a few year prior to the crisis period or a few years around the crisis period. Also, the immediate after-
effects of the financial crisis may only be the short-term reaction. Firms may react in one way to immediate after-effects of the
financial crisis and then further react, possibly in a different way, based on the lessons they have learned from their
experience of financial crisis.
Thus, this paper expects to contribute to the literature by taking a longer perspective of the post-crisis period to examine the
'liquidity' of firms in Indonesia, Thailand and Korea before and after the crisis. The results show that there is a significant
difference in the short-term reaction and the longer term reaction to the crisis in the post-crisis period. Further, the speed of
recovery and return of liquidity varies from country to country.
Keywords: Financial crisis, Liquidity, Korea, Indonesia, Thailand
INTRODUCTION
Currently, there is a severe financial crisis that is plaguing the globe. The current crisis was spawned in the USA and the shocks have sent tremors across the globe. In the short span from October 2007, the economies of USA, UK, the European Union, Japan and several other countries have been reeling. Stock markets are in a downward spiral with no end in immediate sight. Governments of USA, UK, the European Union, Japan and several other countries have acted individually, in concert or through the IMF poured billions of dollars in an effort to contain the crisis and taken measures such as several interest rate cuts etc. Even the bailing out of financial institutions has continued to leave industrial and commercial firms in a ‗liquidity‘ crunch as per their management. The 'liquidity' of banks and firms is being blamed as root cause of all troubles for the current crisis. Hundreds of firms have filed for bankruptcy. Job losses are in the millions. Home foreclosure signs are popping up more and more. Both economically and socially, the impact of the current crisis certainly is proving very costly worldwide. A decade or so ago there was another financial crisis which started in Asia in 1997 but its effects also reached around the Globe. The financial crisis spread from Asia to Latin America, to Europe and the USA. Earlier studies of the Asian financial crisis and subsequent crises in Latin America and Europe mainly examine the same from a macroeconomic perspective. There are only a few studies at the microeconomic level which examine changes at the firm level. These studies generally have been limited to a few years surrounding the crisis year or to the pre-crisis period. None of them appear to have examined how the firms level changes in the after-math of the crisis in the longer run. Though studies of the earlier 1997 Asian financial crisis also laid the blame on 'liquidity' along with other factors, there appear to be only a few studies which have examined 'liquidity' at the firm level. However, they have mainly focused on the ‗liquidity in the economy‘ or the liquidity of financial institutions. Thus, this study is motivated to fill this gap in the literature. This study examines changes in the liquidity of firm during the pre-crisis period, the crisis period and the post-crisis period not only in the short-term

An Examination of the Liquidity of Firms Around a Financial Crisis
91
but also in the intermediate and the longer term. The short-term reaction of firms is likely to be dominated by the immediate after-effects of the financial crisis, including the impact of government intervention. However, in the longer run for the post-crisis period firms are likely to have greater internal control of their financial policies. It would interesting to know if a lesson was learnt by firms and if they adopted ‗safer‘ liquidity patterns in the long run or did they just return to ‗business as usual‘ once the crisis was over. This study examines changes in the liquidity patterns of firms over time in the three Asian countries. Indonesia, Korea and Thailand which faced a financial crisis during the same year: Thailand (July 1997), Indonesia (August 1997), and, Korea (November 1997). These countries suffered the most from the financial crisis [Brimmer (1998)]. The rest of the paper is organized further as follows: A brief review of prior studies relating to the 1997 Asian financial crisis is laid out in the first section followed by a section which details the data for the study, the variables examined, and the methodology employed for the analysis are presented. Thereafter, the results of the study are discussed. In the final section, the conclusions of the study are presented. Some ideas for further research are also presented in this section.
LITERATURE REVIEW
Prasad et al (2009) summarize the finds of some of the earlier studies which offered suggestions regarding the main contributing factors to the financial crises in Asia. Briefly the factors include loose government regulations; laxness in government and financial institution supervision; openness; undisciplined financial practices such as risky financial structures; speculative and risky investments; weak corporate governance; ‗crony capitalism‘ and corruption. Djiwandono (2004) also brings out the suspicions of the general public about corruption involving bankers and officials of Bank Indonesia when the latter provided liquidity support to struggling banks during the financial crisis. Some of the earlier studies include discussions of ‗liquidity,‘ as related to the financial crisis, in terms of market liquid ity rather than firm level liquidity. For example, Brimmer (1998) suggests that the economies of Thailand, Indonesia and South Korea were able to expand rapidly with liquidity provided to aggressive lending by banks – both domestic and foreign as well as foreign investments in the pre-crisis period. Rodrik (1999) suggests that trade orientation did not have much to do with the severe liquidity problems and that the international capital markets did not do a good job of separating bad and risky ventures from the good. In the case of South Korea, Kang et al (2005) identify two steps as being particularly in improving the liquidity of the markets in the post-crisis period. The two steps of ‗reopening system‘ and ‗mandatory electronic exchange trading system for benchmark issues‘ helped expand the government bond market. Brimmer (1999) also suggests that the turnaround after the crisis was fueled by a multibillion dollar infusion by the international community. Help also came in the forms of infusions by the International Monetary Fund (IMF) through their structural adjustments Programs (SAPs) to the tune of billions of dollars [Prasad et al (2006); Khambata and LaCrosse (2001)]. Kawai (2009/2009) argues in favor of stronger regional liquidity as a part of a strategy to stabilize global finance and avoiding future financial crises. In their study of the Thai stock market for a short period around the financial crisis, Pavabutr and Yan (2007) stress the importance of foreign flows in enhancing market liquidity. A few studies discuss liquidity issues at the firm level. Shaw (1999) suggests that liquidity problems, at the end of 1997, forced many companies to undergo major financial restructuring. Yi (2005) suggests that firms can ensure an adequate level of working capital by adopting proper debt maturity structures, and, that the financial crises caused by a mismatch of debt maturities with asset maturities. Bonin and Imai (2007) suggest that the news related to Korean banks‘ efforts to comply with the insistence by the IMF on foreign control had a larger impact on firms which had lesser profitability and liquidity. Ang et al (2004) - in their study of the shares in the Indonesian, Malaysian and Thai stock markets – find that asset liquidity causes returns to behave differently during quiet and extraordinary periods. They further found the presence of price bubbles mainly in the case of most liquid and most volatile shares. As may be seen from the above, none of the earlier studies appear to have examined how the liquidity patterns of firms have changed in the after-math of the crisis in the longer run. Thus, this study is motivated to fill this gap in the literature by examining whether the financial crisis in a country led to a changes in the financing patterns of firm located in that country not only in the short-term but also in the intermediate and the longer term. As has been mentioned earlier, the short-term reaction of firms may be dominated by the immediate after-effects of the financial crisis, including the impact of government intervention possibly as a consequence of the IMF SAPs. However, in the longer run for the post-crisis period firms may be

Dev Prasad, Yash R. Puri and Ravi Jain
92
have greater internal control of their financing patterns as the financial markets stabilize. If so, a question that arises is whether the firms would adopt ‗safer‘ financing patterns or return to their ‗good old ways.‘
DATA AND METHODOLOGY
As mentioned earlier, this study is motivated to examine changes in the liquidity patterns of firms over time in three Asian countries, viz. Indonesia, Korea and Thailand suffered the most from the 1997 Asian financial crisis. The financial data for the industrial companies located in these countries was obtained from the Compustat (Global) database for the 1994-2004 period.
Six ratios are used to examine the changes in the liquidity of firms: (i) Current ratio = [Current Assets/ Current Liabilities], (ii) Quick ratio = [(Current Assets - Inventories)/ Current Liabilities], (iii) Net Working Capital / Sales = [(Current Assets - Current Liabilities) /Sales], (iv) Times-Interest-Earned = [Operating Income/ Interest], (v) Collection period = [Accounts Receivable/ (Sales/ 365)], and, (vi) Inventory turnover = [Cost Of Goods Sold/ Inventories].
CONCLUSIONS
This paper is expected to contribute to the literature by showing how the financial crisis led to changes in the liquidity structure of Asian firms. The results show that firms in different countries reacted similarly, though the levels of reaction were different and so were the times involved in the reaction, to the financial crises in their countries. This is in line with Prasad et al (2006) and Prasad et al (2009) studies which found evidence of a country effect in their studies of capital structure/ financing structure in Asia. Aziz (2008) also observes that recovery in Indonesia is the slowest amongst the countries which faced a crisis. It is interesting to note the changes at the firm level in reaction to the crisis. Further changes are observed as the crisis eased which suggest that firms have adopted safer ‗liquidity‘ policies in the longer run rather than returning to their old ways.
Panel ‗A‘s of Tables 2 to 7 show an apparent convergence in the aggregate ‗liquidity‘ policies by firms in the countries studied. The Prasad et al (2006) study also suggests a similar possibility with regard to capital structure. Thus, further research is suggested for a formal testing of convergence. Further, in future research, an examination of the changes in profitability of firms may suggest the time required for firms to recover from a financial crisis and start growing again.
Possibly many of the economic, social and financial problems relating to the current global crisis could have been avoided if early warning signals had been in place and lessons had been learnt from the past financial crises.
REFERENCES
James S Ang, Alireza Tourani-Rad, and Jean C Yu., ―Some Lessons from Price Bubbles and Market Crashes in Southeast Asia.‖ Managerial Finance. Patrington: 2004. Vol. 30. Iss. 7; p. 1
Iwan J Azis, ―Indonesia's Slow Recovery After Meltdown.‖ Asian Economic Papers. Cambridge: Winter 2008. Vol. 7, Iss. 1; p. 79
Garrick Blalock, Paul J Gertler, David I Levine, ―Financial constraints on investment in an emerging market crisis.‖ Journal of
Monetary Economics. Amsterdam: Apr 2008. Vol. 55, Iss. 3; p. 568 John P Bonin, Masami Imai, ―Soft related lending: A tale of two Korean banks.‖ Journal of Banking & Finance. Amsterdam:
Jun 2007. Vol. 31, Iss. 6; p. 1713 Andrew F Brimmer, ―Bank lending and the Asian economic crisis.‖ North American Journal of Economics and Finance.
Greenwich: 1998. Vol. 9, Iss. 1; p. 105 (15 pages) J Soedradjad Djiwandono, ―Liquidity support to banks during Indonesia's financial crisis.‖ Bulletin of Indonesian Economic
Studies. Canberra: Apr 2004. Vol. 40, Iss. 1; p. 59 Kenneth Kang, Geena Kim, Changyong Rhee, ―Developing the Government Bond Market in South Korea: History,
Challenges, and Implications for Asian Countries.‖ Asian Economic Papers. Cambridge: Spring/Summer 2005. Vol. 4, Iss. 2; p. 91
Masahiro Kawai, ―Evolving Regional Financial Architecture in East Asia.‖ Regional Outlook. Singapore: 2008/2009. p. 77 (8 pages)
Dara Khambata, Martha LaCrosse, ―An emerging equity market in distress: The case of Korea.‖ Journal of East - West
Business. Binghamton: 2001. Vol. 7, Iss. 3; p. 5 Pantisa Pavabutr, Hong Yan, ―The Impact of Foreign Portfolio Flows on Emerging Market Volatility: Evidence from Thailand.‖
Australian Journal of Management. Sydney: Dec 2007. Vol. 32, Iss. 2; p. 345 (24 pages)

An Examination of the Liquidity of Firms Around a Financial Crisis
93
Dev Prasad, Yash R. Puri, and Walayet A. Khan, 2006, ―Firm Level Effects of the IMF Mandated Macroeconomic Reforms in Emerging Markets,‖ The Journal of Current Research in Global Business 8, 75-84.
Dev Prasad, Yash R. Puri, and Ravi Jain, 2009, ―Impact of Financial Crisis on Aggregate Financing Pattern of Firms,‖ Working
Paper. Dani Rodrik, ―The Asian financial crisis and the virtues of democracy.‖ Challenge. Armonk: Jul/Aug 1999. Vol. 42, Iss. 4; p. 44
(16 pages) Alison Shaw, ―Leading Asia out of the gloom.‖ International Financial Law Review. London: Jan 1999. Vol. 18, Iss. 1; p. 33 Junesuh Yi, ―A Study on Debt Maturity Structure.‖ Journal of American Academy of Business. Cambridge. Hollywood: Sep
2005. Vol. 7, Iss. 2; p. 277 (9 pages)
Table 1: Sample Distribution
Panel A: Distribution by year
Year Indonesia Korea Thailand
Sample Sample Sample
1994 57 13 138
1995 61 17 144
1996 95 19 178
1997 156 87 275
1998 178 113 278
1999 181 172 270
2000 189 204 263
2001 199 218 265
2002 211 224 260
2003 211 219 279
2004 201 216 272
Panel B: Distribution by crisis-period
Indonesia Korea Thailand
Sample Sample Sample
Pre-crisis (1994-96) 213 49 460
Crisis (1997) 156 87 275
ST reaction (1998) 178 113 278
MT reaction (1999-01) 569 594 798
LT reaction (2002-04) 623 659 811
Table 2: Current Ratio
Panel A
CURRENT RATI O
0
0.5
1
1.5
2
2.5
pre-crisis crisis st-reaction mt-reaction lt-reaction
IDN
KOR
THA

Dev Prasad, Yash R. Puri and Ravi Jain
94
Panel B: Comparison with the pre-crisis value
Country Pre-crisis Crisis Short-term
Reaction
Medium-term
Reaction
Long-term
Reaction
Indonesia N 213 156 178 569 623
Mean 1.981 1.409*** 1.269*** 1.699** 2.084
Median 1.637 1.117*** 0.826*** 1.196*** 1.516**
Korea N 49 87 113 594 659
Mean 1.116 1.051 1.322 1.506*** 1.812***
Median 1.086 0.937 1.018 1.032 1.232***
Thailand N 460 275 278 798 811
Mean 1.399 1.193** 1.257 1.714*** 1.985***
Median 1.142 0.904*** 0.830*** 1.19 1.411***
Notes:
(i) Current ratio = Current Assets / Current Liabilities
(ii) Significance of difference in means and medians is calculated using the two-tailed t-test and Wilcoxon Signed Rank Sum Test, respectively.
(iii) *, **, and *** mean significantly different from the pre-crisis value at 10%, 5%, and 1% level respectively.
Table 3: Quick Ratio
Panel A:
QU IC K R A TIO
0
0.2
0.4
0.6
0.8
1
1.2
1.4
1.6
pre-crisis crisis st-reaction mt-reaction lt-reaction
IDN
KOR
THA
Panel B: Comparison with the pre-crisis value
Country Pre-crisis Crisis Short-term
Reaction
Medium-term
Reaction
Long-term
Reaction
Indonesia N 213 156 178 569 623
Mean 1.442 0.972*** 0.87*** 1.114*** 1.372
Median 1.142 0.748*** 0.483*** 0.711*** 0.889***
Korea N 49 87 113 594 659
Mean 0.898 0.84 1.019 1.156*** 1.433***
Median 0.825 0.737 0.801 0.785 0.942**
Thailand N 460 275 278 798 811
Mean 0.967 0.829* 0.846 1.138** 1.329***
Median 0.709 0.544*** 0.527*** 0.707 0.881***
Notes:
(i) Quick ratio = (Current Assets – Inventories) / Current Liabilities
(ii) Significance of difference in means and medians is calculated using the two-tailed t-test and Wilcoxon Signed Rank Sum Test, respectively.
(iii) *, **, and *** mean significantly different from the pre-crisis value at 10%, 5%, and 1% level respectively.

An Examination of the Liquidity of Firms Around a Financial Crisis
95
Table 4: Net Working Capital / Sales
Panel A:
Net Working Capital / Sales
-0.8
-0.6
-0.4
-0.2
0
0.2
0.4
0.6
pre-crisis crisis st-reaction mt-reaction lt-reaction
IDN
KOR
THA
Panel B: Comparison with the pre-crisis value
Country Pre-crisis Crisis Short-term
Reaction
Medium-term
Reaction
Long-term
Reaction
Indonesia N 213 156 178 569 623
Mean 0.353 0.021*** -0.650*** -0.531*** 0.028***
Median 0.254 0.079*** -0.123*** 0.059*** 0.137***
Korea N 49 87 113 594 659
Mean 0.021 -0.028 0.057 0.111** 0.161
Median 0.004 -0.03 0.014 0.014 0.072**
Thailand N 460 275 278 798 811
Mean 0.039 -0.286*** -0.575*** -0.281*** 0.103*
Median 0.06 -0.064*** -0.084*** 0.06 0.118***
Notes:
(i) Net Working Capital / Sales = (Current Assets – Current Liabilities) / Sales
(ii) Significance of difference in means and medians is calculated using the two-tailed t-test and Wilcoxon Signed Rank Sum Test, respectively.
(iii) *, **, and *** mean significantly different from the pre-crisis value at 10%, 5%, and 1% level respectively.
Table 5: Times-Interest-Earned
Panel A:
Times-Interest-Earned
0.000
20.000
40.000
60.000
80.000
100.000
120.000
140.000
160.000
pre-crisis crisis st-reaction mt-reaction lt-reaction
IDN
KOR
THA

Dev Prasad, Yash R. Puri and Ravi Jain
96
Panel B: Comparison with the pre-crisis value
Country Pre-crisis Crisis Short-term
Reaction
Medium-term
Reaction
Long-term
Reaction
Indonesia N 213 156 178 569 623
Mean 10.632 7.353 19.000 27.950* 37.154**
Median 3.130 1.858*** 1.116*** 1.455*** 1.312***
Korea N 49 87 113 594 659
Mean 5.912 3.961 4.603 38.684*** 73.958***
Median 1.030 1.401 0.994 1.736* 4.523***
Thailand N 460 275 278 798 811
Mean 21.681 42.708 47.052 91.979*** 146.388***
Median 2.115 1.206*** 0.502*** 1.507** 4.422***
Notes:
(i) Times-Interest-Earned = Operating Income / Interest
(ii) Significance of difference in means and medians is calculated using the two-tailed t-test and Wilcoxon Signed Rank Sum Test, respectively.
(iii) *, **, and *** mean significantly different from the pre-crisis value at 10%, 5%, and 1% level respectively.
Table 6: Collection Period
Panel A:
Collection Period
0
20
40
60
80
100
120
140
160
pre-crisis crisis st-reaction mt-reaction lt-reaction
IDN
KOR
THA
Panel B: Comparison with the pre-crisis value
Country Pre-crisis Crisis Short-term
Relation
Medium-term
Reaction
Long-term
Reaction
Indonesia N 213 156 178 569 623
Mean 100.93 135.847*** 95.65 72.26*** 67.042***
Median 83.456 104.442*** 64.355** 51.255*** 52.888***
Korea N 49 87 113 594 659
Mean 85.28 98.115 87.465 78.514 67.733
Median 64.271 78.067** 66.245 61.529 56.579
Thailand N 460 275 278 798 811
Mean 108.652 107.524 93.278** 77.253*** 66.532***
Median 75.691 85.811 64.124*** 59.681*** 56.134***
Notes: (i) Collection Period = Accounts Receivables / (Sales/365) (ii) Significance of difference in means and medians is calculated using the two-tailed t-test and Wilcoxon Signed Rank Sum Test, respectively. (iii) *, **, and *** mean significantly different from the pre-crisis value at 10%, 5%, and 1% level respectively.

An Examination of the Liquidity of Firms Around a Financial Crisis
97
Table 7: Inventory Turnover
Panel A:
Inventory Turnover
0
5
10
15
20
25
30
35
40
45
pre-crisis crisis st-reaction mt-reaction lt-reaction
IDN
KOR
THA
Panel B: Comparison with the pre-crisis value
Country Pre-crisis Crisis Short-term
Reaction
Medium-term
Reaction
Long-term
Reaction
Indonesia N 213 156 178 569 623
Mean 5.223 4.644 5.797 11.456** 13.092***
Median 3.402 2.635*** 3.343 4.046*** 4.929***
Korea N 49 87 113 594 659
Mean 41.319 21.462 23.019 18.639* 23.667
Median 9.948 7.558 8.405 7.425 8.188
Thailand N 460 275 278 798 811
Mean 8.586 10.864 9.881 10.335 14.323***
Median 3.883 4.164 4.809*** 4.996*** 5.428***
Notes: (i) Inventory Turnover = Cost of goods sold/Inventory (ii) Significance of difference in means and medians is calculated using the two-tailed t-test and Wilcoxon Signed Rank Sum Test, respectively. (iii) *, **, and *** mean significantly different from the pre-crisis value at 10%, 5%, and 1% level respectively.
Table 8: Comparison with the short-term reaction value
Panel A: Current Ratio
Country Short-term
Reaction
Medium-term
Reaction
Long-term
Reaction
Indonesia N 178 569 623
Mean 1.269 1.699*** 2.084***
Median 0.826 1.196*** 1.516***
Korea N 113 594 659
Mean 1.322 1.506 1.812***
Median 1.018 1.032 1.232***
Thailand N 278 798 811
Mean 1.257 1.714*** 1.985***
Median 0.830 1.19*** 1.411***

Dev Prasad, Yash R. Puri and Ravi Jain
98
Panel B: Quick Ratio
Country Short-term
Reaction
Medium-term
Reaction
Long-term
Reaction
Indonesia N 178 569 623
Mean 0.870 1.114** 1.372***
Median 0.483 0.711** 0.889***
Korea N 113 594 659
Mean 1.019 1.156 1.433***
Median 0.801 0.785 0.942***
Thailand N 278 798 811
Mean 0.846 1.138*** 1.329***
Median 0.527 0.707*** 0.881***
Panel C: Net Working Capital / Sales
Country Short-term
Reaction
Medium-term
Reaction
Long-term
Reaction
Indonesia N 178 569 623
Mean -0.650 -0.531 0.028***
Median -0.123 0.059*** 0.137***
Korea N 113 594 659
Mean 0.057 0.111 0.161***
Median 0.014 0.014 0.072***
Thailand N 278 798 811
Mean -0.575 -0.281*** 0.103***
Median -0.084 0.06*** 0.118***
Panel D: Times-Interest-Earned
Country Short-term
Reaction
Medium-term
Reaction
Long-term
Reaction
Indonesia N 178 569 623
Mean 19.000 27.950 37.154
Median 1.116 1.455** 1.312
Korea N 113 594 659
Mean 4.603 38.684*** 73.958***
Median 0.994 1.736*** 4.523***
Thailand N 278 798 811
Mean 47.052 91.979* 146.388***
Median 0.502 1.507*** 4.422***

An Examination of the Liquidity of Firms Around a Financial Crisis
99
Panel E: Collection Period
Country Short-term
Reaction
Medium-term
Reaction
Long-term
Reaction
Indonesia N 178 569 623
Mean 95.65 72.26*** 67.042***
Median 64.355 51.255*** 52.888***
Korea N 113 594 659
Mean 87.465 78.514 67.733***
Median 66.245 61.529 56.579***
Thailand N 278 798 811
Mean 93.278 77.253** 66.532***
Median 64.124 59.681* 56.134***
Panel F: Inventory Turnover
Country Short-term
Reaction
Medium-term
Reaction
Long-term
Reaction
Indonesia N 178 569 623
Mean 5.797 11.456*** 13.092***
Median 3.343 4.046*** 4.929***
Korea N 113 594 659
Mean 23.019 18.639 23.667
Median 8.405 7.425 8.188
Thailand N 278 798 811
Mean 9.881 10.335 14.323***
Median 4.809 4.996 5.428**

Khalid Alrawi
100
TOWARDS STRATEGIC MANAGEMENT OF STANDARDS ACTIVITIES IN THE INTERNATIONAL BUSINESS
Khalid Alrawi Al-Ain University of Science and Technology,
ABSTRACT
There is a considerable interest and debate over the effectiveness of culture upon standardization in the international
business (IB), and a growing awareness that the term 'standards' connotes much more than just the documents that
prescribes technical requirements and specialized test methods that demonstrate compliances. A Quasi-experimental design
is used to test a series of hypotheses based on a sample of Indian and Arab employees in the UAE. It is found that despite
the existence of cultural differences at the ethnic level, culture does not appear to have a significant impact on (ST) decisions
by management.
This study aims at verifying whether there are any relationships between cultural dimensions and standardization (ST). The
researcher believes that (ST) as a strategy may be different from being cultural concept, but understanding cultural
differences may increase a company's competitiveness. The study also provides evidence which further validates a scale
used for the measurement of culture.
Keywords: Standards, Standardization, International Business, Culture, Management Strategy.
INTRODUCTION
Standards are now gaining higher recognition as the non-prejudicial methodology to achieve greater firms and consumer benefits. In marketing standards are one of the best marketing tools ever conceived as standards generally go unnoticed. They are mostly quite, unseen forces such as specifications regulations and protocols that ensure that things work properly, interactively, and responsibility (Dyer, Kale, and Singh, 2001). Therefore, they will pay an expanding role in the field of business in general and in IB in particular (i.e., manufactured goods, to commercial fields and to many other new fields).With this belief, it becomes evident that provision must be made for the orderly development of standards (Smith, 2003).Also, (ST) per se is the basic key to all technical and industrial progress and trade. Thus, they will ultimately affect the production of goods and services. Managers were concerned about the risks that surround placing comprehensive and critical tools in the hands of capable people when there are no guidelines in place to ensure that the tools are effectively used. Therefore, most managers understand that (ST) is a critical step in establishing necessary guidelines, and is essential to a strategic competent policy deployment. They also understand the benefit that business competency can provide for them, and increased transparency of information throughout the organization, (George, 2004). In this context strategic management is a methodology to employ, and to effectively manage and control standards – related activities. The firm, it recognizes (ST) as a viable competitiveness strategy. Also, facilitators for a change, integrate economic concerns into technical harmonization (Ellram et.al, 2002). The importance of standards in a global economy is well understood by major European and Asian companies, and in the United Arab Emirates, companies in some industries appear to be logging. The widespread employment of foreigners in UAE's open economies has sparked considerable interest and debate over (ST) effectiveness. This situation may suggest that there are conditions and factors that can influence the effectiveness of standardization. In a culture that has an impact on many aspects of individual behavior and innovativeness, it has also been suggested that an understanding of culture can assist in making decisions such as whether to pursue standardized or localized strategies , something that has been discussed in the context of retailing strategies, (Mooij and Hofstede, 2002). Such finding suggests
Towards Strategic Management of Standards Activities in the International Business
101
that there are conditions and factors that can influence the effectiveness of the standardization's decision making. Furthermore, although developed for cross-country comparison, Hofestede's dimension are believed to be capable for explaining intra-country variations, (Au, 1999), even at an ethnic group level. Indeed, central to any ethnic group is a set of cultural values, attitudes and norms. Each ethnic group constitutes a unique community because of common culture. Thus, the study by ethnicity within a domestic context is feasible and appropriate since each ethnic group will have its own unique set of cultural values, (McGrath, Furrier, and Mendel, 2004). In fact, it has been suggested that intra-country variations of culture can be as large as the variation across countries, (Warner, and Joynt, 2004). Given the potential relevance of culture, a basis is required for assessing its impact on standardization. A corresponding strategic view will help companies to operate better in a global environment. Businesses must pay closer attention to standards matters in order to insure that they will be able to compete on a playing field that is more level. Many standards issues are becoming more company or industry wide, such as quality, environmental, services, and electronic-data interchange, (Kotabe, Srinivasan, and Aulakh, 2002).Continued participation in standards activities and strategic management are needed to avoid standards that add cost but do not add value. This paper explores and extends a consistency framework by incorporating the impact of culture with standardization of strategic management in the IB. However, there is limited empirical research focusing on culture at an ethnic-group level and its impact on (ST). The purpose of this study is to investigate cultural differences at this level, and to gauge the impact on the consistency framework of (ST) effectiveness. The study was undertaken in the UAE. As in many nations, an increasing use of foreign employees by a diverse ethnic mix of non-national employees is being made. This study makes several important contributions to strategic standardization and management model, and emphasizes the significance of standards in the global economy. The study is one of the few pieces of research in management strategy that empirically measure culture at an ethnic-group level. The study provides insights to management practitioners in the design of standardized management strategies. It is not the intent of the researcher to develop a model of competitive advantage to assess an organization's strategy regarding (ST) and standards. On the other hand, the paper is intended to assess if there is a relationship between culture and standardization.
STRATEGIC STANDARDIZATION MANAGEMENT ISSUE
Organizations' management believes that standards will have an ever-increasing importance. Thus, they will ultimately affect the production and sales of all goods in local and global markets. Bearing this belief in mind, it becomes evident that provision must be made for the orderly development of standards. There is a clear need for standards, and a greater attention should be devoted to that. Standards are not only employed strategically as a business tools, but they also serve to interconnect economic activities. An inadequate support for the standards settings process will have serious detrimental effects, therefore, the benefits of standards and the potential impact of (ST) on global commerce should not be neglected, (McGahan and Silverman,2001). Managers were concerned about the risks that surround placing comprehensive critical tools in the hands of capable people when there are no guidelines in place to ensure that the tools are effectively used. Thus, the majority of them were engaged in standardization activities, (Avery, 2002).To those managers (ST) are a critical step in establishing necessary guidelines, and essential to a strategic management development. Improving business process was one imperative behind this drive. What else is a better way to improve processes than to be able to provide that venerable. Such strategic management approach also reduces risks of project failure, and it reduces costs through consistent support, training, and maintenance, (Douglas, Craig, and Nijissen, 2001). It may also gain executive confidence in the data and tools of business. Furthermore, a higher confidence in the executive ranks will be translated into more confidence in strategic decision making. Another benefit was the process and information integration in a world of constant mergers and acquisitions. On the flip side, standardizing has some obvious costs. First, not having one version of the truth leads to wasted money attempting to reconcile data. Second, in the IB standardization as strategic tools for management, it remains as levers used at the tactical level for each department in the organization. Global business is changing to keep pace with unprecedented changes in political conditions and the market place, (Samuelson, 2004). As the market place becomes more globalize, the

Khalid Alrawi
102
ability of organizations to respond rapidly is critical to being internationally competitive. Strategic standardization management is an important asset in helping businesses to achieve international market penetration goals. Its approach is already a priority in a few large, successful international corporations but may not be explicitly recognized as such. This is so because it has evolved as a pragmatic approach to sustain technology advancements and to open up market entry, both domestic and foreign. By developing a strategic standardization assessment model, an organization analyzes the importance and relevance of (ST) to its operations (Shilling and Hill, 1998). A rough strategic model firm may evaluate all (ST) activities related to the organization's businesses and then provides a process for defining, communicating, and implementing appropriate strategic plans and policies to enhance competitive advantages, (Macher,2006). Enterprise standardization is an improvement concept, as are total quality and error-free performance. These concepts have proven to be very difficult to implement successfully because the desired degree of improvement is difficult to achieve. One part of the difficulty lies in the sheer complexity of changing almost the behavior every sector of the business to achieve whether goals is set. Another part of the difficulty is in assessing metrics to measure progress. Still another part is due to the fact that these concepts do not refer to singularities, (Hertz, Johansson, and Jager, 2001). Any evaluation of progress is only a glimpse or a snapshot in a continuous steam of mini-improvements that happens over a period of many years. Therefore, management has been trying for better quality, higher reliability through (ST), and better communication ever since there has been business for profit. Thus, there is always room for improvement when considering quality, reliability, and communication among manufacturing, suppliers and customers. Leadership is a fundamental aspect of strategic management and paramount in strategy implementation. The firm's leadership will impact the firm's ability to change internal processes and procedures while addressing market opportunities. 'Transformational leadership' in this respect is providing the vision and direction for the firm while setting the tone and tempo for the organizational culture and work climate. Essentially, we are experiencing a different organizational culture, which is the set of values, beliefs, rules and institutions held by a specific group of people that evolve overtime, (Robins and Coulter, 2007). Culture drives expected behaviors internal to the organization as well and these are engaged when interacting with the surrounding environment. Organizational cultures are integrated, differentiated, or fragmented, (Thomas and Mueller, 2000), thus, there is not certainly a stable organizational consensus. The paper explores if the above concept of culture will have an impact on standardization in the international business. The following section explores the importance of culture, therefore might affect international business activities.
INTERNAL BUSINESS DEMANDS FOR STANDARDIZATION, AND CULTURE
Strategic standardization is a methodology to employ to effectively manage, and to control standards-related activities, (Grant, 2008), and therefore many organizations recognize (ST) as a viable competitiveness strategy. Global firms engaged in high technology design, development, and manufacturing endorse strategic (ST) because it is recognized as crucial to their survival. A mutual understanding among workers within the cultural context is a variable from many to design a system of realistic standards to boost process interoperability without stifling technology development and technology insertion. Employees are at the centre of all business activity. When people from around the world come together to conduct business, or work in other countries or environments, they bring with them different backgrounds, assumptions, expectations and ways of communicating-in other words culture (Forster,1997). Culture then assuming has a pivotal role in all international commercial activities. As globalization continues, managers directly involved in IB benefit increasingly from a certain degree of cultural literacy. Therefore, cultural literacy improves manager's ability to managing employees, markets, products, and to conduct negotiations in other countries. For example, a global brand such as ''Gap'' (www.gap.com) provides a competitive advantage because consumers know and respect this recognizable name. Yet cultural differences dictate alterations in some aspect of a business to suit local tastes and preferences. The culturally literate manager that compensates for local needs and desires brings his / her company closer to customers, and employees, and improves the firm‘s competitiveness, (Wild et al, 2008). Values are important to business because they affect people‘s work, ethics, and desire for material possessions. Because values are so important to individuals, groups, and management, the influx of values from other cultures can be fiercely resisted. When doing business in another culture, it is important for management to understand people‘s manners and customs. At a minimum, understanding manners and customs helps managers to avoid making mistakes. In-depth knowledge, meanwhile, it improves the ability to negotiate in other cultures, markets products effectively, and manages international operations.

Towards Strategic Management of Standards Activities in the International Business
103
People living in broadly different cultures tend to respond differently in similar business situations. Globalization and technology are increasing the pace of cultural change around the globe. Moreover, companies can influence culture when they import business practices or products into the host country. A firm‘s choice of international strategy involves the search for competitive advantage from global configuration-coordination throughout the value chain, (Fitzgerald-Turner, 1997). For (Andrade, Mitchell, and Stafford, 2001), in today‘s environment, (ST) usually means cross-national strategies rather than a policy of viewing foreign markets as secondary and, therefore, not important enough to have products adapted for them. Global thinking requires flexibility in exploiting good ideas and products on a worldwide basis regardless of their origin.
Hunger and Wheelen (2003) argued that (ST) strategy depends on three sets of variables: 1. The market(s) targeted 2. The product and its characteristics, and 3. The company characteristics including factors such as resources and policy. Standardization of the physical attributes of a product and convergence of consumer preferences constraints, but does not eliminate opportunities for meaningful and profitable differentiation. Thus, product standardization is frequently accompanied by an increased differentiation of complementary service-financing terms warranties, after-sales services, and the like, (David, 1995).
For the global companies, a better approach to planning for standards may be to include (ST) as a component of their strategy. The companies would be planning to operate on a more global basis, planning to compete more effectively in a new market, seeking to expand their market or their competitive position, and seeking ways to protect significant investment in a rapidly changing technology. These investments could be in their manufacturing facilities, quality assurance and environmental impact policies and procedures, and process-interoperability plans (Gordon, 2003).
The goal of strategic standardization is to see how certain standards would help the company better fulfill its mission. In applying strategic-standardization management, the standards-investment decision becomes a strategic one for the company rather than a tactical one for the process. Therefore strategic-standardization management is not about standards. Rather, it is about leveraging all aspects of the standardizing process to optimize competitiveness, (Nell, 2008).
The section highlights the nature of the relationships between culture and (ST). From the above discussion we may conclude that culture is a concept, whereas (ST) is a policy and a strategy for management to implement in its IB activities. It seems to be that culture has a little effect on (ST) strategic management, however. As globalization continues to draw more and more companies into the international arena, understanding local culture can give a company an advantage over rivals. Culture is a variable in setting a policy, whereas (ST) is a strategy in the long-run.
To the researcher's knowledge, nothing has been written about the effect of culture on standardization as strategic management efforts in IB in the Gulf Region despite the florishment of the multinational companies in this area. Indeed, one of the aims of this study is to verify whether there are any relationships between the Hofstede's cultural dimensions responses to standardization in management strategy.
The research methodology is based on the same techniques used by Yoo, Donthu and Lenartowicz (2001).The same model is used by Kwok, and Uncles (2002), concerning cultural impact at an ethnic-group level in the field of marketing. The next section will examine if cultural concept affects standardization.
SUMMARY OF MEASURE AND ANALYSIS
Hypotheses
In general, it is hypothesized that differences based on Hofstede's (1991) five cultural dimensions can lead to relative differences between ethnic groups in their preferences for standardization. In effect, ethnic groups may differ in their relative choices of standardization. For example, the choice share of standardization might be higher for one ethnic group than another due to cultural differences.
In what follows, the hypotheses are based on the five cultural dimensions. It is should be kept in mind that the theoretical strength of the hypotheses is not equal across the five dimensions. For example, hypotheses regarding collectivism have a stronger theoretical basis than hypotheses regarding power distance. Also, as is in the nature of any testing of this kind, it is possible to conceive alternative arguments. However, all five dimensions have been included to ensure that the study is comprehensive, (Kwok, and Uncles, 2002).
The researcher based the research hypotheses on Hofstede's cultural dimensions. Therefore, the hypotheses produced are built on these dimensions, and it is not the intent of the researcher to support or criticized the dimensions.

Khalid Alrawi
104
Power Distance
Power distance deals with the acceptability of social inequalities, such as in power, wealth, and status, (Nakata and Sivakumar, 2001).In higher power distance cultures, inequality are prevalent and accepted. Employees in such cultures are thus likely to be more responsive to work promotions that contain standardization. In contrast, cultures with lower power distance are less tolerant of inequalities and special privileges. In such a culture, there would be a relatively higher preference for standardization that equal reward for everyone. These mainly involve standardization such as production promotions, as they are generally available with the same level of benefits offered to everyone. Differences in power distance often result in miscommunication and conflicts between employees from different cultures.
Hypothesis 1: standardization is more effective for low power distance cultures that are relative to high distance power cultures.
Uncertainty Avoidance
Uncertainty avoidance describes how cultures seek to deal with the fact that the future is not perfectly predicted. It is defined as the degree to which employees in a culture prefer structured over unstructured situation, (Noe, et.al, 2006). Though not equivalent, it is closely related to risk aversion. In high uncertainty avoidance cultures, there is a tendency to ''prefer stable situations and avoid risk'', (Usunier, 2000). Thus, such cultures would prefer standardization that offers more tangible and immediate employees‘ satisfaction to the extent that uncertainty avoidance is related to risk aversion. This is expected since such environments are more certain and involve minimal amount of risk. On the other hand, cultures with low uncertainty avoidance are more risk tolerant and see opportunities within future uncertainties. They socialize employees (individuals) to accept this uncertainty and take each day as it comes. In fact, they may even be considered as risk seeking given that cultures with low uncertainty avoidance were shown to exhibit higher levels of innovativeness (Elizabeth, 2000).
Hypothesis 2: standardization is more effective for high uncertainty avoidance cultures that are relative to low uncertainty avoidance cultures.
Individualism / Collectivism
Individualism- collectivism describes the strength of the relation between an individual and others in the society that is the degree to which people act as individuals rather than as members of a group. In an individualist culture, it has been suggested that employees are expected to look after their own interests and of their immediate families, (Noe, et.al, 2006). Individualistic cultures have distant social relationships in which personal goals are favored over group needs, (Mats, 2002). Value is placed on self-interest and independence, (Gurhan-Canli and Maheswaran, 2000). In addition, individualistic cultures emphasize differentiation (Aaker and Maheswaran, 1997). In contrast, less individualistic (or more collectivistic) cultures are characterized by close relationships and interdependence. Thus, collectivistic cultures can be expected to be less responsive to relationship building standardizations, since they will be reluctant to forge a relationship with an out-group. Instead, collectivistic cultures may be more likely to respond to standardization since the benefits provided are more common (e.g., conform to group norms) and are more readily shared amongst the in-group.
Hypothesis 3: standardization is more effective for collectivistic cultures that are relative to individualistic cultures.
Masculinity / Femininity
Masculinity refers to the tendency to strive for personal achievement and performance. These societies stress assertiveness, performance, success and competition, (Nakata and Sivakumar, 2001). At the other end of the spectrum, less masculine (or more feminine) cultures promote values that have been traditionally regarded as feminine, such as putting relationships before money, helping others, and preserving the environment . There is relatively less emphasis on personal and materialistic gains. These cultures stress service, care for the weak, and solidarity (Noe, et.al, 2006). Thus, feminine cultures are expected to be more responsive to non-standardization since the benefits offered are more relationship focused.
Hypothesis 4: standardization is more effective in masculine cultures that are relative to feminine cultures.
Confucian Dynamism
According to Hofstede, Confucian dynamism captures attitudes towards time, persistence, ordering by status, protection of face, respect for tradition, and reciprocation of gifts and favors. It has been suggested that the way employees ''understand and allocate time may help explain differences in employees behavior across cultures''. The final dimension of Confucian concerns time orientation and bipolar, (Kwok, and Uncles, 2002). It has been suggested that the way employees ‗‘understand

Towards Strategic Management of Standards Activities in the International Business
105
and allocate time may help explain differences in employees behavior across cultures‘‘ (Brodowsky and Anderson, 2000). Employees in such cultures are more willing to make short-term sacrifices or investments for long term gains, (Nakata and Sivakumar, 2001). In effect, employees in cultures high on Confucian dynamism are expected to be more responsive to non-standardization, since many of the expected rewards are long term and loyalty-based. In contrast, the lower or negative end is characterized by a past oriented perspective, with an emphasis on traditions, (Fletcher and Brown, 1999). Employees in such cultures favor short-term planning and more immediate financial gains, (Nakata and Sivakumar, 2001). Thus, employees of cultures low on Confucian dynamism are expected to react relatively poorly towards non-standardization promotions due to the delayed gratification involved. Instead, they are expected to favor standardization given the benefits which are more immediate and transactional.
Hypothesis 5: Standardization is more effective in cultures low on the Confucian dynamism that are relative to cultures high on the Confucian dynamism.
The five hypotheses associated with the five cultural dimensions are summarized in Figure 1. Each cultural dimension is considered one-by-one.
Figure 1: Summary of Hypotheses
SAMPLES
The two ethnic groups (Indians and Arabs) are selected for investigation. The source countries of these groups differ markedly in terms of Hofstede's (1991) cultural dimensions. Relatively, Arabs are seen as: high power distance, low on uncertainty avoidance, collectivistic, feminine and high on the Confucian dynamism, whereas the Indians are : low power distance, high on uncertainty avoidance, individualistic, masculine and low on the Confucian dynamism. A total of 717 questionnaires were completed with an equal split between the two groups. The sample represents 75% of the total foreign employees working in industrial enterprises in the '' Industrial Area'' in Abu Dhabi Emirates, UAE. For both groups, respondents were asked: (1) if their preference is standardization and (2) to complete the CVSCALE items. Culture is measured using a personality-centered approach based on direct value inference (Lenartowicz and Roth, 1999). In particular, use is made of the CVSCALE proposed by Yoo, Donthu and Lenartowicz (2001).This is an adaptation of Hofstede‘s scale: it consists of 26-items, measured by 5-point Likert scales relating to Hofstede‘s five cultural dimensions (see Appendix A). It allows culture to be measured at the individual level and then aggregated to form groups at a chosen level for comparison. This is appropriate as it recognizes that members of a society may not share the same cultural values (Au, 1999) and it also allows different ethnic groups within one country to be analyzed. As suggested by Yoo, Donthu and Lenartowicz (2001), the CVSCALE is useful for analyzing cultural values in a heterogeneous country like the UAE, and thus, the scale is particularly relevant for this study. Furthermore, the items of the scale have been adapted to suit the employees' context. This reduces the negative impact of using Hofestede's measures, which were based on work-related values. Finally, the CVSCALE
- High Power Distance - Low Uncertainty Avoidance - Individualistic - Feminine - High Confucian
Homogeneous Products
- Low Power Distance - High Uncertainty Avoidance - Collectivistic - Masculine - Low Confucian
Standardization
Heterogeneous
Strategic Management
Non- Standardization

Khalid Alrawi
106
has also been applied in cross-cultural research, (Yoo and Donthu, 2002). Thus, there is strong evidence to support the use of this scale (Kwok, and Uncles, 2002).
ANALYSIS
The researcher attempted at tracking the same techniques in analyzing the results used by Kwok and Uncles (2002) work. Responses to the CVSCALE are used to determine the relative cultural values of both ethnic groups on the five cultural dimensions. However, first the reliability and validity of the CVSCALE are tested. For the whole sample, the reliability alpha of the cultural dimensions ranged from 0.56 to 0.65 (Table 1).Although these results are modest, they are comparable to those reported by Yoo, Donthu and Lenartowicz (2001), and they all satisfy the reliability threshold of 0.6 that is commonly accepted for new scales, (Hair et al,1998). It should be noticed that reliability levels varied slightly between the ethnic groups. However, the variations are similar to those reported by Yoo, Donthu and Lenartowicz (2001), and in only one case did the reliability alpha fall below 0.6 (0.56 for masculinity among Indian) (Table 1).
Table 1: Reliability Analysis Results
Dimension Whole Sample Indian Minority Arab Minority Yoo, Donthu and
Lenartowicz
Power Distance 0.67 0.71 0.64 0.61
Uncertainty Avoidance 0.61 0.69 0.63 0.71
Collectivism 0.67 0.63 0.72 0.76
Masculinity 0.62 0.56 0.69 0.67
Confucian Dynamism 0.70 0.70 0.71 0.69
After reliability, factor analysis was used to ascertain the validity of the items (Table 2). Under the specification of 5 factors, the results of exploratory factor analysis provide preliminary support for the CVSCALE's validity. With one exception (D3-personal steadiness and stability), all the items loaded highly on the appropriate factors and no item loaded on more than one factor.

Towards Strategic Management of Standards Activities in the International Business
107
Table 2: Exploratory Factor Analysis Results
CVSCALE Item no. Power Distance Uncertainty Avoidance
Collectivism Masculinity Confucian Dynamism
P2 0.65 0.08 0.12 -0.06 -0.06
P1 0.62 0.06 -0.01 0.08 -0.14
P4 0.56 -0.07 0.09 0.12 0.05
P5 0.54 0.14 0.03 0.02 -0.01
P3 0.45 -0.23 -0.01 0.04 0.08
U3 0.01 0.73 0.02 0.08 0.02
U5 -0.02 0.60 0.04 0.15 0.15
U2 0.09 0.50 0.08 -0.17 0.22
D3 0.05 0.42 -0.02 -0.07 0.42
U4 -0.01 0.42 0.10 0.20 0.07
U1 0.09 0.41 -0.01 0.16 0.24
C3 0.01 0.00 0.63 0.15 0.17
C4 0.18 0.00 0.63 -0.04 0.18
C6 0.08 0.00 0. 63 0.23 -0.05
C2 -0.15 0.15 0.51 -0.08 -0.11
C5 0.15 0.16 0.50 0.21 -0.15
C1 0.04 -0.01 0.50 0.01 0.13
M2 -0.03 0.06 0.01 0. 71 0.12
M1 0.32 -0.10 0.15 0.64 0.12
M3 0.07 0.11 0.10 0.61 -0.01
D4 -0.02 0.24 0.05 0.05 0. 66
D5 0.06 0.00 0.06 0.02 0.63
D6 -0.05 0.22 0.13 -0.08 0.62
D1 0.00 0.23 -0.04 0.06 0.55
D2 -0.15 -0.19 0.19 -0.02 0.32
Extraction Method Principle Components
Rotation Method Varimax
Kaiser-Meyer-Olkin Measure of Sampling Adequacy 0.725
Bartlett's Test of Sphericity 0.000
The measurement model is based on the same specifications as Yoo, Donthu and Lenartowicz (2001), with 5 factors and 26 items, where each item loaded on only one factor and the factors are uncorrelated. Using AMOS 4.0, the key results of the standardized solution are shown in Table 3.

Khalid Alrawi
108
Table 3: Confirmatory Factor Analysis Results
Standardized Factor Loading
CVSCALE
Item No. Power Distance
Uncertainty Avoidance
Individualism Self-Esteem Time Orientation
Power Power Power Power Power
0.57 0.50 0.38 0.48 0.45
Uncertainty Uncertainty Uncertainty Uncertainty Uncertainty
0.43 0.43 0.71 035 0.58
Individualism Individualism Individualism Individualism Individualism Individualism
0.37 0.27 0.62 0.57 0.45 0.55
Masculinity Masculinity Masculinity Masculinity
0.57 0.54 0.57 0.34
Conf-Dynam. Conf-Dynam. Conf-Dynam. Conf-Dynam. Conf-Dynam. Conf-Dynam.
0.54 0.20 0.46 0.69 0.45 0.64
Composite Reliability
0.78 0.79 0.82 0.76 0.82
Variance Extracted 0.49 0.49 0.49 0.49 0.49
X2 d.f. RMSEA NFI CFI IFI
Model 536.95 295 0.04 0.95 0.97 0.97
The overall fit of the measurement model was excellent: X2 (d.f = 295) = 536.95: root mean square error or approximation (RMSEA) = 0.04, normed fit index (NFI) = 0.94, comparative fit index (CFI) = 0.96, and the incremental fit index (IFI) = 0.96. These results provide strong confirmatory support for the CVSCALE and its use in studying the hypothesized constructs. With regard to composite reliability, all the estimates were above the recommended level of 0.70, ranging from 0.77 to 0.81, (Table 3). In addition, whilst the average variance extracted for each dimension was only moderate at 0.49, they do satisfy the minimum acceptable level, (Hair et al, 1998).Thus; the results provide support for the independence of the dimensions. Having confirmed the reliability and validity of the CVSCALE, responses to the scale are then aggregated for analysis. The score is calculated as the average of the individual items of each cultural dimension answered by the respondents of each ethnic group. This approach reflects the flexibility of the CVSCALE in that it allows culture to be measured at the individual level but analyzed at an appropriate aggregated level. The average scores are then compared to classify the relative cultural values of the two ethnic groups on each dimension, (Table 4).

Towards Strategic Management of Standards Activities in the International Business
109
Table 4: Average Cultural Scores
Power Distance Uncertainty Avoidance
Collectivism Masculinity Confucian Dynamism
Indian 3.95 Low 2.0 Low 2.71 Individualistic 2.95 Feminine 1.92 Low
Arab 3.61 High 1.97 High 2.41 Collectivistic 2.91 Self-esteem 1.71 High
T-value 2.40 1.29 2.60 3.00 3.11
Sig. P-value 0.01 0.12 0.00 0.0 0.00
Although the absolute difference appears small, based on conventional statistical standards, there are significant differences between the two ethnic groups on all the cultural dimensions (P<0.05), except for uncertainty avoidance. Using the relative averages, Indians can be classified as relatively low power distance, low on uncertainty avoidance, individualistic, feminine and low on Confucian dynamism, and vice-versa for Arabs. However, some inconsistency is acceptable given the distinctiveness of the CVSCALE and the limitations of Hofstede's empirical data.
TESTING HYPOTHESES
In testing the hypotheses, the data was analyzed at an ethnic group level. The ethnic groups are already classified on each cultural dimension as shown in Table 4. For the purposes of analysis, the upper median splits within each ethnic group on each cultural dimension are used. The choice share results provide a basis to evaluate the hypotheses. As is evident in Table 5, there were no significant differences in the choice shares between ethnic groups across employees toward standardization. Specifically, this is in line with the prediction of hypotheses between culture and standardization.
Table 5: Choice Shares for Standardization at an Ethnic Level
All Incentives
Power Distance Low-Indian High- Arab (sig. p-value)
80% 78%
(0.51)
Uncertainty Avoidance Low-Indian High- Arab (sig. p-value)
77% 76%
(0.39)
Individualism Individualist-Indian Collectivist-Arab (sig. p-value)
76%
775% (070)
Self-Esteem Feminine-Indian Masculine-Arab (sig. p-value)
78% 79%
(0.77)
Time Orientation Low-Indian High- Arab (sig. p-value)
76% 78%
(0.62)
Choice for non-standardization is the complement to 100%
In order to provide further understanding, the data were also analyzed at an individual level. Specifically, median splits were conducted on each dimension based on the scores of all individuals, regardless of their ethnic background, Table 6.

Khalid Alrawi
110
Table 6: Logistic Regression Results at an Ethnic Level
Model Summary Independent variables
-2 log
Likelihood R2 Value
Omnibus Test of Model
coefficients ST Gender Age Income
Low Power Distance
468a (475)b 0.02c 0.04
-0.49 (0.01)d
0.42 (0.04)
0.13 (0.48)
-0.02 (0.89)
High Power Distance
489 (510) 0.03 0.01
-0.82 (0.00)
0.02 (0.85)
-0.12 (0.50)
0.02 (0.85)
Low Uncertainty Avoidance
470 (477) 0.02 0.03
-0.51 (0.01)
0.37 (0.06)
0.20 (0.25)
-0.45 (0.16)
High Uncertainty Avoidance
501 (510) 0.03 0.01
-0.79 (0.00)
0.07 (0.63)
-0.20 (0.29)
0.12 (0.48)
Individualist 474
(478) 0.03 0.01 -0.71 (0.00)
0.28 (0.14)
0.02 (0.90)
0.09 (0.60)
Collectivist 476
(479) 0.02 0.04 -0.59 (0.00)
0.15 (0.38)
-0.02 (0.83)
-0.03 (0.85)
Feminine 474
(476) 0.02 0.07 -0.48 (0.02)
0.37 (0.13)
0.13 (0.46)
0.12 (0.51)
Masculine 496
(503) 0.04 0.00 -0.84 (0.00)
0.07 (0.63)
-0.15 (0.41)
-0.06 (0.70)
Low Confucian Dynamism
476 (479) 0.03 0.01
-0.68 (0.00)
0.42 (0.04)
0.09 (0.59)
0.05 (0.70)
High Confucian Dynamism
474 (478) 0.02 0.03
-0.62 (0.00)
0.05 (0.68)
-0.09 (0.61)
0.08 (0.63)
a Model -2 Log Likelihood b Initial -2 Likelihood
c Nagelkerke d Significant value
As shown in Table 6, it is evident that the results generally reflect those found at the ethnic level. Firstly, the reduction in the -2 log likelihood values and the R2 values for each regression are again relatively low, suggesting a poor fit for all the models. However, with the exception of the collectivist dimension, model coefficients were found to be significant for the same dimensions identified at the ethnic level (P < 0.05). Similarly, standardization was consistently shown to have a significant and a negative relationship with the employee's culture: high power distance (β = -0.82, P= 0.00), high uncertainty avoidance (β = -0.79, P= 0.00), masculine (β = -0.84, P= 0.00) and high Confucian dynamism (β = -0.62, P= 0.00). These results confirm that the findings at the ethnic level are not associated with (ST). In regard to the covariates, they were generally again found to be insignificant. However, there are some results that differ on the ethnic level. Firstly, the model coefficients for low uncertainty avoidance, individualist and low Confucian dynamism were also found to be significant (P < 0.05). Standardization was again negatively related to ethnic culture. In addition, under the low Confucian dynamism dimension female responses were positively related with the choice of standardization (β= 0.42, P= 0.05).
CONCLUSION
There is recognition of the importance of standards in the globalizing economy, as do many in businesses and companies in the IB. The purpose of this study is to raise awareness and highlight the importance of standardization in the IB with culture. A significant awareness exists with top management nowadays in the private and public sectors concerning (ST) and its effect on global commerce. Many leading companies in IB, regardless of the context of (ST) develop business standardization policies and strategies. The policies are often technically based regardless of the inter-and intra-relatedness of various management systems. Clear cultural differences are found at ethnic group levels. The mean scores between the two groups are significantly different from each other across cultural dimensions, but there is no significant difference towards standardization. The implication of this finding is twofold. First, cultural differences do not appear to affect employees' response towards standardization. This suggests that managers can use standardized products when targeting different ethnic groups and avoid the use of more costly differentiated strategies. Second, the finding highlights the fact that cultural distinctions may be more relevant in some

Towards Strategic Management of Standards Activities in the International Business
111
areas of business than in others. Thus, it would be a mistake to assume that cultural differences will affect all areas of IB management. The researcher believes that the effect of culture, even if exists, is on the short-run, whereas the effect of (ST) became a strategy for the firm on the long-run. In reality, while culture might influence the economic success of a nation, it is just one of many factors, and while its importance should not be ignored, it should not be overstated either. This may need a further investigation, witnessing examples from economies with different level of development. The study also validates the CVSCALE established by Yoo, Donthu, and Lenartowicz.
LIMITATIONS AND FURTHER RESEARCH
There are several limitations relating to the focus of the study and the methodology used. Some of these highlight useful directions for future research. One issue is that further information is needed to foster if culture has a relationship with the standardization in the IB. (For example the acculturation analysis (i.e., if respondents have lived in the UAE, or were born in the UAE or overseas). However, the researcher thinks that the analysis presented above is enough to assess if culture has an effect on standardization. In terms of methodology for this study, a quasi-experimental design is adopted and data is analyzed using inferential statistics. It is acknowledged that this is only one way of the many possible methodologies that might be used. An alternative would be to observe the choice behavior of management at the point of decision towards standardization. The study could be further extended by considering the use of alternative measures and stimuli. For example, culture may also be measured using Hofstede's (1990) original scale, or one of the alternatives that have existed in the field of business. The results may then be compared with the CVSCALE to provide a form of triangulation, (Kwok and Uncles, 2002).
REFERENCES
Avery, S., (2002), E-Procurement Helps Set Strategy That Cut Costs, Purchasing, Vol. 131, No. 4, pp. 25-28. Au, Kevin Y., (1999), Intra-Cultural Variation: Evidence and Implications for International Business, Journal of International
Business Studies, Vol.30, No.4, pp. 789-813. Andrade, G., Mitchell, M., and Stafford, E., (2001), New Economic Perspectives, Vol. 5, No.3, pp.103-120. Aaker, L., and Maheswaran, D., (1997), The Effect of Cultural Orientation on Persuasion, Journal of Consumer Research, Vol.
24, (December), pp. 315-328. Brodowsky, H., and Beverlee, A.,(2000)., A Cross-Cultural Study of Consumer Attitudes Toward Time, Journal of Global
Marketing, Vol. 13, No. 3, pp. 93-109. Czinkota, M., Ronkainen, I., and Moffett, M., (2008), International Business, 6th Ed, Harcourt Publishers, USA, pp. 340-342. Shilling, M., and Hill, C.,(1998), Managing The New Product Development Process, Academy of Management Executive,
Vol.12, No. 3, pp. 67-81. Douglas, S., Craig, C., and Nijissen, E., (2001), Integrating Branding Starategy Across Markets, Journal of International
Marketing, Vol.9, No.2, pp97-114. Dyer, J., Kale, P., and Singh, H., (2001), How to make Strategic Alliances Work, (2001), Sloan Management Review, Vol. 42,
No. 4, pp. 37-43. David, B., (1995), Integrated Strategy: Market and Nonmarket Components, California Management Review, Vol. 37, No. 2,
pp. 51-52. Ellram, L., Zsidisin, G., Siferd, S., and Stanly, M.,(2002), The Impact of Purchasing and Supply Chain Management on
Corporate Success, Journal of Supply Chain Management, Vol. 38, No. 1, pp. 4-17. Elizabeth, W., (2000), Inclusion, Exlusion, and Ambiguity: The Role of Organizational Culture, Personnel Review, Vol. 29, No.
3, pp. 274-92. Forster, N.,(1997), The Persistent Myth of High Expatriate failure Rates, A Reappraisal, International Journal of Human
resource Management, Vol.8, No. 4, pp. 414-34. Fitzgerald-Turner, B., (1997), Myth of Expatriate Life, HRMagazine, Vol.42, No.6, (June), pp. 65-74. Grant, R., (2008), Contemporary Strategy Analysis, 6th ED, Blackwell Publishing, UK, Ch 13. George,Y.,(2004), Using Strategy to Change your Business, Business Strategy Review, Vol. 15, No. 2, pp.17-24. Gordon, B., (2003), High Risk Trade policy, Foreign Affairs, Vol.82, No. 4, pp. 105-15. Gurhan-Canli, Z., and Maheswaran, D., (2000), Cultural Variations in Country of Origin Effects, Journal of Marketing
Research, Vol. 37 (August), pp. 309-17. Hunger, J., and Wheelen, T., (2003), Essentials of Strategic Management, 3rd ED, Prentice-Hall, Ch 3.

Khalid Alrawi
112
Hertz, S., Johansson, J., and de Jager, F.,(2001), Customer-focused Cost Cutting: Process Management at Volvo, Journal of Supply Chain Management,Vol.6, No. 3, pp. 128-41.
Hair, F., Rolph, A., Ronald, T., and William, B., (1998), Multivariate Data Analysis, 5th Ed, Prentice-Hall, NJ. Kwok, S., and Uncles, M., (2002), Sales Promotion Effectiveness: The Impact of Culture at an Ethnic- Group Level, School of
Marketing Working Paper, University of New South Wales, Sydney. Kotabe, M., Srinivasan, S., and Aulakh, P.,(2002), The Moderating Role of R&D and Marketing Capabilities, Journal of
International Business studies, Vol.33, No. 1, pp. 79-97. Macher, J.,(2006), Technological Development and the Boundaries of the Firm: A knowledge-based Examination in
Semiconductor Manufacturing, Management Science, Vol. 52, pp. 826-43. Mooij, M., and Hofstede, G., (2002), Convergence and Divergence in Consumer Behavior: Implications for International
Reality, Journal of Retailing, Vol. 78, No.1, pp.61-69. McGahan, A., and Silverman, B., (2001), How Does Innovative Activity Change as Industries Mature? International Journal of
Industrial Organization, Vol.19, No. 7, pp. 1141-60. Mats, A., (2002), Understanding Organizational Culture, Sage, London, Chs. 3, 4. McGrath, R., Furrier,W., and Mendel, A.,(2004),Real Options As Engines of Choice and Heterogeneity, Academy of
Management,Vol. 29, No.1,p.5. Nell, J., (2008), Standardization Strategy That Matches Enterprise Operation, Working Paper, National Institute of Standards
and Technology, Gaithers Burge, USA, pp.1-7. Noe, R., Hollenbeck, J., Gerhart, B., and Wright, P., (2006), Human Resource Management, 5th ED, McGraw-Hill, NY, Ch 15. Nakata, C., and Sivakumar, K., (2001), Instituting The Marketing Concept in A Multinational Setting: The Role of National
Culture, Journal of Academy of marketing Science, Vol. 29, (Summer), pp. 255-75. Robins, S., and Coulter, M., (2007) Management, 9th ED, Prentice-Hall, Ch 17. Smith, C., (2003), Corporate Social Responsibility: Whether or How? California Management Review, vol.45, No. 4, pp. 52-76. Samuelson, P.,(2004),Where Ricardo and Mill Rebut and Confirm Arguments of mainstream Economists Supporting
Globalization, Journal of Economic Perspectives, Vol.18, No.3, pp. 135-46. Thomas, A., and Mueller, S., (2000), The Case For Comparative Entrepreneurship, Journal of International Business Studies,
Vol. 31, No. 2.287-302. Usunier, J-Claude., (2000), Marketing Across Cultures, 3rd Ed, Prentice-Hall, UK, Chs 3, 4. Wild, J., Wild, K., and Han, J., (2008), International Business, The Challenges of Globalization, 4th ed, Prentice-Hall, NJ, Ch 2. Warner, M., and Joynt, P., (2004), Managing Across Culture, Thomson, 2nd Ed, NY, Ch 1. Yoo, B., Donthu, N., and Lenartowicz (2001), Measuring Cultural Values: Development and Validation of CVSCALE, Working
paper, Georgia State University. Yoo, B., Donthu, N.,(2002),The effects of Marketing Education and Individual Cultural Values On Marketing Ethics of
Students, Journal of Marketing Education,Vol.24, No. 2, pp.92-104.

Towards Strategic Management of Standards Activities in the International Business
113
APPENDIX A: THE CVSCALE
Cultural Dimension
Measurement Items 5-Point Scale
Power Distance P1. People in higher positions should make most decisions without consulting people in lower positions.
P2. People in higher positions should not ask the opinions of people in lower positions too frequently.
P3. People in higher positions should avoid social interaction with people in lower positions.
P4. People in lower positions should not disagree with decisions by people in higher positions.
P5. People in higher positions should not delegate important tasks to people in lower positions.
1= Strongly agree
2= Agree
3= Neither
Agree/disagree
4= Disagree
5= Strongly disagree
Uncertainty Avoidance
U1. It is important to have instructions spelled out in detail so that I always know what I‘m expected to do. U2. It important to closely follow instructions and procedures.
U3. Rules and regulations are important because they inform me of what is expected of me.
U4. Standardized work procedures are helpful.
U5. Instructions for operations are important.
1= Strongly agree
2= Agree
3= Neither
Agree/disagree
4= Disagree
5= Strongly disagree
Individualism / Collectivism
I1. Individuals should sacrifice self-interest for the group (either at school or the work place).
I2. Individuals should stick with the group even through difficulties.
I3. Group welfare is more important than individual rewards.
I4. Group success is more important than individual success.
I5. Individuals should only pursue their goals after considering the welfare of the group.
I6. Group loyalty should be encouraged even if individual goals suffer.
1= Strongly agree
2= Agree
3= Neither
Agree/disagree
4= Disagree
5= Strongly disagree
Masculinity / Femininity
S1. It is more important for men to have a professional career than it is for women.
S2. Men usually solve problems with logical analysis; women usually solve problems with intuition.
S3. Solving difficult problems usually requires an active, forceful approach, which is typical of men.
S4. There are some jobs that a man can always do better than a woman.
1= Strongly agree
2= Agree
3= Neither
Agree/disagree
4= Disagree
5= Strongly disagree
Confucian Dynamism
T1. Careful Management of money ( thrift)
T2. Going on resolutely in spite of opposition
T3. Personal steadiness and stability
T4. Long term planning
T5. Giving up today‘s fun for success in the future
T6. Working hard for success in the future
1= Strongly agree
2= Agree
3= Neither
Agree/disagree
4= Disagree
5= Strongly disagree
Uche Nwabueze and Janelle Lewis
114
CORPORATE GOVERNANCE IN AMERICA: NEW RULES OF ENGAGEMENT
Uche Nwabueze and Janelle Lewis University of Houston
ABSTRACT
In examining corporate governance we believe two important issues need to be addressed: the failure of human-nature and
the more fundamental issue that is socioeconomic. The inherent limitation of the capitalist system is its failure through
regulatory bodies to enforce laws that would protect the public from self-interest - the need by top management in corporate
America to profit through direct and indirect compensation in spite of poor organizational performance. This attitude begs the
question: ―How can corporate governance protect against the abuses of self-interest without hindering the necessary rational
actions that drive the capitalist system?‖
From a socioeconomic perspective, the workings of the capitalist system involve the management of the dynamic relationship
of the various parts of the system. For example, in any given corporation effective relationship is evidenced by inter-
dependencies between management, the board of directors and shareholders, but this is further from the truth. The reality of
corporate America is an environment of intense pressure for quarterly performance, uncooperative and some cases abusive
and corrupt relations between the three critical elements of a well balanced enterprise –the board, management and
shareholders. The ideal relationship as we hope to delineate is a strategic planning and execution engagement between the
board and top management, and financial accountability and responsibility between the board and management, and between
the board and shareholders. This we hope will reduce the cycle of greed inherent in the system, eradicate conflicts of interest,
but more fundamentally, keep the American capitalist system democratic.
It is important to note however, that the absence of a cooperative model of corporate governance, which allows for joint
sessions in the formulation, execution and monitoring of strategy between the three critical elements of a balanced
corporation informed our research. We also would argue as Moss Kanter has stated; ‗companies that get into trouble often do
so because of minimal internal connections between the various parts of the organization‘‘ (Kanter 2002). Thus to solve the problem of self-centered leadership requires we believe, a redefinition of organizational design, structure, processes and
culture. However, the central thesis of our research resonates more with Clark (2003), who argues that much of the public
debate on the failure of corporate governance has operated on the surface of the problem, thus requiring a deeper level of
analysis to conceptualize what went wrong.
Thus our paper suggests that the failure of corporate governance in America is not as a result of a few bad apples, but more
to do with systemic failure. Against this assertion, the paper proposes a corporate governance new rules of engagement
framework that calls for the wholesale revamping of the systems of governance, with checks and balances that maximize
relationships between top management, the board, shareholders, auditors, regulators, financial analysts, professional
investors and money managers.
INTRODUCTION
In the wake of corporate debacles such as Enron, Tyco, Adelphia and WorldCom, corporate governance has become a prominent issue on the political and business landscape. Lawmakers in the United States reacted promptly with the passing of the Sarbanes-Oxley Act of 2002, which represents the most drastic corporate reform legislation since the Great Depression. This sweeping legislation brought light to the need for new rules of engagement and the importance of holding top management of public companies accountable for the true state of the financial health of their companies. However, some Chief Executive Officers (CEO‘s) have suggested that excessive regulation and overly strict auditing procedures may impede the ability of American companies to grow effectively. We do not share this sentiment, but hold the opinion that the lack of strict and enforceable set of regulation, particularly auditing, and the lack of awareness of investment risks has resulted in unethical behavior and false financial information.

Corporate Governance in America: New Rules of Engagement
115
There is connectivity between monitoring, accountability, responsibility, enforcement of rules and the maximization of shareholder value. It is our belief that the failure to practice and manage ethically across organizations led to the betrayal of trust between management, the board and shareholders. The challenge remains, how do we as a nation balance the need for corporate growth and real profitability with corporate responsibility? To put in context, Healy (2002) contends that we live in a society in which the stars-entertainers, professional athletes, top managers in any industry make all the money. For example, a Business week article on executive pay of May 6, 2002 stated that CEO‘s of large corporations in America made 411 times as much as the average factory worker. In the same article, Peter Drucker is quoted as saying: ‗‘If the CEO took too large a share of the rewards, it would make a mockery of the contributions of all the other employees‘… What we find is not only a mockery of the contributions of the hard working men and women in America organizations but a total disdain for corporate responsibility and governance. Clark (2003) in his assessment of corruption and ethical misconduct in corporate America identified three reasons for the failure of governance: first, as markets became pervasive, firms used them badly; secondly, the tendency of leaders to substitute market-based incentives for judgment and for standards where they shouldn‘t; Third, governance institutions compromising principles in the pursuit of market opportunity. Whilst we agree with Clark, we believe there are three more profound reasons for failure - the slave to Wall Street mentality, which results in the dedication to managing earnings and a focus on the short-term; a disengaged, soundly asleep board of directors. This group is made up of part-timers without enough time for meetings, are hopelessly beholden to management and most of them sit on several other boards to be effective. And, a dysfunctional corporate culture lacking in a core set of ethical values, responsibility and accountability.
WHAT IS CORPORATE GOVERNANCE
We define corporate governance as a system of entities established on the behalf of employees, shareholders/creditors, consumers, and, in a broader scope, society in order to hold public companies accountable. On a more human level, corporate governance can be defined as a system to instill trust within capitalistic companies. To hold a company accountable simply means to call for responsibility of both the rewards and consequences of their actions. This brings us to a juncture in which it is necessary to address the constant struggle between the ideals of true capitalism and the governing body, known as corporate governance, which impedes it. It is necessary to first ask ourselves the questions, why are we not able to inherently trust our companies and their leaders, and why aren‘t our companies responsive to ethics? This can be explained as stated in the abstract at two levels: human-nature and socioeconomic. The socioeconomic and human-nature problems can be described around one word, self-interest. Adam Smith, in the Wealth of Nations, described capitalism, without government or political intervention, as the most effective economic system to ensure the growth of a nation‘s wealth. Capitalism is an economic structure that relies heavily on a free-enterprise system in which there is enormous pressure for short-term performance in the capital market. As a consequence, Healy (2002) argues money managers and analysts are basically driven by quarterly profits, thus corporate leaders feel the pressure to deliver good numbers even if it takes fudging. Thus the general attitude is that of protecting and enhancing self-interest. According to Adam Smith, self-interest and competition motivates businesses to produce the best products and price them reasonably in order to benefit themselves, thus some organizations would have the intense desire to win at all cost. This statement is underscored by Walter B. Wriston, CEO of Citicorp, who argues that there always have been, and always will be, people in every walk of life who shade the truth or fudge the numbers. He goes on to state that no amount of new regulations or laws can overcome this flaw in human nature. Therefore, we argue that the nature of man is to act and protect his interest in total disregard for rules of law, trust and integrity. In light of the dearth of morality in business in Corporate America, Kenneth Arrow (2003), a Nobel Prize winning economist, is of the opinion that trust is an important lubricant of any well meaning social system. It is extremely difficult for top management to be trusted he contends, but it saves a lot of trouble to have a fair degree of reliance on other people‘s word because trust is required to maintain any type of market stability. We agree with his assertion of the very importance of trust for market viability, but corporate governance as we have it in Corporate America today serves as safeguard for untrustworthiness and is by definition, we believe in direct contrast with the ideals of capitalism. In addition, capitalism by definition infiltrates the structure of accountability. Our understanding suggests that true Capitalism represents the so-called ‗free market‘ without the interference of any governing bodies. Since we realize that governance is absolutely necessary to maintain our market‘s health and keep capitalists (entrepreneurs/managers) accountable, the question becomes, ―How much influence should these governing bodies have upon companies?‖ This premise brings us to

Uche Nwabueze and Janelle Lewis
116
the topical issue of an ideal corporate governance framework that effectively deals with the paradox between growth, real profits and governance within the constraints of the capitalist system.
WHY CORPORATE GOVERNANCE?
Corporate governance from a stakeholder perspective involves eight interconnecting parties: shareholders, board of directors, executive management, employees, suppliers, environment, community and customers. From diagram 1 below the importance of corporate governance lies in the fiduciary duty of executive management to stockholders, society, customers and employees in terms of need fulfillment. It fundamentally ensures a management team that is openly accountable to the board and a board that in turn is accountable to shareholders. Success is therefore dependent on information transparency; open communication channels and teamwork.
Shareholders/
Creditors
Board of Directors
Executive
ManagementEmployees
Consumers/
Society
CorporateAccountability
Flowchart
With this structure we can theoretically posit that the overall purpose of the modern corporation is to maximize stakeholder value rather than the misconstrued notion of maximizing shareholder wealth. This is supported by Tishler (2002), who argues that maximizing shareholder return is required only when the breakup of the corporation has become inevitable or there is a change of control.
MANAGING RELATIONSHIPS AND THE ROLE OF THE BOARD
William W. George, former CEO of Medtronic, is of the view that governance starts and ends with the board of directors. The board he believes has an overarching responsibility to preserve and build the enterprise (George 2002). Instead of falling prey to maximizing short-term shareholder value the board must we suggest challenge and change the prevailing business doctrine of short-term focus and move to an enterprise doctrine of long-term growth. Furthermore, the board must make sure that its various committees, particularly audit and compensation are independent, with absolutely no ties to the organization (Lorsch 2002). From a strategic standpoint, like other authors such as (Montgomery 2004), we suggest the separation of the positions of chairman and CEO in order to maintain balance in the boardroom. However, if CEO and chairman is the same person, a lead director should be chosen from the non-executive directors. Furthermore, as Jay Lorsch has consistently argued and we concur, the chairman of the audit committee should be an independent, strong minded, financial astute leader (Lorsch 2002). This basic reorientation we believe would facilitate a more ethically driven corporate environment by reducing the enormous pressure for increased performance that CEO‘s face each day on the job. However, the relationship between top management and board of directors and between the board and shareholders in Corporate America has always been a precarious one. The reason according to Kanter is poor access and deficient information as a result of the dependence of the board on management to provide them with appropriate information (Kanter

Corporate Governance in America: New Rules of Engagement
117
2002). Ever so often, the information that management passes on is little too late but in majority of cases inaccurate. For Pound (1995) the relationship between the board, management and shareholders is that premised on power, with the goal been that of tight control over wayward managers and unaccountability to shareholders. This has led to strategic disagreements between management and the board. To overcome the imbalance of power between the board and top management, Pound (1995) is of the opinion that the transition to a governed environment is required. By governed he means a corporation where managers, shareholders and the board all have a voice. Moreover, to ensure accountability between the board and shareholders it is a must to record individual directors‘ votes on key corporate resolutions in proxy statements (Montgomery 2004). As Louis Brandeis said in his 1914 treatise Other People‘s Money, and How the Bankers Use It, ―Sunlight is said to be the best of disinfectants….Disclosure is needed and to be effective, knowledge of the exact facts must be communicated to the investor‖( Montgomery 2004). For Nadler (2004), the critical role of the board is involvement with key decision-making as it relates to board type. He suggests three board types: the passive board whose main objective is to ratify management decisions. Secondly, the operating board whose main responsibilities include making key decisions which management then implements and the third type is the engaged board, which actively assists the chief executive in his decision-making. A key concept Nadler introduces with his three board types is the relationship between active participation and active reaction. When boards become less involved as was the case at Enron, WorldCom etc, there main role is to react to adverse situations rather than engaged participation to prevent such situations. Thus the center piece of corporate governance that we surmise from Nadler‘s postulation is the need to engage the board in active participation in policy making, execution and measurement of goal attainment because we believe that what gets measured gets done. Nevertheless, there are some writers who argue that expanding the role of the board is not in the best interest of the company. For example, Siciliano (2002), states that the board spends far too much time in the planning process as opposed to the implementation process. She believes that a more focused role for the board is needed in terms of its control functions and in strategy implementation. There is some merit in Siciliano‘s argument because board members are part-time and would require a much focused job description to be effective. However, Jay Lorsch articulates a compromise known as the ―empowered board.‖ He writes, in a Harvard Business Review (HBS) article ―Empowering the Board‖, that an empowered board consists mainly of directors from outside the company who have no relationship with it, the board is small enough to be a cohesive group, that members range in expertise, communicates freely with and without management, and that the directors receive information about the company‘s financial and product performance. Thus there would be distinctions between a director who contributes ideas to company strategy and one who tries to manage the company. The implication for the board is to not micromanage top management, but rather to fully engage in policy making, policy execution and accountability for results on behalf of the shareholders. The ―empowered board‖ strikingly resembles Nadler‘s ―engaged board‖ in that both concepts designate for the board to be an active participant in the planning process whilst recognizing that the ultimate responsibility of any board is not only to oversee and monitor the CEO. As a consequence, Lorsch outlines some important activities which enable the board to be an effective monitor, which means ensuring legal and ethical conduct by top management and employees, approving the firm‘s strategic direction, and evaluating progress. Lorsch states: ―Evaluating the CEO annually is central to effective monitoring for several reasons. Fundamentally, it is a major step toward empowering the board because it delivers a clear message to both the CEO and the directors that the former is accountable to the latter.‖ In light of Lorsch‘s arguments, John Pound (1995), in his HBR article ―The Promise of a Governed Corporation,‖ contends that corporate governance should not be centered on the power struggle between executives and the board of directors. Pound points out, ―Power-based reforms are not the key to correcting the problem… At its core, corporate governance is not about power; it is about ensuring effective decision making.‖ Although Pound presents a valid point that the board-top management relationship is not all about who has more power, he fails to consider that allowing the board more influence on key decision making is, in essence, giving it more power. We would argue that without a clear balance of power between the board and top management, the board‘s ability to hold management accountable would be in question. Moreover, the need for the board to serve as corporate oversight in requiring the CEO to confront the brutal realities of strategic moves in the market place would be lost forever. In an attempt to create a better board-chief executive relationship, it is necessary to recognize that when things go wrong in organizations it is not due to the absence of clearly defined lines of responsibility, but the lack of courage on the part of board members to effectively question the CEO‘s judgment.

Uche Nwabueze and Janelle Lewis
118
BOARD MEMBER SELECTION/RESPONSIBILITY
Nadler (2004) emphasizes the importance of directors having the right mindset. He indicates that in order to foster constant improvement there need to be mechanisms in place such as annual constructive self-assessments to reinvent the board‘s role and duties. Such mechanisms are a key facet of effective corporate governance. There is in essence no template of corporate governance available that will suit all corporations. To illustrate this point, we can revert back to the spectrum of board involvement that includes ―the passive board‖ and ―the operating board. Nadler (2004) states, ―Reform efforts unduly emphasize several narrow aspects of board composition. Sarbanes-Oxley for example, prescribes a heavy dose of independent directors, but the real issue as we see it is not independence, but competence. We would argue similarly to Nadler that certain competences and skill set are required of all directors, such as knowledge of Industry, independence of mind, business credibility, high moral character, financial expertise, nonconformist, confidence, and teamwork. Having the right people with the right skills on the board would ensure that we never again find a board so sound asleep as was the case at Enron. Robert A. Monks, a professor on corporate governance at Cambridge University, outlines the ―Myth of the Director‘s Duty‖ in his book Power and Accountability, which insists that the director‘s obligation to maximize shareholder value is a façade (2004). Monks introduces a fundamental problem in corporations arguing that Karl Marx and Adam Smith did not agree on much, but they both believed that the corporate form of organizations was unworkable, and for remarkably similar reasons. For example, they questioned whether it is possible to create a structure that will operate efficiently and fairly, despite the fact that there is a separation of ownership and control. This separation of ownership and control according to Monks is a key factor in determining if all directors of the board truly act on behalf of corporate shareholders. For us, drawing on the doctrine of corporatism, we believe an effective structure is possible whereby the main duty of the board of directors is to act, protect and leverage the interests of the owners of the company, the shareholders. At the very minimum, we suggest a structure that should limit every board to no more than three insiders (CEO, CFO and SVP for HR ), a five year term limit for board members, require every board in the event that one individual holds the position of CEO/Chairman to appoint a lead director who can convene the board without the CEO, assign only independent outsiders to the audit, compensation, and nominating committees, and restrict directors from serving on more than two boards and ban stock sales by directors for the duration of their terms. Contrary to this conventional belief, Monks suggests that it is naïve to believe that directors are purely ―ornaments on a Christmas tree‘‘. Hence, the theory that boards work in the best interest of shareholders is basically false in light of the recent corporate scandals. However, Peter F. Drucker opines that: ―whenever an institution malfunctions as consistently as boards of directors have in nearly every major fiasco of the last forty or fifty years it is futile to blame men; it is the institution that malfunctions.‖ We are in total agreement with Drucker that if men cannot be blamed then there is indeed a requirement for a paradigm shift in terms of a new set of rules that would facilitate a functioning; well balanced institution where the board keeps a watchful eye on management and shareholders in turn keeps an eye on the board.
RULES OF ENGAGEMENT
In an HBR Article, ―A New Compact for Owners and Directors,‖ the Working Group on Corporate Governance (2004) outlined some key solutions to the management of shareholder – board relationship; 1. Institutional shareholders of public companies should see themselves as owners rather than investors, 2. Shareholders should not be involved in the day-to-day affairs of the operations of a company, 3. shareholders should evaluate the performance of the directors regularly, 4. In evaluating the performance of directors, shareholders should become better informed, 5. Shareholders should recognize and respect that the goal is the ongoing prosperity of the company. However, we believe that the more important question to ask in regard to the board of directors-shareholders relationship is, ―How can we practically improve shareholder involvement in order to govern corporations effectively?‖
SHAREHOLDER INVOLVEMENT
Clifton R. Wharton suggests that since institutional investors hold approximately 46% of American public stock, their involvement is essential. Wharton in his HBR article, ―Just Vote No‖, explains that there is a fundamental distinction between shareholders who view the company as would an owner as opposed to as an investor, and the former would lead to greater sensitivity for long-term prospects. It is also important to acknowledge that not all institutional shareholders have the same objective; therefore, the shareholders who invest long-term would view certain strategic initiatives such as a hasty sell-off of

Corporate Governance in America: New Rules of Engagement
119
assets or a takeover detrimental to long-term health. Meanwhile the short-term institutional investor is most certainly focused on short-term prospects, yearly but mostly quarterly results. This represents a significant dilemma in corporations where the ―owners‖ so to speak do not share the same goals. For Jay Lorsch the establishment of real ownership of equity in America‘s corporations is impossible. He asks two important questions: Can and should institutional investors act as true long-term owners, and if they cannot, then to whom and for what should directors be accountable? The most important element to take away from these questions is that if shareholders do not expect a long-term value driven enterprise, then are the directors doing their jobs by ensuring short-term gains at the expense of the future? Lorsch presents an excellent point that if these large institutional investors which mainly consist of corporate or public pension funds, mutual funds, or endowments, they cannot act as owners because their primary fiduciary responsibility is to their own investors and beneficiaries not their fellow shareholders. It would seem that the only time these large institutional investors would step in and play their part as owners would be if there is a significant decline in their holdings. We hold the opinion that the we may have to accept the reality that there may be no real ‗owners‘ for the majority of shares in America‘s major companies. To create true ownership will require a fundamental shift in the investment philosophy and practices of major institutional investors and major reform in the laws and regulations that affect their participation in the corporate governance process (Lorsch 2002). At the end of the day, we would contend that this fundamental flaw in the separation of ownership and control is at the root of a lot of our corporate governance failures. To state it simply, if boards cannot truly act on behalf of shareholders because shareholders are not interested in long-term prosperity, then how can we allow top management to shoulder the burden of acting in the best interests of shareholders. According to Handy (2003), executives no longer run their companies for the benefit of consumers and shareholders but for their own personal ambition and financial gain. The problems of the board‘s involvement in relation to top management and shareholders not acting as true owners in holding the board of directors accountable brings us to a crossroad no real solution.
CORPORATE GOVERNANCE: AN INTERNATIONAL PERSPECTIVE
To gain insight into how corporate governance should be structured, we will explore the frameworks of Japan and Germany and do a comparison with that of the United States. It is important to note that there may be some common boundaries between all three nation‘s corporate governance, as there may be some differences. The key lesson to take away from this comparison study is how we can improve corporate governance in the United States (USA) by learning from our international neighbors. We will begin with the board-executive relationship differences between the United States and Germany. Germany has an interesting structure of its board of directors, which consists of a two-tiered board structure (Supervisory and Management). The supervisory board is the financial partners who provide a voice for stakeholders. The management board represents shareholders and is much more like the conventional board of directors in the USA. These two boards meet quarterly, and embody some key accountability structures found lacking in American corporate governance. For example, the supervisory board is an important step in providing active engaged platform for large shareholders to exert some control over the decision-making process. This is truly absent in the United States where many boards do not represent the shareholders best interests 100% of the time nor are they actively involved in decision-making. In Japanese companies, boards generally consist of 20 to 25 directors many of whom lack the independence we seek in America. Virtually all Japanese directors are inside managing directors chosen from the ranks of top management itself. This obvious difference between Japanese and American structure of governance is interesting. For instance, how does Japan, whose boards lack the so called independent directors still able to successfully govern their corporations? We were able to determine through our research that a prominent feature of Japanese corporate governance is the tendency for large corporations to focus on long-term commercial relationships as opposed to our focus on quarterly results. These inter-corporation relationships are termed keiretsu, which means an affiliation of related companies whose interests are aligned partly through long-term supply contracts, inter-company personnel transfers, and reciprocal equity ownership. This is essentially an added layer of accountability that Japanese corporations must adhere to; since the counter-corporation can be a supplier, equity owner, and competitor simultaneously. This creates a lot of interest in seeing the counter-corporation succeed. It is far more powerful in terms of enforcement, monitoring and accountability when a large, influential corporation

Uche Nwabueze and Janelle Lewis
120
who holds equity in a company questions the CEO than is the case in American where the board of twelve members is responsible. This fundamental difference between the Japanese and American corporate governance structure is the reason why Japanese companies experience less failures in governance. A key characteristic to note however is that in both Germany and Japan, banks own equity stakes in public corporations. This encourages corporations to finance their operations with bank debt rather than equity, thus enabling the banks to exert power in the form of influence on executive management.
LEARNING FROM OUR INTERNATIONAL PARTNERS
The key factor to recognize is that in the United States we are constrained by laws of governance. The Glass-Steagall Act of 1933 prohibits banks from owning stock directly or indirectly in public companies. For instance, pension funds control two-thirds of institutionally owned equity, but cannot attempt to sway shareholder opinion without approval from the Securities and Exchange Commission (SEC). This provision is another reason for failure. The governance laws of Germany and Japan encourages major shareholders to be active participants in governing corporations, and we think that this is the key to improving the relationships of both the board – top management and – shareholders. If we have measures to prevent our owners from being involved within our corporations, then how can we expect boards to truly act on behalf of the company owners? Within corporate America, there are many struggles that are taking place. The shifting responsibility between the board, top management, and shareholders, and more fundamentally governance and capitalism, are all important struggles we must resolve in order to have an effective governance framework to uphold moral and ethical accountability. Additionally, we opine that to protect the democratic ideals of modern capitalism, effective structures must put in place to ensure that CEO‘s are making decisions that are in the best interests of the owners of the company. This is also the sole reason for having a board of directors, who are required to ensure that the right decisions are being made; selects, monitors, measures and rewards performance of top management, ensures accountability and the provision of factual financial information. This would bridge the gap between ownership and control, and eradicate for good the struggle between the governed and the governing.
CASE STUDY: BERKSHIRE HATHAWAY
Berkshire Hathaway, a large holding company with approximately 40 subsidiaries, is somewhat of a novelty in corporate America. With its major emphasis in the insurance and reinsurance industries, Berkshire Hathaway has substantial funds available for investment, and the company uses these funds to purchase shares in industrial based companies like Coca-Cola and Gillette in order to maximize long-term shareholder value. However Berkshire‘s investment approach is not necessarily the company‘s most striking attribute; Berkshire‘s approach to corporate governance and investor relations is equally unique. For example, Berkshire Hathaway encourages its shareholders to be actively engaged in the affairs of the company and to invest long-term. Berkshire‘s Chairman, Warren Buffet, said in his booklet: ―An Owner‘s Manual;‖
―Although our form is corporate, our attitude is partnership. Charlie Munger and I think of our shareholders as owner-partners, and of ourselves as managing partners…Charlie and I hope that you do not think of yourself as
merely owning a piece of paper whose price wiggles around daily and that is candidate for sale when some
economic or political event makes you nervous. We hope you instead visualize yourself as a part owner of a
business that you expect to stay with indefinitely, much as you might if you owned a farm or apartment house in
partnership with members of your family‖ (www.berkshirehathaway.com).
Furthermore, Berkshire‘s low level of stock turnover indicates that the company‘s leadership has been successful in convincing stockholders to think of themselves as owners, and this success is due primarily to a single aspect of Berkshire‘s leadership- excellent two-way communication. The company actively communicates relevant information to shareholders in plain-English so that shareholders, particularly the average Joe really understands what is going on in the company, what Buffet refers to as been real. The leadership encourages questions from its shareholders, as evidenced by the fact that Chairman Warren Buffet annually sits for a 6-hour Q&A session at the shareholder meeting attended by thousands of Berkshire owners. Straightforward communication which encourages shareholder involvement is a significant part of Berkshire‘s approach to corporate governance, and it is this forthrightness and participation that sets Berkshire apart from thousands of other corporations.

Corporate Governance in America: New Rules of Engagement
121
However what makes Berkshire Hathaway a true example of democratic capitalism is the significant vested interest that board members and executives have in the company‘s prosperity:
In line with Berkshire‘s owner-orientation, most of our directors have a major portion of their net worth invested in the
company. We eat our own cooking. Charlie‘s family has 90% or more of its net worth in Berkshire shares; my wife,
Susie, and I have more than 99%... Charlie and I cannot promise you results. But we can guarantee that your
financial fortunes will move in lockstep with ours for whatever period of time you elect to be our partner. We have no
interest in large salaries or options or other means of gaining an ―edge‖ over you. We want to make money only when our partners do and in exactly the same proportion. Moreover, when I do something dumb, I want you to be
able to derive some solace from the fact that my financial suffering is proportional to yours
(www.berkshirehathaway.com).
In addition, the company lives the values and characteristics of the governed corporation (Pound 1995). Some of board characteristics include; expertise - financial and industry sufficient to allow the board to add value to the decision-making process; procedures that foster open debate; regular meetings and minimum time commitment of 25 days. By aligning their personal assets to company profits, the company‘s leadership have virtually guaranteed that they will act ethically and responsibly, looking out for the best long-term interests of shareholders. In such an environment, shareholders have tremendous confidence in the leadership when board members and executives align significant portions of their personal wealth directly to the long-term stock value of the company. Berkshire Hathaway‘s unique approach and structure make it an interesting case study of corporate governance. It seems that corporate America could learn a great deal from this company especially with regard to Berkshire‘s determination to relentlessly adhere to fundamental principles of doing what is right and focusing on the long-term regardless of the whims of the marketplace.
CONCLUSION
Proposed Corporate Governance Framework
In conclusion, after exhaustive research we have assert that recent failures in corporate governance in the United States is systemic, thus we propose a governance framework that would facilitate a more effective relationship between the three critical arms of the balanced corporation – the board, management and shareholders. An attempt is made to address all the central issues of accountability, roles and responsibilities of the board, the chief executive officer, board committees and shareholders. In addition, we offer propositions for executive compensation and executive appointments. Finally, we are hopeful that our framework goes a long way in providing a solution to the confused state of corporate governance in America today.
Accountability Structure
The CEO is accountable to the Board
The relation of the CEO to the Board is a relation that acquires great trust and loyalty, but mostly importantly that of partnership. The CEO has the sole responsibility of articulating the vision, but policy making, particularly strategy formulation must be a joint effort. Transparency in information sharing, communication and business results is a must for a successful relationship. The Board is accountable to the shareholders
The Board must have the ability to participate in the setting of strategic objectives for the company that is feasible and attainable. But the primary function is to represent the financial interests of shareholders. To ensure accountability, shareholder resolutions that pass by a majority of the shares voted for three consecutive years must be binding. We believe that making resolutions binding would make companies profoundly answerable to shareholders. Montgomery and Kaufman (2004) argue and we agree that shareholders should seek each other out and to work in concert on issues on which they share common ground. When boards and managers believe there is a real chance that shareholders will push back on the director slate or block an initiative, their behavior and decision-making process will change (Montgomery and Kaufman, 2004). Role of Board of Directors (Specific duties of the Board )
The Board of Directors is to provide direction and oversee the conduct of the executive officers of the corporation and as a matter of fact become the custodians for high moral business conduct. As such, we note the Board‘s specific duties as:

Uche Nwabueze and Janelle Lewis
122
1. Selecting the Chief Executive Officer, not necessarily a visionary, but one who is very willing to serve. The board should be guided by the notion that:‖ Whoever wants to become great among you must be your servant, and whoever wants to be first, must be slave to all. For even the Son of Man did not come to be served, but to serve‘‘ (Mark 10:43-45).
2. Working with the CEO and other members of the executive team in planning, formulating and monitoring strategic execution.
3. Evaluating the CEOs performance and the company‘s business performance as it relates to meeting goals. 4. Fire the CEO for poor performance. One of the greatest flaws of many of today‘s leaders is their avoidance of making the
tough calls. While courage is doing the right thing, wisdom which most corporate leaders lack, is doing the right thing. 5. Monitoring financial and legal compliance as determined by regulators –making sure that only the legal and ethical is
done consistently. How the Board should determine the CEO’s Compensation
The compensation committee of the board of most corporations in America has failed shareholders. For example, there is no internal process to evaluate CEO performance. From 1990 to 2001, the share of equity-based compensation in total CEO compensation-how much is coming from options and other forms of equity grew from 8% to 66 %( Clark 2003). The loading up of executives by this soundly at sleep group with stock options led to the temptation by some executives to ―game‘‘ the financial markets. According to Lorsch, excesses in executive pay and the cycle of greed has to do with compensation committees not holding the line, they granted packages that ensured executives receive above average pay in spite of financial performance, forgetting that it is there responsibility to align executive pay and benefits to profitability (Lorsch 2002). We strongly advocate that stock options be expensed because once options represent a direct hit to the bottom line, the committee would be less inclined to dole them out by the millions. Conversely, rather than award stock options with no strings attached, the CEO can be paid in restricted stock with the consequence of losing all of it on failure to meet cash-flow targets. We cannot over state the fact of the need to link pay, particularly bonuses with profit/performance goals. How the Board should handle executive appointments
A Nominating Committee composed of members of the Board should have sole responsibility to appoint the CEO and the CFO. In reviewing the research on why CEO‘s fail we draw some conclusions on what makes a successful CEO that the nominating committee should look out for: the capacity to execute, which means getting things done and delivering on commitments; hiring and putting the right people in the right positions; intellectual curiosity and capacity for self reflection –emotionally intelligent; ability to confront and deal with reality; a high moral character-the fear of God and capacity to build connections with people; decisiveness in decision making, particularly the need for simplification; not afraid of wall street and inner peace/ strength to deal with complexity and finally a servant‘s heart. These we believe are the essential attributes of great leaders-―People first, strategy second‘‘. The audit Committee
The audit committee is the board‘s vehicle for monitoring financial reporting and must ensure perfect accounting and full disclosure by the organization. We suggest like many before us that the chairman of the audit committee be a certified public accountant and if possible with a doctorate in finance. This would provide the status, experience and leadership to insist on full and complete discussions on all business transactions and investments. The audit committee with compensation and nominating must be fully independent with no ties to corporate so as to be able to work with independent auditors appointed by management. Auditors should be rotated every few years; we would venture to say every five years to prevent long-term ties between management and the firm of auditors but more so to ensure a ―fresh look‘‘ by a new firm. The audit committee should also review all analyst and press reports about the organization‘s accounting and financial disclosures on a consistent basis. However, as stated in an article in Business week, the deepest problem in recent accounting scandals is how easy it has been for all the players involved to pass the buck (Business week, 2003). For example, the board blames management, management blames the auditor, and the auditor blames accounting rules. To prevent this happening again in the future, we advocate that one and the same company should not as has been the practice, provide management consulting and auditing services. It should be done by two different companies and proxy statements should delineate which responsibilities fall to the board and which to management. Finally, the all important role of the audit committee is forensic –the need to dig behind the journal entries (Business week 2003).

Corporate Governance in America: New Rules of Engagement
123
Chief Executive Officer (CEO)
The Chief Executive Officer is responsible for defining a compelling the vision for the company, developing a strategy with insights from the board for reaching that vision, and leading management and employees in executing the strategy. The most important job of the CEO is to be the ethics and moral high priest of the organization evidenced by his or her forthrightness and taking responsibility for any failures. Other responsibilities include: 1. Creating a culture high on moral/ethical core values of doing right, fairness, integrity, honesty, justice and hard work. 2. Reward doers who live company values 3. Lead by example by becoming the moral compass of the organization 4. Encourage dissent among senior managers and implement a system that discourages group think and cronyism. 5. Belief that others are equal to self by encouraging criticism of decisions and align personal interests to that of others,
particularly the organization. 6. Listens, coaches and sets direction for the elevation of people and business performance. Shareholders
We believe, as does Montgomery and Kaufman that, the system of corporate governance would not function well until shareholders take due responsibility as owners and actively engage with not only the board but also management as it affects strategic direction of the enterprise. The German model would represent a good start. For example, in the nomination and election process, shareholders should actively vote for candidates informed by the voting records of directors. Shareholders must insist on accurate and real time information to facilitate the oversight function over the board. Financial institutions such as banks, pension funds, insurance companies, mutual funds, and money managers must adhere to the olden adage of united we win, but divided the practice of shutting-out shareholders from boardrooms will continue. The need to work in concert remains the only reasonable chance for protecting shareholder interests.
REFERENCES
The Future of Corporate Governance by Patrick Dixon (http://www.globalchange.com/corporategovernance.htm) What is Corporate Governance? (http://www.encycogov.com/Whatiscorpgov.asp) Corporate Governance: ―Other People‘s Money‖ by Walter B. Wriston Remarks by Chairman Alan Greenspan: Corporate Governance (http://www.federalreserve.gov) Power and Accountability by Robert Monks (http://www.thecorporatelibrary.com) ―Moral Conflicts at Enron: Moral Responsibility in Corporate Capitalism‖ Harvard Business Review article by Sherron S.
Watkins ―Empowering the Board‖ Harvard Business Review article by Jay W. Lorsch ―Advice and Dissent: Rating the Corporate Governance Compact‖ Harvard Business Review article by Wharton, Lorsch and
Hanson ―Governance and Strategy Implementation: Expanding the Board‘s Involvement‖ Harvard Business Review article byJulie
Siciliano ―What Makes Great Boards Great‖ Harvard Business Review article by Jeffrey A. Sonnenfeld ―What‘s Business for?‖ Harvard Business Review article by Charles Handy ―Imbalance of Power‖ Harvard Business Review article by William W. George ―Building Better Boards‖ Harvard Business Review article by David A. Nadler Revised Corporate Governance Principles in Japan Unknown Author ―A letter to the Chief Executive‖ Harvard Business Review article by Joseph Fuller ―Corporate Governance: the Other Side of the Coin‖ Harvard Business Review article by Kenneth N. Dayton ―Public Policy and the Manager Conceptual Framework‖ Harvard Business Review case by Willis Emmons ―Corporate Governance: The New Strategic Imperative‖ Economist Intelligence Unit sponsored by KPMG Intl. The German Corporate Governance Code Principles of Corporate Governance The Business Roundtable May 2002 ―Note on Corporate Governance Systems: The United States, Japan, Germany‖ Harvard Business Discussion by Robert W.
Lightfoot ―Holes at the Top: Why CEO Firings Backfire‖ Harvard Business Article by Margarethe Wiersema ―Good Governance and the Misleading Myths of Bad Metrics‖ By Jeffrey Sonnefield ―Ten Questions Every Board Member Should Ask‖ By Ram Charan, Fortune Magazine

Uche Nwabueze and Janelle Lewis
124
SOURCES FOR CASE STUDY
Berkshire Hathaway‘s website (http://www.berkshirehathaway.com) Yahoo! Finance (http://finance.yahoo.com/q/pr?s=BRKa) Forbes.com (http://www.forbes.com/finance/mktguideapps/compinfo/CompanyTearsheet.jhtml?tkr=BRKa) Salon.com (http://www.salon.com/people/bc/1999/08/31/buffett/index.html)
NOTE: A significant portion of the case study was taken directly and indirectly from Warren Buffet‘s booklet ―An Owner‘s Manual,‖ which can be found on Berkshire Hathaway‘s website. We believe that it was best to draw directly from the Berkshire leadership teams own articulation of their approach even as we compared the information they provided with information from objective sources.

Hybrid Networks and In-House Expertise
125
HYBRID NETWORKS AND IN-HOUSE EXPERTISE
Donna M. Schaeffer and Patrick C. Olson Marymount University and National University
ABSTRACT
This paper is about the impact of the diffusion of wireless LAN as additions to existing networks in organizations. The
implications of this addition are generally misunderstood, and this is a problem for the leadership of organizations. A graphic
example of this occurred at the kick off of the wireless effort for the city of Philadelphia. The Mayor of the city is pictured on
the front page of the newspaper cutting an Ethernet cable. While it is nice to indicate an understanding of the end-user‘s desire to ―cut the cord‖, one wonders how the Internet will be connected to the wireless antennas in Philadelphia?
While there can be no question that wireless is an important and possibly the connection to the end-user for the future, there
can also be no question that wireless networks are not provided from simply turning on a series of wireless access points. The
implications for organizations go beyond the lack of understanding generally witnessed on this topic.
Networking has generally been the target of outsourcing for decades. This has not been the result of the recent popularity of
outsourcing. Networking requires expertise which is generally in short supply, and once network changes are operational,
involves having a specialized and expensive staff waiting (hopefully studying to keep current) for a problem to fix. This is a
human resource problem which has been avoided, generally, by outsourcing. Thus, some ―normal‖ network architecture is purchased (for the purpose of avoiding overly specialized expertise), and an outside organization is hired to manage the
network. However one views outsourcing, this particular practice seems to please everybody. The organization gets a high
quality and reliable network and the people that provide the network are happily engaged in their field of expertise.
The introduction of wireless to this arrangement creates challenges. The first challenge is what is ―normal‖ and how will the
evolving wireless approaches be handled by the end-user organization and the service providing organization? The second
challenge is that there are now two network architectures not one. The third challenge is, the availability of service providers
that have sufficient expertise is both wireless and wired architectures. This implies the fourth and most important challenge
which is how to manage the availability of expertise for this more complicated environment.
This study of the problem will begin with implications from the technologies themselves. Certainly the transport mediums are
sufficiently different that different expertise is required, but does it belong in house or can it be ―normalized‖ so that outside sources can be relied upon. Secondly, can convergence address this problem? Can routers that do wireless and wired
networks, and other technologies help. Additionally, examples and lessons from particular implementations will be illustrated.
The implications from these stories will be examined.
The intended result is a movement toward defining the optimal management approaches to providing expertise for these
networks as needed. This is intended to be a scholarly discussion, however, the result has general utility to managers.

Yu-Wen Huang and George Mansour
126
THE EFFECTS OF CORPORATE SOCIAL RESPONSIBILITY (CSR) ON CORPORATE REPUTATION VIA STAKEHOLDER RESPONSES AND COMPANY
PRACTICE REVIEWS
Yu-Wen Huang and George Mansour Spalding University and DeVry College of NY
ABSTRACT
In an information age characterized by rapid change and competitive environments, businesses today face more challenges
than they did previously. New media and communication technologies provide the public with knowledge and resources.
Customers can obtain company information easily from the Internet, newspapers, magazines and a variety of other media.
Business leaders and employees should be aware that company operations can no longer be kept from public scrutiny.
Customers and consumers acquire more company knowledge, and thus are more savvy decision-makers.
After a series of highly-publicized scandals involving companies such as Enron, Adelphia and WorldCom, many industries are
facing a public trust crisis. The challenge now is to institute the necessary reforms to cease further erosion of public trust.
Business leaders now should be focused on restoring public trust, improving corporate governance, and understanding the
public‘s expectations.
The purpose of this research was to study to expand on stakeholders‘ and companies‘ views and perceptions of corporate
social responsibility (CSR) on corporate reputation. The researchers were to examine how corporate social responsibility is
related to corporate reputation, and the priority placed on corporate social responsibility by stakeholders and response
companies from100 Best Corporate Citizens in the U.S. as identified by Business Ethics.
This paper analyzed differences in perceptions between stakeholders‘ views and businesses‘ actual practices of CSR in terms
of corporate reputation via selected survey questions, such as rank the primary responsibility priority (business ethics,
economic responsibility (profit), community involvement, human/employee rights and environmental protection) for CSR. This
paper explores how important corporate social responsibility initiatives contribute to company‘s corporate reputation.
The researchers provide suggestions, based on the survey results, for businesses to take into account when considering the
perspectives of stakeholders, in particular, and of general employees or potential employees; the researcher hopes that such
considerations may enable business leaders to adjust the priority of their companies‘ CSR activities and corporate reputation policies. Though model companies and stakeholders have the same top two concerns about CSR issues vary on the order of
priority on remaining issues. In addition, via the models provided by U.S. 100 Best Corporate Citizens, one can examine
company practices in CSR and how they contribute to improving corporate reputation in this information and technology age.
Keywords: Corporate Social Responsibility (CSR), Corporate Reputation.

The Acceptance of Peer Appraisals in a Virtual Work Team Setting: An Examination of Social Contextual Factors
127
THE ACCEPTANCE OF PEER APPRAISALS IN A VIRTUAL WORK TEAM SETTING: AN EXAMINATION OF SOCIAL CONTEXTUAL FACTORS
Kimberly Johnson Auburn University Montgomery
ABSTRACT
Today organizations face new challenges such as coordinating organizational tasks across time zones, countries, (Kayworth
& Leidner, 2002) and cultures. As contextual changes such as globalization and advances in technology increase,
organizations are becoming more decentralized and less hierarchical (Murphy & Cleveland, 1995). One response to the
changing business environment is the implementation of self-managed teams.
Self-managed teams, as their name implies, are ―empowered‖ teams and are one of the most frequent types of teams utilized in organizations (Lawler, Mohrman, & Ledford, 1995; Erez, Lepine & Elms, 2002). The ability to make their own decisions and
chose their own course in accomplishing tasks, (Erez et al., 2002) differentiates self-managed teams from traditional teams.
Despite the common thread of empowerment in self-managed teams, not all self-managed teams have the same structure
(Erez et al., 2002).
Although not specifically stated in the literature, the author posits virtual teams are a special type of self-managed team.
Virtual teams should have the ability to make their own decisions and determine how to accomplish tasks (Bell & Kozlowski,
2002). Unlike the traditional self-managed team, virtual teams consist of team members who are disbursed physically or
organizationally (Baker, 2002), often having little opportunity to meet face-to-face (Townsend, DeMarie, & Hendrickson, 1998).
Despite this limitation, many virtual teams have virtual team leaders who are responsible for monitoring the group as a whole
and monitoring members individually. Evaluating the performance of individual members is problematic because direct
observation is not possible. Mentoring, coaching, and developing individual members is an area of concern and research has
suggested these functions be performed by substitutes or distributed to members of the team (Bell & Kozlowski, 2002).
This paper proposes the implementation of peer appraisals in a virtual work team setting as an alternative to traditional
performance appraisals. The overall purpose of this paper is to determine the social contextual factors which can influence
the acceptance of peer appraisal results in a virtual work team setting. This paper will demonstrate how the work relationship
and demographic similarity between the rater and ratee in a virtual team will impact the ratees‘ reaction to the peer
performance appraisal results. It is further proposed the level of trust and communication in the virtual team mediates this
relationship. This paper proposes a study to examine this relationship and potential study limitations and future research.
REFERENCES
Baker, G. (2002). The effects of synchronous collaborative technologies on decision making: a study of virtual teams. Information Resources Management Journal, 15(4), 79-93.
Bell, B.S. & Kozlowski, S.W.J. (2002). A typology of virtual teams. Implications for effective leadership. Group & Organization
Management, 27 (1), 14-49. Erez, A., Lepine, J.A., & Elms, H. (2002). Effects of rotated leadership and peer evaluation on the functioning and
effectiveness of self-managed teams: A quasi-experiment. Personnel Psychology, 55, 929-949. Kayworth, T.R. & Leidner, D.E. (2002). Leadership effectiveness in global virtual teams. Journal of Management Information
Systems, 18 (3), 7-40. Lawler, E.E. III, Mohrman, S.A., & Ledford, G.E. Jr. (1995). Creating high performance organizations: Practices and results of
employee involvement and total quality management in Fortune 1000 companies. San Francisco: Jossey-Bass. Murphy, K.R., & Cleveland, J.N. (1995). Understanding performance appraisal: Social, organizational, and goal-based
perspective. Thousand Oaks, CA: Sage. Townsend, A.M., DeMarie, S.M., & Hendrickson, A.R. (1998). Virtual teams: technology and the workplace of the future.
Academy of Management Executive, 12 (3), 17-29.

Liz Mulig
128
WASN’T ME! HOW IDENTITY THEFT AFFECTS THE ACCOUNTING PROFESSION
Liz Mulig University of Houston Victoria
ABSTRACT
The American Institute of Certified Public Accountants (AICPA) has developed a series of assurance and advisory services.
These services are focused on building trust and confidence in businesses and are a natural extension of the CPA's auditing
and information technology consulting functions. One of the services is focused on privacy of personal information.
Identity theft is one of the fastest growing crimes in America. It occurs when the criminal obtains confidential information from
an individual or business and uses it to access private financial accounts.
One of the biggest risks for businesses is that customers‘ private data be stolen from the business records. This theft could easily mushroom into loss of business and loss of public trust. One type business this could strike is banking. In these
economic times, with the public already uneasy about the banking industry, this effect would no doubt be multiplied.
This research examines how identity theft occurs (ie how the fraud is perpetrated), what type information is at risk, and
potential exposures. It then addresses how the accounting profession is affected, outlining CPAs‘ roles in discovering if their clients are susceptible to this type theft, helping combat the problem and in assisting in preventing future occurrences.

129
SECTION 2
SCIENCE & TECHNOLOGY

William Ebomoyi and Josephine Ebomoyi
130
SOCIO-STIGMATIZATION OF HIV/AIDS STATUS AND THE COGNITIVE LEVEL OF COLLEGE-AGE STUDENTS ABOUT HIV TRANSMISSION IN NIGERIA AND
UNITED STATES
William Ebomoyi1 and Josephine I. Ebomoyi2,3 Chicago State University1, Saint Xavier University2 and Northwestern Memorial Hospital3
ABSTRACT
This study assessed the socio-stigmatization status of people living with AIDS(PLWA) by interviewing a random sample of
Nigerian and American college-age students. Although the American respondents were more knowledgeable about the risk of
HIV transmission, they still hold stigmatizing views about PLWA. The Nigeria respondents held more stigmatizing views
about PLWA. We therefore recommended intense education to eliminate the stigma associated with HIV status. We also
recommended official policies to ban this discriminating tendencies worldwide.
INTRODUCTION
Human Immunodeficiency Virus (HIV)
Human immunodeficiency virus (HIV) is a retrovirus that is the causative agent of acquired immunodeficiency syndrome (AIDS). The Virus colonizes and destroys the immune system (t-cell lymphocytes), which protects the body from infections. The Centers for Disease Control (CDC), Atlanta, Georgia defined a case of AIDS as an illness characterized by: one or more of a group of opportunistic or indicator diseases that are indicative of underlying cellular immunodeficiency Absence of all known underlying causes of cellular immunodeficiency and absence of all other causes of reduced resistance to opportunistic or indicator diseases, Serum positive for HIV antibody, Positive culture for HIV, Decline in the level of CD4 (T4 helper and lymphocytes to <200/ cubic millimeter
AIDS Opportunistic Infections
• Mycrobacterium Tuberculae
• Histoplasmosis
• Salmonella
• Chronic Diarrhea
• Generalized Lymphadenopathy
• Isopora Belli
• Peripheral Neuropathy
• Hairy Leukoplakia
• PCP- Pneumocystic Carri Pneumonia
• Herpes Zoster
• Cytomegalovirus
• Enteropathy
• Protein Energy Malnutrition
• Dermatitis
• Invasive Cancer
• Ardenocarcinoma of the Cervix
• Generalized Puritis
• AIDS Dementia
• Pelvic Inflammatory Disease
• Cytomegalovirus Retinitis
• Herpes Simplex Virus 1
• Kaposi Sarcoma
• Candidiasis
• Herpes Simplex Virus 2
United Nations AIDS Statistical data reported more than 36-42 million people worldwide were infected with HIV by the end of 2007 with 44.05% women. Over 70% of cases occur in Africa because of poverty, ignorance and weak public health infrastructure. The Americas have an estimated 2.71 million cases of HIV infection. 920,000 persons in North America are infected (UNAIDS, 2007). Young adults in American feel invulnerable, believing the epicenters for STD/HIV are in the East, West coast and cosmopolitan cities of the U. S. expose Colorado rural college-age students to STD/HIV/AIDS infections. At the end of 2007, an estimated 551,932 persons in only 34 states were living with HIV/AIDS (CDC, 2007)

Socio-Stigmatization of HIV/AIDS Status and the Cognitive Level of College-Age Students About HIV Transmission in Nigeria and United States
131
Sexually Transmitted Diseases
Today more than 65 million Americans have an incurable STD. Annually, 15 million persons become infected with one or more STDs; half contract lifelong infections (Cates, 2000). Over 1/4 of new infections occur in teenagers and college-age students. Most common STDs in the U. S. are: Chlamydia (5.5 mil. new cases), gonorrhea (650,000 new cases), syphilis (70,000 new cases), genital herpes (1 mil. new cases), human papillomavirus, hepatitis B, trichomoniasis, and bacterial vaginosis (CDC, 2000). About one college student in five hundred is believed to be HIV-positive. Annually, more students end-up with full-blown AIDS (CDC 1999;), and college-age students are at a higher risk because STDs are difficult to track and many individuals with the infections do not have symptoms and remain undiagnosed. High risk sexual activities such as unprotected sexual intercourse, group sex, and having sex while under the influence of alcohol and other drugs predispose this population to STD/HIV infections.
HIV infections and STDs Among University Students in the United States:
Although the precise number of people infected with HIV in the United States is unknown, among university students this statistic is even more difficult to establish because of the veil of secrecy surrounding medical screening medical screening and diagnosis of the college student population nationwide. CDC reported HIV/AIDS is the sixth-leading cause of death among individuals age 15-24 in the United States. The number of AIDS cases reported each year in that cohort increased by 417 percent from 1981 through 1994. CDC (2000) found 1 in 5 reported AIDS cases is diagnosed among college-age students (20-29). As the asymptomatic period may last 10 years, many diagnosed with AIDS in their 20‘s were likely infected as teenagers. The American College Health Association, CDC and the National Institutes of Health have estimated 1 in 500 college students are infected with HIV (Gayle, Keeling, Garcia-Tunon, et. Al. 1990).
HIV/AIDS STIGMA
People living with AIDS (PLWA), their intra-familial network and social groups have been stigmatized worldwide (Herek et al, 2002; Mann et al, 1992; Farmer, 1992 and Herek & Capitianio, 1993). Stigma interferes with and complicates compassionate care thereby imposing hardship on people living with HIV, their loved ones, caregivers, and communities (Herek, 2002; Herek, Mitnick & Burris, et al, 1998). Although HIV was not diagnosed until 1981; the report of Erving Goffman had elucidated the concept of stigma, the stigmatized person and how stigma should be analyzed. According to Goffman (1963) stigma is ―an attribute that is deeply discrediting‖ (p.3). He further explained that it is not the attribute that creates stigma, but the relationship between the attribute and society‘s beliefs, myths, and ideas about the attribute. Before the outbreak of HIV, Goffman (1963) characterized three types of stigma to include: bodily stigma, character stigma and group stigma. In his analysis homosexual males experience a group stigma and a character stigma because society often imputes character defect to those with ―sexual deviance‖. Goffman classified these discrediting attributes into two categories: Discrediting stigma if the stigmatized individual assumes that his stigma is visibly apparent and Discreditable stigma if the stigma can be hidden and not immediately discerned by others. Both types of stigma give
rise to alienation (Goffman, 1963; 1991). In the era of HIV/AIDS stigma can be conceptualized as an attribute or a label that sets an individual apart from others. Stigma links the labeled person to demeaning, undesirable and inhumane characteristics (Corrigan & Penn, 1999). Stigma in relation to HIV/AIDS is directed at individuals perceived to have AIDS (Corrigan, 1999). Shame as an internalized reaction stigma has been defined as ―a negative emotion elicited when an individual experiences failure in relation to personal or social standards, accepts responsibility for this failure and believes that the failure indicated self-inadequacy rather than inappropriate behavior‖. In sub-Sahara Africa particularly the HIV positive persons are stigmatized as untouchables, the walking corpse, infidelity rewarded, the ― ill person”, the one with the big cough, “ (Ugiagbe), it cannot be cured” . The language used to describe the individuals living with clearly conveys stigmatizing attitudes. Some very powerful examples of derogatory and stigmatizing local languages to characterize those living with the virus can be agonizing and psychologically dehumanizing. In Nigeria, most HIV positive persons feel guilty, shame and are exposed to stigmatization by society. Stigma, also represents a socially shared knowledge understood even by the targeted persons of the stigmatizing attitudes and behaviors. HIV/AIDS continues to be one of the leading causes of death in Nigeria and United States, and there is no known cure.
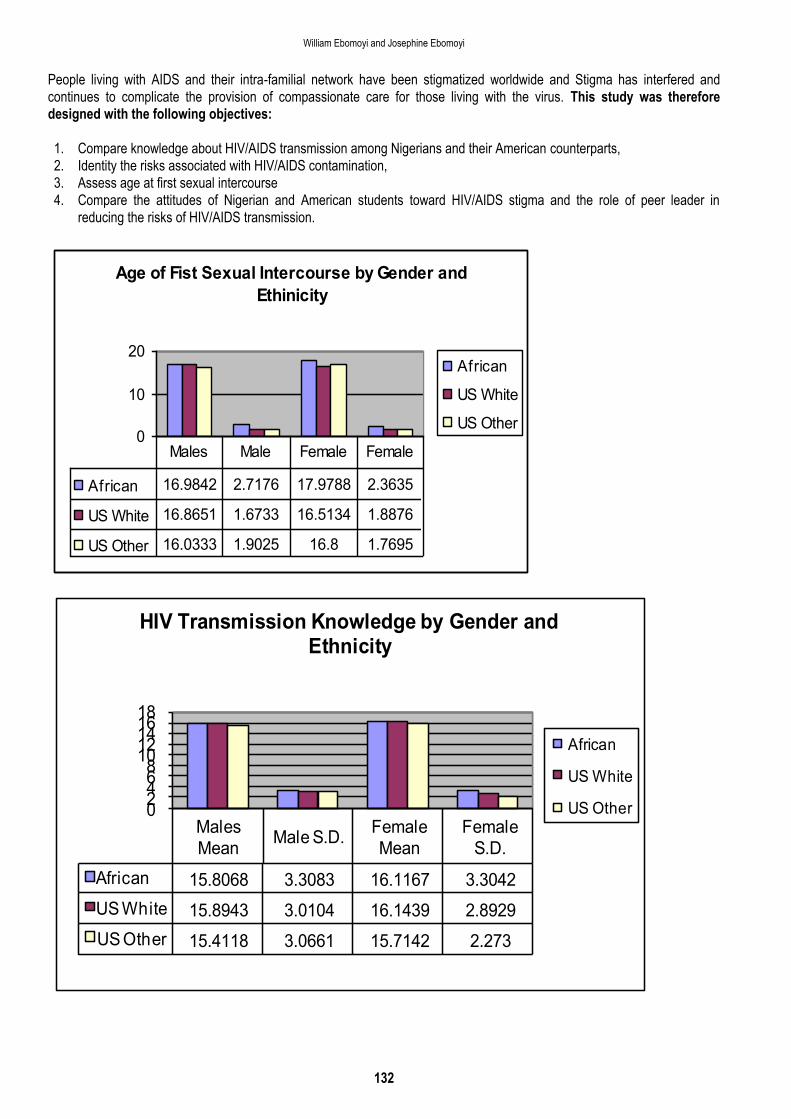
William Ebomoyi and Josephine Ebomoyi
132
People living with AIDS and their intra-familial network have been stigmatized worldwide and Stigma has interfered and continues to complicate the provision of compassionate care for those living with the virus. This study was therefore designed with the following objectives: 1. Compare knowledge about HIV/AIDS transmission among Nigerians and their American counterparts, 2. Identity the risks associated with HIV/AIDS contamination, 3. Assess age at first sexual intercourse 4. Compare the attitudes of Nigerian and American students toward HIV/AIDS stigma and the role of peer leader in
reducing the risks of HIV/AIDS transmission.
Age of Fist Sexual Intercourse by Gender and
Ethinicity
0
10
20African
US White
US Other
African 16.9842 2.7176 17.9788 2.3635
US White 16.8651 1.6733 16.5134 1.8876
US Other 16.0333 1.9025 16.8 1.7695
Males Male Female Female
Males
MeanMale S.D.
Female
Mean
Female
S.D.
African 15.8068 3.3083 16.1167 3.3042
US White 15.8943 3.0104 16.1439 2.8929
US Other 15.4118 3.0661 15.7142 2.273
02468
1012141618
HIV Transmission Knowledge by Gender and Ethnicity
African
US White
US Other

Socio-Stigmatization of HIV/AIDS Status and the Cognitive Level of College-Age Students About HIV Transmission in Nigeria and United States
133
Age of First Sexual Intercourse by Community
0
20
Africa
U.S.
Africa 16.9842 2.7197 17.9788 2.3636
U.S. 16.6554 1.7633 16.553 1.8703
Males Male S.D. Female Female
This study is a component of an elaborate international educational intervention program to prevent HIV/AIDS stigma in Benin City Nigeria and in Greeley Colorado. Subjects: 526 American university students and 289 Nigerian university counterparts: Total respondents were :387
females and 333 males. Methods: Three paid research assistants and two faculty administered a survey to 900 college students. 9.3% (54 students) Colorado subjects abstained and 9.6% (31 students) Nigerian subjects abstained. Research assistants were trained to elicit detailed responses to structured and open-ended questions. The survey consisted of questions on social stigmatization adapted from Herek et al. ( 2002), questions on knowledge about the risk of HIV/AIDS transmission, HIV/AIDS infection and Social-demographic characteristics were subject reported
To assess the reliability of the instrument, a pilot survey was conducted by administering the questionnaire to 100 randomly selected respondents. As a result of the pilot test the questionnaire was modified and the number of questions reduced to 60. A reliability of 0.92. was obtained by using spearmen‘s rank correlation. Descriptive statistics were used to summarize the data. Frequency test was used to compare mean scores of respondents about their knowledge in HIV/AIDS. Fisher‘s exact test was used to assess the degree of social stigmatization associated with HIV/AIDS between US and Nigerian respondents. The one-way analysis of variance (ANOVA) was used to assess the difference in knowledge among the various groups. The first question on social stigma derived from Herek‘s (2000) study focused on a proxy indicator for stigmatizing attitude. The inter-item consistency was computed to be 0.95 using Kuder- Richardson Formula 21 (Kuder-Richardson, 1939).
RESULTS
The gender, ethnicity and mean scores of subjects on the twenty HIV/AIDS risk of transmission questions are summarized in Table 1. The Caucasian females were the most knowledgeable about HIV/AIDS transmission than any other group. The respondents having the least knowledge about HIV/AIDS transmission were nonwhite males and females and Nigeria males.
Table 1: Mean scores of Respondents about Risk of HIV/AIDS
Respondents N Mean Standard Deviation
U S White 401 16.06 2.93
U S Non White 83 15.59 2.61
Nigerians 236 15.89 3.3
Females 387 16.09 2.89
Males 333 15.8 3.17
US White female 278 16.14 2.89
US White male 123 16.9 3.01
US Non White Female 49 15.41 3.07
US Non white male 34 15.41 3.04
Nigerian female 60 16.11 3.04
Nigerian male 176 15.41 3.08

William Ebomoyi and Josephine Ebomoyi
134
Table 2: Possibility of Someone getting HIV/AIDS by sharing A Glass of Water or Soft drink
LIKELY UNLIKELY TOTAL
SUBJECTS N % N % N %
US 12 1.46 516 62.62 528 64.00
NIGERIANS 30 3.64 266 32.28 296 35.92
TOTAL 42 5.10 782 94.90 324 100.0
Using Fischer‘s Exact test Chi squared with one degree of freedom
X2 =24.24 P<0.0001
On the specific element of HIV/AIDS stigma question; that is ―people who got AIDS through sex, drug use have gotten‖ what they deserve‖, American interviewees who gave stigmatizing responses were 143 (17.55%) compared to 92 (11.29%) Nigerians. American who gave non-stigmatizing responses were 383 (46.99%) compared to 197 (24.17%) Nigerians. Regarding the possibility of someone getting HIV/AIDS by sharing a glass of water of soft drink, the Americans who stated the it was unlikely were 516(62.62%), compared to 266(32.28%) of Nigeria respondents. Based on the data collected, a statistically significant association existed in the opinion of respondents about the possibility of getting HIV/AIDS by sharing a glass of water or soft drink with HIV positive patients. Summarized in Table 3, is the likelihood of having HIV by being coughed on or sneezed on by HIV positive patients. American subjects who stated that it was unlikely were 519(63.06%) compared to 267 (32.44%) of Nigeria respondents. Regarding age at first intake of alcohol, American respondents who abstained from alcohol were 65 (8.29%) compared to 84(10.7%) Nigerians Statistically significant association existed between age at first intake of alcohol and respondents nationality (X2=92.25, df6,P<0.0009).
Table 3: Is One Likely to Have HIV/AIDS by Being Coughed on or Sneezed on by an HIV Infected Person?
LIKELY UNLIKELY TOTAL
SUBJECTS N % N % N %
US 9 1.09 519 63.06 528 64.16
NIGERIAN 28 3.4 267 32.44 295 35.84
TOTAL 37 4.5 786 95.5 823 100.00
Using Fischer Exact Test Chi squared with 1 degree of freedom
X2 =26.73 df1 P<0.0001
Table 4: Age at First Alcohol Intake
SUBJECTS ABSTAIN 11-12 13-14 15-16 >17 TOTAL
US 65 (8.29) 41(5.23) 80 (10.2) 170 (21.68) 152 (19.39) 508 (64.80)
NIGERIAN 84 (8.29) 41(5.23) 17(2.17) 34(4.34) 100 (12.76) 276 (35.20)
TOTAL 149(19.00) 82(10.46) 97(12.37) 204(26.02) 252 (32.15) 784 (100.00)
Fisher‘s exact Test, X2 =92.25 df6 P<0.0009
Presented in Table 5, is the use of alcohol and other drugs before coitus; although 136 practiced abstinence, those who used alcohol before sexual intercourse were 84(10.84%) compared to 129(15.48%) Nigerians. These two variables involving use of alcohol and age at first sexual intercourse pertain to factors that could inhibit judgment before having sexual intercourse.
Table 5: Use of Alcohol and Other Drugs Before Last Sexual Intercourse
SUBJECTS NEVER HAD SEXUAL
INTERCOURSE YES NO TOTAL
US 136 (17.55) 84 (10.84) 272(35.10) 492(63.48)
NIGERIAN 60 (7.74) 36(4.65) 187(24.13) 283(36.52)
TOTAL 196(25.26) 120(15.48) 459(59..23) 775(100.00)
X2 8.68 DF2 P<0.013

Socio-Stigmatization of HIV/AIDS Status and the Cognitive Level of College-Age Students About HIV Transmission in Nigeria and United States
135
DISCUSSION
At the United Nations level, the various regional consultations have confirmed that stigma and discrimination faced by HIV positive persons particularly those men who have sex with men, constitute barrier to universal access to HIV prevention, treatment, and curative services (UNAIDS, 2007). The UNIAIDS therefore released resolutions to overcome these social barriers. Herek (1999) a pioneer in Stigma research, has emphasized that stigma involves prejudice and active discrimination toward persons who are either perceived to be HIV positive or actually infected. From this survey, the American respondents held relatively few stigmatization views about persons living with HIV compared to their Nigerian counterparts. Our results are consistent with the findings of Herek (1999) that knowledge plays a major role in dispelling ignorance and the American cohort was more knowledgeable about HIV-risks of transmission. The various stigmatizing labels used to either in United States or Nigeria against PLWA involve a process of derogation of individual attributes and blaming the affected persons for the devalued attributes(Coulter & Maida, 2005) According to Goffman (1963) stigma is associated with a trait that is discreditable. Recent reports from The United States Health Resource Administration (2003) emphasized how PLWA have been the target of stigma since the outbreak of the virus. There has been constellation of abuses, discrimination in the workplace, in social settings and even attempts to harm PLWA. It is quite obvious in many communities around the world, that PLWA are punished for simply revealing their HIV status. In many nations, the positive diagnosis of HIV status can easily create a psychological milieu whereby the medical provider may shun the patient and family member start advioding their relative with HIV/AIDS. The consequences of stigma consists of deterioration of interpersonal relations, negative emotions, rejection of HIV antibody test, guilt and severe psychosocial stress .(HRSA,2003). There is a need for official efforts banning discrimination against PLWA as this will enable them to disclose their sero-status of HIV without intimidation. Comprehensive education in the United States in many developing nations particularly in Nigeria can assist health care provider to treat and prevent HIV with more meaningful results.
ROLE OF PEER HEALTH EDUCATORS(PHE)
When trained and supervised, peer health educators become capable of providing interactive and experiential lessons that can facilitate risk reduction activities. Shuulkin, Meyer,DeMorr et al(1991) demonstrated an increase in knowledge following one 50-minute intervention by peer lead educators and a change in behavioral intentions to decrease future risky behavior. Robert et al(1943) observed attributes of peer-leaders:
Fellow students are more likely to hear and personalize messages that may result in changing their attitudes and behavior, if they believe the messenger is similar to them in life-style and faces the same concerns and pressures. Peer leaders are perceived as less threatening and more accessible than authority figures such as teachers and college professors. In less threatening situations, PHE may be better able to directly and immediately confront self destructive tendencies
REFERENCES
Olumbo O at al (2002) Acceptance and stigmatization of PLWA in Nigeria AIDS care 14: Pp117-126. CDC (2007) HIV/AIDS surveillance report. Cases of HIV in the United States and dependent areas Vol 19, Pp1-61. CDC(2000) HIV-related knowledge and stigma….United States CDC Report Vol. 49(47 Pp1062-4 Coulter ID and Maida CA(2005) Destigmatization of HIV: Progress or regress, International journal of Self-help care Vol 3
No3-4 Pp213-237. Goffman E (1963) Stigma notes on the management of spoiled identity, New Jersey Prentice Hall Pp1-40. Herek GM (1999) Aids and Stigma, American Behavioral Scientist Vol. 142(7) Pp1106. Mann J (1987) Statement at an Informal briefing on AIDS to the 42nd session of the United states General Assembly New
York, October. Mann J (1999) The future of global AIDS movement, Harvard AIDS Review 18-21 Rankin WW et al(2005) The stigma of being HIV positive in Africa, PLOS Med 2(8) e247 Retrieved February 28, 2009. United Nations (2007) Year in review: United Nations in 2007 Pp1-6, Retrieved February 28, 2009.
Robert O‘Connell Jr. and Edilberto A. Raynes
136
TUBERCULOSIS IN THE UNITED STATES: A LITERATURE REVIEW ON MULTI- AND EXTENSIVELY DRUG-RESISTANT
Robert R. O’Connell, Jr. and Edilberto A. Raynes JSA Healthcare Corporation and Tennessee State University
ABSTRACT
The number of reported cases of tuberculosis in the United States continues to remain steady. However, what is not readily
apparent is that despite public health efforts, these numbers are not declining as they should. Additionally, while the number
of reported cases has been decreasing in United States-born persons, the number of reported cases in foreign-born persons
is increasing at a greater rate. At one time tuberculosis had been considered all but eradicated. Tuberculosis has re-emerged
on a global scale and with its re-emergence has come drug resistant forms that are even more difficult to manage.
Researchers, scientists, and policy makers around the world are beginning to recognize the potential magnitude this re-
emergence will have on public health and the populations affected. While there is speculation regarding the causes behind
this re-emergence, which are varied in many ways, there does not appear to be definitive proof that any one of these
identified problems is the source. There could be the possibility that all of the identified problems are contributing collectively
to the continued tuberculosis problem. This paper explores some of the causes for the re-emergence of tuberculosis, in
particular multi-drug resistant and extensively-drug resistant forms, looks at the recommended preventions and controls, and
provides additional suggestions for combating this public health issue.
Keywords: Tuberculosis, Global, World-Wide, Multiple-Drug Resistant, Extensively-Drug Resistant, Therapy, United States,
Immigration, Prisons, Screening, Epidemiology, Antibiotics, Compliance, Non-Compliance, Capitalism,
Pharmaceuticals, Pharmacology, Treatment, Control, Prevention
INTRODUCTION
At one time Tuberculosis (TB) had been considered curable and preventable (Reichmann, 1993). There seems to be a re-emergence of TB once again in the U.S. with only a 50% cure rate (Reichmann, 1993). With the reemergence of TB, it now includes more challenging issues for it includes multi-drug (MDR) and extensively drug-resistant (XDR) tuberculosis forms CDC, 2008b; CDC, 2008c). While the number of reported TB cases in the United States (U.S.) born citizens continue to decrease, over the last 25 years the number of reported case of TB in foreign born people continues to remain steady (CDC, 2008a). CDC further reported that 58% of TB cases in the U.S. were from a foreign born population; in 2004, there were 9 million new cases of TB worldwide; and there were 13,299 new cases reported in the U.S. in 2007 with males sharing the largest burden (61%). In addition, the American Lung Association (2006) estimated that there are currently 10 million Americans infected with TB. With the rise of TB cases, CDC reported 100 cases of MDR TB and 2 cases of XDRTB in the U.S. as of 2007 (CDC, 2008a). This paper aims to look at the causative agent of TB, the clinical aspects of the aforementioned forms of TB, the epidemiology of MDR- TB and XDR- TB, and the potential control and prevention.
CAUSATIVE AGENT
There is speculation throughout the medical and public health community regarding just what has caused the re-emergence of TB as well as the reasons for the emergence of both MDRTB and XDRTB. Schmidt (2008) points to environmental and risk factors such as personal habits (smoking, alcohol and drug use, and prison overcrowding, to name a few). Goforth and Goforth (2000) link MDRTB and XDRTB to the use, and perhaps over utilization, of antibiotics in livestock feed. The following section explores potential and possible causes of MDRTB and XDRTB in the U.S. and its distribution within the population.
Antibiotic Usage
Goforth and Goforth (2000) found that one of the contributing factors to the spread of multi-drug resistant bacteria throughout the U.S. is the use of antibiotic additives in livestock feed. While farmers were enhancing the feed with antibiotics in order to promote growth in the herd and to reduce infections, the unintended consequence is that the antibiotics are passed on to

Tuberculosis in the United States: A Literature Review on Multi- and Extensively Drug-Resistant
137
humans through the livestock as a food source. They found that of the 50 million pounds of antibiotics produced in the U.S. only 50% are consumed by the population while the remaining 50% is utilized in livestock feed.
Likewise, Selgelid (2007) attributes much of the drug-resistant forms of TB to over-consumption of antibiotics. However, Selgelid argued that the misuse of antibiotics by rich nations might have caused burden of MDRTB and XDRTB on the poor countries. Selgelid cites a report from the World Health Organization (WHO) stating that between 2002 and 2020 there will be about 1 billion new cases of TB, with 150 million of those getting sick and 36 million will die. The lion‘s share will be borne by those in developing nations. He contends that over usage of antibiotics in developed nations has resulted in the under usage and misusage of antibiotics in developing nations.
Prison
Spencer and Morton (1998) conducted a mass screening program at the State of New Mexico Corrections Facility and found that tuberculosis morbidity was up to 6.5 times greater in the prison than in the general population. In their study on Analysis
of Prevention and Control of Tuberculosis in Correctional Facilities, Raynes and O‘Connell (2008) explored that there has been a four-fold increase of the prison population since 1980 (500,000 compared to 2 million in 2000). Additionally, they further state that 3.2% of the entire population with reported TB resides in U.S. prisons. Moreover, they asserted that the primary causes for the continued transmission of TB in our prison population were due to overcrowding, poor ventilation, and the diversity of the population in the prisons. Many of those in prison are illicit drug users, HIV positive, or had no access to healthcare due to low socioeconomic status. Likewise, many of the U.S. correctional facilities do not follow the CDC recommended guidelines for TB control and prevention that led to the increasing transmission within the prison population.
Non-Compliance
One of the common factors cited by various researchers (Burgos, et al, 2005; CDC, 2008a; CDC, 2008b; CDC, 2008c; Dybul, 2007; Dybul, 2008; Girard, 2007;Hill, 2008; McEwan, 2007; Nichols, 2001; Oeltman, et al, 2008; Reichmann, 2003; Selgelid, 2007; Schmidt, 2008) for the increase in TB and in MDRTB and XDRTB is the non-compliance in TB patients. The literature documented above has shown that those active TB infected patients who begin a course of treatment often times stop taking the drug. While all 50 states have ordinances requiring patients to be treated (Nichols, 2001) these ordinances only apply to those who have been identified and diagnosed. According to Goforth and Goforth (2000) and Selgelid (2007) when patients stop their treatment, this provides an avenue for the bacteria to develop resistance to the antibiotics. Each time a patient starts and stops treatment, resistance continues to build to the point the patient eventually develops MDRTB (Goforth, & Goforth, 2000; Selgelid, 2007).
Capitalism And The Free-Market System
Selgelid (2007), Stair (2006), and Girard (2007) point out that there have been no new anti-tuberculosis drugs created in the last 40 years. Additionally, there has been very little research and development investigating newer drugs to help combat TB, in particular MDRTB and XDRTB. Selgelid attributes this to the free-market capitalist system in that drug manufacturers are not compelled to research, develop, and manufacture new anti-tuberculosis drugs as they are not profitable. Since there have been no new drugs developed in the last 40 years, and with all the aforementioned factors, the mycobacterium tuberculosis bacteria have plenty of time to develop a resistance to the primary front-line drugs utilized in treating TB. Likewise, as a result of the building resistance to the front-line drugs, the bacteria are now developing a resistance to the second-tier drugs resulting in XDRTB.
Immigrant Screening Processes
A thorough study was conducted by Oeltman et al. (2007) regarding immigrant screening prior to arrival in the United States. A special immigration program had been developed by the US for Hmong refugees in 2003. As part of that immigration program – a health screen – including a Tuberculosis Skin Test (TST) is conducted prior to immigration to the US. From 2004 – 2005 (post pre-screening program) Oeltman et al. (2008) identified 272 TB positive immigrants out of 15,455 that were screened. Of those, 24 were found to have MDR TB. These individuals remained in the Thailand refugee camp. Essentially, their findings indicated there needed to be improvements in the screening program to include providing additional testing facilities and personnel in the refugee camp to ensure all immigrants were tested and treated prior to their emigration. This was a single controlled study of a limited population. As such, in order for these results to be conclusive, more testing is recommended in larger populations in other countries.

Robert O‘Connell Jr. and Edilberto A. Raynes
138
However, Nichols (2001) pointed out that there have been many reports that ―some panel-approved physicians‖ can and do issue clean bills of health to immigrant applicants for a bribe. Such incidents would diminish any advances made in immigrant screening programs. One other potential problem that Nichols pointed out was that of the 22 million annual foreign visitors they are trusted to report their health status on their paperwork. Since they are not immigrants, they are not required to go through the same rigorous screening programs.
Illegal Immigration
Jauregui, Cristobal-Salas, Rodriguez-Diaz, and Castanon-Puga (2003) conducted a simulation of infection by TB in a Texas-Mexico border town to see the effects. They selected bars and discos in the city of Tijuana as this is a border town where U.S. citizens tend to stay over prolonged periods of time among Mexican citizens. Given the illegal immigration problem in the U.S. coupled with poor TB screening, tracking, and prevention in Mexico their simulation found the U.S. to be at great risk for an outbreak of TB at U.S.-Mexico border towns both from U.S. citizens bringing the disease back with them and by illegal migration.
CLINICAL ASPECTS OF TB
Clinical Manifestations
Tuberculosis results from infection of mycobacterium tuberculosis and presents with the following symptoms: weight loss, loss of appetite, persistent cough, malaise and easily fatigued, coughing up blood, and in some cases, fever and night sweats (Heymann, 2004). Diagnosis of TB is through a skin test (TST), QuantiFeron ® TB Gold Test (QFT-G), chest radiography, or sputum examination (Raynes & O‘Connell, 2008). The TST is an intradermal injection (usually on the forearm) and read after a 48 to 72 hour period after administration. The TST is considered positive if a >10mm induration exists. A TST of >5mm induration may be considered positive if they have other co-morbidities to include being HIV/AIDS positive or immunocomprimised. MDR TB is a form of TB in which resistance to isoniazid and rifampicin exists. These are considered first-line drugs in the treatment of TB (CDC, 2008b). MDR TB is spread the same was as regular TB in which an individual comes in contact with an airborne tubercle bacilli that is expelled when some coughs, speaks, or sneezes (CDC, 2008b; Heymann, 2004). XDR TB is a form of TB in which resistance to both isoniazid and rifampicin exists as well as a resistance to any flouroquinolone and at least three injectible second-line drugs (CDC, 2008c). XDR TB is spread in the same manner as TB and MDR TB.
Treatment
Treatment for TB consists of regular injections of isoniazid, rifampin, pyrazinamide, and either ethambutol or streptomycin until signs and symptoms no longer remain. This protocol could last six months or more (Stair, 2006). The best practice to ensure compliance is through practitioner monitored Direct Observation Therapy (DOT). Treatment of MDR TB, since there is resistance to two of the first-line antibiotics, is DOT of the remaining first-line antibiotics as well as second-line antibiotics with continued monitoring and testing. While not entirely incurable, it is more difficult to treat someone with MDR TB than one with regular TB. Such a regimen could take up to 24 months to resolve. Treatment for XDR TB is extremely difficult, costly, and does not promise a resolution (Khan, Muennig, Behta, and Zivin, 2002; Pablos-Mendez et al, 1998). There is a vaccine available for TB – Bacille Calmette-Guerin (BCG), that is used extensively in other countries. However, it is not recommended or widely used in the U.S. since it has not been proven effective in preventing TB in adults (CDC, 2008c).
EPIDEMIOLOGY OF TB, MDR TB, AND XDR TB
Population Prevalence & Incidence
Currently, it is estimated that 30% of the world‘s population has some form of TB infection (Khan, Muennig, Behta, & Zivin, 2002; Pablos-Mendez et al, 1998; Azia & Wright, 2005; Stair, 2006; Girard, 2007). In the United States there are
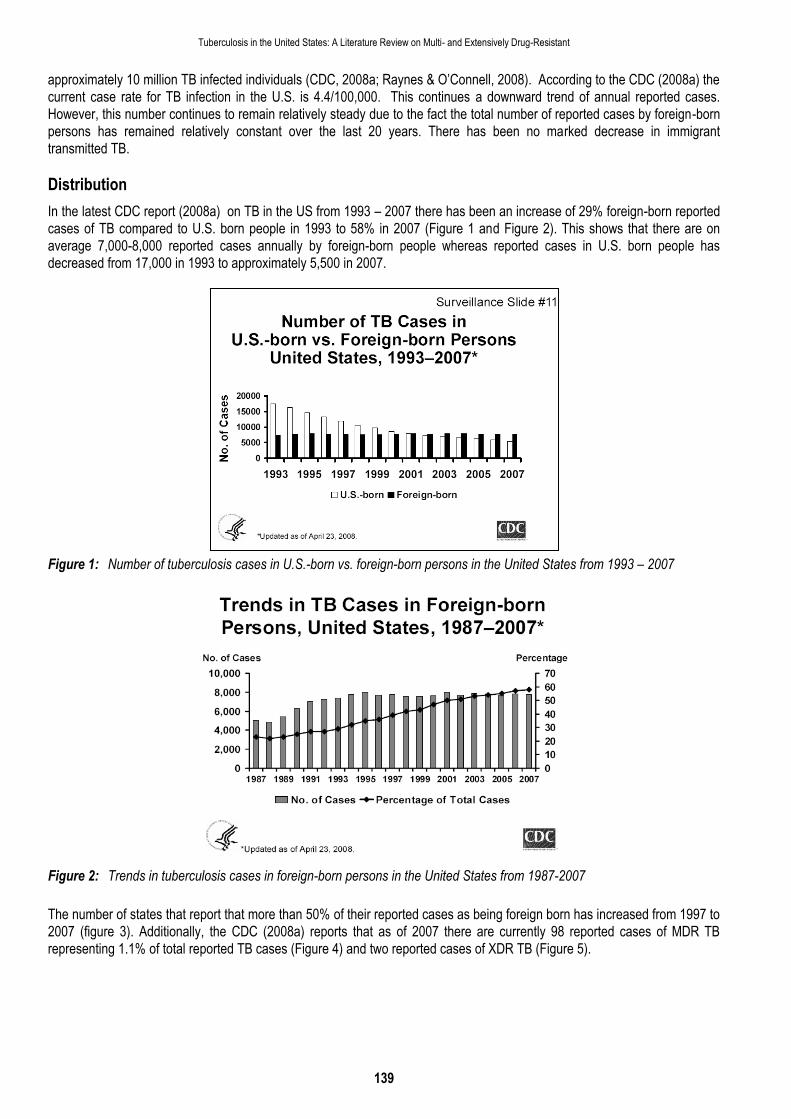
Tuberculosis in the United States: A Literature Review on Multi- and Extensively Drug-Resistant
139
approximately 10 million TB infected individuals (CDC, 2008a; Raynes & O‘Connell, 2008). According to the CDC (2008a) the current case rate for TB infection in the U.S. is 4.4/100,000. This continues a downward trend of annual reported cases. However, this number continues to remain relatively steady due to the fact the total number of reported cases by foreign-born persons has remained relatively constant over the last 20 years. There has been no marked decrease in immigrant transmitted TB.
Distribution
In the latest CDC report (2008a) on TB in the US from 1993 – 2007 there has been an increase of 29% foreign-born reported cases of TB compared to U.S. born people in 1993 to 58% in 2007 (Figure 1 and Figure 2). This shows that there are on average 7,000-8,000 reported cases annually by foreign-born people whereas reported cases in U.S. born people has decreased from 17,000 in 1993 to approximately 5,500 in 2007.
Figure 1: Number of tuberculosis cases in U.S.-born vs. foreign-born persons in the United States from 1993 – 2007
Figure 2: Trends in tuberculosis cases in foreign-born persons in the United States from 1987-2007
The number of states that report that more than 50% of their reported cases as being foreign born has increased from 1997 to 2007 (figure 3). Additionally, the CDC (2008a) reports that as of 2007 there are currently 98 reported cases of MDR TB representing 1.1% of total reported TB cases (Figure 4) and two reported cases of XDR TB (Figure 5).

Robert O‘Connell Jr. and Edilberto A. Raynes
140
Figure 3: Foreign-born persons in the United States, 1997 compared to 2007
Figure 4: Reported cases of Primary MDRTB in the United States from 1993 to 2007
Figure 5: Number of reported XDRTB cases reported in the United States from 1993 to 2007
The total distribution of reported TB cases in the United States by age and ethnicity is found under Figure 6. Non-Hispanic whites have the lowest rates whereas rates were the highest in Asians and Native Hawaiians/Other Pacific Islanders. The greatest numbers of infection were found in the >65 age group.

Tuberculosis in the United States: A Literature Review on Multi- and Extensively Drug-Resistant
141
Figure 6: Tuberculosis case rates by age group and race/ethnicity in the United States in 2007.
The CDC Report (2008a) also indicates that males are more likely to acquire TB than females. Of all the ethnic groups, of the 2007 reported cases, Hispanics had the highest number of cases (3,872) followed by Blacks (3,470), Asians (3,445), the Whites (2,216). The distribution of males versus females follows this same trend with Hispanic males having the highest reported cases followed by males of the above groups. Of all foreign-born people with reported cases of TB the distribution by countries is as follows: Mexico (24%), Philippines (12%), India (8%), Viet Nam (7%), China (5%), Haiti (2%), Republic of Korea (2%), and all other countries (39%) – (see Figure 7).
Figure 7: Countries of birth of foreign-born persons with tuberculosis reported in the United States in 2007
Occurrence
TB is co-morbid to those who are immunocompromised (including those diagnosed with HIV/AIDS, and hepatitis). Those individuals infected with TB may be either symptomatic or asymptomatic. Those who are symptomatic are considered to have active TB where as those who are asymptomatic have a latent form of TB. In the US the majority of adult infections result from the reactivation of latent TB (Heymann, 2004) as the result of contact with other infected individuals or due to compromised immune system from an illness. Likewise, 30% of those in large U.S. urban areas who develop TB are new infections (Heymann, 2004). As previously mentioned, the largest cases of new infection are in foreign-born people. Additionally, it has been reported of newly arrived immigrants there is a high TB incidence rate shortly after they arrive to the U.S. (Oeltman et al, 2008). Such increases could be due to the low sensitivity of the pre-immigration screening programs. Furthermore, two-thirds of all reported foreign-born people with TB in the U.S. originate from one of the following countries: Mexico, the Philippines, Vietnam, India, China, Haiti,

Robert O‘Connell Jr. and Edilberto A. Raynes
142
and South Korea (Khan, Muennig, Behta, and Zivin, 2002). Having this knowledge, control and prevention strategies should be developed that specifically address the reduction of TB in foreign-born persons. In the U.S., Heymann (2004) reported that it is estimated that at the current rates the annual rate of risk for new infections is 10/100,000. This is above our current case rate.
Geography
Based on the latest report from the CDC (2008a) the majority of cases with the highest case rates are reported in border states (Figure 8) and those states that are prone to migrant workers. New York has large Asian and sub-Saharan immigrant populations that continue to cause their case rates to remain elevated.
Figure 8: Geographical reporting of cases of tuberculosis
Overall, the greatest numbers of reported cases of TB in the United States occur in Pacific states, Southeastern states, and Texas (CDC, 2008a).
Reservoir and Mode of Transmission
The primary reservoir for transmissions is humans (Heymann, 2004). The primary means of infection and transmission in humans is through inhalation of tubercle bacilli expelled by someone who is infected with mycobacterium tuberculosis. These airborne particles are known as droplet nuclei. A droplet nuclei may be transmitted when a person sneezes, coughs, or speaks. A susceptible individual becomes infected after the droplet nuclei has been inhaled and ―taken up by alveolar macrophages‖ (Heymann, 2004, p565). Other means of transmission is found in a hospital, or other healthcare setting, during various medical procedures including surgery, bronchoscopy, autopsy, endoscopy, and endotracheal intubation (Heymann, 2004; Raynes & O‘Connell, 2008). Healthcare workers are particularly susceptible as a result and nosocomial infections have increased 36% over the past 20 years (Peterson & Walker, 2006).
Incubation Period
According to Heymann (2004) the incubation period for all forms of TB (including MDR and XDR) is anywhere between 2 to 10 weeks. Latent TB infection can last for a lifetime and reactivity remains a possibility despite treatment.
Period of Communicability
Essentially, as long as the sputum contains viable tubercle bacilli, an individual remains contagious. It is therefore essential that anyone diagnosed with TB be treated and to continue treatment for as long as is necessary to eliminate communicability. Communicability may be eliminated within 2 to 4 weeks with antimicrobial chemotherapy (Heymann, 2004).

Tuberculosis in the United States: A Literature Review on Multi- and Extensively Drug-Resistant
143
Susceptibility
Susceptibility is directly proportionate to the amount of time exposed and the amount of viable airborne droplet nuclei. However, young children under the age of 3 remain highly susceptible as do older adults (Heymann, 2004). Individuals who are immunocompromised or immunosuppressed are even more susceptible. The susceptibility increases in those in lower socioeconomic groups as the result of being malnourished or underweight, substance users, or alcoholic. Heymann (2004) states that those groups who have not been previously exposed to TB are also highly susceptible to infection. He further states that those individuals with latent TB with HIV have a 10% - 50% chance of developing an active case of TB.
PREVENTION AND CONTROL
Nettleman (2005) adds that MDR and XDR TB are entirely man-made as the result of over-utilization of antibiotics that cause increased resistance through spontaneous mutation. The recommended prevention to creating resistant strains is to treat the primary cases correctly (completion of DOT and appropriate use of antibiotics).
Prevention
The CDC (2008b) recommends the following for prevention of TB, MDR TB and XDR TB:
1. Take all medications as prescribed. No doses should be missed and treatment should not be stopped early. 2. Health care physicians can help prevent further spread by quickly diagnosing cases and following recommended
treatment guidelines. 3. Avoid exposure to individuals known to have TB, MDR TB or XDR TB 4. Health care workers should practice universal precautions when treating TB diagnosed patients (to include using
respiratory devices). Heymann (2004) recommends the following additional preventive measures:
1. Education of the public regarding preventive measures and modes of transmission for avoidance. 2. Set up TB prevention and control programs in institutions where transmission is likely to occur. 3. Make public health nursing and outreach services available 4. Automatic testing of all HIV infected individuals
Additional recommendations for the prevention of TB or the further spread of MDR and XDR TB would be to reduce or eliminate the need for enhancing livestock feed with antibiotics. Additionally, health care practitioners should be more cautious in prescribing antibiotics and only prescribe when absolutely necessary.
Control
Control and containment of those infected with TB, MDR TB and XDR TB vary depending on severity and whether or not there is a localized outbreak. During the initial stages and diagnosis of TB patients should be isolated from others in order to prevent the further spread. Individuals infected with TB should avoid all social situations. Likewise, all healthcare providers should immediately report any suspected cases of TB to local public health authorities for proper surveillance and contact follow-up. Public health officials should provide testing to all known contacts of infected individuals and to implement isolation protocols with known contacts until diagnostic testing has been completed. Healthcare workers should practice universal precautions when treating TB infected persons. All medical equipment should be cleaned and disinfected after use, or if and whenever possible, disposable medical equipment should be utilized. Housekeeping should clean and disinfect all sinks, beds, bedding, floors, and any other areas that a TB infected patient may have been treated. Practitioners responsible for the treatment of TB infected persons should continue to closely monitor their patient to ensure completion of antibiotic therapy.

Robert O‘Connell Jr. and Edilberto A. Raynes
144
SUMMARY
Tuberculosis was at one time considered to be a curable disease (Reichmann, 1993). Because of over-utilization of antibiotics multiple and extensively drug-resistant strains of tuberculosis have developed. While this may be one of the main culprits of MDR and XDR TB, it has also been proven that non-compliant patients too have contributed to the increase in MDR and XDR TB cases. Coupled with the aforementioned is the fact that pharmaceutical companies have not developed a new anti-tuberculosis drug in over 40 years and there does not appear to be plans to develop new ones in the future. While TB appears to be on the decline in the United States, it continues to be a global problem that the United States will some day have to face. Current pre-immigration screening programs appear to be providing some controls to prevent further active cases from entering the country. However, there is evidence that some physicians may be falsely approving health records to immigrants which sabotage the pre-screening process. The U.S. – Mexico border towns are particularly prone to increased risk of TB infection outbreaks. Illegal immigration just exacerbates the problem as infected persons gain access to this country without any prior testing or screening. Likewise, foreign visitors do not go through any pre-screening exams either. It would be prudent, with the continued increase in world wide TB cases, for the United States to implement more stringent requirements for foreign visitors as well as crack down on illegal immigration. There are currently laws on the books that the U.S. Congress and law enforcement refuses to enforce. While incidence of MDR and XDR TB is relatively low right now, considering there has been a gradual increase in foreign-born TB cases compared to U.S. born cases over the last 25 years, it is recommended that U.S. public health and elected officials begin to look at current immigration laws more closely and to develop appropriate measures, such as more stringent pre-immigration screening programs, to reduce these numbers and provide safety and security to the American public.
REFERENCES
American Lung Association. (2006). Tuberculosis. Retrieved on November 2, 2008, from http://www.lungusa.org/site/pp.aspx?c=dvLUK9O0E&b=35778.
Azia, M.A., and Wright, A. (2005). The World Health Organization/International Union against Tuberculosis and Lung Disease Global Project on Surveillance for Anti-Tuberculosis Drug Resistance: A model for other infectious diseases. Clinical
Infectious Diseases, Supplement, 41, S258-S262. Brown, J.W. (2004). TB: keeping an ancient killer at bay. Medical Laboratory Observer, 36(11), 8-10, 14-6, 18-21. Burqos, M., Gonzalez, L.C., Paz, E.A., Gournis, E., Kawamura, L.M., Schecter, G., Hopewell, P.C., and Daley, C.L. (2005).
Treatment of multidrug-resistant tuberculosis in San Francisco: An outpatient-based approach. Clinical Infectious Diseases, 40(7), 968-975.
Centers for Disease Control and Prevention. (2008a). Reported tuberculosis in the United States, 2007. Atlanta, GA: U.S. Department of Health and Human Services.
Centers for Disease Control and Prevention. (2008b). Multi-drug resistant tuberculosis (MDRTB). Retrieved on November 4, 2008, from http://www.cdc.gov/tb/pubs/tbfactsheets/mdrtb.htm
Centers for Disease Control and Prevention. (2008c). Extensively Drug-Resistant Tuberculosis (XDR TB). Retrieved on November 4, 2008, from http://www.cdc.gov/tb/pubs/tbfactsheets/xdrtb.htm
Dybul, M. (2007). Threat of drug-resistant tuberculosis. Congressional Testimony. Dybul, M. (2008). U.S. response to multidrug resistant tuberculosis. Congressional Testimony. Girard, N.J. (2007). Tuberculosis is making a comeback [corrected] [published erratum appears in AORN J 2007 May;
85(5):888]. AORN Journal, 85 (2), 261-262. Goforth, R.L., and Goforth, C.R. (2000). Appropriate regulation of antibiotics in livestock feed. Boston College Environmental
Affairs Law Review, 28(1), 39–78. Heymann, D.L. (2004). Control of communicable diseases manual. 18th Edition. Washington, D.C.: American Public Health
Association. Hill, K.R. (2008). U.S. response to multidrug resistant tuberculosis. Congressional Testimony. Jauregui, C., Cristobal-Salas, A., Rodriguez-Diaz, A., Castanon-Puga, M. (2003). Simulation of contagion by tuberculosis in
public places at US-Mexico border area edited by Di Martino, B., Yang, L.T., and Bobeanu.C. The European Simulation and Modelling Conference. Conference paper. pp348-352
Khan, K., Muennig, P., Behta, M., and Zivin, J.G. (2002). Global drug-resistance patterns and the management of latent tuberculosis infection in immigrants to the United States. New England Journal of Medicine, 347(23). 1850-1859.
McEwan, E. (2007). Threat of drug-resistant tuberculosis. Congressional Testimony.

Tuberculosis in the United States: A Literature Review on Multi- and Extensively Drug-Resistant
145
Nettleman, M.D. (2005). Multidrug-Resistant tuberculosis: News from the front. Journal of the American Medical Association, 293(22), 2788-2790.
Nichols, H.S. (2001). A troubling comeback for TB. Insight on the News, 17(36), 20-22. Oeltmann, J.E., Varma, J.K., Ortega, L., Liu, Y., O'Rourke, T., Cano, M., Harrington, T., Toney, S., Jones, W., Karuchit, S.,
Diem, L., Rienthong, D., Tappero, J.W., Ijaz, K., and Maloney, S.A., (2008). Multidrug-resistant tuberculosis outbreak among US-bound Hmong refugees, Thailand, 2005. Emerging Infectious Diseases, 14(11). Retrieved on November 1, 2008, from http://www.cdc.gov/eid/content/14/11/1715.htm
Pablos-Mendez, A., Raviglione, M.C., Laszlo, A., Binkin, N., Rieder, H.L., Bustreo, F., Cohn, D.L., Lambregts-Van Weezenbeek, C.S.B., Kim, S.J., Chaulet, P., and Nunn, P. (1998). Global surveillance for antituberculosis-drug resistances, 1994-1997. The New England Journal of Medicine, 338(23), 1641-1650.
Peterson, A.M.B., and Walker, P.H. (2006). Hospital-acquired infections as patient safety indicators. Annual Review of
Nursing Research, 24, 75-99. Purvis, A., and Thompson, D. (1991). TB takes a deadly turn. Time, 138(22), p85. Raynes, E.A., and O‘Connell, R.R. (2008). An analysis of prevention and control of tuberculosis in correctional facilities.
International Journal of Social Health Information. 1(2), 47-54. Reichmann, L.B. (1993). Fear, embarrassment, and relief: The tuberculosis epidemic and public health. American Journal of
Public Health, 83(5), 639-641. Schmidt, C.W. (2008). Linking TB and the environment. Environmental health perspectives. 116(11), A479-A485. Selgelid, M.J. (2007). Ethics and drug resistance. Bioethics. 21(4). 218-229. Stair, P., (2006). Tuberculosis Even More Drug Resistant. World Watch, 19(4), p8. Spencer, S.S., and Morton, A.R. (1998). Tuberculosis Surveillance in a State Prison System. American Journal of Public
Health, 79(4), 507-509.

Danka Radulovic, Dobrivoje Radovanovic and Zoran Ilic
146
COGNITIVE ABILITIES OF PSYCHOPATH KILLERS COMPARED TO THE ABILITIES OF NORMAL NON-CRIMINAL POPULATION
Danka Radulovic, Dobrivoje Radovanovic and Zoran Ilic University of Belgrade
ABSTRACT
On the basis of the results on the battery of eight psychopath tests, applied on the larger sample of homicide offenders, the
sub-sample of 54 psychopath killers was derived, using Ward hierarchy method of grouping. Discriminative analysis of this
subset and another subset complementary to it in the area of psychopathic feature enabled us to conclude that diagnosis of
psychopath for our sub-sample of murders is reliable. Cognitive characteristics of these killers identified as psychopaths are
defined by cybernetic model of cognitive function. They were compared to cognitive characteristics of normal, non criminal
population. It was found out that psychopath killers are clearly different from non criminal population as they have inferior
functions of all three basic cognitive processors. Using Fisher‘s method for a posteriori diagnostic it was possible to recognize more than 70% of subjects with cognitive pattern which is typical for psychopathic killers. In that pattern, defects of perceptive
processors are dominated, but defects of parallel and serial processors are significance and discriminative, too. As a result,
average IQ of psychopath killers was 89.
Keywords: Cognitive Abilities, Psychopath Killers, Normal.
PROBLEM
It is well known that empirical researches dealing with typology of killers proved the existence of psychopath killers among others types of homicide offenders (Blackburn, 1986, 1998). Moreover, criminological and psychological evidence indicated their majorities in the population of serious murders (Stone, 1998). Although, an attempts to form a typology of killers were often derived on the basis of the results obtained through MMPI questionnaire in its original or some other shortened version; however, as increase in Pd scale, which would be a clear symptom of psychopathy, is very rare phenomenon if not followed by increases in other clinical scales both due to weak reliability of the scale and artificially generated correlations of all scales contained in this questionnaire, and since it is not so often that high increase in Pd scale is followed by increases in Sc and Ma scales, which is also a symptom of psychopathy, psychopaths taxa based on these results is very hard to obtain in relatively same form, and in real dimensions. In any case, psychopath killers top the field of risk factors of violence crimes and must be considered not only a central part of any punitive strategy but also of strategy of prevention (Hare, 1993,1996). Murders committed by psychopath killers are callous, cold blooded, uncomplicated, done like business. They are often planned and calculated, carried out without guilt, inhibition, empathy and fear. Modern understanding of psychopathy in relation to violence is reflected on description of psychopathy in the latest American and International classification of mental disorders. For example, in DSM-IV (APA, 1994), the term for psychopathy is ―antisocial personality disorder‖ basically pointed to antisocial orientation of such individuals and the danger they represent to the society. The similar term for psychopathy, ―dissocial personality disorder‖, is applied in ICD-10 (WHO, 1992) characterized at least three of follow: 1. callous unconcern for feelings of others; 2. gross and persistent attitude of irresponsibility and disregard for social norms, rules and obligations; 3. incapacity to maintain enduring relationships, though having no difficulty in establishing them; 4. very low tolerance to frustration and low threshold for discharge of aggression, including violence; 5. incapacity to experience guilt and to profit from experience, particular punishment; 6. marked proneness to blame others, or to offer plausible rationalizations for the behavior that has brought individual into conflict with society. However, beside all the mentioned, it‘s still only a few data about what cognitive abilities of psychopath killers are in respect to normal, non-criminal population, and there are no clear data at all about cognitive characteristics defined in cybernetic model of information processing; anyway on the basis of that model it is possible to make good assessment of probability of this type of criminal behavior (Momirovic, Hosek, 1998).

Cognitive Abilities of Psychopath Killers Compared to the Abilities of Normal Non-Criminal Population
147
In fact, there is no consistent data about cognitive functions of psychopaths in general. But results of some research have shown that physical violent criminal psychopaths are of lower intelligence which makes them more dangerous than other offenders (Hirschi, Hindeland, 1977, Radulovic et al. 2006; Momirovic et al, 2000). As the comparison of intelligence of killers, and especially intelligence of psychopath killers with intelligence of normal, non-criminal population is very rare and very non systematic (Singer, 1994), the aim of this work is to make this comparison define intellectual ability under the cybernetic model of cognitive functioning ( Momirovic, et al, 1982).
METHOD
From one sample of killers, which were subject to eight psychopathy tests, a sub-sample of 54 examinees was extracted on the basis of results obtained in taxa analysis performed by Ward method of hierarchy grouping. Canonic discriminative analysis of this and complementary sub-group of killers in the area of psychopath, oral and anal aggressiveness, belonging to subculture of violence, machiavellism, hedonism, hyper-individualism and pseudo-masculinity, has shown that such sub-sample may be identified as sub-group of psychopath killers. Canonic correlation of discriminative function, which was in high correlation with all applied variables, and binary variable which differentiated psychopath from other killers was .83, so that with simple linear classifiers it was possible to recognize 96.1% of psychopath killers. Those examinees were subject to battery of cognitive abilities tests KOG 3 (Wolf, et al. 1992) which assessed cognitive dimensions assumed by cybernetic model of cognitive functioning provided by Momirovic and associates (1982).Those dimensions have been assessed with simple simulation of results obtained in test tasks IT1, AL4 and S1 contained in this battery. Hence, these cognitive factors have been obtained: (1) perceptive processor factor ( the results are scaled in such a way that higher score means better efficiency of processor for perceptive information processing); (2) serial processing factor ( the results are scaled in such a way that higher score means better efficiency of processor for symbolic sequential information processing); (3) parallel processing factor ( the results are scaled in such a way that higher score means better efficiency of processor for simultaneous information processing). Differences in cognitive abilities of psychopath killers and normal population10 were analyzed using serial t-tests; testing the level of significance of Mahalanobis distance of the sample from the population; accounting uniserial coefficient correlation and a posteriori classification of subjects derived with two alternative methods, with the aim to establish whether psychopath killers should be recognized on the basis of cognitive profile. Procedure for that purpose was described in the article of Momirovic, et. al (2000).
RESULTS AND DISCUSION
Tables 1, 2, 3, 4 and 5 show the results of the analysis of discrepancies between arithmetic averages in cognitive function tests for psychopathic killers and expected values among population. Table 1 contains expected population values marked with pop, sample arithmetic averages are marked with sm, variables are marked with vrsm, standard deviation with sdsm, while standard error for of sample arithmetic value is marked with esm. Table 2 contains entry discrepancy, marking discrepancy between arithmetic sample value and population, standardized discrepancy between arithmetic sample averages and expected population values is marked with z, while ttest represents t-test result for such discrepancy; error related to rejection of the hypothesis that cognitive characteristics of psychopath killers are not different from those characteristics among normal population is marked with hre. In table 3, Mahalanobis distance between this sample and population is marked with dsq, while the result of Hi-square of the distance significance test is marked with hisq, hre stands for the error for rejection of zero hypothesis that cognitive functions of psychopath killers do not differ from cognitive functions of normal population, and c stands for critical point of Fisher‘s discriminative function. In table 4, squares of separation coefficient are marked with etasq, while Momirovic uniserial correlation coefficients are marked with eta, and w stands for Fisher‘s discriminative coefficients. Table 5 contains number and percentage of correct a posteriori classifications based on Fisher‘s procedure for form recognition, which are marked with t1 and p1, while t2 and p2 stand for the number and percentage of correct a posteriori classifications based on Momirovic procedure for forms recognition. 11
10 Population values of means of tests of cognitive factors were obtained from the sample of 52 000 subjects which was representative one for Yugoslav population of adult
males in stationary phase of cognitive development. Metric characteristics and norms of those tests are given in Manual (Wolf, et al, 1992). 11 The author of applied programs UNISER and UNICLAS is Momirovic (2000).

Danka Radulovic, Dobrivoje Radovanovic and Zoran Ilic
148
Table 1: Parameters of Psychopath Killers Samples
PROCESSOR pop sm vrsm sdsm esm
PERCEPTIVE 20.700 13.963 62.369 7.897 1.075
SERIAL 25.710 20.278 115.682 10.756 1.464
PARALLEL 18.030 13.463 58.767 7.666 1.043
Table 2: Discrepancies Between Sample Averages and Population
PROCESSOR discrepancy z ttest hre
PERCEPTIVE -6.737 -.853 6.269 .000
SERIAL -5.432 -.505 3.711 .000
PARALLEL -4.567 -.596 4.378 .000
Table 3: Mahalanobis Distance, Distance Significance Test and Critical Point of Discriminative Function
dsq hisq hre c
.766 41.372 .000 -2.16
Table 4: Separation Coefficient, Uniserial Correlation Coefficient and Discriminative Coefficient
PROCESSOR etasq eta w
PERCEPTIVE .421 .649 -.095
SERIAL .203 .451 -.018
PARALLEL .262 .512 -.006
Table 5: Number and Probability of Correct Classifications
t1 p1 t2 p2
38 .704 37 .685
As evident from these results, psychopath killers possess inferior intelligence compared to comparative non-criminal population; it is easy to calculate that their IQ is only 89. This differentiates psychopath killers from the rest of criminal population; yet, criminals have lower level of cognitive abilities (Radovanovic, et. al 1995, Hirschi, Hindeland,1977), they are still somewhat more intelligent than psychopath killers. Although psychopath killers posses inferior functions with all three basic cognitive processors, still their cognitive profile is dominated by breakdowns in perceptive, than parallel processor, i.e. processors whose functions are dominated by genetic factors. However, latent profile of such breakdowns, defined by a set of Fisher‘s discriminative functions, shows that main generator of intellectual insufficiency among psychopath killers is inability to identify, analyze and synthesize incoming information, i.e. basic operations needed for more complex cognitive processes and for reasonable decision-making. Such cognitive profile is so characteristic for psychopath killers, that on the basis of simple Fisher‘s linear classificatory it is possible to recognize 70.4% such killers only on the basis of cognitive profile. Of course, such percentage is too low to apply for psychopath detection among murderers in direct way. However, combined with other diagnostic operations, out of which detection of psychopath killers on the basis of their cognitive profile (Radovanovic, et al. 2001) is most important one, operation of identification of psychopath killers also on the basis of cognitive profile or on the basis of the outcome of Fisher‘s recognition method, probably would not be useless. Reliable psychological empiric records have established that apart from the fact that there are a lot of psychopaths among criminals in general, their proportion among murderers is even higher. In fact, killers may be divided into two taxa: one, which

Cognitive Abilities of Psychopath Killers Compared to the Abilities of Normal Non-Criminal Population
149
covers almost two thirds of murdering population, composed of psychopaths, i.e. real criminals, and the remaining part of one third of killers without psychopath symptoms, who committed murder out of sudden passion, due to excessive defense, or as a typical situation delict. Although this type of killers does not have fully normal cognitive profile, it strongly differs from psychopath killers also due to their cognitive functions12. Therefore, one of the main reasons of inferior cognitive functions among psychopath killers is negative correlation between the cognitive abilities and violent criminal psychopathy, which was proved on examinees from non-criminal group (Momirovic, Hosek, 2000; Hosek et al. 2001). It seems that such correlation is of systematic character; such deep core damages to conative regulators are not possible as are characteristic for psychopath population, without having disorder in functions of their cognitive processors as a consequence. Of course, low cognitive abilities among psychopath killers makes cognitive control of their behavior much harder than in the case of intelligence of killers in general. Cognitive defects make cognitive control of deviant impulses and alocentric logics of brutal psychopath criminals very hard. From criminological point of view, there is a very unfavorable piece of information stating that psychopath killers, as well as killers in general, have main damages in processors which are under influence of exogenous factors. However, cognitive control of behavior mostly depends on serial processor functioning (Momirovic,et al. 1986), so that attempts to improve cognitive control of psychopath killers‘ behaviour are not hopeless, at least not partially, because exogenous variable of serial processor is pretty higher than those cognitive processors whose damages are characteristic for most serious offenders.
REFERENCE
American Psychiatric Asssociation (1994). Diagnostic and statistic manual of mental disorders(4th ed.)Washington,DC:Author. Blackburn, R. (1986), Patterns of personality deviation among violent offenders: Replication and extension of empirical taxonomy.
British Journal of Criminology, 26, 254-269. Blackburn, R. (1998), Psychopathy and the Contribution of Personality to Violence, In: T., Millon, E., Simones, M., Briket-Smith, &
R. Davis, (1998), Psychopathy: antisocial, criminal and violent behavior. 50- 69, New York & London: Guilford Press. Hare, R. D. (1993), Without conscience: The disturbing world of the psychopaths among us New York: Pocet books. Hare, R.D.(1996), Psychopathy: A clinical construct whose time has come, Criminal Justice and Behaviour, 23, 25-54. Hirschi, T. and Hindeland, M. J. (1977), Intelligence and delinquency: A revisionist review, American Sociological Review, 42,
571-587. Hosek, A.; Radovanovic, D.; Radulovic, D.; Momirovic, K. (2001): About the relations between stupidity, hysteria and
psychopathy , 40th Congress of Anthropology Association of Yugoslavia, 114, Nis: Anthropology Association of Yugoslavia
Momirovic, K.; Horga, S.; Bosnar, K. (1982): Cybernetic Model of Cognitive Functioning: Attempt to create synthesis of some theories about the structure of cognitive abilities, Kinesiology, 14, 5: 63-82.
Momirovic, K.; Hosek, A. (1998): Impact of Cognitive and Conative Factors to Criminal Behavior Psychology, 31, 1-2: 29-44. Momirovic, K.; Hosek, A. (2000): Intelligence and Psychopathy 39th Congress of Anthropology Association of Yugoslavia,
Releases, 6, Belgrade: Anthropology Association of Yugoslavia. Momirovic, K.; Hosek, A. (2001): About the Intelligence of Normal and Psychopath Criminals 40th Congress of Anthropology
Association of Yugoslavia, 112, Nis: Anthropology Association of Yugoslavia Momirovic, K.; Hosek, A.; Popovic, D. A. (2000): A measure of the distance of a sample from a population: Point-uniserial
correlation coefficient. Statistic Review, 49, 1-4: 7-10. Momirovic, K.; Ignjatovic, I.; Sipka, P.; Horga, S. (1986): Canonical relations between intellectual and personality domains,
Review of psychology, 16, 1-2: 21-32. Radovanovic, D.; Radulovic, D.; Hosek, A.; Momirovic, K. (2001): Personality Traits of Psychopathic Killers Technical report,
Institute of criminological and sociological research, Belgrade
12 The following table shows the results obtained in the examination of cognitive abilities of killers who do not have psychopathic personality characteristics. Discrepancy of
means of the sample of non psychopath killers and population:
PROCESSOR sm discrep. z
PERCEPTIVE 16.25 -4.45 -.57 SERIAL 28.19 2.48 .22 PARALLEL 16.28 -1.75 -.21
Defects of perceptive and parallel processors of non psychopath killers are obviously lower and they, in general have no defect to serial processor, so their mean IQ is equally 97.

Danka Radulovic, Dobrivoje Radovanovic and Zoran Ilic
150
Radovanovic, D.; Radulovic, D.; Momirovic, K.; Hrnjica, S. (1995): Cognitive and Conative Characteristics of Criminals, In D. Radovanovic, Psychology of Crime, 1, 75-86. Belgrade: Institute of criminological and sociological research and Center of applied psychology.
Radulović, D.(2006) Psychology of Crime–Psychopathy and Offences, Belgrade: Faculty of Special Education and Rehabilitation, Institute of Criminological and Sociological Research.
Radulovic, D.; Hosek, A.; Momirovic, K.; Radovanovic, D. (1998): The influence of sociological and psychological factors on various forms of criminal behavior, Summary of 4th scientific conference "Empirical research in psychology", 20-21. Belgrade: Institute of Psychology and Laboratory of Experimental Psychology.
Singer,M. (1994): Kriminologija.Zagreb:Globus. Stone, H. (1998), Sadistic personality in murders. In: T., Millon, E. Simonsen, M. Briket-Smith, and R Davis, Psychopathy:
antisocial, criminal and violent behavior, 346-359, New York & London: Guilford Press. Warld Health Organization.(1992) International classification of deseases and related health problems (10th ed) Geneva:
Author. Wolf, B., Momirović, K., Džamonja, Z. (1992), Kog 3 Baterija testova inteligencije, Beograd: Centar za primenjenu psihologiju.

Gender Disparities in Prenatal Screening of Pregnant Mothers for Life Threatening Genetic Diseases
151
GENDER DISPARITIES IN PRENATAL SCREENING OF PREGNANT MOTHERS FOR LIFE THREATENING GENETIC DISEASES13
William Ebomoyi1 and Josephine I. Ebomoyi2,3 Chicago State University1, Saint Xavier University2 and Northwestern Memorial Hospital3
ABSTRACT
This project explores the role of the National Institutes of Health, United States Department of Energy and other international
collaborators in accomplishing the sequencing of the draft of human genome by 2003. This initiative facilitated the
development of genomic epidemiology as an inevitable component of translational science. Epidemiological technique was
utilized to assess gender disparities in prenatal and neonatal screening for hemoglobin disorders. As recently observed,
epidemiological studies have revealed glaring disparities in the screening and medical treatment of expectant mothers with
unborn fetuses with genetic disorders. Although genomic technology enhanced the increasing detection of early onset of
many genetic disorders and their medical management, there is disproportionate abortion of female fetuses compared to their
male counterparts in many developing nations. This review outlines the cultural, social and phenomenological nuances of
gender preferences in selected developing nations. It is therefore axiomatic for educators to pay attention to the issues of
fairness, social justice and equity in the medical management of genetic diseases in developing nations. Also, the ethical,
legal and social implications of advanced medical neonatal interventions are succinctly discussed.
INTRODUCTION
The recent scientific breakthrough in human genomic sequencing created significant international improvement in the management of disease. In Genomics and the Public‘s Health: The Institute of Medicine (2003) defined public health genomics as ―the study of the entire human genome‖ The acclaimed potential benefits of genomics include: improving the health of the public (not only the actions of single genes, but also the interactions of multiple genes with each other and with the environments, differentiating genomics from genetics (functions and effects of single genes). Harwell‘s (2004) definition of genomics is ―the study of the whole genome‖ and the development and application of more effective mapping, sequencing and bio-informatics computational tools Genomics scientists are also involved in molecular techniques for linkage analysis, physical mapping, and the sequencing of genomes to generate detailed data which are subjected to analysis, using high-speed computer facility A typical genome is the entire collection of chromosomes which are present in the nucleus of each cell of an individual organism. Genomic technology has many and various applications in prenatal screening of pregnant mothers for several life-threatening genetic diseases. Owing to the innovations in genomic science and its potential to detect numerous genetic alleles which could be lethal or defective, this project was designed to: explore possible single gene diseases could be diagnosed during prenatal screening of pregnant women, explore those single gene diseases which are associated with consanguineous marriages, discuss disparities associated with the disproportionate abortion of female fetuses compared to the male fetus and
discuss the socio-cultural implications of consanguinity and outline strategies to eliminate discrimination against females worldwide.
GENETIC DISEASES
Genomics has enhanced the ability of most clinicians or gynecologists to quickly detect the onset of genetic diseases in the unborn fetus. Many of the single gene diseases which follow Medelian pattern of inheritance include sickle cell anemia, cystic fibrosis, hemochromatosis, hemophilia, neurofibromatosis, Duchenne muscular dystrophy, Tay-Sachs disease, phenylketonuria ( PKU) and Huntington diseases among others (Tables 1 and 2).
13 This paper was presented at the Women & Gender Studies Program Symposium ―Privilege, Power and Politics on Tuesday, March 12, 2009 at Chicago State University,
Chicago Illinois

William Ebomoyi and Josephine Ebomoyi
152
Table 1: Interpretation of Common Findings in Screening Newborns in the U.S. for Hemoglobinopathies.
Confirmed Phenotype
Possible clinical syndromes Clinical/hematologic severity
F only Homozygous
- β° thalassemia
- (δβ)° thalassemia
- HPFH
- Combination of any two above (Very premature baby with undetectable β-hemoglobin)
Severe hemolytic disease
Moderate to severe hemolytic disease
Asymptomatic
Depends on combination
F A Normal Hb genes
Heterozygous
- β+ thalassemia
- β° thalassemia
- (δβ)° thalassemia
- HPFH
- β+ thal. plus β° or (δβ)°
Homozygous β+ thalassemia
Normal
Asymptomatic; microcytosis; hypochromia; mild anemia
Asymptomatic; microcytosis; hypochromia; mild anemia
Asymptomatic; microcytosis; hypochromia; mild anemia
Asymptomatic; slight hypochromia; usually no anemia
More severe conditions than heterozygotes above
Severe hemolytic disease
F A S
F S
F S C
F S A
F S D
F S O-Arab
F S E
A S (sickle cell trait)
A S-Antilles (S-Antilles trait)
S S (Hb SS Disease)
S β° thalassemia
S (δβ)° thalassemia
S- HPFH
S C (Hb SC Disease)
S β+ thalassemia
S D (Hb SD Disease)
S O-Arab (Hb S O-Arab Disease)
S E (Hb SE Disease)
Usually asymptomatic
Extremely rare; moderately severe sickling disorder
Severe sickling disorder, variable course
Severe sickling disorder, variable course
Mild sickling disorder
Usually asymptomatic
Moderately severe sickling disorder
Mild to Moderately severe sickling disorder
Moderately severe sickling disorder
Moderate to severe sickling disorder
Mild hemolytic disease
F A C
F C
F C A
A C (Hb C trait)
C C (Hb CC disease)
C β° thalassemia
C β+ thalassemia
Asymptomatic
Moderately severe hemolytic disease
Moderately severe hemolytic disease
Asymptomatic; microcytosis; hypochromia
F A E
F E
A E (Hb E trait)
E E (Hb EE disease)
E β° thalassemia
Asymptomatic; microcytosis; hypochromia; mild anemia
Very mild hemolytic disease
Severe hemolytic disease
Any phenotype, +Bart‘s
Genotype plus α-thalassemia As for genotype, + microcytosis; hypochromia; mild anemia
Where the phenotype shows Hb F plus one other Hb, the β° syndromes [β°, (δβ)°, and HPFH] should also be considered. (Source: Kwaku Ohene-Frempong, M.D., Comprehensive Sickle Cell Center, The Children‘s Hospital of Philadelphia, 34th Street & Civic Center Boulevard, Philadelphia, PA 19104.
The complex genetic diseases are the congenital heart disease, neural tube defects, cleft lip/palate, and congenital primary hypothyroidism. The chromosomal aberrations include: Down syndrome, fragile-x syndrome, klinefelter syndrome and trisomy13 among others. Although the technology for screening and detecting these diseases were developed quite a few years ago, the high precision liquid chromatography and hemoglobin electrophoresis are found to be quite effective. DNA-based test used in many prenatal services has been modified with the improved knowledge of many medical scientists and

Gender Disparities in Prenatal Screening of Pregnant Mothers for Life Threatening Genetic Diseases
153
molecular biologists. These gene tests can be used to diagnose, and confirm genetic diseases, even before the symptoms of the disease begin to appear. DNA test can effectively predict or provide relevant information about the progression or prognosis of a disease. It can also predict the risk of future onset of specific diseases in apparently healthy individuals (Ebomoyi,2009, Ebomoyi, 1998)..
GLOBAL GENETIC SCREENING OF PREGNANT MOTHERS
The expressed intent of prenatal screening of expectant mothers is to ensure that unborn fetus is not only developing in a heavy environment in the uterus, but also has an acceptable chance of survival during and after birth. To ensure that this natural process becomes a reality, there are specific drugs, foods and alcoholic beverages that are prohibited during pregnancy. Other medical rationales for screening of carriers of genetic diseases during pregnancy include the possibility of certain diseases being severe enough to demand requisite screening and diagnosis. Clinical epidemiologists must be able to ascertain that an inexpensive test is available with acceptable sensitivity and specificity. Sensitivity is when the technology indicates that the genetic disease is present when it is actually present, whereas specificity is when the technology indicates that the genetic disease is absent when in fact the disease is not present in the unborn baby. Reproductive option must be available for the couple. The best example is that of Tay-Sachs disease, because this disease is autosomal recessive disorder and because of the attendant neurological defects and the possibility of death at the age of two and four years, and no known therapy; this disease is most appropriate for prenatal screening. With advances in genomic medicine, many of the genetic diseases can routinely be managed to ensure that the child with many of these can still enjoy improved quality of life. Specifically, the guidelines recommended by the World Health Organization WHO(2006) for most genetic screening must meet a number of requirements before implementation: The condition in question should portray high prevalence The condition in question should impose a significant health and economic burden on the population The gene in question should be easily and inexpensively tested, the analytic validity of the test should be justify the
screening Genetic counseling and prenatal diagnosis should be available and termination of affected pregnancies, for women who voluntarily choose to use this service should be a feasible option For many of the genetic diseases presented in Table 1, these conditions are squarely met(WHO, 2006).
WORLDWIDE PRACTICE OF CONSANGUINEOUS MARRIAGES
Consanguineous relationship is characterized by the marital practice whereby people share common ancestry. Illustrated in figure 1, is the global prevalence of consanguineous marital practice. Groups of people are said to be consanguineous if they have common recent ancestors. This relationship has potent genetic implications when the common ancestry is not more that than two or three recent generations. In genetic epidemiology, a consanguineous marriage is most frequently defined as occurring between marriage partners who are related as second cousin or closer intra-familial groups. There are many reasons which underlie the practice of consanguinity. There are the cultural and economic rationales. In many communities in developed and developing nations, those involved in the practice, adduce the relevance consanguineous marriage as a cultural practice for strengthening family ties, sustainability of family wealth, land ownership and maintenance of intra familial nobility. There is a high degree of social compatibility involving cultural nuances and the close involvement of the entire family in consanguineous unions which promote lower divorce rates and enhanced female autonomy (Bittles, 1994). In many areas, consanguinity is used as rationale not only for landholdings but also for reduced requirement for dowry or bride price. The belief is that the bride will enjoy a more harmonious relationship with her new parent-in-law
GLOBAL PREVALENCE
As illustrated in Figure 1, in North America, Australia and New Zealand, the prevalence of consanguinity is less than 1%, in South America, Japan and China, this marital practice has a range of 4 to 9% depending on whether one is in rural or urban areas of these countries. Many communities in North and sub-Saharan Africa, the Middle East and West, Central and South Asia portray a strong cultural option for consanguineous marriage (Modell & Darr, 2002; Modell & Kuliev, 1998)). It should be noted that Pakistan demonstrates a strong cultural preference for consanguinity than Saudi Arabia. A national survey in Pakistan revealed the prevalence of consanguinity to be 62%, whereas in Saudi Arabia, the prevalence is 58%, compared to Jordan which revealed a frequency of 50-66% and in the Kingdom of Bahrain, the rate stood at 39% in 1995.

William Ebomoyi and Josephine Ebomoyi
154
Figure 1: Global Prevalence of Consanguinity
Although there is tolerance of consanguinity in many cultures worldwide, under the Chinese Law, marriage between relatives of first and second degrees of kinship is legislatively prohibited. However, the marriage between first cousin and uncle/niece and nephew marriages may be permissible particularly in communities where such practice has been a component of their cultural behavior. The Hindu Marriage Act in India proscribes and bans uncle/niece marriage, but studies in parts of southern India revealed that more than 21% of Hindu marriages were between uncles and nieces. Although consanguinity is not an etiological agent for the high prevalence of recessive alleles, the practice constitutes a risk factor for hereditary genetic diseases. Cultural anthropologists do argue that preference for consanguineous marriage is a component of the socio-cultural context that medical genetic services need to operate. However, in view of the overwhelming evidence created by the field of genomics, emphasizing how genetics plays an increasingly important role in the diagnosis, monitoring, and treatment of diseases the practice of consanguinity must be reviewed. Beside, genomics has revealed that all diseases have not only genetic components, but researchers are able to pinpoint errors in genes, and proteomes which are the smallest units of heredity, most likely to cause or contribute to specific diseases. In fact, in the industrialized nations, biotechnological companies have made tremendous progress in commercialization of medical technology. State-of –the- science diagnostic tests with very high sensitivity and specificity are now available to detect errant genes in children born from consanguineous marriage. Summarized in Tables 1 and 2 are some of the typical genetic diseases that children born out of consanguineous marriages are most at risk. So far, with the promise of the Human Genome Project, there is no known cure for any of these genetic diseases (Ebomoyi, 2009).

Gender Disparities in Prenatal Screening of Pregnant Mothers for Life Threatening Genetic Diseases
155
Table 2A: Some of the Most Common Major Genetic Disorders
Disorder Single Gene Description Genetype Genetic Prevalence
1. Sickling & related blood disorders
Including Sickle-cell anemia, Thalassemia, and others Single Gene 1:680
2. Colon Cancer (Familial Adenomatous Polyposis)
Inherited predisposition to colon cancer Single Gene 1:5000
3. Polycystic Kidney Disease
Kidney Cysts resulting in death in infants, or another version resulting in varying affects on mid-life adults
Single Gene 1:4000
4. Hemochromatosis Treatable metabolic disorder of excessive iron accumulation in the body; varying degrees of severity
Single Gene 1:2500
5. Hypercholesterolemia Hereditary high cholesterol Single Gene 1:2000
6. Breast/Ovarian Cancer Inherited form of cancer in breasts and/or ovaries found 1 in 270 woman over 50 in U.S.
Single Gene 1:1850
7. Noonan Syndrome Heart Defects, mental retardation, hypogenitalism Single Gene 1:1000
8. Cystic Fibrosis Lung disorder usually resulting in death by late twenties Single Gene 1:400
9. Alpha I-Antitrypsin Deficiency
Metabolic disorder which may result in liver cirrhosis and emphysema
Single Gene 1:350
10. Neurofibromatosis (Type 1)
Disorder resulting in varying degrees of deforming tumors Single Gene 1:330
11. Waardenburg Syndrome Results in deafness and other features Single Gene 1:250
12. Ichthyosis Multiple forms of scaling skin disease Single Gene 1:200
13. Duchenne Muscular Dystrophy
Disabling muscle loss in male children; results in death by age 20
Single Gene 1:140
14. Hemophilla A Blood disorder resulting in excessive bleeding Single Gene 1:110
15. Achondroplasia Short-Limbed Dwarfism Single Gene 1:100
16. Marfan Syndrome Connective tissue disorder with varying degrees of severity Single Gene 1:100
17. Tuberous Sclerosis Epilepsy, mental retardation, and other features Single Gene 1:100
18. Congenital Adrenal Hyperplasia
Dehydration and weight loss, virilization, many die in infancy Single Gene 1:67
19. PKU (phenylketonuria) Metabolic disorder which may cause mental retardation if untreated
Single Gene 1:60
20. Huntington Disease Results in severe mental and physical incapacities in midlife Single Gene 1:50
Table 2B: Some of the Most Common Major Genetic Disorders
Disorder Multifractorial Genes Description Genetic Link Genetic Prevalence
1. Congenital Heart Defects Defects in heart function or structure Multifractorial 1:5700
2. Neural tube Defects Lack of closure result in anencephaly, hydrocephalus, or spina bifida,
Multifractorial 1:2000
3. Diabetes Type 1 Insulin-dependent diabetes Multifractorial 1:2000
4. Cleft Lip/Palate Lack of closure in the upper lip and/or palate Multifractorial 1:1420
5. Down Syndrome Disorder resulting in mild or severe mental retardation Chromosomal 1:1000
6. Fragile-X Syndrome Causes mental retardation mostly in males Chromosomal 1:700
7. Klinefelter Syndrome Extra ―X‖ chromosome in males, usually taller, with delayed sexual development; permanent infertility in 99% of cases
Chromosomal 1:500
8. Trisomy 18 Extra #18 chromosome, results in cardiac defects, mental retardation, and other defects
Chromosomal 1:333
9. Congenital Primary Hypothyroidism
Mental, skeletal and growth retardation, sluggishness Multifractorial 1:250
10. Turner Syndrome Results in short stature, sexual immaturity in females Chromosomal 1:200
11. Trisomy 13 Extra #13 chromosomes results in abnormal brain and heart, deafness, with death in 1st year for over 80%
Chromosomal 1:200

William Ebomoyi and Josephine Ebomoyi
156
GENDER DISPARITIES IN FETAL ABORTION AND SEX SELECTION
Abortion refers to the termination of pregnancy which follows pre-natal diagnosis of abnormality which constitutes health risk either for the unborn baby or the expectant mother or both. Termination of pregnancy routinely accepted for Tay-Sachs among Ashkenazi Jews and abortion on account of thalassemia is religiously allowed in Saudi Arabia and Pakistan even up to 17 weeks of pregnancy. Whereas abortion under any circumstances is not tolerated in Chile, this practice is universal in most of the Latin American states and the Caribbean with the exception of Cuba, Ecuador and the isolated jurisdiction of Mexico City (Penchaszadeh, 2004). In many cultures where the social system does not treat men and females equally and where there is strict gender roles, the scope for discrimination against women exit, and the females who gives birth to children with recessive genes is tainted with ill luck and this could create the potential for discrimination, because they are stigmatized as carrier of recessive genes. In many of these societies, where consanguineous marriage is accepted, the practice of sex-selective abortion not occurs but also in such communities, the there are strong social and cultural structures that strongly favor the birth of male of male children. Sex selection for medical reasons could involve the selection of specific gender to avoid reproducing children affected by sex-linked recessive genes. In many developing nations, ―sex selection almost exclusively involves the abortion female fetuses‖ Commercialization of personalized medical services has led to the development of very sophisticated genetic diagnostic tools capable of identifying with relative ease, the sex of the fetus. Even before the upsurge of genomic technology, ultrasound machine, which is relatively inexpensive, was used worldwide to identify fetal gender. Coale and Banister (1994) reported for many European nations approximately 51.3% of all live births are males revealing a live birth ratio of 1.06. Comprehensive European data indicate relatively consistent ratio of 51.39 for Austria, Belgium 51.27%, Denmark 51.38%, England and Wales 51.2%, France 51.18%, Germany51.47%, Italy 51.35%, Netherland 51.38% and Spain 51.44% ( Graffelman et al, 1999). The one child policy adopted by the Chinese government further exacerbated gender disparity and female infanticide. The current male: female birth ratio of 58.8% reveals glaring evidence of male preference in China. The concomitant effect of this policy is the high incidence of obesity in adolescent males in the areas with the attendant medical complications.
PHENOMENOLOGY AND CULTURAL CONTRIBUTIONS TO GENDER DISPARITIES
The lived-experiences of people, their culture, religious and ritual observances constitute their phenomenological experience. The cultural milieu which contributes to gender disparities in prenatal abortion of the fetus is associated with the gender specific role in societies. In the developing nations, the domineering role of males by ascribing to them leadership functions regarding religious observances, burial rights, military functions, and political leadership activities accentuate their perceived superiority to their female counterparts. The roles of females in these societies include enhanced fecundity, child up-bringing, domestic type duties which further relegate their functions to non-aggressive less risk-taking status. Whereas, the inherent biological genes of female with their XX chromosomes confer better longevity and improved quality of life as universal advantage. However, in developing nations, their male counterparts develop and modify human cultural attributes just to compensate for their biological disadvantages. From the innovative human genome project, and the commercialization of sophisticated sequencing techniques, numerous genetic diseases will be diagnosed, and the attributed alleles will be characterized so as to pinpoint the litany of disadvantages of consanguineous and endogamous marriages. In the twenty first century, the physical agony, the psychosocial pain associated with these single genes, and those involving multi-factorial etiological agents have out-spaced existing curative medical sciences anywhere in the world.
HUMAN RIGHTS AND VIOLATIONS OF FEMALES
The social bias in favor of male children in many cultures has led to the abortion of female fetuses during prenatal screening and diagnosis. Man‘s inhumanity to females is reflected in currents sex selection mainly of male children because is not only oppressive, but it dehumanizes females. In society where this practice is rampant, the various Ministry of Health and Women affairs have major role to play in exposing these wanton disparities in the entire regions. Stringent legislations must be developed to ban t sanguineous marriage which serves as the precursor for the prevalence of excessive recessive alleles

Gender Disparities in Prenatal Screening of Pregnant Mothers for Life Threatening Genetic Diseases
157
in the gene pool of the society. The United Nations Committee (1979) on the Elimination of all forms of Discrimination Against Women (CEDAW) requires State Parties to take all appropriate measures:
To modify the social and cultural patterns of conduct of men and women, with a view to achieving the elimination of prejudices and customary practices and all other behaviors which are based on the idea of the inferiority or superiority of either the sexes or on stereotyped roles for men and women(UN,CEDAW,1979).
Strategies to eliminate the disparities in the abortion of female fetuses and other lethal female infanticide demand the empowerment of females worldwide, and their education. The education of women can create an awareness which will lead to the exposure of all forms of inhuman practices meted on them. Many of such cultural practices include, female genital mutilation, scarification, and the elimination of female fetuses with relatively benign recessive alleles. The education and employment opportunities for women in rural areas of the world will enable them to become mobile, and self-sufficient in stead of being reticent and susceptible to dangerous cultural practices of underdeveloped, developing and industrially advanced parts of the world.
REFERENCES
Bittles, A. H. (1994) The role and significance of consanguinity as a demographic variable, Population and Demographic
Review, 20, pp. 561-584. Coale, A. J. and Banister, J. (1994) Five decades of missing females in China, Demography, 31(3), pp. 459-479. Ebomoyi, E. W. (1998) Community Medicine: A Global perspective, Belmont, CA, Star Press Ebomoyi, E. W. (2005) ―Genomic applications in public health across all populations, environment and work setting‖,
Continuing Education Institute, Presentation at the American Public Health Association meeting and exposition Philadelphia, PA, retrieved 2/10/ 2009, www.Apha.confex.com/apha/133am/techprogram/sessions_16480.htm-6k
Ebomoyi, E. W. (2009) National genomics disparities in the wake of personalized medical service, American Biotechnology
Laboratory, March 2009 (In Press). Ebomoyi, W. and Srinivasan, S. (2009) Innovation in capacity building in genomics technology in USA, International Journal of
Medical Engineering and Information, (In press). Festini, F. and de Martino, M. (2004) Twenty five years of the one child policy in China, Journal of Epidemiology and
Community Health, 58(5), pp/ 358-360. Graffelman, J., Fugger, E. F., Keyvanfar, K. and Schulman, J. D. (1999) Human live birth and sperm-sex ratio compared,
Human reproduction, 14(11), pp. 2917-2920 Hartwell, L., Hood, L., Goldberg, M., Reynolds, A., Silver, L. and Veres, R. (2004) Genetics from genes to genomes, McGraw
Hill higher Education, Boston. Institute of Medicine (IOM)(2005) Future of public health, The National Academy Press, Washington, DC. Institute of Medicine (IOM)(2005) Implications of genomics for public health, The National Academy Press, Washington, DC. Khoury, M. J. (1999) Human genome epidemiology (HuGE): Translating advances in human genetics into population-based
data from medicine and public health, Genetics in Medicine, 1, pp. 71-73. Modell, B. and Darr, A. (2002) Science and society: genetics counseling and customary consanguineous marriage, Nature
Reviews: Genetics, 3(3), pp. 225-229. Modell, B. and Kulier, A. (1998) The history of community genetics: the contribution of hemoglobin disorders, Community
Genetics, 1. Pp. 3-11. Penchaszadelh, V. B. (2004) Genetic services in Latin America (Guest editorial), Community Genetics. United Nations (1979) Convention on the elimination of all forms of discrimination against women, UN (A/RES/58/145). United Nations (1999) Report of the committee on the elimination of all forms of discrimination against women, CEDAW
(A55/38). World Health Organization (WHO) (2006) Medical genetic services in developing countries, WHO human genetics chronic
diseases and health promotion, Geneva, Switzerland, WHO pp. 1-234.

Kenton Fleming
158
COMPUTER AIDED ENGINEERING: AN UNDERGRADUATE COURSE IN COMPUTER AIDED DESIGN AND ANALYSIS FOR MECHANICAL ENGINEERING
TECHNOLOGY SOUTHERN POLYTECHNIC STATE UNIVERSITY
Kenton Fleming Southern Polytechnic State University
ABSTRACT
An undergraduate mechanical engineering technology course in Computer Aided Engineering (CAE) is presented. This
course consists of two parts: advanced geometry modeling; and computer simulations. Assignments are chosen to provide
sufficient challenge to the student. The level of difficulty for this course requires upper classmen level prerequisites such as
Fluid Mechanics or Strength of Materials. For each problem the student must create geometry and then perform a computer
simulated engineering analysis. The course requires the student to critically interpret computer input and output.
This paper presents examples of student assignments from this course. Two problems in complex geometry creation and one
problem in computational fluid dynamic (CFD) simulation are presented. Geometry problems involve an aircraft body and a
race car body. The CFD problem involves external, low Reynolds number, incompressible flow around the race car body.
Results are presented for pressure contours, velocity vectors and surface pressure contours. Geometry creation and flow
analysis are performed using SolidWorks and COSMOS FloWorks respectively. Topics discussed are surface modeling,
surface and line continuity, and surface analysis tools. Topics in CFD include geometry input, mesh generation and
refinement, and initial and boundary conditions. Interpretation of computational results is also discussed.
Keywords: Computational Fluid Dynamics, CFD, Solidworks, SolidWorks, Solid Works, FloWorks, Cosmos, Simulation,
Computer, CAD, CAE, Prismatic
INTRODUCTION
Market demands for non-prismatic (complex) design are apparent through products that are being manufactured today. Plastic molded and metal products, automotive styles, etc. are examples of items that have a complicated shape. The skill level to achieve these shapes in a computer aided virtual environment requires artistic and engineering finesse beyond the introductory college CAD course. Equally important is the success of computational simulations on the same. Such results depend greatly upon the quality of these geometries since these geometry models serve as the input to any CAE software. Industries have expressed the need for such talent in college engineering graduates. This paper proposes a college level, semester long course in this very subject of computer aided engineering (CAE). Here the student will be equipped to perform a number of engineering simulations on various engineering systems by creating the geometries and subjecting them to the virtual stress test or wind tunnel provided by CAE software. In this paper Solidworks and Cosmos are used. Assigned problems are presented for geometry creation and fluid flow simulation.
GEOMETRY
Geometry is the main input to a computer aided analysis problem. Figure 1 shows one of the first geometry assignments in this course. This assignment is designed to challenge the students to recognize important details about surface construction. Its‘ level of difficulty is moderate for a first assignment in non-prismatic CAD geometry. The student must become familiar with concepts of both solid, surface, and wire frame models, and the differences between them. Additionally the student must master the concepts of wire frame modeling such as curve or 3-D sketch creation, and intersection of 2-D orthogonal sketches into a 3-D spatial curve.

Computer Aided Engineering: An Undergraduate Course in Computer Aided Design and Analysis for Mechanical Engineering Technology Southern Polytechnic State University
159
Figure 1: The glass box principle applied in reverse to show the intersection of two sketches on mutually orthogonal planes
intersecting to form a three dimensional spatial curve.
In the problem above the student becomes familiar with the CAD software‘s tools such as splines and spline controls, surface lofts and sweeps, and tangency and curvature controls. The result is a finished solid model of the helicopter body of Figure 2.
Figure 2: Three dimensional CAD geometry resulting from many 3-D spatial curves.
The student is required to complete all geometries, which may begin as wire or surface entity models, as solid models. The importance of this is that surface and wire frames do not possess the CAD data such as mass or material properties necessary to perform stress and flow simulations.

Kenton Fleming
160
SURFACE ANALYSIS AND CONTINUITY
Surface analysis is crucial to any non-prismatic geometry design. A single complex model consists of many simple surfaces trimmed and joined together. How these surfaces come together is the subject of a thing called continuity. Surfaces with ―bad‖ continuity end up looking like quilts.
Figure 3: Canopies of models showing 1st order and 2nd order (tangent) continuity between canopy surface halves,
respectively.
Figure 4: Zebra stripes used for surface continuity analysis.
Like many surface models, half of the helicopter body is created, and then mirrored about the symmetry plane. Hence, surfaces meet at this plane. Figure 3a shows what happens if the canopy surface does not meet at the symmetry plane perpendicularly to it. For the purposes of this paper this type of connection is referred to as 1st order continuous, i.e. the surfaces meet, but not tangent to each other. In the design of windshields for aircraft or automobiles, this serves as a good illustration of a design issue. Discontinuities like this can create undesirable reflections or glare, or even aero effects. CAD software possessing robust surfacing tools will always provide a way to avoid this. Figure 3b shows a more desirable design where the surfaces meet tangent to each other as the halves come to the mirroring plane at a 90 degree angle. This kind of connection between the two surfaces is called 2nd order continuity, or tangent continuity. Indeed, this particular example has
b. a.
a. b.

Computer Aided Engineering: An Undergraduate Course in Computer Aided Design and Analysis for Mechanical Engineering Technology Southern Polytechnic State University
161
an even more stringent continuity type. In this case, where the surfaces meet they also possess the same radius of curvature, both in magnitude and direction. This ―curvature continuous‖ geometry is said to be 3rd order continuous. CAD software such as SolidWorks, Autodesk, or Pro-Engineer possess handy tools to control surface continuity. However, specialized surface software and add-ins often possess the most powerful tools. Also found in good surface modeling software are the tools to analyze a surface for continuity. Figure 4 shows reflection lines or ―zebra stripes‖ as it is referred to in SolidWorks. These ―stripes‖ meet at the joining lines of mating surfaces to indicate the order of continuity. If they meet at the seam, but don‘t join each other, as shown in Figure 4a, this indicates 1st order continuity only, i.e. the surfaces are not tangent. However if they meet and join each other, they indicate 2nd or 3rd order continuity. The difference between these is indicated by a sharp ―kink‖ in the zebra stripe for tangent continuity. In Figure 4b there is smooth continuation of the zebra stripe as it crosses the surface seam. This indicates 3rd order, or curvature, continuity. A good way to think of reflection lines or ―zebra stripes‖ is to imagine how a pin stripe suit might look in a mirror with a crack. If the mirror changes angle across the crack, the striped image will be ―broken‖. Creating surfaces models with good continuity is a significant challenge to the CAE student. However it is a skill of significant importance to the design industry. In this course, the student is behooved to master these skills and tools.
RACE CAR PROBLEM, GEOMETRY AND FLOW SIMULATION
The author has discovered that engineering students like race cars. Therefore the next problem involves a race car model. In this assignment geometry is created and flow is computed over the geometry. The student is given a choice of a few popular models and then assigned the task of ―reverse engineering‖ the shape. As with the heli body, the student must create a detailed CAD surface model of the car. Figure 5 shows such a model of the ever popular Porsche 917 car of the late 60‘s to early 70‘s era. This problem is very challenging to the student because it is highly non-prismatic and requires surface continuities of the 2nd and 3rd order. Hence the student must utilize the surface analysis tools previously discussed. This problem is graded on continuity and geometric correctness to the actual model.
Figure 5: Surface model of a race car body

Kenton Fleming
162
Figure 5 is of a surface model. As mentioned earlier, the surface model is of no use for simulation. It is useful for manufacturing, however, and the model may be used to generate CNC tool path coding. Before flow simulations can begin, the surface model must be made into a solid model. The final problem is to compute the air flow over this geometry. Students are given a lecture on the theory behind computational fluid dynamic (CFD) solvers so they will be cognizant of the potential pitfalls when specifying input and interpreting output. A brief discussion of the Navier Stokes equations and finite discretization is given. Initial and boundary conditions, and geometry meshing are also discussed. The purpose of these lectures is to prevent the student from ―misusing‖ the software, and trusting erroneous results. The student is then given their first CFD assignment to compute and present velocity and pressure over the spatial domain of the car. Figure 6 shows the results of the assignment. Note the simplified geometry, i.e. no cuts for head lights, windshield, etc. as with the surface model in Figure 5. Figure 7 shows the pressure distribution over the car surface. Presented here are velocity vectors and pressure contours at the symmetry plane. In this case the model is of a 9 inch long scale model car. The flow input is air at 50 fps in the positive x direction, where the car is facing in the negative x. Therefore not much pressure variation is created in the flow. The computational domain does not include a moving road surface. The actual physical scenario would be the model car in a wind tunnel.
Figure 6: Flow field around race car showing velocity vectors and pressure contours at symmetry plane.

Computer Aided Engineering: An Undergraduate Course in Computer Aided Design and Analysis for Mechanical Engineering Technology Southern Polytechnic State University
163
Figure 7: Surface pressure contours.
This problem is presented to the student as a first assignment in CFD. It is designed to introduce the basics of CFD input and meshing. Further assignments are given which present greater detail and difficulty in both geometry and physics. For the car assignment this would mean things such as a moving road surface, automatic mesh refinement, or increased flow. Internal flow, supersonic flow, and internal/external flows are also considered. Also assignments for benchmarking, i.e. solving problems of known solution are proposed.
SUMMARY
An introductory course in Computer Aided Engineering was presented. In this course the student performed advanced geometry modeling and computational flow simulations. The students learned to solve real problems encountered in industry. As a result the student acquired a rare yet sought after skill. Students have shown a high level of interest in this course, and it continues to grow.
REFERENCES
Forth coming
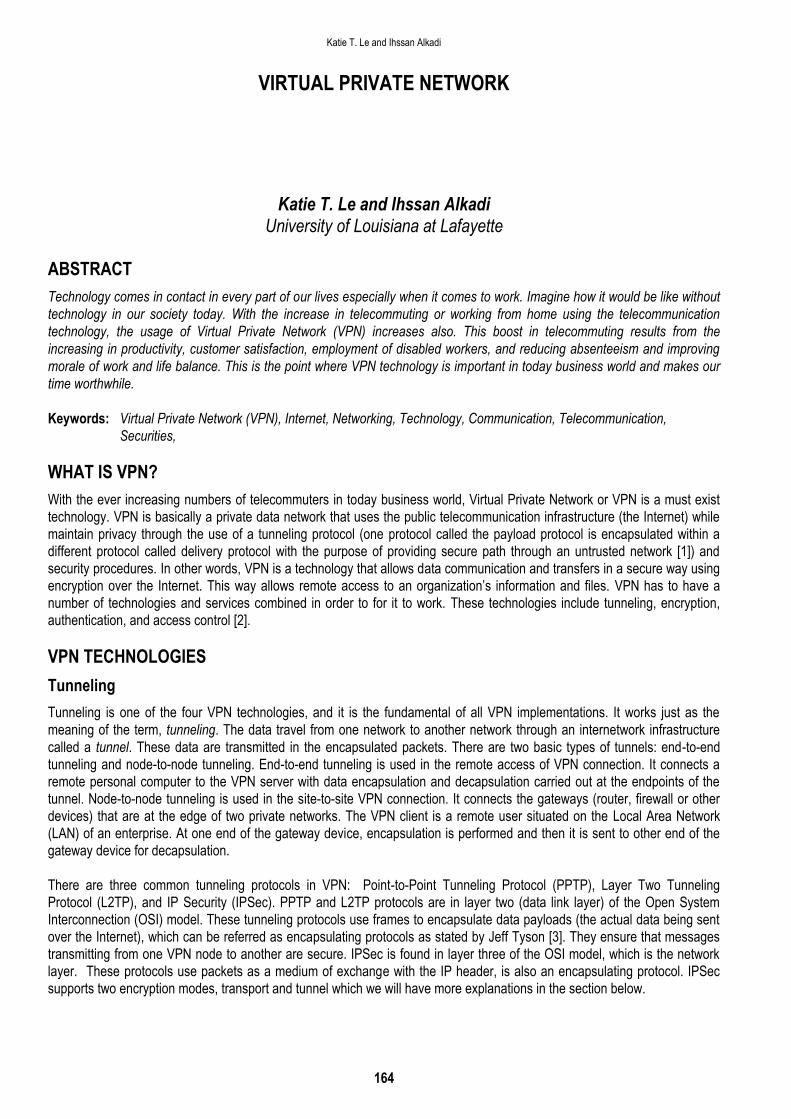
Katie T. Le and Ihssan Alkadi
164
VIRTUAL PRIVATE NETWORK
Katie T. Le and Ihssan Alkadi University of Louisiana at Lafayette
ABSTRACT
Technology comes in contact in every part of our lives especially when it comes to work. Imagine how it would be like without
technology in our society today. With the increase in telecommuting or working from home using the telecommunication
technology, the usage of Virtual Private Network (VPN) increases also. This boost in telecommuting results from the
increasing in productivity, customer satisfaction, employment of disabled workers, and reducing absenteeism and improving
morale of work and life balance. This is the point where VPN technology is important in today business world and makes our
time worthwhile.
Keywords: Virtual Private Network (VPN), Internet, Networking, Technology, Communication, Telecommunication,
Securities,
WHAT IS VPN?
With the ever increasing numbers of telecommuters in today business world, Virtual Private Network or VPN is a must exist technology. VPN is basically a private data network that uses the public telecommunication infrastructure (the Internet) while maintain privacy through the use of a tunneling protocol (one protocol called the payload protocol is encapsulated within a different protocol called delivery protocol with the purpose of providing secure path through an untrusted network [1]) and security procedures. In other words, VPN is a technology that allows data communication and transfers in a secure way using encryption over the Internet. This way allows remote access to an organization‘s information and files. VPN has to have a number of technologies and services combined in order to for it to work. These technologies include tunneling, encryption, authentication, and access control [2].
VPN TECHNOLOGIES
Tunneling
Tunneling is one of the four VPN technologies, and it is the fundamental of all VPN implementations. It works just as the meaning of the term, tunneling. The data travel from one network to another network through an internetwork infrastructure called a tunnel. These data are transmitted in the encapsulated packets. There are two basic types of tunnels: end-to-end tunneling and node-to-node tunneling. End-to-end tunneling is used in the remote access of VPN connection. It connects a remote personal computer to the VPN server with data encapsulation and decapsulation carried out at the endpoints of the tunnel. Node-to-node tunneling is used in the site-to-site VPN connection. It connects the gateways (router, firewall or other devices) that are at the edge of two private networks. The VPN client is a remote user situated on the Local Area Network (LAN) of an enterprise. At one end of the gateway device, encapsulation is performed and then it is sent to other end of the gateway device for decapsulation. There are three common tunneling protocols in VPN: Point-to-Point Tunneling Protocol (PPTP), Layer Two Tunneling Protocol (L2TP), and IP Security (IPSec). PPTP and L2TP protocols are in layer two (data link layer) of the Open System Interconnection (OSI) model. These tunneling protocols use frames to encapsulate data payloads (the actual data being sent over the Internet), which can be referred as encapsulating protocols as stated by Jeff Tyson [3]. They ensure that messages transmitting from one VPN node to another are secure. IPSec is found in layer three of the OSI model, which is the network layer. These protocols use packets as a medium of exchange with the IP header, is also an encapsulating protocol. IPSec supports two encryption modes, transport and tunnel which we will have more explanations in the section below.

Virtual Private Network
165
Figure 1: Tunneling Demonstration (Image Courtesy of How Stuff Works)
Encryption
Encryption is a process of taking the entire data of one computer and sending to another and encoding it into a form that only the other computer will be able to decode it. There are two types of encryption: symmetric-key encryption and public-key encryption. Symmetric encryption uses private key only. One needs to know which computer s/he is going to send to in order to install the secret key or code that is using to encrypt a pack of information before it is being sent over to another computer over the network. To decode the key, the secret code must know by both parties. While public-key encryption uses both private and public key or code. The private key is known to one computer, and public key is given by that one‘s computer to any other computers that wants to communicate safely with it. To decode the key, the ―receiver‖ computer must use the public key provided by the ―sender‖ computer, and its own private key.
Authentication
The word authentication means involving the confirming the identity of a person, the origins of an artifact, or assuring that a computer program is a trusted one [4]. That means one party has to verify another's identity. For example, logging into a computer required the username and password to identify the user. If the username and password is identified in the system, access will be permitted. According to Burtecin ―Turk‖ Sapta, RADIUS (Remote Authentication Dial in User Server) is commonly used and supported by most remote-access equipment vendors including VPN today [5]. RADIUS allows managers to simplify administration of user authentication by maintaining a centralized database of access rights.
Access Control
Access control tailors the access rights granted to different directory users, and provides a means of specifying required credentials or bind attributes. Also access control comprises authentication, authorization, and accounting. According to an online source [6], access control restricts access based on something other than the identity of the user.
VPN APPLICATIONS
Remote-access VPN is also known as the virtual private dial-up network (VPDN) according to Jeff Tyson [3]. Remote-access VPN offers encrypted network connections between a company‘s private network and remote users through a third-party service provider. Site-to-site VPN offers encrypted tunnel between various networks such as Local Area Network (LAN) to LAN through a public network, the Internet. Under site-to-site VPN, there are two types: Intranet-based and Extranet-based [3]. Intranet-based is when firms want to connect one or more remote locations (usually organization‘s members and employees) to a single private network; whereas, extranet-based is when firms connect from different locations (authorized outsiders such as partners, suppliers, and customers) to a network that allows all to work in a shared environment (See Figure 2 below).

Katie T. Le and Ihssan Alkadi
166
Figure 2: Image Courtesy of Cisco Systems, Inc.
VPN SECURITIES
Encryption
Encryption is one of the methods to securely send data through Internet. As mentioned above, encryption is the process of taking the entire data one computer is sending to another and encoding it into a form that only the other computer will be able to decode it. There are two types of encryption: symmetric-key encryption and public-key encryption. Symmetric encryption uses private key only. One needs to know which computer s/he is going to send to in order to install the secret key or code that is using to encrypt a pack of information before it is being sent over to another computer over the network. To decode the key, the secret code must know by both parties. While public-key encryption uses both private and public key or code. The private key is known to one computer, and public key is given by that one‘s computer to any other computers that wants to communicate safely with it. To decode the key, the ―receiver‖ computer must use the public key provided by the ―sender‖ computer, and its own private key.
Firewall
Firewall is another easy way to increase the security of a network is to open only the ports that are actually required by the devices being used. The more ports that are open to be used, the more risk the user must accept [7]. The firewall works as blocking all inbound and all port open outbound to protect a network from outsides while allowing the user open access to outside sites. According to Jeff Tyson[3], Cisco 1700 routers can be upgraded to include firewall capabilities by running appropriate Cisco IOS (Internetwork Operating System) on them.
Authentication, Authorization, Accounting (AAA) Server
AAA Server is used to secure access in a remote-access VPN environment. When a request is established from some dial-up client, it is proxied to the AAA server. The AAA server then checks to see who is trying to connect and authorizes with known names to prevent unauthorized access (Authentication), then it decides what will be allowed to be done (Authorization), and finally it monitors to see what one is actually doing (Accounting). In the process, Authentication must be occurred before Authorization.
Internet Protocol Security (IPsec)
IPsec provides enhanced security features with better encryption algorithms and more comprehensive authentication in the Internet protocol (IP) networks in the network layer of the OSI (Open Systems Interconnection) model. IPsec has two encryption modes, tunnel and transport. While transport only encrypts the payload, tunnel encrypts the header and the payload of each packet. According to the Wikipedia [8], IPsec implementation is a mandatory part in the IPv6. Furthermore, IPsec can provide one with data privacy, data integrity, authenticity, and anti-relay protection for network traffic. It can be end-

Virtual Private Network
167
to-end security from client-to-server, server-to-server, or client-to-client using IPsec transport mode. A picture would explain better (See Figure 3 below).
Figure 3: A remote-access VPN utilizing IPSec (Image Courtesy Cisco Systems, Inc.)
VPN SET UP
Basic VPN Setup in Windows XP
1. Go to Start My Network Places Open Network Connection.
2. Double-click on New Connection Wizard.
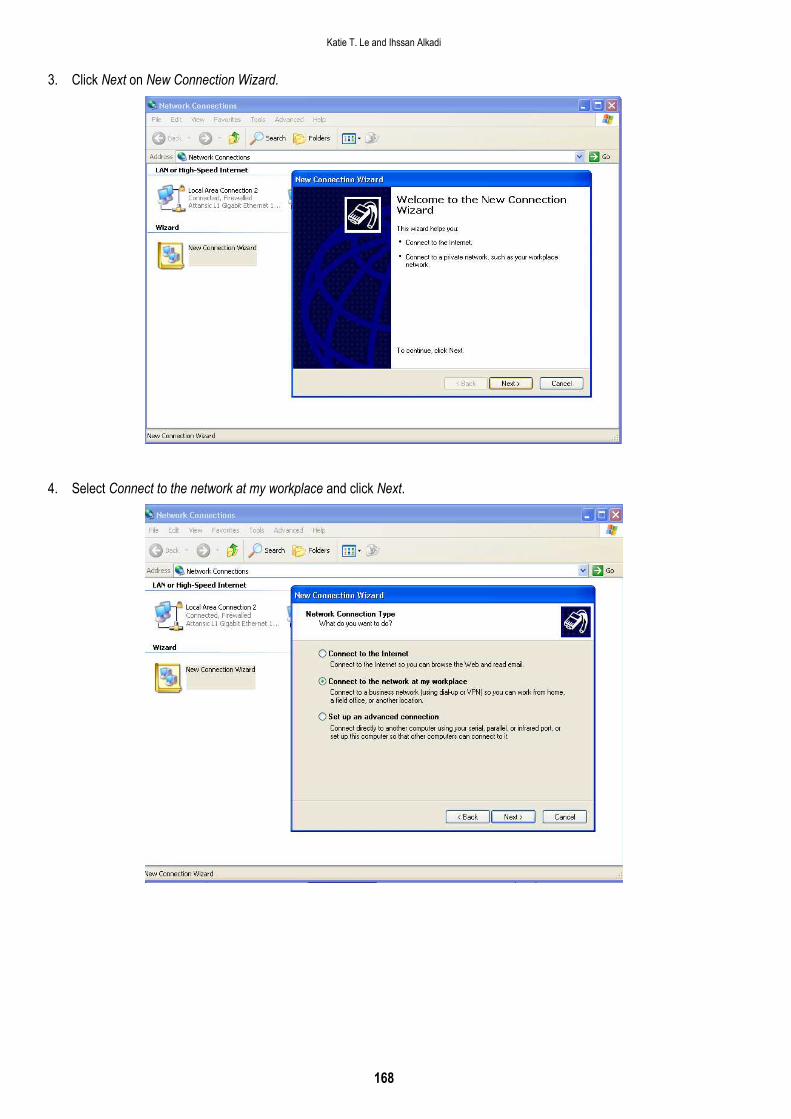
Katie T. Le and Ihssan Alkadi
168
3. Click Next on New Connection Wizard.
4. Select Connect to the network at my workplace and click Next.

Virtual Private Network
169
5. Select Virtual Private Network connection and click Next.
6. Enter the Company Name and click Next.

Katie T. Le and Ihssan Alkadi
170
7. Enter the Host name or IP address and click Next.
8. Check if you want to add a shortcut to the desktop and click Next to finish.
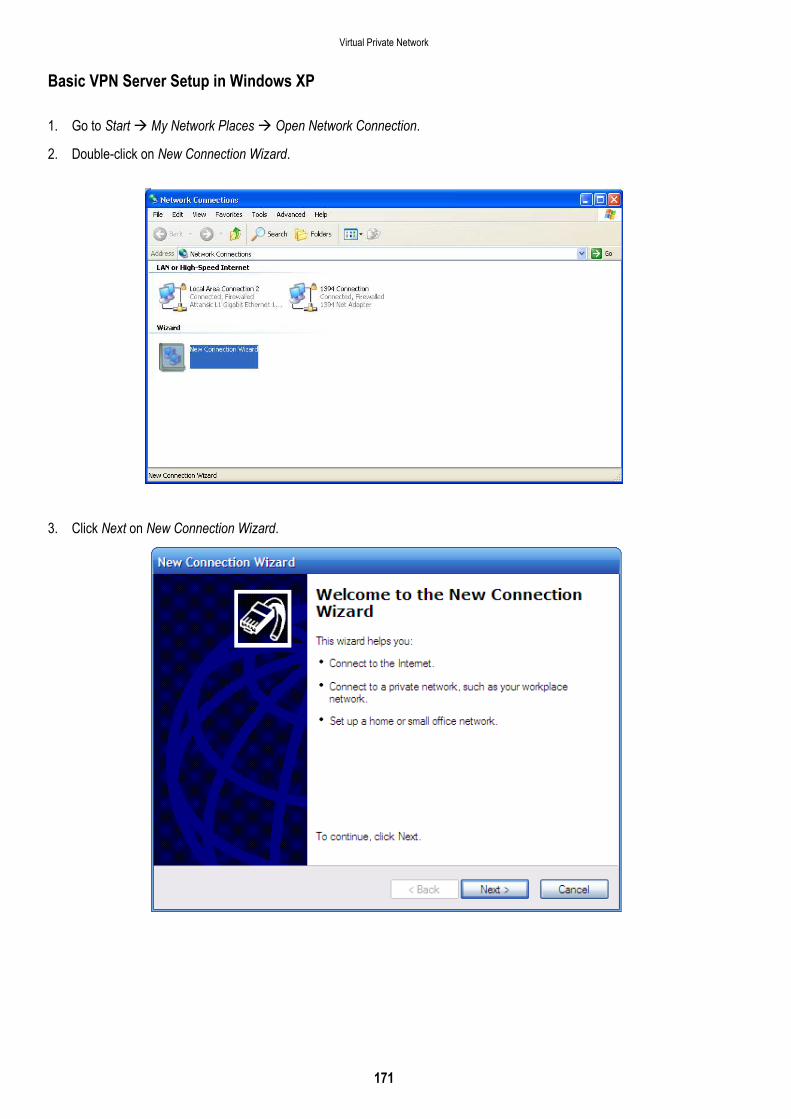
Virtual Private Network
171
Basic VPN Server Setup in Windows XP
1. Go to Start My Network Places Open Network Connection.
2. Double-click on New Connection Wizard.
3. Click Next on New Connection Wizard.

Katie T. Le and Ihssan Alkadi
172
4. Select Set up advanced connection and click Next.
5. Select Accept incoming connections and click Next.

Virtual Private Network
173
6. At the Devices for Incoming Connections window, skip it and just click on the Next button.
7. Select Allow Virtual Private Connections and click Next.
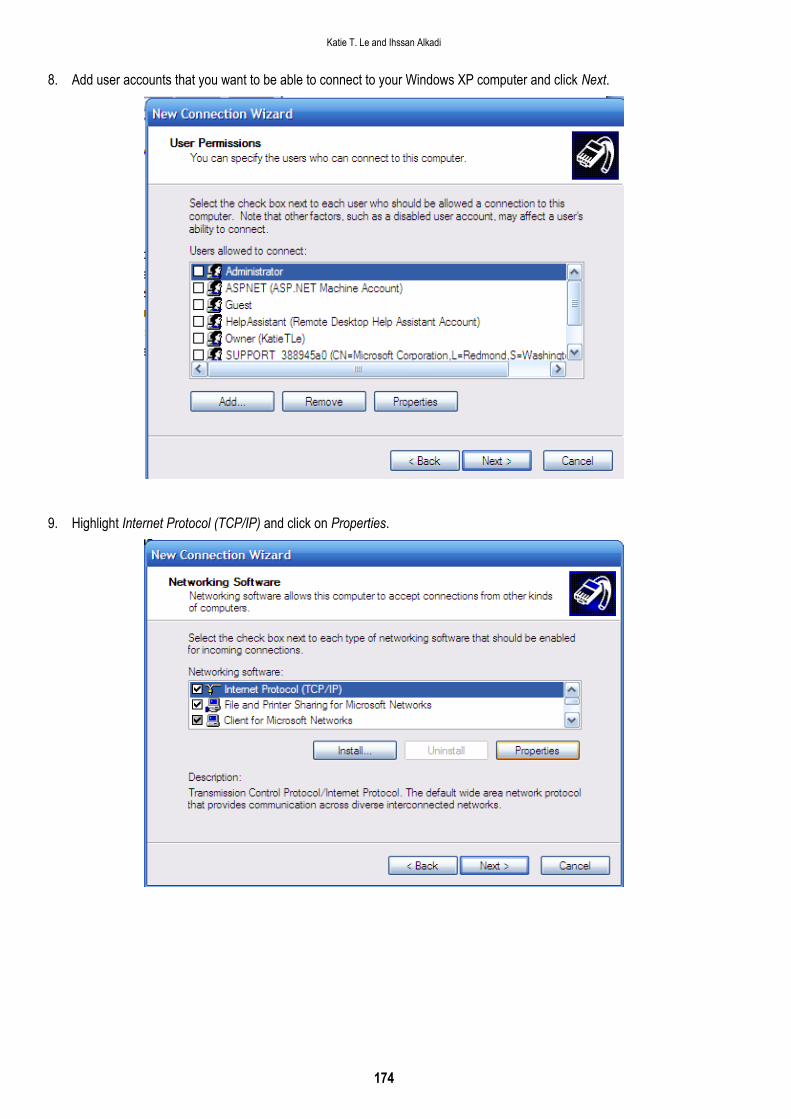
Katie T. Le and Ihssan Alkadi
174
8. Add user accounts that you want to be able to connect to your Windows XP computer and click Next.
9. Highlight Internet Protocol (TCP/IP) and click on Properties.

Virtual Private Network
175
10. Determine how you want the remote computers to get their IP address and click OK.
11. Click Next.
12. Click Finish.
13. The above example will assign IP addresses to each client. Make sure the IP scheme is the same as your server.
14. If the VPN server is behind a router, Port Mapping will need to be done on the router. Standard port usage is 1723 for PPTP. You might also need to configure your router for PPTP Pass-through. Port usage for IPSec is 500, 50-51. These ports will have to be forwarded to the VPN server‘s IP.

Katie T. Le and Ihssan Alkadi
176
COSTS AND BENEFITS OF VPN
A well-designed VPN can be advantageous for both firms and their clients. For example firms can extend geographic connectivity, improve security, reduce operational costs against the traditional expensive long-distance leased lines, and provide broadband networking compatibility [3]. Furthermore, users or clients may benefit from reducing transit time and transportation costs, and getting global networking opportunities. One can access to the server or to one‘s office or home computer at any places if the availability of Internet is there. The only major cost that faces a company is the startup costs since the firm has to buy proper equipment and train new staff to maintain the process. According to Gartner, IP-based VPN‘s and firewall equipment spending on this newer technology will reach $6.1 billion in 2009 [9]. Also, detailed understanding of network security issues and careful installation and configuration is required to ensure sufficient protection on a public network like the Internet. On the contrary, the company has all the benefits once the beginning stage is done. According to Monte Enbysk, the number of telecommuters has reached 23 million, and it continues to grow [10]. Many factors have lead to increase in telecommuting or working from home using the telecommunication technology such as VPN to work remotely. For example, the individuals benefit from the reducing of transit time and transportation costs, increasing productivity due to fewer interruptions and distractions, increasing job satisfaction and personal expense such as clothing, grooming, and food costs [11].
WHY USE VPN
There are many reasons for companies to use VPN, but the two main reasons to use VPN are security and cost. One of the causes to use VPN is that it allows one to connect to one‘s office computer using remote desktop securely. There are a number of types of network access that allow data sent between one computer and the other computer as mentioned above such as encryption, authentication, firewall, internet protocol security and so on. Using VPN can replace the traditional, high cost technology leased lines because of distance and price, such as frame relay and wide area network. The current forms of VPN networks are faster, more reliable, and more affordable than the older technologies as it progresses increasing availability and bandwidth and reducing cost [12]. These costs include telecommunications costs – costs that replace those long distance phone charges, and costs that minimize the number of lines accessing corporate site [13]. Instead of making long distance calls to their corporations, users now can place local calls to their Internet Service Providers (ISPs). According to Alliance Datacom [14], cost savings can range from 30% to 80% that depending on the type of leased line and its destination. The bigger the companies, the more costs they can save with the communication costs as they have offices all over the world. VPN also impact firms by increasing sales, speeding up product development, and strengthening strategic partnerships [14]. For instance, companies can outsource their products and strength relationships with partners through secure usage of VPN. When outsourcing, firms can save those operational costs since they do not have to use the equipments, devices, or technologies. According to an online source, there are more than eighty percent of companies are expected to adopt VPN‘s for at least some segments of their remote access users by 2003 [14]. SonicWALL study finds that 80% of small and medium size businesses (SMBs) are using some form of VPN connectivity to enable remote access as of October 12, 2008 [9]. Besides penetration trend will accelerate worldwide as the support of limited number of standards and rationalization of suppliers.
SURVEY
Questions
1. Do you use any kind of VPN (Virtual Private Network)?
a. Yes b. No
2. What types of VPN do you currently use?
a. Site-to-site VPN b. Remote-access VPN c. Both

Virtual Private Network
177
3. What types of VPN security do you currently use?
a. Encryption b. Firewalls c. Internet Protocol Security (IPSec) d. Authentication, Authorization, Accounting (AAA)
4. Do you have a data wireless network operating in your job?
a. Yes b. No
5. Do you use VPN to secure access through the data wireless network?
a. Yes b. No
6. What make and model of VPN do you use?
a. Cisco VPN 3000 Series Concentrator b. Cisco VPN 5000 Series c. Cisco VPN 7000 Series d. Others ____________________
7. What authentication protocols does your VPN support?
a. RADIUS (Remote Authentication Dial In User Service) b. TACACS+ (Terminal Access Controller Access-Control System Plus) c. Kerberos d. Other ________________________
8. Do remote users use your central VPN gateway to get to their departmental networks?
a. Yes b. No
9. How many individual users access your VPN at peak?
a. 0 – 50 users _____ Internal ______External b. 50 – 100 users _____ Internal ______External c. 100 – 200 users _____ Internal ______External d. 200 – 300 users _____ Internal ______External e. Over 300 users _____ Internal ______External
10. How many simultaneous sessions is your VPN handling at peak per day? What is your peak bandwidth?
a. Less 50 sessions; peak bandwidth ________ b. 50 – 100 sessions; peak bandwidth ________ c. 100 – 200 sessions; peak bandwidth ________ d. 200 – 300 sessions; peak bandwidth ________ e. Above 300 sessions; peak bandwidth ________
11. Do you have access criteria in place to limit access or timeout sessions?
a. 1 – 3 hour access limit b. 3 – 5 hour access limit c. 5 – 7 hour access limit d. More than 10 hours access limit e. Unlimited

Katie T. Le and Ihssan Alkadi
178
12. Do departments in your organization provide their own VPNs?
a. Yes b. No
13. So, do you allow them to tunnel through your wireless network? Using which protocols?
a. Yes __________________ b. No
14. Has your institution defined organization wide standards for departmental VPNs?
a. Yes b. No
15. If so, do you provide specialized VPN access to make it appear to remote users that they are accessing a standalone department VPN?
a. Yes b. No
16. Do you recommend using VPN‘s?
a. Yes b. No
Results of Survey
According to the survey the researcher ran, there are 65 percent using some kind of VPN, and only 4 percent does not recommend the usage of VPN. With this 65 percent using VPN, 21 percent using encryption as VPN security, 37 percent using firewall as VPN security, 11 percent using Internet Protocol security as VPN security, and 14 percent using Authentication, Authorization, and Accounting server as VPN security. There are about 44 percent have data wireless network operating in their job. Out of the sample of 81, 13 users utilize Cisco VPN 5000 Series, 4 apply Cisco VPN 3000 Series, 2 make use of Cisco VPN 7000 Series and 15 others are not sure or not recall the brand and model, and the rest did not answer. Furthermore, there are about 22 percent answers that less 50 simultaneous sessions VPN handling at peak per day, and about 7.5 percent answers that 50 – 100 simultaneous sessions VPN handling at peak per day. Currently, there are only 7 answers that they provide their own VPNs in their departments. Also, there are about 15 percent are using RADIUS (Remote Authentication Dial In User Service) as their authentication protocols, and the rest are using TACACS+ (Terminal Access Controller Access-Control System Plus), Kerberos, and other protocols
VPN: CONCLUSION AND OUTLOOK
With the current wave of Virtual Private Networks featured self-contains hardware solutions, it does not require an additional connection to a network; thus, it cuts down on the use of a file server and LAN, which makes everything run smoothly, and yet less cost. According to an online source, wireless VPNs may be developed in the future when technology will be developed that is reliable, convenient, and secure [14]. Yet, some VPN providers have experimented with running VPNs over cable television networks. It gives higher bandwidth and lows costs, but less security. A continuous gradual expansion in use of VPN technology expects to prolong in the coming years. Understanding the importance of VPN and how to manage it is the endeavor of this research.
REFERENCES
[1] ―Tunneling protocol.‖ Wikipedia, the Free Encyclopedia. 24 June 2008. [2] Soria Arthur L. (2000). Virtual Private Network. 21 May 2008 from the World Wide Web: [3] <http://faculty.ed.umuc.edu/~meinkej/inss690/soria/soria.htm>. [4] Tyson, Jeff. ―How Virtual Private Networks Work?‖ HowStuffWorks. 17 March 2008. [5] <http://computer.howstuffworks.com/vpn.htm>. [6] ―Authentication.‖ Wikipedia, the Free Encyclopedia. 11 October 2008. [7] Sapta, Burtecin ―Turk‖. ―The Concept and the Effects of Virtual Private Network on Our Nation and World Wide.‖ May 21
2008: 1-10.

Virtual Private Network
179
[8] ―Authentication, Authorization, and Access Control.‖ Apache HTTP Server Version 1.3. [9] <http://httpd.apache.org/docs/1.3/howto/auth.html>. [10] Moss, John. ―How Secure are Internet Connections? Security April 2005: 20-21. [11] ―IPsec.‖ Wikipedia, the Free Encyclopedia. 8 Oct. 2008. [12] ―IT Facts‖ 3 Dec. 2008 <http://www.itfacts.biz/> [13] Enbysk, Monte. ―Make Telecommuting Work for Your Business.‖ Microsoft Small Business [14] Center Home. 22 May 2008. [15] ―Why Telecommuting Working‖ [16] <http://www.italladdsup.gov/newsletter/winter06/why_telecommuting_works.pdf>. [17] Schoonover, Eric. ―Wholesale Bandwidth: The Price is Still Right.‖ Communications Review. Hinsdale: July 2007. Vol. 37,
Issue 7: Pg 32 [18] ―VPN FAQ.‖ Broadband Reports. 4 Dec. 2008. [19] <http://www.broadbandreports.com/faq/vpn>. [20] ―Why Do Companies Use VPN?‖ Alliance Datacom. 2 Dec. 2008. [21] < http://www.alliancedatacom.com/why-use-vpn.asp>. [22] ―Virtual Private Network.‖ Answers. 21 May 2008. <http://www.answers.com>.
ABOUT THE AUTHORS
Ihssan Alkadi is on the faculty at University of Louisiana at Lafayette (UL Lafayette). He works in the Business, Systems, Analysis, and Technology (BSAT) Department. He received his BS Degree in Computer Science at SLU, May 1985. In May 1992 he earned his MS. In Systems Science from Louisiana State University (LSU). He earned his Doctoral degree in Computer Science at LSU May 1999. His areas of expertise include software engineering in general, testing in particular, Internet, HTML, and operating systems. His research interests include testing in object oriented systems, systems validation, and system verification. *Corresponding author. Tel.: +1 337 482 5378
Katie T. Le is a graduate student at the University of Louisiana at Lafayette. She received her Bachelor‘s in Finance and Management Information Systems from University of Louisiana at Lafayette in May 2007. She is currently enrolled in the MBA Program and pursuing her MBA in Fall 2008.

180
SECTION 3
EDUCATION & SOCIAL SCIENCES
The Academic Performance of College Students in Higher Education
181
THE ACADEMIC PERFORMANCE OF COLLEGE STUDENTS IN HIGHER EDUCATION
Michael M. Campbell Florida A&M University
ABSTRACT
This study investigated the relationships between motivational strategies, self-regulated learning strategies, and academic
performance of College students pursuing higher education degrees. The unit of analysis used in this study is college
students pursuing degrees in institutions of higher learning in the Southeast Region of the United States. The study utilized
the Motivated Strategies for Learning Questionnaire (MSLQ) to obtain students responses to 81 questions pertaining to their
college experience as relates to motivation and learning strategies, and ultimately their performance. The survey was
administered to students enrolled during the Spring and Summer semesters 2006-07. Two hundred and fifty-nine students
completely filled out the surveys. Their responses and performance were tabulated and formed the basis for the study. The
research revealed that motivation and learning strategies were related to the academic performance of College students. The
female students‘ levels of academic performance were higher than their male counterparts irrespective of race. Test anxiety, impacted Caucasian females more than the other gender or race groups. ANOVA confirmed that statistically significant
relationships existed between academic performance and demographic variables gender and race. MANOVA confirmed that
the differences in performance levels across gender and race lines were statistically significant. The results strongly
supported the premise that the levels of academic performance are impacted significantly across gender and race lines for
college students pursuing degrees in higher education programs. Further analysis revealed that independent variables, self-
efficacy and task value, were the variables that best model the dependent variable, academic performance for the sample.
The results provide evidence for the importance of considering both motivational and self-regulated learning components in
the classroom in an effort to enhance the academic performance of College students, who need both the will (motivation
beliefs) and the skill (learning strategies) to be successful in their college academic careers. The results also indicated that
gender and race play a significant role in the levels of academic performance of college students. As a result, institutions of
higher learning, at all levels of the educational process, need to integrate these components into their models for continued
classroom success among college students.
Keywords: Higher Education Learning; Student Performance
REVIEW OF THE LITERATURE
There are numerous studies that are available to support the correlation between motivational constructs and learning strategies and academic performance. Elaine Elliott teamed with Carol Dweck (1988) to publish the findings of research that she had conducted for her doctoral degree. The study, which utilized 101 students, experimentally tested a framework in which goals are proposed to be central determinants of achievement patterns. Learning goals, in which individuals seek to increase their competence, were predicted to promote challenge-seeking and a mastery-oriented response to failure regardless of perceived ability. Performance goals, in which subjects seek to gain favorable judgments of their competence or avoid negative judgments, were predicted to produce challenge-avoidance and learned helplessness when perceived ability was low, and to promote certain forms of risk-avoidance even when perceived ability was high. The study addressed the question of students‘ behavioral, cognitive, and affective patterns in achievement situations. The results of Elliott and Dweck (1988) study suggest that, for students, achievement goals are critical determinants of their behavioral patterns. When the students‘ achievement goals were fostered experimentally, a combination of mastery-oriented and helpless achievement responses was created. When the value of a performance goal was highlighted and the subjects believed that their current skills were high, they responded in a mastery-oriented manner in the face of obstacles. These subjects persisted in attempts to find solutions and did not make attributions for failure or express negative effects. During the 1990‘s a plethora of studies were carried out that relate to motivation and performance in the college environment. Paul Pintrich, another top researcher in the area of motivation, teamed with Elisabeth De Groot (1990) to examine the
Michael M. Campbell
182
relationship between motivational orientation, self-regulated learning, and classroom academic performance for 173 students from eight science and seven English classes of a predominantly Caucasian institution. The students responded to a self-report questionnaire (the Motivated Strategies for Learning Questionnaire or MSLQ developed and tested by a team of researchers led by Paul Pintrich), that included 56 items on student motivation, cognitive strategy use, metacognitive strategy use, and management of effort (Pintrich et al, 1993a). The students were asked to respond to the items using a seven-point Likert scale in terms of their behavior in the specific science or English class. Data on the student‘s performance were obtained from work on classroom assignments. Self-efficacy and intrinsic value were positively related to cognitive engagement and performance. Regression analysis revealed that, depending on the outcome measure, self-regulation, self-efficacy, and test anxiety emerged as the variables that had the highest correlations with students‘ performance. Catherine Wambach (1993) used attribution motivation theory to analyze interviews with 19 ―at-risk‖ freshmen students who had made the Dean‘s list during their first semester in college although they had not performed at high levels during their h igh school tenure. The attributes used to explain success or failure at a task in this study were ability, effort, task difficulty, and luck. A structured interview format, of ten questions, was used in which the subjects were asked to respond to all ten basic questions. The students‘ were also invited to make any additional responses or comments they felt were relevant to understanding their college experience. Wambach found that the students‘ previous academic difficulties were attributed to lack of effort rather than lack of ability or skills. A number of events occurred before entering college that influenced these students to change their attitudes towards academic achievement. For some of the participants, having to find a job and go to work provided experiences that motivated them to choose school. Supportive friends, spouses and family members were instrumental in encouraging some of the participants to choose college. Michael Paulsen and James Gentry (1995) presented the results of a study of the relationship among students aptitude, motivational beliefs, use of learning strategies, and academic performance, measured as student semester grades, in a large introductory financial management class. The sample of 535 students was drawn from a population of students enrolled in an introductory Financial Management course. The students responded to the MSLQ, which included 56 items on student motivation. The motivational variables used by Paulsen and Gentry (1995) were intrinsic goal orientation, extrinsic goal orientation, task value, control of learning, self-efficacy, and test anxiety. The cognitive learning variables utilized were the rehearsal strategy, and elaboration-organization strategy. The self-regulation learning variables were metacognition strategy, time, study and effort regulation strategy, and peer learning and help-seeking strategy. The researchers found that academic performance was significantly related to student aptitude and to several motivational variables. Students‘ grades were also related to learning strategy variables. The motivational variables correlated with the learning strategy variables, and in combination explained almost 60 percent of the variation in the students‘ academic performance.
METHODOLOGY
Unit of Analysis
The subjects in this study consisted of 259 students attending a university in the southeast region of the United States. The sample consisted of 161 African-American students and 98 Caucasians. The African-American group consisted of 98 females and 63 males. These respondents included 23 freshmen, 26 sophomores, 36 juniors, 70 seniors, and 6 graduate students, while the Caucasians consisted of 52 females and 46 males with 14 freshmen, 16 sophomores, 18 juniors, 39 seniors and 11 graduate students.
The Survey Instrument
The Motivated Strategies for Learning Questionnaire (MLSQ) developed for the National Center for Research to Improve Post-secondary Teaching and Learning was utilized in this study (Pintrich et al, 1993b). The instrument was specifically designed to access motivation and the use of learning strategies by college students. The motivational strategies pertain to three areas; (1) value: intrinsic and extrinsic goal orientation and task value; (2) expectancy: control beliefs about learning and self-efficacy; and (3) affect: test anxiety. The learning strategies component of the instrument consists of three scales, namely, cognitive, meta-cognitive, and resource management strategies, containing nine subscales or components. The cognitive strategy components are: (1) rehearsal, (2) elaboration, (3) organization, and (4) critical thinking. The meta-cognitive strategy component is self-regulation. Resource management strategies are: (1) time management and study environment, (2) effort management, (3) peer learning, and (4) help seeking. The reliability and predictive validity of the instrument will be presented. The instrument‘s internal consistency, reliability and validity, more so, its ability to measure the traits they were designed to measure but in college business courses will be examined by the use of a control group. Regression analysis was

The Academic Performance of College Students in Higher Education
183
introduced to the dependent and independent variables to determine the descriptive statistics and correlation levels such as; the means (M), standard deviations (SD), internal reliability coefficients (), and correlations (r) of each variable.
Data Collection
The data required for this project was collected using the MLSQ. The participating subjects were instructed to tabulate their responses to the items based on a seven-point Likert-scale (from 1 = not at all true of me to 7 = very true of me) in terms of their behavior in the specific college level business course. Subjects final course grades were obtained from the instructors‘ grade reports. The data was tabulated in terms of gender, classification (freshman, sophomore, junior, senior), course title, reason for taking course (requirement, elective, or interest) and the measurement scales for each variable.
Measurement of Variables
The Motivation Strategies for Learning Questionnaire has 31 items designed to measure motivational beliefs, and 50 items designed to measure self-regulation learning strategies. The subjects reported their attitudes and behaviors about their specific course work. The software used to analyze the data was the Statistical Package for Social Sciences (SPSS) package. The responses to the questions were grouped according to the variable/scale to which they apply. Exploratory factor analysis was used to develop scales that measure the underlying motivation and self-regulation learning strategy constructs. Internal reliability coefficients (Cronbach Alphas) were computed for each scale in order to measure and report their reliability. The Descriptive Statistics (Mean and Standard Deviation) of each scale were calculated. The content validity of the instrument, that is, the extent to which the scales and sub-scales actually measure the traits that they were developed to measure, had already been validated through research (Pintrich et al., 1993b) and the control group used with this study. This process is in keeping with prior research performed by Paul Pintrich and Elizabeth DeGroot (1990), and Michael Paulsen and James Gentry (1995). Regression analysis was introduced to the variables (both dependent and independent) to determine whether correlations existed, between the variables, and if it did exist, to measure the size and direction of the correlation. The direction and size of the correlation with each scale and performance were tabulated. The measure of academic performance, the dependant variable, was the Final Course Grade (FCG) of the students in the specific course over the duration of a semester. This decision to utilize the final grade as the measure of performance was in keeping with prior research in this area (Paul Pintrich and Elizabeth DeGroot, 1990, Paul Pintrich et. al., 1993b, and Michael Paulsen and James Gentry, 1995). The grading system in effect at all institutions assigned points (on a 100-point scale) or grades on the traditional letter scale (A, B, C, D, or F). The distribution of grades allowed all students the possibility of receiving an A or 100 points for each course.
The Hypotheses
H1. It is hypothesized that the academic performance/achievement of college students is positively and directly related to motivational strategies.
N1. It is hypothesized that academic performance of college students is negatively or not related to motivation strategies. H2. It is hypothesized that learning strategies of college students are positively related to their academic performance in a
college environment. N2. It is hypothesized that and learning strategies of college students are negatively or not related to academic performance. H3. It is hypothesized that multi-correlations exists between motivational strategies and self-regulated learning strategies. N3. It is hypothesized that no correlation exists among motivational strategies and self-regulated learning strategies. H4. It is hypothesized that the performance of college students vary across gender and race lines. N4. It is hypothesized that there no variance of college students performance across gender and race lines.
ANALYSIS AND RESULTS
Regression analysis was introduced to the variables (both dependent and independent) to determine whether correlations existed, between the variables, and if it did exist, to measure the size and direction of the correlation. The direction and size of the correlation with each scale and performance were tabulated. The first purpose of this project (pertained to hypothesis 1 and 2) was to measure and record the correlation between motivation and learning strategies constructs and the academic performance of the college students. The scales utilized to measure this component were individually correlated with the students final grade. To accomplish this investigation, the data for the variables were grouped in their respective scales, then subjected to mean level analysis. Descriptive statistics were calculated, tabulated and compared. Data was then subjected to

Michael M. Campbell
184
univariate Scheffe confidence intervals. To avoid interaction among scales, due to the possible presence of multi-correlations, these post hoc tests were conducted separately. The overall mean scores for each scale (M), standard deviations (SD) and correlation coefficient (A) with students‘ classroom performance for the sample of college students, are presented in Table 1.
Table 1: Descriptive Statistics
Sample Population Race Gender
AA CA Male Female
N=259 N=161 N=98 N=109 N=150
M SD A M SD A M SD A M SD A M SD A
Motivational Scales
IGO 4.86 1.40 .73 4.77 1.36 .77 5.01 1.47 .67 5.07 1.35 .55 4.71 1.43 .80
EGO 5.48 1.36 .69 5.51 1.33 .70 5.44 1.43 .66 5.53 1.37 .67 5.45 1.36 .70
TV 5.41 1.29 .89 5.41 1.22 .91 5.41 1.40 .86 5.43 1.22 .86 5.39 1.34 .91
CLB 5.42 1.26 .71 5.33 1.27 .69 5.54 1.23 .73 5.52 1.21 .59 5.36 1.29 .77
SEP 5.67 1.10 .90 5.62 1.08 .93 5.65 1.13 .89 5.69 1.03 .88 5.59 1.16 .92
TA 3.84 1.21 .74 3.99 1.66 .73 3.58 1.86 .73 4.03 1.81 .67 3.70 1.67 .78
Self-Regulated Learning Strategy Scales
A. Cognitive & Meta-cognitive Scales
RE 4.93 1.40 .71 5.09 1.27 .76 4.92 1.54 .65 5.04 1.30 .69 4.85 1.46 .73
EL 4.85 1.42 .80 4.88 1.33 .82 4.80 1.52 .79 4.77 1.35 .76 4.91 1.46 .83
OR 4.56 1.44 .64 4.73 1.24 .72 4.29 1.67 .58 4.53 1.36 .59 4.58 1.50 .69
CT 4.30 1.47 .80 4.31 1.36 .79 4.27 1.63 .82 4.47 1.35 .75 4.17 1.54 .83
SR 4.66 1.52 .83 4.94 2.60 .81 4.36 1.70 ..83 4.64 1.45 .78 4.67 1.57 .86
B. Resource Management Scales.
TSE 5.24 1.56 .75 5.20 1.46 .75 4.98 1.65 .76 5.06 1.52 .71 5.17 1.56 .78
ER 3.85 1.33 .64 5.24 1.30 .65 5.25 1.36 .66 5.13 1.35 .53 5.32 1.29 .72
PL 4.46 1.38 .70 4.03 1.53 .73 3.55 1.72 .67 3.74 1.61 .62 3.92 1.63 .75
HS 4.46 1.26 .57 4.51 1.46 .50 4.38 1.64 .56 4.35 1.53 .47 4.53 1.55 .61
Legend: M = Mean; SD = Standard Deviation; and A = alpha
Source: The data used in this analysis was the students‘ responses to the MSLQ questionnaire.
The second purpose of the study (also pertained to hypothesis number 3) was to examine the relationship among motivation, and self-regulated learning strategy scales related to academic performance for the sample of college students. To ensure that the magnitude of the relationship between the motivation constructs and learning strategy constructs were not as a result of interaction among the constructs themselves, each scale was individually correlated to the performance component and results calculated. The results were tabulated and are presented in Table 3. The first hypothesis related to the relationship between motivational strategies and the academic performance of college students. The findings for each motivational scale component are presented as follows (Table 2): Intrinsic goal orientation: The degree to which the students perceived themselves to be participating in the academic task for reasons of challenge, curiosity, and mastery. Results indicated main effect positive interaction with academic performance (F = 4.33, p< 0.05, r = 0.35) for the sample. Two of the sub scales, challenge and mastery, also had significant relationships with academic performance of r = 0.35 and r = 0.28 respectively. Extrinsic goal orientation: The level to which the students were concerned with issues which were not directly related to participating in the task, such as, grades, rewards, and comparing performance with others. The results indicate that the sample of students were most interested in their level of performance or getting good grades as evident through a positive correlation (F = 3.37, p< 0.05, r = 0.29). Task value: Students evaluated the course material in terms of interest, important, and utility. The results indicated a high level of interaction between task value and academic performance of the college students (F = 11.28; p< 0.05; r = 0.52). The

The Academic Performance of College Students in Higher Education
185
results indicated that the sample of college students did not only find the courses that they pursued interesting, but also important and usable in their future careers. Task value had a much higher level of correlation with performance than the two prior value components, intrinsic and extrinsic value. The coefficient alpha was tabulated at 0.89. Control of learning beliefs: This scale was used to measure the level to which students believed that their efforts to study made a difference in their learning (Ames & Archer, 1987). The results indicated that this scale interacted with the African-American college students performance (F = 3.27; p< 0.05; r = 0.33).The sub-scales also displayed high levels of interaction with the students‘ performance which indicated the students‘ confidence in their ability to master the academic tasks and obtain an excellent grade. Self-efficacy: This scale measured the students‘ ability to master tasks and confidence that they possessed the skills to perform the tasks (Bandura, 1977). The results indicated that self-efficacy, or the ability of the sample of African-American college students interacted strongly with their academic performance. This construct‘s correlation coefficient was robust, with coefficient alpha tabulated at 0.90 (F = 13.51; p< 0.05; r = 0.50). Each sub-scale also displayed significant interaction with the students‘ academic performance. Test Anxiety: This scale measured (Hill& Wigfield, 1984; Kaufman, 1999)The results indicated that most of the sub-scales and the biological component of test anxiety were negatively related to academic performance (F = 3.70; p < 0.05; r = -0.26). The second hypothesis pertained to the relationship between self-regulated learning strategies and the academic performance of the sample of college students. The results of the scale correlations between motivation constructs, self-regulation constructs and academic performance are presented in Table 2. The results indicated that cognitive learning constructs were related to students performance are as follows: Rehearsal: This scale assessed learning strategies implemented to aid the student‘s learning process and involved reciting or naming items from a list of items to be learned. The rehearsal scale is represented by four items on the survey (coefficient alpha = .76; p<0.05; r=0.33). Elaboration : This scale help students retain information by building internal connection between items to be learned. Elaboration was assessed by students‘ responses to six items on the survey, pertaining to paraphrasing, summarizing, creating analogies and note-taking strategies, that help them integrate and connect new information with prior knowledge (coefficient alpha = .82; p<0.05; r=0.38).

Michael M. Campbell
186
Table 2: Variables Correlation Levels (r) with Final Grade ( FG )
Total Race Gender
Sample AA CG Male Female
All All Male Fem All Male Fem All AA CG All AA CG
N= 259 N=161 N=63 N=98 N=98 N=46 N=52 N=109 N=63 N=46 N=150 N=98 N=52
r r r r r r r r r r r r r
Motivational Scales
IGO .35 .39 .32 .44 .33 .10 .49 .20 .32 .10 .45 .44 .49
EGO .29 .29 .28 .31 .28 .26 .29 .27 .28 .26 .30 .31 .29
TV .52 .57 53 .74 .48 .37 .56 .46 53 .37 .57 .74 .56
CLB .33 .31 .20 .48 .37 .31 .42 .24 .20 .31 .39 .48 .42
SEP .50 .57 .51 .60 .46 .39 .52 .45 .51 .39 .56 .60 .52
TA -.26 -.26 -.24 -.28 -.28 -.17 -.37 -.22 -.24 -.17 -.32 -.28 -.37
Self-Regulated Learning Strategy Scales
A. Cognitive & Meta-cognitive scales
RE .33 .38 .36 .41 .28 .24 .31 .30 .36 .24 .36 .41 .31
EL .38 .39 .37 .42 .37 .26 .46 .31 .37 .26 .42 .42 .46
OR .28 .34 .26 .38 .23 .17 .27 .22 .26 .17 .31 .38 .27
CT .39 .37 .29 .41 .42 .37 .46 .32 .29 .37 .43 .41 .46
SR .28 .23 .24 .37 .26 .17 .27 .22 .24 .17 .32 .37 .27
B. Resource Management Scales
TSE .27 .28 .26 .29 .27 .20 .34 .23 .26 .20 .30 .29 .34
ER .27 .26 .22 .32 .30 .22 .40 .21 .22 .22 .34 .32 .40
PL .36 .40 .29 .48 .31 .25 .36 .27 .29 .25 .42 .48 .36
HS .23 .12 .21 .24 .12 .19 .21 .14 .21 .19 .22 .24 .21
Source: The data used in this analysis was the students‘ responses to the MSLQ questionnaire.
Organization: The strategies, such as clustering, outlining, and highlighting the main idea, helps the student select appropriate information and construct connections among the information the information to be learned. Organizing is an active, effortful, endeavor, and result in the student being closely involved in the task. The utilization of the organizational was assessed by the students‘ responses to the ways in which they implement or utilize these strategies in their college courses. Four items on the survey represent this scale (coefficient alpha = .72; p<0.05; r=0.28). Critical Thinking: This scale was assessed by the degree to which students report applying previous knowledge to new situations in order to solve problems, reach decisions, or make critical evaluations with respect to their courses. Five items pertain to critical thinking on the survey (coefficient alpha = .79; p<0.05; r=0.39) Self Regulation: This scale was assessed by how well, according to their responses to twelve items on the survey, students implement planning, monitoring, and regulating activities to enhance their academic performance (coefficient alpha = .81; p<0.05; r=0.28). Time and study environment: This scale measured the level at which students must be able to manage and regulate their time and their study environment. The sub-scale concerned with good use of study time showed the highest correlation (r = 0.47) with the students‘ performance. The results indicated that time and study environment as utilized by the sample of college students is positively related to the students‘ academic performance (F = 4.07; p< 0.05; r =0.27). Effort regulation: This scale measured the level of students‘ effort and commitment to completing their study goals, even in the presence of difficulties or distractions (Borg et al, 1989). The results indicated that three of the four sub-goals were above the significance correlation level of r > 0.15. The results indicated that effort regulation was related to the academic performance of college students (F = 2.83; p< 0.05; r = 0.27). Peer learning: The level of collaboration with peers to assist a learner to clarify materials and reach insights on coursework that was not attained in the classroom. All three of the sub-scales were significantly related to academic performance. The results indicated that peer learning was significantly related to the academic performance of the African-American college students (F = 3.70; p< 0.05; r = 0.36).

The Academic Performance of College Students in Higher Education
187
Help seeking: Research has indicated that peer help, peer tutoring, and instructor assistance facilitate student achievement (Wigfield, 1994). The results indicated that the African-American students participants in this study did not fully utilize this resource . Although the scale was related to the students academic performance, the magnitude of that relation was less than the acceptable significance level for this study of r > 0.15 (F = 1.99; p < 0.05; r = 0.23). The third hypothesis pertained to the notion that multi-correlations existed between motivation strategies and self-regulated learning strategies. The results of the bi-variant correlation analysis relationships between the various constructs were tabulated and are presented in Table 3. The fourth hypothesis pertained to the level of correlation of the variables with academic performance of the college students across gender and race lines. The results of the scale correlations between motivation constructs, self regulation constructs and academic performance are presented in Table 4. The results indicated that there are differences in the level of performance of college students across gender and race lines.
PRESENTATION OF FINDINGS
With respect to the first hypothesis (H1) concerning the relationship between the academic performance of college students and motivational strategies, the findings (Table 2) indicated that the motivational constructs, namely, intrinsic goal orientation (r = 0.35), extrinsic goal orientation (r = 0.29), task value (0.52), control of learning beliefs (r = 0.33) and self-efficacy (r = 0.50) were all positively and significantly (r > 0.15) related to academic performance (Table 1). The results implied that the motivational components were directly (positive correlation coefficients) linked to students‘ academic performance in the classroom. The strongest correlation coefficients for the motivational components were recorded for task value (r = 0.52) and self-efficacy (r = 0.50). Each scale was individually examined with academic performance, so the relations of task value and self-efficacy were independent of and did not interact with any of the other scales, therefore, negating the possibility of inter-correlation effect. The results indicated that, as pertained to the students‘ task value, they not only found the courses they studied interesting, but also understood the course content was very important and it was their intention to utilize the learned coursework. The results also indicate that the students‘ were confident that they had the necessary ability to accomplish and the necessary skills to perform the tasks. It may be implied that teaching students about different motivational strategies may prove to be more important for improving actual performance on classroom academic tasks (Schunk, 1985). Motivation strategies were positively related to academic performance and, therefore, did not support the null hypothesis (N1). The second hypothesis (H2) (Table 2) pertained to the relationship between learning strategies and the academic performance of college students. Self-regulated learning strategies were represented by the scales rehearsal (r = 0.33), elaboration (r = .38), organization (r = 0.28), critical thinking (r = 0.39), and self-regulation (r = 0.28). All the correlations were positive and the correlation coefficients were significant (r > 0.15). The findings for the cognitive variables provided useful data on academic performance in actual classroom tasks and support for the notion of self-regulated learning. Students who were engaged in trying to learn by memorization, organization and transformation of the classroom materials through the use of rehearsal, elaboration, and organization cognitive strategies performed better than students who did not utilize these strategies (Hagen &Weinstein, 1995; Pintrich & DeGroot, 1990). The results clearly indicate that self regulation learning strategies were good predictors and positively related to academic performance of college students. Therefore, the null hypothesis (N2) was not supported. The third hypothesis (H3) related to any multi-correlations that existed between motivation constructs, and self-regulated learning constructs (Table 3). The findings clearly indicated that correlation among the constructs existed in various magnitudes and directions. As expected the biological component, test anxiety, was negatively with the other constructs of the study. However, two self-regulated constructs (critical thinking and self-regulation) and one responsive environment construct (help seek) were in some cases negatively correlated to the other constructs. Critical thinking was negatively correlated with the motivational and responsive environment construct, time/study environment construct. The self-regulation construct was positively related only with task value and self-efficacy from the motivational component and with help seek from the responsive environment component. Help seek was positively correlated only with the control of learning beliefs construct from the motivational components, and was negatively correlated with elaboration. These findings strongly suggest that that students must be able to understand not only the ‗what‘ of cognitive strategies, but, most importantly, they must also know how and when to apply these strategies effectively (Pintrich & DeGroot, 1990).

Michael M. Campbell
188
Table 3: Correlation Levels for Motivation and Self-Regulated Learning Scales
Dependent Variables 1 2 3 4 5 6 7 8 9 10 11 12 13 14
Motivational Scales
1. Intrinsic Goals .----
2. Extrinsic Goals .713
3. Control of Learning Beliefs .817 .257
4. Task Value .978 .839 .690
5. Self-Efficacy .936 .421 .654 .844
6. Test Anxiety -.463 -.687 -.082 -.524 -.284
Self-Regulated Learning Scales
7. Rehearsal .555 .836 .025 .694 .287 -.181
8. Elaboration .917 .385 .898 .824 .721 -.168 .329
9. Organization .750 .087 .850 .612 .922 -.103 .109 .951
10. Critical Thinking -.302 -.490 -.023 -.337 -.191 .969 .060 .322 .174
11. Regulation -.540 -.155 -.823 .357 .486 -.089 -.371 .607 -.836 -.118
12. Time/Study Environment .083 .586 .126 .204 .143 -.495 .161 .085 .531 -.366 -.213
13. Effort Regulation .778 .473 .901 .710 .783 -.749 .021 .690 .551 .725 -.721 .380
14. Peer Learning .991 .260 .978 .966 .999 -.101 .785 .978 .933 .120 -.998 .355 .778
15. Help Seek -.536 -.448 .681 -.506 -.487 .905 .101 -.362 .196 .938 .504 .664 .924 .487
Note: N = 161. Correlations greater than .19 are significant at .05 level; and greater than .35 at .01 level
The fourth hypothesis (H4) (Table 2) related to differences that existed in the levels of performance of college students across gender and race lines. The findings clearly indicated that correlation among the constructs and performance existed in various magnitudes. It is apparent that as pertains to the gender of the students, female students level of performance were predicted to be higher than their male counterparts. Female students were also more impacted by test anxiety than their male counterparts. Among females students, the Caucasian female students were more impacted by test anxiety than African-American females. However, with male students the results were reversed. The results indicated that Caucasian females made better use of their study time and exerted more effort in their studies than their African-American counterparts. However, the African-American students (males and females) utilized peer learning and help-seek to greater advantage than their Caucasian counterparts. As relates to gender, the African-American and Caucasian females outperformed their male counterparts with motivation and responsive environment scales. The female students were more impacted by test anxiety than their male counterparts for both African-American and Caucasian students. The analysis clearly indicate that the relationship between academic performance and the demographic variables gender and race were statistically significant and that the differences in the levels of academic performance across gender and racial lines were also statistically significant (Carpenter et al, 1993).
CONCLUSION
The results provide evidence for the importance of considering both motivational and self-regulated learning components in the classroom in an effort to enhance the academic performance of college students. This model, if implemented properly would not only result in improved academic performance among college students, but could also result in the reduction of their dropout rate. As the classroom tasks and assignments become more interesting and manageable, and as their performance levels improve, college students will be more apt to complete their college careers. However, implementation of the motivational and learning strategies alone are inadequate. The students‘ learning environment is one of the most important factors in this model and a catalyst to success. Students need to have both the will and the skill to be successful in the classroom setting (Blumenfeld, 1992; Pintrich, 1989). Finally, learning institutions, at all levels of the educational process, need to integrate these components into their models for continued classroom success among college students.
REFERENCES
Ames, C. & Archer, J. (1987). Mothers beliefs about the role of ability and effort in school learning. Journal of Educational Psychology, 79(4), 409-414
Bandura, A. (1977). Self-Efficacy: Towards a unifying theory of behavioral change. Psychological Review, 84, 191-215.

The Academic Performance of College Students in Higher Education
189
Blumenfeld, P. (1992). Classroom learning and motivation: clarifying and expanding goal theory. Journal of Educational Psychology, 84(3), 272-281.
Borg, M., Mason, P., & Shapiro, S. (1989). The case of effort variables in student performance. Journal of Economic Education, (Summer), 309-313.
Carpenter, V., Friar, S., & Lipe, M.(1993). Evidence on the performance of accounting students: Race, gender, and expectations. Issues in Accounting Education, (Spring), 1-17.
Elliott, E. & Dweck, C. (1988). Goals: An approach to motivation and achievement. Journal of Personality and Social Psychology, 54(1), 5-12.
Hagen, A., & Weinstein, C. (1995). Achievement goals, self-regulated learning, and the role of classroom context. New Directions for Teaching and Learning, (Fall) , 43-55.
Hill, K. & Wigfield, A. (1984). Test anxiety: A major educational problem and what can be done about it. Elementary School Journal, 85, 105-126
Kaufman, R. (1999). Treating Depression and anxiety: A test of the anxiety hypothesis. The Sciences & Engineering, 60(3-B), 1304.
Paulsen, N. & Gentry, J. (1995). Motivational, learning strategies, and academic performance: A study of the college finance classroom. Financial Practice & Education, (Spring/Summer),78-89.
Pintrich, P. & De Groot, E. (1990). Motivational and self-regulated learning components of classroom academic performance. Journal of Educational Psychology, 82, 33-40.
Pintrich, P. (1989). The dynamic interplay of student motivation and cognition in the college classroom. In M. Maehr and P. Pintrich (Eds.), Advances in Motivation and Achievement: Motivation Enhancing Environments, Vol 6. (pp. 117-160), Greenwich, CT: JAI Press.
Pintrich, P., Marx, R. & Boyle, R. (1993a). Beyond cold conceptual change: The role of motivation beliefs and classroom contextual factors in the process of conceptual change. Review of Educational Research. 63(2), 167-199.
Pintrich, P., Smith, D., Garcia, T., & McKeachie, W. (1993b). Reliability and predictive validity of the Motivated Strategies for Learning Questionnaire (MSLQ). Educational and Psychological Measurement, 53, 801-813.
Schunk, D. (1985). Self-efficacy and school learning. Psychology in the Schools, 22, 208-223. Wigfield, A. (1994). Expectancy-value theory of achievement motivation: A developmental perspective. Educational
Psychological Review, 6, 49-78. Wambach, C. (1993). Motivational themes and academic success of at-risk freshmen. Journal of Developmental Education,
(Spring), 8-10.
ABOUT THE AUTHOR
Dr. Michael Campbell is the Director of Academic Student Services and Instructor at Florida A&M University, School of Business & Industry. Research interests include Regional Integration, Economic Growth/Development, Trade Issues and Student Performance in Higher education.

Joselina Cheng
190
E-TEACHING BUSINESS ARCHIECTURE WITH INNOVATIVE TECHNOLOGY IN THE MIS VIRTUAL CLASSROOM OF THE TWENTY-FIRST CENTURY
Joselina Cheng University of Central Oklahoma
ABSTRACT
The number of students enrolled in online course has more than doubled in the past five years. To meet the rising demands
for online education, faculty members in the traditional brick-and-mortar higher education are expected to teach hybrid or
online courses with advanced technology in the virtual classroom (e-teaching). Although management information system
(MIS) faculty members often incorporate technology in the classroom, e-teaching VB.NET programming courses with text-
based learning modules may not adequately address students‘ learning styles. To provide academic stakeholders with insights on how the use of innovative technology can affect students‘ learning effectiveness, this quantitative study compared differences in academic performance that existed among online students. This study adopted convenient sampling that
included students who self-enrolled in online MIS Business Architecture courses at one Western university in the United
States for four semesters (2006-2008).Out of 120 students who volunteered to participate in the study, 60 were randomly
assigned to a treatment group and 60 were assigned to a control group. Pre-test was administrated to both groups to
establish the baseline for prior knowledge of database and ASP.NET at the beginning of the semester. Following the pretest,
the control group was given text-based lectures. The treatment group was granted with access to multimedia-based learning
modules that the researcher created with Camtasia and Microsoft VB.NET2005. Post test were administered to both groups.
Score differences from the pretest and posttest were calculated and analyzed to answer the research question. The analysis
of variance (ANOVA) revealed statistical significance to support the research hypothesis that the use of innovative technology
can enhance learning outcomes when students‘ learning styles were addressed. This study contributes to the literature by
providing results of an empirical investigation of the effects of innovative technology on students‘ academic performance. Future studies were suggested to extend the findings. This knowledge becomes increasingly important as more traditional
higher education universities transition into hybrid institutions in an effort to offer quality online education and sustain long-
term competitiveness in the 21st century global e-learning environment.
Keywords: Innovation, Virtual Tutor, Andragogy, Pedagogy
INTRODUCTION
The number of students enrolled in online course has more than doubled in the past five years, from ―483,113 in 2002 to 1,501,005 in 2006‖ (Romano, 2006, A06). There are several factors that contribute to the growth of online courses. First, advanced technology enables higher education institutions to deliver educational content digitally in the global e-learning environment where adult learners and faculty members are at a distance from one another but are connected by technological communication media, platform, and course learning system such as WebCT/Blackboard (Saba, 2005). Second, the flexibility of online courses can better accommodate adult learners who are often too constrained to attend traditional face-to-face classrooms due to working schedules, business travels, and the demands for raising families (Zhang, 2004; Carr-Chellman, 2006). As the demands for online education continues, administrators of traditional brick-and-mortar universities sense the urgency in transitioning to hybrid institutions that offer ground, hybrid, and online courses to meet the needs of adult learners and sustain long-term competitiveness (Picciano, 2006; De Simone, 2006; Folkers, 2005; Waterhouse, 2005). According to a survey study conducted by the Association to Advance Collegiate Schools of Business, sixty percent of full-time faculties were involved in online course creation, maintenance, and delivery through the Internet and course management systems (Singh & Bernard, 2004; Trees, 2000; Mossavar-Rahmani & Larson-Daugherty, 2007).
RESEARCH BACKGROUND AND OBJECTIVE
As the demand for online educational continues, administrators of traditional higher education institutions need to understand the burden of faculty members who transition from teaching in the traditional classroom to teaching with advanced technology (e-teach) in the virtual classroom (Alshare, Kwun, & Grandon, 2006; Cao, 2005; Zhang, 2004; Moallem, 2008). E-teaching can

E-Teaching Business Archiecture with Innovative Technology in the MIS Virtual Classroom of the Twenty-First Century
191
present faculty and learners with technological and pedagogical challenges. Without technical training and pedagogical guidelines, faculty members may shy away from e-teaching or struggle to incorporate innovative technology into online course design, development, and delivery. Research shows that online learning modules that are static text-based many not adequately address students‘ auditory, visual, and kinesthethic learning styles in the virtual classroom (Cao, 2005; Zhang, 2004; Bourne & Moore, 2004; Sandman, 2009). While the literature is filled with research studies that compare the learning outcomes of traditional courses and those of online courses, there appears a dearth of research on learning styles of students enrolled in Management Information System (MIS) online courses (Alshare, Kwun, & Grandon, 2006; Britt, 2006; Carr-
Chellman, 2006; Durrington, Berryhill, & Swafford, 2006; Lessen & Sorensen, 2006; Sandman, 2009). To fill the research gap, the
objective of this study was to compare the effects of the use of innovative technology on MIS students' academic performance in relation to learning styles.
RESEARCH VARIABLES, QUESTION, AND HYPOTHESIS
The research variables in this include the method of instruction, students‘ academic performance, and preferred learning
style. Two methods of instructional delivery were adopted for this study including text-based lectures and multimedia-based learning modules. While text-based lectures came with the textbook, the researcher created multimedia-based learning modules by integrating innovative technology including Camtasia and Microsoft Visual Basic.NET 2005. The collection of multimedia-based learning modules is referred to as Virtual Tutor. Students‘ academic performance is derived from researcher-constructed assessment as shown in Appendix A. The research variable preferred learning style was self-reported by MIS students from three pre-defined learning styles auditory, visual, and kinesthetic learning style in respect to the effort to narrow the possibility of multiple learning orientations. Based on the research objective stated above, the following research question (RQ) and hypothesis were formulated. RQ1: What are the differences in MIS students‘ academic performance in relation to the method of instruction and students‘
preferred learning styles? H1: The use of innovative Virtual Tutor can enhance MIS students‘ academic performance in the virtual classroom.
LITERATURE REVIEW
Technology has played a vital part in the evolution of distance learning over four generations in the last century as shown in Table 1 (Aduwa-Ogiegbaen & Isah, 2005; Moore & Kearsley, 1996; Moore & Fowler, 2009; Zirkle, 2005). E-learning, a subset of distance education, is defined as ―planned teaching and learning where educators and learners are at a distance from one another but connected by technological media‖ (Saba, 2005, p. 256). Given the rising demands for just-in-time skill acquisition in the global knowledge-based societies, many multinational organizations embrace e-learning as an essential component for corporate training in order to sustain long-term competitiveness in the global market place (Combe, 2005). The U.S. Department of Labor estimates that ―corporate e-learning revenues are expected to increase from $550 million to $11.4 billion, a projected 83% compound annual growth rate‖ in the last decade (Fry, 2001, p. 1).
Table 1: Four Generations of Distance Education
Distance learning generation
Duration Technology
Generation #1 1800s-1960 Radio
Generation #2 1960-1984 Television, audiocassettes, videocassettes, fax
Generation #3 1985-1994 Computers, network, CD, phone, videoconferencing, and cable
Generation #4 1995-Present Internet, wireless, course management system (email, chat, bulletin), DVD, streaming video, podCasting, and terrestrial satellite
Likewise, institutional administrators in traditional brick-and-mortar higher education are becoming aware of the rising demands for e-learning since the flexibility of online courses can better accommodate the needs of working adults who are often constrained by their working schedule, travels, and family to attend the traditional face-to-face classes on campus

Joselina Cheng
192
(Waterhouse, 2005). While online education can be an alternative strategy for traditional universities to recruit adult learners, the success of online education depends on the quality of learning modules that address students‘ learning styles sufficiently in the virtual classrooms (Cao, 2005; Sandman, 2009; Zhang, 2004; Waterhouse, 2005). Research shows a linkage for faculty members who are consciously aware of their pedagogical choices and students‘ learning styles (Hawk & Shah, 2007). Furthermore, research shows that multimedia-based learning modules can better address students‘ learning styles (Cao, 2005; Morales, Cory, & Bozell, 2001; Zhang, 2004). In the context of this study, multimedia-based learning modules that were used for MIS online courses are based on the following theoretical frameworks.
Theoretical Framework for Innovative Technology
According to Multimedia Learning Theory, faculty members can address students‘ learning styles by using multimedia technology to develop learning modules that entice learners to focus full attention on a task through the vividness of the presentation (Moallem, 2008; Sandman, 2009; Yu, Wang, & Che, 2005; Zhang, 2004). Multimedia is the delivery of information in a computer-based presentation that integrates two or more media (Beckman, 1999; Zhang, 2004). Multimedia involves technologies that combine several mediums of communication such as text, graphics, video, animation, and sound. Since the Internet supports the delivery of full-motion audio and video to personal computers, multimedia technology that carries multimedia learning contents can be easily retrieved and downloaded over increasing network bandwidth (Zhang, 2003). Furthermore, research has shown that using multimedia-based learning modules have a dramatic impact on the process of learning and problem solving (Syed, 2001; Sandman, 2009). Research has shown the multi-sensory learning environments can help maximize the learner‘s ability to process, encode, retain, and retrieve information (Yu et al., 2005; Waterhouse, 2005). Faculty members can also design and develop online modules with emphasis to integrate high interactivity that can enhance students‘ participation and e-learning effectiveness (Nugent, Soh, Samal, Person, & Lang, 2005; Pachnowski & Jurczyk, 2000). Despite the fact that online education ―has gained momentum and now accounts for a significant proportion of course offerings in higher education,‖ (McKnight, p. 510) limited pedagogical guidance is available to faculty members. Since e-
teaching in the virtual environment requires different pedagogical strategies than those used in the traditional face-to-face classroom, faculty members often undergo the pragmatic process by unlearning past teaching habits and philosophies in an effort to successfully teach online courses. To that end, addressing students‘ different learning styles in an e-learning environment can be a challenging task for instructors who are technically challenged (Waterhouse, 2005). Institutional administrators need to provide faculty members with technical training and pedagogical guidelines so that faculty can incorporate innovative technology and pedagogical strategies into the development of multimedia-based learning modules in order to address students‘ learning styles (Tangdhanakanond, Pitiyanuwat, & Archwamety, 2006; Zhang, 2004; Waterhouse, 2005). The following sections present discussion of past research that incorporated innovative technology with sound pedagogy to enhance e-teaching and e-learning effectiveness in the virtual classroom
Theoretical Framework for E-Teaching Strategies
According to Knowles (1980), the core of Adult Learning Theory is the art of helping adult learners learn (andragogy). In the context of e-learning, making the educational content professionally and personally relevant is critical for adult learners to succeed (Knowles, 1980). Online faculty members can incorporate innovative technology to design and develop multimedia-based learning modules that (a) address adult learners‘ needs, (b) engage adult learners in problem solving, and (c) acquire knowledge to apply to real-life situations (Cheren, 2002; Mungania & Hatcher, 2004). Research has shown that online learning modules that incorporate strategic andragogy help adults learn more effectively in virtual classrooms (Waterhouse, 2005). In addition, incorporating cognitive and constructive learning theories into online learning modules can help adult learners learn autonomously (Folkers, 2005). Faculty members’ teaching philosophies change from knowledge transmission to knowledge construction in a virtual classroom (Yu, Wang, & Che, 2005). Hence, cognitive and constructive learning can underline the importance of timely feedback that can motivate students to learn in a virtual classroom (Bellefeuille, 2006; Waterhouse, 2005). Furthermore, cognitive and constructive learning can develop students‘ self-regulatory skills to set goals, manage course workload, and succeed in the virtual learning environment (Whipp & Chiarelli, 2004). Likewise, the concepts of Benjamin Bloom‘s (1956) Taxonomy can also be incorporated into multimedia-based modules to foster online students‘ critical thinking

E-Teaching Business Archiecture with Innovative Technology in the MIS Virtual Classroom of the Twenty-First Century
193
in a learner-centered learning environment where learners ―become more actively engage in the learning process‖ (Waterhouse, 2005, p. 37). The theoretical frameworks that were discussed allow faculty members to design and develop quality online learning modules that cultivate an innovative, collegial, and collaborative learning environment to enhance online students‘ learning (De Simone, 2006).
Method of Instruction
In this study, two methods of instruction were adopted including (a) text-based lectures that came with the textbook and (b) multimedia-based learning modules that the researchers created with Microsoft Visual Basic 2005 and Camtasia. Each multimedia-based learning module was animated with sound, graphic, and hands-on instructions that were designed to address students‘ visual, auditory, and kinesthetic learning style. These learning modules were sharable objects that were converted to streamed videos. The researcher referred to the collection of multimedia-based learning modules as Virtual
Tutor. Only students in the treatment group were granted with secured login to access Virtual Tutor that resided at WebCT/Blackbroad course site. Learners only need a Web browser, a RealPlayer, and a sound card installed on his or her computer. Appendix A shows an example of multimedia-based learning module that provides students with step-by-step instructions on how to create Web-based application using ASP.NET.
Learning Styles
Learning Style Theory addresses specific skills and tasks generally incorporated into formal pedagogy (Groble, 2002). Academic-oriented learning style is the preference, predisposition, or habitual mode of an individual to acquire information and knowledge (Curry, 1991; Riding & Cheema, 1991; Zapalska & Brozik, 2007). Of the researched academic learning styles, the consistently identifiable and validated styles include visual, auditory, and kinesthetic learning styles (MacInnis & Price, 1987; Zapalska & Brozik, 2007). For visual learners, thinking and problem-solving processes consist of graphics and pictorial representations in which multisensory information is represented (MacInnis & Price, 1987; Drago & Wagner, 2004). In contrast, auditory learners prefer to verbalize in order to hear words or numbers spoken while kinesthetic learners prefer hands-on activities (Drago & Wagner, 2004).
Academic Performance
In the context of e-learning, research has shown a correlation between the multimedia-oriented learning modules and a student academic performance that was measured by grade point average (Yu, Wang, & Che, 2005). A study conducted by Morales, Cory, and Bozell (2001) compared students‘ performance between scores of students in traditional face-to-face classrooms and those in virtual classrooms. Morales et al., (2001) found significant differences in learning effectiveness that were measured by test scores for online and ground students. Online students who were exposed to both a text-based lectures and multimedia-based learning modules outperformed those who were exposed to text-based lectures (Morales et al., 2001).
METHODOLOGY
The research method of this study is quantitative. The research design is quasi-experiment. The time dimension of the research is cross-sectional. The general population included MIS students at one at one Western university. Convenience sampling was used to target students who self-enrolled in MIS online courses for fall 2006, spring 2007, fall 2007, and spring 2008 semesters. The sample for this study included 120 MIS students who volunteered to participate in the study. Out of 120 participants, 60 were randomly assigned to the control group and 60 were randomly assigned to the treatment group.
Instrument and Measurements
A pilot study was conducted at the researcher‘s institution to establish the validity and reliability of the researcher-constructed instrument that t has not been used in prior studies. The instrument, as shown in Appendix B, contained multiple questions relevant to architecture of database, business intelligence, and web-based application. The instrument was used as pretest and posttest to assess MIS students‘ academic performance. A pretest was administered to participants in the treatment and the control group to establish the baseline for existing knowledge at the beginning of each semester. Multimedia-based learning modules were given to the treatment group; whereas text-based lectures were given to the control group. Post test was administrated to both groups to collect, measure, and compare students‘ academic performance in relation to their preferred learning styles.

Joselina Cheng
194
Furthermore, the same set of activities was used for all of the classes where data were collected. The course structure and textbook also stayed the same over the data collection period of four semesters. The nature of the exams and other assignments remained the same.
FINDINGS OF THIS STUDY
Data were derived from the MIS Assessment and entered into Statistical Package for the Social Sciences (SPSS). Statistical procedures were used to analyze the data. The findings were organized on the basis of research question, and research hypothesis.
Data Analysis for Research Question
To answer the research question, What are the differences in MIS students‘ academic performance in relation to the method of instruction and students‘ preferred learning styles?, students‘ academic performances were computed by subtracting the pre-test scores from the post-test. The data evidenced MIS students who had access to multimedia-based learning modules achieved higher scores than students who were given text-based lectures. In addition, kinesthetic learners outperformed the auditory and visual learners, as shown in Table 2.
Table 2: Academic Performance in Relation to the Method of Instruction and Preferred Learning Style
Group Affiliation/Method of Instruction Preferred Learning Style
Treatment Group (Multimedia-based learning modules)
Control Group (Text-based lectures)
Auditory
Visual
Kinesthetic
3.35
3.33
3.40
2.92
3.25
2.83
Data Analysis for Research Hypothesis
To answer the research hypothesis, The use of innovative Virtual Tutor can enhance MIS students‘ academic performance in the virtual classroom, an analysis of variance (ANOVA) statistical procedure was performed to determine any statistical significance. The p-value was (0.001), which was less than a 95% confidence level (.05), evidenced statistical significance to support the research hypothesis that the use of innovative technology could enhance MIS students‘ academic performance when students‘ preferred learning style was addressed. To that end, the null hypothesis was rejected.
Additional Findings
When reviewing the analyses of the collected data, one finding that was not sought by this research was noted. For the treatment group as shown in Table 3, the data suggested that non-international students performed better academically than those of international students. One plausible explanation for the international students‘ underperformance may be contributed to language barriers since these online learning modules were created in English. The language barriers could be further compounded with syntaxes of VB.NET programming language and the complexity of Web-based architectural design.
Table 3: Comparative Summary of Academic Performance
GPA International Students Non-International Students
below 2.50 7.14% 11.11%
2.50-3.00 28.57% 5.56%
3.01-3.50 21.43% 33.33%
3.51 or higher 42.86% 50.00%
100.00% 100.00%
LIMITATIONS OF THIS STUDY
This quantitative quasi-experimental study has several limitations. First, the study employed convenience sampling. Collecting data from a non-probability sample may result in possibility of sampling errors due to heterogeneity (Berenson, Levine, &

E-Teaching Business Archiecture with Innovative Technology in the MIS Virtual Classroom of the Twenty-First Century
195
Krehbiel, 2006). Second, all participants came from the same institution. Third, the experimental treatment and testing procedures were conducted in a two-year period for one discipline. These limitations hinder the researcher‘s ability to inference and generalize the findings to a larger population.
STUDY SIGNIFICANCE FOR KNOWLEDGE-BASED GLOBAL SOCIETIES
Technology is a tool that can be used by faculty members innovatively to enhance e-teaching and e-learning in the virtual classroom. However, faculty members who are technical challenged are less likely to participate in e-teaching. Hence, administrators of traditional brick-and-mortar higher education institutions have tremendous responsibilities to provide faculty members with pedagogical guidelines and technical trainings so that online courses are pedagogically addressed when moving from the traditional face-to-face classroom to the virtual classroom. The leadership implications of this empirical investigation are several. The findings of this study provide academic stakeholders, including policy makers institutional administrators, interdisciplinary faculty members, students, and researchers with unique insights on the impact of innovative pedagogy and technology in the global e-learning environment. For institutional administrators, providing interdisciplinary faculty with pedagogical guidelines and technical training can assist faculty members to incorporate innovative technology and cultivate a multi-sensory e-learning environment. For policy makers who provide funding for traditional brick-and-mortar higher education institutions can require administrators to revise institutional policies to provide e-teaching faculty with technical training and pedagogical guidelines. Faculty members who are supported can gain confidence to incorporate innovative technology and develop multimedia-based learning modules to address different learning styles and enhance academic performance. Take the state of Oklahoma for example, the Brain Gain 2010 is an initiative that provides funding for Oklahoma institutions that incorporate innovative technology into online education to enhance e-learning effectiveness, and increase degree completion (Bauman & Graf, 2003; Oklahoma State Regents, 2003). Innovative technology can also be incorporated into national educational systems to improve intellectual capital (Folkers, 2005; Waterhouse, 2005). In addition to the implications in academia, innovative technology can also be incorporated into professional training and human resource development by leaders of multinational corporations in order to sustain long-term competitiveness in the post-modern societies and global knowledge-based economies (Combe, 2005). IBM, Dell, 3COM, Cisco Systems, GE, and Motorola have incorporated innovative technology into their corporate universities that provide cross-continent employees with technology-based trainings (Folkers, 2005; Galagan, 2001; Mantyla, 2001; Pantazis, 2002; Schank, 2002). The benefits of corporate universities include reduced travel costs, increased productivity, and the generated return on investment (Huynh, Umesh, & Valacich, 2003).
FUTURE RESEARCH
Future studies are recommended to extend the findings of the study. First, researchers may want to conduct the research in more disciplines and explore the effects of innovative technology on students‘ learning outcomes. For example, accounting and finance faculty can use Camtasia and Excel to create interdisciplinary multimedia-based learning modules that provide students with step-by-step instructions on how to construct financial statements. Next, researchers may also want to conduct the research with more U.S. higher education institutions. A larger sample size can increase the probability to generalize the findings to a larger population. For institutions that have high enrollments of international students, researchers may consider creating online learning modules in different languages and compare any improvement in learning outcomes of international students. Researchers may also consider using other instruments to assess the learning outcomes in relation to learning styles. Instruments that have been validated in past research include but are not limit to Kolb‘s learning style inventory, Myers-Briggs, and Felder-Solomon earning styles inventory (Sandman, 2009). In addition to the application of in academia, innovative technology can be adopted by IT industry, for-profit and non-profit organizations, and government agencies for training and human resource development.
CONCLUSION
Online education can be an innovative strategy for traditional brick-and-mortar higher education institutions to provide adult learners with flexible schedule and global access to course content without time and location constraints. However, the success of online education depends on the efforts of stakeholders. Without the close collaboration and participation from academic stakeholders, the delivery of online education can be challenging and the cultivation of a successful e-teaching and e-learning environment may be difficult (De Simone, 2006; Folkers, 2005). Hence, institutional administrators and faculty have tremendous responsibilities to ensure that the quality of online education is pedagogically addressed when migrating learning modules to WebCT/Blackboard course site (De Simone, 2006; Waterhouse, 2005). This study contributes to the literature by providing results of an empirical investigation of the use of innovative technology on students‘ academic performance in

Joselina Cheng
196
relation to students‘ preferred learning style. The findings should encourage institutional administrators and interdisciplinary faculty members to transform education with innovative technology by creating a multi-sensory e-learning environment that can better address students‘ learning styles (Collins, 2001; De Simone, 2006; Moallem, 2008; Waterhouse, 2005). Future studies are also suggested to extend the findings. The knowledge becomes increasingly important as more traditional brick-and-mortar higher education institutions transition to become hybrid institutions that deliver education content digitally in order to sustain long-term competitiveness in global knowledge-based societies.
REFERENCES
Aduwa-Ogiegbaen, S., & Isah, S. (2005). Extent of faculty members' use of internet in the University of Benin, Nigeria. Journal
of Instructional Psychology, 32(4), 269-277. Alshare, K., Kwun, O., & Grandon, E. (2006). Determinants of instructors‘ intentions to teach online courses: A cross-cultural
perspective. The Journal of Computer Information Systems, Stillwater, 4(3), 87-95. Bauman, K., & Graf, N. (2003). Educational attainment. Retrieved February 14, 2009, from
http://www.census.gov/prod/2003pubs/c2kbr-24.pdf Beckman, C. (1999). ―Collaborative work networks among distributed learners.‖ Proceedings of the 32nd Hawaii International
Conference on System Sciences, IEEE Computer Society Press. Bellefeuille, G. (2006). Rethinking reflective practice education in social work education: A blended constructivist and
objectivist instructional design strategy for a web-based child welfare practice course. Journal of Social Work Education, 42(1), 85-103.
Berenson, M., Levine, D., & Krehbiel, T. (2006). Basic business statistics: Concepts and applications (10th ed.). Upper Saddle River: Pearson.
Bloom, Benjaman. (1956). Taxonomy of educational objectives, handbook I: The cognitive domain. New York: David McKay Co Inc.
Bourne, J., & Moore, J. (2004). Quality of online education: Into the mainstream. Solan-C Series, 5. Retrieved from
http://www.sloan-c.org. Britt, R. (2006). Online education: A survey of faculty and students. Radiologic Technology, 77(3), 183-190. Cao, J. (2005). Learning with Virtual Mentors: How to make e-learning interactive and effective? The University of Arizona,
AAT 3176282. Carr-Chellman, A. (2006). Desperate technologists: critical issues in e-learning and implications for higher education. Journal
of Thought, 41(1), 95-115. Cheren, M. (2002). A concise review of adult learning theory. Journal of Continuing Education the Health Professions, 22(3),
199-201. Collins, J. (2001). Good to Great: Why some companies make the leap and others don‘t (1st ed.). New York: Harper
Business. Combe, C. (2005). Developing and implementing an online doctoral programme. The International Journal of Educational
Management, 19(2), 118-127. Curry, L. (1991). Patterns of learning style across selected medical specialties. Educational Psychology, 11, 247–278. De Simone, C. (2006). Preparing our teachers for distance education. College Teaching, 54(1), 183-184. Drago, W., & Wagner, R. (2004). Vark preferred learning styles and online education. Management Research News, 27(1), 1. Durrington, V., Berryhill, A., & Swafford, J. (2006). Strategies for enhancing student interactivity in an online environment.
College Teaching, 54(1), 190-193. Folkers, D. (2005). Competing in the Marketspace: Incorporating Online Education into Higher Education - An Organizational
Perspective. Information Resources Management Journal, 18(1), 61-78. Fry, K. (2001). E-learning markets and providers: Some issues and prospects. Education & Training, 43(4). Galagan, P. (2001). Mission E-possible, Training & Development, 55(2), 46-56. Groble, M. (2002). Process and outcome efficacy of Internet counseling. Hawk, T. F., & Shah, A. (2007). Using learning style instruments to enhance student learning. Decision Science Journal of
Innovative Education, 5(1), 1-19. Huynh, M., Umesh, U., & Valacich, S. (2003). E-learning as an emerging entrepreneurial enterprise in universities and firms.
Communications of the Association for Information Systems, 12, 48-68. Knowles, M. (1980). The modern practice of adult education: From pedagogy to andragogy (2nd ed.). New York, NY:
Cambridge Books. Lessen, E., & Sorensen, C. (2006, March/April). Integrating. Change, 38(2), 44-49. MacInnis, D., & Price, L. (1987). The role of imagery information processing: Review and extensions. Journal of Consumer
Research, 13, 473-491.

E-Teaching Business Archiecture with Innovative Technology in the MIS Virtual Classroom of the Twenty-First Century
197
Mantyla, K. (2001). Blending e-learning the power is in the mix. Virginia: American Society for Training & Development. McKnight, R. (2004). Virtual necessities: assessing online course design. International Journal on E-Learning, 3(1), 510. Moallem, M. (2008). Accommodating Individual Differences in the Design of Online Learning Environments: A Comparative
Study. Journal of Research on Technology in Education, 40(2), 217-235. Moore, M. G., & Kearsley, G. (1996). Distance education: A systems view. San Francisco, CA: Wadsworth. Moore, A., Moore J., & Fowler, S. (2009). Faculty development for the net generation. Retrieved on February 24, 2009, from
http://www.educause.edu/FacultyDevelopmentfortheNetGeneration/6071 Morales, C., Cory, C., & Bozell, D. (2001). A comparative efficiency study between a live lecture and a Web-based live-
switched multi-camera streaming video distance learning instructional unit. In proceedings of 2001 Information Resources Management Association International Conference, Toronto, Ontario, Canada.
Mossavar-Rahmani, F., & Larson-Daugherty, C. (2007). Supporting the hybrid learning model: A new proposition. MERLOT
Journal of Online Learning and Teaching, 3(1). Mungania, P., & Hatcher, T. (2004).Systemic, flexible, and multidimensional models for evaluating e-learning programs.
Symbolic Interaction, 43(7), 33-39. Nugent, G., Soh, L., Samal, A., Person, S., & Lang, J. (2005). Design, development, and validation of a learning object for
CS1. Proceedings of the 10th annual SIGCSE conference on Innovation and technology in computer science education ITiCSE '05.
Oklahoma State Regents for Higher Education. (2003). Oklahoma‘s EDGE: Economic development generating excellence. Oklahoma City, OK.
Pachnowski, L., & Jurczyk, J. (2000, February). Correlating self-directing learning with distance learning success.‖ Paper presented at the annual meeting of the Eastern Educational Research Association, Clearwater, FL. (ERIC Document reproduction service No. ED441000).
Pantazis, C. (2002). Maximizing e-learning to train the 21st century workforce. Public Personnel Management, 31(1), 21-26. Picciano, A. (2006). Online learning: Implication for higher education pedagogy and policy. Journal of Thought, 41(1), 75-95. Riding, R., & Cheema, I. (1991). “Cognitive Styles: An Overview and Integration.‖ Educational Psychology, 11, 193–215. Romano, L. (2006, May 16). Online degree programs take off. The Washington Post, A06. Retrieved on February 24, 2009,
from http://www.washingtonpost.com/wpdyn/content/article/2006/05/15/AR2006051501496.html Saba, F. (2005, August). Critical issues in distance education: A report from the United States. Distance Education, 26(2),
255-272. Sandman, T. (2009, January). Gaining insight into business telecommunications students through the assessment of learning
styles. Decision Sciences Journal of Innovative Education, 7(1), 295-317. Schank, R. (2002). Designing world-class e-learning. New York, NY: McGraw-Hill. Singh, R., & Bernard, M. (2004, January). Computers in education and business: A model for maintaining interoperability of
coarse XML sharable Learning Objects after re-authoring in a standards-based editor. Proceedings of the winter international Symposium on Information and Communication Technologies WISICT 2004.
Syed, M. (2001, July-September). Diminishing the distance in distance education. IEEE Multimedia, 18-21. Tangdhanakanond, K., Pitiyanuwat, S., & Archwamety, T. (2006). Assessment of achievement and personal qualities under
constructionist learning environment. Education, 126(3), 495-504. Trees, M. (2000, April 19). E-learning accelerates and transforms business school pedagogy: A special report to AACSB. The
International Association for Management Education Annual Meeting. San Diego, CA. Waterhouse, S. (2005). The power of eLearning: The essential guide for teaching in the digital age. Boston: Pearson. Weston, T., & Barker, L. (2001). Designing, implementing, and evaluating Web-based learning modules for university
students. Educational Technology, 41(4), 15-22. Whipp, J. L., & Chiarelli, S. (2004). Self-regulation in a web-based course: A case study. Educational Technology Research
and Development, 52(4), 5-22. Yu, S., Wang, M., & Che. K. (2005). An exposition of the crucial issues in China‘s educational information. Educational
Technology Research and Development, Washington, 53(4), 88-101. Zapalska, A., Brozik, D. (2007). Learning styles and online education. Campuswide Information Systems, 24(1), 6. Zhang, D. (2003). Powering e-learning in the new millennium: An overview of e-learning and enabling technology. Information
Systems Frontiers, 5(2), 207-218. Zhang, D. (2004). Virtual Mentor and the lab system – toward building an interactive, personalized, and intelligent e-learning
environment.. The Journal of Computer Information Systems, 44(3), 35-43. Zirkle, C. (2005). Web-enhanced alternative teacher licensure. The Teacher Educator, Muncie, 40(3), 208-220.

Joselina Cheng
198
APPENDIX A
Examples of Multimedia-based Learning Modules: Architecture of Database, Business Intelligence,
and Web-based Application.

E-Teaching Business Archiecture with Innovative Technology in the MIS Virtual Classroom of the Twenty-First Century
199
APPENDIX B Excerpt of MIS Pre- and Post-Test Questionnaire
Please select only one answer for the following questions.
1. A university uses a database to store information about each of the student, faculty, administrators, and staff. All of the information about a student is stored in a _______.
A) file in the database B) record in the database table C) field in the database table D) key field
2. A library keeps track of all of the entities of courses in a database file such as Course title, course description, and
section number are _______ in the database table.
A) files B) records C) fields D) keys
3. A unique record identifier (ie: AutoNumber) is referred to as _______
A) Foreign key B) Primary key C) Composite key D) None of the above
4. What is normalization in the context of database design?
A) A process to reduce redundancy B) A technique to improve data efficiency C) A strategy to improve data consistency D) All of the Above
5. What should a database maintenance program perform in the context of data integrity?
A) Delete the parent record first and then the child record B) Delete the child record first and then the parent record C) Delete both the parent and child record at the same time D) None of the Above
6. What is the Author-Book data relationship that a database administrator should define for the Author table and Book
table with potential scenario that each author can write multiple books?
A) One-to-One relationship B) One-to-many relationship C) Many-to-one relationship D) None of the above

William C. Root
200
THE VANISHING MIDDLE SCHOOL
William C. Root Augusta State University
ABSTRACT
Prior to the 1960s, the Junior High setting was how young adolescents were instructed. The middle grades concept was
developed in the 1960‘s as a method of reaching young adolescents. By 2001, the major push at the national level was to test all students in order to demonstrate intelligence or competence of subject matter.
With the fruition of Adequate Yearly Progress, there has been a shift from the Middle school concept of instruction to that of
the original Junior High—or little High School. Administrators and central office personnel seem to be diverted in their thinking
of what is best for students and what are practices that benefit students the most. Faced with threats of losing their careers,
teachers are buying into the concept that ‗drill and kill‘ really works.
There are four questions we need to look at when addressing this problem:
1. Are ALL students college material?
2. Will high test scores produce quality citizens?
3. Are we failing to meet the needs of the very students we are trying to get to succeed?
4. Why do we want to burden the already full social services departments with drop-outs?
In order to accomplish true educational reform, middle grades campuses need to address their priorities, whether those
priorities are test scores, or the need of the adolescent as a whole person. These two priorities need not be polar opposites.
INTRODUCTION
Prior to the 1960s, the Junior High setting was how young adolescents were instructed. Subject matter far outweighed the concerns of the student as a person. As a result, American education was losing far too many students for the sake of the system. The middle grades concept was developed in the mid-20th century as a method of reaching young adolescents. The focus became placed on the adolescents being seen as a whole child through instruction and behaviors, mixed together, rather than focusing on subject matter, teachers focused on the student as a person, the student‘s behaviors, and instruction, combined together (Lounsbury, 1992). By 2001, the major push at the national level was to test all students in order to demonstrate intelligence or competence of subject matter. The resulting consequences of this action created a reverting back to ‗the old ways‘ and has pushed the middle school concept to the edge, outskirts, or back burners of learning. We must now consider if the middle school model flawed or are we no longer caring about students, just test scores?
BRIEF HISTORY OF THE PROBLEM
Around the early 1960‘s there was a major effort to change the concept of how to teach students in grades 6 through 8. In the process of change, the Middle School concept came out. This concept treated the teaching of this age group as teaching the whole child, not just the subject matter. Evidence showed that this perception of how to address the adolescent student worked (Messick and Reynolds, 1992; Schurr, Thomason, and Thompson, 1996; Jackson and Davis, 2000; Wiles and Bonti, 2001; Stevenson, 2002; This We Believe, 2003; Erb, 2005).

The Vanishing Middle School
201
In the early 1980‘s, President Reagan commissioned a group of educational professionals and others to look into the problem of why America‘s high school graduates were not seen as being able to compete in a global market. The results from that commission were published in a study that had major effects on education. The overwhelming conclusion of that report was that American education was failing and more attention was needed at the Math and Science levels for future graduation requirements (A Nation At Risk, 1983). By the mid-1990‘s under President Clinton‘s efforts, Goals 2000 was established looking at the educational effects of A Nation At Risk, and what was needed as America entered the 21st Century. Again, emphasis was placed on stricter Math and Science coursework, in particular for stricter graduation requirements. This was seen as an attempt to bolster American high school graduates in the world market and in so doing, place the United States back on top, having the smartest and brightest products entering the world market. In so doing, there were changes made at the high school level. Students were required to take more math and science in order to graduate. Partly in fear of curriculum having been dummied down, and partly in fear of not being first in the world stage with future learners, these changes were placed into effect. Other changes came about, also. Things like Block scheduling, where students stayed with a teacher, or a team of teachers, for up to 90 minutes and beyond, instead of the traditional daily schedule was implemented in many schools. The theory was that less movement in the halls meant more time on task (A Nation At Risk, 1983; Goals 2000, 1994; U.S. Department of Education, 1997). Now, with all the attention given to middle schools making Adequate Yearly Progress from the mandates of No Child Left Behind, the Middle School Concept has been put on the shelf by many middle schools. The middle school concept was developed to emphasize the student as a whole person in the course of his or her learning. (Beane, 2001, Clark and Clark, 1994, Hechinger, 1993, Lewis, 1993, Lounsbury, 1992, McKay, 1995) Not to be outdone by the secondary setting, school districts began looking at the middle schools for stronger instruction. But in order to accomplish this task, the concept of the middle school had to be revisited, or simply scrapped. Teachers who were strong believers in the middle school concept were distressed, to say the least. Some of the major components of the middle school concept were team teaching and integrated curriculum. Students learned subject matter in real-life settings, not compartmentalized subject instruction (Schurr, Thomason, and Thompson, 1996; Stevenson, 2002; Roberts and Kellough, 2004). And middle school educators saw that it was working. With the fruition of Adequate Yearly Progress, there has been a shift from the Middle school concept of instruction to that of the original Junior High—or little High School. Team teaching has all but gone by the wayside with each teacher focused on his or her core subject with the major intent of exposing each student to enough information to get each child to pass the state mandated test that tracks AYP. The child as a person has been pushed to the edge of the middle school instruction. Sadly, administrators who have not understood or simply didn‘t care for the middle school concept of instruction, among other reasons, started a revolution of change in the middle grades. In order to have teaming, teams needed planning time together. With time-on-task as the banner for change and the need to Pass the Test, teams started to find out not every planning period was scheduled at the same time as team members. There has also been a move back to Junior High days of departmentalized instruction in 50 to 55 minutes sections. Student needs and pressures that are intertwined with their learning are being set aside for the benefit of passing The Test. It appears sad, or melancholy, that the very ones the community turns to, to administer the necessary learning principles and guidelines for the best learning situation of their children, when those very administrators are more comfortable going back to Jr. High ways that have been discarded long ago in favor of Best Practices.
BREAKING DOWN BARRIERS
Administrators and central office personnel seem to be diverted in their thinking of what is best for students and what are practices that benefit students the most. These administrators seem to simply want the best scores on The Test, trading quality learning and documented best practices in the middle grades for a short-term goal. And again, as for the past seven years, in one form or another, we ask, ―Does passing The Test indicate the intelligence students have acquired?‖ Faced with threats of losing their careers, teachers are buying into the concept that ‗drill and kill‘ really works. Even though, time and time again, research shows that simply doing worksheets does not connect to long-term memory (Loundsbury, 1992, Williams, 1996). It is almost as though teachers are thinking it is not worth the effort to dig into research to find the best practices for middle school students and memory retention. Yet, as deadlines draw closer, more and more classrooms turn to the old ways in the hopes of gaining ground. What is the old adage of insanity…When you keep doing the same thing you

William C. Root
202
have always done and expect different results? Is it a wonder, then that students have become disheartened with education and are no longer motivated to ‗perform.‘ The joy of learning is stifled or even killed by present-day ‗middle grades‘ actions.
PROPOSAL
This paper will be looking at a perceived flawed middle school concept versus what really works in teaching students (Goals 2000, 1994). There are four questions we need to look at when addressing this problem:
1. Are ALL students college material? 2. Will high test scores produce quality citizens? 3. Are we failing to meet the needs of the very students we are trying to get to succeed? 4. Why do we want to burden the already full social services departments with drop-outs?
All students are not college-bound material. Without a doubt, the public ought to insist on more from public schools than to educate children to be talented in reading and mathematics. United States public schools were established for moral and social reasons as well as for academic instruction. Institutions of higher education are geared for the upper ability levels of society (Noddings, 2006). High test scores will not produce high quality citizens. Strong families perform much more than nourish and provide clothes for their offspring. Similarly, schools have got to be anxious about the whole development of students. Common sense and history have enlightened America to the fact that a democratic society expects graduates who exhibit a solid disposition, have a social conscience and using critical thinking, are willing to commitment to responsibilities, and are attentive to global problems (Noddings, 2006; Soder, Goodlad, & McMannon, 2001). We are failing to meet the needs of the very students we are trying to get to succeed. Remedial classes were formed for students who failed to achieve in reading and mathematics. This practice of mounting the number of instructional hours spent in remediation, at the expense of electives or other core classes. Slavin‘s review of the literature on remedial classes in middle school found a zero effect size for academic gains. There is no persuasive research support that student learning has augmented in any noteworthy way through the use of remediation (Cavanaugh, 2006; Frey & Fisher, 2008; Nichols & Berliner, 2008). We are burdening society with an increase in drop-outs. There is an abundance of documentation showing that the largely negative effects of meeting AYP are all-encompassing and a reason for concern with student drop-out rates. High-stakes testing encourages teachers to view students not in terms of their potential, or what unique or new qualities they bring to the learning environment, but rather as test-score increasers or suppressors. Students quickly pick this up and realize they are defined as winners or losers on the basis of their test scores (Jones, Jones & Hargrove, 2003; Nichols & Berliner, 2008; Orfield & Kornhaber, 2001). Are we really giving our middle schoolers the best education possible, or are we just trying to pass the test?
CONCLUSION
In order to accomplish true educational reform, middle grades campuses need to address their priorities, whether those priorities are test scores, or the needs of the adolescent as a whole person. These two priorities need not be polar opposites. We, the educational community, can resurrect the original intent of the middle grades concept and address the needs of the whole child in a learning environment. We can create the critical thinkers that each state‘s standards address through the proper use of the middle school concept. And, with the proper training, or re-training in the use of the middle school concept, critical thinking will abound and the ―trickle down‖ theory will move to education and test scores will increase.
REFERENCES
A Nation At Risk. (1983). Archived findings. Retrieved 9/12/2005, from http://www.ed.gov/pubs/NatAtRisk/findings.html Beane, J. (2001). Introduction: Reform and reinvention. In T. Dickinson (Ed.), Reinventing the middle school. xiii-xxii. New
York: Routledge. Cavanaugh, S. (2006, June 14). Students double-dosing on reading and math: Schools aim to improve state test scores—and
satisfy federal education laws. Education Week. Retrieved September 3, 2006 from http://www.all4ed.org/press/EdWeek_ 061406_StudentsDoubleDosingReadingMath.pdf
Clark, S. N., & Clark, D. C. (1994). Restructuring the middle level school. Albany, N.Y.: State University of New York Press.

The Vanishing Middle School
203
Erb, T., ed. (2005). This we believe in action: Implementing successful middle level schools. Westerville, OH: National Middle School Association.
Frey, N., & Fisher, D. (2008). The under-appreciated role of humiliation in the middle school. Middle School Journal. (39(3) 4-12.
Goals 2000: Educate America Act (1994). The Clinton administration educaton program. Retrieved November 8, 2005, from: http://www.ed.gov/legislature/GOAL2000/TheAct/index.html
Hechinger, F. (1993). Schools for teenagers: A Historic dilemma. Teachers College Record, 94(3), 522-539. Jackson, A., and Davis, G. (2000). Turning points 2000: Educating adolescents in the 21st century. NY: Teachers College
Press. Lewis, A. C. (1993). Changing the odds: Middle school reform in progress: 1991-1993. New York: The Edna McConnell Clark
Foundation. Lounsbury, J. H. (1992). Perspectives on the middle school movement. In J.L. Irvin (Ed.), Transforming middle level
education: Perspectives and possibilities. (pp.3-15). Needham Heights, MA: Allyn and Bacon. McKay, J. A. (1995). Schools in the middle: Developing a middle-level orientation. The practicing administrator‘s leadership
series. Thousand Oaks, CA: Corwin Press, Inc. Messick, R., and Reynolds, K. (1992). Middle level curriculum in action. NY: Longman. Nichols, S. L., & Berliner, D. C. (2008). Testing the job out of learning. Educational Leadership 65(6) 14-18. Noddings, N. (2006). What does it mean to educate the whole child? The Best of Educational Leadership, 2005-2006. 2-6. Roberts, P., and Kellough, R. (2004) A guide fro developing interdisciplinary thematic units. Upper Saddle River, NJ: Pearson
Merrill Prentice Hall Schurr, S., Thomason, J, and Thompson, M. (1996). Teaching at the middle level: A professional‘s handbook. Lexington, MA:
Heath and Company. Stevenson, C. (2002). Teaching ten to fourteen year olds. Boston, MA: Allyn and Bacon. This we believe: Successful schools for young adolescents. (2003). Westerville, OH: National Middle School Association. U.S. Department of Education (1997). Elementary and secondary education act (ESEA) as amended by improving America‘s
schools act of 1994 (IASA): Guidance for title VI of the ESEA innovative education program strategies. Retrieved September 12, 2005, from http://www.ed.gov/pubs/Final/title.html
Wiles, J., and Bondi, J. (2001). The new American middle school: Educating preadolescents in an era of change. Upper Saddle River, NJ: Merril Prentice Hall.
Williams, B. (1996). Closing the achievement gap. Alexandria, VA: Association for Supervision and Curriculum Development

F. E. Anyachebelu, Ada Anyamene and Ladep Timku
204
IMPEDIMENTS TO CHILD’S RIGHT TO EDUCATION IN NIGERIA: IMPLICATIONS FOR CHILD DEVELOPMENT
F. E. Anyachebelu1, Ada Anyamene2 and Ladep Timku3 Nnamdi Azikiwe University1,2 and University of Jos3
ABSTRACT
The educational development of children should be one of utmost concern and should receive priority place in the strategic
policy plan of every country. This is so because good governance with workable educational policies; would prepare the child
for full realization and actualization of his potentials. It would also guarantee the future of the country concerned and there is
no better way to achieve these than to educate the child. The study investigated impediments to child‘s right to education. The design of the study was survey and the area of the study was the south east of Nigeria .All the teachers in the public primary
schools constituted the population. Simple random sampling technique was used to select a sample of two thousand teachers
(850 males and 1150 females).Two research questions and one null hypothesis guided the study. A reliability coefficient value
of 0.82 was established using Pearson Product Moment Correlation Coefficient Mean values were used to analyze the
research questions while t-test was used to test the hypothesis. Findings of the study revealed that factors such as no clear
framework for delivery of education, frequent policy changes, poor funding and lack of clarity of the roles of the many
agencies in the Ministry of Education impede the child‘s right to education.. Based on the findings, the researchers recommended amongst others that government should make education a top priority in the budget, define the roles of the
many agencies in the Ministry of Education and come up with workable and result –oriented policies. The implications were
highlighted
Keywords: Impediments, Child, Right, Education, Development
INTRODUCTION
The bulk of the basic human rights in Nigeria are on existence and preservation of life. All other rights address the quality of life; the child‘s right falls into this second category. Even so, it is somewhat special because the denial of the child‘s right to education may lead to permanent impairment of the individual and cause serious problem to the corporate entity ( Maduewesi, 2005).That is why the child‘s right to education should be handled with utmost sensitivity and seriousness ( Ekeh, 2004 ). Every Nigerian child has a right to education. Many important documents authenticate this right. The Nigerian child‘s right to education is enshrined in the Nigerian constitution (1999), the United Nations Convention on the Rights of the child, Organization of African Unity Charter on the Rights and welfare of the child and the Education Laws for the welfare of the child; and the Education Laws of the various states of the federation. The Nigerian government has not only signed the UN Convention of the Rights of the child and the OAU Charter but has also enacted the Child‘s Bill of Rights. According to the OAU Charter, a child is a human being up to the age of 18. In formal education term, therefore, a child is someone whose age falls within the pre-school, primary and secondary levels of education. The National Policy on Education (2004) spells out in detail the content and implementation strategies for those levels of education. The OAU Charter, sub-sections of article 11 states the child‘s right to education as follows: 1. Every child shall have the right to education 2. The education of the child shall be directed to:
a. The promotion and development of the child‘s personality, talents, mental and physical abilities to their fullest potential.
b. The preparation of the child for the responsible life in a free society, in the spirit of understanding, tolerance, dialogue ,mutual respect and friendship among all people , ethnic, tribal and religious groups.
c. The development of respect for the environment and natural resources. 3. State to the present charter shall take all appropriate measures with a view to achieving

Impediments to Child‘s Right to Education in Nigeria: Implications for Child Development
205
The full realization of this right and shall in particular:
a. Provide free and compulsory basic education; b. Encourage the development of secondary education in its different forms and to progressively make it free and
accessible to all; c. Take measures to encourage regular attendance to schools and the reduction of drop-outs, d. Take special measures to ensure that children from disadvantaged groups of communities have equal access to
education. e. State parties to the present charter shall take all appropriate measures to ensure that a child who is subject to school
or parental discipline shall be treated with humanity and with respect for the inherent dignity of the child and in conformity with the present charter.
f. State parties to the present charter shall take all appropriate measures to ensure that children who become mothers before completing their education shall have opportunity to continue with their education on the basis of their individual ability.
These provisions deal with the issues of access and development of the child‘s potential. The document points out a double way attack on school enrolment. States are to ensure that places are provided for teaching and learning, ensure regular attendance of children to school and reduction in school drop outs. The Educational Objectives in the Nigerian Constitution
1999 section 18 states:
1. Government shall direct its policy towards ensuring that there are equal and adequate educational opportunities at all
levels. 2. Government shall strive to eradicate illiteracy ; and to this end, government shall as and when practicable provide
a. Free compulsory and universal education b. Free secondary education c. Free university education; and free adult literacy programme.
Succinctly put, these stipulations mean that: Education is the legal right of every child, this therefore goes to say that government and parents have certain obligations to ensure the appropriate education for children .Ukeje (1993), explaining this point opines that education should be free at primary and junior secondary school levels. Ukeje added that the stipulation about equal opportunity should apply not to enrolment but the type of public education that is made accessible to all children especially when taken in conjunction with the right of freedom from discrimination. Furthering his explanation, Ukeje emphasizes that the quota system should be operated in such a way that the attempt to include a certain class of children, does not lead to the exclusion of others. Ukeje believes that the child is entitled to quality education which develops his abilities to optimal potentials. According to Ekeh (2001), these stipulations have been operative for some time though not satisfactory. This statement suggests that the education of the child is operational in Nigeria but not according to stipulations. This therefore is a problem for the child. Nigeria as a developing nation is faced with many problems ranging from political instability; which nips the full execution of policies at the bud, to lack of proper governance which to a great extent does not help matters at all. In situations like this the growing child is one of the citizenry who is vulnerable to bearing the brunt. This is so because rights due to him are often ignored and the child is faced with a gloomy future which in the long run affects the development of the country. Worthy of note is the fact that countries where the rights of children to education are eroded may not have directed their minds to the fact that they are playing with their future. It therefore becomes crucial and pertinent to investigate the non-satisfactory execution of the stipulations for the educational rights of the child with a view to suggesting ways of ensuring its full actualization for the benefit of the Nigerian child and Nigeria as a nation.
PURPOSE OF THE STUDY
The purpose of this study is to find out the impediments to child‘s rights to education in Nigeria, recommend ameliorating solutions and highlight the implications.
SIGNIFICANCE OF THE STUDY
The findings of the study will be significant to the government of Nigeria. The ministry of education will come to appreciate the areas they are not living up to expectation in the delivery of education to the child. They will come to terms with the fact that the present age is on the move technologically and information conscious; therefore the Nigerian child cannot afford to be left behind to their own detriment and the Nigerian nation at large. Parents will come to the know of issues impeding their children‘s opportunity to smooth and hitch- free education. Those of them in the corridors of power or holding positions in

F. E. Anyachebelu, Ada Anyamene and Ladep Timku
206
government can pressurize the government to be alive to her responsibility to make quality education for the Nigerian child tenable.
RESEARCH QUESTIONS
The following research questions guided the study 1. What are the impediments to child‘s rights to education? 2. What are male and female teachers‘ perceptions of the impediments to the child‘s rights to education?
NULL HYPOTHESIS
One null hypothesis formulated at 0.05 level of significance perceptions of male and female teachers on the impediments to child‘s rights to education will have no significant difference.
METHODOLOGY
The research design was survey. The area of the study was south east of Nigeria. The south east of Nigeria is made up of five states namely Anambra, Enugu, Abia, Ebonyi and Imo states. All the primary school teachers constituted the population for the study. Proportionate random sampling technique was used to select twenty schools from each state, bringing the total number of schools used for the study to one hundred. Simple random sampling technique was used to select twenty teachers from each school, bringing the total sample size for each state to four hundred teachers. The total sample size for the study was therefore two thousand (1150 females and 850 males) primary school teachers. The 20-item researchers-developed instrument used for the study was a questionnaire designed in four point rating scales of Strongly Agree (4points), Agree (3points), Disagree (2points) and Strongly Disagree (1point). The instrument titled Impediments to Child‘s Right to Education (ICRE) was validated by experts in educational psychology and measurement and evaluation. Pearson Product Moment Correlation Coefficient was used to establish the reliability which was 0.82. The instrument was accepted because of its high value. Five trained research assistants were used to collect data in each state. Mean values were used to analyze the research questions while t-test statistics was used to test the hypothesis. Mean values of 2.50 and above were accepted while mean values below 2.50 were rejected.
RESULTS
The results are presented in the order of the research questions
Table 1: Research Question 1 - Teachers‘ mean responses on the impediments to child‘s right to education
S/N ITEMS X DECISION
1. Drop out rate is high 2.6 Accepted
2. Schools are over-populated 3.0 Accepted
3. Cost of education is not free 3.1 Accepted
4. Poor policy framework 3.1 Accepted
5. Education is not a priority 3.0 Accepted
6. Inadequate staffing 3.0 Accepted
7. Unreliable statistical data 3.2 Accepted
8. Lack of adequate formal legislation 3.3 Accepted
9. Inadequate mode of regulation of education Policies 3.1 Accepted
10. Poor management of resources 3.0 Accepted
11. Inadequate funding 3.3 Accepted
12. Lack of clarity of the roles of the many Agencies in the federal ministry of education 3.2 Accepted
13. Lack of clear framework for the delivery of Education 3.0 Accepted
14. Non- provision of instructional materials by the government 3.4 Rejected
15. Lack of proper framework for planning 3.9 Accepted
16. Poor infrastructure 3.8 Accepted
17. Poor private sector integration 3.8 Accepted
18. Poor quality staff 3.4 Rejected
19. Frequent policy changes 3.1 Accepted
20. Political instability and attendant problems 3.7 Accepted

Impediments to Child‘s Right to Education in Nigeria: Implications for Child Development
207
Table 1 above shows that teachers do not consider non- provision of instructional materials by the government and poor quality staff impediments to child‘s right to education .These are IS/N 14 and 18. They scored 2.4 and 2.4 respectively. The rest of the items were considered impediments to child‘s right to education. They all scored mean values above 2.50.
Table 2: Research Question 2 - Male and female teachers‘ mean responses on their perceptions of impediments to child‘s
right to education
S/N ITEMS X DECISION X DECISION
1. N=850 N=1150
2. Drop out rate is high 2.7 Accepted 2.5 Accepted
3. Schools are over-populated 2.9 Accepted 2.7 Accepted
4. Cost of education is not free 3.4 Accepted 32 Accepted
5. Poor policy framework 2.9 Accepted 2.7 Accepted
6. Education is not a priority 2.9 Accepted 3.1 Accepted
7. Inadequate staffing 2.8 Accepted 2.7 Accepted
8. Unreliable statistical data 2.9 Accepted 2.9 Accepted
9. Lack of adequate formal legislation 2.7 Accepted 2.9 Accepted
10. Poor execution of regulation of educational policies 2.7 Accepted 2.8 Accepted
11. Poor management of resources 3.0 Accepted 3.1 Accepted
12. Inadequate funding 2.8 Accepted 3.0 Accepted
13. Lack of clarity of the roles of the many agencies in the ministry of education 3.1 Accepted 3.0 Accepted
14. Lack of clear framework for the delivery of Education 2.9 Accepted 2.8 Accepted
15. Non- provision of instructional materials by the government 2.2 Rejected 2.3 Rejected
16. Lack of planning 2.6 Accepted 2.8 Accepted
17. Poor infrastructure 2.7 Accepted 3.1 Accepted
18. Poor private sector integration 2.7 Accepted 3.0 Accepted
19. Poor quality staff 2.1 Rejected 2.0 Rejected
20. Frequent policy changes 2.8 Accepted 3.2 Accepted
21. Political instability and attendant problems 3.1 Accepted 3.3 Accepted
Table 2 above shows that both male and female teachers do not perceive non-provision of instructional materials by the government and poor quality staff impediments to child‘s right to education. These items are IS/N 14 and 18.IS/N 14 scored 2.2 for males and 2.3 for females while IS/N 18 scored 2.1 for males and 2.0 for females respectively. The rest of the items are perceived impediments to child‘s right to education.
HYPOTHESIS:
Table 3: t-test comparison of the responses of male and female teachers on their perceptions of impediments to child‘s
right to education
Respondents N X SD DF T-Cal. T-Crit. Decision
Male 850 54.9 49.2
1198 1.66 1.76 Accepted
Female 1150 56.2 59.5
Table 3 above shows that there is no significant difference between male and female perceptions on impediments to child‘s right to education, the t-critical is greater than t-calculated. The null hypothesis is therefore accepted.
DISCUSSION
The findings of the study from tables one and two above show that there are issues which are impediments to child‘s right to education. These findings are in consonance to the findings of (Anowoor, 2006; Ekeh, 2004; Oraifo, 2006 and Okeke, 2005).Nothing should impede a child‘s right and access to education in a country that means well for her future. The null hypothesis was accepted. These findings are unfortunate and revealing. Further investigations on these issues revealed that Nigeria‘s current policy environment presents huge challenges to EFA (Education for All by the year 2015), and her presidential system of government has created a plethora of challenges in providing a clear framework for the delivery of

F. E. Anyachebelu, Ada Anyamene and Ladep Timku
208
education (Okeke, 2005). The federal ministry of education presides over the largest number of agencies in any ministry(Abani,2003).This has resulted in a large number of institutions at different levels with often conflicting and duplicating mandates without any synergy between them. A complex constitutional context, power sharing, and responsibility for the delivery of education between federal, state and local governments compounds the confusion which is also exacerbated by a revenue allocation formula and resource control approach that does not support and enhance coordination. The 1999 constitution makes mention of some of the issues but much remains to be clarified in terms of management, funding and policy. The lack of adequate formal legislation and regulation of these issues are sources of conflict once they are translated into the operational arena. Critical issues have remained unresolved (Abani, 2003), and the right to education for all 2015 remains elusive. One of the critical issues affecting the quality of data relates to the political attachment to which data have been subjected to over the years. Most states and local governments have multiple versions of data and decide which to present depending on their perceptions of its use. The existence of multiple data makes it unreliable and complicates the problem. Research evidence shows that the numbers of Nigerian children who are not enrolled in school are on the increase (UNDP, 2005). The development of the Nigerian child is very important and the only avenue through which it can be achieved is education. Without education and a sound one too for the child, the nation is in jeopardy. Equipping the child adequately educationally means raising able hands that can take-over the affairs of the nation and sustain the efforts of their predecessors given acquisition of knowledge and skills.
IMPLICATIONS OF THE STUDY
The findings of the study imply that the Nigerian child‘s right to education is being eroded; Nigeria is yet to recognize the need and realize the necessity of making education accessible to all children.
RECOMMENDATIONS
The federal government should give education priority place in the budget. This is very important because without imparting knowledge and skills in the up-coming citizens of a country, they can never develop themselves and their nation at large. The federal government should define the roles of the different agencies in the ministry of education. This will streamline the duty of each agency and bring to an end the conflicts that often occur in the execution of mandates which sometimes result in abandonment of projects or double expenditure for one project though registered under different sub-headings .Adequate planning and implementation strategies should be consolidated before executing a policy. This measure will ensure hitch-free implementation of educational policies. The federal government should carry out awareness campaign on the need for accurate statistical data to assist government in allocation of resources. A record of this type will give government insight into the number of pupils in enrollment, number of schools in existent and status of the available infrastructure. Information of this nature will facilitate planning, funding and ensure education-for-all at no cost or affordable cost even for the lowest income earning family.
CONCLUSION
The rights of the child as it concerns education are one that should receive utmost concern from any well meaning government. Because the future of any country rests on the younger generation to whom the nation owes it as a responsibility to equip them with all the knowledge and skills education can afford; for a better tomorrow for themselves and their country.
REFERENCES
Abani, C. (2003). Progress towards achieving education for all in Nigeria. WHO Monitoring Report. Anowoor, O. O. (2006). Plannings and implementation of educational policies in Nigeria at the pre-primary level A lead paper
presented at the National Conference of the Faculty of Education, Nnamdi Azikiwe University Awka. Ekeh, E. (2001). Teacher education in the 21st century Nigeria. Pre-Convocation Lecture of federal College of Education,
Ehamufu. Ekeh, E. (2004). Actualizing the Nigerian child‘s right to education in the 21st Century. Enugu: EL DEMAK Publishers. FRN (1999). Constitution of the Federal Republic of Nigeria. FRN (2004). National Policy on Education. Lagos: NERDC Press Maduewesi, E. J. (2005). Emergent curriculum: how are the teachers coping? Benchmarks and global trends in education.
Benin City: Dasylva Influence Enterprises. Okeke, E. A. C. (2005).Funding of education in Nigeria: Realities and strategies for improvement. A paper presented at the
annual lecture of the Faculty of Education, Nnamdi Azikiwe University, and Awka. Okeke, J.T. (2005).Policies in Nigerian education .Lagos: Deck Publishers

Impediments to Child‘s Right to Education in Nigeria: Implications for Child Development
209
Oraifo, S. O. (2005). Planning and implementation of policies in Nigeria Education: Issues, problems and prospects. Benin City: Dasylva
Ukeje, B. O. (1993). Education and the law in Nigeria. Nigeria Academy of Education 1993 Year Book. UNDP (2005). Achieving the Millennium Development Goals. London: Earthscan.

Smaragda Papadopoulou
210
ORAL LANGUAGE ACQUISITION WITH CHILDREN HAVING LANGUAGE DIFFICULTIES IN LEARNING GREEK AS A SECOND LANGUAGE: THE USES OF
CREATIVE TEACHING STRATEGIES IN MULTICULTURAL SETTINGS.
Smaragda Papadopoulou University of Ioannina
ABSTRACT
An example of teaching Greek as a second language is studied in a research with children that learn to speak Greek.
Activities which were tested in our research involved traditional folktales from the children‘s mother tongue, pictures, shared
reading and role play, empirical talking/portraits about persons they know from their mother country, monuments or nature
scenes of their countries. Creative storytelling was taught in a specific area of the Greek curriculum called the ―Flexible Zone‖, which involves innovative projects in class. In our research children came close to different oral language settings by using
their imagination and their language acquisition was measured with pretest and posttest. This sample was compared with
language acquisition of another multicultural class at the same school and at the same age level of other children, which used
traditional methods of teaching language in accordance with grammar rules of the Greek language, syntactic rules and
memorization of words. The results showed that the group that used visualization, personal storytelling and creative strategies
in class and teach language managed to have less errors in the use of the second language, to use a richer vocabulary and
they are more eager to speak in the second language.
Keywords: Storytelling, Learning a Second Language, Oral Language, Narration, Creativity, Visualization.
INTRODUCTION
Narration is an integral part of human existence. Occasionally, we use expressions in every day language such as ―tell me your story‖ when we rather mean ―tell me the facts in your opinion ‖or elsewhere we say the words ‖the book of my life‖, as if our whole life is a story written in a book, or narrated as a story. These expressions are common in the Greek language, also. Children‘s imitation play and daydreaming as storytelling proves that there is a narrative form in human thought from the very early years of a child. Moreover, a lot of jobs involve versions of storytelling and whenever narration is successful the person has quite important incomes from the job. Lowers and policemen listen to a testimony, a witness or sworn depositions in order to make sense about whose story is true. Teachers use narration to provide knowledge to their class. Priests as confessors listen to people telling stories during confessions. At this case we can consider different versions of narration of journalists and presenters during the TV news. In the medical science research on ―dysnarrativia‖ from Neurologists and psychologists has provided evidence of internal narrative as a primary factor in constructing and maintaining a self-in-time and a socially viable identity. The term ‗dysnarrativia‘ describes the documented inability to construct self-narrative by those suffering amnesia, autism, severe child abuse or brain damage. Narrative and identity disorders seem to be correlated, (Eakin).14 Doctors who worked on the clinical course of their patients without respect of patients‘ case-history and their ―storytelling‖ on how they got sick, lost more patients and failed to attain a speedy recovery15. At the third chapter of his book on narratives16, Jerome Bruner, (2003), suggests that story creations make the unexpected less unexpected, less weird, they tame, and they civilize in a sense of regularity. As we already mentioned about narration as the inevitable limit of human life, there are many intellectuals such as Aristotle, Barthes, and others who recognized the importance of narrative in human thought. Cases of patients with syndromes such as Alzheimer or Korsakov have proved the relation between narration and capacity of self orientation and personality of people. Persons that lost the language capability of narration lost the sense of identity of themselves17.
14 Eakin, Paul, John, 1999, How Our Lives Become Stories, Making Selves, Ithaca, N.Y.: Cornell University Press, p. 128. 15 Columbia University, New York: Medical school of Pathology: Program on narratives and case history. In this experimental study, there were some doctors who stayed
close to the incident without taking into account the personal stories (case-history) of the patients. This involved loss of evidence about the therapeutic procedure they should follow.
16 Bruner,J., 2003, Making Stories:Law,Literature,Life. Harvard University Press. 17 Young,K.&Salver, J.L., 2001, The Neurology of Narrative, University of Wisconsin Press.

Oral Language Acquisition with Children Having Language Difficulties in Learning Greek as a Second Language the Uses of Creative Teaching Strategies in Multicultural Settings.
211
Memory and imagination are interrelated in the narrative form. Capability to speak about things which are not present, to reflect the action of human beings and change ourselves inside every change in the plot of the story is studied in different sciences, other than medicals. There is a typical example of Vygotsky with his student Luria, which is important to note about the expression of this internalization at the description of the way we get involved in narrative styles. The introduction of engines in simple village people‘s life in Kazakhstan at the first years of the Russian Revolution changed the opinion of these people about the nature and their beliefs about what makes the clouds move, the whole idea about themselves and who they are. Shirley Brice Heath in her study on the social role of narration in an anthropological research compared Negro children of low social class to white children of middle social class living in a city close to this geographical region. Negro children were encouraged to use their imagination in every day storytelling and common narrations and they improved in this genre of the imaginative. They used articulated expressions and visualization in events of their life that they narrated to the family members or friends.18 This didn‘t happen to the children of white-middle social class children that were encouraged to keep their narration close to the facts without any imaginative details. When interchange systems (Levi-Strauss)19 and serious symbolic games and rituals fail (Geertz), we invent myths, laws and tales or gossips to face the ―unexpected‖ of Bruner‘s theory about stories, as we already mentioned. Stories provide meaning of life in alternative worlds, a chance to capture a new point of view for the real world. Studies on the chimpanzees reveal that narration is rather a human trait. Chimpanzees do not show interest in repetition of stories, but human beings do20. Linguists study narration in terms of a narrative grammar and levels of narration, such as: Who did something, to whom, in what environment, through which specific actions.
NARRATION OF FOLKTALES
Theoretical Perspective, Criteria and Procedure of Our Study
Κieran Egan (1988a) studied the typical reflections of children‘s involvement with stories that heard (riming, repetition of words etc.) He compared this reflection to methods that storytellers use in oral folktales of oral cultural communities and the language of poets and storytellers. He found a lot of similarities between children‘s narrations and this of traditional storytelling. This is a point that we took into account in planning our study with children and teaching Greek as a second language through imaginative storytelling and visualization. We also were influenced from Gordon Wells who has noted the educational importance of hearing folktales in a research with children in Bristol. As he concluded in this research this language activity can increase children‘s capacity in writing and oral language acquisition. Listening of myths, as he noted, may enrich children‘s empirical perception of meanings, (1987,p.200). According to M.A.K.Halliday all versions of linguistic uses are fulfilled in children‘s attempt to learn in meaning making (1973,p. 24). Carol Fox (1992) and Dorothy White (1954) also declared the emphasis that we need to give in the educational role of children‘s literature. They mentioned in their studies how students improve in reading in cases that narration of stories is used as a teaching method, since they develop rhythm, vocabulary, complicated syntax, narrative genres in the structure of the language they use. (Vivian Gussin Paley, 1993, Fox, 1993, Myra Bars (1992), Margaret Meek (1988). Consequently, we can assume that educational value of imaginative storytelling and story-listening has been noted many years ago. A critical role of pictures as a visual stimulation, in picture - story books can be added to this assumption in relation with the elements that children choose to come up with their inventive stories and narrate them (Meek, 1991, p.116) , (Dorothy White, 1954, p.132). There is a rich bibliography on artistic representation in narration and the story mapping of plot as a capability to describe and use oral language in different situations and language environments. (Barrs, M., 1988a, Bob Barton, 1988, p.9). It is important to mention that the role of emotions, senses and the descriptive language in an imaginative story has been connected with the work of Lev Vygotsky. A lot of contemporary studies (James Britton, 1990, p.6), (F.C. Bartlett, 1932, p. 213), (Fox, 1987, p.215) are influenced from this aspect and can be viewed in a sequence of his perspective on language and thought regarding memory development as a function of the human brain. This information helped us put activities of this kind in our language study.
18 Shirley Brice Heath, 1983, Ways with Words: Language, Life and Work in Communities and Classrooms, Cambridge, U.K.: Cambridge University Press. 19 In the opinion of Levi-Strauss, myths and history are exposures of a culture‘s compromise with the impact of the demands in communal life. 20 Sue Savage-Rumbaygh, J. Murphy, R.A. Sevcick, K.E. Brakke, S.L. Williams & Duana Rumbaugh, (1993) ―Language Comprehension in Ape and Child‖, Monographs of
the Society for Research in Child Development, serial no.233, vol.58, nos.3-4 .

Smaragda Papadopoulou
212
VISUALIZATION
Degenhardt and McKay suggested that visual imagination is important in oral language and thought and they expressed the opinion that the nature and the formation of visual gestures in mind is a rational procedure(1988, p. 242-244). From a different level, that of the professional storytellers the same opinion is noted. (Haggarty, 1944, pp.99-100), (Pomme Clayton, 1988, p.21). Visualization fulfilled a great expectation in cultural history with the changes that television as an invention reached almost every place on earth. This invention was valuable in planning our language activities in terms of using TV screens as a stimulus to imaginary storytelling with children learning Greek as a second language. Visual fantasy and Gnostic development of the children is a two fold notion of the experimental teaching procedure that was held. As Richard Baumann approves, the narration of stories influences the social identity of the persons involved in it. (1986, p.11). Additionally, Claire Woods said, every cultural narration is a web of understanding, traditions, ways of learning, ways we use to speak, ways that each one of us takes with his/her birth and grow with them.(1988, p 139)21. In our study it was important to plan language activities in multicultural settings, since we tried to teach through imaginary procedures children with different cultural needs. It was important to use teaching materials and stories that help children compare themselves with something different from themselves 22
IMAGINATION IN ORAL READING AND NARRATION OF A STORY WITH YOUNGSTERS: THE CULTURAL IMPLEMENTATION
A crucial consideration in teaching is the use of a language full of metaphors, as it appears in traditional storytelling and visualization. Children develop a met agnostic understanding of the narrated story, as many specialists suggest (Fox, 1993, pp. 141-168). Analogies between here and now of a child-narrator or a child – listener and the past which is described at imaginative environment of a classical tale‘s structure can be turn to advantage in teaching a language as a second one, when this language is used in terms of a storytelling time23. Children in an imaginative perspective are storytellers that don‘t care that much about the technique of the narration. They usually repeat words in the same rhythm and they may reveal the end of a story which makes the story less attractive for the listeners. In other cases, they get trapped in the attempt to give details as main elements of a story plot, which, once again, leads to digress from the subject of the plot. This is why we tried to give to the children that participated in our study the guidelines of an imaginative storytelling, which could shape the images of brainstorming at a second level of working on the oral or written language; they used to tell their story. These guidelines were formed in cooperation of the teacher with the students: 1. The story needs a luminous start, something extraordinary and important.
2. The main character of the story has to appear at the beginning of the narration. For example:
Ulysses jumped off the wreck before it sank and now he is lying down on the sand of an unknown island.
3. We give details about how we feel about the heroes, how they may feel, or about their obstacles and huge problems.
4. We keep the main stream in brainstorming including: What happened, who talked, what happened, how it looked like, when and where something is happening.
5. It is important to decide what the story is and to know the story you tell very well. This means a lot of exercising for it.
6. Look at your listeners all the time.
7. If you are working for a presentation: you can use a map or a picture to describe for your theme.
8. All stories have an introduction, a main part and a epilogue, an ending.
21 See also: Jerome Bruner, 1986, pp. 66-67. 22 In: Ellis &Young, 1988, p. 23. 23 Collins, F., 1999, The Use of Traditional Storytelling in Education to the Learning of Literacy Skills, Early Childhood Development and Care, vol.152, pp. 101-105.

Oral Language Acquisition with Children Having Language Difficulties in Learning Greek as a Second Language the Uses of Creative Teaching Strategies in Multicultural Settings.
213
Rules for an oral presentation/narration of the story, (as we gave them for our experimental study and were on boards in class):
1. prepare your material
2. organize your material
3. use the language in a proper way
4. Speak clearly and try to be understood.
5. Try a vivid presentation for everybody in your audience.
6. Look at your listeners, let them add something, or answer their question, but not all the time. If the questions are too many, leave them to answer after ending your talk.
7. Choose interesting subjects not only for you, but for the others, too.
Conversation in class
We gave the listeners a chance to tell something, the atmosphere needs to be positive for everybody in class. This experiment of imaginative storytelling and visualization could be strengthened with debates and the uses of arguments. Persuasion in imaginative settings was also a technique used in class in our study24. Also, we used techniques of ―bibliotherapy‖25 and emotional literacy, in order to help our multicultural class accept the others and improve in terms of building self-esteem. Talking from different points of view, telling the same story from the opposite version of a hero‘s attitude were games we involved in oral reading and talking. Another part of the prerequisite exercises in class before and during our study was the narration for different school subjects, not only in teaching Greek as a second language, but also using the language to tell a story in Science or History lessons, or Geography. It is important to mention that stories that children thought and told in class could be studied as a linguistic material for the variations of cultural identities and oral expression and body language. In other words, we gathered a rich linguistic sample of stories. Narration as a teaching method is an old component of Educative procedures. Teachers are random viewers of themselves of storytellers, though. A lot of a teacher‘s work has to do with narration, as Grant Bage has mentioned in past26 An interesting sequence of our study could be a research on how teachers feel about themselves as storytellers, verbally, visually, physically. Adrian Halliday27 has mentioned the need for social analysis of school reality. Cultural issues of a complicated class, as she suggests demand ethnography of non verbal attitude, planning of curriculum in a wide range of people involved, of materials and tools, meanings of moral thinking, we need to look wider than verbal information of our student. Teaching of language has to be fulfilled in as many ways, as the cultures and the civilizations of our students‘ origin. Narrative study differentiates between three interconnected types of information one might gather from life histories: subject reality (i.e. findings on how ‗things‘ or events were experienced by the respondents), life reality (i.e. findings on how ‗things‘ are or were), and text reality (i.e. ways in which ‗things‘ or events are narrated by the respondents)28 In our study we used kinds of autobiographic narratives since we had to teach in multicultural settings and let the students have a motivation of their personal interests and development.
24 Fox Eades, J. M (2005) Classroom tales, Using Storytelling to Build Emotional,Social and Academic Skills Across the Primary Curriculum,Jessica Kingsley Publishers . 25 Papadopoulou, Sm.( 2004). The Emotional Language, Athens, Greek Ltd:Typothito- Dardanos. 26 Bage,Gr.(2000). Tales for the Millennial Teaching, Education, 3-13 March 2000. 27 Halliday ,A., 1996 Developing Sociological Imagination:Expanding Ethnography in International English language Education, Applied Linguistics, 17(2) : 234-255 28 Denzin 1989, Nekvapil 2003. see in: B. Benwell &E.Stokoe,2006, Discourse and Identity, Edinburgh, Edinburgh University Press.

Smaragda Papadopoulou
214
THE STUDY
Research Methodology
In our research we used qualitative and quantitative methods. Since we have educational and linguistic research our direction was to provide useful and dependable knowledge through which the process of learning can be more effective. A curriculum project with an innovative design was planned in terms of an action research, to be used with the method of pretest and posttest. We used observation and interview methods, too. Interview is particularly helpful in securing data from children. In addition, teaching of a six months trial of the program with creative strategies in Greek language and evaluation of control group was compared to that of the experimental group: it was important to measure number of errors and to evaluate the data in language development of the experimental group of students. Oral language, plurality, mistakes in using Greek as a second language, understanding and vocabulary were criteria to evaluate poor readers and speakers with difficulties in the second language. Analysis of children‘s language was conducted. Reversals of words, syntactical errors, reinforcement of visual memory approaches were included in the quantitative evaluation. A research questionnaire, as a data collection technique was employed to secure factual information opinions and attitudes that the participants wanted to approve in changing learning attitudes. Children‘s logs were a free qualitative strategy in our research methodology as a kind of self-evaluation from the participants.
Participants
Our case study involved twelve students of the Greek language in the experimental group. Most of them had arrived in Greece in the last five years. They follow the program of elementary public Greek schools in a small city of north-west Greece. In Greece the program of studies in special needs provides classes for students with special language difficulties in parallel with the ordinary schedule. The students with problems in language could participate for two hours every day in a program of teaching Greek as a foreign language with creative storytelling and imagination in language activities. We planned to teach from this perspective the language and have a control group of 14 students at the same age and the same geographical region and age, instead of the experimental group. The control group used the ordinary schedule of language learning in introductory classes at public Greek schools. We worked with these groups (experimental and control), for two semesters, six months for both of them. The age of the people participated in both groups was the same, that of fifth grade, approximately, eleven years old.
AIM OF STUDY-PLANNING
The aim of our study was two fold: 1) To examine the effectiveness of creative storytelling and imaginative language in language acquisition of children speaking the Greek as a second language 1) To help children with learning difficulties in language acquisition to overcome racial obstacles, negative attitudes and the
fear of the different or the new strategy in class; and
2) To develop a program of oral reading and storytelling of fables and folk tales in a communicative method regarding cultural diversity of linguistic components. Especially:
a. Creative learning to speak in Greek through imaginative storytelling
b. Creation of images to describe and include in children‘s stories which will be read or written to share in class and discuss as a group-activity.
To be more specific we gave a lot of information to these students about idiomatic and metaphorical language, which is common in Greek everyday language and a foreign student would rather have a tension not to implement in meaningful sentences. (For example: he has brain no pip: to mean that he is foolish. They shake hands: to mean that they became friends and agreed. They found them, they agreed again. He made my heart garden: to mean ―that‘s cold comfort‖, that someone made me sad etc.) We also used a class that the same teacher had the previous year so as we make sure that we know the children‘s language habits, their interests, and their social life and language capacities. We also asked the teacher to keep a reflective journal on children‘s attitude about the new language activities and creative storytelling program.

Oral Language Acquisition with Children Having Language Difficulties in Learning Greek as a Second Language the Uses of Creative Teaching Strategies in Multicultural Settings.
215
Design
Pretest and posttest also took place in order to have accurate measurements of results. Observation and interview with the experimental group was used in order to have more quality information about their language development. To plan our activities, we took into account mistakes they already did at the beginning of the study when they talk, read and write in Greek. We checked the listening conversation with a set of questions about simple stories they listened in the second language. Criteria we measured were: rhythm and speed in reading, speaking meaningfully (number of errors), length of sentences, vocabulary and uses of difficult words at the right sequence. In these six months during the year 2008-2009 we examined the effectiveness of speech in narration and especially, during the first term (three months of the experimental study on imaginative and creative storytelling. Phase 1
FIRST THREE MONTHS: Students try to tell personal stories from their country, a special incident in their life, family stories, and traditional tales from the country that they come from. Sometimes they choose to tell stories that their parents heard from their parents. They try in using imagination and describe new pictures for old tales and change plot or make their own stories to share in class (real and imaginative). Phase 2
SECOND THREE MONTHS: Students use and come closer to narrative language, descriptive language visualization and idioms as metaphors in speaking, everyday idioms
RESULTS AND DISCUSSION
Data Analysis-Statistical Methods
Reading and speech fluency in total errors was calculated. A 2X3 analysis of variance with repeated measurements (ANOVA) was conducted to evaluate the effects of the creative program in teaching Greek as a second language with children having difficulties because they are not native speakers. Improvement in speaking and creating stories from the beginning of the year and after six months gave evidence of linguistic development.
Measurement before the experiment: 50.417
Measurement after the experiment: 74.167 (the highest was 90)
Standard deviation: 13.042 and 6337.
Mean Increase: 23.75 (68%).
From 12 students of Greek language as a second language, the percentage of record in expression increased to 57%-80%. For two of these students it increased to 90%-96%. The difference of the two measurements before and after the experimental teaching was extraordinary significant ( 7.526 as t-value : df=11, p=.001).
Table 1: Descriptive Statistics and Paired T-Test of Pretest and Posttest Scores
Measurement before imaginative storytelling program in Greek language
Measurement after imaginative storytelling program in Greek language
Improvement p
Mean score 50.417 74167 23.75 (68%) .0001
Standard deviation 13.042 6337
Df=11 t-value=7.526 (noticeable difference) Improvement was noticed in meaningful reading, oral language (speech without mistakes), capability of listening the Greek language and communication in Greek within the group.

Smaragda Papadopoulou
216
The students approved that imaginative storytelling helped them understand their surrounding when Greek is the language of communication and in several environments such as home, school, playground, companion) They also noted that they built a better self esteem as speakers of the second language. The writing of the children involved in the experimental group was remarkably improved, too. Shared reading and reading in pairs were among their favourite procedures in learning the foreign language. They preferred teacher‘s language games in met agnostic activities, and corrections of their speech. These kinds of activities as a sequence of a storytelling were embodied into a special teaching time called the ―eligible zone‖. ―Eligible zone‖ is a creative time at Greek school curriculum, when children work on creative projects. Sample: Activities of the program
Describe the life of a person that lived and worked in your mother- country and has a remarkable value for you. It could be recreation of incidents you know from different persons, so as you make your own story. It can be a person that doesn‘t exist, but you would like to bring into life. It can also be a person famous in your neighborhood, or your place of birth. Tell a story from the Rhapsodies of Odyssey and a favourite story from Herodotus‘s history. Tell a story that happened to you even here or at your place of birth, something you will never forget. Tell a traditional story of your country or a fairytale your mother has told you when you were very young. Tell a story you really enjoyed when you first heard it and you want to share it with the others. Describe a picture from that tale, draw it and explain the episodes of the story making a story map. Create your imaginative story. Talk about an imaginative story that you have just been told in brainstorming time and visualization games. Bring a storyteller, maybe a person of your family that wants to share a story with us. If he/she is not a native speaker of Greek, translate for him and let us know as we listen to this story. (Invitation of good Greek storytellers, listening to different dialects of the same story told different verbal environments and different language style.) Find similarities and differences between stories you told and stories of the others. Repeat the same story to different audience and different place or time: tell us if you something was different to yourself and to others‘ repetition of the same story. Narrate the story you just heard from your friend to another person that speaks Greek and write down his/her comments, tell us the impressions he or she had from the story, what this story reminds him, if it reminds him/her of another story, (story reproduction29)
Aspects of children involved in the sudy :
Teacher, when I first came, I didn‘t listen much to you. But I liked your story time. I stopped talking with my friend
during class; I didn‘t want to miss a word I like stories. Know I think of stories, I have the picture of places and heroes on my mind. I like the pictures, they are colorful. Sometimes, I don‘t find the words to describe, until you help
me with words. I know more words now. And I put in my stories things that have never happened. I feel free.
From a child‘s interview
The use of myths in search of similarities and differences within a multicultural class helped children build an empirical foundation of coexistence at school in terms of shared values, and ideas instead of learning to speak in a second language. As Joseph Campbell at the Power of the Myth and as many other specialists remarked, myths30 are the primitive expression of imagination of civilizations and they involve universal feelings. Emotions such as fear of death, love and hatred, faith and betrayal, generosity and coward behavior are themes that appear in multicultural literacy and children prove to be fond of in learning a language. Vocabulary in everyday tales and literature is a pluralistic approach of teaching. Narration gives an effective and persuasive base of language examples. The communicative strategies of fiction story books are also an opponent of critical and creative learning, (Sage, 1987, p. 6)31. As we conclude, the use of tales in teaching Greek as a second language was a matter of linguistic, Gnostic and aesthetic reasons, in our study. Moreover, Greeks have a big tradition in Mythology and that was an additional reason of working on storytelling with the experimental group in our study. We suggest storytelling as an effective tool in a language class to be combined with short narrations in simple language and the development of a capability in reproduction of a story to visual acoustic documents, paintings, portraits, photographs turned to a video-film and other creative productions. Activities need to be oriented to action, especially with elementary
29 See also a relevant research of Saracho, Olivia: 2007, ―A literacy program for fathers: a case study‖, Early childhood Educational Journal, www.springerlink.com 30 McConochie, Jean: 1994Telling tales in School:Using Myths in the ESL Classroom, Imagination, Volume II, 31 Sage, H. 1987, Incorporating Literature in ESL Literature.Language in Education:Theory and Practice series.Englewood Cliffs:Prentice Hall.

Oral Language Acquisition with Children Having Language Difficulties in Learning Greek as a Second Language the Uses of Creative Teaching Strategies in Multicultural Settings.
217
education classes, instead of working only on picture descriptions Children can be encouraged to make their own books from the stories they told.
REFERENCES
Bage, G. (2000) Tales for Millennial Teaching, Education 3-13, Volume 28, Issue 1, March 2000, pp. 9 - 15. Benwell, B. & Stokoe, E. (2006) Discourse and Identity, Edinburgh, Edinburgh University Press. Bilson, A. & Thorpe, D. (2007) Towards Aesthetic seduction using emotional engagement and stories, Kybernetes, Vol. 36,
Issue 7/8, 2007, pp. 936-945. Bruner, J. (2003) Making Stories: Law, Literature, Life, Harvard University Press. Collins, F. (1999) The Use of Traditional Storytelling in Education to the learning of Literacy Skills, Early Childhood
Development and Care, Vol. 152, pp. 77-108. OPA, N.V. McConochie, J. (1994).Telling tales in School: Using Myths in the ESL Classroom, Imagination, Volume II. Corington, M. (1989) ―Self Esteem and Failure in School‖, in The Social Importance of Self- Esteem, Berkeley, CA: U.C.
Press. Eakin, P. J. (1999) How Our Lives Become Stories, Making Selves, Ithaca, N.Y.: Cornell University Press. Edwards, V., Kristmanston, P. & Rehorick, S. (Eds.) (2000), Manuel pour la formation des enseignants et enseignantes:
L'enseignement d'après une approche communicative/ expérientielle, Fredericton, NB, Canada. Second Language Education Centre.
Ellis, A. W. & Young, A. W. (1988) Reprinted in 1996: Human Cognitive Neuropsychology, Psychology Press. Fox Eades, J. M (2005) Classroom tales, Using Storytelling to Build Emotional, Social and Academic Skills Across the
Primary Curriculum, Jessica Kingsley Publishers. Halliday,A. (1996) Developing Sociological Imagination: Expanding Ethnography in International English Language Education,
Applied Linguistics, 17(2), pp. 234-255. Heath, S. B. (1983) Ways with Words: Language, Life and Work in Communities and Classrooms, Cambridge, U.K.:
Cambridge University Press. Hu, R. & Commeyras, M. ( 2008) A Case Study: Emergent Biliteracy in English and Chinese of a 5-year old Chinese Child
with Wordless Picture Books, EJ785600, Reading Psychology , Vol. 29, No. 1, pp. 1-30, Jan. 2008. Jarvis, J. & Trodd, L. (2008) Other ways of Seeing: other ways of Being: Imagination as a tool for developing multiprofessional
practice for children with communication needs, Child language Teaching and Therapy, Vol. 24, No. 2, pp. 211-227. King, N. (2007) Developing imagination, creativity and literacy through collaborative storymaking: A way of knowing, summer
issue 2007 Harvard Educational Review.
Krashen, S. (1981) Second language Acquisition and Second language Learning, Oxford, Pergamon Press. Lapp, D., Jacobson, J., Flood, J. & Fisher, D. (2002-2003) ―Adapting to ESL Foreign Language Instruction‖, in: Clyde, C. ED
476597, The Journal of the Imagination in Language Learning and Teaching, vol. 7, 2002-2003 collected works. Marzec, M. (2007) Telling the Corporate Story: vision into action, Journal of Business Strategy, Vol. 28, Issue 1, 2007. Papadopoulou, S. ( 2004) The Emotional Language, Athens, Greek Ltd: Typothito-Dardanos. Peyton, J. K. & Rigg, P. (1999) Poetry in Adult ESL Classroom, ERIC Digest Washington DC: National Clearinghouse for ESL
Literacy, ED 439626, pp. 626-633. Riley, J. & Burrell, A. (2007) Assessing Children‘s Oral Storytelling in Their First Year of School, (EJ764334), June 2007,
International Journal of Early Years Education, Vol.15, No. 2, pp. 181-196. Rossiter, M. ( 2002) Narrative and the Stories in Adult Teaching and Learning, ERIC ED 473147, www.eric.ed.gov Sage, H. (1987) Incorporating Literature in ESL Literature.Language in Education:Theory and Practice series, Englewood
Cliffs: Prentice Hall. Saracho, O. (2007) ―A literacy program for fathers: a case study‖, Early childhood Educational Journal, www.springerlink.com Savage-Rumbaygh, S., Murphy, J., Sevcick, R. A., Brakke, K. E., Williams, S.L. & Rumbaugh, D. (1993) ―Language
Comprehension in Ape and Child‖, Monographs of the Society for Research in Child Development, serial no. 233, vol. 58, nos. 3-4.
Young, K. & Salver, J. L. ( 2001)The Neurology of Narrative, University of Wisconsin Press. Zahavi, D. (2007) Self and the Other: the limits of narrative understanding, Published in D. D. Hutto (Ed): Narrative and
Understanding Persons, Royal Institute of Philosophy, Supplement 60, Cambridge: Cambridge University Press 2007, pp. 179-201.

John M. Kagochi and Lesley M. Mace
218
MIGRATION AND DEMAND FOR NEW HOUSING IN ALABAMA MSAS
John M. Kagochi and Lesley M. Mace University of Houston-Victoria and Auburn University Montgomery
ABSTRACT
Several studies have looked at how economic and demographic factors affecting housing demand. However, although the
demand for housing is unique and mostly local, few studies have looked at the relationship between net migration and
demand for new housing at the local level. This study extends previous research by examining the effect of net migration on
the demand for new housing at Metropolitan Statistical Areas (MSAs) of the Alabama State. We use time series data and
apply Dynamic Ordinary Least Squares (DOLS) regression. The study finds that demand for new housing in Alabama MSAs is
influenced by net migration and other local factors such as building costs and unemployment; and national economic factors,
such as mortgage interest rates.
Keywords: Migration, Housing Demand, Alabama MSA, Housing Markets
INTRODUCTION
Demand and supply for new housing is influenced by several factors that can either be demographic or economic in nature. The interactions of the construction sector (the supply side) with households (the demand side) determine prices and quantities in housing markets. Key variables governing the supply of new housing include prices, the costs of construction materials and land, the cost of financing, and the amount of undepreciated housing stock. Similarly, key variables governing the quantity of housing include prices, the level of mortgage rates, expectations of permanent income or wealth, rates of return on other investments, and demographic factors that influence the decision to buy a house (Krainer, 2005). Some of the demographic factors that influence demand for new housing include population migration, the changing age structure of the population, and the composition of households. For example, increases in the number of separations and divorces could result in an increase in the formation of new households, while increases in the number of children per family could influence the type of housing required (BC Stats, 2000). These demographic and economic factors also influence both the type of housing demanded and household size, and consequently vary considerably across different regions of even the same state. Several studies, for example, Marcin and Kokus (1975) have looked at economic and demographic factors affecting housing demand in the US. However, few studies have looked at the relationship between migration and demand for new housing at the Metropolitan Statistical Areas (MSAs) level. As noted by Kottis (1971), housing is an extremely heterogeneous good and the housing market is a composite of a large number of smaller markets specializing in different types of housing that are subject to different supply and demand conditions. The demand for housing is therefore very unique when compared to demand for other commodities. Since we cannot move houses from one locality to another even after demand changes, this study argues that demand for housing will always be local and therefore influenced mostly by local conditions. A study of how net migration influences the demand for housing at the local level will therefore gain a better understanding of the local interaction of migration and the demand for new housing, as compared to studies that look at housing demand at the state or national level. The objectives of the study are (1) develop a model for new housing in Alabama MSAs, (2) evaluate the influence of migration on the demand for new housing in Alabama MSAs, and (3) discuss the policy implications. The results of the study should provide useful information to local governments and stakeholders in the housing industry on the impact of population changes (migration) on the demand for new housing in Alabama MSAs. The rest of the study has six sections. These are migration and housing, Alabama MSAs, determinants of housing demand, data and models, results and discussions, and summary and conclusion including policy recommendations.

Migration and Demand for New Housing in Alabama MSAs
219
Migration and Housing Demand
Several studies have looked at the impact of migration on the housing market. However, most of the literature is dominated by studies that look at the impact on local rental prices in the US with the assumption that predominantly low-skilled US immigrants tend to live in rented accommodation. In general, these studies have found that immigration has a positive effect on rental prices (Stillman and Maré, 2008). A study done by Saiz (2003) that examined the 1980 ―Mariel boatlift‖ found out that the Cuban immigrants added 9% more individuals to Miami‘s renter population. He also found that rental prices increased by 8%, with smaller increases for top-end rental units, and a slight decline in house sales prices. In another study that examined the annual and decennial immigration flows and rental price changes in metropolitan areas Saiz (2007) found a similar elasticity, with a 1% increase in population due to immigrants resulting in a 1% increase in rental prices. Another study done by Ottaviano and Peri (2007) estimated the impacts of immigrants on wages and rents and found a slightly lower elasticity of 0.6 to 0.8 for the housing rents. Coleman and Landon-Lane (2007) note that if the migrants moving to a locality are wealthier than the host population, there may be a genuine housing shortage in the short term as the construction sector takes time to build suitable accommodation since the new migrants purchase high quality properties that have inelastic supply or take a long time to build. According to Mulder (2006), the relationship between population and housing is two-sided. On the one hand, population changes particularly the growth in the number of households lead to a growth in housing demand. Also, population decline might lead to a decrease in housing demand in the long run. But at the same time, the supply of housing influences the opportunities for population increase through immigration and the opportunities for people to form new households. Housing supply may also play a decisive part in leaving the parental home and the formation of married and unmarried union, and might play a part in the timing of fertility or the number of children people have. Thus, while housing may attract migrants or prevent out-migration and a lack of housing may prevent migrants from entering or lead to out-migration. As noted by Kottis (1971), the impact of migration on housing may be discussed meaningfully in terms of supply and demand. While the demand for new housing is affected by a host of economic, social and demographic factors; the paper assumes, for simplicity, that housing is a homogenous good and the immediate effect of positive net migration to an area is to increase the population and the demand of housing services. The paper therefore examines only the effect of migration on the demand for new houses in Alabama MSAs. A brief description of Alabama MSAs and theoretical discussion of the relationships studied precedes the empirical analysis.
Alabama Metropolitan Statistical Areas (MSAs)
The State of Alabama has 12 MSAs namely Anniston, Auburn/Opelika, Birmingham, Phenix City, Decatur, Dothan, Florence, Gadsden, Huntsville, Mobile, Montgomery, and Tuscaloosa. Alabama has historically been a state where population is concentrated in metropolitan areas, with metropolitan counties housing 71.2% of the state‘s population in 2006, up 1.1% from 2000. Alabama has been characterized as a state of ―few large cities and many small cities and towns.‖ Only eleven counties have cities of 25,000 or more. Jobs in Alabama are located around MSAs and in 2006 over 76% of nonagricultural employment were located in the 28 counties that make up the 11 metro areas (Trent, 2007). In 2006 Alabama had 2,110,154 Census housing units, while the 2000 Census data reported a homeownership rate of 72.5%, which is nearly 10% above the national average. According to the Census data projections, the median value of Alabama homes in 2000 was $85,100, well below the national median of $119,600. Between 1940 and 1970 Alabama lost almost a million residents, mainly as a result of the black migration to the East and Midwest in search of employment (Advameg, 2008). However, Alabama saw a net population gain of over 100,000 in the two decades following 1970s, and a population increase of 10% between 1990 and 2000. More than 40% of the growth in the 1990s was due to net migration, with a gain of nearly 90,000 more people moving to the state than leaving the state. Only during these two decades in the last century did Alabama see positive net migration as indicated by Figure 1 (Trent, 2001). Alabama‘s population is expected to increase 21.1% by 2025 with the number of households also growing 21.7% by 2025. The largest increase will occur in Shelby County, which has been Alabama‘s fastest growing county for several decades, although according to the U.S. Census Bureau Population Projections (2007) Auburn-Opelika MSA is expected to grow the most, by 56%, in the next 17 years. The Montgomery MSA population, which includes the state capital, is projected to grow

John M. Kagochi and Lesley M. Mace
220
30.1% by 2025. The Birmingham MSA will have the strongest population growth centered in the suburban metropolitan counties while declines are projected in largely minority rural counties reflecting their lack of economic opportunity.
Figure 1: Net Migration and Total Single Family Dwelling Housing Permits for Alabama MSAs, 1988-2007 (000s).
0
10
20
30
40
50
60
1988 1990 1992 1994 1996 1998 2000 2002 2004 2006Year
Tho
usan
ds
Migration Permits
Alabama‘s 2004 median household income of $37,062 is only 84% of the national average, and its poverty rate, at 16.1%, exceeds the national average by more than 25%. However, the years following the 2001 recession has seen Alabama job growth increase more rapidly than the overall U.S. economy, and an unemployment rate that remained below the national average (Bryson, 2006). Alabama‘s housing market has remained fairly strong despite the national downturn and although the state‘s foreclosure rate increased 81% between 2006 and 2007, it still stood at only 0.268 % or about ¼ the national average. During the same period, Alabama‘s homeownership rate exceeded the national average by 6.3 percentage points according to the U.S. Census Bureau (2008). Building permit issuance in Alabama MSAs increased by over 150% between 1988 and 2005 but slowed down during the 2004 -2006 although it exceeded the national average (Figure 1). While housing prices doubled across the nation from 1995-2005, Alabama home prices rose only 60%, an average of about 5% per year. One factor that has kept home prices down is that Alabama is a sparsely populated state with a population density of only 91 people per square mile. This makes it easier to build new houses and helps to keep a cap on house price inflation (Bryson, 2006).
Determinants of Housing Demand
An extensive body of literature exists concerning housing demand, with most works confined to specific subtopics within the housing market. A smaller number of studies target specifically the economic factors influencing the demand for housing, a good that is peculiar in its immobility. This literature review relates to the variables in our statistical model and their explanatory power in the case of housing demand. Rising home prices would tend to result in a decrease in the quantity demanded for housing. However, as Campbell and Cocco (2007) found, a positive relationship may exist if rising home prices increase the perceived wealth of households, or lead to relaxed borrowing constraints. Their work also suggested that a reverse causality could result, with relaxed borrowing constraints increasing housing demand and therefore prices. Goodwin (1986) noted that inflation-distorted home prices may actually increase demand by acting as inflation hedges, with homeowners using increased home equity to compensate for rising prices in other areas. Unemployment, by lowering a person‘s income, would tend to dampen the demand for new housing. Literature concerning the effects of unemployment on housing have largely ignored this simple assumption and instead focused on the effect homeownership has on unemployment. Oswald (1996) found that a ten percent increase in homeownership increased unemployment by two percent. Other studies have found that this effect to be most relevant for middle-aged homeowners
Source: Own Calculation from Real Estate center at Texas A&M Data

Migration and Demand for New Housing in Alabama MSAs
221
(Green and Hendershott, 2001; Munch, Rosholm and Svarer, 2006). Contributions by Dohmen (2005), Boheim and Taylor (2002), and Evans and McCormack (1994) showed that this effect was somewhat diminished for high skill or high wage workers, who tended to be more mobile. A study using Spanish data by Garcia and Hernandez (2004) that included extensive demographic variables concerning age, income, and marital status found that the previous literature was not relevant for the Spanish market, where high homeownership rates were negatively correlated to unemployment. Inflation can produce a number of effects on the housing market. By increasing the price of housing, inflation can be assumed to reduce the demand for housing in inflationary times. Yet if used as an inflation hedge, housing demand may actually increase with inflation (Goodwin, 1986). The tax deductible nature of nominal rates of mortgage interest can actually lower the real cost of capital and therefore stimulates demand and homeownership (Rosen and Rosen, 1980); especially, given the fact that capital gains are not taxable for first time home sales. Kearl‘s (1979) often cited work stated that inflation‘s effect on housing costs serves to lower housing demand, while Feldstein et.al (1978) observed that inflation decreases housing‘s attractiveness as an investment. Hendershott (1980) confirmed the negative relationship between inflation and housing demand, and found that carrying costs were much more important in determining this demand than capital gains. According to Follain (1982), a one percent increase in the anticipated inflation rate reduced homeownership by more than three percentage points for all households with a larger effect occurring for non-elderly married couples. Complicit in this finding was the result that higher interest rates necessarily constrain borrowing. Homeownership usually necessitates borrowing, making the interest rate a key factor in the demand for housing. Aspergis ( 2003) stated that interest rates were the most important factor influencing housing demand, outweighing both inflation and unemployment as an explanatory variable which reinforced a conclusion suggested by Goodwin (1986),among others. Feldstein and Summers (1978) noted that the tax deductibility of mortgage interest plays a role in increasing the real interest rate, with cost depreciation lowering it. Their work also confirmed the Fisher effect link between inflation and nominal interest rates, with the two variables working together to either increase or decrease housing demand. The literature concerning the relationship between income and housing demand tends to focus on the elasticity of the demand for housing, rather than the assumption of a positive correlation between income and housing demand. Findings by Follain (1979), in a paper that also used MSA data, reported that high income households had much greater elasticities of demand for housing than lower income households. DeLeeuw (1971) noted that homeowners have greater housing demand elasticities than renters. Lee (1964) computed an income elasticity of less than one for housing stock, which would decrease both the percentage of income spent on housing and the burden of property taxes as income rises. Given that price elasticity was found to be more negative than minus one, the interaction and relative strengths of these two elasticities could have a significant effect on the impact of income on housing demand. Lee (1963) failed to find that disposable income was a deciding factor in the probability of home purchasing or rental; age of household head and initial home ownership played a far greater role, with even income changes being irrelevant in determining household buying behavior. Each of the preceding factors plays a role in determining migration. Higher incomes and lower unemployment would increase migration into an area and tend to increase home prices. This in turn would depress housing demand and lower the mobility of homeowners, who will be unable to sell their homes. Migration‘s effects on the housing market follow a strict demand and supply model. If an area experiences net immigration, housing demand would increase along with the price of housing. Net outmigration would lower both demand and housing prices (McDougall, 2000). Thus, if we assume, for simplicity, that housing is a particular MSA is a homogeneous good, the immediate effect of positive net migration to an area would be to increase the population and therefore the demand for new housing, with economic conditions underpinning these movements (Kottis, 1971). The macroeconomic variables of income, inflation, and interest rates can be either preceded or followed by fiscal and monetary responses that play a large role in determining household responses. If recession is accompanied by a loosening of borrowing restraints via the interest rate, as was in the case of the recession beginning in 2001, housing demand may remain strong despite rises in unemployment and decreases in income. A contractionary monetary response to inflation, as was the case in the deep recession of 1981, may dampen housing demand due to higher interest rates, even though housing values, and therefore hedging value, are on the rise. The interplay of these variables and the ultimate outcomes must rest on the empirical evidence presented. Other factors that influence demand for housing include the homeowner‘s age. According to Lee (1963) and Follain (1982), housing demand has been shown to peak at the homeowners age of around 34 years or to increase with homeowners age until at least age 64 (Garcia and Hernandez, 2004).

John M. Kagochi and Lesley M. Mace
222
DATA AND MODELS
Data
The study attempts to analyze the impact of migration on the demand for new housing in Alabama Metropolitan Statistical Areas (MSAs). The MSAs considered are Anniston, Auburn/Opelika, Birmingham, Phenix City, Decatur, Dothan, Florence, Gadsden, Huntsville, Mobile, Montgomery, and Tuscaloosa. Dothan is not considered because of lack of consistent data for the MSA. To do the analysis, net migration and other determinants of demand for new housing are examined across the 11 MSAs between 1988 and 2007 using regression analysis. The time frame was selected after taking into consideration the availability of data. The study uses a panel data set that comprises the following annual time series variables for the 11 Alabama MSAs from 1988 to 2007: number of new single family building permits issued, value of new single family building permits issued, number of single family houses sold, unemployment rates, population, net migration, real interest rates for mortgages, and per capita personal income. Data on the number of single-family building permits and the value for new houses issued for each MSA are obtained from U.S. Bureau of Census and Real Estate Center at Texas A&M University; real interest rates for mortgage data are obtained from the Federal Housing Finance Board; unemployment data is provided by the U. S. Bureau of Labor Statistics; population data are provided by Bureau of Census; houses sales data are obtained from Alabama Center for Real Estate; and personal income data are obtained from the Bureau of Economic Analysis.
Models
The study hypothesizes that housing is an extremely heterogeneous good and the housing market is a composite of a large number of smaller markets specializing in different types of housing and being subject to different supply and demand conditions which makes housing demand to be very unique when compared to demand for other commodities. Since we cannot move houses from one locality to another even after demand changes, the study argues that demand for housing will always be local and is therefore influenced mostly by local conditions. A study on the impact of net migration to the quantity demanded for new housing at the MSAs level is likely to reveal more accurate results when compared to studies that mostly look at housing demand from the state or national level perspective. The study builds on the estimated housing demand model of Ge and Lam (2002), and Halicioglu (2007) among others who summarize a general function of the quantity demanded for houses (Q
d) as follows:
),,,( tDHGfQd ( t = 1, 2, 3, …….n) (1)
where G stands for macroeconomic variables such as GDP, interest rates, stock exchange index, etc; H represents housing related variables such as house prices, income, unemployment rate, etc; and D is related to demographic variables such as population, number of marriages, birth rates, etc. Following Reichert (1990), Equation (1) is expressed in natural logarithmic multiple regression form as follows: tttttdt DHHGQ lnlnlnln 43210 (2)
The appropriate economic and demographic variables to include in Equation (1) are limited mostly by the specific region‘s cases and available data set to researchers (Halicioglu, 2007). This study follows Fulpen (1988) and Ge and Lam (2002) who provide surveys on model specifications and empirical evidences in housing demand studies and modifies Equation (2) for Alabama MSAs as follows: tttttttttdt RCIUPPoMSH lnlnlnlnlnlnlnlnln 876543210 (3)
where Hd is the demand for new housing as measured by the new permits issued for single housing units, S is the number of houses that are sold within an MSA which includes new and existing houses, M is the net migration of population to the MSA, Po is the population of the MSA, P is the median house price within the MSA, U is the unemployment rate that prevails within the MSA, I is the average per capita income of the MSA, C is the cost of building a new house within an MSA and is expressed by the value of the permit, and R is the prevailing average mortgage interest rate in the state of Alabama.

Migration and Demand for New Housing in Alabama MSAs
223
The use of panel data for long-run regression studies poses some difficulties because the time series component of the panel may not be stationary. This study therefore relies on Kao and Chiang (1998) who discuss the properties of the OLS and dynamic OLS (DOLS) estimators for the estimation of the long-run cointegration vector. Kao and Chiang (1998) find that the OLS fixed effects estimation of the panel is subject to a non-negligible bias in finite samples. For this reason, they propose alternative DOLS estimator based on Stock and Watson (1993) obtained from running the following regression:
itjti
p
jjjti
p
jjitiit
exxxy ,1
,1
(4)
The DOLS regression adds to the OLS the leads and lags of the differences of the independent variables. Kao and Chiang (1998) also show that the DOLS estimator is preferable to OLS since it ensures asymptotically unbiased estimates and avoids the estimation of nuisance parameters. The DOLS estimation for equation (3) was estimated and the results are reported in Table 1. To resolve the auto-correlation problem that is common with time series data, the model was run using the Cochrane – Orcutt correction method for auto-correlation. The expected signs for the coefficients used in the study are expected to be positive except for building cost, unemployment, and the interest rates.
RESULTS AND DISCUSSION
Data was analyzed using the DOLS regression technique using the software LIMDEP. The F-statistic for the DOLS regression was 90.2 and is statistically significant at the 1% level. The results indicates that the number of houses sold, net migration, population, median house price, unemployment level, per capita income, cost of building a new house, and interest rates are together statistically significant (i.e., they strongly influence the demand for the new housing). The R2 for the regression model was 0.783 which is an indication of good predictive power. It implies that the variables used in the model can explain 78% of the demand for new housing in Alabama MSAs. The estimation results show that the sign and size of all parameters, except per capita income, were as expected in the corrected DOLS regression. The coefficient for houses sold was statistically significant at 1% level, consistent with our expectations. This indicates that as more existing houses are sold in Alabama MSAs, they act like a signal for increased future demand for housing, which translates to increased demand for new housing. The results indicate that a 1% increase in the number of houses sold, ceteris paribus, will lead to 0.12% increase in the demand for new housing.
Table 1: Dynamic Ordinary Least Squares Regression (DOLS) results
Variable Coefficient
ONE 1.433
(-3.600)***
Houses Sold 0.117
(3.514) ***
Migration 0.053
(2.450) ***
Population 0.284
(5.311) ***
Median House Price 0.147
(1.827) **
Unemployment -0.030
(-3.055) ***
Per Capita Income -0.339
(-2.751) ***
Building Cost -0.100
(-2.190) ***
Interest Rates -0.049
(-4.150) ***
R2 0.783
F-Stat (90.2)***
t-ratios in parenthesis *** significant at 1% level.

John M. Kagochi and Lesley M. Mace
224
The coefficient for net migration is positive and significant at 1% level, consistent with our expectations. The results of the net migration coefficient indicate that a 1% increase in net migration to Alabama MSAs will lead to 0.05% increase in the quantity demanded of new housing. The coefficient for population was also positive and significant at 1% level, consistent with our expectations. The results indicate that when population increases by 1% in Alabama MSAs, ceteris paribus, demand for new housing will increases by 0.28%. Results for the other explanatory variables that were included in the model are discussed next. The coefficient for median house price was positive and significant at 5% level. This is consistent with our expectations since higher house prices are expected to lead to high levels of residential construction as increased margins encourage more market participants. The results of the study show that a 1% increase in median house price, ceteris paribus, will lead to 0.15% in the demand for new housing. The unemployment coefficient showed a negative relationship between unemployment and demand for new housing, consistent with our expectations, and was significant at 1% level. The results indicate that as unemployment increases by 1% in Alabama MSAs, ceteris paribus, demand for new housing will decrease by 0.03%. The interest rate coefficient was negative and significant at 1% level, consistent with our expectations. This implies that when mortgage interest rate increases by 1%, ceteris paribus, demand for new housing decreases by 0.05%. The coefficient for cost of building a new house was also negative and significant at 1% level which is an indication that as cost of putting up new housing increases in Alabama MSAs, it dampens the demand for new housing. The result showed that when cost for putting up new houses in Alabama MSAs increases by 1%, ceteris paribus, demand for new houses would decreases by 0.1%. Although per capita income was significant at the 1% the coefficient was negative, which is not consistent with our expectations. The results would indicate that as per capita income increases within Alabama MSAs, demand for new housing will decrease by 0.34%. The results of Eisenberg (2008) and American Housing Survey (2005) can be used to advance and explanation to this outcome. Eisenberg (2008) notes that first-time buyers tend to be younger with lower incomes and are more sensitive to house prices. By contrast, move-up buyers have substantially higher incomes largely because they are older and likely to have experienced income growth subsequent to the first home purchase that is in part what makes the move-up purchase possible. Since our study estimated demand for new housing, and increases in per capita income usually benefit low income residents or first time buyers, while demand for new housing comes from move-up buyers, the two variables (demand for new housing and per capita income) may not be strongly correlated.
SUMMARY AND CONCLUSION
A large literature has addressed both economic and demographic factors and how they affect new housing demand at the national and state level in the US. However, housing is an extremely heterogeneous good and the housing market is a composite of a large number of smaller markets specializing in different types of housing that are subject to different supply and demand conditions. Thus, demographic and economic factors influence most the demand for new housing at the local level. This appears to be largely ignored in the literature. This study attempts to analyze how net migration and other determinants of the demand for new housing effect the quantity demanded of new houses in Alabama MSAs using a panel time series dataset that covers 1988 to 2007. The dataset contains the value of new single family building permits issued, number of single family houses sold, net migration, population, median home price, unemployment rates, per capita personal income; and real mortgage interest rates for the State of Alabama. The study finds that net migration tends to increase demand for new housing in Alabama MSAs. Also, increased sale of existing houses in the market acts like positive signal that influences the demand for new housing in Alabama MSAs as depicted by the sales coefficient. On the contrary, the cost of new housing, real mortgage interest rates, and unemployment rates were found to negatively influence the demand for new housing in Alabama MSAs. The study finds no evidence to suggest that increased per capita income directly influences the demand for new housing in Alabama MSAs. In terms of policy, the state government should strive to develop and implement policies that allocate economic activity more evenly around the state. This will ensure that new migration is not concentrated only in the MSAs but spread out to other Metropolitan Statistical Areas. By doing this, there will slow down house price inflation and make houses affordable to most people.

Migration and Demand for New Housing in Alabama MSAs
225
REFERENCES
Advameg, Inc (2008) Alabama-Migration [electronic resource], http:// www.city-data.com Alabama Center for Real Estate (ACRE), Housing Statistics, Alabama Center for Real Estate (ACRE) [electronic
resource],The University of Alabama, http://www.acre.cba.ua.edu/ Aspergis, N. (2003) Housing Prices and Macroeconomic Factors: Prospects within the European Monetary Union,
International Real Estate Review, 6(1), pp. 63-74. BC Stats. (2000) Migration and Housing Demand, Population Section, Finance and Corporate Relations [electronic resource],
http://www.bcstats.gov.bc.ca/pubs/mig/mig001fa.pdf Boheim, R. and Taylor, M. P. (2002) Tied down or room to move? Investigating the Relationships between housing tenure,
employment status, and residential mobility in Britain, Scottish Journal of Political Economy, 49(4), pp. 369-392. Bryson, J. H. (2006) Alabama Economic Trends & Outlook, Wachovia Economics Commentary. Bureau of Economic Analysis, Local Area Personal Income [electronic resource], http://www.bea.gov/. Bureau of Labor Statistics (2008), Local Area Unemployment Statistics [electronic resource], http://www.bls.gov/. Campbell, J. Y. and Cocco, J. (2007) How do house prices affect consumption? Evidence from micro data, Journal of
Monetary Economics, 54, pp. 591-621. Coleman, A. and Landon-Lane, J. (2007) Housing markets and migration in New Zealand, 1962-2006, Reserve Bank of New
Zealand (Discussion paper, 2007/12). DeLeeuw, F. (1971) The Demand for Housing: A Review of Cross-Section Evidence, The Review of Economics and Statistics,
5(1), pp. 1-10. Dohmen, T. J. (2005) Housing, Mobility, and Unemployment, Regional Science and Urban Economics, 35, pp. 305-325. Eisenberg, E. F. (2008) Characteristics of First-Time Home Buyers, National Association of Home Builders (NAHB)/ Housing
Economics [electronic resource], http://www.nahb.org/category Evans, P. and McCormick, B. (1994) The new pattern of regional unemployment: causes and policy significance, Economic
Journal, 104(424), pp. 633-647. Federal Housing Finance Board (2008) Monthly Interest Rate Survey [electronic resource], http://www.fhfb.gov/ Feldstein, M. and Summers, L. (1978) Inflation, Tax Rules, and the Long-Term Interest Rate, Brookings Papers on Economic
Activity, 1, pp. 61-109. Follain, J. R. Jr. (1979) A Study of the Demand for Housing by Low versus High Income Households, The Journal of Financial
and Quantitative Analysis, 1(4), pp. 769-782. Follain, J. R. Jr. (1982) Does Inflation Affect Real Behavior: The Case of Housing, Southern Economic Journal, 48(3), pp.
570-582. Fulpen, H. (1988) An analysis of the housing market in the Netherlands, Urban Studies, 25, pp. 190-203. Garcia, J. A. B. and Hernandez, R. J. E. (2004) User Cost Changes, Unemployment and Home-Ownership: Evidence from
Spain, Urban Studies, 41(3), pp. 563-578. Ge, X. J. and Lam, K. C. (2002) Building a house prices forecasting model in Hong Kong‖, The Australian Journal of
Construction Economics and Building, 2(2), pp. 57 - 70. Goodwin, T. H. (1986) Inflation, Risk, Taxes, and the Demand for Owner-Occupied Housing‖, Review of Economics and
Statistics, 68(2), pp. 197-206. Green, R. K. and Hendershott, P. H. (2001) Home Ownership and Unemployment in the U.S., Urban Studies, 38(9), pp.1509-
1520. Halicioglu, F. (2007) The demand for new housing in Turkey: an application of ARDL model, Global Business and Economics
Review, 9, pp. 62-74. Hendershott, P. H. (1980) Real User Costs and the Demand for Single Family Housing‖, Brookings Papers on Economic
Activity, 2. pp. 401-452. Kao, C. and Chiang, M-H. (1998) On the Estimation and Inference of a Cointegrated Regression in Panel Data, Center for
Policy Research, Syracuse University (Working Paper). Kearl, J. R. (1979) Inflation, Mortgage, and Housing, The Journal of Political Economy, 87(5), pp. 115-1138. Kottis, A. (1971) Impact of migration on housing in urban areas, The Annals of Regional Science, 5(1), pp. 117-124. Krainer, J. (2005) Housing Markets and Demographics, FRBSF Economic Letter, No. 2005-21 [electronic resource],
http://dfm.idaho.gov/Publications/EAB/Forecast/2005/October/Article.pdf Lee, T. (1963) Demand for Housing: A cross-Section Analysis, The Review of Economics and Statistics, 45(2), pp. 190-196. Lee, T. (1964) The Stock Demand Elasticities of Non-Farm Housing, The Review of Economics and Statistics, 46(1), pp. 82-
89. Marcin T.C. and Kokus, J. (1975) Economic and Demographic Factors Affecting Housing Demand into the 1980s and 1990s,
Real Estate Economics, 3(3), pp. 81-93.

John M. Kagochi and Lesley M. Mace
226
McDougall, R. (2000) Migration and Housing Demand, BSStats, Population section [electronic resource], http://www.bcstats.gov.bc.ca/pubs/mig/mig961fa.pdf
Munch, J. R., Rosholm, M. and Svarer, M. (2006) Are Homeowners Really More Unemployed? The Economic Journal, 116, pp. 991-1013.
Mulder, C. H. (2006) Population and housing: A two-sided relationship, Demographic Research, 15(13), pp. 401-412. Oswald, A. (1996) A conjecture on the explanation for high unemployment in the industrialized nations: part I, Warwick
Economics Research Paper No. 475, University of Warwick, pp. 197-206. Reichert, A. K. (1990) The impact of interest rates, income, and employment upon regional housing prices, Journal of Real
Estate Economics, 3, pp. 373-391. Rosen, H. S. and Rosen, K. T. (1980) Federal Taxes and Homeownership: Evidence from Time Series, Journal of Political
Economy, 88(11), pp. 59-75. Stillman, S. and Maré, D. C. (2008) Housing Markets and Migration: Evidence from New Zealand, Motu Working Paper 08-06. Trent, C. (2001) Alabama‘s Population at the Dawn of the 21st century, University of Alabama Center for Business and
Economic Research Briefs, May 2001. Trent, C. (2007) Alabama Population Trends, University of Alabama Center for Business and Economic Research Briefs, May
2007. U.S. Census Bureau (2008) Annual Estimates of the Population [electronic resource], http://www.census.gov/

Kinship Care as a Valid Permanency Option Independent of Adoption or Legal Guardianship: A Review of the Literature and Proposal for Future Study
227
KINSHIP CARE AS A VALID PERMANENCY OPTION INDEPENDENT OF ADOPTION OR LEGAL GUARDIANSHIP: A REVIEW OF THE LITERATURE AND
PROPOSAL FOR FUTURE STUDY
Richard Dane Holt1, Terence Perkins2 and Rhonda Holt3 Eastern New Mexico University1, Veterans‘ Administration1,2 and New Mexico Christian Children‘s Home3
ABSTRACT
Too often the only options considered to meet the standard of permanency for children in the child welfare system are
reunification or adoption. However, many kinship foster caregivers see adoption as an unnecessary burden, even when they
view their situation as permanent. It has been suggested that while some deem a ―lasting‖ placement to meet permanency standards, others insist that permanency must include a ―binding‖ legal obligation on the part of the primary caregiver. Legal
guardianship has been suggested as a third permanency option. But it seems appropriate to ask if a legally binding
commitment actually has any affect on the lasting stability of a kinship care placement. The purpose of this proposal to make
an initial attempt to measure the impact of legal obligation on the permanency of kinship care foster placements.
Some knowledge of how the placement stability of kinship foster care compares with traditional foster care already exists.
However, we have very little knowledge about how the placement stability of kinship foster care compares with legally
obligated arrangements (e.g., adoptions and legal guardianships). This descriptive study will be based upon a random sample
of kinship foster care placements in New Mexico over a selected five-year period. Specifically stated, the research question
for this proposal is: What effect do legal obligations have on placement stability for children placed with relatives? The working
hypothesis for study is that neither legal guardianships nor adoptions will make a statistically significant difference on the
placement stability of the sample.
Keywords: Foster Care, Kinship Care, Placement Stability.
STATEMENT OF RESEARCH PROBLEM
Too often the only options considered to meet the standard of permanency for children in the child welfare system are reunification or adoption. However, many kinship foster caregivers see adoption as an unnecessary burden, even when they view their situation as permanent (O‘Brien, Massat, and Gleeson, 2001; see also Beeman and Boisen, 1999). It has been suggested that while some deem a ―lasting‖ placement to meet permanency standards, others insist that permanency must include a ―binding‖ legal obligation on the part of the primary caregiver (Testa, 2002, p. 156). Legal guardianship has been suggested as a third permanency option (Henry, 1999; Testa, 2002). But it seems appropriate to ask if a legally binding commitment actually has any affect on the lasting stability of a kinship care placement.
SUMMARY OF LITERATURE
Kinship care has been defined as ―a particular form of family foster care in which the children are placed with foster parents who are biologically related to them‖ (Grogan-Kaylor, 2000, p.132). But in some cases, the term refers to others with close familial ties that are not biologically related such as friends, neighbors, or godparents (Beeman and Boisen, 1999; Schwartz, 2002). ―Traditionally kinship care has been described as either ‗informal,‘ meaning that such caregiving arrangements occurred without the involvement of a child welfare agency, or ‗formal,‘ meaning that kin act as foster parents for children in state custody‖ (Geen, R., 2000, p.20). These ―arrangements [are also] referred to as ‗kinship foster care,‘ ‗relative foster care,‘ or ‗formal kinship care‘‖ (O‘Brien, Massat, and Gleeson, 2001, p.719). However, as Geen (2000) points out, adoptions, legal guardianships, and power of attorney arrangements are sometimes accurately referred to as kinship care as well. A significant amount of research has been done on various aspects of kinship care. For convenience, these findings can be grouped into three categories: demographics, attitudes, and outcomes.
Demographics
Studies have shown that African American and Hispanic children are far more likely to placed with extended family than are children with other ethnic or racial backgrounds (Grogan-Kaylor, 2000; Leslie, Landsverk, Horton, Ganger, and Newton, 2000;

Richard Dane Holt, Terence Perkins and Rhonda Holt
228
Scannapieco, Hegar, and McAlpine, 1997). Infants have been shown to be the least likely age group for placement with kin (Grogan-Kaylor, 2000). Children from negligent homes are more likely to be placed with relatives than children from abusive homes (Grogan-Kaylor, 2000; Scannapieco, Hegar, and McAlpine, 1997). Children from single parent homes are significantly more likely to be placed with relatives than are children from two parent homes (Grogan-Kaylor, 2000). Most of these findings have been replicated in studies using a variety of methods in various geographical areas. Kinship caregivers are more likely to be African-American (Chipman, Wells, and Johnson, 2002; Gebel, 1996; Leslie, Landsverk, Horton, Ganger, and Newton, 2000; Scannapieco, Hegar, and McAlpine, 1997), older (Chipman, Wells, and Johnson, 2002; Gebel, 1996; Scannapieco, Hegar, and McAlpine, 1997), poor (Chipman, Wells, and Johnson, 2002; Fuller-Thomsom and Minkler, 2000; Scannapieco, Hegar, and McAlpine, 1997), single (Chipman, Wells, and Johnson, 2002; Fuller-Thomsom and Minkler, 2000; Scannapieco, Hegar, and McAlpine, 1997), and female (Chipman, Wells, and Johnson, 2002; Fuller-Thomsom and Minkler, 2000; Scannapieco, Hegar, and McAlpine, 1997) than their non-caregiving counterparts. African American grandmothers who were providing care were found to be in poorer health and in need of more supports than their counterparts who were not raising children (Fuller-Thomsom and Minkler, 2000).
Attitudes
Preliminary studies seem to indicate that caseworkers and other professionals involved in Child Protective Services (CPS) have a generally favorable view of kinship care and actively pursue this type of care as one permanency option (Beeman and Boisen, 1999; Gleeson, O‘Donnell, and Johnson, 1997). Additionally, some research indicates that the relatives providing kinship foster care tend to view this responsibility positively (Edelhoch, Liu, and Martin, 2002; Gebel, 1996; O‘Brien, Massat, and Gleeson, 2001 ). However, research also indicates that providing such care is burdensome (Edelhoch, Liu, and Martin, 2002; Gleeson, O‘Donnell, and Johnson, 1997; O‘Brien, Massat, and Gleeson, 2001 ). Research also suggests that most kinship caregivers are motivated by family expectations or obligations (Beeman and Boisen, 1999; Gibson, 2000). Very little research has been done on children‘s perceptions of this type of care. However, the opportunity to stay in contact with extended family and continue to live within a familiar culture, seems to be an advantage from which children benefit. While professionals involved in the CPS system indicate a generally positive view of kinship care, research raises questions about the lesser amount of contact and support kinship caregivers receive when compared with non-relative foster parents (Gebel, 1996; Gleeson, O‘Donnell, and Johnson, 1997; O‘Donnell, 1999, 2001). Some research also indicates that extended family members are too often left out of the planning process (Franck, 2001; Gleeson, O‘Donnell, and Johnson, 1997; O‘Donnell, 1999, 2001). Birth-fathers, in particular, have received scant attention and are often left out of the process altogether (Franck, 2001; O‘Donnell, 1999, 2001).
Outcomes
A number of studies have found that kinship care has a negative impact on adoption rates (Beeman and Boisen, 1999; Chipman, Wells, and Johnson, 2002; O‘Brien, Massat, and Gleeson, 2001). This may be as a result of kinship caregivers not believing adoption is necessary (Beeman and Boisen, 1999; O‘Brien, Massat, and Gleeson, 2001). It may also be due to a lack of minority caregivers‘ trust in the system (Gibson, 2002; O‘Brien, Massat, and Gleeson, 2001). Some research indicates that kinship caregivers are generally willing to care for children long-term (Edelhoch, Liu, and Martin, 2002; Gibson, 2002; O‘Brien, Massat, and Gleeson, 2001). Legal guardianships have also been used effectively as a permanency option with some kinship caregivers (Henry, 1999; Testa, 2002). It is interesting to note that at least one study indicates adjudication has a negative impact on stability (Henry, 1999). Research in Finland found a correlation between foster parents having birth-children living in the home, and foster placement breakdown (Lalland and Sinkkonen, 2001). Another variable that has been found to have a significant impact on permanency/stability is the age of a child at first placement (Leslie, Landsverk, Horton, Ganger, and Newton, 2000). It is also interesting to note that some research indicates that most instability occurs within the first year (Wulczyn, Kogan, and Harden, 2003). This is a particularly grave concern as other research indicates children who experience more than one move in their first year of placement are most likely to experience long-term instability (Webster, Barth, and Needell, 2000). Nonetheless, research consistently supports the claims that children who experience kinship placements have significantly higher rates of permanency and reunification (Chipman, Wells, and Johnson, 2002; Leslie, Landsverk, Horton, Ganger, and Newton, 2000; Scannapieco, Hegar, and McAlpine, 1997; Webster, Barth, and Needell, 2000; Wulczyn, Kogan, and Harden, 2003).
Kinship Care as a Valid Permanency Option Independent of Adoption or Legal Guardianship: A Review of the Literature and Proposal for Future Study
229
THE LIMITATIONS OF EXISTING RESEARCH
While a detailed discussion of research limitations of each source cited is beyond the scope of this paper, some general comments seem to be warranted. First, it must be noted that the literature review presented above, while hopefully somewhat representative of what has been done in the field, is far from exhaustive. In addition, while many of these studies yielded compatible results, not every finding discussed was supported by every study. Another limitation involves terminology. For example, several studies examined stability, permanence, or placement disruptions. However, the specific definitions used in each study for these terms varied as the unique concerns and methodology of each project dictated. Many of the studies used were qualitative and the related findings are thus of an exploratory nature. Others were descriptive in nature, providing useful information on association or correlation of variables but very little identification of causation. Other limitations involved small sample sizes and non-random sampling in some studies as well as geographic limitations. A statistically significant finding for an urban county in California, for example, may or may not be replicated in rural Kentucky. Also most of the research that has been done on kinship care has been of a cross-sectional nature. A greater number of longitudinal studies would likely be helpful.
PROPOSAL FOR FURTHER INVESTIGATION
Question and Hypothesis
As discussed above, kinship care has been shown to be more lasting than traditional foster care. Some evidence suggests that kinship caregivers often view their role as being long-term. Evidence has also been presented that indicates these providers are motivated by family expectation and obligation. If caregivers already consider themselves obligated, due to familial or cultural concerns, is an additional legal obligation (adoption or legal guardianship) really necessary? Testa (2002) used rigorous research methods for the state of Illinois and found that ―…placement stability may be determined by factors that are independent of the legal relationship between the child and caregiver‖ (p.155-156). Henry (1999) reviewed court files for two counties in Michigan and found that ―abused/neglected children who were not adjudicated had a much higher rate of permanency‖ (p.566). Both of these studies are examining children with legal guardians. However, it could be inferred from Henry‘s (1999) research that lesser court involvement is preferable for children‘s placement stability. We have some knowledge about how the placement stability of kinship foster care compares with traditional foster care. However, we have very little knowledge about how the placement stability of kinship foster care compares with legally obligated arrangements (e.g., adoptions and legal guardianships). Specifically stated, the research question for this proposal is: What effect do legal obligations have on placement stability for children placed with relatives? The working hypothesis for study is that neither legal guardianships nor adoptions will make a statistically significant difference on the placement stability of the sample.
Proposed Methodology
This study will include both descriptive and exploratory methodologies. The dependent variable will be placement stability. Placement stability will be defined as the average number of moves over the three-year study period. The independent variable will be legal obligation. Legal obligation will include any court appointed adoption or guardianship. This test will not seek to prove causation but will seek to support the hypothesis by showing a statistically insignificant correlation between legal obligation and stability.
Data Collection
A baseline of average number of placement moves for all U.S. foster children from 1990 through 1992 will be established using administrative data from the Voluntary Cooperative Information Service (VCIS), a national database. This database was selected because prior to 1995 ―…all 50 states annually provide[d] information on their out of home care populations…[to it]‖ (Grogan-Kaylor, 2000, p.132). While this is a very helpful data set, it does include some inconsistent and incomplete reporting. Still it is the best data available for its time period and provides interesting historical information. A second more recent and more reliable baseline of placement moves will be taken from the Adoption and Foster Care Analysis and Reporting System (AFCARS). This data set includes the mandatory reports from all fifty states and is generally considered to be a significantly more consistent and complete set of data. The average number of moves nationally and for the state of New Mexico from 2003-2005 will be taken from this summary data. The AFCARS will also be used to provide information on the specific individuals used in the sample below.

Richard Dane Holt, Terence Perkins and Rhonda Holt
230
Sampling Strategy
First, all New Mexico children placed in any kind of kinship care arrangement in 2003 will be identified as the sample set. A random sample of 8% will then be selected from that subset. This cohort will be observed for the total number of placement moves over the three year period from January 2003 – December 2005. The average number of moves experienced by New Mexico foster children who receive the intervention (legally obligated caregivers) will then be compared with the average number of moves experienced by New Mexico children not receiving the intervention.
Projected Analysis
Because of the size of the sample and the narrow focus of this study, only one independent variable will be considered. This means that the likelihood of picking up ―noise‖ will be greater than if a multi-variable approach were used. However, since this is an exploratory study, the findings should be valuable as an initial investigation. It should be understood that even if the data supports this study‘s hypothesis, this evidence alone would not justify extensive changes in policy. While placement stability is an important aspect of the foster care system, other issues such as child safety, reunification with parents, and legally mandated timelines also need to be taken into consideration. Replication of the results in other regions of the United States would also be helpful. Nonetheless, the potential benefits to children remaining with supportive family for an extended period of time make this research question worth investigating. It may also suggest some interesting possibilities regarding better use of resources in a child protective services system that often finds itself spread thin.
BIBLIOGRAPHY
Altshuler, S.J., and Gleeson, S.J. (1999). Completing the Evaluation Triangle for the Next Century: Measuring Child ―Well-Being‖ in Family Foster Care. In Child Welfare, 78, 1, 125-147. Retrieved August 30, 2003, from the OCLC FirstSearch database.
Beeman, S., and Boison, L. (1999). Child Welfare Professionals‘ Attitudes Toward Kinship Foster Care. In Child Welfare, 78,
3, 315-337.
Burnette, D. (1999). Social Relationships of Latino Grandparent Caregivers: A Role Theory Perspective. In The Gerontologist,
39, 1, 49-58. Chipman, R., Wells, S.W., and Johnson, M.A. (2002). The Meaning of Quality in Kinship Foster Care: Caregiver, Child, and
Worker Perspectives. In Families in Society, 83, 5/6, 508-520.
Donner, W.W. (1999). Sharing and Compassion: Fosterage in a Polynesian Society. In Journal of Comparative Family
Studies, 30, 4, 703-722. Retrieved August 30, 2003, from the OCLC FirstSearch database. Dubowitz, H. (1994). Kinship Care: Suggestions for Future Research. In Child Welfare, 73, 5, 553-564. Retrieved September
04, 2003, from the ProQuest database. Edelhoch, M., Liu, Q., and Martin, L.S. (2002). Unsung Caregivers: Relative Caretakers in Child-Only Cases. In Policy and
Practice of Public Human Services, 60, 1, 26-30. Retrieved August 28, 2003, from the OCLC FirstSearch database. Fluke, J.D., Edwards, M., Kutzler, P., Kuna, J., and Tooman, G. (2000). Safety, Permanency, and In-Home Services: Applying
Administrative Data. In Child Welfare, 79, 5, 573-595.
Franck, E.J. (2001). Outreach to Birthfathers of Children in Out-of-Home Care. In Child Welfare, 80, 3, 381-399. Fuller-Thomson, E., and Minkler, M. (2000). African American Grandparents Raising Grandchildren: A National Profile of Demographic and Health Characteristics. In Health & Social Work, 25, 2, 109-118. Retrieved August 30, 2003, from the OCLC FirstSearch database.
Gebel, T.J. (1996). Kinship Care and Non-Relative Family Foster Care: A comparison of Caregiver Attributes and Attitudes. In Child Welfare, 75, 1, 5-11. Retrieved September 04, 2003, from the ProQuest database.
Geen, R. (2000). In the Interest of Children: Rethinking Federal and State Policies Affecting Kinship Care. In Policy & Practice
of Public Human Services, 58, 1, 19-27.
Gennaro, S., York, R., and Dunphy, P. (1998). Vulnerable Infants: Kinship Care and Health. In Pediatric Nursing, 24, 2, 119-
125.
Gibson, P.A. (2002). African American Grandmothers as Caregivers: Answering the Call to Help Their Grandchildren. In Families in Society, 83, 1, 35-43.

Kinship Care as a Valid Permanency Option Independent of Adoption or Legal Guardianship: A Review of the Literature and Proposal for Future Study
231
Gibson, P.A., (2002). Caregiving Role Affects Family Relationships of African American Grandmothers as New Mothers Again: A Phenomenological Perspective. In Journal of Marital and Family Therapy, 28, 3, 341-353. Gleeson, J.P., O‘Donnell, J., and Bonecutter, F.J. (1997). Understanding the Complexity of Kinship Foster Care. In Child Welfare, 76, 6,
801-826. Retrieved August 30, 2003, from the OCLC FirstSearch database. Goodman, C.C. and Silverstein, M. (2001). Grandmothers Who Parent Their Grandchildren: An Exploratory Study of Close
Relations Across Three Generations. In Journal of Family Issues, 22, 5, 557-578. Retrieved May 30, 2003, from the ProQuest database.
Grogan-Kaylor, A. (2000). Who Goes Into Kinship Care? The Relationship of Child and Family Characteristics to Placement into Kinship Foster Care. In Social Work Research, 24, 3, 132-141.
Henry, J. (1999). Permanency Outcomes in Legal Guardianships of Abused/Neglected Children. In Families in Society, 80, 6,
561-568.
Hegar, R.L., and Scannapieco, M. (2000). Grandma‘s Babies: The Problem of Welfare Eligibility for Children Raised by Relatives. In Journal of Sociology and Social Welfare, 27, 3, 153-171.
Jamieson, M., and Bodonyi, J.M. (1999). Data-Driven Child Welfare Policy and Practice in the Next Century. In Child Welfare,
78, 1, 15-30. Retrieved August 30, 2003, from the OCLC FirstSearch database. Jonson-Reid, M. and Barth, R.P. (2003). Probation Foster Care as an Outcome for Children Exiting Child Welfare Foster
Care. In Social Work, 48, 3, 348-362.
Kalland, M. and Sinkkonen, J. (2001). Finnish Children in Foster Care: Evaluating the Breakdown of Long-Term Placements. In Child Welfare, 80, 5, 513-527.
Landsman, M.J., Groza, V., Tyler, M., and Malone, K. (2001). Outcomes of Family Centered Residential Treatment. In Child
Welfare, 80, 3, 351-379. Retrieved May 30, 2003, from the ProQuest database. Lawrence-Webb, Okundaye, J.N., and Hafner, G. (2003). Education and Kinship Caregivers: Creating a New Vision.
In Families in Society, 84, 1, 135-142.
Leslie, L.K., Hurlburt, M.S., Landsverk, J., Rolls, J.A., Wood, P.A., and Kelleher, K.J. (2003). Comprehensive Assessment for Children Entering Foster Care: A National Perspective. In Pediatrics, 112, 1, 134-145.
Leslie, L.K., Landsverk, J., Horton, M.B., Ganger, W., and Newton, R.R. (2000). The Heterogeneity of Children and their Experiences in Kinship Care. In Child Welfare, 79, 3, 315-334.
O‘Brien, P., Massat, C.R., and Gleeson, J.P. (2001). Upping the Ante: Relative Caregivers‘ Perceptions of Changes in Child Welfare Policies. In Child Welfare, 80, 6, 719-748. Retrieved May 30, 2003, from the ProQuest database.
O‘Donnell, J.M. (1999). Involvement of African American Fathers in Kinship Foster Care Services. In Social Work, 44, 5, 428-
441. O‘Donnell, J.M. (2001). Paternal Involvement in Kinship Foster Care Services in One Father and Multiple Father Families. In
Child Welfare, 80, 4, 453-479.
Scannapieco, M., Hegar, R.L., and McAlpine, C. (1997). Kinship Care and Foster Care: A Comparison of Characteristics and Outcomes. In Families in Society, 78, 5, 480-488.
Schwartz, A.E. (2002). Societal Value and the Funding of Kinship Care. In The Social Services Review, 76, 3, 430-459.
Retrieved August 11, 2003, from the ProQuest database. Shlonsky, A.E., and Berrick, J.D. (2001). Assessing and Promoting Quality in Kin and Nonkin Foster Care. In The Social
Service Review, 75, 1, 60-88.
Testa, M.F. (2002). Subsidized Guardianship: Testing an Idea Whose Time has Finally Come. In Social Work Research,
26,3,145-158.
Webster, D., Barth, R.P., and Needell, B. (2000). Placement Stability for Children in Out-of-Home Care: A Longitudinal Analysis. In Child Welfare, 79, 5, 614-632.
Werner, E.E. (1999). Children of the Garden Island. In A. Slater and D. Muir (Eds.), The Blackwell Reader in Developmental
Psychology (pp. 482-492). Malden, MA: Blackewell. Whittaker, J.K. and Maluccio, A.N. (2002). Rethinking ―Child Placement‖: A Reflective Essay. In The Social Review, 76, 1,
108-134.
Worrall, J. (2001). Kinship Care of the Abused Child: The New Zealand Experience. In Child Welfare, 80, 5, 497-511.
Retrieved August 11, 2003, from the ProQuest database. Wulczyn, F., Kogan, J., and Harden, B.J. (2003). Placement Stability and Movement Trajectories. In The Social Service
Review, 77, 2, 212-236.

Barbara-Leigh Tonelli, Jean Gordon and Michael Williams
232
LEADERSHIP STYLES AND FUNDING: AN ANALYSIS OF CALIFORNIA JUVENILE DELINQUENCY PREVENTION PROGRAMS RECEIVING FEDERAL
GRANTS
Barbara-Leigh Tonelli, Jean Gordon and Michael Williams Coastline Community College, Capella University and Touro College
ABSTRACT
Leadership styles vary within programs for at risk youth in the prevention of juvenile delinquency. There is a real need to
identify directors‘ leadership style of such programs to optimize juvenile delinquency prevention, and discern the correlation
between the programs being awarded Federal grant money for the prevention of juvenile delinquency. Although many
Leadership theories exist, the focus of this dissertation will analyze transactional and transformational leadership models,
synthesize the models comparisons and contrasts, and evaluate which leadership model is most widely implemented within
programs for the prevention of juvenile delinquency that receive Federal grant money.
The increase in juvenile delinquency is growing at an alarming rate according to Department of Justice statistics (OJP, 2001). If the 2001 rates of incarceration are to continue, more than 16,000 murders a year, coupled with millions of youth that will be incarcerated annually, the evidence suggests a requisite for the prevention of juvenile delinquency programs has reached a pinnacle. There is a need for change, and without intervention, there will be no change. Juvenile delinquency prevention programs have been found to challenge the rising number of violations and arrests. Perhaps if these programs continue to function and thrive through grant funding, crime prevention will be optimized within the at-risk youth population. This study identifies if a correlation exists between leadership styles of the directors of California juvenile delinquency prevention programs and the Federal grant money received by their programs. The emphasis drawn from the analysis of this data will provide a means of enhancement to this type of program‘s revenue to improve each program‘s ability to enrich at risk youths‘ experiences, while contributing to the prevention of juvenile delinquency. This research study was based on the Bass (1997) model of transformational, transactional, and laissez-faire leadership theory, and Harold Lynn Frittz (2005) model dissertation. The three hypotheses in the null and alternative form were the following: Hypothesis H01 (null): Transformational Leadership style is not the most common Leadership Style used by California juvenile delinquency prevention programs receiving Federal grant money. Hypothesis HA1 (alternative): Transformational Leadership style is the most common Leadership Style used by California juvenile delinquency prevention programs receiving Federal grant money. Hypothesis H02 (null): Transactional Leadership style is not the most common Leadership Style used by California juvenile delinquency prevention programs receiving Federal grant money. Hypothesis HA2 (alternative): Transactional Leadership style is the most common Leadership Style used by California juvenile delinquency prevention programs receiving Federal grant money. Hypothesis H03 (null): There is not a common Leadership Style used by California juvenile delinquency prevention programs receiving Federal grant money. Hypothesis HA3 (alternative): There is a common Leadership Style used by California juvenile delinquency prevention programs receiving Federal grant money. A summary of the demographic characteristics of the respondents were broken down to consist of directors and their delegates of juvenile delinquency prevention programs within the state of California that receive federal grant money. The gender, age, income level, and experience of the subjects were not relevant to the research due to the limitations of the study.

Leadership Styles and Funding: An Analysis of California Juvenile Delinquency Prevention Programs Receiving Federal Grants
233
The occupation of the participants and the possession of a working e-mail address were the only criteria for subjects to participate in the research study. The study required the subject to be actively employed by a juvenile delinquency prevention program within the state of California which receives federal grant money for its program. The sampling frame for this correlation study consisted of a combined 100 directors and their delegates of programs for at risk youth in California that were recipients of Federal grant money awarded by the Department of Justice Office of Juvenile Justice and Delinquency Prevention, for developing, testing and demonstrating promising new programs in the State of California. Data from this study was gathered using the Multifactor Leadership Questionnaire (5X) (Revised) which measures and identifies three types of leadership style: transformational, transactional, and laissez-faire (Avolio & Bass, 2004) using 45 questions on a Likert-type scale ranging from 0 (Not at all) to 4 (Frequently, if not always). The sample group of directors and their delegates were accessed via cross referencing with the Department of Commerce Federal Assistance Award Data System (FAADS) data base of grant recipients for the prevention of juvenile delinquency programs (U.S. Census Bureau, 2006) referred by the Department of Justice Juvenile Division. The reference codes for prevention of juvenile delinquency programs were 16.541, 16.548, and 16.726. The next step in data collection cross referenced via Advance Search Google.com the phrase ―prevention of juvenile delinquency,‖ and the acronym ―FAADS‖ (Federal Assistance Award Data System), by individual city. The recipients of these grants were listed accordingly and grant recipients‘ program name, address, Web site, contact information, and phone number for the subsequent survey implementation were recorded. The researcher contacted 312 potential subjects via the telephone. A total of 163 verbal commitments were received to complete the survey. Follow-up e-mails were sent to the target population a total of 109 times during the 6 month period before obtaining the required 100 participants‘ to complete the survey. Five participants of the 163 electronically opted out from taking the survey, and 58 never received the 109 e-mail transmissions due to extensive firewalls in place and therefore never responded. The response rate values from the MLQ multirater leadership surveys reflect the number of perceived frequencies an individual leader demonstrated or exhibited a specific behavior, as perceived by themselves, peers, colleagues, or subordinates. The scores were calculated in a two part step. First, the collected data detailed the frequency of each of the 45 MLQ survey questions where the identification of the highest frequency of the number of perceived frequencies an individual leader demonstrated or exhibited a specific behavior, as perceived by themselves, peers, colleagues, or subordinates per each question, which supplied the data necessary for step two. The values of 3.60, 2.82, and 0.00 calculated in step two are representative of scores reflecting that a higher frequency is indicative that a higher degree of perceived leadership style for the director or delegate of juvenile delinquency prevention programs receiving federal grant funding shown in Table 1.
Table 1: Results of First Three Null and Alternative Hypotheses
Style Frequency
Transformational Leadership 3.60
Transactional Leadership 2.82
Passive/Avoidant Behavior 0.00
These findings suggest there is a higher frequency of perceived Transformational Leadership style, a lower frequency of perceived Transactional Leadership and an absence of perceived Passive/Avoidant Behavior leadership style within the subject population of 100 participants of directors or their delegates of juvenile delinquency prevention programs receiving federal grant funding. The research findings supports Transformational Leadership style is the most common Leadership Style used by California juvenile delinquency prevention programs receiving Federal grant money. The following literature review provides a brief overview of the capability of the study to identify if there is a common leadership style between federal grant recipient directors of programs toward the prevention of juvenile delinquency and if the research relates to any other studies performed to identify a similar correlation (Francis, 1998).

Barbara-Leigh Tonelli, Jean Gordon and Michael Williams
234
Mark A. Cohen, Professor of Vanderbilt University examined the cost of crime from a prevention perspective. Research results concluded that for each high risk juvenile prevented from choosing a life of crime, this could save the country between $1.7 million and $2.3 million per youth (Cohen, 2004). In 2003, the Special Emphasis Discretionary Grant Program of the Office of Juvenile Justice and Delinquency Prevention (OJJDP, 2005) provided continuing support for truancy intervention and prevention, and a diminution in gang involvement. Juvenile justice activities have been awarded over $400 million in 2004 which involve delinquency prevention programs promoting mentoring and working to reduce gang violence (OJP, 2005). No research to date has identified if a correlation exists between the leadership style implemented within California juvenile delinquency prevention programs and the federal grant money they receive. As a result of leadership styles, Luckner and Nadler (1995) believe the effect that participation in an outdoor program has on its participants depends largely on the ―self-talk‖ (p. 175) the participant creates from his or her experience. The stories fashioned about the experience determine the memory and loosely translates into the meaning of the recipients‘ perception, which is naturally expounded from a transformational leadership model. The stories of what the participants believed they achieved during the activity, helps program information in participants‘ recollections and transfer it to other situations in the future (e.g. ―If I climbed that mountain in that program, then I can certainly do this‖; Warren, 2005). Luckner and Nadler also believe that program leaders should be trained to assist participants in coauthoring their stories so that they can generalize their experiences to other aspects of their lives in the future (Warren) which are congruent with the transformational leadership model. The success of the after school program whether in an outdoor or a ranch setting has demonstrated the ability to enrich lives of the participants. The research suggests the effects of after school sport and study hall experiences are positive and should be implemented in communities throughout the country (Collum, 2003), justifying this research to identify the most effective leadership style to optimize California juvenile delinquency prevention programs receiving federal grant money. Social science has long recognized that leadership exceeds a transactional relationship between leaders and subordinates. However up until the early 1980s most of the training received by leaders was transactional in nature where goals were clearly identified and followers received reinforcement for task completion (Weber, 1998). The transformational leader provides vision and a sense of pride, gaining respect and trust of the followers. Robbins (1998, p. 374) supports Bass‘s (1990) determination that ―transformational leaders provide inspiration, individualized consideration, intellectual stimulation, and even possess charisma.‖ The distinction presented by Avolio and Gibbons (1988) however that transformational leadership is more than charisma.
The purely charismatic [leader] may want followers to adopt the charismatic‘s world view and go no further; the
transformational leader will attempt to instill in followers the ability to question not only established views but
eventually those established by the leader. (p. 47)
Outwardly a clear picture emerges where the research findings support the Hypothesis HA1 (alternative): that transformational leadership style is the most common leadership style used by California juvenile delinquency prevention programs receiving federal grant money. Conclusively, the research would have to consider if the limitations of the study impacted the findings. Over 300 potential participants were personally contacted via the telephone and only 109 subjects responded for varying reasons. The results perhaps indicate the research question was improperly phrased, where if the hypothesis tested for only two leadership styles, and theoretically a leadership style not hypothesized, may have provided evidence to suggest an overwhelming prevalent leadership style. Alternatively, other leadership styles could have scored considerably lower on the frequency scale. A future research recommendation from this study would be to test the hypothesis: Transformational and Transactional Leadership styles are the most common Leadership Style used by California juvenile delinquency prevention programs receiving federal grant money. Therefore, if similar study results were derived, evidence from the research data analysis may definitively suggest a correlation is demonstrated to exist between leadership styles of the directors of California juvenile delinquency prevention programs and the federal grant money received by their programs.

Leadership Styles and Funding: An Analysis of California Juvenile Delinquency Prevention Programs Receiving Federal Grants
235
Compelling evidence could then suggest it prudent and rational to anticipate program directors implementing an alternative leadership style other than transformational and transactional styles identified may choose to emulate the leadership style of those program directors receiving federal grant funding, as a way to optimize their programs‘ ability to receive federal grant money. This research study‘s conclusions clearly connect to the results; however, in some instances, the data analysis does not support the hypotheses or fully answer the research question. The range of perceived behavior frequency between transformational leadership style and perceived behavior frequency transactional leadership style is not as wide of a spread between the two leadership styles as the researcher anticipated. The absence of definitive findings is not uncommon in dissertation research; however, the outcome of this research study is not interpreted to have failed, as the surrounding purpose of this dissertation has added to the body of knowledge. Although the analysis supports the researcher‘s contentions and answered the hypotheses posed, the results were without overwhelming results. The absence of an expected outcome where the perceived behavior frequency between transformational and transactional leadership styles was not overwhelmingly demonstrated within the limitations of the research study; therefore, contribute to the disciplinary body of knowledge. The research findings of this study support Transformational Leadership style is the most common Leadership Style used by California juvenile delinquency prevention programs receiving federal grant money as indicated by the MLQ survey results where the highest number of perceived frequencies an individual leader demonstrated or exhibited a specific behavior, as perceived by themselves, peers, colleagues, or subordinates; however, there is an absence of a significant range of measurement between transformational and transactional leadership styles, likely due to the limitations of the study. Recommendations for future research reveal the study could have been improved by surveying a larger sample population by surveying additional states or regions within the United States, such as western, eastern, Midwest, southwest, Deep South, and so on. Also, surveying delegates exclusively or directors exclusively to compare and contrast the results would be a suggestion. A more comprehensive data collection may have been gathered to make the results more meaningful with an implementation of alternative survey submissions in addition to an electronically transmitted survey, such as provisions to allow faxed or hard copy survey submissions. The integrity of these alternative surveys would necessitate careful consideration to assure the quality of the data collected. More participants would have responded if alternative methods of posting their survey responses were made available to them. High level firewalls and spam blockers prevented 58 potential subjects the opportunity to respond. Future studies may also be directed to test for additional leadership styles other than transformational or transactional, as results of this suggest an unexpected complete absence of passive/avoidant leadership style. Although the evidence suggests transformational leadership style was demonstrated with the highest frequency, the research also suggests a transactional leadership style was demonstrated with a lower frequency than transformational leadership style. High quality research does not answer all the questions, but does point to further activity that will strengthen disciplinary knowledge of the topic, leaving the research to explore how other leadership styles frequency levels that were not tested would score. A final recommendation for future research would be to test the hypothesis: Transformational and Transactional Leadership styles are the most common Leadership Style used by California juvenile delinquency prevention programs receiving Federal grant money. Therefore if similar results are derived, the evidence from the research data analysis would suggest a correlation is demonstrated to exist between leadership styles of the directors of California juvenile delinquency prevention programs and the federal grant money received by their programs. It seems prudent and rational then to anticipate that program directors implementing an alternative leadership style other than the two styles identified (transactional or transformational) may choose to emulate the leadership style of program directors receiving federal grant funding, as a way to optimize their programs‘ ability to receive federal grant money.
REFERENCES
Avolio, B. J., & Bass, B. M. (2004). Multifactor Leadership Questionnaire (3rd ed.) manual and sampler set. Retrieved June 19, 2006, from http://www.mlq.com.au/Products/mlq/body_mlq.html

Barbara-Leigh Tonelli, Jean Gordon and Michael Williams
236
Avolio, B. J., & Gibbons, T. C. (1988). Developing transformational leaders: A life span, approach. San Francisco: Jossey-Bass.
Bass, B. M. (1990). Transactional to transformational leadership: Learning to share the vision: Organizational dynamics. In S. P. Robbins (Ed.), Organizational behavior (pp. 374–375). Upper Saddle River, NJ: Prentice Hall.
Bass, B. M. (1997). Leadership and performance beyond expectations. In M. Horner (Ed.), Leadership theory: Past, present and future. Team Performance Management, 3(4), 1997, 270–287.
Cohen, M. A. (2004). The monetary value of saving a high-risk youth. In W. Christeson & S. Newman (Eds.), Caught in the
crossfire: Arresting gang violence by investing in kids (pp. 5–53). Washington, DC: Fight Crime: Invest in Kids. Collum, R. (2003). An investigation of the impact of participation in an after school program on the academic achievement and
social behavior of adolescent Black males defined as at-risk. Doctoral dissertation, Florida State University, College of Education, Department of Physical Education, Tallahassee.
Francis, B. J. (1998). The proposal cookbook, A step by step guide to proposal and design and writing (5th ed.). Naples, FL: MicroFutures.
Frittz, H. L. (2005). Transformational, transactional, and laissez-faire leadership: An examination of the Bass (1985) theory in
the university classroom environment. Doctoral dissertation, Capella University, Minneapolis, MN. Luckner, J. L., & Nadler, R. S. (1995). Processing adventure experiences: It‘s the story that counts. Therapeutic Recreation
Journal, 29, 175–183. Office of Justice Programs. (2001). Juvenile delinquency prevention federal grant funding. Retrieved June 17, 2006, from
http://www.ojp.usdoj.gov Office of Justice Juvenile Delinquency Prevention. (2005). Juvenile delinquency prevention federal grant funding. Retrieved
June 17, 2006, from http://www.ojp.usdoj.gov Robbins, S. P. (1998). Organizational behavior. Upper Saddle River, NJ: Prentice Hall. U.S. Census Bureau. (2006). Model Programs Guide, version 2.5. Retrieved July 22, 2006, from
http://www.census.gov/govs/www/cffr04.html Warren, K. (2005). A path worth taking: The development of social justice in outdoor experiential education. Retrieved June
17, 2006, from http://www.outwardbound.com.us Weber, M. (1998). The theory of social and economic organization. In B. J. Avolio & B. M. Bass (Eds.), You can drag a horse
to water but you can‘t make it drink unless it is thirsty. The Journal of Leadership Studies, 4(1), 394.\

Teacher Preparation for Universal Basic Education Program in Nigeria Using Information and Communication Technology: Opportunities and Challenges
237
TEACHER PREPARATION FOR UNIVERSAL BASIC EDUCATION PROGRAM IN NIGERIA USING INFORMATION AND COMMUNICATION TECHNOLOGY:
OPPORTUNITIES AND CHALLENGES
P.N. Okorji, V.N. Nwogbo and C.O. Ezeugbor Nnamdi Azikiwe University
ABSTRACT
Improving the quality of education through the diversification of contents, methods and promoting innovation is fundamental to
the creation of effective human capital in any country, particularly in a developing economy like Nigeria. With the vision of
changing teaching and learning paradigms in Africa, this paper focused on teacher preparation for Universal Basic Education
(UBE) Program through information and communication technology (ICT). Three research questions guided the study. The
data were gathered through questionnaire which was administered to 150 respondents who were accessible in both the
Faculty of Education and Schools of Education in the Institutions selected for the study. The data were analyzed using
Percentages, Mean and chart. The findings of the study among others suggested that the respondents accentuated to the fact
that Radio, Computer, Web-based courses among others can be used for teacher training in Nigeria. It was found that there
abound many prospects and opportunities in ICT usage for teacher‘s preparation for UBE, which include training and access
in ICT among others. Among the challenges of using ICT for the training of teachers in Nigeria includes funding, Lack of
training in ICT, inadequate ICT facilities among others. Thus, the onus is on how to effectively resolve these challenges to
ensure the sustainability of the teacher education program for the production of quality teachers for UBE program in Nigeria.
Keywords: Teacher Preparation, Universal Basic Education, Information and Communication Technology, Nigeria
INTRODUCTION
Education is generally known as one of the crucial allies of development and very fundamental to the creation of effective human capital in any country particularly in a developing economy. In Nigeria, one of the countries in sub- Saharan Africa (SSA) the 1999 constitution places education in the concurrent list and education is adopted as an instrument par excellence for national development (Federal Republic of Nigeria (FRN), 2004). Teachers constitute the most important group of stakeholders in determining good quality education. Based on this the training of these teachers who facilitate the education of the people is paramount to the government. As a result the FRN (2004) stated that teacher education will continue to be given attention in all educational planning efforts, because no education can rise above the quality of its teachers. This view was crystallized by Ukeje(2002) when he said that what teachers know and can do can make a great difference and what they do not know and cannot do or fail to do can be an irreparable loss to children. Subscribing to this view point Lassa (2000) stated that the importance of teachers and the roles they play in the education process is fundamental and akin to basic education, particularly in developing countries. The 1990 World Conference on Education for All (EFA) for the year 2000 held in Jometian Thailand signaled the introduction of Universal Basic Education (UBE) Program in Nigeria. The UBE scheme was aimed at increasing access and improving poor quality in the nation‘s education system. Prior to the introduction of UBE in the country Nigeria‘s human development record was rated very low. According to a United Nations Development Program (UNDP) report by Adewole (1998), it showed that Nigeria was ranked 137th out of 174 countries in the Human Development Index in 1996 and dropped further to 141st in 1997. The report stated that 47.5% of the nation‘s population is illiterate. This perhaps underscores the need for UBE scheme to save the nation from the rot and decay of the past and improve the human potential for a sustainable economy. While it is good news that many more children in Nigeria are receiving basic education the demand for teachers in both quality and quantity to match the growing population of school children becomes obvious (UNESCO, 2002). Apparently, teacher preparation seemed to be the most daunting challenge facing the education system in Nigeria. Perratton and Potashnik (1997) are of the opinion that teacher education has been severely criticized on the grounds of quality and quantity. Experts have reiterated that there is only modest evidence of the effectiveness of the Nigeria teacher education

P. N. Okorji, V. N. Nwogbo and C. O. Ezeugbor
238
program. Okebukola (2002) opined that teacher education in the last two decades had been characterized by incessant instability, not unconnected with attempts by practitioners in the field to better their lot. The education program has not responded to the hopes and aspirations of well meaning Nigerians. The teacher preparation program has failed to respond and adhere to the provisions of the National Policy which stated intalia that teachers shall be regally exposed to innovations in their profession (FRN, 2004). The 21st century is an information driven era. The emergence of Information and Communication Technology (ICT) has serious implications for teacher education. There is need to exploit the potentials and opportunities of ICTs which include radio, television, computers and internet as powerful enabling tools for educational change and reform. UNESCO (2002) supported this view by stating that teacher training is crucial using ICTs tools that can help teachers take full advantage of the potentials of the technology in improving educational delivery. Thus it places huge demand on teachers who are facilitators and custodians of knowledge. It appears that many teachers in Nigeria have been unable to find effective ways of using technology in the classroom, or any other aspect of the teaching and learning style. The possible explanation of this lack of success according to Ololube (2006) is that teachers are not adequately trained in using ICTs in teaching coupled with the fact that Nigeria as a nation came late and slowly into ICT usage. Another obvious factor s which was recognized by Afemikhe (2004) is that the teacher education program in Nigeria is too restrictive and as such fail to adequately cater for the societal need which is central in every curriculum endeavor. It is expected that in a complex society like Nigeria teachers need training not only in computer literacy but also in the application of various kinds of software in teaching and learning. It therefore suggest that for EFA and UBE to succeed teacher education reform is inevitable in order to strengthen the relevance of education, raise educational quality, improve professional competences through effective integration of ICTs into the teacher preparation program.
Problem of the Study
In a developing and complex society like Nigeria, we recognize that teachers meander through multiple problems as the play the roles of learning facilitators, counselors of students, work colleague, employee and member of a profession. They key assertion of this paper is on teacher preparation for UBE using ICTs. It addresses both the opportunities and the challenges of technological based learning. The Federal and State Governments had in the past used various policies to establish adequate and effective teacher education program to help in the preparation of competent teachers in the country. Evidence from past research works suggest that, teacher education program in Nigeria has a fundamental flaw which has hindered its development. It appears that most faculty of education in the universities and colleges of education lacked adequate ICT infrastructure and this tend to reduce access to ICTs instructional material to lecturers and students. Perhaps, there is need to better design teacher education curriculum as well as organize programs so that teachers can adequately plan for unanticipated and unintended problems that confronts then in the classroom.
Research Questions
The following research questions guided the study: 1. How can teachers be prepared for UBE program in Nigeria using ICT? 2. What are the opportunities of ICT for teachers with respect to UBE? 3. What are the challenges, of teacher preparation for UBE using ICT?
METHODOLOGY
The survey – descriptive research design was adopted for this study which is a simple assessment of the program workability as it concerns teacher preparation for UBE using ICTs. The population of the study comprised all the 250 lecturers in the three Federal Government owned Institutions in Anambra State of Nigeria. These institutions were one University, one Polytechniic and one College of Education – all three institutions offer teacher education programs.
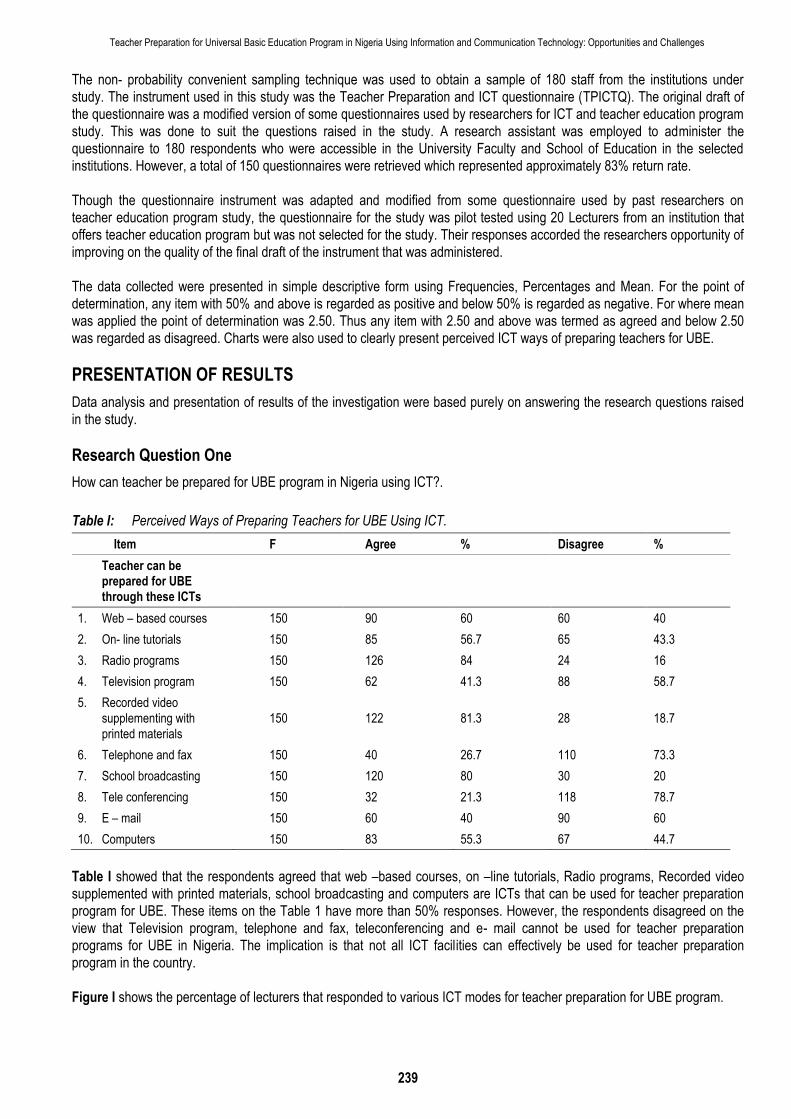
Teacher Preparation for Universal Basic Education Program in Nigeria Using Information and Communication Technology: Opportunities and Challenges
239
The non- probability convenient sampling technique was used to obtain a sample of 180 staff from the institutions under study. The instrument used in this study was the Teacher Preparation and ICT questionnaire (TPICTQ). The original draft of the questionnaire was a modified version of some questionnaires used by researchers for ICT and teacher education program study. This was done to suit the questions raised in the study. A research assistant was employed to administer the questionnaire to 180 respondents who were accessible in the University Faculty and School of Education in the selected institutions. However, a total of 150 questionnaires were retrieved which represented approximately 83% return rate. Though the questionnaire instrument was adapted and modified from some questionnaire used by past researchers on teacher education program study, the questionnaire for the study was pilot tested using 20 Lecturers from an institution that offers teacher education program but was not selected for the study. Their responses accorded the researchers opportunity of improving on the quality of the final draft of the instrument that was administered. The data collected were presented in simple descriptive form using Frequencies, Percentages and Mean. For the point of determination, any item with 50% and above is regarded as positive and below 50% is regarded as negative. For where mean was applied the point of determination was 2.50. Thus any item with 2.50 and above was termed as agreed and below 2.50 was regarded as disagreed. Charts were also used to clearly present perceived ICT ways of preparing teachers for UBE.
PRESENTATION OF RESULTS
Data analysis and presentation of results of the investigation were based purely on answering the research questions raised in the study.
Research Question One
How can teacher be prepared for UBE program in Nigeria using ICT?.
Table I: Perceived Ways of Preparing Teachers for UBE Using ICT.
Item F Agree % Disagree %
Teacher can be prepared for UBE through these ICTs
1. Web – based courses 150 90 60 60 40
2. On- line tutorials 150 85 56.7 65 43.3
3. Radio programs 150 126 84 24 16
4. Television program 150 62 41.3 88 58.7
5. Recorded video supplementing with printed materials
150 122 81.3 28 18.7
6. Telephone and fax 150 40 26.7 110 73.3
7. School broadcasting 150 120 80 30 20
8. Tele conferencing 150 32 21.3 118 78.7
9. E – mail 150 60 40 90 60
10. Computers 150 83 55.3 67 44.7
Table I showed that the respondents agreed that web –based courses, on –line tutorials, Radio programs, Recorded video supplemented with printed materials, school broadcasting and computers are ICTs that can be used for teacher preparation program for UBE. These items on the Table 1 have more than 50% responses. However, the respondents disagreed on the view that Television program, telephone and fax, teleconferencing and e- mail cannot be used for teacher preparation programs for UBE in Nigeria. The implication is that not all ICT facilities can effectively be used for teacher preparation program in the country. Figure I shows the percentage of lecturers that responded to various ICT modes for teacher preparation for UBE program.

P. N. Okorji, V. N. Nwogbo and C. O. Ezeugbor
240
Figure I: Lecturers Perception in relation to ICTs for Teacher Preparation for UBE Program
Research Question Two
What are the opportunities in using ICT for Teachers preparation with respect to UBE program?
Table 2: Opportunities for ICT Usage for Teacher Preparation with Respect to UBE Program
Items N = 150
Mean Responses
Opportunities in using ICTs for teacher preparation include
1. It provides knowledge sources 3.04 *
2. It promotes efficiency 3.09 *
3. It facilitates quicker and easier communication and networking 3.16 *
4. It allows teacher opportunity to perform administrative tasks more quickly and thoroughly 3.10 *
5. It reduces duplication of efforts through using templates, proformas and shared teaching resources 2.96 *
6. It offers high quality training 2.98 *
7. Many people can be reached at the same time 3.02 *
8. It enhances the quality of teaching & learning 3.00 *
9. It provides support and motivation to learn 2.83 *
10. It improves home – school links through greater access to information 2.84 *
Note: * mean >2.5
Table 2 revealed that there was overwhelming agreement among the respondents in all the 10 items on the tables as indicators of ICTs for teacher preparation for UBE Program. The obvious in implication is that using ICT for preparation can guarantee access, training, improved teaching and management functions among others.
Research Question Three
What are the challenges of using ICT for teacher preparation program for UBE?

Teacher Preparation for Universal Basic Education Program in Nigeria Using Information and Communication Technology: Opportunities and Challenges
241
Table 3: Challenges of Using ICT for Teacher Preparation Program for UBE
Items N = 150 Mean response
The challenges of using ICT for teacher preparation are:
1. Inadequate Technical Support 3.18
2. Lack of training 3.16
3. Lack of Access to ICT facilities 3.21
4. Inadequate funds 3.22
5. Lack of power supply 3.15
6. Safety and security of ICT facilities 3.05
7. Lack of policy statements 3.09
8. Inadequate ICT facilities 3.01
9. Poor monitoring & evaluation system 3.02
10. Organizational and policy changes 3.07
Note: * mean >2.5
Table 3. There were positive strong indications judging from the evidence on the table that the respondents agreed to the fact that the 10 items on the table are challenges of teacher preparation program using ICT. Such challenges among others include;
• Training • Technical support • Funds • Power supply and • Access
DISCUSSION OF RESULTS
From the analysis and results obtained, it was found that teachers can be prepared or trained for UBE program in Nigeria using various ICT facilities for instruction. The most notable and best suited ICTs for the training of teachers which the study revealed include Radio, recorded video supplemented with printed materials, school broadcast, web – based courses and computers. Radio and printed materials which are old or traditional ICTs according to UNESCO (2002) have been used widely as educational tools. Radio lessons developed around specific learning objectives are intended to improve quality of classroom teaching to act as a regular structured aid to poorly trained classroom teachers (Perraton & Creed, 2002). The finding of the study negate the use of television which past research workers found to be effective for reaching out to large population ( Iwanga, 2002). Perhaps the obvious reason for the disagreement in view cannot be unconnected with the poor power supply in Nigeria. Often times power supplies is epileptic and regularly interrupted. In most rural communities where teachers are located, there are no electricity and this renders every effort at actualization of ICT services ineffective. The findings of the study indicated that ICT usage offer far reaching opportunities as training devices for the preparation of teachers for UBE. Transmission of knowledge to the new generation is an essential component of the educational process. Haddad & Jurich , (2005) suggests that ICT has myriad websites to help teachers develop or improve lesson plans, exchange ideas, obtain information, find free animation and simulation to support their lessons. It offers training and capacity building programs opportunities for teachers. This is because ICT has the potentials to act as a force for change in education, that is, to bring about changes that will affect learners, practitioners and the whole institution (Odile Quintin, 2006). The implication therefore is that for Nigerian teachers to reap the full benefits of ICT, it is essential that pre-service and in service teachers who are being prepared for UBE should be able to effectively use the ICT tools for learning. Accordingly, teacher education institutions and programs must provide the leadership for pre-services and in-services teachers and model the new pedagogies and tools for learning through effective strategic plan. Evidence from the research suggests that a number of challenging factors were found to act as drawbacks to ICT integration to education and to teacher training in particular. One issue of concern relates to training of teachers in ICT usage. This findings collaborates that of Olulube (2006) where he found that most teachers in Nigeria do not have the needed experience and competence in the use of computers. He observed that since 1988 when computer education was introduced in schools

P. N. Okorji, V. N. Nwogbo and C. O. Ezeugbor
242
in Nigeria, teachers have been unable to use the technology effectively in the classroom and in aspects of teaching and learning. Apparently, this is because the quality of teachers trained through the teacher education program are not well equipped technologically to be able to face the challenges especially in this UBE era. This presupposed that the existing curriculum must be overhauled to meet the global transformations. Closely linked to training is the issue of funding of ICTs and insufficient insight in ICT costs which tend to militate against ICT expansion and access to consumers., Osunde & Omoruyi (2004), supported this finding by stating that inadequate finance has been the greatest problem faced by teacher education institutions and this probably accounts for the limitations to the effectiveness of the institutions training programs. There must be definite policy statements in which teachers will be willing to embrace the changes and shift in knowledge. Okorji, Nwogbo & Ezeugbor (2007) recognized that ICT programs required sound policies that will lead to an understanding of roles of ICTs in education with respect to teacher preparation for the actualization of UBE objectives. Given the crucial opportunities that abounds in ICT for teacher professional development, there is need to re-design and repositioned our teachers who are custodians of knowledge to effectively participate in the global knowledge driven economy for the sustainability of UBE in Nigeria.
Recommendations
Based on the findings of the study, it is recommended that: Adequate training in computer appreciation and processes should be give teachers. Courses in computer basic skills
should be centralized and taught in the faculty or school of education as core courses not as university general course. This will offer more in depth knowledge and acquisition of computer skills and processes to teachers. Funds should be adequately provided to schools to tackle ICT needs of teachers. Government should help teachers to procure and own lap tops. The cost should be deducted minimally as pay back from salaries of teachers. This will offer them more opportunity of practicing at home and even have more access to ICT facilities. Alternative sources of funds generation like cyber café, computer maintenance workshop may be established for fund raising rather than relaying solely on government for fund provision. As alternative for electricity supply, solar energy supply may be tried out by schools. There may be need to liaise with communities for support or seek aid from some international agencies and organizations.
CONCLUSION
ICT is an influential tool for the development of quality teaching and learning for sustainable e education system. This research endeavor perhaps offers an insight in the understanding of impact and waves of ICTs on teacher‘s preparation towards producing a new caliber of teachers whose professional ability and competence are very necessary in a developing economy like Nigeria. Thus, it is essential to tackle the ICT challenges effectively in order to compete favorably with the other nations especially in the attainment of the UBE and the millennium development goals.
REFERENCES
Adewole, A. (1998) Education and Human Development. Journal of Educational Improvement. 1, 3- 12. Afemikhe, O.A (2004). Quality Assurance in Teacher Education in Nigeria: Reflection of an Evaluation in O.A. Afemikhe and
J.E Adewale (eds). Issues in Educational Measurement and Evaluation in Nigeria. pp. 17-26. Ibadan: Institute of Education UI.
Federal Republic of Nigeria (2204). National Policy on Education. Abuja: Nigerian Education Research Develop Council (NERDC).
Haddad, W.D & Jurich, S (2005). Education Potential and Policy. Available at http://wwwtechnos.net/jouemamall.volume712cubanhtm
Lassa, P.N. (2000). Teacher Production: A Focus on Nigeria. In Proceedings of the Education Mini summit holds in Abuja, Monday 29 November 1999
Okebukola P. (2002). Teacher Education in Nigeria; Past, Present and Future, in Teacher Education in Nigeria;Past, Present and Future. Proceedings of the First Teachers summit. Kaduna: NTI.

Teacher Preparation for Universal Basic Education Program in Nigeria Using Information and Communication Technology: Opportunities and Challenges
243
Okorji, P.N, Nwogbo, V.N & Ezeugbor C.O. (2007). The Role of Information and Communication Technologies in the
Management of Technical Secondary Schools in Anambra State. Nigerian Journal of Educational Administration and Planning, vol. 7, No. 3, pp 133 – 142.
Pertton, H & Potashnik (1997). Teacher Education at a Distance. Education and Technology. Technical Notes, vol. 2, No. 2. Ukeje, B.O. (2002). The Future of Teacher Education in Nigeria, in Teacher Education in Nigeria: Past, Present and Future.
Proceedings of the First Teachers‘ Summit. Kaduna NTI. UNESCO (2002). Information and Communication Technology in Education - A curriculum for Schools and Programme for
Teacher Development. Paris: UNESCO.

Sasha Pursley
244
THE MOTHERLAND CALLS: THE 46TH TAMAN GUARDS AVIATION UNIT IN THE SECOND WORLD WAR
Sasha Pursley Black Hills State University
ABSTRACT
In a speech to the Communist Party Plenum in 1987, Soviet leader Mikhail Gorbachev declared that ―War has an unwomanly face.‖32 This sentiment emphasized that women are caregivers, not life-takers and had a long history in the Soviet Union.
Despite the fact that the country boasted of gender equality, and that almost one million women served in the Soviet Armed
Forces during the Second World War, this attitude was widely held by both male and female citizens (including female
veterans) in the postwar era.
That such a belief was widely held attests to the tension that existed between the Communist commitment to gender equality
and traditional Russian patriarchy, a tension that lasted throughout the Soviet period but which was most evident during the
Second World War. It was during these years that hundreds of thousands of Soviet women eagerly volunteered for duty at the
front and served their country with courage and distinction. Military records attest to the heroic actions of countless Soviet
women who served as snipers, tank drivers, nurses, pilots and navigators. In fact, judging by statistics, women‘s units often
outperformed male combat units, and were highly decorated. Yet at the end of the war, when these units were demobilized,
the women were encouraged not to speak of their experiences.
While the vast majority of Soviet women in the Second World War were assigned to mixed-gender units, the air force created
three all-female regiments. The first regiment was composed of fighter pilots, the second of day bombers, and the third of
night bombers. Eventually, the first two regiments became mixed units, but the night bombers remained an all-female unit
throughout the war. The night bombers, officially designated the 46th Taman Guards Women‘s Aviation Regiment, is the focus of this study. The 46th regiment draws attention to the connection between women, war and communism, a relationship that
has received little attention in the scholarly community, despite the fact that the separate issues of women and communism,
and women and war have been addressed.
DVOEVERIYA (DUAL BELIEF)
In twentieth century Soviet Union, concepts of masculinity and femininity can be derived in two major traditions. First, traditional Russian patriarchal notions of masculinity and femininity survived the Bolshevik revolution. These norms associated masculinity with power over the household, the tsar (father of the people), bravery, courage and war. Femininity was associated with subservience, the ―motherland,‖ caregivers, mothers and peace. The second tradition, which collided with traditional Russian patriarchy, was a manifestation of Soviet Marxist policy. The October Revolution of 1917 ushered in a new era for women, based on full equality under the law. Traditional notions of masculinity and femininity were upended by an ideology that sought to create a new image of the Soviet man and woman. No longer would patriarchal concepts of traditional gendered identities govern the sexes—rather the new Soviet individual would personify the belief that sexual equality equals sameness. Instead of blending equal parts of masculine and feminine qualities to create this new citizen, women were obliged to assimilate, to deny their femininity and conform to masculine standards. Official government policy toward women and the family underwent a significant shift in the first two decades of the Soviet Union. The 1920s were a time of sexual experimentation and a libertarian policy, but when Josef Stalin assumed power, official Soviet policy underwent a complete reversal. Despite Stalin‘s emphasis on a strong, stable family, the Communist Party continued to encourage women to enter the workforce and ―couched its appeals in the older rhetoric of women‘s liberation.‖33 The conservative Stalinist policy was still rooted in Soviet Marxist philosophy, which eclipsed traditional Russian
32 ―Plenum Kommunisticheskoi Partii SSSR 1987.‖ Cited in Aleksievich, Svetlana, U voiny—ne zhenskoe litso (Moscow: Sovetskii pisatel‘, 1988), p. 11. 33 Goldman, Wendy, Women, the State and Revolution (Cambridge: Cambridge University Press, 1993), p. 342.

The Motherland Calls: The 46th Taman Guards Aviation Unit in the Second World War
245
patriarchy, creating dual and often competing notions of gender. A significant parallel can be made with the history of religion in Russia. Paganism remained strong in early medieval Russia, and as Russians converted to Christianity, they retained strong pagan elements. The result was what scholars refer to as dvoeveriya, or ―dual-belief.‖ A similar type of dvoeveriya, based on notions of gender, existed in the Soviet Union. This gendered dvoeveriya was most visible in the Soviet Union during the Second World War. In an era of total war, gender boundaries became blurred. Women on the home front were called upon to support the war effort in a variety of ways that previously were considered masculine, from digging anti-tank ditches to working in munitions factories. This blurring of gender boundaries shows the dilemma facing Soviet women: was sexual equality equivalent to sameness? In other words, did sexual equality for women require a repudiation of qualities considered feminine? The experience of Soviet airwomen during the Second World War sheds light on this issue. Soviet airwomen in the Second World War were faced with a difficult challenge: while having to prove that they were just as good as men, they also had to show that engaging in combat was not turning them into men. They went about proving the first point in battle. The second point was played out in presenting a physical appearance, language, rituals and behaviors the airwomen thought of as feminine. The expectation of sacrificing one‘s sexuality affected the experience of the airwomen of the 46th regiment. In the vast majority of interviews conducted with Soviet airwomen, two points are made abundantly clear. First, the airwomen forcefully argue that they performed just as well as, if not better than, male military units. The second point is made with equal fervor: that they retained their femininity during and after the Second World War.
MARINA RASKOVA AND SOVIET AVIATION
The 1930s was a decade of great enthusiasm in the field of aviation. Stalin promoted the aviation sector, and personally sponsored world record-breaking attempts by aviators, dubbed ―Stalin‘s falcons.‖ The hero aviators included several women: the most prominent was Marina Raskova, who was to have an important impact on the formation of the women‘s aviation units in the Second World War. Raskova was born in Moscow in 1912, and in the early 1930s trained as a navigator and pilot at the Zhukovskii Air Force Academy. Upon receiving her diploma, she became an instructor at the Academy and joined the Red Army. 1937 was a critical year for Raskova: she became a full-time consultant to the NKVD, and began her series of world-record breaking long distance flights.34 Her crowning achievement occurred in 1939, when she smashed her previous record by flying an ANT-37 aircraft a distance of 6,450 km.35 Upon her return to Moscow, Stalin hosted a reception in her honor at the Kremlin. Raskova‘s flights were closely followed in the press, and inspired a generation of young women to learn to fly at civilian air clubs (Osoaviakhim). When war broke out, many of these young pilots volunteered for duty at the front. By June 1941, the Soviet Union had the largest air force in the world, with an estimated 9,576 combat aircraft.36 However, the actual strength and battle-readiness of the air force had been severely diminished by the Great Purges in 1938-39. In the civilian sector the Osoaviakhim air clubs had trained thousands of pilots; one out of every three or four pilots were women.37 Yet since only a handful of women served in the air force before 1941, the timing of and rationale for Stalin‘s decision in allowing the formation of the all-women aviation regiments can only be understood in the context of the war effort. When Germany invaded the Soviet Union on 22 June 1941, the country was caught by surprise. Soviet aircraft, parked in rows at air force bases, were sitting ducks for the blitzkrieg offensive. In the first months of the war, the Nazis moved east rapidly. There was much confusion in the military: this led to massive casualties and loss of territory. The fate of the Soviet Union hung in the balance.
THE DECISION TO FORM WOMEN’S AVIATION REGIMENTS
The decision-making process in wartime Soviet Union remains shrouded in mystery. Stalin did not permit stenographic notes of his meetings, so it is quite difficult for historians of the Soviet Union to definitively ascertain the process by which decisions were reached. However, in interviews the airwomen all agree that from the first days of the war, hundreds of Soviet women with pilot training wrote letters volunteering to be sent to the front. For several months the requests were denied. According to
34 The NKVD was the secret police organization, and was later renamed the KGB. 35 For a summary of Marina Raskova‘s record-setting flights, see Raskova, Marina, Zapiski shturmana (Moscow: Molodaya gvardiya, 1939). 36 Mel‘tiukhov, M.I., ―22 iiunia 1941 g.: Tsifri svidetel‘stvuiut,‖ Istoriya SSSR 3 (March 1991), pp. 16-28. 37 Mitroshenko, V., ―They Were First,‖ Soviet Military Review, March 1969, pp. 20-22; Cottam, K.J., Soviet Airwomen in Combat in World War II (Manhattan: Sunflower
University Press, 1983), p. 1.

Sasha Pursley
246
Chief of Staff Irina V. Rakobolskaya, in the first days of the war, Marina Raskova—who was already an officer in the Air Force—asked to be sent to the front, but was ―categorically refused.‖ After this, Raskova asked to form ―special women‘s regiments‖ and was told that her idea would be given consideration. Meanwhile, according to Rakobolskaya, letters kept pouring in from all over the country and ―Raskova was not one to sit on her hands.‖38 On 8 September 1941, Marina Raskova gave a speech that was broadcast by radio and reprinted in many newspapers. She appealed to her audience:
Soviet woman—she is the hundreds of thousands of drivers, tractor operators and pilots, who are ready at any
moment to sit down in a combat machine and plunge into battle…. Dear Sisters! The hour has come for harsh
retribution! Stand in the ranks of the warriors for freedom!39
Raskova had been given a seat on the People‘s Defense Committee, on or before 3 June 1941, and quite possibly used this position to lobby Stalin on the issue.40 Stalin was well aware of the fact that women had fought alongside men in the Bolshevik Revolution and in the Civil War, and as a ―good‖ Marxist had to at least give lip service to the equality of the sexes. Addit ional factors may also have played a role in the formation of the women‘s units. Personnel shortages might have been a factor but due to the catastrophic loss of aircraft in the first days of the war, Stalin made his decision at a time when the Soviet Union was in desperate need of more aircraft, not pilots.41 Some historians have viewed the women‘s regiments as an exercise in propaganda, with messages targeting Soviet troops and foreign opinion. By advertising the existence of the women‘s regiments to the international community, Stalin might gain sympathy for the Soviet Union as an underdog. By broadcasting the same news to his own troops, he would be attempting to shame male soldiers into greater acts of bravery. However, there are problems with this theory: the airwomen were not given much publicity, within the Soviet Union and abroad.42 However the decision was reached, on 8 October 1941 Stalin issued ―Order No. 99,‖ which called for the formation of three women‘s aviation regiments.43 All three units were to be formed under the supervision of Marina Raskova. The 586th fighter Regiment would be equipped with Yak-I aircraft. The 587th Dive Bomber Regiment (later renamed the 125th M.M. Raskova Borisov Guards Dive Bomber Regiment) would be equipped with SU-2 aircraft. The final unit, initially labeled the 588th Regiment (later given the title 46th Taman Guards Women‘s Aviation Regiment) was equipped with Po-2 aircraft. Initially, the 46th regiment consisted of 112 women divided into two squadrons, each with ten planes. By the end of the war, the regiment had increased to 300 women divided into four squadrons, one of which was used for training purposes.44
RECRUITMENT
The day after Order No. 99 was signed, the Central Committee of the Komsomol (Young Communist League) put out an appeal for young women willing to volunteer for duty at the front. The challenge was quickly taken up by a group of students at Moscow State University. One of the first recruits to sign up, Irina V. Rakobolskaya, was a third-year physics student at the university who realized that her country ―needed soldiers, not physicists.‖45 As an active Komsomol member, Rakobolskaya took the initiative and aggressively recruited female students willing to volunteer for duty at the front. Demographic data on the recruits shows that the experience of the regiment was shaped by age and level of education. The majority of the recruits were young, ranging from twenty to twenty-four years of age. There were exceptions, however: some recruits were as young as sixteen and others as old as twenty-nine. The average age was twenty-two.46 Different occupations in the regiment required different levels of education; thus the pilots and navigators tended to be slightly older and better educated than the rest of the crew. The airwomen referred to themselves as ―girls‖ (devushki), not ―women‖ (zhenshchiny). The use of this language reflects the young age of the recruits as well as their status as single women.
38 Rakobol‘skaya, Irina, V., ―Etogo zabyt‘ nel‘zia! Iz zapisok nachalnika shtaba polka Rakobol‘skoi I.,‖ unpublished manuscript, p. 1. My deepest gratitude goes to Irina
Viacheslavna Rakobol‘skaya for kindly allowing me access to this document, and for permission to quote from the manuscript. 39 Migunova, E.A., ―Prodolzheniie podviga,‖ in Zapiski shturmana prodolzheniie podviga (Moscow: DOSAAF, 1976), p. 244; Markova, Galina I., Vzlet: o Geroe Sovetskogo
Soiuza M.M. Raskova (Moscow: Politizdat, 1986), pp. 66-67. 40 Cottam, K.J., Women in War and Resistance. Selected Biographies of Soviet Women Soldiers (Nepean, Canada: New Military Publishing, 1998), p. 20. 41 Ibid, p. xix. 42 Pennington, Reina, ―The Propaganda Factor and Soviet Women Pilots in World War II, Minerva, vol. xv, no. 2 (Summer 1997). 43 ―Prikaz Narodnogo Komissara Oborony Soiuz SSSR No. 99,‖ Tsentral‘nyi Arkhiv Ministerstva Oborony, Fond Engel‘skoy VASh Pilotov, Fond 60396, Opis‘ 35912, List
103, Delo 58, Korpus 4014. 44 Pennington, Reina, Women, Wings and War: Soviet Airwomen in World War II Combat (Lawrence: University Press of Kansas, 2001), pp. 83-84. 45 Rakobolskaya, Irina V., in Noggle, Anne, A Dance with Death: Soviet Airwomen in World War II (College Station: Texas A&M University Press, 1994), pp. 26-27. 46 ―Nagradnye listy o prisvoenii zvaniya Geroyakh Sovetskogo Soiuza,‖ Fond 33, Opis‘ 793756, Tsentral‘nyi Arkhiv Ministerstvo Oborony.

The Motherland Calls: The 46th Taman Guards Aviation Unit in the Second World War
247
Initially, information about the women‘s aviation group spread by word of mouth: this explains why the majority of the volunteers were either native Muscovites, or happened to be studying at Moscow State University. The remaining volunteers heard about the new regiments either at Komsomol meetings, air clubs or through military channels. Those volunteers who were in Moscow in early October 1941 were directed to an assembly point in the city, and on 13 October were sent to the Zhukovskii Air Force Engineering Academy in Moscow, where final selections for the aviation group were made. It was at this point that the airwomen received their assignments. The most coveted position was that of a pilot, followed by navigator. These two positions required a higher degree of education. Yevgeniya Zhigulenko recalled that ―all of us who were navigators looked upon ourselves as a very elite group because our backgrounds were of colleges and universities. We were well-read, intellectually minded, had good manners, and never heard or said dirty words.‖47 Zhigulenko‘s comments, while elitist, provide several clues to understanding how the airwomen perceived femininity. According to Zhigulenko, femininity carried a class element: those from elitist backgrounds would be less likely to use—or hear—―dirty words,‖ than those from a working class background, who were assigned positions as mechanics, armorers and gunners. This class element in perceptions of femininity is supported by comments made by working-class members of the 46th
regiment. Klavdiya Ilushina, who had received training as a mechanic before being promoted to engineer, stated that the regiment‘s mechanics were from a ―very common strata of society: from factories, from working families.‖ When Ilushina first reported to the regiment, she was not pleased: she ―wasn‘t used to working with girls. . . [who] seemed noisy, and some of them were naughty.‖ Initially, Ilushina felt irritated with the situation, but after she got to know the girls better, she considered them her ―sisters.‖48 It is unclear which behavior Ilushina considered ―naughty‖: she may have simply been referring—like Zhigulenko—to ―dirty words.‖ While at the Zhukovskii Air Force Engineering Academy in Moscow, uniforms were issued to the volunteers. At this time there were no special uniforms for women: instead, the volunteers received standard men‘s clothing, including underwear. The volunteers dealt with their oversized uniforms as best as possible. While shirts and pants could be rolled up, shoes presented more of a problem: the women had to stuff the toes of boots with cloth. While at the front, the issue of clothing would become one of the most important ways that the airwomen fought to retain their femininity, by embroidering male uniforms. In early October, Moscow was coming under increasing pressure by the Nazi blitzkrieg. On 15 October 1941, Raskova received orders to evacuate the aviation group immediately to Engels Air Force Base—located 500 miles to the southeast, on the Volga river--in order to complete the formation and training of the three women‘s units.
TRAINING AND COMBAT
Upon arriving at Engels Air Force Base, Raskova ordered all the airwomen to receive regulation, boy-style haircuts. Many of the recruits met the news with dismay, but the order reflected Raskova‘s insistence on strict military discipline. Raskova‘s adherence to these standards partially reflected her own background in the Red Army. But there was an additional reason: Raskova herself understood the historic importance of the formation of the women‘s regiments, and often reminded her recruits, ―You are the first [women] that the army took, so whether they take any more depends on you.‖49 Raskova believed that in order for the women to excel according to masculine military norms, they must assimilate or sacrifice their sexuality in order to attain honorary male status. In the Soviet Union, virtually all women had long hair. Women‘s hair was also sexualized—married women (zhenshchiny) publicly covered their hair with shawls, while single women (devushki or ―girls‖) did not. That Raskova‘s first order was for the women to have their hair cut was highly symbolic of her insistence that the women assimilate in order to excel at masculine norms. In spite of her strict standards, Raskova was genuinely well-respected and liked by the airwomen. During the time they were at Engels Air Force Base, the women received an extremely condensed, intensive course of training. The flight training that normally took three years was condensed into less than six months: it included bombing and firing tactics, code navigation, and learning to fire machine guns and small arms. After several weeks of grueling round-the-clock training, a revealing event occurred. The Chief of Staff of the 125th Regiment happened upon Raskova enjoying a cigarette, which was considered a masculine activity. Raskova explained herself: ―It‘s nothing; when the war is over, I give you my word—I‘ll stop smoking! You‘re right, it‘s not the sort of thing for a woman to do,
47 Zhigulenko, Yevgeniya, in Noggle, op. cit., p. 54. 48 Ilushina, Klavdiya, ibid, p. 48. 49 Rakobolskaya, I.V., Poka stuchit serdtse: Dnevniki i pis‘ma Geroya Sovetskogo Soiuza Yevgenii Rudnevoi (Moscow: izdatel‘stvo moskovskogo universiteta, 1995), p. 15.

Sasha Pursley
248
but after all we‘re all now occupied with something that is not ‗women‘s business.‘‖50 Raskova‘s response indicates her own sensitivity to and ambivalence about masculine and feminine norms raised by women engaging in combat. Her comment suggests that Raskova believed that for the duration, she (and the other recruits) were ―men.‖ In February 1942, the 46th regiment was delivered their aircraft: the Po-2. Before the war, the aircraft had been used by flying clubs and ―no one would have dreamed of using it for military purposes.‖51 The Po-2 was a bi-plane, developed in 1927 by the Soviet engineer Nikolai N. Polikarpov. Equipped with a four-cylinder engine, the frame of the aircraft was constructed of canvas and plywood.52 It had two open cockpits, the first occupied by the pilot and the rear cockpit by the navigator. With a maximum speed of sixty miles per hour, the plane was used almost exclusively by the Soviet air force in night missions during World War Two that required precision bombing. The airwomen did not fly in formations, but instead flew one after another in a line toward the target, at three to five minute intervals. Planes would fly at an altitude of 1,000 meters, cut their engines and then swoop down to their target, before dropping their load at a height of no less than 400 meters before breaking away at a sharp angle to minimize the impact of the explosions on the aircraft. The airwomen then looped back to the airfield to re-arm and flew another mission with the same pattern. The Po-2 was not equipped with brakes or radios, and the flying instruments were rudimentary. The 46th was not the only regiment to fly the Po-2; male units used the aircraft as well. For the first three years of the war, parachutes were not made available to the airwomen, and only in 1944 were they issued to the pilots and navigators. The lack of parachutes was initially the result of a supply problem, but many of the pilots, when they were finally delivered, were reluctant to carry them on board. The parachutes took up extra weight, and in the case of a forced landing on Nazi-held territory, many women preferred death to being captured alive by enemy troops, which inevitably led to rape, summary execution or internment in concentration camps. In case the plane crash landed in Nazi-held territory, each pilot and navigator was issued a pistol: some airwomen preferred suicide to being captured. To the women of the 46th, rape was seen as the worst fate to befall a women warrior, for it represented a double-victimization: she lost her honor both as a warrior, and as a woman. Because the materials used to construct the plane were canvas and plywood, the Po-2 was prone to catching on fire when hit by enemy forces. The situation was made worse by the fact that the fuselage and gas tank were open and unprotected. In these situations, the pilot would do her best to get the plane back over Soviet territory and land in any field large enough to serve as a runway. In muddy conditions, landings and take-offs became much more difficult. Ground crews would place ―hardstands‖ on the runways, planks of wood that allowed the planes to increase traction. Ground personnel would stand on the planks and hold onto the wings, while the pilot revved up the engine to a high rpm. After the pilot gave a hand signal, the ground crew would release the wings, and the plane would take off. In late May 1942, six months after arriving at Engels Air Force Base for training, the regiment received its orders. The 46th regiment was assigned to the 218th Night Bomber Aviation Division, a section of the 4th Air Army. They were directed to the Southern Front, in the Donbas region. On the morning of their departure from Engels, garrison commander Colonel Bagaev gave a short farewell speech:
Today, for the first time, a women‘s regiment leaves our airfield for the front. You do not fly on awesome machines,
but on training aircraft. And it‘s true that you yourselves are not excessively awesome in appearance. But I am
certain that in these light-winged airplanes, you will be able to inflict heavy blows on the enemy. Let fly with you my
fatherly wish: success to you and combat glory!53
This speech is interesting for a number of reasons. First, Colonel Bagaev would never have spoken to a group of male pilots in the same way. While he might have told a group of male Po-2 pilots that they did ―not fly on awesome machines,‖ his additional comment that the airwomen were ―not excessively awesome in appearance‖ was patronizing. Knowing that the airwomen were breaching a set of norms, Bagaev was assimilating their behavior back into the social order through his ―fatherly wish.‖
50 Migunova, op. cit., p. 313. 51 Alexiyevich, Svetlana, War‘s Unwomanly Face, trans. Keith Hammond and Lyudmila Lexhneva (Moscow: Progress Publishers, 1988), p. 153. 52 Wagner, Ray (editor), The Soviet Air Force in World War II: The Official History (Garden City: Doubleday, 1973), pp. 14-15. 53 Aranova, R.E., Nochnye ved‘my (Moscow: Sovetskaya Rossiya, 1969), pp. 50-51.

The Motherland Calls: The 46th Taman Guards Aviation Unit in the Second World War
249
On 23 May 1942 the 46th regiment left the training base at Engels for combat duty, having been assigned to the 4 th Air Army on the Southern Front in the Donbas region. The following month, the regiment flew their first sortie at the front. Conditions at the front were primitive. The 46th usually slept in dugouts, which were large underground trenches covered with logs and soil. Inside were plank beds. At other times the airwomen were billeted by the local population, or slept under the wings of the aircraft. The women had to wash themselves using water from puddles, or by melting snow in the winter. One mechanic with the regiment, Junior Lieutenant Olga Yerokhina-Averjanova, recalled that ―our staff would say that we had to always remember that we were women and take care of ourselves.‖54 In spite of the harsh conditions, Rakobolskaya recalled that
We had parties and danced and sang, and we had amateur contests and wrote poetry. The first slogan of the
regiment was: you are a woman, and you should be proud of that. When weather caused the cancellation of a
mission, everyone stayed at the airfield and danced. It would never come into any man‘s head to do that, while waiting for permission to fly.55
Unlike the other women‘s regiments, the 46th had a single commander throughout the war—Yevdokiya Davydovna Bershanskaya. In the early days of the war, Bershanskaya was unaccustomed to military life: giving orders and military discipline were new to her. Neither she nor Rakobolskaya upheld the strict military discipline so characteristic of Marina Raskova. In part, this was a result of the chaotic conditions at the front—Rakobolskaya recalled that ―our superiors were not in a position to fuss over us.‖ Despite the relaxation of some aspects of strict army discipline, the airwomen were still expected to uphold the same standards of performance of male units. Rakobolskaya recalled one situation that resulted in severe punishment for two airwomen:
It was required that we fly with flares, which came with a parachute attached to slow their descent so we could see
where to land. Once two of our navigators, who did not use the flares while on a mission, separated the parachutes
from the unused flares. They used the material to sew underwear and pants, because we were supplied with only
male underwear. These crew members were brought to trial in the regiment for destroying military ammunition and
were each sentenced to ten years‘ imprisonment.56
The two crew members, however, were allowed to remain with the regiment ―to show their ability to settle down and be adequate military officers through their work.‖ One of them was killed in action; the other survived and was highly decorated by the end of the war.57 While the airwomen were held to the same standards of performance for male units, Rakobolskaya and Bershanskaya did create a more relaxed atmosphere that ultimately benefitted the entire regiment‘s performance. In this less strict setting, Bershanskaya was unafraid to innovate, and under her leadership, the 46th became one of the top-performing Po-2 night bomber regiments in the Soviet military. One of her innovations was a system of in-house training to provide continual replacements for flying personnel, which meant that the 46th regiment was never taken out of action for regeneration. Bershanskaya would later be singled out for mention as one of twelve ―remarkable air regiment commanders‖ in the Air Force.58 In conditions of war, Soviet airwomen developed new mourning rituals that challenged traditional modes of gendered behavior. One of the most painful casualties suffered by the three women‘s regiments was that of Marina Raskova, who crashed in a snowstorm on 4 January 1943. Raskova—a key figure in the formation of the women‘s aviation units—was also the commander of the 125th regiment. While delivering the final three crews of the 125th regiment to their new base in Stalingrad, Raskova missed her airfield in whiteout conditions and crashed into the upper banks of the Volga, dying instantly, along with three other crew members on her plane.59 Raskova‘s death made front page news for ten days: her body was recovered and sent by a special train to Moscow, where she was given the first state funeral of the war. Her ashes were interred by the Kremlin Wall.60 The worst single incident of casualties was on 31 July 1943, when the 46th lost four crews (eight people) to night fighters, which had not previously been encountered. On some occasions, airwomen witnessed their
54 Yerokhina-Averjanova, Olga, in Noggle, op. cit., p. 60. 55 Rakobolskaya, ibid, p. 29. 56 Ibid. 57 Ibid. 58 Kozhevnikov, M.N., Komandovanie i shtab VVS Sovetskoi Armii v Velikoi Otechestvennoi voine 1941-1945 gg. (Moscow: Nauka, 1977), p. 248. 59 Cottam, Women in War, op. cit., pp. 26-27. 60 For coverage of Raskova‘s death see the newspaper Krasnaya Zvezda on the following dates: 9 January 1943, p. 3; 12 January 1943, p. 4; 13 January 1943, p. 3.

Sasha Pursley
250
comrades‘ excruciating final moments: ―It was a horrible scene when a plane is burning. First it explodes; then it burns like a torch falling apart, and you can see particles of fuselage, wings, tail, and human bodies scattered in the air.‖61 The airwomen developed a series of rituals around comrades who were killed or missing in action. Junior-Lieutenant Olga Yerokhina-Averjanova, a mechanic in the 46th, recalled that
On the night of a crash, we never slept, never left the airfield. We waited until dawn, believing in miracles, asking
God to save our girls, waiting for them to return. Many of them did not come back, but sometimes when the planes
went missing after a mission they really did return. They were shot down and made emergency landings, returning
sometimes two or three days later.62
One of the most poignant rituals the airwomen developed when crews didn‘t return involved placing silverware and plates out for them. The places would be set for several days, in hopes that the missing crews might return. Comrades whose bodies were recovered were given a simple burial at the side of the airfield. Flowers would be placed on their graves, and women who chose to might say a few words. Many, however, remained silent, and channeled their grief into revenge for the enemy. The airwomen‘s response to death raises issues of masculinity and femininity. In twentieth century Soviet Union certain mourning rituals were performed only by women. Typically, a funeral was divided into two parts. In the first part, which involved the burial itself, the matriarch of the household, dressed entirely in black, would cradle herself in her arms, rock back and forth, and voice lamentations in a type of keening. The second custom happened the day after burial. A reception was held in honor of the deceased: women would prepare an elaborate feast, and mourners would share memories of the deceased. The emotions displayed at the reception were more subdued than at the burial. The first of these rituals was only done by women—keening, that involves an elaborate expression of grief, an emotional and physical release. The second ritual—commemoration—is gendered in a different way: women prepared for and hosted the reception, but men also participated in sharing stories.63 In conditions of war, the airwomen‘s response to death was altered. When the 46th lost a comrade, some airwomen ―couldn‘t help but cry.‖64 This admission has a slightly apologetic tone. While some airwomen ―couldn‘t help but cry,‖ other ritualized forms of behavior were absent, such as lamentations, keening and the death dance. The 46th tended to transform their grief into feelings of revenge. On the fuselage of the Po-2s, the airwomen painted ―Revenge to the Enemy for the Death of our Friends.‖65 Yet another way that the airwomen subverted the expected military norms was through embroidering. Instead of socks, they had cloth that they stretched over their feet to make the boots fit better. The airwomen would extract thread from their regulation blue underwear and embroidered flowers on the foot cloths. Embroidery was one of the ways in which the airwomen fought to retain their femininity. This behavior would not have been tolerated by Marina Raskova, but under the more relaxed command of Bershanskaya and Rakobolskaya, the women were allowed to express their femininity. In January 1943, soon after Raskova‘s death, the 46th was directed to the Northern Caucasus Front. The regiment was stationed in the Kuban region, based near the city of Krasnodar. The following month, in recognition of its success in combat in the Crimea, the regiment received its Guards appellation and was officially renamed the 46th Guards Night Bomber Aviation Regiment. Later in 1943, the regiment was transferred to the Taman Peninsula in the Crimea, where they participated in the liberation of Novorossisk. Altogether, the 46th served alongside five other Po-2 regiments in their division. The other Po-2 regiments were all-male, and none of them received the Guards appellation. When asked why the 46th was honored while other units in the division were not, Chief of Staff Rakobolskaya said, ―We flew many more flights.‖
There were no men‘s Po-2 regiments such as ours, in which there were so many Heroes of the Soviet Union—only
ours. Usually, there were 1-3 in a regiment, but we had 23, and the title Hero by law was conferred if a pilot or
navigator completed more than 500 combat flights—successful flights. Our heroes, as a rule, had more than 700
flights. A.I. Sebrova was able to make 1,008 combat flights.66
61 Amosova-Taranenko, Serafima, in Noggle, op. cit., p. 46. 62 Yerokhina-Averjanova, ibid, p. 60. 63 Semenov, V.A. (editor), Smert kak fenomen kultury (Syktyvkarskii gosudarstvennyi universitet, 1994). 64 Akilina, Mariya, in Noggle, op. cit., p. 95. 65 Amosova-Taranenko, ibid, p. 45. 66 Pennington, Women, Wings and War, op. cit., pp. 83-84.

The Motherland Calls: The 46th Taman Guards Aviation Unit in the Second World War
251
Although the Po-2 carried only a light bomb load and could attack only light targets (troops, unarmored vehicles, ammunition and supply depots), most sources evaluate the night bombing raids as effective; harassment raids worked well because they forced the enemy to lose sleep, take extra precautions and suffer losses to storage areas or fuel depots. The rugged reliability of the Po-2 and its basing right behind the front lines enabled it to maintain continuous harassment of German troops throughout the year, even in bad weather. In fact, the effectiveness of the 46th regiment can be ascertained by the nickname that German troops applied to them: ―Night Witches.‖ The 46th interrupted the sleep pattern of German troops who ―were very angry with the planes.‖ German soldiers ―spread the rumor throughout the army that these were neither women nor men but night witches.‖67 This nickname was coined during a time when the Germans were unable to shoot down any of the 46th‘s aircraft: thus the airwomen were referred to as night witches, ―since it seemed impossible to kill [them] or shoot [them] down.‖68 In an oblique reference to the nickname, Polina Gelman said that ―we hated the German fascists so much that we didn‘t care which aircraft we were to fly; we would have even flown a broom to be able to fire at them.‖69 One source of pride for the 46th veterans is the number of missions they performed. Because of the limited range of the aircraft, the 46th regiment was based very near the front and could fly repeated missions, limited only by fatigue and the approach of daylight. On average, the Po-2 crews flew five to ten missions each night, with an occasional maximum effort of as many as fifteen missions a night. Seasonal darkness made it possible to achieve high sortie rates. On the average night, the 46th might be ordered to perform 100 flights during the night; the maximum number of flights in one night was 325.70 According to Gelman, the 46th ―was not only equal to the men‘s regiments according to effectiveness and other indicies, but was among the first.‖ She explained what the indices were:
The effectiveness was determined by the accuracy of the hits from bombing and shooting. After completing a
mission, everyone had to report his results and the results of others, as he saw them, what and where it happened.
Crews from other regiments reported on our results. . . . It was easy to verify everything. . . In the 4th Air Army our
regiment was always first or among the first.
Moreover, Gelman stated that ―our regiment firmly held first place among all in the Air Forces for the number of flights.‖71 When asked in a 1993 interview why the airwomen went to such lengths to fly record numbers of missions, Chief of Staff Rakobolskaya replied, ―Out of enthusiasm. In order to prove that we could do anything.‖ Twenty years earlier, she had written that outperforming men was also a factor: ―We were not content just standing on par with men‘s regiments.‖72 Veterans of the 46th felt that conditions were better in their all-female unit. Rakobolskaya commented, ―I believe that women fight more effectively in a separate unit than together with men. I have talked a great deal with women who fought alongside men. It was more difficult for them than for us.‖73 In January 1945, the regiment was transferred to East Prussia, where they fought for the liberation of Poland. Within several months, the 46th was redirected to Buchgoltz. In this period, the regiment participated in the final push to Berlin. By the end of the war, eighteen pilots and six navigators of the 46th had received the highest military honor, the Hero of the Soviet Union title—a far greater proportion than in the other women‘s regiments (the 125th received five HSU awards, the 586th none, and four women pilots in other units were awarded the HSU). Although there was a much better chance of receiving medals in the 46th, there was also a much greater risk of mortality. The 46th lost a total of thirty-one people in the war, or approximately 27 percent of the total flying personnel assigned during the war. The regiment flew 24,000 combat missions, and participated in some of the most dangerous and important battles in the war: Stalingrad, Krasnodar, Novorossisk, Kerch, Sevastopol, Minsk, Warsaw, and all the way to Berlin.74 In August 1945, ten crews from the 46th were called to participate in the victory parade in Moscow‘s Red Square, celebrating Air Force Day.75 Though considered a great honor, the regiment‘s future proved far less glorious.
67 Gelman, Polina in Noggle, op. cit., pp. 37-38. 68 Amosovo-Taranenko, ibid, p. 46. 69 Gelman, ibid, p. 39. 70 Rakobolskaya, Irina, ―Dni minuvshvie,‖ in Kazarinova, A.A., et. al. (editors), V nebe frontovom: sbornik vospominanii sovetskikh letchits-uchastnits Velikoi Otechestvennoi
Voiny, 2nd ed. (Moscow: Molodaya Gvardiya, 1971 ), p. 164. 71 Quoted in Pennington, Women, Wings and War, op. cit., p. 88. 72 Rakobolskaya, ―Dni minuvshie,‖ op. cit., p. 167. 73 Cited in Pennington, Wings, op. cit., p. 80. 74 ―Izmenenie v dislokatsii chaste,‖ Istoricheskii formulyar‘ 46 gvardeiskogo Tamanskogo nochnogo bombadirovochnogo aviatsionnogo polka, Tsentral‘nyi Arkhiv
Ministerstva Oborony, Fond 33, Opis‘ 518931, Delo 1, p. 36. 75 Boevoi put‘: 46-ogo gvardeiskogo bombadirovochnogo Tamanskogo krasnoznamennogo ordena Suvarova aviatsionnogo polka. My thanks to Irina Rakobolskaya for
providing me with this document.

Sasha Pursley
252
POSTWAR
Soviet women in the Red Army served their country with courage and distinction. The government‘s acknowledgement of their achievements, however, was mixed at best. In July 1945, President Kalinin spoke to a gathering of recently demobilized women soldiers. Although he acknowledged their strength and heroism, he made no mention of continued military careers; his main concern was that they quickly find civilian jobs. His final advice to them was this:
You have won equal rights for women in a field in which they hitherto have not taken such a direct part. But allow
me, as one grown wise with years, to say to you: do not give yourself airs. Do not talk about the services you
rendered, let others do it for you. That will be better.76
Kalinin‘s speech was a powerful illustration of the shifting boundaries of gender norms in the post-war era. The voices of women veterans were silenced and they were mobilized in a new way by the state. During the war, Soviet women had transgressed traditional gender norms by engaging in combat. In the postwar era, they faced a conservative backlash predicated on the belief that ―war has an unwomanly face.‖ The Soviet government backpedaled by arguing that combat (or even a military career) was unacceptable for women. Yet even while espousing gendered essentialist arguments the government encouraged women to enter the workforce in non-traditional occupations such as mining and construction because of the deficit of male workers after the war. The overwhelming message of Soviet propaganda after the war was that although women could fulfill combat roles when duty called, they were not to expect permanent careers in the military. Their achievements were acknowledged during the war but then quickly forgotten. On 15 October 1945, the 46th Taman Guards Women‘s Aviation Unit was officially disbanded.77 After the war, the overwhelming majority of Soviet airwomen agreed that ―War has an unwomanly face.‖ In a typical expression of this sentiment, Senior Lieutenant Alexandra Akimova stated ―The very nature of a woman rejects the idea of fighting. A women is born to give birth to children, to nurture. Flying combat missions is against our nature.‖78 Traditional notions of Russian patriarchy collided with Soviet Marxist policy in the twentieth century, creating a gendered dvoeveriya (dual belief). During the war, however, the women of the 46th regiment subverted this dvoeveriya by refusing to sacrifice their sexuality in order to attain honorary male status as warriors. They accomplished this by going into battle as women, thus subverting traditional Russian patriarchy. But by refusing to sacrifice their sexuality, they were also subverting Soviet Marxism, which desexed women. Through their actions and behavior, such as embroidery, dancing, the use of language and mourning rituals, they subverted the dialectical process of dvoeveriya and carved out for themselves a whole new territory. During the Second World War, the most well-known recruitment poster depicted a woman summoning troops, emblazoned with the large caption ―The Motherland is Calling.‖ Women in the 46th regiment answered the call and fought all the way from Stalingrad to Berlin. After the war, the unit was demobilized and the veterans sought employment in the civilian sector. Beginning in 1946, veterans of the 46th regiment held a gathering every year on 2 May in front of Moscow‘s Bolshoi Theatre. One purpose of these annual gatherings was to catch up on news; but an additional motive was related to countermemory. As Eva Hoffman has pointed out, ―in the Soviet Union. . . . memory was the only guarantee of a truthful history. When official history writing. . . deleted entire groups. . . from the historical record, people literally had to rely on private, local, subversive memory to preserve the true version—the fundamental facts, even—of what happened.‖79 Through the annual gatherings, the veterans of the 46th ensured that the history of their regiment was not lost.
76 Kalinin, M.I., On Communist Education: Selected Speeches and Articles (Moscow: Foreign Languages Publishing House, 1953), p. 4. 77 Bershanskaya, Y., Rakobolskaya, I.V. (et. al.), 46 gvardeiskii Tamanskii zhenskii aviatsionnii polk (Moscow: Tsentralnii dom sovetskogo armii imeni M.V. Frunze, n.d.), p.
4. 78 Akimova, Alexandra, in Noggle, op. cit., p. 94. 79 Hoffman, Eva, ―Complex Histories, Contested Memories. Some Reflections on Remembering Difficult Pasts,‖ Doreen B. Townsend Occasional Papers 23.

Feasibility Study of Offering Online Hybrid Courses to Graduate Students
253
FEASIBILITY STUDY OF OFFERING ONLINE HYBRID COURSES TO GRADUATE STUDENTS
Charles Lipinski, Laura Boyarsky and Jennifer Phillips Marywood University
EXECUTIVE SUMMARY
Over the last several years, student and faculty interest in exploring Online and Online Hybrid classes has been growing.
Throughout the Summer I 2008 semester, Laura Boyarksy and Jennifer Phillips, graduate students at Marywood University,
conducted a feasibility study of the prospect of offering Online Hybrid courses to graduate students.
During the months of May and June 2008, research was conducted by interviewing Marywood University faculty members,
interviewing college and universities who currently offer Online Hybrid courses at their institutions, distributing a survey among
professionals to determine interest in these courses in addition to related concepts, and researching background information
on the subject matter, including accreditation, advantages and disadvantages, and best practices.
The research conducted throughout the semester proved successful in showing a demand for and interest in Online Hybrid
classes among current and potential students. Overall, the return rate in the survey conducted was about 55 percent (217 of
400). The results of the survey show a clear interest in Online Hybrid courses among current and potential business
professionals. In addition, faculty members of the Universities who were interviewed in this study support the introduction of
blended, online courses and feel they can offer many advantages. The most important factors limiting the success of this
study include the time and resource limit of the semester, a self-selected sample, and participant honesty.
Overall, the study demonstrates the soundness of demand and interest in Online Hybrid courses. We recommend the
following actions: Develop a committee responsible for taking this initiative to the next level. Consider conducting an additional study with the help of outside consultants if needed. Design the Online Hybrid Courses to be offered through the established committee. (Proposed design / other provided in
recommendations)
INTRODUCTION
This research report is based on both research conducted and data collected from faculty interviews in addition to a questionnaire survey conducted during the months of May and June 2008. The survey asks respondents about their experience with and opinions of Online Hybrid courses. Its purpose is to determine whether or not Universities should begin to offer Online Hybrid business courses to graduate students. The purpose of the personal professional interviews was to gain feedback among faculty members as to their opinions on this subject matter, including whether or not they wish such classes to be offered, what steps they feel would need to taken to implement such a process, and what feedback they have received among students and fellow faculty members on this matter to date.
Problem Statement
Due to somewhat stagnant growth in the number of graduate school enrollments and student and faculty interest in new course design options, research needs to be conducted to determine whether or not it is feasible for the Universities to begin to offer Online Hybrid business courses to graduate students to address such problems.
At the present time, a few Universities offer Online hybrid business courses to graduate students. Recent discussions among faculty and students have led to both increased levels of interchange and interest in the Online Hybrid subject matter. Due to personal, family, and work commitments, more often than not graduate students need flexibility in course design and availability. In addition, the ever-changing and continuous improvement and introduction of technology related-products allow these courses to be designed and implemented allowing for increased flexibility and higher learning.

Charles Lipinski, Laura Boyarsky and Jennifer Phillips
254
Faculty desires research information on Online Hybrid courses and their potential impact on raising the enrollment levels among business graduate students at their respective Universities, in addition to student satisfaction levels in order to determine if steps should be taken to introduce such courses.
Research Objectives
The purpose of this research is to discover the level of interest in Online Hybrid courses among current and potential students and faculty members at Universities in Northeast Pennsylvania. We hypothesize that over a two to three year time span, graduate enrollment counts can see a lift of five to ten percent. Specifically, we intend to identify colleges and universities who currently offer Online Hybrid courses, interest levels among potential and current students through the results of a survey distributed by group members to professionals of different occupations in addition to current students. Feedback from faculty obtained through personal interviews detailing their own personal feedback in addition to feedback they have received among their students and co-faculty members, and finally a course design outline that University administrators can model an Online Hybrid course after.
Background
A hybrid course combines face-to-face instruction with computer-based learning in an educational environment that is non-specific as to time and place. Common features of hybrid courses include the delivery of the syllabus, lectures, readings and assignments on web pages; discussions and presentations through online message boards, e-mail and chat software; interactive tutorials and labs; and on-line assessments (or any combination of the above). In a hybrid class, a significant part of the course interaction takes place online and students can expect to spend at least as much time as they would in an on-campus section of the course. The following is a partial list of colleges and universities that currently offer online hybrid courses.
Colleges & Universities Offering Online Hybrid Courses
Appalachian State University Boone, North Carolina http://www.appstate.edu/
Arizona State University Phoenix, Arizona http://www.asu.edu/
Columbia State University Columbus, Georgia http://www.colstate.edu/
Community College of Beaver County Monaca, Pennsylvania http://www.ccbc.edu/
Cypress College Cypress, California http://www.cypresscollege.edu
Delaware County Community College Chester, Pennsylvania http://www.dccc.edu/dl/about.html
Diablo Valley College Pleasant Hill, California http://www.dvc.edu/
Drexel University Philadelphia, Pennsylvania http://www.drexel.edu/
Durham Technical Community College Durham, North Carolina http://durhamtech.edu
Florida State University Tallahassee, Florida http://www.fsu.edu/
Harrisburg Area Community College Harrisburg, Pennsylvania http://www.hacc.edu/
Las Positas College Livermore, California http://www.laspositascollege.edu/
Lawrence Technological Universities Southfield, Michigan http://www.ltu.edu/
Maricopa Community College Tempe, Arizona http://www.maricopa.edu/
Marist College Poughkeepsie, New York http://www.marist.edu/
Middlesex County College Edison, New Jersey http://www.middlesexcc.edu/
Montgomery Community College Reading, Pennsylvania http://www.mc3.edu/
Northeastern Illinois University Chicago, Illinois http://www.neiu.edu/Home/
Pueblo Community College Pueblo, Colorado http://www.pueblocc.edu/
Salisbury University Salisbury, Maryland http://www.salisbury.edu/
San Juan College Farmington, New Mexico http://www.sjc.cc.nm.us/
Schoolcraft College Livonia, Michigan http://www.schoolcraft.edu/
Southern New Hampshire University Manchester, New Hampshire http://www.snhu.edu/

Feasibility Study of Offering Online Hybrid Courses to Graduate Students
255
Colleges & Universities Offering Online Hybrid Courses
State University of New York Institute of Technology
Utica, New York http://www.sunyit.edu/
St. Joseph‘s University Philadelphia, Pennsylvania http://www.sju.edu/
University of Colorado Boulder, Colorado http://www.colorado.edu/
University of Houston Houston, Texas http://www.uh.edu/
University of New Mexico Albuquerque, New Mexico http://www.unm.edu/
University of Tennessee Knoxville Tennessee http://www.utk.edu/
University of Wisconsin Milwaukee, Wisconsin http://www.uwm.edu
Victor Valley Community College Victorville, California http://www.vvc.edu/
Weber State University Ogden, Utah http://www.salisbury.edu/
Wilkes University Wilkes-Barre, Pennsylvania http://www.wilkes.edu
Wilmington University Rehoboth Beach, Delaware http://www.wilmu.edu/
Wilson Community College Wilson, North Carolina http://www.wilsontech.cc.nc.us/
Accreditation
The process of creating online hybrid courses cannot be researched without reference to accreditation. Accreditation is a validation process by which institutions of higher education are evaluated against established standards to ensure a high level of educational quality. In the United States, accreditation is a voluntary process that is implemented by private nongovernmental accrediting agencies. At present, there are both regional as well as national agencies involved in the process. Accreditation is important because it can tell students a lot about the value of the degree or course for which they are participating and paying for. In addition, a student may find that obtaining a degree from a non-accredited institution may not be recognized by some employers or course credits may not be transferable to other institutions. Both the regional and national accrediting agencies that are responsible for all accreditation including programs offered at a distance hold distance learning institutions to the same high standards as other colleges and universities.
Universities will need to pay close attention to accreditation if it should decide to offer Online Hybrid courses to graduate students. One of the most admired accrediting agencies is the AACSB (Association to Advance Collegiate Schools of Business). As a specialized agency, the AACSB grants accreditation for undergraduate and graduate business administration and accounting programs. AACSB International accreditation represents the highest standard of achievement for business schools, worldwide. Institutions that earn accreditation confirm their commitment to quality and continuous improvement through a rigorous and comprehensive peer review. AACSB International accreditation assures stakeholders that business schools: Manage resources to achieve a vibrant and relevant mission. Advance business and management knowledge through faculty scholarship. Provide high-caliber teaching of quality and current curricula. Cultivate meaningful interaction between students and a qualified faculty. Produce graduates who have achieved specified learning goals.
The advent of Online Hybrid courses provides Universities with a strong incentive to consider accreditation for both its traditional face-to-face classes in addition to Online Hybrid ones being researched. There are many schools in the state of Pennsylvania that are accredited by the AACSB. A list of these institutions follows:
Bloomsburg University Edinboro University of Pennsylvania
Bucknell University Holy Family University
California University of Pennsylvania Indiana University of Pennsylvania
Carlow College King's College
Carnegie Mellon University Kutztown University
Clarion University of Pennsylvania LaSalle University
Drexel University Lehigh University
Duquesne University Mansfield University
East Stroudsburg University Millersville University of Pennsylvania

Charles Lipinski, Laura Boyarsky and Jennifer Phillips
256
Moravian College Robert Morris University
University of Pennsylvania Saint Joseph's University
The Pennsylvania State University University of Scranton
The Pennsylvania State University Berks Shippensburg University
The Pennsylvania State University at Abington Slippery Rock University
The Pennsylvania State University at Altoona Susquehanna University
The Pennsylvania State University at Erie, The Behrend College Temple University
The Pennsylvania State University at Harrisburg Villanova University
The Pennsylvania State University Great Valley School of Graduate Professional Studies
West Chester University
Philadelphia University Widener University
University of Pittsburgh
Advantages / Disadvantages
Online hybrid education has the potential to provide numerous advantages to graduate students. First, the flexibility of these courses allows students to gain greater convenience in their learning efforts and experience. It allows for less commuting to campus which proves valuable to graduate students who are strapped for time because of work and family commitments. Also, in the northeast region of Pennsylvania, often students will drive a substantial distance to class and so the combined travel and class time relief provide these individuals with the flexibility to do other things, including their school work at home. Since these courses are self-paced, students can speed up or slow down as needed. In addition, they can skip over material they are familiar with and focus on the material they want and/or need to learn. Ultimately, this model fits many students‘ attention spans and lifestyles. More often than not, these courses encourage and even mandate student participation at often higher levels than the traditional classroom setting permits. This participation and interaction between students can allow for greater learning to be realized. As part of the course design, students are often required to interact with each other on a regular basis. In addition, student to teacher interaction is often augmented and provides the student with more information and one-on-one feedback which again increases learning. A student who would normally not volunteer and participate in class is presented with the opportunity to learn by taking an online hybrid course. These students feel less pressure as they have more time to think about what they want to say and how they want to react. As a result, they can focus on learning the subject matter. The online hybrid model can improve the educational experience of students by allowing teachers to present materials in different formats which ensure students are participating in one respect or another. For students, more information is available at their fingertips. Another reason for the greater amount of learning is that different tools are used including the Internet, chat rooms, auditory, visual and various other programs. Hybrid courses have the potential to impact and help graduate students advance their computer and writing skills by introducing them to these new technologies. In addition, lectures, notes, and other materials are usually easily accessible online which allows students to revisit important materials. This lessens the pressure placed on students to take good notes at all times. Also, the design of these courses encourages time management, problem-solving, and critical thinking skills to be advanced upon. In addition, often professors are able to cover more material throughout a semester because there is less of a time constraint placed upon them. During the time that graduate students would have traditionally been traveling to and attending class, they now can be covering greater subject matter. Technology may allow different subject matter to be taught that could not be in the traditional classroom environment. Another advantage of online hybrid education may be less thought about but may prove to be very valuable nonetheless. That is, it reduces traffic on campus, and may even free up valuable classroom space. Also, commuters save money on gas and parking fees. In the long-run, this could mean substantial savings for colleges and universities that may trickle down to the graduate student level. One disadvantage that may arise if a University starts to offer online hybrid classes is that class size might increase significantly. Online classes have the potential to allow more students to enroll in a class, which alters the student-to-teacher ratio unfavorably. Even in instances where the class size might remain within acceptable standards, online hybrid classes might influence students to feel isolated from a lack of face-to-face interaction.

Feasibility Study of Offering Online Hybrid Courses to Graduate Students
257
Another disadvantage is that students and teachers must often learn how to use the technology that these classes require. Often learning how to use such technology can take a lot of time and may frustrate and overwhelm students and teachers alike. If trained personnel are not easily available to assist with technical questions, the problems become magnified. In addition to this learning curve requirement, the increased use of technology often results in new fees being added to tuition expense to cover the cost. Also, technology problems pose the threat of interrupting the course and impacting the learning experience. Finally, students may not be able to afford a fast internet connection and may even have problems viewing documents online. The drop out rate among graduate level students taking online hybrid classes can surpass that of the drop out rate in the traditional classroom setting. Often there is less incentive and pressure for online hybrid students and they may become lazy and unfocused. A teacher may not be aware of which students have dropped the course because they may not have class every week and so they are unable to take attendance and gauge participation and involvement levels among students. The design of these courses also has the potential to impact course quality based on the new requirements of graduate teachers. Instructors will be forced to reexamine their course goals and objectives, to design online learning activities to meet these goals and objectives, and effectively integrate the online activities with the meetings they will have in class. In addition, teachers will now be required to change performance standards of students to take into account the new learning environment. Teachers need a whole new set of skills in order to make an online hybrid course successful. There is always a risk that teachers may not have appropriate skills or may find transforming assignments, texts, and other course materials into an online environment and communicating effectively in a different medium to be difficult. Participating in an online learning environment also requires students to have or develop skills beyond those needed to be successful in the traditional classroom environment. The success of these courses rests upon the right fit between the skills of student and faculty.
Best Practices
In a study done by Gordon Hensley, Gordon explores the steps in creating a hybrid college course and the results and recommendations for others interested in hybrid learning. He used WebCT and found that most students were happy that the entire class was not online. He proposed that the students meet only four times during the semester and would have the remaining classes online. He created some collaboration opportunities within WebCT that included discussion posts, live chats and personal web pages. He also housed quizzes and assignments in there so they can be accessed at any time. The results of this test had successes and failures. He found that his e-mail load was intense at times, however this helped to create a personal exchange with the students. A few students had difficulty with the technology so he had to train them. He was surprised that he spent more time on this class than he had on any other face to face class that he had. One major success was that students were able to ―attend‖ a class without having to drive to school. Student feedback was overall positive. He also stated that there were lower withdrawal rates and student retention is at least equivalent to that of traditional courses. He found that most students learned as much or more in the hybrid format than they did in the traditional classroom setting. Overall, he would continue to adjust certain aspects as he holds more online/hybrid courses but he would consider this test a success. Some suggestions he had for improvement was to present the content in a logical manner, indicate professor response time on messages and grades, explain how to use technology, provide opportunities for the students to apply concepts and to request a course evaluation so you can continually improve and change the course outline. Hensley wrote an article for the Journal of Online Learning and Teaching providing the following best practice guidelines in creating and administering an Online Hybrid college course. Professor Hensley himself created an Online Hybrid course (described above) at his University which encouraged him to write the article: ―Creating a Hybrid College Course: Instructional Design Notes and Recommendations for Beginners‖ for the Journal. His guidelines and suggestions are detailed below and follow what we believe to be true best practices. Course Design and Content
o Note in the published class listing that the class is a hybrid, and list the required meeting dates and times o Write objectives/learning outcomes at the appropriate language level o Clearly convey objectives/learning outcomes in the syllabus and in each module o Make content available to students in manageable segments (modules) o Present the content in a logical, sequential manner o Make content available internally (CDROM) and externally (Internet) o Enhance content with technology and WebCT, Blackboard, etc. tools o Utilize visual and auditory stimuli, like songs, video clips, and recorded narration

Charles Lipinski, Laura Boyarsky and Jennifer Phillips
258
o Make ancillary resources available Online or at a mutually convenient location (library) o Create the content so it is as demanding as face-to-face time (include reading, research, review, learning new concepts,
and assessment) o Invite students to participate in mid-semester and final course evaluation o Address accessibility issues from the start, color choices for example Interaction/Collaboration
o Clarify expectations of student participation o Indicate instructor response time on personal messages and grading assignments o Deliberately attempt to make a learning community via group projects and activities o Use collaborative tools such as discussion boards, chat rooms, instant messenger, Email, student web pages, etc.
Participation in these areas should be evaluated in some way (number of posts, attendance in chat, comments made, etc.)
Technology
o Require technology in assignments and explain how to use the technology o Use technology is for a purpose, not just for show o Consider student connectivity issues – make content available in different formats, and on a CDROM o Try to be creative in the use of multiple technologies together Assessment
o Create assignments that encourage students to think critically, not just to use rote memorization o Align assignments with stated course objectives o Provide opportunities for students to apply concepts and skills they have learned o Create a use for external resources such as printed materials and the Internet o Clearly communicate the assignments with very specific length requirements, formatting style, etc. o Direct students to specific web sites to use, and sites to not use o Use built-in quiz features that are tied to course objectives o Provide the opportunity for self-assessment Learner Support
o Email students regular reminders and expectations before the class begins o Link to tutorials on applications such as Email, using the Internet, etc. o Link to resources for writing, grammar, etc. o Link to the instructor, to the school‘s help desk, and to WebCT‘s help page o Link to tools required for the course such as plug-ins o Make your contact information and communication means clear on all materials o References
College / University Interviews
A phone interview was conducted with a representative at Drexel University to obtain information about Drexel University‘s Online Hybrid classes. Drexel offers an on-campus MBA and what may be labeled an Online Hybrid MBA. Their Online Hybrid MBA is approximately 90% online. They began offering these classes in 1998-1999. The MBA is structured using Blackboard as a supplement tool. Students are expected to participate in online chats for class in addition to participating in discussion boards between classmates and themselves. These online chats and discussions count toward a small part of the final total course grade. In addition, questions on course content are often listed on Blackboard and must be answered and submitted weekly. Drexel‘s representative mentioned that there is a significant amount of one-on-one contact with the professor through email, chats, etc. Also, professors are required to provide students feedback to questions and inquiries in a twenty-four hour timeframe. When signing up for the MBA, each student has their own web page and an orientation is posted on their website that they are required to complete. For each course of the MBA, students must complete an orientation online. In addition to this orientation, there is a tutorial showing students how to use the Blackboard supplement. On a student‘s website, often there are links to various websites and other useful additional information present to help students along throughout a semester. In regards to the technical side of these courses and problems that often occur, Drexel has 24 hour tech support. There is a 1-800 number for each class a student enrolls in. In regards to feedback among students, often the feedback is

Feasibility Study of Offering Online Hybrid Courses to Graduate Students
259
mixed, based upon student preference. Some students really like the online formats while other do not. Drexel‘s representative mentioned that the people who do like the online classes say it fits their lifestyle and gives them a chance to complete their MBA or else they would not have been able to. Drexel distributes surveys among students during the semester, one being a regular class survey, and the other one being a survey directed to the online component of the class. Currently, there is a major project going on to determine the growth rate in enrollments due to offering these online courses. The representative guesses it is fair to assume that their enrollment count has increased at least 5-10% (in her opinion). She went on to mention that she feels the University‘s reputation in general, and specifically for their online classes, has resu lted in greater enrollments at the University. Being a student herself, she said that some fellow classmates have complained to her that they made the change to Drexel University because they did not care for the format of other school‘s online programs. Some fellow classmates felt that other schools just wanted their tuition dollars and were not committed to providing quality online courses. She feels the quality of the online course is what matters the most. A phone interview was conducted with Hank Snyder at Montgomery County Community College in Reading, Pennsylvania to obtain information about Montgomery County Community College‘s Online Hybrid courses. MCCC offers Online Hybrid Associates Degrees in Business Administration and other fields. They began offering these classes in 2001. All of their Online Hybrid courses meet the goals and objectives of traditional courses and carry the same credit as face-to-face courses. These Online Hybrid courses are structured using Blackboard as a supplement tool. These classes require high levels of interaction by and among students. Students must respond to discussion questions posted by the instructor and in addition they must contribute to discussion threads initiated by the instructor and responded to by fellow classmates. The count and quality of these online discussion threads count toward part of the final total course grade. Professors provide students with feedback to questions and inquiries during specific timeframes which they communicate to the class. Students must complete a registration/ orientation online. In addition to this registration/orientation, there are online computer tutorials showing students how to use both the Blackboard and other related supplements. On MCCC‘s website, there are links to Online Learning Support Services information in addition to other helpful links including Advising, Technical Help, and Tutoring and Workshops. In regards to the technical side of these courses and problems that often occur, MCCC has a tech support hotline. In addition, on their website, there are detailed instructions showing students how to handle different technical problems on their own. In regards to feedback among students, Mr. Snyder says the feedback has been favorable for these Online Hybrid classes. Students enjoy the convenience of not having to travel, especially due to work and family commitments. Once again, the Online Hybrid classes fit many student lifestyles and gives them a chance to complete their degree otherwise not being able to. Mr. Snyder assumes that their enrollment count has increased at least 5-10%, although he did not have a definitive figure at hand (in his opinion).
Personal Interviews
Interviews were performed of several faculty and professors at Marywood University. Most requested to be anonymous so no names will be given in this report. Many interviewees stated that they feel there are many benefits and disadvantages of having online/hybrid courses. Many faculty/professors at Marywood have shown a great interest in Moodle, WebCT and other possible programs especially for supplemental or hybrid use. Most like it because it incorporates face to face learning with the online learning aspect. One professor stated she likes having the ability to say ―it‘s online‖ to students when a student needs a handout or information repeated. Another likes having a record of what was done in each class so she can refer back if necessary. Professors also like utilizing Moodle as they can monitor how often students use it and whether or not the students read the info posted. Another benefit given for online/hybrid courses is the fact that the professors can post sites and creates links for the students to go directly to the site. This can be helpful for students to attain additional information. Many professors have received feedback from their students. Many of the students have found it helpful to have the general course materials, assignments, syllabus, etc., posted online so they are available to them at anytime. For students that live a far distance from campus it is a way to keep them connected with campus and with each other. Many of the faculty that have requested to get an online course shell have said that it is at the request of their students. Students that have used technology before were very happy with it as a tool for communication and were happy to be able to discuss issues and topics via the internet. They liked that they could check info like the syllabus and felt is was useful to communicate with each other and with the professor. The faculty likes the idea of the materials being available to the students 24/7 and not wasting paper and energy printing items that the students may not want or may miss place. It seems that the courses that have open communication, use of discussion tools and email system, where the faculty responded within the time frame set in their syllabus, materials that are presented in chunks and courses that have no big files to download are all well received and welcomed.

Charles Lipinski, Laura Boyarsky and Jennifer Phillips
260
There were also several negative comments that the interviewees had about having an online/hybrid class. Like all things, technology is great when it works. For some students accessing the online courses may be an issue. Other technical problems that can occur are popup blockers, e-mail issues, security settings, plugins etc. But once past that point, most have heard only good things about having the information at their fingertips. Some interviewees have stated that the students have had mixed thoughts. Some students that have not used technology before and were almost finished with their graduate degree were not happy with it initially as they felt it was another thing to do, another site to check and was too much work. Another thought that was a concern of many professors is that it takes a lot of time to set the course up initially. Some professors stated at times the amount of e-mails become too much as you can see every post that everyone sends. Students have shared that they have not read all of the e-mails that are exchanged which can defeat the purpose of having part of the class online. Some professors stated that they are not sure WebCT is the answer that Universities would need in order to fulfill the requirements needed for an online/hybrid course. Many also feel that if they were to have more online/hybrid classes, they would also need to increase their technical support. The support needs to be quicker in order for requests to be answered in a timely manner. One professor also stated that she feels that there is a need for a central repository where a list of resources can be provided. This list can provide the person‘s name and how they can be reached so the faculty can get in touch with them whenever they have a problem or issue that needs to be answered. Almost all professors do not ever see themselves teaching a class completely online. They value the face to face time. They feel that face to face time is needed for courses, so most would support a blended, hybrid class. They feel that a totally online course would be difficult as the students may not know one another and it can be more successful if the students already have somewhat of a relationship with each other. They believe that many courses teach methods that have to have group participation and practice real-life situations. They have also found that younger students (under age 25) are more comfortable with online courses than older students.
METHODOLOGY
In general enrollment for graduate courses has been steady for the past few years. Universities are looking at ways to help increase this enrollment. Will offering Online Hybrid courses for graduate degrees result in increased enrollments? The survey conducted consists of ten questions (see appendix) that will show what professionals feel and think about online hybrid classes.
Sampling & Research Design and Data Collection
This survey consists of ten questions (see appendix for actual survey). The survey was sent out to five hundred professionals in the Scranton area. The professionals that were given this survey include people in financial market, sales, marketing, technology, education and non for profit employees and other various professions. In total, the response rate was approximately 55 percent with no incentive given. The survey consisted of ten multiple choice questions followed by an open ended question for comments, feedback and suggestions. The survey method of data collection was to maximize the sample size while minimizing the time and cost required for data collection. The survey instruments included items on type of profession, status on attending graduate school, items that investigated the relative appeal of face to face classes compared to online courses and a series of questions about their perceived likelihood of enrolling in graduate school based on the differing methods of delivery- face to face or online hybrid.
Data Analysis
Overall, the return rate in this study was about 55 percent (217 of 400). Only about 18 percent were already attending graduate school but about 70 percent of the respondents said they are very or somewhat likely to further their education for a graduate degree. In summary, this survey supports our hypothesis that online hybrid courses would be more attractive to professionals looking to further their education. In today‘s busy business world, professionals feel that their lives would be less stressful if they would be able to organize and prioritize their own schedules and complete their school workload when it is appropriate for them. Many of the respondents believe that this can be the first step for a University being able to increase their enrollment in the graduate courses. More detailed explanations can be found below in the findings section.
Limitations
First, because the sample was self-selected, it is likely that those who felt strongly about online hybrid offerings may have responded in greater numbers than those with less extreme opinions. Second, while the results are the respondents views on the demand for online hybrid programs, their views do not necessarily predict the demand of the entire population. Third, the

Feasibility Study of Offering Online Hybrid Courses to Graduate Students
261
responses given may not necessarily reflect true honestly among participants. Lastly, this research was designed in a very short period of time. It is only a minute version of what should actually be performed on a larger basis prior to making any decisions on implementing a new online hybrid graduate program.
FINDINGS
Overall, the return rate in this study was about 55 percent (217 of 400). Only about 18 percent were already attending graduate school but about 70 percent of the respondents said they are very or somewhat likely to further their education for a graduate degree. Please see the following for the percentages of answers for each question. The more detailed version with total numbers and percentages can be found in the appendix.
Type of Professional Participating in Survey
Technology
10%
Sales/Marketing
24%
Financial
35%
Education/Non Profit
13%
Other
18%
Technology
Sales/Marketing
Financial
Education/NonProfit
Other
Of the total polled that actually responded, about 35% were from the financial market, 24% were from sales or marketing, 13% from the education or not for profit profession, 10% from the technology area and 18% were from other various professions.
Currently Attending Graduate School
Yes
19%
No
81%
Yes No
0%
10%
20%
30%
40%
50%
60%
70%
Percentage of Responses
Never Took a Class Good Experience Bad Experience Experience the same as face to
face classes
Ever Taken an On-line Class & If So, How Was It?
This question was asked to what percentage of people have had good experiences when taking an online class. Of the people who have taken an online course, we found that the vast majority of them have had a good experience when they took
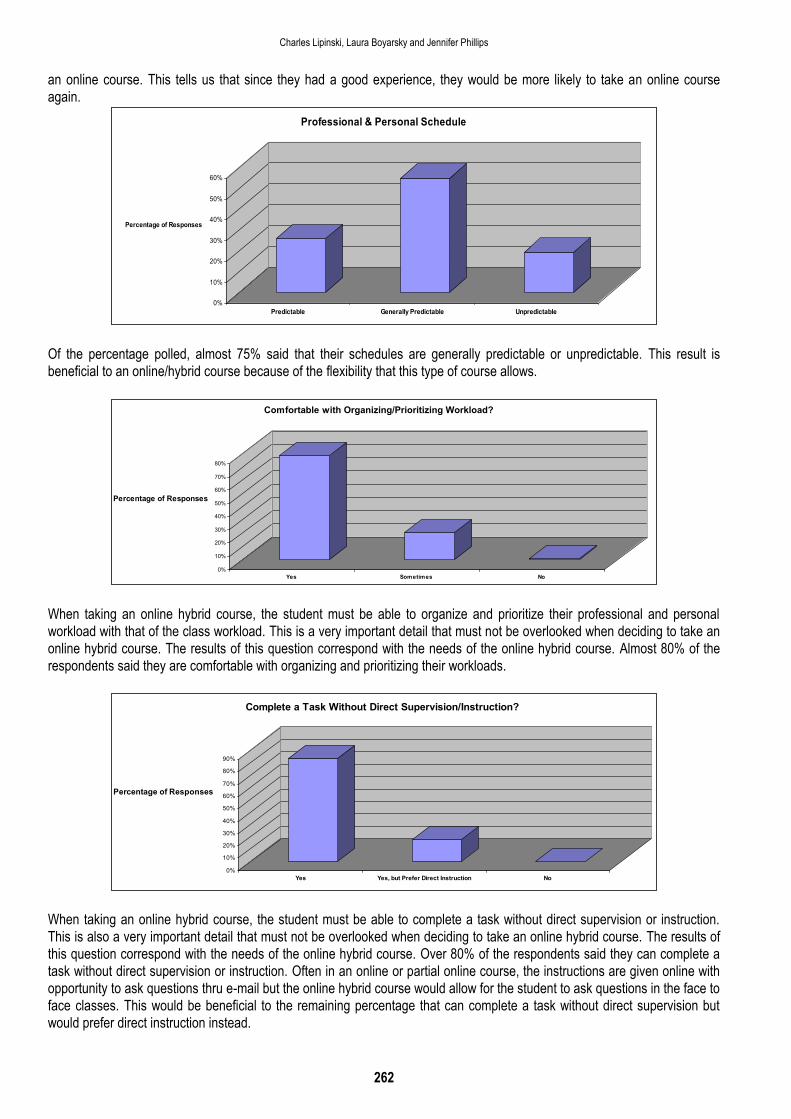
Charles Lipinski, Laura Boyarsky and Jennifer Phillips
262
an online course. This tells us that since they had a good experience, they would be more likely to take an online course again.
0%
10%
20%
30%
40%
50%
60%
Percentage of Responses
Predictable Generally Predictable Unpredictable
Professional & Personal Schedule
Of the percentage polled, almost 75% said that their schedules are generally predictable or unpredictable. This result is beneficial to an online/hybrid course because of the flexibility that this type of course allows.
0%
10%
20%
30%
40%
50%
60%
70%
80%
Percentage of Responses
Yes Sometimes No
Comfortable with Organizing/Prioritizing Workload?
When taking an online hybrid course, the student must be able to organize and prioritize their professional and personal workload with that of the class workload. This is a very important detail that must not be overlooked when deciding to take an online hybrid course. The results of this question correspond with the needs of the online hybrid course. Almost 80% of the respondents said they are comfortable with organizing and prioritizing their workloads.
0%
10%
20%
30%
40%
50%
60%
70%
80%
90%
Percentage of Responses
Yes Yes, but Prefer Direct Instruction No
Complete a Task Without Direct Supervision/Instruction?
When taking an online hybrid course, the student must be able to complete a task without direct supervision or instruction. This is also a very important detail that must not be overlooked when deciding to take an online hybrid course. The results of this question correspond with the needs of the online hybrid course. Over 80% of the respondents said they can complete a task without direct supervision or instruction. Often in an online or partial online course, the instructions are given online with opportunity to ask questions thru e-mail but the online hybrid course would allow for the student to ask questions in the face to face classes. This would be beneficial to the remaining percentage that can complete a task without direct supervision but would prefer direct instruction instead.
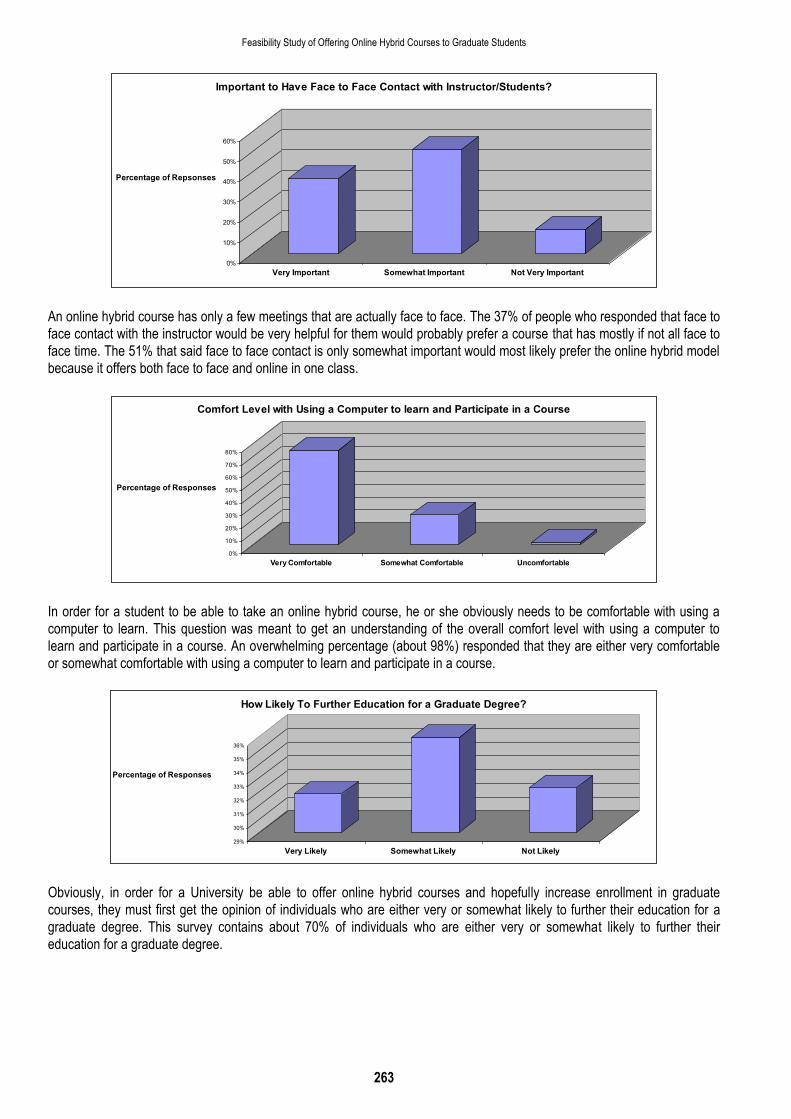
Feasibility Study of Offering Online Hybrid Courses to Graduate Students
263
0%
10%
20%
30%
40%
50%
60%
Percentage of Repsonses
Very Important Somewhat Important Not Very Important
Important to Have Face to Face Contact with Instructor/Students?
An online hybrid course has only a few meetings that are actually face to face. The 37% of people who responded that face to face contact with the instructor would be very helpful for them would probably prefer a course that has mostly if not all face to face time. The 51% that said face to face contact is only somewhat important would most likely prefer the online hybrid model because it offers both face to face and online in one class.
0%
10%
20%
30%
40%
50%
60%
70%
80%
Percentage of Responses
Very Comfortable Somewhat Comfortable Uncomfortable
Comfort Level with Using a Computer to learn and Participate in a Course
In order for a student to be able to take an online hybrid course, he or she obviously needs to be comfortable with using a computer to learn. This question was meant to get an understanding of the overall comfort level with using a computer to learn and participate in a course. An overwhelming percentage (about 98%) responded that they are either very comfortable or somewhat comfortable with using a computer to learn and participate in a course.
29%
30%
31%
32%
33%
34%
35%
36%
Percentage of Responses
Very Likely Somewhat Likely Not Likely
How Likely To Further Education for a Graduate Degree?
Obviously, in order for a University be able to offer online hybrid courses and hopefully increase enrollment in graduate courses, they must first get the opinion of individuals who are either very or somewhat likely to further their education for a graduate degree. This survey contains about 70% of individuals who are either very or somewhat likely to further their education for a graduate degree.

Charles Lipinski, Laura Boyarsky and Jennifer Phillips
264
0%
10%
20%
30%
40%
50%
60%
70%
Percentage of Responses
Choose the one that offered
Online/Hybrid classes
Choose the one that offered only
Face to Face classes
My Decision would not be affected by
the types of classes offered
When Choosing Between Two Locally Universities:
This question is probably the most important question of the survey. The results show that almost 70% of the respondents would choose a University that would offer online/hybrid courses for their graduate degrees. About 25% said that their decision would not be affected by the delivery method of classes while only 8% said they would prefer the face to face method of delivery. There were many comments, feedback and suggestions for the last question of the survey that was an open ended question. Some of them are listed below. o Not all courses should be offered with the online hybrid option. Certain courses really need to be 100 percent face to face
delivery. o I like to learn independently but would like accessibility of a professor to clarify material. o I would prefer more face to face classes compared to online. The online courses should be structured through a better
software system rather than just over the e-mail. o I feel that if there was also interaction in a classroom type setting along with the online instruction, I would feel more
comfortable taking an online course. o Have the courses where a certain percentage can be done online in order to make attaining a degree a bit more
accessible to those whose career demands would otherwise make it impossible to finish what was started. o At this stage of my life, I would only be taking courses for employment or learning something of interest. Therefore, online
hybrid courses would be my choice. o It is hard to discuss/debate when you can not see expressions or body language of the other individuals. The online
hybrid delivery method would enhance this learning process. o My style is conducive to an in classroom setting. o If I were to participate in an online class, I would like to meet the instructor face to face a few times to clarify information. o I would feel the need for at least 25% face to face portion. o Some class time or web conferencing would be better than completely on e-mail. o Online courses would be very convenient for my circumstances and I‘m sure for many others in the graduate courses. o A traditional face to face schedule would not fit into my life right now. o Online classes reduce stress when trying to regulate time and scheduling. o I think online classes can be a great supplement to learning but cannot replace the value of classroom interaction. o I think online/hybrid classes would be perfect for working professionals to complete a degree, earn a graduate degree, or
even just to keep on the changing business world.
CONCLUSIONS
In summary, the findings above support our hypothesis that a University can see an increase in enrollments if they begin to offer online hybrid courses in their graduate program. An overwhelming percentage of participants in our survey stated they would choose a college which offers online hybrid courses over one that only offers face to face classes. The personal interviews conducted among faculty at Marywood suggest that the majority of faculty members support the online hybrid model of teaching. While there may be obstacles to overcome, there are numerous benefits that will out way these obstacles. This, in the end, should help to improve graduate enrollments.

Feasibility Study of Offering Online Hybrid Courses to Graduate Students
265
RECOMMENDATIONS
Proposed Online Hybrid Model
First Class: Face to Face
Students will be introduced to the professor along with fellow classmates. The professor will hand out and discuss an outline of the course which includes assignments, learning outcomes, assessments, and any projects that will be assigned. An overview of the online hybrid model will be given and the instructor should stress to the class that the course will not be easier than a traditional face-to-face class, just more convenient. In addition, students will be introduced to the course management software that will be used as part of the course. The professor, assisted by a technology employee will demonstrate how to use the technology that will be selected by the University and will familiarize the students through navigation around the Website. In addition to this demonstration in class, it is recommended that an online tutorial be available on University‘s website. Any questions that students may have will be addressed in this session and may include general course questions in addition to technology related questions in dealing with the website. Examples of the software features that will be introduced include the ability to post course content material, assignments, and quizzes, instructional links to various websites and other resources on the Internet, online assessments, and communication tools related to discussion such as chat rooms etc. An allotment of time should be set aside to allow students the opportunity to use such tools through a hands on practice of sending the instructor and fellow students emails, posting a new comment on a discussion board, and signing on to participate in a chat room. In addition, the instructor assisted by the technology employee should provide detailed worksheets to all students to take home with them. These worksheets will provide the students with directions in dealing with the online related functions that will be communicated and practiced within this first initial meeting. Time should also be set aside for the students to mingle with each other, thereby promoting an opportunity to socialize and start to build a feeling of community and friendship. This part of the class will prove very important.
Second, Third, Fifth, Seventh, Ninth, Eleventh Class: Online (Details Follow)
During the next two weeks and beyond, both the instructor and students will communicate regularly through email. Both will be able to communicate on a one to one basis or to the entire group of students participating in the class. In regards to email, students will not be able to use their personal email addresses. This will eliminate problems that may arise from having the wrong email address, from people who do not check their email on a regular basis, and from individuals who do not know or have misplaced another person‘s email address. Instead, the course management system that has been set up for the hybrid online modeled courses will allow each student to log on and go to an e-mail area to send and receive emails. The professor should be held responsible for answering student emails and providing feedback within a certain amount of time unless he/she specifies they will not be able to. Instructor immediacy has been linked to enhanced learning opportunities for students. Rapid and continuous feedback within a certain time frame can allow students to learn more as they do not have to wait for graded assignments to be received.
Chat
During the online session weeks listed above, each student will be required to participate in a one or two hour chat with the instructor to clarify course concepts. Beforehand, the students will be required to prepare for the chats by reading the text assignments, review the chat outline, and take an online quiz. Therefore, chat time is used efficiently, motivates students to stay current, and provides the additional opportunity for students to interact with both fellow students and the instructor in regards to course content. Beforehand, the instructor may also want to assign certain discussion questions to selected students to prepare their responses for a chat. Through software measures, each student should be allowed to archive, download, and print at a later time. Part of the students‘ grade will include their participation and preparation efforts in these chats. Quality student-teacher contact and communication will be a must and so it is recommended that the professor designates a certain window of time for students to perform chats with the professor during the online session weeks.
Online Quizzes
During each online session week of the semester, students will be responsible for taking an online quiz. This allows the instructor to test their understanding the assigned course material. In addition, the students are incentivized to stay current with reading assignments. These quizzes should be timed and set up so that students can only take them once. Upon completion, the students will receive feedback detailing what questions were answered incorrectly and what the correct responses should have been. These quizzes should be given before the second and third week chats so that students can discuss questions they have in regards to unclear material and incorrect responses on the quizzes. If the instructor would rather allow the students the choice to take the quiz more than once, it is proposed that alternate questions should be given.

Charles Lipinski, Laura Boyarsky and Jennifer Phillips
266
Discussion Threads
A discussion board should be set up to allow students to post both course related and technical questions. Certain threads should be allowed to continue throughout the entire course with an example being technical questions and issues. On the other hand, other threads should begin and end weekly being based on course material covered for that week. Instructors can monitor, review, and grade students on their discussion postings. As part of the course grade, it is recommended that the instructor requires each student to post a defined number of discussion postings. The instructor can then incorporate the quality of these postings into their grading criteria, allowing students to earn points towards their final grades for the degree of effort they put forward. Fourth, Sixth, Eighth, Tenth Class: Face-to-Face (Details Follow)
During each face-to-face session, students will be required to attend class in the traditional classroom environment. Attendance will be taken at each of these weekly sessions and shall count in each student‘s final course grade. This attendance in class should be strongly enforced and students should be reminded from the first class that attendance is required even though the course has several online sessions. Instructors should use their own discretion and teaching style in regards to conducting these classes. Some instructors shall lecture for the entire class period using PowerPoint slides from which students can take their own notes. In addition, the instructors can promote discussion throughout the class, assign case studies to be analyzed in groups for discussion and other personal class preference styles to be carried out. Due to the online hybrid nature of the course, it is recommended that the instructor allows and promotes some kind of discussion among students throughout these face-to-face sessions. This allows students to build upon a sense of community that was encouraged in the first face-to-face class session. Throughout these sessions, teachers should focus on lecturing about the new course content assigned for that week. Due to the design of the class, students are able to discuss and ask questions online for each of the online sessions and so a great deal of face-to-face class time should not be spent reviewing prior weeks‘ course content that was covered through an online session. Because the hybrid online model will be novel, in the beginning it is suggested that the instructor may want to devote a certain amount of face-to-face class time on the previous material just mentioned. Overall though, the instructor is encouraged to follow the course outline so all necessary topics are covered. In addition, this allows the course to run smoothly and encourages students to participate in the course in the way that it was intended to be carried out – a hybrid of face-to-face and online class sessions. It is also suggested that the instructor does not require students to take an in-class quiz in every face-to-face session. Ultimately, every instructor has their own discretion in the matter, but the online quizzes mentioned above were introduced to motivate students to stay current in the weeks where they do not have to attend class. Twelfth / Final Class: Face-to-Face
For the final class session, students are required to meet one last time. It is suggested that the instructor uses this last session to bring together all the concepts covered throughout the twelve week session. Discussion should be promoted once again between the students and the instructor and among the students themselves. Based on personal teaching preference, the instructor may require each student to take a final exam or make a presentation or may just require each student to submit a final take-home exam or project. During this last class meeting, the professor should ask the entire class to complete two surveys. One of the surveys will be the traditional course survey. This survey will need to be amended to reflect the now online hybrid nature of the course. In addition to this traditional survey, the second survey distributed should cover online hybrid model questions and should allow students to write their own comments at the end of the survey. Professors are advised to use both of the surveys to improve both the face-to-face and online components of the class. Due to the new nature of these courses, instructors should spend a decent amount of time focusing on the online hybrid survey questions to aid in tailoring these courses further and further to benefit all the parties involved. Other:
Labor Resources
In response to research feedback and Online Hybrid course design, it is recommended that the proper employees in addition to the proper number of employees head up the entire task of making such a big project possible. Additional IT-related staff will need to be hired to deal with the technological side of developing the courses and administrating them. Faculty, staff, IT employees, and even outside consultants will need to work together to ensure successful implementation. Website
Universities may need to update their website to allow students to access information on the Online Hybrid Courses it may choose to offer. As mentioned above, it is recommended that an online tutorial be designed and then should be allowed to be

Feasibility Study of Offering Online Hybrid Courses to Graduate Students
267
taken by accessing the University‘s website. In addition to course specific information, we feel the website should define what a hybrid course is, why the University is offering these courses, and finally what they hope to accomplish (ex. giving students increased flexibility, higher learning etc.). Also, a link to frequently asked questions or FAQ‘s should appear on the University website. The section of the website devoted to the Online Hybrid courses should also link all contact information of administrators who can assist with questions and problems that students may have. Sample frequently asked questions that the University may want to add to their website appear in the Appendix section of this research paper. These questions appear on Diablo Valley College‘s website. Bookstore
In addition to the traditional bookstore, administrators may want to consider adding an online bookstore to their operation. Accreditation
It is recommended that the Universities consider applying for accreditation for current and potential future course/degree offerings. The following sample list contains recommendations on a course-by-course basis. Core Courses
1) Advanced Topics in Management Information Systems- this course has a lot of class discussion, professor lectures, group work and presentations and readings. A face to face session would benefit the student in this case. While many of the handouts and readings can be held online, we recommend that only one or two classes be considered for online sessions.
2) Organizational Behavior and Development- this course can be held predominantly online with only three or four face to face sessions for presentations and class discussions.
3) Financial Planning and Management- this course involves many complicated methods and formulas. We recommend that this class be held face to face for all sessions.
4) Operation Analysis and Management (Quantitative Methods)- this course also involves many complicated methods and math formulas that we feel really need to be taught in a face to face class. We recommend that this course be held mostly face to face with only one or two online sessions.
5) Policy Formulation and Strategy Management- this course is the summation of the entire masters program. It should be held mainly in a face to face session but may contain two or three online courses throughout the semester.
6) Legal Aspects of the Administrative Process- this course would be good to be held predominantly online with three or four face to face sessions for presentations and class discussions.
7) Marketing and Strategic Planning- this course would also be good to be held mostly online with only three or four face to face sessions for presentations and class discussions.
8) Research Methodology- this course would be another good class to be held largely online with four to six face to face sessions for presentations, class discussions and group work.
Elective Courses - (For Concentration in Finance & Investments)
1) Business Venture & the Entrepreneur- this course can probably hold three or four online classes with the remaining classes being face to face.
2) Accounting Information Systems- this course involves many complicated topics and methods. We recommend that this class be held face to face for most if not all sessions.
3) Acquisition & Divestment- this course can probably hold three or four online classes with the remaining classes being face to face.
4) Business Taxation- this course involves learning many rules and regulations. Those classes can probably be held in online sessions. The remaining courses should mainly be held in face to face classes.
5) SEC & the Financial Markets- this course would be good to be held predominantly online with three to five face to face sessions for presentations and class discussions.
6) International Trade & Investment- this is also a course that involves many complicated topics, methods and formulas. We recommend that this class be held face to face for most if not all sessions.
7) Portfolio Theory & Capital Markets- this is a course that can probably hold an even number of face to face and online sessions.

Charles Lipinski, Laura Boyarsky and Jennifer Phillips
268
APPENDIX
Survey for Online/Hybrid Courses
This survey is to review the prospect of Universities offering Online/Hybrid classes. Online/Hybrid classes are classes that are partially face to face and partially online. This will allow flexibility to the student to accommodate professional and personal demands. Please complete this survey to see if online hybrid learning would be a good addition to graduate programs. Thank You!
1. What is your current profession? 2. Are you currently attending graduate school? 3. Have you ever taken any form of on-line class and if so, what was the experience like?
o I never took an on-line class. o The experience was a good one. o The experience was bad. o The experience was the same as any face to face class.
4. My professional and personal schedule is: o Predictable: I can plan blocks of time that I would be able to devote to my coursework o Generally Predictable but sometimes last minute events come up that I cannot reschedule o Unpredictable: I am seldom sure when I‘ll have free time that I could set aside for coursework
5. Are you comfortable with organizing or prioritizing your workload? o Yes- I am very good at organizing o Sometimes- I find it difficult to be organized all the time o No- I need someone to remind and push me to complete tasks
6. Can you complete a task without direct supervision or instruction? o Yes- I can complete tasks with little help or supervision o Yes- but I prefer having direct instructions o No- I need to have someone there to provide direct supervision
7. How important is having face-to-face contact with your instructor and other students: o Not very Important o Somewhat Important o Very Important
8. Estimate your comfort level with using a computer to learn and participate in a course: o Very comfortable o Somewhat comfortable o Uncomfortable
9. How likely are you to further your education for a graduate degree? o Not Likely (please still answer question 10) o Somewhat Likely o Very Likely
10. If you were going to further your education, when choosing between two locally accredited universities: o I would more than likely choose the university that offered online/hybrid classes o I would more than likely choose the university that offered only face to face classes o My decision would not be affected by the types of classes offered
Please write any comments that you have about on-line/hybrid courses possibly being offered. Please include any comments on how you would like to see the structure of the program (i.e. how many classes should be face to face versus online, how should the on-line portion be structured, etc.)

Feasibility Study of Offering Online Hybrid Courses to Graduate Students
269
Sample Frequently Asked Questions – (http://dvc.edu/online.faqs)
1. Do students have to sit down at their computers at the same time every day? Not for most online courses. Some courses have group meetings online. This varies by course. For some courses you leave your written comments or work for others to see, and check in at a later time to pick up the responses to those messages. But you might also have a group meeting of a few students to discuss the work that was posted. Some courses might have very little interaction online between the students. These meetings are scheduled as part of the course but have the same flexibility that is a key part of online courses. 2. Wouldn't it be better to have real-time discussion just like in a more traditional face-to-face classroom? The online program is designed to take advantage of the technology's strengths, rather than to replicate a model that works well in a face-to-face traditional classroom environment. Since students are located across various geographic time zones and have various work schedules and personal obligations, it would be very difficult and inconvenient for them to dial into their class at the same time. When communication is asynchronous, students can participate when and where it is convenient for them, whether that is 3:00 in the morning, or in a hotel room while traveling on business. In addition, there are significant cognitive benefits attributed to a synchronicity in online education. Because students have an opportunity to take their time reviewing the class archives (comments, lectures, discussions) and also take as much time as they need to compose their responses, the material and concepts are approached at an individual rate. Our students and faculty find that a level of depth and breadth can be achieved in asynchronous communication, which is more difficult to achieve with real-time" or "chat-mode" text-based communication. 3. Can you describe how a typical week's instruction is conducted? Typically the instructor posts introductory information on the week's topic in the online classroom, which includes the assignments, such as reading from the textbook, completing a case-study, taking part in an online discussion with other students in the class, or preparing a paper on the topic you're studying. The instructor also posts a short lecture or elaborates on the material, and provides discussion questions related to the topic. Throughout the week you work on your reading and assignments on your own, just as you would in a traditional classroom setting. You use the class discussion board to participate in class discussions with others in the class and to ask questions/receive feedback. When your assignments are due, you send them to your instructor online, and she/he grades them and sends them back to you with comments. 4. Can I talk to the instructor or other students in private? Yes, through the instructor‘s e-mail, by telephone conversation with the instructor at the college, or by visiting them during their office hours. 5. What about the lack of physical contact? Doesn't that detract from the educational process? While the lack of physical contact has its constraints, it does not necessarily have to detract from the educational process. The most obvious issue is the lack of visual cues-you can't have eye contact or see a smile or a nod-students and faculty have to find other ways to compensate for this. They frequently use the telephone when they need to clarify issues immediately. In addition, study materials and teaching techniques have been adapted to a visual, rather than an auditory learning environment, making use of the strengths of the online medium. In an online class, all students have an equal opportunity to participate in the discussions, not just the extroverts. Potentially discriminating factors such as race, handicap, gender and appearance disappear, and your ideas become the major focus. 6. How does this program differ from correspondence study? Correspondence study is generally self-study with individual written communication between one student and one instructor. The online courses focus strongly on the interactive, or cooperative methods of education, only achievable in groups. You participate in group discussion, academic debate, and social dialogue which eliminates the isolation of traditional correspondence study and provides a peer group for support. The group-driven component of the online model of education also contributes to knowledge-building as students share information and validate their ideas against the group's reactions. 7. Does it matter which type of computer equipment an individual uses? See the ―Technical Requirements for Online Courses‖ page for the list of necessary hardware and software. 8. How do you know the students are who they say they are? It sometimes comes as a surprise but the issue is really no different or problematic than in a traditional academic setting. For example, how does an instructor know that the student sitting in his/her class is the same student who registered for the course? How do faculty verify that students actually complete their own homework? These questions apply to all forms of educational delivery, and they must be taken seriously. As in traditional programs, there are checks and balances to discourage fraudulent practices. These begin with the application process whereby social security numbers, addresses, phone numbers, birth dates, places of employment, and previous college transcripts are all

Charles Lipinski, Laura Boyarsky and Jennifer Phillips
270
verified against the other. Small classes foster closer communication between faculty and students, and enable faculty to differentiate and recognize their students' written styles and personalities. 9. Do online courses cost more? No. In fact they often cost less because the student does not have to drive to campus, pay for parking, or adjust his or her working schedule. To get a better sense of this, consider using the Distance Learning Calculator. 10. Can I complete my entire course online, or do I have to come to campus for part of it? Some courses have required on-campus meetings. These are listed in the course schedule. 11. How many hours per week do students devote to an online course? Students generally spend the same amount of time as on a face-to-face course (i.e., a 3-unit course has 3 hours of class time plus 3-6 hours of homework). 12. Do I have to be an expert in computers to take classes this way? No. You should, however, know how to use your computer; how to save and retrieve files; how to use the simple functions of your word processor; and how to download to or update your computer with the common programs mentioned within the Tips for Success page. You should be able to type fairly quickly (minimum 25 wpm). You should be comfortable with browsing the Internet and using e-mail. 13. What are the online students like? Online students are typically the same students seen on any college campus. Students prefer online education for a variety of reasons including the technology itself, elimination of scheduling and transportation problems, disabilities. They are generally self-motivated and do not require traditional face-to-face contact with the instructor. 14. Are online courses accredited? Yes. The online courses have the same accreditation status as traditional courses. 15. Do students pay extra for online classes? No, they pay the same per credit fee which DVC charges all students. 16. How do I get my books or course materials? This will depend on the course. All books and materials will be available in the college bookstore, and you may purchase your books online at http://www.bookcenter.dvc.edu. Check with your instructor, the books may be available through an online source. Check out the links section of the technical support page. 17. What is the class setup? Taking an online class is self-directed study, making it different from the traditional classroom. It takes motivation to be an online student. Without a teacher looking over your shoulder students have to guide their own study, find the answers they need to get past a problem, and keep up with the class timetable. 19. When do I schedule my 'class' times? This will be determined by your instructor's syllabus and calendar. Some classes may have a weekly schedule, but the work can be completed at any time during that week. It will work best for you to set up at least two time spots a week to log on to your online classroom to take part in activities. Each time spot should be one and a half to two hours for the 'class time'. Another two to three hours each week should be spent on homework. In a traditional classroom for a three-unit class, you would spend three hours a week in class, and spend three-to-six additional hours in study. The best part of an online class is that these hours are flexible. 20. How do I communicate with the instructor? Studies have shown there to be more personal interaction between a student and his/her instructor in online classes than in traditional classes. This communication usually takes the form of discussion board postings, e-mail messages, or sessions in a chat room. E-mail involves a delay sometimes, since the instructor might only check messages once that day. Other forms of communication are sometimes needed with the instructor. The course syllabus will list phone numbers, addresses, etc. Remember, too, that you will also be communicating with other students in the class on a regular basis. 21. How do I ask questions? If you have a question in a traditional classroom, you would raise your hand and ask it. If the instructor does not understand it, or needs more information from you, he or she would ask for it. Online, you do not have the immediate feedback. You must ask questions of the instructor that they can answer. "I tried it, but it did not work, what now?" is not enough. It does not get you the answer, and makes it frustrating for the instructor. If you say "I tapped the Alt-F7 keys, and it said 'not ready reading drive A', what now?", your instructor can get you past the bump in the road, because they have the information needed. The majority of the time you should send questions to your instructor via e-mail, or post your message to the class discussion board. Sometimes the best way to ask a question is to telephone the instructor or visit during office hours.

Feasibility Study of Offering Online Hybrid Courses to Graduate Students
271
22. How do I get help? The different format of this class requires different techniques for getting help from the instructor. In this course, you must not allow yourself to become bogged down at any spot. Getting stuck can be frustrating, but should not stop you. Following are some ways to receive help, so you can continue your learning. Studies have also shown more interaction between individual online students than in a traditional class. Work in groups, but if you are
alone, ask questions of your fellow online students in the form of messages posted to the class discussion board. Read all the class messages. Everyone has the same types of questions and problems. Call the instructor by telephone! Call the office or visit during office hours. Sometimes a problem needs a voice answer. Do not hesitate to call. Phone calls are a good way to maintain rapport between teacher and student, especially when questions are complex enough to require intensive back and forth exchange.
23. What are the benefits to taking online classes? You get the best of two class types: the convenience of working at home along with the frequent communication of a classroom instructor. Some students need to study from home because travel costs or personal and professional obligations prohibit getting to a regular classroom class. Health problems or disabilities may also limit a student's ability to attend class on campus. Online classes may be the only delivery system available to these students. If you have a busy schedule, online classes give you more options. Students may work variable shifts, participate in academic and athletic organizations or travel while completing school. Meeting during a regularly scheduled class time may be impossible. The availability of computers and modems in households means more people have the technical capability. Students receive a taste of college class work without having to actually attend class. It can 'hook' some students into taking other computer classes. This creates a wider available student base for your local college. While learning the course subject matter, online students also develop important communication and technology skills, which are highly sought after in today's competitive work environment. Online courses are often less expensive than on-campus classes because of transportation and energy costs, lost working or professional opportunities, or childcare requirements. Consider using the Distance Learning Calculator to explore this type of cost savings. 24. Why have other students taken online classes? "Easy to fit into my schedule." "I work 8 to 5 and live 20 miles away." "Wanted to play sports and work while going to school...this way I can do it all" "Too tired to come to school at 9am" "I just had a baby 2 weeks prior to the class and also have a two-year-old. I would not be able to go to school for these classes." "Distance to the college - convenience of ability to work anytime day or night." "Cheaper because I don't need to drive, pay for parking, or eat on campus." "Scheduling." "I was drawn to this class because of having to spend so much time in the lab. I like being home." "I could take the class while on my lunch break at work." 25. How can I find out more? If you have questions regarding a specific course that are not answered in the course description or on the course web site you should e-mail the instructor directly. Instructors' e-mail addresses are listed on the Faculty Home Pages and the course websites are available off of the Online webpage. If you have questions regarding admission or registering check out the admissions and records web site or e-mail your question to them.
BIBLIOGRAPHY
―Distance Learning Accreditation and Online Degrees‖ June 2008. http://elearners.com/resources/accreditation.asp Fanter, Amy. ―Hybrid Education: The Future of Instructional Models.‖ WorldWideLearn May 2008.
Http://www.worldwidelearn.com/education-articles/hybrid-education.html Flowers, Jim and Baltzer, Holly. ―Perceived Demand for Online and Hybrid Doctoral Programs in Technical Education‖.
Journal of Industrial Teacher Education Winter 2006. http://scholar.lib.vt.edu/ejournals/JITE/v43n4/flowers.html Garnham, Carla and Robert Kaleta. ―Introduction to Hybrid Courses.‖ May 2008. http://courses.durhamtech.edu

Charles Lipinski, Laura Boyarsky and Jennifer Phillips
272
Hensley, Gordon. ―Creating a Hybrid College Course: Instructional Design Notes and Recommendations for Beginners‖, ―Creating A Hybrid College Course: A Case Study‖. Journal of Online Learning and Teaching December 2005. http://jolt.merlot.org/documents/Vol1_No2_hensley.pdf
Lindsay, Elizabeth Blakesley. ―The Best of Both Worlds: Teaching a Hybrid Course.‖ Academic Exchange Quarterly 2006. http://rapidintellect.com
Martyn, Margie. ―The Hybrid Online Model: Good Practice.‖ Educause Quarterly November 2003. http://educause.edu ―Online Nation: Five Years of Growth in Online Learning‖. Sloan C Publications- Survey Reports http://www.sloan-
c.org/publications/survey/index.asp ―Schools Accredited in Business.‖ The Association to Advance Collegiate Schools of Business June 2008.
http://www.aacsb.edu/General/InstLists.asp?lid=3 Sheridan, Rick. ―Reducing the Online Instructor‘s Workload.‖ Educause Quarterly November 2006. http://educause.edu Williamson, Jennifer. ―Today‘s Classrooms are Going Hybrid: Six Ways You Can Benefit.‖ Distance Education Organization
August 2007. http://distance-education.org/Articles/Today-s-Classrooms-Are-Going_Hyrbid.html

Faith Integration in the Discipline of Music
273
FAITH INTEGRATION IN THE DISCIPLINE OF MUSIC
Peter Miller Indiana Wesleyan University
FOUNDATIONS
Before I share my views on faith and academic discipline, I feel that I need to lay the groundwork with some basic philosophies I have developed and which are guiding principles in my life and faith. When I interviewed for my present position at IWU, I shared that my goal - that for which I strive in my daily life/walk is to be more like Jesus. I realize that God calls us to perfection. He desires for us to be holy as He is holy. We strive to narrow the gulf between what God expects us to become and where we are presently in our journey on the way to following His will completely and fulfilling His plan for us. Humans are three part beings. We all consist of body, mind, and spirit. Integration of faith and our discipline affects a permanent change in all three areas. As this relates to learning in the general sense, FAITH is the only omniscience (all-knowing). It is far beyond what our present-moment minds can comprehend. God alone is the source of all knowledge! Specifically, my approach to faith and learning in music is to make the world a better place in which we can all make music and have it be an infusion of God‘s gifts and an outpouring of the human spirit. IWU is a wonderful Christian academic community where much nurturing, mentoring, and spiritual growth take place–not only for students but for faculty and staff as well. I‘m blessed that God has called me to share my (His) gifts and talents with my students. My goal and prayer is that I make a difference in every student‘s life so that each may in turn go out and change the world for Christ.
DEFINITIONS
The Merriam-Webster Dictionary defines integration as 1) the act of forming into a whole: UNITING 2) incorporating into a larger unit. David Wolfe states that ―Genuine integration occurs when an assumption or concern can be shown to be internally shared by both the Judeo-Christian vision and an academic discipline. . .Integration is the process by which two very differing visions are related in an interesting and informative way on the basis of one or more [common] presuppositions.‖ in the introduction to his book ―The Reality of Christian Learning.‖
THE GIFT IS INSIDE OF YOU
For the student involved in Christ-centered learning about and the professor committed to Christ-centered teaching in the vocal or choral area of music, the ability to integrate faith within the discipline is fairly obvious and intentional, as well as easy to ascertain and relate to. God has placed our instrument inside of us. In all other cases. . .‖the instrument is external to the person using it and its tonal characteristics are not considered synonymous with the musician himself.‖ In addition, music ians in general and singers in particular, approach life with a unique intensity. ―Our art is a correspondingly intense way to express our feelings. Singers experience this to a particularly potent degree because our bodies are the instruments. We sing the words, and we feel the complexity of emotions resounding within our bodies.‖ Likewise, because the Creator‘s gift is innately part of our being, we have opportunity, passion, and purpose to express gratitude to the Giver in a uniquely personal way.
A HISTORICAL ROLE MODEL AND MENTOR IN OUR DISCIPLINE
Many Christians, both musicians and non-musicians alike are keenly aware of the fine example of a Christ-like composer, performer, and servant Johann Sebastian Bach has set for us. I have incorporated the reference from Roger Kamien‘s ―Music an Appreciation‖ ―Bach was a deeply religious man – a Lutheran - who wrote the letters J.J., standing for Jesu Juva (Jesus

Peter Miller
274
help), at the beginning of each of his sacred compositions and S.D.G. for Soli Deo Gloria (to God alone the glory) at the end‖ as a springboard to conversations about faith integration in music with every section of MUS 180 I taught. Ultimately, it led us to discussions about every student being passionate about discovering and developing his/her unique talents in each one‘s own discipline of God‘s calling. Bach‘s music is obviously very spiritual, even to a first-time listener. Perhaps he was a bit preoccupied with death and eternity. Haydn and Handel were also deeply religious men. [However they] ―felt they were friends of God. Not Bach, who stood much more in awe of the Deity. He once said that the aim and final reason of music ‗should be none else but the Glory of God and the recreation of the mind.‘. . .there is so religious a feeling that the music cannot be fully understood except by one whose religious roots, feeling, and very background run closely parallel to Bach‘s. The refinements of the music in relation to the spiritual message and the actual religious service that it represents are fully open only to those who can identify with the church and the spiritual life of Bach‘s day.‖
WORD PAINTING AND ITS IMPLICATIONS
The most obvious examples of Bach‘s use of faith integration in his sacred compositions, then, might well be his explicit use of musical word painting (musical representation of specific poetic images). While citing specific, individual musical examples in Bach‘s music may well go beyond the scope of our discussion in this paper, I will highlight a few general characteristics of text painting encountered in the vast majority of compositions of the Renaissance and Baroque era. ―Composers wrote music to enhance the meaning and emotion of the text. ‗When one of the words expresses weeping, pain, heartbreak, sighs, tears, and other similar things, let the harmony be full of sadness,‘wrote Gioseffo Zarlino, a music theorist of the sixteenth century.‖ A composer‘s use of a minor tonality or chromatically descending half-steps would musically illustrate this emotion well. Use of quickly moving notes to depict running; large downward melodic leaps to illustrate descending to the depths; bright major keys, florid melismatic passages, and multiple repetitions of text to express joy; and rests or spaces in the music to convey sighs, restlessness, or longing were also popular idioms in the music of these historical style periods. If Johann Sebastian Bach was a Baroque composer, a musical genius, and a Christian, (he was obviously all three), would it not make sense that he would excel in expressing his deeply profound faith articulately through his music, especially in vocal and choral genres? As I continue to share this music with my students, I become increasingly passionate about helping them discover these spiritual moments in the music and relating these events to experiences in their own spiritual journey.
FAITH INTEGRATION IN THE APPLIED VOICE STUDIO
I have a student currently studying two soprano arias each from a different sacred church cantata of Bach. She will perform both arias on her senior recital next spring. Her faith and life are a testimony to the love she has for her Savior. When we became immersed in the meaning of the text and understood how the composer set these words to music as a personal expression of his faith, she was deeply moved. Section A: Offne dich, mein ganzes Herze – open thou my whole heart (ascending scale passages to the highest note in the melodic line) Jesus kommt und ziehet ein - Jesus comes and enters in. Each phrase is then repeated with the climax on the words Jesus and whole heart. Section B: O wie selig – O how blessed (this phrase is repeated no less than six times in the space of four measures; the setting is also a bit melismatic depicting the excitement of the soul at the thought of being blessed). Werd‘ ich sein – will I be (cadencing in the dominant, creating a feeling of anticipation as the music returns to repeat Section A. I had a similar experience with a first-time freshman just last week. His only experience with singing was ministering through music with the worship team from his home church. He‘d not even sung in his high school choir but he knew God had called him to be a church music major with a vocal concentration. It was only his second voice lesson and we were sharing about a sacred song he had begun working on the week before. It was a setting of the text from Psalm 51 (Misere Mei). I decided to pursue a spiritual discussion relating to the psalm text, penitential seasons, the liturgical year, and the use of word painting in the music (minor tonality and severe rhythms for the ―Cast Me not Away‖ text, and triumphant modulation to C Major for the ―Restore unto Me the Joy‖section. I was glad that Dr. Lessly happened to be sitting in on the lesson completing my faculty evaluation for rank improvement, so that I could share some of my faith integration approaches in an applied teaching setting with her. I have alluded to the natural inclination of vocal/choral composers and performers to find it easier to express their faith through their ―instruments‖ and their music. Also, as I approach the mid-point of my earthly life, I look for more ways to

Faith Integration in the Discipline of Music
275
challenge myself with opportunities to link areas within my own discipline, reference different disciplines across the curriculum and integrate faith into every aspect of learning. I‘m going to ―go out on limb‖ just a bit with what follows and state a premise that making music and integrating faith for an instrumentalist is a different sort of challenge than for a singer. I will verbalize my purpose for this supposition from my own experiences in the quest for a terminal degree.
PROFESSOR AS STUDENT
Several motivations for pursuing a DMA in organ performance rather than voice included wanting to further explore a passion which I had not completely developed, becoming comfortable with and perfecting practice/performance techniques which were already second-nature to me as a vocalist, and learning how to internalize the concept of phrase-making when the instrument is not part of your body. Little did I know what life-changing experiences I was in for when I was first accepted into the program. My applied teacher is a world-class instructor, musician, and performer. His chosen area of specialization is the three generations of North German organ composers and the direct line of influence to J. S. Bach. This has aroused an interest in following this thread as it leads to research and further study for my final project/lecture recitals/dissertation topic ―The Development of the Chorale Prelude in the North German Organ School of the 17th Century (you might well imagine that there will be numerous references to word painting and faith integration in my work). His permeation of my musical personality has revolutionized the ways in which I approach practice, performance, theoretical analysis, historical perspective, interpretation, communication, expression, articulation, phrasing, presence, poise, self-confidence and being (and therefore the way I teach my students). But sadly, my professor is not a Christian. All of his knowledge, skill, and musicianship are based solely on his own abilities without any dependence on the God who blessed him with these talents. His interpretation of this phenomenal development of sacred keyboard literature (chorale settings) has no foundation in faith. How can he not accept the gift of Grace in light of all of the evidence which is present within the music itself? Indeed nearly two-thirds of the organ repertoire of the 17th century consists of chorale settings. From Sweelinck‘s ―monodic chorales‖ the ―cantus planus‖settings of Scheidt, Scheidemann, and the three Praetoriuses (1st generation), the chorale variations of Reincken, Tunder and Weckmann (2nd generation), the chorale fantasies of Buxtehude, Bruhns, Hanff, and Lubeck (3rd generation), the chorale partita sets of Bohm and early Bach to the magnificent ―great eighteen‖ Leipzig chorales of the consummate master, the Grace of God is at work in the lives and music of these great men of faith. Well, I now have another motivation for my studies; live my faith by example and allow God to use me in my witness to my teacher. The spiritual journey of the Christian is more about paths, directions and milestones along the way than arrival at a destination. As I stated at the beginning of my paper, faith integration affects changes in body, mind, and spirit. Approaching our discipline from Christ-centered teaching and learning will result in a positive, permanent transformation of both teacher and learner. All good gifts come from above and God is the source of all of them. ―We give but Thine own, Whate‘er the gift may be; Respectfully submitted, All that we have is Thine alone, A trust, O Lord, from Thee‖ Peter K. Miller
BIBLIOGRAPHY
Eustis, Lynn. The Singer‘s Ego (Chicago: GIA Publications, Inc. 2005) Heihe, Harold and Wolfe, David. The Reality of Christian Learning (Grand Rapids: Eerdmans, 1987) Jordan, James, The Musician‘s Walk (Chicago: GIA Publications, Inc. 2006) Kamien, Roger. Music: an Appreciation – 5th Brief Edition (New York: McGraw Hill Companies, Inc, 2006) Merriam-Webster Dictionary (New York: G. & C. Merriam Co. 1974) Schonberg, Harold C. The Lives of the Great Composers (New York: W.W. Norton & Company. 1970) Shannon, John R. Organ Literature of the Seventeenth Century: a Study of its Styles (Raleigh: at the Sunbury 1978)

Rehana K. Whatley
276
BEYOND BORDERS: A YOGIC APPROACH TO LANGUAGE LEARNING AND TEACHING
Rehana K. Whatley Oakwood University
ABSTRACT
Teaching requires new initiatives, creative ventures and immense courage. Any pedagogical approach that focuses on the
mind alone, I believe, empirically speaking, can achieve only so much. My teaching experience is my lab. I have taught
upper level students English in Pakistan, Saudi Arabia, United Arab Emirates, Canada, and the U.S. Over forty two years of
passionate classroom research, my credo remains to connect mind and body and deliver a holistic experience to all
concerned.
I seek to awaken my students‘ senses to ―the rippling fields‖ of meanings and connotations that lie behind words. When English is being acquired as a second language one has to sink one‘s teeth into the commonality of something. This vertical thrust into common human experience entails a common sense right and wrong and thence a search for meanings and
connotations becomes not only engaging but a unifying experience for the class. For example, an activity on swords and
daggers and what they connote plunged students into stories of chivalry on the one hand and tales of deceit and treachery on
the other. Students enjoy digging and their finds are no less archaeological, for they are slicing and dicing folklore and
culture.
Early on, I realized that students engage in games, creative activities, discussion when they are challenged, teased into thinking. The quest theme is something I use shamelessly in my classes. Meaning of something may be the golden fleece, but the added bonus of personal meanings and connections the students take away are the kicker. Unlike Cardinal Newman in the nineteenth century who suggested a whole host of subjects for a wholesome education, a yogic or a deep thrust approach which taps the roots of human experience can truly deliver. The students in my class debate different nuances of meanings until ―seedlings start whistling in the wind.‖ The crux of this approach will show how the use of a text such as the Iliad energized students to probe and uncover basic human values buried in an ancient classical epic. I usually begin my classes with folktales from around the world. In 2006, or a Fulbright Scholarship, I studied the folk heritage of Thailand and Myanmar. It gave me added impetus into exploring the moral principles underlying oral or written narratives. The folk tales we handle in class deal with issues regarding relationships, rites of passage, rituals, goals, death etc. The questions of right and wrong in different folktales of many nations lead to the basic assumption that wrong hurts as seen in the tales while right moves people forward into harmony. Connections are made between stories and human experiences and a sense of the common human family surfaces. Students from various parts of the world bring their personal world views but when the inessentials are shed in the cauldron of class activities what remains is the human expression of a scream of pain or a cry of joy. The African folktale of creation resembled so much the South East Asian tale of creation. A huge gourd, for example, let loose on the earth produces millions of seeds or humans who spread across the length and breadth of mother earth. Plurality and diversity encouraged the students to visualize and feel the universal truth of human creation. Through language learning the students are exposed to wisdom that is the common bedrock of human existence. The students enjoy celebrating differences but I tend to facilitate activities towards the common human denominator in us all. In an age of international conflicts and numerous regional problems students are eager to know why, wherefore, and what of things. I see this as a blessing and challenge them so that they can sift out their human heritage as something different from ancestry, nationality, caste, creed, etc. ―No man is an island,‖ claimed Donne the metaphysical voice of wisdom in the seventeenth century. Each one of us is a part of the other. It is elevating to see students assess that by cooperating they are honoring their common heritage. Language learning and teaching thus yokes together the hearts and minds of students.

Beyond Borders: A Yogic Approach to Language Learning and Teaching
277
While they are learning the language, they are teachers in the making, thinking beyond borders. This harmony of mind and heart, of strategies and holistic experience is no doubt a yogic approach to language learning and teaching. This lab room or classroom experience does not mention the titles of classes and where which is totally intentional. My approach can be tried by anyone, customized their way, to stir the heartseed in students. This brings me to the heart of this approach. The centerpiece of classroom dissection is the Iliad, the Greek epic. In my classes we summarize it, act it, handle bits and pieces, so as to soak ourselves in it. We focus on Achilles‘ devotion to honor. The students take crises in the epic to understand Achilles‘ sense of who he is and what honor means to him. Students have diverse experiences to relate to class. What is honor to one student is not as such to another. After sorting through personal reactions, they are able to see how Achilles‘ grasp of the word changes with the change in his experiences. The students see Achilles as a proud, selfish man, totally self-obsessed, but through the course of the epic they realize that Achilles is at peace when he honors his enemy humbly. The students see how experience of anything changes and adds to meaning. As they are learning the language, with each reading their understanding deepens. By connecting things they are growing in their understanding. Learning a language without a doubt, is an act of courage, for it is akin to Hercules maneuvering his way by facing his several labors. Students are riveted, for they see Achilles butchering the Trojans, killing Hector and dishonoring his body. Through the carnage, the students find their way in a baptismal moment between Priam, the father of Hector, and Achilles, the killer of Hector. The students use the meeting between King Priam and Achilles for several class discussions. They see Achilles, half-god, half-man, oblivious to others, suddenly moved to sob incessantly. Priam, begging for his son‘s body, reminds Achilles of his father, Peleus. One of my students called the moment an archetypal father and son moment. A father faces the killer of his sons and a killer faces an old man, almost like his own father. Another student screamed in joy, for she realized that Achilles finally earned honor. By respecting and honoring Priam‘s wishes, by returning Hector‘s body, by suspending war for 12 days, Achilles, to her, was someone who by sharing honor became an honorable warrior. My classes focus on the heart of texts, the universal heart. Language learning becomes an adventure when students and teachers dip into ground zero, and become totally vulnerable. Palmer, an authority on teaching, asserts it is when we are vulnerable that we are open and receptive. To my students, the Iliad opened up meanings upon meanings. Students concluded that from mentally hugging honor, Achilles stoops to lift the body of hector, his enemy; Achilles bends to soothe sobbing Priam. Achilles, to them, alchemized into the human design and they celebrated the moment in mind and spirit.
WORK CITED
Homer. The Iliad. The Norton Anthology of Western Literature. Ed. Sarah Lawall. 8th Edition. Volume 1. New York. W.W.W. Norton and Company, 2006
Palmer, J. Parker. The Courage to Teach: Exploring the Inner Landscape. San Francisco: Jossey-Bass, 1998.
ABOUT THE AUTHOR
Rehana K. Whatley is an associate professor at Oakwood University, in the Department of English and Foreign Languages, Huntsville, AL 35786. She has been at Oakwood since 2000. Her teaching career spans 42 years and covers several countries. She writes essays and poetry as a pastime.

Jianjun Yin and William A. Brown
278
UNFAIR AT ANY COST: A SURVEY OF THE STUDENT POPULATION MAKE-UP IN JACKSON PUBLIC SCHOOLS (MS)
Jianjun Yin and William A. Brown Jackson State University
This study reviewed the history of the African Americans residing in the inner city of Jackson and how they have gone through
the process of segregation, de-segregation, re-segregation and finally the de facto segregation. A survey was administered to
the schools in Jackson, the largest school district in the State of Mississippi, which serve predominantly African American
children and youth to determine the student population composition, and how the African American school-age children and
youth are deprived of the best educational opportunities due to their residence, their socioeconomic status, inadequate school
funding, lack of resources, poor learning environment, and less competitive and competent teaching force resulting from the
de facto segregation. The study also compared Jackson Public Schools with other school districts in the suburban areas of
Jackson, which serve predominantly affluent white students. The investigator had traveled to the Jackson Public School
Central Office, many school libraries and other related locations and facilities to retrieve critical statistical data, and browsed
some histories of the schools serving children and youth in Jackson inner city areas. To depict a better picture of how African
American children and youth fare in schools and the society, the investigator had taken the liberty to interview dozens of
people including school officials, teachers, parents and students. By carefully analyzing results and findings, the researcher
further discussed the inequity and unfairness imposed upon the African American youth and children residing in the inner city
areas. Being segregated, young African American children are faced with severe challenges and provided with fewer
opportunities become less productive in their endeavor and search for a better future. With no one to lean upon, any
children‘s their school careers are inadvertently cut short due seemingly to failing grades, unexpected pregnancies, divorces
of parents, and poverty. They are forced to drop out of the schools they attend and eventually become victimized by the
environment in which they live.
The researcher took a period of three months in data collection and analysis which involved students, parents, school
administrators, librarians, and JSU graduate and undergraduate students who were working as interns in the Jackson Public
Schools. The researcher had made numerous successful attempts to access the Jackson State University and school libraries
in order to acquire crucial data and information with regards to students‘ enrolment, their childhood socioeconomic status, standardized test scores, teenage pregnancy rate, school funding, enrolment and dropout rates and percentage of graduates
going to college. The researcher had spent a tremendous amount of time interviewing dozens of students, parents and
teachers on their views of how segregation has affected the educational opportunities of youth and children.
Recommendations, based upon the findings and analysis, were made to school authorities, policy makers, educators and
parents as to how we can best provide all children with equal opportunities so that they are better academically, economically,
socially, emotionally and physically prepared for future challenges in this diverse and multicultural society.

Is There a Correlation Between Cheating in Undergraduate Institutions and The Mess on Wall Street? Student Perceptions of Cheating in Today‘s Competitive
Environment.....
279
IS THERE A CORRELATION BETWEEN CHEATING IN UNDERGRADUATE INSTITUTIONS AND THE MESS ON WALL STREET? STUDENT PERCEPTIONS
OF CHEATING IN TODAY’S COMPETITIVE ENVIRONMENT …..
Constance J. Crawford and Anita Stellenwerf Ramapo College of New Jersey
ABSTRACT
A recent survey of undergraduate business students indicated that an overwhelming majority, over 75%1, of the participants
cheated. When graduate majors are surveyed, research determines that the biggest cheaters, 56% overall, were business
students2. Are students behaving in response to societal rewards of corporate malfeasance resulting from corporate fraud?
The defense and justification of ―everybody does it‖3 undermines the academic integrity standards and the financial reporting
standards. A recent editorial likened the reports issued by leading Wall Street financial firms to a ―fairy tale‖ of assets4. This
mindset of fraud and corruption infiltrates the learning process and establishes a diminished ethical expectation for the
business students.
INTRODUCTION
Are the recent ―bailout‖ legislative proposals perceived as a reward to the students standing on the sidelines watching the ―Washington Legislators vs. Wall Street Barons‖ game? It appears as if Wall Street scored a touchdown with the $700 billion dollar ―bailout‖ plan. How can we expect our students to behave in an ethical manner when they perceive unethical behavior rewarded and sanctioned by our capitalistic system? Could there be a link between perceived expectations of reward vs. questionable reporting of financials and an increase in cheating by business students on college campuses? Some research suggests that the U.S. economic climate has become so competitive that the only successful strategy for winning is cheating5. If cheating has become the new pedagogy for academic achievement, the ultimate consequence will be increased cheating on the part of business graduates in corporate America. The genesis of cheating did not begin in the board room it began in the classroom6 where practices involving cheating are rampant. Research exists connecting cheating in one academic environment to repetitive behavior exhibited by students throughout their educational experiences7. It would seem a likely conclusion that the cheating tendencies would continue as students become business leaders.
WHAT CONSTITUTES CHEATING?
There is confusion on the part of undergraduate business students in today‘s complex as to what cheating really means. This confusion leads to behavior that is linked to cheating scandals at the most prestigious of academic institutions. Unfortunately, when surveyed, business students perceptions of what constitutes cheating was significantly more lax than other majors8. Have we developed a culture that encourages and rewards cheating? Could the example of risk, cheating, compared to the return, good grades, provide the foundation for successful business decision-making upon graduation? Students develop coping mechanisms during their academic endeavors to justify behavior that might appear to be immoral. This process, called ethical distancing9, permitted students to separate their actions from the unethical behavior. Students have the ability to focus on the result rather than the action. The justification for cheating was driven by a competitive desire to achieve a goal. The actions of corporate management involved in irresponsible and inaccurate financial reporting are justified by the participants using a similar mindset. Could this perception of ethical distancing that allowed a student to cheat in the classroom enable that same student to cheat in the board room? Academic research indicates that students perceive themselves to be more ethical than business professionals10. The conclusion, reached by the students, provides the foundation for the realization that cheating will continue throughout the students‘ business careers in order to advance in a perceived unethical business environment.

Constance J. Crawford and Anita Stellenwerf
280
METHODOLOGY
My research will be based on both primary and secondary research. My primary research will consist of a survey pertaining to issues and cheating in school to be administered to undergraduate business students. The results of the survey will be included in the paper. My secondary research will consist of an extensive review of the current literature pertaining to cheating in school and the correlation between cheating on financial statement reporting in annual reports.
PAPER FORMAT
The paper will follow APA guidelines and structure. The paper will include an introduction, a section on methodology followed, the results of the literature search, the results of the primary research, and my conclusions. If there is an indication for future research, I will include these indications.
REFERENCES
1 Mays Business on-line, ―Honor the Aggie Way,‖ http://maysbusiness.tamu.edu/old2004/07/honor.html.
2 Slashdot, ―Which Grad Students Cheat the Most?‖ http://science.slashdot.org/article 3 Latte, ―GSU Students Perspectives on Academic Dishonesty,‖ http://latte.pbwiki.com/. 4 Bramhall, ―Bramhall‘s World, The Daily News September 16,2008. 5 McGowan, M.,‖Why We Cheat‖, Fayetteville Free Weekly, Jan 17, 2007. 6 Morris, D. & Killian, C., ―Do Accounting Students Cheat? A Study Examining Undergraduate Accounting Students
Honesty and Perceptions of Dishonest Behavior.‖ Journal of Accountancy and Public Policy, Vol 5. No. 3 2006. 7 Ibid. 8 Klein, et al., ―Cheating During the College Years: How Do Business Students Compare?‖ Journal of Business Ethics, Vol
72, No. 2, May 2007. 9 McGowan, M., ―Why We Cheat‖, Fayetteville Free Weekly, Jan. 18, 2007. 10 Lawson, R., ―Is Classroom Cheating Related to Business Students‘ Propensity to Cheat in the ‗Real World‘‖?, Journal of
Business Ethics, Vol. 49, No. 2, January, 2004.

NOTES:

IJEDAS-International Journal
of Electronic Data
Administration and Security
JIBMR-Journal of International
Business Management &
Research
JOIM-Journal of Organizational
Information Management
JISTP-Journal of Information
Systems Technology and
Planning
RMIC-Review of Management
Innovation and Creativity
JGIP-Journal of Global
Intelligence and Policy
IJAISL-International Journal of
Accounting Information
Science and Leadership
JAGR-Journal of Applied Global
Research
IJSHIM-International Journal
of Social Health Information
Systems Management
RHESL-Review of Higher
Education and Self-Learning
For information about Intellectbase International Consortium and associated journals of the conference, please visit www.intellectbase.org
B E S T M A P S
MULTI-DISCIPLINARY
FOUNDATIONS & INTELLECTUAL
PERSPECTIVES
EDUCATION
BUSINESS
SOCIAL
POLITICAL
ADMINISTRATION
MANAGEMENT
TECHNOLOGY
SCIENCE
JWBSTE-Journal of Web-Based
Socio-Technical Engineering
JKHRM-Journal of Knowledge
and Human Resource
Management
IHPPL-Intellectbase Handbook
of Professional Practice and
Learning
JGISM-Journal of Global
Health Information Systems in
Medicine