Taxes, tenders and the design of Australian off-market share repurchases
42
Taxes, Tenders and the Design of Australian Off-Market Share Repurchases * Christine Brown 1 Department of Accounting and Finance, Monash University and Kevin Davis Department of Finance, The University of Melbourne and The Australian Centre for Financial Studies ** We are grateful for comments on earlier versions to Bruce Grundy, Vernon Joice, Peter Monkhouse and to participants in the seminar series at Manchester Business School, the 2010 Latrobe Corporate Finance and Governance Conference and the 2010 FMA International Conference, and to an anonymous referee. Any remaining errors are our responsibility. 1 Contact details: Christine Brown, [email protected] Phone 613 99031793, Kevin Davis, [email protected] , Phone 613 83445098.
-
Upload
independent -
Category
Documents
-
view
3 -
download
0
Transcript of Taxes, tenders and the design of Australian off-market share repurchases

Taxes, Tenders and the Design of Australian Off-Market Share Repurchases*
Christine Brown1 Department of Accounting and Finance, Monash University
and
Kevin DavisDepartment of Finance, The University of Melbourne
and The Australian Centre for Financial Studies
** We are grateful for comments on earlier versions to Bruce Grundy, Vernon Joice, Peter Monkhouse and to participants in the seminar series at Manchester Business School, the 2010 Latrobe Corporate Finance and Governance Conference and the 2010 FMA International Conference, and to an anonymous referee. Any remaining errors are our responsibility.
1 Contact details: Christine Brown, [email protected] Phone 613 99031793, Kevin Davis, [email protected], Phone 613 83445098.

Taxes, Tenders and the Design of Australian Off-Market Share Repurchases
ABSTRACT
In designing off-market (self-tender offer) share repurchases, Australian companies must consider the resulting potential tax benefits for different investor groups with consequent effects upon the supply of stock tendered by holders and the ultimate tender outcome. We develop and estimate a model of the stock supply curve which demonstrates less than perfect elasticity and incomplete tax arbitrage arising from “participation risk” for potential arbitrageurs. We are able to estimate the extent of disequilibrium in prices involved in fixed price repurchases, and show that it is substantial. We show that Australian Tax Office restrictions on the tender price range for Dutch auctions have meant that non-participating shareholders have foregone some potential benefits through the transfer of .tax benefits to (primarily institutional, low tax rate) successful tender participants. The results provide support for legislative changes proposed in 2009 (but not implemented as of mid 2011) which removed constraints on the allowable range of repurchase prices.
KEYWORDS: Repurchases, Taxation, Tenders, Shareholder Heterogeneity
JEL Classification: G32, G35, H20
2

1. Introduction
The literature on share repurchases is extensive and examines,
inter alia, motivation (signaling, capital management etc.), market
reactions, and choice of method (on- versus off-market2 etc.). See Allen
and Michaely (2003) for a recent survey. The focus of this paper is
upon two specific issues identified in that literature. One is the
argument that corporate managers make payout decisions which favor
institutional investors. A second is the merits of fixed price versus
Dutch auction tender mechanisms in implementing off-market share
repurchases. We utilize Australian data which, because of its particular
tax characteristics, provides a favorable institutional environment in
which to examine these issues.
Off-market share repurchases, structured to achieve certain tax
advantages, have been popular in Australia in recent years, but have
attracted criticism from commentators in the financial press.3
Underpinning the criticism has been the complaint that such
repurchases favor one group of shareholders to the detriment of
others. The possibility of inequitable treatment of shareholders arises
because of the specific tax treatment applied to Australian repurchases
which also leads to the unusual outcome of repurchases occurring at a
substantial discount to the prevailing market price.
2The terms ‘repurchase’ and ‘buyback’ are used interchangeably in Australia. Off-market repurchases are called self-tender offers in the U.S. and on-market repurchases, where the company repurchases shares on the stock market through a broker, are called open-market repurchases in the U.S.
3 See for example, Sellars-Jones (2006) as well as submissions to the Australian Government Board of Taxation at: http://www.taxboard.gov.au/content/content.aspx?doc=reviews_and_consultations/off_market_share_buybacks/default.htm&pageid=007
3

While the discount pricing of repurchases reflects idiosyncratic
tax factors, the Australian tax and institutional environment provides a
valuable opportunity to examine whether characteristics of the supply
curve of stock tendered by holders found in other studies of
repurchases are robust to marked changes in institutional conditions.
In particular tax heterogeneity of investors is well defined in the
Australian case enabling us to identify key determinants of the stock
supply curve, to test whether complete tax arbitrage occurs, and
examine how pricing constraints affect the distribution of benefits from
repurchases between participants and non-participants.
As Bagwell and Shoven (1989, p130) note, “[b]oth the sellers
and the nonsellers can gain from a corporate program of share
repurchase” due to self selection based on their tax characteristics,
implying that the pricing mechanism for the repurchases is important
in distributing such gains. Rau and Vermaelen (2002), Short, Zhang
and Keasey (2002) (using UK data from a partial imputation tax
system) and Lie and Lie (1999) (using US data from a classical tax
system) find that the tax position of important shareholders, such as
pension funds and other institutional shareholders, is a key factor in
corporate payout policy. Thus the importance of institutional investors
in firm capital management decisions appears to be independent of
the specific tax environment. While we do not examine the choice
between payout methods (see Brown and Norman, 2010) our analysis
of the characteristics and pricing of repurchases provides evidence
from a different tax environment consistent with corporate payout
policy favoring institutional investors.
The full imputation tax system operating in Australia combines
with somewhat unique tax rules governing the treatment of off-market
repurchases to provide an ideal environment to investigate the
importance of investor-level taxes in the structure of repurchases. Thus
4

the first general contribution of the paper is an examination of how
taxes affect capital management in a non-classical tax system, and in
providing a different lens to previous studies through which to examine
the consequences of shareholder tax heterogeneity.
Our analysis shows that Australian off-market repurchases are
generally structured to provide most benefits to low tax rate
participating investors (such as institutional pension (superannuation)
funds) who have short term capital gains from trading activities
elsewhere in their portfolios. Our empirical findings also suggest that
alternative structures and pricing could provide a greater share of
benefits to non-participants, although Australian Tax Office restrictions
have played an important role in the outcomes observed.
A second contribution of the paper lies in developing and
estimating a model of the supply curve for stock tendered by
shareholders, by modeling the net benefits of participation to
shareholders with different tax situations. We are also able to exploit
information extracted from repurchase offer and completion
documents to measure outcomes of excess demand for shares wanted
for repurchase by the company or excess supply of shares tendered by
holders due to auction price bounds. We use this information to
estimate an upward sloping supply curve for stock tendered in Dutch
auctions using censored regression techniques. We are able to test
whether tax arbitrage can fully explain the shape of the supply curve
or whether other risk-related factors associated with tendering are also
relevant.
These results enable us to assess the extent of mispricing in
fixed price tenders, and also the costs to non-participating
shareholders from the minimum price bounds imposed by companies
(in response to Australian Tax Office rulings) on Dutch auction
outcomes. Our results provide support for changes to the tax
5

legislation proposed in May 2009 (but not enacted as of mid 2011),
affecting the treatment of off-market repurchases, which inter alia
removed the lower bound on the price at which companies can
repurchase shares.
The Australian experience is also of interest because it relates to
significant capital management decisions. As we demonstrate later,
many of the largest listed companies are involved (often more than
once) and the average percentage of shares outstanding bought back
is in the order of 5 per cent. While the number of off-market
repurchases over our study period is relatively small (82), the total
dollar amount involved in many years in the sample period is
comparable to the very much larger number of on-market
repurchases.4 There has also been a change in the dominant method of
conducting off-market repurchases, away from fixed-price tenders to
(constrained) Dutch auction tenders. The data available provides an
opportunity to examine the consequences of this change and compare
the merits of the two methods.
The remainder of the paper is structured in the following way.
Section 2 reviews the literature relevant to the development of later
sections of the paper while Section 3 outlines the tax treatment of off-
market repurchases in Australia. Section 4 describes how off-market
repurchases have evolved in Australia and presents salient details of
the characteristics of our data. Modeling of the tender process and
derivation of the supply curve of stock tendered is undertaken in
4 For example, for the complete population of on-market and off-market repurchases for the period 2003-2006, there are 147 companies undertaking 247 on-market repurchases buying an (unweighted) average of 2.4% of outstanding shares and spending $7.4 billion. In contrast over the same period there were 18 companies undertaking 22 off-market repurchases returning $13.7 billion to shareholders and buying back an (unweighted) average of 7.2% of outstanding shares.
6

Section 5. Section 6 contains estimation of the supply curve and
application of the results to assess the effects of price limits on auction
outcomes and distributional effects. Section 7 summarizes our results
and concludes with some suggestions for further research and policy
implications.
2. Literature Review
Off-market (self-tender) repurchases are generally conducted at a
fixed price or via a Dutch auction, where a range of prices at which
shareholders can tender is specified. Bagwell (1992) finds considerable
heterogeneity across the shareholder bid information provided by 32
US companies conducting Dutch auction share repurchases. She
provides direct evidence that US firms repurchasing shares via a Dutch
auction face upward sloping supply curves, a finding corroborated by
Brown and Ryngaert (1992) for fixed-price tender repurchases. Market
imperfections such as capital gains tax and asymmetric information or
differences of opinion about fundamental value have been used as
explanations for the presence of an upward sloping supply curve.
Comment and Jarrell (1991) argue that the less than complete
tendering response in the U.S. to both fixed price and Dutch auction
repurchases at a premium to the market price indicates that firms face
upward sloping supply curves during the offer period.
Studies such as Dann (1981), Vermaelen (1981, 1984),
Lakonishok and Vermaelen (1990), Comment and Jarrell (1991) and
D’Mello and Schroff (2000) that find positive abnormal returns on
announcement of self-tender offers in the U.S. are taken as evidence in
support of managers undertaking a repurchase to signal to the market
that their shares are undervalued (the ‘undervaluation hypothesis’).
Extensive empirical support for the undervaluation hypothesis does not
of course preclude other explanations for the observed positive
announcement returns. The market may react positively if the
7

disbursement of cash via the repurchase lowers the agency costs of
free cash flows (Jensen, 1986; Bagwell and Shoven, 1989; Jagannathan,
Stephens and Weisbach, 2000; Dittmar, 2000; Grullon and Michaely,
2004).
Another possible reason for the observed positive announcement
response in the U.S. is that repurchases are generally tax-advantaged
as a payout mechanism when compared to dividends. Bagwell (1992)
and Anderson and Dyl (2004) find that the magnitude of the market
response in the U.S. to the announcement of a repurchase is positively
related to the premium over market price at which the offer is made,
consistent with the idea that the signal sent must be credible to market
participants. In fact, share repurchases in the U.S. almost always occur
at a premium to the market price at the date of tender completion
because participating shareholders must be compensated for the
capital gains tax which becomes due once the shares are tendered
(Anderson and Dyl, 2004).
The off-market share repurchase environment in Australia is
different in three important aspects to that in which US self-tender
offers are conducted. First, because of the dividend imputation tax
system operating in Australia the tax disadvantages of dividends are
not as pronounced as in the U.S. While high marginal tax rate
individuals may prefer capital gains because the payment of a dividend
with attached tax credits still leaves residual personal tax to be paid,
ceteris paribus the imputation system reduces the preference for
capital gains. Second, because the proceeds of many off-market
repurchases are not taxed purely as capital gains but as a mixture of
dividend income and capital repayment, tax-based arguments for the
choice between dividends and repurchases as preferred distribution
mechanisms are not as straightforward. These tax arrangements
enable shareholders to self-select regarding participation in response
to the value of tax benefits arising for them, in contrast to the absence
8
of such choice in the case of a pro rata dividend payment or return of
capital.
Third, the unique structure for off-market repurchases often
means that the repurchase is completed at a discount to market price.
The transfer of valuable tax benefits results in shareholders’
willingness to tender at prices below the current market price, implying
that off-market repurchases in Australia are less likely to send or be
used as a credible signal of firm undervaluation. Survey evidence
suggests that off-market repurchases are primarily undertaken by
companies as an alternative to dividends (Mitchell and Robinson,
1999).
Consistent with this last argument, much lower abnormal returns
on announcement are observed in Australia as compared with the U.S.,
with the magnitude of the response positively related to the
subsequent size of the discount to market price at which the
repurchase is completed (Brown, 2007).5 One interpretation for the
observed positive market response that is consistent with its
magnitude being positively related to the offer discount, is that the
disbursement of cash via an off-market share repurchase is tax-
advantaged for some shareholders and induces announcement date
purchases by such investors in order to participate. These transitory
purchases push up the announcement date share price and their
subsequent reversal (via supply offers in the tender) pushes down (up)
the tender outcome price (discount).
The offer discount in many Australian off-market repurchases
represents a gain to non-tendering shareholders in return for the tax
benefits directed to tendering shareholders. Shareholders on the
lowest marginal tax rates who are active traders generating non-
5 The abnormal returns of 2.2% for off-market repurchases in Australia are much lower than the 7.7% reported by Bagwell (1992) for self-tender offers in the U.S.
9
concessionally taxed capital gains6 (generally charitable institutions
and pension funds) will have the lowest reservation prices because (as
explained in Section 5) they have larger tax benefits. Hence
heterogeneity in shareholder marginal tax rates is likely to lead to
upward sloping supply curves by shareholders for ‘discount’ off-market
repurchases, similar to the result for ‘premium’ off-market repurchases
in the U.S. (Comment and Jarrell, 1991; Bagwell, 1992; Brown and
Ryngaert, 1992). Whereas in the U.S. Brown and Ryngaert (1992) and
Anderson and Dyl (2004) find that the premium over market price in
fixed price tenders is increasing in shareholders’ capital gains tax
liabilities, we show (in Section 5) that in Australia a larger dividend
component (with its consequent tax benefits) is likely to increase the
discount to market price in Dutch auction repurchases.7 Participating
institutional investors enjoy the greatest tax benefits suggesting that
the structure of off-market repurchases in Australia will be sensitive to
institutional shareholdings,8 consistent with the empirical findings of
Rau and Vermaelen (2002) and Short, Zhang and Keasey (2002) for the
U.K. and Lie and Lie (1999) for the U.S.
3. Repurchases in Australia: Tax and Legal Considerations
Share repurchases were not allowed in Australia until enabling
legislation was introduced in 1989. They can be undertaken on- or off-
market and the focus of our study is the situation where the company
6 Concessional tax rates for capital gains tax apply in some circumstances. See Appendix 1.
7 Brown and Efthim (2005) show that the discount is positively related to the franked dividend component of the off-market buyback price.
8 Unfortunately reliable data on institutional shareholdings are not available in Australia due to the widespread use of nominee companies.
10

invites all shareholders to tender shares into the repurchase (termed
an ‘equal access off-market’ repurchase). In general companies are
able to repurchase up to 10 percent of their ordinary shares in any 12-
month period (commonly referred to as the 10/12 limit). There are a
myriad of corporation laws, stock exchange listing rules, tax rulings
and exemptions granted by the Australian Securities and Investment
Commission, which taken together give companies undertaking such
repurchases the opportunity to structure the offer price (payment for
the shares tendered) in certain tax advantageous ways. Fundamental
to this is that Australia operates a full dividend imputation system. A
brief overview of the Australian tax system is given in Appendix 1.
The interaction of taxation law and company law has created a
somewhat unique taxation treatment for off-market repurchases in
Australia.9 The company may be able to designate a (sometimes very
small) portion of the repurchase price as being debited from the
company’s share capital account, which is treated as a return of capital
or capital component C. Thus, denoting the current share price by P
and the repurchase price by wP, the remainder of the repurchase price
amount is then sourced from retained profits and is a deemed dividend
(D = wP – C) for taxation purposes.10
A tax ruling on the dividend and capital component breakdown is
required before a repurchase involving a dividend component is
9 The tax treatment is similar to that in the U.K. for a subperiod of the Rau and Vermaelen (2002) study.
10 The Australian Government Board of Taxation (2007) states that the rationale for allowing part of the repurchase price to consist of a dividend was to ensure consistency with the rules on returns of capital, cancellations and liquidation. The logic behind the approach appears to be based on considering the repurchase as a ‘partial winding up’ of the company in which total contributed capital and retained earnings (each with different tax consequences upon distribution to shareholders) are each to be shared pro-rata between liquidating and remaining shareholders.
11

announced. In the case of Dutch auction tenders, the announcement
specifies a dividend amount with the capital component being
subsequently determined from the auction outcome as the difference
C = wP – D. If the company has sufficient undistributed tax (franking)
credits, the deemed dividend portion can be “fully franked”, with
Australian resident shareholders entitled to an income tax credit
representing the Australian corporate tax paid by the company in
respect of the profits from which the deemed dividend is derived.11 The
tax on the cash amount of the dividend (D) directly payable, or
received as a refund from the Australian Tax Office (ATO), by a resident
taxpayer with a marginal tax rate of t is D(t-tc)/(1-tc) where tc is the
company tax rate. The capital component C can be quite low, and may
result in participating shareholders who sell shares into the repurchase
benefitting from a capital loss for tax purposes (depending on their
cost base). Investors who have short term realized capital gains on
other assets, which would be taxed at their full marginal tax rate,
benefit most from the tax offset. Investors whose only realized capital
gains on other assets are from holding periods in excess of one year,
and who thus face a capital gains tax rate in the current year lower
than their marginal tax rate, receive less benefit. Appendix 2 provides
a numerical illustration of the differential after-tax gains from
participating for different classes of shareholders, and an algebraic
proof is contained in Section 5.
One important consequence of this tax treatment is that the
price resulting from the tender has, in most cases where a franked
dividend component is involved, led to a repurchase price less than the
prevailing market price. That is, wP<P, where P is the market share
11 Companies unable to pay a franked dividend are unlikely to elect to have part of the repurchase price treated as an unfranked dividend on which tax is paid at the shareholder’s marginal tax rate, because of investor tax preferences for capital gains rather than unfranked dividends.
12

price at the close of the tender, so that 0<w<1. This is in sharp
contrast to the case of self-tender offers in the U.S. which as previously
discussed are generally conducted at a premium. In the case of fixed
price offers, 14 of the 18 repurchases in our sample involving franked
dividends specified a repurchase price less than or equal to the
company’s share price on the announcement date. In the case of
Dutch auctions the indicative price range specified at the
announcement of the repurchase has, since late 2004 when ATO
rulings in individual cases induced a change in approach, seen
companies specify an upper limit as some minimum discount
(generally 8 or 5 per cent) to the volume weighted average price
(VWAP) at the tender closing date.12 Those ATO rulings prevented
repurchases at a discount of more than 14 per cent of the VWAP,
leading to specification of this maximum discount (ie a minimum price)
being pervasive.13
The assignment of some part of the repurchase price as a
franked dividend has made off-market repurchases in Australia
contentious. Dividends are in principle to be paid pro-rata to all
shareholders. However the deemed dividend component of the offer
price in an off-market repurchase is distributed only to participating
shareholders. This has given rise to criticism from commentators in the
financial press that such repurchases create personal tax advantages
for one group of shareholders (low tax rate institutional investors who
12 Earlier Dutch auctions which specified price limits as dollar amounts often involved upper price limits in excess of the announcement date price.
13 In late 2007 the Australian Tax Office (ATO) released a Practice Note (PLSA 2007/9) stating that the maximum discount allowed in an off-market repurchase is 14 percent calculated by reference to the VWAP on the 5 days leading up to and including the closing date of the repurchase. The ATO had in practice been applying this maximum discount in private rulings for some years prior to its official announcement.
13

participate) to the detriment of other non-participants. Whether that is
so, depends on the extent of gains to non-participants from the
company repurchasing shares at a price less than the current market
price.14 Our subsequent examination of whether price limits in the
Dutch auction system (or use of a fixed price tender) prevent
equilibrium outcomes helps cast light on this question.
4. Usage and Characteristics of Off-Market Repurchases in Australia
The regulatory environment as described in Section 3 gives
access to a rich source of data from the announcements made by the
companies to the stock exchange. We have collected data on all off-
market equal access repurchases from the Signal G Announcements
section of the Aspect Huntley Financial Database, and verified using
announcements reported on the Australian Securities Exchange (ASX)
web-site. Share prices are supplied by SIRCA15 on behalf of the ASX.
Information on scalebacks (when an excess of tenders at the
repurchase price occurs), shortfalls (when the company is unable to
purchase the desired number of shares), deemed capital amounts and
franked dividends are taken from company announcements. The data
have been manually checked for consistency. Our sample consists of
62 off-market equal access repurchases conducted between 1996 and
December 2008 out of 82 such repurchase announcements identified
by our search. Those cases omitted involved delisted companies (for
14 This issue has been implicitly acknowledged by some companies in structuring the Dutch auction process. For example in the February 2006 off-market repurchase BHP Billiton announced that it would “…not proceed with the off-market repurchase unless the discount at which the shares can be repurchased represents at least an 8 percent discount…” and that “[a]ll shareholders …including those not participating….benefit [because of the] [p]urchase of shares at a discount of at least 8%.”
15 www.sirca.org.au
14

which data was not available, or the repurchase was part of the
delisting process), unavailability of data for some early cases,
repurchases as part of a merger process, non-standard arrangements
(such as associated issues or exchanges of securities) and those
cancelled without completion. Appendix 3 provides a full list of the
included companies in date order along with certain characteristics of
the repurchases.
In the early years of the study period most companies offered to
buy back shares at a fixed price but from around 2002 most large
repurchases were conducted via a Dutch auction. Our sample contains
30 fixed price and 32 Dutch auction tenders. For 61% of the
repurchases the final tender price is below the share price at the close
of the offer, with 24 of 26 Dutch auctions involving a franked dividend
component in this category (with the two exceptions early in the
sample period involving a fall in the market price between
announcement and closing date). A shortfall occurs in 18 cases, of
which 13 are fixed price tenders, and a scaleback of successful tenders
in 28 cases (of which 11 are fixed price tenders). The importance of
distributing franking credits as one motive for undertaking off-market
repurchases (Brown and Norman, 2010)16 is illustrated with 71% of
repurchases occurring with a franked dividend component.17
Table 1: Descriptive statistics for off-market repurchases
This table provides summary statistics for the sample of off-market equal access repurchases. Column 2 gives the number of repurchases each year, with the number of Dutch auctions each year in brackets. Market capitalization is measured as the number of shares outstanding at announcement date times the share price at the close of the offer. The discount ($m) is measured as number of shares bought back
16 See also Mitchell, Dharmawan and Clarke (2001) and Mitchell and Robinson (1999) for information on stated motivations for share repurchases in Australia.
17 Over 2001 to 2004 franking credits distributed via off-market repurchases were equal to 8% of total franking credits claimed by taxpayers (the remainder being from dividends paid) (Australian Government Board of Taxation, 2007, p56).
15

times the share price at the close of the offer minus the actual amount spent by the company. Franking credits represent the total tax credits distributed with the repurchase. Panel A gives statistics by year: the number of repurchases, the mean market capitalization of repurchasing companies, the average discount to market price, the average value of franking credits distributed, the total discount to market value, the total value of franking credits distributed, the amount spent by the company and the average proportion of shares bought back.Panel B gives the same statistics for fixed price and Dutch auction tender separately.
No.(Dutch)
Mean Market Cap ($m)
MeanDiscount($m)
Mean Franking Credits ($m)
SumDiscount($m)
SumFranking Credits ($m)
Amount Spent($m)
MeanProp’n Bought
Panel A199
61(0) 52 -1 0 -1 0
5 7.62199
71(0) 16444 10 165 10 165
651 4.01199
98(2) 6400 -44 23 -351 184
2028 9.06200
05(1) 3686 21 119 105 593
2413 10.11200
18(0) 7175 19 59 150 472
2199 12.17200
24(1) 1760 2 24 10 98
566 9.63200
34(4) 21989 74 159 298 636
2395 2.96200
48(7) 21141 90 179 719 1431
5051 4.09200
56(6) 16372 83 174 496 1043
3122 3.83200
64(2) 28885 144 283 575 1134
3101 3.84200
78(7) 18005 112 222 896 1780
4777 3.88200
85(2) 2964 -6 26 -29 129
639 15.04whole sampl
e
62 (32) 12585 46 124 2877 7664 26946 5.32
Panel BDutc
h 32 20559 93 193 2988 6186 200063.83
Fixed 30 4080 -4 49 -111 1479 6940 11.86
Table 1 provides summary statistics additional to the information
in Appendix 3. Panel A illustrates the increasing frequency of off-
market repurchases from 1999 onwards. Reinforcing the fact that 61%
16
of repurchases are conducted at a discount, there are few years where
repurchases are on average conducted at a premium. The total number
of shares bought back as a proportion of the total shares outstanding
(at the time of the repurchase) for all companies over the period is
5.32%. The equally weighted average across firms of the proportion
bought back is 11.58%. As shown in Panel B companies undertaking
the 32 Dutch auction tenders are larger, spend around three times as
much buying back shares and distribute around four times the dollar
value of franking credits (on average) as compared to those using a
fixed price tender. Within the fixed price sample there are several small
companies that bought back a large proportion of shares.
5. The tender process
In this section we analyze the determinants of the equilibrium
relationship between a stock’s market price and the repurchase price
arising from a tender process in which tax differences involved in
selling into the repurchase versus selling on-market create a form of
clientele effect.18 The resulting supply (offer) curve of shareholders, in
conjunction with the demand for shares specified by the company in
the repurchase, enables identification of an equilibrium repurchase
price and of the determinants of net gains from participation to
different clienteles. In section 6 we use data available from Dutch
auction tenders (including measures of excess demand of the company
and excess supply of shareholders where the equilibrium price is
constrained by company imposed price limits) to estimate the supply
18 The clienteles can arise after the announcement of the repurchase as ‘tax arbitrageurs’ purchase stock in order to participate. This corresponds to a dynamic form of the clientele model (see Allen and Michaely (2003)) where through the trading process stocks end up just prior to the ex-dividend date in the hands of those investors most tax advantaged by the payment of the dividend.
17

curve.19 This also enables us to estimate how the price set in fixed
price tender offers differs from the equilibrium price, and the
consequences thereof.
We first compare the after tax-cash flows of selling into the
repurchase, where the repurchase price comprises a capital component
and a franked dividend component20, with selling on-market (such as is
illustrated in Appendix 2). The notation used is given in Table 2. For
convenience, the term αt (where 0<α<1) is referred to as the capital
gains tax rate.21
Table 2: Notation
Variable NotationInvestor’s Original Purchase Price PB
Current Market Share Price PMarginal Tax Rate TtCapital Gains Tax Rate αtCapital Component of Repurchase Price CRatio of Repurchase Price to Current Market Price
Ww
Franked Dividend Component of Repurchase
D = wP-C
19 Our approach differs from Bagwell (1992) who uses actual shareholder tendering data supplied by 32 companies buying back shares through a Dutch auction. She finds upward sloping supply curves.
20 Because capital gains are preferred to unfranked dividends by all shareholders, there is no benefit in specifying part of the repurchase price as an unfranked dividend. Thus all repurchases involve franked dividends and a capital component, or a capital component only.
21 In practice, α% of any gain is subject to tax at the marginal tax rate of t, where α=1 if the asset has been held for less than one year, or is 0.5 for individuals and 0.67 for superannuation funds for assets held for more than one year (see Appendix 1).
18

The after-tax cash flow from selling on the market22 is:
SM = P(1−αt) + PBαt (5)
If the share is sold into the repurchase, the capital component is taxed
at a rate αt and the franked dividend component at rate (t−tc)/(1−tc),
such that the after tax cash flow for an Australian investor able to use
the tax credits is:
SB = wP – (C−PB)αt – (wP−C)(t−tc)/(1−tc) (6)
Comparing these after-tax amounts, the repurchase sale proceeds
exceed the on-market sale proceeds if
Gain = SB – SM > 0
Substituting and simplifying,
Gain = P[w(1−(t−tc)/(1−tc)) – (1−αt)] – C[αt − (t−tc)/(1−tc)] (7)
The shareholder’s original purchase price PB is not relevant to the
decision since it is the cost base used in calculating capital gains tax in
both cases. As expected, the benefit from participating increases as
the repurchase price increases (ie as w increases):
(8)
The repurchase/market price ratio which makes the investor indifferent
is:
(9)
Thus, for repurchase/market price ratios above the investor will prefer
to participate in the repurchase. Note that depends upon α so that
the participation indifference price is lower for investors with α = 1.
(This is the case where they have capital gains to offset which would
22 The relevant market price is immediately prior to the close of tenders, because most shares will be tendered just prior to expiration of the offer (see Bagwell 1992).
19

not receive concessional tax treatment due to the assets having been
sold within one year of purchase).
For α = 1, equation 9 simplifies to
(10)
where D is the dividend component of the repurchase price. In this
case is independent of the taxpayer’s marginal tax rate t. All
Australian investors with non-concessionally taxed capital gains will
find it advantageous to participate if23
, (11)
although the increase in the gain as w increases is inversely related to
the investor’s marginal tax rate t, which can be seen from equation 8
by noting that .
For investors with concessionally-taxed capital gains, such that α<1,
. (12)
Thus the repurchase/market price ratio which makes investors
with concessionally-taxed capital gains indifferent between
participating or not, is higher (ie the required discount is lower). The
gains from participating for a higher tax rate investor (when w>) are
less than those for a lower tax rate investor.
These results are summarized in Figure 1. It can be seen that
investors with concessionally taxed capital gains (α<1) to offset will
23 It is straightforward to show that foreign investors who are unable to use franking credits and with non-concessionally taxed capital gains will only participate if w > 1 (ie if the repurchase price is above the current market price). While foreign investors with concessionally taxed capital gains to offset (α < 1) may be willing to participate for some w < 1 (because of the low deemed sale price and thus tax capital losses) their gain is always less than that of Australian investors for any w, making them uncompetitive in the tender and not relevant to the determination of the tender outcome,
20
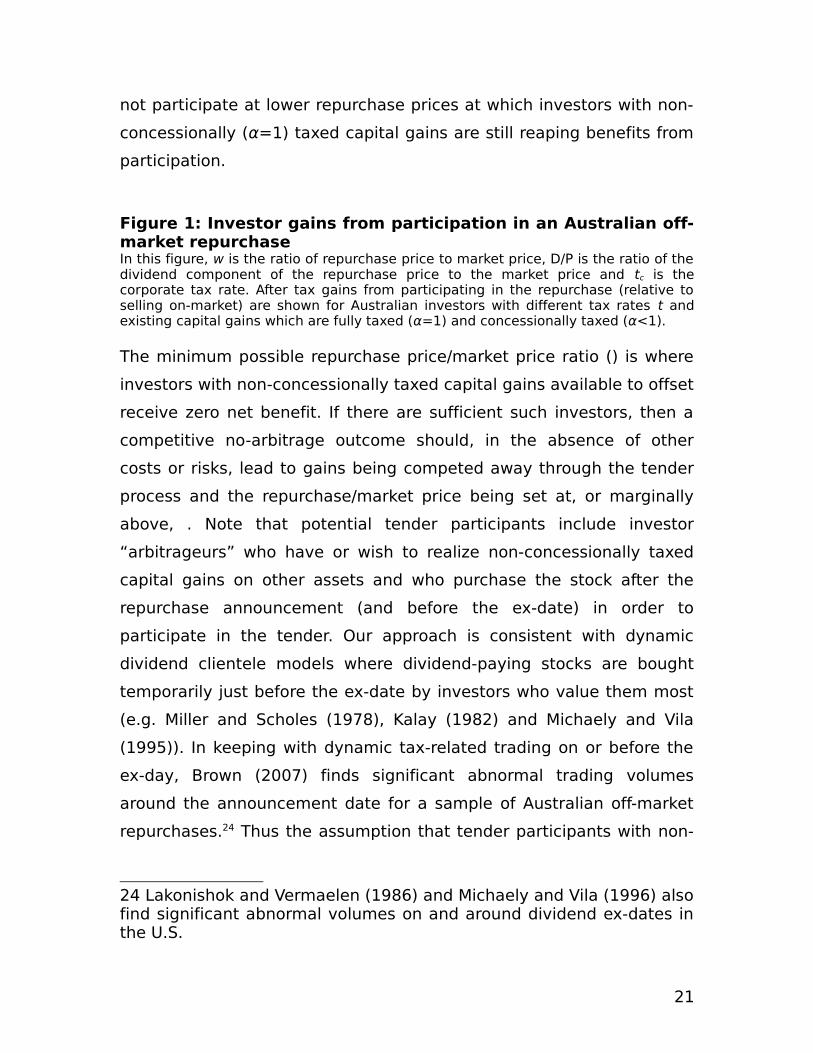
not participate at lower repurchase prices at which investors with non-
concessionally (α=1) taxed capital gains are still reaping benefits from
participation.
Figure 1: Investor gains from participation in an Australian off-market repurchaseIn this figure, w is the ratio of repurchase price to market price, D/P is the ratio of the dividend component of the repurchase price to the market price and tc is the corporate tax rate. After tax gains from participating in the repurchase (relative to selling on-market) are shown for Australian investors with different tax rates t and existing capital gains which are fully taxed (α=1) and concessionally taxed (α<1).
The minimum possible repurchase price/market price ratio () is where
investors with non-concessionally taxed capital gains available to offset
receive zero net benefit. If there are sufficient such investors, then a
competitive no-arbitrage outcome should, in the absence of other
costs or risks, lead to gains being competed away through the tender
process and the repurchase/market price being set at, or marginally
above, . Note that potential tender participants include investor
“arbitrageurs” who have or wish to realize non-concessionally taxed
capital gains on other assets and who purchase the stock after the
repurchase announcement (and before the ex-date) in order to
participate in the tender. Our approach is consistent with dynamic
dividend clientele models where dividend-paying stocks are bought
temporarily just before the ex-date by investors who value them most
(e.g. Miller and Scholes (1978), Kalay (1982) and Michaely and Vila
(1995)). In keeping with dynamic tax-related trading on or before the
ex-day, Brown (2007) finds significant abnormal trading volumes
around the announcement date for a sample of Australian off-market
repurchases.24 Thus the assumption that tender participants with non-
24 Lakonishok and Vermaelen (1986) and Michaely and Vila (1996) also find significant abnormal volumes on and around dividend ex-dates in the U.S.
21

concessionally taxed capital gains will dominate the repurchase price
determination is a priori reasonable.25
In practice, however, other factors are relevant. First, all Dutch
auction tenders have involved announcement of a tender price range
within which the repurchase price will be set. Not only does this
constrain the repurchase price, it also introduces the risk for
“arbitrageurs” that the amounts purchased at the final repurchase
price might involve scaling back relative to amounts tendered. Because
repurchases typically involve 40-60 days between announcement and
completion, the market price of the stock can vary significantly
introducing price risk for unsuccessful tenders. Second, even in the
absence of scaling back, “arbitrageurs” face price risk (and quantity
risk from “underbidding”) arising from uncertainty about the final
repurchase price determined by the auction process.26 The existence of
such risks suggests that completion of the repurchase may require a
higher price to elicit supply of stock from less tax-preferred investors or
from those inframarginal investors who would otherwise prefer to
continue to hold the stock.27
25 This requires that there is at least 45 days between purchase and the tender closing date in order that purchaser/participants meet the legal requirement to be able to use the franking (tax) credits. While some repurchases did not have 45 days between announcement and closing date, in many cases a forthcoming repurchase was foreshadowed in earlier corporate announcements. In our empirical work we have tested whether possibility of post-announcement purchase and participation is a significant determinant of the repurchase price, by inclusion of a variable measuring the number of days between announcement and close, but find that it is not.
26 Koski and Michaely (2000) find that abnormal trading volumes around announcements are negatively related to risk exposure, consistent with risk being a relevant determinant of such “arbitrage” activities.
27 As noted earlier, the market price is a lower bound on the value these investors place on the stock, and the zero net gain repurchase price derived in the text is thus only a lower bound for these investors.
22

These arguments suggest that the supply curve of stock
tendered will not be infinitely elastic at the price ratio (which reflects
the minimum price at which any supply will be forthcoming) but
upward sloping to reflect the risks discussed above and the need to
induce less tax-preferred and inframarginal investors to participate to
meet the required quantity demanded by the company.
Hence, assuming linearity, the supply curve of stock for tender i
takes the form:
, (13)
where Qs is the amount supplied by investors into the tender. A test of
whether “arbitrageurs” determine the repurchase price (as in equation
10) is given by the null hypothesis that β0 = 1 and β1 = - tc/(1-tc) = -3/7
(for tc = 0.3). In the following section we test this hypothesis by
estimating the supply curve for stock using data from the 32 Dutch
auctions conducted over the period of our study. We also use this
information to examine the pricing consequences of the 30 fixed price
tenders conducted.
6. Estimation of the Supply Curve of Stock
In this section we use censored regression techniques to
estimate the supply curve of stock tendered in Dutch auctions used for
repurchases. In these auctions, the company announces a quantity of
stock which it wishes to repurchase (either as a number or dollar
amount of shares) and, in all cases, announces a range of tender prices
(either as dollar amounts or as percentage discounts to the closing
market stock price). Consequently, the auction outcome may be
constrained by the minimum price specified and involve an excess
supply of shares tendered at that price, leading to scaling back of
amounts tendered. Alternatively, if the maximum price specified
23

constrains the outcome, there is excess demand and the company will
fail to repurchase the number of shares desired.
Company documents reporting the outcome of repurchases to
the ASX provide information which enables the calculation of the
company’s excess demand for shares (shortfall) or excess supply by
investors (scaleback). Thus denoting the quantity of shares demanded
by the company (as a proportion of shares on issue) by bbsize, and
equating supply and demand gives the equilibrium repurchase price
(as a ratio to market price) as the latent variable wi*, which is only
observed when the auction outcome is not constrained by price limits:
(14)
The coefficient on bbsize is expected to be positive, because if the
supply curve for shares is not perfectly elastic, then acquiring a greater
proportion of shares requires paying a higher price to attract
shareholders who would otherwise not tender. When a shortfall occurs,
the observed price wi = pmax < w*i and quantity supplied is less than
bbsize, with the difference (the company’s excess demand) proxied by
ED which is calculated as the percentage difference between shares
sought and shares bought.28 When a scaleback occurs, the observed
price wi = pmin > w*i and quantity supplied is greater than bbsize, with
the difference (excess supply by investors) proxied by ES which is
calculated as the amount of scaleback as a percentage of shares
sought. While our calculated ED measure could arguably be an exact
measure of the excess quantity demanded, that is not so for the ES
measure which would reflect inflation of tender amounts in expectation
of possible scalebacks. Hence, we include both variables separately,
rather than combining with bbsize.
28 Where a range of shares sought was indicated, the excess supply was calculated using the minimum of that range.
24

The resulting censored regression model is:
for w i* >pmaxi
for pmini < w i* < pmaxi
for w i* <pmini
Estimation of the model involves inclusion of both ED and ES as
regressors for all observations, with, in principle, ED = 0 for w i* <
pmaxi and ES = 0 for w i* > pmini. In practice there are a small number
of cases where repurchase prices within the price limits have been
accompanied by either shortfall or scaleback due to unexplained
decisions of the company in deciding upon a final price.
Five of the repurchases did not involve a franked dividend
component, and this would be expected to lead to a higher repurchase
price. Hence a dummy variable equal to 1 when the repurchase did not
include a franked dividend component is included, with the coefficient
expected to be positive, giving
(15)
as the estimating equation. 29
We estimate equation 15 as a censored regression, assuming
normally distributed residuals for the 32 Dutch auctions held over our
period of study.30 Upper and lower censoring points were specified for
29 Because repurchases by smaller companies may be of less interest to large institutional investors we also considered company size as a possible explanatory variable but found it to be insignificant.
30 We have also estimated the censored regression excluding the three Dutch Auctions (all involving no dividend payment) prior to July 2001 when the company tax rate was above 30 per cent in order to examine whether the change in company tax rate affects our results. There are no significant differences in either estimated coefficients or their significance levels.
25

each repurchase as the maximum and minimum prices specified in the
offer document as a proportion of the stock’s market price at the
closing date of the auction.31 The dividend/price ratio uses the closing
price (consistent with the scaling of the repurchase price).32
Table 4 presents the results. The adjusted R2 for the regression is
97.3% with all coefficients significant and having their expected sign.
The hypothesis that competition between “arbitrageurs” dictates the
repurchase price determination (which, at tc = 0.30 as prevailed for
most of the sample, implies that β0 = 1 and β1 = - 3/7) is clearly
rejected.33 Consistent with that, the significant positive coefficient (β2)
for bbsize indicates that larger size offerings lead to a higher
repurchase price, as would be expected if non tax-preferred
shareholders must be induced to participate and because of risks to
“arbitrageurs”. Our finding of an upward sloping supply curve is
consistent with the results of Bagwell (1992) and Kadapakkam and
Seth (1997) for Dutch auction tenders and Brown and Ryngaert (1992)
for fixed-price tenders. Repurchases without a franked dividend
component have a higher repurchase price (β5>0) as expected. Both
the excess demand and excess supply proxies have significant
coefficients with expected signs, with the smaller absolute value for
31 In later dated auctions, the price bounds were generally expressed as a percentage discount to the value weighted average price (VWAP) over the five days prior to the closing date (and this was used in those cases). For earlier auctions, dollar prices were specified, and the share price on the closing date was used to scale the repurchase price.
32 Using announcement day prices leads to similar results. The dividend component is used because the dividend amount is exogenously given, whereas the capital component is determined endogenously as the difference between the repurchase price and the dividend amount.
33 It is also rejected for higher values of tc which existed for the first three observations of the sample.
26

the coefficient of the excess supply proxy consistent with inflation of
tender bid sizes in anticipation of a scaleback.
Table 4: Censored regression results for the repurchase price
This table provides the results of estimating equation (15) using Eviews. The dependent variable is w, the repurchase price divided by the market price at close of repurchase (closing price). D/P is the dividend component of the repurchase price divided by the closing price. Bbsize measures shares sought (demanded by the company) as a proportion of shares outstanding. ED is excess demand and ES excess supply as reported by the company to the ASX. FDIVDUM is a dummy variable equal to 1 when the repurchase does not have a franked dividend component. Standard errors and covariances are estimated using QML (Huber/White).
Coefficient &
Coefficient
Std. Error z-Statistic
Prob.
Expected sign
Value
Constant β0 0.890 0.029 30.652 0.000D/P (dividend/closing price) β1 < 0 -0.111 0.043 -2.581 0.010
Bbsize β2 > 0 0.746 0.131 5.692 0.000ED (excess demand) β3 > 0 0.253 0.031 8.216 0.000ES (excess supply) β4 < 0 -0.031 0.012 -2.543 0.011FDIVDUM β5 > 0 0.067 0.027 2.524 0.012
R-squared 0.973 Mean dependent var
0.906
Adjusted R-squared 0.967 S.D. dependent var 0.075S.E. of regression 0.014 Akaike info
criterion-1.166
Sum squared resid 0.005 Schwarz criterion -0.845Log likelihood 25.651 Hannan-Quinn
criter.-1.059
Avg. log likelihood 0.802Left censored obs 18 Right censored obs 2Uncensored obs 12 Total obs 32
It is also apparent that the minimum price constraint plays a
significant role in determining tender outcomes, with 18 of the 32
tenders involving left censoring (and only two right censored cases). Of
those, 16 involved a franked dividend component.34 The extent of
overpricing OP induced by the minimum price constraint can be
estimated as:
34 The other two cases were completed at a premium to market price with the repurchase price having no dividend component.
27

where is the forecast latent variable.35 The mean (median) value of
overpricing for these left censored observations is 6.8 (4.9) percentage
points, indicating that the ATO specified minimum of 14 per cent is a
significant constraint in many cases, with the equilibrium average
discount for these cases thus being around 50 per cent higher than
that allowed. The maximum overpricing is 21.7 percentage points,
which occurred when the minimum price set by the company was only
$0.10 (2 per cent) below the share price at announcement date.
These results suggest that minimum price constraints imposed
on the auction process substantially reduce the potential benefits to
non-participating shareholders to the benefit of those participants
whose tenders are accepted.
It is also possible to estimate the mispricing involved in fixed
price tenders, by out-of-sample forecasting of the latent variable for
fixed price tenders, using equation (15). In these cases, both over and
underpricing can be observed and calculated by estimating the
mispricing using. For the 17 fixed price tenders involving a franked
dividend component, for which complete data is available, the mean
(median) mispricing is 8.8 (8.1) percentage points. However, because
both under and overpricing occurs, these figures understate the
degree of mispricing. For the 12 cases of overpricing, the mean
(median) is 18.4 (15.5) percentage points. For the five cases of
underpricing, the mean (median) is 14.4 (3.0) percentage points
If fixed price tenders for which there is no dividend component
are considered, the mispricing is even worse. For the 8 cases of
overpricing, the mean (median) is 33.4 (25.5) percentage points with a
maximum of 78.9 percentage points. However, these eight cases were
all either very small companies and/or small listed fund managers
35 The overpricing for the two left censored observations involving no dividend component were both small (2.5 and 1.2 percentage points).
28

seeking to buy back a large proportion of stock on issue. For the 3
cases of underpricing, the mean (median) is 6.3 (1.6) percentage
points with a maximum of 16.6 percentage points.
Comparing these results, it is apparent that the Dutch auction
tender process, even when subject to price limits performs better than
the fixed price tenders in reducing the degree of overpricing. And while
there are too few cases (two only) of underpricing in the Dutch
auctions to enable a meaningful comparison, the fact that 12 of 32
cases did not involve censoring suggests that this system is better at
avoiding underpricing also (as would be expected).
Focusing on the repurchases involving a franked dividend
component, where tax benefits are distributed to successful tenderers,
in return for those shareholders accepting a lower price than the
current market price, it is apparent that companies have generally “left
money on the table”. This has occurred in the case of Dutch auctions
because price limits imposed due to ATO rulings prevent an equilibrium
outcome, or because the price specified in fixed price tenders is above
the equilibrium. Successful tendering shareholders would have paid
more (by way of accepting a lower price) for the tax benefits
distributed, which would have benefitted non-participants. The
implications of this finding for policy are considered in the conclusion.
7. Conclusion
This paper makes a number of contributions to the literature on
corporate capital management. First, it illustrates how tax distortions
generate problems for corporate managers in making decisions
involving equitable treatment of all shareholders. Second, it provides a
valuable case study of how large and significant off-market
repurchases are conducted in response to tax distortions in a well
developed capital market, in which shareholder tax heterogeneity is
more clearly identifiable than in previous studies. Third, it uses a novel
29
data set to estimate the supply curve for stock in Dutch auction
tenders. The results show that auctions result in less mispricing than
fixed price tenders, even when they are constrained by maximum and
minimum price limits. Supply curves for Dutch auction tenders are
upward sloping, consistent with the results documented by Bagwell
(1992) and others for different tax environments such as the U.S. We
show that the supply curve shape is not determined solely by tax
arbitrage, but that factors such as risks arising in the tender process
are also relevant.
Fourth, the results are suggestive of corporate financial policy
decisions, at least in some cases in our sample, being structured to
favor low tax rate institutional investors who participate in the
repurchase, to the detriment of other (high tax rate, long term)
investors. High tax rate investors and those (such as foreign investors
who cannot utilize the tax credits) for whom it is not optimal to
participate in the repurchase, do not reap as much of the benefit from
the pay-out decision as they would if, for example, the repurchase
price were set, or permitted by tax authorities to be, lower. Abstracting
from the announcement effects of a higher share price, high tax rate
investors can be worse off, even if the repurchase is done at a discount
to the market price. This can occur because tenderers would have
accepted less for their shares in the absence of price limits, and also if
the previously undistributed tax credits were impounded in the share
price, which would thus be depressed by their distribution.
Moreover, most recent repurchases have been announced with a
sufficiently long lead time to the actual repurchase date to enable low
tax rate investors such as institutional pension funds and fund
managers, who may not be current shareholders, to purchase shares
after the announcement and participate in the tax benefits. While that
participation-induced demand for shares may cause a temporary spike
30

in the share price, and the increased resulting competition in the
tender process may lead to a larger final discount, our results suggest
that price limits prevent non-participants achieving the full benefits
associated with an equilibrium outcome.
This raises questions about the merits of tender price limits
imposed as a result of ATO rulings. Following a report in May 2009 by
the Australian Government Board of Taxation (2009) the Australian
Government announced (but has not, as of mid 2011, implemented)
changes to the tax arrangements for off-market repurchases, with two
important consequences. First, the cap on the level of discount to the
market price would be removed, which our analysis shows should
result in a lower repurchase price and be of benefit to non-participating
shareholders. However the second major change, that capital losses
would be denied to participating shareholders, reduces the tax benefits
to participating shareholders and would ceteris paribus increase the
equilibrium repurchase price. Introduction of those changes could be
expected to have significant effects on the design of, and outcomes
for, repurchases, involving a redistribution of (the overall reduced) tax
benefits to non-participants.
31

REFERENCES
Allen, F., and R. Michaely. “Payout Policy.” In Handbook of Economics. Constantinides, G., Harris, M., Stulz, R. (Eds.), North-Holland, Amsterdam (2003), 337–430.
Anderson, A., and E. Dyl. “Determinants of premiums on self-tender offers.” Financial Management, 33 (2004), 25-45.
Australian Government Board of Taxation. Review of the taxation treatment of off-market share repurchases. (2007). http://www.taxboard.gov.au/content/share_repurchases.asp .
Australian Government Board of Taxation. Review of the taxation treatment of off-market share repurchases. A report to the Treasurer. (2009). ISBN 978-0-642-74500-2. http://www.taxboard.gov.au/content/share_repurchases.asp .
Bagwell, L. “Dutch auction repurchases: An analysis of shareholder heterogeneity.” Journal of Finance, 47 (1992), 71-105.
Bagwell, L. S., and J. B. Shoven. “Cash distributions to shareholders”, The Journal of Economic Perspectives, 3 (1989), 129-140.
Brown, C.A. and K. Efthim. “Effect of taxation on equal access buybacks in Australia.” International Review of Finance, 5 (2005), 199–218.
Brown, C.A. “The announcement effects of off-market share repurchases in Australia.” Australian Journal of Management, 32 (2007), 369-385.
Brown C.A., and D. Norman. “Management choice of buyback method:
Australian evidence.” Accounting and Finance 50 (2010), 767-782.
Brown, D., and M. Ryngaert.. “The determinants of tendering rates in interfirm and self-tender offers.” Journal of Business 65 (1992), 529-556.
Comment, R., and G. Jarrell. “The relative signalling power of Dutch-auction and fixed-price self-tender offers and open-market share repurchases.” Journal of Finance, 46 (1991), 1243-1271.
32
Dann, L. “Common Stock Repurchases: An analysis of returns to bondholders and stockholders.” Journal of Financial Economics, 9 (1981), 113-138.
Dittmar, A. “Why do firms repurchase stock?” The Journal of Business, 73 (2000), 331-355.
D’Mello, R., and R. Schroff. “Equity undervaluation and decisions related to repurchase tender offers: An empirical investigation.” Journal of Finance 55 (2000), 2399-2424.
Grullon, G., and R. Michaely. ’Dividends, share repurchases and the substitution hypothesis’ Journal of Finance, 57 (2002), 1649-1684.
Grullon, G., and R. Michaely. “The information content of share repurchase programs.” Journal of Finance, 59 (2004), 651-680.
Hodrick, L. “Does stock price elasticity affect corporate financial decisions?” Journal of Financial Economics, 52 (1999), 225-256.
Jensen, M. “Agency costs of free cash flow, corporate finance and takeovers.” The American Economic Review, 76 (1986), 323-329.
Jagannathan, M., C. Stephens, and M. Weisbach. “Financial Flexibility and the Choice Between Dividends and Stock Repurchases.” Journal of Financial Economics, 57 (2000), 355-384.
Kadapakkam, P. and S. Seth. “Capital gains taxes and stockholders' response to Dutch auction tender offers.” Financial Review, 32 (1997), 779 – 800.
Kalay, A. “The ex-dividend day behavior of stock prices: A re-examination of the clientele effect.” Journal of Finance, 37 (1982), 1059-1070.
Koski, J., and R. Michaely. “Prices, liquidity and the information content of trades.” Review of Financial Studies, 13 (2000), 659-696.
Lakonishok, J., and T. Vermaelen. “Tax induced trading around ex-dividend dates.” Journal of Financial Economics, 16 (1986), 287-319.
Lakonishok, J., and T. Vermaelen. “Anomalous price behavior around repurchase tender offers.” Journal of Finance, 45 (1990), 455-77.
33

Lie, E., and H. Lie. “The role of personal taxes in corporate decisions: An empirical analysis of share repurchases and dividends.” Journal of Financial and Quantitative Analysis 34 (1999), 533-552.
Michaely, R., and J. Vila. “Investors’ heterogeneity, prices and volume around the ex-dividend day.” Journal of Financial and Quantitative Analysis 30 (1995), 171-198.
Michaely, R., and J. Vila. “Trading volume with private valuations: Evidence from the ex-dividend day.” Review of Financial Studies 9 (1996), 471-510.
Miller, M., and M. Scholes. “Dividends and Taxes.” Journal of Financial Economics, 6 (1978), 333-264.
Mitchell, J., Dharmawan, G., and Clarke, A. “Managements’ views on share buy-backs: an Australian survey.” Accounting and Finance, 41 (2001), 93-129
Mitchell, J., and P. Robinson. “Motivations of Australian listed companies effecting repurchases.” Abacus, 35 (1999), 91-119.
Officer, R. “The cost of capital of a company under an imputation tax system,” Accounting and Finance, 34 (1994), 1-17.
Rau, P. and T. Vermaelen. “Regulation, taxes and share repurchases in the United Kingdom.” Journal of Business, 75 (2002), 245-282.
Sellars-Jones G ‘Coles buyback: why not a capital return?’ Australian Financial Review, 14 June (2006), p 67.
Short, H., H. Zhang, and K. Keasey. “The link between dividend policy and institutional ownership.” Journal of Corporate Finance, 8 (2002), 105–122.
Vermaelen, T. “Common stock repurchases and market signaling.” Journal of Financial Economics, 9 (1981), 139-183.
Vermaelen, T. “Repurchase tender offers, signaling and managerial incentives.” Journal of Financial and Quantitative Analysis, 19 (1984), 163-181.
34

Appendix 1: The Australian Tax System
Australia introduced a dividend imputation tax system in 1987
under which resident companies generate imputation or ‘franking
credits’ for company tax paid. The company’s franking account keeps
track of these income tax credits (plus distributions carrying franking
credits received from other companies) that can be passed on to
shareholders. If the franking account balance is positive, dividends
paid are “franked” with a tax credit to recipients, but dividends paid
when the balance is zero are “unfranked”.
Franked dividends carry tax credits equal to the company tax
paid on the profits from which the dividend has been distributed.
Resident shareholders declare the dividend (grossed up to equal the
pre-company-tax profit from which the dividend was paid) as income,
and then the tax credit is used to offset personal income tax
obligations.36 Thus if D is the cash dividend paid, the resulting taxable
personal income is D/(1-tc) where tc is the corporate tax rate. (The
corporate tax rate has been 30 per cent since July 2001, was 34 per
cent in the preceding fiscal year and was 36 per cent for the prior five
years). Personal tax is levied at the investor’s marginal tax rate of t,
which progresses to a maximum rate of 45 per cent, while
superannuation (pension) funds face a flat tax rate of 15 per cent. The
tax levied on the investor is thus tD/(1-tc), but the investor also
receives a tax credit of tcD/(1-tc) such that the tax payable (or
rebateable) is (t-tc)D/(1-tc). Overseas investors cannot use the franking
36 Australian resident individuals, complying superannuation funds, registered organizations and life assurance companies may use distributed franking credits to offset their tax liabilities. Since July 2000, Australian investors have been able to receive a refund from the tax office if taxable income is insufficient to use all franking credits received. If all the franking credits are distributed, and all recipients are able to fully utilize them, then the imputation system effectively eliminates the double taxation of dividends (Officer, 1994).
35

credits, nor can investors who have not held the stock for at least 45
days around the dividend entitlement date or who have hedged the
price risk over the period.
Australia’s capital gains tax (CGT) provisions treat realized
capital gains as assessable income in the year of disposal of the asset.
Prior to September 1999 the inflation adjusted capital gain was
included in ordinary income. For assets acquired after September 1999
(and at the taxpayer’ option for assets acquired prior to that date)
proceeds are concessionally taxed for assets held longer than one year.
For individuals, half, and for superannuation funds, two thirds, of the
nominal capital gain accrued on assets held for longer than one year is
included as income. Capital losses are offset against capital gains in
the year of calculation or carried forward.
36

Appendix 2: Investor tax-treatment in Australian off-market
repurchases
We illustrate the structuring of Australian off-market repurchases
and the tax considerations for a superannuation (pension) fund with a
tax rate of 15% and an individual paying tax at the top marginal rate of
45%. ABC announces an off-market Dutch auction repurchase for which
the final price would comprise a franked dividend component of $18.00
with the remainder being a capital component. At the close of the
tender the final price is $26.00 at a discount of 13.3% to the current
share price of $30.00. The $26.00 repurchase price thus comprises a
fully franked dividend component of $18.00 with the remaining $8
defined as a capital repayment.
Table A1: The Repurchase Participation Decision
The calculations assume that the share has been held for more than one year such that the shareholder is eligible for a concessionary rate on the capital gains when sold on market. Superannuation funds are taxed at the rate tp = 0.15 on income and at the rate (2/3)tp = 0.10 on long term capital gains. For individual shareholders on the top marginal tax rate, the rates are respectively tp =0.45 and (1/2)tp = 0.225. Capital losses from participating are assumed to be used to offset other short term capital gains. A franked dividend of $D generates a net tax payment (rebate) of $D(tp-tc)/(1-tc), where tc =0.30 is the corporate tax rate.
15 % tax rate (superfund)
45 % tax rate
On-market sale
at $30.0
0
Buyback participati
onat $26.00
On-market sale at $30.00
Buyback participati
onat $26.00
Repurchase price (1) 26.00 26.00 Market price (2) 30.00 30.00 30.00 30.00 Purchase Price (3) 20.00 20.00 20.00 20.00 Capital Component (4) na 8.00 na 8.00 Capital Gain (5) = (2)-(3) or (4)-(3) 10.00 -12.00 10.00 -12.00 Tax on gain (6) =0.10 (5) or 0.225 (5)
1.00 -1.20 2.25 -2.70
Cash amount of Dividend (7) = (1)-(4)
18.00 18.00
Tax payable/redeemable on -3.86 3.86
37

dividend (8)Net After Tax Cash Flow (9) = (2) -(6)-(8) or (1) -(6)-(8)
29.00 31.06 27.75 24.84
Consider first a superannuation fund which, several years earlier,
had purchased an ABC share for $20. As shown in Table A1, sale of that
share on the market at a market price of $30 would generate a net
after tax cash flow of $29.00, once tax at 15 per cent had been paid on
two-thirds of the $10.00 capital gain. (For investors holding the stock
for less than one year the entire capital gain would be taxable and the
calculations in Table A1 would be amended accordingly).
If the superannuation fund participates in the repurchase at a
price of $26.00 then $8.00 is the sale price for tax purposes and
$18.00 is a dividend franked at a 30 per cent tax rate (the corporate
tax rate). The superannuation fund makes a capital loss of $12.00
which when offset against other realized capital gains in its portfolio
reduces tax payable by $1.20. The franked dividend receipt implies
assessable income of $18.00/0.7 = $25.71, tax credits received of
$7.71 and tax assessed of $3.86, giving a tax refund of $3.86. The net
cash flow is thus $31.06 so that participating at a repurchase price of
$26.00 is preferable to selling on market for $30.00. In contrast, the
individual shareholder with a marginal tax rate of 45 per cent would be
worse off from participating in the repurchase (because even though
the tax benefit of capital loss is greater due to the higher marginal tax
rate, that higher rate also means additional tax must be paid on the
dividend).
In practice the tax authorities assign a deemed sale price equal
to a volume weighted market price around the close of the tender
offer, which also affects the deemed capital component. 37 These
37 In January 2004, the ATO issued a draft determination (TD2004/D1) which complicated the determination of the capital component. A “deemed” sale price for tax purposes would be determined by adjusting the pre-announcement company share price by the
38

complexities make the calculations somewhat more complex, but the
outcome is essentially similar.
percentage change in the market index (the S&P/ASX 200) between the announcement date and the tender closing date, and using this figure to calculate the capital component for tax purposes. In our empirical work, inclusion of a variable measuring the market index increase over the relevant period, to test whether this change had any significant effect on tender outcomes did not produce significant results.
39

Appendix 3: Australian Off-Market Repurchases: 1996 - 2008
ASX Code
Date announce
d
Offer Price/ Price
at Close
EDa ESb
Franked dividend component/Pric
e at Close
Capital Compon
ent/ Offer Price
Dutch v Fixed
GYM 28/10/1996
1.310 0.162 0.000 0.000 1.000 Fixed
CBA 12/11/1997
0.986 0.000 0.422 0.582 0.410 Fixed
CBA 10/02/1999
0.909 0.000 0.639 0.565 0.378 Fixed
SEV 11/03/1999
1.085 0.000 1.584 0.000 1.000 Dutch
AOR 17/03/1999
1.667 0.014 0.000 0.000 1.000 Fixed
WYL 17/05/1999
1.048 0.000 0.672 0.609 0.419 Fixed
TIG 19/07/1999
1.222 0.000 0.000 0.000 1.000 Fixed
CIN 30/09/1999
1.190 0.304 0.000 0.714 0.400 Fixed
CBA 30/09/1999
1.018 0.262 0.000 0.000 1.000 Dutch
GOW 7/10/1999
1.026 0.000 0.000 0.632 0.385 Fixed
WOW 14/02/2000
0.927 0.000 0.842 0.465 0.498 Fixed
GUD 8/08/2000
1.142 0.768 0.000 0.000 1.000 Fixed
LLC 18/08/2000
0.962 0.000 1.353 0.623 0.352 Fixed
ANN 2/10/2000
1.013 0.000 0.965 0.000 1.000 Dutch
PDR 23/10/2000
1.800 0.077 0.000 0.000 1.000 Fixed
CAA 13/02/2001
0.956 0.156 0.000 0.301 0.685 Fixed
CBA 13/02/2001
0.973 0.000 17.868 0.624 0.359 Fixed
IBC 14/02/2001
1.103 0.106 0.000 0.195 0.000 Fixed
IAG 2/03/2001
0.875 0.000 6.246 0.302 0.654 Fixed
BOQ 6/04/2001
0.994 0.000 2.425 0.508 0.488 Fixed
WOW 30/04/2001
0.827 0.000 0.736 0.553 0.331 Fixed
EPI 11/09/2001
1.778 0.000 0.000 0.000 0.000 Fixed
STO 17/10/2001
0.978 0.000 2.077 0.561 0.426 Fixed
TAB 21/03/20 0.965 0.185 0.000 0.137 0.858 Fixed
40

02
IAG 6/05/2002
0.968 0.301 0.000 0.403 0.584 Fixed
SEV 27/08/2002
1.033 0.000 2.448 0.671 0.350 Dutch
SOF 15/10/2002
1.250 0.375 0.000 0.000 1.000 Fixed
WOW 24/02/2003
0.921 0.324 0.000 0.688 0.253 Dutch
TLS 3/10/2003
0.850 0.000 1.907 0.547 0.357 Dutch
SEV 24/10/2003
1.032 0.295 0.000 0.413 0.600 Dutch
FGL 6/11/2003
0.891 0.045 0.000 0.488 0.453 Dutch
MAY 30/01/2004
1.044 0.000 0.000 0.000 1.000 Dutch
CBA 11/02/2004
0.828 0.000 0.000 0.497 0.506 Dutch
LMC 24/02/2004
1.115 0.420 0.000 0.447 0.599 Fixed
IAG 30/04/2004
0.878 0.000 0.000 0.523 0.491 Dutch
WBC 6/05/2004
0.839 0.000 0.000 0.608 0.497 Dutch
TLS 27/09/2004
0.860 0.000 0.127 0.541 0.556 Dutch
BHP 5/10/2004
0.870 0.000 0.000 0.725 0.321 Dutch
ANN 12/10/2004
1.011 0.000 0.869 0.000 1.000 Dutch
BSL 23/02/2005
0.890 0.000 0.000 0.537 0.618 Dutch
CXP 1/03/2005
0.889 0.294 0.000 0.841 0.079 Dutch
RIO 11/03/2005
0.844 0.000 0.000 0.752 0.175 Dutch
CML 17/03/2005
0.908 0.000 0.000 0.580 0.463 Dutch
WBC 2/11/2005
0.854 0.000 0.040 0.675 0.271 Dutch
SGB 16/12/2005
0.855 0.000 2.425 0.637 0.412 Dutch
BHP 15/02/2006
0.838 0.000 1.740 0.763 0.254 Dutch
CML 23/05/2006
0.860 0.000 0.000 0.608 0.410 Dutch
NHH 29/09/2006
0.848 0.123 0.000 0.364 0.571 Fixed
GFL 30/11/2006
1.026 0.000 0.000 0.000 1.000 Fixed
BHP 7/02/2007
0.827 0.000 1.662 0.743 0.298 Dutch
CXP 8/02/2007
0.866 0.000 1.561 0.817 0.132 Dutch
41

FGL 20/02/2007
0.865 0.000 0.724 0.600 0.495 Dutch
AWC 5/03/2007
0.888 0.000 3.938 0.838 0.210 Dutch
JST 7/03/2007
0.857 0.000 1.488 0.835 0.038 Dutch
STO 14/05/2007
0.950 0.000 1.556 0.732 0.317 Dutch
GFL 23/11/2007
1.256 0.000 0.000 0.000 1.000 Fixed
CCL 5/12/2007
0.858 0.000 1.524 0.566 0.500 Dutch
BLD 13/02/2008
0.850 0.000 0.000 0.423 0.632 Dutch
STO 21/08/2008
0.920 0.000 1.449 0.751 0.195 Dutch
LST 25/09/2008
1.632 0.000 1.994 0.000 1.000 Fixed
MMA 30/09/2008
1.289 0.000 0.000 0.000 1.000 Fixed
GFL 28/11/2008
1.259 0.000 0.000 0.000 1.000 Fixed
a Shortfall as a percentage of shares soughtb Scaleback of tenders as a percentage of shares sought
42