Taxation and Inequality in Canada and the United States: Two Stories or One?
28
Osgoode Hall Law Journal Volume 52, Issue 2 (Summer 2015) Tax Policy for a Beer Tomorrow: Intersectoral and Multidisciplinary Connections, a Workshop in Honour of Neil Brooks Guest Editor: Tim Edgar, addeus Hwong & Jinyan Li Article 3 Taxation and Inequality in Canada and the United States: Two Stories or One? Richard M. Bird Eric M. Zolt Follow this and additional works at: hp://digitalcommons.osgoode.yorku.ca/ohlj is Special Issue Article is brought to you for free and open access by the Journals at Osgoode Digital Commons. It has been accepted for inclusion in Osgoode Hall Law Journal by an authorized administrator of Osgoode Digital Commons. Citation Information Bird, Richard M. and Zolt, Eric M.. "Taxation and Inequality in Canada and the United States: Two Stories or One?." Osgoode Hall Law Journal 52.2 (2015) : 401-426. hp://digitalcommons.osgoode.yorku.ca/ohlj/vol52/iss2/3
Transcript of Taxation and Inequality in Canada and the United States: Two Stories or One?
Osgoode Hall Law Journal
Volume 52, Issue 2 (Summer 2015)Tax Policy for a Better Tomorrow: Intersectoral andMultidisciplinary Connections, a Workshop in Honourof Neil BrooksGuest Editor: Tim Edgar, Thaddeus Hwong & JinyanLi
Article 3
Taxation and Inequality in Canada and the UnitedStates: Two Stories or One?Richard M. Bird
Eric M. Zolt
Follow this and additional works at: http://digitalcommons.osgoode.yorku.ca/ohlj
This Special Issue Article is brought to you for free and open access by the Journals at Osgoode Digital Commons. It has been accepted for inclusion inOsgoode Hall Law Journal by an authorized administrator of Osgoode Digital Commons.
Citation InformationBird, Richard M. and Zolt, Eric M.. "Taxation and Inequality in Canada and the United States: Two Stories or One?." Osgoode Hall LawJournal 52.2 (2015) : 401-426.http://digitalcommons.osgoode.yorku.ca/ohlj/vol52/iss2/3

401
* Professor Emeritus, Department of Economics and Rotman School of Management, University of Toronto; Michael H Schill Distinguished Professor of Law, UCLA School of Law. This article was originally presented at Tax Policy for a Better Tomorrow: Intersectoral and Multidisciplinary Connections, a Workshop in Honour of Neil Brooks (Blake, Cassels & Graydon LLP, Toronto, 10-11 May, 2013). This revised and updated version has benefited from comments at the conference and by several anonymous referees.
Taxation and Inequality in Canada and the United States: Two Stories or One?
RICHARD M. BIRD & ERIC M. ZOLT*
Canada and the United States have both experienced a substantial increase in income inequality over the last several decades. In this article, we examine the complex interaction of income inequality with tax and transfer systems in Canada and the United States. We begin by comparing the data on taxation and expenditure to understand the similarities and differ-ences between the two countries. We then consider how changes to tax and transfer policies have affected the levels of inequality in both countries. The article concludes by offering some policy recommendations that each country may consider to address the increasing levels of inequality.
Le Canada et les États-Unis éprouvent tous deux depuis plusieurs décennies une augmen-tation substantielle de la disparité des revenus. Dans cet article, nous examinons l’interaction complexe de la disparité des revenus avec la fiscalité et le système de transfert au Canada et aux États-Unis. Nous comparons tout d’abord les données relatives à la fiscalité et aux dépenses pour mieux comprendre les similitudes et les différences entre les deux pays. Nous considérons ensuite la manière dont les modifications apportées aux politiques relatives à la fiscalité et au transfert ont affecté le taux de disparité dans les deux pays. En conclusion, l’article propose certaines recommandations sur des politiques que chacun des deux pays pourrait adopter afin de combattre cette augmentation du taux de disparité.
(2015) 52 OSGOODE HALL LAW JOURNAL402
I. THE LAST THREE DECADES: CHANGING TIMES, CHANGING INEQUALITY .................................... 405
II. TAXES, TRANSFERS, AND INEQUALITY ........................................................................................... 414A. The United States................................................................................................................. 416B. Canada ................................................................................................................................ 417
III. CHANGING THE FISCAL CONTRACT: CANADA AND THE UNITED STATES ..................................... 419
MICHAEL ADAMS ONCE NOTED THAT “Americans go where no man has gone before; Canadians follow hoping to make that new place livable.”1 Professor Neil Brooks has devoted considerable efforts to make Canada more livable by improving its tax and transfer system. A few years ago, Brooks and Professor Thaddeus Hwong published a thoughtful and thorough study comparing the social benefits and economic costs of taxation in Organisation for Economic Co-operation and Development (OECD) countries.2 In that study, Brooks and Hwong challenge the view that “no taxes are good taxes”3 and that high tax burdens result in poor social and economic outcomes. They conclude that “the social contract struck by the citizens of Nordic countries [that is, high taxes and high social expenditures] … has been dramatically more successful in terms of achieving social and economic objectives than that struck by citizens of Anglo-American countries [that is, lower taxes and expenditures].”4 In terms of almost every indicator considered by Brooks and Hwong (including poverty rates, gender equality, health and education outcomes, innovation, and competitive-ness), the Nordic countries do better. The intended lesson is clear: Canadians would be better off emulating Norway or Finland, rather than the United States.
Appreciation of the Canada-Norway comparison requires an understanding of the role of social contracts, especially the fiscal component of these contracts. Social contracts are implicit agreements between members of a society and their
1. Michael Adams, Fire and Ice: The United States, Canada and the Myth of Converging Values (Toronto: Penguin Canada, 2003) at 123.
2. Neil Brooks & Thaddeus Hwong, The Social Benefits and Economic Costs of Taxation: A Comparison of High- and Low-Tax Countries (Ottawa: Canadian Centre for Policy Alternatives, December 2006).
3. Ibid at 5. See also Interview of Prime Minister Stephen Harper by Eric Reguly in “What Harper told The Globe,” The Globe and Mail (10 July 2009), online: <www.theglobeandmail.com/news/politics/what-harper-told-the-globe/article4278789>. Prime Minister Harper stated, “You know, there’s two schools in economics on this, one is that there are some good taxes and the other is that no taxes are good taxes. I’m in the latter category, I don’t believe that any taxes are good taxes.”
4. Brooks & Hwong, supra note 2 at 35.

BIRD & ZOLT, TAXATION AND INEQUALITY IN CANADA AND THE UNITED STATES 403
government about their respective rights and obligations. As such, the concept of the social contract frequently arises in discussions of public policy and inequality. In contrast, the public finance literature generally ignores the social contract concept and often assumes the model of an autonomous state in which governments have sufficient coercive power to design and enforce tax regimes.5 Similarly, in the political arena, the social contract concept often gets short shrift because policies related to inequality and the choice of policy outcomes are often attributed to those who control the central government, whether left or right, Liberal or Conservative, Democratic or Republican. Structuring the discussion in these terms, however, implicitly assumes that “there is no relationship between the source of state revenue and state output; and spending is a function of rulers’ whims.”6
The fiscal contract approach posits that citizens, at least to some extent, view governments as selling services in exchange for tax revenue. Governments, like all good suppliers, are likely to respond primarily to the wishes of those who pay for their services. Because taxes are costly and difficult to collect, those who run states presumably want to reduce the willingness and ability of citizens to evade or avoid taxes. One approach to reducing tax collection costs is to increase citizens’ willingness to pay by ensuring that a majority of taxpayers view government spending as beneficial. Another approach is to strengthen tax administration and increase penalties to make it more costly for citizens who fail to pay their taxes. From this perspective, the central fiscal problem of the state is to balance the use of these two levers to obtain the revenues desired at the least cost. Countries are thus continually seeking a sustainable equilibrium between force and persuasion in raising tax revenue.
The fiscal contract paradigm fits uneasily with the welfarist approach, which assumes that redistribution is, or at least should be, a major goal of the fiscal system.7 The welfarist approach calls for taxes to be paid mainly by the wealthy
5. An important variant of this approach is to assume that the state is not an actor in itself, but simply the instrument of specific groups such as social classes, organized interest groups, or partisan political parties that act in a self-interested way to increase their command over resources. In all of these cases, however, it is usually assumed that those who control the state can use their power as they wish. Public finance scholars often defer on distributional issues and note that “the underlying core of concern about inequality is one’s taste for redistribution, derived from personal values.” See Nicole Fortin et al, “Canadian Inequality: Recent Developments and Policy Options” (2012) 38:2 Canadian Public Policy 121 at 141.
6. Jeffrey F Timmons, “The Fiscal Contract: States, Taxes, and Public Services” (2005) 57:4 World Politics 530 at 534.
7. Louis Kaplow & Steven Shavell, “Fairness versus Welfare: Notes on the Pareto Principle, Preferences, and Distributive Justice” (2003) 32:1 J Legal Stud 331.

(2015) 52 OSGOODE HALL LAW JOURNAL404
and expenditures targeted mainly to benefit the poor. In contrast, the fiscal contract approach predicts that those who are expected to pay most of the taxes are likely to receive most of the benefits. The benefits can be direct or indirect. An example of the latter would be to provide people who are too poor to owe tax with funds on the condition that they act in ways taxpayers value, such as ensuring that their children go to school.
Fiscal contracts will change when taxpayers change their preferences for redistribution (altruism), their preferences for social insurance (either over their lifetime or related to health, disability, or unemployment), or their beliefs in the relative efficiency and effectiveness of governments to provide goods and services. Taxpayers’ preferences are also coloured by beliefs (whether well-founded or not) about why the poor are poor and the rich are rich, as well as by perceptions of who bears the tax burden and who benefits from government spending.
In this short article, we examine the complex interaction of the tax and transfer system with inequality in Canada and the United States. The complex and multidimensional nature of the problems inherent in measuring both inequality and changes in inequality over time means that some observations in this article may be incomplete and open to objection on technical as well as ideological grounds.8 Nonetheless, Part I provides a brief comparison of fiscal policy data for Canada and the United States. Against this background, Part II considers how and to what extent changes in tax and transfer policy in recent decades appear to have affected inequality in each country. Finally, Part III concludes with a few policy changes that each country might wish to consider and that may be broadly consistent with their existing implicit fiscal contracts.
8. To illustrate the point, consider the different perspectives taken on taxation and inequality in Canada in several recent studies. For two by academics, see e.g. Fortin et al, supra note 5; Kevin Milligan & Michael Smart, “Taxation and Top Incomes in Canada” (September 2014) NBER working paper 20489, online: <www.nber.org/papers/w20489>. For two by diametrically opposed interest groups, see e.g. Jason Clemens, Niels Veldhuis & Robert P Murphy, “Tax Payers and Tax Takers: Is the Trend of Tax Progressivity in the US Emerging in Canada?” (Studies in Tax Policy, Fraser Institute, March 2013), online: <www.fraserinstitute.org/research-news/display.aspx?id=19478>; Marc Lee & Iglika Ivanova, Fairness by Design: A Framework for Tax Reform in Canada (Ottawa: Canadian Centre for Policy Alternatives, February 2013).
BIRD & ZOLT, TAXATION AND INEQUALITY IN CANADA AND THE UNITED STATES 405
I. THE LAST THREE DECADES: CHANGING TIMES, CHANGING INEQUALITY
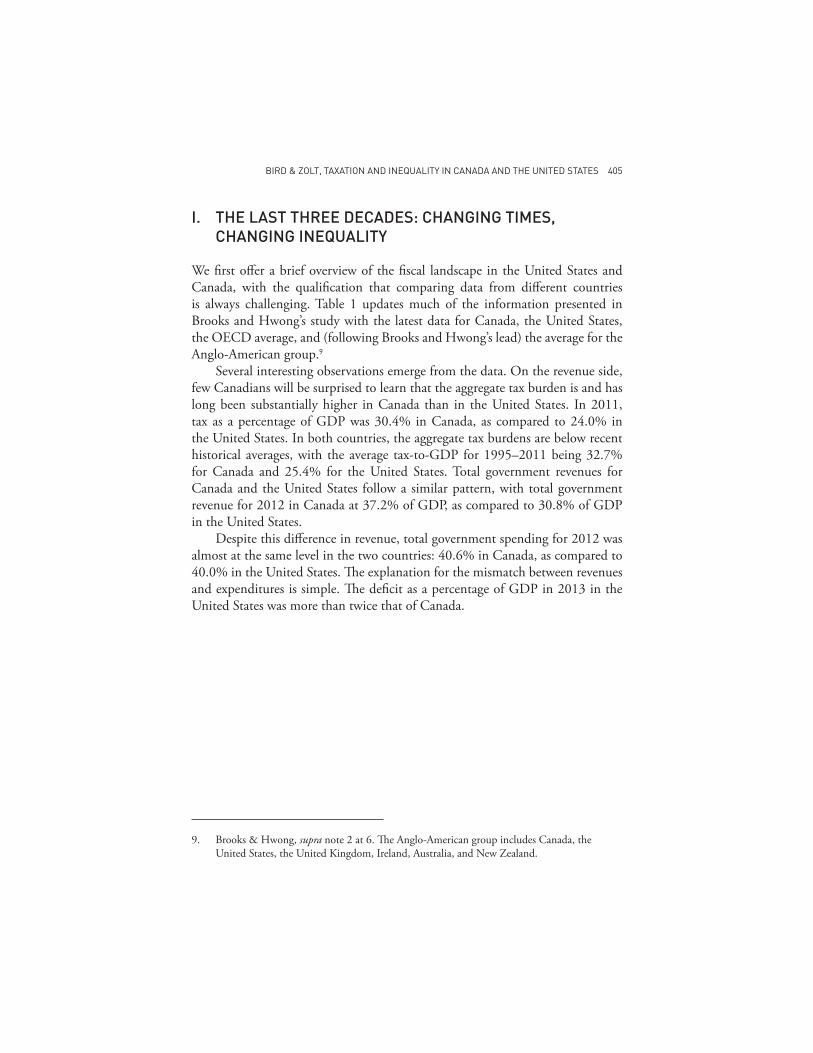
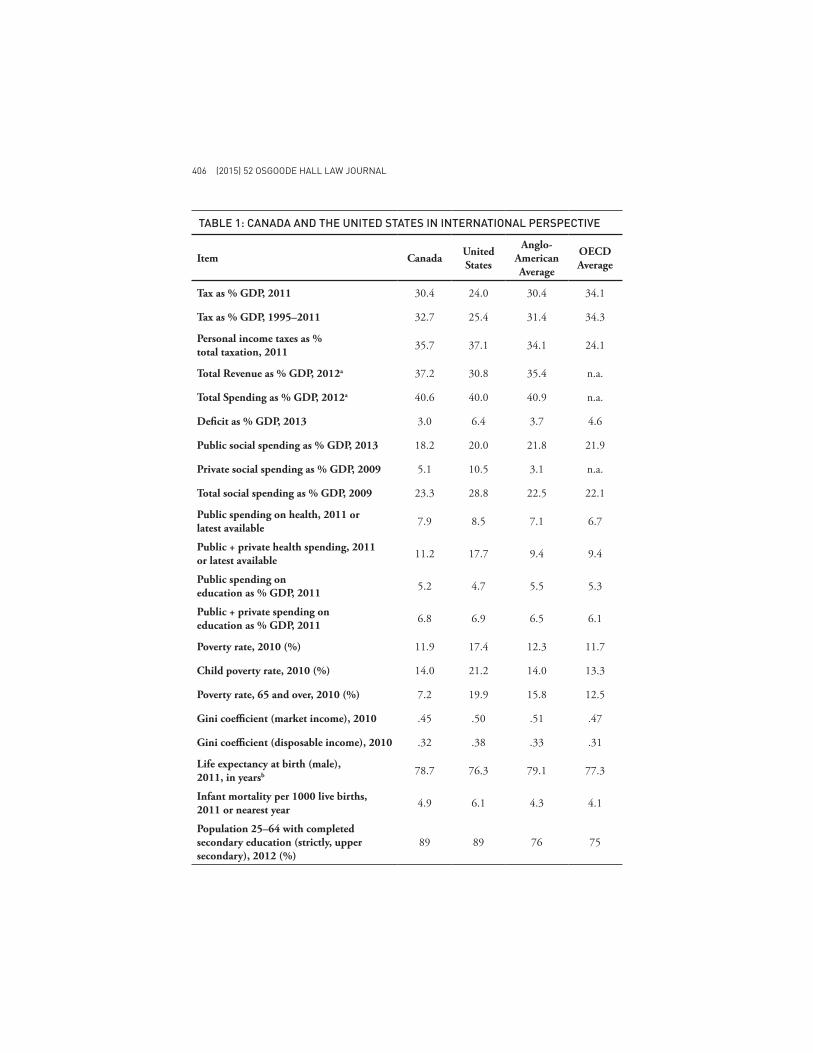
We first offer a brief overview of the fiscal landscape in the United States and Canada, with the qualification that comparing data from different countries is always challenging. Table 1 updates much of the information presented in Brooks and Hwong’s study with the latest data for Canada, the United States, the OECD average, and (following Brooks and Hwong’s lead) the average for the Anglo-American group.9
Several interesting observations emerge from the data. On the revenue side, few Canadians will be surprised to learn that the aggregate tax burden is and has long been substantially higher in Canada than in the United States. In 2011, tax as a percentage of GDP was 30.4% in Canada, as compared to 24.0% in the United States. In both countries, the aggregate tax burdens are below recent historical averages, with the average tax-to-GDP for 1995–2011 being 32.7% for Canada and 25.4% for the United States. Total government revenues for Canada and the United States follow a similar pattern, with total government revenue for 2012 in Canada at 37.2% of GDP, as compared to 30.8% of GDP in the United States.
Despite this difference in revenue, total government spending for 2012 was almost at the same level in the two countries: 40.6% in Canada, as compared to 40.0% in the United States. The explanation for the mismatch between revenues and expenditures is simple. The deficit as a percentage of GDP in 2013 in the United States was more than twice that of Canada.
9. Brooks & Hwong, supra note 2 at 6. The Anglo-American group includes Canada, the United States, the United Kingdom, Ireland, Australia, and New Zealand.
(2015) 52 OSGOODE HALL LAW JOURNAL406
TABLE 1: CANADA AND THE UNITED STATES IN INTERNATIONAL PERSPECTIVE
Item Canada United States
Anglo- American Average
OECDAverage
Tax as % GDP, 2011 30.4 24.0 30.4 34.1
Tax as % GDP, 1995–2011 32.7 25.4 31.4 34.3
Personal income taxes as % total taxation, 2011 35.7 37.1 34.1 24.1
Total Revenue as % GDP, 2012a 37.2 30.8 35.4 n.a.
Total Spending as % GDP, 2012a 40.6 40.0 40.9 n.a.
Deficit as % GDP, 2013 3.0 6.4 3.7 4.6
Public social spending as % GDP, 2013 18.2 20.0 21.8 21.9
Private social spending as % GDP, 2009 5.1 10.5 3.1 n.a.
Total social spending as % GDP, 2009 23.3 28.8 22.5 22.1
Public spending on health, 2011 or latest available 7.9 8.5 7.1 6.7
Public + private health spending, 2011 or latest available 11.2 17.7 9.4 9.4
Public spending on education as % GDP, 2011 5.2 4.7 5.5 5.3
Public + private spending on education as % GDP, 2011 6.8 6.9 6.5 6.1
Poverty rate, 2010 (%) 11.9 17.4 12.3 11.7
Child poverty rate, 2010 (%) 14.0 21.2 14.0 13.3
Poverty rate, 65 and over, 2010 (%) 7.2 19.9 15.8 12.5
Gini coefficient (market income), 2010 .45 .50 .51 .47
Gini coefficient (disposable income), 2010 .32 .38 .33 .31
Life expectancy at birth (male), 2011, in yearsb 78.7 76.3 79.1 77.3
Infant mortality per 1000 live births, 2011 or nearest year 4.9 6.1 4.3 4.1
Population 25–64 with completed secondary education (strictly, upper secondary), 2012 (%)
89 89 76 75
BIRD & ZOLT, TAXATION AND INEQUALITY IN CANADA AND THE UNITED STATES 407
TABLE 1: CANADA AND THE UNITED STATES IN INTERNATIONAL PERSPECTIVE
Item Canada United States
Anglo- American Average
OECDAverage
Population 25–64 with completed post-secondary (strictly, tertiary Type A) education, 2012 (%)
28 33 28 24
Reading PISA score of 15 year-olds, 2012 523 498 511.5 496
Math PISA score of 15 year-olds, 2012 518 481 499.8 494
Percent of variance in score explained by socioeconomic background 9.4 14.8 14.5 14.8
SOURCES: See Appendix.a. Anglo-American average does not include New Zealand.b. Data used for Canada is from 2009.
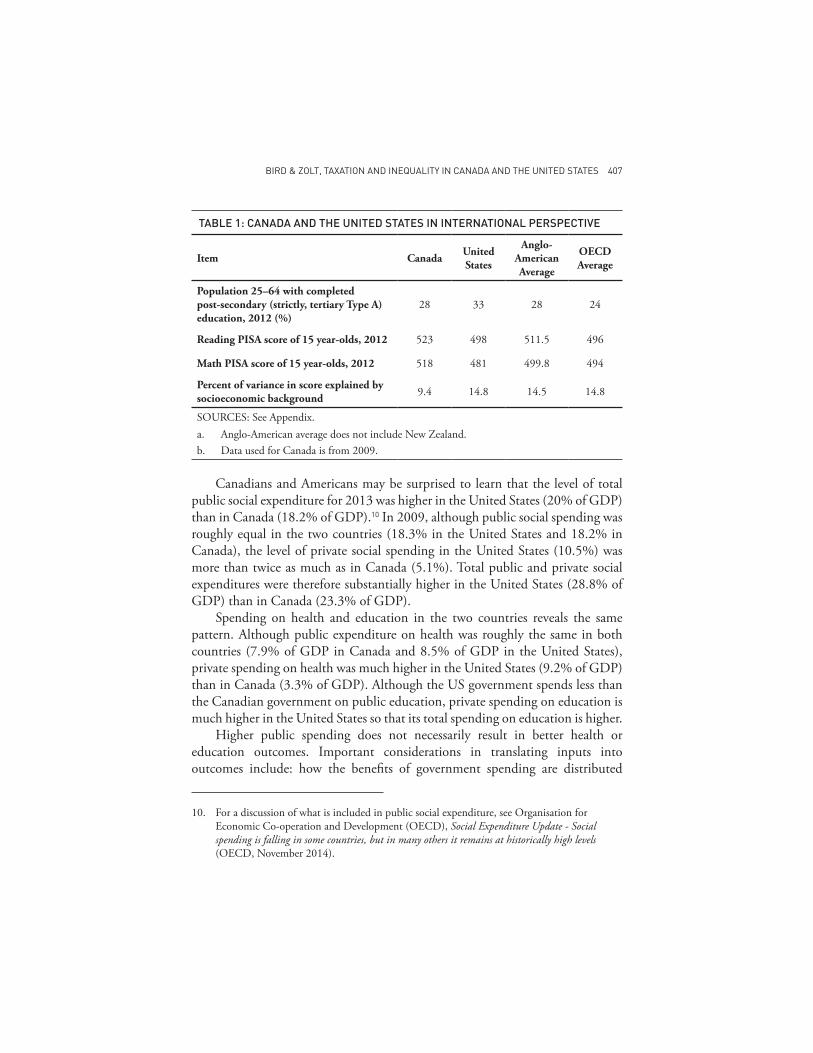
Canadians and Americans may be surprised to learn that the level of total public social expenditure for 2013 was higher in the United States (20% of GDP) than in Canada (18.2% of GDP).10 In 2009, although public social spending was roughly equal in the two countries (18.3% in the United States and 18.2% in Canada), the level of private social spending in the United States (10.5%) was more than twice as much as in Canada (5.1%). Total public and private social expenditures were therefore substantially higher in the United States (28.8% of GDP) than in Canada (23.3% of GDP).
Spending on health and education in the two countries reveals the same pattern. Although public expenditure on health was roughly the same in both countries (7.9% of GDP in Canada and 8.5% of GDP in the United States), private spending on health was much higher in the United States (9.2% of GDP) than in Canada (3.3% of GDP). Although the US government spends less than the Canadian government on public education, private spending on education is much higher in the United States so that its total spending on education is higher.
Higher public spending does not necessarily result in better health or education outcomes. Important considerations in translating inputs into outcomes include: how the benefits of government spending are distributed
10. For a discussion of what is included in public social expenditure, see Organisation for Economic Co-operation and Development (OECD), Social Expenditure Update - Social spending is falling in some countries, but in many others it remains at historically high levels (OECD, November 2014).
(2015) 52 OSGOODE HALL LAW JOURNAL408
across the income distribution, the form of subsidy (cash, in-kind, or tax benefit), and the efficiency and effectiveness of delivering health and education services.11 While the United States spends a higher percentage of GDP on health and education than Canada, outcomes are better in Canada. For example, Canada is superior in terms of life expectancy and infant mortality, as shown in Table 1. One important reason for these differences is the more egalitarian nature of most social spending in Canada. Viewed in lifetime terms, for example, average publicly funded healthcare in Canada represents 24% of average income for the lowest quintile, compared to only 3% for the highest quintile.12
Similarly, in terms of educational outcomes, Programme for International Student Assessment (PISA) scores of fifteen-year-old students are higher in Canada than in the United States. Interestingly, the percentage of variance in reading scores explained by students’ socioeconomic backgrounds was signifi-cantly higher in the United States (14.8%) than in Canada (9.4%).13 This statistic seems consistent with the difference in estimates of economic mobility between the two countries. Although parents’ economic success (or lack thereof ) strongly influences that of their children, estimates of intergenerational elasticity between father and son earnings find that only about 19% of the variance can be explained
11. We do not examine the distributional effect of in-kind services, such as public health and education. Irwin Garfinkel, Lee Rainwater and Timothy Smeeding demonstrate that including in-kind transfers may significantly change the relative levels of inequality across countries. If in-kind transfers are attributed at cost and indirect taxes are subtracted from income, the authors find that the differences in inequality across countries often narrow substantially. For example, in the United States the median disposable income of the top-income decile is 5.4 times larger than that of the lowest decile, compared to 4.0 in Canada. See Irwin Garfinkel, Lee Rainwater & Timothy Smeeding, “A Re-examination of Welfare States and Inequality in Rich Nations: How In-kind Transfers and Indirect Taxes Change the Story” (2006) 25:4 J Pol’y Analysis & Mgmt 897 at 908. These results reflect the different measures, different assumptions, and different objectives of the different data sources. These results do not necessarily imply that Canada’s public social expenditure programs are more efficient and effective than those in the United States because health and education outcomes in both countries are influenced by many other factors.
12. Canadian Institute for Health Information, Lifetime Distributional Effects of Publicly Financed Health Care in Canada (May 2013) at 2, 11-13. Since the estimated tax cost of the public share of health expenditure is 6% of income for the bottom quintile and 8% for the top quintile, it is not surprising that this study found that the difference in average incomes between the top and bottom quintiles was reduced from 5.1 to only 4.3 times the latter when the dollar value of publicly financed healthcare was included in the analysis.
13. Linda Levine, The U.S Income Distribution and Mobility: Trends and International Comparisons (Congressional Research Service, November 2012).

BIRD & ZOLT, TAXATION AND INEQUALITY IN CANADA AND THE UNITED STATES 409
by family background in Canada, compared to 47% in the United States.14 It may be true that “Horatio Alger has never been a Canadian hero,” but poor people in Canada nonetheless seem to have a better chance to succeed than do poor people in the United States.15
Finally, poverty rates are higher in the United States than in Canada.16 This is true for poverty in the total population (about 17% relative poverty rate in the United States, as compared to 12% in Canada), for child poverty (about 21% compared to 14%), for child poverty in single-parent households (47% compared to 41%), and for poverty among the elderly (about 20% compared to 7%). The scope and structure of public transfer programs, such as cash and health benefits to the elderly, appear to account for much of this difference. Although relatively more transfers have gone to the elderly in the United States in recent years, there is, for example, no American equivalent to Canada’s basic income support through the Old Age Security and Guaranteed Income Supplement system. In addition, Canada did not see the same sort of increase in the share of total transfers going to the middle- and upper-income groups that is evident in US data in recent decades.17
14. See Miles Corak, “Inequality from Generation to Generation: The United States in Comparison” in Robert S Rycroft, ed, The Economics of Inequality, Poverty and Discrimination in the 21st Century (Santa Barbara, Cal: Praeger, 2013) vol 1 at 107. Michael Veall suggests that the Canadian advantage may lie in broader access to good public healthcare and education. See Michael R Veall, “Top Income Shares in Canada: Recent Trends and Policy Implications” (2012) 45:4 Can J Econ 1247. Many ways to measure income mobility exist, and income persistence across a single generation may not be the best measure of intergenerational income mobility. For example, Raj Chetty concludes that income mobility, as measured, has not in fact declined in the United States in recent years. See Raj Chetty et al, “Is the United States Still a Land of Opportunity? Recent Trends in Intergenerational Mobility” (January 2014) NBER working paper 19844, online: <www.nber.org/papers/w19844>. For an interesting discussion of alternative measures, see also Markus Jäntti et al, “American Exceptionalism in a New Light: A Comparison of Intergenerational Earnings Mobility in the Nordic Countries, the United Kingdom and the United States” (January 2006) IZA discussion paper 1938, online: <ftp.iza.org/dp1938.pdf>.
15. For this quotation, see Seymour Martin Lipset, The First New Nation: The United States in Historical and Comparative Perspective (New York: Basic Books, 1963) at 251. For a detailed discussion of the Alger myth in the United States, see Eric M Zolt, “Inequality in America: Challenges for Tax and Spending Policies” (2013) 66:4 Tax L Rev 641.
16. Every country defines poverty rates in its own way. The OECD rate reported in Table 1 is calculated uniformly as the percentage of the population with equalized household income less than 50% of the median household income.
17. For a detailed examination of recent tax-transfer trends in the United States and their effects on inequality, see Zolt, supra note 15.

(2015) 52 OSGOODE HALL LAW JOURNAL410
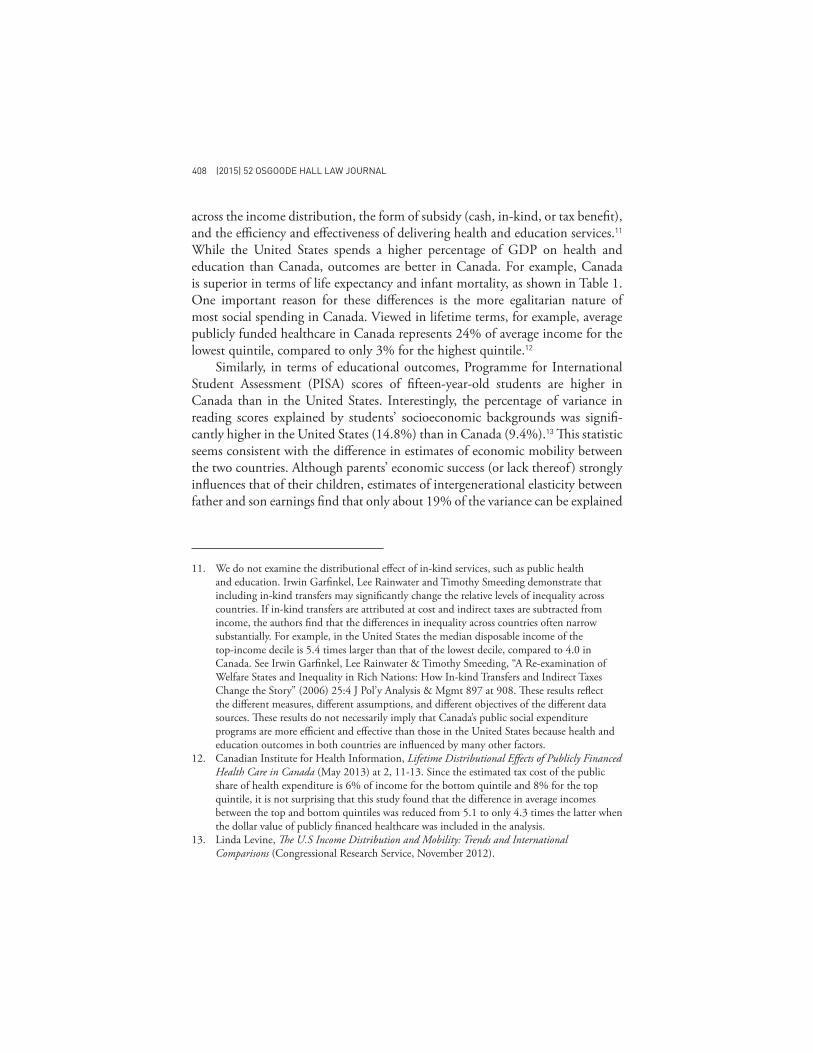
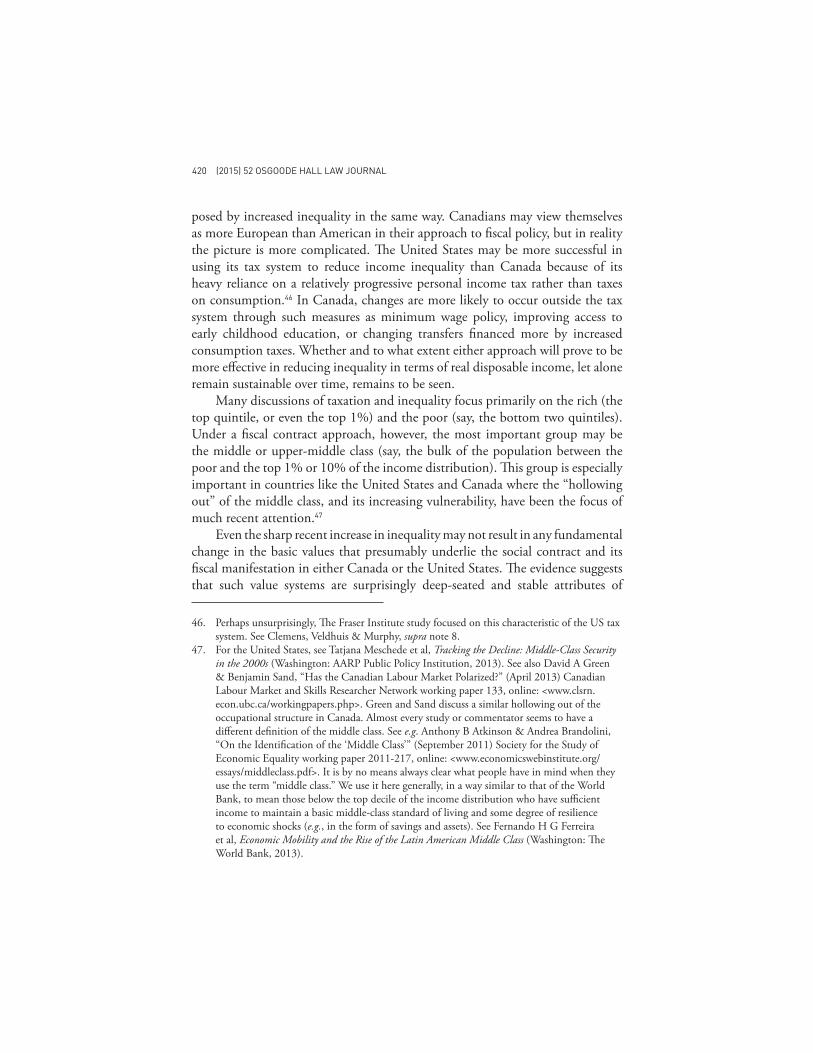
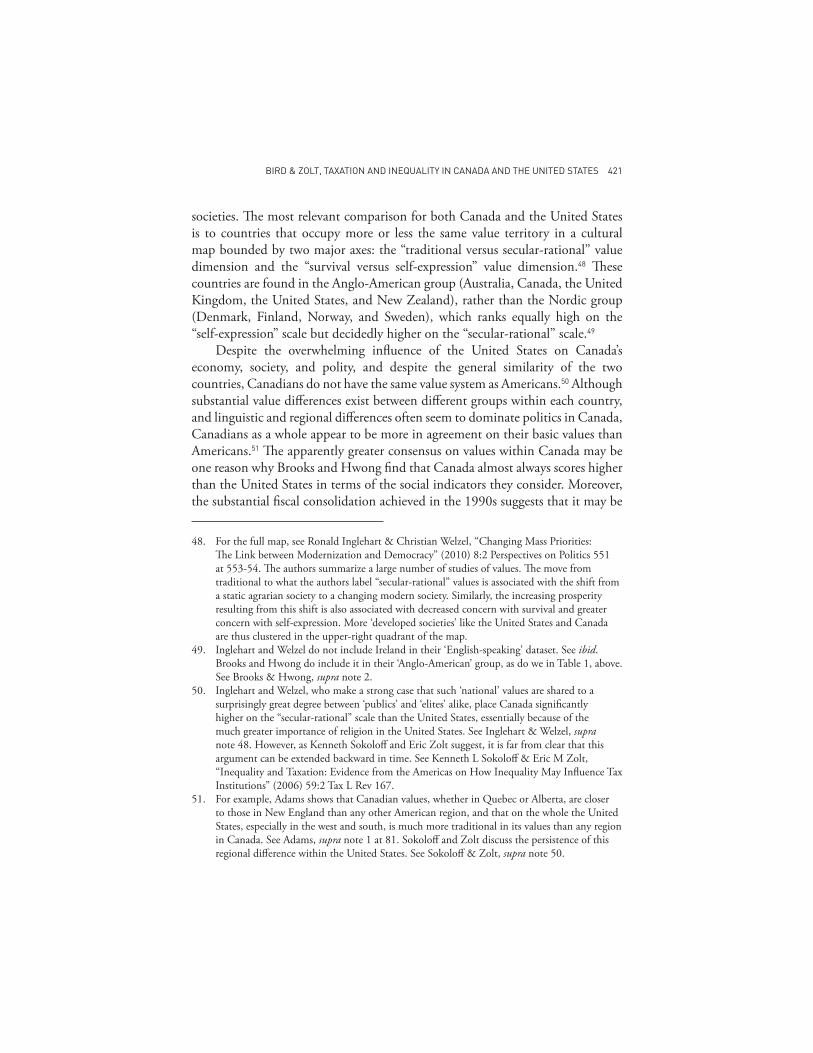
Figures 1 and 2 highlight the increase in income inequality both before taxes and transfers (so-called market income) and after (disposable income) over the last thirty years in Canada and the United States. As Table 1 shows, the Gini coefficient before taxes and transfers (market income) in the United States (.50), although close to the OECD average, is higher than that in Canada (.45).18 The Gini coefficient is a metric that measures income inequality. Market income distribution does not result solely from individual effort in an economic environment free from government intervention. It also reflects the consequences of government action (such as deregulation of the financial sector, welfare and minimum wage policies, protection of monopoly or quasi-monopoly market positions, and existing education and health programs), as well as advantages that have little to do with effort, intelligence, or talent (such as good parents, inherited wealth, or luck).
FIGURE 1: EFFECTS OF TAXES AND TRANSFERS ON INCOME INEQUALITY, AS MEASURED BY THE GINI COEFFICIENT, CANADA 1981–2010
18. Several ways exist to measure income inequality. Although the Gini coefficient is useful in making comparisons across countries over time, countries adopt different approaches in constructing the Gini coefficient. See e.g. United Nations University, “World Income Inequality Database, Version 2.0c: User Guide and Data Sources” (May 2008), online: <www.wider.unu.edu/research/WIID3-0B/en_GB/database>. The Gini coefficient is also more sensitive to changes in the middle of the income distribution than at the top, as compared to some other measures of inequality.
BIRD & ZOLT, TAXATION AND INEQUALITY IN CANADA AND THE UNITED STATES 411
FIGURE 2: EFFECTS OF TAXES AND TRANSFERS ON INCOME INEQUALITY, AS MEASURED BY THE GINI COEFFICIENT, UNITED STATES 1979–2009
No consensus exists on the relative influence of the various factors that have contributed to increasing inequality of market-generated incomes over the last thirty years. Separating the relative contributions of the many different factors is difficult in a single country and even more challenging across countries.19 At a general level, however, the causes of increased economic inequality can be separated into three categories: market-driven factors, demographic factors, and institutional factors.
Market-driven factors include changes resulting from increased globaliza-tion and technological change.20 Globalization, for example, leads to increases in imports, exports, and cross-border investment flows, all of which are associated with changes in factor and product markets that may affect income distribution. While such issues have been much discussed,21 there is little hard evidence of the
19. For a recent comprehensive overview of Canada, see Fortin et al, supra note 5. See also Veall, supra note 14. For a recent comprehensive overview of the United States, see Claudia Goldin & Lawrence Katz, The Race between Education and Technology (Cambridge, Mass: The Belknap Press of Harvard University Press, 2008).
20. See generally, OECD Secretary General, Growing Unequal? Income Distribution and Poverty in OECD Countries (2008).
21. Lynn Karoly, “Trends in Income Inequality: The Impact of, and Implications for, Tax Policy” in Joel Slemrod, ed, Tax Progressivity and Income Inequality (Cambridge, UK: Cambridge University Press, 1996) 95 at 123-24.
(2015) 52 OSGOODE HALL LAW JOURNAL412
net distributional impact of these factors.22 Much more attention has been paid to shifts in market rewards to different levels of skill and education over time, which in both countries have contributed to a greater share of income going to the top 1% or 10% and a smaller share to the rest of the population.23 The distributional impact of technological change on the demand side of the labour market was offset to some extent in Canada by the greater relative increase in the number of college graduates in Canada than in the United States.24
Demographic factors that could influence the level of income inequality include changing age distributions (percent of population in prime working years) and changes in the size of households (increase in single-person and single-parent households).25 The share of the working age (15–64) population grew in both countries over the last two decades, though somewhat more in Canada (from 53% to 56%) than in the United States (from 48% to 50%). The average size of households also fell more sharply in Canada (from 3.7 persons in 1971 to
22. There is a study that provides strong evidence showing that offshoring was an important factor in the polarization of US wages in the 1990s. See Sergio Firpo, Nicole M Fortin & Thomas Lemieux, “Occupational Tasks and Changes in the Wage Structure” (February 2011) IZA Discussion Papers No 5542, online: <www.iza.org/en/webcontent/publications/papers/viewAbstract?dp_id=5542>.
23. In the United States, between 1979 and 2007 the after-tax income of the top 1% grew by 275% and the after-tax income of the top quintile (excluding the top 1%) increased by 65%. In contrast, the income growth over this period for the middle three quintiles was 40%, and for the lowest quintile, only 18%. See US, Congressional Budget Office, Trends in Distribution of Household Income between 1979 and 2007 (Congress of the United States, October 2011) at 3. In Canada, between 1986 and 2009 the share of income going to the top 1% grew by 53% (48% if capital gains are included, and 38% after taxes) with an increase in average real (disposable) income of 72%. For the top .01%, average real income over this period increased by 153%. In contrast, the share of pre-tax income going to the bottom nine deciles decreased over the same period by 9% in pre-tax and 4% in after-tax terms. See Veall, supra note 14.
24. See Fortin et al, supra note 5. Veall concludes that, for the most part, the factors underlying recent trends in income inequality in Canada remain undetermined. See Veall, supra note 14 at 1259.
25. Robert J Gordon & Ian Dew-Becker, “Controversies about the Rise of American Inequality: A Survey” (May 2008) NBER working paper 13982, online: <www.nber.org/papers/w13982.pdf>.
BIRD & ZOLT, TAXATION AND INEQUALITY IN CANADA AND THE UNITED STATES 413
2.5 in 2011) than in the United States (from 3.1 to 2.6 over the same period).26 Although the major changes in both countries took place before the 1990s, it takes substantial time for demographic changes to affect market incomes.
Institutional factors also influence inequality levels in both countries. These factors include legal rules related to unionization and job security, minimum wage legislation, and immigration policies. While the amount of immigration is substantial in both countries, differences in immigration policy may have different distributional consequences. Canada’s immigration policy admits relatively more legal immigrants and places more emphasis on selecting those who will qualify for better-paid jobs. However, the relative earnings of immigrants have declined markedly in recent years, so it may be that immigration is not a significant factor in increasing the levels of inequality in the United States and Canada.27
Both unionization and minimum wage legislation likely play a greater role in supporting lower-income groups in Canada than in the United States. Although union membership has declined in both countries, unions remain much more important in Canada than in the United States. One study attributed about 20% of the growth in income inequality in the United States during the two last decades of the twentieth century to the decline in unionization, and about 15% of the growth in income inequality in Canada to the same factor.28 Canada’s significantly higher minimum wages are likely more effective in sustaining lower incomes than similar policies in the United States. In the United States, the real value of minimum wages decreased over the last thirty years, exacerbating inequality in the lower tail of the income distribution.29 While many state and local governments in the United States have increased minimum wages above
26. The first set of numbers is calculated from data in the World Bank database. See The World Bank Group, “Population ages 15-64 (% of total)” (2015), online: <data.worldbank.org/indicator/SP.POP.1564.TO.ZS>. For the second set of numbers from census information in the two countries, see Statistics Canada, “Census families, number and average size” (September 2007), online: <www.statcan.gc.ca/tables-tableaux/sum-som/l01/cst01/famil40-eng.htm>. See also Daphne Lofquist et al, “Households and Families: 2010” (April 2012), online: United States Census Bureau <www.census.gov/prod/cen2010/briefs/c2010br-14.pdf>.
27. For a detailed discussion of the Canadian case, see Garnett Picot, Yuqian Lu & Feng Hou, “Immigrant Low-Income Rates: The Role of Market Income and Government Transfers” (2009) 10:12 Perspectives on Labour & Income 13.
28. David Card, Thomas Lemieux & W Craig Riddell, “Unionization and Wage Inequality: A Comparative Study of the U.S., U.K., and Canada” (January 2003) NBER working paper 9473, online: <www.nber.org/papers/w9473>.
29. David H Autor, Alan Manning & Christopher L Smith, “The Contribution of the Minimum Wage to U.S. Wage Inequality over Three Decades: A Reassessment” (November 2010) NBER working paper 16533, online: <www.nber.org/papers/w16533>.
(2015) 52 OSGOODE HALL LAW JOURNAL414
the federal level, these increases are generally less than the significant increases in minimum wages adopted in most Canadian provinces.30
II. TAXES, TRANSFERS, AND INEQUALITY
To this point, we have largely focused on income inequality. Some contend that high levels of income and wealth inequality adversely affect both economic performance and political stability.31 If so, this provides reason enough for government intervention through fiscal and other policies that alter market outcomes.32 A related approach focuses less on inequality than on related components of the current fragile economic and political environment, such as increasing poverty, the economic vulnerability of the near-poor and middle classes, and declining economic mobility. The distinction between focusing on inequality and focusing on related components is important. For instance, tolerance for high levels of income inequality is likely greater when economic mobility is high and poverty rates are low, than with low mobility and high poverty. Moreover, the appropriate fiscal policy responses will differ depending on whether the goal is primarily to reduce income or wealth inequality or, instead, to use tax and spending policies to address the related but distinct triad of poverty, economic vulnerability, and economic mobility.
As Figures 1 and 2 show, the recent increased level of inequality was largely driven by changes in the market distribution of income. Governments may use fiscal policy to reduce market inequality via progressive taxes or via spending programs that provide cash or in-kind benefits disproportionately to those in the bottom half of the income distribution. In recent years, the United States and Canada have had relatively similar results in using taxes and transfers to reduce market income inequality, as shown in both figures and Table 1. No doubt, both countries could do more in this direction.
30. See Fortin et al, supra note 5 at 132. For a comparison of state and federal level minimum wages in the United States, see US, Department of Labor, Wage and Hour Division, Changes in Basic Minimum Wages in Non-Farm Employment Under State Law: Selected Years 1968 to 2013 (2014), online: <www.dol.gov/whd/state/stateMinWageHis.htm>.
31. Joseph E Stiglitz, The Price of Inequality: How Today’s Divided Society Endangers Our Future (New York: WW Norton & Company, 2012) at 96-106, 118-38.
32. We do not examine wealth inequality in this article. In all countries, the levels of wealth inequality are substantially higher than levels of income inequality. For a collection of studies discussing wealth distribution, see James B Davies, ed, Personal Wealth from a Global Perspective (Oxford: Oxford University Press, 2008).
BIRD & ZOLT, TAXATION AND INEQUALITY IN CANADA AND THE UNITED STATES 415
In addition to using fiscal policy to reduce market inequality directly, governments may use spending policies (and, to a limited extent, tax policies) to improve market outcomes. Investments in education (particularly early education and improving access to quality education), in job training and job creation, and in improving health outcomes may not only improve the economic prospects of those lower in the income distribution, but also alter the distri-bution of market income. For those at the top of the income distribution, eliminating tax preferences and reducing social spending through the tax system may improve economic efficiency and alter the distribution of market income. Explicitly redistributive policies (more progressive taxes and more income-targeted transfers) may be more effective in reducing inequality in the short run, but policies aimed at increasing the market income of those at the bottom of the income distribution may have more important long-run effects.33
Taxes can play only a limited role in addressing income inequality. Even dramatically increasing taxes on the wealthy, and assuming high tax compliance rates, does little to alter the Gini coefficient unless the impact of such changes extends deeply in the upper-middle income group. Such an outcome is highly unlikely to be either politically feasible or economically desirable in North America.34 A more effective approach may be to support or subsidize different income groups or activities directly though cash grants or indirectly through tax benefits. Both Canada and the United States provide tax subsidies for retirement and other savings, as well as a host of other items. However, the countries differ in both the level of such expenditures and the distribution of
33. Gosta Esping-Andersen and John Myles find that the extent to which the state shapes the market distribution is potentially more significant than its role in redistributing market outcomes. See Gosta Esping-Andersen & John Myles, “Economic Inequality and The Welfare State” in Wiemer Salverda, Brian Nolan & Timothy M Smeeding, eds, The Oxford Handbook of Income Inequality (New York: Oxford University Press, 2009) at 639. This article also contains a useful review of the many different ways in which income inequality can be measured and assessed.
34. Since the Gini coefficient is more sensitive to changes in the middle of the distribution than at the extremes, a given proportionate increase in taxes will actually reduce the coefficient more if it hits the upper-middle group rather than the top 10% or 1%.
(2015) 52 OSGOODE HALL LAW JOURNAL416
those benefits across income classes, with tax expenditures more important in the United States and more skewed towards higher income groups.35
A. THE UNITED STATES
The relative federal income tax burdens of different income groups have changed substantially over the past several decades. Four types of legislative changes have reduced the federal income tax burden of low- and middle-income taxpayers: (i) increases in the personal exemption and standard deduction, (ii) increases in the amount and coverage of the Earned Income Tax Credit (EITC), (iii) adoption of additional tax subsidies for families with children, and (iv) lower tax rates. These tax reductions were not part of any comprehensive, well-thought-out package, but resulted from a series of political compromises over the last several decades.
The reduction in tax rates for middle-class taxpayers was an essential part of the political compromise that reduced personal income tax rates beginning in 2001. Due mainly to the large increases in household incomes of the top deciles, it was possible to cut tax rates for all income levels while still keeping the federal tax-to-GDP ratio constant at roughly 18% (well within historical averages).
The result is that the federal income tax burden on the middle class (particu-larly the second-lowest and middle quintiles) is likely at its lowest point since 1942, when the amount and scope of the income tax were dramatically increased to meet revenue needs resulting from World War II.36 The average federal income tax rate for the middle-income quintile was about 8% in 1981, but had fallen below 3% by 2003, with further decreases in later years (to 1.3% in 2009).37 Everything
35. Suzanne Mettler provides a recent discussion on what she calls the submerged state of the US tax expenditure system. See Suzanne Mettler, The Submerged State: How Invisible Government Policies Undermine American Democracy (Chicago: University of Chicago Press, 2011). Mettler’s arguments are important as perceptions of the benefits from government spending (either direct spending or through tax subsidies) shape opinions on the efficacy of government programs. Carina Engelhardt and Andreas Wagener depict individuals’ reactions to their perceptions of inequality and redistribution, rather than the facts depicted in statistical measures. See Carina Engelhardt & Andreas Wagener, “Biased Perceptions of Income Inequality and Redistribution” (CESifo working paper 4838, June 2014), online: <www.ssrn.com/abstract=2463129>.
36. See Chuck Marr, Federal Income Taxes on Middle-Income Families Remain Near Historic Lows (Washington: Center on Budget and Policy Priorities, April 2012).
37. At the same time, average government transfers have increased for all income groups. The middle quintile, as a group, now receives more in federal government transfers than it pays in federal taxes. See Greg Mankiw, “The Progressivity of Taxes and Transfers” (14 July 2012), online: Greg Mankiw’s Blog: Random Observations for Students of Economics <www.gregmankiw.blogspot.com/2012/07/progressivity-of-taxes-and-transfers.html>.

BIRD & ZOLT, TAXATION AND INEQUALITY IN CANADA AND THE UNITED STATES 417
else has become more challenging for the middle-class family, however: dramatic increases in healthcare costs, rising debt levels, costly university tuition, uncertain pension benefits, and a challenging labour market. Moreover, the tax burden on the middle class increases substantially when other federal taxes, and state and local taxes, are included.38 While average rates have declined, marginal rates for many in the middle class are quite high due to income phase-out for many of the targeted tax benefits. While low average tax rates in the federal income tax mean that relatively little tax revenue is raised from the middle class, the high effective marginal tax rates from tax and transfer programs distort incentives to work and to save money.39
On the expenditure side, spending on social security and Medicare increased faster than spending on programs targeted at low-income households. In 1979, elderly, childless households received 62% of all transfers and by 2007 that percentage had increased to 68%. In contrast, households in the bottom quintile received 54% of all transfers in 1979, but by 2007, that percentage had decreased to 36% of transfer payments.40
The effectiveness of tax and transfer policies in reducing inequality has declined over the last thirty years. Fiscal policy reduced the pre-tax and transfer Gini coefficient by 23% in 1979, but by only 17% in 2007.41 Compared to Canada, a higher portion of the reduction in the Gini coefficient was attributable to taxes (40% in the United States and 30% in Canada) than spending programs.
B. CANADA
The federal personal income tax system in Canada is progressive because of the progressive statutory tax rate structure and, to a lesser extent, the Goods and Services Tax (GST) credit and the Canada Child Tax Benefit (CCTB), both of which are refundable. The personal income tax system also influences income distribution because of the tax benefits extended to the young, the old, and single-parent families. Since 2001, four tax rates have been applicable to taxable
38. Carl Davis et al, Who Pays? A Distributional Analysis of the Tax Systems in All 50 States, 4th ed (Washington: Institute on Taxation & Economic Policy, 2013).
39. Elaine Maag et al, “How Marginal Tax Rates Affect Families at Various Levels of Poverty” (2012) 65:4 Nat’l Tax J 759.
40. Congressional Budget Office, supra note 23 at 22.41. Ibid at 19.

(2015) 52 OSGOODE HALL LAW JOURNAL418
income thresholds that are generally indexed annually to inflation.42 In addition, those filing taxes may claim a basic personal amount (also indexed) as exempt, which effectively creates a fifth (zero) rate bracket. In 2008, the last year for which such information is available, 31% of the almost 25 million persons who filed federal personal income tax returns actually ended up with an increase in their total income, receiving $12.1 billion in net transfers or the equivalent of 11.6% of their total pre-tax income.43 Another 12% of those filing taxes ended up with the same income before and after tax, neither paying tax nor receiving a transfer. In other words, no net income tax revenue flowed to the government from 43% of those filing personal income tax returns. The principal reason is the existence of two major refundable tax credits–the CCTB and the GST credit. In the absence of these credits, only 1.7 million of the 7.7 million people who were net gainers from filing income tax returns would have ended up in this position.
The major redistributive effect of the federal personal income tax is attribut-able to its progressive rate structure. Overall, the net effect of the federal personal income tax system was to reduce the Gini coefficient by about 8% (from .5197 to .4764), with 71% of this effect attributable to the rate structure (including the zero-rate bracket applied to the basic personal amount), and the balance due mainly to the CCTB and GST credits. Furthermore, the progressive distribu-tional impact of the tax rate structure is entirely attributable to its direct impact on tax payable (that is, those with higher incomes pay tax at higher rates), because the indirect interaction of the rate structure with the structure of deductions (including the exclusion of half of capital gains from income) actually produced a small increase in the Gini coefficient. Tax credits other than the basic personal amount, the CCTB and the GST credit, contributed little to the overall progres-sivity of the tax system because the basic personal amount must be claimed before other credits, and tax filers may not owe enough tax to utilize fully non-refundable credits.
42. Many elements of the personal income tax structure are indexed to Consumer Price Index inflation. Most indexed changes take effect on January 1. These changes include bracket thresholds and several largely non-refundable credits, including the basic personal allowance, seniors allowance, dependants allowance, disability allowance, child care expenses, and medical expenses (which in some instances may result in a refundable amount). However, the two major refundable credits–the CCTB (including two add-on credits, called the national child benefit supplement and the child disability benefit) and the GST credit (which also includes some supplemental credits for children, for example) take effect on July 1, the beginning of the program year for payment of these benefits.
43. For the results reported in this and the next paragraph, see Canada, Department of Finance, Tax Expenditures and Evaluations 2011 (Ottawa: Department of Finance, 2012).
BIRD & ZOLT, TAXATION AND INEQUALITY IN CANADA AND THE UNITED STATES 419
In sum, Canada’s federal personal income tax system (which in these respects is almost completely mimicked by provincial income taxes) both delivers substantial transfer income through refundable credits to lower-income Canadians, particularly those with children, and imposes mildly progressive taxes on those with higher incomes. Since the federal personal income tax accounted for only 47.9% of federal revenues in the 2008/09 fiscal year, and federal and provincial personal income taxes combined accounted for only 29.5% of all own-source government revenue, however, the distributional effect of the entire tax system may be different.44
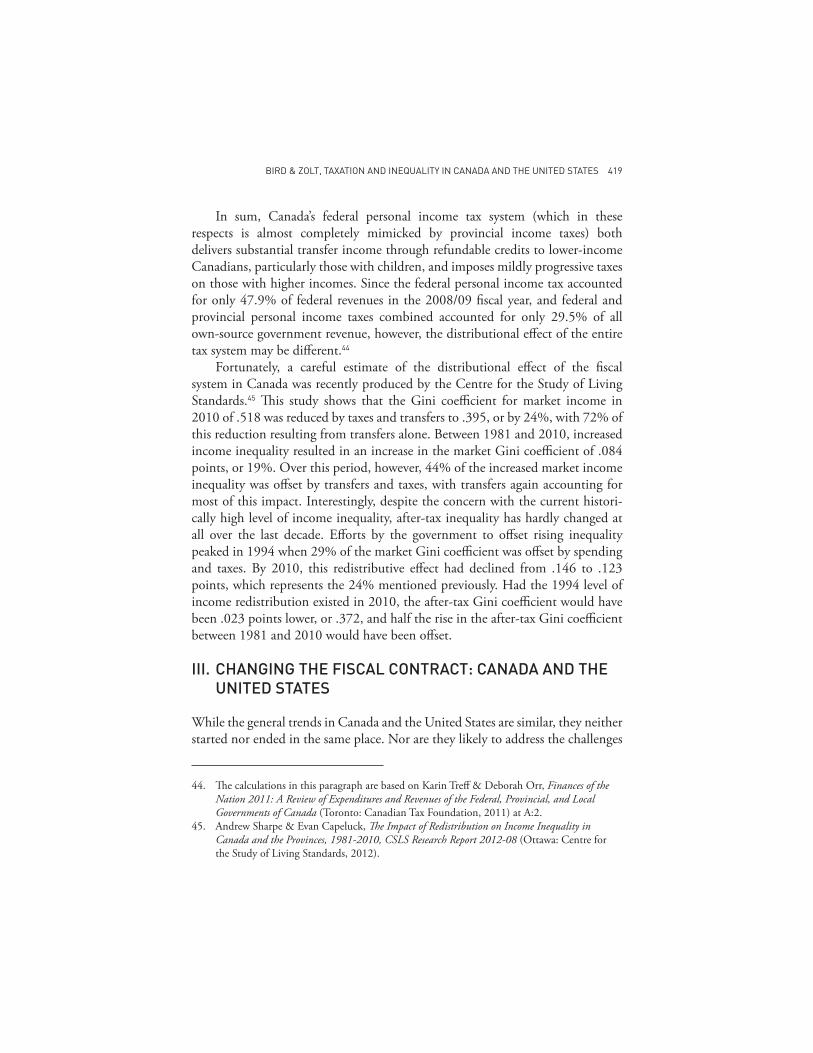
Fortunately, a careful estimate of the distributional effect of the fiscal system in Canada was recently produced by the Centre for the Study of Living Standards.45 This study shows that the Gini coefficient for market income in 2010 of .518 was reduced by taxes and transfers to .395, or by 24%, with 72% of this reduction resulting from transfers alone. Between 1981 and 2010, increased income inequality resulted in an increase in the market Gini coefficient of .084 points, or 19%. Over this period, however, 44% of the increased market income inequality was offset by transfers and taxes, with transfers again accounting for most of this impact. Interestingly, despite the concern with the current histori-cally high level of income inequality, after-tax inequality has hardly changed at all over the last decade. Efforts by the government to offset rising inequality peaked in 1994 when 29% of the market Gini coefficient was offset by spending and taxes. By 2010, this redistributive effect had declined from .146 to .123 points, which represents the 24% mentioned previously. Had the 1994 level of income redistribution existed in 2010, the after-tax Gini coefficient would have been .023 points lower, or .372, and half the rise in the after-tax Gini coefficient between 1981 and 2010 would have been offset.
III. CHANGING THE FISCAL CONTRACT: CANADA AND THE UNITED STATES
While the general trends in Canada and the United States are similar, they neither started nor ended in the same place. Nor are they likely to address the challenges
44. The calculations in this paragraph are based on Karin Treff & Deborah Orr, Finances of the Nation 2011: A Review of Expenditures and Revenues of the Federal, Provincial, and Local Governments of Canada (Toronto: Canadian Tax Foundation, 2011) at A:2.
45. Andrew Sharpe & Evan Capeluck, The Impact of Redistribution on Income Inequality in Canada and the Provinces, 1981-2010, CSLS Research Report 2012-08 (Ottawa: Centre for the Study of Living Standards, 2012).
(2015) 52 OSGOODE HALL LAW JOURNAL420
posed by increased inequality in the same way. Canadians may view themselves as more European than American in their approach to fiscal policy, but in reality the picture is more complicated. The United States may be more successful in using its tax system to reduce income inequality than Canada because of its heavy reliance on a relatively progressive personal income tax rather than taxes on consumption.46 In Canada, changes are more likely to occur outside the tax system through such measures as minimum wage policy, improving access to early childhood education, or changing transfers financed more by increased consumption taxes. Whether and to what extent either approach will prove to be more effective in reducing inequality in terms of real disposable income, let alone remain sustainable over time, remains to be seen.
Many discussions of taxation and inequality focus primarily on the rich (the top quintile, or even the top 1%) and the poor (say, the bottom two quintiles). Under a fiscal contract approach, however, the most important group may be the middle or upper-middle class (say, the bulk of the population between the poor and the top 1% or 10% of the income distribution). This group is especially important in countries like the United States and Canada where the “hollowing out” of the middle class, and its increasing vulnerability, have been the focus of much recent attention.47
Even the sharp recent increase in inequality may not result in any fundamental change in the basic values that presumably underlie the social contract and its fiscal manifestation in either Canada or the United States. The evidence suggests that such value systems are surprisingly deep-seated and stable attributes of
46. Perhaps unsurprisingly, The Fraser Institute study focused on this characteristic of the US tax system. See Clemens, Veldhuis & Murphy, supra note 8.
47. For the United States, see Tatjana Meschede et al, Tracking the Decline: Middle-Class Security in the 2000s (Washington: AARP Public Policy Institution, 2013). See also David A Green & Benjamin Sand, “Has the Canadian Labour Market Polarized?” (April 2013) Canadian Labour Market and Skills Researcher Network working paper 133, online: <www.clsrn.econ.ubc.ca/workingpapers.php>. Green and Sand discuss a similar hollowing out of the occupational structure in Canada. Almost every study or commentator seems to have a different definition of the middle class. See e.g. Anthony B Atkinson & Andrea Brandolini, “On the Identification of the ‘Middle Class’” (September 2011) Society for the Study of Economic Equality working paper 2011-217, online: <www.economicswebinstitute.org/essays/middleclass.pdf>. It is by no means always clear what people have in mind when they use the term “middle class.” We use it here generally, in a way similar to that of the World Bank, to mean those below the top decile of the income distribution who have sufficient income to maintain a basic middle-class standard of living and some degree of resilience to economic shocks (e.g., in the form of savings and assets). See Fernando H G Ferreira et al, Economic Mobility and the Rise of the Latin American Middle Class (Washington: The World Bank, 2013).
BIRD & ZOLT, TAXATION AND INEQUALITY IN CANADA AND THE UNITED STATES 421
societies. The most relevant comparison for both Canada and the United States is to countries that occupy more or less the same value territory in a cultural map bounded by two major axes: the “traditional versus secular-rational” value dimension and the “survival versus self-expression” value dimension.48 These countries are found in the Anglo-American group (Australia, Canada, the United Kingdom, the United States, and New Zealand), rather than the Nordic group (Denmark, Finland, Norway, and Sweden), which ranks equally high on the “self-expression” scale but decidedly higher on the “secular-rational” scale.49
Despite the overwhelming influence of the United States on Canada’s economy, society, and polity, and despite the general similarity of the two countries, Canadians do not have the same value system as Americans.50 Although substantial value differences exist between different groups within each country, and linguistic and regional differences often seem to dominate politics in Canada, Canadians as a whole appear to be more in agreement on their basic values than Americans.51 The apparently greater consensus on values within Canada may be one reason why Brooks and Hwong find that Canada almost always scores higher than the United States in terms of the social indicators they consider. Moreover, the substantial fiscal consolidation achieved in the 1990s suggests that it may be
48. For the full map, see Ronald Inglehart & Christian Welzel, “Changing Mass Priorities: The Link between Modernization and Democracy” (2010) 8:2 Perspectives on Politics 551 at 553-54. The authors summarize a large number of studies of values. The move from traditional to what the authors label “secular-rational” values is associated with the shift from a static agrarian society to a changing modern society. Similarly, the increasing prosperity resulting from this shift is also associated with decreased concern with survival and greater concern with self-expression. More ‘developed societies’ like the United States and Canada are thus clustered in the upper-right quadrant of the map.
49. Inglehart and Welzel do not include Ireland in their ‘English-speaking’ dataset. See ibid. Brooks and Hwong do include it in their ‘Anglo-American’ group, as do we in Table 1, above. See Brooks & Hwong, supra note 2.
50. Inglehart and Welzel, who make a strong case that such ‘national’ values are shared to a surprisingly great degree between ‘publics’ and ‘elites’ alike, place Canada significantly higher on the “secular-rational” scale than the United States, essentially because of the much greater importance of religion in the United States. See Inglehart & Welzel, supra note 48. However, as Kenneth Sokoloff and Eric Zolt suggest, it is far from clear that this argument can be extended backward in time. See Kenneth L Sokoloff & Eric M Zolt, “Inequality and Taxation: Evidence from the Americas on How Inequality May Influence Tax Institutions” (2006) 59:2 Tax L Rev 167.
51. For example, Adams shows that Canadian values, whether in Quebec or Alberta, are closer to those in New England than any other American region, and that on the whole the United States, especially in the west and south, is much more traditional in its values than any region in Canada. See Adams, supra note 1 at 81. Sokoloff and Zolt discuss the persistence of this regional difference within the United States. See Sokoloff & Zolt, supra note 50.

(2015) 52 OSGOODE HALL LAW JOURNAL422
easier for Canadians than for their neighbours to the south to agree on how to revise the underlying fiscal contract in the face of changing circumstances.52
What are the opportunities and alternatives going forward? The first step is to identify clearly the relative priorities among reducing inequality, reducing poverty, increasing economic mobility, and the nebulous goal of shoring up the middle class. In a world of relatively limited resources, governments need to make difficult choices and, given the concentration of recent income growth at the very top of the income distribution in both countries,53 the appropriate tax and spending policies will differ depending on the weight given to each of these objectives.
The main driver of income inequality is differentials in market income, and the current level of these differentials will almost certainly swamp any politically feasible tax increases on the wealthy in both countries. Current US spending policies, including spending through the tax system, have reduced inequality among the elderly at a substantial cost, but have done much less for reducing inequality among the rest of the population. Absent major changes in tax and entitlement policies, the United States will continue to have a tax and spending system that results in substantial cross-subsidies among middle- and upper-income taxpayers while providing inadequate resources and opportunities to those at the bottom of the income distribution.54 Aggregate spending programs will likely become less progressive as non-means tested transfers to the elderly continue to grow faster than transfers targeted at the poor. On the tax side, absent additional tax increases on the wealthy, the tax system will likely become less
52. In the late 1980s and early 1990s, Canada’s federal government (under successive Conservative and Liberal regimes) implemented a major process of fiscal consolidation, ending twenty-seven years of deficits and beginning eight successive years of budget surpluses. Moreover, although market incomes became more unequal over this period, disposable incomes actually became less unequal as a result of the combination of spending cuts and tax increases used to accomplish this budget turnaround, which has been called “one of the most spectacular fiscal turnarounds in recent economic history.” See Marcelin Joanis & Edgard Rodriguez, “Policy Redistribution and Inequality in a Period of Fiscal Consolidation: A Decomposition Analysis for Canada in the 1980s and 1990s” (2013) 32:2 Economic Papers: J Applied Econ & Pol’y 218 at 218.
53. See Facundo Alvaredo et al, “The Top 1 Percent in International and Historical Perspective” (2003) 27:3 J Econ Perspectives 3.
54. To remedy this may require, among other changes, limiting or eliminating tax subsidies for health, retirement, housing, and education benefits. Base-broadening will generate new winners and losers that will change the distribution of the tax burden. See e.g. Samuel Brown, William Gale & Adam Looney, “On the Distributional Effects of Base-Broadening Income Tax Reform” (August 2012), online: <www.taxpolicycenter.org/publications/url.cfm?ID=1001628>.
BIRD & ZOLT, TAXATION AND INEQUALITY IN CANADA AND THE UNITED STATES 423
progressive, primarily because revenues from social insurance taxes (which tend to be regressive) will increase faster than income tax revenues (which tend to be progressive).
Canada is likely at a better starting point despite the recent proliferation of relatively minor middle-class tax incentives. Though much could be done to improve both tax and transfer systems, Canada has made less use of tax subsidies for housing, retirement income, or healthcare than the United States. Such subsidies often disproportionately benefit the upper-middle- and upper-income taxpayers. Canada has also adopted more effective poverty-reducing transfers. Like Americans, with respect to poverty alleviation, Canadians appear to prefer better targeting to exclude from the welfare system those whom they believe should not be included. Moreover, middle-class voters may resist additional benefits to the poor unless such voters perceive some compensating gain to themselves, for example through increased tax relief for expenditures related to child welfare, education, and health. The tax and transfer system may be perceived by some middle-income taxpayers to be unfair, in that middle- or high-income individuals who incur additional living costs (to support children, for example) may be worse off than those with similar incomes who do not incur these costs (and, in some instances, perhaps even worse off than lower-income people who qualify for government support).
If governments in either country decide to give greater weight to increasing economic mobility, tax and spending policies should place greater emphasis on addressing inequalities of opportunities. While taxes can play a role in improving economic mobility (generally, through tax policies that foster growth, and specifi-cally, through such programs as targeted job credits and tax subsidies to encourage investment in education or investments in low-income areas), the major changes will fall on the spending side. Proposals, such as expanding pre-school programs, lengthening the school year, providing summer school opportunities for low-income children, improving the quality of teachers especially in low-income areas, and developing various teen and adult job-training programs all merit serious consideration.55 Improving human capital for those at the middle and, especially, the lower part of the income distribution is the key to reducing inequality over any extended period of time.
Programs aimed at reducing poverty and increasing economic opportunity could, of course, be funded by dramatically increasing the tax burden on the
55. Alan B Krueger, “Inequality, Too Much of a Good Thing” in Alan B Krueger & Benjamin M Friedman, eds, Inequality in America: What Role for Human Capital Policies (Cambridge, Mass: MIT Press, 2003) at 53.
(2015) 52 OSGOODE HALL LAW JOURNAL424
rich. If the major objective is to reduce inequality in income and wealth, taxes should play a major role in taking from the wealthy and redistributing to those at the middle and bottom of the economic ladder. Even if the aim is simply to distribute the cost of government more fairly and efficiently, a strong case can be made for higher taxes on those with high incomes.56 Proposals to increase the tax burden on the wealthy through higher income tax rates, eliminating or reducing preferences for capital gains, and taxing wealth more directly, all seem to merit consideration in both countries. However, assuming that policy-makers can somehow address the political and economic challenges that make tax increases difficult,57 even substantial increases in taxes on the wealthy will have relatively little effect on income distribution. Whether increased taxation of the top 1%, or even the top 10%, is achievable is more a matter of politics than of economics. But even if this goal is achieved, the amount of reduction in the Gini coefficient and the effects on poverty reduction and economic mobility will likely be relatively small.
As in the Nordic countries, the best way to finance more progressive spending programs in both the United States and Canada may be with less progressive, or even regressive, taxes.58 A broad-based consumption tax, such as an improved version of the Canadian value-added tax59 or perhaps even a carbon tax, would provide a significant source of revenue to fund spending programs and perhaps to reduce the amount of revenue required from income taxes.
The United States has a long tradition of low taxes and relatively small government. The United States still has relatively low taxes, but the level of social spending has expanded substantially, primarily because of the rapid growth in entitlement spending, which is largely attributable to rising healthcare costs. The United States has been able to maintain low taxes while financing at least a Canadian level of government social spending over the last decade largely because
56. Peter Diamond & Emmanuel Saez, “The Case for a Progressive Tax: From Basic Research to Policy Recommendations” (2011) 25:4 J Econ Perspectives 165.
57. One may wonder, for example, if any politician in Canada today would dare to advocate the restoration of the estate tax or indeed any form of wealth tax. Once such a tax has been removed, as it was in Canada in the 1970s, it may be harder to reverse that removal than to introduce a new tax (such as a value-added tax, VAT, in the United States).
58. On the history of financing the welfare state in Nordic countries, see Peter H Lindert, Growing Public: Social Spending and Economic Growth since the Eighteenth Century, vols 1-2 (Cambridge, UK: Cambridge University Press, 2004).
59. Jack Mintz and Stephen Richardson offer a recent examination of how to broaden the base and improve Canada’s federal VAT (the GST). See Jack Mintz & Stephen Richardson, After Twenty Years: The Future of the Goods and Services Tax (Toronto: Canadian Tax Foundation, 2014).
BIRD & ZOLT, TAXATION AND INEQUALITY IN CANADA AND THE UNITED STATES 425
of its ability to increase the level of government debt. This pattern seems unlikely to be sustainable.
In addition, while there is little evidence of much increased concern about the state of poor and nearly poor people in the United States, the combination of the prolonged housing crisis, high levels of personal debt, and increased job insecurity has clearly resulted in the growth of an increasingly vulnerable middle class whose interests may now be more closely aligned with those of the poor than at any time since the 1930s. While the political ramifications of this change are far from clear, it is possible that the long-run interest of both the poor and the middle class in the United States may be better served with a different fiscal menu that includes both higher taxes (including consumption taxes) and increased social transfers. To make any such increase in consumption taxes palatable to the middle-income groups that would have to pay most of them, greater explicit progressivity might also have to be introduced in the personal income tax system.60 It may also prove to be more acceptable in the United States to channel a large proportion of any increased social-spending transfers through universal tax expenditures or, less likely, universal transfers, rather than income-targeted direct or indirect transfers.
Though similar pressures may exist in Canada, they may be significantly less important for three reasons. Firstly, the effects of the recent economic crisis have been less damaging in Canada than in the United States. Secondly, taxes are already higher in Canada than in the United States. Lastly, the transfer system in Canada is already more effective in reducing poverty. Canada needs to pay more attention to direct-spending programs, particularly on education, both to increase the income and economic mobility of those at the bottom of the income distri-bution and to support the growth and competiveness of the country as a whole.
In both countries, any reforms introduced in response to changing circum-stances should ideally strengthen rather than further strain the fiscal contract. Governments in both countries need to consider carefully how to make the structure and the outcome of their tax and expenditure systems sufficiently acceptable to voters, to ensure that any revisions in the fiscal contract are supported widely and deeply enough to be sustainable.
60. In Canada, Veall suggests that an approach of increasing progressivity through limiting tax concessions is likely more effective than by simply increasing rates. See Veall, supra note 14. For a more recent discussion of income tax reform in Canada, see Kevin Milligan, “Tax Policy for a New Era: Promoting Economic Growth and Fairness” (Benefactor’s Lecture delivered at the CD Howe Institute, Toronto, 25 November 2014), online: <www.cdhowe.org/tax-policy-for-a-new-era-promoting-economic-growth-and-fairness/28070>.
(2015) 52 OSGOODE HALL LAW JOURNAL426
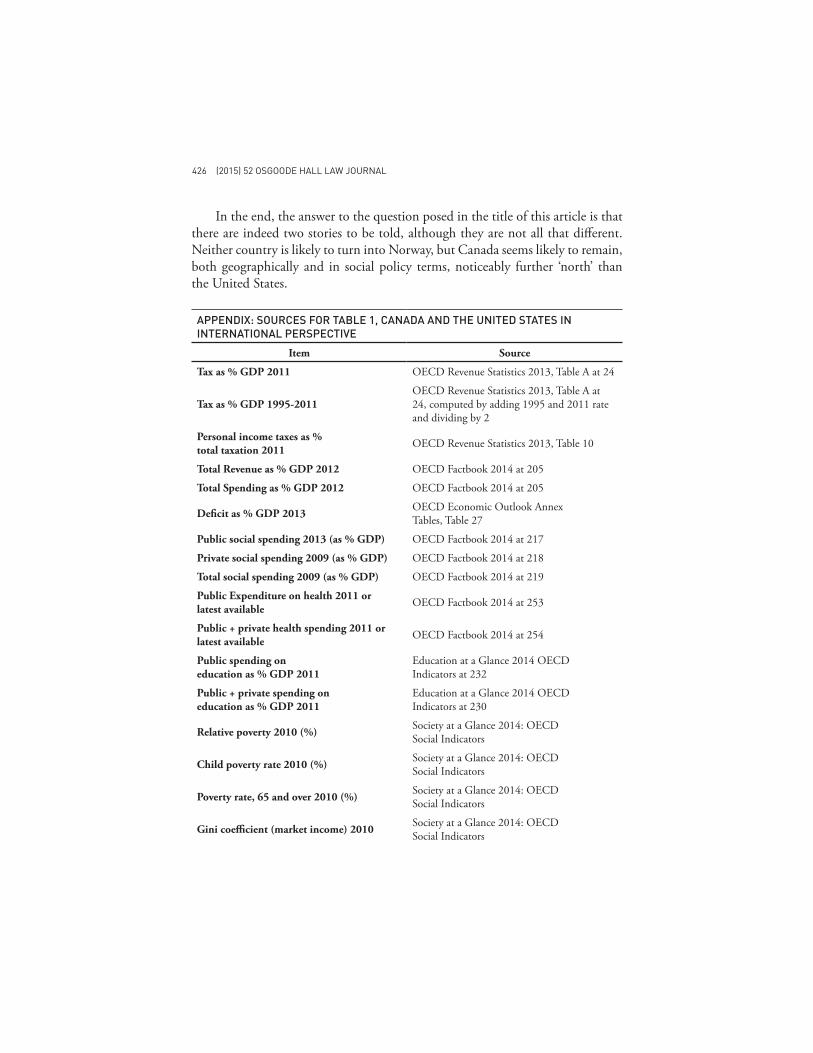
In the end, the answer to the question posed in the title of this article is that there are indeed two stories to be told, although they are not all that different. Neither country is likely to turn into Norway, but Canada seems likely to remain, both geographically and in social policy terms, noticeably further ‘north’ than the United States.
APPENDIX: SOURCES FOR TABLE 1, CANADA AND THE UNITED STATES IN INTERNATIONAL PERSPECTIVE
Item Source
Tax as % GDP 2011 OECD Revenue Statistics 2013, Table A at 24
Tax as % GDP 1995-2011OECD Revenue Statistics 2013, Table A at 24, computed by adding 1995 and 2011 rate and dividing by 2
Personal income taxes as % total taxation 2011 OECD Revenue Statistics 2013, Table 10
Total Revenue as % GDP 2012 OECD Factbook 2014 at 205
Total Spending as % GDP 2012 OECD Factbook 2014 at 205
Deficit as % GDP 2013 OECD Economic Outlook Annex Tables, Table 27
Public social spending 2013 (as % GDP) OECD Factbook 2014 at 217
Private social spending 2009 (as % GDP) OECD Factbook 2014 at 218
Total social spending 2009 (as % GDP) OECD Factbook 2014 at 219
Public Expenditure on health 2011 or latest available OECD Factbook 2014 at 253
Public + private health spending 2011 or latest available OECD Factbook 2014 at 254
Public spending on education as % GDP 2011
Education at a Glance 2014 OECD Indicators at 232
Public + private spending on education as % GDP 2011
Education at a Glance 2014 OECD Indicators at 230
Relative poverty 2010 (%) Society at a Glance 2014: OECD Social Indicators
Child poverty rate 2010 (%) Society at a Glance 2014: OECD Social Indicators
Poverty rate, 65 and over 2010 (%) Society at a Glance 2014: OECD Social Indicators
Gini coefficient (market income) 2010 Society at a Glance 2014: OECD Social Indicators
BIRD & ZOLT, TAXATION AND INEQUALITY IN CANADA AND THE UNITED STATES 427
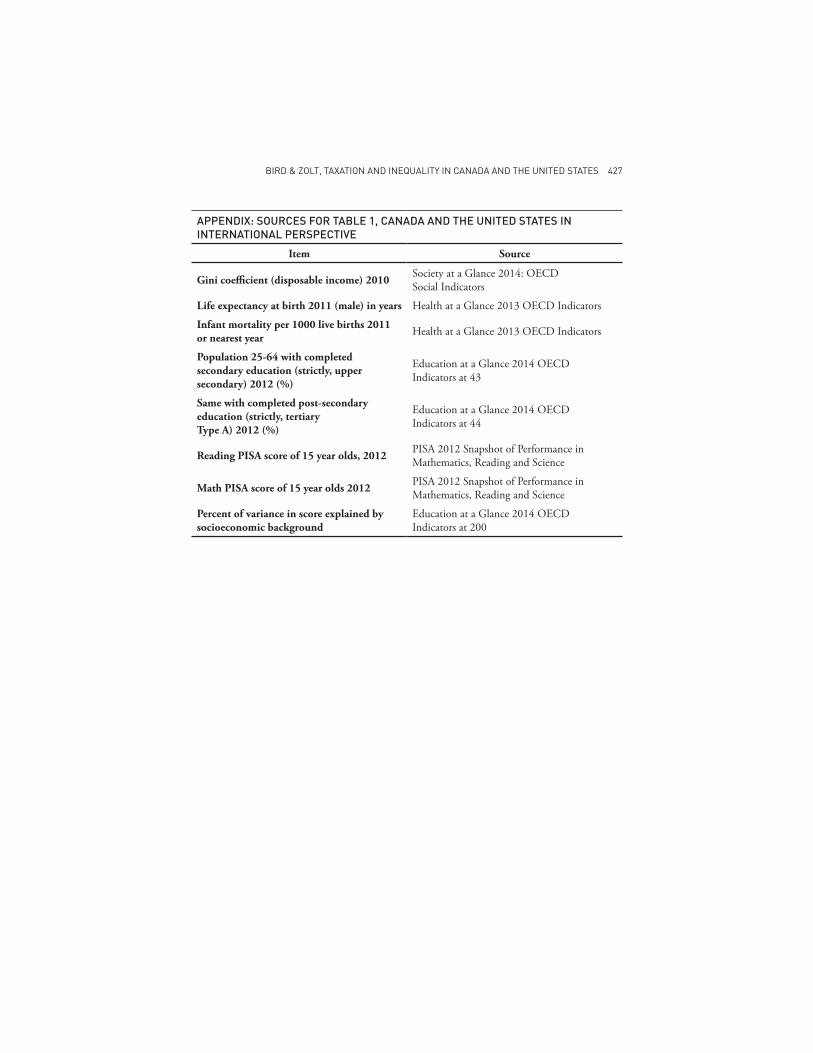
APPENDIX: SOURCES FOR TABLE 1, CANADA AND THE UNITED STATES IN INTERNATIONAL PERSPECTIVE
Item Source
Gini coefficient (disposable income) 2010 Society at a Glance 2014: OECD Social Indicators
Life expectancy at birth 2011 (male) in years Health at a Glance 2013 OECD Indicators
Infant mortality per 1000 live births 2011 or nearest year Health at a Glance 2013 OECD Indicators
Population 25-64 with completed secondary education (strictly, upper secondary) 2012 (%)
Education at a Glance 2014 OECD Indicators at 43
Same with completed post-secondary education (strictly, tertiary Type A) 2012 (%)
Education at a Glance 2014 OECD Indicators at 44
Reading PISA score of 15 year olds, 2012 PISA 2012 Snapshot of Performance in Mathematics, Reading and Science
Math PISA score of 15 year olds 2012 PISA 2012 Snapshot of Performance in Mathematics, Reading and Science
Percent of variance in score explained by socioeconomic background
Education at a Glance 2014 OECD Indicators at 200