Targeting the NG2/CSPG4 Proteoglycan Retards Tumour Growth and Angiogenesis in Preclinical Models of...
14
Targeting the NG2/CSPG4 Proteoglycan Retards Tumour Growth and Angiogenesis in Preclinical Models of GBM and Melanoma Jian Wang 1. , Agnete Svendsen 1. , Justyna Kmiecik , Heike Immervoll 1 2,3 , Kai Ove Skaftnesmo 1 , Jesu ´s Planaguma ` 1 , Rolf Ka ˚re Reed , Rolf Bjerkvig 4 1,5 , Hrvoje Miletic 1,2 , Per Øyvind Enger 1,6 , Cecilie Brekke Rygh 1,4" , Martha Chekenya 1 * " 1 Translational Cancer Research Group, Department of Biomedicine, University of Bergen, Bergen, Norway, 2 Haukeland University Hospital, Department of Pathology, Bergen, Norway, 3 The Gades Institute, University of Bergen, Bergen, Norway, 4 Heart and Circulatory Research Group, Haukeland University Hospital, Bergen, Norway, 5 Centre de Recherche Public de la Sante ´ , Luxembourg, Luxembourg, 6 Department of Neurosurgery, Haukeland University Hospital, Bergen, Norway Abstract Aberrant expression of the progenitor marker Neuron-glia 2 (NG2/CSPG4) or melanoma proteoglycan on cancer cells and angiogenic vasculature is associated with an aggressive disease course in several malignancies including glioblastoma multiforme (GBM) and melanoma. Thus, we investigated the mechanism of NG2 mediated malignant progression and its potential as a therapeutic target in clinically relevant GBM and melanoma animal models. Xenografting NG2 overexpressing GBM cell lines resulted in increased growth rate, angiogenesis and vascular permeability compared to control, NG2 negative tumours. The effect of abrogating NG2 function was investigated after intracerebral delivery of lentivirally encoded shRNAs targeting NG2 in patient GBM xenografts as well as in established subcutaneous A375 melanoma tumours. NG2 knockdown reduced melanoma proliferation and increased apoptosis and necrosis. Targeting NG2 in two heterogeneous GBM xenografts significantly reduced tumour growth and oedema levels, angiogenesis and normalised vascular function. Vascular normalisation resulted in increased tumour invasion and decreased apoptosis and necrosis. We conclude that NG2 promotes tumour progression by multiple mechanisms and represents an amenable target for cancer molecular therapy. Citation: Wang J, Svendsen A, Kmiecik J, Immervoll H, Skaftnesmo KO, et al. (2011) Targeting the NG2/CSPG4 Proteoglycan Retards Tumour Growth and Angiogenesis in Preclinical Models of GBM and Melanoma. PLoS ONE 6(7): e23062. doi:10.1371/journal.pone.0023062 Editor: Jun Li, Sun Yat-sen University Medical School, China Received February 11, 2011; Accepted July 11, 2011; Published July 29, 2011 Copyright: ß 2011 Wang et al. This is an open-access article distributed under the terms of the Creative Commons Attribution License, which permits unrestricted use, distribution, and reproduction in any medium, provided the original author and source are credited. Funding: We thank The Norwegian Cancer Society (grant PK01-2008-0093), The Meltzer Fond, Norges Forskningsra ˚ds FRIFORSK, Bergen Medical Research Foundation and Helse-Vest (grants 911382 and 911383) that supported our work. The molecular imaging platform and MRI performed in Trondheim was supported by the National Program for Research in Functional Genomics (FUGE), funded by the Norwegian Research Council. The funders had no role in study design, data collection and analysis, decision to publish, or preparation of the manuscript. Competing Interests: The authors have declared that no competing interests exist. * E-mail: [email protected] . These authors contributed equally to this work. " These authors also contributed equally to this work. Introduction GBM is the most common and aggressive brain tumour in adults, where the median survival after diagnosis is only 14.6 months [1,2], [3], despite advances in multimodal therapeutic options. This is partly due to diffuse invasion that invariably results in tumour recurrence, molecular and cellular heterogeneity that renders them therapy resistant. GBMs are characterised by florid angiogenesis, formed by leaky and variably perfused chaotic vasculature that results in tissue necrosis and high tumour interstitial pressure that further prevents the entry of cytotoxic agents. Thus, there is a major need for the development of local therapies that target the cell types that mediate this aggressive disease course. We have previously shown that a subpopulation of GBM cells express Neuron-glia 2 (NG2/CSPG4), also known as melanoma proteoglycan (MPG), a cell surface chondroitin sulphate proteo- glycan that is also expressed by numerous tissue specific progenitor cells during development. The CSPG4 gene encoding the NG2 proteoglycan, is turned off upon terminal differentiation, but is aberrantly re-expressed by several tumour types [4,5,6,7,8,9]. Shoshan and co-workers demonstrated NG2 expression in one out of five GBMs by immunoblotting [8], whilst we showed moderate to high expression in 6 out of 14 GBM biopsies from the tumour mass and confrontation edge by immunohistochemistry [5]. The discrepancies in these two studies are likely explained by the method of analysis and the small sample sizes. In agreement with our previous results, we recently demonstrated in 74 GBM biopsies that NG2 was highly expressed on tumour cells and angiogenic vessels in 50% of GBM patients, and was associated with significantly shorter survival outcomes. This effect of NG2 on poor survival was independent of age at diagnosis, treatment received and hypermethylation of the O 6 -methylguanine methyl- transferase (MGMT) DNA repair gene promoter (Svendsen et al., unpublished data). The association of high NG2 expression with an aggressive disease course may be mediated by its role in increasing cell proliferation, angiogenesis and treatment resis- tance[10,11], [12]. PLoS ONE | www.plosone.org 1 July 2011 | Volume 6 | Issue 7 | e23062
-
Upload
independent -
Category
Documents
-
view
5 -
download
0
Transcript of Targeting the NG2/CSPG4 Proteoglycan Retards Tumour Growth and Angiogenesis in Preclinical Models of...

Targeting the NG2/CSPG4 Proteoglycan Retards TumourGrowth and Angiogenesis in Preclinical Models of GBMand MelanomaJian Wang1., Agnete Svendsen1., Justyna Kmiecik , Heike Immervoll1 2,3
, Kai Ove Skaftnesmo1, Jesus
Planaguma1, Rolf Kare Reed , Rolf Bjerkvig4 1,5, Hrvoje Miletic1,2, Per Øyvind Enger1,6, Cecilie Brekke
Rygh1,4", Martha Chekenya1*"
1 Translational Cancer Research Group, Department of Biomedicine, University of Bergen, Bergen, Norway, 2 Haukeland University Hospital, Department of Pathology,
Bergen, Norway, 3 The Gades Institute, University of Bergen, Bergen, Norway, 4 Heart and Circulatory Research Group, Haukeland University Hospital, Bergen, Norway,
5 Centre de Recherche Public de la Sante, Luxembourg, Luxembourg, 6 Department of Neurosurgery, Haukeland University Hospital, Bergen, Norway
Abstract
Aberrant expression of the progenitor marker Neuron-glia 2 (NG2/CSPG4) or melanoma proteoglycan on cancer cells andangiogenic vasculature is associated with an aggressive disease course in several malignancies including glioblastomamultiforme (GBM) and melanoma. Thus, we investigated the mechanism of NG2 mediated malignant progression and itspotential as a therapeutic target in clinically relevant GBM and melanoma animal models. Xenografting NG2 overexpressingGBM cell lines resulted in increased growth rate, angiogenesis and vascular permeability compared to control, NG2 negativetumours. The effect of abrogating NG2 function was investigated after intracerebral delivery of lentivirally encoded shRNAstargeting NG2 in patient GBM xenografts as well as in established subcutaneous A375 melanoma tumours. NG2 knockdownreduced melanoma proliferation and increased apoptosis and necrosis. Targeting NG2 in two heterogeneous GBMxenografts significantly reduced tumour growth and oedema levels, angiogenesis and normalised vascular function.Vascular normalisation resulted in increased tumour invasion and decreased apoptosis and necrosis. We conclude that NG2promotes tumour progression by multiple mechanisms and represents an amenable target for cancer molecular therapy.
Citation: Wang J, Svendsen A, Kmiecik J, Immervoll H, Skaftnesmo KO, et al. (2011) Targeting the NG2/CSPG4 Proteoglycan Retards Tumour Growth andAngiogenesis in Preclinical Models of GBM and Melanoma. PLoS ONE 6(7): e23062. doi:10.1371/journal.pone.0023062
Editor: Jun Li, Sun Yat-sen University Medical School, China
Received February 11, 2011; Accepted July 11, 2011; Published July 29, 2011
Copyright: � 2011 Wang et al. This is an open-access article distributed under the terms of the Creative Commons Attribution License, which permitsunrestricted use, distribution, and reproduction in any medium, provided the original author and source are credited.
Funding: We thank The Norwegian Cancer Society (grant PK01-2008-0093), The Meltzer Fond, Norges Forskningsrads FRIFORSK, Bergen Medical ResearchFoundation and Helse-Vest (grants 911382 and 911383) that supported our work. The molecular imaging platform and MRI performed in Trondheim wassupported by the National Program for Research in Functional Genomics (FUGE), funded by the Norwegian Research Council. The funders had no role in studydesign, data collection and analysis, decision to publish, or preparation of the manuscript.
Competing Interests: The authors have declared that no competing interests exist.
* E-mail: [email protected]
. These authors contributed equally to this work.
" These authors also contributed equally to this work.
Introduction
GBM is the most common and aggressive brain tumour in
adults, where the median survival after diagnosis is only 14.6
months [1,2], [3], despite advances in multimodal therapeutic
options. This is partly due to diffuse invasion that invariably results
in tumour recurrence, molecular and cellular heterogeneity that
renders them therapy resistant. GBMs are characterised by florid
angiogenesis, formed by leaky and variably perfused chaotic
vasculature that results in tissue necrosis and high tumour
interstitial pressure that further prevents the entry of cytotoxic
agents. Thus, there is a major need for the development of local
therapies that target the cell types that mediate this aggressive
disease course.
We have previously shown that a subpopulation of GBM cells
express Neuron-glia 2 (NG2/CSPG4), also known as melanoma
proteoglycan (MPG), a cell surface chondroitin sulphate proteo-
glycan that is also expressed by numerous tissue specific progenitor
cells during development. The CSPG4 gene encoding the NG2
proteoglycan, is turned off upon terminal differentiation, but is
aberrantly re-expressed by several tumour types [4,5,6,7,8,9].
Shoshan and co-workers demonstrated NG2 expression in one out
of five GBMs by immunoblotting [8], whilst we showed moderate
to high expression in 6 out of 14 GBM biopsies from the tumour
mass and confrontation edge by immunohistochemistry [5]. The
discrepancies in these two studies are likely explained by the
method of analysis and the small sample sizes. In agreement with
our previous results, we recently demonstrated in 74 GBM
biopsies that NG2 was highly expressed on tumour cells and
angiogenic vessels in 50% of GBM patients, and was associated
with significantly shorter survival outcomes. This effect of NG2 on
poor survival was independent of age at diagnosis, treatment
received and hypermethylation of the O6-methylguanine methyl-
transferase (MGMT) DNA repair gene promoter (Svendsen et al.,
unpublished data). The association of high NG2 expression with
an aggressive disease course may be mediated by its role in
increasing cell proliferation, angiogenesis and treatment resis-
tance[10,11], [12].
PLoS ONE | www.plosone.org 1 July 2011 | Volume 6 | Issue 7 | e23062

Others have demonstrated high NG2 expression in 95% of
uveal melanomas [13], that it increased the metastatic potential of
melanomas, and soft tissue sarcomas [14,15], and mediated a poor
prognosis in childhood acute myeloid leukaemia (AML) pa-
tients[9]. Since NG2 is expressed on the surface of both tumour
cells and pericytes, it is an attractive candidate for simultaneously
targeting the malignant and stromal cellular compartments within
the tumour.
Several treatment approaches, such as anti-angiogenesis treat-
ment and viral gene therapies [16,17] have shown promising
results in preclinical models. However, only a fraction of the drug
candidates that show good results in animal studies is verified to
have a treatment effect in patients [16,18,19]. This lack of
correlation between effects observed in pre-clinical models and in
patients is largely due to limited cellular heterogeneity in syngeneic
animal tumours, smaller tumour burden due to their smaller
brains, altered growth characteristics [20,21], lack of invasive
tumour cells in most tumour models, and lack of appropriate
antigen profiles compared to human brain tumours. A novel
animal model of brain tumours has been developed in our
laboratory where patient GBM biopsies minimally propagated in
vitro as spheroids [20,21], [22] are implanted intracranially into
athymic rats[23]. As opposed to the well circumscribed, non-
invasive tumours established from GBM cell-lines, xenografts
established from tumour biopsy-spheroids show striking histolog-
ical and genetic features of the patient GBMs in situ, such as diffuse
invasion of the brain parenchyma, and cellular heterogeneity [22].
The aims of the present study were to investigate the mechanisms
of NG2 mediated malignant progression in multiple tumour
models and validate it as a cancer therapeutic target. We asked
whether abrogation of NG2/CSPG4 function with shRNAs
inhibited tumour growth in human GBM and melanoma
xenografts.
Results
NG2 overexpressing GBM tumours share characteristicsof patient GBM
To investigate the significance of NG2 on tumour growth, U251
GBM cells overexpressing its gene CSPG4, were xenografted into
nude rat brains and tumour progression compared to NG2
negative xenografts. NG2 expression enhanced the growth of the
tumours compared to the NG2 negative controls (Fig. 1) that were
smaller and showed a homogeneously high signal intensity on T1
weighted MRI after contrast agent injection (Fig. 1A1). The NG2
positive tumours were larger, exhibited MRI detectable central
necrosis and displayed similar characteristics to human GBMs in
situ (Fig. 1A2). Only obstructive cerebrospinal fluid (CSF) was
apparent in the NG2 negative tumours (Fig. 1A3), while peri-
tumoural oedema was most evident in the rapidly growing NG2
positive tumours, as shown by T2 weighted MRI (Fig. 1A4).
Indeed, quantification of the solid tumour tissue and oedema
revealed a significantly slower growth rate of the NG2 negative
tumours, with mean volumes approximately 25% of those of NG2
positive tumours (Fig. 1D). NG2 expression resulted in more
necrosis, numerous and dilated vessels (Fig. 1B1, right panel,
arrowheads), in contrast to the NG2 negative tumours (Fig. 1B1,
left panel). Examination of the invasive edges in these tumours
revealed microsatellite invasion of the brain parenchyma by
positive NG2 tumour cells. U251-Wt tumours were uniformly
NG2 negative (Fig. 1B2, left panel), except for expression on
oligodendrocyte progenitors in normal brain (Fig. 1B2, insert). To
clarify whether the alterations in vascular morphology were also
accompanied by functional changes, we estimated microvascular
parameters such as permeability, fractional blood volume and
elimination rate of contrast agent, as well as the extent of
vasogenic oedema. There was a significant increase in tumour and
oedema volumes in the U251-NG2 compared to the U251-wt
tumours (Fig. 1D left; p,0.05) indicating rapid growth and
increased oedema. The vascular parameters were determined
from pharmacokinetic models of tracer concentration/time curves
where the initial up-slope of the curve is representative of D0, the
peak of the curve correlates to (D1), and the decay phase of the
curve is representative of the (K2) (wash out of the tracer; Fig. 1C).
Indeed, blood-tissue permeability (D1) was significantly elevated in
the NG2 positive tumours, (Fig. 1D; Mann Whitney Test;
p = 0.0317) which is also consistent with the increased oedema.
Likewise, the fractional blood volume, (D0), which is a measure of
angiogenesis, was also significantly elevated in the NG2 positive
tumours (Fig. 1D; Mann Whitney Test; p = 0.0159). However,
there was no significant difference in the washout of tracer (K2)
from tumour tissue of NG2 positive and negative tumours (Fig. 1D;
Mann Whitney Test; p = 0.73). These results are corroborated by
similar findings from our previous study [24], in which we
compared high and low molecular weight tracers and implement-
ed two different pharmacokinetic models [25–26] to quantify
tumour vessel permeability for larger molecules.
The biological effects of NG2 knockdown in patient GBMxenografts
Reduction of tumour growth. To demonstrate that these
biological effects were due to NG2 function, we sought to disrupt its
expression in GBM biopsy xenografts derived from two different
patients using intratumoural delivery of lentivirally encoded
shRNAs. We have previously verified that these lentivirally
encoded shRNAs successfully abrogate NG2 expression and
function [12]. MR imaging of patient 3 (P3) donor revealed a
GBM with characteristics typical of the diagnosis, i.e. large areas
affected by vasogenic oedema illustrated on T2 weighted images
(Fig. 2A1) heterogeneous contrast enhancement and necrosis on T1
weighted images after administration of gadodiamide (Fig. 2A4).
The heterogeneity of enhancement reflects the presence of both
highly vascularised regions with leaky vessels and necrosis within the
same tumour (Fig. 2A4). Animals treated with control shRNAs
exhibited similar MR features as the patient (Fig. 2A2 and 2A5) as
well as shift of midline structures and obstructive CSF due to the
expansive tumour mass (Fig. 2A2). The NG2 shRNA treated
animals had smaller lesions with minimal MR signal intensity
alterations in the tumour compared to NG2 expressing tumours
(Fig. 2A3 and 2A6). The mean tumour volume in the control shRNA
treatment group was significantly larger than in the NG2 shRNA
treated group, where additionally, not all animals developed MR
detectable tumours (i.e. 3 out of 8, Fig. 2B left boxes, p = 0.015, two-
tailed t-test). High NG2 levels led to increased lesion volumes that
included the solid tumour and the peritumoural oedema (Fig. 2B
right boxes p = 0.015, Students t-test). However, at end-stage, there
was no significant difference in tumour cell proliferation (Fig. 2C,
p.0.05), or apoptosis (Fig. 2D, p.0.05) of the animals treated with
control and NG2 shRNAs.
Reduction of angiogenesis and increased tumour
invasion. Characteristically, the P3 GBM was highly heteroge-
neous with pleomorphic nuclei, microvascular proliferations and
regions with pseudopalisading necrosis (Fig. 3A1). The invasive edge of
the patient biopsy revealed diffuse invasion of tumour cells into the
brain parenchyma (Fig. 3A2). The histological features of control
shRNA and NG2 shRNA treated P3 xenograft tumours were in
accordance with the MR images (inserts in Fig. 3B1, Fig S11 and
videos S1 and S2), showing tumour mass effect that induced shift of
NG2(CSPG4) and Angiogenesis in Glioblastoma
PLoS ONE | www.plosone.org 2 July 2011 | Volume 6 | Issue 7 | e23062

NG2(CSPG4) and Angiogenesis in Glioblastoma
PLoS ONE | www.plosone.org 3 July 2011 | Volume 6 | Issue 7 | e23062

the midline structures (determined by ventricular compression and
sulcal effacement) (Fig. 3B1). The NG2 expressing tumours were
highly cellular, contained pseudopalisading necrosis with surrounding
pyknotic cells (Fig. 3C1) and numerous small and large vessels
(Fig. 3D1). In contrast, the NG2 shRNA treated tumours frequently
exhibited bilateral and microsatellite lesions that did not enhance
contrast on T1 weighted images (Fig. 3B2, Fig S12 and videos S1 and
S2). Despite their dense cellularity, fewer and smaller vessels were
detected in these tumours (Fig. 3C2 and 3D2), where quantification of
the vascular area fraction and vascular density proved that the NG2
shRNA treated tumours were significantly less vascularised
(microvascular area fraction, p = 0.006 t-test, and microvascular
density, p = 0.010 t-test, respectively, Fig. 3E, left and right panels,
respectively), compared to the NG2 positive tumours. The area
fraction that was NG2 positive was significantly reduced in the NG2
shRNA treated tumours compared control shRNA treated tumours
(Fig. 3F1-2 and 3G left panel, p = 0.0003, t-test). The number of NG2
positive tumour microvessels was also significantly reduced by the
NG2 shRNAs compared to control shRNA treated tumours (Fig. 3F1-
2 and 3G right panel, p = 0.0025 t-test). The reduction in NG2 positive
microvasculature was similar to the reduction in vWF positive vessels
in the NG2 shRNA treated tumours. The differences in tumour
vasculature were also reflected in the change in contrast enhancement
ratio (i.e. the signal intensity ratio between the tumour and healthy
brain tissue). Control shRNA treated tumours had a significantly
higher contrast ratio between the tumour and brain tissue on T1-
wighted MRI images after contrast agent injection (Fig. 3H,
p = 0.032), indicating greater vessel permeability compared to the
vasculature from NG2 shRNA treated tumours. Although the NG2
shRNA treated animals had a median survival of 82 compared to 73
days of the control shRNA treated animals, this difference was not
significant (Fig. 3I, p = 0.3; Log-Rank test).
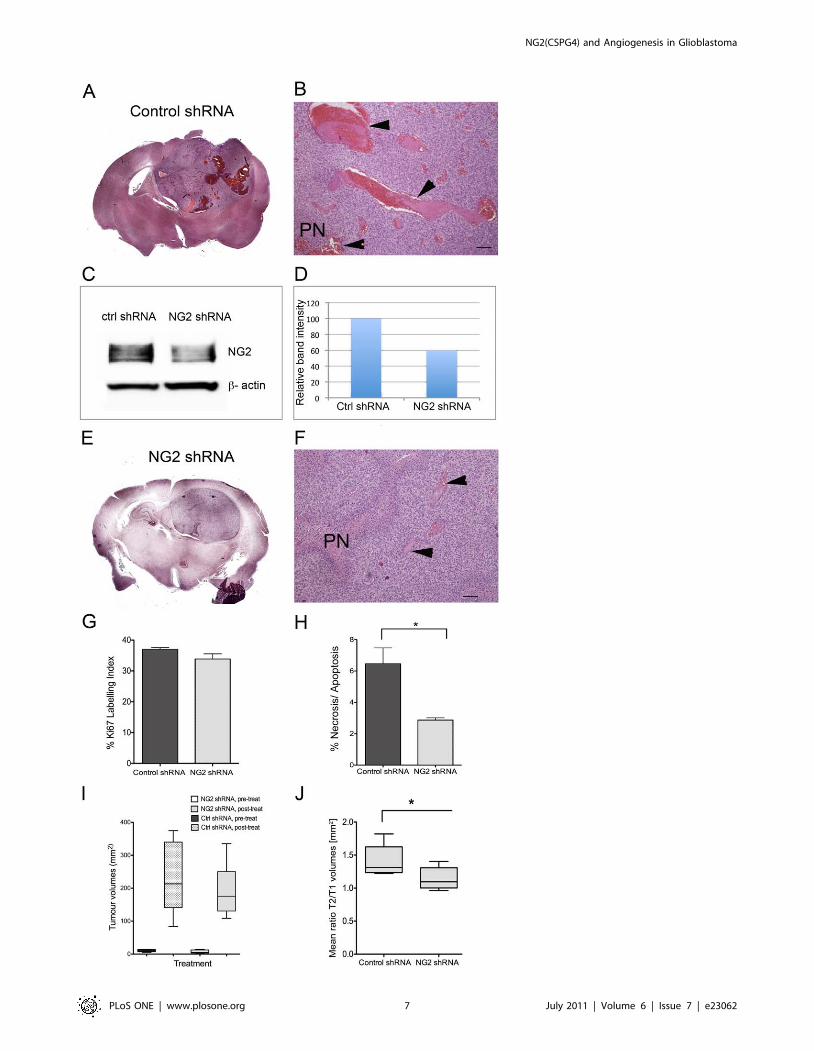
Reduction of haemorrhagic vessels and vasogenic
oedema. GBMs are characterized by high intra- and inter-
tumoural heterogeneity, hence the moniker ‘‘multiforme’’. Therefore
we sought to validate our findings from P3 by investigating GBM
xenografts derived from another patient, (P13) which predominantly
expressed NG2 on the tumour vasculature. The tumours treated with
control shRNAs were highly angiogenic, indicated by the presence of
large, leaky and haemorrhagic vessels, with morphological features of
‘‘vascular lakes’’, (Fig. 4A and B, arrowheads). In contrast to control
shRNAs, treatment with NG2 shRNAs reduced NG2 expression
(Fig. 4C and D), and resulted in morphologically smaller and less
haemorrhagic vessels (Fig. 4E and DF, arrowheads). Although
treatment with NG2 shRNAs did not change the tumour cell
proliferation (Fig. 4G), it significantly reduced the amount of cell
death (p = 0.02, t-test, Fig. 4H). Treatment with NG2 shRNA had no
effect on solid tumour volumes as measured by T1 weighted post
contrast MRI, Fig. 4I, or overall survival (p = 0.5, Log-Rank test).
However, it significantly reduced levels of vasogenic oedema
compared to control shRNA treated tumours as indicated by the
ratio of lesion volume (T2-weighted)/solid tumour volume (T1-
weighted), p = 0.043, t-test, Fig. 4J.
Increased vascular reabsorption, decreased plasma
volume and vascular normalization. The reduction in large
haemorrhagic vessels and vasognic oedema after treatment with
NG2 shRNAs led us to hypothesise that targeting NG2 normalises
vascular function. T1 weighted MRI revealed that the control
shRNA treated tumours had numerous discrete regions with
greater contrast enhancement (Fig. 5A) compared to the NG2
shRNA treated tumours (Fig. 5B). These regions corresponded to
the haemorrhagic and leaky vessels observed in the histological
sections. To investigate whether the alterations in vascular
morphology were also accompanied by functional changes, we
employed dynamic contrast enhanced MRI (DCE-MRI) and
pharmacokinetic models to estimate microvascular parameters
such as elimination rate of contrast agent and plasma volume
fraction. Treatment with NG2 shRNAs significantly increased the
transfer of contrast agent from the extracellular space to the
plasma, (Kep) compared to control shRNA treated tumours
(p = 0.018, t-test, Fig. 5C, D and G). Furthermore, this treatment
reduced the fractional plasma volume (Vp) in the tumour
compared to control shRNAs, although this difference was not
statistically significant (p = 0.17, t-test, Fig. 5E,F and H). The
tracer signal intensity/time curves from the control and NG2
shRNA treated tumours (Fig. 5I) reveal four distinct phases; an
initial step representing (vascular filling), slope (perfusion and
permeability), maximum enhancement (leakage space) and
washout. Muscle tissue was used as control in the analyses to
verify that the animals received similar doses of the tracer and
showed similar contrast enhancement patterns in both treatment
groups (Fig. 5I). The Ktrans transfer constant, which reflects
delivery of the contrast agent (by both perfusion and permeability),
was higher in the NG2 shRNA treated compared the control
shRNA treated tumours, although the difference was not
statistically significant (data not shown).
The control shRNA treated tumours contained larger, dilated
von Willebrand positive vessels compared to the NG2 shRNA
treated tumours (Fig. 5J, right and left panels, respectively).
Although the number of vessel elements was not significantly
different, Fig. 5K, the area fraction taken up by the vessels was
significantly larger in control shRNA treated tumours, (p = 0.04, t-
test, Fig. 5L) indicating that they were more dilated. P13
xenografts treated with control shRNAs expressed NG2 on
tumour cells but predominantly on the vessels (Fig. 5M, left
panel). Treatment with NG2 shRNA reduced NG2 expression
levels (Fig. 5M, right panels) although this was not statistically
significant, (Fig. 5N and O). These findings indicate that targeting
NG2 led to a partial normalisation of vWF positive tumour vessels,
both functionally and structurally. Taken together, our findings
from patient biopsy xenografts correlate with those from the cell-
line based tumour xenografts, indicating that NG2 function
Figure 1. Growth characteristics of NG2 negative and positive tumours. The upper panels show post-contrast T1-weighted MRI images ofU251-wt (A1), and U251-NG2 tumours (A2) and the corresponding T2 weighted images of U251-wt (A3) and U251-NG2 tumours (A4). (B) H&EComparisons of NG2 U251-Wt (B1, left panel) and U251-NG2 GBMs showing numerous leaky blood vessels, pleomorphic tumour cells and necrosis(B1, right panel). In the NG2 negative U251-Wt tumours (B2, left panel), expression was observed only on oligodendrocyte progenitors in normal brain(B2, insert), Invasive NG2 positive U251-NG2 tumour cells (B2, right panel). (C) Vascular parameters determined from pharmacokinetic models of tracerconcentration/time curves where the initial step and slope of the curve is representative of D0 (fractional blood volume), and D1 (blood-tissuepermeability), and the decay phase is representative of K2 (washout of tracer). Significant increased tumour and vasogenic oedema volumes of U251-NG2 tumours compared to U251-wt tumours (D, *p,0.05). Significant elevation of D1 (D, Mann Whitney U Test; *p = 0.0317) and D0 in the U251-NG2tumours (D, Mann Whitney U Test; *p = 0.0159) compared to U251-wt tumours. K2 levels in the NG2 positive and negative tumours (D, Mann WhitneyTest; p = 0.73). Scale bars in B1 = 100 mm, magnification 1006; scale bars in B2 = 100 mm, magnification 2006. N denotes necrosis; arrowheads: largevessels ‘‘vascular lakes’’.doi:10.1371/journal.pone.0023062.g001
NG2(CSPG4) and Angiogenesis in Glioblastoma
PLoS ONE | www.plosone.org 4 July 2011 | Volume 6 | Issue 7 | e23062

induces rapid tumour growth, angiogenesis, increased vessel
permeability and oedema, contributing to a more aggressive
disease progression.
NG2 knockdown in melanomas suppresses tumourgrowth and proliferation
Next, we validated the effect of NG2 knockdown on tumour
growth in orthotopic A375 melanoma tumours with high endo-
genous NG2 expression levels (A375-wt). Highly demarcated solid
tumours (Fig. 6A), with lymphatic vessel infiltration (Fig. 6B) were
established. The tumours were composed of polygonal atypical
cells showing moderate pleomorphic nuclei with prominent
eosinophilic nucleoli (Fig. 6C) and S-100 expression (Fig. 6D).
NG2 knockdown with NG2 shRNA significantly decreased
tumour growth compared to the control shRNA treated tumours
(Fig. 6E, Two-Way ANOVA F8.28, df = 13; p,0.0005,). At the
termination of the experiment A375 melanoma tumours treated
with NG2 shRNAs had a mean volume of 1120.66486.6 mm3
compared to 26906807.3 mm3 for those treated with control
shRNA and 3375.06866.1 mm3 for those injected with PBS
vehicle only. Immunohistochemical analyses confirmed high NG2
expression in the untreated parental and control shRNA treated
tumours (Fig. 6F and 6G, respectively). Tumour transduction with
NG2 shRNAs strongly reduced NG2 protein expression (Fig. 6H
and I) and decreased cell proliferation compared to the control
tumours (One-way ANOVA F9.259; df = 3; p = 0.0006; Fig. 6J). In
contrast, NG2 shRNA treatment induced greater cell death by
Figure 2. NG2 knockdown in patient biopsy GBM xenografts is associated with reduced tumour volume. MRI of the patient 3: T2weighted image (A1), and T1 weighted image post contrast administration (A4). Animals xenografted with P3 biopsy tissue from the same tumour, T2weighted (A2), and post-contrast T1 weighted images (A5). MRI of the NG2 shRNA treated animals T2 weighted images (A3), and T1 weighted images(A6). Tumour (B left boxes, *p = 0.015, t-test) and lesion volumes (B, right boxes, *p = 0.015, t-test) were significantly reduced in the NG2 shRNAtumours compared to the shRNA control tumours. Ki67 labelling in the NG2 shRNA tumours compared to the control shRNA tumours (C, p.0.05).Apoptosis/Necrosis measured by TUNEL staining was reduced in the NG2 knockdown tumours (D, p.0.05). Arrowheads in A2 and A3 indicate regionsof high signal intensity.doi:10.1371/journal.pone.0023062.g002
NG2(CSPG4) and Angiogenesis in Glioblastoma
PLoS ONE | www.plosone.org 5 July 2011 | Volume 6 | Issue 7 | e23062

apoptosis and necrosis that resulted in overall slower growing
tumours (One-Way ANOVA F37.53; df = 3; p = 0.0001; Fig. 6K).
Discussion
The prerequisite for successful translation of experimental data
to clinical practice is generation and validation in relevant model
systems. The present study sought to validate the role of NG2 in
malignant progression and its potential as a therapeutic target
using the available animal models for preclinical therapies. We
showed that NG2 expression affected several aspects of tumour
progression and that targeting it in GBM and melanoma
xenografts suppressed angiogenesis, and reduced tumour growth.
NG2 overexpression induced highly aggressive tumours charac-
terized by increased angiogenic and moderately invasive tumour
phenotypes. Indeed, larger areas with signal alterations on T2
weighted and increased contrast enhancement on T1 weighed MR
images showed that the NG2 positive tumours were more rapidly
growing, with disrupted blood brain barrier integrity, and
increased vascular volume fraction. We have previously used
two pharmacokinetic models [25,26] in studies of NG29s role in
tumour angiogenesis[24] in order to rule out model dependency
Figure 3. NG2 knockdown in GBM biopsy xenografts reduced angiogenesis and increased tumour invasion. Heterogeneous GBM insitu with pleomorphic nuclei, microvascular proliferations (arrowheads) and pseudopalisading necrosis (PN) (A1). Patient GBM cells diffusely invadingthe brain parenchyma (A2, scalebar = 100 mm). Expansive, control shRNA treated tumour (B, 1), Inserts: areas with increased T1 weighted signal postcontrast overlayed on T2 weighted MR images. NG2 shRNA treated tumours dissemination throughout the brain (B2). Pseudopalisading necrosis (PN),and large vessel sprouting (arrowheads) in the shRNA control treated tumours (C1) compared to NG2 shRNA treated xenografts (C2, arrowheads),scale bar = 100 mm). Immunostaining for vWF in control shRNA (D1) and NG2 shRNA treated tumours (D2), scalebar = 100 mm). Quantification of vWFpositive area fraction (**p = 0.006, t-test) and microvascular density (*p = 0.010, t-test) in control shRNA compared to NG2 shRNA treated tumours (E,left and right respectively), scale bar = 100 mm). NG2 positive vessels (brown) in control shRNA (F1) compared to NG2 shRNA (F2) treated tumours(scalebar = 100 mm). Quantification of NG2 positive area fraction (G, left panel, ***p = 0.0003, t-test) and microvascular density (G, right panel,**p = 0.0025 t-test) in control shRNA and NG2 shRNA treated tumours. Contrast ratio between tumour tissue and normal brain in T1 weighted postcontrast images in the control and NG2 shRNA treated tumour xenografts (H, *p = 0.032 t-test). Kaplan–Meier survival curves (I, p = 0.3; Log-Rank test).doi:10.1371/journal.pone.0023062.g003
NG2(CSPG4) and Angiogenesis in Glioblastoma
PLoS ONE | www.plosone.org 6 July 2011 | Volume 6 | Issue 7 | e23062
NG2(CSPG4) and Angiogenesis in Glioblastoma
PLoS ONE | www.plosone.org 7 July 2011 | Volume 6 | Issue 7 | e23062

when quantifying tumour microcirculation parameters. Similar
results from both methods using a high molecular weight tracer
indicated that the estimated differences in transcapillary exchange
between NG2-expressing compared to NG2 negative tumours
were indeed due to biological differences [24]. In the present work,
we used a low-molecular weight tracer that is approved for clinical
use in order to increase the translational relevance. The Tofts
model is the most commonly used model in both clinical and
preclinical settings and is recommended for use in early-stage
clinical trials [27]. However, as the Ktrans parameter is influenced
by both blood flow and blood-tissue permeability, and the
dominant factor is determined by the cause of the contrast agent
depletion in the tissue (i.e. permeability-limited or flow-limited
depletion)[26,27].
Increased vasogenic oedema was evident in the aggressive
U251-NG2 tumours that also had a more invasive phenotype
compared to the U251-Wt tumours. This finding was also
confirmed in the P3 and P13 GBMs, where the control shRNA
treated tumours exhibited higher levels of vasogenic oedema
compared to NG2 shRNA treated tumours. Oedema contributes
to morbidity and mortality, and is an independent predictor of
outcome for GBM patients [28]. Thus, our data and previous
studies published by others collectively establish NG2 as an
important factor contributing to the malignant progression.
Therapeutic strategies combining tumour and vascular targets
are hypothesized to be more successful than targeting either
compartment alone. As a membrane glycoprotein expressed on
tumour cells and pericytes, NG2 is an attractive candidate for
targeting both the tumour and angiogenic compartments within
the tumour. P3 GBM xenografts expressed NG2 on both tumour
cells and their angiogenic vessels and had a moderately invasive
phenotype. Disruption of NG2 function in these xenografts
significantly reduced tumour growth and angiogenesis by
approximately 70% and 50%, respectively. However, there was
no significant difference in cell proliferation and apoptosis
measured at end-stage. These histological data and the MRI
quantification showing reduced tumour volumes can be reconciled
by the fact that MRI was undertaken 2–3 weeks prior to
development of neurological symptoms. Indeed, three animals
that did not have MRI detectable tumours were shown at post-
mortem to harbour small, butterfly-like, non-angiogenic tumours.
Thus, at end-stage tumours from both treatment groups were in an
exponential growth phase characterised by rapid proliferation
rates, hence the lack of statistical significance on histological
analyses. Furthermore, tumour volume quantification by T1
weighted MRI alone may not always be accurate to define the
tumour mass in the absence of blood brain barrier disruption and
leakage of contrast agent[29]. Anti-angiogenic treatments may
reduce vascular permeability to contrast agents rather exerting
true anti-tumour effects[30,31,32]. We validated the effects on
vascular normalisation in GBM xenografts derived from another
patient, P13 that expressed NG2 predominantly on the highly
angiogenic vessels and exhibited a less invasive phenotype.
Targeting NG2 in these xenografts normalised the vasculature
both structurally and functionally. The large, haemorrhagic vessels
characteristic of the control shRNA treated P13 tumours became
less dilated and leaky after treatment with NG2 shRNAs. The
latter tumours exhibited functionally increased transcapillary re-
absorption from the extracellular space to the plasma and
concomitantly decreased oedema. Despite these dramatic effects
on tumour angiogenesis, disruption of NG2 function by gene
silencing did not result in significantly prolonged survival in
neither patient derived GBM xenografts. This finding in the P3
xenografts might be explained by the presence multiple invasive
tumour lesions in the brains of animals treated with NG2 shRNAs.
We hypothesize that antagonisation of angiogenesis increased
tumour invasiveness towards the cerebral ventricles and spread to
distant sites in the brain. Previous studies demonstrated increased
development of microsatellite tumours after inhibition of neo-
angiogenesis by monoclonal antibodies (mAb) against vascular
endothelial growth factor receptor-2 (VEGFR-2) [31,33] [30]. The
development of microsatellite tumours could be inhibited by
combined treatment with mAbs against epidermal growth factor
receptor [34], known to stimulate GBM migration and invasion
[35]. Indeed, Bevacizumab, a humanised mAb targeting VEGF
also decreases vascular permeability and increased invasion in
GBM patients [36]. We showed previously that although NG2
positive tumours were highly angiogenic, they did not depend
strongly on VEGF[37] but rather on diminished inhibition of
angiogenesis[10]. Nevertheless, our present findings are in line
with those of VEGF inhibition.
Disruption of NG2 function in the melanoma model resulted in
reduced proliferation, increased apoptosis and immune infiltration
by macrophages, plasma cells and histiocyte mediated granulo-
matous response (data not shown). Dying cells trigger inflamma-
tory responses in vivo, where the ensuing hyperemia results in
leakage of plasma proteins, and sustained recruitment of
leukocytes and macrophages. In contrast to the melanoma
tumours, NG2 shRNA treatment of both P3 and P13 GBM
xenografts did not significantly reduce tumour proliferation. We
postulate that this maybe due to normalisation of the angiogenic
vasculature as indicated by diminished leakage of the contrast
agent as detected by T1 weighted MR images. DCE-MRI with
pharmacokinetic modelling revealed increased tracer efflux from
the interstitium in the P13 tumours treated with NG2 shRNAs.
The finding of reduced oedema, decreased fractional plasma
volume fraction and area fraction of vWF positive vessels in both
patient GBMs further supports this finding. As previously
described, the Ktrans parameter is influenced by both tumour
vascular perfusion and permeability. Vascular normalisation
would increase tissue perfusion, leading to an increased Ktrans
parameter as we indeed observed. Moreover, the relatively small
change in the plasma volume fraction maybe due to the
contribution of blood flow that masks the true plasma volume
fraction in the NG2 shRNA treated tumours. Vessel normalisation
also improves oxygenation. Taken together, these factors would
contribute to increased tumour cell proliferation, reduced hypoxia
and necrosis. Indeed, P13 tumours treated with NG2 shRNAs had
Figure 4. NG2 knockdown in GBM xenografts reduced large, haemorrhagic vessels and vasogenic oedema. H&E stained compositeimage showing expansive, haemorrhagic and highly angiogenic P13 tumour treated with control shRNA (A). Large leaky vessels with phenotype of‘‘vascular lakes’’ in the control shRNA treated tumours (B, arrowheads, scale bars = 100 mm). Immunoblot showing NG2 expression after treatmentwith control shRNA (C) and NG2 shRNAs (D) in P13 tumour cells indicating knockdown. H&E stained composite image showing less vascular and non-haemorrhagic NG2 shRNA treated tumour (E). H&E showing pseudopalisading necrosis (PN), fewer and morphologically smaller vessels aftertreatment with NG2 shRNAs (F, arrowheads), scale bars = 100 mm). Ki67 labelling in the control and NG2 shRNA treated tumours (G, p.0.05 t-test). %Necrosis/Apoptosis measured by TUNEL staining was reduced in the NG2 knockdown tumours (H, *p = 0.02, t-test). Tumour volumes before and aftertreatment with control and NG2 shRNAs (I, p.0.05, t-test). The oedema levels measured by the ratio of the total lesion volume (T2 w signal change)/solid tumour volume (T1w post contrast signal change) (J) in the control and NG2 shRNA treated tumours (*p = 0.043).doi:10.1371/journal.pone.0023062.g004
NG2(CSPG4) and Angiogenesis in Glioblastoma
PLoS ONE | www.plosone.org 8 July 2011 | Volume 6 | Issue 7 | e23062

significantly reduced apoptotic cells indicated by TUNEL
labelling. In contrast to the GBM xenografts, NG2 shRNA
treatment may have drastically reduced neovascularisation in the
melanoma tumours, thereby cutting off oxygenation and nutrient
supply resulting in apoptosis and arrested cell cycle progression.
Although NG2 shRNAs did not prolong survival, its drastic effects
on vascular normalisation might make targeting NG2 expressing
cells useful as neo-adjuvant treatment in combination therapy to
permit more efficient delivery of systemically administered
chemotherapy drugs to the brain and to sensitise the tumours to
radiotherapy (RT). Vascular normalisation would sensitise to RT
by re-oxygenating the tumour. Hypoxia is known to promote
radioresistance by reducing cell cycle progression, thus increased
blood flow would promote tumour cell redistribution in the cell
cycle and thus sensitise them to IR. Increased blood flow might
also increase the bio-distribution of systemically administered
chemotherapy to the tumour. Reduced oedema would also reduce
tumour interstitial pressure that would prevent collapse of blood
vessels and permit appropriate perfusion of therapeutic agents
from the blood to the tumours extracellular space. Indeed, anti-
Figure 5. NG2 knockdown in GBM xenografts increased vascular reabsorption, decreased plasma volume and normalized tumourvasculature. Post-contrast T1 weighted images of representative animals xenografted with P13 biopsy tissue and treated with control shRNAs (A),or NG2 shRNAs (B). Kep maps representing efflux of gadodiamide contrast from the extracellular space to the plasma in representative animalstreated with control shRNAs (C) and with NG2 shRNAs (D). Fractional plasma volume maps in the same animals treated with control shRNAs (E) andwith NG2 shRNAs (F). Quantification of Kep (G, p = 0.018, t-test) and fractional plasma volume (H, p.0.05) in animals treated with control shRNAscompared to NG2 shRNAs. Vascular parameters determined from pharmacokinetic models of gadodiamide induced signal intensity change frombaseline/time curves from representative animals in C-F, where the initial step of the curve represents (vascular filling), the slope represents (flow andpermeability), the maximum enhancement represents (leakage space) and decay phase represents the washout of tracer (I). Immunostaining for vWFin control shRNA (J, left panel) and NG2 shRNA treated tumours (J, right panel), scalebar = 100 mm). Quantification of vWF positive microvasculardensity (K, p.0.05) and area fraction (L, p = 0.04, t-test) in control shRNA compared to NG2 shRNA treated tumours, scale bar = 100 mm). NG2 positivetumour cells and vessels in control shRNA treated (M, left panel) compared to NG2 shRNA treated tumours (M, right panel, scalebar = 100 mm).Quantification of NG2 positive microvascular density (N, p.0.05) and area fraction (O, p.0.05) in control shRNA and NG2 shRNA treated tumours,*p,0.05.doi:10.1371/journal.pone.0023062.g005
NG2(CSPG4) and Angiogenesis in Glioblastoma
PLoS ONE | www.plosone.org 9 July 2011 | Volume 6 | Issue 7 | e23062

NG2(CSPG4) and Angiogenesis in Glioblastoma
PLoS ONE | www.plosone.org 10 July 2011 | Volume 6 | Issue 7 | e23062

angiogenic compounds have been employed to normalize the
chaotic tumour vasculature resulting in more efficient delivery of
therapeutic substances to the tumour bed [32]. We showed
previously that NG2 expressing tumour cells were radio- and
chemo-resistant [37] [12]. Thus, targeting this cellular subpopu-
lation might result in overall sensitisation of the residual tumour to
further cytotoxic therapy.
Although gene therapy trials using lentiviral vectors at present
cannot be conducted in patients due to safety and bio-distribution
concerns. Delivery is a major challenge for viral gene therapy
strategies to the brain. Incomplete shutdown of NG2/CSPG4
mRNA translation in the total tumour mass by the lentivirally
delivered shRNA constructs, inappropriate timing of the treatment
with respect to tumour growth kinetics may have contributed to
the lack of survival advantage after treatment. Despite high viral
multiplicity of infectious units (MOI) greater than 56107/ml, NG2
was evidently expressed on a proportion of the angiogenic vessels
post shRNA transduction indicating incomplete target inhibition.
Multiple injections of the shRNA constructs, even higher viral
loads and reduced implanted tumour burden might enhance
NG29s inhibitory effects on tumour growth, potentiating greater
survival differences. The present study utilized this method of
delivery as a proof of principle approach to demonstrate that
abrogation of NG2 function by gene silencing diminishes tumour
growth and angiogenesis. Previous studies indicated that targeting
NG2 positive tumour cells using monoclonal antibodies (mAb)
conjugated to diphtheria toxin may have therapeutic potential
[12,38]. Future studies validating the combination of mAbs with
adoptively transferred immune cells are currently underway to
augment the anti-tumour effects of NG2 inhibition. The present
study validated NG2 as an amenable therapeutic target in several
relevant pre-clinical models of cancer. Since biological relevance
and reproducibility are not simultaneously present in the available
tumour models, we suggest that potential therapeutic targets, such
as NG2, are validated in a complementary panel of pre-clinical
cancer models to successfully determine their potential for clinical
translation.
Materials and Methods
Cell culture and GBM biopsy tissueThe human glioblastoma (GBM) cell line U251N (American
Type Culture Collection, Rockville, MD) was transfected with the
NG2 cDNA by calcium phosphate transfection using standard
protocols.The cells were propagated as multicellular spheroids in
medium supplemented with geneticin to maintain transgene
expression as previously described[10],[24]. U251-wt, U251-
NG2 and A375 human melanoma cells (American Type Culture
Collection, Rockville, MD) expressing high endogenous levels of
NG2 were propagated in vitro as previously described [12]. The
GBM biopsies were obtained from surgical resections performed at
Haukeland University Hospitals. The local ethical board (REK
Vest) and the Data Protection Agency in Norway approved the
collection of tumour tissue. Patients gave their informed consent to
specimen collection for research purposes and their samples were
analyzed anonymously.
Animals and Tumour implantationThe National Animal Research Authority in Norway approved
all animal experiments. Athymic nude rats (Han: rnu/rnu Rowett)
and NOD-SCID mice were used in the GBM and melanoma
studies, respectively. The animals were bred in an isolation facility
at 25uC (55% relative humidity) in a specific pathogen free
environment and animal husbandry protocols were maintained as
previously described[10]. The nude rats weighing approximately
100 g (4–6 weeks) were intracerebrally transplanted with parental
U251 (U251-wt), as well as NG2 overexpressing U251-NG2
(n = 7, respectively) tumour spheroids. In addition, patient GBM
biopsy spheroids (Patient 3 and 13) that had been serially in vivo
passaged through 21 and 22 generations of nude rats (respectively)
were implanted into 15 and 16 (respectively) nude rat brains as
previously described [22], NOD-SCID mice (n = 35) weighing
approximately 25 g (4–6 weeks) were subcutaneously injected with
56105A375 melanoma cells.
Lentiviral vector productionLentiviral vectors targeting NG2 were produced by subcloning
the selected shRNA sequences into the pRNAt-U6.1/Lentiviral
vector from GenScript (Scotch Plains, NJ). The NG2 shRNA
targets the following site: 59-GGGCUGUGUUGAAGAGU-
UU-39. Target sequence of the scrambled control shRNA is
59-GUAGAUCAAUUGGGUACACUU-39. Lentiviral particles
were produced by triple transfection of the lentiviral expression
plasmids encoding shRNA, together with vsv-g encoding envelope
plasmid (pMD2.G) and a gag-pol encoding packaging plasmid
(psPAX.2) into HEK 293FT cells. Envelope and packaging
plasmids were kindly provided by Tronolab and protocols for
virus production and harvest is largely adapted from their website
http://tronolab.epfl.ch. Briefly, lentiviral particles were harvested
48 h and 72 h post-transfection, sterile filtered, and concentrated
for in vivo experiments by polyethylene glycol (PEG) 6000
precipitation [39]. Titration of concentrated virus stocks were
performed on an Accuri C6 flow cytometer (Accuri Cytometer
Inc., Ann Arbor, MI) and viral yields of ,5610e7 transducing
Units/ml.
Infection of primary culture monolayers by Lentiviralvectors
Monolayer cultures of primary GBM biopsy material p3 and
p13 were cultivated in serum-free neurobasal medium (Invitro-
gen), supplemented with B-27 supplement (Invitrogen) and 20 ng/
ml FGF and 20 ng/ml EGF. Viral infection was performed by
centrifugation of cells in the presence of viral particles at 1200 g
for 90minutes at 31uC. In vitro NG2 knockdown was validated by
Western Blotting, whilst in vivo knockdown was validated by
immunostaining for NG2 on tissue sections of the treated tumours.
Samples of infected monolayers harvested 96 h post-infection.
Figure 6. NG2 knockdown in melanomas diminishes tumour growth and proliferation. Well-demarcated, subcutaneous solid tumour (A),and lymphatic vessel infiltration (B), Solid groups of polygonal atypical tumour cells showing moderate pleomorphic nuclei with prominenteosinophilic nucleoli interspersed with connective tissue (C). Partial S-100 protein expression (D), Magnification, 2006. Growth curves of establishedA375 melanoma tumours treated with vehicle, control and NG2 shRNAs in in vivo (E, Two-Way ANOVA F8.28, df = 13; *p,0.0005). Arrow indicatesbeginning of lentiviral shRNAs or vehicle injections at day 7. Cell surface NG2 expression in parental A375 tumours (F), and in control non-functionalshRNA transduced tumours (G). Reduced NG2 immunoreactivity in the NG2 shRNA transduced tumours (H), and A375 melaoma protein lysates (I).Magnification 10006. Quantification of Ki67 positive tumour cells (J, One-way ANOVA F9.259; df = 3; *p = 0.0006) and cell death (necrotic/apoptoticcells by TUNEL positivity (K, One-Way ANOVA F37.53; df = 3; *p = 0.0001). Data represent mean 6SEM. Scale bars in A = 200 mm magnification 1006;Scale bars in B-D = 200 mm magnification 4006; Scale bars F-H = 200 mm, magnification 10006.doi:10.1371/journal.pone.0023062.g006
NG2(CSPG4) and Angiogenesis in Glioblastoma
PLoS ONE | www.plosone.org 11 July 2011 | Volume 6 | Issue 7 | e23062

Convection enhanced delivery of shRNAsTwo-three weeks after tumour implantation, the nude rats were
MRI scanned to confirm tumour engraftment. The rats were
anesthetized and a craniotomy performed as previously described
[22]. Viral stocks (2610 mL) were delivered into the centre of the
tumours using a glass syringe (model 701, Hamilton, Bonaduz,
Switzerland) secured in a microprocessor-controlled infusion
pump (UMP 2–1, World Precision Instruments, Aston, Stevenage,
UK). The injection coordinates were estimated from the MRI
images for each tumour. The viral shRNAs were infused by
convection-enhanced delivery in the course of 25 min (200 nl/min
for 10 min, followed by 400 nl/min for 10 min, and finally
800 nl/min for 5 min). 8 animals received NG2 shRNAs and 7
animals received control shRNAs against mismatched cspg4
mRNA sequence in both P3 and P13 cohorts. After infusion, the
needle was left in place for 5 min and thereafter slowly retracted
and the skinfolds closed with polyamide surgical thread.
Fourteen melanoma bearing mice received intra-tumoural
injections of control or NG2 shRNAs, while 7 received PBS
vehicle 7 days after tumour implantation. Following surgery, the
animals were monitored until recovery in an incubator at 35uC.
Melanoma tumour growth was determined by measuring tumour
nodules with a caliper, and tumour volumes (V) were calculated
using the formula (V) = (a6b6c)/2, where a, b and c are the long
axis, short axis and the depth, respectively, that was derived for an
ellipsoid (pd3/6) as previously described[12].
Magnetic resonance imagingAnimals bearing U251-NG2 (n = 3) and U251-wt (n = 4)
tumours were imaged with a small animal horizontal bore 2.35T
Biospec (Bruker Biospin MRI, Ettlingen, Germany) equipped with
a specially designed rat head coil. T2 weighted (T2 w) spin echo
(SE) images and post-contrast T1 weighted (T1 w) SE images were
acquired for vasogenic oedema and solid tumour volume
measurements respectively (repetition time (TR)/echo time (TE)
were 500/113 ms and 524/13 ms, respectively). Both sequences
were acquired using 4 NEX (number of acquisitions), matrix of
2566256 and 1 mm slice thickness. To assess microvascular status,
we performed dynamic contrast enhanced MRI (DCE-MRI) using
a dynamic T1 weighted SE sequence with 100 repetitions and 12 s
temporal resolution in 4 axial slices (TR/TE = 91/5 ms, NEX = 2,
acquisition matrix 64664, slice thickness 3 mm). Gadolinium-
based contrast agent (0.1 mmol/kg gadodiamide, GE Healthcare,
Oslo, Norway) was administered in the femoral vein after baseline
images were acquired, and an additional dose of 0.3 mmol/kg the
contrast agent was given 4 min prior to the post-contrast T1
weighted sequence. Fifteen animals bearing P3 GBMs were
scanned at 2 months, while 13 animals bearing P13 tumours were
scanned two weeks after tumour implantation and 2 weeks post
treatment using a 7T Pharmascan MR scanner (Bruker Biospin
MRI, Ettlingen, Germany). Pre- and post-contrast T1 weighted
RARE (Rapid Acquisition with Relaxation Enhancement) se-
quence (TR/TE = 1300/8.9 ms, NEX = 6, acquisition matrix
2566256, slice thickness 1 mm), and a T2 weighted RARE
sequence (TR/TE = 4200/36 ms, NEX = 3) were performed.
DCE-MRI was performed on animals bearing human GBM from
Patient 13 to assess functional changes in the microvascular status
after treatment using a FLASH-sequence (Fast low angle shot) with
a flip angle of 25u (TR/TE = 16.3/2.8 ms) and 550 repetitions
with a temporal resolution of 1.5 s (acquisition matrix 96696, slice
thickness 1 mm). A bolus injection of gadodiamide (0.1 mmol/kg)
was administered after acquisition of 30 baseline images. All
sequences were obtained with identical geometric imaging
parameters. The tail veins were cannulated to ensure secure
injection of the contrast agent.
MRI data analysesVolumes of solid tumour tissue and oedema were estimated
using image segmentation based on signal intensity threshold in
T1 weighted post contrast and T2 weighted images, respectively,
using nordicICE version 2.3.7 (Nordic Imaging Control and
Evaluation, NNL, Bergen, Norway). The contrast ratio between
solid tumour and healthy brain tissue in post-contrast T1 weighted
images was estimated using the following equation: (SItumour-
SIhealthy brain)/((SItumour+ SIhealthy brain)/2), where the SI in the
healthy brain tissue was measured in the contralateral hemisphere.
The DCE-MRI data were analysed by applying the pharmaco-
kinetic model proposed by Su et al[25] and Tofts and co-workers
[26]The models are based on the biological assumptions that: i)
the tracer is well mixed in the plasma and ii) the blood plasma and
the extracellular extravascular space (EES) are the two compart-
ments available for the tracer. In addition, we assumed there is a
bi-directional exchange between the vessels and EES. Time curves
were extracted from ROIs (regions-of-interest) covering the solid
tumour and discreet regions within the tumour. ROIs were
delineated a priori based on increase in signal intensity of the
tumour after contrast agent injection. When applying Su’s model,
the signal intensity time curves were extracted and curves from
regions-of-interest (ROI) were converted to tissue concentration
based on the assumption that the increase in T1 relaxation rate is
proportional to the concentration of the tracer. The microvascular
parameters D0 (mM, related to local blood volume), D1 (mM/
min, related to blood-tissue permeability) and K2 (l/min, related to
tissue-blood permeability) were estimated. For the Tofts model,
nordicICE was used to estimate pixel-by-pixel the transfer
constant, Ktrans (min21, which reflects contrast delivery (by
perfusion) and transport across the vascular endothelium (by
permeability), with the dominant factor depending on whether the
tracer depletion is flow or permeability limited), ve (fraction of
extravascular extracellular space, i.e. distribution volume), vp
(plasma volume fraction) and the Kep (min21, which is a function
of Ktrans and ve, describing the contrast agent efflux from
tumour). In a previous study [24] we used both models on the
same dataset in order to compare the models, where both methods
gave the same results, indicating that the models were equivalent.
MRI videoMaximum intensity projection images from T1w MR images
were generated using multiplanar reconstruction and the maxi-
mum intensity projection (MIP) tool in nordicICE. Manual
reorientation in multiplanar reconstructed images and MIP was
recorded in real time using CamStudioTM Open Source Free
Streeming Video Software.
Histology and immunohistochemistryFormalin fixed paraffin embedded sections from each specimen
were stained with Harris Haematoxylin and Eosin (H&E, Merck,
Darmstadt, Germany) according to standard procedures and
examined with a Nikon Eclipse (E600) light microscope. Images
were captured with a Nikon DXM1200 digital camera (Nikon
Corporation, Tokyo, Japan). Indirect immunohistochemistry was
performed using the EnVisionSystem, horse-radish peroxidase
(HRP) and 3939-diaminobenzidine (DAB) (Dako, Glostrup, Den-
mark) method, as described previously[24]. The antibodies MIB-1
Ki67, S-100, (Dako), von Willebrand factor (Dako) and anti-NG2
were applied as described previously[24]. FFPE sections were also
stained with mouse anti-rat/mouse CD8a (BD Pharmingen),
NG2(CSPG4) and Angiogenesis in Glioblastoma
PLoS ONE | www.plosone.org 12 July 2011 | Volume 6 | Issue 7 | e23062

mouse anti-rat/mouse CD68 (Serotec) and visualised with
biotinylated horse anti-mouse secondary antibody and ABC-
complex (Vectastain kit, Vector Laboratories). Double staining
with CD8a (DAB) and CD68 (Liquid Permanent Red) was
performed using EnVisionTM G/2 Doublestain System (Dako).
DAB stained tissue sections were analyzed using the image analysis
system LUCIA, version 4.21 (Laboratory Imaging Ltd., Prague,
The Czech Republic). The fraction of positive labelled tumour
cells, defined as the Ki67 labelling index (Ki67 LI), was assessed in
5 microscopic high power fields (magnification 4006). For
detection of apoptotic cells and necrosis the terminal deoxynu-
cleotidyltransferase mediated nick end labelling (TUNEL) assay
was used according to the manufacturer’s instructions (Roche
Applied Bioscience, Manheim Germany), with DAB as chromo-
gen. Tunel-positive cells were assessed from the entire maximal
tumour slice on low power fields in all the animals.
Composite H&E image renderingThe rat brain sections showing maximal tumour were imaged
using a Nikon TE2000 fluorescent microscope (Nikon). To cover
the whole brain, 9–20 images per section were acquired using a
Plan apo 2x 0.1 NA objective. Images were merged together using
Adobe Photoshop CS4 extended (version 11.0.1) through the
automated photomerge function.
StatisticsThe two-tailed Student’s t-test was used when comparing two
categories and one way- or two way-analysis of variance (ANOVA)
for comparisons of more than 2 groups or variables. Mann
Whitney-U test was used to analyse non-parametric data and the
Kaplan Meier survival curves were analysed using the Log-rank
(Mantel-Cox) test. A probability level of #0.05 was considered
significant and all statistical analyses were performed in Graphpad
Prism 5.0 software.
Supporting Information
Figure S1 Correlation of MRI and Histology. Panel 1:
Large, expansive H&E stained control shRNA treated tumour
with pseudopalisading necrosis and shift of the midline structures.
Panel 2: Small NG2 shRNA treated tumour disseminating to the
contralateral hemisphere. Inserts in both panels show the area
with signal change in T1 weighted images superimposed onto T2
weighted MR images.
(TIF)
Video S1 Video recorded in real time using multiplanar
reconstruction and MIP from T1 weighted MRI post contrast
images of control shRNA tumours demonstrating differences in
tumour volumes and contrast enhancement.
(AVI)
Video S2 Video recorded in real time using multiplanar
reconstruction and MIP from T1 weighted MRI post contrast
images of NG2 shRNA treated tumours demonstrating differences
in tumour volumes and contrast enhancement.
(AVI)
Acknowledgments
We thank Professor Bill Stallcup for his immense generosity with critical
reagents and Professor Arvid Lundervold for implementing Su’s pharma-
cokinetic model in Matlab. We acknowledge Bodil B. Hansen, Tove
Johannsen, Narve Brekka and Ingrid Sandvik Gavlen for excellent
technical assistance. We are grateful to Endy Spriet at the Molecular
Imaging Centre (MIC), University of Bergen for assistance with
microscopy. MRI scanning was performed at MIC in Bergen (7T) and
Trondheim (2.35 T).
Author Contributions
Conceived and designed the experiments: MC. Performed the experi-
ments: JW AS JK HM HI JP KOS PØE CBR MC. Analyzed the data: JW
JK HI PØE CBR MC. Contributed reagents/materials/analysis tools: MC
CBR PØE. Wrote the paper: JW AS PØE RB RKR CBR MC.
References
1. Ohgaki H, Kleihues P (2005) Population-based studies on incidence, survival
rates, and genetic alterations in astrocytic and oligodendroglial gliomas.J Neuropathol Exp Neurol 64: 479–489.
2. Smith JS, Jenkins RB (2000) Genetic alterations in adult diffuse glioma:occurrence, significance, and prognostic implications. Front Biosci 5: D213–231.
3. Stupp R, Mason WP, van den Bent MJ, Weller M, Fisher B, et al. (2005)
Radiotherapy plus concomitant and adjuvant temozolomide for glioblastoma.N Engl J Med 352: 987–996.
4. Behm FG, Smith FO, Raimondi SC, Pui CH, Bernstein ID (1996) Humanhomologue of the rat chondroitin sulfate proteoglycan, NG2, detected by
monoclonal antibody 7.1, identifies childhood acute lymphoblastic leukemiaswith t(4;11)(q21;q23) or t(11;19)(q23;p13) and MLL gene rearrangements. Blood
87: 1134–1139.
5. Chekenya M, Enger PO, Thorsen F, Tysnes BB, Al-Sarraj S, et al. (2002) Theglial precursor proteoglycan, NG2, is expressed on tumour neovasculature by
vascular pericytes in human malignant brain tumours. Neuropathol ApplNeurobiol 28: 367–380.
6. Mauvieux L, Delabesse E, Bourquelot P, Radford-Weiss I, Bennaceur A, et al.
(1999) NG2 expression in MLL rearranged acute myeloid leukaemia is restrictedto monoblastic cases. Br J Haematol 107: 674–676.
7. Schrappe M, Klier FG, Spiro RC, Waltz TA, Reisfeld RA, et al. (1991)Correlation of chondroitin sulfate proteoglycan expression on proliferating brain
capillary endothelial cells with the malignant phenotype of astroglial cells.Cancer Res 51: 4986–4993.
8. Shoshan Y, Nishiyama A, Chang A, Mork S, Barnett GH, et al. (1999)
Expression of oligodendrocyte progenitor cell antigens by gliomas: implicationsfor the histogenesis of brain tumors. Proc Natl Acad Sci U S A 96:
10361–10366.
9. Smith FO, Rauch C, Williams DE, March CJ, Arthur D, et al. (1996) The
human homologue of rat NG2, a chondroitin sulfate proteoglycan, is notexpressed on the cell surface of normal hematopoietic cells but is expressed by
acute myeloid leukemia blasts from poor-prognosis patients with abnormalities
of chromosome band 11q23. Blood 87: 1123–1133.
10. Chekenya M, Hjelstuen M, Enger PO, Thorsen F, Jacob AL, et al. (2002) NG2proteoglycan promotes angiogenesis-dependent tumor growth in CNS by
sequestering angiostatin. Faseb J 16: 586–588.
11. Goretzki L, Lombardo CR, Stallcup WB (2000) Binding of the NG2
proteoglycan to kringle domains modulates the functional properties ofangiostatin and plasmin(ogen). J Biol Chem 275: 28625–28633.
12. Chekenya M, Krakstad C, Svendsen A, Netland IA, Staalesen V, et al. (2008)
The progenitor cell marker NG2/MPG promotes chemoresistance by activation
of integrin-dependent PI3K/Akt signaling. Oncogene 27: 5182–5194.
13. Li Y, Madigan MC, Lai K, Conway RM, Billson FA, et al. (2003) Human uvealmelanoma expresses NG2 immunoreactivity. Br J Ophthalmol 87: 629–632.
14. Benassi MS, Pazzaglia L, Chiechi A, Alberghini M, Conti A, et al. (2008) NG2expression predicts the metastasis formation in soft-tissue sarcoma patients. J
Orthop Res;doi: 10.1002/jor.20694.
15. Burg MA, Grako KA, Stallcup WB (1998) Expression of the NG2 proteoglycan
enhances the growth and metastatic properties of melanoma cells. J Cell Physiol177: 299–312.
16. Read TA, Sorensen DR, Mahesparan R, Enger PO, Timpl R, et al. (2001) Local
endostatin treatment of gliomas administered by microencapsulated producer
cells. Nat Biotechnol 19: 29–34.
17. Rainov NG (2000) A phase III clinical evaluation of herpes simplex virus type 1thymidine kinase and ganciclovir gene therapy as an adjuvant to surgical
resection and radiation in adults with previously untreated glioblastoma
multiforme. Hum Gene Ther 11: 2389–2401.
18. Folkman J (2003) Angiogenesis inhibitors: a new class of drugs. Cancer Biol Ther2: S127–133.
19. Peroulis I, Jonas N, Saleh M (2002) Antiangiogenic activity of endostatin inhibitsC6 glioma growth. Int J Cancer 97: 839–845.
20. Engebraaten O, Hjortland GO, Hirschberg H, Fodstad O (1999) Growth ofprecultured human glioma specimens in nude rat brain. J Neurosurg 90: 125–132.
21. Mahesparan R, Read TA, Lund-Johansen M, Skaftnesmo KO, Bjerkvig R, et al.
(2003) Expression of extracellular matrix components in a highly infiltrative in
vivo glioma model. Acta Neuropathol 105: 49–57.
NG2(CSPG4) and Angiogenesis in Glioblastoma
PLoS ONE | www.plosone.org 13 July 2011 | Volume 6 | Issue 7 | e23062

22. Wang J, Miletic H, Sakariassen PO, Huszthy PC, Jacobsen H, et al. (2009) A
reproducible brain tumour model established from human glioblastoma biopsies.BMC Cancer 9: 465.
23. Festing MF, May D, Connors TA, Lovell D, Sparrow S (1978) An athymic nude
mutation in the rat. Nature 274: 365–366.24. Brekke C, Lundervold A, Enger PO, Brekken C, Stalsett E, et al. (2006) NG2
expression regulates vascular morphology and function in human brain tumours.Neuroimage 29: 965–976.
25. Su MY, Jao JC, Nalcioglu O (1994) Measurement of vascular volume fraction
and blood-tissue permeability constants with a pharmacokinetic model: studiesin rat muscle tumors with dynamic Gd-DTPA enhanced MRI. Magn Reson
Med 32: 714–724.26. Tofts PS, Brix G, Buckley DL, Evelhoch JL, Henderson E, et al. (1999)
Estimating kinetic parameters from dynamic contrast-enhanced T(1)-weightedMRI of a diffusable tracer: standardized quantities and symbols. J Magn Reson
Imaging 10: 223–232.
27. Leach MO, Brindle KM, Evelhoch JL, Griffiths JR, Horsman MR, et al. (2005)The assessment of antiangiogenic and antivascular therapies in early-stage
clinical trials using magnetic resonance imaging: issues and recommendations.Br J Cancer 92: 1599–1610.
28. Schoenegger K, Oberndorfer S, Wuschitz B, Struhal W, Hainfellner J, et al.
(2009) Peritumoral edema on MRI at initial diagnosis: an independentprognostic factor for glioblastoma? Eur J Neurol 16: 874–878.
29. Wen PY, Macdonald DR, Reardon DA, Cloughesy TF, Sorensen AG, et al.(2010) Updated response assessment criteria for high-grade gliomas: response
assessment in neuro-oncology working group. J Clin Oncol 28: 1963–1972.30. Keunen OJ, Oudin M, Sanzey A, Abdul-Rahim M, Fack SA, et al. (2011) Anti-
VEGF treatment reduces blood supply and increases tumor cell invasion in
glioblastoma. PNAS 108: 3749–3754.31. Kunkel P, Ulbricht U, Bohlen P, Brockmann MA, Fillbrandt R, et al. (2001)
Inhibition of glioma angiogenesis and growth in vivo by systemic treatment with
a monoclonal antibody against vascular endothelial growth factor receptor-2.
Cancer Res 61: 6624–6628.32. Lai A, Filka E, McGibbon B, Nghiemphu PL, Graham C, et al. (2008) Phase II
Pilot Study of Bevacizumab in Combination with Temozolomide and Regional
Radiation Therapy for Up-Front Treatment of Patients With Newly DiagnosedGlioblastoma Multiforme: Interim Analysis of Safety and Tolerability.
Int J Radiat Oncol Biol Phys 71: 1372–1380.33. Paez-Ribes M, Allen E, Hudock J, Takeda T, Okuyama H, et al. (2009)
Antiangiogenic therapy elicits malignant progression of tumors to increased local
invasion and distant metastasis. Cancer Cell 15: 220–231.34. Lamszus K, Brockmann MA, Eckerich C, Bohlen P, May C, et al. (2005)
Inhibition of glioblastoma angiogenesis and invasion by combined treatmentsdirected against vascular endothelial growth factor receptor-2, epidermal growth
factor receptor, and vascular endothelial-cadherin. Clin Cancer Res 11:4934–4940.
35. Lund-Johansen M, Bjerkvig R, Humphrey PA, Bigner SH, Bigner DD, et al.
(1990) Effect of epidermal growth factor on glioma cell growth, migration, andinvasion in vitro. Cancer Res 50: 6039–6044.
36. Gerstner ER, Chen PJ, Wen PY, Jain RK, Batchelor TT, et al. (2010) Infiltrativepatterns of glioblastoma spread detected via diffusion MRI after treatment with
cediranib. Neuro Oncol 12: 466–472.
37. Hovinga KE, Stalpers LJ, van Bree C, Donker M, Verhoeff JJ, et al. (2005)Radiation-enhanced vascular endothelial growth factor (VEGF) secretion in
glioblastoma multiforme cell lines--a clue to radioresistance? J Neurooncol 74:99–103.
38. Hjortland GO, Garman-Vik SS, Juell S, Olsen OE, Hirschberg H, et al. (2004)Immunotoxin treatment targeted to the high-molecular-weight melanoma-
associated antigen prolonging the survival of immunodeficient rats with invasive
intracranial human glioblastoma multiforme. J Neurosurg 100: 320–327.39. Kutner RH, Zhang XY, Reiser J (2009) Production, concentration and titration
of pseudotyped HIV-1-based lentiviral vectors. Nat Protoc 4: 495–505.
NG2(CSPG4) and Angiogenesis in Glioblastoma
PLoS ONE | www.plosone.org 14 July 2011 | Volume 6 | Issue 7 | e23062