
GBM Volumetry using the 3D Slicer Medical ... - Harvard DASH
8
GBM Volumetry using the 3D Slicer Medical Image Computing Platform The Harvard community has made this article openly available. Please share how this access benefits you. Your story matters Citation Egger, Jan, Tina Kapur, Andriy Fedorov, Steve Pieper, James V. Miller, Harini Veeraraghavan, Bernd Freisleben, Alexandra J. Golby, Christopher Nimsky, and Ron Kikinis. 2013. GBM volumetry using the 3D slicer medical image computing platform. Scientific Reports 3:1364. Published Version doi:10.1038/srep01364 Citable link http://nrs.harvard.edu/urn-3:HUL.InstRepos:10611818 Terms of Use This article was downloaded from Harvard University’s DASH repository, and is made available under the terms and conditions applicable to Other Posted Material, as set forth at http:// nrs.harvard.edu/urn-3:HUL.InstRepos:dash.current.terms-of- use#LAA
-
Upload
khangminh22 -
Category
Documents
-
view
1 -
download
0
Transcript of GBM Volumetry using the 3D Slicer Medical ... - Harvard DASH
GBM Volumetry using the 3D SlicerMedical Image Computing Platform
The Harvard community has made thisarticle openly available. Please share howthis access benefits you. Your story matters
Citation Egger, Jan, Tina Kapur, Andriy Fedorov, Steve Pieper, James V.Miller, Harini Veeraraghavan, Bernd Freisleben, Alexandra J. Golby,Christopher Nimsky, and Ron Kikinis. 2013. GBM volumetry usingthe 3D slicer medical image computing platform. Scientific Reports3:1364.
Published Version doi:10.1038/srep01364
Citable link http://nrs.harvard.edu/urn-3:HUL.InstRepos:10611818
Terms of Use This article was downloaded from Harvard University’s DASHrepository, and is made available under the terms and conditionsapplicable to Other Posted Material, as set forth at http://nrs.harvard.edu/urn-3:HUL.InstRepos:dash.current.terms-of-use#LAA

GBM Volumetry using the 3D SlicerMedical Image Computing PlatformJan Egger1,2,3, Tina Kapur1, Andriy Fedorov1, Steve Pieper1,4, James V. Miller5, Harini Veeraraghavan6,Bernd Freisleben3, Alexandra J. Golby1,7, Christopher Nimsky2 & Ron Kikinis1
1Department of Radiology, Brigham and Women’s Hospital, Harvard Medical School, Boston, MA, USA, 2Department ofNeurosurgery, University Hospital of Marburg, Marburg, Germany, 3Department of Mathematics and Computer Science, ThePhilipps-University of Marburg, Marburg, Germany, 4Isomics, Inc., Cambridge, MA, USA, 5Interventional and Therapy Lab, GEResearch, Niskayuna, NY, USA, 6Biomedical Image Analysis Lab, GE Research, Niskayuna, NY, USA, 7Department ofNeurosurgery, Brigham and Women’s Hospital, Harvard Medical School, Boston, MA, USA.
Volumetric change in glioblastoma multiforme (GBM) over time is a critical factor in treatment decisions.Typically, the tumor volume is computed on a slice-by-slice basis using MRI scans obtained at regularintervals. (3D)Slicer – a free platform for biomedical research – provides an alternative to this manualslice-by-slice segmentation process, which is significantly faster and requires less user interaction. In thisstudy, 4 physicians segmented GBMs in 10 patients, once using the competitive region-growing basedGrowCut segmentation module of Slicer, and once purely by drawing boundaries completely manually on aslice-by-slice basis. Furthermore, we provide a variability analysis for three physicians for 12 GBMs. Thetime required for GrowCut segmentation was on an average 61% of the time required for a pure manualsegmentation. A comparison of Slicer-based segmentation with manual slice-by-slice segmentation resultedin a Dice Similarity Coefficient of 88.43 6 5.23% and a Hausdorff Distance of 2.32 6 5.23 mm.
Gliomas are the most common primary brain tumors, arising from the glial cells that support the cerebralnerve cells. The World Health Organization (WHO) grading system for gliomas defines grades I–IV,where grade I tumors are the least aggressive and IV are the most aggressive1. Of these, 70% are
considered malignant gliomas (anaplastic astrocytoma WHO grade III and glioblastoma multiforme WHO gradeIV). The glioblastoma multiforme, named for its histopathological appearance, is the most frequent malignantprimary brain tumor and is one of the most highly malignant human neoplasms. The approach to the treatmentof glioblastomas typically includes maximum safe resection, percutaneous radiation and chemotherapy. Despitenew radiation strategies and the development of oral alcylating substances (e.g. Temozolomide), the life expect-ancy for GBM patients is still only about fifteen months2. Although in previous years the role of surgery wascontroversial, recent literature favors a maximum safe surgical resection as a positive predictor for extendedpatient survival3. Microsurgical resection can now be optimized with the technical development of neuronaviga-tion based on data from diffusion tensor imaging (DTI), functional magnetic resonance imaging (fMRI),magnetoencephalography (MEG), magnetic resonance spectroscopy (MRS), or positron-emission-computed-tomography (PET). An early postoperative magnetic resonance imaging (MRI) with a contrast agent can be usedto determine how much of the tumor mass has been removed and frequent MRI scans can help to monitor anynew tumor growth.
For automatic glioma segmentation in general (World Health Organization grade I–IV), several algorithmshave already been proposed that rely on magnetic resonance imaging. Szwarc et al.4 have presented a segmenta-tion approach that uses fuzzy clustering techniques. In their evaluation, the authors used six magnetic resonance(MR) studies of three subjects and the reported Dice Similarity Coefficient (DSC)5,6 ranged from 67.21% to 75.63%.Angelini et al.7 have presented an extensive overview of some deterministic and statistical approaches. Gibbs et al.8
have introduced a combination of region growing and morphological edge detection for segmenting enhancingtumors in T1-weighted MRI data. The authors evaluated their method with one phantom data set and ten clinicaldata sets. An interactive method for segmentation of full-enhancing, ring-enhancing and non-enhancing tumorshas been proposed by Letteboer et al.9 and was evaluated on twenty clinical cases. Depending on intensity-basedpixel probabilities for tumor tissue, Droske et al.10 have presented a deformable model method, using a level setformulation, to divide the MRI data into regions of similar image properties for tumor segmentation. Clark et al.11
have introduced a knowledge-based automated segmentation on multispectral data in order to partition
SUBJECT AREAS:CANCER
COMPUTATIONAL SCIENCE
SOFTWARE
COMPUTATIONAL BIOLOGYAND BIOINFORMATICS
Received31 May 2012
Accepted15 February 2013
Published4 March 2013
Correspondence andrequests for materials
should be addressed toJ.E. (egger@bwh.
harvard.edu)
SCIENTIFIC REPORTS | 3 : 1364 | DOI: 10.1038/srep01364 1
glioblastomas. Direct comparison with a hand labeled segmentation89 of 120 slices had a percent matching rate of 90% or higher.Segmentation based on outlier detection in T2-weighted MR datahas been proposed by Prastawa et al.12. For each case, the timerequired for the automatic segmentation method was about ninetyminutes. Sieg et al.13 have introduced an approach to segment con-trast-enhanced, intracranial tumors and anatomical structures ofregistered, multispectral MR data. The approach has been testedon twenty-two data sets, but no computation times were provided.Egger et al.14,15 present a graph-based approach. After the graph hasbeen constructed, the minimal cost closed set on the graph is com-puted via a polynomial time s-t cut16. The presented method has beenevaluated with fifty glioblastoma multiforme yielding an averageDice Similarity Coefficient of 80.37 6 8.93%.
Since fully automated segmentation often fails to match humanjudgments of tumor boundaries, a number interactive segmentationalgorithms have been proposed. Vezhnevets and Konouchine17 givean overview of methods for generic image editing and methods forediting medical images. An interactive segmentation techniquecalled Magic Wand17 is a common selection tool in image editingsoftware applications. The tool gathers color statistics from the userspecified image point (or region) and segments (connected) imageregions with pixels whose color properties fall within some giventolerance of the gathered statistics. Reese18 has presented a region-based interactive segmentation technique called Intelligent Paint,based on hierarchical image segmentation by tobogganing, with aconnect-and-collect strategy to define an object’s region. Mortensenand Barrett19 have introduced a boundary-based method to computea minimum-cost path between user-specified boundary points. Theintelligent scissors method20 treats each pixel as a graph node anduses shortest-path graph algorithms for boundary calculation and afaster variant of region-based intelligent scissors uses tobogganingfor image over-segmentation and then treats homogenous regions asgraph nodes. GraphCut is a combinatorial optimization techniqueapplied to the task of image segmentation by Boykov and Jolly21. Anextension of the GraphCut named GrabCut developed by Rotheret al.22, is an iterative segmentation scheme that uses a graph-cutfor intermediate steps. A marker-based watershed transformationalgorithm for medical image segmentation, developed by Mogaand Gabbouj23, uses user-specified markers for segmenting gray levelimages. The Random Walker algorithm of Grady and Funka-Lea24 isa probabilistic approach using a small number of user-labeled pixels.
Heimann et al.25 have presented an interactive region growingmethod that is a descendant of one of the classic image segmentationtechniques. A manual refinement system for graph-basedapproaches has recently been presented by Egger et al.26,27. Theapproach takes advantage of the basic design of graph-based imagesegmentation algorithms and restricts a graph-cut by using addi-tional user-defined seed points to set up fixed nodes in the graph.Another resent publication by Zukic et al.28 presents semi-automaticGBM segmentation with a balloon inflation approach29. The ballooninflation method has been evaluated with twenty-seven magneticresonance imaging data sets with a reported average DSC of80.46%. The GrowCut method, developed by Vezhnevets andKonouchine17, is a cellular automaton-based algorithm for interact-ive multilabel segmentation of N-dimensional images. The GrowCutalgorithm is freely available as a module30 for the medical imagecomputing platform 3D Slicer31 and has been used in a recent studyto segment Pituitary Adenomas32.
In this paper, we present a detailed study of the volumetric analysisof glioblastoma multiforme using the GrowCut tool 3D Slicer. Ourobjective is to evaluate the utility of 3D Slicer in simplifying thetime-consuming manual slice-by-slice segmentation while achievinga comparable accuracy. Thus, 4 physicians segmented GBMs in 10patients, once using the competitive region-growing based GrowCut
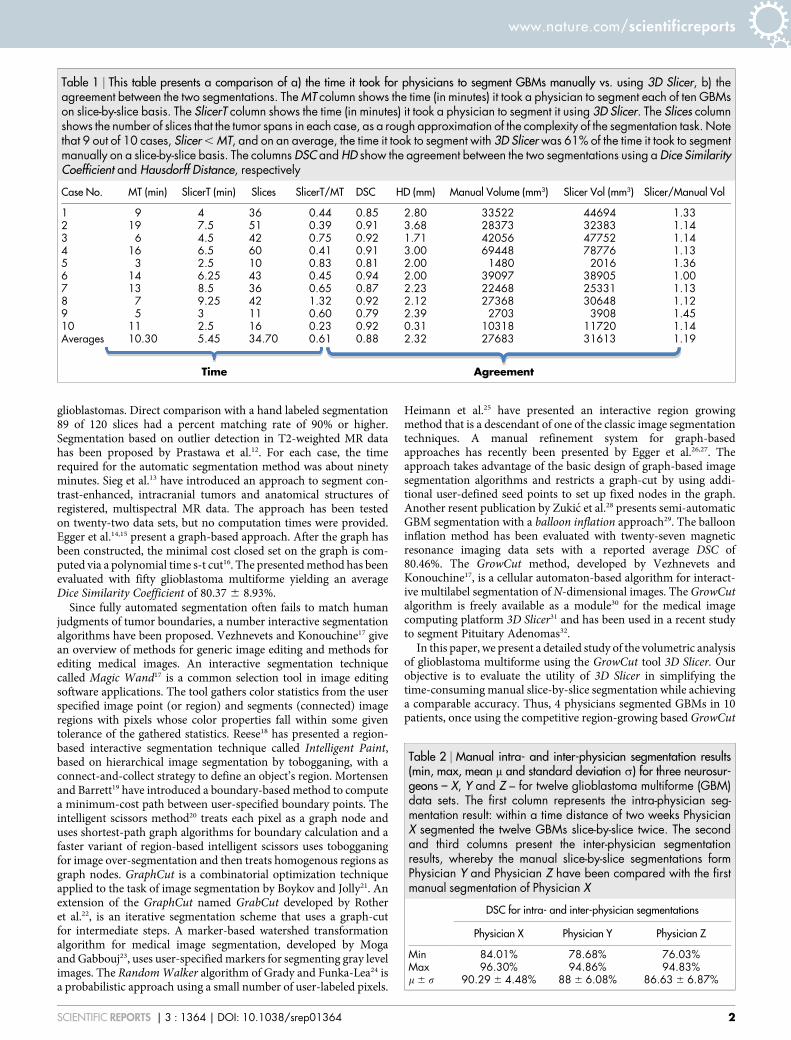
Table 1 | This table presents a comparison of a) the time it took for physicians to segment GBMs manually vs. using 3D Slicer, b) theagreement between the two segmentations. The MT column shows the time (in minutes) it took a physician to segment each of ten GBMson slice-by-slice basis. The SlicerT column shows the time (in minutes) it took a physician to segment it using 3D Slicer. The Slices columnshows the number of slices that the tumor spans in each case, as a rough approximation of the complexity of the segmentation task. Notethat 9 out of 10 cases, Slicer , MT, and on an average, the time it took to segment with 3D Slicer was 61% of the time it took to segmentmanually on a slice-by-slice basis. The columns DSC and HD show the agreement between the two segmentations using a Dice SimilarityCoefficient and Hausdorff Distance, respectively
Case No. MT (min) SlicerT (min) Slices SlicerT/MT DSC HD (mm) Manual Volume (mm3) Slicer Vol (mm3) Slicer/Manual Vol
1 9 4 36 0.44 0.85 2.80 33522 44694 1.332 19 7.5 51 0.39 0.91 3.68 28373 32383 1.143 6 4.5 42 0.75 0.92 1.71 42056 47752 1.144 16 6.5 60 0.41 0.91 3.00 69448 78776 1.135 3 2.5 10 0.83 0.81 2.00 1480 2016 1.366 14 6.25 43 0.45 0.94 2.00 39097 38905 1.007 13 8.5 36 0.65 0.87 2.23 22468 25331 1.138 7 9.25 42 1.32 0.92 2.12 27368 30648 1.129 5 3 11 0.60 0.79 2.39 2703 3908 1.4510 11 2.5 16 0.23 0.92 0.31 10318 11720 1.14Averages 10.30 5.45 34.70 0.61 0.88 2.32 27683 31613 1.19
Time Agreement
Table 2 | Manual intra- and inter-physician segmentation results(min, max, mean m and standard deviation s) for three neurosur-geons – X, Y and Z – for twelve glioblastoma multiforme (GBM)data sets. The first column represents the intra-physician seg-mentation result: within a time distance of two weeks PhysicianX segmented the twelve GBMs slice-by-slice twice. The secondand third columns present the inter-physician segmentationresults, whereby the manual slice-by-slice segmentations formPhysician Y and Physician Z have been compared with the firstmanual segmentation of Physician X
DSC for intra- and inter-physician segmentations
Physician X Physician Y Physician Z
Min 84.01% 78.68% 76.03%Max 96.30% 94.86% 94.83%m 6 s 90.29 6 4.48% 88 6 6.08% 86.63 6 6.87%
www.nature.com/scientificreports
SCIENTIFIC REPORTS | 3 : 1364 | DOI: 10.1038/srep01364 2
segmentation module of 3D Slicer, and once by drawing boundariesmanually on a slice-by-slice basis. The time required for GrowCut vs.manual segmentation were recorded. A comparison was performedof 3D Slicer based segmentation with manual slice-by-slice seg-mentation using the Dice Similarity Coefficient (DSC) and theHausdorff Distance (HD)33–35.
Methods that use all slices to calculate the tumor boundaries havemore information available to make accurate predictions of tumorvolume. Simpler methods such as geometric models provide only arough estimate of the tumor volume and may not be indicated foraccurate determination of tumor burden. Geometric approximationsuse one or several user-defined diameters to estimate the tumorvolume36–38. The Macdonald criteria39 for measuring brain tumors
adopts uniform, rigorous response criteria similar to those in generaloncology where response is defined as a $50% reduction in tumorsize and the usual measure of "size" is the largest cross-sectional area(the largest cross-sectional diameter multiplied by the largest dia-meter perpendicular to it). Accurate and repeatable methods to cal-culate tumor volume are therefore an important aspect of clinicalcare.
The rest of this article is organized as follows: Section 2 presents theresults of our experiments. Section 3 discusses the performance of theproposed approach, concludes the contribution and outlines areasfor future work. Finally, Section 4 presents the material and themethods.
ResultsThe goal of this study was to evaluate the utility of 3D Slicer forsegmentation of GBMs compared to manual slice-by-slice segmenta-tion. We used two metrics for this evaluation: a) the time it took forphysicians to segment GBMs manually vs. using 3D Slicer, b) theagreement between the two segmentations. In using these metrics toevaluate our results, our assumption is that if 3D Slicer can be used toproduce GBM segmentations that are statistically equivalent to whatthe physicians achieve manually, and in substantially less time, thenthe tool is useful for volumetric follow-ups of GBM patients. Overall,four physicians participated in our study: three physicians providedthe manual slice-by-slice segmentations and one physician has beentrained in a Slicer-based segmentation as described in the methodssection. The results of our study are detailed in Table 1, the primaryconclusion of which is that 3D Slicer based GBM segmentation can beperformed in about 60% of the time, and with acceptable agreement(DSC: 88.43 6 5.23%, HD: 2.32 6 5.23 mm) to manual segmenta-tion by a qualified physician. In Table 1, The MT column shows thetime (in minutes) it took a physician to segment each of ten GBMs onslice-by-slice basis. The SlicerT column shows the time (in minutes)it took a physician to segment it using 3D Slicer. The Slices columnshows the number of slices that the tumor spans in each case, as arough approximation of the complexity of the segmentation task.Note that 9 out of 10 cases, Slicer , MT, and on an average, the timeit took to segment with 3D Slicer was 61% of the time it took tosegment manually on a slice-by-slice basis. The columns DSC andHD show the agreement between the two segmentations using a DiceSimilarity Coefficient and Hausdorff Distance, respectively.
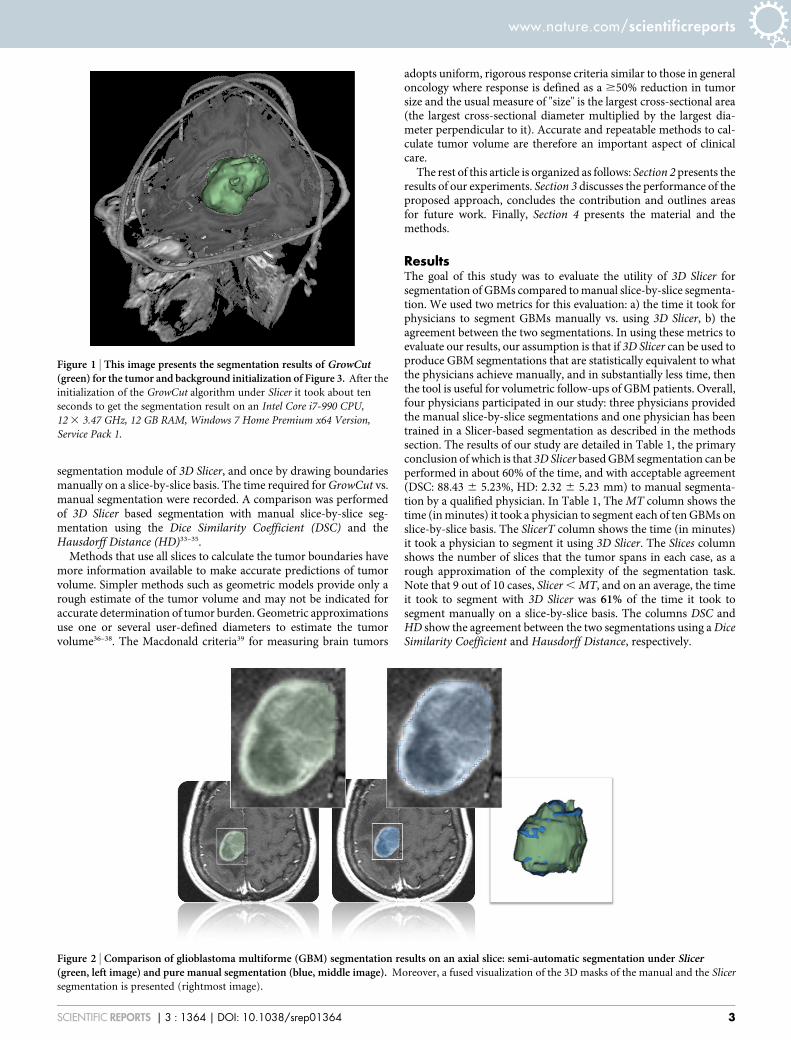
Figure 1 | This image presents the segmentation results of GrowCut(green) for the tumor and background initialization of Figure 3. After the
initialization of the GrowCut algorithm under Slicer it took about ten
seconds to get the segmentation result on an Intel Core i7-990 CPU,
12 3 3.47 GHz, 12 GB RAM, Windows 7 Home Premium x64 Version,
Service Pack 1.
Figure 2 | Comparison of glioblastoma multiforme (GBM) segmentation results on an axial slice: semi-automatic segmentation under Slicer(green, left image) and pure manual segmentation (blue, middle image). Moreover, a fused visualization of the 3D masks of the manual and the Slicer
segmentation is presented (rightmost image).
www.nature.com/scientificreports
SCIENTIFIC REPORTS | 3 : 1364 | DOI: 10.1038/srep01364 3

To provide readers with a point of comparison on how DSC andHD computations vary between expert raters, we include in Table 2some statistics that we published in another article where we ana-lyzed the results of 12 manual slice-by-slice GBM segmentations by 3neurosurgeons40,41.
In addition to the quantitative results, we present sample GBMsegmentation results in Figures 1 and 2 for visual inspection. Figure 1shows the results of the 3D Slicer GrowCut function (for the tumorand background initialization shown in Figure 3). The rendered 3Dtumor segmentation is superimposed (green) on three orthogonalcross-sections of the data. Figure 2 presents the direct comparison of3D Slicer vs. manual segmentation on an axial slice: the semi-automatic segmentation under 3D Slicer (green) is shown on the leftside of the figure and the pure manual segmentation (blue) is shown
in the middle of the figure. A fused visualization of the 3D masks ofthe manual and the Slicer segmentations are displayed on the rightside of the figure.
DiscussionWe observed that the automatic segmentation results produced by3D Slicer (GrowCut) typically required some additional editing onsome slices to achieve the desired boundary and the time required forthis manual correction is included in our measurements. Manualsegmentation by neurosurgeons took three to nineteen minutes(mean: ten minutes), in contrast to the semi-automatic segmentationwith the GrowCut implementation under 3D Slicer that took about60% of that time (mean: five minutes) including the time needed forediting the GrowCut results.
Figure 3 | These images present a typical user initialization for glioblastoma multiforme (GBM) segmentation under Slicer with GrowCut: axial(left image) sagittal (second image from the left), and coronal (third image from the left). Besides, a 3D visualization of all three slices is presented
(rightmost image). Note: the tumor has been initialized in green and the background has been initialized in yellow.
Figure 4 | Detailed workflow of the segmentation process that is used in the training and the evaluation phase (left). The segmentation process starts
with the initialization of the GrowCut algorithm by the user on an axial, sagittal and coronal slice. Then, the automatic segmentation is started and
afterwards reviewed by the user. This results into the refinement phase where the Editor tools under Slicer are used to correct the automatic segmentation
result – mostly by navigating along the axial slices. During the evaluation phase the time for the initialization and the refinement has been measured. The
overall workflow of the proposed study is presented on the right side; it starts with the image data and ends with the training or the evaluation process.
Therefore, the data is divided into two pools of data sets: the training data set and the evaluation data set. The segmentation process is for both stages the
same. However, for the evaluation phase further image processing (voxelization and volume calculation) is required to calculate the Dice Similarity
Coefficient (DSC) and the Hausdorff Distance (HD) for a quantitative evaluation.
www.nature.com/scientificreports
SCIENTIFIC REPORTS | 3 : 1364 | DOI: 10.1038/srep01364 4
To quantify the quality of the GrowCut algorithm, we per-formed intra- and inter-physician segmentations40,41. The resultsalso provided an upper segmentation threshold and therefore aquality measure for our algorithm. For the intra-physician seg-mentation, a neurosurgeon segmented twelve glioblastoma multi-forme. After two weeks, the same neurosurgeon segmented thesetwelve cases again. The detailed results are presented in Table 2and provide a mean value m and a standard deviation s of 90.29 6
4.48% with a minimal Dice Similarity Coefficient of 84.01% anda maximal Dice Similarity Coefficient of 96.30% (see the firstcolumn). Finally, Table 2 also shows inter-physician segmentationresults for the twelve glioblastoma multiforme (see the second andthird columns). Therefore, the segmentation of the neurosurgeonsY and Z have been compared with the segmentations of neuro-surgeon X. It is evident that there is an upper threshold with aDice Similarity Coefficient of around ninety percent for the man-ual intra- and inter-physician segmentations (average DSC whencompared with an automatic segmentation: 79.96 6 8.06% (neu-rosurgeon X), 77.79 6 8.49% (neurosurgeon Y) and 76.83 6
13.67% (neurosurgeon Z)). The DSC of 90% can be thought ofas a metric for estimating how well an automatic segmentationresult is performing relative to the range of performance ofexperts, and perhaps also can serve as an indicator for how much
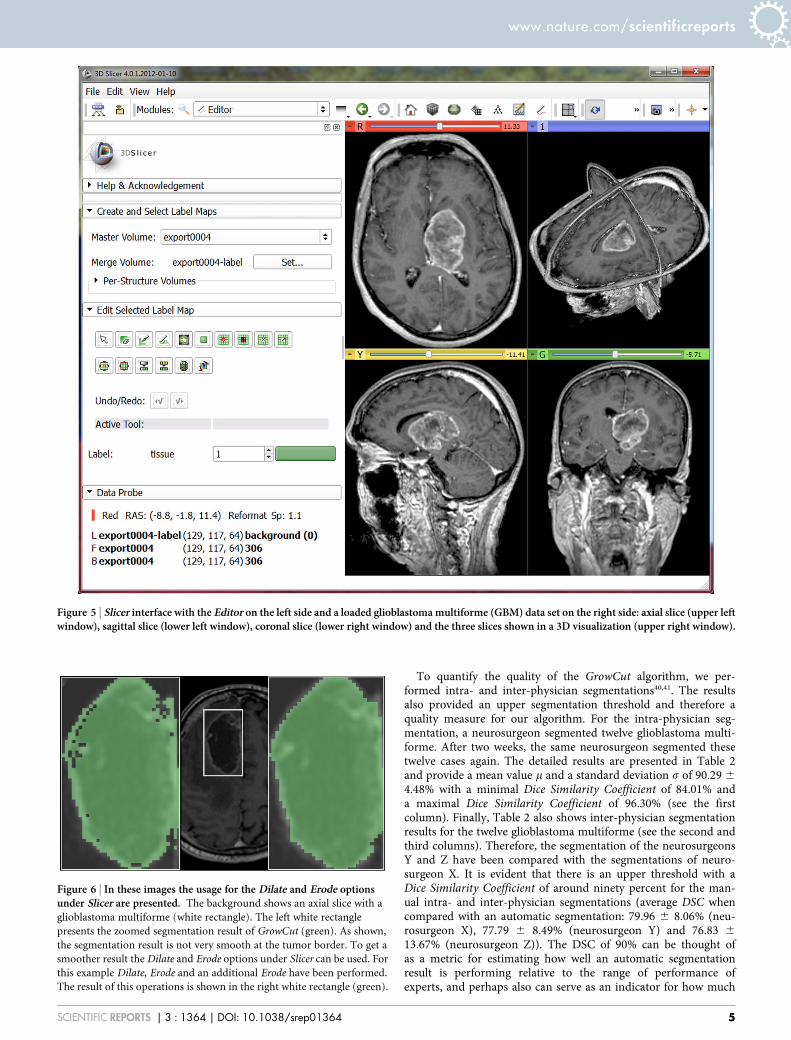
Figure 5 | Slicer interface with the Editor on the left side and a loaded glioblastoma multiforme (GBM) data set on the right side: axial slice (upper leftwindow), sagittal slice (lower left window), coronal slice (lower right window) and the three slices shown in a 3D visualization (upper right window).
Figure 6 | In these images the usage for the Dilate and Erode optionsunder Slicer are presented. The background shows an axial slice with a
glioblastoma multiforme (white rectangle). The left white rectangle
presents the zoomed segmentation result of GrowCut (green). As shown,
the segmentation result is not very smooth at the tumor border. To get a
smoother result the Dilate and Erode options under Slicer can be used. For
this example Dilate, Erode and an additional Erode have been performed.
The result of this operations is shown in the right white rectangle (green).
www.nature.com/scientificreports
SCIENTIFIC REPORTS | 3 : 1364 | DOI: 10.1038/srep01364 5
manual post-editing will be required after the automatic seg-mentation is performed.
In this paper, the evaluation of glioblastoma multiforme seg-mentation with the free and open source medical image analysissoftware 3D Slicer has been presented. Slicer provides a semi-automatic, 3D segmentation algorithm, GrowCut, that is a viablealternative to the time-consuming process of volume determinationduring monitoring of a patient, for which slice-by-slice contouringhas been the best demonstrated practice. Editing tools available in 3DSlicer are used for manual editing of the results upon completion ofthe automatic GrowCut segmentation. The volume of the 3D tumoris then computed and stored as an aide for the surgeon in decisionmaking for comparison with follow-up scans. This segmentation hasbeen evaluated on 10 GBM data sets against manual expert segmen-tations using the Dice Similarity Coefficient (DSC) and the HausdorffDistance (HD). Additionally, intra-physician segmentations havebeen performed to provide a quality measure of the presented evalu-ation. In summary, the achieved research highlights of the presentedwork are:
. Manual slice-by-slice segmentations of glioblastoma multiforme(GBM) have been performed by clinical experts to obtain groundtruth of tumor boundaries and estimates of rater variability.
. Physicians have been trained in segmenting glioblastoma multi-forme with GrowCut and the Editor module of 3D Slicer.
. Trained physicians used Slicer to segment a glioblastoma multi-forme evaluation set.
. Semi-automatic segmentation times have been measured forGrowCut based segmentation in 3D Slicer.
. Dice Similarity Coefficient (DSC) and Hausdorff Distance (HD)have been calculated to evaluate the quality of the segmentations.
There are several areas for future work. In particular, some steps ofthe segmentation workflow under Slicer can be automated. Instead ofinitializing the foreground on three single 2D slices, a single 3Dinitialization could be used by means of generating a sphere aroundthe position of the user-defined seed point. Additionally, the algo-rithm can be enhanced with statistical information about the shape42
and the texture of the desired object43 to improve the automaticsegmentation. Furthermore, we plan to evaluate the method onmagnetic resonance imaging (MRI) data sets with World HealthOrganization grade I, II and III gliomas. As compared to high-gradegliomas, low-grade tumor MR images lack gadolinium enhance-ment. Thus, for these tumors, outlines cannot be expressed by con-trast-enhancing T1-weighted images, but by surrounding edema inT2-weighted images. In addition, we want to study how Slicer can beused to enhance the segmentation process of vertebral bodies.Besides, we want to apply the scheme to segment other organs andpathologies. Moreover, we are considering improving the algorithmby performing the whole segmentation iteratively; that is, after thesegmentation has been performed, the result of the segmenta-tion can be used as a new initialization for a new segmentation runwith the process repeated under user control. We anticipate that theiterative approach will result in more robustness with respect toinitialization.
MethodsData. Ten diagnostic T1-weighted MRI scans with gadolinium enhancement wereused for segmentation. These were acquired on a 1.5 Tesla MRI scanner (SiemensMAGNETOM Sonata, Siemens Medical Solutions, Erlangen, Germany) using astandard head coil. Scan parameters were: TR/TE 2020/4.38 msec, isotropic matrix,1 mm; FOV, 250 3 250 mm; 160 sections.
Software. For the semi-automatic segmentation work in this study we used 3D Slicer4.0, which is freely downloadable from the website http://www.slicer.org.
Manual segmentation of each data set was performed on a slice-by-slice basis byneurosurgeons at the University Hospital of Marburg in Germany (Chairman: Prof.Dr. Ch. Nimsky) with several years of experience in the resection of gliomas (note: ifthe tumor border was very similar between consecutive slices, the software allowedthe user to skip manual segmentation in each slice, and instead interpolated theboundaries in these areas). The software used for this manual contouring providedsimple contouring capabilities, and was created by us using the medical prototypingplatform MeVisLab (see http://www.mevislab.de/). The hardware platform used wasan Intel Core i5-750 CPU, 4 3 2.66 GHz, 8 GB RAM, Windows XP Professional 364Version, Version 2003, Service Pack 2.
GrowCut segmentation in 3D Slicer. The GrowCut is an interactive segmentationalgorithm based on the idea of cellular automaton. The algorithm achieves reliableand reasonably fast segmentation of moderately difficult objects in 2D and 3D usingan iterative labeling procedure resembling competitive region growing. A user’sinteractions results in a set of seed pixels which in turn try to assign their labels to theirpixel neighborhood. A pixel is assigned the label of its neighbor when the similaritymeasure of the two pixels weighted by the neighboring pixel’s weight or ‘‘strength’’exceeds its current weight. Label assignment also results in an update of the pixel’sweight. The labeling procedure continues iteratively until a stable configuration isreached when modification of the pixel labels is no longer possible. The algorithm issimple to use requiring no additional inputs from the user besides the painted strokeson the apparent foreground and background. Furthermore, the user can modify thesegmentation by adding additional labels in the image, thereby influencing thesegmentation result.
Our implementation of the algorithm in 3D Slicer consists of a GUI front-end toenable interactions of the user with the image and an algorithm back-end where thesegmentation is computed. We employ a minimal interface, where the user interactsby painting on the image. The algorithm requires labeling with at least two differentcolors (for a foreground and a background label class). The naıve implementation ofthe algorithm would require every pixel to be visited in each iteration. Furthermore, apixel will need to visit every one of its neighbors to update the pixel strengths andlabels. Such an implementation would be computationally expensive especially forlarge 3D images. We implemented the following techniques for speeding up thesegmentation. First, as the user may be interested only in segmenting out a small areain the image, the algorithm computes the segmentation only within a small region ofinterest (ROI). The ROI is computed as a convex hull of all user labeled pixels with anadditional margin of approximately 5% for our study. Second, the iterations involvingthe image are executed in multiple threads, such that several small regions of theimage are updated simultaneously (note: the implementation is multithreaded andautomatically makes use of all the cores of the computer). Finally, the similaritydistance between the pixels are pre-computed once and reused. Also the algorithmkeeps track of saturated pixels (those whose weights and therefore labels can nolonger be updated) and avoids the expensive neighborhood computation on thosepixels. Keeping track of such pixels also helps to determine when to terminate thealgorithm.
GBM segmentation using 3D Slicer. After trials of the various segmentation facilitiesavailable in Slicer, we determined that the use of GrowCut followed by morphologicaloperations such as erosion, dilation, and island removal provides the most efficientsegmentation method for GBMs from gadolinium enhanced T1 images. As shown inFigure 4, we used the following workflow to perform GBM segmentation: 1) load thedata set into Slicer 2) initialization of an area inside the tumor, and a stroke drawnoutside the tumor with a brush size of about 1 cm 3) automatic competing region-growing using GrowCut, and 4) usage of Editing tools like dilation, erosion, and islandremoval or pure manual refinement after visual inspection of results (note: the usersare responsible for qualitatively deciding how much dilation, erosion and islandremoval are required for the segmentation). Figure 5 shows the Slicer Editor moduleuser interface on the left side and a loaded GBM data set on the right side. Figure 3presents a typical user initialization for GrowCut on the axial, sagittal and coronalcross-sections. Figure 6 shows the results of subsequent erosion followed by a dilation,and Figure 1 shows the results of the GrowCut method.
The hardware platform used was an Apple MacBook Pro (4 Intel Core i7, 2.3 GHz,8 GB RAM, AMD Radeon HD 6750 M, Mac OS 3 10.6 Snow Leopard).
Measurement of segmentation time. We measured the time taken by the samephysician to segment manually vs. the 3D Slicer method. Within the 3D Slicersegmentation, we separately measured the time taken by each of the three steps(initialization, GrowCut, refinement using morphological operations) of the 3D Slicermethod (see left chart of Figure 4).
Metrics for comparison between 3D Slicer and manual segmentation. Theresulting segmentations from both methods were saved as binary volumes, and theagreement between the two was compared using the Dice Similarity Coefficient andthe Hausdorff Distance.
The Dice Similarity Coefficient (DSC) of agreement between two binary volumes iscalculated as follows:
DSC ~2:V(A\R)
V(A)zV(R)ð1Þ
The DSC measures the relative volume overlap between A and R, where A and R arethe binary masks from the automatic (A) and the reference (R) segmentation. V(?) is
www.nature.com/scientificreports
SCIENTIFIC REPORTS | 3 : 1364 | DOI: 10.1038/srep01364 6
the volume (in mm3) of voxels inside the binary mask, by means of counting thenumber of voxels, then multiplying with the voxel size.
The Hausdorff Distance (HD) between two binary volumes is defined in terms ofthe Euclidean distance between the boundary voxels of the masks. Given the sets A (ofthe automatic segmentation) and R (of the reference segmentation) that consist of thepoints that correspond to the centers of segmentation mask boundary voxels in thetwo images, the directed HD h(A,R) is defined as the minimum Euclidean distancefrom any of the points in the first set to the second set, and the HD between the twosets H(A,R) is the maximum of these distances:
h(A,R) ~max
a[Ad(a,R)ð Þ, where d(a,R) ~
min
r[Ra{rk k
H A,Rð Þ~ max h A,Rð Þ,h R,A,ð Þð Þð2Þ
1. Kleihues, P. et al. The WHO classification of tumors of the nervous system.Journal of Neuropathology & Experimental Neurology 61(3), 215–229 (2002).
2. Kortmann, R. D., Jeremic, B., Weller, M., Plasswilm, L. & Bamberg, M.Radiochemotherapy of malignant gliom in adults. Clinical experiences.Strahlenther Onkol. 179(4), 219–232 (2003).
3. Lacroix, M. et al. A multivariate analysis of 416 patients with glioblastomamultiforme: Prognosis, extent of resection and survival. Journal of Neurosurgery95, 190–198 (2001).
4. Szwarc, P., Kawa, J., Bobek-Billewicz, B. & Pietka, E. Segmentation of BrainTumours in MR Images Using Fuzzy Clustering Techniques. Proceedings ofComputer Assisted Radiology and Surgery (CARS), Geneva, Switzerland (2010).
5. Zou, K. H. et al. Statistical Validation of Image Segmentation Quality Based on aSpatial Overlap Index: Scientific Reports. Academic Radiology 11(2), 178–189(2004).
6. Sampat, M. P. et al. Measuring intra- and inter-observer agreement in identifyingand localizing structures in medical images. IEEE Inter Conf Image Processing, 4pages (2006).
7. Angelini, E. D. et al. Glioma Dynamics and Computational Models: A Review ofSegmentation, Registration, and In Silico Growth Algorithms and their ClinicalApplications. Current Med. Imaging Rev. 3, 262–76 (2007).
8. Gibbs, P. et al. Tumour volume determination from MR images by morphologicalsegmentation. Physics in Med. & Biology 41(11), 2437–46 (1996).
9. Letteboer, M. M. J. et al. Segmentation of tumors in magnetic resonance brainimages using an interactive multiscale watershed algorithm. Academic Radiology11, 1125–1138 (2004).
10. Droske, M. et al. An adaptive level set method for interactive segmentation ofintracranial tumors. Neurol Res 27(4), 363–70 (2005).
11. Clark, M. et al. Automatic tumor segmentation using knowledge-basedtechniques. IEEE Transactions on Medical Imaging (TMI) 17(2), 187–201 (1998).
12. Prastawa, M. et al. A brain tumor segmentation framework based on outlierdetection. Medical Image Analysis 8, 275–283 (2004).
13. Sieg, C., Handels, H. & Poppl, S. J. Automatic Segmentation of Contrast-EnhancedBrain Tumors in Multispectral MR-Images with Backpropagation-Networks (inGerman). Bildverarbeitung fur die Medizin (BVM), Springer Press, 347–351(2001).
14. Egger, J. et al. Nugget-Cut: A Segmentation Scheme for Spherically- andElliptically-Shaped 3D Objects. 32nd Annual Symposium of the GermanAssociation for Pattern Recognition (DAGM). LNCS 6376, 383–392, SpringerPress, Darmstadt, Germany (2010).
15. Egger, J., Kappus, C., Freisleben, B., & Nimsky, C. A Medical Software System forVolumetric Analysis of Cerebral Pathologies in Magnetic Resonance Imaging(MRI) Data. J Med Syst. 2012 Aug 36(4), 2097–10 (2012).
16. Boykov, Y. & Kolmogorov, V. An Experimental Comparison of Min-Cut/Max-Flow Algorithms for Energy Minimization in Vision. IEEE Transactions onPattern Analysis and Machine Intelligence 26(9), 1124–1137 (2004).
17. Vezhnevets, V. & Konouchine, V. GrowCut-Interactive multi-label N-D imagesegmentation. Proc. Graphicon, 150–156 (2005).
18. Reese, L. Intelligent Paint: Region-Based Interactive Image Segmentation.Master’s thesis, Department of Computer Science, Brigham Young University,Provo, UT (1999).
19. Mortensen, E. N. & Barrett, W. A. Interactive segmentation with intelligentscissors. Graphical Models and Image Processing 60(5), 349–384 (1998).
20. Mortensen, E. N. & Barrett, W. A. Toboggan-based intelligent scissors with afour-parameter edge model. IEEE Conference on Computer Vision and PatternRecognition (CVPR), pages 2452–2458 (1999).
21. Boykov, Y. & Jolly, M.-P. Interactive graph cuts for optimal boundary and regionsegmentation of objects in n-d images. Proceedings of the International Conferenceon Computer Vision (ICCV), volume 1, pages 105–112 (2001).
22. Rother, C., Kolmogorov, V. & Blake, A. Grabcut-interactive foreground extractionusing iterated graph cuts. Proceedings of ACM Siggraph (2004).
23. Moga, A. & Gabbouj, M. A parallel marker based watershed transformation. InIEEE International Conference on Image Processing (ICIP), II, 137–140 (1996).
24. Grady, L. & Funka-Lea, G. Multi-label image segmentation for medicalapplications based on graph-theoretic electrical potentials. ECCV WorkshopsCVAMIA and MMBIA, 230–245 (2004).
25. Heimann, T., Thorn, M., Kunert, T. & Meinzer, H.-P. New methods for leakdetection and contour correction in seeded region growing segmentation. In 20th
ISPRS Congress, Istanbul 2004. International Archives of Photogrammetry andRemote Sensing, vol. XXXV, 317–322 (2004).
26. Egger, J., Colen, R., Freisleben, B. & Nimsky, C. Manual Refinement System forGraph-Based Segmentation Results in the Medical Domain. J Med Syst. 2012 Oct36(5), 2829–39 (2011).
27. Egger, J. et al. A Flexible Semi-Automatic Approach for Glioblastoma multiformeSegmentation. Proceedings of International Biosignal Processing Conference,Charite, Berlin, Germany, 4 pages (2010).
28. Zukic, D. et al. Glioblastoma Multiforme Segmentation in MRI Data with aBalloon Inflation Approach. Proceedings of 6th RB Conference on Bio-MedicalEngineering, State Technical University, Moscow, Russia, 4 pages (2010).
29. Cohen, L. D. On active contour models and balloons. CVGIP: ImageUnderstanding 53(2), 211–218 (1991).
30. Egger, J. et al. Square-Cut: A Segmentation Algorithm on the Basis of a RectangleShape. PLoS One 7(2), e31064. Epub Feb 21 (2012).
31. Fedorov, A. et al. 3D Slicer as an Image Computing Platform for the QuantitativeImaging Network. Magnetic Resonance Imaging 2012; July PMID: 22770690(2012).
32. Egger, J., Kapur, T., Nimsky, C. & Kikinis, R. Pituitary Adenoma Volumetry with3D Slicer. PLoS ONE 7(12), e51788 (2012).
33. Hausdorff, F. Grundzuge der Mengenlehre. Veit & Comp., Leipzig 1914 (rep. inSrishti D. Chatterji et al. (Hrsg.), Gesammelte Werke, Band II, Springer, Berlin,ISBN 3-540-42224-2 (2002).
34. Rockafellar, R. T. & Wets, R. J.-B. Variational Analysis. Springer, page 117, ISBN3540627723, ISBN 978-3540627722 (2005).
35. Huttenlocher, D. P., Klanderman, G. A. & Rucklidge, W. J. Comparing imagesusing the Hausdorff distance. IEEE Transactions on Pattern Analysis and MachineIntelligence 15(9), 850–863 (1993).
36. Jimenez, C. et al. Follow-up of pituitary tumor volume in patients with acromegalytreated with pegvisomant in clinical trials. European Journal of Endocrinology 159,517–523 (2008).
37. Nobels, F. R. E. et al. Long-term treatment with the dopamine agonist quinagolideof patients with clinically non-functioning pituitary adenoma, in European.Journal of Endocrinology 143, 615–621 (2000).
38. Korsisaari, N. et al. Blocking Vascular Endothelial Growth Factor-A Inhibits theGrowth of Pituitary Adenomas and Lowers Serum Prolactin Level in a MouseModel of Multiple Endocrine Neoplasia Type 1. Clinical Cancer Research, January1 14(1), 249–258 (2008).
39. Macdonald, D. R., Cascino, T. L., Schold, S. C. Jr. & Cairncross, J. G. Responsecriteria for phase II studies of supratentorial malignant glioma. J Clin Oncol. 8(7),1277–80 (1990).
40. Egger, J., Bauer, M. H. A., Kuhnt, D., Freisleben, B. & Nimsky, C.Min-Cut-Segmentation of WHO Grade IV Gliomas Evaluated against ManualSegmentation. XIX Congress of the European Society for Stereotactic andFunctional Neurosurgery, Athens, Greece (2010).
41. Egger, J. et al. Evaluation of a Novel Approach for Automatic VolumeDetermination of Glioblastomas Based on Several Manual Expert Segmentations.Proceedings of 44. Jahrestagung der DGBMT, Rostock, Germany (2010).
42. Cootes, T. F. & Taylor, C. J. Active Shape Models-‘Smart Snakes’. Proceedings ofthe British Machine Vision Conference, pages 266–275(1992).
43. Cootes, T. F. & Taylor, C. J. Statistical Models of Appearance for ComputerVision. Technical report, University of Manchester (2004).
AcknowledgementsThe authors would like to thank the physicians: Dr. med. Barbara Carl, Rivka Colen, M.D.,Christoph Kappus and Dr. med. Daniela Kuhnt for performing the manual segmentationsof the medical images and participating in the study. The authors would also like to thankthe members of the Slicer Community for their contributions. Furthermore, the authorswould like to thank Fraunhofer MeVis in Bremen, Germany, for their collaboration andespecially Prof. Dr. Horst K. Hahn for his support.This project was supported by the National Center for Research Resources (P41RR019703)and the National Institute of Biomedical Imaging and Bioengineering (P41EB015898,U54EB005149, R03EB013792) of the National Institutes of Health. Its contents are solelythe responsibility of the authors and do not necessarily represent the official views of theNIH.
Author contributionsConceived and designed the experiments: J.E. & A.F. Performed the experiments: J.E. & A.F.Analyzed the data: J.E. & A.F. Contributed reagents/materials/analysis tools: J.E., T.K., A.F.,S.P., J.V.M., H.V., B.F., A.J.G., C.N. & R.K. Wrote the paper: J.E., T.K. & S.P.
Additional informationCompeting financial interests: The authors declare no competing financial interests.
License: This work is licensed under a Creative CommonsAttribution-NonCommercial-ShareALike 3.0 Unported License. To view a copy of thislicense, visit http://creativecommons.org/licenses/by-nc-sa/3.0/
How to cite this article: Egger, J. et al. GBM Volumetry using the 3D Slicer Medical ImageComputing Platform. Sci. Rep. 3, 1364; DOI:10.1038/srep01364 (2013).
www.nature.com/scientificreports
SCIENTIFIC REPORTS | 3 : 1364 | DOI: 10.1038/srep01364 7