Practice Drills with Fact Dash - Penn Hills School District
395
Note: To view a listing of the document titles, select Bookmarks from the tabs on the left.
-
Upload
khangminh22 -
Category
Documents
-
view
1 -
download
0
Transcript of Practice Drills with Fact Dash - Penn Hills School District

Note: To view a listing of the document titles, select Bookmarks from the tabs on the left.

Fact Dash

Practice Drills with Fact DashFact Dash provides drill-like math sessions students can use to practice math skills. It offers timed and untimed sessions in each of the four mathoperations and in combination operations of addition/subtraction andmultiplication/division. Fact Dash also offers basic feedback by providingstudents with a tally screen detailing the results of their session. The tallyscreen is also available in a slightly expanded form to teachers.
Starting Fact DashFact Dash is automatically installed with Math Traveler. Refer to the steps inthe discussion titled “Installing Math Traveler” in the “Installation and Setup”section. Students should use the following steps to start Fact Dash.
Grade 2 • Practice Drills with Fact Dash 61

Macintosh and Windows1. Macintosh — Students open the hard drive folder on the computer.
Next, they open the folder titled McGraw-Hill School or the folder inwhich the product is installed, and then open the Math Traveler folder.
Students double-click the Fact Dash alias to start the program. An introductory screen appears.
Windows — From the Start button on the taskbar, students use the cursorto point to Programs. Then they point to and open the McGraw-Hill Schoolfolder. Next, they point to and open the Math Traveler folder. Students clickFact Dash. An introductory screen appears.
2. Students click Go to start Fact Dash. A Sign-in screen appears. If studentshave not signed in to Fact Dash before, they should type their name in thelist and click OK.
If their name is already on the list because they have used Fact Dash before,they simply select their name and click OK.
3. When the Fact Dash Operations screen appears, students click the mathoperation they want to practice.
Students can click the Back arrow to allow a different student to sign in.
62 McGraw-Hill Mathematics Math Traveler
Students can choose one of sixcategories: four are single-operationactivities, and twofeature combinedoperations.

After students type their name the first time, Math Traveler saves it so theycan simply select it from the list the next time.
4. Then, students click a group of math facts they want to practice.
5. Before the Fact Dash session begins, students need to select how the mathproblems should appear and, if they’re running a timed session, how long itshould run.
The default format is vertical and the default time is 3 minutes.
Using the default settings: To use the default settings, students click OKand the Fact Dash session begins.
Changing the default format: Students click either the horizontal or verticalformat.
Changing the default time: Students click the arrows to choose a timedsession of 1-10 minutes.
6. If students did not use the default settings, after they make their choices,they click OK to begin the Fact Dash session.
Students select how they want the mathproblems to appear in Fact Dash.
Grade 2 • Practice Drills with Fact Dash 63
Students haveseveral choices fortimed sessions…
…they can acceptthe 3-minutesetting…
…they can click thearrows to choose adifferent timedsetting…
…or they can clickhere to run anuntimed Fact Dashsession.

Introducing Fact Dash to StudentsFact Dash directions are not spoken so you may want to take students througha practice session before they begin. In particular, be sure to review how to seta timed session, how to choose a format, the different ways that students canenter their answers, and how to use the Restart, Clear, and Skip buttons.
Entering Answers in Fact DashThere are two ways for students to enter answers in Fact Dash. Students canpress numbers on the keyboard or they can use the mouse to click numbersonscreen.
Using the KeyboardTo answer Fact Dash questions using the keyboard, students simply type theirresponse and press Return (Macintosh) or Enter (Windows).
● Students press the Delete key to erase an incorrect answer.
● Students can skip a question simply by not typing a response and pressingReturn or Enter. Once they have skipped a question, they can’t return to it.
64 McGraw-Hill Mathematics Math Traveler

Clicking Buttons on the ScreenTo answer Fact Dash questions using the mouse, students click the answerfrom the set of numbers that appears at the bottom edge of the screen. After they click an answer, students click OK.
● Students can click the Clear button to erase an incorrect answer.
● Students can click Skip on the screen to move past a question withoutanswering it. Once they have skipped a question, they can’t return to it.
Students click Restart to go back to the Fact Dash Operations screen.
Grade 2 • Practice Drills with Fact Dash 65
If a timed session isrunning, the timeremaining appearshere.
Students click Skip tomove past a questionwithout answering it.
Students click Clear to erase their answer.

Student Self-AssessmentWhen time runs out in a session or when the student completes questions inan untimed session, a tally screen appears showing students their score in theFact Dash session. Students click Print to print the screen.
Students click Go to see details about their session. The detailed view showsthe problems that students answered incorrectly as well as those they skipped.When students click Go from the Details screen, a screen appears where theycan choose Practice Some More or Quit.
If students click Practice Some More, they return to the Fact Dash Operationsscreen.
Monitoring Student AchievementFact Dash offers a simple utility that allows you to monitor studentachievement. To access the utility, start Fact Dash and press -T (Macintosh) or Ctrl-T (Windows) when the Sign-in screen appears.
On the next screen that appears, you can click one of three options: View a Student’s Records, Delete a Student, and Delete All Students.
Students clickhere to exit Fact Dash.
Students clickhere to print the tally screen.
Students clickhere to get moredetails about theproblems theymissed.
66 McGraw-Hill Mathematics Math Traveler

View a Student’s RecordsClick this button so you can view work from each of the Fact Dash sessions.
Select the student whose work you want to review and click OK. A tally screenfrom the student’s most recent session will appear.
DetailClick this button to open a screen that shows the problems answeredincorrectly as well as those that were skipped.
SummaryClick this button to return to the tally screen.
PreviousClick this button to review the student’s previous Fact Dash sessions.
NextClick this button to review the student’s additional Fact Dash sessions.
PrintClick this button to print the tally and detail screens.
Grade 2 • Practice Drills with Fact Dash 67
The title shows the math operationand fact set.
Teachers can see the tally of a student’s Fact Dash session.

QuitClick this button to exit Fact Dash. A message will appear confirming that youwant to quit.
StudentClick this button to review another student’s scores in Fact Dash. A student name screen will appear.
Main MenuClick this button to return to the main teacher utility screen.
68 McGraw-Hill Mathematics Math Traveler


FOLLOW THESE EASY STEPSTO GET A FAST START:
1. Sign up your team members.a) Write your name on the Master Sheet.b) Use this pre-assigned User ID and Password
when you log on at www.firstinmath.com.c) Write the first player’s name
in the space under 01(team name).d) Peel off the label next to her name
on the Master Sheet and stick it on the back of the membership card.
e) Write that player’s name on the front of a membership card and giveit to the player. She can now log on to www.firstinmath.com and begin to play!
f) Repeat c) to e) above for all yourstudents so they can begin right away.
2. Go to www.firstinmath.com.Type in your User ID and Password(see 1b above). Click “Go.” You will be taken to a “Program Status” page (which shows the total number of stickers earned by First In Math® teams.) Click “Go.”
3. Register your class to viewassessment reports.a) Enter your first and last name. b) Enter or edit your school’s information.c) Enter your e-mail address (required).d) Confirm that the User ID and Password
listed match those on your Master Sheet.You may change your Password at any time.
e) Name your class.f) Select your classroom grade level (required).g) Click “Submit.” You are now registered.
T E A C H E R I N S T R U C T I O N S
Team Leader/Teacher Master Sheet
Player Membership Card
www.firstinmath.comHome Page
TeacherWelcome Page
www.firstinmath.comC L A S S R O O M K I T

Graph Club

A Sensational Graphing Tool for Elementary Grades.
Tom Snyder Productions®
™

The Graph Club Teacher’s Guide
2
CreditsPublisher: Richard Abrams
Editor-in-Chief: David Dockterman
The Graph Club™ was designed by Peggy Healy Stearns, Ph.D.
Original Macintosh VersionImplementation and additional design: Shawn Cokus
Product Manager: Bruce Michael GreenAssistant Product Manager: Peter Reynolds
Updated Macintosh VersionProgramming support and adaptation: Sean Nolan
Product Manager: Laurel Kayne
Windows VersionProduct Manager: Jessica Adler
Software Project Leader: Jim ParkSoftware Engineers: Bryan Dube, Eric VanHelene
Software Technical Leader: Bruce RosenblumProgramming Support: Eytan Bernet
EditorialDocumentation: Research/Writing/Editorial: Peggy Healy Stearns
Managing Editor: Annette DonnellyProofreading: Janet Reynolds
Suggested Reading List: Mary Jo Melvin
Art and DesignProgram Graphics and Icons: Robert Thibeault, Robert Keough, Liz Hurley
Design & Production: Laurie Bennett, Sharon LeBoeuf-Dubois, Christine BarieTeacher Guide Illustrations: Peter Hamilton Reynolds
Music: Gerry and Gordy Stearns
Thanks to the team at Tom Snyder ProductionsSam Ackerman, Cam Ackland, Carl W. Adams, Jessica Adler, Chris Akelian, Martha Akers, Anthony Allen, Seth Alpert, Julie Angorn,
Maxim Antinori, Eytan Bernet, Loren Bouchard, Max Coniglio, Amy Conklin, Jennifer Connelly, Becky Conners, Robert Daley,Aldina Dias, Peter Elarde, Bill Eldridge, Hedrick Ellis, Peter Erwin, Carrie Finison, Maria Flanagan, Chris Georgenes,
Rebecca Georgenes, Lisa Gillim, Pip Gilmour, Sharon Glick, Rishava Green, Naomi Angorn Halpern, Lisa Hamanaka,Arlene Hawkins, Lisa Heaney, Niki Hebert, Ruta Kulbis, Michelle Lauder, Annette Cate LeBlanc, Karen LeBlanc, Richard Luongo,
André Lyman, Amy MacDonald-Ronayne, Kathy Manning, Lisa Marenghi, Christie McQueen, Melissa Mixer, Peter Mullin,Kim O’Neil, James Reidy, Sandy Reilly, Ivan Rhudick, John Rielly, Jenny Robinson, John Sacco, Jessica Sandel, Paul Santucci,
Jennifer Schulman, Tom Snyder, Mark Usher, Steven Veverka, Kathleen Weller, Christopher Werler, Jim Woodell, and Amy Yau
Special thanks to the following educators:Judi Adams, Ellen Baru, Diane Boehm, Karen Bryant, Gary Carnow, Barbara Chmura, Frances Curcio, Bob Densmore,
Lori Deuchar Yum, Pat Dolan, Chris Dowd, Peter Flyzik, Mirium Furst, Lori Gern, Marianne Handler, Meg Henderson,Frances Malloway, Michelle Marriott, Kam Matray, Paula McGirr, Pat Messina, Karen Michalak, Marilyn Nicholson,
Ted Perry, Linda Polin, Joe Proscia, Mary Vesneske, Judy Yacio
Copyright Notice© 1996–1998 Tom Snyder Productions, Inc. All rights reserved. The Graph Club is a trademark of Tom Snyder Productions, Inc.
Tom Snyder Productions is a registered trademark of Tom Snyder Productions, Inc.Macintosh is a registered trademark of Apple Computer, Inc. Windows is a registered trademark of Microsoft Corporation.
This document and the software described in it may not, in whole or part, be copied, photocopied,reproduced, translated, or reduced to any electronic medium or machine-readable form other than that
which has been specified herein without prior written consent from Tom Snyder Productions, Inc.
For further information about Tom Snyder Productions or for a free catalog, call us at
1-800-342-0236
♦
♦

3
The Graph Club Teacher’s Guide
ContentsThe Graph Club at a GlanceNotes from the Field .................................................. 4A Note from the Author............................................. 5What Is The Graph Club ? ........................................... 6Learning Objectives ................................................... 8
Getting StartedWhat You Get & What You Need .............................. 9Quick Install & Easy Start ....................................... 10WalkThrough .......................................................... 12Features & Functions ............................................... 19
Classroom Tips & ActivitiesUsing The Graph Club’s Four Modes......................... 27Graphing Ideas ......................................................... 34Sample Graphs & Activities ..................................... 37Choosing the Right Graph ....................................... 73Getting Started in the Primary Grades ..................... 74Working with Manipulatives .................................... 76Printing Ideas ........................................................... 79Authentic Assessment............................................... 80Reproducible Masters ............................................... 81Reading List: Counting ............................................ 96Reading List: Math & Language Arts ....................... 97
Index ..................................................................... 100

The Graph Club Teacher’s Guide
4
Notes from the FieldHundreds of educators have used The Graph Club in theirclassrooms. Here’s what they are saying:
“At last! Here is a truly flexible, easy-to-use, yet sophisticated ‘think-ing’ resource for both learning and teaching. As a learning resource,it’s perfect for individual and collaborative critical or creative thinkingactivities. As a teaching resource, it supports all the essential elementsof fine instruction both in and out of the math classroom.”
Kam Matray, Director, California Model Technology SchoolsProject, Monterey, California
“The Graph Club is OUTSTANDING! It makes graphs understandablefor students of all ages. It’s fun!”
Diane Boehm, Texas Computer Education Association Teacherof the Year 1992, Saint Andrew’s Episcopal School, Austin, Texas
“I feel The Graph Club will revolutionize the teaching of graphingskills at the primary level. It is easy and fun to create graphs, and I wasvery pleased at how well my Kindergartners analyzed the changestaking place as they placed the icons for their choices in the graph.Since they all were able to participate in the creation of the graph, theyfelt as though the graph reflected their thoughts and feelings. I postedthe graphs we made and the children remained highly interested inassessing the printouts long after the lessons were finished.”
Karen Bryant, Kindergarten Teacher, Apple Early LearningConnections Demonstration Site, Yorkshire Central Schools,Yorkshire, New York

5
The Graph Club Teacher’s Guide
A Note from the AuthorGraphs, like other kinds of pictures, tell a story at a glance.Most people would rather read a graph than a page full ofnumbers. And even though reading a graph takes only afraction of the time, one generally ends up with a much betterunderstanding of the data. In this age of information overload,when students come to our classrooms visually orientedanyway, graphs are a powerful adjunct to the written word.We can share this power with our students.
The Graph Club is designed to do just that. Its highly manipulativeand interactive environment can help children make the transi-tion from graphing with manipulatives to graphing in the ab-stract and help them see that the same data can be representeddifferently. Using The Graph Club, children learn to gather, sort,and classify information; they construct graphs, analyze theirdata, and print their graphs in multiple sizes. They learn to usegraphs to solve problems and make decisions, and they talkabout, write about, and share their graphs.
The Graph Club is an exciting and effective tool which can be usedin any area of the curriculum, from math and science to languagearts, social studies, and more. We hope you and your studentsfind The Graph Club a fun and motivating environment in whichto explore, play, think, and learn about the power of graphs.
Peggy Healy Stearns
The Graph Club Teacher’s Guide
6
What Is The Graph Club ?A Hands-on Graphing ToolThe Graph Club provides a motivating, manipulative environmentwithin which you can structure your entire graphing unit. It wasdesigned to help students in grades K–4 develop the ability toread and interpret graphs and use graphs to communicate infor-mation, answer questions, and solve problems. The Graph Clubassists children in making the transition from graphing withmanipulatives to graphing in the abstract and helps them under-stand the relationship between different representations of thesame data — e.g., picture graph, bar graph, line graph, circlegraph, and table. It is designed to support the NCTM standardsand encourage cooperative learning, problem solving, and cross-curricular integration.
Students learn that data comes from many sources and that it isused for a variety of purposes. Students can collect informationfrom class surveys, interviews, reading, and other research.They can use data to organize and communicate information,answer questions, make decisions, and solve problems.
A Flexible Curriculum ResourceThe Graph Club is a powerful, open-ended tool which can beused to support and enhance graphing activities across thecurriculum. The suggestions on pages 27–33 will give yousome ideas on how best to utilize the program. See pages34–36 for suggested graphing ideas.
Sample GraphsA set of 35 sample graphs — 25 Explore graphs and 10 Matchgraphs — have been included with the software. They covera variety of subjects and graphing skills. While it’s easy todesign your own graphs and activities, we’ve included thesesample graphs as ready-to-go graphing activities for busyteachers. See pages 37–72 for full-page printouts of the graphs.

7
The Graph Club Teacher’s Guide
Many Printing OptionsAll graphs can be printed in three sizes — standard, big book,or poster. A title box and a text box in the print option encour-age students to write about their graphs. Titles and descriptionscan be printed with the graphs and saved with the graph file.
Range of ApplicationsYou’ll discover that although The Graph Club was designedfor grades K–4, the program has exciting potential at the upperelementary and middle school levels. Circle graphs, for instance,can be labeled with whole numbers, fractions, or percents; opentwo views of the same circle graph, label each differently (e.g.,one with numbers and the other with fractions or percents) andyou have a powerful interactive environment for exploring therelationship between these numerical forms. This ability to viewthe same data in a variety of ways provides countless opportu-nities for sophisticated critical thinking and problem solvingactivities.

The Graph Club Teacher’s Guide
8
Learning ObjectivesContent GoalsStudents will create and interpret the following types of graphsin both concrete and abstract form:
✦ Tables✦ Picture graphs✦ Bar graphs✦ Line graphs✦ Circle graphs
Skill and Process GoalsStudents will develop the following math, problem solving,communication, cooperative learning and cross-curricular skills:
✦ Counting, adding, subtracting✦ Sorting and classifying✦ Comparing✦ Generating questions✦ Determining what information is needed to
answer a question✦ Collecting data via surveys, interviews, research,
and other means✦ Organizing data✦ Discovering patterns✦ Interpreting data✦ Using graphs to communicate information✦ Creating and interpreting abstract representations of data✦ Using graphs to solve problems✦ Using graphs to make decisions✦ Reading, writing and talking math

9
The Graph Club Teacher’s Guide
What You Get & What You NeedWhat You Get✦ The Graph Club software (disks or CD-ROM)
✦ Teacher’s Guide‚ including a software WalkThrough,a guide to Features & Functions, classroom suggestions,sample activities, and more.
What You Need
Optional Curriculum KitWe’ve developed a complete, interdisciplinary graphingcurriculum for use with The Graph Club. It is based on anoriginal chapter book and contains 100 ready-to-use graphingactivities. The Graph Club Curriculum Kit includes a softwaretemplate disk which works with this version of The Graph Club,one copy of Fizz & Martina’s Not-For-Profit Pet Resort Mystery,an Activities Guide, and 28 student books (7 sets of 4 differentbooks which guide a myriad of cooperative learning activities).The Graph Club Curriculum Kit is available for both Macintoshand Windows. For more information, or to place an order,just call our Sales and Support Team at 1-800-342-0236.
RAMSystemComputer Monitor Optional
* Note: To hear sounds you must have a Windows-compatible sound card.
Macintosh LC II(68030 processor)
or higher
IBM-compatible*386/33 processor
or higher
MacintoshPower PC
6.0.7 orlater
Windows3.1 or later
1 megavailable
4 megs
black &white or
color
VGA orbetter
requiredfor floppy
disk version
Hard Disk
requiredfor
CD-ROMversion
CD-ROMDrive
large-screen
projectiondevice,externalspeakers

The Graph Club Teacher’s Guide
10
Quick Install & Easy StartQuick InstallCD-ROM VersionMacintosh: Insert the CD-ROM and double-click the program icon.
Windows 3.1: Insert the CD-ROM. From the Program Manager,choose Run from the File menu. Type D:SETUP (where D is yourCD-ROM drive), and click OK. Follow the on-screen instructions.
Windows 95: Insert the CD-ROM, double-click the CD-ROM icon,then double-click the program icon to start the program.
Disk VersionMacintosh: Insert Install disk 1 and double-click the installer icon.Follow the on-screen instructions.
Windows: Insert Install disk 1 into drive A.• For Windows 3.1: go to the Program Manager and choose
Run from the File menu. Type A:SETUP and click OK.Follow the on-screen instructions.
• For Windows 95: go to the Start menu and choose Run.Type A:SETUP and click OK. Follow the on-screeninstructions.
Easy StartThe WalkThrough on page 12 provides a simple tour that intro-duces you to the software. If you prefer to explore on your own,here is an abbreviated road map to help you navigate solo.
Four ModesThe Graph Club has four modes: Explore, Match, Create, and Guess.
Main Menu (Macintosh)
Program Icon
The Graph Clubinstaller

11
The Graph Club Teacher’s Guide
Explore mode provides two side-by-side graphs and lets youand your students do the rest. Change one graph and the otherchanges simultaneously. Open additional graphs and see yourdata up to five different ways: picture, bar, circle, line, table.
Match mode sets up one graph with randomly generated data,and one blank graph. Students are challenged to fill in the blankgraph to match the existing one.
Create mode generates a blank table with the data set to zero.Enter your numeric data, then choose Make Another Graphfrom the Graph menu and view your data different ways.
Guess mode generates a graph and challenges your studentsto hypothesize about what the data might represent.
Basic Features & FunctionsBelow is an example of a graph created in Explore mode. High-lighted are basic operations, such as adding data and changingthe view of your data. Be sure to explore the many optionsavailable through the menu items. For an explanation of anymenu item, please refer to Features & Functions on page 19.
Note: If you have the Bilingual version of The Graph Club,you can toggle back and forth between English and Spanishby choosing English or Español from the Special menu.For more information, see page 26.
Click here tochange scale.Drag icons from
these bins into thewindows to creategraphs. Once yourgraph is started,
you can click graphelements (such as
the top of a bar) anddrag them to add ordelete data quickly.
Explore Graph Set(Macintosh)
Click hereto change they-axis label.
Click hereto change thex-axis label.
Click these Graph Typebuttons to see data in fiveviews: table, picture, bar,
line, and circle.

12
The Graph Club Teacher’s Guide
WalkThroughInstall the SoftwareSee page 10 for instructions on installing the software.
IntroductionClick Play Introduction when the title screen appears,then click the arrows in the lower right corner to scrollthrough the introduction.
The Four ModesAt the Main menu, you will see The Graph Club’s fourprogram modes: Explore, Match, Create, and Guess.Click Explore to select it, then click OK. For a moredetailed explanation of the modes, please refer toUsing The Graph Club’s Four Modes on page 27.
Main Menu (Macintosh)
Title Screen (Macintosh)

13
The Graph Club Teacher’s Guide
Making a Graph in Explore ModeEntering data3. Move your cursor to the orange cat at the top of the graph
on the left. Hold the mouse button down and drag a catinto the area above the cat icon at the bottom of the graph.
When the cat is in the correct area, a highlighted column willappear, and you will hear “bing.” Release the mouse at thistime, and you will have graphed one cat! Notice that on thebar graph to the right you also have one cat.
4. Click the bar graph to select it, then click the top of theorange bar, hold the mouse down, and drag the bar upor down to change data.
5. Enter data for all four animals until you have a graphto your liking.
Cool Feature: Copy graphs from The Graph Cluband paste them into any paint or draw program!For directions, see page 21.
Explore Graph (Macintosh)
14
The Graph Club Teacher’s Guide
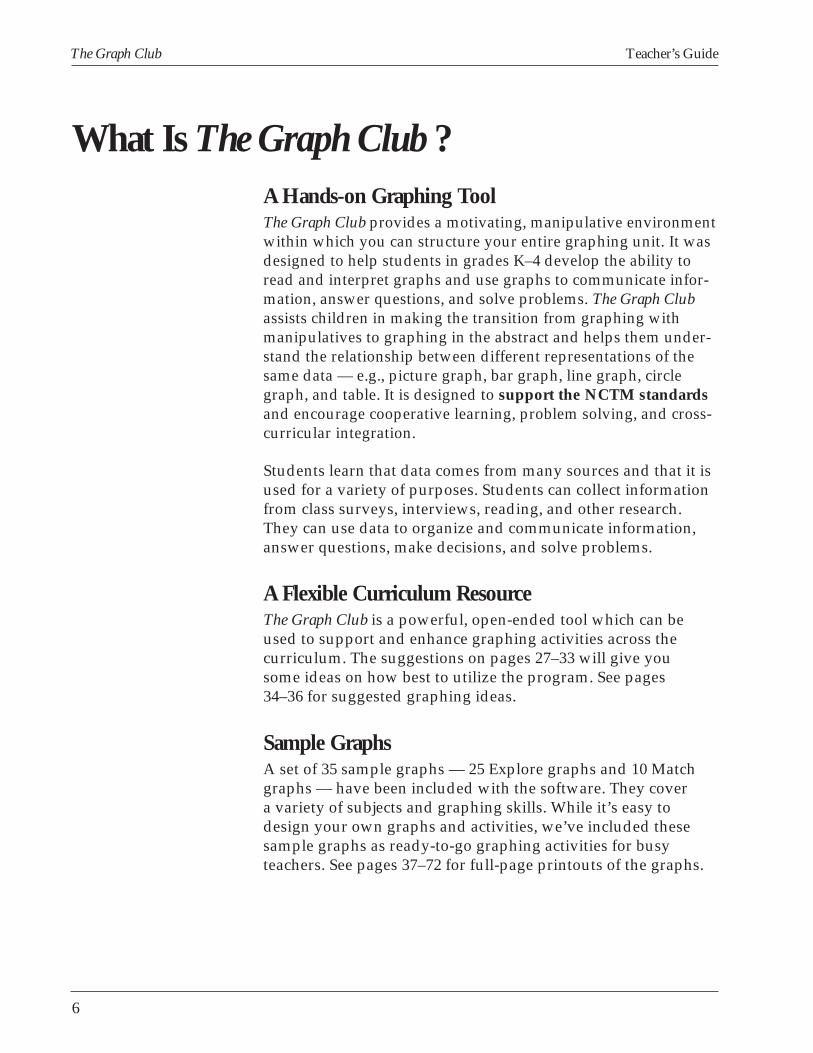
Having Some FunGraph 5 kinds6. Now go to the Graph menu and choose Graph 5 Kinds.
Notice that there are now five “icon bins” above yourgraph, and there is a bird in the fifth bin for you to graph.
Choose symbols7. Go back to the Graph menu and choose Choose Symbols...
The following screen will appear. (Note: The picture belowshows a Macintosh screen. The Windows screen is slightlydifferent.)
8. Scroll through the library of icons until you find a fewfavorites. To add an icon to your graph, simply click itand drag it up to the icon bin. Experiment with replacingall five icons in your graph.
Cool Feature: In addition to choosing icons, you can choosea range of colors and patterns for circle and bar graphs.
Extra-cool Feature: You can design your own symbols in any paint ordraw program and import them into The Graph Club. For directions,see page 22.
9. Click OK to return to your graph.
Icon bins
Libraryof over 150
icons
Scroll bar
Choose Symbols dialog box (Macintosh)
If you click one of these buttons,that icon and all icons to the leftwill be included on your graph.

15
The Graph Club Teacher’s Guide
Graph types10. Make sure the picture graph is selected (click it) and
move your cursor to the Graph Type buttons at thebottom of your graph.
Notice that the picture graph button is in color. Click thecircle graph button, then experiment with the other GraphType buttons.
Cool Feature: Using the Make Another Graph optionin the Graph menu, you can open up additional graphs,resize them to fit on the screen together, and see yourdata represented multiple ways. (Note: Your computer’sresolution will determine the number of graphs that canfit on screen without overlapping.)
Scale maximum11. Using the Graph Type buttons, select a circle graph and
a bar graph. Next go to the Graph menu and chooseChoose Scale Maximum. Click 200, then click OK.
Note: The scale maximum for picture graphs is 20.
Cool Feature: On your bar graph, notice the box at the topof the Y axis that says 200. You can change the scalemaximum by clicking this box. This option is available forbar, picture, and line graphs.
Explore Graph (Macintosh)
Graph Typebuttons

16
The Graph Club Teacher’s Guide
Entering and deleting dataNow let’s add some more data to your graphs — we’ll try twodifferent ways to do this.
12. Drag an icon into its corresponding segment in your circlegraph. This adds one unit to your graph.
13. Now move the mouse to the edge of a segment and dragit clockwise. This allows you to add data more rapidly toyour graph. Moving the mouse counterclockwise deletesdata from the graph.
Note: The dragging method of changing data is availablefor bar, circle, and line graphs.
Cool Feature: You can label your circle graph 5 differentways. Click a number on your circle graph. Notice that youcan select icons, numbers, fractions, percents, or no labelsat all. (You can open this same dialog box by choosingCircle Graph Labels from the Options menu.)
Axis labels14. Go to your bar graph and click What? above the Graph Type
buttons. Enter a label for the X axis. Do the same for the Yaxis by clicking How Many? Finally, click one of the littleicons along the X axis and enter a label for the icon.
Cool Feature: With tables, you can add a title as well asaxis and icon labels.
SavingYour graphs are surely masterpieces by now, so let’s save them.(All views of a given data set are saved together as one file.)
15. Choose Save from the File menu. You can also press z-S(Macintosh) or Control-S (Windows).
Printing16. To print, choose Print Graphs from the File menu. You
can also press z-P (Macintosh) or Control-P (Windows).Select the graph types you wish to print and they will bedisplayed in the Print Preview area. (You can print upto five on one page.)

17
The Graph Club Teacher’s Guide
Cool Feature: The Graph Club has a special print menudesigned to encourage students to write about theirgraphs. Enter a title and a brief description (amountof text is limited) and be sure to check the little boxesto the left of “Title” and “Description.”
Match Mode17. Choose Close Set from the File menu to close your graphs.
18. Click Match, then click OK. Your job is to create a graph onthe right that matches the randomly generated graph on theleft. Go to it!
19. When you have entered data in the bar graph which matchesthe data in the picture graph, click Check My Match! abovethe picture graph. You should see the following screen:
Note: If the program finds an incorrect match, it tells you,“Now match the others!” The Graph Club gives students asmany tries as they need to match the graph correctly.
Print Graphs dialog box (Macintosh)
Click thisgraphic to
make itdisappear.
Match challenge successfully completed (Macintosh)

18
The Graph Club Teacher’s Guide
Cool Feature: Click Print Certificate for a certificatedisplaying the matched graphs. This is a great wayto reward students’ success with graphing.
Another Cool Feature: Using Teacher Options... in theSpecial menu, you can change the Match mode graphtypes and control a number of other Match modefeatures. For details, see Teacher Options on page 25.
Create Mode20. Choose Close Set from the File menu.
21. Click Create, then click OK.
22. Click each zero and enter data for your table. The defaultscale maximum is 10, a setting you can change by choosingChoose Scale Maximum... from the Graph menu.
23. Once you have entered data for each item, go to the Graphmenu and choose Make Another Graph. This allows youto see your data represented in different forms. As you openadditional graphs, you may need to resize them to see themall at once.
Guess Mode24. Close the graphs you made in Create mode. You can also
press z-E (Macintosh) or Control-E (Windows). Then clickGuess and click OK.
This randomly generated graph gives students an opportunityto brainstorm about why someone would have made that par-ticular graph, what it could signify, and what people couldconclude from the graph.
Cool Activity: Using New in the File menu, open severalGuess graphs at once (each will have the same symbols,but different data). As each graph is generated, askstudents to compare the data. Challenge them toexplain what underlying differences the graphs couldbe representing.
Cool Feature: Change the icons in the graph for a varietyof critical thinking challenges.

19
The Graph Club Teacher’s Guide
Features & FunctionsThe File MenuNew: Lets you open a new graph set in any ofThe Graph Club’s four modes.
Open: Opens a previously saved graph set.
Close: Closes the selected graph view.
Close Set: Closes all the views in a graph set.
Save: Lets you save a graph set. When you save,all views of a given set are saved together.
Save As: This option lets you save a previouslysaved file under another name or location.
Macintosh
Windows
File Menu with shortcuts(Macintosh)
1. Name yourgraph file
Save As dialog box (Macintosh)
2. Pull downto locate the
folder in whichyou want tostore the file
3. Click Saveafter you’ve
named your fileand given it a
location
File Menu with shortcuts(Windows)
Save As dialog box (Windows)
1. Name yourgraph file
2. Locate the drive anddirectory in which youwant to store the file
3. Click OKafter you’venamed yourfile and givenit a location

20
The Graph Club Teacher’s Guide
Page Setup (Macintosh) or Print Setup (Windows): Lets youset page orientation and other specifications for printing graphs.
Note: To set specifications for printing graphics, use PrintSpecial Setup in the Special menu.
Print Graphs: The Graph Club print menu has a number ofgreat features which are highlighted below. (Note: The picturebelow shows a Macintosh screen. The Windows screen isslightly different.)
Cool Feature: Print in color! The Graph Club supports color printing(with a color ribbon). If you are using Windows, make sure to checkthe Color Printer box.
Quit (Macintosh) or Exit (Windows): Use this option to exitThe Graph Club.
Printpreview
Write a shortdescription whichwill print out with
your graph
Titleyour graph
Print oneor all five
graph types
Click Print whendone selecting all ofyour print options
Print Graphs dialog box (Macintosh) Choose from three print sizes• 81/2 x 11" (1 page)• 17 x 22" (4 pages)• 251/2 x 33" (9 pages)

21
The Graph Club Teacher’s Guide
The Edit MenuThese are basic options found in many applications. If the Editmenu is not accessible, you can perform these actions using theappropriate shortcut keys. (Note: Copy is the only function youcan perform on graphs. All funtions can be performed on text.)
Undo: Lets you undo your last action.
Cut: Lets you remove a highlighted section in order toplace it elsewhere.
Copy: Lets you duplicate a highlighted section in orderto add it elsewhere.
Paste: Use this option to insert cut or copied items intoyour document.
Clear: Erases highlighted section.
Cool Feature: Copy graphs from The Graph Club and paste theminto any paint or draw program! Just select a graph (by clickingon it), choose copy from the Edit menu, open a paint or drawprogram, and paste!
The Graph MenuMake Another Graph: Choose this option to create anotherview of the selected data set. The new view will appear onyour desktop. You can open up to ten views of your data set.(Note: If you wish to see more than two views at once, youwill have to resize the windows. Your computer’s resolutionwill determine the number of graphs that can fit on screenwithout overlapping.)
Graph 1 or More Kinds: These options allow you to change thenumber of items you are graphing. If you reduce the number ofitems, The Graph Club will eliminate symbols starting from theright. If you increase the number of items, The Graph Club willuse the additional symbols saved with this graph.
Choose Scale Maximum: Use this option to change the scalemaximum. (Note: The scale maximum for picture graphs cannotexceed 20.)
Edit Menu (Macintosh)
Edit Menu (Windows)
Graph Menu (Macintosh)

22
The Graph Club Teacher’s Guide
Choose Symbols: Use this option to select new symbols.You can use the symbols that come with The Graph Clubor import your own from any paint or draw program.(Note: The picture below shows a Macintosh screen.The Windows screen is slightly different.)
To select a new icon for your graph from The Graph Club libraryof icons, simply click the icon you wish to add and drag it to theicon bin.
Cool Feature: The Graph Club lets you import your own graphicsto use as icons. Here’s how:
• Using a paint or drawing program create your own graphic.• Copy the graphic; it will be saved in the computer’s Clipboard.• Open The Graph Club.• Choose Choose Symbols from the Graph menu.• Click Paste from Clipboard. The cursor will change to your icon.• Now just click the icon bin where you wish to place your icon!
Note: Icons you import will not be saved in the programbut will be saved in any new graphs you make using them.
Technical Note: Icons in The Graph Club library are 28 x 28pixels. Imported icons don’t have to be this size, but thecloser your icons are to 28 x 28, the better they will lookin the program.
If you click one ofthese buttons, that iconand all icons to the leftwill be included in yourgraph; icons to the right
will be excluded.This is useful if you
want to change the numberof items you are graphing.
Icon bins — thesedisplay the icons
included in your graph
Click here whenimporting graphics
(see belowfor directions)
Choose Symbols dialog box(Macintosh) Colors and patterns
for bar andcircle graphs
Library of over150 icons

23
The Graph Club Teacher’s Guide
The Options MenuGraph Vertically: This option gives your graph a verticalorientation and is the default setting whenever you createa new graph. When you choose this option, all views ofthe selected data set will be changed and windows will berearranged on the screen.
Note: Some picture graphs with a scale of 20 use one icon torepresent two (because of space limitations). This is noted atthe top of the Y axis.
Graph Horizontally: Use this option to give graphs a horizon-tal orientation. All views of the selected graph will be changedand windows will automatically be rearranged on the screen.In this orientation, icon bins are on the left of the graph windowand Graph Type buttons are on the right.
Circle Graph Labels: This option lets you label circle graphs fiveways: with icons, numbers, fractions, percents, or no labels at all.Simply select the desired option in the dialog box and click OK.
Shortcut: Click any of the labels inside the circle graphto open this same dialog box.
Show Bar and Line Grid: This option lets you turn grid linesin bar and line graphs on or off. If the menu item is selectedwith a check mark, grid lines are on; simply reselect the optionto turn the lines off.
Shortcut: Double-click any white area inside a selected graphwindow to turn grid lines on and off automatically.
Show Axis Labels: Select this option to show axis labels;deselect it to hide them.
Options Menu (Macintosh)
Circle Graph Labels dialog box (Macintosh)
24
The Graph Club Teacher’s Guide
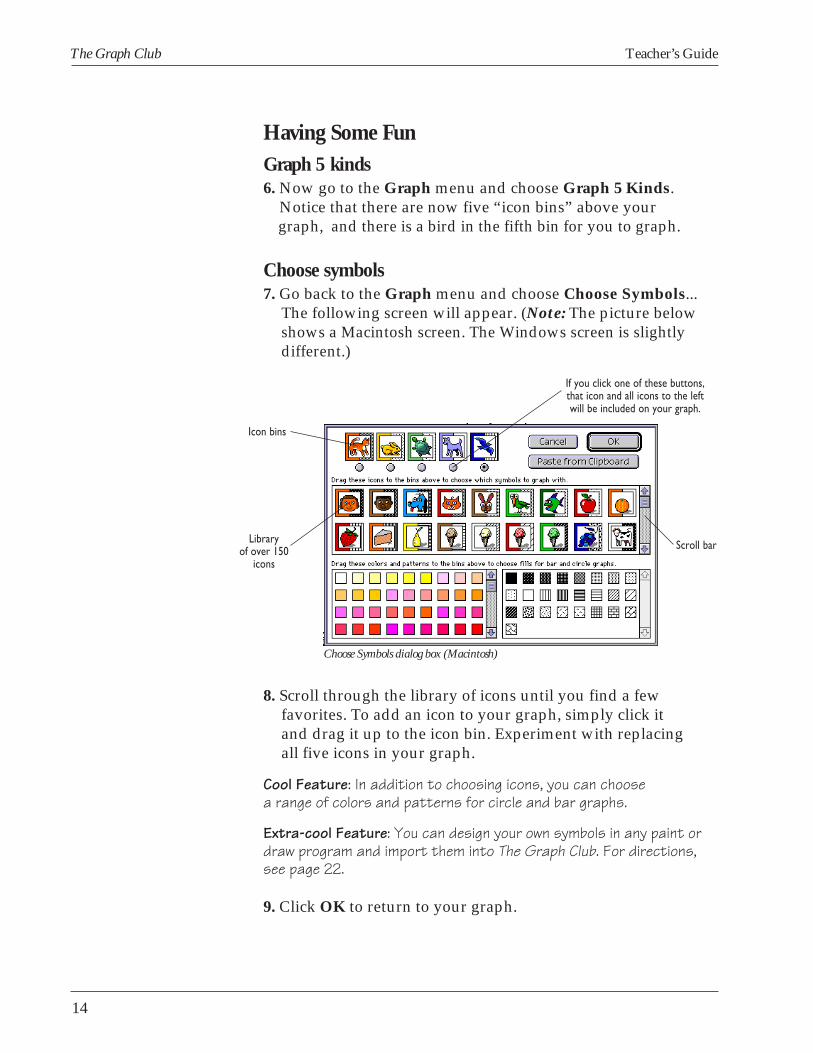
Special MenuEdit Groups: This option allows you to add and edit classes foruse with the Random Student Picker™. The Random StudentPicker — a feature in many Tom Snyder Productions programs— lets you randomly select a student to enter data, answer aquestion, interpret a graph, or offer his or her opinion. It’s a funway to involve the entire class and keep students on their toes!
Pick Student: Select this option to activate the RandomStudent Picker.
Note: You can also choose this option by pressing z-F(Macintosh) or Control-F (Windows). If you have morethan one group set up, you’ll need to choose Edit Groupsand select the group you want the program to pick frombefore you choose Pick Student.
To leave the Random Student Picker, just click anywhereon the graphic.
Click to saveall changes
Create anew group
Remove theselected group
Remove theselected
student fromthe group
Special Menu (Macintosh)
Add a studentto the selected
group
Edit Groups dialog box (Macintosh)
Random Student Picker (Macintosh)

25
The Graph Club Teacher’s Guide
Print Special Setup: This allows you to select options forprinting the special graphics that come with The Graph Club(available by choosing Print Special in the Special menu).Blank Match certificates, for example, should be printedlandscape rather than portrait.
Print Special: We’ve included in The Graph Club a numberof fun graphics including illustrations from The Graph ClubCurriculum Kit (sold separately — see page 9 for details).
Be sure to check out The Graph Club logo. Print the regularversion to make posters. Print the reverse version using a heattransfer ribbon in your printer (dot-matrix only) to make t-shirtsfor your students. You can also print blank graphing grids inthree sizes for graphing activities away from the computer.
Teacher Options: Teacher Options lets you customizeand tailor preferences to meet the needs of your students.This option is always grayed (to restrict access). To selectTeacher Options:
• Macintosh: Hold down the Command and Option keysand (without letting go) open the Special menu and chooseTeacher Options.
• Windows: Hold down the Shift and Control keys and(without letting go) open the Special menu and chooseTeacher Options.
Note: If you open the Special menu before pressingShift and Control, Teacher Options will remain grayed.
Graphicsfrom whichto choose
Preview ofthe graphic
you’ve selected Print Special dialog box (Macintosh)

26
The Graph Club Teacher’s Guide
The Teacher Options dialog box appears below. A Macintoshscreen is shown. The Windows screen is slightly different.
English/Español: If you have the bilingual version of The GraphClub, you can toggle back and forth between English and Span-ish using these two menu items.
Note: To read and hear the introduction in Spanish you mustfirst enter the program, choose Español, then exit and restartThe Graph Club.
Entering and Deleting DataBelow is an explanation of how to enter and delete data forall five graph types.
Enter Delete
Bar: Drag icons Drag top of bar downDrag top of bar up
Circle: Drag icons Drag wedges counter-Drag wedges clockwise clockwise
Line: Drag data points up Drag data points downDrag icons to desireddata points
Picture: Drag icons Click icons in graph
Table: Click number and Click number andtype a new one type a new oneDrag icons
Graph typeoptions
Match options
Sound options
Teacher Options dialog box (Macintosh)
Special Menu(Macintosh Bilingual)
Line graph option(Line graphs show
change of onething over time.)
27
The Graph Club Teacher’s Guide
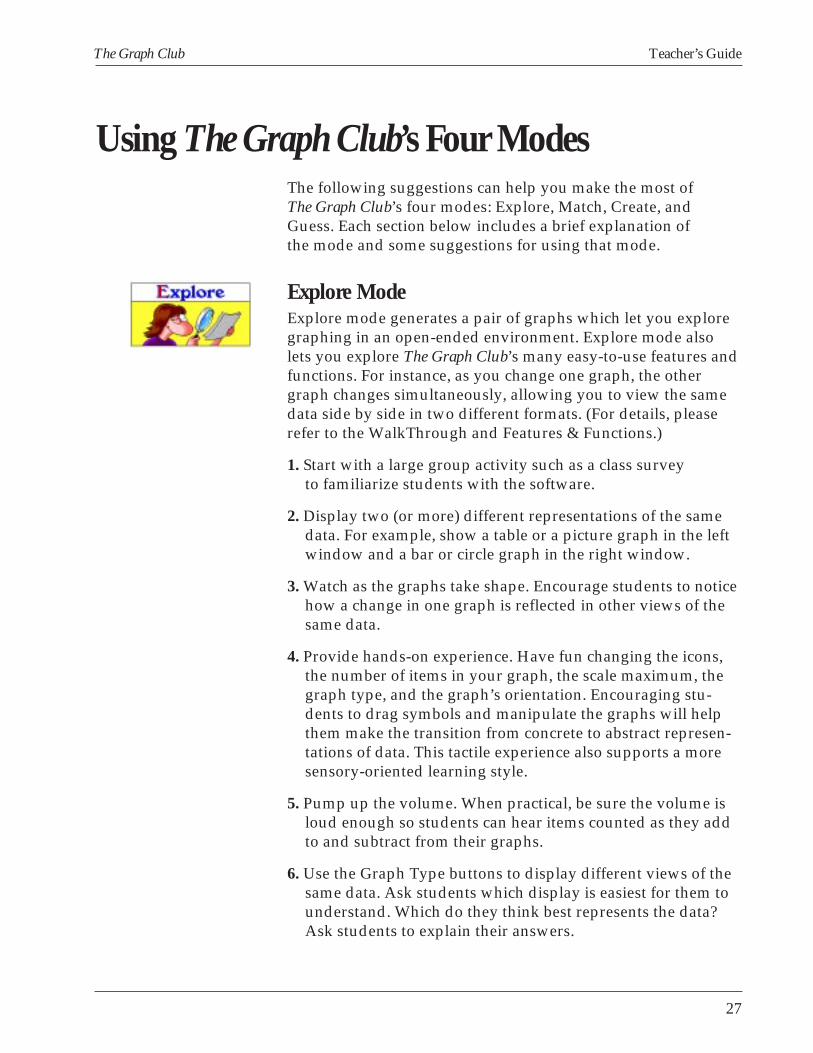
Using The Graph Club’s Four ModesThe following suggestions can help you make the most ofThe Graph Club’s four modes: Explore, Match, Create, andGuess. Each section below includes a brief explanation ofthe mode and some suggestions for using that mode.
Explore ModeExplore mode generates a pair of graphs which let you exploregraphing in an open-ended environment. Explore mode alsolets you explore The Graph Club’s many easy-to-use features andfunctions. For instance, as you change one graph, the othergraph changes simultaneously, allowing you to view the samedata side by side in two different formats. (For details, pleaserefer to the WalkThrough and Features & Functions.)
1. Start with a large group activity such as a class surveyto familiarize students with the software.
2. Display two (or more) different representations of the samedata. For example, show a table or a picture graph in the leftwindow and a bar or circle graph in the right window.
3. Watch as the graphs take shape. Encourage students to noticehow a change in one graph is reflected in other views of thesame data.
4. Provide hands-on experience. Have fun changing the icons,the number of items in your graph, the scale maximum, thegraph type, and the graph’s orientation. Encouraging stu-dents to drag symbols and manipulate the graphs will helpthem make the transition from concrete to abstract represen-tations of data. This tactile experience also supports a moresensory-oriented learning style.
5. Pump up the volume. When practical, be sure the volume isloud enough so students can hear items counted as they addto and subtract from their graphs.
6. Use the Graph Type buttons to display different views of thesame data. Ask students which display is easiest for them tounderstand. Which do they think best represents the data?Ask students to explain their answers.

28
The Graph Club Teacher’s Guide
7. Discuss the graphs. Ask students questions such as:
What kind of graph is this?
What is this graph about?
What is a good title for this graph?
How many (of each kind) are there?
Of which kind is there the most? The least?
How many more (of one kind) are there than (another kind)?
Is this graph a good way to display the data?
How could you use this information?
What questions would you like to ask about this graph?
How would you like to change this graph?
Encourage students to come up with their own answers byhaving them write, draw, or otherwise record their responsebefore eliciting spoken answers. When there are a limitednumber of possible answers, ask for a hand count to see howmany students picked each answer. Ask students to givereasons for their answers.
8. Encourage students to pose questions.
9. Encourage student-initiated data collection activities.Have students conduct their own interviews, surveys, andinvestigations and use The Graph Club to display the data.
10. Graph data from other sources. Ask students to find datafrom another source and use The Graph Club to display it.Let them manipulate the data, play “what if” games, andexperiment with different representations of the same data.
11. Use the saved graphs which are included with the software.These graphs — 25 Explore graphs and 10 Match graphs —are ready to use and cover a range of topics and graphingskills. Simply choose Open from the File menu and selectthe graph you wish to use. (See pages 37–72 for full-pageprintouts of these graphs.)
12. Allow students to print their graphs whenever possible.Encourage them to include a title and write a story ordescription in the print dialog box before printing, orwrite one by hand after printing.

29
The Graph Club Teacher’s Guide
13. Have students share and discuss their graphs.
14. Pose challenges. For example:
• Display a line graph and a bar graph. Ask students whatthey could do to the line graph to make all the bars in thebar graph the same height. Let them manipulate the linegraph to check their predictions.
• Have students display a bar graph and a circle graph.Ask questions such as:
If you make all the bars the same height, how will the circlegraph look?
If you remove one bar completely, how will the circle graph look?
After students hypothesize, let them manipulate the bar graphand see if they are right. Ask students to continue this gameby asking their own questions.
• If students are sophisticated enough, introduce a discussionof fractions. Display a bar graph on the left and a circle graphon the right. Start with two bars of equal size and ask studentswhat each part of the circle is called. Then have them changethe wedge labels to fractions to see if they were right. (SeeCircle Graph Labels on page 23.) Ask students to predict whateach wedge will be called if you add another bar of equal size.
• Display two circle graphs and label each differently — e.g.,one with whole numbers and one with fractions, or one withfractions and one with percents. Compare fractions and per-cents. Ask students to predict how a change in one will affectthe other.
15. Be alert for graphing opportunities that emerge naturallyfrom your classroom experience. These activities will bethe most meaningful and will best support your curriculum.

30
The Graph Club Teacher’s Guide
Match ModeMatch mode generates a random graph and challenges studentsto create a different type of graph which represents the samedata. Match mode gives students hands-on experience readinggraphs and lets them see the transformation of data from oneform to another.
1. Start with an easy challenge. The program is preset todisplay a picture graph on the left and a bar graph on theright. Even if your students are more advanced, startingat this level will help them become familiar with the gameand experience success.
2. Create easier challenges by reducing the number of itemsbeing graphed and/or using the same type of graph in eachview. (See Teacher Options on page 25.)
3. Create more difficult challenges by increasing the numberof items being graphed and/or using a more difficult graphtype — e.g., circle.
4. Use Choose Symbols under the Graph menu (see page 22)to select interesting and relevant symbols.
5. Encourage cooperation. Have students solve Matchchallenges together.
6. Encourage competition. Have students take turns solvingMatch challenges and keep score.
7. Have students design Match challenges, save them,and then challenge their classmates.
8. Whenever possible, allow students to print the “I Matched It”certificate after completing a challenging match. Or havethem print one of their random graphs and then write astory or description.

31
The Graph Club Teacher’s Guide
Create ModeCreate mode automatically brings up a table with each data valueset to zero. This presents an opportunity for students to collect aset of data, enter it into a table in numeric form, then see thosenumbers transformed as they switch from a table to any of thefour other graph types.
1. Have students collect data from a class survey, independentinvestigations, or any other source. Be sure students have theirdata ready, preferably recorded in list or table form, beforethey go to the computer.
2. Enter the data into a table, which is automatically created whenyou use the Create mode.
3. When students have entered their data, have them go to theGraph menu and choose Make Another Graph. Have themuse the Graph Type buttons at the bottom of the picture graphto view the data in different graph forms.
4. Ask students what types of graphs are most appropriate fordisplaying their data. Ask them to explain their choices.
5. Encourage students to give their table a title and write ordictate a description or story about their graph in the printdialog box before printing.
6. Encourage older students to use word labels. They can dothis by clicking picture labels and then entering their text.
7. Ask students to use graphs to communicate a point of viewor persuade their audience.
8. Have students print graphs, color them, and share themwith classmates, friends, or family. Print standard size,big book size, or poster size. Refer to Printing Ideas onpage 79 for more printing ideas.
9. Be alert to graphing opportunities that emerge naturally fromyour classroom experiences. Encourage students to suggestgraphing ideas of their own

32
The Graph Club Teacher’s Guide
Guess ModeThe Guess mode is designed to encourage critical thinkingskills and help students understand that there are often manygood answers to a question. This brainstorming activity alsodevelops an awareness of the many different types of datathat can be represented in graph form. Guess mode randomlygenerates graphs and challenges students to hypothesize aboutwhat the data might represent. (The data is generated randomly;you can change the icons to graph any information you choose.)Students analyze data, practice their graph-reading skills, andlearn that there are often many interpretations of the sameinformation.
For example, you could choose food icons from The Graph Club’slibrary of icons, and the program would display a graph likethis one . . .
. . . which could be interpreted as:Peggy: How much a family eats in a week.Bruce: The food we would have at a family picnic.Annette: My third grade class’s favorite meats.Peter: The type of food commercials I saw on TV this week.
Guess Graph (Macintosh)

33
The Graph Club Teacher’s Guide
1. Introduce a critical thinking activity any time you havea few unscheduled minutes. Use a large-screen monitoror projection device if available.
2. Encourage students to brainstorm as many interpretationsas possible. Accept zany, imaginary interpretations as wellas more mundane suggestions. Ask students to explain theiranswers. Then ask them to decide which interpretations aremost probable.
3. Once students have suggested several interpretations forthe first graph view, use the Graph Type buttons to displaythe data differently. Ask students which interpretations stillseem plausible.
4. Type a collective description or story about your graphin the Print dialog box. The description will be saved andprinted with the graph.
5. Print graphs with a story or description dictated by theclass. Or print a variety of graphs without descriptions,make copies, and distribute them. Have individual studentsor teams brainstorm and write a logical or zany descriptionor story about their graph. Make sure they are able to givereasons for their interpretation.

34
The Graph Club Teacher’s Guide
Graphing IdeasAfter a few exciting adventures with The Graph Club, yourstudents will begin to notice graphs in magazines, newspapers,books, television, and other media. They’ll be inspired to createtheir own graphs and are likely to suggest all kinds of interest-ing topics for surveys, interviews, and investigations. Ideas thatemerge naturally from the classroom experience will be the mostmeaningful and will best support the curriculum, so look forthese opportunities and encourage students to do so.
To help you get started, we’ve included several dozen graphingideas. Not all topics are appropriate for every population, so besure to consider your student group. Select topics that are ageappropriate and insure a high interest level and then enlist yourstudents’ help in identifying appropriate categories. Plan activi-ties that actively engage your students in collecting and organiz-ing data, creating and interpreting graphs.
Some of the following topics are ideal for picture and bar graphs,others work best as line graphs, and some suggest the use ofcircle graphs. Suggested graph types are noted at the top ofeach list. (In some cases, additional graph types might alsobe appropriate.) When selecting a topic, consider the type ofgraph students will be constructing.
Favorite Things (Table, Picture, Bar, Circle)Beverage (milk, juice, pop, etc.)Book, type of bookCandy, snack, dessertCerealColorColor for jacket, sweater, hat, etc.CookieDay of the weekDinosaurFast food restaurantFruitHolidayIce cream flavorMonster

35
The Graph Club Teacher’s Guide
Favorite Things (Cont.)MoviePetPlanet to visitSeasonShoes, sneakers, bootsSongSport to watchSport/game to playStorybook characterStuffed animalTelevision showType of toyVacation spotVegetableWay to spend your leisure timeWild animal, zoo animal
How many? (Table, Picture, Bar, Circle)Animals of specific varieties at the zoo (lion, monkeys, giraffes, etc.)Birds (robins, bluebirds, cardinals, etc.)Books readBoys/girls in class, family, club, etc.Children come to school by bus/car/bike/walkChildren have ancestors from Europe, Asia, Africa, Latin America, etc.Children have blue/brown/black/green eyesChildren have brown/blond/red/black hairChildren have relatives in other countriesChildren in your familyChildren were born here/born elsewhere (other town, state, country)Children’s birthdays each seasonCost of different food itemsCost of different toysDays for different seedlings to sproutDoors in your houseGames won/lostGoals, hits, runs, basketsLegs different animals haveLegs different insects have

36
The Graph Club Teacher’s Guide
How many? (Cont.)Sunny/rainy/cloudy/snowy days this week/monthTeeth children have lostTelevision shows watched per dayTelevisions/radios/telephones in householdTrash bags filled each week (in classroom or at home)Trees of various kinds (oak, pine, maple, palm, etc.)
Measurements (Table, Bar)Blocks/miles to school, park, shopping areaChildren’s heightChildren’s weightHeight of different seedlings/plantsHeight of dolls, teddy bears, toy charactersHeight/length of different animalsHours to drive/fly to other citiesHow far a frog can jumpHow far students can jumpHow far students can throw a ball/beanbagHow high students can climb a ropeInches of rain/snowMinutes to walk to cafeteria/main office/library, etc.
Dividing things up (Table, Picture, Bar, Circle)How children spend their allowanceHow children spend their waking hoursHow money for a party, field trip, etc. is spentHow students share a cake, pie, cookies, pizza, apple, peanuts, etc.Types of trash collected around classroom, school,
community that can be recycledWhere allowance or club money comes from
How things change over time (Table, Picture, Bar, Line)Children’s height over several monthsChildren’s foot size over several monthsHeight/weight/length of animals over timeLength of shadows throughout the dayNumber of children who drink juice for breakfast each day
for several daysNumber of children who drink milk for lunch each day
for several daysPlant’s height over several weeksRainfall for several consecutive monthsTemperature (high/low/average) over several days,
weeks, or months

37
The Graph Club Teacher’s Guide
Sample Graphs & ActivitiesThis section gives you a preview of the graphs you’ll find in theSample Graphs folder. These sample graphs are ready-to-usegraphing activities you can do with your whole class. Thefollowing pages provide some fun questions you can use withthe sample graphs.
There are two ways to access the sample graph files:
1. If you’re running The Graph Club, choose Open from theFile menu and navigate to the Sample Graphs folder.
2. If you’re not running The Graph Club, simply double-clicka sample graph. This will open both the sample graph andThe Graph Club.
Important Note: Be sure to make a backup copy of the SampleGraphs folder on a floppy disk. Keep this disk in a safe place!
Fun Tip: Change the graph types for additional challenges!
Graph 19: Sunny Days .................................... 56Graph 20: Teeth You’ve Lost ......................... 57Graph 21: Weather Forecast ........................... 58Graph 22: What Pets Do You Have? ............. 59Graph 23: What’s Your Job? ........................... 60Graph 24: You Want to Ride a WHAT???.... 61Graph 25: Your Class Plant Has Grown! ..... 62Graph 26: Match It - Birthdays! ..................... 63Graph 27: Match It - Farm Animals .............. 64Graph 28: Match It - Fruits ............................. 65Graph 29: Match It - Lost Teeth ..................... 66Graph 30: Match It - Moods ........................... 67Graph 31: Match It - More Animals .............. 68Graph 32: Match It - Safari Animals ............. 69Graph 33: Match It - Seasons ......................... 70Graph 34: Match It - Starry Night ................. 71Graph 35: Match It - Travel ............................ 72
Sample Graphs
Graph 1: Crazy Flavors ................................... 38Graph 2: Favorite Breakfast Food ................. 39Graph 3: Favorite Colors ................................ 40Graph 4: Favorite Ice Cream .......................... 41Graph 5: Favorite Pets ..................................... 42Graph 6: Favorite Season ................................ 43Graph 7: Favorite Snacks ................................ 44Graph 8: Favorite Sports ................................. 45Graph 9: Favorite Weather ............................. 46Graph 10: Hours of TV ................................... 47Graph 11: Hours You Read a Day................ 48Graph 12: How Big Are Your Feet? .............. 49Graph 13: How Big Are Your Hands? .......... 50Graph 14: How Far to School? ....................... 51Graph 15: How Many Would You Like? ..... 52Graph 16: How Much Rain? .......................... 53Graph 17: How We Get to School ................. 54Graph 18: Milk Your Class Drinks ................ 55

38
The Graph Club Teacher’s Guide
Graph 1: Crazy FlavorsBrainstorm some wacky ice cream flavors, then vote for your favorites andgraph the data. If the local ice cream parlor were trying to decide on a new flavor,which one would your class suggest? Use your graph to answer the question!
Sample Graph 1 (Macintosh)

39
The Graph Club Teacher’s Guide
Graph 2: Favorite Breakfast FoodHave students vote for their favorite breakfast foods and graph the data.If your class were having a special breakfast one morning at school, which three
foods would you want on the menu? Use your graph to answer the question!
Sample Graph 2 (Macintosh)

40
The Graph Club Teacher’s Guide
Graph 3: Favorite ColorsVote for your favorite colors and graph the data. If you were going
to redecorate your classroom, how could this graph help you?
Sample Graph 3 (Macintosh)

41
The Graph Club Teacher’s Guide
Graph 4: Favorite Ice CreamPick four popular ice cream flavors, then graph your favorites. If yourclass could open an ice cream stand in the classroom with only three flavors
available, which three would you pick? Use your graph to answer the question!
Sample Graph 4 (Macintosh)

42
The Graph Club Teacher’s Guide
Graph 5: Favorite PetsGraph “favorite pet” data for your class. If your class could adopt a pet, what
animal would it be? If the local animal shelter didn’t have any of that animal, whatwould your class’s second choice be? Use your graph to answer the questions!
Sample Graph 5 (Macintosh)

43
The Graph Club Teacher’s Guide
Graph 6: Favorite SeasonWhat season do your students enjoy the most? If your class
could go on an outdoor adventure during any season, whenwould you go? Use your graph to answer the question!
Sample Graph 6 (Macintosh)

44
The Graph Club Teacher’s Guide
Graph 7: Favorite SnacksGraph your preferences for snack food. If your class were going to have a
party, and the grocery store were out of your first two choices, what food wouldbe next on your shopping list? Use your graph to answer the question!
Sample Graph 7 (Macintosh)

45
The Graph Club Teacher’s Guide
Graph 8: Favorite SportsVote on your favorite sports and graph the data. What equipment
would you recommend that the principal buy for your class to useat recess? Use your graph to answer the question!
Sample Graph 8 (Macintosh)

46
The Graph Club Teacher’s Guide
Graph 9: Favorite WeatherWhat weather does your class enjoy most? If the meteorologistin your town could create the weather for five days — from your1st choice to your last — what would the weather report be for the
next five days? Use your graph to answer the question!
Sample Graph 9 (Macintosh)

47
The Graph Club Teacher’s Guide
Graph 10: Hours of TVHow many hours of TV does your class watch after school each
weekday? On what day of the week would your class have the most free timeafter school for a special field trip? Use your graph to answer the question!
Option: Have students graph their hours individually and compare graphs.
Sample Graph 10 (Macintosh)

48
The Graph Club Teacher’s Guide
Graph 11: Hours You Read a DayHow many hours a day does your class read (both in and out of school)?
On what day would your class be most likely to win the Bookworm of the Day award?Use your graph to answer the question! Option: Have students graph their
hours individually and compare graphs.
Sample Graph 11 (Macintosh)

49
The Graph Club Teacher’s Guide
Graph 12: How Big Are Your Feet?Have students work in teams of five and measure their feet. As a class, graph
each team’s data, creating as many graphs as necessary. (Print each one as youcreate it, then make the next one.) If aliens came down from space and wanted to
study kids with the biggest feet and the smallest feet, who would not get takenaway to the aliens’ laboratory? Use your graphs to answer the question!
Sample Graph 12 (Macintosh)

50
The Graph Club Teacher’s Guide
Graph 13: How Big Are Your Hands?Have students work in teams of five and measure their hands. As aclass, graph each team’s data, creating as many graphs as necessary.
(Print each one as you create it, then make the next one.) If you were alllocked in a dungeon and the key was just a few inches away through a narrow
opening, which student would have the best chance of reaching through theopening and getting the key? Use your graphs to answer the question!
Sample Graph 13 (Macintosh)

51
The Graph Club Teacher’s Guide
Graph 14: How Far to School?Figure out how far you travel to school and graph the data. If you decided to buy a
minivan and hire a chauffeur to pick up the kids who live more than two miles from school,how many seats would the van need to have? Use your graph to answer the question!
Sample Graph 14 (Macintosh)

52
The Graph Club Teacher’s Guide
Graph 15: How Many Would You Like?You’re having a pizza party and need to figure out how many pizzas
to order. If the pizza parlor ran out of sauce part way through your order, andkids who requested four slices had to settle for three, how many kids would
have to give up a slice? Use your graph to answer the question!
Sample Graph 15 (Macintosh)

53
The Graph Club Teacher’s Guide
Graph 16: How Much Rain?Measure your rainfall for five weeks and graph the data. (If you
don’t get much rain, you may want to make up some data.) Duringwhich week did the birds in your community have the most water in
their bird baths? Use your graph to answer the question!
Sample Graph 16 (Macintosh)

54
The Graph Club Teacher’s Guide
Graph 17: How We Get to SchoolSurvey how you get to school and graph the data. If all motors were
mysteriously shut down tomorrow, how many students would have to findanother way to get to school? Use your graph to answer the question!
Sample Graph 17 (Macintosh)

55
The Graph Club Teacher’s Guide
Graph 18: Milk Your Class DrinksKeep track of how much milk your class drinks in a week and
graph the data. If you made ice cream with your milk one day insteadof drinking it, on which day would you have made the most ice cream?
Use your graph to answer the question!
Sample Graph 18 (Macintosh)

56
The Graph Club Teacher’s Guide
Graph 19: Sunny DaysKeep track of how many sunny days you have for five weeks andgraph the data. If you were a sunflower, during which week would you
have been the happiest? Use your graph to answer the question!
Sample Graph 19 (Macintosh)

57
The Graph Club Teacher’s Guide
Graph 20: Teeth You’ve LostHave students work in teams of five and graph how many teeth they’ve lost.
(Print each graph.) If the Tooth Fairy gave out a gold coin for every lost tooth,who would have the most gold coins? Use your graphs to answer the question!
Sample Graph 20 (Macintosh)

58
The Graph Club Teacher’s Guide
Graph 21: Weather ForecastMake predictions for what you think the weather will be like exactly one
week from today. Graph your data, then print and post your graph, and checkback a week later. How many students should think about becoming professional
guessers when they grow up? Use your graphs to answer the question!
Sample Graph 21 (Macintosh)

59
The Graph Club Teacher’s Guide
Graph 22: What Pets Do You Have?Make a graph of the pets you have. If the grocery store ranout of turtle chow, how many kids would have hungry pets?
Use your graphs to answer the question!
Sample Graph 22 (Macintosh)

60
The Graph Club Teacher’s Guide
Graph 23: What’s Your Job?Graph the jobs you do at home. If the grass in your town grewa foot overnight, how many kids would have a LOT of work to do?
Use your graphs to answer the question!
Sample Graph 23 (Macintosh)

61
The Graph Club Teacher’s Guide
Graph 24: You Want to Ride a WHAT???Imagine that a very special animal circus came to town and offered rides
on different animals. Which animal would you like to ride the most?If the fish came down with Fish Flu and had to rest, how many students
would be disappointed? Use your graphs to answer the question!
Sample Graph 24 (Macintosh)

62
The Graph Club Teacher’s Guide
Graph 25: Your Class Plant Has Grown!Start a plant from seed, measure its growth over a period of weeks,and graph the data. Did your plant have a growth spurt or did it growat a slow and steady pace? Use your graphs to answer the question!
Sample Graph 25 (Macintosh)

63
The Graph Club Teacher’s Guide
Graph 26: Match It - Birthdays!Working as a class, in teams, or individually, create a graphthat represents the data in this graph. When you’ve finished,
click Check My Match! to see how well you’ve done!
Sample Graph 26 (Macintosh)

64
The Graph Club Teacher’s Guide
Graph 27: Match It - Farm AnimalsWorking as a class, in teams, or individually, create a graphthat represents the data in this graph. When you’ve finished,
click Check My Match! to see how well you’ve done!
Sample Graph 27 (Macintosh)

65
The Graph Club Teacher’s Guide
Graph 28: Match It - FruitsWorking as a class, in teams, or individually, create a graphthat represents the data in this graph. When you’ve finished,
click Check My Match! to see how well you’ve done!
Sample Graph 28 (Macintosh)

66
The Graph Club Teacher’s Guide
Graph 29: Match It - Lost TeethWorking as a class, in teams, or individually, create a graphthat represents the data in this graph. When you’ve finished,
click Check My Match! to see how well you’ve done!
Sample Graph 29 (Macintosh)

67
The Graph Club Teacher’s Guide
Graph 30: Match It - MoodsWorking as a class, in teams, or individually, create a graphthat represents the data in this graph. When you’ve finished,
click Check My Match! to see how well you’ve done!
Sample Graph 30 (Macintosh)

68
The Graph Club Teacher’s Guide
Graph 31: Match It - More AnimalsWorking as a class, in teams, or individually, create a graphthat represents the data in this graph. When you’ve finished,
click Check My Match! to see how well you’ve done!
Sample Graph 31 (Macintosh)

69
The Graph Club Teacher’s Guide
Graph 32: Match It - Safari AnimalsWorking as a class, in teams, or individually, create a graphthat represents the data in this graph. When you’ve finished,
click Check My Match! to see how well you’ve done!
Sample Graph 32 (Macintosh)

70
The Graph Club Teacher’s Guide
Graph 33: Match It - SeasonsWorking as a class, in teams, or individually, create a graphthat represents the data in this graph. When you’ve finished,
click Check My Match! to see how well you’ve done!
Sample Graph 33 (Macintosh)

71
The Graph Club Teacher’s Guide
Graph 34: Match It - Starry NightWorking as a class, in teams, or individually, create a graphthat represents the data in this graph. When you’ve finished,
click Check My Match! to see how well you’ve done!
Sample Graph 34 (Macintosh)

72
The Graph Club Teacher’s Guide
Graph 35: Match It - TravelWorking as a class, in teams, or individually, create a graphthat represents the data in this graph. When you’ve finished,
click Check My Match! to see how well you’ve done!
Sample Graph 35 (Macintosh)

73
The Graph Club Teacher’s Guide
Choosing the Right GraphChildren need to understand that different types of graphsare used to describe different kinds of data. Consider theseguidelines when planning and implementing graphingactivities with your class.
Table All kinds of dataPicture Things that can be countedBar Things that can be counted or measuredLine Things that change over time, trendsCircle Parts of a whole, parts of a set
The following practices can encourage students to developskills in identifying appropriate ways of displaying differenttypes of data:
• Display different representations of the same data sideby side for comparison.
• Use the Graph Type buttons to change data instantlyfrom one representation to another.
• Ask students which type of graph is easiest for them tounderstand. Which graph do they think makes the mostsense? Ask students to give reasons for their opinions.
• Encourage students to examine the ways data is displayedin newspapers, magazines, television, textbooks, andother media.
• Guide students in making generalizations about the typesof data best displayed by each graph type.

74
The Graph Club Teacher’s Guide
Getting Started in the Primary GradesThe following suggestions can help assure success when intro-ducing graphing concepts and activities in the primary grades.
Start with counting, classifying, and sorting activities.Have students count objects, determine categories, and sort.Then have them come up with new categories and sort again.
Use manipulatives. Provide extensive experience with concreteactivities before moving on to abstract concepts. (See Workingwith Manipulatives on pages 76–78.)
Encourage students to devise their own systems.Ask students how they would display data and have themdesign imaginative displays using manipulatives, diagrams,and graphs.
Start by graphing real objects. Create people graphs, objectgraphs, and block graphs.
Move on to representational graphs. Use pictures, drawings,and photographs of real objects. These semi-concrete represen-tations help students make a transition to more abstract formsof graphing.
Make the transition to abstract representations. Introducethe use of uniform ideographs or symbols in the form of picturegraphs. Then move on to bar, line, and circle graphs.
Limit the number of graph elements. Start with graphs thatinclude only two groups or graph elements. Gradually increasethe number of groups.
Select topics to which children can relate. Young childrenare curious about themselves and the world around them.Take advantage of this natural curiosity by selecting topicsof interest to your students. Encourage students to suggestgraphing activities and enlist their help in identifying appro-priate categories for sorting and classifying data.
Provide a meaningful context. Graphing will make moresense and students will internalize concepts better if graphingactivities are presented in meaningful contexts.

75
The Graph Club Teacher’s Guide
Build graphing activities around a theme. When planningadditional graphing activities, try to organize them aroundan ongoing project or theme. Activities that are drawn fromeveryday classroom experiences will have the advantage ofa meaningful context.
Print. A printed copy makes the abstract more concrete andallows students to share their work.
Talk math, write math. Learning and using the languageof math and graphing will help students internalize concepts.The ability to type a story or description when printinggraphs encourages students to “write math.” You may wantto culminate graphing activities with creative writing anddrawing activities.
Encourage confidence. Success builds confidence. Takingstudents through a progression of easy to more difficult graph-ing activities will encourage success and build confidence asthey gradually develop more sophisticated graphing skills.

76
The Graph Club Teacher’s Guide
Working with ManipulativesChildren’s first graphing experiences should involve the use ofconcrete objects. From real graphs (graphs that use real objects),students should move to representational graphs (drawings,photos, pictures cut from magazines), and only then tosymbolic graphs.
Use some of the following ideas for implementing concretegraphing activities, or devise your own. Try to pick topics thatare conducive to the use of manipulatives. Also be sure that youencourage your students to suggest and devise original systemsfor displaying data.
People graphs• Line up desks or chairs in several rows to create a grid-like
pattern. Assign labels to each row — e.g., blue eyes, browneyes, black eyes, green eyes — and have students chooseseats accordingly.
• Create a large reusable floor grid using heavy paper, canvas,or other fabric. Label rows and columns and have studentsline up accordingly.
• Use masking tape to create a floor grid or, if you have largerectangular floor tiles, use tape to mark off rows. Place labelsfor each row and have students line up.
Block graphsHave students stack Unifix® cubes, building blocks, Cuisenaire®
rods or any standard size blocks. If you want, students can pastepictures on blocks or use different colored blocks to representdifferent categories. (Unifix and Cuisenaire available throughDelta Education. For a catalog, call 1-800-442-5444.)
Object graphsUse juice cartons, cereal boxes, shoes, hats, books, toys, stuffedanimals, or any other objects. Make smaller object graphs withclothespins, tokens, beads, paper clips, plastic or paper chainlinks, M&M’s, or similar items. Use the following suggestionsor a system of your own for organizing object graphs. Betteryet, let your students devise a system.
77
The Graph Club Teacher’s Guide
• Draw a grid on the blackboard, bulletin board, or wall. Labelrows or columns and stack items or attach them with tape.
• Use the floor grid described above or create a smaller versionwhich can also be used on a desktop.
• Create a rectangular fabric panel approximately 4’ x 4’ orlarger. Divide the panel into squares in a grid-like patternand sew a pocket on each section. Attach removable labelsto each row and let students tuck items into pockets in theappropriate row.
• Create a large rectangular frame with pigeonholes in agrid-like pattern. Assign labels to different rows or columnsand have students place one item per pigeonhole inappropriate rows.
• For small objects, make copies of the 1” graph paper onpage 89. Have students sort objects, label columns, andplace objects on the sheet with one per box or “cell.”
• Use egg cartons as ready-made grids.
• Attach magnets in rows or columns to any magnetic surface.
• Hook together links and hang chains side by side.
• Clip clothes pins in rows to the sides or bottom of a chart.
Pictures and photographs of real objectsHave students draw pictures, cut pictures from magazines, oruse photographs. Students can use photos or drawings of them-selves to cast votes. Have students tape the pictures in rows orcolumns on the blackboard, bulletin board, or wall. If you want,place a large sheet of paper with a grid on the floor or table andlabel rows or columns.
Other concrete graphing activitiesThere are a million uses for graphs. Here are a few activityideas that may spark some great interest:
• Have students outline their hands, feet, or entire body andthen cut out their outlines and post them on the blackboard,bulletin board, or wall. Older students can draw horizontaland/or vertical axes and make appropriate labels.

78
The Graph Club Teacher’s Guide
• Use ribbon, cash register tape, or string to measure students’height, the circumference of their wrists, or the length orheight of any object. Cut appropriate lengths and use themto create “bar graphs.”
• Have students create picture graphs using rubber stampsand ink pads. Use different stamps or identical stamps witha different color ink for each column or row.
• Use string, yarn, or ribbon to connect the tops of thecolumns in a bar or picture graph in order to introducestudents to line graphs.
• Use geoboards to create bar or line graphs.
• Use your imagination! Look around you and invent yourown unique measuring units.

79
The Graph Club Teacher’s Guide
Printing IdeasWith The Graph Club you can print graphs and a whole bunchof other neat stuff including graphics from The Graph Club Cur-riculum Kit (sold separately — see page 9 for details). All graphsand graphics can be printed in three sizes: standard, big book(2 pages by 2 pages), and poster (3 pages by 3 pages). A specialprint dialog box encourages students to write about their graphsby providing an opportunity to enter text. This text can be savedand printed with your graphs. Here are some suggestions formaking the most of The Graph Club’s printing features.
• Have students suggest a description or story to go with thegraph and enter it in the print dialog box before printing.
• Print graphs standard size and make copies for each studentin the class. Have students color their graphs and, if the textbox is blank, write a description or story.
• Have students create a book composed entirely of graphsthat tell a story. Print the graphs book-size, bind themtogether, and have students color them and write descriptionsin the text boxes.
• Print graphs poster-size and have students work together tocolor them and write a description or story. Post the finishedproduct in the classroom, hallway, library, or another locationin the school or community.
• Insert a heat transfer ribbon in your dot matrix printer andprint The Graph Club logo (reverse version) on regular paperto create an iron-on transfer for t-shirts or banners. Or printThe Graph Club logo (normal version) using a regular ribbonor toner to create posters, book covers and report covers.

80
The Graph Club Teacher’s Guide
Authentic AssessmentThe Graph Club is an effective tool for assessing student perfor-mance. It provides a means to engage students in meaningfulreal-world tasks and allows them to create products that can beadded to their portfolios.
Have students use The Graph Club to complete real-world taskssuch as those listed below.
✦ Surveys – Ask students to pose a meaningful question,design a survey form, and collect data. Have them organizethe results in graph form, interpret their findings, and tellwhy their findings are meaningful.
✦ Field studies – Have students investigate the world aroundthem. Ask students to count or measure plants, objects,animals or themselves, create a graph, and interpret theirfindings. Ask them to hypothesize to a broader sample.
✦ Library research – Have students collect information frombooks, magazines, and other resources, organize their data,and present it in graph form. Have them summarize andinterpret their findings for the class.
✦ Predicting – Ask students to predict what will happen to onegraph when another graph in the same data set is changed —e.g., what will happen to a circle graph when a bar graph ischanged. Ask students to use their research or survey resultsto predict the outcome of a future endeavor.
✦ Match – Use the Match mode to evaluate students’ under-standing of the relationship between different representationsof the same data.
✦ Brainstorm – Have students brainstorm as many interpreta-tions as possible for a randomly generated graph in theGuess modes.
✦ Add printed graphs and written work to students’ portfolios.

81Permission granted to copy for classroom use only. ©Tom Snyder Productions, Inc.
The Graph Club Teacher’s Guide
Reproducible Masters
Circle Graph ............................................................................................ 82Dogs Cats Bunnies Fish ......................................................................... 83Bus Car Bicycle Foot .............................................................................. 84Dollar Bills ............................................................................................... 85Grid .......................................................................................................... 861 cm x 1 cm Grid..................................................................................... 871/2 in. x 1/2 in. Grid ............................................................................. 881 in. x 1 in. Grid ...................................................................................... 89The Graph Club Logo .............................................................................. 90The Graph Club Reversible Logo ........................................................... 91Membership Cards ................................................................................ 92Software Icons ........................................................................................ 93
82 Permission granted to copy for classroom use only. ©Tom Snyder Productions, Inc.
The Graph Club Teacher’s Guide
Circle Graph

83Permission granted to copy for classroom use only. ©Tom Snyder Productions, Inc.
The Graph Club Teacher’s Guide
10987654321
Dogs Cats Bunnies Fish

84 Permission granted to copy for classroom use only. ©Tom Snyder Productions, Inc.
The Graph Club Teacher’s Guide
6
7 8
93
4
52
113
14
15 1
6 17
10 1
1 12
18 19
20
Bus
Car
Bic
ycle
Foo
t

85Permission granted to copy for classroom use only. ©Tom Snyder Productions, Inc.
The Graph Club Teacher’s Guide
Dollar Bills

86 Permission granted to copy for classroom use only. ©Tom Snyder Productions, Inc.
The Graph Club Teacher’s Guide
Grid
Title:
How many? How many? How many?How many?
10
9
8
7
6
5
4
3
2
1

87Permission granted to copy for classroom use only. ©Tom Snyder Productions, Inc.
The Graph Club Teacher’s Guide
1 cm x 1 cm Grid

88 Permission granted to copy for classroom use only. ©Tom Snyder Productions, Inc.
The Graph Club Teacher’s Guide
1/2 in. x 1/2 in. Grid

89Permission granted to copy for classroom use only. ©Tom Snyder Productions, Inc.
The Graph Club Teacher’s Guide
1 in. x 1 in. Grid

90 Permission granted to copy for classroom use only. ©Tom Snyder Productions, Inc.
The Graph Club Teacher’s Guide
The Graph Club Logo

91Permission granted to copy for classroom use only. ©Tom Snyder Productions, Inc.
The Graph Club Teacher’s Guide
The Graph Club Reversible Logo
• Insert a heat transfer ribbon in your dot matrix printer and print The Graph Club logo(reverse version in the Print Special Menu) on regular paper to create an iron-on transferfor t-shirts or banners. Or print The Graph Club logo (normal version) using a regularribbon or toner to create posters, book covers, and report covers.

92 Permission granted to copy for classroom use only. ©Tom Snyder Productions, Inc.
The Graph Club Teacher’s Guide
Official Graph Club I.D. Card
Team Name
Your name
Teacher’s Signature
Official Graph Club Team Card
Team Name
Team Members
Draw your team flag or symbol
Membership Cards
Additional team activities can help promote cohesiveness. Creating team paraphernalia —flags, buttons, posters — are good spirit boosters. Use this template to create team cardswhich can be displayed when a team, or teams, achieve a certain goal or behavior. Keep inmind that many activities designed for teams can become whole class (whole team) activi-ties. Consider activities which incorporate all teams the way the Olympic flag includes acolor from each participating nation’s flag. Cooperative teamwork does not need to excludewhole class work and class spirit.

93Permission granted to copy for classroom use only. ©Tom Snyder Productions, Inc.
The Graph Club Teacher’s Guide
Software Icons
Ancestors
Buildings
Farm Animals
Wild Animals
Creatures
Fruits & Vegetables
Meats & Proteins

94 Permission granted to copy for classroom use only. ©Tom Snyder Productions, Inc.
The Graph Club Teacher’s Guide
Software Icons (cont.)Grains & Cereal Dairy Products
Misc. Foods
Holidays
Weather
Seasons
Sports
Shoes
People & Characters
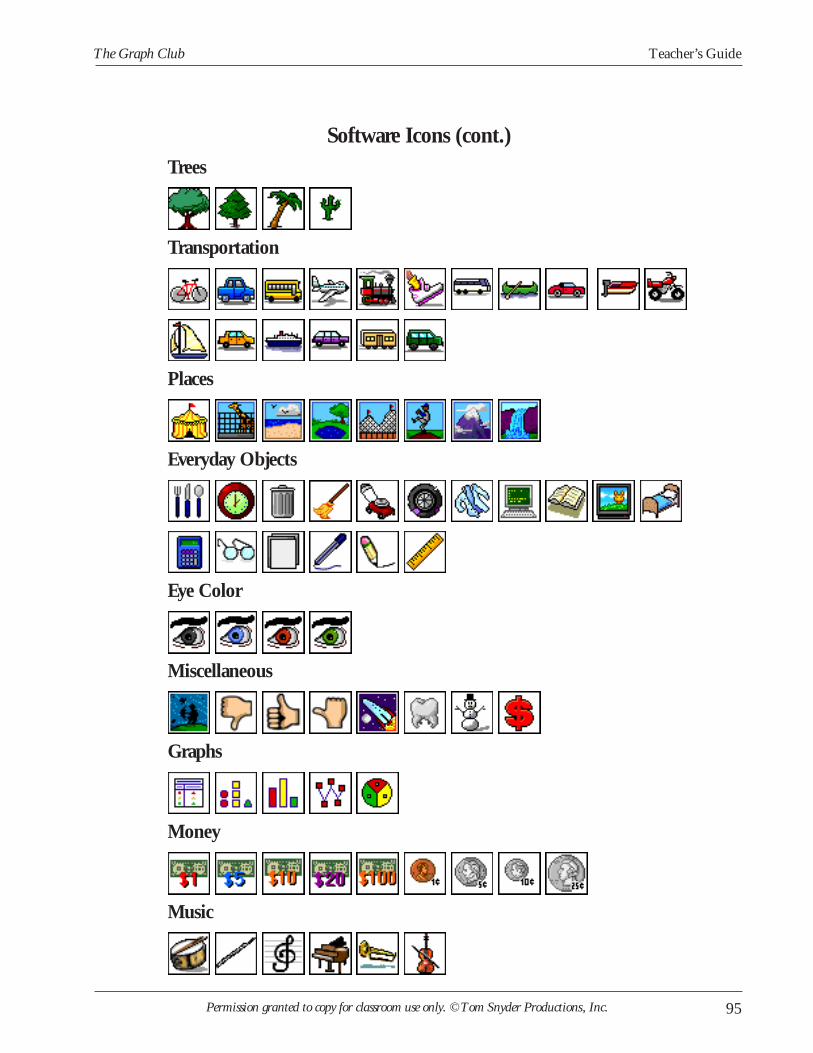
95Permission granted to copy for classroom use only. ©Tom Snyder Productions, Inc.
The Graph Club Teacher’s Guide
Software Icons (cont.)Trees
Transportation
Places
Everyday Objects
Eye Color
Miscellaneous
Graphs
Money
Music

96 Permission granted to copy for classroom use only. ©Tom Snyder Productions, Inc.
The Graph Club Teacher’s Guide
Software Icons (cont.)Faces
Shapes
Letters and Numbers
to ; to

The Graph Club -Second Grade
- This lesson is designed to integrate technology into the graphing unit. This is a whole group lesson, which will be conducted in the computer lab.
Objectives: Gather data and represent data using tally marks Use data to create a chart Interpret data to complete a bar graph on teacher created worksheet Use technology to check accuracy
Procedures for Lesson: Depending on your class size and skill level, divide your students into groups of up to no more than 10 in a group. Assign each group one of the following categories: Animals, Seasons, Sports, Fruits and Snacks (See attached page) In each group, students will vote for their favorite using tally marks For the computer lab, students will need their pencil, crayons a n d data Students will log into Compass Double click on Graph Club Click on Add, then R u n Click on Skip Introduction Double click on Create Have all students go up to Graph Scroll down to Choose Symbols Students will search for their symbols To choose a symbol, students will click & drag to one of the lst four boxes, then click OK Students will enter their data by clicking on the zero In the box, enter the number of votes for the symbol, then click OK Repeat procedure for next three Using the data from the chart, each student will complete the teacher created bar graph To check their work, students will go up to Graph and click on Make Another Graph At the bottom of their new graph, students will click on the third icon, which is a bar graph After checking for accuracy, students will complete the questions a t the bottom of the teacher created worksheet Students will turn in their chart and bar graph To exit, students will click on File, Close Set, then Don't Save If time allows, students are permitted to independently work in Graph Club

Favorite Animal What? How Many?
r'

Grid
Title:
Which had the most votes? Which had the least votes? How many votes did each symbol stand for? How many students voted in all? How many students voted f o r horse and monkey?
Create a subtraction problem using the data.
- knrichment: - If each symbol is 2 votes, how many sfudents voted in all?

Favorite Season

Grid
Which had the most vores! Which had the least votes? How many votes does each symbol stand for? How many students voted in all? How many students voted f o r winter and spring?
Create a subtraction problem using the data.
Enrichment: If each symbol is 2 votes, how many

Favorite Sport What? How Many?
I

Name:
Grid
Title:
Which had the most votes? Which had the least votes? How many votes does each symbol stand for? How many students voted in all? How many students voted f o r football and basebal I ?
Create a subtraction problem using t h e data.
- rnrichment: - If each symbol is 2 votes, how many siudenis voted in all?


Name:
Grid
Which had t h e most votes?
Title:
Which had t h e least votes?
How many votes does each symbol stand for?
10 ~ I I
9 I 8
7 1 6
'7 ~ ~
How manv students voted in all?
I
3 ~ 2
1
How many students voted f o r banana and orange?
I
I
Create a subtraction problem using t he data.
Enrichment: I f each symbol is 2 votes, how many
s.$&ents voted in all? -.

Favorite Snack What? How Many?

Grid
Title:
Which had the most votes? Which had the least votes? How many votes does each symbol stand fo r? How many students voted in all? How many students voted f o r cookies and potato
Create a subtraction problem using t h e data.
Enrichment: If each symbol is 2 votes, how many students v o i d in all?

Third Grade Technology/Science
Plant Growth and Development
(Graphing growth spurt results using Graph Club)
Standards: -2.11.3 B : 3.1.4 E : 2.6.3 A : 2.6.3 B : 2.6.5 A : 2.8.3 G : 2.8.3 H
Objectives: The student can: Enter text. Use a table or chart to display information. Describe and interpret the data shown in tables and charts. Identify least and greatest values represented in bar graphs and pictographs. Gather, organize, and display data using pictures, tallies, charts, bar graphs, and pictographs. Examine and explain change by using time and measurement.
1. Assign Graph C l u b so that each child will be able to log in through
Compass.
2. Choose create and click &
Directions To Create Table
1. Double click on the word Title at the top of the graph. Enter a title for the graph
(ex. My Plant's Growth Spurt) Click OK.
2. Double click on What? at the top of the left column. Type Day # and click OK
3. Double click on How Many? at the top of the right column. Type Inches and
click OK.
4. Move cursor to top of page and click on the word Graph. Move down to the
number of days you would like to graph. After you choose the amount you wish
to enter. Click

5. Double click each animal one at a time, and type the day # (ex. Day 1, Day 2,
Day 3, Day 4) and click OK. Repeat process until the column is filled with day
numbers. Note: You may have the class chart every other day of the growth
spurt. (ex. Day 1, Day 3, Day 5)
6. Move cursor to top of page and click on the word Graph. Highlight Choose Scale
Maximum and click in the circle beside the number 20, then c l i c k s
7. In the Inches column, click on each day's corresponding number, enter your data
and click OK.
8. Now your table is completed.
Directions to Create Graphs
1. Move cursor to top of page and click on the word Graph. Highlight the words
Make another graph.
2. A Split screen will appear that will show a pictograph along with your chart.
3. At the bottom of the pictograph, under the x axis- there are 4 different squares to
press to create various graphs such as: bar graph, line graph, and circle graph.
4. If you would like to have the students print graphs. Move the cursor to the top of
the page and click on the word File, and then Highlight Print Graphs.
5. Check the box next to which graphs you would like to be printed. Note: All
graphs will print on one page.


Graph Master

Using Graph Master Open Graph Master Click twice on Graph Master icon in your screen. Click the yellow bvtton, New
Data Set, to enter your data and create a graph. A new empty data table will appear.
'j
Enter Data to Table Label Columns - Click the column label and type. Enter values - Click, type, and hit Entsr.
Use the foliowing keys to move inside the table: Tab -Tomwsonecelltotheright. Enter - To move one cell down. Arrow Keys - To move up, down, left, & right.
Save Data Choose Scwe Data Set As... from the File menu. Give your data set file a name related to your work Select loretion where you wont to save your file in the box Savs in:.
Create Graph Gmph Master guides you hmugh this process all the way. You just need to make choices about variabies, gmph type, and scale. Click the Graph button on your toolbar in the left side of your screen.
Choose Variables fhe Choose Variables dialog box appears. Click the checkboxes for the variables you would like to gmph. Click OK.
Choose Graph Type The Click to choose a n m ~ h ime,dialog box will appear. Determine which graph type is the most appropriate for your data set and click the button for the graphtype, then dick OK.
Set the Scale The numbers in red show the mnge of the dato displayed on an axis. Use this - information to choose an appropriate minimum, maximum, and step size for
your gmph. You move fmm one box to the next by pressing the Tabkey. Click OK and your graph will appear.
The maximum is the highest value in your scale. The minimum is the lowest value in your scale. The step size is the difference between two consecutive values.
Add a Title Click on the word ji& at the top of your graph and enter a title for your graph.
A n a l p Graph Click Notebook on the toolbar. A notebook window will appear. Write about your data set or answer the major quesiions of the activity. When you are done writing in the notebook, click the close box, B, on the upper right comer of the notebook window.
Save Data Save your wok again. Choose S c m Data Set from the File menu. The data table, graph, and notebook text will be saved together as one data set file.
Print and Present Choose from the File menu or hit the keys Ctd and P simultaneously. A dialog box appears. From the list on the left, select the items you want to print. The selected items will be displc~yed in the Preview area on the right. Check the printing options instructed by your teacher. When you am ready, ciick OK.
w
Close Graph Master before you wit, make sure you save any new changes made to your data set file. Choose Exit from the File menu. Gmph Merster will close.

Tom Snyder Productions®Tom Snyder Productions®
Mac/Win CD-ROM
www.tomsnyder.com
Graph, analyze, and compare datawith this easy-to-use tool!
Graph, analyze, and compare datawith this easy-to-use tool!

II
Executive ProducerJessica Adler
DesignersJessica Adler, Eytan Bernet
Software EngineeringProject Management: Eric VanHelene (Vanteon)Programming: Eytan Bernet, Steve Athanas (Vanteon), Dean Brown (Vanteon)Programming Support: Eric Hilfer, Sean NolanAdditional Support (Vanteon): Joshua Bouk, Chuck Dubois, Kelly Forth, Vincent Frisina,Mike Houle, Ann Lafford, Chris Meaker, Dan Palma, Joel Reiser, Aaron Sher, John Szucs
Help SystemTina Moran
Software Quality AssuranceMark Lynch, Kevin Kennedy-Spaien, Zlatka FitnevaAdditional QA (Vanteon): Scott Daniels, Anne Moorehouse,Wayne Agostino, Dan Bower,Cindy Goh, Suzanne Golia, Carryl Hardy, Melissa Karakashian, Cliff Konefke, Kaurie MacElroy,Karen Nader, Hassan Nur, Andre Quina, Sampada Salunkhe, Deanne Shaffer, Paul Sixt,Andrei Tsapaev, Will Veeder, Kathy Warren, Sara Wendell, Michael Zawistowski
Art & DesignSoftware Interface & Design: David Grotrian, Liz HurleyPrint Design & Production: Tina BourgeoisCover Illustration: Lauren Harman
EditorialTeacher’s Guide: Jessica Adler, Tina MoranProofreader: Pauline ChinInterns: Vinh Trinh, Kimberly Macey
Content ReviewJoan Weinstein, Grace Kelemanik, Sydney Foster, E. Samuel Palmer
Data SetsThe following organizations generously provided data for use with Graph Master:Harvard-Smithsonian Center for Astrophysics, Infoplease.com, Inter-university Consortiumfor Political and Social Research (ICPSR), Kids’ Money, NBA Properties, Inc., Six Flags, Inc.,United States Census Bureau.
Special thanks to the following educators:Rosalie Allen, Glenn Angell, Mr. Bader, Vincent Baldari, Kathleen Barry, Amy Bebell,Rachel Belsito, Charles Bender, Debbie Bresnick, Lynne Buchhalter, Brenda Bullock,Joanne Calnan, Domenic Campagnone, Bob Carpenter, Meagan Carr, Dan Cedrone,Maria Cirmia, Laurie Cleveland, Coleen Collette,Tom Commeret, Diane Cooper,Patrick Cunningham, Linda Curran, Christine Dardia, Mary Deppe, Michele DiGirolamo,Colleen Donahue, Joyce Dziedzic, Merideth Ekwall, Clenna Emery, Maura Erwin,Mark Ferrera, Sarah Fiarman, Paula Fiorillo, Elsa Francescone, Alyson Gaylord-Loy,David Gorman, David Guarnieri, Mark Gura, Gerald Haber, Sondra Hamilton, Joel Heffner,Susan Hirsh, Sara Horton, Erica Ilyin, Judi Mathis Johnson, Mae Kelly, Monica King,Amy Kuhn,Margaret LeBlanc, Debi Levine, Joan Leyland, Lise Linthicum, Crystal Magnant, Faye Manyak,Sandy Martinez, Olivia Mathews, Kay McGarrity, Anna Mendez, Mary Anne Michon,Pam Miller, Dan Monahan, Deborah Montagna, Pamela Moore, Suzanne Morin, Peg Mullen,Philomena Mullen,Anne Oates, Jack O’Keefe, Frederick Park, Rebecca Perry, Barbara Peskin,Renee Phillips,Tom Plati, Maggie Prezzano, Deborah Reidy, Kathy Rielly, Raylene Roberts,Janet Rogers, Robert Rossetti, Erik Ruhmann, Barbara Scotto, Michelle Scribner-MacLean,Maureen Severo, Gary Shrager, Mindy Sick, Mary K. Smith, Mary St. Onge, Katie Sullivan,Bob Thomas, Norman Townsend, Margot Vine, Laurette Viteritti, Charles Vogel, John Ward Jr.,Jean Warden, Deborah White, Chris Willems, Molly Wolverton, Deanna Wong
For more information about Tom Snyder Productions or for a free catalog, please call us at
1-800-342-0236 or visit us on the Web at www.tomsnyder.com
CreditsPublisherRichard Abrams
Editor-in-ChiefDavid A. Dockterman, Ed.D.
Thanks to the team atTom Snyder Productions:Carl Adams, Mark Airey, Seth Alpert, Phillip Andrews,Amy Ashman, Heidi August, Liz Baker, Christine Barie,Erin Bergin, Marci Bernstein, Lori Bertino, Dee Boyd,Brian Briggs, Meghan Cahill, Ronan Campbell,Andrea Castellanos, Brian Cerasuolo, Amy Conklin,Becky Conners, Rachel Cook, Mary Crane, Nancy Csaplar,Evemarie Davis,Will Davis, Patrick Downie, David Dussault,Kerry Dwyer, Hedrick Ellis, Peter Erwin, Caitlin Fahey,Jack Ferraiolo, Carrie Finison,Tim Finn, Maria Flanagan,Alan Foreman, Aya Fukuda, Sean Gallagher, Mandy Gallant,Melissa Galsky, Chris Georgenes, Priscilla Giguere,Terry Gilligan, Lisa Gillim, Jen Gimber, Eric Gitelson,Arnold Goldstein, Kim Goodman, Rish Green,Lisa Hamanaka, Arlene Hawkins, Niki Hebert, Steve Huff,Jason Hutton, Ikay Iwobi, Andrew Kay, Josh Kickham,Denis Knjazihhin, Laura Kozuh, Ruta Kulbis,Aidas Kupcinskas,Charlie Lamson, Inga Logan, Bernie Lord,Andre Lyman,Marty Lyman, Greg Mardirosian, Brian McCabe,Chris McClain, Lisa Miller, Cory Mitchell, Ashaela Moore,Brian O’Mara, David O’Neil, Kim O’Neil, Edie Perkins,Bill Provost, Sandy Reilly, Maribel Reyes, Paula Rheaume,Ivan Rhudick, Lenora Robinson, Stephen Rogan,Tyler Ronald,Amy Ronayne, John Sacco, David SanAngelo, Mike Scott,Adam Simha, John Simpson, Jody Snider, Nathaniel Stahl,Arlene Steele, Deb Stolusky, David Tata, Kaydi Terwilliger,Sandra Sicard, Mark Usher, Kim Verner, Chrissie Welch,Caroline Wingerd, Nelson Wolf, Damon Wong,Jleaugen Wong, Amy Yau
Copyright Notice© 2001 Tom Snyder Productions, Inc.All rights reserved.
Graph Master is a trademark of Tom Snyder Productions, Inc.Tom Snyder Productions is a registered trademark of Tom Snyder Productions, Inc.Macintosh is a registered trademark ofApple Computer, Inc.Windows is a registered trademark of Microsoft Corporation.
QuickTime and the QuickTime logo are trademarks of Apple Computer, Inc.used under license.
This document and the software described in it may not, in whole or in part, be copied,photocopied, reproduced, translated, or reduced to any electronic medium or machine-readableform other than that which has been specifiedherein without prior written consent from Tom Snyder Productions, Inc.

III
ContentsGetting StartedWhat Is Graph Master ? ................................................................................................................................................1
What You Get & What You Need........................................................................................................................2
A Quick Feature Snapshot ........................................................................................................................................3
Meeting State & NCTM Standards ....................................................................................................................7
Using Graph MasterInstallation..............................................................................................................................................................................9
WalkThrough ..................................................................................................................................................................11
Features & Functions ..................................................................................................................................................29
Technical Support & Troubleshooting..............................................................................................................49
Nine Graph Types ........................................................................................................................................................51
Classroom Activities ............................................................................................................................71
Math Curriculum Matrix ................................................................................................................88
Index ................................................................................................................................................................................89

IV

1
What Is Graph Master?Graph Master is a powerful, yet easy-to-use data analysis tool for grades 4-8. The programallows you to meet state and NCTM standards as your students collect, graph, analyze,and present data.
Collect DataStudents can collect and enter their own data (up to 16 columns and 512 rows) orthey can import data from tables, spreadsheet programs, or the Internet. In addition,Graph Master comes with ten sample data sets on topics ranging from immigration toroller coasters!
Create GraphsGraph Master lets students create nine types of graphs: Bar graphs, pictographs, circlegraphs, line graphs, scatterplots, frequency charts, histograms, line plots, and box plots.The program doesn’t just make graphs; it helps students understand and interpretthem. As students create a graph, they must make decisions about variables, graphtype, and scale.The built-in glossary helps students understand how to use and interpreteach of the nine graph types.
Analyze GraphsGraph Master’s comparison feature makes it easy for students to compare differentrepresentations of the same data (different graph types, different scales), or to viewrelated data sets side by side. Students can also display statistics (mean, median, mode,and range), filter data in lots of different ways, and write observations and conclusionsin an on-screen notebook. In the process, students learn to use graphs to investigateand answer questions, such as: “How tall are the students in our class?” or “How havepatterns of immigration changed over the past 50 years?”
Print & PresentOnce students have finished analyzing their data, Graph Master makes it easy for themto present their results. Students can print graphs in a variety of formats.They can alsosave or copy graph images for use in written reports, slide shows, or Web sites.

2
What You Get & What You NeedWhat You Get
• Hybrid Macintosh/Windows CD-ROM
• This Teacher’s Guide
What You Need
Data RightsGraph Master includes ten sample data sets for students to graph and analyze. You arefree to use this data, and related graphs, for personal, classroom, and non-commercialuses only. Graph Master data sets are copyrighted materials, and therefore may not bereproduced in books, commercial software, or commercial Internet sites, or broadcaston television.
When you print or export data or graphs for use in school-related or personal (non-commercial) publications or Internet sites, please include the appropriate copyrightinformation.(This information appears in the notebook for each data set file, and alsoon pages 73–82 of this Teacher’s Guide.)
Thank you!
Computer System RAM Monitor Hard Disk CD-ROM
Power PC Macintosh or better 8.1 or later100 MHz or higher 32 megs
256-colors;Recommended: 800 x 600 monitor 10 megabytes of Double-speed
IBM-compatible Windows 95 64 megs resolution or higher free disk space or higherPentium or higher or higher100 MHz or higher
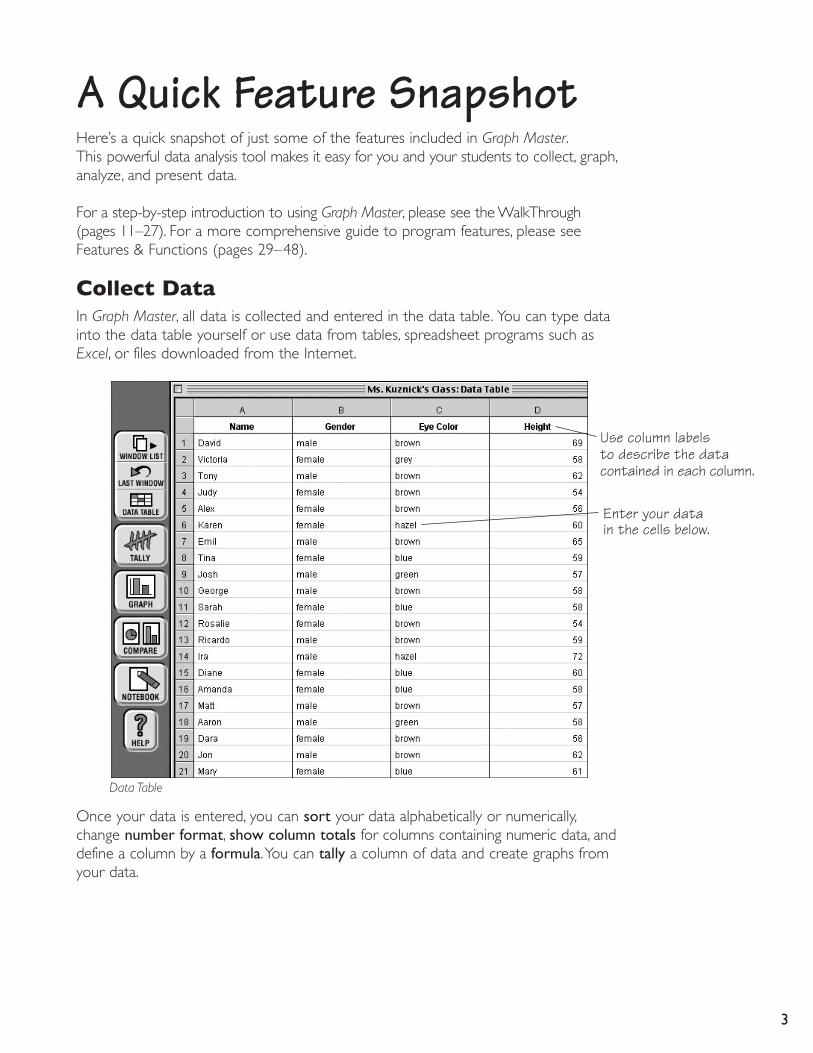
3
A Quick Feature SnapshotHere’s a quick snapshot of just some of the features included in Graph Master.This powerful data analysis tool makes it easy for you and your students to collect, graph,analyze, and present data.
For a step-by-step introduction to using Graph Master, please see the WalkThrough(pages 11–27). For a more comprehensive guide to program features, please seeFeatures & Functions (pages 29–48).
Collect DataIn Graph Master, all data is collected and entered in the data table. You can type datainto the data table yourself or use data from tables, spreadsheet programs such asExcel, or files downloaded from the Internet.
Once your data is entered, you can sort your data alphabetically or numerically,change number format, show column totals for columns containing numeric data, anddefine a column by a formula.You can tally a column of data and create graphs fromyour data.
Use column labels to describe the data contained in each column.
Enter your data in the cells below.
Data Table

4
Create GraphsGraph Master lets you create nine types of graphs.(To learn more about each graph type, please see pages 51–70.)
Bar graphs (and double bar graphs) Frequency charts
Pictographs Histograms
Circle graphs Line plots
Line graphs (and double line graphs) Box plots
Scatterplots
Creating a graph is easy! The program takes you through several steps:
1. Choose the variables you want to graph.
2. Choose an appropriate graph type.
3. Choose an independent variable.
4. Set the scale.
When the final step is complete, your graph appears on screen! From there, it’s easyto add a title and make changes to axis labels or scale:
Click the graph scaleto set a new scale.
Click the axis labelsto type new labels.
Click the title of yourgraph to type a title.

5
Analyze GraphsGraph Master includes a variety of features designed to help students understand, analyze,and interpret graphs. These include the ability to:
• Compare multiple graphs or a graph and a data table side by side.
These graphs display the same data, but use different graph scales. The ability to represent the same data indifferent ways can lead to great critical-thinking and cooperative-learning activities.
• Write about graphs in an on-screen notebook.
• Show statistics for graphs containing numerical data. Graph Master allows you to display the mean, median, mode, and range. Statistics can be displayedboth as numbers and as symbols on a graph.
• Filter the data displayed in your graphs.Example:Your class has just collected data on students’ age, height, and gender,and created a graph showing the distribution of heights. Using this powerful feature, you can filter the data so that the graph displays only the heights ofmale students, or only the heights of female students.
• Mark outliers on box plots and show a line of best fit on scatterplots.

6
Print & PresentWith Graph Master, it’s easy to present your results! You can print data tables, graphs,and notebook text. You and your students can also publish graphs or data on theInternet, or incorporate them into written reports, worksheets, slide shows, or portfolioassignments.You can:
• Print graphs in a variety of formats including:
– up to four graphs on a single page– in black and white or color– regular size or large size (across four sheets of paper)– notebook text on its own page, or on the same page as your graphs
• Copy and paste graphs into your favorite paint, word processing, or desktop publishing programs.
• Save graphs as PICT, JPEG, or BMP files.
• Save data as tab-delimited text files which can be opened in spreadsheetprograms such as Excel.
Graph Master also includes:• Teacher preferences that allow you to limit the types of graphs available
to students, and modify the graph-creation process.
• An extensive Help system, including a glossary of data analysis terms and tips on using and interpreting the nine graph types.

7
Meeting State & NCTM StandardsGraph Master is designed to teach data analysis skills as students collect and organizedata, create graphs, analyze graphs, and present their results. The learning objectives ofthe program correlate to the NCTM Standards, as outlined below. For correlations tostate standards, visit our Web site at: www.tomsnyder.com/products/standards.
NCTM Standards Graph MasterStudents should be able to… Students can…
Formulate questions that can be • Collect and enter data in Graph Master’s addressed with data and collect, data table.organize, and display relevant data to answer them. • Represent data using nine types of tables
and graphs, including:(Data Analysis & Probability Standard)
Bar graph Frequency chartPictograph HistogramCircle graph Line plotLine graph Box plotScatterplot
• Make decisions about appropriate variables, scale, and graph type.
• Choose different graph types, depending onwhether data is categorical or numerical.
• Use the compare feature to view differentrepresentations of the same data (differentgraph types, different scale) side by side.
• Use the compare feature to view graphs from two related data sets side by side.

8
NCTM Standards Graph MasterStudents should be able to… Students can…
Select and use appropriate statistical • Display and interpret measures of centermethods to analyze data. (mean, median, and mode).
(Data Analysis & Probability Standard) • Display and interpret range of data.
• Mark outliers in a data set, and explorehow outliers affect the mean.
• Display a line of best fit on a scatterplot.
• Use the filter feature to analyze andcompare subsets of data.
Develop and evaluate inferences and • Use the enclosed data files and activities predictions that are based on data. to explore real-world questions, or…
come up with their own!(Data Analysis & Probability Standard)Organize and consolidate their • Write about data and graphs in themathematical thinking through on-screen notebook.communication.
• Print data tables, graphs, and notebook (Communication Standard) text for use in presentations and reports.Understand patterns, relations, • Create and interpret line graphs of linearand functions. and non-linear functions.
(Algebra Standard) • Use line graphs to explore linear change.

9
InstallationMacintosh 1. Insert the CD-ROM into the CD-ROM drive.2. Double-click the Graph Master Installer.3. Follow the on-screen instructions to install Graph Master.4. To launch the application, double-click the Graph Master icon on your computer’s
hard drive.
Windows 95 or Higher1. Insert the CD-ROM into the CD-ROM drive.2. From the Start menu, choose Run.3. Type D:\SETUP (where D is your CD-ROM drive) and click OK.4. Follow the on-screen instructions to install Graph Master.5. To launch the application, go to the Start menu and choose Graph Master from the
Programs folder.
Network InstallationGraph Master can be installed to your network or run off a network CD tower. Followthe instructions below. Please see the Installation Instructions file on the CD for moreinformation.
Installing to a Network ServerMacintoshSimply drag the Graph Master folder to your network volume.
If you wish to have searchable Help: At each workstation, navigate to the Graph Masterfolder on your network volume, double-click the Help Installer, and follow the on-screendirections.
Windows 95 or HigherSimply drag the Graph Master folder from the CD-ROM to your network volume.
At each workstation, navigate to where you have just installed Graph Master on thenetwork, and run the SETUP.EXE application.This will install a Graph Master shortcutin the workstation’s Start menu.
Graph Master program icon
Graph Master Installer icon

Installing to a CD TowerMacintoshInsert the Graph Master CD-ROM in the network CD tower.
If you wish to have searchable Help: At each workstation, navigate to the Graph MasterCD-ROM, double-click the Help Installer, and follow the on-screen directions.
Windows 95 or HigherAt each workstation, navigate to the Graph Master CD-ROM, and run the SETUP.EXEapplication.This will install a Graph Master shortcut in the workstation’s Start menu.
10

11
WalkThroughThis WalkThrough steps you through the basics of analyzing data with Graph Master.You’ll learn how to collect and enter data, create graphs, analyze your graphs in a variety of ways and print and present your results.
For a quick overview of program features, see A Quick Feature Snapshot (pages 3–6).For comprehensive descriptions of each feature, see Features & Functions (pages 29–48).
Get Started1. Install the software. (See page 9 for instructions.)2. Double-click the Graph Master icon on your hard drive.The opening screen will appear.
3. Click New Data Set. A new, empty data table will appear. This is where you willenter your data.
Opening Screen
Graph Master program icon

12
Collect DataWe’ll begin by exploring the following question:What is the proportion of colors in a snack-size bag of your favorite multicolored candy?
Let’s imagine your students have investigated three bags of candy and come up withthe results shown below:
Let’s enter this data in the data table. Notice that the data table is divided into rowsand columns. Each column holds data for a different variable.
Data Table
Use column labels to describe the data contained in each column.
BAG 1brown 23green 4orange 7yellow 7blue 6red 9
BAG 2brown 18green 5
orange 9yellow 8blue 7red 9
BAG 3brown 24green 3
orange 6yellow 9blue 4red 11
TIP
When entering data,click Tab to move one
cell to the right. Click Return to move
one cell down. You can also use the arrow keys tonavigate up, down,
left, or right.
Enter your data in the cells below.

13
1. First, let’s enter column labels.When you make a graph, these column labels willbecome your axis labels, so it’s important to be descriptive! Since we’re investigatingthe color of candies in each of the three bags, let’s label the columns Color,Number in Bag 1, Number in Bag 2, and Number in Bag 3.
• Click the column label for column A (“Variable A” by default).
• Type “Color.”
• Now, continue adding labels to columns B, C, and D.
2. Next, let’s add the data in the columns below. Just click and type!3. Now go to the Data menu and choose Show Column Totals. The total number of
candies in each bag will appear at the bottom of the table.
SaveBefore continuing, let’s save our work.
1. Choose Save Data Set As... from the File menu. You can also press z-S(Macintosh) or Control-S (Windows).
2. Give your data set file a name (for example,“Candy”) and save it onto your hard drive.
Data Table with Column Totals
The Greek letter Sigma means sum or total.This row shows the totals for each column containing number data.

14
Create GraphsNow that you’ve entered your data, you’re ready to make a graph! When you create agraph, Graph Master guides you through a series of screens on which you’ll makechoices about variables, graph type, and scale. (This series of screens can be modifiedusing the Teacher Preferences settings. See page 36.)
Let’s start by making a graph of the candy colors in bag 1.
Choose Variables1. Click the Graph button on the toolbar. ( The toolbar runs along the left side of
the screen.) The Choose Variables dialog box appears.
2. Click the checkboxes for the variables you would like to graph. Since we want ourgraph to display the different candy colors along the x-axis, and the number of candiesin bag 1 along the y-axis, we’ll click Color and Number in Bag 1. Notice that thecorresponding columns highlight when they are selected.
Choose Variables
TIP
You can set Teacher Preferences to skip this dialog
(see page 36), then select the columns you want to graph prior to clicking the
Graph button.

15
Choose Graph Type1. When you have made your selection, click OK.The Choose Graph Type dialog box
appears.This dialog box shows you the nine types of graphs available in Graph Master.
2. Experiment by clicking buttons for different graph types. Notice that a descriptionof each graph type appears at the bottom of the dialog.This allows students todetermine which is the most appropriate type of graph for their data. Dependingon the data you have selected, some graph types will be unavailable. To learn why agiven graph is unavailable, simply move your cursor over that graph type, and anexplanation will appear below.
3. For now, let’s try a bar graph. Click Bar Graph, then click OK.
Set the Scale1. Next, let’s set a scale for our bar graph.The numbers in red show the range of the
data displayed on the y-axis (in this case, from 4 to 23). Use this information tochoose an appropriate minimum, maximum, and step size for your graph.
Then click OK, and your graph will appear!
Choose Graph Type
Set Scale
The maximum isthe highest valuein your scale.
The step size is thedifference betweenconsecutive values.
The minimum isthe lowest value in your scale.
TIP
You can set Teacher Preferences to skip this dialog (see page 36), sothat the scale is
set automatically.(Students will still be able to change
the scale after thegraph appears.)

16
Add a TitleClick Title at the top of your bar graph and enter a title for your graph, such as “CandyColors in Bag 1.”
Change Axis LabelsClick the y-axis label (“Number in Bag 1”) and change the label to “Number of Candies.”
Change Bar Colors1. Go to the Graphs menu and choose Change Colors. Let’s change the colors of the
bars so that they match the colors represented in the graph.
2. The first color in our list is brown. Click a brown square in the color palette. Noticethat the fill color (at left) changes to brown.
3. Now click the label Brown, below. Notice that the color associated with the label isnow brown. Continue changing the rest of the colors so they match their labels.Then click OK.
Title
Change Colors

17
Change the ScaleClick any number along the y-axis scale.The Set Scale dialog box appears again. Changethe scale maximum to 30.
Change Graph Type1. Move your cursor to the Graph Type buttons at the top of your graph window. As
you move your cursor slowly over each button, a tool tip names each graph type.You can use these buttons to change how your data is displayed. Click the circlegraph button and watch your graph change to a circle graph.
2. By default, circle graphs are labeled with fractions. Let’s change the labels to per-centages. Click one of the labels on the circle graph. The following dialog appears:
3. Click the button for percent.Then click OK.
Change Circle Graph Labels
Bar Circle Line Boxgraph graph graph Histogram plot
Pictograph Frequency Scatterplot Line chart plot

18
Analyze GraphsGraph Master makes it easy to analyze your data. For example, you can create multiplegraphs from your data set, and view them side by side. Let’s make another graph fromthe data, and see how it compares to the first graph!
Navigate between Windows1. Click Data Table on the toolbar. This lets you return quickly to the data table.
You can also use the Window List and Last Window buttons to navigate betweengraphs and tables:
Window List — displays a list of windows, including the data table, graphs, and notebook. Just select the item you wish to display.
Last Window — toggles back and forth between the active window and the window that was previously active.
2. Select the columns of data labeled Color and Number in Bag 2. In order to select non-adjacent columns, hold down the z key (Macintosh) or CTRL key (Windows) whileclicking the letters at the top of each column. Then click Graph, and OK.
3. Click Circle Graph, then OK to make a circle graph of this new data.4. Change the graph title to “Candy Colors in Bag 2.”5. Change the circle graph labels to percentages.6. Change the colors to match the labels.
Compare Graphs1. Click Compare on the toolbar. The Compare dialog box appears. Use the pull-down
menu on the left to choose the first graph you created (Candy Colors in Bag1).Use the pull-down menu on the right to choose the second graph (Candy Colorsin Bag 2).
2. When you have selected your two graphs to compare, click OK. Your two graphswill appear side by side.
Navigation buttons
Compare
TIP
Compare is a quick and easy way to
compare two graphs. To compare more than
two, simply resize graphwindows by hand, by
dragging the corners.

19
Write in the Notebook1. Click Notebook on the toolbar. Write a few lines describing the similarities and
differences between our two graphs.
2. When you are done writing in the notebook, click the close box on the notebookwindow.
3. Let’s take this opportunity to save our work again by choosing Save Data Set...from the File menu.The data table, graphs, and notebook text will all be savedtogether as one data set file.
Notebook
TIP
Use the buttons at the bottom of the
notebook to make textlarger or smaller.
TIP
Sometimes you maycreate a graph thatyou don’t want tosave. To delete the
active graph, chooseDelete Graph fromthe Graphs menu.

20
Print & PresentOnce you’ve completed your analysis, it’s time to print the results.
1. To print, choose Print... from the File menu. You can also press zP (Macintosh) or Control P (Windows).
2. From the list on the left, select all the items you want to print. The selected itemswill be displayed in the Preview area on the right. Up to four graphs, and the note-book, can be printed on a single page, however the data table will always print outon its own page.
3. Experiment with the various print options and notice how they change the Preview.When you are satisfied with your choices, click OK.
TIP
If the print preview is more than one
page long, use thearrows below the preview to move
forward and backward.
Printed page

21
Analyze Graphs in More Depth
In the first part of this WalkThrough, we demonstrated the basics of analyzing datawith Graph Master. We showed you how to collect and enter data, create graphs, analyzegraphs, and print your results. Next, we will explore some more advanced ways to useGraph Master to organize and analyze data. We will begin by investigating a new question:How tall is the typical student in our class?
Earlier in this WalkThrough, you entered data into the data table yourself. This time,we’ll take a look at a pre-existing data set file.
1. Choose Open Data Set from the File menu.2. Locate the Data Sets folder and open the file called WalkThrough. This file contains
data on fifty students, including their gender, age, and height (in inches).
Sort DataTake a look at the data in the data table. How tall are most of the students in oursample? To get a sense of the range of the data, let’s sort this information by height.
1. Choose Sort… from the Data menu. The Sort dialog box appears.
2. Choose Height (inches) from the pull-down menu, since we’d like to sort our dataaccording to height.Then click OK.
Shorter students will be listed first; taller students later. After scrolling down throughthe data table, you can see that the tallest student is 72 inches in height.
Sort
Open

22
Tally DataNow let’s make a graph of the data on students’ heights.You’ll notice that this data,unlike the data you entered earlier, is untallied. Although we can see individual stu-dents’ heights, we don’t yet know how many students there are of each height (orinterval of heights).
If you were making a graph by hand, you would probably begin by tallying this data.The same is true when using Graph Master.
1. Click the Tally button on the toolbar. The tally dialog box appears.
2. Choose Height (inches) from the pull-down menu, since we wish to tally the data onstudents’ heights.
3. Click OK. A dialog box will appear containing the tallied data.
Tally
Data Table with Tallied Data
TIP
You can set Teacher Preferencesto skip this dialog
(see page 36).

23
Tallied DataNow let’s go ahead and display this data.We’ll begin by creating a frequency chart.
1. Click the Graph button on the Tallied Data dialog box.2. Click Chart on the Graph Choice dialog box.Then click OK.3. Choose the intervals of data that will appear in the frequency chart. Since students in
this class range from 55 inches to 72 inches, let’s choose a minimum of 54, an intervalsize of 2, and a maximum of 74.Then click OK.
4. Make sure to add a title to your chart.5. Change the label of the 2nd column from Frequency to Number of Students.
Now let’s explore another graph.6. Click the Histogram graph type button (third from right) and watch your chart
change to a histogram. A histogram is similar to a bar graph, except each bar represents an interval of numeric data (rather than a category).
Display StatisticsNow that we’ve created a graph of students’ heights, let’s analyze this graph. TheAnalyze menu contains lots of options for exploring data in more depth.
1. Choose Statistics from the Analyze menu. A check will appear next to the menu item,and the program will display statistics for your data, including mean, median, mode, andrange.
We can see that the mean height for this group of students is 59.54, while the medianheight is 59. If students want a refresher on these terms, they can look them up in theprogram’s glossary (see page 48).
Statistics
Histogram

24
You’ll notice that currently, each interval label is centered under the corresponding bar.Histograms can also be labeled a second way, with numbers appearing along the axisin a number line (see pages 61–62). Because the numbers are displayed in a numberline, this approach is helpful for viewing statistics.
2. Open the Graphs menu and deselect Center Numbers Under Bars (so that thecheck mark next to this item disappears). Notice that checkboxes now appear nextto the Mean, Median, and Range.
3. Click the checkbox to the left of the word Mean.This displays a graphical symbol (a red triangle) along the x-axis, showing where the mean falls in relation to thedata.Take a moment to display the median and range as well.
4. Click the triangle in the upper right of the window. (This is a quick way to show andhide statistics.) Notice that the graphical symbols remain on the screen.To removethem, simply open the statistics again and click the checkboxes once more.
Histogram with Statistics
Histogram with Labels at Edges

25
Filter DataAfter looking at the class’ mean height, a student in your class might wonder:Is average height the same for each gender, or is one group (on average) taller than theother? We can investigate this question using the filter feature.
1. First, let’s clone our original graph. Click on your histogram (to make that graphactive), then choose Clone Graph from the Graphs menu. An identical graphappears.You can check that a new graph has been created by:
• clicking Window List
• dragging the new window to reveal the original underneath
The original graph and its clone can now be manipulated independently.2. Click on the cloned graph.We’re going to filter this graph so that it only includes
height data for boys.3. Choose Filter from the Analyze menu.The filter dialog appears.This dialog displays
a checkbox for all columns which currently contain some data (in this case Student,Gender, Age, and Height).
4. Click the checkbox for Gender, since we want to filter our data by Gender.5. Next, using the pull-down menus, choose is from the first pull-down menu, M from
the second.This filters the graph to include only rows of data in which the student’sgender is male. Click OK.Your graph now displays the heights of boys only.
Filter
Click the checkbox to select the variableyou want to filter by.
Then define your filters using the pull-down menus.

26
6. Let’s change our title to communicate this. Click Title and change the graph’s titleto “Boys’ Heights.”
7. Now let’s do the same for girls. Click the graph you just created, and clone it(choosing Clone Graph from the Graphs menu).
8. Click the cloned graph and choose Filter from the Analyze menu.9. Click the Gender checkbox.Then using the pull-down menus, set the filter to
include rows of data in which gender is female. Then click OK.
Filter
Filtered Graph
TIP
When a graph has beenfiltered, an * appears inthe window’s title bar.This makes it easy to
identify filtered graphs.

27
10. Change the title of this new graph to “Girls’ Heights.”11. Now let’s compare our two graphs. Click Compare and choose the two graphs we
just made. Click OK.
Take a look at your two graphs. Do you see a difference?
There are lots of other features in Graph Master to experiment with. For a feature-by-feature list, see the Features & Functions reference section (pages 29–48).
Comparison of Filtered Graphs
TIP
For further interestinginvestigations, see theHeights activity, page76. In this activity, students compare
boys’ and girls’ heightsin the 4th, 6th, 8th,
and 12th grades.

28

29
Features & Functions This section contains in-depth information on Graph Master’s features and functionsincluding the data table‚ graphs, toolbar buttons, and menu items. For a quick overview ofprogram features, see A Quick Feature Snapshot (pages 3–6). For a step-by-step guideto entering data, creating and analyzing graphs, see the WalkThrough (pages 11–27).
The Data TableEvery data set file contains a data table, where all data is entered and stored. The datatable is organized in rows and columns. Each column contains data for a different variable.
Click a column letter to select a column. There are 16 columns.
Click a row number to select a row. There are 512 rows.
Click and type to change the column label. This label describes the data contained in the column.
Click and type in the data cells to enter data.
Data Table
Cells are identified bytheir column-row location.This is cell E 7.

30
Entering data in the data tableOrganize your data in columns. Each column in the data table should contain data fora single variable.
1.Type a label for the data in each column. By default, columns are labeled “Variable A,”“Variable B,” etc. (Later, when you graph your data, these column labels will becomeyour axis labels.)
2. Enter the corresponding data in the column.• You may enter either category data (text) or number data. Numbers up to
999,999 are supported. (Note: If any cell within a column contains non-numeric data, the entire column will be considered category data.)
• You may enter either raw (untallied) data or data that has been tallied.
Moving around within the data tableThere are two modes for moving around within the data table: Select Mode and Edit Mode.
• When you first click on a new cell, you are in Select Mode.In Select Mode, the selected cell is highlighted.
• If you click a second time within a cell, you will enter Edit Mode.In Edit Mode, the cursor blinks.
The following keys and menu items help you move around within the data table:
Select Mode Edit ModeTab move one cell to the right move one cell to the right and enter Select Mode
Return [Macintosh] move one cell down move one cell down and enter Select Mode Enter [Windows]
Left & right arrow keys move one cell left or right move one text character to the left or right within a cell
Up & down arrow keys move one cell up or down move to the beginning or end of text within a cell
Page up move one screen up move one screen up and enter Select Mode
Page down move one screen down move one screen down and enter Select ModeHome move to top left cell of no effect
data tableSelect All select all cells in data table select all text within a cell(in Edit menu)
For further information on the data table, read about the Data menu on page 38.
Raw (untallied) data Tallied data

31
Creating a GraphOnce you have entered your data, and are ready to create a graph, click the Graphbutton on the toolbar (or choose Graph from the Data menu). Graph Master will thenguide you through a series of screens on which you make choices about variables, graphtype, and scale.
Note: This series of screens can be modified using the Teacher Preferences settings.(See page 36.)
Step 1: Choose VariablesThe first screen that appears asks you to choose the variables (columns of data) youwish to graph. Click the checkboxes to choose variables. Choose two variables forstandard graphs, three for double bar or double line graphs. (If you can only identifyone column of data to graph, you may need to tally your data first. See page 38.)
Hint: You can set Teacher Preferences to skip this dialog (see page 36) and select thecolumns you want to graph prior to clicking Graph. Select a column by clicking the lettersat the top of the desired column. Select non-adjacent columns by holding down CTRL(Windows) or z (Macintosh) while you select your columns.
Choose Variables

32
Step 2: Choose Graph TypeThe next screen asks you to choose the type of graph you want to create. Click a buttonto select a graph type. A description of the graph type you have selected will appear inthe dialog.When you are satisfied with your choice, click OK.
Hint: Some graph types will not be available for certain types of data. To see a messageexplaining why a graph is unavailable, place your cursor over the button for that graph type.
Step 3: Choose Independent VariableIf you have chosen to graph two columns of numerical data, you must identify whichvariable is the independent variable. ( This is the variable that will be displayed on thex-axis.) Choose a variable from the pull-down menu. Then click OK.
Choose Graph Type
Choose Independent Variable

33
Step 4: Set the ScaleFinally, set the scale for your graph. The range of the data is included on this dialog inorder to help you choose an appropriate scale. (In the example shown, the data rangesfrom 5 to 18.) Type a minimum, maximum, and step size for the scale.Then click OK.
Once you have completed these steps, your graph will be displayed. You can changevarious elements of the graph (such as title, axis labels, and scale) by clicking on them.You can also change other graph features using the Graphs menu (see pages 40–44).
Set Scale
Click the title to type title text.
Click any number on the scale to change the scale (minimum, maximum, and step size).
Graph Click the axis labels to type new labels.
Click the graph type buttons to change how your data is represented. (See page 17.)
The maximum isthe highest valuein your scale.
The step size is thedifference betweenconsecutive values.
The minimum isthe lowest value in your scale.

34
The ToolbarThe toolbar provides easy access to many of Graph Master’s key features.
Window ListLets you choose a data table, graph, or notebook to display.(A check mark identifies the active window.)
Last WindowReturns to the previously active window.
Data TableDisplays the data table.
TallyLets you choose a column of data to tally. The resulting tally is displayed in a dialog box. (See page 38.)
GraphLets you create a graph from data in the data table.(See page 31.)
CompareLets you choose two graphs or tables to compare. After making your choice, and clicking OK, your two graphs will be displayed side by side.(See page 45.)
NotebookOpens a notebook where you can describe, analyze, or ask questions about your graphs. Each data set contains one notebook.
HelpDisplays help — including information on program features, a glossary of data analysis terms, and tips on the currently displayed graph type or dialog box.

35
The File MenuNew Data SetOpens a new data set.
Open Data Set...Lets you open a previously saved data set, or tab-delimited text file.
Close Data SetCloses the active data set.
Close Window Closes the active window. ( If the window is a graph, you may choose to hide thegraph or delete the graph permanently.)
Save Data Set Lets you save the active data set (including the data table, notebook, and corresponding graphs).
Save Data Set As...Lets you save a previously saved data set under a new name or location.
Page Setup...Lets you set page orientation and other specifications for printing.
Print...Opens the Print dialog box. This dialog box lets you print the data table, notebook,and graphs for one or more data sets. Select the items you want to print from the liston the left. Items will appear on the page (and in the print preview) in the order theyare listed.
Print preview
If you are printing more than a single page,use the arrows below theprint preview to view thenext (or previous) page.
Up to four graphsmay be printed ona single page.
File Menu (Macintosh)
File Menu (Windows)

36
Teacher Preferences...Lets you customize the program to meet the needs of your students. This option isalways grayed to restrict student access. To access Teacher Preferences:
• Macintosh: Hold down the z and Option keys and (without letting go) open the File menu and choose Teacher Preferences.
• Windows: Hold down the Shift and Control keys and (without letting go) open the File menu and choose Teacher Preferences.
Note: If you open the File menu before pressing these keys,Teacher Preferences will remain grayed.
The Teacher Preferences allow you to modify the program in the following ways:
Graph Types: Provide students access to all nine graph types, or to a basic setof six (Bar, Pictograph, Circle, Chart, Line, Scatterplot).
Graph/Tally options: By default, all three of these options are turned on.Turn them off to minimize the number of steps involved in making a new graph.
Confirm variables to graph: When this option is turned off, the Choose Variablesdialog (see page 31) will not appear if appropriate columns have been selected.
Display tallied data: When this option is turned off, the Tallied Data dialog does not appear. (Clicking Tally leads directly to the Choose Graph Type dialog.)
Set scale before viewing graph: When this option is turned off, the user is not required to set the scale when creating a new graph.
Number Format defaults: Use these options to change the default format for columns of number data. (Note: Changing the defaults will change the default format for new data sets. It will not change the format for columns in existing data sets.)
Quit (Macintosh) or Exit (Windows)Closes the program and prompts you, if necessary, to save changes.
Teacher Preferences

37
The Edit MenuThese options are standard text-editing functions.With the exception of Undo andCopy Graph, they are available only when a text field is active.
UndoUndoes your last action.
CutRemoves selected text so you can paste it in another location.
CopyDuplicates selected text so you can paste a copy in another location.
Copy Graph (Available only when the current window is a graph.)Copies an image of the selected graph to the clipboard, so that you can paste it into aword processing, paint, or draw program.
PastePastes the contents of your clipboard into the selected location.
ClearErases selected text.
Select All Selects all cells in the data table (in Select Mode). Selects all text within a cell (in EditMode). (See page 30.)
Edit Menu (Macintosh)
Edit Menu (Windows)

38
The Data MenuGraph...Lets you create a graph from data in the current data table. (See page 31.)
Tally...Tallies the data in the selected column. If no column is selected, you are prompted tochoose a column. Click Graph on the Tallied Data dialog box to graph the tallied data.(See page 23.)
Show Column TotalsDisplays a total for all columns with number data. The totals appear in a row at the bottom of the data table.
Sort...Lets you sort the data table by the contents of a single column.( The data in the column can be sorted in ascending or descending order.) Choose acolumn to sort by. Then click OK.
Tallied Data
Sort

39
Number Format...Lets you format number data in the selected column (or columns).You may displaynumbers rounded up to 5 decimal places.You may also choose whether to displaynumbers with or without commas. (If neither box in this dialog is checked, data will be displayed exactly as entered.)
FormulaLets you use a formula to define a selected column in relation to existing datacolumns.When a column contains a formula, data in the column appears in blue, andcells cannot be edited directly.
The Formula menu provides four different options:
Select None if you do not wish to apply a formula to the column.(None is active by default.)
Select Row Total to display the total of numbers to the left of the selected column. (Text data will be ignored.)
Select Row Average to display the average (arithmetic mean) of numbers to the left of the selected column. (Text data will be ignored.)
Select Other… to apply your own formula to a column.The Formula dialog boxwill appear. To set up your formula:1. Choose a variable from the first pull-down menu, or choose number... and then
type a constant.2. Choose an operation from the second pull-down menu.3. Choose another variable from the third pull-down menu (or choose number...).
Your formula will appear in the box below.
Number Format
Formula

40
Hide ColumnHides selected columns in the data table. (To select a column, click the letter above thecolumn.)
Show All ColumnsShows all columns that were previously hidden.
Save Data as Text...Lets you save the data in the data table as tab-delimited text.The resulting file can beopened in any spreadsheet program.
The Graphs MenuThese options allow you to edit graphs. Some of these functions apply to all graphtypes; others apply only to certain graphs.
Change Scale…Lets you change the scale on a bar graph, line graph, histogram, line plot, box plot, orscatterplot. For each numerical axis, you must choose a minimum value, maximum value(up to 1,000,000), and step size.The range of the data is displayed on screen, so that youcan choose an appropriate scale. In the example below, the data for the y-axis rangesfrom 7 to 17. (See individual graph types, pages 51–70, for more detail.)
Change Intervals…Lets you change the intervals on a frequency chart with numeric categories. You mustchoose a minimum value, maximum value (up to 1,000,000), and interval size.Therange of the data is displayed on screen so that you can choose an appropriate scale.
Change Scale
The maximum isthe highest valuein your scale.
The step size is thedifference betweenconsecutive values.
The minimum isthe lowest value in your scale.

41
Change Pictograph Scale…Lets you change the scale on a pictograph.You must define how many items each symbol represents. In the example below, each symbol represents 2 houses.
Change Intervals
Change Pictograph Scale

42
Change Colors…Lets you change the colors of bars (in a bar graph) or circle segments (in a circle graph).To change a color: 1) First select a color from the palette.Your selected color will bedisplayed in the Fill Color box. 2) Then click a category to assign the selected color tothat category.
Change Symbol…Lets you change the symbol displayed in a pictograph. Choose from a library of over 100 symbols. (The same symbol is used for all pictograph categories.)
Change Colors
Change Symbol

43
Graph Master lets you import your own graphics to use as symbols. Here’s how:
• Using a paint or draw program, create your own graphic. (The image sizes inGraph Master are 28 x 28. The closer your graphics are to this size, the betterthey will look.)
• Copy the graphic. It will be saved to your computer’s clipboard.
• Open Graph Master.
• Choose Change Symbol from the Graphs menu.
• Click Paste. Then click OK.
• Your graphic will now appear in your graph.
Note: Icons you make will not be saved in the program, but will be saved in the graphs you create using them.
Show GridLets you turn grid lines on and off for bar graphs, line graphs, scatterplots, and histograms.By default, grid lines are on.
Center Numbers Under BarsLets you change how a histogram is labeled. (See pages 65–66.)
Note: This option is only available when the data consists only of integers. Otherwise,histograms are always labeled with numbers at edges of bars.
TIP
To edit an existing pictograph symbol:
1) Create a graph with the symbol.
2) Choose Copy Graph from the Edit menu.
3) Paste the results into a paint program.
4) Edit the symbol.5) Copy and paste
the symbol back into your graph.
Space for pictures
Numbers Centered Under Bars Numbers at Edges of Bars

44
Change Circle Graph LabelsThis option lets you label circle graphs seven different ways: with fractions, simplifiedfractions, count, decimals, percentages, angles (measured in degrees), or with no label at all.
Note: By default, circle graph segments are labeled with fractions in which the numeratoris the frequency of data within a specific category and the denominator is the total numberof pieces of data.
Label OrientationLets you change the orientation of x-axis labels to either horizontal or vertical. Horizontallabels are the default. Vertical labels can be extremely useful if a graph appears crowded.
Save Graph AsLets you save graphs in PICT or JPEG format (for Macintosh users), or BMP format(for Windows users).
Clone GraphLets you create a new graph window identical to the active graph. A graph window andits clone are independent of one another; features such as graph type, color, scale, andlabels can be changed independently.
Hide GraphUse this option to hide the active graph window. To access the hidden graph, use theWindow List button on the toolbar.
Delete GraphUse this option to delete an unwanted graph.
Horizontal Labels Vertical Labels
Change Circle Graph Labels

45
The Analyze MenuThese options allow you to compare, analyze, or write about your graphs. Some ofthese functions apply to all graph types; others apply only to certain graphs.
Compare...Lets you choose two graphs or tables to compare. Use the pull-down menus tochoose from a list of all available graphs and data tables. When you are finished makingyour choice, click OK. Your two graphs will be displayed side by side.
If you choose the same graph from both pull-down menus, the graph you chose will becloned (see page 44), and the original and clone will appear side by side.
Filter...This option allows you to filter the data values displayed in a graph. (See pages 25–27.)Selecting Filter opens a dialog box containing a series of pull-down menus, one for eachcolumn of data. Use these menus to identify which data you wish to include in yourgraph.The graph below is filtered to include only the data from rows in which Genderis male and Age is greater than 12 (i.e., data for males older than 12).When a graphhas been filtered, an * appears in the window’s title bar.
Compare
Filter Data
1) Click the checkboxesto select the variablesyou want to filter by.
2) Then use thepull-down menus to define the filters.

46
StatisticsDisplays statistics on box plots, histograms, line plots, scatterplots, and frequency charts containing numerical data.
All statistics are displayed in numerical format. In addition, some statistics can beviewed as graphical representations on the corresponding graph.To view a statistic as agraphical representation, simply click the checkbox located next to the statistic. If nocheckbox appears, a graphical view for the statistic is unavailable.
Statistics
Statistics with graphical display

47
Line of Best FitLets you display the line of best fit for scatterplots.
Mark OutliersIdentifies outliers on box plots.The outliers are represented by asterisks (*).
Line of Best Fit
Marked Outliers

48
The Help MenuThe Help Menu provides easy access to a variety of help features.
HelpDisplays helpful tips on the currently displayed graph type or data table. For example,if a bar graph is displayed, clicking Help will provide tips on interpreting and editing bargraphs.
ContentsDisplays a list of help contents.
IndexDisplays an alphabetized list of program features.
GlossaryDisplays an alphabetized list of data analysis and graphing terms.
Show Tool TipsTurns tool tips on or off. (By default, tool tips are on.)
Launch Graph Master Web siteOpens your browser to Graph Master’s Web site.
Help Screen for Bar Graph

Technical Support &TroubleshootingTechnical SupportIf, after reading through the Features & Functions section and following the troubleshootingtips below, you are still having trouble, please call our Technical Support team at 1-800-342-0236.
When you call, please have the following information available:
• Software title and version number. These can be found on the CD-ROM and in the About Graph Master dialog box (under the Apple menu if you’re using Macintosh;under the Help menu if you’re using Windows)
• Your computer platform (e.g.,Windows 95, 98, or 2000; Macintosh OS 8.1, 9.0)• Your computer model (e.g., Power Macintosh 6100; Compaq Prolinea)• Your computer’s memory (e.g., 32 megabytes of RAM)• Your computer’s processor and speed (e.g., Pentium processor running at 200 MHz)
If possible, please have the software running on a computer close to the telephonewhen you call.
Our technical support staff is available Monday through Friday, 8 a.m. to 4 p.m. EST.You can also e-mail us at [email protected].
TroubleshootingThis troubleshooting guide contains answers to frequently asked questions. For the latesttechnical updates, check the ReadMe file (installed in the Graph Master application folder).
My system is running very slowly.
If your system begins to slow down, take the following steps:
• Close down all applications other than Graph Master.• If you have multiple data sets open, close some data sets.
( To close a data set, click the close box on the corresponding data table.)• If you have many graphs open, delete any unnecessary graphs.
( To delete a graph, select the graph from Window List. Then choose Delete Graph from the Graphs menu.)
• If you have multiple columns defined by formulas, remove the formulas (going from left to right).The data will remain in the cells, but will not update automatically whencells are changed.
49

I am unable to select the graph type that I want to create from the ChooseGraph Type dialog.
Many of the graph types in Graph Master require either one or more columns ofnumerical data. If you are having difficulty making a graph, check the requirements forthat graph type (see Nine Graph Types, pages 51–70) and make sure the columns ofdata you have selected meet the appropriate criteria.
Check that all columns of numbers are being treated by the program as number dataand not as category data. (Number data will appear right-justified, category data left-justified.) Number data will be treated as category data if:• any of the cells contain invalid numbers (i.e., numbers that contain incorrectly
placed commas, text characters, or symbols such as %, $, or /)• any of the numbers are 1,000,000 or over (Graph Master only supports numbers
up to 999,999.) If you are dealing with data in the millions, change your units to thousands. (For example, 1,999,564 people becomes 1,999.564 thousands of people.)
I can’t locate the Data Sets folder.
Many of the activities described in this Teacher’s Guide (pages 73–82) include sampledata sets, which are installed in the Data Sets folder.
To locate this folder on the Macintosh: Go to the location on your hard drive where youinstalled Graph Master. Open the Graph Master folder. The Data Sets folder appearsinside.
To locate this folder on Windows: Navigate to C:\Program Folder\TSP\Graph Master.
How do I import a data file from the Internet or a spreadsheet program intoGraph Master?
Download the data file from the Internet to your computer’s hard drive. Open the filein Graph Master. If the file is unreadable or will not open, follow the directions below.
1. Open the file in Excel or in an AppleWorks spreadsheet.To open correctly in Graph Master, the file must have:
• column labels at the top of each column• no additional text (If your file has extraneous text such as titles and notes,
delete the text.)2. Choose Save As from the File menu.3. Type a name for your data set file.4. If you are using Excel, go to the Save File as Type pull-down menu (Macintosh) or
the Save as Type pull-down menu (Windows) and choose Text (Tab delimited).5. If you are using AppleWorks, go to the Save As pull-down menu and choose
ASCII Text.6. Click Save. Open the saved file in Graph Master.
50

51
Nine Graph TypesThe following pages provide an overview of each of the nine graphs that you canmake using Graph Master.
IndexBar Graph ........................................................................................................................................................................................53
Box Plot ..............................................................................................................................................................................................55
Circle Graph..................................................................................................................................................................................57
Frequency Chart......................................................................................................................................................................59
Histogram ........................................................................................................................................................................................61
Line Graph ......................................................................................................................................................................................63
Line Plot..............................................................................................................................................................................................65
Pictograph ........................................................................................................................................................................................67
Scatterplot........................................................................................................................................................................................69

52
About the ContentThe Nine Graph Types section dedicates two pages to each of the graph types thatyou can make using Graph Master. For each graph type, we’ve included the followinginformation:
• a definition • an example of the graph along with a clear explanation of how to interpret it• sample questions to help students analyze the data• key terms associated with the graph type• how to make the graph using Graph Master
• how to make changes to a graph including setting a new scale, changing axis labels,adding a title, and showing statistics
How to Use the PagesYou’ll find many ways to use the Nine Graph Types pages, but to help you get started,we’ve listed a few ideas below.
Make photocopies of these pages and:• give them to students to introduce or review graph types
• have students record answers to the Questions to Ask Yourself section in their math journals
• create a poster, bulletin board, or data analysis display for your classroom• incorporate them into a learning or computer center

53
Bar GraphA bar graph uses bars to compare categories in a data set. Each bar represents a category. The height of the bar shows the count or measurement of the category.
A double bar graph shows two sets of related data on one graph.
Interpreting Bar GraphsThis bar graph uses bars to compare the popularity of animals in a fourth grade classroom.Each bar represents a different animal. The height of a bar shows how many students preferred that animal. For example, the second bar shows that turtle was the most popular animal.
Questions to Ask YourselfWhen you look at a bar graph, ask questions like these:1. What is this graph about?2. How many votes did each animal receive?3. Which animal received the most votes? The fewest votes?4. How many animals received more than four votes?5. How many more votes did iguana receive than ferret?6. How could the information in this graph be helpful?
category data Data that describes or categorizes a group of people or things.
If you were purchasing a pet for this classroom,
how could this bar graphhelp you?
$Key Term
?
Animal
Num
ber
of V
otes
Iguana Turtle Ferret Hamster Snake
Favorite Animals in the Fourth Grade14
12
10
8
6
4
2
0

54
Making a Bar Graph with Graph MasterOnce you have entered your data, click Graph on the toolbar. Use two columns ofdata (or one column, tallied) to make a bar graph. Use three columns to make a double bar graph.
You can make changes to your bar graph by clicking directly on the graph.
Making Other ChangesTo change bar colors1. Choose Change Colors from the Graphs menu.2. Click a color from the palette.Then click a category to assign the selected color.3. Click OK to see the changes.
To show or hide grid lines1. Choose Show Grid from the Graphs menu. (A check mark means grid lines
are visible.)
To change the x-axis label orientation1. Choose Label Orientation from the Graphs menu.2. Choose Vertical or Horizontal.
Animal
Num
ber
of V
otes
Iguana Turtle Ferret Hamster Snake
14
12
10
8
6
4
2
0
Click the title of yourgraph to type a new title.
Click the axis labels to type new labels.
Favorite Animals in the Fourth Grade
Click the graph’sscale to set a new scale.

55
Box PlotA box plot summarizes how numbers in a data set are distributed using five important statistics: minimum, maximum, median, lower quartile, and upper quartile.
Interpreting Box PlotsThe box plot below shows the distribution of midterm scores for Mr. Ruiz’s class.
• The lowest test score was 50, and the highest score was 98.• The median score was 83.This means half the scores were above 83 and half were below.• The lower quartile (left edge of box) is 78.5.
This means that one quarter of the class scored 78.5 or lower on the test.• The upper quartile (right edge of box) is 89.5.
This means that one quarter of the class scored 89.5 or higher on the test.
Questions to Ask YourselfWhen you look at a box plot, ask questions like these:1. What does this box plot show?2. What is the lowest test score? The highest test score? The median test score?3. Are scores more spread out above the median or below?
number data Data that measure or count a group of people or things.minimum The smallest value in a data set.
maximum The greatest value in a data set.median The middle value within a data set when the values are placed in numerical order.
outlier A value in a data set that is much lower or much higher than the other values.quartile A number that divides a data set into equal fourths.
What is the median test score in this class?
$
Key Terms
?Midterm Test Scores
0 50 54 58 62 68 70 74 78 82 88 90 94 98 100Test Scores

56
Making a Box Plot with Graph MasterOnce you have entered your data, click Tally on the toolbar. Use one column of number data, tallied, to make a box plot.
You can make changes to your box plot by clicking directly on the graph.
Making Other ChangesTo mark outliersChoose Mark Outliers from the Analyze menu. Outliers are marked with an *.
To show statisticsYou can display the mean, median, mode, and range for your data. Here’s how:
1. Choose Statistics from the Analyze menu, or click the Statistics symbol ( ),to display statistics in numerical format.
2. Click the checkbox located next to a statistic to view a pictorial representation of the statistic on your graph.
Midterm Test Scores
0 50 54 58 62 68 70 74 78 82 88 90 94 98 100Test Scores
Click the title of yourgraph to type a new title.
Click the axis label to type a new label.
Click the graph’sscale to set a new scale.

57
Circle GraphA circle graph is used to compare parts of a data set with the whole. A circle, divided into segments, represents the whole data set. Each segment represents a category in the set.The larger the segment, the greater the count or percentage of the category.
Interpreting Circle GraphsThe circle graphs below show how much money was spent on party supplies.The circle represents the total party budget (in this case, $93.00). Each segment represents a portion of the whole cost.The pizza segment is the largest, which means more money was spent on pizza than on any other item.
The only difference between these two graphs is how they are labeled.• The labels on the left show that $35 was spent on pizza.• The labels on the right show that 37.6% of the total party budget was spent on pizza.
Questions to Ask YourselfWhen you look at a circle graph, ask questions like these:1. What is this graph about? ( What is the whole? What are the parts?)2. Which item costs the most? The least?3. How much more was spent on pizza and cake than paper goods?4. Which two items make up approximately 1/3 of the total cost?
category data Data that describes or categorizes a group of people or things.
$Key Term
If you were planning a party,what percentage of your
budget would you expect tospend on food and soda?
?Party Costs (in percentages)
Itemsodapizzacakepaper goodsparty favors
Total: 93
21.5%6.5%
37.6%
19.4%
15.1%
Party Costs (in dollars)
sodapizzacakepaper goodsparty favors
Total: 93
206
35
18
14
Item

58
Making a Circle Graph with Graph MasterOnce you have entered your data, click Graph on the toolbar. Use two columns ofdata (or one column, tallied) to make a circle graph.
You can make changes to your circle graph by clicking directly on the graph.
Making Other ChangesTo change circle segment colors1. Choose Change Colors from the Graphs menu.2. Click a color from the palette.Then click a category to assign the selected color.3. Click OK to see the changes.
Click the legend label totype a new label.
Click the title of yourgraph to type a new title.
Party Costs (in dollars)
sodapizzacakepaper goodsparty favors
Total: 93
206
35
18
14
Item
Click a circle segmentlabel to change the waysegments are labeled(i.e., count, fraction,decimal, percentage,angle measure, no label).

59
Frequency ChartA frequency chart displays the frequency (count) of values in a data set. The first columnlists each category (or interval of numerical values); the second column shows the number of times the category or interval occurs.
Interpreting Frequency ChartsTwelve students were asked to name the type of transportation they take to school.Their responses are as follows: bus, bike, bus, car, bus, foot, bus, bus, car, bike, foot, car.
A frequency chart can quickly organize the results of this survey to show that bus is the most common form of transportation.
A frequency chart can also be used to organize numerical data, such as the list of students’heights (in inches) as follows: 62, 59, 57, 58, 59, 60, 62, 63, 65, 59, 60, 60, 55, 57, 68.
The chart below shows how many students’ heights fall within different intervals.For example, 6 students are at least 60, but less than 65 inches tall.
Questions to Ask YourselfWhen you look at a frequency chart, ask questions like these:1. What does the chart show?2. How many students are at least 65, but less than 69 inches tall?3. Which height interval represents the most students? The fewest students?4. What is the typical height for students in this class?
frequency The number of times a value occurs in a data set.
$Key Term
?What is the
most common form ofschool transportation?
School Transportation
Transportation Frequency
buscarbikefoot
5322
?If another student joined the class,
how tall would he/shemost likely be?
Student Height
Height (inches) Frequency
55 to 5960 to 6465 to 69
762

60
Making a Frequency Chart with Graph MasterOnce you have entered your data, click Tally on the toolbar. Use one column of data,tallied, to make a frequency chart.
You can make changes to your frequency chart by clicking directly on the chart.
Click the title of yourchart to type a new title.
Making Other ChangesTo show statisticsYou can display the mean, median, mode, and range for your data (number data only).Here’s how:
1. Choose Statistics from the Analyze menu, or click the Statistics symbol ( ),to display statistics in numerical format.
Student Height
Height (inches) Frequency
55 to 5960 to 6465 to 69
762
Click a column label to type a new label.
To change intervals (for number data only),click any numerical interval, then enter a minimum, maximum, and interval size.(In this chart, the interval size is 5.)

61
HistogramA histogram uses bars to show the distribution of numbers in a data set. Each bar represents a value or interval of values.The height of the bar represents the frequencyof values in each interval. Histograms look similar to bar graphs, however numbers,rather than categories, appear along the x-axis, and there are no gaps between bars.
Interpreting HistogramsThe histograms below show how many points a college basketball player scored during her junior year.The first bar represents games in which she scored 0-4 points. Since the bar is 2 units tall, we can seethat there were only 2 games in which she scored less than 5 points. Overall, this player is most likely toscore between 15-29 points.
Histograms can be labeled two different ways:
In the first example, the second bar represents integers 5 through 9.In the second example, the second bar represents numbers that are at least 5, but less than 10.
Questions to Ask YourselfWhen you look at a histogram, ask questions like these:1. What is this graph about?2. In how many games did this player score more than 19 points?3. Is this player more likely to score over 29 points, or under 10 points?4. What is the distribution of this data? What does this tell you about this basketball player’s season?
frequency The number of times a value occurs in a data set.distribution The way values in a data set are arranged.The values can be spread out evenly
or clustered around particular numbers.They can be symmetrical or skewed (more spread out on one side than another).number data Data that measures or counts a group of people or things.
$
Key Terms
?Points Scored in a Basketball Season10
8
6
4
2
0
Fre
quen
cy
0 5 10 15 20 25 30 35Points
If you were to attend this college player’s
next basketball game, how many points do you predict she would score?
10
8
6
4
2
0
Points Scored in a Basketball Season10
8
6
4
2
0
Fre
quen
cy
0 to 4 5 to 9 10 to 14 15 to 19 20 to 24 25 to 29 30 to34Points

62
Making a Histogram with Graph MasterOnce you have entered your data, click Tally on the toolbar. Use one column of number data, tallied, to make a histogram.
You can make changes to your histogram by clicking directly on the graph.
Click the graph’s scale to set a new scale. Enter a minimum, maximum, and interval size for the x-axis.Then enter a minimum,maximum, and step size for the y-axis.
Making Other ChangesYou can also use the Graphs menu to show or hide grid lines or to choose whetherhistogram bars are labeled with numbers centered under bars. Here’s how:
To show or hide grid lines1. Choose Show Grid from the Graphs menu. (A check mark means grid lines are visible.)
To center number labels under bars1. Choose Center Numbers Under Bars from the Graphs menu. (A check mark
means numbers are centered under bars.)
To show statisticsYou can display the mean, median, mode, and range for your data. Here’s how:
1. Choose Statistics from the Analyze menu, or click the Statistics symbol ( ),to display statistics in numerical format.
2. Click the checkbox located next to each statistic to view a pictorial representationof the statistics on your graph.
Points Scored in a Basketball Season10
8
6
4
2
0
Fre
quen
cy
0 5 10 15 20 25 30 35Points
Click the axis labels to type new labels.
Click the title of yourgraph to type a new title.

63
Line GraphA line graph uses points connected by lines to show how numerical values change continuously over time. Units of time are displayed along the x-axis; units of value are displayed along the y-axis. Each point shows the value at a particular moment in time.
A double line graph shows two sets of related data on one graph.
Interpreting Line GraphsThis line graph shows how the height of one plant changed over the course of 9 days.The x-axis representstime, measured in days.The y-axis represents height, measured in inches.The points show the plant’sheight at a particular moment in time. For example, after 4 days had passed, the plant was approximately 5 inches tall. (Notice that the first measurement was made when the experiment started, after 0 dayshad passed.)
Questions to Ask YourselfWhen you look at a line graph, ask questions like these:1. What is this graph about?2. What day showed the largest increase in height? The smallest?3. What’s the difference between the plant’s height from Day 2 to Day 5?4. What would you expect the plant’s height to be on Day 10?5. Describe the overall change in the plant’s height from Day 0 to Day 9.
continuous data Data that has no gaps in the range of values. Continuous data usually involves a measurement such as height, weight, or temperature.
number data Data that measures or counts a group of people or things.trend A pattern that appears in the data.
$
Key Terms
Did the plant have a growth spurt or did itgrow at a steady pace?
?Plant Growth
Day
Hei
ght
(inch
es)
7
6
5
4
3
2
1
00 1 2 3 4 5 6 7 8 9 10

64
Making a Line Graph with Graph MasterOnce you have entered your data, click Graph on the toolbar. Use two columns of number data to make a line graph. Use three columns of number data to make a dou-ble line graph. In each case, one column of data represents units of time.
You can make changes to your line graph by clicking directly on the graph.
Click the graph’s scaleto set a new scale.
Click the title of yourgraph to type a new title.
Making Other ChangesTo show or hide grid lines1. Choose Show Grid from the Graphs menu. (A check mark means grid lines are visible.)
Plant Growth
Day
Hei
ght
(inch
es)
7
6
5
4
3
2
1
00 1 2 3 4 5 6 7 8 9 10
Click the axis labelsto type new labels.
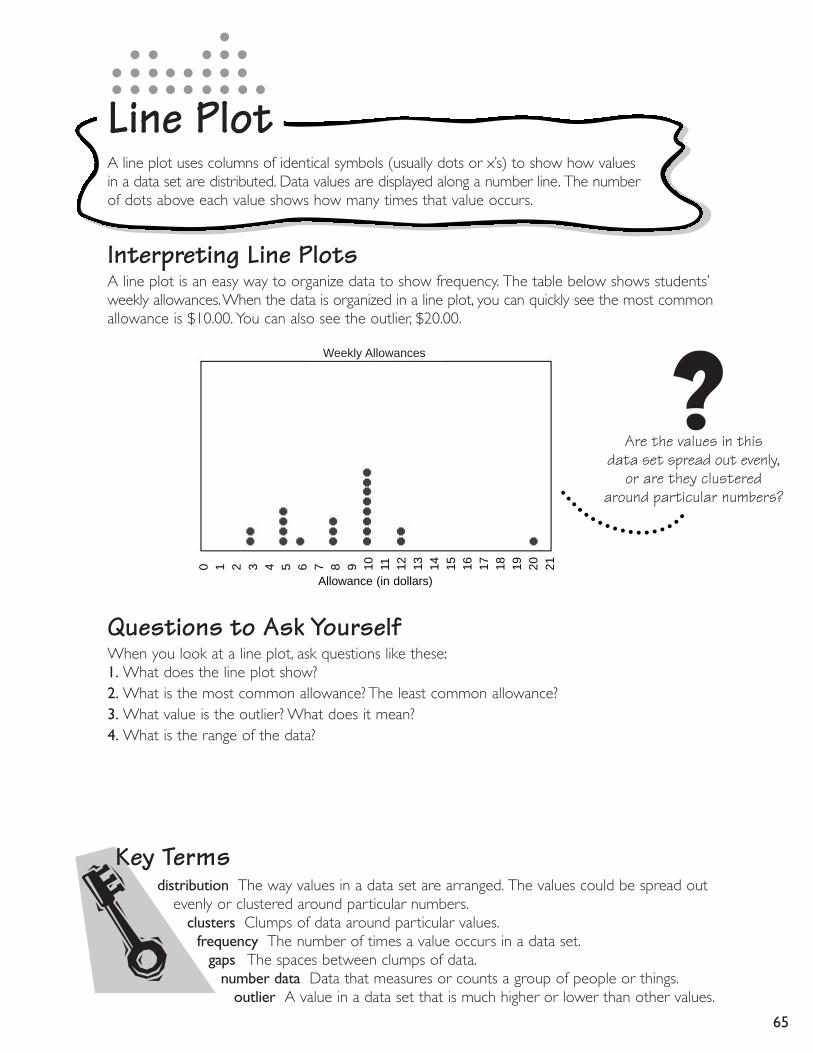
Line PlotA line plot uses columns of identical symbols (usually dots or x’s) to show how valuesin a data set are distributed. Data values are displayed along a number line. The number of dots above each value shows how many times that value occurs.
Interpreting Line PlotsA line plot is an easy way to organize data to show frequency. The table below shows students’weekly allowances.When the data is organized in a line plot, you can quickly see the most commonallowance is $10.00. You can also see the outlier, $20.00.
Questions to Ask YourselfWhen you look at a line plot, ask questions like these:1. What does the line plot show?2. What is the most common allowance? The least common allowance?3. What value is the outlier? What does it mean?4. What is the range of the data?
distribution The way values in a data set are arranged. The values could be spread out evenly or clustered around particular numbers.
clusters Clumps of data around particular values.frequency The number of times a value occurs in a data set.
gaps The spaces between clumps of data.number data Data that measures or counts a group of people or things.
outlier A value in a data set that is much higher or lower than other values.
Are the values in this data set spread out evenly,
or are they clusteredaround particular numbers?
$
Key Terms
?Weekly Allowances
0 1 2 3 4 5 6 7 8 9 10 11 12 13 14 15 16 17 18 19 20 21
Allowance (in dollars)
65

66
Making a Line Plot with Graph MasterOnce you have entered your data, click Tally on the toolbar. Use one column of number data, tallied, to make a line plot. With Graph Master, the range of your datamust be 60 or less to make a line plot.
You can make changes to your line plot by clicking directly on the graph.
Click the line plot’s scale to set a new scale.Click the axis label
to type new label.
Click the title of yourgraph to type a new title.
Making Other ChangesTo show statisticsYou can display the mean, median, mode, and range for your data (number data only).Here’s how:
1. Choose Statistics from the Analyze menu, or click the Statistics symbol ( ),to display statistics in numerical format.
2. Click the checkbox located next to a statistic to view a pictorial representation of the statistic on your graph.
Weekly Allowances
0 1 2 3 4 5 6 7 8 9 10 11 12 13 14 15 16 17 18 19 20 21
Allowance (in dollars)

67
PictographA pictograph uses columns of identical symbols to compare categories in a data set.Each column represents a category. The number of symbols in the column shows the count of the category. The pictograph legend shows how many units each symbol represents.
Interpreting PictographsIn the pictograph below, monkey symbols are used to compare the number of monkey species in 5 different zoos.The pictograph legend shows that each symbol represents 10 monkeys. Since there are 3 monkey symbols above Zoo E, and 3x10=30, this pictograph shows that there are 30 different monkey species in Zoo E.
Questions to Ask YourselfWhen you look at a pictograph, ask questions like these:1. What is this graph about?2. How many monkey species does each zoo have?3. Which zoo is home to the most species? The fewest?4. How many more species does Zoo B have than Zoo D?5. How could the information on this graph be helpful?
category data Data that describes or categorizes a group of people or things.legend An explanation of the symbols or information used on a graph.
$Key Terms
Which zoo is home to the largest number of
monkey species?
?Number of Different Monkey
Species in 5 Zoos
Num
ber
of S
peci
es
Zoo A Zoo B Zoo C Zoo D Zoo E
Zoo
= 10

68
Making a Pictograph with Graph MasterOnce you have entered your data, click Graph on the toolbar. Use two columns ofdata (or one column, tallied) to make a pictograph.
You can make changes to your pictograph by clicking directly on the graph.
Making Other ChangesTo change the symbol1. Choose Change Symbol from the Graphs menu.2. Click a new symbol.3. Click OK.
To change the x-axis label orientation1. Choose Label Orientation from the Graphs menu.2. Choose Vertical or Horizontal. (The default orientation is horizontal.)
Click the pictographlegend to change the number of units represented by a single symbol.
Number of Different MonkeySpecies in 5 Zoos
Num
ber
of S
peci
es
Zoo A Zoo B Zoo C Zoo D Zoo E
Zoo
= 10Click the title ofyour graph totype a new title.
Click the axis labels to type new labels.

ScatterplotA scatterplot uses points to show the relationship between paired numerical values.Each point on the graph represents an ordered pair. The first value in each pair is represented by how far a point appears to the right. The second value is represented by the height of the point.
Interpreting ScatterplotsThis scatterplot shows the relationship between students’ arm span and height.The x-axis represents height, measured in inches.The y-axis represents arm span, also measured in inches.The shortest student in this class is 56 inches and has an arm span of 57 inches.
Questions to Ask YourselfWhen you look at a scatterplot, ask questions like these:1. What is the shortest arm span? The longest? The arm span of the student who is 70 inches tall?2. If a new student joined your class and was 65 inches tall, what would you predict about her arm span?3. Which of the following statements is backed up by this graph:
• In general, the taller you are, the longer your arm span.• In general, the taller you are, the shorter your arm span.• Your height doesn’t have any relationship to your arm span.
paired data Two sets of numbers in which each value from one set can be paired with a value from the other.
line of best fit A straight line drawn on a scatterplot that is as close as possible to all points within a data set. This line helps to show the relationship between the two variables.
trend A pattern that appears in the data. A scatterplot can show:a positive trend (as one variable increases, the other increases)
a negative trend (as one variable increases, the other decreases)no trend (there is no predictable relationship between the two variables).
If you know a student’s armspan, do you know anything
about his or her height?
$
Key Terms
?74
72
70
68
66
64
62
60
58
56
54
52
50
0
Arm Span vs. Height
Height (in inches)0 50 52 54 56 58 60 62 64 66 68 70 72 74
Arm
Spa
n (in
inch
es)
69

70
Making a Scatterplot with Graph MasterOnce you have entered your data, click Graph on the toolbar. Use two columns of number data to make a scatterplot.
You can make changes to your scatterplot by clicking directly on the graph.
Making Other ChangesTo show or hide grid lines1. Choose Show Grid from the Graphs menu. (A check mark means grid lines are visible.)
To show a line of best fit1. Choose Line of Best Fit from the Analyze menu.
To show statisticsYou can display the mean, median, mode, and range for each of the variables in yourgraph. Here’s how:
1. Choose Statistics from the Analyze menu, or click the Statistics symbol ( ), to displaystatistics in numerical format.
2. Click the checkbox located next to a statistic to view a pictorial representation ofthe statistic on your graph.
74
72
70
68
66
64
62
60
58
56
54
52
50
0
Arm Span vs. Height
Height (in inches)0 50 52 54 56 58 60 62 64 66 68 70 72 74
Arm
Spa
n (in
inch
es)
Click the title of yourgraph to type a new title.
Click the axis labels to type new labels.
Click the graph’s scale to set a new scale.Then enter a minimum,maximum, and step size.

71
Classroom ActivitiesGraph Master is a powerful, open-ended tool that helps your students investigate andanswer questions across the curriculum by collecting and analyzing data. On the followingpages is a set of 20 activities to help you get started. We’re sure you’ll come up withlots more on your own!
You can use the table of contents below, or refer to the matrix on page 72 for moredetail on the graph types, mathematical content, and curricular areas covered by eachactivity.
Ten of these activities use data that students collect themselves.The other ten usepre-made data set files included with this program.When you install Graph Master,these files will be installed in the Graph Master application folder, in a folder calledData Sets. (If you are using the network version of the program, the Data Sets foldercan also be found on the CD-ROM.)
Activities with Data ProvidedAllowances ....................................................................................73Basketball Statistics....................................................................74Cities ................................................................................................75Heights ............................................................................................76Immigration & Race..................................................................77Mean & Median ..........................................................................78Olympic Medals..........................................................................79Planets ..............................................................................................80Presidents ......................................................................................81Roller Coasters ..........................................................................82
Activities Where Students Collect DataCoin Toss ........................................................................................83Common Letters ......................................................................83Line Graphs ..................................................................................84Misleading Graphs ....................................................................84Parachutes......................................................................................84Perimeter & Area ......................................................................85Pictograph Ratios ......................................................................86Popular Cars ................................................................................86Raisins in a Box ..........................................................................86A Typical Day................................................................................87

72
Activities Matrix
Bar
Gra
ph
Pict
ogra
ph
Circ
le G
raph
Freq
uenc
y C
hart
Line
Gra
ph
Scat
terp
lot
Hist
ogra
m
Line
Plo
t
Box
Plot
Scal
e &
Prop
ortio
n
Frac
tions
,Dec
imal
s,Pe
rcen
tage
s
Geo
met
ry
Prob
abilit
y
Dist
ance
,Rat
e &
Tim
e
Shap
e of
Dat
a
Mea
n,M
edia
n,M
ode
Out
liers
Tren
ds
Scie
nce
Soci
al S
tudi
es
Page
Mat
hem
atic
alC
urri
culu
mO
bjec
tive
s
Gra
ph
Type
Allowances 73
Basketball Statistics 74
Cities 75
Heights 76
Immigration & Race 77
Mean & Median 78Olympic Medals 79
Planets 80
Presidents 81
Roller Coasters 82
Activities Where Students Collect Data:
Coin Toss 83
Common Letters 83
Line Graphs 84Misleading Graphs 84
Parachutes 84
Perimeter & Area 85Pictograph Ratios 86
Popular Cars 86
Raisins in a Box 86A Typical Day 87
Activities with Data Provided:
Cro
ss-C
urri
cula
rC
onne
ctio
ns

73
AllowancesHave students collect data on the allowance earned by each member of the class (or a sample of students from throughout the school). Collect information on:
• student’s grade or age• student’s gender• weekly allowance• whether the allowance is contingent on chores (yes, no)• number of hours spent on chores each week
Questions students can explore with this data:What does a typical student earn for an allowance?Create a histogram of students’ weekly allowances.What is the typical allowance? How do mean, median, mode, and range help to answer this question? If studentswere making a case with their parents for a particular allowance, how would the datasupport them?
Is there a relationship between a student’s age and allowance? Create a scatterplot comparing age (or grade) and weekly allowance. Is there a relationship? Is the relationship positive or negative? Compare your findings to thedata* in the Allowances file.This data was collected from kids all over the country.Regular updates of this data can be found on the Kids’ Money Web site:www.kidsmoney.org/
Is there a relationship between a student’s gender and allowance? Create a histogram of students’ weekly allowances.Then clone and filter to create twographs: one showing the allowances of boys and another showing the allowances ofgirls. Is there a difference between the two groups? If so, what evidence can you provide?
Is there a relationship between students’ allowances and the number ofhours they spend weekly on chores?Create a scatterplot comparing weekly allowances and hours spent weekly on chores.Is there a relationship? Is the relationship positive or negative?
* Copyright © 2001 by Kids’ Money. All rights reserved.

74
Basketball StatisticsThe file Shaq’s Stats contains data* on NBA star Shaquille O’Neil’s performance duringeach game of the 1999–2000 season.Variables include:
• game date • field goals made (FGM) • free throw percentage (FT%)• opponent • field goals attempted (FGA) • offensive rebounds• home or away • field goal percentage (FG%) • defensive rebounds• win or loss • free throws made (FTM) • total rebounds• total points scored • free throws attempted (FTA) • minutes played
Questions students can explore with this data:Is there a home court advantage?Make a circle graph of the Lakers’ wins and losses during the 1999-2000 season.Clone and filter to create two new graphs: one of wins and losses for home gamesonly, the other for away games only. Compare the two graphs side by side.
How does Shaq’s field goal percentage compare to his free throw percentage?Create and compare histograms showing Shaq’s field goal percentage (FG%) and freethrow percentage (FT%) for the 1999-2000 games. How would you describe theshape of each data set?
How many rebounds does Shaq get in a typical game?Create line plots of Shaq’s offensive and defensive rebounds. How would you describethe shape of each graph? How are they similar/different? Discuss the mean, median,mode, and range for each graph. How are these measures helpful?
How many free throw attempts does Shaq make in a typical game?Tally Shaq’s free throw attempts for the season. Display the results as a box plot. Markthe outliers.What circumstances might lead to the unusually high number of freethrow attempts? (Students can help answer this question by researching newspapercoverage of the games in question.)
Students can find data on other basketball players at NBA.com or WNBA.com.• Go to: www.nba.com/playerindex.html (NBA)
www.wnba.com/playerindex.html (WNBA)• Click on a player’s name• Click on Game-by-Game Stats (NBA) or Game Log (WNBA)
* Copyright © 2000 by NBA Properties, Inc. All rights reserved.The NBA and individual NBA member team identifications are trademarks and copyrighted designs, and/or other forms of intellectual property,that are the exclusive property of NBA Properties, Inc. and the respective NBA member teams and may not be used, in whole or in part,without the prior written consent of NBA Properties, Inc.
Internet Extensions

75
CitiesThe file Cities contains data* on the population of eight U.S. cities during each decadefrom 1800 to 1990. Cities include:
• Boston • Detroit• New York • Chicago• Los Angeles • Savannah• San Francisco • Atlanta
Questions students can explore with this data:How did the population of New York (or any other city) change over time?Create a line graph showing how the population of a city changed between 1800 and1990.When did the city’s population grow most rapidly? Least rapidly? Have studentsresearch the historical factors that influenced the city’s growth. Based on trends in thedata, what would you expect the population to be in the year 2000? (Students can doresearch to test their predictions.)
How does population growth in Savannah and Atlanta (or any other twocities) compare?Create a double line graph showing the population growth in Savannah and Atlantabetween 1800 and 1990. How would you compare the growth of these two cities?Research the historical reasons behind the trends you observe.
Additional population data can be found on the U.S. Census Bureau Web site:www.census.gov
* Data provided courtesy of the U.S. Census Bureau.
Internet Extensions

76
HeightsThe file Heights contains data on students in 4th, 6th, 8th, and 12th grades (collected from several different schools). Variables include:
• grade• height• gender
Questions students can explore with this data:How tall are students in each grade?Create a histogram showing the heights of all students. Filter the graph to show theheights of students in one grade only. How would you describe the data? Show statistics.How do the mean, median, mode, and range help summarize this data? Repeat forother grades.
Is there a grade when girls are typically taller than boys?Clone the graph that you made in the activity above two times. Filter the first clonedgraph to display data for boys in the fourth grade only. Filter the second cloned graphto display data for girls in the fourth grade only. Compare these graphs side by side.Display statistics for both graphs. How do the mean, median, mode, and range helpyou compare the heights of fourth grade boys and girls? Repeat for grades 6, 8, and12. In which grades are boys taller than girls? In which grades are girls taller than boys?
What is the relationship between a student’s grade and height?Create a scatterplot showing the relationship between a student’s grade and height.Display a line of best fit. Is there a clear relationship between grade and height? If so,is it a positive or negative relationship?

77
Immigration & RaceThe file States contains data* on the population of 48 U.S. states in the year 1930.Variables include:
• state• total population (age 10 and up)• native white population (age 10 and up)• foreign white population (age 10 and up)• black population (age 10 and up)• other population (age 10 and up)
Questions students can explore with this data:Which states have the largest foreign white population?Sort the data table by column D (Foreign White Population) in descending order.Create a chart showing which states have the highest foreign white population. Usingthe formula feature, calculate the percentage of each state’s total population that iswhite and foreign-born (% Foreign White) and create a chart of this data. In what waysis this presentation of the data more meaningful? (Percentages allow you to make validcomparisons between states with differing populations.) Discuss historical reasons whysome states have a higher percentage of foreign-born white people than others.
Which regions have the largest foreign white population? Create a new column in the data table called Region. Assign each state to a region of the country (Northeast, Midwest, South,West, etc.). Create a histogram from the % Foreign White column. Clone and filter this histogram to compare different regionsof the country.
Which states/regions have the greatest percentage of blacks? Of native-bornwhites? Of people whose race was listed as neither black nor white?Repeat the above explorations for data on native white, black, and other segments ofthe population.
Students can find more population data at the following Web sites:• United States Historical Census Data Browser: fisher.lib.virginia.edu/census/• U.S. Census Bureau: www.census.gov
* Copyright © 2001 Inter-university Consortium for Political and Social Research (ICPSR). All rights reserved.
Internet Extensions

78
Mean & MedianThe file Centers contains data showing how many siblings each of 5 classmates has.A data table appears on the top left, a line plot (with mean and median displayed)below. When students change the data, the line plot (and its mean and median)change dynamically. Have students explore measures of center by constructing data setsthat meet the following criteria:
• There are 5 students in the class.The students’ mean number of siblings is 3.
• There are 5 students in the class.The students’ mean number of siblings is 3.None of the 5 students has exactly 3 siblings.
• There are 5 students in the class.The students’ mean number of siblings is 3.One of the students has 12 siblings.
• There are 6 students in the class. (A new student has joined.)The students’ mean number of siblings is 3.
• There are 6 students in the class.The students’ mean number of siblings is 3.The median number of siblings is 2.
• There are 6 students in the class.The mean number of siblings is less than the median.

79
Olympic MedalsThe file Olympics contains data* on the number of medals won by each participatingcountry in the 2000 Olympics. Variables include:
• country• number of gold medals won• number of silver medals won• number of bronze medals won• total number of medals won
Questions students can explore with this data:Which country won the most medals overall? Which country won the mostgold, silver, bronze?
Create a frequency chart showing the number of medals won by each country. To seecountries in order of the number of medals won, sort the data table by column E(Total Medals), in descending order.
How were medals distributed in the 2000 Olympics?Create a histogram of the number of medals won by different countries.What doesthis distribution show? Are medals distributed evenly, or do a few countries win themajority of the medals? View the histogram described above with statistics displayed.
How many medals does a typical country win?Which measure of center (mean, median, or mode) gives the best picture of the number of medals a typical country wins? View the data as a box plot and mark outliers. How do outliers affect the mean?
Which region of the world won the most medals?Create a 6th column labeled “Region,” and list a continent or region for each country.Create a histogram of medals won (as described above) and then filter by region tosee if certain regions/continents won more medals than others.
* “Final Medal Standings.” Infoplease.com. © 2001 Learning Network. http://www.infoplease.com/ipsa/A0875902.html

80
PlanetsThe file Planets contains data* on each of the nine planets in our solar system.Variables include:
• planet• distance from the sun
1 unit = distance of earth from sun (93,000,000 miles or 150,000,000 km)• orbit period (in years)• diameter (measured at planet’s equator, where diameter is largest)
unit = diameter of earth (7928 miles or 12,756 km)• volume
unit = volume of earth• planet solar day (in days)
This is the period between noons (the time when the Sun is halfway across the sky).• planet spin (in days)
This is the period to complete one physical rotation relative to the rest of the universe - not the same asa solar day.When the spin is slow compared to the orbit period, planet spin and solar day are very different, because the planet moves a significant distance along its orbit in the time to complete one spin.
• weight (per 100 lbs on earth)This is what you would weigh (at the surface of each planet) if you weighed 100 lbs on earth. On the giant planets, which have no solid surface, you would have to weigh yourself on a platform hoveringat some “surface level,” suspended by a balloon.
• average temperature from space (in Kelvins)The Kelvin scale counts from absolute zero in Celsius degrees.The melting point of water is 273 Kelvins.
• average temperature from space (in degrees Fahrenheit)• average surface temperature (in Kelvins)
For the giant planets, which have no solid surface, “surface” means the level in the atmosphere wherethe pressure is the same as at earth’s surface.The same level is used for the weight data.
• average surface temperature (in degrees Fahrenheit)• number of satellites• number of rings
Questions students can explore with this data:How do the other planets compare to earth?Create graphs of different characteristics, such as distance from the sun, or number ofsatellites.Which graph type best represents each set of data? How do the other plan-ets compare with earth?
Is there a relationship between a planet’s distance from the sun and its temperature? number of rings? orbit period? between volume and weight(per 100 lbs)?Create scatterplots exploring the relationship of various planetary characteristics.Do some reveal strong relationships? How can these relationships be explained?
How do planets’ temperatures vary when measured on the surface vs. fromspace?Create a double bar graph displaying the surface temperature and temperature from spacefor each planet. For which planets are these two measurements similar? For which arethey very different? Have students investigate and discuss the reasons for these differences.
* Data provided courtesy of the Harvard-Smithsonian Center for Astrophysics. A standard reference for these data is “Allen's AstrophysicalQuantities,” 4th ed., Cox, A. N., editor, AIP/Springer (2000).

81
PresidentsThe file Presidents contains data* on each of the presidents of the United States.Variables include:
• number (1st, 2nd, etc.) • term end (year) • age at inauguration (in years)• name • term length (in years) • age at death (in years)• political party • died in office (yes or no) • state of residence• term start (year) • religion
Questions students can explore with this data:How many presidents have we had from each political party?Create a bar or circle graph of presidents’ political parties.Which party was most represented? Encourage students to research the history of each party. (Did the partiesstand for the same issues and ideals at different points in history?) Clone and filter thegraph to compare the proportion of presidents in each political party at differentpoints in time (e.g., pre-1865, 1865 and after).
How well do our presidents reflect the religious diversity of the United States?Create a bar or circle graph showing the religions of the presidents.Which religionsare most common? Which are not represented at all? Clone and filter the graph tocompare the proportion of presidents of different religions at different points in time(e.g., pre-1900, 1900 and after). Have students investigate the frequency of differentreligions in the general population.
What is the typical term length of a U.S. president?Create a histogram of presidents’ term lengths. Discuss the appropriate intervals forthis graph. (Is it helpful to use intervals of 2 rather than 4? Why or why not?) Whatwas the shortest presidential term? The longest? What’s the story behind these? Havestudents research the 22nd Amendment to the Constitution, ratified in 1951, whichlimited presidents to two terms in office.
How old are presidents, typically, when they take office?Create a histogram of presidents’ ages when first taking office.What is the typical agewhen presidents take office? How do statistics such as mean, median, mode, and rangehelp answer this question? What is the youngest legal age for a president? (35)
* “Presidents.” Infoplease.com. © 2001 Learning Network. http://www.infoplease.com/ipa/A0194030.html

82
Roller CoastersThe file Coasters contains data on roller coasters at each of the Six Flags ThemeParks located in the United States. Variables include:
• coaster name • height (in feet)• coaster type • height of first drop (in feet)• park • maximum speed (in miles per hour)• location • track length (in feet)• material (metal or wooden) • passengers per car• date opened • ride time (in seconds)
Questions students can explore with this data:How tall are Six Flags roller coasters?Create a histogram showing the heights of all Six Flags roller coasters. How wouldyou describe the data? Show statistics.What does each measure (mean, median, modeand range) tell you about the data?
How do wooden coasters compare with metal coasters?Create histograms of various coaster attributes (such as height or speed).Then filteryour graphs to display data for wooden coasters only or metal coasters only. Whichtype of coaster is typically faster, taller, longer? Display statistics and discuss how themean, median, mode, and range help you compare these two groups of coasters.
What is the relationship of a coaster’s height and its speed?Create a scatterplot showing the relationship between the height of a coaster and itsspeed. Is this a clear relationship? If so, is it a positive or negative relationship?
Maximum speed vs. average speedUse the formula feature to calculate the average speed (in mph) of each coaster usingthe information on track length and ride time. (Students will need to convert units.)Compare this to the maximum speed. Is there a relationship?
Students can find more roller coaster data at the following Web sites:• Six Flags Theme Parks: www.sixflags.com• CoasterBuzz: www.coasterbuzz.com
Internet Extensions
* Copyright © 2001 by Six Flags, Inc. All rights reserved.
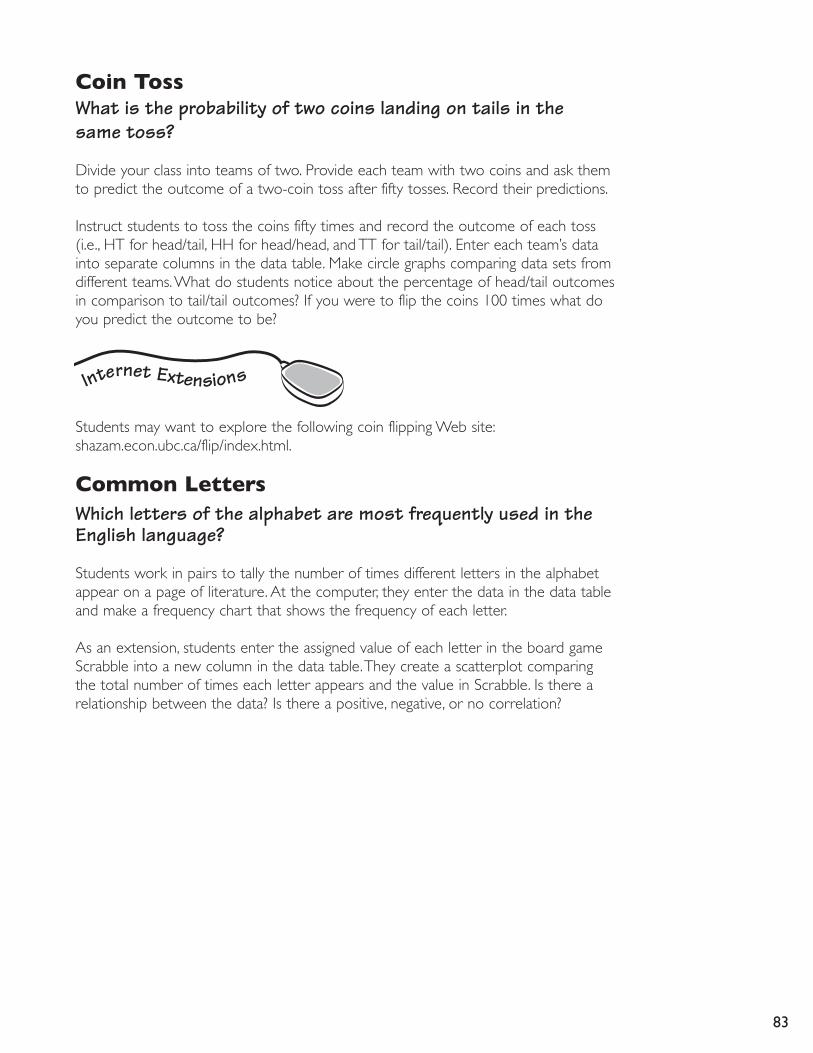
83
Coin TossWhat is the probability of two coins landing on tails in the same toss?
Divide your class into teams of two. Provide each team with two coins and ask themto predict the outcome of a two-coin toss after fifty tosses. Record their predictions.
Instruct students to toss the coins fifty times and record the outcome of each toss(i.e., HT for head/tail, HH for head/head, and TT for tail/tail). Enter each team’s datainto separate columns in the data table. Make circle graphs comparing data sets fromdifferent teams.What do students notice about the percentage of head/tail outcomesin comparison to tail/tail outcomes? If you were to flip the coins 100 times what doyou predict the outcome to be?
Students may want to explore the following coin flipping Web site:shazam.econ.ubc.ca/flip/index.html.
Common LettersWhich letters of the alphabet are most frequently used in theEnglish language?
Students work in pairs to tally the number of times different letters in the alphabetappear on a page of literature. At the computer, they enter the data in the data tableand make a frequency chart that shows the frequency of each letter.
As an extension, students enter the assigned value of each letter in the board gameScrabble into a new column in the data table.They create a scatterplot comparing the total number of times each letter appears and the value in Scrabble. Is there arelationship between the data? Is there a positive, negative, or no correlation?
Internet Extensions

84
Line GraphsWhen should you use a line graph?
Have students record the temperature outside each hour for ten consecutive hours in a given day.Create a line graph of the data. Pose questions such as: What do the points represent? What do the linesrepresent? Can you use this graph to estimate the temperature between measurements? Why is a linegraph appropriate to use with this type of data?
Now make a line graph showing class attendance for one week.What do the points represent in this graph?Do the lines connecting points have meaning? (No, because it does not make sense to give the attendanceof a class on day 1.5.) Does a line graph make sense for this data? (No, because the data is discrete.)
Discuss the differences between discrete and continuous data.
Misleading GraphsHow can a graph misrepresent data?
The data in graphs is not always shown correctly. Sometimes the data is shown inaccurately or is intentionallymisrepresented. Gather two or three examples of misleading graphs from newspapers, magazines, or theInternet. Make transparencies of these graphs and have students examine them. Ask students to identifywhy these graphs are misleading (e.g., the scale does not start at zero, the spaces between intervals areuneven, the graph is not titled appropriately, etc.) and who would benefit from the misrepresented data.
Now divide students into teams. Allow time for each team to collect graphs from the resources mentionedabove. At the computer, instruct the teams to create graphs from their data to support different points ofview. Finally, compare the graphs side by side. Have the students examine the scales, axes labels, titles, andother features that result in a misleading graph.
ParachutesIs there a relationship between the size of a parachute and its rate of descent?
Have students brainstorm everything they know about parachutes and how they work.
Divide the class into teams of four. Provide each team with a small garbage bag, string, paper clips, and awalnut. Instruct each team to create a parachute out of the materials provided, with the goal of creatingthe parachute that descends the most slowly. Designs may vary in a number of ways including size(perimeter or area of the parachute), shape, and weight (paper clips vs. a walnut).
Students test their parachutes by dropping them from a fixed height (e.g., 10 feet) and measuring thetime it takes for the parachute to drop to the floor (hang time).
Enter the following information for each parachute into the data table: area, perimeter, weight (in grams),height of drop, and hang time.With the formula feature, calculate the rate of descent for each parachuteusing the formula d=rt.

85
After the rate of descent is calculated, have students create graphs showing the rate of descent for their parachutes.They can use the filter feature to view the results fordifferent types of designs (large vs. small parachutes, parachutes with or without paperclips attached, etc.) By creating a scatterplot, students can also explore the relationshipbetween the hang time and the rate of descent.
Perimeter & AreaHow are perimeter and area related? If you have a fixed amountof fence, what shape encloses the largest area?
Present students with the following problem: You want to create an enclosed rectangularpen for some animals, and you have exactly 40 feet of fence.What different types ofrectangles can you make? Which shape encloses the largest area? Have students makeconjectures.
Have students work in groups, and come up with examples of different size pens thatcould be made with 40 feet of fence. Enter each example in the data table. Includelength, width, and area. (You can use the formula feature to calculate the area.) Createscatterplots from this data showing the relationship between length and area, andbetween width and area.What can you conclude from these graphs? (Students cancreate additional data sets exploring the same problem with a different perimeter.Does the same pattern seem to hold?)
86
Pictograph RatiosWhat information do you need in order to assign a value to a pictograph symbol?
Show students examples of pictographs. For each graph, ask questions such as: What is the value of eachpictograph symbol? How would the pictograph change if the value of the symbol increases? If the valuedecreases?
Have students collect data about their classmates, school, or community. At the computer, enter the datainto the data table and create a pictograph. Explore changing the value of the pictograph symbol basedon students’ suggestions. Ask questions such as: How many symbols will you get in the largest category ifeach symbol represents 5 people? 10 people? What is the best symbol value for the data? Why?
As an extension, print examples of the class’ pictographs with different symbol values. Photocopy thegraphs and randomly distribute them. Ask students to write an explanation about whether or not thebest symbol value has been assigned.
Popular CarsWhat is the most popular make of car at our school?
Take students outside to the parking lot and conduct a survey of cars. Have them record the make ofeach car, the color, and whether it is a two-door, four-door, or SUV. At the computer, have students workin pairs to enter the following data in the data table: car make, color, type (two-door, four-door, or SUV).Instruct each pair to tally the car make column and to create a circle graph labeled with fractions. Clonethe graph and change the circle graph labels to decimals. Compare both graphs side by side. Challengestudents to predict the angle measurement for each segment.
Now use the filter feature to show only the four-door cars or only the green cars in the parking lot.Print out the graph with no labels. Have students label the graph with angle measurements or fractionestimates.
Raisins in a BoxDo boxes of raisins contain an equal amount?
Provide each student with a small box of raisins and ask them to predict how many are in the box.Record their predictions. Have students count the actual number of raisins in their box. Enter the datainto the data table.Tally the data and create a line plot. Show statistics. How do the mean, median, mode,and range help summarize this data?
Now clone the line plot. Click the Box Plot graph type button on the cloned graph. Show statistics.Compare the two graphs. Arrange the graphs on screen so that the line plot takes up the top half andthe box plot takes up the bottom half. How do these graphs relate to one another?

87
A Typical DayHow do students spend their time during a typical day?
Have students record how they spend their time in a 24-hour period. For youngerstudents, you may want to brainstorm categories as a class such as school, eating,sleeping, reading, sports, homework, television, etc.
Enter the data in the data table and create a variety of graphs to explore questionssuch as:
• How many hours per day do students spend doing homework? Watching television?Playing sports?
• Is there a relationship between the number of hours a student spends watching television and the number of hours spent on homework?
• Which activity shows the greatest range of values? The least?
• Overall, how would you describe the typical day of a student? How do measures of center (mean, median, mode) and spread (range) help answer this question?

The Graph Club K-4
Neighborhood MapMachine 1-5
Community Construction Kit 1-5
Classroom StoreWorks 2-6
Fizz & Martina’s Math Adventures
• Buddies for Life 1-2
• Caves of Blue Falls 2-3
• Blue Falls Elementary 3-4• Project Sphinx 4-5
• Lights, Camera, Fractions! 5-6
Science Court: Statistics 4-6
PrimeTime Math
• Adrift! 4-5
• Lost! 5-6
• Cliffbound! 6-7
• Stakeout! 6-7• Emergency! 7-8
• Fire! 8-9
Math Mysteries
• Whole Numbers 4-5
• Advanced Whole Numbers 4-5
• Fractions 5-6
• Advanced Fractions 6-7
• Measurement 4-5
Tessellation Exploration 4-8
Graph Master 4-8
Who
le N
umbe
r O
pera
tions
Frac
tions
&D
ecim
als
Ratio
s &
Per
cent
ages
Den
omin
atio
ns &
Plac
e Va
lues
Estim
atio
n
Gra
phs
&C
hart
s
Dat
a C
olle
ctio
n &
Ana
lysis
Rand
om S
ampl
e &
Bia
s
Shap
es
Scal
e &
Prop
ortio
n
Spat
ial S
ense
Sym
met
ry &
Tran
sform
atio
ns
Stan
dard
Uni
ts
Dist
ance
,Rat
e &
Tim
e
Patt
erns
Equa
tions
&Fu
nctio
ns
Solv
e Pr
oble
ms
App
ly S
trat
egie
s
Expr
ess
Mat
hem
atic
al Id
eas
Num
ber
&O
pera
tion
s
Dat
a A
naly
sis
&P
roba
bilit
y
Geo
met
ry
Mea
sure
men
t
Alg
ebra
Pro
blem
Solv
ing
Math Curriculum MatrixThe curriculum matrix below shows how Tom Snyder Productions products address a range of math curriculum objectives.
Com
mun
icat
ion
88

89
IndexActivities 71–87Analyze menu 45– 47Axis labels 13, 16, 44
Bar graphInterpreting 53Making 54
BMP, Save As… 44Box plotInterpreting 55Making 56
Category data vs. number data 30Cells 12, 29Center Number Under Bars 43Change Circle Graph Labels… 44Change Colors… 42Change Intervals… 40Change Pictograph Scale… 41Change Pictograph Symbol… 42Change Scale… 40Chart See Frequency ChartChoose Graph Type 32Choose Independent Variable 32Choose Variables 31Circle graphInterpreting 57Making 58
Clear 37Clone Graph 44Close Data Set 35Close Window 35ColumnHiding/showing 40Labels 29Letters 29Selecting 29
Compare 45CopyGraph 37Text 37
Create Graphs See GraphsCut 37
DataCopying 37
Entering/deleting 30Graphing 31–33Importing from Internet/spreadsheet 50Number vs. category 30Tallying 22–23, 34
Data menu 11–40Data TableButton 34Entering data 30Navigation within 30
Delete Graph 44Double bar graph 53–54Double line graph 63–64
Edit Graphs See Graph, ChangingEdit menu 37Edit mode 30Exit 36
File menu 35–36Filter 45Formula 39Frequency chartInterpreting 59Making 60
Glossary 48GraphButton 34Changing 16–17, 33Cloning 44Creating 31Deleting 44Graph Types 36
Bar graph 53Box plot 55Circle graph 57Frequency chart 59Hiding/Showing 44Histogram 61Line graph 63Line plot 65Pictograph 67Scatterplot 69
Viewing 34Graphics programs 37, 43– 44

90
Graphs menu 40–44
Help menu 48Hide Columns 40Hide Graph 44HistogramInterpreting 61Labeling 61Making 62
Import tab-delimited text 50Independent variable 32Installation 9–10Interpreting graphs 53, 55, 57, 59, 61, 63, 65, 67, 69Intervals 40– 41
JPEG, Save As… 44
Label Orientation 44Last Window 34Line graphInterpreting 63Making 64
Line of best fit 47Line plot Interpreting 65Making 66
Lower quartile 55
Mark Outliers 47Mean 46Median 46Mode 46
Navigation between windows 18New Data Set 35Notebook 19, 34Number data vs. category data 30Number format 36, 39
Open Data Set 35Outliers 47, 55
Page Setup 35Paste 37PICT, Save As… 44
PictographInterpreting 67Making 68
Preferences See Teacher PreferencesPrint 20, 35Print Setup 35
Quartile 55Quick Feature Snapshot 3–6Quit 36
Range 23–24, 46Row Numbers 29Selecting 29
Save as PICT, JPEG, BMP 44Save Data as Text… 40Save Data Set 35Save Data Set As... 35Save Graph As 44Scale 33, 40– 41ScatterplotInterpreting 69Making 70
Select All 37Select mode 30Set Scale 33, 40– 41Show All Columns 40Show Column Totals 38Show Grid 43Show Line of Best Fit 47Sort 38Statistics 23–24, 46System requirements 2
Tab-delimited text filesOpen 35, 50Save data as… 40
Tally 34, 36, 38Teacher Preferences 36Title 16Toolbar 34Tool tips 17Trend 69

91
Unavailable graphs 15Undo 37Upper quartile 55
Variable 14
Web site 48Window List 34Write in notebook 19, 34

XGRA MAS U 01
®
80 Coolidge Hill Road • Water town, MA 02472-5003 • USAPhone 1-800-342-0236 • Fax 1-800-304-1254 • www.tomsnyder.com
Tom Snyder ProductionsTom Snyder Productions®

Name: ______________________________________ Graph Master Project Objective: Collect information, organize it using tally tables and data charts and present it in graph form.
1. Determine a question that you would like to have answered by surveying other students.
2. Write the question down and get teacher approval. 3. Create a tally table in order to organize the information you will gather through
your survey. • You must survey 4 different classrooms and have the classroom teacher sign
the tally table. Note: You will need 1 tally table for each classroom you survey.
4. Survey each classroom and record the information you have gathered on the tally table. Total the number of tallys. Make sure you add correctly!!!!
5. Once you have all of your survey’s completed you will use GRAPH MASTER to present your findings.
6. Now enter data in the data table. • Open Graph Master • Click on the icon “New Data Set” • Highlight Variable A and type in the information • In Cells 1-4 type in the actual colors. • Highlight Variable B and type in Number of Students. • Using your tally table type in the total number of students for each color.
SAVE Choose File scroll to “Save Data As” and title your file. Example Favorite Color Graph
PRINT Choose File and scroll to “Print” and then enter.
Creating a Graph
Find the graph button on the left side of your screen. Now you need to choose which columns you would like to display on your graph. Click the box next to each desired column.. Choose which type of graph you want to create. You must set an appropriate scale.
a. First choose a maximum number of students you want to represent. b. Next, choose step size. c. Finally choose a minimum d. Click OK
Change the title of the graph. Click TITLE and rename your graph appropriately.

SAVE Choose File scroll to “Save Data As” and title your file. Example Favorite Color Graph
PRINT Choose File and scroll to “Print” and then enter.
The following items should be turned into the teacher. ____ Copy of 4 surveys with teacher signature ____ Copy of data table ____ Copy of graph

Penn Hills School District Graph Master Rubric
Teacher: 4th Grade
Title of Work:
Teacher Comments:

Graph Master Introductory Lesson Grade 4
Collect Data
1. We will begin by exploring a question.
Example: What is your favorite color?
2. You will create a tally table to record the findings of your survey.
- - -
Green Yellow
3. Conduct survey.
Total Colors Red '
Tallies
4. Now enter data in the data table.
Colors Red Green
U5c column labels to dczribc the data contaiincd in each column
When entenng data. click Tab w mwc one
ccll W the right. Click Return to mwe
one ccll d m . You can also use the arrow keys w navigate up, down.
left, or right.
Tallies I l l I II I
--- .-".. " Entcr your data
Total 4 3
Yellow
In the cells below
1 Orange ! 11 8

Open Graph Master Click on the icon "New Data Set" Highlight Variable A and type in the mformation. Example: Color In Cells 1-4 type in the actual colors. Example: red, green, yellow, and orange ; Highlight Variable B and type in Number of Students. Using your tally table type in the total number of students for each color.
SAVE Choose File and scroll to "Save Data Set As." Name your file in the Title box. Example "Favorite Color Graph." Click SAVE.
Creating a Graph
5. Find the graph button on the left side of your screen. Now you need to choose which columns you would like to display on your graph. Click the box next to each desired column. Example click A and B and click OK.
6. Choose which type of graph you want to create. Example: BAR GRAPH 7. You must set an appropriate scale.
First choose a maximum number of students you want to represent. Example 10 Next, choose step size. Example 1 Finally choose a minimum. &le 0 ClickOK
8. Change the title of the graph. Click TlTLE and rename your graph appropriately. Example: Favorite Colors of Students.
SAVE Choose File scroll to "Save Data Set As" and check that your file name is correct. Click SAVE. A window may pop up that asks: "This file already exists. Do you want to replace it?" Click YES.
PRINT Choose File and scroll to "Print." Click to select items to print. Click data table and graph. The preview will show you what you are printing. It may go on two pages. Check the page numbers below the preview box. CIick "Print in black and white." Click OK

Skills Tutor

SkillsTutor TM
Getting Started Guide for the�Getting Started Guide for the�TeacherTeacher

SkillsTutor 3–1
3 Getting Started forGetting Started forTEACHERSTEACHERS
IntroductionSkillsTutor is a comprehensive resource for diagnosing and meeting the needs of your students. It gives students SkillsTutor is a comprehensive resource for diagnosing and meeting the needs of your students. It gives students SkillsTutora guided review of basic skills covered by national standardized tests such as the California Achievement Tests (CAT), the Comprehensive Tests of Basic Skills (CTBS), the Iowa Tests of Basic Skills (ITBS), and the Stanford Achievement Test (SAT). It also provides students with important practice for the standardized tests by presenting questions in the same format used by national tests in a variety of subject areas.
Th e three principal activities in the teacher program are setting up classes, creating assignments, and viewing/printing reports. Th is document provides a quick overview of these activities to help you get started.
Classroom Guide (online): See page 3-4 on viewing online documentation. Each Classroom guide contains Les-son Summaries and assignment sheets. Many Classroom Guides also contain worksheets to support lessons within the module.
About Getting Started for TeachersTh e information on subsequent pages of this section is organized according to the process defi ned in the diagram shown below:
Process Flow – Getting Started with SkillsTutor
We recommend that you go through each of the steps identifi ed in this process to successfully get started with SkillsTutor.
Step I: Log In
Step VIII: Log Out
Step II: View Tutorials
Step III: View Guides
and Worksheets
Step IV: Create a Class
Step V: Enroll Students into Your Class
Step VI: Create Assignment(s)
Step VII: Give Assignment(s)

Teacher Getting Started
3–2 Achievement Technologies, Inc.
Teacher Getting Started3
RequirementsIn order to be able to access SkillsTutor, your computer must have Flash Player and Adobe Acrobat Reader in-stalled. If your computer does NOT have these applications, you may:
• Proceed and you will be guided through the installation of both of these applications.• Contact your organization’s technical representative to have these applications installed and then proceed
with the steps described on the next page.• Go to System Requirements at http://www.AchievementTech.com/go/stsysreq
Your hardware confi guration and operating system MUST meet the following requirements specifi ed for the browser you are using:
Internet Browsers Supported
Windows(98, 2000, NT, ME, XP)
Internet ExplorerVersions 5.5 SP2 or higher
Netscape NavigatorVersions 4.76, 6.x or 7.x
America OnlineVersion 6 or higher
Macintosh(OS 8.x or 9.x)
Internet ExplorerVersions 5.1.5
Netscape NavigatorVersions 4.76, 6.x or 7.x
America OnlineVersion 5 or higher
Macintosh(OS X)
Internet ExplorerVersions 5.1.4 or 5.2.1
Netscape NavigatorVersions 4.76, 6.x or 7.x
America OnlineVersion 5 or higher
Macromedia Flash Player Version 5 or higher Version 5 or higher Version 5 or higher
Adobe Acrobat Reader Version 5 or higher Version 5 or higher Version 5 or higher
Browser Settings
• Javascript enabled• SSL 1 and 2 enabled• Access to secure pages• Access to Temporary Internet
Files
• Javascript enabled• SSL 1 and 2 enabled• Access to secure pages• Access to Temporary Internet
Files
• Javascript enabled• SSL 1 and 2 enabled• Access to secure pages• Access to Temporary Internet
Files
NO POP-UP WINDOW MANAGERS
Connection Speed Minimum 56Kbps Minimum 56Kbps Minimum 56Kbps
Display Settings• Minimum 800 x 600
(1024 x 768 recommended)• 256 Colors
• Minimum 800 x 600(1024 x 768 recommended)
• 256 Colors
• Minimum 800 x 600(1024 x 768 recommended)
• 256 Colors
Log-In InformationYou should receive your user name, password and site identifi er from your school’s designated SkillsTutor adminis-SkillsTutor adminis-SkillsTutortrator. You will need this information in order to use SkillsTutor. If you do not have it, please obtain this informa-tion from your administrator before proceeding.
User Name: ___________________________________________
Password: ____________________________________________
Site Identifi er: _________________________________________

Getting Started Teacher
SkillsTutor 3–3
Getting Started Teacher3
Steps for Getting StartedStep I: Log In
1. Open your Web Browser.
2. Go to www.MySkillsTutor.com.
. Important: If you do not have Flash player installed, you will be prompted to install it. The instructions for downloading and installing Flash Player for your particular browser and operating system can be found in Frequently Asked Questions located at http://www.AchievementTech.com/go/stsysreq
3. Type your: • user name in the fi eld labeled User Name.• user name in the fi eld labeled User Name.• password in the fi eld labeled Password. • password in the fi eld labeled Password. • site identifi er in the fi eld labeled Site.• site identifi er in the fi eld labeled Site.
4. Click Log In. Th e Main SkillsTutor screen displays.SkillsTutor screen displays.SkillsTutor
h Tip: When a Teacher logs in for the fi rst time a “Welcome to SkillsTutor” message appears. This may be turned off by choosing the “Click Here to disable this message” link. The Teacher can turn the message back on at any time by going to the “Change Password” screen and selecting the box next to “Show New User Intro Screen.”
. Important: A Tip button is located on every page. Refer to this for instructions tied to screen content.

Teacher Getting Started
3–4 Achievement Technologies, Inc.
Teacher Getting Started3
Step II: Viewing the Tutorials
Step III: Viewing Guides & Worksheets1. From the Main SkillsTutor screen, click SkillsTutor screen, click SkillsTutor View Tutorials or View Guides & Worksheets
. Important: If you do not have Adobe Acrobat Reader installed, you will be prompted to install it. The instructions for downloading and installing Adobe Acrobat Reader for you particular browser and operating system can be found in Frequently Asked Questions located at http://www.AchievementTech.com/go/stsysreq
2. Click on a tool, a tutorial movie, or a guide.
. Important: Tutorial movies require Flash 6 and above.
3. When you are fi nished, click the x located in the far upper right corner to close the “Adobe Acrobat – [Embedded File]” window.
4. Click the x located in the far upper right corner to close the “Teacher Guide” window.
h Tip: The User Guide is the complete instruction manual for the program. Each Classroom Guide outlines the content and activities for each SkillsTutor module.SkillsTutor module.SkillsTutor

Getting Started Teacher
SkillsTutor 3–5
Getting Started Teacher3
Step IV: Create a Class 1. From the Main SkillsTutor screen, click SkillsTutor screen, click SkillsTutor Classes.
2. Click Add Class(es)Add Class(es).
3. Type a class name in the blank space.
4. Click Add this Class to return to the Classes screen.
Step V: Enroll Students in Your Class1. Select a class with which to work and click Class PropertiesClass Properties. Th en, click Students.
2. Click Enrollment.
h Tip: If your SkillsTutor administrator has imported your school’s student roster, an alphabetized list of student names will display on SkillsTutor administrator has imported your school’s student roster, an alphabetized list of student names will display on SkillsTutorthe right. Enrolling a student in your class may involve both selecting student names from the list as well as adding students whose names do not appear on the list. Both techniques for enrolling students in your class are addressed in steps 3 and 4.

Teacher Getting Started
3–6 Achievement Technologies, Inc.
Teacher Getting Started3
3. Adding a student to the list:• Click Add New Student(s)Add New Student(s).• Type the student’s fi rst and last name and user name. (Password is optional. If it is not assigned, the
student will create one the fi rst time s/he logs in).• Click Add this Student and Next if more than one (1) student must be added to the list. Continue
until the last new student’s information has been added OR
Add this Student if this is the only student’s name to be added to the list.
h Tip: If you accidentally click Add this Student and Next, but have no additional students to add, click Cancel.
h Tip: The new students that are added to the class enrollment list are also added to the school roster.
4. Enrolling student(s) from the list of students:• Scroll through the list of student names and click the check box next to each student to enroll in your
class.
• Deselect the check box next to the student’s name to unenroll students from the class list.
. Important: All of the names with a ˛ will be enrolled in your class.
5. Click Enroll Selected Student(s)Enroll Selected Student(s). A list of all students enrolled in the class will be displayed.
6. Click Done.

Getting Started Teacher
SkillsTutor 3–7
Getting Started Teacher3
Step VI: Create Assignment(s)Assignments can be created for individuals or an entire class. Both options are demonstrated.
1. From the Classes screen, click the check box beside the class for which you want to make an assignment.
2. Click Class PropertiesClass Properties.
3. Click Add AssignmentAdd Assignment.
4. Enter an assignment name (e.g., Math-Fractions).a. Type a note for your students. Th is is what students will see when they log in. (Optional.)b. Enter the Mastery % (if the default of 80% is not appropriate).

Teacher Getting Started
3–8 Achievement Technologies, Inc.
Teacher Getting Started3
5. Click a subject (e.g., Math A) from the list on the left.
h Tip: You may choose to only assign the pretest for a subject. Upon completion of the pretest, activities (i.e., lessons) will be prescribed based on the Mastery % that is defi ned.
6. Scroll through the list of activities on the right associated with the selected subject displayed on the left. Click the check box(es) for the activity(ies) you want to assign to all students in the class.
h Tip: Click the topic name to select or deselect all activities in that topic.
7. Once the desired activities have been selected, click Done to give the assignment to students in the class.

Getting Started Teacher
SkillsTutor 3–9
Getting Started Teacher3
Step VII: Give Assignment(s)Once the assignment is created, it needs to be given to the students. Assignments can be given to the entire class or to individual students.
h Tip: If you have already enrolled students before working through the steps in this Getting Started section, you will be taken directly to the Give Assignments screen after creating a new assignment.
1. To give an assignment to an entire class, click on the assignment name. All students in the class will be given the assignment.
2. To give an assignment to individuals, click on the check box under the assignment you want to give and across from the student you wish to complete it.
. Important: Every time a new student is enrolled into a class, they will also have to be given an assignment. If they are not given an assignment by a teacher, the program will assign all the default pretests.
3. Click Done to save.
4. Click Done on the next three screens to return to the Main SkillsTutor screen.SkillsTutor screen.SkillsTutor

Teacher Getting Started
3–10 Achievement Technologies, Inc.
Teacher Getting Started3
Step VIII: Log OutFrom the Main SkillsTutor screen, click SkillsTutor screen, click SkillsTutor Log OutLog Out.
Preparing the Student QuickStartOn page 3-11 is a Quick Reference Sheet for Students. If you are ready for your students to begin using SkillsTu-tor, you may want to use this Quick Reference Sheet to distribute log-in information and instructions. To do so,
1. Make photocopies of the Quick Reference Sheet for Students (pages 3-11 and 3-12). Make as many cop-ies as you have students in your class roster.
2. If you have not already printed the Class Roster, refer to the online user guide. (See page 3-4 if you are unsure of how to view online guides.)
3. In the fi elds provided at the top of the Quick Reference Sheet for Students, enter the log-in information for each student from the Class Roster Printout.
4. Distribute the Quick Reference Sheet for Students to each student as appropriate.

Technical SupportPhone 1-888-764-2446Email [email protected]
Customer ServicePhone 1-800-230-3571Email [email protected]
Web Site www.AchievementTech.com
Achievement Technologies, Inc.
10400 LITTLE PATUXENT PARKWAY • SUITE 310 • COLUMBIA, MD 21044

SkillsTutor TM
Getting Started Guide for the�Getting Started Guide for the�StudentStudent

Getting Started Teacher
SkillsTutor 3–11
Getting Started Teacher3
Th e following step-by-step instructions provide a quick and easy way to get you started with SkillsTutor. If you need additional assistance using the program, please contact the instructor who provided you with access to the program.
Logging InListed below is the information that you need to log in to SkillsTutor:
User Name: _________________________________
Password: __________________________________
Site: _______________________________________
1. Open your Web browser.
2. Go to www.MySkillsTutor.com.
3. Type your user name, password and site.
. Important: If no password has been given to you, leave it blank. You will be required to create a password later.
4. Click Log In. a. If you entered a password at the log-in screen, the list of available assignments under the class name
displays. Proceed to “Taking An Assignment” on the back of this page.
b. If you did NOT enter a password, click Yes, it is my nameYes, it is my name. Th en: • Type a password in the New Password: blank space. • Type this same password again in the New Password (Repeat): blank space. • Click Done. If a SECURITY ALERT window displays, click the Yes button. • Th e list of available assignments and class name displays.
c. If you did NOT enter a password and the name displayed is NOT yours, please contact your instructor.
. Important: A Tip button is located on every page. Refer to this for instructions tied to screen content.

Teacher Getting Started
3–12 Achievement Technologies, Inc.
Teacher Getting Started3
Taking an AssignmentYour instructor has assigned activities for you to complete. Th ere may be one activity or several activities. To access your assignments follow these steps:
1. Click an assignment under the class name on which you wish to work.
h Tip: If you have been enrolled in only ONE class with ONE assignment, you will go immediately to the subject screen.
2. Click a subject to select it.
3. Click the activity listed in the Your next recommended activity is box at the top of the screen.
4. Complete the activity following the directions on each screen.
h Tip: When audio is available, your cursor will change to a hand. You can then click in the activity window to hear the audio support.
5. When you have completed the activity, click Go On.
. Important: Do NOT click the x in the upper right corner of the window. If you do, you will not get credit for the work you just completed.
Once you have completed an activity, you will be returned to the list of activities available to you in your selected subject. You may choose one of the following options:
• Click on the next recommended activity.• Click the Back button once and select a diff erent subject.• Click the Back button twice to choose a diff erent assignment.• Click Log OutLog Out to exit SkillsTutor.
. Important: If you are accessing the program outside of your school or educational organization, please make sure the computer you are using meets the system requirements. These requirements can be found at www.AchievementTech.com/go/stsysreq

SkillsTutor 1–1
1 Getting StartedGetting StartedREQUIREMENTSREQUIREMENTS
Th e following table lists the requirements for the successful operation of SkillsTutor. All of these requirements have been fully tested for proper execution and acceptable performance.
. Important: Individual system performance can be signifi cantly impacted by conditions outside of the requirements listed in the table. The following conditions may affect performance:• Local network traffi c• Bandwidth of the connection to your Internet Service Provider (ISP)• Contention with other network users
Your hardware confi guration and operating system MUST meet the following requirements specifi ed for the browser you are using:
Internet Browsers Supported
Windows(98, 2000, NT, ME, XP)
Internet ExplorerVersions 5.5 SP2 or higher
Netscape NavigatorVersions 4.76, 6.x or 7.x
America OnlineVersion 6 or higher
Macintosh(OS 8.x or 9.x)
Internet ExplorerVersions 5.1.5
Netscape NavigatorVersions 4.76, 6.x or 7.x
America OnlineVersion 5 or higher
Macintosh(OS X)
Internet ExplorerVersions 5.1.4 or 5.2.1
Netscape NavigatorVersions 4.76, 6.x or 7.x
America OnlineVersion 5 or higher
Macromedia Flash Player Version 5 or higher Version 5 or higher Version 5 or higher
Adobe Acrobat Reader Version 5 or higher Version 5 or higher Version 5 or higher
Browser Settings
• Javascript enabled• SSL 1 and 2 enabled• Access to secure pages• Access to Temporary Internet
Files
• Javascript enabled• SSL 1 and 2 enabled• Access to secure pages• Access to Temporary Internet
Files
• Javascript enabled• SSL 1 and 2 enabled• Access to secure pages• Access to Temporary Internet
Files
NO POP-UP WINDOW MANAGERS
Connection Speed Minimum 56Kbps Minimum 56Kbps Minimum 56Kbps
Display Settings• Minimum 800 x 600
(1024 x 768 recommended)• 256 Colors
• Minimum 800 x 600(1024 x 768 recommended)
• 256 Colors
• Minimum 800 x 600(1024 x 768 recommended)
• 256 Colors

Requirements Getting Started
1–2 Achievement Technologies, Inc.
Requirements Getting Started1
Installation of Flash Player and Adobe Acrobat ReaderIn order to be able to access all features and functionality of SkillsTutor, your computers must have Macromedia Flash Player and Adobe Acrobat Reader installed. If your computer does NOT have these applications, both ap-plications can be downloaded at http://www.AchievementTech.com/go/stsysreq
• Macromedia Flash Player is necessary for accessing the program’s activities.
• Adobe Acrobat Reader is necessary for operating the program’s management system and viewing addi-tional online documentation
Requesting Technical AssistanceTo ensure the quickest problem resolution, we request that all of the questions from students, teachers and parents fi rst be directed to the designated Program Administrator for your school.
It is our experience that many problems that occur while using Internet-based products are due to customer-spe-cifi c confi guration issues with the Internet Service Provider (ISP) software, desktop protection systems, fi rewalls, Internet site fi ltering software, and local area networks.
H Tip: Our Technical Support staff is not permitted to disperse names or passwords to any teacher, student or administrator without the express written consent—on school letterhead—of your school’s SkillsTutor administrator.SkillsTutor administrator.SkillsTutor
If a problem cannot be resolved locally, please contact our Technical Support center:Phone (toll free): 1.888.764.2446 Fax (toll free): 1.888.391.3244 Email: [email protected]
Non-Technical questions can be directed to our Customer Service department at:Phone (toll free): 1.800.230.3571 Fax (toll free): 1.888.391.3244 Email: [email protected]
Representatives are available to assist you between the hours of 8:30 AM and 5:00 PM EST, Monday through Friday.

Study Island

Study Island Administrator Handbook
How to Get Started Using the Program
2006-2007

www.studyisland.com 800.419.3191 [email protected]
© 2006 Study Island - All rights reserved.
2
3400 Carlisle St. Suite 345 Dallas, TX 75204 ~ 1.800.419.3191 ~ [email protected] Dear Administrator, Welcome! Thank you for purchasing Study Island. To ensure success in using this program, we have developed this user manual. In the pages that follow, you will find an explanation of your duties as administrator. Please keep in mind, we are here to help if you ever run into a problem or have a question. Technical support is included with your purchase, so please
feel free to call us at 800.419.3191, email us at [email protected], or click on the “Live Support” link located at the top left corner of the Admin Page. Sincerely, Study Island Support

www.studyisland.com 800.419.3191 [email protected]
© 2006 Study Island - All rights reserved.
3
Table of Contents
I. Getting Started...................................................................................................................................
a. Step 1: Choosing a Study Island Administrator........................................................................
b. Step 2: Registering Your Students and Teachers......................................................................
c. Step 3: Distribute Usernames and Passwords..………….........................................................
d. Step 4: Print the Teacher Instructions and Distribute to Teachers...……………………………….
e. Step 5 (optional): Arrange Students Into Classes……..…………………………………………….
f. Step 6 (optional): Setup Automatically E-mailed Reports ……………………..............................
g. Step 7 (optional): Hold a Teacher Information Session……..……………………………………..
h. Step 8 (optional): Distribute a Letter to the Parents…………………………………….................
II. Administration Page…………………...................................................................................................
a. Administrator Functions Menu………………..........................................................................
- Documentation………………………………………………………………………….
- Add Users………………………………………………………………………………..
- Adjusting Passing Parameters…………………………………………………………...
- Reset High Score Table………………………………………………………………….
- Printable User List……………………………………………….................................
- School Info……………………………………………………………………………….
- Alter Subjects…………………………………………………………………………….
- Restrict Student Access………………………………………….................................
- Software Add-Ons……………………………………………………………...............
- Export Stats……………………………………………………………………………… b. School Preferences Menu…………….…................................................................................
- Student Messaging ………...……………………………………………………………
- Games (On/Off)…………………………………………………………………………
- Attributes Change (On/Off)…………………………………………………………….
- Remedial Topics or Building Block Topics (On/Off)…………………………………...
- Multiplayer Games (On/Off)……………………………………………………………
- Timer (On/Off)…………………………………………………………………………..
- Block Score Improvement When Students Correct Missed Questions………………...
- Allow Teachers to Override These Settings for Students in Their Class……...............
- Allow Teachers to Adjust Passing Parameters for Students…………………………….
c. Operations Performed on Checked Users………….................................................................
- Change Users Attributes…………………………………………………………………
- Advance Users To Next Grade.…………………………………………………………
- Remove Users……………………………………………………………………………
- Clear User Stats…………………………………………………………………………
- Reset User Passwords……………………………………………………………………
III. School Stats Page……………………………………………………………………………………………….
IV. Study Island Teacher Instruction Sheet………………..….…...…............................................................
V. Parent Letters and Instructions…………………………………………………………..……………………… a. English…………………………….………................................................................................................
b. Spanish…..…………..……………………...............................................................................................
c. Send home brochure (English only)……………………………………………………………………………….
d. Certificate of Completion………………………………………………………………….………………………
e. Back to School Checklist……………………………..……………………………………………………………
4
4
4
7
7
8
8
8
8
9
9
9
9
9
9
10
10
10
10
10
10
11
11
11
11
12
12
12
12
12
12
13
13
13
13
14
14
14
15
19 19
21
23
25
26

www.studyisland.com 800.419.3191 [email protected]
© 2006 Study Island - All rights reserved.
4
Getting Started Step 1: Choosing a Study Island Administrator The first step in getting started is to designate one staff member to be the Study Island Administrator (Administrator) for your school. The general roles of the Administrator are to register the students and teachers into the program, update the roster as needed, and to handle the administrative settings on the program located on the Administration Page. There is exactly one Administrator per school building. Usually, the Administrator is a teacher or lab coordinator who is comfortable with using a computer and the Internet and who also has an interest in the school's state test performance. If there is absolutely no one who fits this description, the Administrator can also be the principal. Once the Administrator is selected, he or she should be the one who continues with these instructions. Step 2: Registering Your Students and Teachers As the Administrator, locate the Administrator username and password. This may be printed inside the front cover of this manual, or you may have received an email with this information. If you cannot locate it, please call 800-419-3191 to retrieve it. This is a special username and password that allows you to access all student and teacher records. You can change the username and password at any time. Each student and teacher will obtain a unique username and password. The Administrator is responsible for deciding how to register users for your school. You will need to choose either Option 1 or 2 below. The first option is suitable if you do not have a large number of students and teachers to register. Option 2 would be more appropriate if you are planning on registering a large amount of users. Option 1: Register Users Individually: 1. In your web browser, go to http://www.studyisland.com.
2. Locate your Admin username and password, and enter them into the corresponding fields on the left side of the Study Island homepage under “Members Login”. When finished, click on the “Login” button.
3. Upon logging in, you are taken to the Admin Page. On the Admin Page, click the “Add Users” button located at the top of the page in the “Administrator Functions” box.
4. Register each user by filling out the form and then clicking the “Add User” button. You must pick a unique username for each user. All usernames must be unique in the Study Island database so that statistics can be created for each student. If you try to register a student and you find that a particular username has already been taken, another student (possibly even from a different school) already has that username.
If you are having trouble trying to differentiate all of the usernames, perhaps you should try using an extension, such as @MHS, or @tigers. Using an extension such as your school’s name or mascot makes almost every username unique in the Study Island system.
We recommend using the same password for all students and checking the "force change of password upon login" option. This will help prevent students from logging in as other users. The students will be prompted to

www.studyisland.com 800.419.3191 [email protected]
© 2006 Study Island - All rights reserved.
5
choose their own password upon logging in. The administrator and teachers will have access to the updated information in case a student forgets his/her new password.
To complete the registration process, click on the button that says “Finished Adding Users.”
5. After you are finished registering all of the students and teachers, go to “Step 3: Completing the Registration Process” on page 8. Option 2: Register Users Via Database File: 1. Create a database file.
Rules for the database files:
The following database file types are supported:
• Microsoft Excel • Comma delimited text file
Your database file should contain the following fields which are NOT case-sensitive:
• FirstName – the first name of the user
• LastName – the last name of the user
• Grade – the grade level of the user. Must be one of the following: (K,1,2,3,4,5,6,7,8,9,10,11,12)
• Username (optional) – the username for the user. Each username must be unique, so keep this in mind if you are creating your own usernames. If you do not include this field in the database file, the Study Island system will create a default username for each student. These usernames will look like a.lastname@suffix, where “a” is the first initial of the student, and “suffix” is anything from the name of your school to your mascot. The suffix is designed to make each username unique in the Study Island database.
• Password (optional) – the password for the user. If this field is omitted, you will later have the option to choose a default password which will be applied to all users. If you wish users can pick a new password the first time they login.
• SIS primary key (optional) - if your school's Student Information System has a unique ID for each student, you can include it in the database file. This is optional but will make it easier when you upload students next year or export data from Study Island.
• Other Optional Database Fields (for reporting purposes only) – Gender, Ethnicity, Economically Disadvantaged, Title I, Migratory Student, Gifted/Talented, Special Education and LEP/ELL
Example Excel User Database File (required fields only):
FirstName LastName Grade Jeff Gordon 3 Sarah Gellar 4 Pete Sampras 4 Susie Jones 3
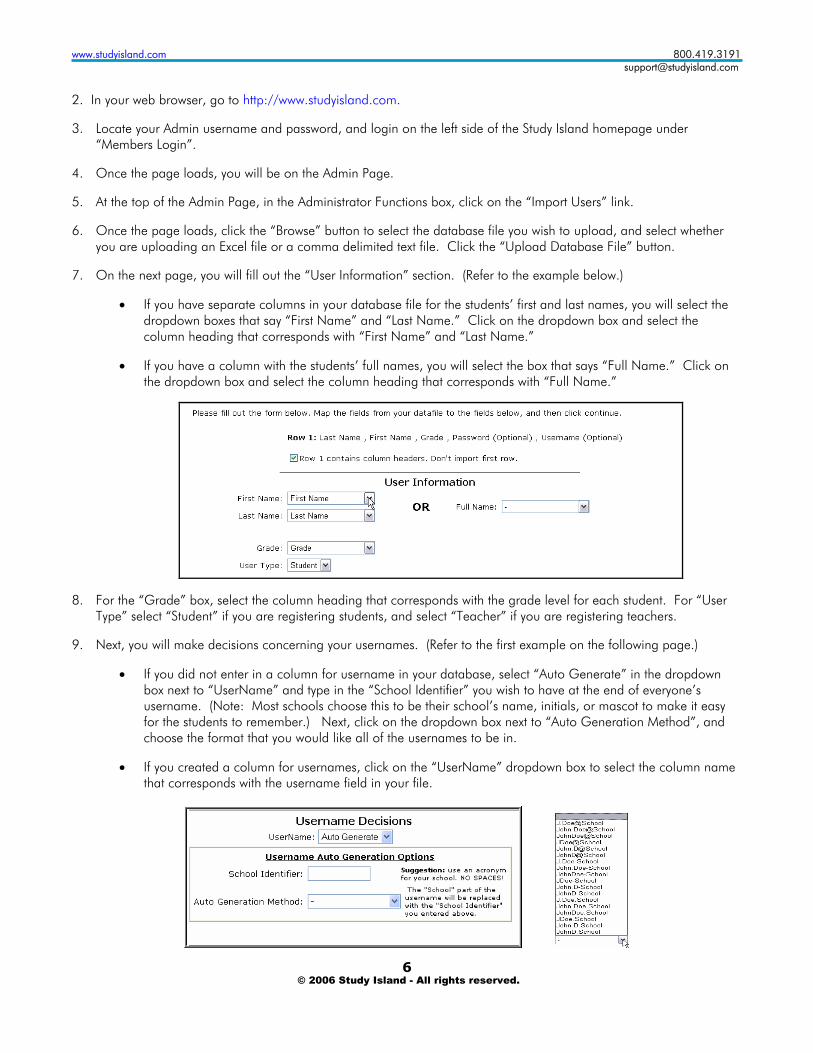
www.studyisland.com 800.419.3191 [email protected]
© 2006 Study Island - All rights reserved.
6
2. In your web browser, go to http://www.studyisland.com.
3. Locate your Admin username and password, and login on the left side of the Study Island homepage under “Members Login”.
4. Once the page loads, you will be on the Admin Page. 5. At the top of the Admin Page, in the Administrator Functions box, click on the “Import Users” link.
6. Once the page loads, click the “Browse” button to select the database file you wish to upload, and select whether
you are uploading an Excel file or a comma delimited text file. Click the “Upload Database File” button. 7. On the next page, you will fill out the “User Information” section. (Refer to the example below.)
• If you have separate columns in your database file for the students’ first and last names, you will select the
dropdown boxes that say “First Name” and “Last Name.” Click on the dropdown box and select the column heading that corresponds with “First Name” and “Last Name.”
• If you have a column with the students’ full names, you will select the box that says “Full Name.” Click on
the dropdown box and select the column heading that corresponds with “Full Name.”
8. For the “Grade” box, select the column heading that corresponds with the grade level for each student. For “User Type” select “Student” if you are registering students, and select “Teacher” if you are registering teachers.
9. Next, you will make decisions concerning your usernames. (Refer to the first example on the following page.)
• If you did not enter in a column for username in your database, select “Auto Generate” in the dropdown box next to “UserName” and type in the “School Identifier” you wish to have at the end of everyone’s username. (Note: Most schools choose this to be their school’s name, initials, or mascot to make it easy for the students to remember.) Next, click on the dropdown box next to “Auto Generation Method”, and choose the format that you would like all of the usernames to be in.
• If you created a column for usernames, click on the “UserName” dropdown box to select the column name
that corresponds with the username field in your file.

www.studyisland.com 800.419.3191 [email protected]
© 2006 Study Island - All rights reserved.
7
10. Next, you will determine the passwords for the students. (Refer to the example below.)
• If you have a column for passwords, click on the dropdown box next to “Password,” and select the column
heading that corresponds with the passwords in your file.
• If you did not create a password for your students in the database file, type in a generic password in the box next to “Default Password.” This generic password will be assigned to all students.
We recommend using the same password for all students and checking the "force change of password upon login" option. This will help prevent students from logging in as other users. The students will be prompted to choose their own password upon logging in. The administrator and teachers will have access to the updated information in case a student forgets his/her new password.
• When you are finished with this page, click the “Continue” button.
10. The next page will ask you to map any optional fields included in your file, such as the SIS primary key, gender, etc. If you did not include any optional fields in your file, just click the “Next” link to continue.
11. Next you will see a preliminary list of the usernames and passwords. This page is for your review and correction if
needed. The students are NOT registered yet. In order to complete the registration process, click “Register Users” at the top of the page.
*If you need help creating or uploading a file, e-mail the file to [email protected] and we will help you with the registration process.
Step 3: Distribute Usernames and Passwords After you are finished registering the students, you need to distribute the usernames and passwords to the teachers and students. The easiest way to do this is to print off a list of usernames and passwords by logging in as the Administrator and clicking the “Printable User List” link located in the “Administrator Functions” box. You can print this list directly from the web browser and distribute it to teachers and even leave a copy of the list in the computer lab.
Step 4: Print the Teacher Instructions and Distribute to Teachers Locate the Study Island Teacher Instruction Sheet on page 15 of this manual. Make copies of these sheets and distribute them to the teachers who will be using Study Island. If teachers need to print off a copy themselves, they can do so online by logging into the program and clicking on the “Help” link located in the top right corner of the screen.

www.studyisland.com 800.419.3191 [email protected]
© 2006 Study Island - All rights reserved.
8
Step 5 (optional): Arrange Students into Classes Teachers have the ability to setup their own classes; however, the administrator can save them time by setting up their classes for them. See the “Creating Classes” section of the Reference Manual for detailed instructions.
Step 6 (optional): Setup Automatically E-mailed Reports Every week a summary report of student progress is emailed out to teachers and administrators whose e-mail address is on the weekly report recipient list. It is a good idea for the administrator to make sure the proper e-mail addresses are on this list. To view this list, login to Study Island and click the “School Stats” link. Once on the “School Stats” page, click the “Emailed Report Manager” button at the top to edit the weekly report recipient list. On the “School Stats” page, detailed reports of student progress can be generated. At the top of each report there is a button that says “Automatically Email Report.” By clicking this button, teachers can register to periodically receive the report via e-mail. Even though teachers can do this themselves, the Administrator may want to generate reports for teachers and sign them up to receive the reports via e-mail. Some schools even generate individual student reports, and then add the parent’s e-mail in so the parent receives the report via e-mail periodically.
Step 7 (optional): Hold a Teacher Information Session Many Study Island Administrators like to conduct an information session with the teachers to explain how to use Study Island and to answer any questions teachers may have concerning how to use the program. It is a good idea to read through the reference manual as well as login to Study Island and experiment as a teacher and student before the information session.
Step 8 (optional): Distribute a Letter to the Parents If you would like to distribute a letter to parents, there is a sample letter included on pages 19 and 21of this manual, just before the reference section. There is also a take-home brochure.

www.studyisland.com 800.419.3191 [email protected]
© 2006 Study Island - All rights reserved.
9
Administration Page
Below you will find snapshots of the various menus on the “Admin Page” followed by an explanation of the different functions and settings. To access this page, you will need to login with the username and password you were given. Remember, you are the only one who will have access to this page and these features, so you may want to familiarize yourself with these items.
Documentation
This is a digital copy of this “Administrator Handbook” and the “Reference Manual.”
Add Users
This function allows the Administrator to add students and teachers throughout the school year. Please see the preceding “Getting Started” section for complete instructions.
Adjust Passing Parameters
In order to complete the program, students must “pass” each topic within a section (for example: Rounding Numbers within the 4th grade math section). To pass a topic, a student must achieve a specified percentage correct while having attempted a minimum number of questions. The “Adjust Passing Parameters” feature enables you to adjust the percentage that a student needs in order pass the topics. You can adjust the passing parameters for a student based on the student’s proficiency level and your expectations for that student. Adjusting the passing parameters does not affect the difficulty level of the questions; it only affects how well a student has to do to pass a topic.
Passing parameters also include a “start date” which you can adjust. A situation may arise where one of your students is performing poorly, and you want them to start over. This feature allows you to do so without erasing all of his/her previous scores simply by adjusting his/her start date. The reports only include statistics from sessions performed after the start date.
Reset High Scores
This feature allows you to reset the high score tables for the games. Resetting only affects your school’s high score tables. It will not adjust the overall Study Island high scores.
Printable User List
You will be able to print a roster of your students’ usernames and passwords using this link. It is recommended that you print a user list for each classroom, so the teacher may have a list of all the students’ passwords. You can do this by clicking on “View by Class” at the top of the Printable Worksheet window. (If the students are required to change their password upon login, you should reprint the user list after a couple of weeks have passed to get the students’ updated passwords.)

www.studyisland.com 800.419.3191 [email protected]
© 2006 Study Island - All rights reserved.
10
School Info This feature allows you to change the school contact information. Please update this page if there is a change in staff or e-mail address, as this is the main contact information for your school. As stated at the top of the webpage, your information will not be distributed or sold to an outside party.
Alter Subjects
This feature gives you the option of rearranging or removing topics from a particular subject. When you alter a subject, for example 3rd grade math, the changes go into effect for all users within your school.
Restrict Access
This feature allows you to restrict student access to a certain grade. For example, you can restrict 7th graders to only have access to the 7th grade material.
Software Add-Ons
This link contains a list of software add-ons that some of our customers are using to add to the functionality of Study Island. Study Island provides this list as a service to its customers. Study Island is not affiliated with these products and does not offer support for theses products. Please contact the specific software manufacturer for support.
Import Users
This link allows you to register students via an Excel or comma delimited text file. For detailed instructions, refer to the beginning of this handbook under the section titled “Getting Started (Step 2, Option 2)”.
Export Users
This link allows you to export user data (first name, last name, grade, username, password, etc) into an Excel file.
Export Stats
This feature allows you to export all student activity from Study Island. This is useful to those who wish to archive data between school years, build their own reporting engine, and/or load the data into a different system for reporting purposes.

www.studyisland.com 800.419.3191 [email protected]
© 2006 Study Island - All rights reserved.
11
School Preferences Menu The following features under the Global Settings box affect all Study Island students registered under your school’s account.
Student Messaging
Study Island offers a messaging center where users can message the administrator, teachers, and students. This message feature is helpful in assigning homework or simply allowing the student to ask a question without being embarrassed. When the option is turned “Off (except teachers)”, students will only be able to message the teachers and administrator. When the feature is turned to “Off (everyone)”, students will not be able to send messages to anyone, including teachers and the administrator. In both of these cases where the setting is “Off”, they are able to attempt sending a message to other students; however, they will be notified that their message was blocked. The “Off during school hours” option will automatically turn off the messaging between the hours of 8am and 4pm local time.
• Profanity Check
When profanity is detected in a student’s message, the message will be forwarded to the principal and administrator. The message will be blocked and will not be sent through to its recipient.
Games (On/Off)
Study Island enables students to learn using a standard multiple-choice format or an interactive game format. The games currently offered are: Splat, Snake, Space, Bouncing, Maze, Chase, Cannon, Skateboard, and Egg Hunt. You have the option to turn off this function completely or to disable it during school hours only. You can also select to allow access to the games only if the students achieve a certain cumulative score for a subject. For example, a student would only be able to access the games if their overall math score was at least 70%. Please note: Playing the games WILL affect the students’ scores just as if they were taking a regular test session.
Attributes Change (On/Off)
This setting allows the students to change their attributes, such as username, password, user type, and school name. Here, you are able to choose whether the students will be allowed to change all of their information, none of the information, or their password only.

www.studyisland.com 800.419.3191 [email protected]
© 2006 Study Island - All rights reserved.
12
Remedial Topics or Building Block Topics (On/Off)
This feature allows you to turn the remedial or Build Block topics off and on. For more information on remedial topics, see the remedial topics section of the Reference Manual.
Multiplayer Games (On/Off)
When the games are turned on the students will have the option to play multiplayer games. When they do this, the scores will be applied to the user that is logged in. This feature allows you to enable the statistics, disable the statistics, and turn the multiplayer games off.
Timer Visible (On/Off)
This feature allows you to turn on and off the timer that is displayed while the students are taking a test or game session.
Block Score Improvement When Students Correct Missed Questions
As the students work through a session, their scores are recorded. When they have completed a session, they are able to go back through and redo the questions they have missed.
Checked – When a student successfully retakes the missed question, their score will NOT improve.
Unchecked – When a student successfully retakes the missed question, their score WILL improve.
Some teachers prefer not to allow score improvement in order to see the actual score the first time the student answers the questions.
Allow Teachers to Override These Settings for Students in Their Class
When this box is checked your teachers will be able to override the school's game setting, timer setting, and remedial setting.
Teachers can do so on the "Class Properties" page (located in the “Class Manager” section from the main menu) for their classes. If a student is in more than one class which has overridden the school preferences, the student's preferences will be set to the preferences for the class whose title is first alphabetically.
Teachers may use this to create different preferences for sub sets of students in their class by creating additional smaller
classes and ordering the class titles alphabetically.
Allow Teachers to Adjust Passing Parameters for Students
When this box is checked your teachers will be able to adjust the passing parameters for their students on their Class Manager page. They will log in and be defaulted to the “School Stats” page. They’ll then click on the “Adjust Passing Parameters” at the top of the screen to access the page where they can make the specific changes. For detailed instruction on how to change the passing parameters, refer to the “Administration Page” section in this handbook. You can also click on the “Help” link in the top right corner of the screen after logging into Study Island.

www.studyisland.com 800.419.3191 [email protected]
© 2006 Study Island - All rights reserved.
13
Operations Performed on Checked Users
On the Admin Page once you select a grade in the “Show Users In Grade Level” drop-down menu at the bottom, a menu like the one below will appear.
The following functions are performed by checking the boxes beside the registered users you wish to affect (as shown above), and then clicking the button of the function you wish to perform. Multiple boxes may be checked at one time.
Previous Grade
This button allows you to send a student back a grade if the student is registered under the wrong grade or if sent back a grade.
Change School
If a student is transferring to another school with Study Island, this button will allow you to transfer all of his/her scores to the new school.
Advance Grade
At the end of the school year, you are able to advance your students to the next grade by simply checking the boxes beside their names and clicking the “Advance Grade” button.
Remove Users
This allows you to remove users. Once removed, they will appear under the “Removed Users” section. Here, you will be able to re-register the students or completely delete the users from the system. This ensures no accidental deletions.

www.studyisland.com 800.419.3191 [email protected]
© 2006 Study Island - All rights reserved.
14
Clear Stats
Here you are able to remove the statistics for one or multiple students. This function deletes all of the user’s statistics.
Reset Passwords
This will reset the passwords to multiple students at one time. Similar to when you first register the students, you will be prompted to give a password and given the option to force password reset upon login. This feature is most useful when a group of students have forgotten their passwords.
Teachers – Trusted vs. Not Trusted
Administrators can choose whether or not to allow your teachers to view the school stats and student passwords. When registered the teachers are automatically registered as a “Trusted” user. This WILL enable them to view the reports. In order to change their status to “Not Trusted,” simply check the box beside their name and click the “Mark Checked Users as Not Trusted” button.
Registered Users – Password and Edit Attributes
Each registered user will have two links next to their name on the “Admin Page”: Password and Edit Attributes. “Password” will enable the Administrator to view the user’s password by simply rolling over the word or by clicking on the link. The “Edit Attributes” function allows you to update the user information such as username, password, grade level, and user type.
School Stats Page
The “School Stats” page is used to generate reports on student progress. You can access this page through the “School Stats” link on the left side of the screen once you are logged into Study Island. The Administrator, principal and teachers all have access to this page. Students do not have access to this page. Here, the teachers are able to run reports on their students and also view a copy of the ‘Printable User List’. (See the reference section for a description of the various reports.)
www.studyisland.com 800.419.3191 [email protected]
© 2006 Study Island - All rights reserved.
15
Study Island Teacher Instructions
Dear Teacher,
Welcome! Your school has recently purchased Study Island, our online assessment preparation program. To assure your success in using this program, we have included the basics to help you get started. Also, keep in mind, if you get stuck you can reach us at 800.419.3191, [email protected], or you can click on the “Live Support” link in the top left of your screen while logged into the program.
Enjoy! Study Island Support
How Study Island Works: • Every student and teacher has their own username and password. • The program is divided into sections based on subject (math, reading, etc.). • Each section is made up of approximately 30 topics, and each topic corresponds to a
standard (or multiple, related standards) from your state curriculum. • Topics consist of a lesson and a bank of practice questions with explanations. • It is helpful to view the lesson before answering the questions in the topic.
Goal of the Program:
The goal of the program is to “pass” every topic (denoted by ). If a student passes every topic, he or she has demonstrated proficiency in all areas tested and is very well prepared for the state test.
How to Get Started – For Students:
By the time you receive these instructions, your students should already have their usernames and passwords. (If not, contact the Study Island Administrator at your school.) Teachers, feel free to practice for yourself, your grades will not be counted towards the school statistics.
1. Go to www.studyisland.com in your web-browser.
2. Enter your username and password under the “Members Login Here:” section located on the left side of the screen.
3. Click on the subject tab that you wish to work on.
4. Click on the word “Pretest” to begin if there is a pretest available. If there is no pretest for the subject, skip this and go to the next step.
You will need to complete at least 10 questions in the pretest in order to move on to the remainder of the section.
5. After completing the pretest, you are ready to move on to the topics within the section. For a multiple-topic test, check the box beside each topic and click “Start Studying.”

www.studyisland.com 800.419.3191 [email protected]
© 2006 Study Island - All rights reserved.
16
6. You will receive a blue ribbon next to the topics you have passed and a red triangle next to the topics in which you need work.
In order to receive a blue ribbon, you will need to pass that topic. The passing requirements can be viewed on the main page under the column “Passing Goal.” The “Your Results” column shows the score you currently have. Both columns show the number of questions or “items” you have taken in each topic and the corresponding “score.”
You will receive this symbol next to a topic that you need additional help in. In some cases, you will be given access to a remedial topic. You may want to move on to the next topic, and try again at a later time.
Note: Ribbons are awarded based on a student’s cumulative score for the topic. For example, if a student does multiple sessions in the same topic, his cumulative score is calculated as follows: Session 1: 5 correct out of 10 attempted Session 2: 3 correct out of 5 attempted Session 3: 4 correct out of 5 attempted
Cumulative Score = 12 out of 20 = 60%
**Unanswered questions in a topic are disregarded. Students can end a session at any time by clicking DONE without a negative affect to their scores. They can return to that topic to complete the session, picking up where they left off. Each time a Blue Ribbon is earned, students can simply click on the ribbon to print it.
7. After all topics have been passed, you can move to the “Post Test.” Once this is complete, you will have passed the subject. You can go back at anytime and retake any areas you had difficulty with.
Features You Need To Know About:
Grouping Students Into Classes – Study Island enables the teachers to group their students into a specific class.
• Why would you want to do this? It makes viewing student progress easier It allows teachers to see class averages It allows teachers to send messages to all students in their class It allows teachers to make class pages and class assignments
• How do you group students into classes? Login under your teacher username, and click on “Class Manager” in the
upper-left of the screen Type the name of the class in the “Class Title” box, and click “Next” Click on the dropdown box next to “Add Users In Grade Level:” and select the
grade level of the students you wish to add Check-off the students you wish to add to the class Scroll to the top of the screen and click “Save and Exit”
Note: Classes are simply groupings. A student can be in more than one class and, you can create as many classes as you want. Student Statistics – When logged in as a teacher, you will immediately be defaulted to the “School Stats” page. On this page you can generate a variety of reports on student progress. You can view reports on the progress of your students in each topic by individual or class. Bar graphs can also be

www.studyisland.com 800.419.3191 [email protected]
© 2006 Study Island - All rights reserved.
17
generated to show student progress compared to the school and state averages. (Additional information on each Study Island report is found in the Study Island Reference Manual which is available online under the “Help” section.)
Study Modes – There are three different modes for your study session. To access them, you will select the topic you want to study by checking the box next to the topic then clicking on Start Studying or by scrolling over and clicking on the topic link. On the next page, you will select the number of questions you’d like to take, and in the top right corner, click on the dropdown box next to “Session Type” You will see the following modes:
• Test Mode – Standard multiple choice or short answer format. (By default, questions are in this mode. The number of questions will automatically default to the minimum number required to meet the passing parameter for that topic.) If you want this number changed, instruct your students to change it when they begin their work.
• Game Mode – There are many different games that your students can play. These games pull questions from the same item bank as the other modes. The difficulty level does not pertain to the questions but rather to the level at which it is played.
Remember: You have the option to control when your students access game mode. Some teachers use this as a reward for reaching a certain percentage, at the end-of-the-week after topics have been reviewed, or for home usage only
• Printable Worksheet – You can choose one or multiple topics by putting a check mark next to the topics you want to include on your worksheet. These can be used for homework, make-up work, tutorials, tests, reviews, transparencies, substitute plans, etc. The answers are at the bottom of the teacher copy. Students can print worksheets, but answers are not included!
Class Pages & Assignments – Teachers have the option of creating custom “Class Pages” which can include class assignments, the class schedule, class notes, and class links. Class assignments allow teachers to assign specific Study Island topics to students on specific dates. A custom “Class Page” is created from the “Class Manager,” which can be accessed by clicking the “Class Manager” link on the left side of the screen. (Complete instructions on Class Pages and Class Assignments can be found in the Study Island Reference Manual which is available online under the “Help” section.)
Messaging - Study Island messaging enables students and teachers to communicate with each other. Sending and receiving of Study Island messages can be done from the "Message Center,” which is accessible by clicking the "Message Center" link on the left side of the page once you are logged into the program. Once inside the "Message Center" you have the ability to read messages and send messages to individual users or user groups, or "classes." Throughout the program there are envelope icons next to other usernames that can be clicked if you desire to send them a Study Island message.
Printable User List - On the School Stats Page you have the ability to print a user list with usernames and passwords. You can view the entire school roster or by class. This is an easy way to look up a student’s password if they forget.

www.studyisland.com 800.419.3191 [email protected]
© 2006 Study Island - All rights reserved.
18
Working Study Island into Your Class Activities:
The following will give you some ideas of how to use Study Island. Keep in mind, the more time your students spend on Study Island, the better prepared they will be to succeed on your state test.
Class Time – You may want to allow the students class time to use Study Island. This allows you the most control and supervision. If there are not enough computers for each student, try assigning groups to rotate using the program.
Homework – Since Study Island can be accessed from any computer with an Internet connection, some teachers chose to make Study Island homework. Below are two suggestions for homework assignments:
• Assign a number of individual topics per week • Set a date for the entire subject or the whole program to be completed
Extra Credit – Offer additional points for students completing a section in the program
Review previous material - At the beginning of the year, allow your grade-level students to use the prior year’s topics as a review if it is available with your subscription.
Class Lessons - If your classroom has a projection device, Study Island can be used as a whole class lesson by connecting the projector to a computer and projecting the Study Island website.
Review Problem Areas - After students have completed various topics, use the reports to find the low-scoring areas per student or per class. Use Study Island to review as a whole group, one-on-one, or small group.
Printable Worksheet -Use the Printable Worksheet mode to create a transparency, test, review, tutorial, or substitute lesson plan. You can also make games by printing the worksheet and cutting the questions into strips.
Tutorials - Study Island provides great tutorial material. Students can utilize the program before or after school. If your subscription allows, it can be a major part of summer school or suggested to parents for a means to review over the summer.
Here are some fun ideas from a few of our schools:
King’s Court – The students with the highest scores are awarded the titles of King, Queen, Prince, Princess, Duke, and Duchess, with the King and Queen having the highest scores. These particular students are given special privileges throughout their reign. (The length of the “reign” is up to you.)
High Score Bulletin Board, Internal TV Broadcasts, and PA Announcements – Study Island highest scorers of the week are posted or announced.
Study Island Reminder Message – “Remember to Logon to Study Island” is posted on a bulletin board or a highly visible place.
Island Party – Students are awarded leis after passing all of the topics, and the class is awarded an Island Party after all students have completed the program.
Certificate of Completion – There is an example of a certificate at the back of this manual that signifies completion of the program. You can also access a certificate by clicking on the blue ribbon icon ( ) to the left of the topic while logged into a student’s account.

www.studyisland.com 800.419.3191 [email protected]
© 2006 Study Island - All rights reserved.
19
Parent Letter The letter below is an example of one that you can send home to the parents of your students to introduce Study Island. We suggest sending the letter below as well as instructions for use which are located on the next page. Note: There is a Spanish version of the Parent Letter and instructions on getting started at home on pages 20 and 21. Dear Parent, Our school now has access to a great resource for preparing our kids for the state standardized tests. We have purchased a building license for a web-based program called Study Island, which is accessible to students from school or home. If you have Internet access, your child can access Study Island from home as well as school to prepare for the state assessments. The enclosed sheet provides an overview of the program. We are excited about the potential benefits this program can bring to our students, and we encourage you to take advantage of this opportunity by using Study Island. Please feel free to contact Study Island at 800-419-3191 or [email protected] if you have any questions. Sincerely, Principal

www.studyisland.com 800.419.3191 [email protected]
© 2006 Study Island - All rights reserved.
20
Using Study Island from Home
Since the Study Island state assessment program is completely web-based, students can access it from any computer with
an Internet connection and a standard web browser (Internet Explorer or Netscape). Results from students study sessions
are recorded and made available to the teachers. This includes results from sessions completed at home.
The program is divided into sections based on subject (math, reading, etc.). Each section is contains approximately 25 to
30 topics. Each topic contains a bank of questions with explanations. All topics are accompanied by a lesson, which
includes some brief information about the material covered by the questions in the topics. It is helpful to view the lesson
before answering the questions in the topic.
Follow the instructions below, in order to use the program:
1. Go to www.studyisland.com
2. Enter your username and password at the upper-left of the screen, and click “Login”.
Note: Students will receive a username and password from their teacher at school.
3. Click on the section tab (math, reading, etc.) that you wish to work on.
4. Click the "Pretest" in order to begin the pretest for the section. You must complete 10 pretest questions before moving on to the topic in the section.
5. Once you complete the "Pretest,” you may work through the remainder of the topics in any order you like. You must "pass" all topics before taking the "Post Test".
6. To pass a topic, you must satisfy the topic’s passing requirements which are based a minimum number of questions answered (usually 10) and a minimum percentage correct (around 70%). A blue ribbon icon is displayed next to all passed topics.
7. Once you have passed all the topics in the section, you have to pass the "Post Test" for the section before the section is complete. Ignore this step if the section has no "Post Test".
8. When you pass all topics in all sections, you have completed the program and will be well prepared to take the state test.
To access the Reports:
1. After your child has logged in, select a subject from the left-hand side of the screen to access the reports. (See the screen shot below.)
2. Here, you will find a variety of reports with information such as how much time your child has spent on various subjects, how they used their time, and what questions they missed. You will also be able to compare your child with other children in their class and in their state that are using Study Island. You can select reports by Subject or select the Summary option to get all subjects.

www.studyisland.com 800.419.3191 [email protected]
© 2006 Study Island - All rights reserved.
21
Estimados padres: Nuestra escuela ahora tiene acceso a un recurso magnífico para ayudar a su hijo/a a aprender las normas academicas que se están comprobados en un examen estandardizado. Hemos comprado una licencia de edificio para un programa basado en el Internet que se llama la Isla de Estudio (Study Island). Este programa es accesible a los estudiantes en la escuela o en casa. Si Usted tiene acceso al Internet en casa, su hijo/a puede conseguir acceso a nuestro programa para continuar su progreso academico. La hoja adjunta provee una vista general del programa. Estamos emocionados acerca de los beneficios potenciales que este programa puede traer a nuestros estudiantes, y nosotros les animamos a Uds. como padres a aprovechar de la oportunidad de usar la Isla del Estudio. Por favor, comunique con nosotros por telefono al 800-419-3191 o por correo electronico en [email protected] si Ud. tiene cualquier pregunta. Atentamente, El director

www.studyisland.com 800.419.3191 [email protected]
© 2006 Study Island - All rights reserved.
22
Usando Study Island en casa
Como que el programa de preparación del examen estandardizado está basado en el Internet, Study Island es accessible en cualquier computadora que tiene acceso al Internet (usando Internet Explorer o Netscape). Los resultos de las prácticas de estudiar están marcadas y están disponibles para los maestros. Se incluyen los resultos de las prácticas hechas en casa.
El programa está dividido en secciones de sujeto (las matematicas, la lectura, etc.). Cada sección tiene entre 10-25 grupos de preguntas, que contienen más o menos 10-15 preguntas para cada grupo. Muchos grupos de preguntas están acompañados con una lección, que incluye un poco de información sobre lo que va a estudiar el estudiante. Es buena idea a ver la lección antes de contester las preguntas en el grupo de preguntas.
Sigue las instrucciones abajo para usar el programa:
1. Ven al sitio del Internet www.studyisland.com
2. Pon su “username” y “password” en la izquierda superior y haz clic en “Login” *Noticia: Su hijo/a recibirá “username” y “password” de su maestro/a.
3. Haz clic en la sección en que su hijo/a tiene que estudiar, la lectura o las mátematicas (Reading, Math).
4. Haz clic en “Pretest” si es la primera vez que su hijo/a está usando el programa. Usualmente, el/la maestro/a dirá a su hijo/a lo que tiene que hacer en el programa. El estudiante no puede pasar a los otros grupos de preguntas hasta que ha hecho al menos que 10 preguntas en el “Pretest”.
5. Ya que terminó el “Pretest”, el estudiante puede trabajar con el resto de los grupos de preguntas, en cualquier orden. El estudiante debe pasar todos los grupos de preguntas antes de tomar el “Post Test”. Preguntele al maestro si Ud. no está seguro lo que debe hacer su hijo/a.
* Para pasar un grupo de preguntas, el estudiante tiene que aprovechar el mínimo de pasar. Los mínimos de pasar están basados en un numero mínimo de preguntas contestados (usualmente 10) y en un mínimo porcentaje corecto (aproximadamente 70%). Un dibujito de un premio azul aparece al lado de los grupos de preguntas que el estudiante ha pasado.
6. Ya que el estudiante ha pasado todos los grupos de preguntas en la sección, el/ella tiene que pasar el “Post Test” para la sección antes de la sección este completa. Si la sección NO tiene un “Post Test” significa que no es necesario.
7. Cuando el estudiante ha pasado todos los grupos de preguntas en todas las secciones, el/ella ha terminado/a el programa de Study Island. ¡Ya su estudiante está listo para el examen estandardizado!
Para acceso a los informes de progreso:
1. Despues de que su hijo/a ha entrado al sistema con su identificación de usuario, elege en sujeto al lado izquierdo de la pantalla para ver a los informes.
2. Aqui Ud. encontrará a una variedad de informes de progreso con información como cuanto tiempo ha pasado su hijo/a en cualquier sujeto, como se usa el tiempo, y las preguntas que se han equivocados. Tambien Ud. podra comparar el progreso de su hijo/a con otros estudiantes en su clase y en el estado de California. Usted puede elegir informes de progreso de un sujeto, o en la forma de resumen para ver todos los sujetos.

Phone: 800.419.3191 Fax: 877.592.1357
Email: support@
studyisland.com
Study Island 3400 C
arlisle St. Suite 345
Dallas, TX 75204
FAST FACTS
Study Island is an all online product designed to help your child m
aster the standards specific to their grade in your state. Study Island’s focus on
the standards enables students to im
prove their performance in all skill
areas tested on your state test, which
leads to improved test scores.
• Every student and teacher has their ow
n username and passw
ord.
• The program
is divided into sections
based on subject.
• Each section is m
ade up of topics,
each of
which
corresponds to
a
specific state standard.
• Each
topic contains
lessons, practice questions and explanations.
• M
ost topics are accompanied by a
lesson, w
hich includes
some
brief
information
about the
material
covered by
the questions
in the
topic.
• It is helpful for the student to view
the lesson
before beginning
the
topic.

Did
you know
you
can access
Study Island
from
any com
puter
with an Internet connection and a
standard web brow
ser?
GETTIN
G STARTED
• After signing in on Study Island’s hom
e page,
click on the subject tab that you wish to w
ork on.
• C
lick “Pretest” in order to begin the pretest for
your section. You must com
plete 10 pretest
questions before moving on to other topics
• O
nce you complete the Pretest you m
ay work
though the remainder of the topics in any order
you like - as directed by your teacher. You must
pass all topics before taking the Post Test.
• To pass a topic, you m
ust satisfy the topic’s
passing requirem
ents w
hich are
based on
a
minim
um num
ber of questions answered and a
minim
um percentage correct. A blue ribbon is
displayed next to all passed topics.
• O
nce you
have passed
all the
topics in
the
subject, you
have to
pass the
Post Test
for subject. Ignore this step if the subject has no Post
Test.
• O
nce you pass all topics in all sections, you
have completed the program
.
• Study Island records all student activity and
makes this inform
ation available in the form
of reports. There reports can be accessed
by clicking one of the report links located in
the menu bar on the left hand side of the
screen.
• There
Is a
Gam
e M
ode that
may
be
accessed in Session Options. The default
setting is
Test M
ode. The
Study Island
Administrator
is able
to enable,
disable,
and enable the games only
during non-
school hours.
This
feature m
ay not
be
available to your child.
• In
Session O
ption you
can also
worksheets for extra practice.
• A
warning
symbol
icon beside
a topic
means the student had problem
s mastering
this section and needs additional help.
• A
dropdown
arrow
icon under
a topic
means the student had problem
s and there
is a remedial lesson available.
• All
words
and num
bers in
blue are
hyperlinks to other information.
I’VE SIGN
ED IN
, NO
W W
HAT?
EXTRA! EXTRA!
STUD
Y ISLAND
’S WEB
ADD
RESS IS
WW
W.STU
DYISLAN
D.C
OM
MY LO
GIN
NAM
E IS
MY PASSW
ORD
IS

This certifies that
has successfully m
astered all levels of
Study Island - 2006-2007.
__________________ ___________________ Teacher
Principal

�������������������������������������������������������� ���������� ��������������� ���������� ��������������� ���������� ��������������� ���������� �������������������������������������������
�������������������������� �������������������������������� �������������������������������� �������������������������������� ����������
�� ������������� ���������������� �������������� � �������� ��� ���!���������"���������#������������� �����������$���������%�&��'� �������������������������� ����������(����� �������� ������������������������
� )���������������������*��)���������������������*��)���������������������*��)���������������������*���������������������������������������������+������+������+������+���������������������������������� ������������������ ������������������ ������������������ �������
�� � �������� ��� ���!�������"�������#�������������,��%�&��������������%����� ����
������������������%������������������ ����������#����� -�������,��������,��������� �������������������������������.���,�������������
�������������%�&�����������������*�� ���/����� ���������������%�&�����&����������� ��� ���,��������� �*������� ���,��������� �*�������������������*�!���������"������#������������������������������*�����
'� �����������������������%�������������"0�� �*�������#!�������������� ��%�*������������ ���������
1� -�������,����������������2 �������������������������!�������"0�� �*��������#�������������,��%�&�������%����� ���������������
3� 2 �����������������!���������")�������0�� �*��������#�%�������%�*�������� �*���������������
� ��*�������*�������*�������*������������������������������������������������4 �������������4 �������������4 �������������4 �������*��*��*��*�����
�� � �������� ��� ���!�������"�������#�������������,��%�&��������������%����� ����
������������������%������������������ ����������#����� 2 �����������������!����������������������,�� ���,��������*���������������&��
�������*�����������"������#�%�������%�*����������������������������������������������*���
'� ��������"��*�����4 ����#����������%�&������� ��"� �������������,����� ������ ���� ���������������#��-���,������� ����� �� �*����������������������������*���
� ����������������5�,�����������5�,�����������5�,�����������5�,������������������� ������������ ������������ ������������ ���� ������������
$��������������������,����������!���������������������� ����������(��6���%��� ����������(��6���%��� ����������(��6���%��� ����������(��6���%�����������������������������������������������6�����������
� 7����������7����������7����������7����������������������8 �������������������8 �������������������8 �������������������8 ������� ����������������
�� ������������� ������!�������������"�����8 ������#�����������������������������������.��������(���&��������������,��%���������
�� � ����������!���� �*�������� ���(���������������������,���������
� )�)�)�)�����%����������� �������%����������� �������%����������� �������%����������� ���9999� ���,�����������-������� ���,�����������-������� ���,�����������-������� ���,�����������-����������
�� 4 ������������ ���������� ����������� ��������" �����%�����������#������������� �����������$���������%�&��'� ���������������� �����������,�����,����������� ��������������������������%���������
���������������������
���� ��������-������ ��������-������ ��������-������ ��������-�����������������������)�����%�������-�����������������)�����%�������-�����������������)�����%�������-�����������������)�����%�������-�������������������������
�� �������������� �������-�������������������������%������������� ����������(��� ��������� 8 �����������������������������������%������� ���������������,��,��%��������
���� ��������

Study Island Reference
2006-2007

www.studyisland.com 800.419.3191 [email protected]
1 © 2006 Study Island - All rights reserved.
Reference Table of Contents
Study Island Program................................................................................................
Working Through the Program………………….…......................................................
Study Modes……...…...…………………....................................................................
Test Mode…..………………………………….….........................................................
Space Game…………………….................................................................................
Bouncing Game……………..……..............................................................................
Splat Game………………………..………………………………………………………….
Egg Hunt Game……………………...……………………………………………..............
Maze Game…………………………………………………………………………………..
Snake Game………………………………………………………………………………….
Chase Game………………………………………………………………………………….
Cannon Game………………………………………………………………………………..
Printable Worksheet View…………………………………………………………………….
Class Manager……………………………………………………………………………….
Creating Classes……………………………………………………………………………...
Creating a Class Page………………………………………………………………………..
Creating Class Assignments………………………………………………………………….
School Stats Page…………...……………………………..….…...….............................
Emailed Report Manager………..………….................................................................
Printable User List…………………………...….............................................................
Adjust Passing Parameters……...…….…….................................................................
Gradebook Report.……..………………......................................................................
Blue Ribbon Report.………..………………..................................................................
Individual Student Report..…..……………...................................................................
Class Summary Report………………..…………………….............................................
Trend Report………………………...………….............................................................
Weekly Report…..…………………...…………............................................................
Additional Features and Information…...…………………………………………………..
My High Scores…………………………..…………………………………………………...
Study Island Message Center…….….………...…….....................................................
Remedial Topics (Building Block Topics)...............…………………………………………
Creating Custom Topics (Custom Tests)…………………………………………………….
Browser Capability/Compatibility…….…….................................................................
Game Debugger……………………………………………………………………………...
Frequently Asked Questions………………………………………………………...............
2
2
3
3
3
4
4
4
4
4
4
4
4
5
5
5
7
8
8
8
8
8
9
9
9
9
9
10
10
10
10
10
11
12
12

www.studyisland.com 800.419.3191 [email protected]
2 © 2006 Study Island - All rights reserved.
Study Island Program
Study Island is an instructional and diagnostic tool that enables teachers to help students master the state standards and prepare for their state tests.
The more time students spend using the Study Island program, the better they will understand the material for their respective grade level. Students can access Study Island from any computer that is connected to the Internet.
Working Through the Program
The program is divided into sections based on subject (math, reading, etc.). Each section is made up of approximately 30 topics. Each topic corresponds to a standard (or multiple, related standards) from your state curriculum. Topics consist of a lesson and a bank of practice questions with explanations. It is helpful to view the lesson before answering the questions in the topic.
Goal of the Program: The goal of the program is to “pass” every topic. If a student passes every topic, he or she has demonstrated proficiency in all areas tested and is very well prepared for the state test.
Follow the instructions below, in order to complete the program: 1. Login at www.studyisland.com. 2. Click on the section tab (math, reading, etc.) that you wish to work on. 3. Click the "Pretest" in order to begin the pretest for the section. Ignore this step if the
section you selected does not have a "Pretest.”
• The student must complete at least ten pretest questions in order to go on to the topics that follow.
4. Once the student completes the "Pretest”, they may work through the remainder of the topics in any order they like. They can also select more than one topic at a time. To do this, they can just check the boxes next to the topics they wish to study, and then click on the “Start Studying” button located towards the top right of the screen. They must "pass" all topics before taking the "Post Test.”
• To pass a topic, the student must satisfy the topic's passing requirements which are based on a minimum number of questions answered (usually 10) and a minimum percentage correct (around 70%). A blue ribbon icon is displayed next to all passed topics. Your Study Island Administrator can alter the passing requirements for a student or group of students.
5. Once the student has passed all of the topics in the subject, they have to pass the "Post Test" for the subject before the section is complete. Ignore this step if the section has no "Post Test.”
6. When they have passed all topics in all sections (math, reading, etc.), they have completed the program and will be well prepared to take the state test.

www.studyisland.com 800.419.3191 [email protected]
3 © 2006 Study Island - All rights reserved.
Study Modes
When you have selected the topic(s) that you wish to study, you then must determine your mode of study. Your choice of mode does not affect the academic content you will see, just the mode in which it is presented. Please note: Playing the games WILL affect the students’ scores just as if they were taking a regular test session. You have the following three options: Test Mode, Game Mode, and Worksheet View.
Test Mode
A test mode session is in standard multiple choice or short answer format.
During the session, use the mouse to click the letter corresponding to the correct answer. If answered incorrectly, you must keep answering until you get the question correct. After clicking the correct answer, click “Explanation” to view an explanation for this question, or click "Next Question" to move to the next question.
When the session is complete, you will be shown the Session Results. You can press "Done" at the bottom of the session window at any time to end the session and be shown the Session Results. All session results will be accounted for in your statistics. Do not hit the X in the corner of the screen as data may be lost.
Game Mode
There are a number different games that your students can play. These games draw questions from the same item bank as the test mode. Java or Flash are required to play the games. These are a free download online. The difficulty level does not pertain to the questions but rather to the level at which it is played. Also, the student’s percentage correct for the session is not affected by their skill level of the game.
Below are brief explanations of our current games. Note: If you need detailed instructions on how to play a specific game, you can click on the “Instructions” link in the top left corner of the screen while in the game mode. The Cannon Game instructions are located within the game window.
Space Game
• The object of the Space Game is to shoot the space ship that has the letter corresponding to the correct answer.
• You must also defend your space ship from the "bombs" of the other ships. Having your ship hit by a "bomb" causes you to lose that ship, but does not constitute a wrong answer. You can still answer the question correctly if you have a remaining ship.
Bouncing Game
• The object of the Bouncing Game is to catch the ball that has the letter corresponding to the correct answer.
• You must avoid the balls with the letters of the wrong answers. Having your bucket hit by a ball bearing a wrong answer causes you to lose that bucket and constitutes a wrong answer.

www.studyisland.com 800.419.3191 [email protected]
4 © 2006 Study Island - All rights reserved.
Splat Game
• The object of the Splat Game is to move your lady bug across the road and touch the letter corresponding to the correct answer.
• You must avoid getting hit by one of the moving vehicles. Having your lady bug hit by a car causes you to lose that lady bug, but does not constitute a wrong answer. You can still answer the question correctly if you have a remaining lady bug.
Egg Hunt Game
• The object of the Egg Hunt Game is to retrieve the egg with the letter of the correct answer on it. You must retrieve the egg and return it to the base without being touched by the pterodactyl.
Maze Game
• The object of the Maze Game is to move your mouse through the maze and hit the correct answer.
Snake Game
• The object of the Snake Game is to move the snake to touch the letter corresponding to the correct answer.
• You must avoid hitting the walls. Having the snake hit a wall or its own tail causes you to lose that snake, but does not constitute a wrong answer. You can still answer the question correctly if you have a remaining snake.
Chase Game
• The object of the Chase Game is to drive over the letter of the correct answer without driving into any rocks.
Cannon Game
• The object of the Cannon Game is to click and drag the letter of the correct answer into the cannon. Once the letter of the correct answer is placed in the cannon the arrow keys on the keyboard are used to aim and shoot the cannonball at the bullseye.
Printable Worksheet
You can use the printouts to study when you are away from a computer. If you’d like to edit the order of the questions or add page breaks to customize your worksheets, click on the link at the top of the worksheet window titled “Open in Microsoft Word (add page breaks and/or edit questions).” You must have Microsoft Word installed on your computer to use this feature. Note: Only the printouts made by teachers and the administrator will have the answers included at the bottom.

www.studyisland.com 800.419.3191 [email protected]
5 © 2006 Study Island - All rights reserved.
Class Manager
Note: The “Class Page” and creation of classes is an optional feature and IS NOT required in order to use the Study Island program.
Creating Classes
Study Island enables the teachers to group their students into specific classes.
• Why would you want to do this?
o It makes viewing student progress easier o It allows teachers to see class averages o It allows teachers to send messages to all students in their class o It allows teachers to make a class page and class assignments
• How do you group students into classes?
o Click on “Class Manager” in the upper-left of the screen o Type the name of the class in the “Class Title” box, and click “Next” o The teacher will default to the person who is adding the class. If the teacher is
not entering the information for themselves, they will need to be changed to the owner of the class in order to view the class page
o “Preferences” allows teachers to override the choices, if this option has been chosen on the Admin page, made by their school for games, remedial topics, and the timer. The settings can be made at the assignment and class level.
o Click on the dropdown box next to “Add Users In Grade Level:” and select the grade level of the students you wish to add.
o Check-off the students you wish to add to the class o Scroll to the top or bottom of the screen and click “Save and Exit”
Creating a Class Page
Once a class is created, a “Class Page” can be made for that class (see “Creating Classes”). Only the owner of the class has the permission to make a “Class Page” for that class.

www.studyisland.com 800.419.3191 [email protected]
6 © 2006 Study Island - All rights reserved.
• From the “Class Manager” click on the link titled “Class Page and Assignments” to the right of the class name. This will only be available if the class has been assigned to a particular owner. (Hint: Use the tab at the top of the page to easily access the Class Properties page.)
This will take you to the Class Page Edit screen. (See below.)
Class pages have the following components which teachers can add. These components are all optional:
• Class Assignments – teachers can instruct students to use specific a Study Island topic • Class Schedule – teachers post class events • Class Notes – teachers post class notes • Class Links – teachers can post class links to other websites (not shown above)
In order for students in a class to be able to view a class page, the teacher has to mark the class page as “Activated.” There are three enabled options:

www.studyisland.com 800.419.3191 [email protected]
7 © 2006 Study Island - All rights reserved.
• Class Page Activated - Choosing “Yes” will allow a teacher’s students to view the class page. “No” means the class page will not appear.
• Default for Students– When the class page is the default for students, students will see the class page first when they login. If it is not the default, they will have to navigate to it by clicking the “My Class” link on the left.
• Block Other Material - When other material is blocked, students will only by able to use Study Island topics assigned on the class page(s). They won't be able to navigate to other topics by using the navigation bar on the left.
Creating Class Assignments
The “Class Assignments” feature allows teachers to assign specific topics to students. This enables teachers to direct students on the order in which they take the topics.
Instructions:
1. Class assignments are added to a “Class Page”, so the first step is to add a “Class Page” (see “Creating a Class Page”).
2. After a class page is created, click on the “Class Manager” link on the left side of the screen.
3. Find the class name you need to create the assignment for on the “Class Manager” screen, and click on the link to the far right titled “Class Page and Assignments.” If a new class needs to be created, refer to “Creating Classes”.
4. Click on the “Add Assignment” link.
5. On the next screen, select a start date and an end date for the assignment, and enter in what you’d like the title to be for the assignment.
6. Then click on “Add Topics.”
7. On the following screen, you will select which grade level and subject you’d like to draw topics from, then click on the “Next” link.
8. Check off the boxes to the left of the topics you’d like in the assignment. There must be at least one box and no more than 5 boxes checked. When finished selecting, click on “Select Checked Topics” at the bottom of the screen.
9. On the next page, click on “Update Assignment” at the bottom of the screen if everything looks correct.
10. The page after that will have the assignment you created under the “Class Assignments” section. The assignment will be grayed out. Click on the “Activate” link to the right of the assignment to make it viewable.
11. At the top of the same page, next to “Class Page Viewable”, make sure “Yes” is
selected. That way, the students will be able to see the assignment.

www.studyisland.com 800.419.3191 [email protected]
8 © 2006 Study Island - All rights reserved.
School Stats Page
The “School Stats” page can be used by the Administrator and teachers to view the progress of their students as the students work through the program. Only teachers and the Administrator have access to the “School Stats” page. Class gradebook reports listing a result for each student, as well as more general class summary reports can be viewed on this page. Also, a variety of graphs can be generated that show student activity.
Below you will find explanations of the different functions and reports found on the “School Stats” page. To access this page, you will need to login with your username and password. When you login, it will default directly to the “School Stats” page. (If you cannot view the “School Stats” page, you may need to speak with your Administrator to receive access.)
Emailed Report Manager
Every Sunday morning a summary report of your school’s usage for the last week is generated and emailed to everyone listed on this screen. Here, you will be able to alter that list by adding or removing email addresses.
On the bottom half of the screen, a list of other emailed reports will appear that are specific for the teacher logged in. Teachers will only see the reports that are emailed to them, and will not be able to see a list of reports sent to other teachers. The Administrator will have a list of all custom reports created.
Printable User List
You will be able to print a user list using this link. You can view the entire school roster or view the roster by class. This is an easy way to look up a student’s or a teacher’s password if they forget.
Adjust Passing Parameters
If your program administrator has given permission for this feature, you will be able to adjust the passing parameters for your different classes and/or individual students.
The “Adjust Passing Parameters” feature enables you to adjust the percentage that a student needs in order pass the topics. You can adjust the passing parameters for a student based on the student’s proficiency level and your expectations for that student. Adjusting the passing parameters does not affect the difficulty level of the questions; it only affects how well a student has to do to pass a topic.
Passing parameters also include a “start date” which you can adjust. A situation may arise where one of your students is performing poorly, and you want them to start over. This feature allows you to do so without erasing all of his/her previous scores simply by adjusting his/her start date. The reports only include statistics from sessions performed after the start date.
Class Gradebook Report
• This report lists scores for each student in the class or grade level selected.
• The Class Gradebook Report has six formats from which to choose, depending on what you are looking for:

www.studyisland.com 800.419.3191 [email protected]
9 © 2006 Study Island - All rights reserved.
o By program broken down by subject – lists each student’s score by the subjects included in the program selected
o By subject broken down by topic – lists scores for each student in the class or grade level by each topic included in the subject selected
o By topic – lists scores for each student by a specified topic o By subject – lists the average score attained by each student for the entire
subject o By program – lists the average score attained by each student for all subjects
included in the specified program (grade level) o All activity – lists the average score attained by each students for all content
areas available (all grade levels programs and topics in those programs)
Blue Ribbon Report
• This report lists the total number of blue ribbons achieved and the percentage complete for each subject in the program selected.
Individual Student Report
• This report allows you to view a report for one specific student. • You are able to choose to see the results for one subject or all subjects included in
the program in which they are working.
Class Summary Report
• This report lists a summary of activity by the subjects included in the grade level program selected for a group of students (class or grade level).
Assignment Report
• Gives the statistics on all class assignments. The teacher is able to look at the data derived from the assignments they created for their own class. To create assignments, refer to the “Creating Class Assignments” section.
Trend Report
The trend report allows you to choose between three different graphs:
• Usage Graph - shows the weekly usage for each subject. It is useful to view how much time your students are spending on Study Island as the year goes by.
• Cumulative Performance Graph - shows the total percentage correct since the start of the school year for each subject. It is useful to see how your yearly percentage correct is changing as the school year goes by.
• Performance Graph - shows the weekly percentage correct for each subject. It includes statistics for all students in your school who used the program during the time period specified.
Note: You do not need to select a group of students for these reports. You can only view these reports for all students in your school.
Weekly Report
• This lists the activity for all grade level programs during a specific week. • This report is emailed each Saturday night to each email address listed on the top
portion of the Emailed Report Manager screen.
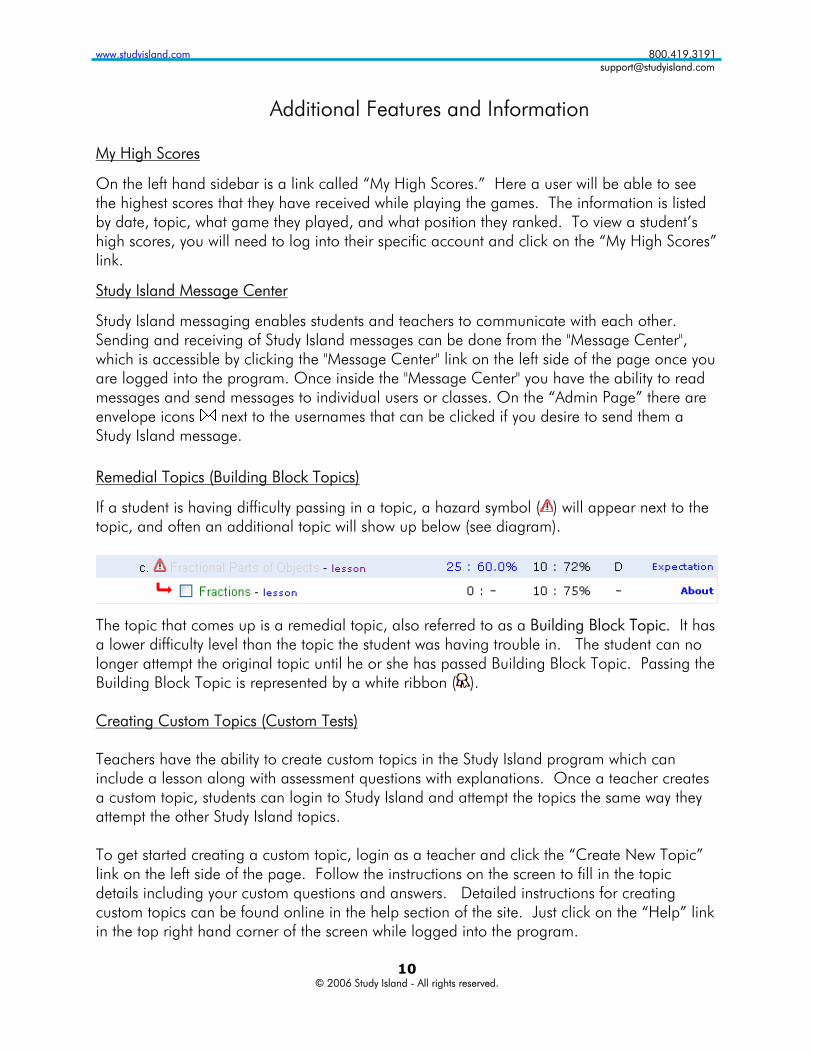
www.studyisland.com 800.419.3191 [email protected]
10 © 2006 Study Island - All rights reserved.
Additional Features and Information
My High Scores
On the left hand sidebar is a link called “My High Scores.” Here a user will be able to see the highest scores that they have received while playing the games. The information is listed by date, topic, what game they played, and what position they ranked. To view a student’s high scores, you will need to log into their specific account and click on the “My High Scores” link.
Study Island Message Center
Study Island messaging enables students and teachers to communicate with each other. Sending and receiving of Study Island messages can be done from the "Message Center", which is accessible by clicking the "Message Center" link on the left side of the page once you are logged into the program. Once inside the "Message Center" you have the ability to read messages and send messages to individual users or classes. On the “Admin Page” there are envelope icons next to the usernames that can be clicked if you desire to send them a Study Island message.
Remedial Topics (Building Block Topics)
If a student is having difficulty passing in a topic, a hazard symbol ( ) will appear next to the topic, and often an additional topic will show up below (see diagram).
The topic that comes up is a remedial topic, also referred to as a Building Block Topic. It has a lower difficulty level than the topic the student was having trouble in. The student can no longer attempt the original topic until he or she has passed Building Block Topic. Passing the Building Block Topic is represented by a white ribbon ( ). Creating Custom Topics (Custom Tests) Teachers have the ability to create custom topics in the Study Island program which can include a lesson along with assessment questions with explanations. Once a teacher creates a custom topic, students can login to Study Island and attempt the topics the same way they attempt the other Study Island topics. To get started creating a custom topic, login as a teacher and click the “Create New Topic” link on the left side of the page. Follow the instructions on the screen to fill in the topic details including your custom questions and answers. Detailed instructions for creating custom topics can be found online in the help section of the site. Just click on the “Help” link in the top right hand corner of the screen while logged into the program.

www.studyisland.com 800.419.3191 [email protected]
11 © 2006 Study Island - All rights reserved.
Browser Capability/Compatibility
For the program to work properly, your browser must be set to accept JavaScript, and style sheets. If you wish to enable game mode, you also need to enable Java Applets which is the default for most browsers.
Although we support most browsers for the test mode of our program, some are not supported in the gaming portion. The chart below lists the browsers supported by the Study Island program in both the test and game modes. If you have any further questions about this information, please call our support line at 1.800.419.3191.
MS Windows Features
Browser Test Mode Games
Creating New Tests
Internet Explorer 4.0 and up Y Y Y Netscape 4.0 and above Y Y Y Firefox 1.0 and up Y Y Y * Java, which is free and normally installed by default, is required for the games.
Mac OS 9.2 and below Features
Browser Test Mode Games
Creating New Tests
Internet Explorer 4.0 and up Y N N Netscape 4.0 - 4.8 Y Y N Netscape 7.02 Y Y Y * suggested browser Netscape 4.7
Mac OS X Features
Browser Test Mode Games
Creating New Tests
Safari 1.0 - 1.1 Y N N Safari 1.2 and up* Y Y Y Internet Explorer 4.0 and up Y N N Netscape 7.02 Y Y Y Netscape 7.1 and up Y N** N** Firefox 1.0 and up Y N** N**
* suggested browser: Safari 1.2 and up requires Mac OS X 10.3 to be installed and Java 1.4.2 or
later for the games.
** The games will function with Netscape 7.1 and up and Firefox 1.0 and up, if the Java Embedded Plugin version 0.9 or higher is installed correctly with Java 1.4.2 or later. Since the Java Embedded Plugin for Mac OS X is still in beta, we strongly recommend using Safari 1.2 with the games.

www.studyisland.com 800.419.3191 [email protected]
12 © 2006 Study Island - All rights reserved.
Game Debugger
If you are having difficulty using or viewing the games, go to http://www.studyisland.com/gametest.cfm to help diagnose the problem.
Frequently Asked Questions
Q) I signed up for Study Island, but I haven’t received any software to install on my computer. Why is that?
Since Study Island is completely Internet-based, there is no software to install on your computer. Once a school signs up for this service, they are assigned a username and password so they can log onto the website. Schools will receive an e-mail upon receipt of their purchase order, along with an instruction manual on how to start using the program.
Q) I tried to log on with my username and password, and it says that my information is invalid. What should I do?
This usually means that you are not entering in your correct username and password. The program is not case sensitive, but please make sure you are entering in the EXACT username and password that you were given. If you still are having problems, contact us at [email protected], or call our support line at 1-800-419-3191.
Q) When I log in and attempt to start studying a particular topic, nothing happens when I click on that topic. What should I do?
All students MUST take a pretest of at least ten questions before they are allowed access to the other topics in each subject. It does not matter how well a student does on the pretest, just as long as they attempt and finish ten questions. Also, they must receive a blue ribbon next to each topic before they can have access to the post test.
Q) A student received a 0% in their first practice session. On their second attempt they received a 100%, but their score says 75%. Is something wrong with the Study Island scoring?
The 75% is the final cumulative score. The system takes the total number of correct answers and divides that by the total number of attempted questions.
Q) Why is it that a student received a score of 100% on their last session, but they did not receive a blue ribbon for that particular topic?
Since Study Island uses cumulative scores to measure each student’s progress, they must receive a cumulative score that is equal to or greater than the percentage listed in the “percentage needed” column of the main page for the subject the student is studying. So if the percentage needed is 70%, they must have a cumulative score of at least 70% to receive a blue ribbon for that topic.
Q) Sometimes the graphics do not appear on my screen. Instead there is a red ‘X’ in the corner of where the image should be. What’s wrong with the graphics?
The reason there is an X instead of those images is because the image failed to load either due to a configuration error or network latency somewhere between the school's computers and our servers. First, if it ever happens students may get the images to load by right-clicking (or hold the button down if using a Mac) where the image should be and then selecting

www.studyisland.com 800.419.3191 [email protected]
13 © 2006 Study Island - All rights reserved.
“Show Image” on the popup menu. Second, you may decrease the likelihood of the image failing to load by changing the following setting:
1. In Internet Explorer, under the 'Tools’ menu select “Internet Options”.
2. A window will pop-up in the middle of the screen. Click the button that says, “Settings...”
3. Under “Check for newer versions of stored pages:” select “Every visit to the page”.
4. Click “OK”, and then click “OK” again.
Q) I think something is wrong with the question I am on. Should I let anyone know about this?
Yes, please let us know if you think that something is incorrect on a particular question. All you have to do is click on the “Comment on this Question” link, located right underneath where the time is taken for each session. By doing this, our content editors will know exactly which question to look at, and they can make any changes, if necessary.

Practice Math Assessment for Grades 4 and 5
Project Background In June,2002, a team of teachers created math tests that are correlated with the PA Standards. Last summer, teachers revised the tests. The results are a test for each quarter in grades four and five. Some of the quarterly tests in grade 4 have two parts. The computer-delivered part has 20-50 math questions. The paper and pencil part has less than 10 questions.
Materials Included in a Packet Given to Teachers
Green Pages (in Technology Binder)
Samples of Student Report and Test Item Summary Report
White Pages
Copy of the items on the computer-delivered tests Check the heading for grade-level and quarter of
the year identification White Pages
Paper & Pencil Test
Grade 4 in quarters 2 and 3 only
Important Information for Administering Test 1. Use of this practice assessment is not mandatory. If used, it should be given prior to the
district’s local assessment. The Test Item Summary Report will identify the weaknesses of the class, in general.
2. Important Directions for ending the test session. A. If a student stops working and is NOT finished with the test, click on the stop sign and
choose LATER. B. If a student is finished, click on the stop sign and choose TURN IN.
3. Students should take paper and pencil to the computer. 4. Students should not use calculators unless the math task supplies one on the screen. 5. To discourage sharing information, the math tasks will be delivered in a random order. 6. Students can print a Student Report after the test is finished. Directions for the students are:
A. Open Student Report from the Compass Assignments. (Teachers must assign this feature. See below.)
B. Then choose the math assessment sequence.
Directions for Assigning the Computer-delivered Test and Student Report Option The main practice test can be assigned to the students via Compass. The steps are:
1. Add an assignment column to your class list in Compass. 2. Choose 4_MA_Quarter_Assessment.s (Grade 4) or
5_MA_Quarter_ASSESSMENT.s (Grade 5) 3. Highlight the entire column and type the quarter of the year in the column i.e
1 for the first quarter of the year 2 for the second quarter of the year 3 for the third quarter of the year 4 for the fourth quarter of the year
4. Add another assignment column to the same class list in Compass if you want the students to be able to pull up their practice test scores immediately after finished.
5. Choose Student Report, highlight the column, and add SS:

Student & Teacher Reports
The Student Report can be viewed and printed by the STUDENTS after taking the test. Please advise them to wait until the test is finished before printing results. The teachers have several reports that can be generated after their class has completed the computer-delivered test.
Directions for Printing Reports for the Teacher
1. Login to Compass as the classroom teacher. 2. Go to FILE>OPEN. 3. Select SEQUENCE and PUBLIC. 4. Open either 4_MA_Quarterly_Assessment.s OR 5_MA_Quarterly_Assessment.s.
With the sequence open, go to TEACHER and drag down to the report needed. Notes:
Teacher Report Suggestions: Objective Summary Report, Test Item Summary Report and/or Test Results Report
The Test Item Summary Report has a column with the percent correct responses for each test question. Match this information with the test questions (math tasks for the second quarter are attached to this memo) to identify the weaknesses of the class.
5. Select the Compass class to include in the report (i.e. Which class had the Math Assessment assignment in Compass?)
6. Preview and then print the results
If you have any questions, contact Sharon Chambers (412) 372-7605.

Practice Math Assessment for Grades 4 and 5
Pro jec t Background
In June,2002, a team of teachers created math tests that are correlated with the PA Standards. Last summer, teachers revised the tests. The results are a test for cach quarter in grades four and five. Some of the quarterly tests have two parts. The computes-delivered part has 20-50 math questions. The paper and pencil part has less than 10 questlons.
Materials Included in a P a c k e t Given to Teachers &
the year identification Paper & Pencil Test
Green Pages
Ivory/Yellow Pages
Grade 4, quarters 2 and 3 only
Samples of Student Report and Test Item Summary Report
Copy of the items on the computer-delivered tests Check the heading for grade-level and quarter of
Impor tant In fo rma t ion fo r Administering Test
1. Use of this practice assessment in not mandatory. If used, it should be given prior to the district's local assessment. The Test Item Summary Report will identify the weaknesses of the class, in general.
2. Important Directions for ending the test session. A. If a student stops working and is NOT finished with the tcst, click on the stop sign and
choose LATER. B. If a student is finished, click on the stop sign and choose TURN IN.
3. Students should take paper and pencil to the computer. 4. Students should not use calculators unless the math taslc supplies one on the screen. 5. To discourage sharing information, the math tasks will be delivered in a random order. 6. Students can print a Student Report after the test is finished. Directions for the students are:
A. Open Student Report from the Compass Assignn~ents. (Teachers must assign this feature.)
B. Then choose the Math Assessment sequence.
S t u d e n t & Teacher Reports
The Student Report can be viewed and printed by the STUDENTS after taking the test. Please advise them to wait until the test is finished before printing results. The teachers have several reports that can be generated after their class has completed the con~puter-delivered test.
Directions for P r in t ing Repor ts I'ol- thc Teache r
1 . Login to Compass as the classroom teacher. 2. Go to FILE>OPEN. 3. Select SEQUENCE and PUBLIC. 4. Open either 4-MA-Quarterly-Assessment.~ OR 5-MA-Qual-terly- assessment.^.

With the sequence open, go to TEACHER and drag down to the report needed. Notes:
Teacher Report Suggestions: Objective Summary Report, Test Item Summary Report and/or Test Results Report
The Test Item Summarv Report has a column with the pcrcent correct responses for each test question. Match this information with the test questlon (ivory pages) to identify the weaknesses of the class.
5 . Select the classes to include in the report (i.e. Which class had the Math Assessment assignment?)
6. Preview and then print the results
Directions for Assigning the Computer-delivered Test and Student Report Option
Please advise the staff that the main test can be assigned to he students via Compass. The steps are:
1. Add an assignment column to your class list in Coml?ass. 2, Choose 4-MA-Quarter-Assessmen t.s or 5-MA-Q uarter-ASSESSMENT.s 3. Highlight the entire column and type 1 (for the first quarter of the year). 4. Add another assignment column to the same class 11,t In Compass. 5. Choose Student Report 6. Highlight the column and add SS:
If you have any questions, contact Sharon Chambers (412) 372-7605.

Student Data Report - DlBLE ELEMENTARY
Printed: Oct 23,2003 05:OO PM Page 1 --
L l u e n c e Title
4-MA-Quarter Cycle 1 Math Test
TY pe Date Score
Test Oct 23,2003 80%
Duration (hr:min) :24

Test Item Summary Report (Sorted by Question Number) 4-MA-Quarter-Assessments.~ Printed: Oct 23,2003 04:58 PM
- --
L NO data for test item
Cycle 1 Math Test
Objective # Name 1 Numbers, Number Systems,
Number Relationships 2.1.5(4) 2 Numbers, Number Systems,
Number Relationships 2.1.5(4) 3 Numbers, Number Systems,
Number Relationships 2.1.5(4) 4 Numbers, Number Systems,
Number Relationships 2.1 3 4 ) 5 Numbers, Number Systems,
Number Relationsh~ps 2.1.5(4) 6 Numbers, Number Systems,
Number Relationships 2.1.5(4) 7 Numbers, Number Systems,
Number Relationships 2.1.5(4) 8 Numbers, Number Systems,
Number Reiationships 2.1.5(43 9 Computation and Estimation
2.2.5(4) 10 Com~utation and Estimation
omputation and Estimat~on
12 computation and Estimation 2.2.5(4)
13 Computation and Estimation 2.2.5(4)
14 Computation and Estimation 2.2.5(4)
15 Computation and Estimation 2.2.5(4)
16 Computation and Estimation 2.2.5(4)
17 Computation and Estimation 2.2.5(4)
18 Computation and Estimation 2.2.5(4)
19 Computation and Estimation 2.2.5(4)
20 Computation and Estimation 2.2.5(4)
21 Computation and Estimation 2.2.5(4)
22 Computation and Estimation 2.2.5(4)
-3 Computation and Estimatron & 2.2.5(4) 4 Computation and Estimation
2.2.5(4)
Display Name MA04A216.ati
MA04A21 O.ati
MA04A247.ati
MA04A232.ati
MA04A249.ati
Standard Form
Order of Numbers
Rounding to the Nearest Doiiar MAO4A132.ati
MA04A104.ati
Regrouping Across Zeros Estimating Sums 1 Estimating Sums 2 Estimating Differences 1 Estimating Differences 2 2-Digit Multiplication 2-Digit Multiplication 2 2-Digit Division 1
Answer Totals ... A B C D 1 0 21 1
0 3 2 1 0
0 3 1 9 3
0 1 8 3 2
2 0 0 2 1
2 0 2 0 0
0 5 0 1 8
0 1 0 2 2
1 2 1 1 1
0 1 0 2 2
- - Page 1
Cor Tot Tot % Ans Cor Att Cor
C 21 23 91

4-MA-Quarter-Assessments.~ Printed: Oct 23, 2003 04:58 PM
# Name 25 Computation and Estimation
2.2.5(4) 26 Mathematical Problem Solving
and Communication 2.5.5 (4) 27 Mathematical Problem Solving
and Communication 2.5.5 (4) 28 Algebra and Functions 2.8.5
(4) 29 Algebra and Functions 2.8.5
(4 30 Concepts of Calculus 2.11.5
(4)
Display Name 2-Digit Division 2 MA04A302.ati
algebra
Calculus 1
Answer Totals ... Cor Tot Tot % A B C D E F Ans Cor At t Cor 2 3 2 1 6 0 0 D 16 23 70
2 1 6 5 2 0 0 B 16 25 64
7 4 0 1 4 0 0 D 14 25 56
0 4 1 6 4 0 0 C 16 24 67
2 3 0 2 0 0 0 A 23 25 92
1 2 3 1 0 0 0 B 23 25 92

Millie’s Math House

®
M I L L I E ’ S
SCHOOL NETWORK VERSIONFOR USE WITH RIVERDEEP SOFTWARE MANAGER
www.riverdeep.net


Teacher’s GuideMacintosh and Windows
DesignTheatrix Edmark
Joyce Hakansson • Carolyn Earhart Tina Ruppelt • Jennifer CastStella Allison • Mitchell Rose Scott Clough
Product DevelopmentKathy Linstrum • Matt Jackson
Art and AnimationMitchell Rose • Jeff Brebner • Bonnie Wallace
Macintosh EngineeringBob Clark • Margaret Boone • Susan Lysek • Paul ElsethEric Slosser • Kevin Arnold • Jeff Joseph • Rand Arnold
Windows EngineeringEric Lippke • Marc Cygnus • Greg Emerson • Bryan Bouwman • Bill Brooks
Sound and MusicMike Bateman • Cotichelli • Hiro Shimozato • Jeff Joseph • Ruth Young
GuideBarbara Wood • Beverly Nelson • Mary Latham
Gail Tremblay • Tracee Gorman • Laurie Stoltman
Riverdeep grants limited permission to classroom teachers to duplicate the reproducible portions of this publication for classroom use only and for no other purpose.
In the interest of product improvement, information and specifications represented herein are subject to change without notice.
©Copyright 1992-2003 Riverdeep Interactive Learning Limited. All rights reserved. Millie’s Math House and Riverdeep are registered trademarks of Riverdeep InteractiveLearning Limited. Windows is either a registered trademark or a trademark of Microsoft Corporation in the United States and/or other countries. Macintosh and Macare registered trademarks of Apple Computer, Inc. Adobe and Acrobat are trademarks of Adobe Systems Incorporated. Pentium is either a registered trademark ortrademark of Intel Corporation in the U.S. and /or other countries. All other trademarks are the property of their respective owners. BOB Language, © 1991, DavidBetz.
Riverdeep, Inc.www.riverdeep.net
®
M I L L I E ’ S
S C H O O L V E R S I O N

..
..
..
..
..
..
..
..
..
..
..
..
..
..
..
..
..
..
..
..
..
..
..
..
..
..
..
..
..
.
IntroductionMillie’s Math House software and classroom activities have been created with a great deal ofthought and care. They reflect our vision of what technology can bring to education. We want to share our love of learning with you and your students, so we’ve filled Millie’s House with hours and hours of learning play, colorful characters, enchanting music, smiles, and giggles.
Through seven activities that feel like play, students learn about numbers, counting, addition,subtraction, patterns, problem solving, size, geometric shapes, and more. Six of the sevenactivities have both an Explore and Discover Mode as well as a Question and Answer Mode sothat children experience both divergent (many good answers) and convergent (one best answer)thinking. These activities will help build a foundation for the math concepts and thinking skills thatchildren need to construct understanding and make sense of the world around them.
Powerful technology and proven educational methods have been combined to ensure success for a wide variety of children. Built-in scanning is available for single switch users. The clear, digitized speech provides effective modeling for ESL students and early language development.Millie’s Math House can also be very appropriately used in inclusionary settings.
A Curriculum Connections section in this Guide provides interdisciplinary opportunities withdozens of teacher-developed activities for use in the classroom and at home. Reproducible activity sheets and artwork are included to provide additional learning opportunities before and after using the software.
Millie’s Math House provides students with the opportunity to develop feelings of control and confidence. Using the computer as a tool, students gain a sense of accomplishment and skill asthey create, play, and learn.
The network version of Millie’s Math House comes with the flexible Riverdeep Software Manager,making it easier for you to quickly assign program activities to individual students, workgroups, orclasses. Look for details on the these and other useful features in the Riverdeep SoftwareManager guide included within the Teacher Resource Binder.

Table of ContentsWhat’s in This Guide? ............................... 2
Steps to Start............................................. 3
What’s Inside Millie’s Math House ......... 4
Learning Opportunities............................ 5
Moving Around the House ..................... 6
Introducing Millie to Your Students ...... 7
Millie’s Map..................................................... 8Millie’s Icons.................................................... 9
Room by Room in Millie’s Math House Little, Middle, & Big
Overview ................................................. 11Explore and Discover Mode ......................12Question and Answer Mode ....................13Together Time Activities ............................14
Mouse HouseOverview ..................................................15Explore and Discover Mode ......................16Question and Answer Mode ....................17Together Time Activities ............................18
What’s My Number?Overview .................................................. 19Question and Answer Mode ................... 20Together Time Activities ........................... 22
Bing & BoingOverview .................................................. 23Explore and Discover Mode ..................... 24Question and Answer Mode ................... 25Together Time Activities ........................... 26
Build-A-Bug Overview ................................................. 27Explore and Discover Mode ..................... 28Question and Answer Mode ................... 29Together Time Activities ........................... 30
Number MachineOverview ................................................. 31Explore and Discover Mode ..................... 32Question and Answer Mode ................... 33Together Time Activities .......................... 34
Cookie FactoryOverview ................................................. 35Explore and Discover Mode ..................... 36Question and Answer Mode ................... 37Together Time Activities ........................... 38
Curriculum Connections Introduction .................................................. 39Activities Chart.............................................. 40Characters for Bulletin Boards,
Posters, and Chalkboards .......................... 41Little, Middle, & Big ..................................... 44Mouse House ............................................... 50What’s My Number?..................................... 57Bing & Boing ................................................ 63Build-A-Bug ................................................. 68Number Machine ......................................... 73Cookie Factory ............................................. 77
Students with Special Needs ................. 82
Technical InformationSystem Requirements.................................... 83Installation Instructions ................................. 84Technical Support.......................................... 85
2
..
..
..
..
..
..
..
..
..
..
..
..
..
..
..
..
..
..
..
..
..
..
..
..
..
..
..
..
..
.
What’s in This Guide?Introductory information (pages 2–9)� Steps to Start information� Visual overview of the program� Activity room descriptions� Learning opportunities matrix� Program navigation for teachers and students � Suggestions for introducing Millie’s Math House to your students� Reproducible quick reference pages for your students
Room by Room in Millie’s Math House (pages 11–38)Helpful information about each room of Millie’s Math House, including:
� Overview, giving a summary of the activity room, learning opportunities, and suggested extension activities for home and school.
� Explore and Discover Mode, explaining how your students can learn by experimenting with numbers, shapes, etc., in the activity room. In this Mode there are no “right” or “wrong”answers.
� Question and Answer Mode, explaining how a character takes charge and is looking for a “right” answer. The character also offers gentle help and fun rewards.
� Together Time Activities, offering suggestions for easy, at-home activities that integrate learning into everyday situations.
Curriculum Connections (pages 39-81)� Suggested activities that can be integrated into many curricular areas. These activities
strengthen the learning opportunities found in Millie’s Math House.� Reproducible sheets (for student handouts, bulletin board headings, and overhead
transparencies) that can be used in conjunction with Curriculum Connections activities. � Suggestions for using Millie’s Math House with students with special needs.
Technical Information (pages 83-84)� System Requirements and Installation Instructions� For Technical Support, please refer to the customer information card included with this product.

..
..
..
..
..
..
..
..
..
..
..
..
..
..
..
..
..
..
..
..
..
..
..
..
..
..
..
..
..
..
3
Steps to Start1. Check to be sure Riverdeep Software Manager is installed.
� See the RSM User Guide for more information.2.Install Millie’s Math House.
� If the software has not been installed, see Installation Instructions (page 84).
3.Read the Teacher’s Guide.� What’s Inside Millie’s Math House (page 4) and Moving Around the House (page 6) will help
you begin using Millie’s Math House immediately. Curriculum Connections (pages 39-81)offers additional suggestions and supplemental materials to help you integrate Millie’s MathHouse with classroom activities.
4.Become familiar with the program. � Try the software before you introduce Millie’s Math House to your students. � Decide if you want to introduce the activity rooms one at a time to your students or let
them explore at their own pace. � Select options (scanning, Stop Sign, etc.) you would like to use.
5.Introduce Millie to your students. � Reproduce (for each student) or make overhead transparencies of Millie’s Map and Millie’s
Icons (pages 8 and 9). � See Introducing Millie to Your Students (page 7) for suggestions.
To play an activity, click one of the rooms below.
Mouse House What’s My Number?
Little, Middle, & Big Bing & Boing
Build-A-Bug
Click to leave Millie’s Math House.
See what happens when you click this.
NumberMachine
Millie,your host!
See what happens when you click this.
Cookie Factory

4
..
..
..
..
..
..
..
..
..
..
..
..
..
..
..
..
..
..
..
..
..
..
..
..
..
..
..
..
..
.
What's Inside Millie’s Math HouseLittle, Middle, & Big
Compare and match sizes. Try shoes of three sizes on three different characters.
Mouse House
Identify and match geometric shapes. Build in the empty work area or by following a blueprint. Print and color what is built.
What’s My Number?
Count or use addition and subtraction. Read numbersentences and find Dorothy’s number.
Bing & Boing
Recognize patterns. Create and complete interesting patternsthat are seen and heard. Record sounds for the pictures.
Build-A-Bug
Hear and see numbers and the corresponding quantity.Place from one to ten eyes, ears, spots, etc. on a bug. Print and color creations and record sounds for the bug.
Number Machine
Recognize numerals. See and hear a delightful assortmentof critters counted as they pop out of a drawer.
Cookie Factory
Use thinking skills and counting. Try devices in differentsequences to produce different results. Count jelly beansto decorate cookies.

..
..
..
..
..
..
..
..
..
..
..
..
..
..
..
..
..
..
..
..
..
..
..
..
..
..
..
..
..
..
Cookie Number Build-A- Bing & What’s My Mouse Little, Middle,Factory Machine Bug Boing Number? House & Big
Explore concept of size X X
Identify and compare sizes X X
Expand vocabulary Xof size words
Explore concept of shape X
Match shapes X
Discriminate between Xsizes of the same shape
Create with shapes X
Expand vocabulary of Xshape words
Create patterns X
Complete patterns X
See relationship of X X X Xparts to whole
Develop number recognition X X X X
Recognize one-to-one X X X Xcorrespondence
Create a unique work X Xof art
Hear numbers counted X X X X
Develop problem-solving X X X Xskills and attitudes
Hear singular and plural X Xforms of nouns
Develop basic addition X X Xand subtraction facts for
numbers 1-10
Recognize and read Xnumber sentences
Observe that number Xsentences are a means ofmathematical communication
Learning Opportunities
55

Moving Around the HouseTo move from the Main Room to an activity room, click one of these:
Click Millie to return to the Main Room from any activity room in the Math House.
When students enter an activity room, they will initially be in the Explore and DiscoverMode. Since emphasis is placed on students experimenting freely by clicking objects andicons to see what happens, there are no right and wrong answers. With students incharge, divergent thinking is encouraged by playful, positive responses to their naturalcuriosity. When you want to enter the Question and Answer Mode, click the framed picture (each activity room has a different picture).
In the Question and Answer Mode of an activity room, a character asks questions ormakes requests. Convergent thinking is emphasized as the character offers gentlefeedback and guides students toward a “correct” answer. Click the empty picture frameto return to the Explore and Discover Mode.
Click the printer to print student creations in Mouse House and Build-A-Bug.
Click the Stop Sign in the Main Room to exit Millie’s Math House. .
..
..
..
..
..
..
..
..
..
..
..
..
..
..
..
..
..
..
..
..
..
..
..
..
..
..
..
..
..
6

Introducing Millie to Your Students
� Hand out copies of Millie’s Map and Millie’s Icons (pages 8 and 9).
� Point out the Main Room. Discuss the Stop Sign if you have not removed it.
� Ask a volunteer to click an activity room. Explain that students will first see the Explore andDiscover Mode in each activity room. (Indicate that What’s My Number? has the Question andAnswer Mode only.) Point out the framed picture, explaining that when one of Millie’s friends isthere, students can freely explore the room to discover what happens.
� Have another volunteer click the framed picture. Point out to students that the frame is nowempty; a character will make a request because they are in the Question and Answer Mode.Explain that if they have trouble finding the answer, the character will help them.
� Help students understand that anytime during play, they can:- go back to the Explore and Discover Mode by clicking the empty picture frame;- go back to the Main Room by clicking the Millie icon.
� If printing is available, point out the printer icon in Mouse House and Build-A-Bug. Point out themicrophone icon in Bing & Boing and Build-A-Bug. Explain that you will help them learn to usethese features when they are in these activity rooms.
� Have the students begin using Millie’s Math House, or skim through Curriculum Connections anduse one of the suggested activities to introduce an activity room. For example, “Meet Bing andBoing” (page 63) is a helpful introduction to the Bing & Boing activity room.
� As students work in different rooms of Millie’s Math House, copy and send home the correspondingTogether Time Activities (pages 14, 18, 22, 26, 30, 34, and 38).
� Use selected activities found in Curriculum Connections as follow-up exercises.
Note: If your students are using a TouchWindow, just have them touch the screen wheninstructed to click or drag.
7..
..
..
..
..
..
..
..
..
..
..
..
..
..
..
..
..
..
..
..
..
..
..
..
..
..
..
..
..
..

Millie’s MapClick the room you want to enter:
8
©Copyright 1992-2003, Riverdeep Interactive Learning Limited.
Build-A-Bug
Number Machine
Cookie Factory
Little, Middle, & Big
Mouse House What’s My Number?
Bing & Boing

Millie’s Icons
Click:
To go back to
To hear questions
To explore
To print
To exit
9
©Copyright 1992-2003, Riverdeep Interactive Learning Limited.


..
..
..
..
..
..
..
..
..
..
..
..
..
..
..
..
..
..
..
..
..
..
..
..
..
..
..
..
.
Little, Middle, & Big Overview
Little, Middle, and Big need help finding shoes. As students select different pairs of shoes, Little,Middle, and Big let them know how well the shoes fit.
Learning Opportunities� Explore the concept of size� Identify and compare different sizes� Examine similarities and differences in size� Expand vocabulary of “size words”
Together Time Activities (page 14)
(To copy and send home)� Bigger Than a Bread Box� Silly Me
Curriculum Connections (pages 44-49)� Size Collages (Art)� Size Up the World (Language Arts)� Trash and Treasure (Language Arts)� Seeing It All (Science)� So Many Ways to Say It (Language Arts)� What Size, Please? (Science)� Color Me Little (Science)
11

..
..
..
..
..
..
..
..
..
..
..
..
..
..
..
..
..
..
..
..
..
..
..
..
..
..
..
..
..
.
12
Little, Middle, & Big
Little, Middle, & Big
Explore and Discover Mode� Click to enter Little, Middle, & Big from the Main Room.
� Click a pair of shoes . A voice says the size; for example, “Small shoes.”
� Click a character . Little, Middle, or Big asks for shoes; for example, “I’m Little. I need shoes.”
� Click the shoes you want to try on Little, Middle, or Big. Because this is the Explore and DiscoverMode, you can put any shoes on any character. The characters’ faces react to the shoes youchoose. You are in charge!
Try shoes on different characters as long as you like.
� If you want to mix up the shoes, click the cat . Try it just for fun. When you want theshoes sorted by size again, click the cat once more.
� Click for the Question and Answer Mode, or click to return to the Main Room.

..
..
..
..
..
..
..
..
..
..
..
..
..
..
..
..
..
..
..
..
..
..
..
..
..
..
..
..
.
13
?Little, Middle, & Big
Little, Middle, & Big
Question and Answer Mode� Click to enter the Question and Answer Mode. The spider introduces a character. Then
Little, Middle, or Big asks you to find a pair of shoes; for example:
� Click a pair of shoes.
� If you want a challenge, mix up the shoes by clicking the cat . When you want themsorted by size, click the cat again.
� Play as long as you want. After all the shoes are used, the cat meows, and the shelves fill with shoes.
� Click for the Explore and Discover Mode, or click to return to the Main Room.
- If the shoes fit, the character looks happy and thanks you!
“I’m Little. I need shoes.”
- If the shoes do not fit, the character tells you what the problem is. For example, “These are too big.” Try again until you find some that are just right.

..
..
..
..
..
..
..
..
..
..
..
..
..
..
..
..
..
..
..
..
..
..
..
..
..
..
..
..
..
..
14
Little, Middle, & Big
Together TimeBigger Than a Bread Box
Play a guessing game that requires size comparison and the use of “size words.” Start by saying, “I see something smaller than you but larger than my ring.” Let your child take a guess.Then help narrow the choices by offering another clue, “I see something smaller than your littlebrother but larger than the flowerpot.” Continue to give clues until your child guesses correctly.Then let your child think of an object and give the clues.
Silly Me
Cut out a full-length picture of your child from an old photograph. Glue the picture onto a largepiece of white paper. Let your child find magazine pictures of hats, shoes, and gloves or mittens.Help cut out these items. Let your child create a funny self-portrait by adding clothing. Talk aboutthe “too big hat,” “too little mittens,” and “just right shirt,” etc. Follow by reading Goldilocks andthe Three Bears as a bedtime story.
Little, Middle, & Big
Hi,
We've been using Millie’s Math
House to learn about size. Maybe
you could try one of these activities
at home.
© Copyright 1992-2003, Riverdeep Interactive Learning Limited.

..
..
..
..
..
..
..
..
..
..
..
..
..
..
..
..
..
..
..
..
..
..
..
..
..
..
..
..
.
15
Mouse House Overview
Students use geometric shapes (squares, triangles, circles, half-circles, and rectangles) as they buildby following blueprints. With these same shapes, students can also create their own designs.Designs can be printed and colored.
Learning Opportunities
� Match shapes� Discriminate between sizes of the same shape� Hear and use the names of shapes� Discover that a shape is still the same shape, regardless of position or size� Create with shapes
Together Time Activities (page 18)
(To copy and send home) � Tabletop Town� Geometric Pretzels� City Stamps
Curriculum Connections (pages 50-56)
� I Spy Shapes (Language Arts)� Funny Faces (Art)� Our Town (Art)� Shadow Play (Art)� Sort It Out (Science)� All Shapes and Sizes (Science)� Crazy Quilt (Art)� Team Shapes (Physical Education)� What Shape Are You In? (Physical Education)

..
..
..
..
..
..
..
..
..
..
..
..
..
..
..
..
..
..
..
..
..
..
..
..
..
..
..
..
..
..
16
Mouse House
Mouse House
Explore and Discover Mode� Click to enter the Mouse House from the Main Room.
�
� Build as long as you like. Click another blueprint, or build in the empty work area at any time.
� Click to print what you have built. Once printed, you may want to color your design,adding bricks, scenery, people, etc.
� Click for the Question and Answer Mode,or click to return to the Main Room.
- If you are following a blueprint, dragthe shape from the supply area to thework area and drop it into place (overthe same shape).
- If you are building in the empty work area without a blueprint or addingextra shapes to a blueprint, drag theshapes wherever you want.
Click
Blueprints with squares,circles, rectangles, andtriangles in one size.
or
Blueprints with squares, circles, rectangles, triangles,and half-circles in two sizes.
or
Empty work area (buildwithout blueprints).
The Mouse Housecontains blueprints, ashape supply area, anda work area.
work areashape supply area

..
..
..
..
..
..
..
..
..
..
..
..
..
..
..
..
..
..
..
..
..
..
..
..
..
..
..
..
.
?Mouse House
17
Mouse House
Question and Answer Mode� Click to enter the Question and Answer Mode.
� Frank Lloyd Mouse has surprise blueprints.You will not know what you are building until youfinish,but you can decide how many shapes and sizes to use.
�
� Mr. Mouse asks you to find a shape; for example:
“Please give me a largerectangle.”
� Click or drag the shape requested. (To hear the request again, click Mr. Mouse.)
When you finish building, the mice move in and celebrate!
� Click for the Explore and Discover Mode, or click to return to the Main Room.
- If you click or drag the right shape, it snaps into place.
- If you do not click or drag the right shape,Mr. Mouse asks you to try again.
Click
Blueprints with squares, circles, rectangles, and triangles in one size.
or
Blueprints with squares, circles, rectangles, triangles,and half-circles in two sizes.
or
Blueprints with all theshapes in two sizes and themost complex design.

..
..
..
..
..
..
..
..
..
..
..
..
..
..
..
..
..
..
..
..
..
..
..
..
..
..
..
..
..
..
18
Mouse House
Mouse House
Together TimeTabletop Town
Cut out rectangles, squares, circles, half-circles, and triangles in different sizes from scraps of felt orother fabric. (Alternatively, use paper.) Sit with your child at the table, and construct buildings,trees, houses, roads, etc. together. Use the entire table. Then have dinner on the town!
Geometric Pretzels
If you and your child enjoy cooking together, you can make geometric pretzels. Mix together 1package of dry yeast, 1 tablespoon of sugar, 11/2 cups of water, 1 teaspoon of salt, and 41/2 cupsof flour. Knead the dough for five minutes, adding a little flour if necessary. Pinch off chunks ofdough and roll them into “ropes” of different lengths. Shape these ropes into rectangles, squares,circles, and triangles of different sizes, and place them on a lightly greased cookie sheet. If youwish, you can brush them with a little water and sprinkle them with coarse salt. Bake for nineminutes at 475 degrees Fahrenheit.
City Stamps
Do you have old, flat sponges available? These can easily be cut into geometric shapes. Then, withtwo or three pie tins of colorful tempera paint, your child can stamp a city onto shelf paper. Thecompleted city can be hung as a mural in a play area or child’s bedroom.
© Copyright 1992-2003, Riverdeep Interactive Learning Limited.
Hello,
We've been using Millie’s
Math House to learn about
shapes.You can
play with shapes at
home, too.

What’s My Number?Overview
Students count objects and help Dorothy build number sentences. What’s My Number?emphasizes numeral recognition and addition and subtraction facts for the numbers 0 through 10.
Learning Opportunities� Recognize and read the numerals from 0 to 10� Understand that a number represents a certain quantity of objects, regardless of what the
objects are� Discover basic addition facts for the numbers 0 to 10 � Discover basic subtraction facts for the numbers 0 to 10� Recognize and read number sentences� Recognize the written or spoken number and the quantity it represents� Observe that number sentences are a means of mathematical communication
Together Time Activities (page 22)(To copy and send home) � Marble Bag� License Plate Search
Curriculum Connections (pages 57-62)� Number Tunes (Music)� Just Add Rain (Science)� Paint by the Numbers (Physical Education)� One of, Two of… (Art)� Arithmetic, Tac, Toe (Problem Solving)� Winner in a Flash (Problem Solving)
19
..
..
..
..
..
..
..
..
..
..
..
..
..
..
..
..
..
..
..
..
..
..
..
..
..
..
..
..
.

..
..
..
..
..
..
..
..
..
..
..
..
..
..
..
..
..
..
..
..
..
..
..
..
..
..
..
..
..
..
What’s My Number?
?
20
What’s My Number?
Question and Answer Mode� Click to enter What’s My Number? from the Main Room.
� A numeral appears on screen and its name is spoken aloud. Dorothy then asks you to solve acounting problem; for example:
“Can you put the same number of objects on your stage as I put on mine?”
� Click an object or drag it to the stage. After you have placed the objects on the stage, click thecurtain. (Click Dorothy to hear the problem again.)
� Click for addition problems. Dorothy asks you to solve a problem; for example:
“Can you put the same number of objects on your stage as I put on mine?”
- If you count out the correct number ofobjects, Dorothy opens her curtain andshows you the same number of objectson her stage.
- If you do not count out the correctnumber of objects, Dorothy asks you totry again. If you keep trying, you willalways find the correct answer.
Addition is selected.
Counting is selected.

What’s My Number?
?
21
..
..
..
..
..
..
..
..
..
..
..
..
..
..
..
..
..
..
..
..
..
..
..
..
..
..
..
..
.
� Click an object or drag it to the stage. After you have placed the objects on the stage, clickthe curtain. (Click Dorothy to hear the problem again.)
� Click for subtraction problems. Dorothy asks you to solve a problem; for example:
“Can you leave the samenumber of objects onyour stage as I left onmine?”
� Click an object or drag it off the stage. Click the curtain when the objects are on the stage.(Click Dorothy to hear the problem again.)
� Click to return to the Main Room.
- If you solve the problem correctly,Dorothy opens her curtain and showsyou the same number of objects on herstage.
- If you do not solve the problemcorrectly, Dorothy asks you to try again.If you keep trying, you will always findthe right answer.
- If you solve the problem correctly,Dorothy opens her curtain and showsyou the same number of objects on herstage.
- If you do not solve the problemcorrectly, Dorothy asks you to try again.If you keep trying, you will always findthe right answer.
Subtraction is selected.

..
..
..
..
..
..
..
..
..
..
..
..
..
..
..
..
..
..
..
..
..
..
..
..
..
..
..
..
..
..
What’s My Number?
22
What’s My Number?
Together TimeMarble Bag
Count out 3 marbles with your child and put them into a marble bag. Now say, “I’m going toadd 1 more marble.” Put another marble into the bag. Can your child guess how manymarbles are now in the bag? Count them together to check the answer. As you continue,switch roles and/or try more difficult problems. You can also try subtraction problems,beginning with a simple problem such as: Put 4 marbles in the bag; remove 1; guess howmany are left.
License Plate Search
This simple game helps time in the car pass quickly and teaches simple number skills as well.Ask your child to search license plates, looking first for a number 1, then a number 2,continuing to number 9. Meanwhile, you look for number 9 and work down to number 1.See who finishes first. To practice simple addition, alter the rules to allow credit if the first twonumbers on a license plate add up to the desired number. (For example, if your child needs anumber 3, a license plate beginning with 21 would work because 2+1=3.) Or, to practicesubtraction, allow credit if the difference between the first two numbers on a license plateequals the desired number.
Hi,
We’ve been playing with
numbers in Millie’s Math House. Here
are two more ideas to encourage
learning about counting,
addition, and subtraction.
© Copyright 1992-2003, Riverdeep Interactive Learning Limited.

..
..
..
..
..
..
..
..
..
..
..
..
..
..
..
..
..
..
..
..
..
..
..
..
..
..
..
..
.
23
Bing & BoingOverview
Bing and Boing are bouncing pals who help students create, recognize, and complete patterns. These patterns are special: each is made of pictures that make their own sounds.
Learning Opportunities� Create patterns� Complete patterns� Recognize that a pattern is made of regularly repeated parts� Understand that parts make up the whole
Together Time Activities (page 26)
(To copy and send home)� Name That Pattern� Patterns, Patterns, Everywhere
Curriculum Connections (pages 63-67)� Musical Motion (Music)� Headband Patterns (Art)� Meet Bing and Boing (Problem Solving)� People Patterns (Creative Dramatics)� Pattern Paths (Art)� All Mixed Up (Creative Dramatics)� Play That Pattern (Music)

Bing & Boing
Explore and Discover Mode� Click to enter Bing & Boing from the Main Room.
� Click from one to three pictures to try in a pattern; for example: . If you click morethan three, the new choices replace the original ones.
� Click Bing . Bing repeats the pattern you created and then hops along, playing the patternfor you to hear. Create and play as many patterns as you like.
Click for Click forone- to three- or one- to five-part patterns. part patterns.
..
..
..
..
..
..
..
..
..
..
..
..
..
..
..
..
..
..
..
..
..
..
..
..
..
..
..
..
..
..
24
Bing & Boing

..
..
..
..
..
..
..
..
..
..
..
..
..
..
..
..
..
..
..
..
..
..
..
..
..
..
..
..
.
Bing & Boing
25
?Bing & Boing
Question and Answer Mode� Click to enter the Question and Answer Mode.
� Click Boing when you are ready to watch and listen. Boing starts to play a pattern. Can youhelp finish it? (Click Boing to see and hear the pattern again.)
“What comes next?”
Click for Click fortwo- to three- or four- to five-part patterns. part patterns.
� Click the picture you think comes next.- If you are right, Boing completes - If you make a mistake, Boing and plays the pattern. stops and asks you to try again.
Try different patterns as long as you like. Just click Boing each time you want to play.
� Click for patterns with up to five parts.
�� Click for the Explore and Discover Mode, or click to return to the Main Room.

..
..
..
..
..
..
..
..
..
..
..
..
..
..
..
..
..
..
..
..
..
..
..
..
..
..
..
..
..
..
26
Bing & Boing
Together TimeName That Pattern
Clap out name patterns with your child. Start with your child’s name and repeatedly clap out“Jen -ni -fer, Jen -ni -fer,” for example. Then, clap out your name pattern. Take turns thinking of names and clapping them out together. Try using some long names from your child’s favorite stories, such as Cinderella or Rumpelstiltskin. For variety, you can play name patterns with back-to-back spoons or sticks on a board.
Patterns, Patterns, Everywhere
Help your child identify patterns in the environment. When you are out for a walk or drive together, look at window placement, patterns in flowers, and the arrangement of bricks or blocks on buildings. At home, point out patterns in quilts, fabrics, wood trim, wallpaper, and flooring. Your child may enjoy sketching some of these patterns.
Bing & Boing
Dear Friends,
We've had fun playing with
patterns in Millie’s Math House.
Here are some ideas to try at home.
© Copyright 1992-2003, Riverdeep Interactive Learning Limited.

..
..
..
..
..
..
..
..
..
..
..
..
..
..
..
..
..
..
..
..
..
..
..
..
..
..
..
..
.
27
Build-A-BugOverview
Students experiment with numbers by placing from one to ten eyes, ears, antennae, spots, feet,and tails on bugs. These bugs can be printed and colored.
Learning Opportunities� See numerals, hear them spoken, and see the corresponding quantity of objects� Understand that a number represents a certain quantity of objects, regardless of what the
objects are or how they are arranged� See the relationship of parts to a whole� Create a unique “work of art”� Hear both singular and plural forms of nouns; for example, one antenna, two antennae
Together Time Activities (page 30)
(To copy and send home) � Yummy Bugs� Big Bug Bread!
Curriculum Connections (pages 68-72)� How Many? (Language Arts)� Find Five (Science)� Mystery Bug (Art)� Count on Me (Science)� Bug Me! (Art)

..
..
..
..
..
..
..
..
..
..
..
..
..
..
..
..
..
..
..
..
..
..
..
..
..
..
..
..
..
..
28
Build-A-Bug
Build-A-Bug
Explore and Discover Mode� Click to enter Build-A-Bug from the Main Room.
� Click to choose a head for your bug. Click the bug’s head to hear it giggle.
� Click a bug part, then click a number. If you click and then , you will see:
� To move a bug part, drag the part from one place to another.
� To change your bug’s appearance, click new numbers and new parts. If you want to erase, clickthe bug part and then click zero.
� Click to print your bug. Once printed, you can color your unique bug.

..
..
..
..
..
..
..
..
..
..
..
..
..
..
..
..
..
..
..
..
..
..
..
..
..
..
..
..
.
29
?Build-A-Bug
Build-A-Bug
Question and Answer Mode� Click to enter Question and Answer Mode. The rabbit unrolls a plan and asks you to
build a bug; for example:
“Make a bug with five earsand two tails.”
� Following the directions given on the plan, click a bug part and a number. (Click the rabbit or theplan to hear the directions repeated.)
� Continue clicking the numbers and parts to complete bugs. You can keep building bugs as longas you like.
� Click for the Explore and Discover Mode, or click to return to the Main Room.
- If you select the correct number ofparts, you hear the number of partsspoken and the parts appear on the bug.
- If you do not select the correct numberof parts, the rabbit repeats the requestfor the number of parts again.

..
..
..
..
..
..
..
..
..
..
..
..
..
..
..
..
..
..
..
..
..
..
..
..
..
..
..
..
..
..
30
Build-A-Bug
Together TimeYummy Bugs
Open the cupboards and the refrigerator. It is time to create yummy bugs for your dining enjoyment!With your child, count out the right number of small plates for your family. Then let your child create a different salad on each plate. Peach or pear halves make good bodies. Radishes, apricots,or marshmallows can serve as heads. An assortment of nuts, raisins, carrots sticks, grapes, etc. canbe counted out and added for different bug parts. Your child can have fun deciding who will enjoydevouring each bug.
Big Bug Bread!
You and your child can create a giant bug from bread dough. Set aside about a third of the doughto use for the small bug parts. Shape the rest of the loaf into a head and a body, using a littlewater to stick them together. Then, using the remaining dough, shape and add feet, eyes, ears,etc. Count with your child as these parts are added. After baking, share the BIG BUG BREAD withyour family for dinner!
Build-A-Bug
Hi,
Wow! We have created some
great bugs in Millie’s Math
House. We counted the spots, ears,
antennae, etc. It would be fun to
make bugs at home, too.
© Copyright 1992-2003, Riverdeep Interactive Learning Limited.

..
..
..
..
..
..
..
..
..
..
..
..
..
..
..
..
..
..
..
..
..
..
..
..
..
..
..
..
.
31
Number MachineOverview
The Number Machine houses critters who help students count and recognize the numerals 0–30.
Learning Opportunities� See the numerals 0–30 and hear them spoken� Recognize and read numerals� Hear the numbers 1–30 counted � Understand that a number represents a certain quantity of objects, regardless of what the
objects are� Hear both the singular and plural forms of nouns; for example, one mouse, two mice, one bee,
three bees
Together Time Activities (page 34)
(To copy and send home)� Book Look� Snip That Number
Curriculum Connections (pages 73-76)� Nonsense Poetry (Language Arts)� Count on Action (Physical Education)� Our Town Countdown (Social Studies)� Door Decor (Science)� Nutrition Numbers (Science)

..
..
..
..
..
..
..
..
..
..
..
..
..
..
..
..
..
..
..
..
..
..
..
..
..
..
..
..
..
..
32
Number Machine
Number Machine
Explore and Discover Mode� Click to enter the Number Machine from the Main Room.
� Click any key on the Number Machine. The number you chose is shown , the drawer opens, and the critters pop up one-by-one. As they pop up, they are counted; forexample:
“One, two. Two mice.”
� Continue exploring the Number Machine by clicking different keys and discovering the othercritters that live in the drawer. You might like to count aloud as you see the numerals and hearthe number of critters counted.
“One, two, three, four, five. Five lizards.”
� Click for numbers 10 –20.
� Click for numbers 20 –30.
� Click for the Question and Answer Mode, or click to return to the Main Room.
Numbers 0–10 currently selected.

..
..
..
..
..
..
..
..
..
..
..
..
..
..
..
..
..
..
..
..
..
..
..
..
..
..
..
..
.
?Number Machine
33
Number Machine
Question and Answer Mode� Click to enter the Question and Answer Mode.
� Annie, the worm, appears and asks you to find a specific number; for example:
“Find the number 3.”
� Try to find the number requested, and click that key. (If you forget what the number is, clickAnnie, the worm, for a reminder.)
- If you are correct, the drawer - If you do not click the keyopens and the critters requested, you can keep tryingpop up and are counted. until you find it.
Annie, the worm, continues asking you to find different numbers. Don’t be concerned about making mistakes; if you keep trying, you will always find the right answer!
� Click for numbers 10–20.
� Click for numbers 20–30.
� Click for the Explore and Discover Mode, or click to return to the Main Room.
Numbers 0–10 currently selected.
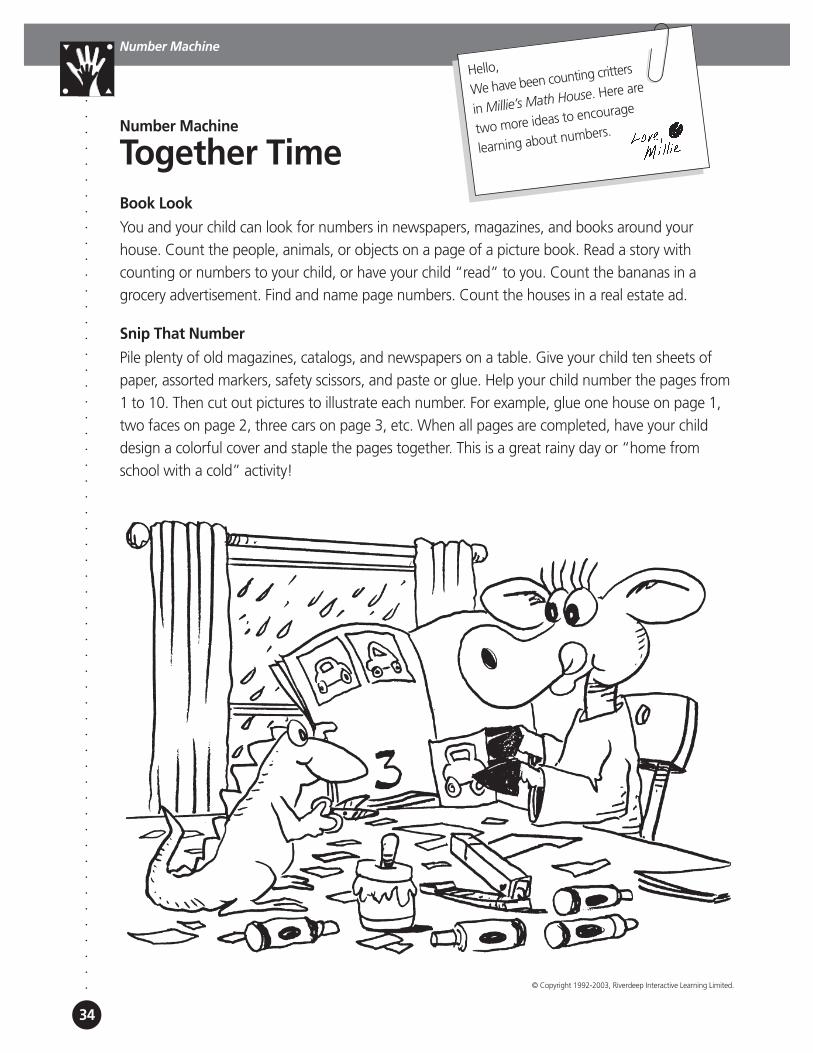
..
..
..
..
..
..
..
..
..
..
..
..
..
..
..
..
..
..
..
..
..
..
..
..
..
..
..
..
..
..
34
Number Machine
Together TimeBook Look
You and your child can look for numbers in newspapers, magazines, and books around yourhouse. Count the people, animals, or objects on a page of a picture book. Read a story with counting or numbers to your child, or have your child “read” to you. Count the bananas in a grocery advertisement. Find and name page numbers. Count the houses in a real estate ad.
Snip That Number
Pile plenty of old magazines, catalogs, and newspapers on a table. Give your child ten sheets ofpaper, assorted markers, safety scissors, and paste or glue. Help your child number the pages from1 to 10. Then cut out pictures to illustrate each number. For example, glue one house on page 1,two faces on page 2, three cars on page 3, etc. When all pages are completed, have your childdesign a colorful cover and staple the pages together. This is a great rainy day or “home fromschool with a cold” activity!
Number Machine
Hello,
We have been counting critters
in Millie’s Math House. Here are
two more ideas to encourage
learning about numbers.
© Copyright 1992-2003, Riverdeep Interactive Learning Limited.
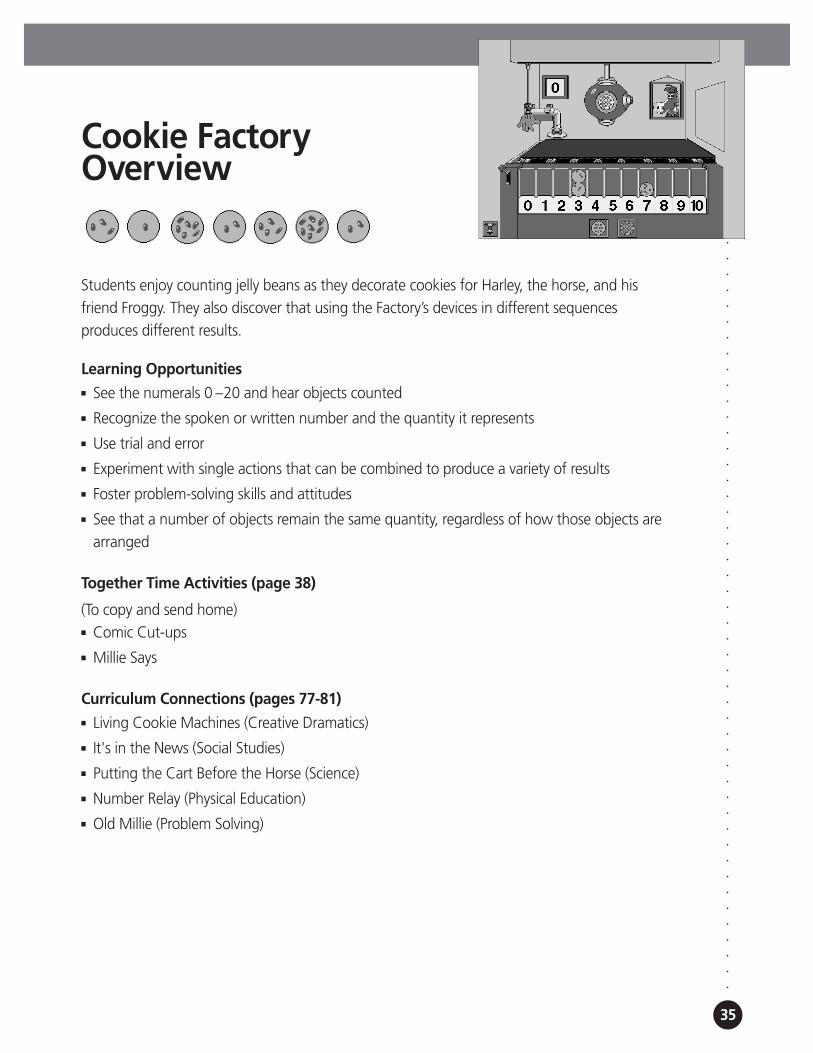
..
..
..
..
..
..
..
..
..
..
..
..
..
..
..
..
..
..
..
..
..
..
..
..
..
..
..
..
.
35
Cookie FactoryOverview
Students enjoy counting jelly beans as they decorate cookies for Harley, the horse, and his friend Froggy. They also discover that using the Factory’s devices in different sequences produces different results.
Learning Opportunities� See the numerals 0 –20 and hear objects counted� Recognize the spoken or written number and the quantity it represents� Use trial and error� Experiment with single actions that can be combined to produce a variety of results� Foster problem-solving skills and attitudes� See that a number of objects remain the same quantity, regardless of how those objects are
arranged
Together Time Activities (page 38)
(To copy and send home)� Comic Cut-ups� Millie Says
Curriculum Connections (pages 77-81)� Living Cookie Machines (Creative Dramatics)� It's in the News (Social Studies)� Putting the Cart Before the Horse (Science)� Number Relay (Physical Education)� Old Millie (Problem Solving)

..
..
..
..
..
..
..
..
..
..
..
..
..
..
..
..
..
..
..
..
..
..
..
..
..
..
..
..
..
..
Cookie Factory
36
Cookie Factory
Explore and Discover ModeLet your students click different devices in the Cookie Factory to discover the function of each one. At first, students may see each device in isolation. At some point, they will discover that clicking devices in different sequences will produce different results. The sequence below decorates and sorts cookies, but let students use trial and error to discover this independently!
� Click to enter the Cookie Factory from the Main Room.
� Click the cookie pipe to make a cookie appear.
� Click the conveyor belt lever to move the cookie under the jelly bean dispenser.
� Decorate the cookie by clicking the jelly bean dispenser as many times as you want. Thenumber of jelly beans will be counted aloud and shown on the jelly bean meter as they droponto the cookie, for example:
“One, two.”Two jelly beans
on the cookie
Bins with numbers 0–10 selected.
� Click the hand to move the cookie into a bin, or click the lever to move the cookie alongthe conveyor belt. Make and decorate as many cookies as you want.
� Click for bins with numbers 10–20.
� Click for the Question and Answer Mode, or click to return to the Main Room.

..
..
..
..
..
..
..
..
..
..
..
..
..
..
..
..
..
..
..
..
..
..
..
..
..
..
..
..
.
Cookie Factory
37
?Cookie Factory
Question and Answer Mode� Click to enter the Question and Answer Mode.� A cookie drops and moves under the jelly bean dispenser. Then Harley asks you to put
jelly beans on it; for example:
“Put three jelly beans on mycookie, please.”
� Click the jelly bean dispenser once for each jelly bean Harley requested. Then click the handto feed the cookie to Harley. (Click Harley if you want to hear the request again.)
You can continue decorating cookies for Harley as long as you like.
� Click for the Explore and Discover Mode, or click to return to the Main Room.
- If you count out the numberof jelly beans requested,Harley thanks you and gobbles the cookie!
- If you count out too many ortoo few jelly beans, Froggygets to eat the cookie and you get to try again.

..
..
..
..
..
..
..
..
..
..
..
..
..
..
..
..
..
..
..
..
..
..
..
..
..
..
..
..
..
..
Cookie Factory
Together TimeComic Cut-ups
Cut out a comic strip (appropriate for your child) from the daily paper. Read the comic to yourchild and discuss what happens first, second, third, etc. Then cut the frames apart, shuffle them,and lay them out in a new order. Read the “new comic strip”and discuss the difference. Then letyour child try arranging the frames into their original order.
Millie Says
Enjoy the fair weather and play “Millie Says” while you are outside in the yard or park. Make arequest, such as “Millie says, ‘Take 9 giant steps toward the tree.’” Count the giant steps together.Then make another request, such as “Millie says, ’Take 12 tiny hops sideways toward the house.’”Count aloud together as your child hops. Switch roles, and let your child be Millie.
Cookie Factory
38
Hi,
We experimented to discover
how the Cookie Factory works in
Millie’s Math House. Then we counted
jelly beans as we decorated cookies.
These two activities might be
fun to try at home.
© Copyright 1992-2003, Riverdeep Interactive Learning Limited.

39
..
..
..
..
..
..
..
..
..
..
..
..
..
..
..
..
..
..
..
..
..
..
..
..
..
..
..
..
..
Curriculum ConnectionsIntroductionThe learning opportunities in Millie’s Math House can be reinforced throughout the school day in many curricular areas. On the following pages you will find ideas to add to those you may havealready tried. These Curriculum Connections activities are grouped by the corresponding Millie’sMath House activity room (see the chart below).
Some of the Curriculum Connections work well before using the corresponding parts of the software. Others work well as follow-up experiences. Most can be used before or after studentsplay in the Math House. Pick and choose activities according to your students’ needs as well asyour computer equipment, facilities, resources, and schedule. There are many different ways to use Millie’s Math House and Curriculum Connections; use them to stimulate your own imaginationas you plan experiences for your students.
Reproducible activity sheets are also included. These can be used in a variety of ways (for studentwork, transparencies, labels, etc.), some of which are suggested in Curriculum Connections. Inaddition, there are two reproducible pages of Math House characters to use on your chalkboard,bulletin board, or computer.

Little, Middle, What’s My Number Cookie & Big Mouse House Number? Bing & Boing Build-A-Bug Machine Factory
(pages 44-49) (pages 50-56) (pages 57-62) (pages 63-67) (pages 68-72) (pages 73-76) (pages 77-81)Art � Size � Funny Faces � One of… � Headband � Mystery Bug
Collages � Our Town Two of… Patterns � Bug Me!� Shadow Play � Pattern Paths
Creative � People � Living CookieDramatics Patterns Machines
� All Mixed UpLanguage � Size Up � I Spy Shapes � How Many? � Nonsense Arts the World Poetry
� Trash andTreasure
� So ManyWays to Say It
Music � Number � Musical Tunes Motion!
� Play That Pattern
Physical � Team Shapes � Paint by the � Count on � Number Education � What Shape Numbers Action Relay
Are You In?Problem � Arithmetic, � Meet Bing � Old MillieSolving Tac, Toe and Boing
� Winner ina Flash
Science � Seeing It All � Sort It Out � Just Add � Find Five � Door Decor � Putting the � What Size, � All Shapes Rain � Count � Nutrition Cart Before
Please? and Sizes on Me Numbers the Horse� Color Me Little
Social � Our Town � It’s in the Studies Countdown News
40
..
..
..
..
..
..
..
..
..
..
..
..
..
..
..
..
..
..
..
..
..
..
..
..
..
..
..
..
..
.
Activity Chart

Characters for Bulletin Boards, Posters, and ChalkboardsPages 42 and 43 can be used to “hold” messages for bulletin boards, computers, and chalkboards.Copy, color, and cut out the character. For bulletin boards, slip the character’s hands over the messageand staple or tape into place. To use the character on the chalkboard, mount the character on thechalkboard and draw a rectangular sign for the character to “hold.” Then write the informationinside the rectangle. These pages can also be reproduced to serve as posters near the computer.You can write in current assignments, notes of encouragement, etc.
41
..
..
..
..
..
..
..
..
..
..
..
..
..
..
..
..
..
..
..
..
..
..
..
..
..
..
..
..
..

42
Mill
ie1.
Cop
y on
hea
vy p
aper
. (O
r cop
y, co
lor,
and
glue
to ta
gboa
rd.)
2. C
olor
.
3. C
ut o
ut.
4. S
lit o
n do
tted
line
s.
5. S
ee p
age
41 fo
r su
gges
ted
uses
.
©©
Cop
yrig
ht 1
992-
2003
, Riv
erde
ep In
tera
ctiv
e Le
arni
ng L
imite
d.
Rem
ove
this
sect
ion
if us
ing
on c
halk
boar
d

43
Fran
k Ll
oyd
Mou
se1.
Cop
y on
hea
vy p
aper
. (O
r cop
y, co
lor,
and
glue
to ta
gboa
rd.)
2. C
olor
.
3. C
ut o
ut.
4. S
ee p
age
41 fo
r su
gges
ted
uses
.
©C
opyr
ight
199
2-20
03, R
iver
deep
Inte
ract
ive
Lear
ning
Lim
ited.

Little, Middle, & BigSize Collages ArtMake one copy of page 47, and have a volunteer color and cut out the shoes. Use these shoes to label a bulletin board with sections for small, medium, and large. Explain that the class will be making a collage for each size. Ask students to cut out pictures of animals, people, boats, cars,etc. of different sizes from magazines and catalogs. Put them on the board as you talk about different sizes. (You may want to help students establish some guidelines. For example, “large”might include pictures of things at least as large as a refrigerator.) Encourage students to use otherwords for sizes, such as tiny, petite, gigantic, huge, etc.
Size Up the World Language ArtsSmall, smaller, smallest. Long, longer, longest. Compare sizes by lining up three stuffed animals,toy trucks, or boxes and asking questions: “Which is smallest?” “Which is tallest?” Then comparetwo objects by talking about which is larger, longer, etc. Encourage students to use words thatdescribe size when they talk. Have students create complete sentences to compare sizes. Forexample, “The red truck is the largest. The yellow truck is larger than the blue truck. The bluetruck is the smallest.” If desired, use a ruler or tape measure to measure the three objects. Recordeach measurement on a piece of masking tape and place on the object.
44
..
..
..
..
..
..
..
..
..
..
..
..
..
..
..
..
..
..
..
..
..
..
..
..
..
..
..
..
..
.

Trash and Treasure Language ArtsMake one copy of page 47 and have a volunteer color and cut out the shoes. Label three smalltables or extra desks with the headings. Explain tostudents that over the next week they can addobjects to the tables: things they find while walkingto school (leaves, rocks, etc.); things from a “junkdrawer” at home (tennis balls, old candles, etc.);things they have made (clay sculptures, pencil holders, etc.); or things from the classroom that arenot in use (basketball, rubber bands, etc.). Remind students not to collect objects that are dangerousor unclean and not to disturb living plants or animals. Once the display is complete, have studentscompose a story or poem, mentioning as many ofthese objects as possible. Invite the class to composethe poem while the teacher records it on the chalkboard or on a large piece of paper, or letgroups dictate their poems to a classroom aide. Apoem can be modeled after the adjacent one byusing the first two words of each line and theentire last line.
Seeing It All ScienceStudents can sharpen their observation and memory skills using the “trash and treasure” display(from the above activity). Have students observe the table of large objects for thirty seconds andthen turn their backs to the table. As students call out the names of objects they remember, theteacher records them on the chalkboard. Repeat the process for the other two tables.
So Many Ways to Say It Language ArtsReproduce page 47 and have students color the shoes. Hang three long strips of shelf or freezerpaper on the wall. At the top of each, place one of the headings (Small, Medium, or Large).Encourage students to think of and write down words that have meanings similar to the headingwords (or set aside a specific time to write down the words your students suggest). Leave thesepapers up for a few weeks so students can add and discuss the words. Use these word lists forvocabulary building activities, such as constructing sentences describing unusual objects.
45
..
..
..
..
..
..
..
..
..
..
..
..
..
..
..
..
..
..
..
..
..
..
..
..
..
..
..
..
..

What Size, Please? ScienceIn this activity, students categorize objects. Make copies of page 48 for your students. As a class,list trucks that are large (moving trucks, garbagetrucks, etc.), trucks that are medium-sized (milktrucks, bread trucks, etc.), and trucks that are small(mail trucks, meter checker trucks, etc.) on the chalkboard. Distribute the activity sheet and discussthe first row (plants). Ask the class, “Can you think ofa little plant?” (violet or pansy) “Draw it in the boxunder the little character.” “Can you think of a medium-sized plant?” (bush or house plant) “Draw it in the box under the character for middle.” “Canyou think of a large plant?” (tree) “Draw it in the box under the big character.” Then allow time forstudents to complete the rest of the activity sheetindependently. When all students are done, have student volunteers share their ideas with the class.
Color Me Little ScienceReproduce page 49 for students. As students learnabout color, they can also learn about categorizing bysize. Distribute the activity sheet and instruct studentsto color the characters: Little — yellow; Middle —red; and Big — green. Then explain that thesecharacters provide the clues that tell them how tocomplete the sheet: color all little objects yellow; allmedium-sized objects red; and all big objects green.Ask students to locate the three spiders on theiractivity sheets. Tell them to color the littlest spideryellow, the medium-sized spider red, and the bigspider green. Have them continue on their own, firstlocating three sizes of the object, and then coloringaccording to the key.
46
..
..
..
..
..
..
..
..
..
..
..
..
..
..
..
..
..
..
..
..
..
..
..
..
..
..
..
..
..
.
Plants
Animals
Birds
Little Middle Big
Little
MiddleBig

47©Copyright 1992-2003, Riverdeep Interactive Learning Limited.
Little, Middle,& Big
Use with “Size Collages” (page 44), “Trash and Treasure” (page 45), and “So Many Ways to Say It” (page 45).
48 Use with “What Size, Please?” (page 46). ©Copyright 1992-2003, Riverdeep Interactive Learning Limited.
Plants
Animals
Birds
Middle BigLittle

49Use with “Color Me Little” (page 46). ©Copyright 1992-2003, Riverdeep Interactive Learning Limited.
Little
MiddleBig

Mouse HouseI Spy Shapes Language ArtsReview the characteristics of each geometric shape with your class: A triangle has three sides; asquare has four equal sides, etc. Describe an object in the room to your class: “I see somethingthat is shaped like a rectangle and is made of wood. What is it?” Let the student who guesses theobject describe the next object to be found.
Funny Faces ArtDraw and discuss the following geometric shapes on the chalkboard: square, triangle, rectangle,circle, and half-circle. Ask a student to draw a funny face on the chalkboard, using these shapes.Then ask another student to describe the face to the class, using the names of the shapes.
To make this a collaborative drawing activity, have students work with partners. All students willneed pencil, paper, and something sturdy under the paper. Have each pair sit back-to-back. Asone student draws and says aloud what is being drawn (for example, “I’m drawing a large circlefor a head. Now I’m using small triangles for ears.”), the other student “copies” the drawing,relying on the verbal information for directions. When the drawings are finished, have studentscompare results and see the variation achieved using the same shapes (see the examples below).Then have students switch roles.
50
..
..
..
..
..
..
..
..
..
..
..
..
..
..
..
..
..
..
..
..
..
..
..
..
..
..
..
..
..
.

Shape Sets Make a copy of pages 54 and 55 (for each student) on the heaviest paper your copierwill accommodate. Have students color the shapes as they choose and cut them out. These shapesets can be stored in old envelopes. Students can use the shape sets for the following three activities:
Our Town ArtRoll out several long pieces of shelf or freezer paper across the classroom or art room floor. Havestudents bring their shape sets and crayons with them to work on a classroom town. Students canwork in small groups or individually, tracing around their shapes along the paper (or gluing theirshapes to the paper) to design buildings, trees, vehicles, etc. Once the shapes are outlined (or gluedin place), have the students add details and fill in with color. Hang the completed artworkin the classroom. Then, play “How many?” with your students and ask questions such as the following: “How many triangles between this tree and this bush?” “How many yellow squares arethere in our paper town?” Student volunteers can also ask “how many.”
Shadow Play ArtSet up a station where students can make shadow pictures using an overhead projector. Have students combine different shapes on the projector surface and then turn on the projector to seethe shadow picture on the screen or wall. They may enjoy working at this station in pairs with onestudent composing the picture and the other guessing what it is.
Sort It Out ScienceEach student will need a shape set for this categorizing activity. Start by asking students to sort theshapes into two groups: shapes that are circles and shapes that are not circles. Then have student volunteers make up rules for sorting the shapes. Some suggestions include:
Two groups:� big shapes and little shapes� shapes with some straight lines and shapes with no straight lines� shapes with four sides and shapes with a different number of sides� shapes that are yellow and shapes that are not yellow (if students
colored their shapes)
Three groups:� shapes with curves, shapes with three straight sides, shapes with four straight sides� big shapes, medium-sized shapes, little shapes
51
..
..
..
..
..
..
..
..
..
..
..
..
..
..
..
..
..
..
..
..
..
..
..
..
..
..
..
..
..

All Shapes and Sizes SciencePage 56 can be used to sharpen categorizing skills, while working with shapes. There are manyways to use the sheet; two are suggested below:
� Make page 56 into a transparency, and use it to introduce Mouse House to your students.Talk about the different shapes and their characteristics. Have students point out all ofthe rectangles in a picture, all of the circles, etc.
� Make a copy of page 56 for each student.Beginning with the first picture, instructstudents to pick a different color to fill in eachshape along the right-hand side of the page(for example, yellow square, red triangle, etc.).Then have students color all of the shapes inthe picture according to this key. Lastly, havethem count the shapes and fill in the blanks atthe right. For the next picture, they may wantto change the color key.
Crazy Quilt ArtIf possible, introduce this activity by showing the students quilts or pictures of quilts. Discuss howquilts have been made for many years and often can give us a glimpse into the times in whichthey were created. Explain how quilt making is a useful way to recycle fabric from old clothing andto utilize leftover fabric scraps. Give each student a 4-inch square of white paper; these will be thequilt blocks. Have students fill their blocks with the geometric shapes they used in the MouseHouse. (You may want to draw the geometric shapes on the board for reference.) They canarrange the shapes into any design they wish and fill the blocks with as much color as possible.When they have finished, assemble the blocks by stapling them edge-to-edge onto a bulletinboard. As a class, discuss the variety and repetition in the quilt. (You can also do this activity with small precut geometric shapes, asking students to color and then glue the shapes to theirquilt blocks.)
52
..
..
..
..
..
..
..
..
..
..
..
..
..
..
..
..
..
..
..
..
..
..
..
..
..
..
..
..
..
.
All Shapes and SizesHow Many?
How Many?
How Many?

Team Shapes Physical EducationUsing paper from a recycling box, cut out an equal number of rectangles, squares, triangles, half-circles, and circles. The total number of shapes should equal the number of students in yourclass. (For example, if you have 20 students, you will need four of each of the five shapes.) Whenyou need to group students into teams, distribute the shapes randomly to the students. Then, tomake up five teams, explain that all of the triangles will be a team, all of the rectangles will be ateam, etc. If you want to make up two teams instead of four, you can have two types of shapeson a team. For example, one team can be squares and triangles. The other team can be circles and rectangles.
What Shape Are You In? Physical EducationUsing chalk on the playground (or tape on the gymnasium floor), mark off very large shapes. You can use some or all of the shapes from Mouse House (square, rectangle, circle, triangle, andhalf-circle). Have students walk along the edges of each shape as they quietly say the name of theshape aloud. Next divide the class into the same number of groups as there are shapes. Write anactivity key on the chalkboard (or post a key written on tagboard). You might like to try the following:
Assign each group to stand inside one of the shapes and then consult the activity key to see whatthey should do first. A student leader rings a bell or says “go” when it is time to start the activity.After a few minutes, the leader instructs the groups to rotate to the next shape, consult the activitykey, and begin the activity for that shape. Continue the rotation until all groups have been in all ofthe shapes. This is a good activity for warm-up or cool-down time in physical education.
53
..
..
..
..
..
..
..
..
..
..
..
..
..
..
..
..
..
..
..
..
..
..
..
..
..
..
..
..
..
Jog in place.
JumpingJacks
Balance on onefoot.
CurlUps
Jump onone foot.

54
©C
opyr
ight
199
2-20
03, R
iver
deep
Inte
ract
ive
Lear
ning
Lim
ited.
Shap
e Se
tsU
se w
ith “
Our
Tow
n,”
“Sha
dow
Pla
y,”
and
“Sor
t It O
ut”
(pag
e 51
).

55Use with “Our Town,” “Shadow Play,” and “Sort It Out” (page 51). ©Copyright 1992-2003, Riverdeep Interactive Learning Limited.
Shape Sets (continued)

56 Use with “All Shapes and Sizes” (page 52). ©Copyright 1992-2003, Riverdeep Interactive Learning Limited.
All Shapes and SizesHow Many?
How Many?
How Many?

What’s My Number?Number Tunes MusicIf students are not already familiar with number songs, introduce them to songs such as, “TheAnts Go Marching.” Encourage participation by selecting ten volunteers (one for each verse).While the whole class sings, “The ants go marching one by one . . .”, the first volunteer marchesaround the room, pausing only when it is time to say or sing a made-up line, such as, “The firstone ate my hot dog bun.”Continue adding volunteers for each successive verse, the last volunteeralways making up the new line. Repeat the activity on other days with a different ten studentsuntil all have had a chance to march.
Just Add Rain ScienceFollow these three steps to make a rain gauge.
Using water from a pitcher, demonstrate howrain is collected and measured. Have studentstake turns determining the amount of “rainfall”when water is added to an empty gauge, as wellas when water is added to a partially filled gauge (“If there were two inches of rain in the gauge,and now there are four inches, how many incheshas it rained?”). Liven up rainy days by setting thegauge outside, near a classroom window, for realworld measurements. Mention other types ofinstruments used for measuring (thermometers,barometers, etc.) and discuss why thesemeasurements are important.
Paint by the Numbers Physical EducationAs a cool-down activity after an outdoor physical education period, here’s a fun way for studentsto practice writing and solving equations. Pair students to work together, outfitting each pair with an old paintbrush and a plastic bucket of water. After the first student “paints” an equation (for example, 2+1 = ) on the sidewalk or blacktop, the second student quickly “paints”the answer before the equation dries up and disappears. Encourage students to switch roles after each equation.
57
..
..
..
..
..
..
..
..
..
..
..
..
..
..
..
..
..
..
..
..
..
..
..
..
..
..
..
..
..
Step 1: Step 2:
plasticsoda popbottle
Cut here.
Measure upfrom thebottom tomark inches(or cm).
maskingtape
Step 3:

58
..
..
..
..
..
..
..
..
..
..
..
..
..
..
..
..
..
..
..
..
..
..
..
..
..
..
..
..
..
.
One of, Two of… ArtMake pages 60 and 61 into transparencies. Using an overhead projector, show one of the pageson a screen. Ask students to think of something there is “zero of” (elephants, trees, whales, etc.)in the classroom. Explain that nothing is drawn next to the numeral 0 on the transparency becausethere are no elephants (for example) in the classroom. Then ask students to find something there is“just one of” (teacher, clock, window) in the classroom and have a volunteer draw it next to thenumeral 1. Continue the activity for each of the numerals. A fun variation of this activity is to project the image onto a large sheet of white paper instead of a screen. Then volunteers can draw on the paper instead of the transparency. Or, turn this into a “cut and paste” activity foryounger students, using old magazines or catalogs.
Older students may be able to do this activity individually or in pairs. Distribute copies of pages andlet students work independently. The completed papers can be posted on a bulletin board forstudents to enjoy the variety of responses.
0 2 31
4 6
5
7
8 9
10

Arithmetic, Tac, Toe Problem SolvingTo prepare for this two-player equation game, first collect ten milk-bottle caps and mark each witha number from 1 to 5 (two bottle caps for each number). Drop all the bottle caps into a bag andshake them up. Next make a copy of page 62 and cut the game boards apart. Set one aside toplay later. You are now ready to explain the game to the students.
The first player selects two bottle caps from the bag and draws an X on the square that displaysthe sum of the bottle cap numbers. For example, if the player selected a 2 and a 3, the playerwould draw an X on the square with the number 5. The second player then takes a turn, drawingtwo bottle caps and placing an O on the correct square. If a square has already been marked, theplayer must pass. Like traditional tic-tac-toe, the winner is the player to first draw a straight linethrough three X’s or three O’s.
Winner in a Flash Problem SolvingPlay a favorite board game, using a deck of equation flashcards instead of the game’s dice orspinner. At the start of a player’s turn, the player draws a flashcard and must correctly answer theequation in order to move the game piece (by as many spaces as the equation answer).
59
..
..
..
..
..
..
..
..
..
..
..
..
..
..
..
..
..
..
..
..
..
..
..
..
..
..
..
..
..

60 Use with “One of, Two of...” (page 58). ©Copyright 1992-2003, Riverdeep Interactive Learning Limited.
0 2 31
4 6
5
7

61Use with “One of, Two of...” (page 58). ©Copyright 1992-2003, Riverdeep Interactive Learning Limited.
8 9
10

62
3 9 8
5 7 6
2 4 10
10 2 7
4 6 5
8 9 3U
se w
ith “
Arit
hmet
ic, T
ac, T
oe”
(pag
e 59
).©
Cop
yrig
ht 1
992-
2003
, Riv
erde
ep In
tera
ctiv
e Le
arni
ng L
imite
d.

Bing & BoingMusical Motion! MusicStudents can use many kinds of sounds, hand claps, and foot stomps to make patterns. Beginwith a two-part pattern, such as a “Bing” in a high voice, followed by a “Boing” in a low voice.Then add a hand clap for a three-part pattern (Bing, Boing, clap; Bing, Boing, clap; etc.). Aftersome practice, students can make up their own sound patterns. Some sample patterns include:
Two-part patterns � Bing, stomp; Bing, stomp; Bing, stomp.� Click, clap; click, clap; click, clap.
Three-part patterns� Clap, clap, Boing; clap, clap, Boing.� Stomp, Bing, clap; stomp, Bing, clap.
Headband Patterns ArtPull out your favorite rubber stamps, cut calculator tape for headbands or wristbands, and stampout a pattern. For example, a student might stamp out 2 frogs, 1 cat; 2 frogs, 1 cat, etc. Glue orstaple the ends together to make headbands or wristbands. If you don’t have stamps or calculatortape, ask students to create their own patterns with crayons on precut strips of paper.
Meet Bing and Boing Problem SolvingMake page 66 into a transparency. This activity helpsdevelop problem-solving skills as studentsanalyze patterns and anticipate what comes next. It is alsoan effective tool for introducing Bing & Boing to the class.Once you have made the transparency, cut it into pieces.Use some of the pieces to lay out a two-part pattern on the overhead projector surface (forexample, star, square; star, square). Arrange the remainingpieces at the bottom on the projector surface. Turn on theprojector and add one more star to the pattern. Ask ifanyone knows what comes next. Have a volunteer movethe square into place. Ask the class to repeat the patternaloud together, “Star, square; star, square; star, square.”Then let a student lay out a new pattern and call on a classmate to complete it.
63
..
..
..
..
..
..
..
..
..
..
..
..
..
..
..
..
..
..
..
..
..
..
..
..
..
..
..
..
..

People Patterns Creative DramaticsDivide the class into groups of six students each. Have each group model positions, gestures, and facial expressions and organize themselves into a two-part or three-part pattern. For example,one student pattern might include two frowning students, one smiling student; two frowning students, one smiling student. Another pattern might include one sitting student, one standingstudent, one student with back to class; one sitting student, one standing student, one studentwith back to class. Have student groups take turns “setting up their patterns” in front of the class.Then, as a volunteer points to each student in the group, the class calls out each part of thepattern.
Pattern Paths ArtMake copies of page 66 for your students and have them cut the copies into pieces. (Keep thepieces in old envelopes or clipped together with paper clips.) Students can work together ingroups of two to four. The first student starts the pattern by laying down two or three pieces.Thereafter, students take turns placing one piece at a time, maintaining the pattern. Students can make the pattern “turn corners” and change direction, but each new piece must touch theprevious piece on one (and only one) side. Interesting designs will form as the pattern is repeated,especially if students combine pieces from all of their envelopes.
All Mixed Up Creative DramaticsRead the story The Cow That Went Oink (by Bernard Most; Harcourt Brace Jovanovich, Publishers)to the class. Let volunteers make the sounds of different animals. Then talk together about whatsounds seem funny. For example, a bunny that moos, an elephant that quacks, etc. Talk about thesounds students hear in Bing & Boing.
64
..
..
..
..
..
..
..
..
..
..
..
..
..
..
..
..
..
..
..
..
..
..
..
..
..
..
..
..
..
.

Play That Pattern MusicMake copies of page 67 for your students and one extra copy. Using the extra copy, cut out the four small pattern pieces at the top of the page. With removable tape, attach these patternpieces to four different keys of a xylophone or piano. (Alternatively, the pattern pieces can beattached to four different rhythm instruments.) Have students bring their activity sheets with them when it is their turn to try playing the instrument. (Two or three students will need to worktogether if they are using rhythm instruments.) Encourage them to play the patterns on the activity sheet and then to invent patterns of their own. The activity sheet is designed for studentsto invent one two-part pattern and one three-part pattern.
65
..
..
..
..
..
..
..
..
..
..
..
..
..
..
..
..
..
..
..
..
..
..
..
..
..
..
..
..
..
Play these patterns.
Make your own patterns.

66 Use with “Meet Bing and Boing” (page 63) and “Pattern Paths” (page 64). ©Copyright 1992-2003, Riverdeep Interactive Learning Limited.

67Use with “Play That Pattern” (page 65). ©Copyright 1992-2003, Riverdeep Interactive Learning Limited.
Play these patterns.
Make your own patterns.

Build-A-BugHow Many? Language ArtsPost printouts of students’ bug creations (from Build-A-Bug) on the bulletin board. Ask one studentat a time: “Can you find a bug with 3 eyes?” “Can you find a bug with 6 legs?” To make it morechallenging ask, “Can you find a bug with 2 ears and 5 spots?”
For a variation of this activity, copy pages 70 and 71. If desired, color the title on page 70 and useit as a title for the bulletin board. Cut out the word cards and put them in a box or sack. Let a student draw out a card. After noting the singular and plural forms of the word (for example,”eye” and “eyes”), ask the student a question about the word such as “Can you find a bug with4 eyes?” Or, let students formulate the questions and/or draw two cards at a time. For example,“Which bug has 4 eyes and 2 spots?” When you have completed the activity, add the word cardsto your bulletin board display.
Find Five SciencePlay this game to give students practice in sorting and counting. Ask students to find 1 tall thing;find 2 short things; find 3 green things; find 4 round things; and so forth. Then let the childrenchoose what and how many to find.
Mystery Bug ArtDivide the students into groups of six students each. Each group will need a large sheet of whitepaper, scissors, glue, and scraps of colored paper. First, the members of the group design a bugbody and head and glue it to the white paper. Then, each member of the group is assigned a bugpart. That member determines how many spots, eyes, etc., the bug will have and cuts them outof the colored paper scraps. Group members take turns gluing the parts onto the bug as thegroup counts, for example, “One, two, three spots.” When every group is finished, they can sharetheir bugs with the rest of the class or post them on a bulletin board labeled “Bug Zoo.”
68
..
..
..
..
..
..
..
..
..
..
..
..
..
..
..
..
..
..
..
..
..
..
..
..
..
..
..
..
..
.

Count on Me ScienceMake two copies of page 80 on the heaviest paper your copier will accommodate. If possible laminate the paper. Cut the cards apart and have them available for pairs of students to sharpentheir observation skills by playing “Count on Me.” To play, students take turns drawing a cardfrom the stack and then finding something of the same number on their own clothing or body.For example, if the card says 2, the student counts, “One, two. Two eyes”; if the number is 4,“One, two, three, four. Four buttons”; if the number is zero, “Zero antennae.” If they find something of the right number, they get a point; if they cannot find something of that number,the other student gets the point. Once something has been said, the other student cannot use itfor an answer. For example, if a student has used “two eyes,” the next time 2 is drawn from thecards, the student cannot use “eyes” but could use “two knees” or “two pockets.” When all the cards are used, the game is over.
Bug Me! ArtMake copies of page 72 for your students. Have them “plan a bug” by writing numbers besidethe bug parts on the activity sheet. Next, tell students toeach draw a bug body and head. Have them continuedrawing by consulting their plans to see how many ofeach part to draw. Encourage them to count quietly tothemselves as they add parts to their bugs. Suggest thatthey use all sorts of colors and shapes and make theirbugs as outlandish as their imaginations allow. If desired,have students name their bugs and introduce them to theclass. For example, “This is my bug, Hannah-Louise. She has 4 spots, 2 ears, 3 antennae, 9eyes, 1 tail, and 6 legs.”
69
..
..
..
..
..
..
..
..
..
..
..
..
..
..
..
..
..
..
..
..
..
..
..
..
..
..
..
..
..
23 5 7
Bug Me!
How many do you want?
Draw your bug here:

70 Use with “How Many?” (page 68). ©Copyright 1992-2003, Riverdeep Interactive Learning Limited.
ante
nna an
tenn
aeey
e
eyes

71Use with “How Many?” (page 68). ©Copyright 1992-2003, Riverdeep Interactive Learning Limited.
foot
feet
spot
s
spot
tail
tails
ear
ears

72 Use with “Bug Me!” (page 69). ©Copyright 1992-2003, Riverdeep Interactive Learning Limited.
Bug Me!
How many do you want?
Draw your bug here:

Number MachineNonsense Poetry Language ArtsCompose a class number poem using fantastic, outlandish words or situations, or rewrite familiarrhymes in creative ways. Examples are shown below:
Count on Action Physical EducationHave the class count aloud to 30 as each student repeats an action such as jumping jacks, toe touching, hand clapping, or jumping. On the playground, in the classroom, or in the gymnasium,let pairs of students take turns counting actions for each other.
73
..
..
..
..
..
..
..
..
..
..
..
..
..
..
..
..
..
..
..
..
..
..
..
..
..
..
..
..
..

74
..
..
..
..
..
..
..
..
..
..
..
..
..
..
..
..
..
..
..
..
..
..
..
..
..
..
..
..
..
.
Door Decor ScienceCover both sides of a classroom door with a large sheet of paper. Give each student a numberfrom 1 to 30. Print a topic that your class is currently studying at the top of the paper. Throughoutthe day, have students take turns (starting with number 1) “drawing on the door” that number ofthings related to the topic. For example, if the topic is “The Ocean,” students could draw oneoctopus, two whales, three pieces of seaweed, etc. This activity can also be done on a section ofthe chalkboard using colored chalk or on a white board using colored, erasable markers.
Our Town Countdown Social StudiesCreate a town scrapbook. Start by using heavy paper (81⁄2 by 11 inch) to prepare the thirty pages.At the top of each page, print the title, “Our Town has,” followed by a number from 1 to 30 andan ellipsis (…). For example, the first page will read, “Our Town has 1…”, the second page willread, “Our Town has 2…”, etc. Shuffle the pages and pass them out to either individual studentsor small student groups.
Offering resources such as local visitors‘ guides, phone book yellow pages, newspapers, and citymaps, ask students to fill each page with appropriate pictures or facts. Encourage a mixture ofcommunity information (professions, landmarks, names, etc.).
Three-hole punch the completed pages. To conclude the activity, ask the students or studentgroups to insert their pages in a three-ring binder in the correct order.

Nutrition Numbers ScienceAs a culminating activity for the study of nutrition, let students work in groups to make healthysalads. Divide the class into groups of 6 to 8 students. Give each group a copy of page 76. Workwith the groups, deciding and writing down what will go into their salads. Ingredients can includefresh, frozen, dried, or canned foods such as raisins, nuts, nectarines, kiwi, peaches, watermelon,sunflower seeds, onions, green beans, or shoestring potatoes. (Other ingredients are included inthe sample recipes shown below.) Each salad will have ten ingredients—one unit of the firstingredient, two units of the second ingredient, etc. Some groups might choose vegetable saladsand others fruit salads.
Provide each group with the ingredients (or have them donated from home), a large bowl, a large spoon, a table knife, and a cutting board for slicing ingredients. (You may want to precutingredients.) Each group will also need a small cup and spoon for each student. After studentshave washed their hands, each student in the group prepares one ingredient and adds it to thebowl while the other students in the group count aloud. For example, a student adds raisins andcounts, “One, two, . . . ten raisins.” Students may need help cutting bananas, carrots, etc., but letthem add the pieces to the bowl. When all the ingredients are in the bowl, a student can stir the
salad and divide it equally into the cups. Theneveryone can enjoy a healthy salad.
If food allergies, school policy, etc. prevent you from doing this activity with real ingredients,groups can make salad collages with pictures they draw themselves or cut from magazines. Theycan start with a large piece of green paper cut into a giant lettuce leaf and glue on the ingredientsas the rest of the students in the group count aloud.
75
..
..
..
..
..
..
..
..
..
..
..
..
..
..
..
..
..
..
..
..
..
..
..
..
..
..
..
..
..
1
2
3
4
5
6
7
8
9
10
Top 10 Salad
Toss together. Enjoy!
1
2
3
4
5
6
7
8
9
10
Top 10 Salad
Toss together. Enjoy!

76
Top
10 S
alad
Put
in b
owl:
16
27
38
49
510
Toss
tog
ethe
r. En
joy!
Use
with
“N
utrit
ion
Num
bers
” (p
age
75).
©C
opyr
ight
199
2-20
03, R
iver
deep
Inte
ract
ive
Lear
ning
Lim
ited.

Cookie FactoryLiving Cookie Machines Creative DramaticsAsk five students to play the following parts:1) The cookie pipe that pats out a clay cookie; 2) The conveyor belt that receives the cookie and slides it under the dispenser;3) Harley, the horse, who asks for a cookie decorated with a specific number of jelly beans;4) The jelly bean dispenser that counts clay jelly beans as they are dropped onto the cookie;5) The hand that gives the cookie to Harley, who pretends to gobble it up.
Encourage the entire class to provide the sound effects and to count along as jelly beans are dispensed.
It’s in the News Social StudiesEncourage children to start looking at the newspaper even before they can read. Set up a bulletinboard using the cards copied from pages 80-81. A suggested arrangement is shown below. Ask students to hunt through old papers (either at home or at school) and circle places where thenumerals 0 through 20 are used. Next, they can tear or cut out the example to post on the bulletinboard by the corresponding numeral. Allow the clippings to accumulate on the board over severaldays and then discuss some of the examples of where numerals were used (classifiedadvertisements, diagrams, weather maps, etc.).
77
..
..
..
..
..
..
..
..
..
..
..
..
..
..
..
..
..
..
..
..
..
..
..
..
..
..
..
..
..
0 1 2 3 4 5 6
7 8 9 10 11 12
14 15 16
card from pages80-81
construction paper

Putting the Cart Before the Horse ScienceCut sheets of drawing paper (9 by 12 inch) into fourths and distribute two pieces to each student.Have students number their sheets “1” and “2.” Set the papers aside for a few minutes.
As a class, talk about sequence as it relates to science. Make the discussion fun by asking sillyquestions such as, “Can a flower grow before the seed is planted?” “Can baby birds fly out of thenest before the eggs hatch?” Then talk about what happens first and second. Help students thinkof other things that must happen in a specific sequence (cooking dinner before eating it; gettingthe paint and the paper ready before making a painting; building a house before moving into thehouse; baking a cake before having the birthday party, etc.).
Then have students draw a two-step sequence of an event. Explain that the first thing to happenshould be drawn on rectangle 1 and the second on rectangle 2. When students are finished, theycan take turns holding their drawings up for the class and asking which comes first and which comessecond. The rectangle sets can also be stored in individual envelopes and left on a table for studentsto enjoy during free time.
Number Relay Physical EducationStudents can sharpen memory skills while exercising. Divide the class into four groups. Each groupsits behind a line in the gymnasium. When the teacher says “go,” the first person in each groupruns up to another line and says “One shoe” (or whatever object they want to say) and then runsback. The next person in each group runs to the line and says, for example, “One shoe, twobananas.” Then the third person says, for example, “One shoe, two bananas, three trucks.” (Agroup member who can’t remember one of the objects must run back and bring the person whohad that particular number to the line. Then they say the list together.) The first group to reach 10wins.
78
..
..
..
..
..
..
..
..
..
..
..
..
..
..
..
..
..
..
..
..
..
..
..
..
..
..
..
..
..
.

Old Millie Problem SolvingMany familiar card games require players to analyze data, anticipate moves, and practice memorytechniques. Use Millie’s Deck to play some of these games. Make two copies of pages 80 and 81on the heaviest paper your copier will accommodate. If possible, laminate the paper. Cut the cardsapart. To play “Old Millie,” remove one of the cards with Millie’s picture (the 1 card). Hand out therest of the cards to two (or more) students; let them draw and match cards until one student is left with Millie.
To play another kind of memory game, students turn all cards face down and take turns trying tomatch cards by turning over two at a time. Students will be able to play other familiar games usingMillie‘s Deck. Also, encourage them to invent new games and teach each other.
79
..
..
..
..
..
..
..
..
..
..
..
..
..
..
..
..
..
..
..
..
..
..
..
..
..
..
..
..
..

80
2
5
3
6 7
108 9
4
0 1Mill
ie’s
Dec
k
Use
with
“C
ount
on
Me
”(pa
ge 6
9), “
It’s
in th
e N
ews”
(pag
e 77
), an
d “O
ld M
illie
” (p
age
79).
©C
opyr
ight
199
2-20
03, R
iver
deep
Inte
ract
ive
Lear
ning
Lim
ited.

81
Mill
ie’s
Dec
k
Use
with
“It’
s in
the
New
s” (p
age
77) a
nd “
Old
Mill
ie”
(pag
e 79
).©
Cop
yrig
ht 1
992-
2003
, Riv
erde
ep In
tera
ctiv
e Le
arni
ng L
imite
d.

82
..
..
..
..
..
..
..
..
..
..
..
..
..
..
..
..
..
..
..
..
..
..
..
..
..
..
..
..
..
.
Students with Special NeedsMillie’s Math House is designed to be used by young students or students with special needs and isfully compatible with TouchWindow, a touch-sensitive screen that attaches to your computermonitor. (The TouchWindow can also be used as a single switch device. See below.)
Single Switch Input Options for Students with Special NeedsBuilt-in scanning is available for single switch users. When scanning is turned on, a selection arrowautomatically advances from choice to choice (the speed is adjustable). Students make a selectionby activating a single switch device. (See below). When scanning is on, Macintosh users cantemporarily suspend or resume scanning by pressing Command -Option-S; Windows userspress Ctrl-Alt-S. Macintosh users can also temporarily activate the mouse cursor by holding downthe Command key.
Although most of the features in Millie’s Math House function normally when scanning is on, twofeatures change:� The Explore and Discover Mode is not available in Mouse House.� The microphone in Bing & Boing and Build-A-Bug is not scanned. Record by suspending
scanning, recording as you normally would, and then resuming scanning.
Single Switch Devices Used with ScanningYou can connect a variety of single switch devices, using them in accordance with the specialneeds of your students. Each student can then use the most suitable switch while taking turns onthe same software activity.
� TouchWindow — The entire TouchWindow can function as the single switch device. When theselection arrow points to the object or icon, touching any part of the screen selects the indicatedobject or icon. The TouchWindow can be placed in the user’s lap or on a desktop.
� Mouse — The mouse button can serve as the single switch device. When the selection arrowpoints to the object or icon, clicking the mouse button selects the indicated object or icon.
� Keyboard — (Windows users only) The Space Bar and the F5 key can be used as single switchdevices. When the selection arrow points to the object or icon, pressing the Space Bar or the F5 key selects the indicated object or icon.
� Switch — A switch is a specialized input device for special needs users. When the selectionarrow points to the object or icon, touching a switch selects the indicated object or icon. (Mostswitches require a switch interface to connect them to the computer.)

83
..
..
..
..
..
..
..
..
..
..
..
..
..
..
..
..
..
..
..
..
..
..
..
..
..
..
..
..
..
.
System RequirementsServer and Network� Windows NT 4.0 with latest service pack
� Windows 2000 with latest service pack
� Novell 4.11 or later
� AppleShare IP 6.0.3 or later
� OS X.0.4 Server or later
� Ethernet 10 Mbit/sec or faster
� CD-ROM drive for one-time installation
� 100 MB free disk space (not including diskspace for students’ saved files)
Windows Client Workstations� Windows 95b/95c/98/ME/2000/XP
� 166 MHz Pentium processor or better
� 64 MB RAM or higher
� 100 MB hard disk space
� Super VGA 800 x 600 display with aminimum of 256 colors
� CD-ROM drive
� Sound card and speakers compatible withDirectX
Optional:
� Windows-compatible printer
� Microphone
� TouchWindow® or single-switch device
Macintosh Client Workstations� OS 8.6 to OS 9.2.2 (classic) and OS 10.1.5
and higher (OS X native)
� G3 processor or better
� 128 MB RAM or higher
� 100 MB hard disk space
� 800 x 600 display with a minimum of 256colors
� CD-ROM drive
Optional:
� Macintosh-compatible printer
� Microphone
� TouchWindow or single-switch device

84
..
..
..
..
..
..
..
..
..
..
..
..
..
..
..
..
..
..
..
..
..
..
..
..
..
..
..
..
..
.
Installation InstructionsThis version of Millie’s Math House is for use with Riverdeep Software Manager (RSM). Make sureRSM is installed before installing Millie’s Math House. If you need assistance with RSM, pleaseconsult the RSM User Guide (included on CD or in the school binder). You will install Millie’s MathHouse to the network file server, you will need to run the RSM Administration Center.
The Millie’s Math House installation places both Windows and Macintosh files on the network fileserver where RSM is located. Both Windows and Macintosh are installed simultaneously.
1. Exit all applications and start at the desktop.
2. Insert the Millie’s Math House Network CD into the drive.
Macintosh: Double click to open the CD
Windows: The CD window will open automatically. If Autoplay is not enabled, choose RUN
from the Start menu and type d:\Autoplay.exe (where d represents your CD drive).
3. Click the Millie’s Math House installer and follow the on-screen instructions.
4. Millie’s Math House must be installed in the Riverdeep Server folder that was created on the
network file server during RSM installation. Navigate to this location and begin the installation.
5. When the installation is complete, you must launch the RSM Administration Center to
enable Millie’s Math House. Consult the Riverdeep Software Manager user’s guide for
additional information.
When students launch Millie’s Math House, it is automatically copied from the server to theworkstation. The technology coordinator may wish to launch Millie’s Math House from the RSM Student Center before first student sue. This will save student’s time in waiting for the application files to be copied to the workstation.
Optional User PrivilegesIf your school has restrictions on user access to network locations, the following folder permissionsrequired for Riverdeep Software Manager� Teacher users will need read, write, and delete access to the Riverdeep Server folder.
� Student users will need read and write access to the Student Documents folder and the Datafolder (both within the Riverdeep Server folder).

85
..
..
..
..
..
..
..
..
..
..
..
..
..
..
..
..
..
..
..
..
..
..
..
..
..
..
..
..
..
.
Technical SupportFor Technical Support, please refer to the customer information card included with this product.

482434-TG

- Dear Parents, Educators, and Children,
Welcome to Money Town. My name is Neale Godfrey, and I created The Children's Financial Neturork. which teaches children about money and its uses and purposes. I also opened the First Children's Bank at F A 0 Schwal-tz in New York.
I b e y my career as an entrepreneur when I was ten. I posted s i p s on the local storm sewers and charged thc neishborhood kids 25s each for a "tour of the sewer." Whether selling Ienlonade in the front yard or zivins tours ot' the seLi.er. children art: never too younz to learn to i~nderstand :[bout money. By our educatin? then1 this \v;t).. tliq. will sroii. LIP to be tlnnncially responsible and solvent adults.
hIoney T o w n is a magical place. A playful and creative computer experience, Money Town has been carefully designed to prov~de children ages 5-9 with a fun way to learn about money-how to earn, save. kund put i r to good use. With delightful graphics, music, sound effects. and the wonderful Greenstreet characters. J:Ioney Town opens up a new and fascinating world for children. Money Town will excite and teach them all at once. There is also a video guide for educators and parents where I answer the most frequently asked questions ~tbout children and money.
As the Greenstreet gang would say: Roll up your slce\.e~ and have a ball!
Neale Godfrey
Packet Contents
Welcome to Money Town
Menu Chart
How to Play .Money Town
Song Lyrics
- Money % ~ r j l

Money Town . . . a learn-and-earn adventure Penn Hills - Grades 2 and 3
Site on Main Menu
Activity Skill Character Active Locations
Recycle Center Concentration Matching Game Coin Machine
Money recognition Equivalent Values
Identify missing coins in total
Ona Budget Entrance: Recycling Machine Song: Radio
Opportunity Knocking Em~orium
Birds Entrance: Poster
Buck's Home Football Game Coin recognition Total amount
Dollar Bill "Buck" En trance location varies Coin collection/car
(timed) En trance: Computer Penny Bright's
Home Quiz Show Short Cut
Penny Bright Small Change
Facts about money Song: Radio
Home of Small Change
Tree
"Pac Man" style Bank means safety Entrance: Mouse Hole Song: Radio
Check off selected items Auto Max Spend earned money on park restoration
Earn money to restore park
Town Mayor
Park
--
Observe park restoration
Town Mayor
--
Notes: Disk 1 is the program - Disk 2 is a video guide. Run this program off the desktop via disk I. Comrnon Cents is the small coin who offers money facts. Choose higher level to earn greater amounts of money. Menu at the bottom: Pig=total amount earned Question Mark=directions Door=entrance/exit area Level=degree of difficulty
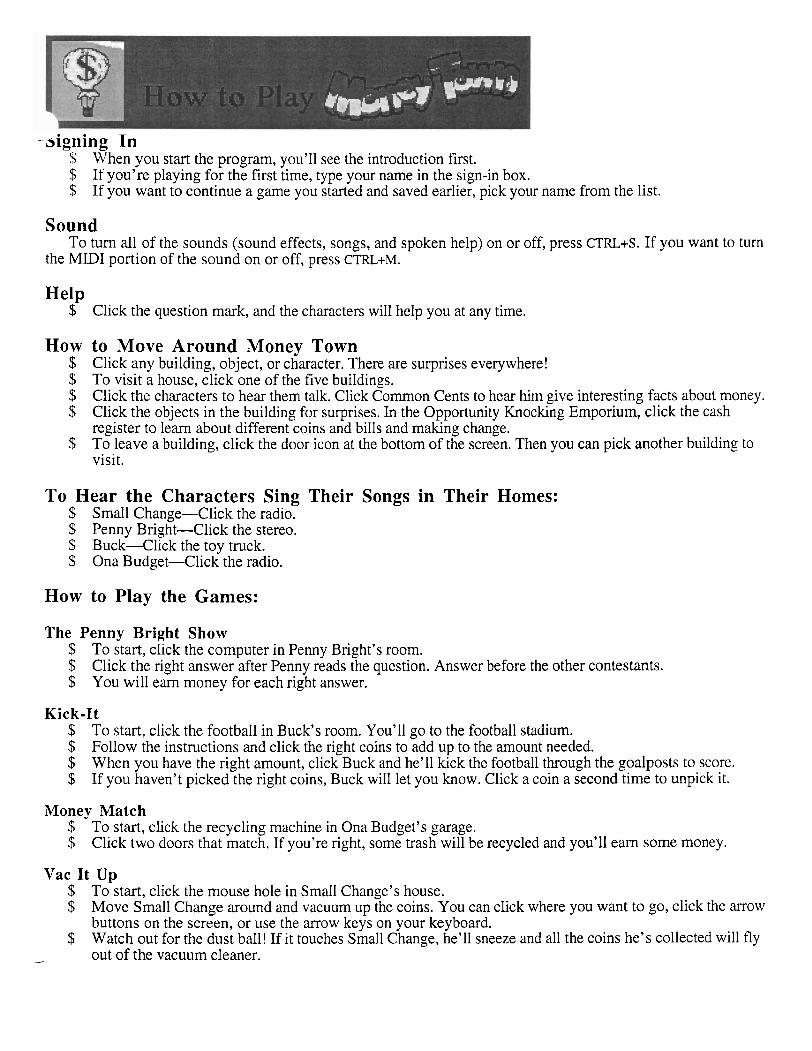
-3igning In S When you start the program, you'll see the introduction first. $ If you're playing for the first time, type your name in the sign-in box. $ If you want to continue a game you started and saved earlier, pick your name from the list.
Sound To turn all of the sounds (sound effects, songs, and spoken help) on or off, press CTRL+S. If you want to turn
the MIDI portion of the sound on or off, press CTRL+M.
Help $ Click the question mark, and the characters will help you at any time.
How to Move Around Money Town $ Click any building, object, or character. There are surprises everywhere! $ To visit a house, click one of the five buildings. $ Click the characters to hear them talk. Click Common Cents to hear him give interesting facts about money. $ Click the objects in the building for surprises. In the Opportunity Knocking Emporium, click the cash
register to learn about different coins and bills and making change. $ To leave a building, click the door icon at the bottom of the screen. Then you can pick another building to
visit.
To Hear the Characters Sing Their Songs in Their Homes: $ Small Change-Click the radio. $ Penny Bright-Click the stereo. $ Buck--Click the toy truck. $ Ona Budget-Click the radio.
How to Play the Games:
The Penny Bright Show $ To start, click the computer in Penny Bright's room. $ Click the right answer after Penny reads the question. Answer before the other contestants. $ You will earn money for each right answer.
Kick-It $ To start, click the football in Buck's room. You'll go to the football stadium. $ Follow the instructions and click the right coins to add up to the amount needed. $ When you have the right amount, click Buck and he'll kick the football through the goalposts to score. $ If you haven't picked the right coins, Buck will let you know. Click a coin a second time to unpick it.
Money Match $ To start, click the recycling machine in Ona Budget's garage. $ Click two doors that match. If you're right, some trash will be recycled and you'll earn some money.
Vac It Up $ To start, click the mouse hole in Small Change's house. $ Move Small Change around and vacuum up the coins. You can click where you want to go, click the arrow
buttons on the screen, or use the arrow keys on your keyboard. $ Watch out for the dust ball! If it touches Small Change, he'll sneeze and all the coins he's collected will fly
- out of the vacuum cleaner.
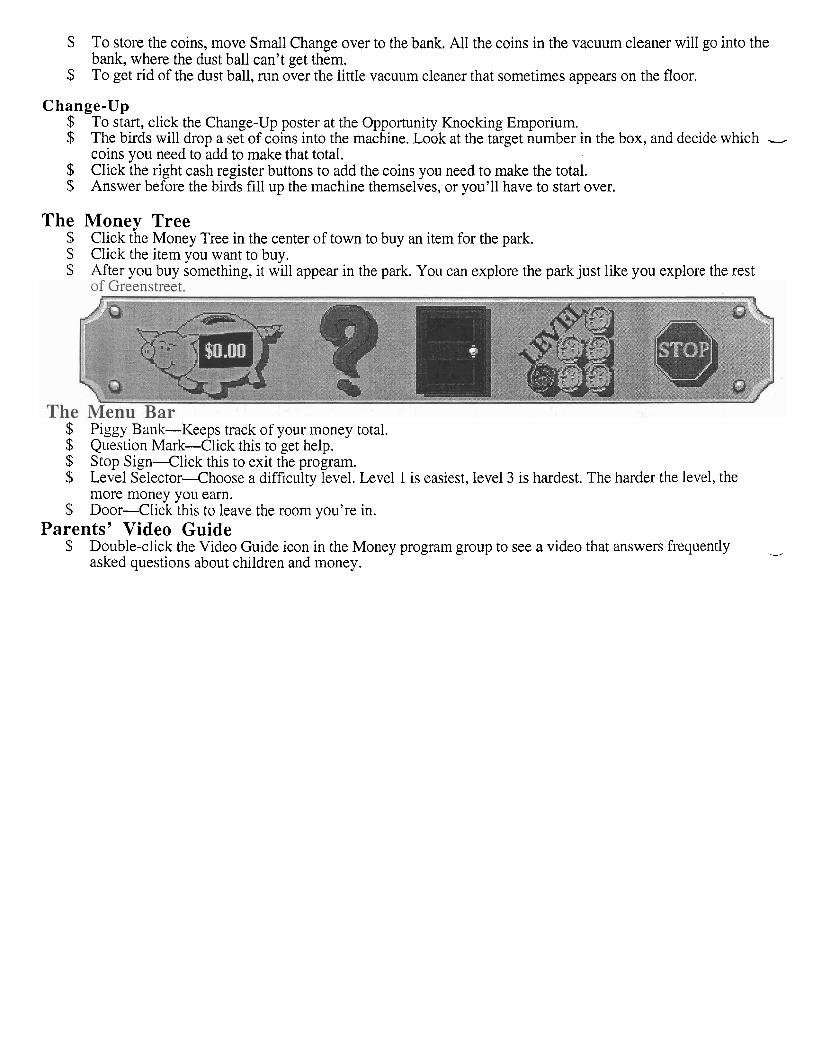
$ To store the coins, move Small Change over to the bank. All the coins in the vacuum cleaner will go into the bank, where the dust ball can't get them.
$ To get rid of the dust ball, run over the little vacuum cleaner that sometimes appears on the floor.
Change-Up $ To start, click the Change-Up poster at the Opportunity Knocking Emporium. $ The birds will drop a set of coins into the machine. Look at the target number in the box, and decide which -
coins you need to add to make that total. $ Click the right cash register buttons to add the coins you need to make the total. $ Answer before the birds fill up the machine themselves, or you'll have to start over.
The Money Tree $ Click the Money Tree in the center of town to buy an item for the park. $ Click the item you want to buy. $ After you buy something, it will appear in the park. You can explore the park just like you explore the rest
$ Piggy Bank-Keeps track of your money total. $ Question Mark-Click this to get help. $ Stop Sign-Click this to exit the program. $ Level Selector-Choose a difficulty level. Level 1 is easiest, level 3 is hardest. The harder the level, the
more money you earn. $ Door-Click this to leave the room you're in.
Parents' Video Guide $ Double-click the Video Guide icon in the Money program group to see a video that answers frequently -
asked questions about children and money.

Money, Money (Mr. Possibility) Money, money Can help our dreams come true. Money, money, There's so much it can do! With kind-hearted visions And some smart decisions, Our good fortune will shine through. Money, money Can help our dreams come true.
Money makes the world spin around and 'round. Buying, selling, and saving our dough, There's great adventure and profit to be found. Let's learn, Let's earn, It will be fun-let's go!
(Repeat chorus.)
-dords and music by Dave Kinnoin O 1995 Davidson & Associates, Inc. and Simon & Schuster, Inc.

L
Kitty Corner of the World (Penny Bright) Gotta hurry, gotta scurry, I 'm as busy as I'm furry. That's a lot of hairs, a lot of jobs, And oh, I love them gobs and gobs! Good thing I'm energetic and athletic, 'Cause my pace is so frenetic I've no time for wishes, hopes, and dreams, Just firm ideas, plans, and schemes.
In my Kitty Corner of the World, I'm sittin' pretty, 'Cause I know just what to do. In my Kitty Corner of the World, a clever kitty Will open her briefcase for you: Laptop computer with a built-in modem, New business programs, Meow-y, wow-y, can't wait to load 'em! Old bag of popcorn with an uncooked kernel, Phone and fax, and to relax, A copy of The Wall Street Journal. I will analyze it and extract the nitty gritty With my tail strategically curled, In my Kitty Corner, Kitty Corner of the World.
Words and music by Dave Kinnoin O 1995 Davidson & Associates, Inc. and Simon & Schuster, Inc.

Stack It Up! (small Change) Five pennies make a nickel, Two nickels make a dime. Two dimes and one nickel make a quarter, Four quarters make a dollar every time.
Stack it up, stack it up, Stack up each denomination. Stack it up, stack it up, To assist your computation. Stack it up, "Stack it up!" The money counter hollers. As you count, it might amount To many, many dollars. Stack it up, stack it up, Be a careful penny sorter. Stack it up, stack it up, Every nickel, dime, and quarter. Stack it up, stack it up, The cash register is happy.
._- It likes to sing, "Ka-ching, ka-ching!" So count and make it snappy! Stack it up, stack it up, stack it up.. .
Words and music by Dave Kinnoin 0 1995 Davidson & Associates, Inc. and Simon & Schuster, Inc.

You Can Call Me Buck ( B U C ~ )
The toy I want is on sale, Guess I'm in luck. It costs one hundred pennies- I'm gonna buy that truck. My name is Dollar Bill, You can call me Buck. (Hey, this is a cool truck. Vrooooom.. .)
I'm drivin' off the highway, My wheel gets stuck. (Aw, yuck!) Two quarters and ten nickels Will pull it out of the muck. (That's what the tow truck driver said, And as he stood there scratchin' his head, I said,) "My name is Dollar Bill, You can call me Buck."
George Washington and I Are havin' lots of fun- As every year goes by, We still stay number one. I could have been born "Chip" Or "Sam" or "Rich" or "Chuck," But hey, it sounds so hip To say, "You can call me Buck!"
Words and music by Dave Kinnoin O 1995 Davidson & Associates, Inc. and Simon & Schuster, Inc.

On a Budget (Ona Budget) I wanted to put up a swing in my backyard, Went to the store to buy one-the price tag hit me hard. Went home and found some rope and wood upon a shelf. I measured, cut, sawed, and sanded, and made that swing myself.
You see, I'm on a budget, Smart shopper in blue jeans. Call me old-fashioned, But I live within my means. On a budget, Good business strikes a chord (chord, chord, chord). Things catch my eye, But I only buy The ones I can afford.
Being broke is such a sad time, That's why I'm really glad I'm
On a budget, Good business strikes a chord (chord, chord, chord).
- Things catch my eye, But I only buy The ones I can afford. Things catch my eye, But I only buy The ones I can afford.
Words and music by Dave Kinnoin O 1995 Davidson & Associates, Inc. and Simon & Schuster, Inc.

L
Decision Street Birds Songs--- Allowance Time
I have those happy feet, Up the stairs they climb. I wear that happy smile, It's allowance time!
Hole in My Pocket I have a dime, I have a dollar- Clean pants, clean shirt, No dirt around the collar. When I see what I want, I light up like a rocket, And my cash (the whole stash!) Bums a hole in my pocket! Then I spend, spend, spend, And that's the end, end, end Of my dough! Oh, no!
I Want It Listen to me sing-I want it. Every little thing-I want it. Stuff that's in the s t o r e 1 want it. Toys and games and more-I want it! Someday my plan will work, It will succeed with ease: I'll walk up to the clerk and say, "Excuse me, please- I want it!"
Pictures of Presidents I like to collect pictures of presidents. I'll settle for metal, but paper's my favorite. It's fun to collect pictures of presidents. Each coin and bill is a tasty thrill, I'm sure you will savor it.
Price to Be Paid I spent 50 cents for five sticks of gum. I went home and everybody wanted some. I gave a stick to the first, And one to each of three others. There's a price to be paid For having sisters and brothers!

Rainy Day Put a little away for a rainy day, Put a little away each week. Doesn't have to be much, A nickel, dime, or such,
- Just enough to stem the spending streak. When the chips are down And you wear a frown, It'll bring you the relief you seek. Put a little away for a rainy day, Put a little away each week.
Soggy Bill Let's go to the bank, but remember: Don't play with a worm on the way. No fishy, no froggy- Your bill might get soggy, And the teller might say, "This isn't funny. Dry out that money, honey!"
Tooth Fairy Hey buddy, how much Did the tooth fairy bring you? When you lifted your pillow, How much dough was underneath? I wished and I hoped, But my dreams were not answered
d
Due to one technicality: I don't have any teeth!
Twenty or Ten? "I gave you a twenty." "You gave me a ten." "She gave him a twenty." "She gave him a ten." We are mixed up plenty, Madder than a hen. "I gave you a twenty." "You gave me a ten!"
Waitin' at the Bank Here we go again, waitin' at the bank. We're standin' number ten- I wonder whom we should thank For this inconvenience. Guess it's none of them- We should have used the ATM!
All words and music by Dave Kinnoin All songs O 1995 Davidson & Associates, Inc. and Simon & Schuster, Inc.