Targeted Investment for Food Access - UVM ScholarWorks
39
University of Vermont University of Vermont UVM ScholarWorks UVM ScholarWorks Transportation Research Center Research Reports Research Centers and Institutes 1-1-2021 Targeted Investment for Food Access Targeted Investment for Food Access David Novak University of Vermont, [email protected] James Sullivan University of Vermont, [email protected] Meredith Niles University of Vermont, [email protected] Follow this and additional works at: https://scholarworks.uvm.edu/trc Part of the Transportation Engineering Commons Recommended Citation Recommended Citation Novak, D. C, Sullivan, J. L, & Niles, M. T. (2021). Targeted Investment for Food Access. UC Davis: National Center for Sustainable Transportation. http://dx.doi.org/10.7922/G2FT8JBR Retrieved from https://escholarship.org/uc/item/9b71p9zg This Report is brought to you for free and open access by the Research Centers and Institutes at UVM ScholarWorks. It has been accepted for inclusion in Transportation Research Center Research Reports by an authorized administrator of UVM ScholarWorks. For more information, please contact [email protected].
-
Upload
khangminh22 -
Category
Documents
-
view
1 -
download
0
Transcript of Targeted Investment for Food Access - UVM ScholarWorks

University of Vermont University of Vermont
UVM ScholarWorks UVM ScholarWorks
Transportation Research Center Research Reports Research Centers and Institutes
1-1-2021
Targeted Investment for Food Access Targeted Investment for Food Access
David Novak University of Vermont, [email protected]
James Sullivan University of Vermont, [email protected]
Meredith Niles University of Vermont, [email protected]
Follow this and additional works at: https://scholarworks.uvm.edu/trc
Part of the Transportation Engineering Commons
Recommended Citation Recommended Citation Novak, D. C, Sullivan, J. L, & Niles, M. T. (2021). Targeted Investment for Food Access. UC Davis: National Center for Sustainable Transportation. http://dx.doi.org/10.7922/G2FT8JBR Retrieved from https://escholarship.org/uc/item/9b71p9zg
This Report is brought to you for free and open access by the Research Centers and Institutes at UVM ScholarWorks. It has been accepted for inclusion in Transportation Research Center Research Reports by an authorized administrator of UVM ScholarWorks. For more information, please contact [email protected].
UC DavisResearch Reports
TitleTargeted Investment for Food Access
Permalinkhttps://escholarship.org/uc/item/9b71p9zg
AuthorsNovak, David C.Sullivan, James L.Niles, Meredith T.
Publication Date2021
DOI10.7922/G2FT8JBR
eScholarship.org Powered by the California Digital LibraryUniversity of California
Targeted Investment for Food Access
January 2021 A Research Report from the National Center for Sustainable Transportation
David C. Novak, University of Vermont
James L. Sullivan, University of Vermont
Meredith T. Niles, University of Vermont
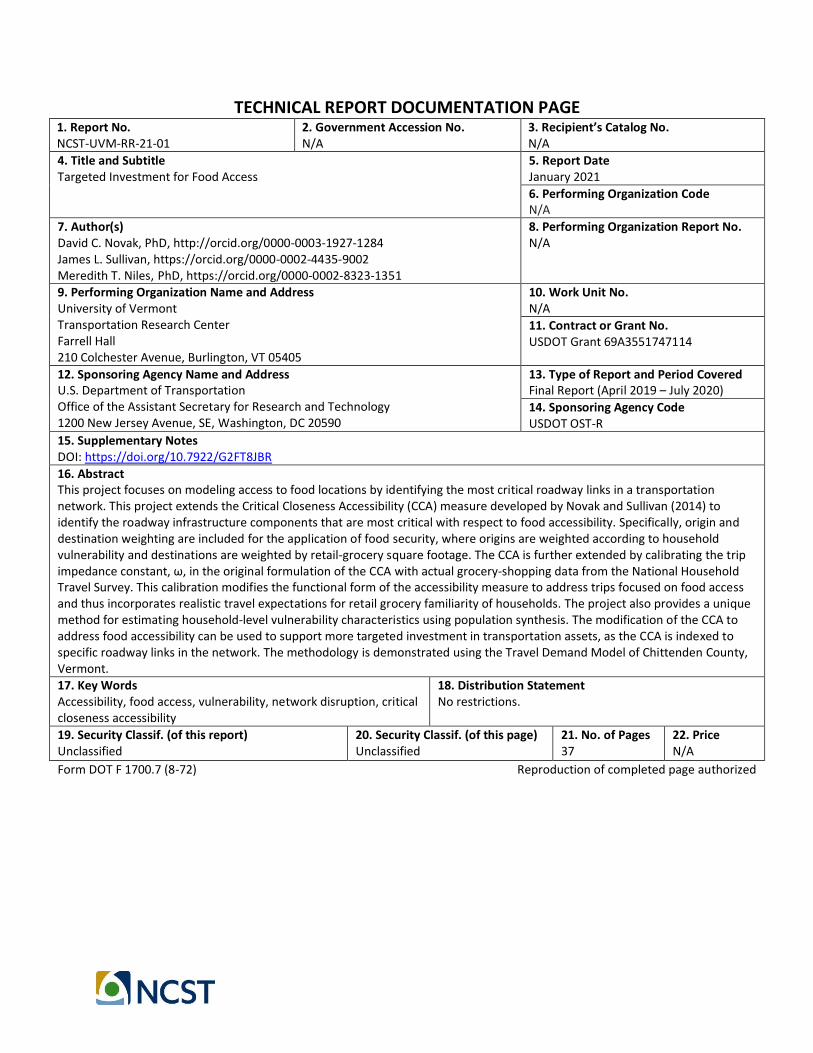
TECHNICAL REPORT DOCUMENTATION PAGE 1. Report No. NCST-UVM-RR-21-01
2. Government Accession No. N/A
3. Recipient’s Catalog No. N/A
4. Title and Subtitle Targeted Investment for Food Access
5. Report Date January 2021
6. Performing Organization Code N/A
7. Author(s) David C. Novak, PhD, http://orcid.org/0000-0003-1927-1284 James L. Sullivan, https://orcid.org/0000-0002-4435-9002 Meredith T. Niles, PhD, https://orcid.org/0000-0002-8323-1351
8. Performing Organization Report No. N/A
9. Performing Organization Name and Address University of Vermont Transportation Research Center Farrell Hall 210 Colchester Avenue, Burlington, VT 05405
10. Work Unit No. N/A
11. Contract or Grant No. USDOT Grant 69A3551747114
12. Sponsoring Agency Name and Address U.S. Department of Transportation Office of the Assistant Secretary for Research and Technology 1200 New Jersey Avenue, SE, Washington, DC 20590
13. Type of Report and Period Covered Final Report (April 2019 – July 2020)
14. Sponsoring Agency Code USDOT OST-R
15. Supplementary Notes DOI: https://doi.org/10.7922/G2FT8JBR
16. Abstract This project focuses on modeling access to food locations by identifying the most critical roadway links in a transportation network. This project extends the Critical Closeness Accessibility (CCA) measure developed by Novak and Sullivan (2014) to identify the roadway infrastructure components that are most critical with respect to food accessibility. Specifically, origin and destination weighting are included for the application of food security, where origins are weighted according to household vulnerability and destinations are weighted by retail-grocery square footage. The CCA is further extended by calibrating the trip impedance constant, ω, in the original formulation of the CCA with actual grocery-shopping data from the National Household Travel Survey. This calibration modifies the functional form of the accessibility measure to address trips focused on food access and thus incorporates realistic travel expectations for retail grocery familiarity of households. The project also provides a unique method for estimating household-level vulnerability characteristics using population synthesis. The modification of the CCA to address food accessibility can be used to support more targeted investment in transportation assets, as the CCA is indexed to specific roadway links in the network. The methodology is demonstrated using the Travel Demand Model of Chittenden County, Vermont.
17. Key Words Accessibility, food access, vulnerability, network disruption, critical closeness accessibility
18. Distribution Statement No restrictions.
19. Security Classif. (of this report) Unclassified
20. Security Classif. (of this page) Unclassified
21. No. of Pages 37
22. Price N/A
Form DOT F 1700.7 (8-72) Reproduction of completed page authorized
About the National Center for Sustainable Transportation
The National Center for Sustainable Transportation is a consortium of leading universities committed to advancing an environmentally sustainable transportation system through cutting-edge research, direct policy engagement, and education of our future leaders. Consortium members include: University of California, Davis; University of California, Riverside; University of Southern California; California State University, Long Beach; Georgia Institute of Technology; and University of Vermont. More information can be found at: ncst.ucdavis.edu.
Disclaimer
The contents of this report reflect the views of the authors, who are responsible for the facts and the accuracy of the information presented herein. This document is disseminated in the interest of information exchange. The report is funded, partially or entirely, by a grant from the U.S. Department of Transportation’s University Transportation Centers Program. However, the U.S. Government assumes no liability for the contents or use thereof.
Acknowledgments
This study was funded, partially or entirely, by a grant from the National Center for Sustainable Transportation (NCST), supported by the U.S. Department of Transportation (USDOT) through the University Transportation Centers program. The authors would like to thank the NCST and the USDOT for their support of university-based research in transportation, and especially for the funding provided in support of this project.

Targeted Investment for Food Access A National Center for Sustainable Transportation Research Report
January 2021
David C. Novak, Grossman School of Business, University of Vermont
James L. Sullivan, Center for Transportation Research, University of Vermont
Meredith T. Niles, Department of Nutrition and Food Sciences, University of Vermont

[page intentionally left blank]

i
TABLE OF CONTENTS
EXECUTIVE SUMMARY .................................................................................................................... iv
1. Introduction ............................................................................................................................ 1
2. Background and Literature ..................................................................................................... 2
2.1. Network Methods for Measuring Access and Security .................................................... 2
2.2. Other Methods for Measuring Access and Security ........................................................ 3
3. Data Sources and Processing .................................................................................................. 4
3.1. Grocery Retail Data .......................................................................................................... 4
3.2. Grocery Shopping Travel/Behavior Data.......................................................................... 6
3.3. Data on Residential Locations .......................................................................................... 7
3.4. Demographic Data Pertaining to Household Vulnerability .............................................. 8
3.5. Road Network................................................................................................................... 8
3.6. Employing Population Synthesis ...................................................................................... 9
4. Methodological Extensions to the CCA................................................................................. 12
5. Results ................................................................................................................................... 16
5.1. Calibration of ω .............................................................................................................. 16
5.2. Select Modeling Results ................................................................................................. 18
6. Conclusions ........................................................................................................................... 21
7. References ............................................................................................................................ 23
8. Data Management ................................................................................................................ 27
ii
List of Tables
Table 1. Retail Grocery/Food Source Locations in Vermont .......................................................... 5
Table 2. NHTS pooled household trip data ..................................................................................... 7
Table 3. Correlation coefficients for vulnerability-related demographic variables ....................... 9
Table 4. Parameters and best-fit PDFs for each vulnerability-related demographic variable ..... 10
Table 5. Characteristics of the three block groups shown in Figure 2.......................................... 11
Table 6. Final square footage characteristics for retail grocery locations in Vermont ................ 15
Table 7. Most critical roadway links ............................................................................................. 18
iii
List of Figures
Figure 1. Locations of Retail Grocery Points in Vermont ................................................................ 6
Figure 2. Example of fitting a PDF to the Non-HS variable ........................................................... 10
Figure 3. Synthetic population synthesis distributions (block groups 1001, 1002, and 1003) .... 11
Figure 4. Best fit ω = 1.28 to observed grocery shopping trip length distribution....................... 17
Figure 5. Best fit ω = 1.28 to observed grocery shopping trip length distribution....................... 19
Figure 6. Five most critical links in Chittenden County................................................................. 20
Figure 7. Illustration of critical links on Route 7 in Colchester ..................................................... 21
iv
Targeted Investment for Food Access
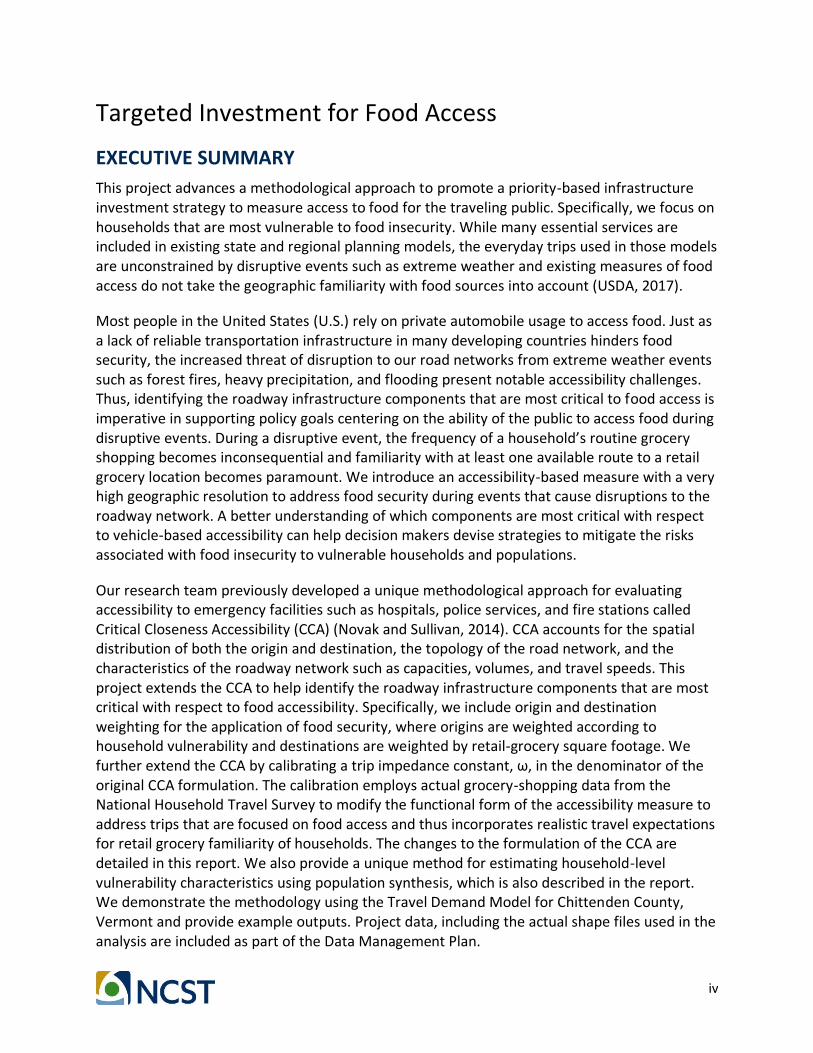
EXECUTIVE SUMMARY
This project advances a methodological approach to promote a priority-based infrastructure investment strategy to measure access to food for the traveling public. Specifically, we focus on households that are most vulnerable to food insecurity. While many essential services are included in existing state and regional planning models, the everyday trips used in those models are unconstrained by disruptive events such as extreme weather and existing measures of food access do not take the geographic familiarity with food sources into account (USDA, 2017).
Most people in the United States (U.S.) rely on private automobile usage to access food. Just as a lack of reliable transportation infrastructure in many developing countries hinders food security, the increased threat of disruption to our road networks from extreme weather events such as forest fires, heavy precipitation, and flooding present notable accessibility challenges. Thus, identifying the roadway infrastructure components that are most critical to food access is imperative in supporting policy goals centering on the ability of the public to access food during disruptive events. During a disruptive event, the frequency of a household’s routine grocery shopping becomes inconsequential and familiarity with at least one available route to a retail grocery location becomes paramount. We introduce an accessibility-based measure with a very high geographic resolution to address food security during events that cause disruptions to the roadway network. A better understanding of which components are most critical with respect to vehicle-based accessibility can help decision makers devise strategies to mitigate the risks associated with food insecurity to vulnerable households and populations.
Our research team previously developed a unique methodological approach for evaluating accessibility to emergency facilities such as hospitals, police services, and fire stations called Critical Closeness Accessibility (CCA) (Novak and Sullivan, 2014). CCA accounts for the spatial distribution of both the origin and destination, the topology of the road network, and the characteristics of the roadway network such as capacities, volumes, and travel speeds. This project extends the CCA to help identify the roadway infrastructure components that are most critical with respect to food accessibility. Specifically, we include origin and destination weighting for the application of food security, where origins are weighted according to household vulnerability and destinations are weighted by retail-grocery square footage. We further extend the CCA by calibrating a trip impedance constant, ω, in the denominator of the original CCA formulation. The calibration employs actual grocery-shopping data from the National Household Travel Survey to modify the functional form of the accessibility measure to address trips that are focused on food access and thus incorporates realistic travel expectations for retail grocery familiarity of households. The changes to the formulation of the CCA are detailed in this report. We also provide a unique method for estimating household-level vulnerability characteristics using population synthesis, which is also described in the report. We demonstrate the methodology using the Travel Demand Model for Chittenden County, Vermont and provide example outputs. Project data, including the actual shape files used in the analysis are included as part of the Data Management Plan.
1
1. Introduction
A sustainable transportation can be defined as a system that provides access and mobility for future generations at or above the current level. As the gap between the funds that are available for infrastructure expansion and maintenance projects and actual infrastructure investment needs widens, prudent infrastructure investment decisions become even more essential, as funding is extremely limited. The use of decision-support tools to maximize the return on investment dollars by targeting investment dollars toward the most important or critical infrastructure components is becoming more widespread (Novak and Sullivan, 2014; Novak et al., 2012; Yin et al. 2009). This project advances a methodological approach to promote a priority-based infrastructure investment strategy to measure access to food for the traveling public. Specifically, we focus on households that are most vulnerable to food insecurity. While many essential services are included in existing state and regional planning models, the everyday trips used in those models are unconstrained by disruptive events such as extreme weather and existing measures of food access do not take the geographic familiarity with food sources into account (USDA, 2017).
Most people in the United States U.S. rely on private automobile usage to access food. Just as a lack of reliable transportation infrastructure in many developing countries hinders food security, the increased threat of disruption to our road networks from extreme weather events such as forest fires, heavy precipitation, and flooding present notable accessibility challenges. Thus, identifying the roadway infrastructure components that are most critical to food access is imperative in supporting policy goals centering on the ability of the public to access food during disruptive events. During a disruptive event, the frequency of a household’s routine grocery shopping becomes inconsequential and familiarity with at least one available route to a retail grocery location becomes paramount.
We introduce an accessibility-based measure with a very high geographic resolution to address food security during events that cause disruptions to the roadway network. A better understanding of which components are most critical with respect to vehicle-based accessibility can help decision makers devise strategies to mitigate the risks associated with food insecurity to vulnerable households and populations. The modified Critical Closeness Accessibility (CCA) provides an ordinal measure of demand-side food accessibility that considers the spatial distribution of both the origin and destination, the topology of the road network, and the characteristics of the roadway network such as capacities, volumes, and travel speeds. The measure also takes into account household familiarity with retail grocery locations, destination weighting to account for retail grocery characteristic (square footage), and origin weighting to account for household vulnerability (through population synthesis). We demonstrate the methodology using the Travel Demand Model for Chittenden County, Vermont and provide example outputs. Chittenden County provides a unique test bed for this type of application as it contains population centers that range from a medium-sized metropolitan area (Burlington-South Burlington) with a high-density downtown core (Primary Rural-Urban Commuting Area (RUCA) = 1), to remote rural regions (Primary RUCA = 10) (USDA, 2019).

2
2. Background and Literature
This research extends the Critical Closeness Accessibility performance measure (CCA) developed by Novak and Sullivan, (2014) to help identify the roadway infrastructure components that are most critical with respect to food accessibility. Specifically, we include origin and destination weighting for the application of food security, where origins are weighted according to household vulnerability and destinations are weighted by retail-grocery square footage. We further extend the CCA by calibrating a trip impedance constant, ω, in the denominator of the original CCA formulation. The calibration employs actual grocery-shopping data from the National Household Travel Survey to modify the functional form of the accessibility measure to address trips that are focused on food access and thus incorporates realistic travel expectations for retail grocery familiarity of households.
Vulnerable households are typically defined by using household-level characteristics such as age, race, health, income, employment, etc. (Cutter et al., 2003). Household vulnerabilities are the product of factors that affect a household’s ability to respond and define the sensitivity of different households. A range of variables, indexes, and tools can be used to measure vulnerability (Novak et al., 2020; CDC, 2015; Cutter et al., 2003).
2.1. Network Methods for Measuring Access and Security
Network-based methods for measuring accessibility (as opposed to connectivity or mobility) are common in the research literature. A recent discursive study provides the definition of three concepts used to measure transportation network performance – connectivity, accessibility, and mobility (Labi et al., 2019). These concepts consider the influence of network topology, operational performance, road condition, and socioeconomic characteristics of a project’s area of influence. Another review-type study classifies research methods pertaining to vulnerability metrics for transportation networks into three categories: network-topology-based, accessibility-based, and mathematical model-based (Zhang and Zhang, 2019).
Other studies have integrated network science into analysis of access to specific types of destinations. One example of this integration is for public transport, to compute average travel impedance for comparative assessment across discrete networks (Luo et al., 2019). D’Orso and Migliore (2020) also focus on accessibility to public transport, but in this case by a pedestrian network of paths and sidewalks. Their measure considers the use of this pedestrian network in accessing railway stations. Another example of this type of integration is for measuring network access to employment destinations. One of these studies measures the impact of rising seas on access to employment over a regional road network (Noland et al., 2019). Other examples broaden the concept of access to employment as a representation of economic impacts (Shayanfar et al., 2019), or to measure accessibility to employment of various characterizations of vulnerable populations: people with disabilities (Grise’ et al., 2019), people living in rural or isolated regions (Dixon et al., 2019), the urban poor (Ren, 2019).
Another study focused on access of older people in rural areas to a variety of destinations, with measures to assess overall quality of life (Graham et. al., 2018). A subset of network-based
3
studies use accessibility measures that are focused on road networks. Since road networks are a dominant public infrastructure investment, measures that help target this investment are useful (D’Orso and Migliore, 2020; Labi et al., 2019). Another study uses a measure of roadway accessibility for measuring urban sprawl (Zhan and Ukkusuri, 2019). The most common example in the research literature is for measuring criticality (Jafino et al., 2020; Nogal et al., 2019; Zhang and Zhang, 2019). A number of papers focused on network or infrastructure criticality, use accessibility-based performance measures to compare accessibility before and after a disruption to the network. In these studies, disruptions can take the form of link- or node-removal, or changes to the parameters of the links or nodes such as free-flow travel time or capacity (Novak et al. 2012; Sullivan et al. 2010).
In this study, we define accessibility in the context of the roadway network: accessibility is the ease with which desired destinations may be reached (Novak and Sullivan, 2014; Niemeier, 1997). Accessibility measures focused on food access and food security are of particular relevance to the research described in this paper. These studies can be distinguished by demand-side or supply-side network measures according to whether they are focused on the pre-retail supply chain of food shipping, or access by households to retail grocery locations. A number of papers address demand-side applications for measuring food access and food security. Wixey et al., (2010) develop a physical standard for accessing healthy food within 20 minutes by walking, biking or using public transport. Zhang and Mao, (2019) introduce several methods for measuring food access across multiple modes of travel. Graham et al., (2018) include access to food as a component of the measurement of overall quality of life. Chavis et al., (2018) incorporate results from the USDA Food Acquisition and Purchase Survey into a validation of existing measures of access to food. McEntee and Agyeman (2010) use a detailed set of food retailers and residential locations to identify areas with inadequate food access. The only other study found in the literature that incorporates a comprehensive measure of food access with considerations of food security is a network-based accessibility approach focused on the supply-side of the retail chain (Nozhati et al., 2019).
2.2. Other Methods for Measuring Access and Security
In the research literature, other (non-network-based) methods are used to measure and assess food access and security. In the study described previously by Chavis et al (2018), data from the USDA Food Acquisition and Purchase Survey is used to draw conclusions directly about food access that are then used to calculate accessibility metrics. A critical conclusion is that travel time and supermarket frequency of visits are optimal measures of food accessibility, but also that most households do not always travel to their nearest store (Chavis et al., 2018). A pair of studies create logistic regression models for relating food insecurity to physical and mental health outcomes (Clay et al., 2018; Sharkey at al., 2011). One other study used convergent parallel mixed methods to calculate a Nutrition Environment Measures Survey (NEMS) composite score for food stores (Ko et al., 2018).

4
3. Data Sources and Processing
Data on grocery retailers, grocery shopping behavior, demographics, and residential locations are used in this research. The following section describes the sources and the necessary pre-processing of the data.
3.1. Grocery Retail Data
A database of all known retail grocery locations at the end of 2019 in Vermont was obtained from InfoUSA (https://www.infousa.com/lp/infousa/), an on-demand marketing company providing business and consumer databases since 1972. The data contains geographic coordinates (longitude and latitude) of retail location and the match code for the geo-coding quality, along with the company name, address, franchise description, primary SIC, secondary SIC, NAICS, employment size, location sales volume, headquarters/branch description, year established, credit score, own/lease description, and location square footage.
To supplement the accuracy of the geographic locations provided in the exhaustive InfoUSA data, we also used data from the Vermont E911 database. The Vermont E911 database contains 338,407 specific site locations of all known inhabitable buildings statewide for the purpose of 911 response. The data have geographic coordinates of points that fall within building footprints. Data was initially collected during 1996-1998 as part of the Enhanced 911 data development project, and locations are added, edited, and updated every 6 months. Site coordinates were captured at each location and descriptive metadata was recorded. In addition to the typical sub-meter GPS systems for capture of coordinate data, the data collection system utilized a "dead-reckoning" system that enhanced the GPS data by providing coordinate and heading data during periods of poor GPS reception. Orthophotography was used for sites not accessible in the field. Site coordinates are generally within 5-meters of the centroid of each building’s actual location. Approximately 700 addresses were extracted from the database where the Site Type attribute was either Grocery Store, Gas Station, or Retail Facility.
An additional subset of all known retail grocery locations was obtained from the USDA’s Supplemental Nutrition Assistance Program (SNAP) retailer locator, at https://www.fns.usda.gov/snap/retailer-locator. The USDA Food and Nutrition Service (FNS) issues permits to qualified retailers to accept SNAP benefits, monitors SNAP stores to ensure they follow Program rules, and withdraws or disqualifies SNAP stores who have broken the rules or no longer qualify to accept SNAP benefits. The list of all 673 SNAP-participating retailers in Vermont was downloaded from the USDA website. The data contains the geographic location (longitude and latitude) of each retailer, along with the store name and address.
After geocoding the InfoUSA locations, specific locations whose match code indicated that they were geocoded poorly (at the zip code level) were reviewed, duplicate locations were removed, and co-located points from the E911 data and the SNAP data were used to improve the geocoding of the InfoUSA data. 42 of the SNAP-retailer locations were either duplicates or could not be confirmed as active retailers in Vermont. Additional E911 and SNAP locations were added to the data even if they were not represented in the InfoUSA data, as long as they are
5
shown in Google Maps as a retail food location. Following this pre-processing, the retail grocery location data includes:
• InfoUSA – 415 unique locations
• Vermont E911 – 118 unique locations
• USDA SNAP – 346 unique locations
The 346 USDA SNAP locations consisted of the following types of retailers:
• Discount stores like Family Dollar, Dollar General, Dollar Tree, Big Lots, and Ocean State Job Lot
• Drug stores like Rite Aid, Kinney, CVS, and Walgreens
• Farm markets (and farmer’s markets)
• Beverage stores
• Discount food stores
• Food distributors (Schwan’s and Freihofers)
• Small, independent, food markets, grocery stores, co-op grocery stores, and convenience stores
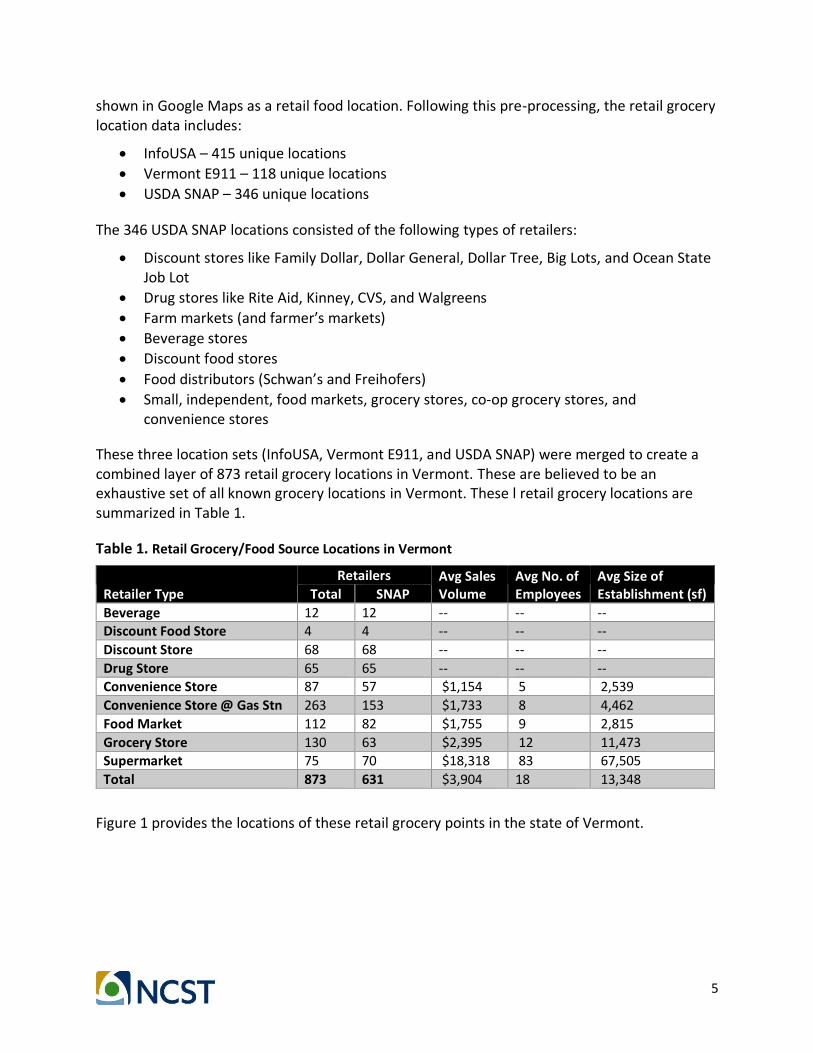
These three location sets (InfoUSA, Vermont E911, and USDA SNAP) were merged to create a combined layer of 873 retail grocery locations in Vermont. These are believed to be an exhaustive set of all known grocery locations in Vermont. These l retail grocery locations are summarized in Table 1.
Table 1. Retail Grocery/Food Source Locations in Vermont
Retailer Type
Retailers Avg Sales Volume
Avg No. of Employees
Avg Size of Establishment (sf) Total SNAP
Beverage 12 12 -- -- -- Discount Food Store 4 4 -- -- --
Discount Store 68 68 -- -- --
Drug Store 65 65 -- -- --
Convenience Store 87 57 $1,154 5 2,539
Convenience Store @ Gas Stn 263 153 $1,733 8 4,462
Food Market 112 82 $1,755 9 2,815
Grocery Store 130 63 $2,395 12 11,473 Supermarket 75 70 $18,318 83 67,505
Total 873 631 $3,904 18 13,348
Figure 1 provides the locations of these retail grocery points in the state of Vermont.
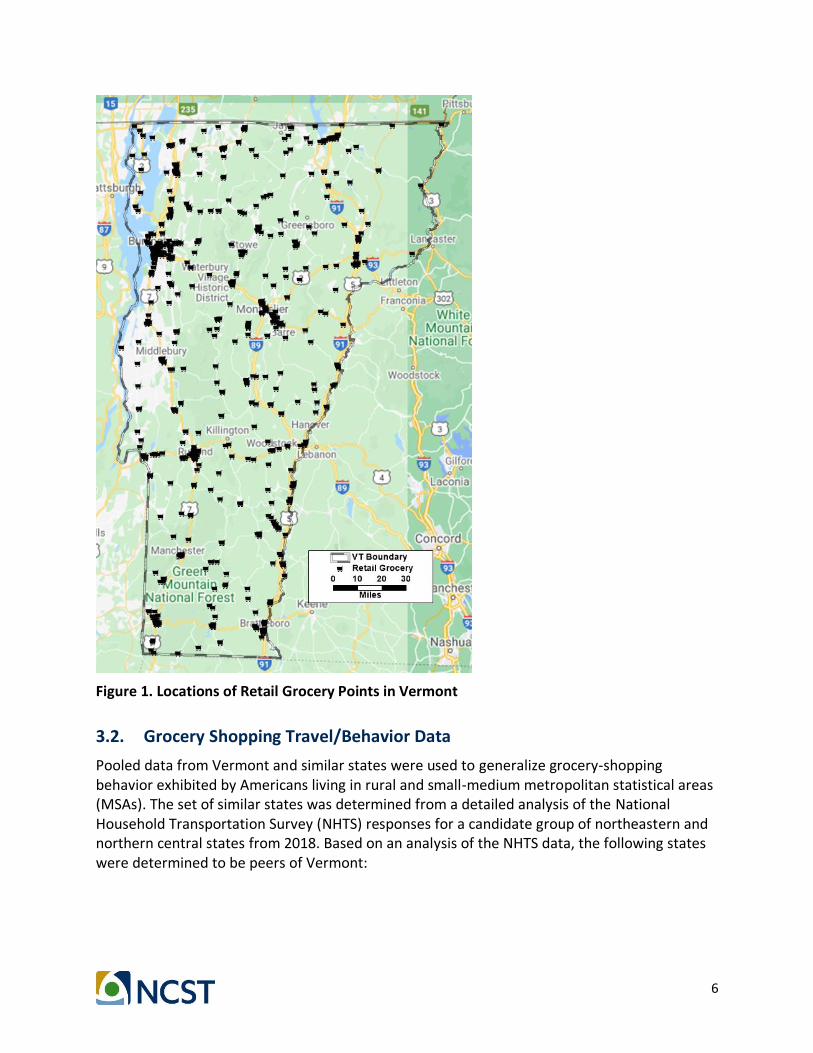
6
Figure 1. Locations of Retail Grocery Points in Vermont
3.2. Grocery Shopping Travel/Behavior Data
Pooled data from Vermont and similar states were used to generalize grocery-shopping behavior exhibited by Americans living in rural and small-medium metropolitan statistical areas (MSAs). The set of similar states was determined from a detailed analysis of the National Household Transportation Survey (NHTS) responses for a candidate group of northeastern and northern central states from 2018. Based on an analysis of the NHTS data, the following states were determined to be peers of Vermont:

7
• Non-CBSA1 northern New Hampshire (189)
• Maine (302)
• West Virginia (224)
• Non-CBSA western Massachusetts (189)
• South Dakota (306)
The total number of households in the pooled data set is 1,622. Using the pooled data, we conducted an intensive analysis of grocery shopping behavior. Grocery shopping trips were extracted from the person-trip files for all households in the pooled data set for the following types of trips:
• Trip mode is car, SUV, van, or pickup truck
• Trip origin purpose is “regular home activities”
• Trip destination purpose is “buy goods (groceries, clothes, appliances, gas)”
As the resolution of the trip purpose of “buying goods” is not fine enough to isolate trips for grocery shopping purposes only, we use the destination purpose “buy goods” as a proxy for grocery shopping trips. Sixteen of these trips were removed from the data set because of inconsistencies. For some, start time, end time, length (in minutes) and length (in miles) were inconsistent, meaning that the trip lengths were not reliable. For others, trip length (in minutes) exceeded 90 minutes and were not considered feasible for emergency-based grocery shopping. Results are summarized in Table 2.
Table 2. NHTS pooled household trip data
3.3. Data on Residential Locations
Residential locations were obtained from the Vermont E911 database. Locations include any point where the Site Type attributes was either Commercial w/Residence, Mobile Home, Multi-Family Dwelling, Other Residential, Residential Farm, or Single-Family Dwelling. The residential
1 Core-based statistical area (CBA) is a geographic area defined by the U.S. Office of Management and Budget (OMB) that consists of at least one county anchored by an urbanized cluster of at least 10,000 people including all adjacent counties that are linked to the urban center.
Total number of households in the pooled data set 1,622
Number of households that made a likely grocery shopping trip in the survey 553
Total number of likely grocery shopping trips 637
Average grocery shopping trip length (mi) 8.61
Std dev. of grocery shopping trip length (mi) 9.88
Average grocery shopping trip length (mi) - urban 6.72
Std dev. of grocery shopping trip length (mi) - urban 9.88
Average grocery shopping trip length (mi) – rural 11.30
Std dev. of grocery shopping trip length (mi) - rural 9.88

8
locations used in the study consisted of 249,827 points with a Unit Count for Multi-Family Dwellings. Other locations are assumed to represent a single household. According to the 2012-2017 American Community Survey (ACS), there are 258,535 households in Vermont. The sum of the Unit Count field for the residential location points is 256,101, so the Unit Count field is a fairly reliable identifier of Vermont’s households.
3.4. Demographic Data Pertaining to Household Vulnerability
Vulnerability-related demographic data for the state of Vermont was obtained from the 2012-2017 ACS at the Census block-group level. Vulnerable households are identified using the following variables:
• Income: Average household income in the block group [Income]
• Age: Percent over 70 years old in households in block group [Over 70]
• Housing: Percent of households that are renter-occupied in the block group [Rented]
• Transportation Issues: Average no. of vehicles available per household in the block group [Vehicles]
• Health/Medical Issues: Percent with of adults with a disability in the block group [Disability]
• Transportation-Dependent Employment: Percent of workers in transportation-dependent occupations in the block group [Trans-Occ]
• Education: Percent of adults without a high school diploma or above in the block group [Non-HS]
• Language Proficiency: Percent of households that speak English “not at all” or “not well” in the block group [Non-English]
• Race/Ethnicity: Percent of households identifying as “white alone” in the block group [Non-White]
For each of these variables, a margin of error is provided in the ACS data. Since the margin of error provides an indication of the upper and lower 90th percentile of the data, it is possible to calculate a standard deviation for each block group from the median and its margin of error. For this analysis, we assume the data are normally distributed within each block group. Thus, the mean is equal to the median and the standard deviation is equal to the margin of error divided by a z-score of 1.28.
3.5. Road Network
As the modeling processes uses the shortest paths between origins and destinations, it is important to have an accurate routable network of roads and streets to support these routing calculations in GIS. We use the road network of the Vermont Travel Model as it already includes an accurate topology of distances, directions, connections, interchanges, and turn prohibitions for all public highways, roads, and streets in the state. The Vermont Travel Model road network originated from the Vermont Road Centerline Data, last updated on December 31, 2017. The data source is maintained by the Vermont Agency of Transportation (VAOT) and contains fields agreed upon by the Agency and the state’s E911 Board. VAOT and the E911 Board merged their
9
separate road networks into a single network in 2012. The Vermont Road Centerline Data continues to be the primary resource for official highway mileage, the linear reference system, and roadway class information, making it the most useful starting point for developing the road network for modeling purposes. For use in the Model, the road network is referred to as the “all-roads network”, or ARN, to contrast it with previous, less comprehensive road networks used in the Model, which omitted many local roads and streets.
3.6. Employing Population Synthesis
To use an accessibility metric that involves detailed, highly resolved retail grocery locations, household locations must also be highly resolved. While the GIS-based data on residential locations provides the necessary level of resolution, the data lack matching demographic data at the household level. The vulnerability-related demographic data needed for the analysis is available only at the block group level for Vermont. To obtain the household level of resolution needed, we employ a population synthesis technique to assign demographic attributes at the block group level to the specific household locations within each census block group.
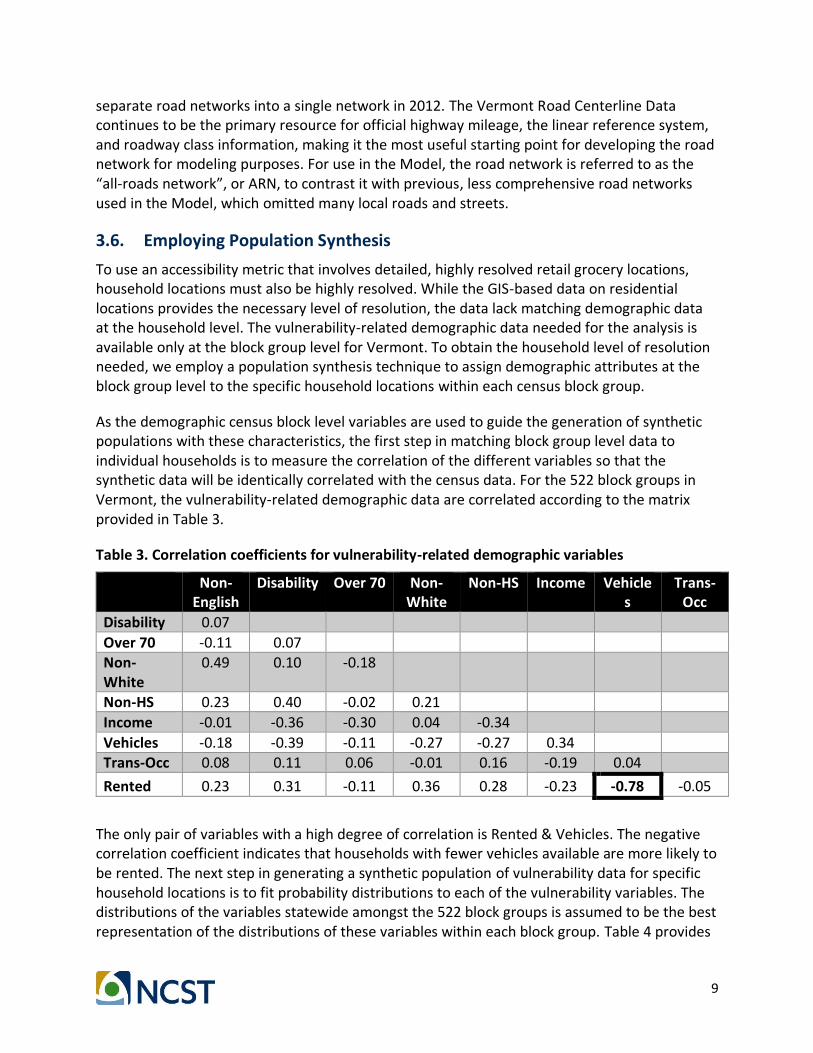
As the demographic census block level variables are used to guide the generation of synthetic populations with these characteristics, the first step in matching block group level data to individual households is to measure the correlation of the different variables so that the synthetic data will be identically correlated with the census data. For the 522 block groups in Vermont, the vulnerability-related demographic data are correlated according to the matrix provided in Table 3.
Table 3. Correlation coefficients for vulnerability-related demographic variables
Non-English
Disability Over 70 Non-White
Non-HS Income Vehicles
Trans-Occ
Disability 0.07
Over 70 -0.11 0.07
Non-White
0.49 0.10 -0.18
Non-HS 0.23 0.40 -0.02 0.21
Income -0.01 -0.36 -0.30 0.04 -0.34
Vehicles -0.18 -0.39 -0.11 -0.27 -0.27 0.34
Trans-Occ 0.08 0.11 0.06 -0.01 0.16 -0.19 0.04
Rented 0.23 0.31 -0.11 0.36 0.28 -0.23 -0.78 -0.05
The only pair of variables with a high degree of correlation is Rented & Vehicles. The negative correlation coefficient indicates that households with fewer vehicles available are more likely to be rented. The next step in generating a synthetic population of vulnerability data for specific household locations is to fit probability distributions to each of the vulnerability variables. The distributions of the variables statewide amongst the 522 block groups is assumed to be the best representation of the distributions of these variables within each block group. Table 4 provides

10
the parameters of the best-fit probability distribution functions (PDFs) for each of these variables.
Table 4. Parameters and best-fit PDFs for each vulnerability-related demographic variable
Variable Best-Fit PDF α or λ or µ β or σ E(X) Variance Max LL Disability Gamma 3.1912 0.0389 0.1242 0.0048 698.8
Non-High School
Gamma 2.2831 0.0362 0.0826 0.0030 819.9
Rented Gamma 2.2091 0.1309 0.2892 0.0379 199.1
Income Gamma 4.4929 10,266 46,122 4.735e+08 -5890.7
Non-English Exponential 0.0046 -- 0.0046 0.0000 2277.2
Over 70 Gamma 3.9447 0.0310 0.1222 0.0038 757.3
Trans-Occ Exponential 0.0281 -- 0.0281 0.0008 1336.6
Vehicles Normal 1.7983 0.3271 1.7983 0.1070 -156.3
Non-White Exponential 0.0500 -- 0.0500 0.0025 1037.4
Matlab software by Mathworks was used to find these best-fit distributions. An example of the histogram of one of these variables (Non-HS) and the associated best-fit PDF is provided in Figure 2.
Figure 2. Example of fitting a PDF to the Non-HS variable
We fix the distribution type for the population synthesis, but estimate the appropriate parameters (α or λ or µ, β or σ, and E(X)) for each block group. For example, for the variables fit to a Gamma PDF, we hold the alpha parameter fixed at the value shown in Table 4, but

11
estimate the beta parameter such that E(X) matches the mean value of each of the individual block groups. For the variables fit to an Exponential distribution, the mean of value of each variable for each block group is used as the coefficient of the Exponential distribution (lambda). For the variables fit to a Normal distribution, the mean and standard deviation of the block group are used. Once all of the block-group-specific PDFs and parameters are calculated, n block-group-specific realizations of a random variable (RV) are generated for each variable in each block group, where n is the number of households in the block group. In this way, a synthetic population of all nine vulnerability variables can be estimated for all households in the state, while adhering to the statewide probability distribution of the variable and the block-group-specific averages. We provide an illustrative example for the income variable, for three block groups in Vermont (1001, 1002, and 1003).
Figure 3. Synthetic population synthesis distributions (block groups 1001, 1002, and 1003)
The characteristics of each of the three block groups are provided in Table 5.
Table 5. Characteristics of the three block groups shown in Figure 2
ID Non-
English Disability
Over 70
Non-White
Non-HS Income Vehicles Trans-Occ Rent
1001 0.0% 6.3% 3.2% 3.7% 4.5% $ 66,217 2.194 4.2% 10.1%
1002 0.0% 9.0% 1.5% 7.0% 12.9% $ 47,411 2.044 1.8% 17.2%
1003 0.0% 8.1% 8.8% 2.3% 6.4% $ 78,435 2.253 3.8% 15.2%
As shown in Figure 3, the number of households in these three block groups are 488, 324, and 843, respectively. The population synthesis procedure generated this many synthetic data
12
points for each block group, such that the average values shown in Table 5 remained accurate, the attributes of each data point are correlated according to Table 3, and the PDF of the resulting distribution adheres to the statewide best-fit type provided in Table 4.
To address the spatial variation in the occurrence of these synthetic households, the residential density of each block group is found by dividing the number of households in the block group by the land area, and then measuring the correlation between the density variable and the other household characteristics. Local residential densities of each household location were calculated by creating ½-mile buffers around each of the locations, summing the number of households in the Unit Count field for each buffer area and then dividing it by the area of the buffer (0.785 sq mi). The highest correlation was found to exist between the “Rented” variable
and residential density ( = 0.64). Therefore, in assigning the synthetic households to the specific household locations, the household locations were sorted by their local residential density and the synthetic household data was sorted by the Rented variable. The result of this process is a unique set of household characteristics for each of the nine vulnerability-related variables for every household location in the state.
4. Methodological Extensions to the CCA
The CCA, introduced in Novak and Sullivan (2014), is a link-focused accessibility measure derived from the network-science/graph theory measure of residual closeness Dangalchev (2006). The CCA can be used to evaluate accessibility in non-connected networks, is monotonic, and is formulated to specifically account for lost accessibility resulting from disconnection of portions of the network. The CCA accounts for changes in routing that result when the capacity on any given link is temporarily reduced to zero (the roadway is impassible) and whether the link provides a single connection point between any households or food locations in the network. While any number of existing accessibility measures are node-focused (i.e., they utilize link impedance in the accessibility calculation but assign an accessibility value to a particular node or set of nodes), CCA is a link-focused measure used to identify specific links that are the most important in terms of facilitating system-wide access to critical destinations (in this case food locations)2.
We modify the CCA by introducing an importance-based weighting approach for both origins (vulnerable versus non-vulnerable households) and destinations (different types of food locations) to evaluate accessibility resulting from roadway disruptions (i.e., closure due to extreme weather). The modified CCA of the specific link being evaluated, 𝑙𝑖, in undirected graph 𝐺 = (𝑁, 𝐿) is defined according to Equation (1).
𝐶𝐶𝐴𝑖 = {∑ ∑
𝜌𝑎𝜑𝑏
2𝑡𝑎𝑏𝑎≠𝑏𝑎∈𝐴𝑏∈𝐵
𝑖𝑙𝑖∈𝐿
(1)
2 The CCA is a ratio scale value.

13
The roadway link, 𝑙𝑖, represents one roadway link in the entire roadway network, 𝑎 represents a unique household origin, and 𝑏 represents a unique grocery destination. Thus, 𝑎𝑏 denotes an OD pair. In this application, 𝑎 ≠ 𝑏, as trips are directed from each origin to the different destinations in the network. The reverse is not true. The free flow travel time is the minimum travel time (in minutes) it takes to travel the shortest path route from each household origin to each grocery store destination through the network, where many different links may be included in the shortest path calculation. The variable 𝑡𝑎𝑏 is the shortest path free flow travel time between household origin 𝑎 and grocery destination 𝑏. The shortest path free flow travel time is commonly used to evaluate distances traveled by a vehicle when modeling traffic flows, particularly essential travel such as emergency-response (Barthélemy, 2011).
The denominator introduces a non-linear aspect to the CCA calculation that is sensitive to each link’s relative importance in the transportation network. If a particular link, 𝑙𝑖, is involved in the shortest path routing calculation between many different OD pairs (it is important or critical in food access), the CCA corresponding to that link will increase dramatically in a non-linear manner. The opposite is true when a particular roadway link rarely appears in shortest path routes between different OD pairs (i.e., the link is not important or critical).
We introduce 𝜌 as the relative “importance” weight associated with origin 𝑎 and 𝜑 as the relative “importance” weight associated with destination 𝑏 , where 0 ≤ 𝜌 ≤ 1 and 0 ≤ 𝜑 ≤ 1. This weighting approach allows any node in the network to vary in importance with respect to its contribution to the CCA.
A variety of techniques and attributes can be used to weight destinations according to the literature, including population, the number of opportunities at a particular destination, market share and GDP among others (Páez et al., 2012; Caschili and De Montis, 2012; Gutiérrez et al., 2011; Taylor et al., 2008; Chen et al., 2007; Xie and Levinson, 2007). Correspondingly, there are many different approaches that could be used to weight different origins and destinations. Because the nodes used in the modified CCA calculation can include different types of household vulnerability and grocery store characteristics – each origin and destination may have its own unique set of attributes – our approach allows for a great deal of flexibility in modeling different types of locations where weights can be estimated subjectively or objectively using traditional place-based attributes. For example, normalized3 objective weights can be derived from quantifiable attributes such as square footage for a grocery store destination while a normalized vulnerability weight can be derived from a mix of household characteristics. Alternatively, weights can be based on a decision-maker’s subjective assessment of the relative importance of a particular node. Higher CCA values indicate increasing importance with respect to the link’s contribution to network-wide accessibility to the complete set of grocery locations.
3 We use the generic term “normalize” to refer changing or transforming numeric data to a common scale without distorting the differences in the range of values.
14
We next calibrate a trip impedance constant, 𝜔, in the denominator of the modified CCA that is sensitive to realistic grocery trips that represent familiar food sources for households by replacing the “2” in the denominator of the original CCA equation. This is shown in Equation (2). Here, we calculate the parameter to be consistent with observed grocery trip behavior instead of using the value of “2” as originally suggested by Dangalchev (2006).
𝐶𝐶𝐴𝑖 = {∑ ∑
𝜌𝑎𝜑𝑏
𝝎𝑡𝑎𝑏𝑎≠𝑏𝑎∈𝐴𝑏∈𝐵
𝑖𝑙𝑖∈𝐿
(2)
The idea of replacing the impedance constant “2” with variable, 𝜔, was motivated by Scott and Horner (2008), who observe that the decay parameter of the contemporary gravity-based measure of accessibility introduced by Hansen (1959), 𝛽, can be computed separately for different types of trip “opportunities”. Using travel data from Louisville, KY, the authors found their empirical computations of 𝛽 for retail, service, and religion-based trips to be notably different from their computation of 𝛽 for purely leisure-based trips. Their results indicate that people are willing to travel much farther for leisure-based trips than they are for retail, service, and religion-based trips.
The calibration of the impedance parameter 𝜔 in the CCA formulation involves adjusting the parameter to match the grocery shopping trip distributions from the 2017 NHTS. The final adjustment made to the CCA addresses the issue of scale. As the CCA calculation for each link in the roadway network is performed for every OD pair (in this case every household to every grocery store), computational requirements become extreme if origins are represented at the household location level. To address this, we aggregate households by associating them with the nearest node in the road network, which typically corresponds to the nearest intersection. The variable 𝜇𝑎 is the household unit count multiplier in the numerator representing the number of households associated with origin node 𝑎, and is treated separately from the vulnerability weighting of the origin, 𝜌𝑎. This is shown in Equation (3).
𝐶𝐶𝐴𝑖 = {∑ ∑
𝝁𝒂𝜌𝑎𝜑𝑏
𝜔𝑡𝑎𝑏𝑎≠𝑏𝑎∈𝐴𝑏∈𝐵
𝑖𝑙𝑖∈𝐿
(3)
We weight household vulnerability using income, percentage under 70, and percentage non-white. These characteristics represent commonly used measures of social vulnerability constructs/variables in transportation studies (Novak et al., 2020; El-Geneidy et al., (2016); Farber et al., (2014); Morency et al., (2011). The complements of the two percentage-based variables (Under 70 and Non-White) are used so that decreases in all three of the characteristics are synonymous with households being “more vulnerable”. The characteristics are normalized, summed, and then combined into a single vulnerability weight, 𝜌, for each household origin node 𝑎. Retail grocery square footage is normalized to represent the retail-grocery weighting, 𝜑, at each destination 𝑏.
15
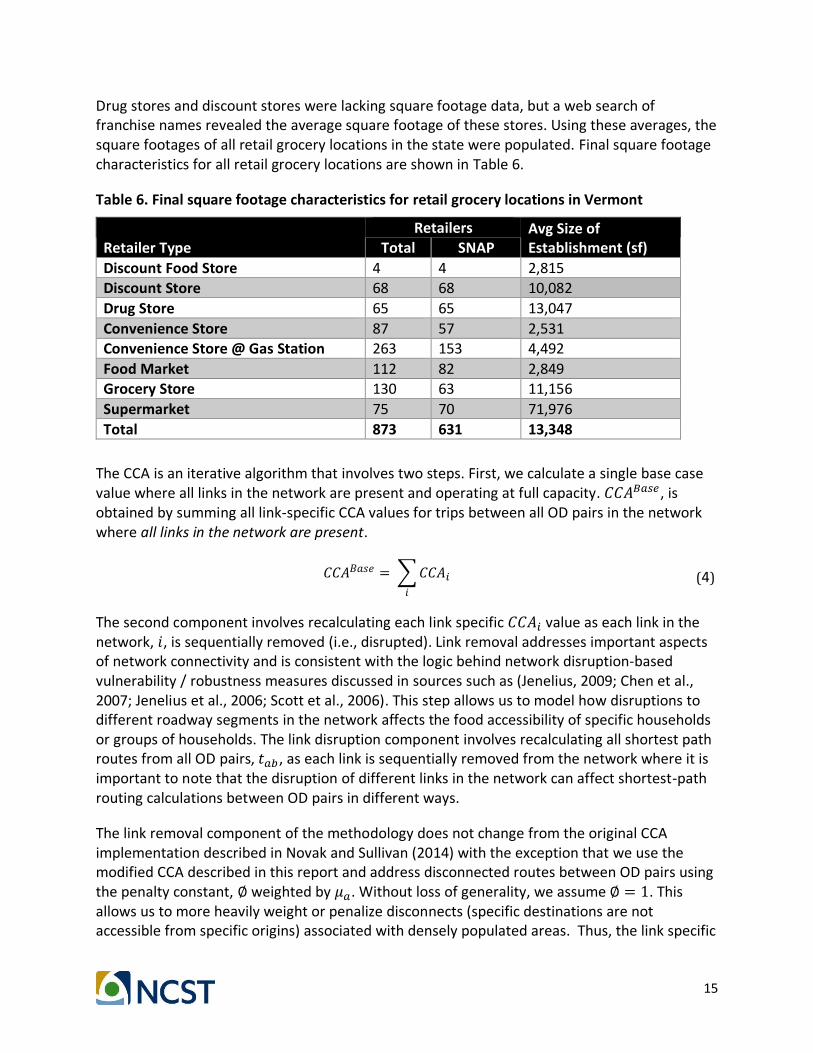
Drug stores and discount stores were lacking square footage data, but a web search of franchise names revealed the average square footage of these stores. Using these averages, the square footages of all retail grocery locations in the state were populated. Final square footage characteristics for all retail grocery locations are shown in Table 6.
Table 6. Final square footage characteristics for retail grocery locations in Vermont
Retailer Type Retailers Avg Size of
Establishment (sf) Total SNAP
Discount Food Store 4 4 2,815 Discount Store 68 68 10,082
Drug Store 65 65 13,047
Convenience Store 87 57 2,531 Convenience Store @ Gas Station 263 153 4,492
Food Market 112 82 2,849 Grocery Store 130 63 11,156
Supermarket 75 70 71,976
Total 873 631 13,348
The CCA is an iterative algorithm that involves two steps. First, we calculate a single base case value where all links in the network are present and operating at full capacity. 𝐶𝐶𝐴𝐵𝑎𝑠𝑒, is obtained by summing all link-specific CCA values for trips between all OD pairs in the network where all links in the network are present.
𝐶𝐶𝐴𝐵𝑎𝑠𝑒 = ∑ 𝐶𝐶𝐴𝑖
𝑖
(4)
The second component involves recalculating each link specific 𝐶𝐶𝐴𝑖 value as each link in the network, 𝑖, is sequentially removed (i.e., disrupted). Link removal addresses important aspects of network connectivity and is consistent with the logic behind network disruption-based vulnerability / robustness measures discussed in sources such as (Jenelius, 2009; Chen et al., 2007; Jenelius et al., 2006; Scott et al., 2006). This step allows us to model how disruptions to different roadway segments in the network affects the food accessibility of specific households or groups of households. The link disruption component involves recalculating all shortest path routes from all OD pairs, 𝑡𝑎𝑏 , as each link is sequentially removed from the network where it is important to note that the disruption of different links in the network can affect shortest-path routing calculations between OD pairs in different ways.
The link removal component of the methodology does not change from the original CCA implementation described in Novak and Sullivan (2014) with the exception that we use the modified CCA described in this report and address disconnected routes between OD pairs using the penalty constant, ∅ weighted by 𝜇𝑎. Without loss of generality, we assume ∅ = 1. This allows us to more heavily weight or penalize disconnects (specific destinations are not accessible from specific origins) associated with densely populated areas. Thus, the link specific
16
CCA value increases dramatically as the number of disconnected household origins, 𝑎 , and/or the population associated with those origins, 𝜇𝑎, increases. We then applied the modified CCA in Chittenden County, Vermont to identify the most critical links with respect to food access.
To limit runtime, the CCA was calculated for a subset of all road segments, corresponding to major roads (AOT functional class of 1 to 4 (town highway, or state, federal, and interstate highway) even though all public roads and streets were used in the determination of distance between OD pairs. Runtimes ranged from 48 to 96 hours. Runtimes are contingent on the number of roadway segments included in the shortest-path calculation. The shortest-path algorithm itself takes about 3 minutes to run using the Multiple Paths tool in TransCAD, so the total runtime is approximately equal to the product of the number of segments considered and the runtime of the Multiple Paths algorithm. The runtime of the shortest path algorithm is dependent on the size of the matrix being calculated. For this project, the size of the shortest path matrix is the number of retail grocery locations by the number of household origin nodes in the study area. Computational requirements become extreme if origins are represented at the individual household level. To address this, we aggregate households by associating them with the nearest node in the road network, which typically corresponds to the nearest intersection (see subsection 3.6). The numbers of household-nodes considered in this study ranged from 6,300 to 7,000, and the number of retail grocery locations considered ranged from 99 to 162.
5. Results
5.1. Calibration of ω
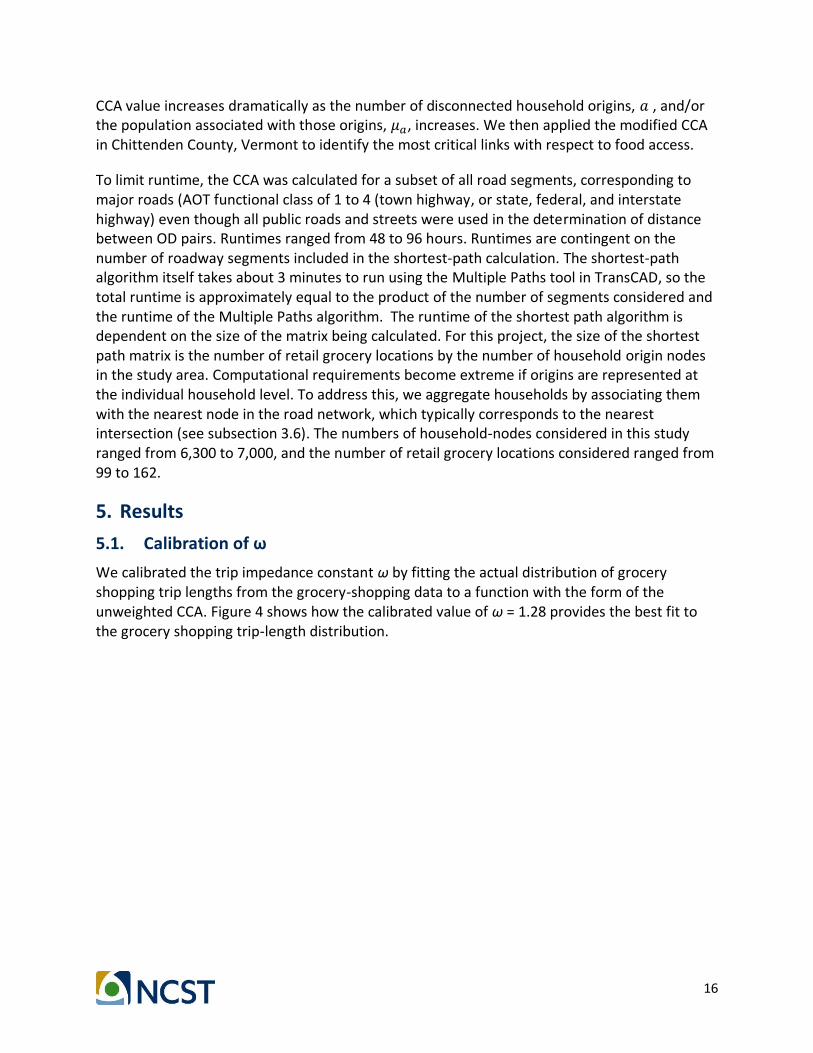
We calibrated the trip impedance constant ω by fitting the actual distribution of grocery shopping trip lengths from the grocery-shopping data to a function with the form of the unweighted CCA. Figure 4 shows how the calibrated value of ω = 1.28 provides the best fit to the grocery shopping trip-length distribution.
17
Figure 4. Best fit ω = 1.28 to observed grocery shopping trip length distribution
18
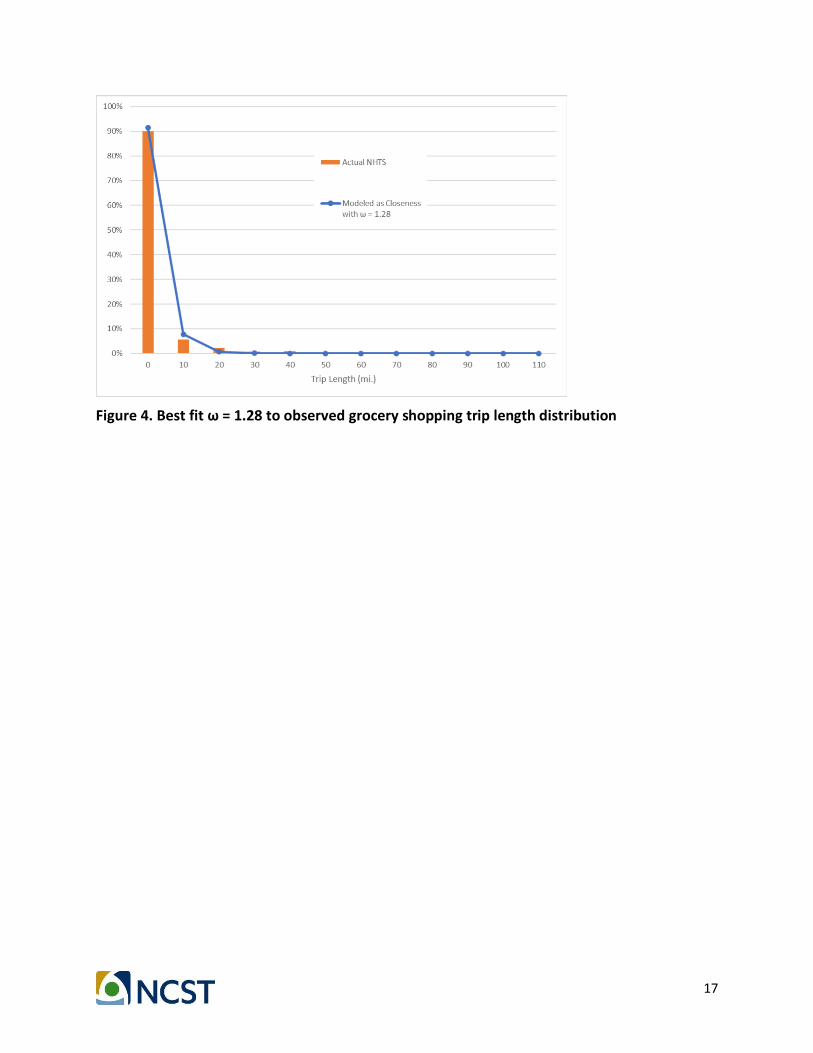
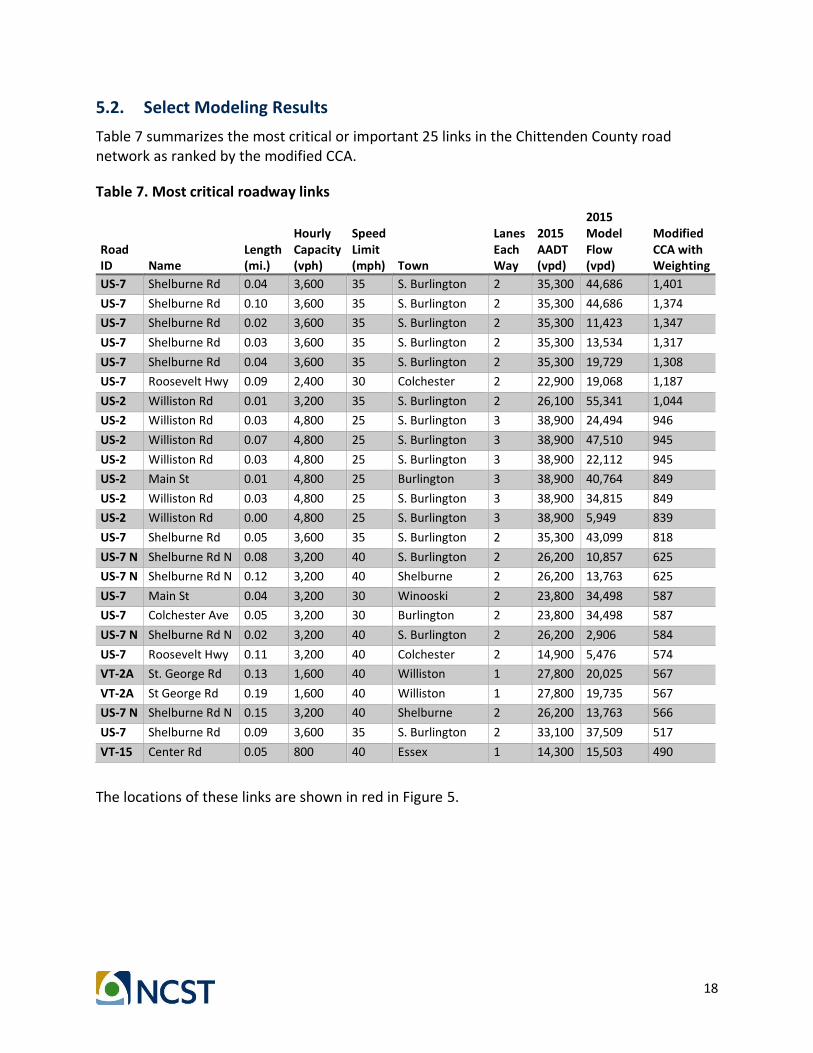
5.2. Select Modeling Results
Table 7 summarizes the most critical or important 25 links in the Chittenden County road network as ranked by the modified CCA.
Table 7. Most critical roadway links
Road ID Name
Length (mi.)
Hourly Capacity (vph)
Speed Limit (mph) Town
Lanes Each Way
2015 AADT (vpd)
2015 Model Flow (vpd)
Modified CCA with Weighting
US-7 Shelburne Rd 0.04 3,600 35 S. Burlington 2 35,300 44,686 1,401
US-7 Shelburne Rd 0.10 3,600 35 S. Burlington 2 35,300 44,686 1,374
US-7 Shelburne Rd 0.02 3,600 35 S. Burlington 2 35,300 11,423 1,347
US-7 Shelburne Rd 0.03 3,600 35 S. Burlington 2 35,300 13,534 1,317
US-7 Shelburne Rd 0.04 3,600 35 S. Burlington 2 35,300 19,729 1,308
US-7 Roosevelt Hwy 0.09 2,400 30 Colchester 2 22,900 19,068 1,187
US-2 Williston Rd 0.01 3,200 35 S. Burlington 2 26,100 55,341 1,044
US-2 Williston Rd 0.03 4,800 25 S. Burlington 3 38,900 24,494 946
US-2 Williston Rd 0.07 4,800 25 S. Burlington 3 38,900 47,510 945
US-2 Williston Rd 0.03 4,800 25 S. Burlington 3 38,900 22,112 945
US-2 Main St 0.01 4,800 25 Burlington 3 38,900 40,764 849
US-2 Williston Rd 0.03 4,800 25 S. Burlington 3 38,900 34,815 849
US-2 Williston Rd 0.00 4,800 25 S. Burlington 3 38,900 5,949 839
US-7 Shelburne Rd 0.05 3,600 35 S. Burlington 2 35,300 43,099 818
US-7 N Shelburne Rd N 0.08 3,200 40 S. Burlington 2 26,200 10,857 625
US-7 N Shelburne Rd N 0.12 3,200 40 Shelburne 2 26,200 13,763 625
US-7 Main St 0.04 3,200 30 Winooski 2 23,800 34,498 587
US-7 Colchester Ave 0.05 3,200 30 Burlington 2 23,800 34,498 587
US-7 N Shelburne Rd N 0.02 3,200 40 S. Burlington 2 26,200 2,906 584
US-7 Roosevelt Hwy 0.11 3,200 40 Colchester 2 14,900 5,476 574
VT-2A St. George Rd 0.13 1,600 40 Williston 1 27,800 20,025 567
VT-2A St George Rd 0.19 1,600 40 Williston 1 27,800 19,735 567
US-7 N Shelburne Rd N 0.15 3,200 40 Shelburne 2 26,200 13,763 566
US-7 Shelburne Rd 0.09 3,600 35 S. Burlington 2 33,100 37,509 517
VT-15 Center Rd 0.05 800 40 Essex 1 14,300 15,503 490
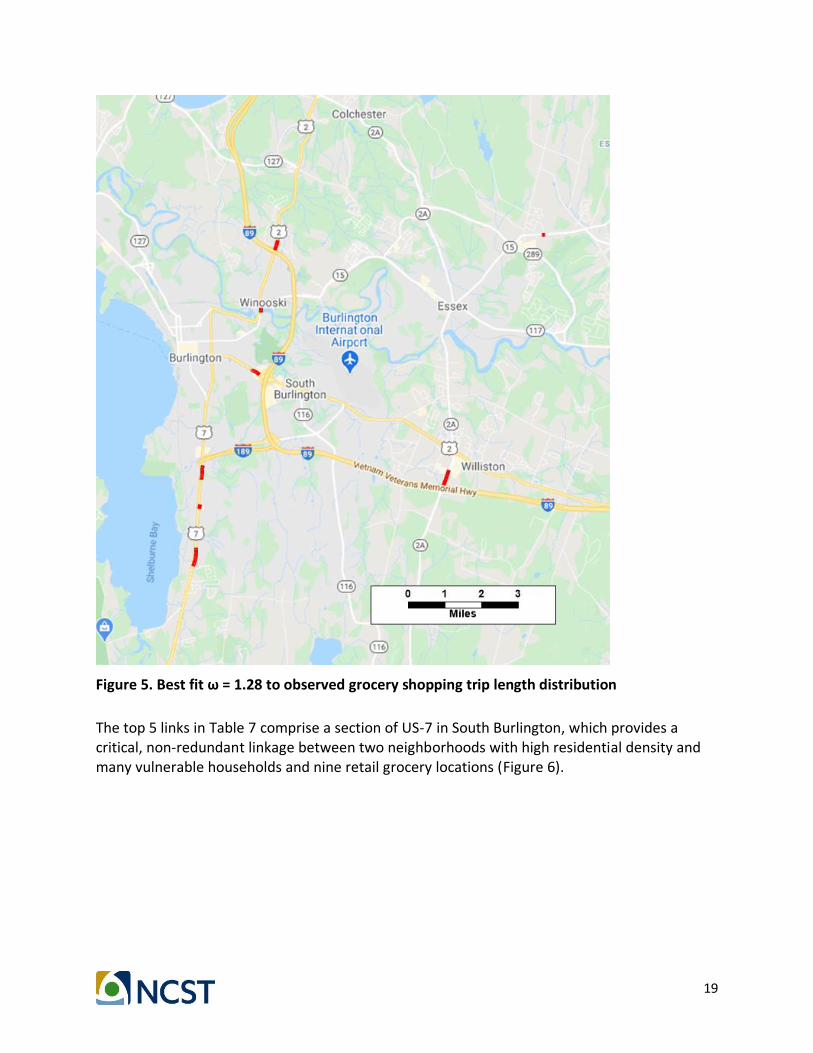
The locations of these links are shown in red in Figure 5.
19
Figure 5. Best fit ω = 1.28 to observed grocery shopping trip length distribution
The top 5 links in Table 7 comprise a section of US-7 in South Burlington, which provides a critical, non-redundant linkage between two neighborhoods with high residential density and many vulnerable households and nine retail grocery locations (Figure 6).

20
Figure 6. Five most critical links in Chittenden County
In Figure 7, we show the links on Route 7 in Colchester, which provide essential routes for grocery shopping traffic where there are no nearby redundant routes. These links also lack local redundancy, making them critical for retail grocery access for a very large number of travelers. For all of the critical links shown in Table 7, a high volume of traffic is carried on a typical day, so their criticality also arises from the fact that their disruption would affect accessibility from a large number of households.
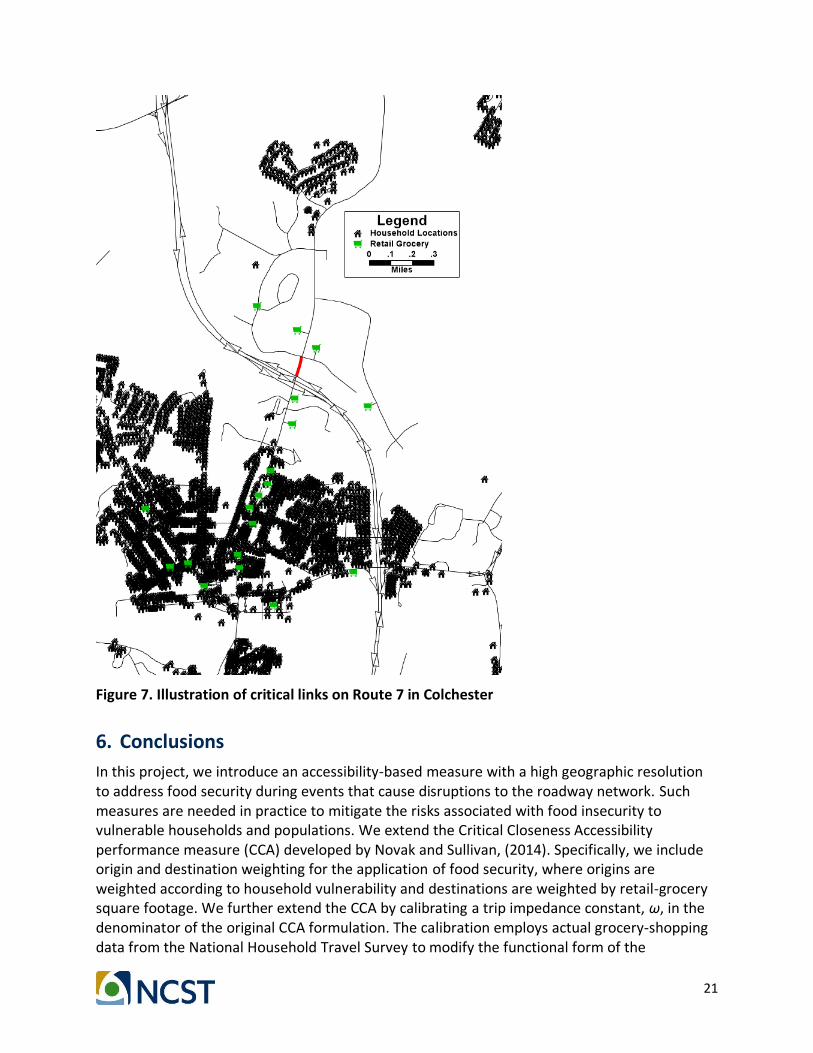
21
Figure 7. Illustration of critical links on Route 7 in Colchester
6. Conclusions
In this project, we introduce an accessibility-based measure with a high geographic resolution to address food security during events that cause disruptions to the roadway network. Such measures are needed in practice to mitigate the risks associated with food insecurity to vulnerable households and populations. We extend the Critical Closeness Accessibility performance measure (CCA) developed by Novak and Sullivan, (2014). Specifically, we include origin and destination weighting for the application of food security, where origins are weighted according to household vulnerability and destinations are weighted by retail-grocery square footage. We further extend the CCA by calibrating a trip impedance constant, ω, in the denominator of the original CCA formulation. The calibration employs actual grocery-shopping data from the National Household Travel Survey to modify the functional form of the

22
accessibility measure to address trips that are focused on food access and thus incorporates realistic travel expectations for retail grocery familiarity of households.
The accessibility measure provides an ordinal measure of demand-side food accessibility that considers the spatial distribution of both the origin and destination, the topology of the road network, and the characteristics of the roadway network such as capacities, volumes, and travel speeds. The measure also takes into account household familiarity with retail grocery locations, destination weighting to account for retail grocery characteristic (square footage), and origin weighting to account for household vulnerability (through population synthesis). We demonstrate the methodology using the Travel Demand Model for Chittenden County, Vermont and provide example outputs. Chittenden County provides a unique test bed for this type of application as it contains population centers that range from a medium-sized metropolitan area with a high-density downtown core to remote rural regions.
As noted, the authors use the TransCAD platform and code the algorithm into the software via Caliperscript. To implement the methodology, practitioners would need to do the same. Alternatively, researchers or practitioners interested in applying the methodology could elect to enter into a research partnership with the authors.

23
7. References
Barthélemy, M., 2011. Spatial networks. Physics Reports, 499(1-3), pp.1-101.
Caschili, S. and De Montis, A., 2013. Accessibility and complex network analysis of the US commuting system. Cities, 30, pp.4-17.
CDC. (2015). Public Health Workbook to Define, Locate, and Reach Special, Vulnerable, and At-risk Populations in an Emergency. Department of Health and Human Services, Centers for Disease Control and Prevention, Office of Public Health Preparedness and Response.
Cutter, S. L., Boruff, B. J., & Shirley, W. L. (2003). Social vulnerability to environmental hazards. Social science quarterly, 84(2), 242-261.
Chavis, Celeste, Tiffani Davis, Tiana Norris, and Anita Jones, 2018. An Analysis of Food Accessibility Using the USDA Food Acquisition and Purchase Survey. Paper No. 18-06598 from the Transportation Research Board 97th Annual Meeting, Washington DC, United States, 2018.
Chen, A., Yang, C., Kongsomsaksakul, S. and Lee, M., 2007. Network-based accessibility measures for vulnerability analysis of degradable transportation networks. Networks and Spatial Economics, 7(3), pp.241-256.
Clay, L., Papas, M., Gill, K., Abramson, D., 2018. Application of a Theoretical Model Toward Understanding Continued Food Insecurity Post Hurricane Katrina. Disaster Medicine and Public Health Preparedness. 21(1): 47-56.
Dangalchev, C., 2006. Residual Closeness in Networks. Physica A 365(2): 556-564.
Dixon, Stephen, Daniel Johnson and Richard Batley, 2019. A job accessibility index to evaluate employment impacts in isolated regions now restored to the rail network. Transportation Planning and Technology, 42:5, 515-537.
D'Orso, Gabriele and Marco Migliore, 2020. A GIS-based method for evaluating the walkability of a pedestrian environment and prioritised investments. Journal of Transport Geography, Volume 82, 2020, 102555.
El-Geneidy, A., Levinson, D., Diab, E., Boisjoly, G., Verbich, D. and Loong, C., 2016. The cost of equity: Assessing transit accessibility and social disparity using total travel cost. Transportation Research Part A: Policy and Practice, 91, pp.302-316.
Farber, S., Bartholomew, K., Li, X., Páez, A. and Habib, K.M.N., 2014. Assessing social equity in distance based transit fares using a model of travel behavior. Transportation Research Part A: Policy and Practice, 67, pp.291-303.
Graham, Hilary, Siân de Bell, Kate Flemming, Amanda Sowden, Piran White, and Kath Wright, 2018. The experiences of everyday travel for older people in rural areas: A systematic review of UK qualitative studies. Journal of Transport & Health, Volume 11, 2018, pp 141-152.
24
Grisé, Emily, Geneviève Boisjoly, Meadhbh Maguire, and Ahmed El-Geneidy, 2019. Elevating access: Comparing accessibility to jobs by public transport for individuals with and without a physical disability. Transportation Research Part A 125 (2019) pp 280 – 293.
Gutiérrez, J. and Urbano, P., 1996. Accessibility in the European Union: the impact of the trans-European road network. Journal of transport Geography, 4(1), pp.15-25.
Hansen, W.G., 1959. How accessibility shapes land use. Journal of the American Institute of planners, 25(2), pp.73-76.
Jafino, Bramka Arga, Jan Kwakkel and Alexander Verbraeck, 2020. Transport network criticality metrics: a comparative analysis and a guideline for selection. Transport Reviews, 40:2, 241-264.
Jenelius, E., 2009. Network structure and travel patterns: explaining the geographical disparities of road network vulnerability. Journal of Transport Geography, 17(3), pp.234-244.
Jenelius, E., Petersen, T. and Mattsson, L.G., 2006. Importance and exposure in road network vulnerability analysis. Transportation Research Part A: Policy and Practice, 40(7), pp.537-560.
Ko, L.K., Enzler, C., Perry, C.K., Rodriguez, E., Marisal, N. (2018) Food availability and food access in rural agricultural communities: use of mixed methods. BMC Public Health. 18: 634.
Labi, Samuel, Asif Faiz, Tariq Usman Saeed, Bortiorkor Nii Tsui Alabi and Wubeshet Woldemariam, 2019. Connectivity, Accessibility, and Mobility Relationships in the Context of Low-Volume Road Networks. Transportation Research Record 2019, Vol. 2673(12) 717–727.
Luo, Ding, Oded Cats, Hans van Lint, and Graham Currie, 2019. Integrating network science and public transport accessibility analysis for comparative assessment. Journal of Transport Geography, Volume 80, 2019, 102505.
McEntee, J. and J. Agyeman, 2010. Towards the development of a GIS method for identifying rural food deserts: Geographic access in Vermont, USA. Applied Geography. 30(1): 165-176.
Morency, C., Paez, A., Roorda, M.J., Mercado, R. and Farber, S., 2011. Distance traveled in three Canadian cities: Spatial analysis from the perspective of vulnerable population segments. Journal of Transport Geography, 19(1), pp.39-50.
Niemeier, D. A. (1997). Accessibility: an evaluation using consumer welfare. Transportation, 24(4), 377-396.
Nogal, Maria, Oswaldo Morales Nápoles, and Alan O’Connor, 2019. Structured expert judgement to understand the intrinsic vulnerability of traffic networks. Transportation Research Part A 127 (2019) pp 136 – 152.
Noland, Robert B., Sicheng Wang, Scott Kulp, Benjamin H. Strauss, 2019. Employment accessibility and rising seas. Transportation Research Part D: Transport and Environment, Volume 77, 2019, pp 560-572.
25
Novak, D.C., Sullivan, J.F., Sentoff, K. and Dowds, J., 2020. A framework to guide strategic disinvestment in roadway infrastructure considering social vulnerability. Transportation Research Part A: Policy and Practice, 132, pp.436-451.
Novak, D.C., and James L. Sullivan, 2014. A Link-Focused Methodology for Evaluating Accessibility to Emergency Services. Decision Support Systems, Volume 57 (January 2014): 309-319.
Novak, D.C., Sullivan, J.L. and Scott, D.M., 2012. A network-based approach for evaluating and ranking transportation roadway projects. Applied geography, 34, pp.498-506.
Nozhati, S., N. Rosenheim, B.R. Ellingwood, H. Mahmoud, and M. Perez, 2019. Probabilistic framework for evaluating food security of households in the aftermath of a disaster. Structure and Infrastructure Engineering. 15(8): 1060-1074.
Páez, A., Scott, D.M. and Morency, C., 2012. Measuring accessibility: positive and normative implementations of various accessibility indicators. Journal of Transport Geography, 25, pp.141-153.
Ren, Min, 2019. Measuring Accessibility to Jobs for the Urban Poor—Case Study of Ahmedaba, India. 19th COTA International Conference of Transportation Professionals, July 6–8, 2019 in Nanjing, China.
Scott, D.M. and Horner, M.W., 2008. The role of urban form in shaping access to opportunities: an exploratory spatial data analysis. Journal of transport and land use, 1(2), pp.89-119.
Scott, D.M., Novak, D.C., Aultman-Hall, L. and Guo, F., 2006. Network robustness index: A new method for identifying critical links and evaluating the performance of transportation networks. Journal of Transport Geography, 14(3), pp.215-227.
Sharkey, J.R., C.M. Johnson, and W.R. Dean, 2011. Relationship of Household Food Insecurity to Health-Related Quality of Life in a Large Sample of Rural and Urban Women. Women and Health. 51(5): 442-460.
Shayanfar, Elham, Paul M. Schonfeld, and J. Jason Wang, 2019. Prioritizing Highway Development Projects Based on Market Access in Appalachia. Transportation Research Record 2019, Vol. 2673(8) 333–342.
Sullivan, J. L., Novak, D. C., Aultman-Hall, L., & Scott, D. M. (2010). Identifying critical road segments and measuring system-wide robustness in transportation networks with isolating links: A link-based capacity-reduction approach. Transportation Research Part A: Policy and Practice, 44(5), 323-336.
Taylor, M.A., 2008. Critical transport infrastructure in Urban areas: impacts of traffic incidents assessed using accessibility‐based network vulnerability analysis. Growth and Change, 39(4), pp.593-616.
USDA, 2017. Food Access Research Atlas. A web-based tool of the Economic Research Service of the U.S. Department of Agriculture (https://www.ers.usda.gov/data-products/food-access-research-atlas/).

26
USDA, 2019. Rural-Urban Commuting Area Codes. Created by the United States Department of Agriculture, Economic Research Service, Last Updated 7/3/2019. Accessed at https://www.ers.usda.gov/data-products/rural-urban-commuting-area-codes/ on March 9, 2020.
Wixey, S, D. Elliot, and AA Blair, 2010. Healthy Food Physical Accessibility Standard and its Implications for Transport, Spatial Planning and Public Health. European Transport Conference, 2010 Proceedings, Glasgow Scotland, United Kingdom.
Xie, F. and Levinson, D., 2009. Modeling the growth of transportation networks: A comprehensive review. Networks and Spatial Economics, 9(3), pp.291-307.
Yin, Y., Madanat, S.M. and Lu, X.Y., 2009. Robust improvement schemes for road networks under demand uncertainty. European Journal of Operational Research, 198(2), pp.470-479.
Zhan, X. and Ukkusuri, S.V., 2019. Multiclass, simultaneous route and departure time choice dynamic traffic assignment with an embedded spatial queuing model. Transportmetrica B: Transport Dynamics, 7(1), pp.124-146.
Zhang, Jiawen and Liang Mao, 2019. Integrating multiple transportation modes into measures of spatial food accessibility. Journal of Transport & Health, Volume 13, 2019, pp 1-11.
Zhang, Jing, and Zhi-Hui Zhang, 2019. A Review of the Research Methods on Vulnerability of Transportation System. 19th COTA International Conference of Transportation Professionals, July 6–8, 2019 in Nanjing, China.

27
8. Data Management
Products of Research
The research team used a variety of current data sources to calibrate and weight the Critical Closeness Accessibility (CCA) index for measuring critical food access. Since the CCA is a disaggregate measure, disaggregate data were required. We used retail grocery store square footage to weight the traditional version of the CCA. This disaggregate data was obtained from a private marketing source, InfoGroup, for all business locations in Vermont under the primary standard industry codes (SIC) 541101, 541103, or 541105 (Convenience Stores, Food Markets, and Grocers-Retail).
Scoring Vermont households based on their vulnerability during and after a natural disaster was conducted by disaggregating demographic data from the American Community Survey (ACS) to the household-parcel level using population-synthesis techniques guided by the locations of household points in the state’s E911 point database.
Grocery “food-sheds” were estimated from the 2017 NHTS for the calibration of the form of the closeness equation, based on real trips to access retail food. This process required access to the 2017 NHTS person-trip data for Vermont and its peer states. This data is publicly available at https://nhts.ornl.gov/. New data was not be generated in this step.
Once these steps were completed, new CCA indices were calculated, with a focus on access to food by vulnerable households. These new CCA indices were added as new attributes in the routable roadway network for Vermont.
Data Format and Content
The final data format are shapefiles with fixed-format binary attribute tables.
Data Access and Sharing
Travel behavior data from the National Household Travel Survey has already been anonymized following its collection by US DOT. For more information on the efforts of US DOT to anonymize participant data, refer to:
• Gonder, Jeffrey, Evan Burton, and Elaine Murakami, 2015. Archiving data from new survey technologies: enabling research with high-precision data while preserving participant privacy. Transportation Research Procedia 11 (2015) 85 – 97.
• Frequently Asked Questions About the NHTS, at https://nhts.ornl.gov/2016/pub/participant-faq.pdf.
Disaggregate data pertaining to the vulnerability of Vermont households during and after a natural disaster, will not be shared, since it includes synthesized attributes at the household-parcel level.
28
Grocery store location data from InfoGroup was received with all names, personal identifiers and contact information removed. Only the following fields will be included:
• Street address
• Latitude/Longitude
• Square footage
Due to the terms of the purchase agreement, this data cannot be shared.
Reuse and Redistribution
The three PIs on this project will hold the intellectual property rights to the data created by the project, particularly the new, revised CCA values. Those rights will not be transferred to a data archive.