Target Volume Delineation for Partial Breast Radiotherapy Planning: Clinical Characteristics...
8
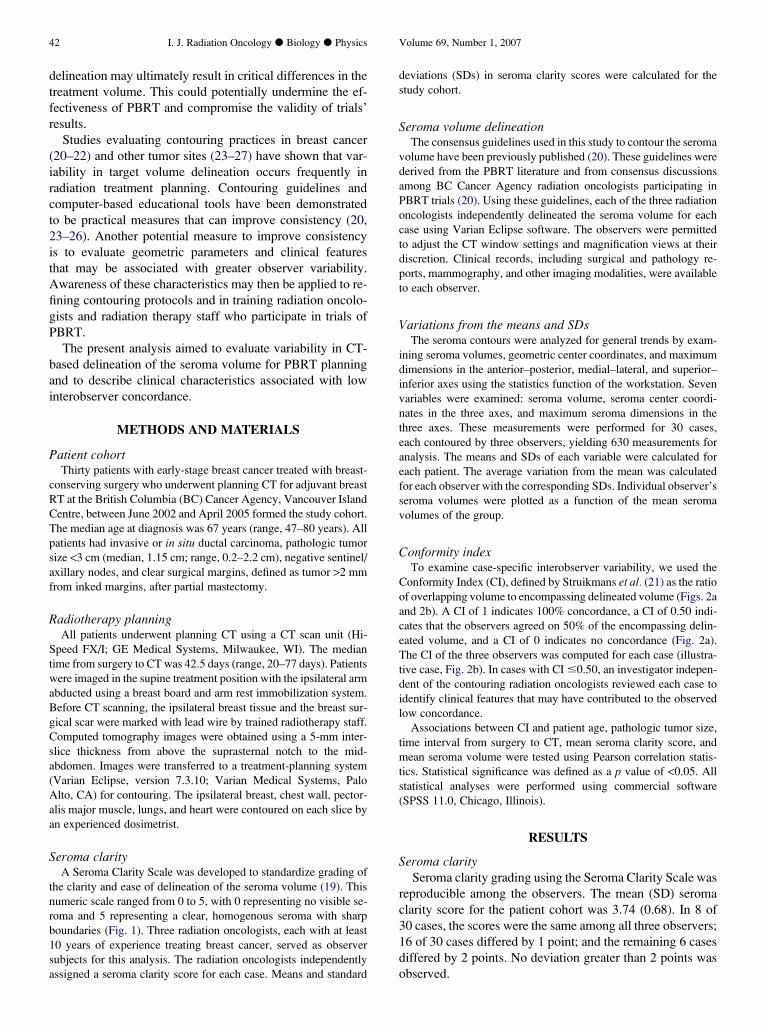
CLINICAL INVESTIGATION Breast TARGET VOLUME DELINEATION FOR PARTIAL BREAST RADIOTHERAPY PLANNING: CLINICAL CHARACTERISTICS ASSOCIATED WITH LOW INTEROBSERVER CONCORDANCE ROSS P. PETERSEN, B.SC.,* y PAULINE T. TRUONG, M.D., C.M.,* y HOSAM A. KADER, M.B., B.S.,* y ERIC BERTHELET, M.D.,* y JUNELLA C. LEE, B.SC.,* y MICHELLE L. HILTS,PH.D.,* z ADAM S. KADER, B.SC.,* y WAYNE A. BECKHAM,PH.D.,* z AND IVO A. OLIVOTTO, M.D.* y * Radiation Therapy Program, British Columbia Cancer Agency, Vancouver Island Centre, y University of British Columbia, and z University of Victoria, Victoria, BC, Canada Purpose: To examine variability in target volume delineation for partial breast radiotherapy planning and evalu- ate characteristics associated with low interobserver concordance. Methods and Materials: Thirty patients who underwent planning CT for adjuvant breast radiotherapy formed the study cohort. Using a standardized scale to score seroma clarity and consensus contouring guidelines, three radi- ation oncologists independently graded seroma clarity and delineated seroma volumes for each case. Seroma geo- metric center coordinates, maximum diameters in three axes, and volumes were recorded. Conformity index (CI), the ratio of overlapping volume and encompassing delineated volume, was calculated for each case. Cases with CI #0.50 were analyzed to identify features associated with low concordance. Results: The median time from surgery to CT was 42.5 days. For geometric center coordinates, variations from the mean were 0.5–1.1 mm and standard deviations (SDs) were 0.5–1.8 mm. For maximum seroma dimensions, var- iations from the mean and SDs were predominantly <5 mm, with the largest SDs observed in the medial–lateral axis. The mean CI was 0.61 (range, 0.27–0.84). Five cases had CI #0.50. Conformity index was significantly asso- ciated with seroma clarity ( p < 0.001) and seroma volume ( p < 0.002). Features associated with reduced concor- dance included tissue stranding from the surgical cavity, proximity to muscle, dense breast parenchyma, and benign calcifications that may be mistaken for surgical clips. Conclusion: Variability in seroma contouring occurred in three dimensions, with the largest variations in the medial–lateral axis. Awareness of clinical features associated with reduced concordance may be applied toward training staff and refining contouring guidelines for partial breast radiotherapy trials. Ó 2007 Elsevier Inc. Breast cancer,Partial breast radiotherapy, Target volume, Interobserver variability, Conformity index. INTRODUCTION Prospective randomized trials are in progress to evaluate the efficacy of adjuvant partial breast radiotherapy (PBRT) after breast-conserving surgery in patients with early-stage breast cancer. The hypothesis that irradiation of the postsurgical excision cavity with a margin of adjacent breast tissue offers equivalent local control compared with standard whole breast radiotherapy is based on studies demonstrating that approxi- mately 70–80% of in-breast recurrences occur at or near the tumor bed (1–4). Radiation treatment targeted to a limited volume using accelerated fractionation schedules over shorter durations has the potential to reduce normal tissue toxicities and improve convenience for breast cancer patients. Currently available PBRT modalities include interstitial brachytherapy (5–9), MammoSite balloon catheter systems (10–12), computerized tomography (CT)-based con- formal external beam techniques (13–15), proton beams (16), and intraoperative electron beam therapy (17). Regardless of the PBRT modality of choice, accurate delineation of target volumes is critical because these volumes provide the basis for all subsequent planning decisions. A potential caveat in PBRT planning is interobserver inconsistencies in delineating the target volume. Although the optimal target volume for PBRT remains to be estab- lished, most series in the PBRT literature have defined the postoperative seroma or tumor bed as the volume on which subsequent planning and prescription decisions are based (5–19). As margins are added to the seroma volume to create the clinical and planning target volumes, variations in its Reprint requests to: Pauline T. Truong, M.D., C.M., British Co- lumbia Cancer Agency, Vancouver Island Centre, 2410 Lee Ave., Victoria, BC V8R 6V5, Canada. Tel: (250) 519-5575; Fax: (250) 519-2018; E-mail: [email protected] Presented in part at the 2007 United Kingdom Radiation Oncol- ogy Conference, March 18–21, 2007, Edinburgh, Scotland. Conflict of interest: none. Received Nov 9, 2006, and in revised form Jan 27, 2007. Accepted for publication Jan 31, 2007. 41 Int. J. Radiation Oncology Biol. Phys., Vol. 69, No. 1, pp. 41–48, 2007 Copyright Ó 2007 Elsevier Inc. Printed in the USA. All rights reserved 0360-3016/07/$–see front matter doi:10.1016/j.ijrobp.2007.01.070
Transcript of Target Volume Delineation for Partial Breast Radiotherapy Planning: Clinical Characteristics...
Int. J. Radiation Oncology Biol. Phys., Vol. 69, No. 1, pp. 41–48, 2007Copyright � 2007 Elsevier Inc.
Printed in the USA. All rights reserved0360-3016/07/$–see front matter
doi:10.1016/j.ijrobp.2007.01.070
CLINICAL INVESTIGATION Breast
TARGET VOLUME DELINEATION FOR PARTIAL BREAST RADIOTHERAPYPLANNING: CLINICAL CHARACTERISTICS ASSOCIATED WITH LOW
INTEROBSERVER CONCORDANCE
ROSS P. PETERSEN, B.SC.,*y PAULINE T. TRUONG, M.D., C.M.,*y HOSAM A. KADER, M.B., B.S.,*y
ERIC BERTHELET, M.D.,*y JUNELLA C. LEE, B.SC.,*y MICHELLE L. HILTS, PH.D.,*z
ADAM S. KADER, B.SC.,*y WAYNE A. BECKHAM, PH.D.,*z AND IVO A. OLIVOTTO, M.D.*y
*Radiation Therapy Program, British Columbia Cancer Agency, Vancouver Island Centre, yUniversity of BritishColumbia, and zUniversity of Victoria, Victoria, BC, Canada
Purpose: To examine variability in target volume delineation for partial breast radiotherapy planning and evalu-ate characteristics associated with low interobserver concordance.Methods and Materials: Thirty patients who underwent planning CT for adjuvant breast radiotherapy formed thestudy cohort. Using a standardized scale to score seroma clarity and consensus contouring guidelines, three radi-ation oncologists independently graded seroma clarity and delineated seroma volumes for each case. Seroma geo-metric center coordinates, maximum diameters in three axes, and volumes were recorded. Conformity index (CI),the ratio of overlapping volume and encompassing delineated volume, was calculated for each case. Cases withCI #0.50 were analyzed to identify features associated with low concordance.Results: The median time from surgery to CT was 42.5 days. For geometric center coordinates, variations from themean were 0.5–1.1 mm and standard deviations (SDs) were 0.5–1.8 mm. For maximum seroma dimensions, var-iations from the mean and SDs were predominantly <5 mm, with the largest SDs observed in the medial–lateralaxis. The mean CI was 0.61 (range, 0.27–0.84). Five cases had CI #0.50. Conformity index was significantly asso-ciated with seroma clarity ( p < 0.001) and seroma volume ( p < 0.002). Features associated with reduced concor-dance included tissue stranding from the surgical cavity, proximity to muscle, dense breast parenchyma, andbenign calcifications that may be mistaken for surgical clips.Conclusion: Variability in seroma contouring occurred in three dimensions, with the largest variations in themedial–lateral axis. Awareness of clinical features associated with reduced concordance may be applied towardtraining staff and refining contouring guidelines for partial breast radiotherapy trials. � 2007 Elsevier Inc.
Breast cancer, Partial breast radiotherapy, Target volume, Interobserver variability, Conformity index.
INTRODUCTION
Prospective randomized trials are in progress to evaluate the
efficacy of adjuvant partial breast radiotherapy (PBRT) after
breast-conserving surgery in patients with early-stage breast
cancer. The hypothesis that irradiation of the postsurgical
excision cavity with a margin of adjacent breast tissue offers
equivalent local control compared with standard whole breast
radiotherapy is based on studies demonstrating that approxi-
mately 70–80% of in-breast recurrences occur at or near the
tumor bed (1–4). Radiation treatment targeted to a limited
volume using accelerated fractionation schedules over
shorter durations has the potential to reduce normal tissue
toxicities and improve convenience for breast cancer
patients. Currently available PBRT modalities include
41
interstitial brachytherapy (5–9), MammoSite balloon catheter
systems (10–12), computerized tomography (CT)-based con-
formal external beam techniques (13–15), proton beams (16),
and intraoperative electron beam therapy (17). Regardless of
the PBRT modality of choice, accurate delineation of target
volumes is critical because these volumes provide the basis
for all subsequent planning decisions.
A potential caveat in PBRT planning is interobserver
inconsistencies in delineating the target volume. Although
the optimal target volume for PBRT remains to be estab-
lished, most series in the PBRT literature have defined the
postoperative seroma or tumor bed as the volume on which
subsequent planning and prescription decisions are based
(5–19). As margins are added to the seroma volume to create
the clinical and planning target volumes, variations in its
Reprint requests to: Pauline T. Truong, M.D., C.M., British Co-lumbia Cancer Agency, Vancouver Island Centre, 2410 Lee Ave.,Victoria, BC V8R 6V5, Canada. Tel: (250) 519-5575; Fax: (250)519-2018; E-mail: [email protected]
Presented in part at the 2007 United Kingdom Radiation Oncol-ogy Conference, March 18–21, 2007, Edinburgh, Scotland.
Conflict of interest: none.Received Nov 9, 2006, and in revised form Jan 27, 2007.
Accepted for publication Jan 31, 2007.
42 I. J. Radiation Oncology d Biology d Physics Volume 69, Number 1, 2007
delineation may ultimately result in critical differences in the
treatment volume. This could potentially undermine the ef-
fectiveness of PBRT and compromise the validity of trials’
results.
Studies evaluating contouring practices in breast cancer
(20–22) and other tumor sites (23–27) have shown that var-
iability in target volume delineation occurs frequently in
radiation treatment planning. Contouring guidelines and
computer-based educational tools have been demonstrated
to be practical measures that can improve consistency (20,
23–26). Another potential measure to improve consistency
is to evaluate geometric parameters and clinical features
that may be associated with greater observer variability.
Awareness of these characteristics may then be applied to re-
fining contouring protocols and in training radiation oncolo-
gists and radiation therapy staff who participate in trials of
PBRT.
The present analysis aimed to evaluate variability in CT-
based delineation of the seroma volume for PBRT planning
and to describe clinical characteristics associated with low
interobserver concordance.
METHODS AND MATERIALS
Patient cohortThirty patients with early-stage breast cancer treated with breast-
conserving surgery who underwent planning CT for adjuvant breast
RT at the British Columbia (BC) Cancer Agency, Vancouver Island
Centre, between June 2002 and April 2005 formed the study cohort.
The median age at diagnosis was 67 years (range, 47–80 years). All
patients had invasive or in situ ductal carcinoma, pathologic tumor
size <3 cm (median, 1.15 cm; range, 0.2–2.2 cm), negative sentinel/
axillary nodes, and clear surgical margins, defined as tumor >2 mm
from inked margins, after partial mastectomy.
Radiotherapy planningAll patients underwent planning CT using a CT scan unit (Hi-
Speed FX/I; GE Medical Systems, Milwaukee, WI). The median
time from surgery to CT was 42.5 days (range, 20–77 days). Patients
were imaged in the supine treatment position with the ipsilateral arm
abducted using a breast board and arm rest immobilization system.
Before CT scanning, the ipsilateral breast tissue and the breast sur-
gical scar were marked with lead wire by trained radiotherapy staff.
Computed tomography images were obtained using a 5-mm inter-
slice thickness from above the suprasternal notch to the mid-
abdomen. Images were transferred to a treatment-planning system
(Varian Eclipse, version 7.3.10; Varian Medical Systems, Palo
Alto, CA) for contouring. The ipsilateral breast, chest wall, pector-
alis major muscle, lungs, and heart were contoured on each slice by
an experienced dosimetrist.
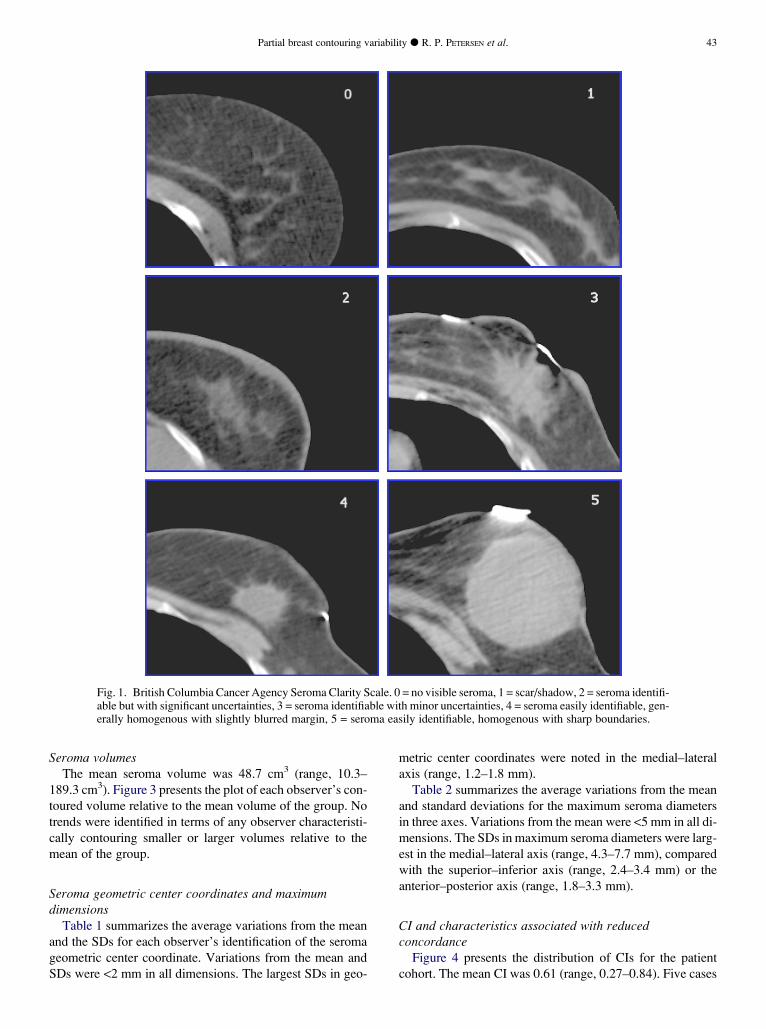
Seroma clarityA Seroma Clarity Scale was developed to standardize grading of
the clarity and ease of delineation of the seroma volume (19). This
numeric scale ranged from 0 to 5, with 0 representing no visible se-
roma and 5 representing a clear, homogenous seroma with sharp
boundaries (Fig. 1). Three radiation oncologists, each with at least
10 years of experience treating breast cancer, served as observer
subjects for this analysis. The radiation oncologists independently
assigned a seroma clarity score for each case. Means and standard
deviations (SDs) in seroma clarity scores were calculated for the
study cohort.
Seroma volume delineationThe consensus guidelines used in this study to contour the seroma
volume have been previously published (20). These guidelines were
derived from the PBRT literature and from consensus discussions
among BC Cancer Agency radiation oncologists participating in
PBRT trials (20). Using these guidelines, each of the three radiation
oncologists independently delineated the seroma volume for each
case using Varian Eclipse software. The observers were permitted
to adjust the CT window settings and magnification views at their
discretion. Clinical records, including surgical and pathology re-
ports, mammography, and other imaging modalities, were available
to each observer.
Variations from the means and SDsThe seroma contours were analyzed for general trends by exam-
ining seroma volumes, geometric center coordinates, and maximum
dimensions in the anterior–posterior, medial–lateral, and superior–
inferior axes using the statistics function of the workstation. Seven
variables were examined: seroma volume, seroma center coordi-
nates in the three axes, and maximum seroma dimensions in the
three axes. These measurements were performed for 30 cases,
each contoured by three observers, yielding 630 measurements for
analysis. The means and SDs of each variable were calculated for
each patient. The average variation from the mean was calculated
for each observer with the corresponding SDs. Individual observer’s
seroma volumes were plotted as a function of the mean seroma
volumes of the group.
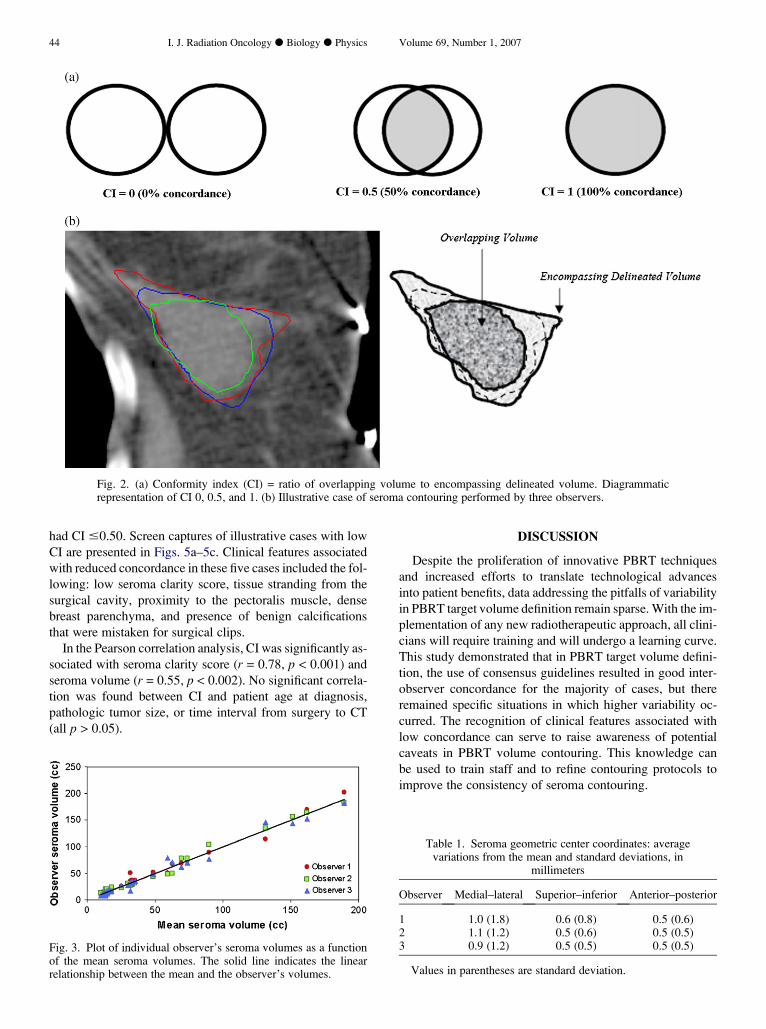
Conformity indexTo examine case-specific interobserver variability, we used the
Conformity Index (CI), defined by Struikmans et al. (21) as the ratio
of overlapping volume to encompassing delineated volume (Figs. 2a
and 2b). A CI of 1 indicates 100% concordance, a CI of 0.50 indi-
cates that the observers agreed on 50% of the encompassing delin-
eated volume, and a CI of 0 indicates no concordance (Fig. 2a).
The CI of the three observers was computed for each case (illustra-
tive case, Fig. 2b). In cases with CI #0.50, an investigator indepen-
dent of the contouring radiation oncologists reviewed each case to
identify clinical features that may have contributed to the observed
low concordance.
Associations between CI and patient age, pathologic tumor size,
time interval from surgery to CT, mean seroma clarity score, and
mean seroma volume were tested using Pearson correlation statis-
tics. Statistical significance was defined as a p value of <0.05. All
statistical analyses were performed using commercial software
(SPSS 11.0, Chicago, Illinois).
RESULTS
Seroma claritySeroma clarity grading using the Seroma Clarity Scale was
reproducible among the observers. The mean (SD) seroma
clarity score for the patient cohort was 3.74 (0.68). In 8 of
30 cases, the scores were the same among all three observers;
16 of 30 cases differed by 1 point; and the remaining 6 cases
differed by 2 points. No deviation greater than 2 points was
observed.
Partial breast contouring variability d R. P. PETERSEN et al. 43
Fig. 1. British Columbia Cancer Agency Seroma Clarity Scale. 0 = no visible seroma, 1 = scar/shadow, 2 = seroma identifi-able but with significant uncertainties, 3 = seroma identifiable with minor uncertainties, 4 = seroma easily identifiable, gen-erally homogenous with slightly blurred margin, 5 = seroma easily identifiable, homogenous with sharp boundaries.
Seroma volumesThe mean seroma volume was 48.7 cm3 (range, 10.3–
189.3 cm3). Figure 3 presents the plot of each observer’s con-
toured volume relative to the mean volume of the group. No
trends were identified in terms of any observer characteristi-
cally contouring smaller or larger volumes relative to the
mean of the group.
Seroma geometric center coordinates and maximumdimensions
Table 1 summarizes the average variations from the mean
and the SDs for each observer’s identification of the seroma
geometric center coordinate. Variations from the mean and
SDs were <2 mm in all dimensions. The largest SDs in geo-
metric center coordinates were noted in the medial–lateral
axis (range, 1.2–1.8 mm).
Table 2 summarizes the average variations from the mean
and standard deviations for the maximum seroma diameters
in three axes. Variations from the mean were <5 mm in all di-
mensions. The SDs in maximum seroma diameters were larg-
est in the medial–lateral axis (range, 4.3–7.7 mm), compared
with the superior–inferior axis (range, 2.4–3.4 mm) or the
anterior–posterior axis (range, 1.8–3.3 mm).
CI and characteristics associated with reducedconcordance
Figure 4 presents the distribution of CIs for the patient
cohort. The mean CI was 0.61 (range, 0.27–0.84). Five cases
44 I. J. Radiation Oncology d Biology d Physics Volume 69, Number 1, 2007
Fig. 2. (a) Conformity index (CI) = ratio of overlapping volume to encompassing delineated volume. Diagrammaticrepresentation of CI 0, 0.5, and 1. (b) Illustrative case of seroma contouring performed by three observers.
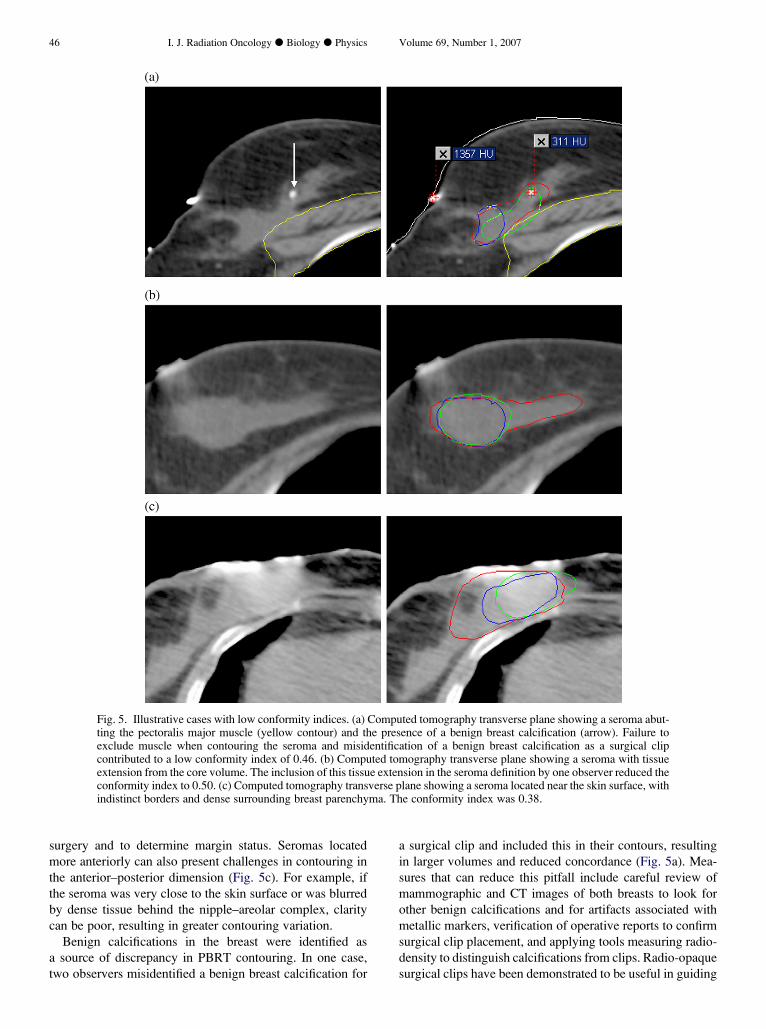
had CI #0.50. Screen captures of illustrative cases with low
CI are presented in Figs. 5a–5c. Clinical features associated
with reduced concordance in these five cases included the fol-
lowing: low seroma clarity score, tissue stranding from the
surgical cavity, proximity to the pectoralis muscle, dense
breast parenchyma, and presence of benign calcifications
that were mistaken for surgical clips.
In the Pearson correlation analysis, CI was significantly as-
sociated with seroma clarity score (r = 0.78, p < 0.001) and
seroma volume (r = 0.55, p < 0.002). No significant correla-
tion was found between CI and patient age at diagnosis,
pathologic tumor size, or time interval from surgery to CT
(all p > 0.05).
Fig. 3. Plot of individual observer’s seroma volumes as a functionof the mean seroma volumes. The solid line indicates the linearrelationship between the mean and the observer’s volumes.
DISCUSSION
Despite the proliferation of innovative PBRT techniques
and increased efforts to translate technological advances
into patient benefits, data addressing the pitfalls of variability
in PBRT target volume definition remain sparse. With the im-
plementation of any new radiotherapeutic approach, all clini-
cians will require training and will undergo a learning curve.
This study demonstrated that in PBRT target volume defini-
tion, the use of consensus guidelines resulted in good inter-
observer concordance for the majority of cases, but there
remained specific situations in which higher variability oc-
curred. The recognition of clinical features associated with
low concordance can serve to raise awareness of potential
caveats in PBRT volume contouring. This knowledge can
be used to train staff and to refine contouring protocols to
improve the consistency of seroma contouring.
Table 1. Seroma geometric center coordinates: averagevariations from the mean and standard deviations, in
millimeters
Observer Medial–lateral Superior–inferior Anterior–posterior
1 1.0 (1.8) 0.6 (0.8) 0.5 (0.6)2 1.1 (1.2) 0.5 (0.6) 0.5 (0.5)3 0.9 (1.2) 0.5 (0.5) 0.5 (0.5)
Values in parentheses are standard deviation.

Partial breast contouring variability d R. P. PETERSEN et al. 45
In the present study’s examination of seroma geometric
center coordinates and maximum diameters, the largest
SDs were noted in the medial–lateral axis. Potential sources
of contouring discrepancies in this axis include seroma vol-
umes with indistinct borders and low clarity scores, tissue ex-
tensions from the tumor bed, and dense breast parenchyma
(Figs. 5a–5c). In the examination of cases with low CI,
although dense extensions from the tumor bed may occur in
any dimension, they were prominent in the medial–lateral di-
rection (Fig. 5b). The consensus adopted by our institution
was that such extensions or stranding likely represented sur-
gical disturbance rather than the tumor bed and hence were
not to be included in contouring the seroma. However, we
acknowledge that uncertainty can arise, and the question of
whether all tissue extensions should be included as part of
the target volume remains controversial. Another clinical
characteristic noted to contribute to greater contouring varia-
tions in the medial–lateral axis was the presence of dense
breast parenchyma. Dense parenchyma, especially when ad-
jacent to the tumor bed, may often appear on CT as lateral
densities merging with the tumor bed (Fig. 5c). Determina-
tion of the boundaries between normal dense breast tissue
and the tumor bed can thus be difficult. Objective evaluation
of tissue radiodensity using the Hounsfield Unit measure-
ment tool in RT planning systems may be helpful in such
a situation.
Our data demonstrated that although the largest SDs were
in the medial–lateral axis, variability in the other axes also
Table 2. Maximum seroma dimensions: average variationfrom the mean and standard deviations, in millimeters
Observer Medial–lateral Superior–inferior Anterior–posterior
1 2.7 (4.5) 2.6 (2.9) 1.8 (2.2)2 3.2 (4.3) 4.1 (3.4) 3.2 (3.3)3 3.4 (7.7) 3.2 (2.4) 2.4 (1.9)
Values in parentheses are standard deviation.
occurred. A relatively large deviation from the mean of 4
mm was noted in the superior–inferior axis for one observer.
With a CT interslice thickness of 5 mm, the observer may
have experienced uncertainty regarding whether an addi-
tional contour was warranted in the superior and inferior
limits. Studies of various tumor sites, including prostate
and lung cancer (27, 28), have suggested that the selection
of CT slice thickness can impact volume definitions. In a se-
ries reporting reproducibility among three radiation oncolo-
gists performing CT-based prostate organ contouring in 40
cases, the use of a 5-mm CT slice thickness was implicated
as a factor contributing to difficulties in localizing the pros-
tate apex and poor demarcation between the prostate base
and seminal vesicles (27). Another series, which compared
the use of 1.25-mm and 5-mm CT slice thicknesses in sub-
jects with pulmonary nodules, reported that reduced slice
thickness improved detection of small nodules and inter-
observer agreement (28). These data support the suggestion
that reducing interslice thickness can correspondingly reduce
interobserver variability, a strategy that warrants investiga-
tion in the setting of PBRT planning.
In the present analysis, the anterior–posterior axis was
associated with the smallest degree of contouring variability.
A potential explanation for this observation may be that the
skin and the chest wall provided clear boundaries in this dimen-
sion for the majority of cases and that the anterior–posterior
dimension is generally the smallest breast dimension on a
supine CT scan. Variability in the anterior–posterior axis
arose when the seroma abutted the pectoralis major muscle
(Fig. 5a). There is no need to include the pectoralis muscle
in the seroma definition if the surgical margins are clear
and cancer has not invaded the muscle. Difficulty in demar-
cating the interface between seroma and muscle can lead to
a failure to exclude muscle from the target volume and can
contribute to greater interobserver discrepancies. Review of
the operative and pathology reports may be helpful in these
situations to determine the extent of surgery and to verify
whether fascia and/or muscle were removed at the time of
0
2
4
6
8
10
12
14
0-0.10 0.11-0.20
0.21-0.30
0.31-0.40
0.41-0.50
0.51-0.60
0.61-0.70
0.71-0.80
0.81-0.90
0.91-1.00
Conformity Index
# of
Pat
ient
s
Fig. 4. Distribution of conformity indices for the study cohort.
46 I. J. Radiation Oncology d Biology d Physics Volume 69, Number 1, 2007
Fig. 5. Illustrative cases with low conformity indices. (a) Computed tomography transverse plane showing a seroma abut-ting the pectoralis major muscle (yellow contour) and the presence of a benign breast calcification (arrow). Failure toexclude muscle when contouring the seroma and misidentification of a benign breast calcification as a surgical clipcontributed to a low conformity index of 0.46. (b) Computed tomography transverse plane showing a seroma with tissueextension from the core volume. The inclusion of this tissue extension in the seroma definition by one observer reduced theconformity index to 0.50. (c) Computed tomography transverse plane showing a seroma located near the skin surface, withindistinct borders and dense surrounding breast parenchyma. The conformity index was 0.38.
surgery and to determine margin status. Seromas located
more anteriorly can also present challenges in contouring in
the anterior–posterior dimension (Fig. 5c). For example, if
the seroma was very close to the skin surface or was blurred
by dense tissue behind the nipple–areolar complex, clarity
can be poor, resulting in greater contouring variation.
Benign calcifications in the breast were identified as
a source of discrepancy in PBRT contouring. In one case,
two observers misidentified a benign breast calcification for
a surgical clip and included this in their contours, resulting
in larger volumes and reduced concordance (Fig. 5a). Mea-
sures that can reduce this pitfall include careful review of
mammographic and CT images of both breasts to look for
other benign calcifications and for artifacts associated with
metallic markers, verification of operative reports to confirm
surgical clip placement, and applying tools measuring radio-
density to distinguish calcifications from clips. Radio-opaque
surgical clips have been demonstrated to be useful in guiding

Partial breast contouring variability d R. P. PETERSEN et al. 47
PBRT volume definition (29) but were not used routinely by
surgeons referring patients with breast cancer to our center
during the era of this study. The pitfalls in seroma delineation
identified in our study support the contention that clip place-
ment may be of added value in PBRT volume localization.
The CI was found to be a useful method to quantify inter-
observer variability and to highlight specific cases with low
concordance for further analysis. The mean CI of 0.61 (range,
0.27–0.84) found in the current study of three observers, each
contouring 30 partial breast volumes, was comparable to the
mean CI of 0.56 (range, 0.39–0.74), reported by Struikmans
et al. (21) in their study of five observers, each contouring 18
breast boost volumes. However, distinct from that study’s
identification of one observer who consistently contoured
smaller volumes with respect to the mean, no characteristic
tendency to contour smaller or larger volumes relative to
the mean was demonstrated among our subjects. The use of
consensus-based contouring guidelines may have contrib-
uted to the concordance of the individual’s volumes in the
majority of cases.
The ongoing randomized trials of PBRT, including the Na-
tional Surgical Adjuvant Breast and Bowel Project B39 trial,
the Canadian Randomized Trial of Accelerated Partial Breast
Irradiation, and the European Society of Therapeutic Radiol-
ogy and Oncology trial, require that subjects have clearly
identifiable excision cavities. The correlations between con-
touring concordance and seroma clarity score and seroma
volume demonstrated in the present analysis have clinical
implications in identifying appropriate PBRT candidates for
these trials. A seroma clarity score of 3 or less may serve to
flag cases that require consensus review of applied contours
before trial enrolment and randomization. When the seroma
volume is small, external review of applied contours may
also be helpful to avert potentially large shifts in the planning
target volume.
The present study did not demonstrate significant associa-
tions between CI and patient age, tumor size, or time interval
from surgery to CT. The vast majority of subjects in our study
cohort were aged >50 years with small tumors, and all under-
went planning CT within 11 weeks from surgery. The relative
homogeneity in these characteristics and small sample size
REFER
may have limited the power to detect statistically significant
associations between CI and these characteristics. In a study
evaluating seroma clarity and volume as a function of time
from surgery, Kader et al. (19) applied the same Seroma Clar-
ity Scale used in the present study to a series of 206 women
undergoing planning CT after breast-conserving surgery. The
mean seroma clarity score was 3.4 and most stable from 3 to 8
weeks after surgery. Thereafter, the mean seroma clarity
score decreased to 2.5 during weeks 9 to 14, and further
declined to 1.7 beyond 14 weeks from surgery. Seroma vol-
umes also progressively decreased with longer time from sur-
gery (19), a finding consistent with a study by Oh et al. (30).
These data and the present study’s demonstration of reduced
concordance with low seroma clarity and volume support the
suggestion that the optimal time to perform planning CT for
PBRT candidates is within 8 weeks from surgery to reduce
the likelihood of encountering difficulties in target volume
delineation associated with low seroma clarity and small
volume.
With continuing advances in imaging technology, the
application of modalities such as breast ultrasound (31–33)
and breast magnetic resonance imaging (33, 34) in PBRT
planning warrant investigation. Correlative studies to assess
relationships between the postoperative seroma and the
preoperative breast tumor as defined by mammography,
CT, or ultrasound are also warranted because they have the
potential to further improve accuracy in localizing the
PBRT target volume.
CONCLUSION
Variability in seroma contouring can occur in three dimen-
sions but was most prominent in the medial–lateral axis.
Clinical features associated with reduced interobserver con-
cordance included low seroma clarity score, small volume,
tissue extension from the surgical cavity, proximity to the
pectoralis muscle, dense breast parenchyma, and the pres-
ence of benign calcifications. Knowledge of these features
may be applied to train staff participating in PBRT trials
and to refine contouring guidelines and quality assurance
processes for PBRT protocols.
ENCES
1. Clark RM, McCullock PB, Levine MN, et al. Randomized clin-ical trial to assess the effectiveness of breast irradiation follow-ing lumpectomy and axillary dissection for node-negative breastcancer. J Natl Cancer Inst 1992;84:683–689.
2. Liljgren G, Homberg L, Bergh J, et al. 10 year results after sec-tor resection with or without postoperative radiotherapy forstage I breast cancer: A randomized trial. J Clin Oncol 1999;17:2326–2333.
3. Veronesi U, Marubini E, Mariani L, et al. Radiotherapy afterbreast-conserving surgery in small breast carcinoma: Longterm results of a randomized trial. Ann Oncol 2001;12:997–1003.
4. Smith TE, Lee D, Turner BC, et al. True recurrence vs. new pri-mary ipsilateral breast tumor relapse: An analysis of clinical andpathologic differences and their implications in natural history,
prognoses, and therapeutic management. Int J Radiat OncolBiol Phys 2000;48:1281–1289.
5. Baglan KL, Martinez AA, Frazier RC, et al. The use of high-dose-rate brachytherapy alone after lumpectomy in patients
with early-stage breast cancer treated with breast-conserving
therapy. Int J Radiat Oncol Biol Phys 2001;50:1003–1011.6. Arthur DW, Koo D, Zwicker RD, et al. Partial breast brachy-
therapy after lumpectomy: Low dose rate and high dose rate
experience. Int J Radiat Oncol Biol Phys 2003;56:681–689.7. Vicini FA, Arthur DW. Breast brachytherapy: North American
experience. Semin Radiat Oncol 2005;15:108–115.8. Vicini F, Winter K, Straube W, et al. A phase I/II trial to eval-
uate three-dimensional conformal radiation therapy confined to
the region of the lumpectomy cavity for stage I/II breast carci-noma: Initial report of feasibility and reproducibility of radiation
48 I. J. Radiation Oncology d Biology d Physics Volume 69, Number 1, 2007
therapy oncology group (RTOG) study 0319. Int J RadiatOncology Biol Phys 2005;63:1531–1537.
9. Kuske RR, Winter K, Arthur DW, et al. Phase II trial of brachy-therapy alone after lumpectomy for select breast cancer: Toxic-ity analysis of RTOG 95-17. Int J Radiat Oncol Biol Phys 2006;65:45–51.
10. Keisch M, Vicini F, Kuske RR, et al. Initial clinical experiencewith the MammoSite breast brachytherapy applicator in womenwith early-stage breast cancer treated with breast-conservingtherapy. Int J Radiat Oncol Biol Phys 2003;55:289–293.
11. Harper JL, Jenrette JM, Vanek KN, et al. Acute complicationsof MammoSite brachytherapy: A single institution’s initial clin-ical experience. Int J Radiat Oncol Biol Phys 2005;61:169–174.
12. Dickler A, Kirk MC, Chu J, et al. The MammoSite breast bra-chytherapy applicator: A review of techniques and outcomes.Brachytherapy 2005;4:130–136.
13. Formenti SC, Truong MT, Goldberg JD, et al. Prone acceleratedpartial breast irradiation after breast-conserving surgery: Pre-liminary clinical results and dose-volume histogram analysis.Int J Radiat Oncol Biol Phys 2004;60:493–504.
14. Taghian AG, Kozak KR, Doppke KP, et al. Initial dosimetricexperience using simple three-dimensional conformal exter-nal-beam accelerated partial-breast irradiation. Int J RadiatOncol Biol Phys 2006;64:1092–1099.
15. Baglan KL, Sharpe MB, Jaffray D, et al. Accelerated partialbreast irradiation using 3D conformal radiation therapy (3D-CRT). Int J Radiat Oncol Biol Phys 2003;55:302–311.
16. Taghian AG, Kozak KR, Katz A, et al. Accelerated partialbreast irradiation using proton beam: Initial dosimetric experi-ence. Int J Radiat Oncol Biol Phys 2006;65:1572–1578.
17. Veronesi U, Orecchia R, Luini A, et al. Full-dose intraoperativeradiotherapy with electrons during breast conserving surgery:Experience with 590 cases. Ann Surg 2005;242:101–106.
18. Vicini FA, Kestin LL, Goldstein N. Defining the clinical targetvolume for patients with early-stage breast cancer treated withlumpectomy and accelerated partial breast irradiation: A patho-logic analysis. Int J Radiat Oncol Biol Phys 2004;60:722–730.
19. Kader HA, Truong PT, Panades M, et al. Is breast seroma theappropriate guide for PTV determination in accelerated partialbreast irradiation planning? (Abstr.). Radiother Oncol 2004;72(Suppl. 1):S6.
20. Wong EK, Truong PT, Kader HA, et al. Consistency in seromacontouring for partial breast radiotherapy: Impact of guidelines.Int J Radiat Oncol Biol Phys 2006;66:372–376.
21. Struikmans H, Warlam-Rodenhuis C, Stam T, et al. Interob-server variability of clinical target volume delineation of glan-dular breast tissue and of boost volume in tangential breastirradiation. Radiother Oncol 2005;76:293–299.
22. Hurkmans CW, Borger HJ, Pieters RB, et al. Variability in tar-get volume delineation on CT scans of the breast. Int J RadiatOncol Biol Phys 2001;50:1366–1372.
23. Tai P, Van Dyk J, Battista JJ, et al. Improving the consistency incervical esophageal target volume definition by special training.Int J Radiat Oncol Biol Phys 2002;53:766–774.
24. Logue JP, Sharrock CL, Cowan RA, et al. Clinical variability oftarget volume description in conformal radiotherapy planning.Int J Radiat Oncol Biol Phys 1998;41:929–931.
25. van Sornsen de Koste JR, Senan S, Underberg RW, et al. Use ofCD-ROM-based tool for analyzing contouring variations ininvolved-field radiotherapy for Stage III NSCLC. Int J RadiatOncol Biol Phys 2005;63:334–339.
26. Steenbakkers RJ, Duppen JC, Fitton I, et al. Observer variationin target volume delineation of lung cancer related to radiationoncologist-computer interaction: A ‘Big Brother’ evaluation.Radiother Oncol 2005;77:182–190.
27. Berthelet E, Liu MCC, Agranovich A, et al. Computed tomog-raphy determination of prostate volume and maximum dimen-sions: A study of interobserver variability. Radiother Oncol2002;63:37–40.
28. Fischbach F, Knollmann F, Griesshaber V, et al. Detection ofpulmonary nodules by multislice computed tomography: Im-proved detection rate with reduced slice thickness. Eur Radiol2003;13:2378–2383.
29. Weed DW, Yan D, Martinez AA, et al. The validity of surgicalclips as a radiographic surrogate for the lumpectomy cavity inimage-guided accelerated partial breast irradiation. Int J RadiatOncol Biol Phys 2004;60:484–492.
30. Oh KS, Kong FM, Griffith KA, et al. Planning the breast tumorbed: Changes in the excision cavity volume and surgical scar lo-cation after breast-conserving surgery and whole-breast irradia-tion. Int J Radiat Oncol Biol Phys 2006;66:680–686.
31. Thompson M, Henry-Tillman R, Margulies A, et al. Hema-toma-directed ultrasound-guided (HUG) breast lumpectomy.Ann Surg Oncol 2007;14:148–156.
32. Della Sala SW, Pellegrini M, Bernardi D, et al. Mammographicand ultrasonographic comparison between intraoperative radio-therapy (IORT) and conventional external radiotherapy (RT) inlimited-stage breast cancer, conservatively treated. Eur J Radiol2006;59:222–230.
33. Li Y, Wang J, Holloway C, et al. Development of an MRI/x-ray/ultrasound compatible marker for pre-operative breasttumour localization. Phys Med Biol 2005;50:3349–3360.
34. Tardivon AA, Athanasiou A, Thibault F, et al. Breast imagingand reporting data system (BIRADS): Magnetic resonanceimaging. Eur J Radiol 2007;61:212–215.