Tanzania HIV Impact Survey (THIS) 2016-2017 - National ...
404
0
-
Upload
khangminh22 -
Category
Documents
-
view
2 -
download
0
Transcript of Tanzania HIV Impact Survey (THIS) 2016-2017 - National ...

0

1
Tanzania HIV Impact Survey (THIS) 2016-2017 THIS 2016-2017 COLLABORATING INSTITUTIONS Tanzania Commission for AIDS (TACAIDS) Zanzibar AIDS Commission (ZAC) Ministry of Health, Community Development, Gender, Elderly and Children, Mainland Tanzania (MoHCDGEC) Zanzibar Integrated HIV, Hepatitis, Tuberculosis and Leprosy Program (ZIHHTLP), Ministry of Health Zanzibar The United States President’s Emergency Plan for AIDS Relief (PEPFAR) The United States Centers for Disease Control and Prevention (CDC), Atlanta National Health Laboratory Quality Assurance and Training Center (NHL-QATC) National AIDS Control Programme (NACP) National Bureau of Statistics (NBS) Office of the Chief Government Statistician (OCGS) ICAP at Columbia University Westat DONOR SUPPORT AND DISCLAIMER This project is supported by the U.S. President’s Emergency Plan for AIDS Relief (PEPFAR) through CDC under the terms of cooperative agreement #U2GGH001226. The findings and conclusions are those of the authors and do not necessarily represent the official position of the funding agencies. SUGGESTED CITATION Tanzania Commission for AIDS (TACAIDS), Zanzibar AIDS Commission (ZAC). Tanzania HIV Impact Survey (THIS) 2016-2017: Final Report. Dar es Salaam, Tanzania. December 2018. ACCESS THIS REPORT ONLINE The PHIA Project: http://phia.icap.columbia.edu National Bureau of Statistics: www.nbs.go.tz CONTACT INFORMATION Statistician General, National Bureau of Statistics: [email protected]

2
Glossary of Terms 6 List of Abbreviations 8 List of Tables and Figures 10 Foreword 14 Acknowledgements 16 Summary of Key Findings 18 Chapter 1 Introduction 21 1.1 Background 21 1.2 Overview of THIS 21 1.3 National Policy on HIV/AIDS 22 1.4 National Policy on Viral Hepatitis 23 1.5 National Policy on STIs (Syphilis) 23 1.6 Sustainable Development Goals (SDGs) 23 1.7 Survey Objectives 24 1.8 References 24 Chapter 2 Survey Design, Methods, and Response Rates 26 2.1 Sample Frame and Design 26 2.2 Eligibility Criteria, Recruitment, and Consent Procedures 28 2.3 Survey Implementation 28 2.4 Fieldwork Organization 30 2.5 Field-Based Biomarker Testing 31 2.6 Laboratory-Based Biomarker Testing 33 2.7 Data Processing and Analysis 37 2.8 Response Rates 38 2.9 References 43 Chapter 3 Survey Household Characteristics 44 3.1 Key Findings 44 3.2 Background 44 3.3 Household Composition 44 3.4 Prevalence of HIV-Affected Households 49 3.5 Gaps and Unmet Needs 51 Chapter 4 Survey Respondent Characteristics 52 4.1 Key Findings 52 4.2 Background 52 4.3 Demographic Characteristics of the Adult Population 52 4.4 Demographic Characteristics of the Adolescent Population 54 4.5 Demographic Characteristics of the Pediatric Population 56
CONTENTS

3
Chapter 5 HIV Incidence: Adults 58 5.1 Key Findings 58 5.2 Background 58 5.3 HIV Incidence Among Adults 59 5.4 Gaps and Unmet Needs 60 5.5 References 60 Chapter 6 HIV Prevalence: Adults 61 6.1 Key Findings 61 6.2 Background 61 6.3 Adult HIV Prevalence by Demographic Characteristics 61 6.4 Adult HIV Prevalence by Region 68 6.5 Gaps and Unmet Needs 69 Chapter 7 HIV Testing: Adults 70 7.1 Key Findings 70 7.2 Background 70 7.3 Self-Reported HIV Testing Among Adults 70 7.4 Gaps and Unmet Needs 78 Chapter 8 HIV Diagnosis and Treatment: Adults 79 8.1 Key Findings 79 8.2 Background 79 8.3 Self-Reported Diagnosis and Treatment Status Among HIV-Positive Adults 79 8.4 Concordance of Self-Reported Treatment Status Versus Laboratory ARV Data 87 8.5 Gaps and Unmet Needs 89 8.6 References 89 Chapter 9 Viral Load Suppression: Adults 90 9.1 Key Findings 90 9.2 Background 90 9.3 Adult Viral Load Suppression by Demographic Characteristics 90 9.4 Adult Viral Load Suppression by Age and Sex 92 9.5 Adult Viral Load Suppression by Region 96 9.6 Gaps and Unmet Needs 97 Chapter 10 UNAIDS 90-90-90 Targets: Adults 98 10.1 Key Findings 98 10.2 Background 98 10.3 Status of the 90-90-90 Goals 99 10.4 Gaps and Unmet Needs 102 10.5 References 102 Chapter 11 Clinical Perspectives on People Living with HIV: Adults 103 11.1 Key Findings 103 11.2 Background 103 11.3 CD4 Counts and Immunosuppression 103 11.4 Late HIV Diagnosis 108 11.5 Retention on Antiretroviral Therapy 110

4
11.6 Antiretroviral Drug Resistance 114 11.7 Gaps and Unmet Needs 115 11.8 References 115 Chapter 12 Prevention of Mother-to-Child Transmission 116 12.1 Key Findings 116 12.2 Background 116 12.3 Antenatal Care Attendance 116 12.4 Breastfeeding 118 12.5 Awareness of Mother’s HIV Status 119 12.6 Antiretroviral Therapy Among HIV-Positive Pregnant Women 121 12.7 Mother-to-Child Transmission 123 12.8 Gaps and Unmet Needs 124 12.9 References 124 Chapter 13 Adolescents and Young Adults 125 13.1 Key Findings 125 13.2 Background 125 13.3 Sex Before Age 15 125 13.4 Knowledge About HIV Prevention 127 13.5 HIV Incidence and Prevalence 133 13.6 HIV Testing, Treatment, and Viral Load Suppression 133 13.7 Status of the 90-90-90 Goals 134 13.8 Gaps and Unmet Needs 135 13.9 References 135 Chapter 14 Children and Early Adolescents 136 14.1 Key Findings 136 14.2 Background 136 14.3 HIV Prevalence 136 14.4 Status of the 90-90-90 Goals 138 14.5 Gaps and Unmet Needs 139 Chapter 15 HIV Risk Factors 140 15.1 Key Findings 140 15.2 Background 140 15.3 HIV Prevalence by Sexual Behavior 140 15.4 Condom Use at Last Sex with a Nonmarital, Noncohabitating Partner 142 15.5 Male Circumcision 150 15.6 Gaps and Unmet Needs 152 Chapter 16 Discriminatory Attitudes Toward People Living with HIV 153 16.1 Key Findings 153 16.2 Background 153 16.3 Discriminatory Attitudes Toward People Living with HIV 153 16.4 Gaps and Unmet Needs 156 16.5 References 156

5
Chapter 17 Tuberculosis, Syphilis, Hepatitis B, Hepatitis C, Sexually Transmitted Infection Symptoms, and Cervical Cancer 157
17.1 Key Findings 157 17.2 Background 157 17.3 Tuberculosis 158 17.4 Syphilis 158 17.5 Hepatitis B 160 17.6 Self-Reported Symptoms and Diagnosis of Sexually Transmitted Infection 162 17.7 Cervical Cancer Screening Among HIV-Positive Women 166 17.8 Hepatitis C 168 17.9 Gaps and Unmet Needs 169 17.10 References 169 Conclusion 170 References 172 Appendix A Sample Design and Implementation 173 Appendix B HIV Testing Methodology 180 Appendix C Estimates of Sampling Errors 191 Appendix D Survey Personnel 206 Appendix E Household Questionnaire 215 Appendix F Adult Questionnaire 241 Appendix G Early Adolescent Questionnaire 314 Appendix H Survey Consent Forms 337

6
90-90-90: Ambitious global HIV program targets proposed by UNAIDS and adopted by each country. By 2020, 90% of all people living with HIV (PLHIV) will know their HIV status; 90% of all people with diagnosed HIV infection will receive sustained antiretroviral therapy (ART); and 90% of all people receiving ART will have viral load (VL) suppression (VLS). Acquired Immunodeficiency Syndrome (AIDS): AIDS is a disease caused by infection with HIV. AIDS is the result of severe damage to the immune system, making the body vulnerable to life-threatening infections and cancers. Antiretroviral Therapy (ART): Treatment with antiretroviral (ARV) drugs that inhibit the ability of HIV to multiply in the body, leading to improved health and survival among people living with HIV. CD4+ T-Cells: CD4+ T-cells (CD4) are white blood cells that are an essential part of the human immune system. These cells are often referred to as T-helper cells. HIV attacks and kills CD4 cells, leaving the body vulnerable to a wide range of infections. The CD4 count is used to determine the degree of weakness of the immune system from HIV infection and can be used to determine the need for and response to ART. De Facto Household Resident: A person who slept in the household the night prior to the survey. Enumeration Area (EA): A limited geographic area defined by the national statistical authority and the primary sampling unit for the Population-Based HIV Impact Assessment (PHIA) surveys. Human Immunodeficiency Virus (HIV): HIV is the virus that causes AIDS. The virus is transmitted from person to person through blood, semen, vaginal fluids, and breast milk. HIV attacks CD4 cells in the body, leaving people living with HIV vulnerable to illnesses that would have otherwise been eliminated by a healthy immune system. HIV Incidence: A measure of the frequency with which new cases of HIV occur in a population over a period of time. HIV Prevalence: The proportion of living persons in a population who are living with HIV at a specific point in time. HIV Viral Load: The concentration of HIV in the blood, usually expressed as copies per milliliter (mL). HIV Viral Load Suppression: An HIV viral load of less than 1,000 copies/mL, which is identified as the threshold for treatment success by WHO’s consolidated guidelines on the use of antiretroviral drugs for treating and preventing HIV infection.1
GLOSSARY OF TERMS

7
Household: A person or group of persons related or unrelated to each other who live in the same compound (fenced or unfenced), share the same cooking arrangements, and have one person whom they identify as head of that household. Informed Consent: Informed consent is a legal condition whereby a person can give consent based upon a clear understanding of the facts, implications, and future consequences of an action. In order to give informed consent, the individual concerned must have adequate reasoning faculties and be in possession of all relevant facts at the time he or she gives consent. Male Circumcision: Male circumcision is the removal of some or the entire foreskin (prepuce) from the penis. Medically supervised adult male circumcision is a scientifically proven method for reducing a man’s risk of acquiring HIV infection through heterosexual intercourse. Voluntary medical male circumcision is an important part of national HIV prevention programs in most HIV high burden countries. Prevention of Mother-to-Child-Transmission (PMTCT): Mother-to-child transmission (MTCT) is when an HIV-positive woman passes HIV to her baby during pregnancy, labor, delivery, or while breastfeeding. The United Nations recommends effective PMTCT to include a four-fold approach: (1) primary prevention of HIV infection among women of childbearing age; (2) preventing unintended pregnancies among women living with HIV; (3) preventing HIV transmission from women living with HIV to their infants; and (4) providing appropriate treatment, care, and support to mothers living with HIV, their children, and families. Primary Sampling Units: Primary sampling unit refers to sampling units that are selected in the first (primary) stage of a multistage sample ultimately aimed at selecting individual elements. Sexually Transmitted Infections (STI): STIs are infections transmitted through person-to-person sexual contact. They are sometimes called sexually transmitted diseases (STDs). Syphilis: Syphilis is a curable STI caused by a bacterium, Treponema pallidum. Syphilis can be transmitted to the fetus during pregnancy or to the infant during delivery. Tuberculosis: Tuberculosis (TB) is a contagious bacterial disease that spreads through the air and is the leading cause of death among people living with HIV in Africa. References 1. UNAIDS, World Health Organization. Guidelines on monitoring the impact of the HIV epidemic using
population-based surveys. Geneva: World Health Organization; 2015. http://www.who.int/hiv/pub/guidelines/si-guidelines-population-survey/en. Accessed November 27, 2018.

8
AIDS Acquired Immunodeficiency Syndrome ANC Antenatal Care Anti-HCV Hepatitis C Virus Antibody ART Antiretroviral Therapy ARV Antiretroviral CDC U.S. Centers for Disease Control and Prevention CD4 CD4+ T-cell CI Confidence Interval CLHIV Children Living with HIV DBS Dried Blood Spot DNA Deoxyribonucleic Acid DTS Dried Tube Specimens EA Enumeration Area EIA Enzyme Immunoassay EID Early Infant Diagnosis HBsAg Hepatitis B Surface Antigen HBTC Home-Based Testing and Counselling HBV Hepatitis B Virus HCV Hepatitis C Virus HIV Human Immunodeficiency Virus HPV Human Papillomavirus HSSP III Health Sector Strategic Plan III ID Identification IQR Interquartile range LAg Limiting Antigen MDRI Mean Duration of Recent Infection µL Microliter mL Milliliter MOH Ministry of Health MoHCDGEC Ministry of Health, Community Development, Gender, Elderly and Children MTCT Mother-to-Child Transmission NACP National AIDS Control Programme NBS National Bureau of Statistics NHL-QATC National Health Laboratory Quality Assurance and Training Center OCGS Office of the Chief Government Statistician PCR Polymerase Chain Reaction PEPFAR U.S. President’s Emergency Plan for AIDS Relief
LIST OF ABBREVIATIONS

9
PFR Proportion False Recent PHIA Population-Based HIV Impact Assessment PLHIV People Living with HIV PMTCT Prevention of Mother-to-Child Transmission POC Point of Care PPS Probability Proportional to Size QA Quality Assurance QC Quality Control RR Response Rate STI Sexually Transmitted Infection TACAIDS Tanzania Commission for AIDS THIS Tanzania HIV Impact Survey THMIS Tanzania HIV/AIDS and Malaria Indicator Survey TNA Total Nucleic Acid UNAIDS Joint United Nations Programme on HIV and AIDS VL Viral Load VLS Viral Load Suppression VMMC Voluntary Medical Male Circumcision WG Working Group WHO World Health Organization ZAC Zanzibar AIDS Commission
ZIHHTLP Zanzibar Integrated HIV, Hepatitis, Tuberculosis and Leprosy Program Ministry of Health Zanzibar

10
Chapter 2 Survey Design, Methods, and Response Rates Table 2.1.A Distribution of sampled enumeration areas and households, by region 27 Figure 2.5.A Household-based HIV-testing algorithm, THIS 2016-2017 32 Figure 2.6.A HIV-1 recent infection testing algorithm (LAg/VL algorithm), THIS 2016-2017 35
Figure 2.6.B HIV-1 recent infection testing algorithm (LAg/VL/ARV algorithm), THIS 2016-2017 36
Table 2.8.A Household Response Rates, United Republic of Tanzania 39 Table 2.8.B Household Response Rates, Zanzibar 39 Table 2.8.C Household Response Rates, Mainland 39 Table 2.8.D Interview and blood draw response rates, United Republic of Tanzania 40 Table 2.8.E Interview and blood draw response rates, Zanzibar 41 Table 2.8.F Interview and blood draw response rates, Mainland 42 Chapter 3 Survey Household Characteristics Table 3.3.A Household composition, United Republic of Tanzania 45 Table 3.3.B Household composition, Zanzibar 45 Table 3.3.C Household composition, Mainland 46 Table 3.3.D Distribution of the de facto household population 46 Figure 3.3.A Distribution of the de facto population by sex and age, THIS 2016-2017 47 Table 3.3.E Distribution of the de facto household population by age, sex, and residence 48 Figure 3.3.B Household population by age, sex, and residence, THIS 2016-2017 48 Table 3.4.A Prevalence of HIV-affected households 49 Table 3.4.B HIV-affected households by number of HIV-positive members 49 Table 3.4.C Prevalence of households with an HIV-positive head of household 49 Figure 3.4.A Prevalence of HIV-affected households by residence, THIS 2016-2017 50
Figure 3.4.B HIV-affected households by number of HIV-positive members and residence, THIS 2016-2017 50
Figure 3.4.C Prevalence of households with an HIV-positive head of household by sex, THIS 2016-2017 51
Chapter 4 Survey Respondent Characteristics Table 4.3.A Demographic characteristics of the adult population 53 Table 4.4.A Demographic characteristics of the adolescent population 55 Table 4.5.A Demographic characteristics of the pediatric population 56 Chapter 5 HIV Incidence: Adults Table 5.3.A Annual HIV incidence using LAg/VL testing algorithm 59 Table 5.3.B Annual HIV incidence using LAg/VL/ARV testing algorithm 60 Chapter 6 HIV Prevalence: Adults Table 6.3.A HIV prevalence by demographic characteristics: Ages 15-49 years 62 Table 6.3.B HIV prevalence by demographic characteristics: Ages 15 years and older 64
LIST OF TABLES AND FIGURES LIST OF TABLES AND FIGURES

11
Figure 6.3.A HIV prevalence by marital status: Ages 15 years and older, THIS 2016-2017 66 Table 6.3.C HIV prevalence by age and sex, United Republic of Tanzania 66 Figure 6.3.B HIV prevalence by age and sex, THIS 2016-2017 67 Table 6.3.D HIV prevalence by age and sex, Zanzibar 67 Table 6.3.E HIV prevalence by age and sex, Mainland 67
Figure 6.4.A HIV prevalence among adults aged 15 years and older, by region, THIS 2016-2017 (Map) 68
Figure 6.4.B HIV prevalence among adults aged 15 years and older, by region, THIS 2016-2017 (Bar graph) 69
Chapter 7 HIV Testing: Adults Table 7.3.A Self-reported HIV testing: Males 71 Table 7.3.B Self-reported HIV testing: Females 74 Table 7.3.C Self-reported HIV testing: Total 76
Figure 7.3.A Proportion of adults who self-reported having received an HIV test in the last 12 months, by age and sex, THIS 2016-2017 78
Chapter 8 HIV Diagnosis and Treatment: Adults Table 8.3.A HIV treatment status: Males 81 Table 8.3.B HIV treatment status: Females 83 Table 8.3.C HIV treatment status: Total 85
Figure 8.3.A Proportion of HIV-positive adults aged 15 years and older self-reporting awareness of HIV status and antiretroviral therapy status, by age and sex, THIS 2016-2017
87
Table 8.4.A Concordance of self-reported treatment status versus presence of antiretrovirals (ARVs): Males 88
Table 8.4.B Concordance of self-reported treatment status versus presence of antiretrovirals (ARVs): Females 88
Table 8.4.C Concordance of self-reported treatment status versus presence of antiretrovirals (ARVs): Total 89
Chapter 9 Viral Load Suppression: Adults Table 9.3.A Viral load suppression prevalence by demographic characteristics 91 Table 9.4.A Viral load suppression by age (5-year age groups) 93 Table 9.4.B Viral load suppression by age (10- to 15-year age groups) 94 Table 9.4.C Viral load suppression by age (10- to 15-year age groups), Zanzibar 94 Table 9.4.D Viral load suppression by age (10- to 15-year age groups), Mainland 95
Figure 9.4.A Proportion of viral load suppression (<1000 copies/mL) among people living with HIV, by age and sex, THIS 2016-2017 95
Figure 9.5.A Viral load suppression (<1000 copies/mL) among HIV-positive adults aged 15 years and older, by region, THIS 2016-2017 (map) 96
Figure 9.5.B Viral load suppression (<1000 copies/mL) among HIV-positive adults aged 15 years and older, by region, THIS 2016-2017 (bar graph) 97
Chapter 10 UNAIDS 90-90-90 Targets: Adults
Table 10.3.A Adult 90-90-90 (self-reported antiretroviral therapy (ART) status; conditional percentages) 100
Table 10.3.B Adult 90-90-90 (self-reported antiretroviral therapy (ART) status and/or laboratory antiretroviral (ARV) data; conditional percentages) 101

12
Figure 10.3.A Adult 90-90-90 (adjusted for laboratory antiretroviral data among adults aged 15 years and older), THIS 2016-2017 102
Chapter 11 Clinical Perspectives on People Living with HIV: Adults Table 11.3.A Median CD4 count and prevalence of immunosuppression 105
Figure 11.3.A CD4 count distribution among HIV-positive adults aged 15 years and older, by antiretroviral therapy status, THIS 2016-2017 108
Table 11.4.A Late HIV diagnosis 109
Table 11.5.A Retention on antiretroviral therapy (ART): people initiating antiretroviral therapy LESS THAN 12 months prior to the survey 111
Table 11.5.B Retention on antiretroviral therapy (ART): people initiating antiretroviral therapy MORE THAN 12 months prior to the survey 113
Table 11.6.A Resistance to antiretrovirals 115 Table 11.6.B HIV Subtype 115 Chapter 12 Prevention of Mother-to-Child Transmission Table 12.3.A Antenatal care 117 Table 12.4.A Breastfeeding status by child's age and mother's HIV status 119 Table 12.5.A Prevention of mother-to-child transmission, known HIV status 120
Table 12.6.A Prevention of mother-to-child transmission, HIV-positive pregnant women who received antiretrovirals 122
Table 12.7.A Prevention of mother-to-child transmission of HIV, early infant testing 124 Chapter 13 Adolescents and Young Adults Table 13.3.A Sex before the age of 15 years 126 Table 13.4.A Young people, knowledge about HIV prevention: Males 128 Table 13.4.B Young people, knowledge about HIV prevention: Females 130 Table 13.4.C Young people, knowledge about HIV prevention: Total 132
Figure 13.7.A Young adults 90-90-90 (laboratory ARV-adjusted data among young adults aged 15 -24 years), THIS 2016-2017 135
Chapter 14 Children and Early Adolescents Table 14.3.A HIV Prevalence by demographic characteristics 0-14 years 137
Table 14.4.A Pediatric 90-90-90 (parent-reported antiretroviral therapy (ART) data; conditional percentages) 138
Table 14.4.B Pediatric 90-90-90 (parent-reported laboratory antiretroviral (ARV) data; conditional percentages) 139
Chapter 15 HIV Risk Factors Table 15.3.A HIV prevalence by sexual behavior 142 Table 15.4.A Condom use at last sex with a nonmarital, noncohabitating partner: Males 143 Table 15.4.B Condom use at last sex with a nonmarital, noncohabitating partner: Females 146 Table 15.4.C Condom use at last sex with a nonmarital, noncohabitating partner: Total 148 Table 15.5.A Male circumcision 150 Chapter 16 Discriminatory Attitudes Toward People Living with HIV Table 16.3.A Discriminatory attitudes toward people living with HIV 154
Chapter 17 Tuberculosis, Syphilis, Hepatitis B and C, Sexually Transmitted Infection Symptoms, and Cervical Cancer
Table 17.3.A Tuberculosis clinic attendance and services among HIV-positive adults 158

13
Table 17.4.A Syphilis prevalence 159 Table 17.5.A Hepatitis B prevalence 161 Table 17.6.A Other sexually transmitted infections: Males 163 Table 17.6.B Other sexually transmitted infections: Females 165 Table 17.7.A Cervical cancer screening among women living with HIV 167 Table 17.8.A Prevalence of past or present hepatitis C 169

14
The Tanzania HIV Impact Survey 2016-2017 (THIS) is the fourth in a series of household-based human immunodeficiency virus (HIV) surveys. The first ever household-based HIV survey was the 2003-04 Tanzania HIV/AIDS Indicator Survey, the second was the Tanzania HIV/AIDS and Malaria Indicator Survey (THMIS) conducted in 2007-08, and this was followed by the 2011-12 Tanzania HIV/AIDS and Malaria Indicator Survey. All of these surveys were designed to provide information on numerous HIV and related indicators for the United Republic of Tanzania. In addition, the surveys provided similar data on HIV indicators disaggregated for Tanzania mainland, Zanzibar, and each of the 31 regions of the United Republic of Tanzania. THIS is the first national HIV survey that covered populations of all ages and other indicators that were not part of the three surveys conducted previously in the country. These additional indicators included: HIV incidence, CD4 T-cell count, viral load (VL) suppression (VLS), antiretroviral (ARV) drug resistance and presence of ARV drugs in the blood; HIV prevalence among children aged 0-9 years, early adolescent children aged 10-14 years, and elders aged 50 years and older; and the prevalence of syphilis, acute or chronic hepatitis B, and past or current hepatitis C. Additionally, THIS obtained indicators to measure progress toward the Joint United Nations Programme on HIV/AIDS (UNAIDS) 90-90-90 goals: § 90% of people living with HIV (PLHIV) on know their status § 90% of those who know their status are on antiretroviral therapy (ART), and § 90% of those on ART have suppressed viral loads). THIS was led by the Government of Tanzania through the Tanzania Commission for AIDS (TACAIDS) and Zanzibar AIDS Commission (ZAC), and the Ministry of Health, Community Development, Gender, Elderly and Children (MoHCDGEC), the Ministry of Health Zanzibar (MoH), National Bureau of Statistics (NBS) and the Office of Chief Government Statistician (OCGS). THIS was conducted with funding from the U.S. President’s Emergency Plan for AIDS Relief (PEPFAR) and technical assistance through the U.S. Centers for Disease Control and Prevention (CDC) and ICAP at Columbia University. The survey was implemented by NBS, OCGS, and ICAP in collaboration with local partners, including the the National Health Laboratory - Quality Assurance and Training Center (NHL-QATC), the National AIDS Control Programme (NACP), and the Zanzibar Integrated HIV, Tuberculosis and Leprosy Program (ZIHTLP). This report is meant to present detailed survey findings covering all primary and secondary survey objectives of THIS. The descriptive statistics and the accompanying analyses furnish the government, stakeholders, and general public, with official statistics for use in planning, policy making, monitoring, and evaluating programmes on HIV and hepatitis. I would like, therefore, to encourage policy makers, planners, program managers, and other stakeholders who work in the area of HIV/AIDS and other communicable and related diseases in the country, to use
FOREWORD
15
these findings to make informed policy decisions based on the current statistics presented in this report and through further analyses of the rich dataset that resulted from the survey.
Dr. Leonard L. Maboko Executive Director, Tanzania Commission for AIDS

16
The completion of the Tanzania HIV Impact Survey 2016-17 (THIS 2016-17) was made possible by the collaborative efforts of different institutions, organizations and individuals whose contribution is gratefully appreciated. The National Bureau of Statistics together with the Office of Chief Government Statistician (OCGS) Zanzibar would like to express sincere gratitude to the government of the United Republic of Tanzania through the Ministry of Health, Community Development, Gender, Elderly and Children and the Ministry of Health Zanzibar for the support in implementing the THIS 2016-17 in both the Mainland and Zanzibar. Similarly, we would like to thank the Tanzania Commission for AIDS (TACAIDS) and Zanzibar AIDS Commission (ZAC) for leading and coordinating the steering committee that was instrumental in directing the survey to success. Our gratitude is extended to ICAP at Columbia University who collaborated with NBS and OCGS to develop and implement the survey. The National Institute for Medical Research (NIMR) in the Mainland and Zanzibar Medical Research and Ethics Committee (ZAMREC) for issuing the ethical clearance to allow the survey to be conducted in Mainland and Zanzibar. The National Health Laboratory Quality Assurance and Training Center (NHLQATC) played a key role in testing survey blood samples and performing Quality Assurance and validation of testing methods and equipment and we are grateful for their work. We acknowledge the crucial role of the Centers for Disease Control and Prevention (CDC) for funding the THIS 2016-2017 through the U.S. President’s Emergency Plan for AIDS Relief (PEPFAR) and providing technical support. Also, Westat provided technical expertise in survey statistics, supporting all aspects of electronic data collection and data management and building capacity in both survey statistics and electronic data collection and data management, they deserve our greatest gratitude. A number of individuals contributed to the success of this survey; we are grateful to Dr. Leonard L. Maboko, Dr. Aroldia Mulokozi and Dr. Ali Salim Ali for the overall oversight of the survey. Also deserving recognition are Dr. Geoffrey Somi, James Juma, Jeremiah Mushi, Dr. Angela Ramadhani and Dr. Farhat Jowhar Khalid. We also thank Dr. Albina Chuwa, Emilian Karugendo and Mariam Kitembe from NBS and Ms. Fahima Issa, Mayasa Mahfoudh Mwinyi and Ahmad Mohammed from OCGS. Their commitment to the survey along with that of the NHLQATC staff, Dr. Fausta Mosha, Victor Muchunguzi and Laurent Kalindima, made this survey a success. We thank Dr. Veronica Mugisha, Dr. Elizabeth Gummerson, Dr. Cecilia Makafu, Dr. Julius Zelothe, Dr. Fernando Morales and Dr. Jessica Justman from ICAP at Columbia University for their technical assistance in planning and implementation of the survey. At CDC Tanzania, we thank Dr. Rennatus Mdodo, Kayla Lavilla, Dr. George Mgomella, Dr. Renicha McCree, Dr. Kevin Cain and Dr. David Lowrance from CDC Tanzania and Dr. Paul Stupp, Dr. Sasi Jonnalagadda, Dr. Drew Voetsch, Dr. Bharat Parekh and Dr. Keisha Jackson from CDC Atlanta for providing technical assistance during planning through implementation of the survey.
ACKNOWLEDGEMENTS

17
Our sincere gratitude to the team of community mobilizers who sensitized the community to participate in the survey, field coordinators, team supervisors, interviewers and their drivers who travelled all over the country despite the rural infrastructure challenges to collect the required data. More thanks to the local leaders for the cooperation they extended to us in their areas and last but not least, the survey participants who willingly opened their doors to the survey teams and responded to questions and provided their personal and sensitive information which we have treated them with an utmost confidentiality.
Albina Chuwa (PhD) Statistician General National Bureau of Statistics

18
The Tanzania HIV Impact Survey 2016-2017 (THIS) is a nationally representative, cross-sectional, population-based survey of households across the United Republic of Tanzania. It focused on measuring key biological endpoints to provide direct estimates of HIV risk and burden, and of the effectiveness and population-level impact of HIV-related prevention, care, and treatment interventions implemented in the country. The primary objectives of THIS were to estimate the national-level annual HIV incidence among adults aged 15 years and older, and the subnational prevalence of viral load (VL) suppression (VLS), defined as HIV ribonucleic acid (RNA) less than 1,000 copies/milliliter (mL), among HIV-positive adults. Secondary objectives of THIS were to measure national and regional adult HIV prevalence; national and regional distribution of CD4 counts; detection of ARVs in blood; national prevalence of transmitted HIV drug resistance; national pediatric HIV prevalence; progress toward the 90-90-90 targets defined by UNAIDS; and national prevalence of syphilis, hepatitis B (HBV) infection and hepatitis C virus (HCV) infection. THIS is the first national survey to conduct these measurements in Tanzania. The survey also collected information on behaviors associated with HIV acquisition and transmission, common HIV comorbidities, and other health conditions. The “90-90-90” refer to targets set by UNAIDS to achieve control of the HIV epidemic by 2020 and are defined as 90% of all people living with HIV (PLHIV) will know their HIV status; 90% of all people with diagnosed HIV infection will receive sustained ART; and 90% of all people receiving ART will have VLS. The design used in THIS was a two-stage, stratified cluster sample design, in which census enumeration areas (EA) [clusters] were selected in the first stage, and households in the second stage. The sample was stratified by the 31 regions in Tanzania (mainland and Zanzibar). Data collection was conducted between October 2016 and August 2017. The survey interviewed 14,811 households. In the households surveyed, 36,087 adults aged 15 years and older and 10,452 children aged 0-14 years (7,477 children aged 0-9 years and 2,975 early adolescents aged 10-14 years) were eligible to participate in the survey. Altogether, 33,004 (91.5%) of the eligible adults were interviewed, and of those interviewed, 31,579 (95.7%) had blood drawn for biomarkers assessment to determine HIV and syphilis status. Among those aged 0-14 years, 97.0% (10,141) of eligible children were interviewed and 94.8% of those (9,616) had blood drawn for biomarkers assessment to determine HIV status. Among those aged 10-14 years, biomarker assessment also included syphilis testing, which contributed to estimates of syphilis prevalence. A subset of 1,310 adults were tested for hepatitis B surface antigen (HBsAg), indicative of acute or chronic HBV infection and 4,874 adults were tested for HCV antibody (anti-HCV) indicative of previous infection with HCV or current acute or chronic hepatitis C. Home-based HIV testing and counseling (HBTC) with return of results was conducted for HIV and syphilis results, and point-of-care (POC) CD4 count was measured for those who tested HIV positive. All HIV VL results and results showing hepatitis B infection were returned to participants through health facilities of their choice. The estimates generated from THIS have been weighted to account for sample selection probabilities and adjusted for nonresponse and noncoverage. Analysis weights accounted for sample selection probabilities and were adjusted for nonresponse and noncoverage. The key findings of THIS were: § Tanzania has made considerable progress towards achievement of the UNAIDS 90-90-90 targets in
adults aged 15 years and older, particularly in linkage to and retention in HIV treatment, demonstrated by the 2nd and 3rd 90s: 93.6% of adults who are aware of their HIV-positive status are
SUMMARY OF KEY FINDINGS

19
on ART and 87.0% of adults who are on ART have suppressed viral loads. However, based on self-reported HIV status and ARV detection data, it is estimated that among adults aged 15 years and older living with HIV, only 60.6% were aware of their HIV-positive status. Awareness of HIV-positive status was lower among young people aged 15-24 years, at 50.2%.
§ Annual incidence of HIV infection among adults aged 15 years and older was 0.24% (95% confidence interval [CI]: 0.15% - 0.33%), which corresponds to 24 new HIV infections for every 10,000 persons in a year, and to approximately 72,000 new cases of HIV infection among adults aged 15 years and older in the country every year.
§ The overall prevalence of VLS among adults, aged 15 years and older, living with HIV was 51.9%: 57.2% among women and 41.5% among men.
§ HIV prevalence among adults aged 15 years and older was 4.9%: 6.3% among females and 3.4% among males. This corresponds to approximately 1.4 million PLHIV in Tanzania. Prevalence varied across the 31 regions, ranging from 0.0% in Kusini Unguja and Kaskazini Pemba, to 11.3% in Iringa, and 11.4% in Njombe. HIV prevalence among adults aged 15-49 years was 4.7%.
§ HIV prevalence among children aged 0-14 years was 0.4%. Based on parents’ report and ARV detection data, it is estimated that among children aged 0-14 years living with HIV, 50.1%* had been diagnosed with HIV. The overall VLS among children living with HIV (CLHIV) aged 0-14 years, (irrespective of awareness of HIV-positive status or ART status) was 18.4%*.
§ Among HIV-positive males aged 15 years and older, over half of those residing in urban (53.0%) and rural (55.8%) areas were not aware of their HIV-positive status based on self-report. Among HIV-positive females aged 15 years and older, 39.0% and 50.9% of those residing in urban and rural areas, respectively, were not aware of their HIV status based on self-report.
§ Concordance between self-report of ART and detection of ARVs was high among HIV-positive individuals aged 15 years and older, with 94.9% of those who reported current ART use having detectable ARVs in their blood. However, 9.7% of those who self-reported not being previously diagnosed with HIV had detectable ARVs in their blood, indicating underreporting of HIV status.
§ Immunosuppression (median CD4 count of less than 500 cells/microliter [μL]) was higher among those living with HIV who had not been diagnosed (68.7%) compared to those who are diagnosed and on ART (54.6%). Among individuals unaware of their HIV-positive status, 45.1% and 19.8% had median CD4 cell count <350 (advanced immunosuppression) and <200 cells/μL (severe immunosuppression), respectively.
§ Among females aged 15-49 years who gave birth within 12 months preceding the survey, 92.4% were aware of their HIV status, and among those who were aware of their HIV-positive status, 97.9% self-reported to have received ARVs, which indicates high coverage of ART provision for the prevention of mother-to-child transmission of HIV (PMTCT).
§ Approximately half (51.9%) of HIV-positive women are first initiated on ARVs during pregnancy. Given the high numbers of infections in young women, there could be more emphasis on diagnosis and treatment of women before they begin childbearing.
§ Among infants under the age of 18 months born to HIV-positive females aged 15-49 years, 10.5%* were confirmed to be living with HIV based on virological testing.
§ One in ten (9.9%) households in Tanzania had at least one HIV-positive household member. Prevalence of HIV is nearly two and a half times higher among female heads of household (12.0%) than among male heads of household (4.8%).
§ Half (50.0%) of males aged 15 years and older had sex with a nonmarital, noncohabitating partner in the 12 months preceding the survey. Among these males, 34.9% reported use of a condom during their last sexual encounter with the partner. Among females aged 15 years and older, 33.5% reported having sex with a nonmarital, noncohabitating partner in the 12 months preceding the survey. Among these females, 27.3% reported use of a condom during their last sexual encounter with the partner.

20
§ Among adults aged 15 years and older, 25.6% reported discriminatory attitudes towards PLHIV (responded “No” to either of the two questions used to assess discriminatory attitudes). Discriminatory attitudes were higher in rural settings (30.7%) than in urban ones (17.3%). More than a third (36.9%) of young persons (ages 15-24 years) identified common misconceptions about HIV.
§ Among males aged 15-49 years, 52.6% reported to have undergone medical circumcision, 26.4% to have undergone a non-medical circumcision, and 18.5% reported being uncircumcised. Circumcision coverage rates varied by region (40.6% in Songwe to - 96.9% in Kilimanjaro%) and marital status (82.0%% compared to 74.8% for never married and married or living together, respectively).
§ Less than a fifth (17.7%) of HIV-positive females aged 30-49 years reported ever having been screened for cervical cancer.
§ About a quarter (27.7%) of HIV-positive adults ever visited a tuberculosis (TB) clinic. About half (54.2%) of them were diagnosed with TB and almost all (98.7%) of those diagnosed with TB were treated.
§ Prevalence of active syphilis infection was 0.9% in adults aged 15 and older: 3.7% in HIV-positive and 0.8% in HIV-negative adults.
§ Prevalence of HBV infection, measured through Hepatitis B Surface Antigen (HBsAg) test, was 3.5% among adults aged 15 years and older. Hepatitis B infection prevalence was 5.2% in HIV-positive and 3.4% in HIV-negative adults aged 15 years and older.
§ Prevalence of past or present HCV infection, measured through anti-HCV was 1.0% in adults aged 15-64 years: 0.5% in HIV-positive and 1.0% in HIV-negative adults.
*Estimates are based on a small number (25-49) of unweighted cases and should be interpreted with caution. The results from THIS indicate that HIV continues to cause a significant burden of disease in Tanzania. Although there has been remarkable progress toward the achievement of the UNAIDS 90-90-90 targets in adults, progress in the pediatric population is not comparable. The major challenge in both populations remains diagnosis, and a critical priority is to identify and link to care those infected but unaware of their HIV status. An additional critical priority is to urgently address very low rates of VLS among CLHIV.

21
1.1 Background The Population-based HIV Impact Assessment (PHIA) is a multicountry project funded by the United States (U.S.) President’s Emergency Plan for AIDS Relief (PEPFAR) to conduct national human immunodeficiency virus (HIV)-focused surveys that describe the status of the HIV epidemic. The surveys measure important national and regional HIV-related parameters, including progress toward the achievement of the Joint United Nations Programme on HIV/AIDS (UNAIDS) 90-90-90 targets (UNAIDS, 2014), and will guide policy and funding priorities. In Tanzania, the survey was branded as the Tanzania HIV Impact Survey 2016-2017 (THIS) and was led by the Government of Tanzania through the Tanzania Commission for AIDS (TACAIDS) and Zanzibar AIDS Commission (ZAC), the Ministry of Health, Community Development, Gender, Elderly and Children (MoHCDGEC) and the Ministry of Health—Zanzibar (MOH), with technical assistance from the U.S. Centers for Disease Control and Prevention (CDC). The survey was implemented by the National Bureau of Statistics (NBS) in Tanzania mainland and the Office of Chief Government Statistician—Zanzibar (OCGS), and ICAP at Columbia University in collaboration with local partners, including the National Health Laboratory—Quality Assurance and Training Center (NHL-QATC), the National AIDS Control Programme (NACP), and the Zanzibar Integrated HIV, Hepatitis, Tuberculosis and Leprosy Program (ZIHHTLP). 1.2 Overview of THIS A household-based national survey, THIS was conducted between October 2016 and August 2017 to measure the status of Tanzania’s national HIV response. It offered home-based HIV testing and counseling (HBTC) with return of results and collected information about uptake of HIV care and treatment services. This survey is the first in Tanzania to measure national HIV incidence, viral load suppression (VLS) prevalence, pediatric HIV prevalence, CD4 count distribution, presence of antiretrovirals (ARVs) in blood, and transmitted HIV drug resistance. The survey also collected information on selected behaviors associated with HIV acquisition and transmission, common HIV comorbidities, including current hepatitis B virus (HBV) infection and past or present hepatitis C virus (HCV) infection, syphilis, and other health conditions. Although facility-based sentinel surveillance and the population-based studies conducted previously, such as the Tanzania HIV/AIDS Indicator Survey (2003-04) and the Tanzania HIV/AIDS and Malaria Indicator Survey (2007-08 and 2011-12), have provided useful knowledge regarding Tanzania’s HIV epidemic and HIV-control efforts, information critical to understand the current status of the epidemic and guide future interventions was limited. With its focus on directly measuring key biological endpoints, such as new HIV infections within the last year and viral load (VL) in a nationally representative sample of the population, THIS provides direct estimates of HIV-infection risk and burden. It also provides estimates of the effectiveness and population-level impact of the prevention, care, and treatment interventions implemented in the country and progress toward the achievement of the UNAIDS 90-90-90 targets.
1 INTRODUCTION

22
1.3 National Policy on HIV/AIDS The HIV/AIDS epidemic is a national public health threat affecting Tanzanian society economically, politically, socially, and culturally. The Government of Tanzania is committed to the national vision of freeing the country from the epidemic and having a generation live without fear of HIV and the acquired immunodeficiency syndrome (AIDS). This vision will be attained in line with the UNAIDS vision of three zeros: zero new HIV infections, zero discrimination, and zero AIDS-related deaths. The Government of Tanzania has made substantial progress in HIV/AIDS prevention, care, treatment, and impact mitigation. Progress has been made in resource mobilization, communication, advocacy, and community participation. The government continues to increase the level of funding for the national response to HIV/AIDS in its annual budget and through collaboration with national and international communities. The government has faced social, economic, and development challenges resulting from the HIV/AIDS epidemic and has made various efforts to address these challenges. This work requires a concerted, multidisciplinary effort from all HIV/AIDS stakeholders at all levels, including government and nongovernment, civil society organizations (CSOs), communities, and individuals. Under the Prime Minister’s Office, TACAIDS is mandated to provide strategic leadership and coordination of the HIV/AIDS national response through development of a strategic framework and national guidelines for HIV. The development of the National Guidelines on HIV Prevention Strategy (Prime Minister’s Office: TACAIDS, 2010) and the National Stigma and Discrimination Reduction Strategy (Prime Minister’s Office: TACAIDS, 2012a) are the government’s road maps to curbing the epidemic. The revised National HIV Policy 2011, the National Multisectoral Strategic Framework (2013-2017), and the fourth National Multisectoral Strategic Framework (2018-2023) are the guiding tools for the implementation of HIV activities (Prime Minister’s Office: TACAIDS, 2012b; Prime Minister’s Office: TACAIDS, 2012c; and Prime Minister’s Office: TACAIDS, 2018). These documents are developed in line with international guidelines on HIV and human rights to ensure the accountability of the government and other stakeholders (the private sector, development partners, CSOs, and the community) in their actions within the national HIV/AIDS response. The Health Sector Strategic Plan III (HSSP III) was a cross-cutting strategic plan for the health sector of Tanzania for the period July 2009-June 2015. It provided an overview of the priority strategic directions across sectors, guided by Vision 2025, the National Strategy Growth and Reduction of Poverty (MKUKUTA in Kiswahili), the Millennium Development Goals, and the National Health Policy. It served as the guiding document for development of council and hospital strategic plans and annual work plans. The formulation process of the HSSP III was led by the Health Sector Reform Secretariat under the Division of Policy and Planning, MoHCDGEC. The process involved key stakeholders from ministries, departments, and agencies as well as the participation of the private sector and development partners. The subsequent Health Sector Strategic Plan IV (HSSP IV) 2015-20201, was developed to build on the successes of the third strategic plan and address remaining challenges and bottlenecks. It emphasizes the quality of health services, aiming to ensure that all households have access to and utilize preventive, curative, and promotional health services of the highest quality, including for HIV. In tandem with this priority, the fourth HIV strategic plan aims at ensuring that the entire population of Tanzania has access to high quality HIV prevention, care, and treatment services. It introduced the monitoring of the HIV care and treatment cascade to measure the progress and impact of the HIV response in Tanzania.

23
1.4 National Policy on Viral Hepatitis Prevention of transmission Prior to THIS, there was no national data on the burden of viral hepatitis in Tanzania. However, sub-population studies in different parts of the country showed the prevalence of HBV to range between 4.4-11.2-%.2 Analysis of data on blood screening from 2007 to 2016 at the National Blood Transfusion Service revealed a prevalence of 6.2% of HBsAg among blood donors.3 Hepatitis B vaccination is part of the routine childhood immunization program in Tanzania. There is a national policy on injection safety in healthcare settings, an infection control policy for blood banks, and all donated blood and blood products nationwide are screened for HBV and HCV. A national policy and guidelines relating to the prevention of viral hepatitis are under development. The draft 2017-2021 national strategic plan and guidelines for the control of viral hepatitis, define the guiding principles and strategies for the control and treatment of viral hepatitis in Tanzania.4 The plan focuses on hepatitis B and hepatitis C, owing to the relative public health burden they represent compared to viral hepatitis A, D, and E. Data from THIS will help to guide the identification of the target population(s) and the prioritization of interventions. Screening, care, and treatment Healthcare professionals in Tanzania obtain the skills and competencies required to effectively care for people with viral hepatitis through on-the-job training. There are national clinical guidelines for the management of viral hepatitis, which include recommendations for cases with HIV co-infection.5 Hepatitis B and hepatitis C testing are free of charge for blood donors and for people with HIV and other chronic illnesses. This may actually lead to the under-diagnosis of clinical hepatitis B and hepatitis C in HIV-negative individuals who are not blood donors. Hepatitis B and hepatitis C testing are compulsory in blood donation, but there is no system to actively refer those who test positive for either of the two diseases to care and management. Publicly-funded treatment is not available for hepatitis B or hepatitis C. Tenofovir, used for the treatment of HBV, is included on the national essential medicines list and is subsidized by the government. Drugs for the treatment and cure of HCV are not included on the national essential medicines list or subsidized by the government. 1.5 National Policy on STIs (Syphilis) The Government of Tanzania recognizes that the identification and treatment of sexually transmitted infections (STIs) is an important aspect of public health. Through a comprehensive approach of providing specialized training to healthcare workers and increased opportunities for counselling and screening. The National STI guidelines (June 2017) recommend screening for syphilis in pregnant females at the first antenatal care (ANC) visit, or as early as possible and to repeat screening in the third trimester, resources permitting, to detect infection acquired during the pregnancy.6 The guidelines also recommends testing during labor for females who do not attend ANC. They also recommend screening for syphilis among clients with STI syndromes other than genital ulcer. Data from ANC surveillance among pregnant females revealed an overall syphilis prevalence of 2.5 % in 2003 and 2004.7 1.6 Sustainable Development Goals (SDGs) One of the targets of the SDGs related to health (SDG 3: Ensure healthy lives and promote wellbeing for all at all ages) is to, by 2030, end the epidemics of AIDS, TB, malaria, and neglected tropical diseases and combat hepatitis, water-borne diseases, and other communicable diseases.8 Two particular indicators in this report, the number of new HIV infections per 1,000 uninfected population (by sex, age, and key populations) and HBV incidence per 100,000 population, both speak directly to progress toward that goal.

24
1.7 Survey Objectives The goal of THIS was to estimate HIV incidence and prevalence in Tanzania, to assess the coverage and impact of HIV services at the population level, and to characterize HIV-related risk behaviors using a nationally representative sample of adults and children. Primary and secondary objectives included the following: Primary Objectives § To estimate national-level annual HIV incidence among adults aged 15-64 years. § To estimate regional-level prevalence of VLS (VLS; defined as HIV RNA less than 1,000 copies/mL of
plasma) among HIV-positive persons aged 15-64 years. Secondary Objectives § To estimate national-level prevalence of HIV among persons aged 0-14 years. § To estimate national and regional-level prevalence of HIV among persons aged 15 years and older. § To assess CD4 count distribution, presence of ARVs, and transmitted drug resistance among PLHIV. § To describe the socioeconomic and behavioral risk factors associated with HIV infection in a
household-based, nationally representative sample. § To estimate syphilis prevalence in a household-based, nationally representative sample of persons
aged 10 years and older. § To estimate current hepatitis B prevalence and prevalence of past or current hepatitis C in a
household-based, nationally representative sample of persons aged 15 years and older. § To estimate national and regional coverage of HIV testing.
The survey was statistically powered for estimating national-level annual HIV incidence among adults aged 15-64 years, national and regional-level prevalence of VLS in persons 15-64 years and national and regional-level HIV prevalence among persons aged 15 years and older. The sample was statistically powered to obtain reasonably precise estimates (95% CI of +/- 10% or lower) of the prevalence of VLS for high prevalence regions. While we also measured VLS in children under the age of 15 years, the sample size was not powered to assure the same level of precision at the regional level. Therefore, analysis of VLS at the regional level focuses on adults. 1.8 References 1. United Republic of Tanzania Ministry of Health, Community Development, Gender, Elderly and Children (MoHCDGEC). Health Sector Strategic Plan IV 2015-2020. Dar es Salaam, Tanzania: MoHCDGEC; 2015. http://www.tzdpg.or.tz/fileadmin/documents/dpg_internal/dpg_working_groups_clusters/cluster_2/health/Key_Sector_Documents/Induction_Pack/Final_HSSP_IV_Vs1.0_260815.pdf. Accessed November 27, 2018. 2. Kilonzo, SB, Gunda DW, Mpondo BCT, Bakshi FA, Jaka H. Hepatitis B virus infection in Tanzania: Current status and challenges. J Trop Med. 2018 Jan 30;2018:4239646. doi: 10.1155/2018/4239646. eCollection 2018. 3. Ministry of Health, Community Development, Gender, Elderly and Children. Tanzania’s Blood Services:
Fact Sheet 2017. National Blood Transfusion Service Blood Collection Report: January to December 2016. Dar es Salaam, Tanzania: MoHCDGEC; 2017. 4. Ministry of Health, Community Development, Gender, Elderly and Children. Viral Hepatitis B &C Comprehensive Management Guidelines. Draft0_2018. Dar es Salaam, Tanzania: MoHCDGEC; 2018.

25
5. Ministry of Health, Community Development, Gender, Elderly and Children. Standard Treatment
Guidelines and National Essential Medicines List. Dar es Salaam, Tanzania: MoHCDGEC; 2017. 6. National AIDS Control Programme (NACP). National guidelines for the management of sexually
transmitted and reproductive tract infection, Second Edition. Dar es Salaam, Tanzania: NACP; June 2017 7. United Nations Department of Economic and Social Affairs (DESA). The Sustainable Development Goals
Report 2018. New York, New York: UN; 2018. https://doi.org/10.18356/7d014b41-en.

26
The Tanzania HIV Impact Survey 2016-2017 (THIS) was a nationally representative, cross-sectional, population-based survey of households across Tanzania. Its target population corresponded to children aged 0-14 years and adults aged 15 years and older. The survey population excluded institutionalized children and adults. 2.1 Sample Frame and Design The THIS used a two-stage, stratified cluster sample design. The sampling frame was comprised of all enumeration areas (EAs in the country based on the 2012 Tanzania Population and Housing Census (2012 PHC), which included 106,642 EAs, containing an estimated 9,362,758 households.1 The first stage selected 526 EAs (clusters) using a Probability Proportional to Size (PPS) method. The 526 EAs were stratified by 31 geographical regions. During the second stage, a sample of households was randomly selected within each EA, using a PPS method, where the average number of households to be selected per EA was 30, but the actual number of households selected per EA ranged from 15 to 61 (Table 2.1.A). The sample size was calculated to provide a representative national estimate of HIV incidence among adults aged 15 years and older, with a relative standard error less than or equal to 37.0%, as well as representative regional estimates of VLS prevalence among HIV-positive adults aged 15 years and older, with 95% CI with ±10% bounds around the point estimates for high prevalence regions. Based on the selected households, one-third were randomly selected for inclusion of children aged 0-14 years, which was designed to provide a representative national estimate of pediatric HIV prevalence, with a relative standard error less than or equal to 16.2%. Although the survey also measured VLS in children under the age of 15 years, the sample size has not been powered to assure the same level of precision for pediatric VLS. The target sample size was 31,730 for adults aged 15 years and older, and 8,296 for children aged 0-14 years.
2 SURVEY DESIGN, METHODS, AND RESPONSE RATES
2 SURVEY DESIGN, METHODS, AND RESPONSE RATES

27
Table 2.1.A Distribution of sampled enumeration areas and households, by region Number of sampled enumeration areas and households in each region, THIS 2016-2017
Region
Enumeration Areas Households
Urban Rural Total Urban Rural Total Dodoma
2 9 11 75 264 339
Arusha
3 6 9 113 164 277 Kilimanjaro
3 7 10 120 188 308
Tanga
2 8 10 70 238 308 Morogoro
5 9 14 180 251 431
Pwani
12 25 37 369 770 1139 Dar es Salaam
32 0 31 985 0 985
Lindi
1 5 6 31 154 185 Mtwara
2 6 8 61 185 246
Ruvuma
8 24 32 278 707 985 Iringa
7 18 25 349 421 770
Mbeya
10 16 26 383 418 801 Songwe
7 19 26 245 556 801
Singida
1 6 7 37 179 216 Tabora
7 34 41 229 1033 1262
Rukwa
9 26 35 281 797 1078 Kigoma
2 9 11 79 260 339
Shinyanga
7 23 30 266 658 924 Kagera
2 14 16 91 402 493
Mwanza
8 11 19 251 334 585 Mara
2 10 12 51 319 370
Manyara
2 5 7 91 125 216 Njombe
5 13 18 210 344 554
Katavi
10 27 37 392 747 1139 Simiyu
1 8 9 38 239 277
Geita
3 9 12 130 240 370 Kaskazini Unguja
0 4 4 0 123 123
Kusini Unguja
1 3 4 38 85 123 Mjini Magharibi
5 5 10 162 146 308
Kaskazini Pemba
0 4 4 0 123 123 Kusini Pemba
1 3 4 31 92 123
Total
159 366 525 5636 10562 16198
28
2.2 Eligibility, Recruitment, and Consent Procedures Households were eligible for participation in this survey if they were within the predefined EA and were randomly selected for inclusion in the survey. A household was eligible if the person recognized within the household as the head was aged 18 years and older or considered an emancipated minor if aged 15-17 years. The eligible survey population included: ▪ Females and males aged 18 years and older who slept in the household the night before the
survey and were willing and able to provide verbal informed consent in Kiswahili or English. ▪ Persons aged 10-17 years who slept in the household the night before the survey, who were
willing and able to provide verbal assent in Kiswahili or English, and whose parents or guardians were willing and able to provide verbal permission for their participation in Kiswahili or English.
▪ Children aged 0-9 years who slept in the household the night before the survey, whose parents or guardians were willing and able to provide verbal informed consent in Kiswahili or English for their participation.
An electronic informed consent form was administered using a tablet computer. Respondents provided verbal informed consent, which was then noted in the tablet. A designated head of household provided consent for household members to participate in the survey, after which individual members had to provide consent/assent for an interview. After completing the interview, individuals aged 18 years and older provided verbal consent for participation in the biomarker component of the survey, including HBTC and syphilis testing, with return of HIV and syphilis test results and CD4 counts during the household visit. People in the household aged 10-17 years were asked for assent to the interview and biomarker components after permission was granted by their parents or guardians. Parents provided consent for biomarker testing for minors below the age of assent (ages 0-9 years). A CD4 count was conducted for all participants who tested HIV positive and 2.0% of the HIV-negative participants who were randomly selected by a computerized algorithm. Receipt of test results was a requirement for participation in the biomarker component. If an individual did not want to receive his or her HIV test result, this was considered a refusal and the survey was concluded. Participants were also asked for consent/assent to store their blood samples in a repository for future use to perform additional tests. All participants were assessed for cognitive ability prior to obtaining their consent. Cognitive ability to consent was assessed by providing information on survey participation and then asking participants to summarize their understanding of the purpose of the survey and what is requested from them if they chose to participate. In addition to verbal consent, participants who consented were provided with a hardcopy version of the same consent form. 2.3 Survey Implementation Ethical considerations The THIS protocol was reviewed and approved by the institutional review boards of CDC, Columbia University, Westat, the National Institute for Medical Research , and Zanzibar Medical Research and Ethics Committee before initiation of data collection. All survey staff including laboratory technologists, nurse interviewers, and supervisors were trained on good clinical and laboratory practices as well as ethical protection of survey respondents and signed a data confidentiality agreement.

29
Survey Staff Recruitment A total of 46 laboratory technologists and 187 nurse counsellors were recruited from public health facilities after they were identified through a competitive process overseen by the MOH through the Regional Medical Offices. Those who qualified were recruited to serve as interviewers, counsellors, and testers during the survey. The selection criteria for a nurse interviewer for THIS was the individual had to be a certified nurse and accredited by the MOH as an HIV counsellor. Additional survey management, supervision, and support staff were also recruited and trained accordingly prior to data collection. Training of Field Staff The field staff training took place in Dodoma over seven weeks (25th July to 14th September 2016). A total of 323 participants participated in the training that comprised 187 interviewers, 31 supervisors, 51 facilitators, and 46 laboratory technicians. Facilitators and supervisors were from the NBS, OCGS, ICAP at Columbia University, TACAIDS, NHLQATC, MOH Zanzibar, MoHCDGEC, ZIHHTLP, CDC both Tanzania and Atlanta, U.S., Westat and other staff from the private sector. Survey staff received training on the contents of the data collection instruments and tablet use. The training curriculum included: ▪ Scientific objectives of the survey ▪ Survey design and methodology ▪ Completion of survey forms ▪ Data collection ▪ Staff responsibilities ▪ Recruitment of participants ▪ Informed consent procedures, including human subject’s protection, privacy, and confidentiality ▪ Blood collection for children and adults, including venipuncture and finger/heel-stick ▪ HIV testing and counseling ▪ CD4 count measurement using the PIMA POC analyzer ▪ Syphilis testing and counseling ▪ Referral of participants to health and social services, as required ▪ Management and transportation of blood specimens ▪ Biosafety ▪ Communication skills ▪ Protocol deviations, adverse events, and reporting of events
Laboratory staff were trained in specimen management, including sample processing, labeling, and quality assurance (QA). Central laboratory staff were trained in VL measurement, early infant diagnosis (EID), HIV confirmatory testing, HIV drug resistance testing, hepatitis B and hepatitis C testing, and HIV recency testing using the Limiting Antigen (LAg) Avidity enzyme immunoassay (EIA). Household Listing The listing operation consisted of visiting each EA, drawing a sketch map of the structures in an EA, and filling in an electronic listing form generated using Open Data Kit (ODK) software installed in the tablet. The main objective of the household listing was to obtain a household sampling frame to be used in selection of households in a selected EA.

30
The household listing exercise started on the 2nd April 2016 and ended on 20th May 2016 in 526 selected EAs in all regions of Tanzania mainland and Zanzibar. A total number of 500 EAs were selected in Tanzania mainland with 499 EAs enumerated. One EA was dropped from the sample, as there were no household dwellings, and was not replaced. All the selected 26 EAs in Zanzibar were enumerated. Therefore, a total of 525 EAs were listed. 2.4 Fieldwork Organization Community Sensitization and Mobilization Community mobilization was conducted prior to data collection to maximize community support and participation in the survey. The mobilization began before fieldwork commenced with a high-level national launch meeting that included key national and regional leaders, mass media, and other stakeholders. Community mobilization teams visited each EA prior to initiation of data collection and partnered with community health workers to meet key gatekeepers in the communities (local government officials and religious and community leaders). The mobilization teams held community sensitization meetings, disseminated written informational materials, such as brochures and posters, and held discussions with community residents. Data Collection Data collection started in November 2016 and was completed in August 2017. Fieldwork was conducted by 28 field teams composed of a team leader, six nurse-counselors, and a driver. A total of 287 field staff, comprised of field teams, field coordinators, community mobilizers, and supervisors participated in data collection. Survey personnel were selected based on their qualifications and areas of expertise. In addition, 46 laboratory technicians processed samples and performed additional procedures for HIV-1 VL, infant virologic HIV testing, and quality control (QC) and assurance. The data collection exercise was carried out in 521 out of 525 listed EAs in all regions in Tanzania. Four selected EAs in Pwani region were not visited because of security issues in Rufiji district at the time of data collection. Supervision The field teams were supervised by five field coordinators and managed by 10 QC supervisors who guided and oversaw data collection activities, performed quality checks, and provided technical support. Data-collection teams were continuously overseen by field-based supervisors and periodically monitored by national and international teams with representation from collaborating institutions. Monitoring teams visited field and laboratory sites at least monthly, and provided direct supervision, as well as verification of results by household revisits. Daily monitoring forms for household and individual outcome tracking were also reviewed by monitors for completeness. Field-based supervisors also supported teams by organizing supplies and transport of blood samples, coordinating community-mobilization efforts, providing technological troubleshooting, and checking the quality of household procedures and data collected. The national and international monitoring teams observed and assessed the quality of survey procedures, including adherence to protocol and standard operating procedures, and identified and responded to challenges with data collection. Regular debriefing sessions were held between field-based supervisors and monitoring teams, and monitoring reports were circulated to collaborating institutions and the THIS Technical Working Group (WG) for response to any issues.

31
Electronic monitoring system An electronic dashboard system was established to monitor the progression of the survey. The dashboard summarized data uploaded to the THIS server on a daily basis. The dashboard tracked coverage and completion of EAs, sampled households, household response, eligible household members providing consent to the interview and biomarker components of the survey, blood draws, response rates (RR), and overall progress toward the achievement of the target sample. Questionnaire Questionnaire and biomarker data were collected on mobile tablet computers using an application programmed in ODK. Three questionnaires were used for THIS: The Household Questionnaire, the Adult Questionnaire, and the Early Adolescent Questionnaire. All the questionnaires were prepared in English, translated into Kiswahili, and translated back into English by a different person to assess accuracy of the translation. The Household Questionnaire was used to list all the usual members and visitors in selected households and it was administered to the designated heads of households. Basic demographic information was collected on the characteristics of each person listed. Questions regarding orphans and vulnerable children, household deaths, characteristics of the household, and economic support were also asked in the Household Questionnaire (Appendix D). After completion of the Household Questionnaire, eligible adults aged 15 years and older were invited to complete the Adult Questionnaire and adolescents aged 10-14 years from one-third of households were randomly selected to complete the Early Adolescent Questionnaire. The Adult Questionnaire included questions on respondent background, reproduction, sexual activity, and HIV testing, care, and treatment (Appendix E). The Early Adolescent Questionnaire included questions on socio-demographic characteristics, sexual behavior, and HIV testing (see Appendix F). Participants who self-reported that they were HIV positive were asked questions about their HIV care experience. Parents answered questions about their children’s (ages 0-14 years) health and participation in HBTC services (this pertains to all rostered children in all sampled household as well as the one-third sample included for HIV testing). Participants of any age who reported being victims of violence and minors who reported being victims of sexual exploitation were provided with referrals to social services. 2.5 Field-Based Biomarker Testing Blood Collection Blood was collected by trained nurse-counselors from consenting participants. Fourteen mL of venous blood was collected from persons aged 15 years and older, while six mL was collected from children aged 2-14 years. One mL of capillary blood was collected from children aged 0-2 years, via finger-stick for children aged 6-24 months and heel-stick for children aged 6 months and younger. Blood samples were labeled with a unique bar-coded participant identification number (ID) and stored in temperature-controlled coolers. Samples were transported to a satellite laboratory at the end of each day for processing into plasma and freezing within 24 hours of blood collection. HIV Home-Based Testing and Counseling (HBTC) HIV HBTC was conducted in each household using the national HIV rapid-test algorithm- SD Bioline (Abbott Molecular Inc., Chicago, Illinois, U.S., formerly Alere), followed by Uni-Gold ( Trinity Biotech Manufacturing, Ltd., County Wicklow, Ireland). Participants who tested indeterminate via the national

32
algorithm were referred to a local facility for follow up testing within two weeks of their home-based test. In order to have a final result for all survey samples, the samples of indeterminate participants were resolved for the PHIA data by laboratory testing using Geenius HIV 1/2 Supplemental Assay (Bio-Rad Laboratories, Hercules, CA, U.S.). (Figure 2.5.A). HIV-seropositive participants were referred to HIV care and treatment services at a health facility of their choice. For children under the age of 18 years, results were provided to a parent or guardian. Participants with indeterminate HIV results were advised to attend a health facility in two weeks for repeated testing per national guidelines. Infants younger than the age of 18 months were screened for HIV exposure using SD Bioline the first test in the national HIV rapid-testing algorithm. If the test was reactive, HIV Total Nucleic Acid (TNA) polymerase chain reaction (PCR) for EID was performed at the central laboratory (Appendix B, Figure B.3.B: Final HIV Status Classification Algorithm (<18 months), THIS 2016-2017). For participants who self-reported an HIV-positive status, but tested HIV negative at the time of the survey, additional laboratory-based testing was conducted using HIV TNA PCR for confirmation of the status. In conjunction with MoHCDGEC and MOH Zanzibar, survey staff revisited these participants to provide counseling and guidance on next steps to confirm these results, particularly for those on ART. QC, using a panel of positive and negative dried tube specimens (DTS), was performed on a weekly basis by each field staff performing HIV testing. In addition, QA proficiency testing was conducted twice in the course of the survey, using a panel of masked HIV-positive and negative DTS. Proficiency in the correct performance and interpretation of the HIV testing algorithm was assessed for each tester.
Figure 2.5.A Household-based HIV-testing algorithm, THIS 2016-2017*
* This algorithm applies to participants >=18 months of age. Appendix B, figure B.3.B shows algorithm for classification of HIV status for infants <18 months.

33
CD4 Count Measurement All participants who tested HIV positive during HBTC, and a random sample of 2.0% of those who tested HIV negative underwent CD4 measurement and received the result in the field. The measurement was performed using the Pima™ CD4 Analyzer (Abbott Molecular Inc., Chicago, Illinois, U.S., formerly Alere).
Syphilis Testing Syphilis testing at the household was offered to participants aged 10 years and older using the Chembio DPP Syphilis Screen & Confirm Assay (Chembio Diagnostic Systems, Inc, Medford, NY, U.S. ) for the simultaneous detection of antibodies against non-Treponemal and Treponema pallidum antigens. The test distinguishes between active syphilis infection (positive for both Treponemal and non-Treponemal antibodies) and previous infection (positive for Treponemal antibodies only). QC using a panel of syphilis-positive and negative DTS was performed on a weekly basis by each field staff performing the testing. Participants with active syphilis infection were referred to care and treatment services at a health facility of their choice. For children aged 18 years and younger, results were provided at the household to a parent or guardian. 2.6 Laboratory-Based Biomarker Testing Satellite and Central Laboratories Twenty-eight fixed satellite laboratories for the survey were established in existing health facility laboratories. In addition, two mobile laboratories moved with the teams in particularly remote areas. One central reference laboratory, the NHL-QATC, conducted specialized tests. At each satellite laboratory, trained technicians processed whole blood into plasma aliquots and dried blood spot (DBS) samples for storage at -20°C and conducted HIV confirmatory and QA testing. Confirmatory testing by Geenius HIV 1/2 Supplemental Assay (Bio-Rad Laboratories, Hercules, CA, U.S.) was conducted on all samples that tested HIV positive or indeterminate during HBTC. In order to confirm quality of rapid testing conducted in the field, QA testing was performed on a random sample of approximately 5% of samples that tested HIV negative during HBTC and the first 50 HIV test results for each field tester, using the national HIV rapid-testing algorithm. Central laboratory procedures included VL testing, EID, HIV recency testing, testing of samples with indeterminate results from HIV HBTC, testing for hepatitis B and hepatitis C, HIV drug resistance testing, and long-term storage of samples at -80°C. The survey conducted household revisits for investigation of discrepancies between the results of testing in the field and in the laboratory. The specimens collected during the revisit underwent comprehensive retesting in the laboratory. For each case, an analysis of the nature of the discrepancy and potential sources of error was performed to define the definitive HIV status for analytical purposes. Viral Load Testing HIV-1 VL (viral copies per mL) of HIV-positive participants was measured using the COBAS AmpliPrep/Taqman 48 and 96 (Roche Diagnostics, Indianapolis, IN, U.S.) . The COBAS AmpliPrep/Taqman HIV-1 is a nucleic acid amplification test for the quantification of HIV Type 1 (HIV-1) RNA in human plasma. Specimen preparation is automated using COBAS AmpliPrep with amplification and detection using Taqman. Viral load results were returned within 10-12 weeks to the health facility chosen by each HIV-positive participant. Additionally, participants were provided with a referral form during HBTC for subsequent retrieval of their results. In addition, survey staff also contacted participants informing them that their results were available at the chosen health facility and further advising them to seek care and treatment.

34
Infant HIV Virologic Testing For infants under the age of 18 months who had a reactive rapid test result for HIV during HBTC, virologic testing was conducted via HIV TNA PCR using the COBAS AmpliPrep/Taqman 48 and 96. Results were returned within eight weeks to a health facility selected by the child’s parent or guardian. Survey staff also contacted the parent or guardian via mobile text message to inform them that the child’s results were available at the health facility. HIV Recent Infection Testing Algorithm To distinguish recent from long-term HIV infections, the survey used two different laboratory-based testing algorithms. Each algorithm employed a combination of assays: 1) HIV-1 LAg Avidity EIA (Sedia Biosciences Corporation, Portland, Oregon, U.S.) and VL (Figure 2.6.A) and 2) HIV-1 LAg Avidity EIA, VL, and ARV detection (Figure 2.6.B), as described in Appendix B. Results from recency testing were used to estimate HIV incidence. Specimens with median normalized optical density (ODn) ≤1.5 were classified as potential recent infections, and their VL results were assessed. Specimens with VL < 1,000 copies/mL were classified as long-term infections, while those with VL ≥ 1,000 copies/mL were classified as recent infections (Figure 2.6.A). In the algorithm involving LAg Avidity assay, VL and ARV detection, specimens with VL ≥ 1,000 copies/mL and with detectable ARVs were classified as long-term infections. Specimens with VL ≥ 1,000 copies/mL and without detectable ARVs were classified as recent infections.

35
Figure 2.6.A HIV-1 recent infection testing algorithm (LAg/VL algorithm), THIS 2016-2017

36
Figure 2.6.B HIV-1 recent infection testing algorithm (LAg/VL/ARV algorithm), THIS 2016-2017
Detection of Antiretroviral Drug Resistance HIV resistance to ARVs was assessed for all those HIV-positive participants aged 18 months and older, classified as recent HIV infections, and a small subset of confirmed long-term infections. Mutations in the HIV protease and reverse transcriptase genes that confer ARV drug resistance, per the Stanford drug resistance database, were detected simultaneously using the CDC in-house multiplex allele-specific drug resistance assay. Detection of Antiretrovirals Qualitative screening for detectable concentrations of ARVs was conducted on DBS specimens from all HIV-positive adults and children, by means of high-performance liquid chromatography coupled with tandem mass spectrometry. The method used for ARV detection is a modified version of the methodology described by Koal and colleagues (2005).2 This qualitative assay is highly specific as it separates the parent compound from the fragments; and highly sensitive, with a limit of detection of 0.02 μg/mL for each drug, and a signal-to-noise ratio of at least 5:1 for all drugs.

37
As detection of all ARVs in use at the time of the survey is cost-prohibitive, three ARVs were selected as markers for the most commonly prescribed first- and second-line regimens: efavirenz, lopinavir, and nevirapine. These ARVs were also selected based on their relatively long half-lives, allowing for a longer period in which they are detectable following intake. Detection of ARVs is considered indicative of participant use of a given drug at the time of blood collection. Results below the limit of detection among individuals who self-reported on ART indicate that there was no recent exposure to the regimen and suggest sub-optimal adherence to a prescribed regimen, but cannot be interpreted as “not on ART.” In addition, given the limited number of ARVs selected for detection, their absence could not rule out the use of other ART regimes that do not include those tested for in the survey. ARV detection was performed at the laboratory in the Department of Clinical Pharmacology of the Department of Medicine at the University of Cape Town in South Africa. Hepatitis B and C Testing A sub-sample of 4,874 were tested for hepatitis C antibody (anti-HCV); anti-HCV positive results indicated past infection that either naturally resolved or were treated, or current acute or chronic hepatitis C. A sub-sample of 1,310 were tested for hepatitis B surface antigen (HBsAg); positive HBsAg results indicated current acute or chronic hepatitis B. Alere Determine (Abbott Molecular Inc., Chicago, Illinois, U.S., formerly Alere) on plasma was used to perform HBsAg and results were returned to participants found to have hepatitis B infection via the same methods as the return of VL results. Participants were contacted and advised that additional test results were available at their chosen facility and referred to the facility for follow up. Murex HCV Antigen/Antibody (Ab) Combination EIA (DiaSorin, Saluggia, Italy) was used to detect anti-HCV in plasma specimens at the central lab, the NHL-QTC in Dar es Salaam. The previously described QA/QC for laboratory-based testing was also applied for viral hepatitis testing. 2.7 Data Processing and Analysis All field data were collected on tablet computers, transmitted to a central server using a secure virtual private network, and stored in a secure PostgreSQL database. Data cleaning was conducted using SAS 9.4 (SAS Institute Inc. Cary, North Carolina, U.S.). Laboratory data were cleaned and merged with the final questionnaire database using unique specimen bar codes and study IDs. All results presented in the report are based on weighted estimates, unless otherwise noted. Analysis weights account for sample selection probabilities and are adjusted for nonresponse and noncoverage. Nonresponse adjusted weights were calculated for households, individual interviews, and individual blood draws in a hierarchical form. Adjustment for nonresponse for initial individual and blood-level weights was based on the development of weighting adjustment cells, defined by a combination of variables that are potential predictors of response and HIV status. The nonresponse adjustment cells were constructed using the chi-square automatic interaction detection, or CHAID, algorithm. The cells were defined based on data from the household interview for the adjustment of individual-level weights, and from both the household and individual interviews for the adjustment of blood sample-level weights. Post-stratification adjustments were implemented to compensate for noncoverage in the sampling process. This final adjustment calibrated the nonresponse-adjusted individual and blood weights to make the sum of each set of weights conform to national population totals by sex and five-year age groups.

38
Descriptive analyses of RR, characteristics of respondents, HIV prevalence, CD4 count distribution, HIV testing, self-reported HIV status, self-reported ART, VLS, PMTCT indicators, and sexual behavior were conducted using SAS 9.4. Incidence estimates were based on the number of HIV infections identified as recent with the HIV-1 LAg Avidity plus VL and ARV detection algorithm, and obtained using the formula recommended by the World Health Organization (WHO) Incidence WG and Consortium for Evaluation and Performance of Incidence Assays, and with assay performance characteristics of a mean duration of recent infection (MDRI)=130 days (95% CI: 118, 142), a time cutoff (T)=1.0 year, and proportion false recent (PFR)=0.00. 2.8 Response Rates Household RR were calculated using the American Association for Public Opinion Research Response Rate 4 method (AAPOR, 2015)3 as the number of complete and incomplete household interviews among all eligible households, and those estimated to be eligible among those with unknown eligibility (households not located, not attempted or unreachable). Vacant and destroyed households, nonresidential units, and household units with no eligible respondents were considered not eligible and excluded from the calculation. Individual interview RR were calculated as the number of individuals who were interviewed divided by the number of individuals eligible to participate in the survey. Blood draw RR for those aged 10 years and older were calculated as the number of individuals who provided blood divided by the number of individuals who were interviewed. Blood draw RR for those aged 0-9 years were calculated as the number of individuals who provided blood divided by the number of individuals eligible to participate in the survey. Of the 16,198 selected households, 15,504 and 14,811 were occupied and interviewed, respectively (Table 2.8.A). The overall household RR was 94.8%: 95.3% in urban areas and 94.5% in rural areas. Household RR were almost similar in Zanzibar (94.1%) and Tanzania mainland (94.8%) (Table 2.8.B, Table 2.8.C). A total of 16,235 males and 19,852 females aged 15 years and older were eligible to participate in THIS. Interview RR were 88.5% for males and 93.2% for females aged 15 years and older. For males and females aged 15 and older, more than nine out of 10 (94.4% and 95.2%, respectively) persons who were interviewed also had their blood drawn (Table 2.8.D). In THIS, children aged 0-14 years in one-third of the selected households were eligible for blood draw. For young persons aged 10-14 years, the interview RR were 91.6% and 92.5% for males and females, respectively. The blood draw RR was 97.1% for males and 97.7% for females. More than nine out of 10 (91.4% for males and 91.6% for females) eligible persons aged 0-9 years had their blood drawn. Blood draw RR among ages 0-9 years were similar between genders in rural areas (92.2%). In urban areas, however, females had a slightly higher RR (89.8%) than males (89.3%).

39
Table 2.8.A Household Response Rates, United Republic of Tanzania Number of households selected, occupied, and interviewed and household response rates (unweighted and weighted), by residence, THIS 2016-2017 Residence
Total Result Urban Rural
Household interviews
Households selected 5,636 10,562 16,198 Households occupied 5,435 10,069 15,504 Households interviewed 5,179 9,632 14,811
Household response rate1 (unweighted) 94.5 94.8 94.7 Household response rate1 (weighted) 95.3 94.5 94.8 1Household response rate was calculated using the American Association for Public Opinion Research (AAPOR) Response Rate 4 (RR4) method: http://www.aapor.org/AAPOR_Main/media/publications/Standard-Definitions20169theditionfinal.pdf
Table 2.8.B Household Response Rates, Zanzibar Number of households selected, occupied, and interviewed and household response rates (unweighted and weighted), in Zanzibar, THIS 2016-2017 Region
Zanzibar Result Unguja Pemba Household interviews
Households selected 554 245 799 Households occupied 531 237 768 Households interviewed 506 220 726
Household response rate1 (unweighted) 95 93 94 Household response rate1 (weighted) 95 93 94 1Household response rate was calculated using the American Association for Public Opinion Research (AAPOR) Response Rate 4 (RR4) method: https://www.aapor.org/AAPOR_Main/media/publications/Standard-Definitions2015_8theditionwithchanges_April2015_logo.pdf
Table 2.8.C Household Response Rates, Mainland Number of households selected, occupied, and interviewed and household response rates (unweighted and weighted), by residence, in Tanzania mainland, THIS 2016-2017 Residence
Total Result Urban Rural
Household interviews
Households selected 5,405 9,994 15,399 Households occupied 5,213 9,523 14,736 Households interviewed 4,970 9,115 14,085
Household response rate1 (unweighted) 95 95 95 Household response rate1 (weighted) 95 94 95 1Household response rate was calculated using the American Association for Public Opinion Research (AAPOR) Response Rate 4 (RR4) method: https://www.aapor.org/AAPOR_Main/media/publications/Standard-Definitions2015_8theditionwithchanges_April2015_logo.pdf

40
Table 2.8.D Interview and blood draw response rates, United Republic of Tanzania Number of eligible individuals and response rates for individual interviews1 and blood draws2 (unweighted and weighted), by residence and sex, THIS 2016-2017 Residence Urban Rural Total Result Males Females Males Females Males Females Eligible individuals, ages 0-9 years
Number of eligible individuals 968 902 2,843 2,764 3,811 3,666 Blood draw response rate (unweighted) 90.5 90.4 92.7 92.9 92.1 92.3 Blood draw response rate (weighted) 89.3 89.8 92.2 92.2 91.4 91.6
Eligible individuals, ages 10-14 years
Number of eligible individuals 387 414 1,095 1,079 1,482 1,493 Interview response rate (unweighted) 93.8 96.1 92.4 93.2 92.8 94.0 Interview response rate (weighted) 92.4 95.2 91.3 91.3 91.6 92.5 Blood draw response rate (unweighted) 97.2 97.2 98.0 98.4 97.8 98.1 Blood draw response rate (weighted) 96.1 97.9 97.5 97.7 97.1 97.7
Eligible individuals, ages 15-24 years
Number of eligible individuals 1,683 2,295 3,596 4,095 5,279 6,390 Interview response rate (unweighted) 89.8 94.7 88.8 94.2 89.1 94.4 Interview response rate (weighted) 88.9 94.6 88.2 93.8 88.5 94.2 Blood draw response rate (unweighted) 94.0 96.0 97.0 97.4 96.0 96.9 Blood draw response rate (weighted) 93.1 95.5 96.0 96.8 95.0 96.3
Eligible individuals, ages 15-49 years
Number of eligible individuals 4,413 5,739 8,646 10,318 13,059 16,057 Interview response rate (unweighted) 84.5 95.4 90.2 94.6 88.3 94.9 Interview response rate (weighted) 84.3 95.2 89.9 94.1 87.8 94.6 Blood draw response rate (unweighted) 92.1 94.5 96.6 96.9 95.1 96.0 Blood draw response rate (weighted) 91.5 94.0 95.7 96.2 94.2 95.3
Eligible individuals, ages 50+ years
Number of eligible individuals 814 1,000 2,362 2,795 3,176 3,795 Interview response rate (unweighted) 88.2 92.2 92.4 86.4 91.3 88.0 Interview response rate (weighted) 87.2 90.5 92.8 86.3 91.2 87.5 Blood draw response rate (unweighted) 93.5 93.3 96.6 96.9 95.8 95.9 Blood draw response rate (weighted) 92.5 92.6 96.1 95.8 95.1 94.8
Eligible individuals, ages 15+ years
Number of eligible individuals 5,227 6,739 11,008 13,113 16,235 19,852 Interview response rate (unweighted) 85.1 94.9 90.7 92.9 88.9 93.6 Interview response rate (weighted) 84.8 94.5 90.6 92.4 88.5 93.2 Blood draw response rate (unweighted) 92.4 94.4 96.6 96.9 95.3 96.0 Blood draw response rate (weighted) 91.7 93.8 95.8 96.1 94.4 95.2
1Interview response rate = number of individuals interviewed/number of eligible individuals 2Blood draw response rate = number of individuals who provided blood/number of individuals interviewed Weighted figures calculated using trmpnr1w0, indiv_bwt0.

41
Table 2.8.E Interview and blood draw response rates, Zanzibar Number of eligible individuals and response rates for individual interviews1 and blood draws2 (unweighted and weighted), by residence and sex, Zanzibar, THIS 2016-2017 Region Unguja Pemba Zanzibar Result Males Females Males Females Males Females Eligible individuals, ages 0-9 years
Number of eligible individuals 123 140 80 79 203 219 Blood draw response rate (unweighted) 90.2 92.1 80.0 75.9 86.2 86.3 Blood draw response rate (weighted) 89.7 91.4 79.1 75.4 86.0 86.5
Eligible individuals, ages 10-14 years
Number of eligible individuals 49 54 36 34 85 88 Interview response rate (unweighted) 98.0 98.1 88.9 88.2 94.1 94.3 Interview response rate (weighted) 97.5 98.7 88.2 87.7 94.0 95.1 Blood draw response rate (unweighted) 97.9 96.2 93.8 100.0 96.3 97.6 Blood draw response rate (weighted) 97.2 96.4 94.2 100.0 96.1 97.6
Eligible individuals, ages 15-24 years
Number of eligible individuals 206 250 75 103 281 353 Interview response rate (unweighted) 85.9 93.2 89.3 92.2 86.8 92.9 Interview response rate (weighted) 86.1 93.2 89.6 91.7 86.9 92.8 Blood draw response rate (unweighted) 98.3 97.0 89.6 94.7 95.9 96.3 Blood draw response rate (weighted) 98.2 96.2 89.5 94.7 96.1 95.8
Eligible individuals, ages 15-49 years
Number of eligible individuals 520 648 173 252 693 900 Interview response rate (unweighted) 83.3 94.1 86.1 94.8 84.0 94.3 Interview response rate (weighted) 82.7 93.8 86.1 94.5 83.4 94.0 Blood draw response rate (unweighted) 95.6 95.9 90.6 92.9 94.3 95.1 Blood draw response rate (weighted) 95.1 95.5 90.4 92.8 94.1 94.9
Eligible individuals, ages 50+ years
Number of eligible individuals 90 119 55 76 145 195 Interview response rate (unweighted) 86.7 92.4 92.7 94.7 89.0 93.3 Interview response rate (weighted) 85.6 91.1 92.8 94.9 88.1 92.5 Blood draw response rate (unweighted) 94.9 98.2 94.1 91.7 94.6 95.6 Blood draw response rate (weighted) 92.8 98.5 93.4 91.6 93.0 95.8
Eligible individuals, ages 15+ years
Number of eligible individuals 610 767 228 328 838 1,095 Interview response rate (unweighted) 83.8 93.9 87.7 94.8 84.8 94.2 Interview response rate (weighted) 83.1 93.4 87.7 94.6 84.2 93.8 Blood draw response rate (unweighted) 95.5 96.3 91.5 92.6 94.4 95.2 Blood draw response rate (weighted) 94.8 95.9 91.1 92.5 93.9 95.0 1Interview response rate = number of individuals interviewed/number of eligible individuals 2Blood draw response rate = number of individuals who provided blood/number of individuals interviewed

42
Table 2.8.F Interview and blood draw response rates, Mainland Number of eligible individuals and response rates for individual interviews1 and blood draws2 (unweighted and weighted), by residence and sex, in Tanzania mainland, THIS 2016-2017 Residence Urban Rural Total Result Males Females Males Females Males Females Eligible individuals, ages 0-9 years
Number of eligible individuals 912 847 2,696 2,600 3,608 3,447 Blood draw response rate (unweighted) 90.5 90.1 93.1 93.5 92.5 92.7 Blood draw response rate (weighted) 89.3 89.6 92.4 92.5 91.5 91.7
Eligible individuals, ages 10-14 years
Number of eligible individuals 361 396 1,036 1,009 1,397 1,405 Interview response rate (unweighted) 93.4 96.0 92.5 93.3 92.7 94.0 Interview response rate (weighted) 92.1 95.0 91.3 91.3 91.5 92.4 Blood draw response rate (unweighted) 97.3 97.4 98.1 98.4 97.9 98.1 Blood draw response rate (weighted) 96.1 98.0 97.5 97.6 97.2 97.8
Eligible individuals, ages 15-24 years
Number of eligible individuals 1,594 2,197 3,404 3,840 4,998 6,037 Interview response rate (unweighted) 90.0 94.8 89.0 94.3 89.3 94.5 Interview response rate (weighted) 88.9 94.7 88.3 93.9 88.5 94.2 Blood draw response rate (unweighted) 93.8 96.1 97.1 97.4 96.1 96.9 Blood draw response rate (weighted) 92.9 95.6 96.0 96.8 94.9 96.3
Eligible individuals, ages 15-49 years
Number of eligible individuals 4,186 5,483 8,180 9,674 12,366 15,157 Interview response rate (unweighted) 84.5 95.3 90.6 94.7 88.5 94.9 Interview response rate (weighted) 84.3 95.2 90.1 94.2 87.9 94.6 Blood draw response rate (unweighted) 92.0 94.5 96.7 97.0 95.2 96.1 Blood draw response rate (weighted) 91.4 94.0 95.7 96.2 94.2 95.3
Eligible individuals, ages 50+ years
Number of eligible individuals 783 966 2,248 2,634 3,031 3,600 Interview response rate (unweighted) 88.6 92.2 92.4 86.0 91.5 87.7 Interview response rate (weighted) 87.5 90.5 92.8 86.1 91.2 87.4 Blood draw response rate (unweighted) 93.5 93.2 96.6 97.0 95.9 95.9 Blood draw response rate (weighted) 92.6 92.5 96.1 95.8 95.1 94.8
Eligible individuals, ages 15+ years
Number of eligible individuals 4,969 6,449 10,428 12,308 15,397 18,757 Interview response rate (unweighted) 85.1 94.9 91.0 92.8 89.1 93.5 Interview response rate (weighted) 84.8 94.5 90.7 92.4 88.6 93.2 Blood draw response rate (unweighted) 92.2 94.3 96.7 97.0 95.3 96.0 Blood draw response rate (weighted) 91.6 93.8 95.8 96.1 94.4 95.2
1Interview response rate = number of individuals interviewed/number of eligible individuals 2Blood draw response rate = number of individuals who provided blood/number of individuals interviewed Weighted figures calculated using trmpnr1w0, indiv_bwt0.

43
2.9 References 1. Tanzania National Bureau of Statistics (NBS). Tanzania 2012 Population and Housing Census Results. Dar es Salaam, Tanzania: NBS; 2012. 2. Koal T, Burhenne H, Römling R, Svoboda M, Resch K, Kaever V. Quantification of ARV drugs in dried blood spot samples by means of liquid chromatography/tandem mass spectrometry. Rapid Commun Mass
Spectrom, 2005, 19(21) 2995-3001. 3. The American Association for Public Opinion Research. Standard Definitions: Final Dispositions of Case
Codes and Outcome Rates for Surveys. 8th edition. Ann Arbor, MI: AAPOR, 2015. https://www.aapor.org/AAPOR_Main/media/publications/Standard-Definitions2015_8 theditionwithchanges_April2015_logo.pdf. Accessed on September 17, 2018.

44
3.1 Key Findings
3.2 Background This chapter describes the characteristics of households surveyed in THIS. Household composition is described in terms of sex of the head of household, age and sex of other members of the household, and the size of the household. The chapter also describes the prevalence and composition of THIS households impacted by HIV, which are households with one or more HIV-positive members. 3.3 Household Composition Overall, the majority of the households (71.4%) were male-headed. This distribution was similar between urban and rural areas: 69.3% of urban households were male-headed, while 72.8% of rural households were male-headed. Zanzibar had a lower percent of female-headed households (19.1%) compared to Tanzania mainland (28.8%). The median household size in Tanzania was four members (interquartile range [IQR] 3-6) and the median number of children under the age of 18 years in households was two (IQR 1-4).
§ Among households, 71.4% were male-headed. § About 46% of the total population were children ages 0-14 years. § The median household size was four members. § Among households with PLHIV, 17.2% had more than one PLHIV.
3 SURVEY HOUSEHOLD CHARACTERISTICS
§ Among households, 71.4% were male-headed. § About 46% of the total population were children aged 0-14 years. § The median household size was four members. § Among households with PLHIV, 17.2% had more than one PLHIV.

45
Table 3.3.A Household composition, United Republic of Tanzania
Percent distribution of households by sex of head of household; median size of household and median (Q11, Q32) number of children aged 18 years and younger, by residence, THIS 2016-2017
Characteristic Residence
Urban Rural Total Percent Number Percent Number Percent Number
Head of household
Male 69.3 3,586 72.8 7,175 71.4 10,761
Female 30.7 1,593 27.2 2,457 28.6 4,050
Total 100.0 5,179 100.0 9,632 100.0 14,811
Characteristic
Residence
Urban Rural Total Media
n Q1, Q3 Median Q1, Q3 Media
n Q1, Q3
Size of households 4 (2, 5) 5 (3, 7) 4 (3, 6) Number of children aged 18 years and younger 2 (0, 3) 2 (1, 4) 2 (1, 4) 1 Q1: quartile one 2 Q3: quartile three
Table 3.3.B Household composition, Zanzibar Percent distribution of households by sex of head of household; median size of household and median (Q11, Q32) number of children aged 18 years and younger, in Zanzibar, THIS 2016-2017
Region Unguja Pemba Zanzibar Characteristic Percent Number Percent Number Percent Number Household headship Male 82.9 414 75.5 166 80.9 580 Female 17.1 92 24.5 54 19.1 146 Total 100.0 506 100.0 220 100.0 726 Region Unguja Pemba Zanzibar Characteristic Median Q1, Q3 Median Q1, Q3 Median Q1, Q3 Size of households 5 (3, 7) 6 (4, 8) 5 (3, 7) Number of children aged 18 years and younger 2 (1, 4) 3 (2, 5) 3 (1, 4) 1 Q1: quartile one 2 Q3: quartile three Weighted figures calculated using hhwt0.

46
Table 3.3.C Household composition, Mainland Percent distribution of households by sex of head of household; median size of household and median (Q11, Q32) number of children aged 18 years and younger, by residence, in Tanzania mainland, THIS 2016-2017
Characteristic Residence
Urban Rural Total Percent Number Percent Number Percent Number
Household headship
Male 68.9 3,410 72.7 6,771 71.2 10,181 Female 31.1 1,560 27.3 2,344 28.8 3,904
Total 100.0 4,970 100.0 9,115 100.0 14,085
Characteristic Residence
Urban Rural Total Median Q1, Q3 Median Q1, Q3 Median Q1, Q3
Size of households 4 (2, 5) 5 (3, 7) 4 (3, 6) Number of children aged 18 years and younger 2 (0, 3) 2 (1, 4) 2 (1, 4)
1 Q1: quartile one 2 Q3: quartile three
Weighted figures calculated using hhwt0
The age and sex distribution of the de facto household population is illustrated by a population pyramid (Figure 3.3.A). Children under the age of 15 years comprised 45.6% (22.9% males and 22.6% females) of the de facto household population, while those aged 15-49 years constituted 43.5% (19.4% males and 24.1% females), and those aged 50 years and older constituted 10.9% (5.0% males and 5.9% females). More than half (54.6%) of the population were under the age of 20 years (Table 3.3.D).
Table 3.3.D Distribution of de facto household population Percent distribution of the de facto household population, by five-year age groups and sex, THIS 2016-2017
Age Males Females Total
Percent Number Percent Number Percent Number 0-4 8.6 5924.0 8.3 5,840 16.9 11,764 5-9 7.6 5298.0 7.4 5,267 15.0 10,565 10-14 6.7 4522.0 6.9 4,723 13.6 9,245 15-19 4.3 2958.0 4.7 3,285 9.1 6,243 20-24 3.3 2322.0 4.7 3,107 8.0 5,429 25-29 3.1 2032.0 4.1 2,797 7.2 4,829 30-34 2.6 1774.0 3.4 2,264 6.0 4,038 35-39 2.4 1582.0 3.0 1,897 5.4 3,479 40-44 2.1 1372.0 2.4 1,552 4.5 2,924 45-49 1.6 1022.0 1.8 1,157 3.4 2,179

47
Table 3.3.D Distribution of de facto household population (continued) Percent distribution of the de facto household population, by five-year age groups and sex, THIS 2016-2017
Age Males Females Total
Percent Number Percent Number Percent Number 50-54 1.3 826.0 1.5 955 2.8 1,781 55-59 1.0 653.0 1.0 659 2.0 1,312 60-64 0.8 519.0 1.0 631 1.8 1,150 65-69 0.6 378.0 0.7 455 1.3 833 70-74 0.5 291.0 0.7 406 1.1 697 75-79 0.4 217.0 0.4 282 0.8 499 ≥80 0.5 292.0 0.6 408 1.1 700
Total 47.2 31982.0 52.8 35,685 100.0 67,667 Figure 3.3.A Distribution of the de facto population by sex and age, THIS 2016-2017
Overall, the population in rural areas was younger than that in urban areas: 48.9% of the rural population was under the age of 15 years compared with 38.7% of the urban population. In urban areas, around half (51.6%) of the population was 15-49 years of age (48.7% of males and 54.0% of females), and 9.7% were over 50 years of age. In rural areas, 39.6% of the population was comprised of individuals aged 15-49 years, and 11.5% were over the age of 50 years (Table 3.3.E).

48
Table 3.3.E Distribution of de facto household population by age, sex, and residence Percent distribution of the household population, by sex, age, and residence, THIS 2016-2017
Age Urban
Males Females Total Percent Number Percent Number Percent Number
0-4 16.5 1,556 13.8 1,546 15.0 3,102 5-14 25.2 2,430 22.4 2,594 23.7 5,024 15-49 48.7 4,415 54.0 5,739 51.6 10,154 ≥50 9.6 814 9.7 1,000 9.7 1,814
Total 100.0 9,215 100.0 10,879 100.0 20,094
Age Rural
Males Females Total Percent Number Percent Number Percent Number
0-4 18.9 4,368 16.7 4,294 17.8 8,662 5-14 32.7 7,390 29.7 7,396 31.1 14,786 15-49 37.4 8,647 41.5 10,320 39.6 18,967 ≥50 11.0 2,362 12.0 2,796 11.5 5,158
Total 100.0 22,767 100.0 24,806 100.0 47,573
Figure 3.3.B Household population by age, sex, and residence, THIS 2016-201

49
3.4 Prevalence of HIV-Affected Households In Tanzania, 9.9% of households had at least one HIV-positive member (11.8% of urban households and 8.7% of rural households) (Table 3.4.A, Figure 3.4.A). Among HIV-affected households, 82.8% had one HIV-positive member and 16.3% had two HIV-positive members. This distribution was almost similar for urban and rural households (Table 3.4.B, Figure 3.4.B). Overall, 7.1% of households in Tanzania had an HIV-positive head of the household. Of the male-headed households, 4.8% were headed by an HIV-positive male. Among female-headed households, 12.0% were headed by an HIV-positive female (Table 3.4.C, Figure 3.4.C).
Table 3.4.A Prevalence of HIV-affected households Percentage of households with at least one HIV-positive household member, by residence, THIS 2016-2017 Residence Percent Number Urban 11.8 4,905 Rural 8.7 9,304
Total 9.9 14,209
Table 3.4.B HIV-affected households by number of HIV-positive members Among households with at least one HIV-positive household member, percent distribution of households by number of HIV-positive household members, by residence, THIS 2016-2017
Number of HIV-positive household members
Residence
Urban Rural Total Percent Number Percent Number Percent Number
1 84.0 533 81.8 756 82.8 1,289 2 15.5 108 17.0 161 16.3 269 3 * 3 * 12 * 15 4 * 0 * 1 * 1 5 * 0 * 0 * 0 ≥6 * 0 * 0 * 0 Total 100.0 644 100.0 930 100.0 1,574 An asterisk indicates that an estimate is based on a very small number (less than 25) of unweighted cases and has been suppressed.
Table 3.4.C Prevalence of households with an HIV-positive head of household
Percentage of households with an HIV-positive head of household, by sex of head of household, THIS 2016-2017
Sex of head of household Percent Number Male 4.8 8,253 Female 12.0 3,557
Total 7.1 11,810

50
Figure 3.4.A Prevalence of HIV-affected households by residence, THIS 2016-2017
Figure 3.4.B HIV-affected households by number of HIV-positive members and residence, THIS 2016-2017

51
Figure 3.4.C Prevalence of households with an HIV-positive head of household by sex, THIS 2016-2017
3.5 Gaps and Unmet Needs
§ More than half (54.6%) of the Tanzania population are young people aged 0-19 years. § One in ten (9.9%) of the households had at least one HIV-positive member. § Among households, 7.1% had an HIV-positive head of household.

52
4.1 Key Findings
4.2 Background
The THIS assessed key indicators and outcomes for children (0-9 years), early adolescents (10-14 years), and adults (15 years and older). To provide context for these outcomes, this chapter summarizes the basic demographic and socioeconomic characteristics of survey respondents. In this report, most key indicators are stratified according to these characteristics. 4.3 Demographic Characteristics of the Adult Population Overall, almost two-thirds (63.2%) of respondents aged 15 years and older lived in rural areas. Among the surveyed population, 2.7% reside in Zanzibar and 97.3% reside in Tanzania mainland. The majority of adult respondents (56.6%) were married or living with a partner, while over a third (36.5%) of the males and nearly a quarter (23.4%) of the females had never been married. More than half (58.6%) of the respondents aged 15 years and older had attended primary education, while nearly one in five (19.1%) had some secondary education. Only 5.2% of the respondents aged 15 years and older had more than secondary education.
4 SURVEY RESPONDENT CHARACTERISTICS
§ Ninety seven percent (97.3%) of the adult survey population, ages 15 years and older, reside in Tanzania mainland and 2.7% reside in Zanzibar.
§ Of the population of children aged 0-14 years, 97% resides in Tanzania mainland and 3% reside in Zanzibar.
§ Among the population aged 0-14 years, 71.6% are under the age of 10 years. § Sixty three percent (63.2%) of adults, ages 15 years and older, and 71.9% of children, ages 0-14
years, reside in rural areas. § Among the respondents, ages 15 years and older, only 5.2% had more than secondary education. § Eleven percent (11.3%) of adolescents, ages 10-14 years, were not currently attending school. § More than half (58.6%) of the respondents, ages 15 years and older, had attended primary
education, while nearly one in five (19.1%) had some secondary education.

53
Table 4.3.A Demographic characteristics of the adult population Percent distribution of the population aged 15 years and older, by sex and selected demographic characteristics, THIS 2016-2017
Characteristic Males Females Total
Percent Number Percent Number Percent Number Residence
Urban 35.2 4,446 38.3 6,395 36.8 10,841 Rural 64.8 9,986 61.7 12,177 63.2 22,163
Tanzania Mainland/Zanzibar Mainland 97.5 13,721 97.2 17,541 97.3 31,262
Urban 34.3 4,231 37.4 6,118 35.9 10,349 Rural 63.2 9,490 59.8 11,423 61.4 20,913
Zanzibar 2.5 711 2.8 1,031 2.7 1,742 Unguja 1.9 511 2.1 720 2.0 1,231 Pemba 0.6 200 0.7 311 0.7 511
Region Dodoma 4.4 247 4.3 303 4.3 550 Arusha 4.0 195 4.4 283 4.2 478 Kilimanjaro 3.8 268 4.1 373 3.9 641 Tanga 3.8 293 3.9 381 3.8 674 Morogoro 5.2 339 6.2 515 5.7 854 Pwani 2.6 823 2.9 1,155 2.8 1,978 Dar es Salaam 9.5 826 9.8 1,129 9.6 1,955 Lindi 2.2 161 1.9 188 2.1 349 Mtwara 2.8 222 2.2 223 2.5 445 Ruvuma 3.3 895 3.1 1,100 3.2 1,995 Iringa 2.6 584 2.8 826 2.7 1,410 Mbeya 4.3 601 4.6 827 4.4 1,428 Singida 2.9 153 3.1 212 3.0 365 Tabora 5.2 1,494 4.4 1,647 4.8 3,141 Rukwa 2.5 922 2.5 1,216 2.5 2,138 Kigoma 3.1 332 3.2 452 3.2 784 Shinyanga 3.7 1,030 3.3 1,225 3.5 2,255 Kagera 5.6 421 4.6 455 5.1 876 Mwanza 5.8 605 5.3 723 5.5 1,328 Mara 5.0 360 5.6 524 5.3 884 Manyara 3.7 201 3.4 238 3.6 439 Njombe 1.7 364 2.1 568 1.9 932 Katavi 1.4 1,056 1.3 1,320 1.4 2,376 Simiyu 2.8 311 2.9 427 2.8 738 Geita 3.8 392 3.3 442 3.6 834 Songwe 2.0 626 2.0 789 2.0 1,415 Kaskazini Unguja 0.2 109 0.3 181 0.3 290 Kusini Unguja 0.3 109 0.3 131 0.3 240 Mjini Magharibi 1.4 293 1.5 408 1.5 701 Kaskazini Pemba 0.3 88 0.3 144 0.3 232 Kusini Pemba 0.3 112 0.4 167 0.4 279

54
Table 4.3.A Demographic characteristics of the adult population (continued) Percent distribution of the population aged 15 years and older, by sex and selected demographic characteristics, THIS 2016-2017
Characteristic Males Females Total Percent Number Percent Number Percent Number
Marital status Never married 36.5 4,613 23.4 3,749 29.8 8,362 Married or living together 56.6 8,694 56.6 10,989 56.6 19,683 Divorced or separated 5.7 855 10.9 2,058 8.4 2,913 Widowed 1.2 240 9.1 1,743 5.3 1,983
Education No education 10.5 1,767 19.5 4,132 15.1 5,899 Pre-Primary 0.6 84 0.5 89 0.6 173 Primary 60.2 8,878 57.1 10,488 58.6 19,366 Post Primary Training 1.6 221 1.1 192 1.4 413 Secondary (O-Level) 20.6 2,667 17.6 3,033 19.1 5,700 Post-Secondary (O-Level) Training 3.0 348 2.6 383 2.8 731 Secondary (A-Level) 1.0 134 0.5 76 0.7 210 Post-Secondary (A-Level) Training 0.7 95 (0.2) 40 0.4 135 University 1.7 230 0.8 127 1.3 357
Wealth quintile Lowest 19.5 3,198 18.9 3,893 19.2 7,091 Second 21.2 3,210 19.9 3,864 20.6 7,074 Middle 20.9 3,195 20.8 4,158 20.8 7,353 Fourth 18.9 2,518 19.5 3,398 19.2 5,916 Highest 19.5 2,307 20.9 3,254 20.2 5,561
Age 15-19 19.7 2,624 18.7 3,073 19.2 5,697 20-24 16.3 2,082 15.8 2,959 16.0 5,041 25-29 13.5 1,779 13.6 2,660 13.6 4,439 30-34 11.4 1,541 11.5 2,158 11.4 3,699 35-39 9.5 1,373 9.5 1,828 9.5 3,201 40-44 7.7 1,217 7.6 1,466 7.7 2,683 45-49 6.0 915 5.9 1,090 5.9 2,005 50-54 4.5 763 4.6 910 4.6 1,673 55-59 3.5 597 3.7 608 3.6 1,205 60-64 2.6 482 3.0 576 2.8 1,058 65-69 1.8 359 2.0 406 1.9 765 70-74 1.3 266 1.7 337 1.5 603 75-79 1.0 199 1.1 231 1.1 430 ≥80 1.2 235 1.3 270 1.2 505 Total 15-24 36.0 4,706 34.5 6,032 35.3 10,738 Total 15-49 84.2 11,531 82.6 15,234 83.4 26,765 Total 15+ 100.0 14,432 100.0 18,572 100.0 33,004
Note: Education categories refer to the highest level of education attended, whether or not that level was completed. The sum of the sample sizes for a given classification may be less than the total sample size because of missing responses to the classification variable.
4.4 Demographic Characteristics of the Early Adolescent Population The distribution of adolescents between rural and urban areas mirrors that of the adult population with 71.1% of the population aged 10-14 years residing in rural areas. In this population bracket, 11.3% were not currently in school, while the majority (80.5%) were in primary education.

55
Table 4.4.A Demographic characteristics of the adolescent population Percent distribution of the population aged 10-14 years, by sex and selected demographic characteristics, THIS 2016-2017 Males Females Total Characteristic Percent Number Percent Number Percent Number Residence
Urban 27.6 363 30.2 398 28.9 761 Rural 72.4 1,012 69.8 1,006 71.1 2,018
Tanzania Mainland/Zanzibar Mainland 97.0 1,295 96.9 1,321 96.9 2,616
Urban 26.5 337 29.3 380 27.9 717 Rural 70.5 958 67.5 941 69.0 1,899
Zanzibar 3.0 80 3.1 83 3.1 163 Unguja (1.8) 48 2.1 53 2.0 101 Pemba (1.2) 32 (1.0) 30 1.1 62
Region Dodoma * 23 * 18 (5.2) 41 Arusha * 11 * 10 * 21 Kilimanjaro (3.9) 27 * 22 (3.6) 49 Tanga (4.2) 31 (4.2) 31 4.2 62 Morogoro * 22 8.1 50 5.9 72 Pwani 2.3 65 2.8 78 2.6 143 Dar es Salaam 6.5 51 (6.1) 49 6.3 100 Lindi * 15 * 11 (1.9) 26 Mtwara * 12 * 14 (1.7) 26 Ruvuma 3.1 78 3.4 87 3.2 165 Iringa 2.1 51 2.4 54 2.3 105 Mbeya 3.7 50 4.0 52 3.9 102 Singida * 10 * 12 * 22 Tabora 5.3 135 5.9 152 5.6 287 Rukwa 2.7 89 3.1 105 2.9 194 Kigoma (4.0) 43 (4.0) 44 4.0 87 Shinyanga 3.7 104 3.5 95 3.6 199 Kagera (5.3) 41 (5.2) 36 5.3 77 Mwanza 6.5 65 5.0 50 5.8 115 Mara 8.6 58 (5.5) 39 7.1 97 Manyara * 15 * 20 (3.1) 35 Njombe (1.9) 38 (2.0) 37 1.9 75 Katavi 1.6 122 1.4 103 1.5 225 Simiyu (3.5) 37 (3.1) 32 3.3 69 Geita 5.1 52 (4.1) 43 4.6 95 Songwe 1.7 50 2.6 77 2.2 127 Kaskazini Unguja * 11 * 6 * 17 Kusini Unguja * 8 * 14 * 22 Mjini Magharibi (1.4) 29 (1.6) 33 1.5 62 Kaskazini Pemba * 17 * 17 (0.6) 34 Kusini Pemba * 15 * 13 (0.5) 28
Education Currently attending pre-primary school * 23 * 15 (2.0) 38 Currently attending primary school 80.0 1,090 80.9 1,123 80.5 2,213 Currently attending post-primary training * 3 * 3 * 6 Currently attending secondary school 5.5 70 6.6 91 6.1 161 Not currently attending school 12.1 188 10.5 172 11.3 360
Total 10-14 100.0 1,375 100.0 1,404 100.0 2,779 Estimates in parentheses are based on a small number (25 to 49) of unweighted cases and should be interpreted with caution. An asterisk indicates that an estimate is based on a very small number (less than 25) of unweighted cases and has been suppressed. The sum of the sample sizes for a given may be less than the total sample size because of missing responses to the classification variable. Note: Education categories refer to the highest level of education attended, whether or not that level was completed.

56
4.5 Demographic Characteristics of the Pediatric and Early Adolescent Population Survey participants aged 10 years and under accounted for 71.6 % of all participants between 0-14 years of age. The majority of the respondents 0-14 years of age group resided in rural areas (71.9%), and the distribution across the five wealth quintiles ranged from 13.7% in the highest wealth quintile to 24.5% in the lowest wealth quintile (Table 4.5.A).
Table 4.5.A Demographic characteristics of the pediatric population Percent distribution of the population aged 0-14 years, by sex and selected demographic characteristics, THIS 2016-2017
Characteristic Males Females Total Percent Number Percent Number Percent Number
Age 0-17 months 11.7 600 11.2 572 11.4 1,172 18-59 months 26.7 1,381 27.1 1,340 26.9 2,721 5-9 years 33.4 1,772 33.1 1,697 33.3 3,469 10-14 years 28.2 1,375 28.7 1,404 28.4 2,779
Residence Urban 28.3 1,315 27.9 1,287 28.1 2,602 Rural 71.7 3,813 72.1 3,726 71.9 7,539
Tanzania Mainland/Zanzibar Mainland 97.2 4,848 96.8 4,714 97.0 9,562
Urban 27.4 1,234 26.9 1,214 27.1 2,448 Rural 69.8 3,614 69.9 3,500 69.9 7,114
Zanzibar 2.8 280 3.2 299 3.0 579 Unguja 1.8 168 2.2 192 2.0 360 Pemba 1.0 112 1.0 107 1.0 219
Region Dodoma 5.3 95 4.8 79 5.1 174 Arusha 3.8 63 3.8 58 3.8 121 Kilimanjaro 2.9 70 2.8 66 2.9 136 Tanga 3.3 85 3.4 88 3.4 173 Morogoro 4.5 96 5.4 116 4.9 212 Pwani 2.2 225 2.4 242 2.3 467 Dar es Salaam 5.8 173 5.9 174 5.8 347 Lindi 2.1 52 (1.3) 31 1.7 83 Mtwara (1.8) 46 (1.8) 47 1.8 93 Ruvuma 3.0 269 3.3 295 3.1 564 Iringa 2.2 176 2.3 177 2.2 353 Mbeya 3.8 183 3.9 179 3.9 362 Singida 3.6 57 (3.1) 48 3.3 105 Tabora 6.3 602 6.3 577 6.3 1,179 Rukwa 3.1 399 3.2 400 3.2 799 Kigoma 4.2 158 3.8 139 4.0 297 Shinyanga 3.9 397 4.0 392 4.0 789 Kagera 4.6 124 4.9 122 4.7 246 Mwanza 6.0 216 5.7 199 5.8 415 Mara 8.0 203 6.7 161 7.4 364 Manyara 3.4 63 3.7 68 3.5 131 Njombe 1.8 130 1.8 124 1.8 254 Katavi 1.7 438 1.5 389 1.6 827 Simiyu 3.9 153 4.0 154 4.0 307 Geita 4.4 158 4.5 165 4.5 323 Songwe 2.0 217 2.2 224 2.1 441 Kaskazini Unguja (0.3) 46 (0.2) 38 0.3 84 Kusini Unguja (0.2) 28 (0.3) 34 0.2 62 Mjini Magharibi 1.3 94 1.7 120 1.5 214 Kaskazini Pemba 0.6 60 0.5 52 0.5 112 Kusini Pemba 0.5 52 0.5 55 0.5 107
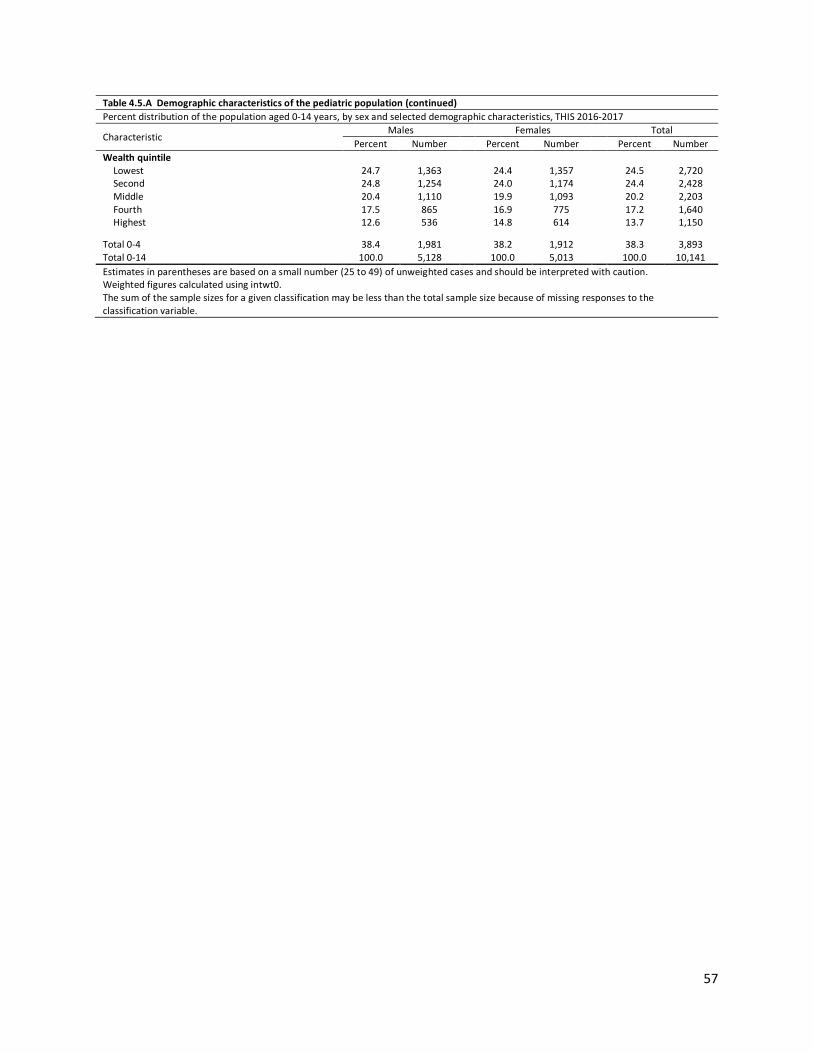
57
Table 4.5.A Demographic characteristics of the pediatric population (continued) Percent distribution of the population aged 0-14 years, by sex and selected demographic characteristics, THIS 2016-2017
Characteristic Males Females Total
Percent Number Percent Number Percent Number Wealth quintile
Lowest 24.7 1,363 24.4 1,357 24.5 2,720 Second 24.8 1,254 24.0 1,174 24.4 2,428 Middle 20.4 1,110 19.9 1,093 20.2 2,203 Fourth 17.5 865 16.9 775 17.2 1,640 Highest 12.6 536 14.8 614 13.7 1,150
Total 0-4 38.4 1,981 38.2 1,912 38.3 3,893 Total 0-14 100.0 5,128 100.0 5,013 100.0 10,141 Estimates in parentheses are based on a small number (25 to 49) of unweighted cases and should be interpreted with caution. Weighted figures calculated using intwt0. The sum of the sample sizes for a given classification may be less than the total sample size because of missing responses to the classification variable.

58
5.1 Key Findings
5.2 Background HIV incidence is the measure of new HIV infections in a population over time. It can provide important information on the status of the HIV epidemic, can be used for effective targeted HIV prevention planning in groups that are most vulnerable to infection, and to measure the impact of HIV prevention programs. This chapter presents annual estimates of HIV incidence among participants aged 15 years and older at the national level. For the purposes of this analysis, HIV incidence is expressed as the cumulative incidence or risk of new infections in a 12-month period, which is a close approximation to the instantaneous incidence rate. It is important to note that THIS was not powered to estimate incidence at the regional level or across different sub-groups. In THIS, two laboratory-based incidence testing algorithms (HIV-1 LAg Avidity plus VL and HIV-1 LAg Avidity plus VL and ARV detection) were used to distinguish recent from long-term infection, and incidence estimates were obtained using the formula recommended by the WHO Incidence WG and Consortium for Evaluation and Performance of Incidence Assays, and with assay performance characteristics of a MDRI=130 days (95% CI: 118, 142), with T=1.0 year and residual PFR=0.00. Survey weights are utilized for all estimates. All HIV-positive participants aged 18 months and older were tested for recent infection using HIV-1 LAg Avidity assay. Updated incidence algorithm Incidence estimation for THIS is based on recent/long-term classification using algorithms with the LAg Avidity assay.1,2,3 The original algorithm incorporated VL results to mitigate misclassification from persons who may be elite controllers or on ART – both groups characterized by low VL. As ART coverage has increased, some individuals on ART for long-periods of time have the potential to be misclassified by the LAg plus VL algorithm as a recent infection. Although they may have suppressed VL for years, drug resistance or lack of adherence may result in VL ≥ 1000 copies/mL, which appear as false recent cases when using only LAg plus VL algorithm. Based in part on data from multiple PHIA surveys, the updated incidence algorithm includes ARV detection as a second exclusion criteria. The addition of ARV detection is expected to produce more accurate estimates of both HIV incidence and transmitted HIV drug resistance.
▪ Annual incidence of HIV infection among adults aged 15-64 years in Tanzania was 0.25% (0.34% for females, and 0.17% for males).
§ Annual incidence of HIV infection among adults aged 15 years and older in Tanzania was 0.24% (0.32% among females and 0.16% among males).
§ The incidence of HIV infection among adults aged 25-34 years is higher (0.43%) compared to other age groups. Females were almost five times more likely to be HIV positive compared to males (0.15% among males and 0.7% among females) in that particular age group.
§ The incidence was highest in males in aged 35-49 years (0.37%) and in females aged 25-34 years (0.7%).
5 HIV INCIDENCE: ADULTS

59
5.3 HIV Incidence Among Adults HIV incidence estimates using LAg Avidity and HIV viral load The incidence of HIV infection among adults aged 15 years and older is 0.27% overall (0.16% among males and 0.38% among females). This corresponds to approximately 81,000 new infections per year. The estimated incidence of HIV infection was 0.27% among adults aged 15-49 years and 0.29% (0.17% among men and 0.40% among women) among those 15-64 years of age. Among males, annual incidence peaked in those 35-49 years of age (0.37%) and among females, annual incidence peaked in those aged 25-34 years (0.70%). However, these results should be interpreted with caution, as the differences are not statistically significant, and the survey was not designed to estimate age- and gender-specific differences (Table 5.3.A ). HIV incidence estimates using LAg Avidity, HIV viral load, and ARV detection The incidence of HIV infection among adults aged 15 years and older is 0.24% overall (0.16% among males and 0.32% among females). This corresponds to approximately 72,000 new infections per year (about 24,000 among males and 48,000 among females). Among adults aged 15-49 years, the estimated HIV incidence was 0.24% and, for those aged 15-64 years, it was 0.25% (0.17% among males and 0.34% among females). Among males, annual incidence peaked in those aged 35-49 years (0.37%), and among females, annual incidence peaked in those aged 25-34 years (0.70%). However, these results should be interpreted with caution, as the differences are not statistically significant, and the survey was not designed to estimate age and gender specific differences (Table 5.3.B).
Table 5.3.A Annual HIV incidence using LAg/VL1 testing algorithm Annual incidence of HIV among persons aged 15-49 years and aged 15 years and older using LAg/VL1 algorithm, by sex and age, THIS 2016-2017 Males Females Total
Age Percentage
annual incidence2
95% CI3 Percentage
annual incidence2
95% CI Percentage
annual incidence2
95% CI
15-24 0.00 (0.00, 023) 0.14 (0.00, 0.31) 0.07 (0.00, 0.16) 15-19 0.00 (0.00, 0.41) 0.22 (0.00, 0.50) 0.11 (0.00, 0.25) 20-24 0.00 (0.00, 0.52) 0.05 (0.00, 0.19) 0.03 (0.00, 0.10)
25-34 0.15 (0.00, 0.38) 0.70 (0.26, 1.15) 0.43 (0.18, 0.68) 35-49 0.37 (0.00, 0.75) 0.47 (0.05, 0.90) 0.42 (0.13, 0.71) 15-49 0.14 (0.02, 0.26) 0.40 (0.22, 0.58) 0.27 (0.16, 0.38) 15-64 0.17 (0.05, 0.29) 0.40 (0.23, 0.57) 0.29 (0.18, 0.39) 15+ 0.16 (0.05, 0.27) 0.38 (0.22, 0.53) 0.27 (0.17, 0.37) 1 LAg/VL: Limiting antigen/viral load 2 Relates to Global AIDS Monitoring indicator 1.3: Retention on antiretroviral therapy at 12 months 3 CI (confidence interval) indicates the interval that is expected to include the true population parameter 95% of the time

60
Table 5.3.B Annual HIV incidence using LAg/VL/ARV1 testing algorithm Annual incidence of HIV among persons aged 15-49 years and aged 15 years and older using LAg/VL/ARV1 algorithm, by sex and age, THIS 2016-2017 Males Females Total
Age Percentage
annual incidence2
95% CI3 Percentage
annual incidence2
95% CI Percentage
annual incidence2
95% CI
15-24 0.00 (0.00, 0.23) 0.14 (0.00, 0.31) 0.07 (0.00, 0.16) 15-19 0.00 (0.00, 0.41) 0.22 (0.00, 0.50) 0.11 (0.00, 0.25) 20-24 0.00 (0.00, 0.52) 0.05 (0.00, 0.19) 0.03 (0.00, 0.10)
25-34 0.15 (0.00, 0.38) 0.70 (0.26, 1.15) 0.43 (0.18, 0.68) 35-49 0.37 (0.00, 0.75) 0.24 (0.00, 0.56) 0.31 (0.05, 0.55) 15-49 0.14 (0.02, 0.26) 0.34 (0.18, 0.50) 0.24 (0.14, 0.35) 15-64 0.17 (0.05, 0.29) 0.34 (0.19, 0.50) 0.25 (0.15, 0.36) 15+ 0.16 (0.05, 0.27) 0.32 (0.17, 0.46) 0.24 (0.15, 0.33) 1 LAg/VL/ARV: Limiting antigen/viral load/antiretrovirals 2 Relates to Global AIDS Monitoring indicator 1.3: Retention on antiretroviral therapy at 12 months 3 CI (confidence interval) indicates the interval that is expected to include the true population parameter 95% of the time
5.4 Gaps and Unmet Needs
5.5 References 1. Duong YT, Kassanjee R, Welte A, et al. Recalibration of the limiting antigen avidity EIA to determine mean duration of recent infection in divergent HIV-1 subtypes. PLoS One. 2015 Feb 24;10(2):e0114947. doi: 10.1371/journal.pone.0114947. 2. Kassanjee R, McWalter TA, Bärnighausen T, Welte A. A new general biomarker-based incidence estimator. Epidemiology. 2012 Sep;23(5):721-8. doi: 10.1097/EDE.0b013e3182576c07. 3. Duong YT, Qiu M, De AK, et al. Detection of recent HIV-1 infection using a new limiting-antigen avidity assay: potential for HIV-1 incidence estimates and avidity maturation studies. PLoS One.
2012;7(3):e33328. doi: 10.1371/journal.pone.0033328. Epub 2012 Mar 27.
§ Incidence results parallel the gender disparity in prevalence; females have significantly higher incidence compared to males, especially among females aged 25-34 years.
§ The highest incidence was among females aged 25-34 years.

61
6.1 Key Findings
6.2 Background HIV prevalence is a measure of the relative burden of disease in a population. This chapter presents representative estimates of prevalence of HIV infection at the national and regional level by selected demographic and behavioral characteristics. This chapter also presents estimates of the number of people living with HIV in Tanzania. HIV prevalence testing was conducted in each household using a serological rapid diagnostic testing algorithm based on Tanzania’s national guidelines, with laboratory confirmation of seropositive samples using a supplemental assay. Appendix A describes the sample design and Appendix C provides estimates of sampling errors. Appendix B describes THIS HIV testing methodology. 6.3 Adult HIV Prevalence by Demographic Characteristics Among adults aged 15-49 years, the prevalence of HIV infection was 4.7% (3.1% among males and 6.2% among females) with higher prevalence in urban areas at 5.5%, as compared to 4.2% in rural areas (Table 6.3.A). HIV prevalence among adults, 15 years and older was 4.9%; 3.4% in males and 6.3% in females. This corresponds to approximately 1,400,000 PLHIV, aged 15 years and older, in Tanzania. In adults aged 15 years and older, HIV prevalence ranged from 0.7% in those aged 15-19 years to 9.7% in those aged 40-44 years. HIV prevalence was highest among females aged 45-49 years at 12.0% compared to 8.4% among males aged 40-44 years. Prevalence among those aged 15-24 years was 1.4% (2.1% among females and 0.6% among males). The disparity in HIV prevalence between males and females is most pronounced among younger adults, with females aged 15-19 years, aged 20-24 years, aged 25-29 years, aged 30-34 years, and aged 35-39 years all having prevalence double (or higher) as compared to males in corresponding age groups. Prevalence increased rapidly from 15-19 years of age (0.7%) to the ages of 35-39 years (8.6%) for both males and females (Table 6.3.C). Among those aged 15 years and older, who have never married, HIV prevalence was 1.8%. HIV prevalence in females who were never married was approximately three-fold greater (3.1%) compared to men who were never married (0.9%). Among those who were married or living with a partner (or living together), HIV prevalence was 4.8%. Among those who were widowed, divorced, or separated, HIV prevalence was
6 HIV PREVALENCE: ADULTS
§ Prevalence of HIV infection among adults aged 15 years and older in Tanzania was 4.9% (6.3% among females, and 3.4% among males). This corresponds to approximately 1.4 million PLHIV aged 15 years and older in the country.
§ Prevalence among adults aged 15-49 years was 4.7% for the entire country, 4.8% in Tanzania mainland and 0.4% in Zanzibar.
§ HIV prevalence among females aged 20-24 years, 25-29 years, 30-34 years, and 35-39 years was higher than in males in corresponding age groups.
§ The burden of HIV infection varies across the country; HIV prevalence ranged from less than 1.0% in Zanzibar and Lindi to 11.4% in Njombe.
§ Overall, HIV prevalence reduced with increasing education level for both males and females.
6 HIV PREVALENCE: ADULTS

62
more than twice as high as in those who were married (widowed 13.0%, divorced/separated 11.0%). (Table 6.3.B, Figure 6.3.B).
Among adults aged 15 years and older, HIV prevalence by education status ranged from 6.1% in those with no education to 0.5% in those with post-secondary (A-Level) training. Overall, prevalence decreased with increasing education level. HIV prevalence was 6.1% among those with no education, compared to 5.5% among those with primary school education and 2.7% among those with secondary/O-level education. HIV prevalence in females with no education, primary education, and secondary (O-level) education was 6.7%, 7.2% and 3.6%, compared to males with the same level of education 5.0%, 3.7%, and 2.0% respectively (Table 6.3.B).
HIV prevalence among females aged 15 years and older who were pregnant at the time of the survey was estimated at 4.7%, compared to 6.4% among females who were not pregnant (Table 6.3.B).
Table 6.3.A HIV prevalence by demographic characteristics: Ages 15-49 years Prevalence of HIV among persons aged 15-49 years, by sex and selected demographic characteristics, THIS 2016-2017 Males Females Total
Characteristic Percentage HIV positive Number Percentage HIV
positive Number Percentage HIV positive Number
Residence Urban 2.8 3,435 7.8 5,174 5.5 8,609 Rural 3.2 7,536 5.1 9,455 4.2 16,991
Tanzania Mainland/Zanzibar Mainland 3.1 10,422 6.4 13,822 4.8 24,244
Urban 2.9 3,253 8.0 4,942 5.6 8,195 Rural 3.3 7,169 5.3 8,880 4.3 16,049
Zanzibar 0.0 549 0.8 807 0.4 1,356 Unguja 0.0 414 1.0 585 0.5 999 Pemba 0.0 135 0.4 222 0.2 357
Region Dodoma 2.5 154 5.8 204 4.2 358 Arusha 2.0 139 1.8 218 1.9 357 Kilimanjaro 1.1 159 3.1 236 2.2 395 Tanga 3.5 204 7.2 281 5.4 485 Morogoro 1.5 247 5.9 391 3.9 638 Pwani 2.6 573 7.7 852 5.3 1,425 Dar es Salaam 2.0 619 6.3 939 4.3 1,558 Lindi 0.0 127 0.7 132 0.3 259 Mtwara 1.3 142 3.1 156 2.1 298 Ruvuma 4.5 657 6.6 803 5.5 1,460 Iringa 6.6 443 15.5 617 11.2 1,060 Mbeya 4.9 450 13.2 634 9.2 1,084 Singida 1.6 100 5.3 146 3.5 246 Tabora 4.2 1,182 5.5 1,373 4.8 2,555 Rukwa 3.0 747 5.1 1,023 4.1 1,770 Kigoma 2.7 258 3.4 344 3.0 602 Shinyanga 4.0 840 7.2 1,005 5.5 1,845 Kagera 6.1 324 7.6 367 6.8 691 Mwanza 4.3 459 8.9 572 6.5 1,031 Mara 2.5 285 4.0 407 3.3 692 Manyara 1.2 160 2.4 205 1.8 365 Njombe 6.1 267 16.1 409 11.6 676 Katavi 2.9 854 8.0 1,119 5.4 1,973 Simiyu 3.2 245 3.7 362 3.5 607 Geita 3.5 319 6.9 388 5.2 707 Songwe 4.7 468 6.5 639 5.6 1,107 Kaskazini Unguja 0.0 87 1.5 136 0.8 223 Kusini Unguja 0.0 83 0.0 99 0.0 182 Mjini Magharibi 0.0 244 1.1 350 0.5 594 Kaskazini Pemba 0.0 54 0.0 91 0.0 145 Kusini Pemba 0.0 81 0.7 131 0.4 212

63
Table 6.3.A HIV prevalence by demographic characteristics: Ages 15-49 years (continued)
Males Females Total
Characteristic Percentage HIV positive Number Percentage HIV
positive Number Percentage HIV positive Number
Marital status Never married 0.9 4,330 3.0 3,517 1.7 7,847 Married or living together 4.3 5,954 5.4 9,117 4.9 15,071 Divorced or separated 7.3 603 12.4 1,527 10.7 2,130 Widowed 19.3 57 31.0 441 29.7 498
Education No education 5.9 1,109 7.5 2,370 6.9 3,479 Pre-Primary 8.6 57 6.3 69 7.4 126 Primary 3.3 6,708 7.2 8,690 5.3 15,398 Post Primary Training 1.9 148 7.6 148 4.3 296 Secondary (O-Level) 1.8 2,337 3.5 2,815 2.7 5,152 Post-Secondary (O-Level)
Training 2.1 263 1.4 321 1.7 584
Secondary (A-Level) 0.3 108 1.9 66 0.9 174 Post-Secondary (A-Level)
Training 0.7 64 (0.0) 34 0.5 98
University 1.6 174 0.3 108 1.2 282 Wealth quintile
Lowest 2.8 2,396 5.0 2,942 3.9 5,338 Second 3.5 2,391 5.1 2,948 4.3 5,339 Middle 4.0 2,418 7.3 3,246 5.7 5,664 Fourth 3.1 1,990 8.0 2,776 5.7 4,766 Highest 1.8 1,774 5.5 2,712 3.7 4,486
Pregnancy status Currently pregnant NA NA 4.8 1,302 NA NA Not currently pregnant NA NA 6.4 13,085 NA NA
Total 15-49 3.1 10,971 6.2 14,629 4.7 25,600 The sum of the sample sizes for a given classification may be less than the total sample size because of missing responses to the classification variable. Estimates in parentheses are based on a small number (25 to 49) of unweighted cases and should be interpreted with caution.

64
Table 6.3.B HIV prevalence by demographic characteristics: Ages 15 years and older Prevalence of HIV among persons aged 15 years and older, by sex and selected demographic characteristics, THIS 2016-2017 Males
Females
Total
Characteristic Percentage HIV positive
Number
Percentage HIV positive
Number
Percentage HIV positive
Number
Residence
Urban 3.4 4,106
8.3 6,034
6.0 10,140 Rural 3.4 9,644
5.0 11,795
4.2 21,439
Tanzania Mainland/Zanzibar
Mainland 3.5 13,079
6.4 16,848
5.0 29,927 Urban 3.5 3,902
8.5 5,772
6.2 9,674
Rural 3.4 9,177
5.1 11,076
4.3 20,253 Zanzibar 0.0 671
0.8 981
0.4 1,652
Unguja 0.0 488
1.0 693
0.5 1,181 Pemba 0.0 183
0.3 288
0.2 471
Region
Dodoma 3.8 226
6.2 280
5.0 506 Arusha 1.7 175
2.2 255
1.9 430
Kilimanjaro 2.0 241
3.1 341
2.6 582 Tanga 3.7 283
6.2 367
5.0 650
Morogoro 2.2 324
5.8 491
4.2 815 Pwani 3.0 764
7.7 1,071
5.5 1,835
Dar es Salaam 2.3 724
6.8 1,049
4.7 1,773 Lindi 0.0 156
0.6 181
0.3 337
Mtwara 1.4 206
2.8 208
2.0 414 Ruvuma 4.6 852
6.6 1,062
5.6 1,914
Iringa 6.6 550
15.3 792
11.3 1,342 Mbeya 5.4 559
12.8 765
9.3 1,324
Singida 1.8 139
5.1 193
3.6 332 Tabora 4.6 1,454
5.7 1,607
5.1 3,061
Rukwa 3.3 896
5.5 1,183
4.4 2,079 Kigoma 2.8 329
3.1 448
2.9 777
Shinyanga 4.3 1,003
7.5 1,206
5.9 2,209 Kagera 5.8 410
7.2 447
6.5 857
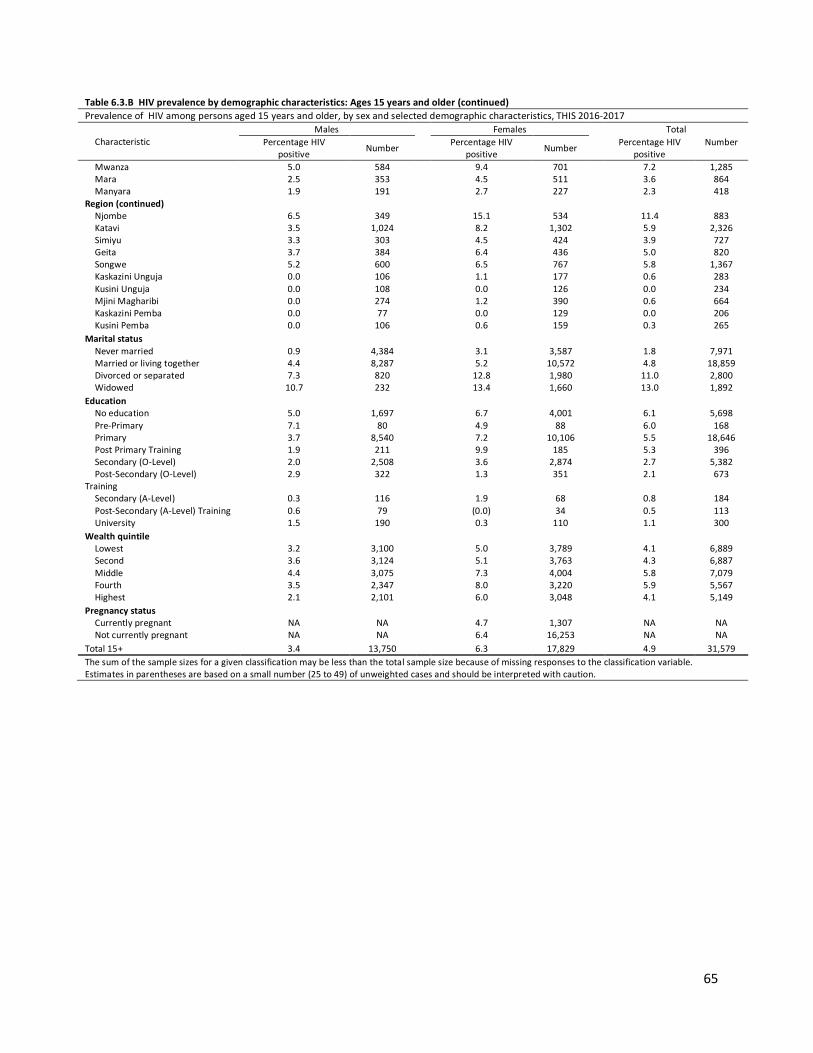
65
Table 6.3.B HIV prevalence by demographic characteristics: Ages 15 years and older (continued) Prevalence of HIV among persons aged 15 years and older, by sex and selected demographic characteristics, THIS 2016-2017
Characteristic Males Females Total
Percentage HIV positive Number Percentage HIV
positive Number Percentage HIV positive
Number
Mwanza 5.0 584
9.4 701
7.2 1,285 Mara 2.5 353
4.5 511
3.6 864
Manyara 1.9 191
2.7 227
2.3 418 Region (continued)
Njombe 6.5 349
15.1 534
11.4 883 Katavi 3.5 1,024
8.2 1,302
5.9 2,326
Simiyu 3.3 303
4.5 424
3.9 727 Geita 3.7 384
6.4 436
5.0 820
Songwe 5.2 600
6.5 767
5.8 1,367 Kaskazini Unguja 0.0 106
1.1 177
0.6 283
Kusini Unguja 0.0 108
0.0 126
0.0 234 Mjini Magharibi 0.0 274
1.2 390
0.6 664
Kaskazini Pemba 0.0 77
0.0 129
0.0 206 Kusini Pemba 0.0 106
0.6 159
0.3 265
Marital status
Never married 0.9 4,384
3.1 3,587
1.8 7,971 Married or living together 4.4 8,287
5.2 10,572
4.8 18,859
Divorced or separated 7.3 820
12.8 1,980
11.0 2,800 Widowed 10.7 232
13.4 1,660
13.0 1,892
Education
No education 5.0 1,697
6.7 4,001
6.1 5,698 Pre-Primary 7.1 80
4.9 88
6.0 168
Primary 3.7 8,540
7.2 10,106
5.5 18,646 Post Primary Training 1.9 211
9.9 185
5.3 396
Secondary (O-Level) 2.0 2,508
3.6 2,874
2.7 5,382 Post-Secondary (O-Level)
Training 2.9 322
1.3 351
2.1 673
Secondary (A-Level) 0.3 116
1.9 68
0.8 184 Post-Secondary (A-Level) Training 0.6 79
(0.0) 34
0.5 113
University 1.5 190
0.3 110
1.1 300 Wealth quintile
Lowest 3.2 3,100
5.0 3,789
4.1 6,889 Second 3.6 3,124
5.1 3,763
4.3 6,887
Middle 4.4 3,075
7.3 4,004
5.8 7,079 Fourth 3.5 2,347
8.0 3,220
5.9 5,567
Highest 2.1 2,101
6.0 3,048
4.1 5,149 Pregnancy status
Currently pregnant NA NA
4.7 1,307
NA NA Not currently pregnant NA NA
6.4 16,253
NA NA
Total 15+ 3.4 13,750
6.3 17,829
4.9 31,579 The sum of the sample sizes for a given classification may be less than the total sample size because of missing responses to the classification variable. Estimates in parentheses are based on a small number (25 to 49) of unweighted cases and should be interpreted with caution.

66
Figure 6.3.A HIV prevalence by marital status: Ages 15 years and older, THIS 2016-2017
Table 6.3.C HIV prevalence by age and sex, United Republic of Tanzania Prevalence of HIV among persons all ages, by sex and age, THIS 2016-2017 Males Females Total
Age Percentage HIV positive Number Percentage
HIV positive Number Percentage HIV positive Number
0-17 months 0.1 538 0.4 525 0.3 1,063 18-59 months 0.2 1,312 0.7 1,251 0.4 2,563 5-9 0.5 1,661 0.5 1,607 0.5 3,268 10-14 0.3 1,345 0.3 1,377 0.3 2,722 Total 0-4 0.2 1,850 0.6 1,776 0.4 3,626 Total 0-14 0.3 4,856 0.5 4,760 0.4 9,616 15-19 0.4 2,533 1.0 2,999 0.7 5,532 20-24 0.9 1,987 3.4 2,845 2.2 4,832 25-29 2.3 1,670 5.6 2,521 4.0 4,191 30-34 3.9 1,453 8.6 2,062 6.4 3,515 35-39 5.6 1,307 11.6 1,749 8.6 3,056 40-44 8.4 1,144 11.0 1,405 9.7 2,549 45-49 6.8 877 12.0 1,048 9.4 1,925 50-54 7.4 728 9.4 872 8.4 1,600 55-59 8.0 572 9.7 580 8.9 1,152 60-64 3.6 459 6.5 558 5.2 1,017 65-69 2.3 344 3.0 395 2.7 739 70-74 1.7 254 4.4 322 3.3 576 75-79 2.0 193 0.2 221 1.0 414 ≥80 0.3 229 1.2 252 0.8 481 Total 15-24 0.6 4,520 2.1 5,844 1.4 10,364 Total 15-49 3.1 10,971 6.2 14,629 4.7 25,600 Total 50+ 5.0 2,779 6.5 3,200 5.8 5,979 Total 15-64 3.5 12,730 6.5 16,639 5.0 29,369 Total 15+ 3.4 13,750 6.3 17,829 4.9 31,579

67
Figure 6.3.B HIV prevalence by age and sex, THIS 2016-2017
Table 6.3.D HIV prevalence by age and sex, Zanzibar Prevalence of HIV among persons all ages, by sex and age, in Zanzibar, THIS 2016-2017 Males Females Total
Age Percentage HIV positive Number Percentage
HIV positive Number Percentage HIV positive Number
0-14 0.0 252 0.0 270 0.0 522 15-49 0.0 549 0.8 807 0.4 1,356 50+ 0.0 122 0.9 174 0.5 296 15-64 0.0 623 0.9 920 0.5 1,543 15+ 0.0 671 0.8 981 0.4 1,652
Table 6.3.E HIV prevalence by age and sex, Mainland Prevalence of HIV among persons all ages, by sex and age, in Tanzania mainland, THIS 2016-2017 Males Females Total
Age Percentage HIV positive Number Percentage
HIV positive Number Percentage HIV positive Number
0-14 0.3 4,604 0.5 4,490 0.4 9,094 15-49 3.1 10,422 6.4 13,822 4.8 24,244 50+ 5.1 2,657 6.7 3,026 6.0 5,683 15-64 3.6 12,107 6.7 15,719 5.1 27,826 15+ 3.5 13,079 6.4 16,848 5.0 29,927

68
6.4 Adult (15+ years) HIV Prevalence by Region Among adults 15 years and older, prevalence varied geographically across Tanzania, ranging from 11.4% in Njombe to 0.0% in Kusini Unguja and Kaskazini Pemba. HIV prevalence was estimated to be 5.0% in the mainland and 0.4% in Zanzibar (Table 6.3.B). HIV prevalence in Dar es Salaam was 4.7%. Female HIV prevalence was approximately three-fold greater in Dar es Salaam compared to male HIV prevalence (6.8% in females compared to 2.3% in males) (Table 6.3.B). HIV prevalence in Iringa was two-fold higher among females (15.3%) compared to males (6.6%). The same observation was noted in Katavi (females 8.2% compared to males 3.5%, Mbeya (females 12.8% compared to males 5.4%), Mwanza (females 9.4% compared to males 5.0%) and Njombe (females 15.1% compared to males 6.5%). The highest prevalences were observed in Iringa (11.3%), Mbeya (9.3%), and Njombe regions (11.4%), and lowest prevalences were observed in Kusini Unguja and Kaskazini Pemba (both 0.0%). Figure 6.4.A HIV prevalence among adults aged 15 years and older, by region, THIS 2016-2017

69
Figure 6.4.B HIV prevalence among adults aged 15 years and older, by region, THIS 2016-2017
6.5 Gaps and Unmet Needs
§ Overall, females have a higher burden of HIV compared to males. § Prevalence was greatest in women aged 35-49 years and hence it is recommended to undertake
initiatives in this age group, including tailored preventive services.

70
7.1 Key Findings
7.2 Background Awareness of HIV status is a critical component of HIV epidemic control. Awareness of HIV-positive status is the first step to engagement with HIV care and treatment services, accessing ART, prevention and counseling. Testing is essential for both HIV-positive and HIV-negative individuals to reduce risk of HIV transmission or acquisition, and access to screening services for other comorbidities. Findings presented in this chapter pertain to male and female adults, ages 15 years and older, who self-reported ever testing for HIV and receiving the test results. Results of HIV testing in the last 12 months and receiving the test results are also presented to understand frequent or recent testing. 7.3 Self-Reported HIV Testing Among Adults Among adults aged 15 years and older, 65.2% reported ever testing for HIV and receiving their test results. Thirty-one percent (31.3%) reported having been tested for HIV in the twelve months preceding the survey (Table 7.3.C). Among men aged 15 years and older, 59.2% reported ever having been tested and receiving their test results for HIV, while about half (29.0%) of those reported testing in the year preceding the survey. More than three-fourths (76.6%) of males aged 25-29 years had been tested and received their results, compared to only 21.0% among males aged 15-19 years. A greater proportion (73.3%) of males, who are married or had partners, reported to have been tested and received test results compared to those who had never married (36.6%). Testing also varied with education level: coverage of testing was 77.4% among males with post-secondary education (O-level), compared to 58.3% and 48.5%, among those with primary education and no education, respectively. A similar pattern was observed across education levels for coverage of testing in the year preceding the survey. Having had a previous HIV test was more common among HIV-positive men aged 15 years and older (80.3%) than among those who were HIV negative (58.1%) (Table 7.3.A, Figure 7.3.A).
7 HIV TESTING: ADULTS
§ Sixty-five percent (65.2%) of adults 15 years and older self-reported having ever been tested for HIV (59.2% of males and 70.8% of females).
§ Overall, 31.3% of adults aged 15 years and older reported having had an HIV test in the twelve months preceding the survey (29.0% of males and 33.5% of females).
§ In Tanzania, 15.7% of adults aged 15 years and older who tested HIV positive during THIS reported that they had never been tested for HIV previously (19.7% of males and 13.7% of females).
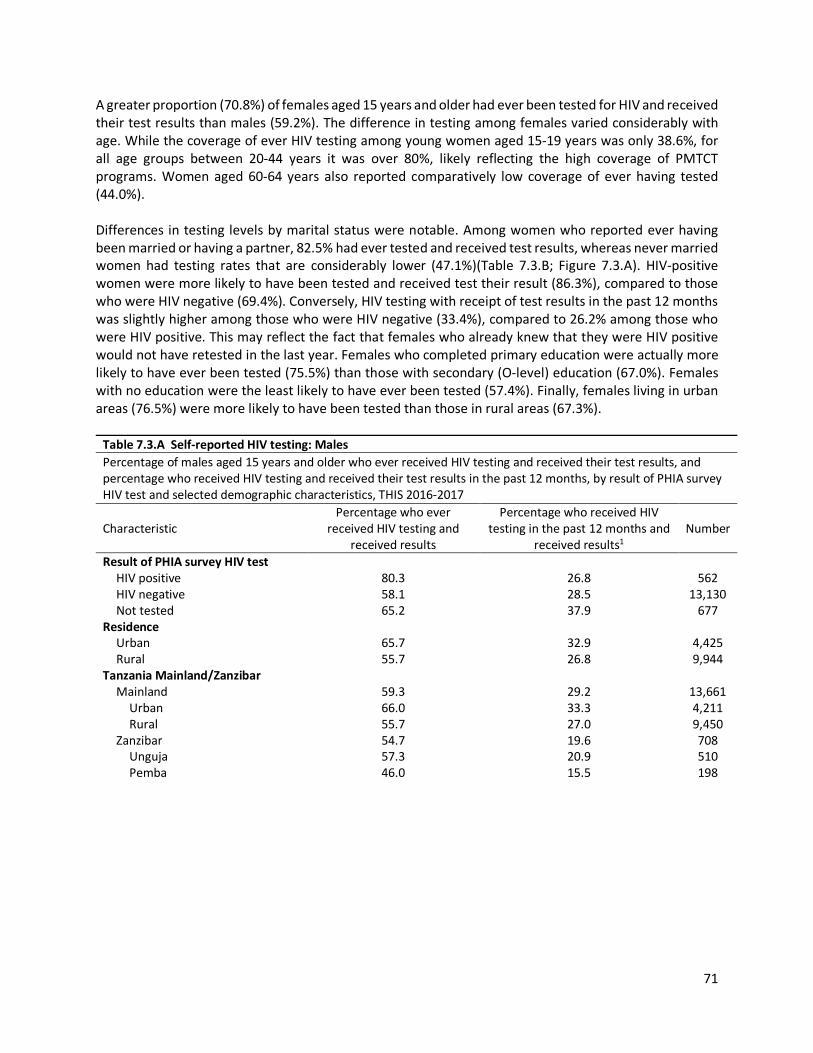
71
A greater proportion (70.8%) of females aged 15 years and older had ever been tested for HIV and received their test results than males (59.2%). The difference in testing among females varied considerably with age. While the coverage of ever HIV testing among young women aged 15-19 years was only 38.6%, for all age groups between 20-44 years it was over 80%, likely reflecting the high coverage of PMTCT programs. Women aged 60-64 years also reported comparatively low coverage of ever having tested (44.0%). Differences in testing levels by marital status were notable. Among women who reported ever having been married or having a partner, 82.5% had ever tested and received test results, whereas never married women had testing rates that are considerably lower (47.1%)(Table 7.3.B; Figure 7.3.A). HIV-positive women were more likely to have been tested and received test their result (86.3%), compared to those who were HIV negative (69.4%). Conversely, HIV testing with receipt of test results in the past 12 months was slightly higher among those who were HIV negative (33.4%), compared to 26.2% among those who were HIV positive. This may reflect the fact that females who already knew that they were HIV positive would not have retested in the last year. Females who completed primary education were actually more likely to have ever been tested (75.5%) than those with secondary (O-level) education (67.0%). Females with no education were the least likely to have ever been tested (57.4%). Finally, females living in urban areas (76.5%) were more likely to have been tested than those in rural areas (67.3%).
Table 7.3.A Self-reported HIV testing: Males Percentage of males aged 15 years and older who ever received HIV testing and received their test results, and percentage who received HIV testing and received their test results in the past 12 months, by result of PHIA survey HIV test and selected demographic characteristics, THIS 2016-2017
Characteristic Percentage who ever
received HIV testing and received results
Percentage who received HIV testing in the past 12 months and
received results1 Number
Result of PHIA survey HIV test HIV positive 80.3 26.8 562 HIV negative 58.1 28.5 13,130 Not tested 65.2 37.9 677
Residence Urban 65.7 32.9 4,425 Rural 55.7 26.8 9,944
Tanzania Mainland/Zanzibar Mainland 59.3 29.2 13,661
Urban 66.0 33.3 4,211 Rural 55.7 27.0 9,450
Zanzibar 54.7 19.6 708 Unguja 57.3 20.9 510 Pemba 46.0 15.5 198

72
Table 7.3.A Self-reported HIV testing: Males (continued) Percentage of males aged 15 years and older who ever received HIV testing and received their test results, and percentage who received HIV testing and received their test results in the past 12 months, by result of PHIA survey HIV test and selected demographic characteristics, THIS 2016-2017
Characteristic Percentage who ever
received HIV testing and received results
Percentage who received HIV testing in the past 12 months and
received results1 Number
Region Dodoma 49.6 16.2 247 Arusha 61.4 29.5 195 Kilimanjaro 60.1 23.7 265 Tanga 51.3 20.3 291 Morogoro 59.0 25.9 338 Pwani 60.2 28.5 821 Dar es Salaam 65.5 36.2 821 Lindi 51.5 20.6 159 Mtwara 52.0 24.0 220 Ruvuma 63.7 33.8 890 Iringa 69.6 29.4 581 Mbeya 66.8 33.0 598 Singida 51.5 18.7 153 Tabora 59.7 33.4 1,488 Rukwa 64.5 34.7 919 Kigoma 56.6 31.2 332 Shinyanga 62.6 36.6 1,026 Kagera 67.7 39.2 419 Mwanza 58.0 29.9 603 Mara 49.0 27.3 359 Manyara 48.5 19.3 199 Njombe 71.4 27.9 362 Katavi 66.4 38.6 1,055 Simiyu 56.7 31.3 310 Geita 59.5 29.5 390 Songwe 59.7 27.9 620 Kaskazini Unguja 48.8 15.9 109 Kusini Unguja 53.7 17.5 109 Mjini Magharibi 59.4 22.4 292 Kaskazini Pemba 44.0 15.4 87 Kusini Pemba 47.7 15.7 111
Marital status Never married 36.6 19.5 4,580 Married or living together 73.3 35.1 8,673 Divorced or separated 66.6 31.2 850 Widowed 52.7 19.6 239
Education No education 48.5 22.3 1,757 Pre-Primary 53.8 17.4 82 Primary 58.3 27.5 8,850 Post Primary Training 68.5 35.4 220 Secondary (O-Level) 60.2 31.3 2,649 Post-Secondary (O-Level) Training 77.4 43.7 347 Secondary (A-Level) 69.9 46.3 133

73
Table 7.3.A Self-reported HIV testing: Males (continued) Percentage of males aged 15 years and older who ever received HIV testing and received their test results, and percentage who received HIV testing and received their test results in the past 12 months, by result of PHIA survey HIV test and selected demographic characteristics, THIS 2016-2017
Characteristic Percentage who ever
received HIV testing and received results
Percentage who received HIV testing in the past 12 months and
received results1 Number
Post-Secondary (A-Level) Training 88.0 48.9 95 University 86.7 48.4 228
Wealth quintile Lowest 49.5 23.7 3,181 Second 54.2 25.1 3,199 Middle 58.6 28.2 3,180 Fourth 65.0 32.0 2,512 Highest 69.3 36.3 2,293
Age 15-19 21.0 10.5 2,595 20-24 58.2 33.7 2,076 25-29 76.6 40.8 1,775 30-34 82.0 40.2 1,539 35-39 79.0 39.0 1,367 40-44 73.3 34.5 1,215 45-49 72.2 27.6 913 50-54 63.6 25.8 762 55-59 60.5 23.1 595 60-64 57.5 25.9 482 65-69 44.9 16.4 358 70-74 33.5 11.3 264 75-79 32.1 7.8 196 ≥80 20.8 6.5 232
Total 15-24 37.9 21.1 4,671 Total 15-49 60.5 30.6 11,480 Total 50+ 52.4 20.5 2,889 Total 15+ 59.2 29.0 14,369 1Relates to PEPFAR HTC_TST. The sum of the sample sizes for a given classification may be less than the total sample size because of missing responses to the classification variable.

74
Table 7.3.B Self-reported HIV testing: Females Percentage of females aged 15 years and older who ever received HIV testing and received their test results, and percentage who received HIV testing and received their test results in the past 12 months, by result of survey HIV test and selected demographic characteristics, THIS 2016-2017
Characteristic Percentage who ever received HIV testing and received results
Percentage who received HIV testing in the past 12 months and received
results1 Number
Result of PHIA survey HIV test HIV positive 86.3 26.2 1,261 HIV negative 69.4 33.4 16,486 Not tested 77.5 44.6 735
Residence Urban 76.5 37.9 6,366 Rural 67.3 30.8 12,116
Tanzania Mainland/Zanzibar
Mainland 71.1 33.8 17,454 Urban 76.7 38.1 6,089 Rural 67.5 31.1 11,365
Zanzibar 62.9 22.2 1,028 Unguja 65.3 24.3 719 Pemba 56.0 16.3 309
Region Dodoma 60.1 21.6 303 Arusha 70.8 27.8 281 Kilimanjaro 68.0 30.8 368 Tanga 65.9 27.7 379 Morogoro 70.7 29.7 514 Pwani 74.9 37.1 1,151 Dar es Salaam 78.4 41.0 1,124 Lindi 68.1 27.1 185 Mtwara 65.0 30.8 222 Ruvuma 77.0 43.0 1,096 Iringa 77.9 32.4 820 Mbeya 76.3 39.1 823 Singida 68.8 32.1 210 Tabora 72.4 34.8 1,637 Rukwa 67.4 38.7 1,207 Kigoma 68.1 33.8 449 Shinyanga 72.2 41.0 1,222 Kagera 74.5 39.8 454 Mwanza 71.7 34.9 722 Mara 66.6 30.6 523 Manyara 66.5 25.5 237 Njombe 78.6 31.4 564 Katavi 76.0 44.5 1,315 Simiyu 64.9 32.4 422 Geita 68.7 35.4 439 Songwe 69.7 34.0 787 Kaskazini Unguja 56.0 12.9 180 Kusini Unguja 62.6 19.7 131 Mjini Magharibi 67.6 27.3 408 Kaskazini Pemba 53.3 15.5 142 Kusini Pemba 58.4 17.1 167
Marital status
Never married 47.1 26.7 3,731 Married or living together 82.5 38.2 10,954 Divorced or separated 80.3 38.0 2,047 Widowed 48.3 16.7 1,721

75
Table 7.3.B Self-reported HIV testing: Females (continued) Percentage of females aged 15 years and older who ever received HIV testing and received their test results, and percentage who received HIV testing and received their test results in the past 12 months, by result of survey HIV test and selected demographic characteristics, THIS 2016-2017
Characteristic Percentage who ever received HIV testing and received results
Percentage who received HIV testing in the past 12 months and received results1 Number
Education
No education 57.4 22.9 4,091 Pre-Primary 62.0 26.3 89 Primary 75.5 34.7 10,449 Post Primary Training 69.8 34.1 192 Secondary (O-Level) 67.0 37.9 3,025 Post-Secondary (O-Level) Training 86.1 49.8 383 Secondary (A-Level) 76.3 44.2 76 Post-Secondary (A-Level) Training (90.6) (44.3) 40 University 94.8 47.6 126
Wealth quintile Lowest 62.4 26.9 3,864 Second 66.6 29.7 3,844 Middle 71.3 32.5 4,136 Fourth 76.8 38.4 3,388 Highest 76.3 39.6 3,245
Age
15-19 38.6 23.5 3,053 20-24 85.3 47.3 2,954 25-29 94.2 48.0 2,655 30-34 92.0 42.9 2,154 35-39 88.8 38.2 1,821 40-44 82.4 29.7 1,465 45-49 72.7 25.6 1,082 50-54 60.2 22.2 906 55-59 55.4 18.9 604 60-64 44.0 16.2 571 65-69 35.0 12.2 404 70-74 26.0 8.8 330 75-79 20.2 5.7 224 ≥80 11.6 4.4 259
Total 15-24 60.0 34.4 6,007 Total 15-49 76.4 37.2 15,184 Total 50+ 44.2 15.7 3,298 Total 15+ 70.8 33.5 18,482 1Relates to PEPFAR HTS_TST.
The sum of the sample sizes for a given classification may be less than the total sample size because of missing responses to the classification variable. Estimates in parentheses are based on a small number (25 to 49) of unweighted cases and should be interpreted with caution.

76
Table 7.3.C Self-reported HIV testing: Total Percentage of persons aged 15 years and older who ever received HIV testing and received their test results, and percentage who received HIV testing and received their test results in the past 12 months, by result of PHIA survey HIV test and selected demographic characteristics, THIS 2016-2017
Characteristic Percentage who ever received HIV testing and received results
Percentage who received HIV testing in the past 12 months and received results1 Number
Result of PHIA survey HIV test
HIV positive 84.3 26.4 1,823 HIV negative 63.9 31.0 29,616 Not tested 70.9 41.0 1,412
Residence
Urban 71.5 35.6 10,791 Rural 61.5 28.8 22,060
Tanzania Mainland/Zanzibar
Mainland 65.3 31.6 31,115 Urban 71.7 35.9 10,300 Rural 61.6 29.1 20,815
Zanzibar 59.1 21.0 1,736 Unguja 61.5 22.7 1,229 Pemba 51.6 16.0 507
Region Dodoma 55.0 18.9 550 Arusha 66.4 28.6 476 Kilimanjaro 64.3 27.5 633 Tanga 58.9 24.1 670 Morogoro 65.5 28.0 852 Pwani 68.1 33.2 1,972 Dar es Salaam 72.2 38.7 1,945 Lindi 59.4 23.7 344 Mtwara 57.9 27.1 442 Ruvuma 70.4 38.4 1,986 Iringa 74.0 31.0 1,401 Mbeya 71.8 36.3 1,421 Singida 60.6 25.7 363 Tabora 65.7 34.1 3,125 Rukwa 66.0 36.7 2,126 Kigoma 62.6 32.6 781 Shinyanga 67.3 38.7 2,248 Kagera 70.8 39.5 873 Mwanza 64.7 32.4 1,325 Mara 58.6 29.1 882 Manyara 57.4 22.3 436 Njombe 75.5 29.9 926 Katavi 71.3 41.6 2,370 Simiyu 60.9 31.9 732 Geita 63.9 32.3 829 Songwe 64.9 31.1 1,407 Kaskazini Unguja 52.9 14.2 289 Kusini Unguja 58.1 18.6 240 Mjini Magharibi 63.7 24.9 700 Kaskazini Pemba 49.4 15.5 229 Kusini Pemba 53.5 16.4 278
Marital status
Never married 40.9 22.4 8,311 Married or living together 78.0 36.7 19,627 Divorced or separated 75.7 35.8 2,897 Widowed 48.8 17.1 1,960

77
Table 7.3.C Self-reported HIV testing: Total (continued) Percentage of persons aged 15 years and older who ever received HIV testing and received their test results, and percentage who received HIV testing and received their test results in the past 12 months, by result of PHIA survey HIV test and selected demographic characteristics, THIS 2016-2017
Characteristic Percentage who ever received HIV testing and received results
Percentage who received HIV testing in the past 12 months and received results1 Number
Education
No education 54.4 22.7 5,848 Pre-Primary 57.8 21.8 171 Primary 66.9 31.1 19,299 Post Primary Training 69.0 34.9 412 Secondary (O-Level) 63.4 34.5 5,674 Post-Secondary (O-Level) Training 81.5 46.6 730 Secondary (A-Level) 72.2 45.6 209 Post-Secondary (A-Level) Training 88.7 47.7 135 University 89.3 48.1 354
Wealth quintile Lowest 56.0 25.3 7,045 Second 60.4 27.4 7,043 Middle 65.1 30.4 7,316 Fourth 71.1 35.3 5,900 Highest 73.0 38.1 5,538
Age
15-19 29.8 17.0 5,648 20-24 71.9 40.5 5,030 25-29 85.7 44.5 4,430 30-34 87.1 41.6 3,693 35-39 84.0 38.6 3,188 40-44 77.9 32.1 2,680 45-49 72.5 26.6 1,995 50-54 61.9 23.9 1,668 55-59 57.8 20.9 1,199 60-64 50.2 20.6 1,053 65-69 39.5 14.1 762 70-74 29.2 9.9 594 75-79 25.6 6.7 420 ≥80 15.9 5.4 491
Total 15-24 49.0 27.8 10,678 Total 15-49 68.6 33.9 26,664 Total 50+ 48.0 17.9 6,187 Total 15+ 65.2 31.3 32,851 1Relates to PEPFAR HTC_TST. The sum of the sample sizes for a given classification may be less than the total sample size because of missing responses to the classification variable

78
Figure 7.3.A Proportion of adults who self-reported having received an HIV test in the last 12 months, by age and sex, THIS 2016-2017
7.4 Gaps and Unmet Needs
§ About forty-one percent (40.8%) of males and 29.2% of females aged 15 and older have never had an HIV test.
§ There is low HIV testing in the adolescents aged 15-19 years: 79.0% of males and 61.4% of females reporting never testing for HIV.
§ Self-report of HIV testing was lower among people who were not educated compared to those who had a university education (54.4% versus 89.3%).

79
8.1 Key Findings
8.2 Background Recent studies have shown that treating PLHIV at higher CD4 counts improves immune recovery, decreases the incidence of non-AIDS events, comorbidities, and mortality, and reduces transmission. In 2016, after extensive review of evidence of both the clinical and population-level benefits of expanding ART treatment, the WHO changed their recommendation to support a policy of “Treatment for All,“ regardless of CD4 count. 1,2 By November 2017, almost all countries in sub-Saharan Africa had adopted this policy, despite the challenges in ensuring uptake and implementation.2 This policy was adopted in Tanzania in October 2016. 8.3 Self-Reported Diagnosis and Treatment Status Among HIV-Positive Adults Among HIV-positive adults aged 15 years and older, based on self-report, 48.2% were unaware of their HIV-positive status, 47.1% were aware of their HIV-positive status and on ART, and 4.7% were aware of their HIV-positive status, but not on ART. Among HIV-positive adults aged 15 years and older, 54.8% of men were unaware of their HIV-positive status. Among HIV-positive men, 38.8% were aware of their status and on ART. In urban areas, 53.0% of HIV-positive men aged 15 years and older were unaware of their HIV status, compared to 55.8% among those in rural areas. Meanwhile, 42.0% of HIV-positive males in the same age bracket in urban areas were aware of their HIV status and on ART compared to 37.0% among those in rural areas (Table 8.3A). Among HIV-positive men, those younger than the age of 35 years were less likely to know their HIV status and, relatedly, less likely to be on ART. The percentage of males who were unaware of their HIV status ranged from 31.2% among those aged 55-59 years to 79.0% among those aged 25-29-years. The percentage of HIV-positive males who reported being on ART ranged from 12.4% among those aged 25-29 years to 67.3% among those aged 55-59 years (Table 8.3A).
8 HIV DIAGNOSIS AND TREATMENT: ADULTS
▪ Based on self-reporting of HIV status, among HIV-positive adults aged 15 years and older, 51.8% were aware of their HIV-positive status (45.2% of males and 55.3% of females).
▪ Among those HIV-positive adults aged 15 years and older who self-reported knowing their status and being on ART, 94.9% had detectable ARVs in their blood.
▪ Among those who reported that they had not been previously diagnosed, 9.7% had ARVs detected in their blood (4.8% among males and 12.8% among females).
▪ Overall, 47.1% of HIV-positive adults reported awareness of their status and ART use (38.8% for males and 51.4% for females).
▪ Overall, ARVs were detected in 54.6% of HIV-positive adults aged 15 years and older.

80
Among married or cohabitating HIV-positive males aged 15 years and older, 40.0% of males were aware of their status and on ART (Table 8.3A). Among HIV-positive women aged 15 years and older, 44.7% were unaware of their HIV-positive status. About 51% (51.4%) of HIV-positive women were aware of their HIV-positive status and on ART. As observed among HIV-positive men, younger women were far less likely to be aware of their status. Among young HIV-positive women aged 15-24 years, 59.4% were unaware of their HIV-positive status while 35.8% of them were aware of their HIV-positive status and on ART. In comparison, among HIV-positive women aged 50-54 years, only 29.4% were unaware of their status and 69.4% were on ART. Awareness of HIV status among women, aged 15 years and older, varied by residence. Among those residing in urban areas, 39.0% were unaware of their HIV status as compared to 50.9% among those in rural areas. Among urban HIV-positive women in the same age bracket, 56.4% were aware of their HIV-positive status and on ART compared to 46.0% among those residing in rural areas (Table 8.3.B). Among HIV-positive women, the percentage unaware of their HIV status ranged from 29.4% among those aged 50-54 years to 58.2% among those aged 20-24 years. The percentage of HIV-positive women who reported being on ART ranged from 35.8% among those aged 20-24 years to 69.4% among those aged 50-54 years (Table 8.3.B). Among married or cohabitating HIV-positive women, 49.9% of females were aware of their status and on ART (Table 8.3.B).

81
Table 8.3.A HIV treatment status: Males Percent distribution of HIV-positive males aged 15 years and older by self-reported HIV diagnosis and treatment status, by selected demographic characteristics, THIS 2016-2017 Aware of HIV status
Characteristic Unaware of HIV status
Not on ART On ART1 Total Number
Residence Urban 53.0 5.0 42.0 100.0 157 Rural 55.8 7.2 37.0 100.0 354
Tanzania Mainland/Zanzibar Mainland 54.8 6.4 38.8 100.0 511
Urban 53.0 5.0 42.0 100.0 157 Rural 55.8 7.2 37.0 100.0 354
Zanzibar * * * * 0 Unguja * * * * 0 Pemba * * * * 0
Region Dodoma * * * * 8 Arusha * * * * 3 Kilimanjaro * * * * 5 Tanga * * * * 9 Morogoro * * * * 7 Pwani (43.3) (4.0) (52.7) (100.0) 25 Dar es Salaam * * * * 16 Lindi * * * * 0 Mtwara * * * * 3 Ruvuma (52.2) (2.7) (45.2) (100.0) 40 Iringa (27.7) (20.0) (52.3) (100.0) 37 Mbeya (51.5) (9.1) (39.4) (100.0) 33 Singida * * * * 3 Tabora 73.9 1.7 24.4 100.0 66 Rukwa (63.7) (12.0) (24.3) (100.0) 25 Kigoma * * * * 9 Shinyanga (61.3) (12.2) (26.5) (100.0) 44 Kagera * * * * 21 Mwanza (69.4) (7.5) (23.1) (100.0) 27 Mara * * * * 8 Manyara * * * * 4 Njombe * * * * 23 Katavi (64.2) (10.1) (25.7) (100.0) 40 Simiyu * * * * 11 Geita * * * * 14 Songwe (45.5) (0.0) (54.5) (100.0) 30 Kaskazini Unguja * * * * 0 Kusini Unguja * * * * 0 Mjini Magharibi * * * * 0 Kaskazini Pemba * * * * 0 Kusini Pemba * * * * 0
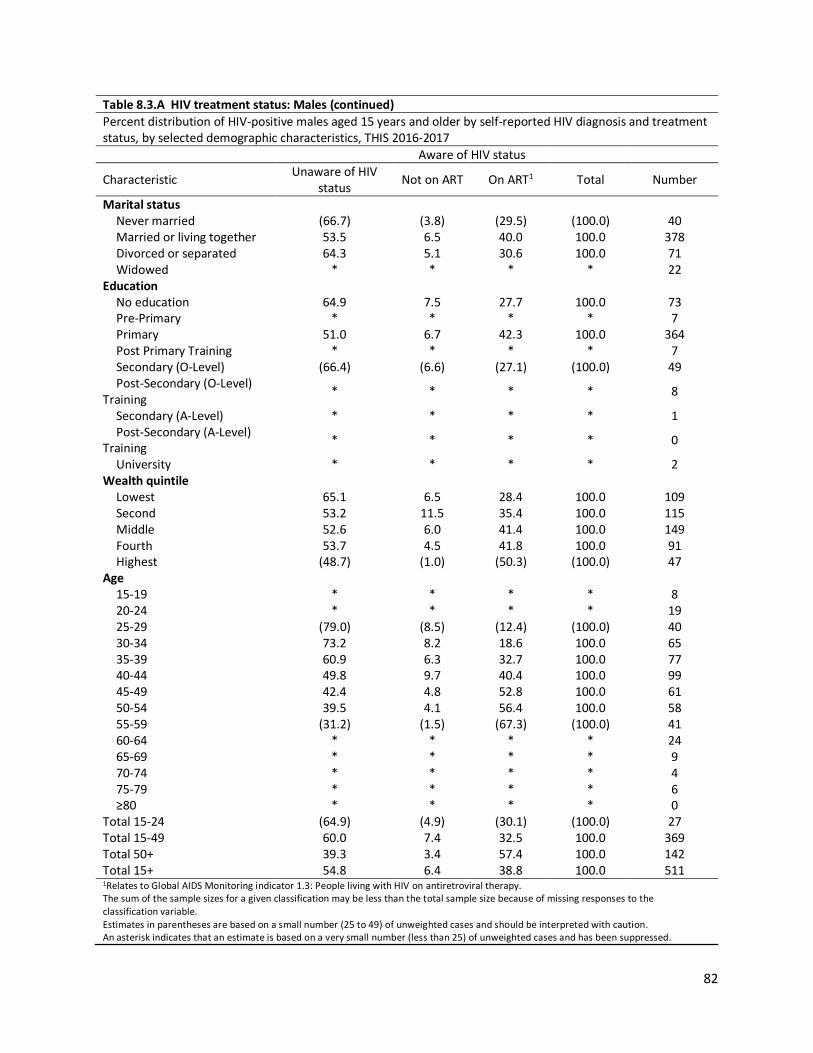
82
Table 8.3.A HIV treatment status: Males (continued) Percent distribution of HIV-positive males aged 15 years and older by self-reported HIV diagnosis and treatment status, by selected demographic characteristics, THIS 2016-2017 Aware of HIV status
Characteristic Unaware of HIV status Not on ART On ART1 Total Number
Marital status Never married (66.7) (3.8) (29.5) (100.0) 40 Married or living together 53.5 6.5 40.0 100.0 378 Divorced or separated 64.3 5.1 30.6 100.0 71 Widowed * * * * 22
Education No education 64.9 7.5 27.7 100.0 73 Pre-Primary * * * * 7 Primary 51.0 6.7 42.3 100.0 364 Post Primary Training * * * * 7 Secondary (O-Level) (66.4) (6.6) (27.1) (100.0) 49 Post-Secondary (O-Level)
Training * * * * 8
Secondary (A-Level) * * * * 1 Post-Secondary (A-Level)
Training * * * * 0
University * * * * 2 Wealth quintile
Lowest 65.1 6.5 28.4 100.0 109 Second 53.2 11.5 35.4 100.0 115 Middle 52.6 6.0 41.4 100.0 149 Fourth 53.7 4.5 41.8 100.0 91 Highest (48.7) (1.0) (50.3) (100.0) 47
Age 15-19 * * * * 8 20-24 * * * * 19 25-29 (79.0) (8.5) (12.4) (100.0) 40 30-34 73.2 8.2 18.6 100.0 65 35-39 60.9 6.3 32.7 100.0 77 40-44 49.8 9.7 40.4 100.0 99 45-49 42.4 4.8 52.8 100.0 61 50-54 39.5 4.1 56.4 100.0 58 55-59 (31.2) (1.5) (67.3) (100.0) 41 60-64 * * * * 24 65-69 * * * * 9 70-74 * * * * 4 75-79 * * * * 6 ≥80 * * * * 0
Total 15-24 (64.9) (4.9) (30.1) (100.0) 27 Total 15-49 60.0 7.4 32.5 100.0 369 Total 50+ 39.3 3.4 57.4 100.0 142 Total 15+ 54.8 6.4 38.8 100.0 511 1Relates to Global AIDS Monitoring indicator 1.3: People living with HIV on antiretroviral therapy. The sum of the sample sizes for a given classification may be less than the total sample size because of missing responses to the classification variable. Estimates in parentheses are based on a small number (25 to 49) of unweighted cases and should be interpreted with caution. An asterisk indicates that an estimate is based on a very small number (less than 25) of unweighted cases and has been suppressed.

83
Table 8.3.B HIV treatment status: Females Percent distribution of HIV-positive females aged 15 years and older by self-reported HIV diagnosis and treatment status, by selected demographic characteristics, THIS 2016-2017 Aware of HIV status
Characteristic Unaware of HIV status
Not on ART On ART1 Total Number
Residence Urban 39.0 4.5 56.4 100.0 511 Rural 50.9 3.1 46.0 100.0 587
Tanzania Mainland/Zanzibar Mainland 44.6 3.9 51.5 100.0 1,090
Urban 39.0 4.6 56.5 100.0 507 Rural 50.7 3.1 46.1 100.0 583
Zanzibar * * * * 8 Unguja * * * * 7 Pemba * * * * 1
Region Dodoma * * * * 16 Arusha * * * * 6 Kilimanjaro * * * * 11 Tanga * * * * 20 Morogoro * * * * 23 Pwani 34.3 6.1 59.6 100.0 77 Dar es Salaam 54.6 2.7 42.7 100.0 70 Lindi * * * * 1 Mtwara * * * * 5 Ruvuma 31.4 1.6 67.0 100.0 63 Iringa 32.9 2.6 64.5 100.0 98 Mbeya 36.9 7.2 55.9 100.0 87 Singida * * * * 10 Tabora 57.9 5.5 36.6 100.0 88 Rukwa 58.0 7.0 35.1 100.0 55 Kigoma * * * * 12 Shinyanga 66.3 3.7 30.1 100.0 80 Kagera 32.3 0.0 67.7 100.0 29 Mwanza 55.0 5.4 39.5 100.0 54 Mara * * * * 23 Manyara * * * * 3 Njombe 29.0 4.9 66.1 100.0 70 Katavi 45.2 6.6 48.2 100.0 102 Simiyu * * * * 18 Geita * * * * 22 Songwe 35.7 4.1 60.2 100.0 47 Kaskazini Unguja * * * * 2 Kusini Unguja * * * * 0 Mjini Magharibi * * * * 5 Kaskazini Pemba * * * * 0 Kusini Pemba * * * * 1

84
Table 8.3.B HIV treatment status: Females (continued) Percent distribution of HIV-positive females aged 15 years and older by self-reported HIV diagnosis and treatment status, by selected demographic characteristics, THIS 2016-2017 Aware of HIV status Characteristic Unaware of HIV status Not on ART On ART1 Total Number Marital status
Never married 45.6 3.2 51.2 100.0 106 Married or living together 46.1 3.9 49.9 100.0 523 Divorced or separated 46.7 6.2 47.1 100.0 239 Widowed 38.7 1.4 59.9 100.0 229
Education No education 54.3 4.2 41.5 100.0 242 Pre-Primary * * * * 4 Primary 41.7 3.5 54.9 100.0 733 Post Primary Training * * * * 14 Secondary (O-Level) 48.2 4.3 47.6 100.0 94 Post-Secondary (O-Level) Training * * * * 9 Secondary (A-Level) * * * * 1 Post-Secondary (A-Level) Training * * * * 0 University * * * * 0
Wealth quintile Lowest 59.3 2.9 37.9 100.0 174 Second 48.4 1.5 50.1 100.0 186 Middle 36.2 3.2 60.6 100.0 290 Fourth 44.4 7.0 48.6 100.0 268 Highest 42.0 3.1 54.9 100.0 180
Age 15-19 * * * * 24 20-24 58.2 6.0 35.8 100.0 97 25-29 46.6 9.9 43.6 100.0 129 30-34 53.2 4.0 42.8 100.0 181 35-39 38.5 4.3 57.2 100.0 194 40-44 39.7 3.9 56.4 100.0 155 45-49 36.9 1.5 61.6 100.0 114 50-54 29.4 1.2 69.4 100.0 77 55-59 40.0 0.0 60.0 100.0 61 60-64 53.7 0.0 46.3 100.0 38 65-69 * * * * 15 70-74 * * * * 8 75-79 * * * * 1 ≥80 * * * * 4
Total 15-24 59.4 4.8 35.8 100.0 121 Total 15-49 45.4 4.7 49.9 100.0 894 Total 50+ 41.9 0.5 57.5 100.0 204 Total 15+ 44.7 3.9 51.4 100.0 1,098 1Relates to Global AIDS Monitoring indicator 1.3: People living with HIV on antiretroviral therapy. The sum of the sample sizes for a given classification may be less than the total sample size because of missing responses to the classification variable. An asterisk indicates that an estimate is based on a very small number (less than 25) of unweighted cases and has been suppressed.

85
Table 8.3.C HIV treatment status: Total Percent distribution of HIV-positive persons aged 15 years and older by self-reported HIV diagnosis and treatment status, by selected demographic characteristics, THIS 2016-2017 Aware of HIV status
Characteristic Unaware of HIV status Not on ART On ART1 Total Number
Residence Urban 42.7 4.7 52.6 100.0 668 Rural 52.9 4.8 42.3 100.0 941
Tanzania Mainland/Zanzibar Mainland 48.1 4.8 47.1 100.0 1,601
Urban 42.7 4.7 52.6 100.0 664 Rural 52.8 4.8 42.4 100.0 937
Zanzibar * * * * 8 Unguja * * * * 7 Pemba * * * * 1
Region Dodoma * * * * 24 Arusha * * * * 9 Kilimanjaro * * * * 16 Tanga (43.2) (4.0) (52.8) (100.0) 29 Morogoro (50.2) (6.9) (42.9) (100.0) 30 Pwani 36.6 5.6 57.8 100.0 102 Dar es Salaam 55.7 2.1 42.2 100.0 86 Lindi * * * * 1 Mtwara * * * * 8 Ruvuma 40.4 2.1 57.6 100.0 103 Iringa 31.4 7.7 61.0 100.0 135 Mbeya 41.0 7.7 51.2 100.0 120 Singida * * * * 13 Tabora 65.6 3.7 30.7 100.0 154 Rukwa 60.0 8.7 31.3 100.0 80 Kigoma * * * * 21 Shinyanga 64.3 7.1 28.6 100.0 124 Kagera 35.7 5.4 59.0 100.0 50 Mwanza 60.4 6.2 33.4 100.0 81 Mara (46.4) (6.0) (47.6) (100.0) 31 Manyara * * * * 7 Njombe 33.1 6.4 60.5 100.0 93 Katavi 51.0 7.7 41.4 100.0 142 Simiyu (42.5) (0.0) (57.5) (100.0) 29 Geita (71.5) (4.3) (24.2) (100.0) 36 Songwe 40.0 2.3 57.6 100.0 77 Kaskazini Unguja * * * * 2 Kusini Unguja * * * * 0 Mjini Magharibi * * * * 5 Kaskazini Pemba * * * * 0 Kusini Pemba * * * * 1

86
Table 8.3.C HIV treatment status: Total (continued) Percent distribution of HIV-positive persons aged 15 years and older by self-reported HIV diagnosis and treatment status, by selected demographic characteristics, THIS 2016-2017 Aware of HIV status Characteristic Unaware of HIV status Not on ART On ART1 Total Number Marital status
Never married 52.1 3.4 44.5 100.0 146 Married or living together 49.5 5.1 45.4 100.0 901 Divorced or separated 50.7 5.9 43.4 100.0 310 Widowed 36.8 2.7 60.5 100.0 251
Education No education 57.1 5.0 37.9 100.0 315 Pre-Primary * * * * 11 Primary 44.9 4.6 50.5 100.0 1,097 Post Primary Training * * * * 21 Secondary (O-Level) 55.4 5.2 39.4 100.0 143 Post-Secondary (O-Level) Training * * * * 17 Secondary (A-Level) * * * * 2 Post-Secondary (A-Level) Training * * * * 0 University * * * * 2
Wealth quintile Lowest 61.6 4.3 34.1 100.0 283 Second 50.4 5.8 43.8 100.0 301 Middle 42.4 4.3 53.4 100.0 439 Fourth 47.1 6.3 46.6 100.0 359 Highest 43.6 2.6 53.8 100.0 227
Age 15-19 (64.0) (0.5) (35.4) (100.0) 32 20-24 59.8 6.2 34.0 100.0 116 25-29 55.7 9.5 34.8 100.0 169 30-34 59.6 5.3 35.1 100.0 246 35-39 45.2 4.9 49.9 100.0 271 40-44 44.0 6.4 49.6 100.0 254 45-49 38.9 2.7 58.4 100.0 175 50-54 33.8 2.4 63.8 100.0 135 55-59 36.2 0.6 63.2 100.0 102 60-64 51.4 0.0 48.6 100.0 62 65-69 * * * * 24 70-74 * * * * 12 75-79 * * * * 7 ≥80 * * * * 4
Total 15-24 60.9 4.8 34.3 100.0 148 Total 15-49 50.2 5.6 44.2 100.0 1,263 Total 50+ 40.9 1.7 57.5 100.0 346 Total 15+ 48.2 4.7 47.1 100.0 1,609 1Relates to Global AIDS Monitoring indicator 1.2: People living with HIV on antiretroviral therapy and PEPFAR TX_CURR_NAT / SUBNAT. The sum of the sample sizes for a given classification may be less than the total sample size because of missing responses to the classification variable. Estimates in parentheses are based on a small number (25 to 49) of unweighted cases and should be interpreted with caution. An asterisk indicates that an estimate is based on a very small number (less than 25) of unweighted cases and has been suppressed.

87
Figure 8.3.A Proportion of HIV-positive adults aged 15 years and older self-reporting awareness of HIV status and antiretroviral therapy status, by age and sex, THIS 2016-2017
Estimates based on <25 observations have been suppressed
8.4 Concordance of Self-Reported Treatment Status Versus Laboratory ARV Data The THIS determined the presence of three ARVs in blood (efavirenz, lopinavir, and nevirapine) as markers of first- and second-line regimes prescribed in the country at the time of the survey. Overall, ARVs were detected in 54.6% of HIV-positive adults aged 15 years and older. Among those previously diagnosed and who reported current use of ART, ARVs were detected in 94.9% of adults (92.8% of males and 95.7% of females). Among those who reported a previous HIV diagnosis, but not on ART, 10.0% had an ARV detected in the blood (7.3% of males and 12.4% of females). Among those who reported no previous HIV diagnosis, 9.7% had an ARV detected in the blood (4.8% among males and 12.8% among females) (Tables 8.4.A, 8.4.B and 8.4.C).

88
Table 8.4.A Concordance of self-reported treatment status versus presence of antiretrovirals (ARVs): Males Percent distribution of HIV-positive males aged 15 years and older by presence of detectable ARVs versus self-reported HIV treatment status, THIS 2016-2017 ARVs1
Characteristic Not detectable Detectable Total Number Self-reported treatment status
Not previously diagnosed 95.2 4.8 100.0 270 Previously diagnosed, not on ART2 (92.7) (7.3) (100.0) 33 Previously diagnosed, on ART 7.2 92.8 100.0 205
Total 15-24 (67.6) (32.4) (100.0) 26 Total 15-49 59.0 41.0 100.0 401 Total 50+ 44.3 55.7 100.0 148 Total 15+ 55.5 44.5 100.0 549 1Antiretroviral detection assay included only atazanavir, efavirenz, and lopinavir. Participants who reported antiretroviral therapy use and/or had undetectable viral load but had no evidence of the first three ARVs were tested for nevirapine as well. 2ART: Antiretroviral therapy The sum of the sample sizes for a given classification may be less than the total sample size because of missing responses to the classification variable. Estimates in parentheses are based on a small number (25 to 49) of unweighted cases and should be interpreted with caution.
Table 8.4.B Concordance of self-reported treatment status versus presence of antiretrovirals (ARVs): Females Percent distribution of HIV-positive females aged 15 years and older by presence of detectable ARVs versus self-reported HIV treatment status, THIS 2016-2017 ARVs1
Characteristic Not detectable Detectable Total Number Self-reported diagnosis and treatment status
Not previously diagnosed 87.2 12.8 100.0 480 Previously diagnosed, not on ART2 87.6 12.4 100.0 51 Previously diagnosed, on ART 4.3 95.7 100.0 557
Total 15-24 50.7 49.3 100.0 140 Total 15-49 41.1 58.9 100.0 999 Total 50+ 36.2 63.8 100.0 221 Total 15+ 40.2 59.8 100.0 1,220 1Antiretroviral detection assay included only atazanavir, efavirenz, and lopinavir. Participants who reported antiretroviral therapy use and/or had undetectable viral load but had no evidence of the first three ARVs were tested for nevirapine as well. 2ART: Antiretroviral therapy The sum of the sample sizes for a given classification may be less than the total sample size because of missing responses to the classification variable.

89
Table 8.4.C Concordance of self-reported treatment status versus presence of antiretrovirals (ARVs): Total Percent distribution of HIV-positive persons aged 15 years and older by presence of detectable ARVs versus self-reported HIV treatment status, THIS 2016-2017 ARVs1
Characteristic Not detectable Detectable Total Number Self-reported diagnosis and treatment status
Not previously diagnosed 90.3 9.7 100.0 750 Previously diagnosed, not on ART2 90.0 10.0 100.0 84 Previously diagnosed, on ART 5.1 94.9 100.0 762
Total 15-24 54.4 45.6 100.0 166 Total 15-49 47.0 53.0 100.0 1,400 Total 50+ 39.5 60.5 100.0 369 Total 15+ 45.4 54.6 100.0 1,769 1Antiretroviral detection assay included only nevirapine, efavirenz, and lopinavir. 2ART: Antiretroviral therapy The sum of the sample sizes for a given classification may be less than the total sample size because of missing responses to the classification variable.
8.5 Gaps and Unmet Needs
8.6 References 1. World Health Organization. Consolidated guidelines on the use of antiretroviral drugs for treating and
preventing HIV infection. Geneva: World Health Organization; 2016. https://www.who.int/hiv/pub/arv/arv-2016/en/. Accessed November 27, 2018. 2. World Health Organization. Treat all: policy adoption and implementation status in countries. Geneva: World Health Organization; 2017.
§ There is a gap in reaching and diagnosing people living with HIV, especially males of all ages, and young people aged 15-24 years.
§ Sixty one percent (60.9%) of HIV-positive individuals aged 15-24 years were unaware of their HIV status.

90
9.1 Key Findings
9.2 Background Viral load suppression is a key indicator of treatment success in HIV-positive individuals. For the purposes of THIS, VLS was defined as VL less than 1,000 HIV RNA copies/mL of plasma. This chapter describes VLS among the population of HIV-positive persons aged 15 years and older by age, sex, region, and other socio-demographic characteristics. 9.3 Adult Viral Load Suppression by Demographic Characteristics Overall, 51.9% of adults aged 15 years and older had VLS (41.5% among males and 57.2% among females). The proportion with VLS was highest among those who reported a previous diagnosis and being on ART (87.8%) and lowest among those who reported a previously diagnosis, but not being on ART (14.2%). Fifteen percent (15.1%) of HIV-positive persons who, by self-report, had reported that they were not previously diagnosed had VLS (Table 9.3.A). About forty-seven percent (46.8%) of never-married HIV-positive persons had VLS; while 51.0% of married or cohabitating persons had VLS. About fifty percent (49.6%) of divorced or separated and 62.1% of widowed persons had VLS (Table 9.3.A).
§ Overall, 51.9% of HIV-positive adults aged 15 years and older, had VLS (41.5% among males and 57.2% among females).
§ The percentage of HIV-positive adults aged 15 years and older with VLS ranged from 32.4% in Geita region to 66.0% in Kagera region.
§ Almost 88% (87.8%) of adults aged 15 years and older on ART had VLS (84.4% of males and 89.1% of females).
§ Adolescents and young adults aged 15-24 years had comparatively lower VLS with 41.5% having a suppressed viral load (22.2% for males and 47.1% for females).
9 VIRAL LOAD SUPPRESSION: ADULTS 9 VIRAL LOAD SUPPRESSION: ADULTS

91
Table 9.3.A Viral load suppression prevalence by demographic characteristics Among HIV-positive persons aged 15 years and older, percentage with viral load suppression (< 1,000 copies/mL)1, by sex, self-reported diagnosis and ART status, and selected demographic characteristics, THIS 2016-2017 Males Females Total
Characteristic Percentage VLS2 Number Percentage
VLS2 Number Percentage VLS2 Number
Self-reported diagnosis and treatment status Not previously diagnosed 8.3 272 19.4 483 15.1 755 Previously diagnosed, not on ART (11.4) 33 16.6 51 14.2 84 Previously diagnosed, on ART 84.4 205 89.1 564 87.8 769 Missing 71.2 53 70.8 169 70.9 222
Residence Urban 42.6 171 60.8 576 56.0 747 Rural 40.9 392 53.4 691 48.4 1,083
Tanzania Mainland/Zanzibar Mainland 41.5 563 57.3 1,259 51.9 1,822
Urban 42.6 171 60.9 572 56.1 743 Rural 40.9 392 53.5 687 48.5 1,079
Zanzibar * 0 * 8 * 8 Unguja * 0 * 7 * 7 Pemba * 0 * 1 * 1
Region Dodoma * 9 * 18 (60.6) 27 Arusha * 3 * 6 * 9 Kilimanjaro * 5 * 11 * 16 Tanga * 11 * 23 (47.2) 34 Morogoro * 8 (51.9) 29 (45.3) 37 Pwani (57.1) 26 65.6 85 63.5 111 Dar es Salaam * 18 48.1 77 44.7 95 Lindi * 0 * 1 * 1 Mtwara * 3 * 6 * 9 Ruvuma (44.9) 41 64.9 70 56.7 111 Iringa (51.1) 39 58.7 116 56.6 155 Mbeya (44.3) 36 62.4 99 57.4 135 Singida * 3 * 10 * 13 Tabora 33.0 71 48.5 97 41.2 168 Rukwa (33.1) 31 48.4 67 42.9 98 Kigoma * 9 * 14 * 23 Shinyanga (32.3) 48 44.9 95 40.1 143 Kagera * 24 (68.9) 33 66.0 57 Mwanza (32.3) 32 59.3 67 49.6 99 Mara * 10 * 24 (63.4) 34 Manyara * 4 * 6 * 10 Njombe (40.5) 25 67.2 81 60.5 106 Katavi (29.3) 45 55.0 117 47.3 162 Simiyu * 11 * 20 (54.3) 31 Geita * 16 (38.4) 29 (32.4) 45 Songwe (60.3) 35 68.0 58 64.6 93 Kaskazini Unguja * 0 * 2 * 2 Kusini Unguja * 0 * 0 * 0 Mjini Magharibi * 0 * 5 * 5 Kaskazini Pemba * 0 * 0 * 0 Kusini Pemba * 0 * 1 * 1

92
Table 9.3.A Viral load suppression prevalence by demographic characteristics (continued) Among HIV-positive persons aged 15 years and older, percentage with viral load suppression (< 1,000 copies/mL)1, by sex, self- reported diagnosis and ART status, and selected demographic characteristics, THIS 2016-2017 Males Females Total
Characteristic Percentage VLS2 Number Percentage VLS2 Number Percentage
VLS2 Number
Marital status Never married (33.7) 44 52.7 124 46.8 168 Married or living together 43.9 412 56.7 613 51.0 1,025 Divorced or separated 29.7 80 55.2 273 49.6 353 Widowed (53.6) 27 63.0 256 62.1 283
Education No education 37.9 86 50.2 281 46.8 367 Pre-Primary * 7 * 6 * 13 Primary 41.9 398 59.8 841 53.7 1,239 Post Primary Training * 8 * 15 * 23 Secondary (O-Level) 42.4 52 54.6 111 50.0 163 Post-Secondary (O-Level) Training * 8 * 9 * 17 Secondary (A-Level) * 1 * 1 * 2 Post-Secondary (A-Level) Training * 1 * 0 * 1 University * 2 * 1 * 3
Wealth quintile Lowest 38.2 118 46.3 213 43.2 331 Second 38.2 131 59.3 218 50.5 349 Middle 43.6 165 62.4 336 55.6 501 Fourth 38.7 97 58.1 293 52.5 390 Highest 52.6 52 56.1 207 55.2 259
Total 15-24 (22.2) 28 47.1 143 41.5 171 Total 15-49 36.1 414 56.0 1,040 49.6 1,454 Total 15+ 41.5 563 57.2 1,267 51.9 1,830 1Relates to Global AIDS Monitoring indicator 1.4: People living with HIV who have suppressed viral loads 2VLS: viral load suppression The sum of the sample sizes for a given classification may be less than the total sample size because of missing responses to the classification variable. Estimates in parentheses are based on a small number (25 to 49) of unweighted cases and should be interpreted with caution. An asterisk indicates that an estimate is based on a very small number (less than 25) of unweighted cases and has been suppressed.
9.4 Adult Viral Load Suppression by Age and Sex Among HIV-positive adults aged 15 years and older, the prevalence of VLS ranged from 37.9% among those aged 15-19 years to 67.9% among those aged 55-59 years. Less than one quarter (22.2%) of males aged 15-24 years had VLS as compared to 58.8% of men aged 50 years and older who had suppressed viral loads. In HIV-positive men, VLS prevalence was lowest (21.5%) among those aged 25-29 years and highest (69.0%) among those aged 55-59 years. Among HIV-positive women, prevalence of VLS was lowest (44.6%) among those aged 25-29 years and highest (67.1%) among those 55-59 years (Tables 9.4.A, 9.4.B, 9.4.C, and 9.4.D; Figure 9.4.A).

93
Table 9.4.A Viral load suppression by age (5-year age groups) Among HIV-positive persons all ages, percentage with viral load suppression (< 1,000 copies/mL)1, by sex and age, THIS 2016-2017 Males Females Total
Age Percentage VLS2 Number Percentage
VLS2 Number Percentage VLS2 Number
0-4 * 5 * 9 * 14 5-9 * 6 * 9 * 15 10-14 * 8 * 7 * 15 15-19 * 9 (45.8) 30 (37.9) 39 20-24 * 19 47.6 113 42.8 132 25-29 (21.5) 47 44.6 158 38.1 205 30-34 28.7 68 55.0 207 47.1 275 35-39 39.1 89 63.4 224 55.8 313 40-44 38.8 113 61.2 175 51.7 288 45-49 55.2 69 61.0 133 59.0 202 50-54 57.1 60 66.9 87 62.7 147 55-59 (69.0) 42 67.1 65 67.9 107 60-64 (39.0) 26 (59.4) 43 52.9 69 65-69 * 9 * 16 (58.7) 25 70-74 * 4 * 11 * 15 75-79 * 6 * 1 * 7 ≥80 * 2 * 4 * 6 Total 15-24 (22.2) 28 47.1 143 41.5 171 Total 15-49 36.1 414 56.0 1,040 49.6 1,454 Total 50+ 58.8 149 62.5 227 61.0 376 Total 15-64 41.2 542 57.5 1,235 52.0 1,777 Total 15+ 41.5 563 57.2 1,267 51.9 1,830 1Relates to Global AIDS Monitoring indicator 1.4: People living with HIV who have suppressed viral loads 2VLS: viral load suppression Estimates in parentheses are based on a small number (25 to 49) of unweighted cases and should be interpreted with caution. An asterisk indicates that an estimate is based on a very small number (less than 25) of unweighted cases and has been suppressed.

94
Table 9.4.B Viral load suppression by age (10-15 Year age groups), United Republic of Tanzania Among HIV-positive persons, percentage with viral load suppression (< 1,000 copies/mL)1, by sex and age, THIS 2016-2017 Males Females Total
Age Percentage VLS2 Number Percentage
VLS2 Number Percentage VLS2 Number
0-14 * 19 11.7 25 18.4 44 15-24 22.2 28 47.1 143 41.5 171 25-34 25.7 115 50.5 365 43.3 480 35-44 38.9 202 62.5 399 53.9 601 45-54 56.0 129 63.2 220 60.5 349 55-64 61.5 68 64.4 108 63.3 176 65+ * 21 42.9 32 46.6 53 1Relates to Global AIDS Monitoring indicator 1.4: People living with HIV who have suppressed viral loads 2VLS: viral load suppression Estimates in parentheses are based on a small number (25 to 49) of unweighted cases and should be interpreted with caution An asterisk indicates that an estimate is based on a very small number (less than 25) of unweighted cases and has been suppressed.
Table 9.4.C Viral load suppression by age (10-to-15-year age groups), Zanzibar Among HIV-positive persons all ages, percentage with viral load suppression (< 1,000 copies/mL)1, by sex and age, in Zanzibar, THIS 2016-2017 Males Females Total
Age Percentage VLS2 Number Percentage
VLS2 Number Percentage VLS2 Number
0-14 * 0 * 0 * 0 15-49 * 0 * 7 * 7 50+ * 0 * 1 * 1 15-64 * 0 * 8 * 8 15+ * 0 * 8 * 8 1Relates to Global AIDS Monitoring indicator 1.4: People living with HIV who have suppressed viral loads 2VLS: viral load suppression Estimates in parentheses are based on a small number (25 to 49) of unweighted cases and should be interpreted with caution. An asterisk indicates that an estimate is based on a very small number (less than 25) of unweighted cases and has been suppressed

95
Table 9.4.D Viral load suppression by age (10- to 15-year age groups), Mainland
Among HIV-positive persons all ages percentage with viral load suppression (< 1,000 copies/mL)1, by sex and age, in Tanzania mainland, THIS 2016-2017 Males Females Total
Age Percentage VLS2 Number Percentage
VLS2 Number Percentage VLS2 Number
0-14 * 19 (11.7) 25 (18.4) 44 15-49 36.1 414 56.2 1,033 49.7 1,447 50+ 58.8 149 62.3 226 60.9 375 15-64 41.2 542 57.6 1,227 52.1 1,769 15+ 41.5 563 57.3 1,259 51.9 1,822 1Relates to Global AIDS Monitoring indicator 1.4: People living with HIV who have suppressed viral loads 2VLS: viral load suppression Estimates in parentheses are based on a small number (25 to 49) of unweighted cases and should be interpreted with caution An asterisk indicates that an estimate is based on a very small number (less than 25) of unweighted cases and has been suppressed.
Figure 9.4.A Proportion of viral load suppression (<1000 copies/mL) among people living with HIV, by age and sex, THIS 2016-2017
Estimates based on <25 observations have been suppressed

96
9.5 Adult Viral Load Suppression by Region Among HIV-positive adults, aged 15 years and older, regional prevalence of VLS ranged between 32.4% in Geita and 66% in Kagera. Pwani and Kagera had the highest proportion of adults with VLS at 63.5% and 66%, respectively. (Although some other regions, such as Lindi, had higher VLS- the numbers of PLHIV in those regions were too low for the estimate of VLS to be reliable). Shinyanga (40.1%) and Geita (32.4%) had the lowest VLS relative to other regions. Figure 9.5.A Viral load suppression (<1000 copies/mL) among HIV-positive adults aged 15 years and older, by region, THIS 2016-2017
A star indicates that estimate is based on <25 observations and should be interpreted with caution; Estimates in parentheses are based on 25-49 observations and should be interpreted with caution. A double star (**) indicates that the region had no HIV-positive samples with which to estimate viral load suppression.

97
Figure 9.5.B Viral load suppression (<1000 copies/mL) among HIV-positive adults aged 15 years and older), by region, THIS 2016-2017
Estimates based on <25 observations have been suppressed; Kusini Unguja and Kaskazini Pemba had no HIV-positive samples with which to estimate viral load suppression. 9.6 Gaps and Unmet Needs
§ Almost half (48.1%) of adults aged 15 years and older who are living with HIV in the country do not have suppressed viral loads.
§ About 58% of adolescents and young adults aged 15-24 years do not have suppressed viral loads.

98
10.1 Key Findings
10.2 Background In order to bring the HIV epidemic under control, UNAIDS has set ambitious targets referred to as 90-90-90: that is by 2020; 90% of all PLHIV will know their HIV status; 90% of all persons with diagnosed HIV infection will receive sustained ART; and 90% of all persons receiving ART will have VLS.1 The previous chapters on HIV testing and treatment provide results on coverage of HIV testing and treatment services, while VLS among all HIV-positive individuals is a measure of program impact, irrespective of knowledge of status or being on treatment. This chapter presents the status of the 90-90-90 indicators, which indicate signals of HIV program performance. Awareness of HIV-positive status and treatment status among those aware of their HIV-positive status are indicators of access to services. Viral load suppression among those aware of their HIV status and on treatment not only provides an indication of access to and retention in care, but also when compared to VLS among all HIV-positive individuals, provides a measure of program success. Viral load suppression among all HIV-positive individuals of 73% (90 x 90 x 90) or greater is an indication of successful testing and treatment services. The 90-90-90 results in this chapter have been presented in two ways. First, Table 10.3.A uses only self-reported awareness and ARV status. Individuals are defined as ‘aware’ of their HIV-positive status if they self-reported an HIV-positive status before testing as part of THIS. Individuals were defined as ‘on treatment’ if they self-reported ART use. Second, Table 10.3.B measures the 90-90-90 indicators using both self-reported and ARV biomarker data. In this table, ‘aware’ and ‘on treatment’ have been adjusted such that individuals in whom ARVs were detected are classified as ‘aware’ and ‘on treatment’ even if they did not self-report. Individuals are classified as ‘aware’ of their HIV-positive status if they self-reported HIV-positive status and/or had detectable ARVs in their blood. Individuals are classified as ‘on treatment’ if they self-reported that they are taking ART and/or had detectable ARVs in their blood. It is important to note that in both cascades, individuals who have VLS, but are not aware of their HIV-positive status or are not on ARVs, are excluded from the numerator for the third 90 (VLS among those who are aware and on ARVs).
▪ Diagnosis: About 61% (60.6%) of adults 15 years and older living with HIV, know their HIV-positive status as determined by a combination of both self-report and ARV detection in their blood.
▪ On treatment: Of those 15 years of age and older who were aware of their HIV-positive status, 93.6% were on ART based on a combination self-report and ARV detection (89.6% in males and 95.3% in females).
▪ Viral load suppression: Among those 15 years of age and older who were on treatment, 87.0% had suppressed viral loads (83.2% in males and 88.6% in females).
10 UNAIDS 90-90-90 TARGETS: ADULTS

99
10.3 Status of the 90-90-90 Goals 90-90-90 cascade based on self-reported awareness of HIV status and ARV use: Among adults aged 15 years and older living with HIV, 51.8% knew their HIV-positive status (45.2% in males and 55.3% in females) based on self-report of HIV status. Among HIV-positive females, awareness of HIV-positive status was highest (61.5%) among those aged 35-49 years, while in HIV-positive males, awareness of HIV-positive status was highest in those aged 50 years and older (60.7%). Awareness of HIV-positive status was lowest (39.1%) in those aged 15-24 years (35.1% in males and 40.6% in females) (Table 10.3.A). ART status among persons aged 15 years and older who reported awareness of their HIV-positive status varied by age and sex. Overall, 90.8% reported ART use (85.8% in males and 93.0% in females). The proportion of females who were aware of their HIV-positive status and on ART ranged from 88.2% among those aged 15-24 years to 99.1% among those aged 50 years and older. The proportion of males who were aware of their HIV-positive status and on ART ranged from 66.0% among those aged 25-34 years to 94.5% in those aged 50 years and older (Table 10.3.A). Among adults aged 15 years and older who knew their HIV-positive status and are on ART, 87.8% had VLS (84.4% in males and 89.1% in females). Among adults aged 15-49 years, VLS among those who were aware of their HIV-positive status and on ART was higher among females (88.4%) than males (78.8%). Viral load suppression was highest (92.6%) in those aged 50 years and older in both sexes (93.7% for males and 91.8% for females). 90-90-90 cascade based on self-reported awareness of HIV status and ARV use and/or detectable ARVs: ARV-adjusted awareness of HIV-positive status: Among adults aged 15 years and older living with HIV, 60.6% (52.2% of males and 64.9% of females) were classified as aware, according to combined self-reported awareness and/or detectable ARV data (ARV-adjusted awareness). Generally, ARV-adjusted awareness was lowest among males compared to females across all age categories. Among females, ARV-adjusted awareness was greatest in those aged 35-49 years (71.3%) whereas in males, ARV-adjusted awareness was highest among those aged 50 years and older (63.2%). Overall, ARV-adjusted awareness of HIV-positive status was observed in 50.2% of PLHIV aged 15-24 years (35.7% of males and 54.4% of females) (Table 10.3.B). ARV-adjusted treatment status: Based on either self-report ARV status or detectable ARVs, 93.6% of adults aged 15 years and older with ARV-adjusted awareness of status were classified as being on ART. ARV-adjusted awareness of status ranged from 88.3% among those aged 25-34 years to 97.5% among those aged 50 years and older. The greatest disparity by gender was seen in those aged 25-34 years, among whom 76.0% of males and 91.1% of females were on ART (ARV-adjusted treatment status). Viral suppression: Among adults aged 15 years and older who either self-reported ARV use or had detectable ARVs, 87.0% had VLS, which ranged from 83.5% among those aged 15-24 years to 90.7% among those aged 50 years and older. There was a 5%-8% difference in VLS between males and females on ART, in ages 25-34 years and ages 35-49 years, with a greater percentage of VLS seen in females in both these age groups (Table 10.3.B; Figure 10.3.A).

100
Table 10.3.A Adult 90-90-90 (self-reported antiretroviral therapy (ART) status; conditional percentages) 90-90-90 targets among people living with HIV aged 15 years and older, by sex and age, THIS 2016-2017 Diagnosed Males Females Total
Age
Percentage who self-
reported HIV positive
Number Percentage who self-
reported HIV positive
Number Percentage
who self-reported HIV
positive
Number
15-24 (35.1) 27 40.6 121 39.1 148 15-19 * 8 * 24 (36.0) 32 20-24 * 19 41.8 97 40.2 116
25-34 24.6 105 49.6 310 42.0 415
35-49 48.6 237 61.5 463 56.9 700
15-49 40.0 369 54.6 894 49.8 1,263
50+ 60.7 142 58.1 204 59.1 346
15-64 45.3 492 55.9 1,070 52.2 1,562 15+ 45.2 511 55.3 1,098 51.8 1,609
On Treatment
Among males who self-report HIV positive
Among females who self-report HIV positive
Total
Age Percentage who self-
reported ART Number
Percentage who self-
reported ART Number
Percentage who self-
reported ART Number
15-24 * 7 (88.2) 43 87.7 50 15-19 * 2 * 9 * 11 20-24 * 5 (85.7) 34 (84.5) 39
25-34 (66.0) 28 86.9 155 83.2 183
35-49 84.8 110 94.4 293 91.5 403
15-49 81.4 145 91.5 491 88.8 636
50+ 94.5 93 99.1 124 97.2 217
15-64 86.1 228 92.9 603 90.9 831
15+ 85.8 238 93.0 615 90.8 853
Viral Load Suppression (VLS) Among males who
self-report ART Among females who
self-report ART Total
Age Percentage with VLS Number Percentage
with VLS Number Percentage with VLS Number
15-24 * 6 (90.6) 35 (82.3) 41 15-19 * 2 * 8 * 10 20-24 * 4 (89.6) 27 (84.7) 31
25-34 * 16 88.0 136 87.4 152
35-49 80.8 96 88.2 272 86.1 368
15-49 78.8 118 88.4 443 86.1 561
50+ 93.7 87 91.8 121 92.6 208
15-64 84.0 197 89.2 553 87.7 750
15+ 84.4 205 89.1 564 87.8 769 Estimates in parentheses are based on a small number (25 to 49) of unweighted cases and should be interpreted with caution. An asterisk indicates that an estimate is based on a very small number (less than 25) of unweighted cases and has been suppressed.

101
Table 10.3.B Adult 90-90-90 (self-reported antiretroviral therapy (ART) status and/or laboratory antiretroviral (ARV) data, conditional percentages) 90-90-90 targets among people living with HIV aged 15 years and older, by sex and age, THIS 2016-2017 Diagnosed Males Females Total
Age
Percentage who self-reported HIV positive AND/OR with
detectable ARVs1
Number Percentage
who self-reported HIV positive AND/OR with
detectable ARVs1
Number Percentage
who self-reported HIV positive AND/OR with
detectable ARVs1
Number
15-24 (35.7) 27 54.4 140 50.2 167 15-19 * 8 (59.8) 29 (53.9) 37 20-24 * 19 52.6 111 48.8 130 25-34 32.0 112 59.0 350 50.9 462 35-49 58.7 264 71.3 515 66.7 779 15-49 48.8 403 64.7 1,005 59.5 1,408 50+ 63.2 149 65.9 225 64.8 374 15-64 52.4 531 65.3 1,199 60.9 1,730 15+ 52.2 552 64.9 1,230 60.6 1,782
On Treatment
Among males who
self-report HIV positive AND/OR with detectable ARVs
Among females who
self-report HIV positive AND/OR with detectable ARVs
Total
Age
Percentage with detectable
ARVs AND/OR who self-reported
current ARV usage2
Number
Percentage with detectable
ARVs AND/OR who self-reported
current ARV usage2
Number
Percentage with detectable
ARVs AND/OR who self-reported
current ARV usage2
Number
15-24 * 8 93.8 69 92.6 77 15-19 * 3 * 15 * 18 20-24 * 5 91.8 54 90.0 59 25-34 (76.0) 38 91.1 210 88.3 248 35-49 90.6 148 96.3 371 94.4 519 15-49 87.4 194 94.4 650 92.5 844 50+ 94.9 103 99.3 154 97.5 257 15-64 89.9 285 95.2 786 93.7 1,071 15+ 89.6 297 95.3 804 93.6 1,101
Viral Load Suppression (VLS) Among males with detectable
ARVs AND/OR who self-reported current ARV usage
Among females with detectable ARVs AND/OR who self-reported
current ARV usage Total
Age Percentage with VLS Number Percentage
with VLS Number Percentage with VLS Number
15-24 * 7 88.9 63 83.5 70 15-19 * 3 * 14 * 17 20-24 * 4 (91.5) 49 87.8 53 25-34 (84.1) 26 89.1 192 88.3 218 35-49 79.8 137 87.9 353 85.4 490 15-49 78.8 170 88.4 608 86.0 778 50+ 93.0 97 89.2 151 90.7 248 15-64 83.0 257 88.5 742 87.0 999 15+ 83.2 267 88.6 759 87.0 1,026 1Relates to Global AIDS Monitoring indicator (GAM) 1.1: People living with HIV who know their HIV status and PEPFAR Indicator DIAGNOSED_NAT; 2Relates to GAM 1.2: People living with HIV on antiretroviral therapy and PEPFAR TX_CURR_NAT / SUBNAT; 3Relates to GAM 1.4: People living with HIV who have suppressed viral loads and PEPFAR VL_SUPPRESSION_NAT. Estimates in parentheses are based on a small number (25 to 49) of unweighted cases and should be interpreted with caution. An asterisk indicates that an estimate is based on a very small number (less than 25) of unweighted cases and has been suppressed.

102
Figure 10.3.A Adult 90-90-90 (adjusted for laboratory antiretroviral data1 among adults aged 15 years and older), THIS 2016-2017
1In the antiretroviral (ARV)-adjusted 90-90-90 participants are classified as ‘Aware’ or ‘Diagnosed’ if they self-reported HIV positive before testing HIV positive in THIS and/or had detectable ARVs in their blood. Participants are classified as ‘On Treatment’ if they self-reported that they were on treatment and/or if they had detectable ARVs in their blood. *Inset numbers are conditional proportions. 10.4 Gaps and Unmet Needs
10.5 References 1. Joint United Nations Programme on HIV/AIDS. 90-90-90. An ambitious treatment target to help end the
AIDS epidemic. Geneva: UNAIDS; 2014.
§ Only 61% of PLHIV are aware of their status. § A gender gap is apparent for each of the three 90’s. In comparison to men, a greater proportion of
women were diagnosed (52.2% and 64.9%), on treatment (89.6% and 95.3%), with suppressed viral loads (83.2% and 88.6%).
§ A large proportion (39.4%) of people living with HIV aged 15 years and older do not know their HIV-positive status based on self-report and ARV detection; the gap was the largest among those aged 15-24 years and males.
§ There is still a gap in the number of HIV-positive individuals not initiated on ART. This is highest among males aged 25-34 years, among whom 24% of those already diagnosed were not receiving ART based on ARV adjusted measures.
§ Although VLS is high among those on ARV, overall VLS among all PLHIV was 41.5% in males aged 15 years and older. This was even lower in the group aged 15-24 years (22.2% in males and 47.1% in females).
§ Age groups also varied in each of the 90’s and provide insight for programmatic focus. For example, only half of those aged 15-24 years (50.2%) living with HIV were aware of their status of which 92.6% were on treatment; and 83.5% had suppressed viral loads.

103
11.1 Key Findings
11.2 Background The quality of HIV care is based on key principles of accessibility, efficiency, and safety. As countries implement treatment for all PLHIV, ensuring a sustainable health system that is people-centered and innovative requires diligent monitoring and responsiveness.1 It is vital to assess indicators that show the potential impact of HIV on overall morbidity and mortality as well as HIV program effectiveness. The distribution of CD4 counts reflects population health, and indicates the stage of HIV disease progression (immunosuppression level) among PLHIV. Treating PLHIV at higher CD4 counts improves immune recovery, decreases the incidence of non-AIDS events, comorbidities, and mortality, and reduces transmission. Diagnosis of HIV at late stage of disease indicated by low CD4 count may reflect barriers and/or challenges in the ability of our program to reach PLHIV prior to disease progression and point to gaps in implementing “Test and Treat” strategy. Retention on ART, which reduces immunosuppression (i.e., increases CD4 counts), can provide evidence of program coverage and quality of care. Finally, the measurement of transmitted drug resistance allows optimization of national ART guidelines, including second- and third-line regimens. This survey, therefore, provides a unique opportunity to gauge progress in the expansion of HIV clinical services in Tanzania and identify gaps and future challenges. This chapter describes the distribution of immunosuppression (CD4 count <500 cells/microliter [μL]) among THIS participants by socio-demographic characteristics—age, sex, marital status, residence, and self-reported HIV status and ART use. The chapter also covers the distribution of HIV late diagnosis, retention on ART, and HIV drugs resistance prevalence by socio-demographic characteristics. 11.3 CD4 Counts and Immunosuppression Overall, among HIV-positive persons aged 15 years and older, the median CD4 count was 423 cells/ μL Table 11.3.A. The median CD4 count was lower among males (359 cells/μL compared to females (464 cells/μL). The proportion with immunosuppression was 61.8% among all HIV-positive persons aged 15 years and older (73.8% of males, 55.7% of females). By age, median CD4 is higher among the younger age groups (ages 15-24 years), with those aged 20-24 years having the highest at a median CD4 of 551 cells/μL. Additionally, HIV-positive males had higher prevalence of immunosuppression when compared to their female counterparts across all age groups. In males, those aged 45-49 years were the least immunosuppressed with approximately two-thirds of
11 CLINICAL PERSPECTIVES ON PEOPLE LIVING WITH HIV: ADULTS
§ The proportion with immunosuppression (CD4 counts less than 500 cells/µL) was 61.8% among all HIV-positive individuals aged 15 years and older (73.8% in males, 55.7% in females).
§ Median CD4 cell count among individuals who have not been previously diagnosed with HIV was 388 cells/µL compared to 420 cells/µL and 467 cells/µL in those previously diagnosed but not on treatment and those diagnosed and receiving treatment, respectively.
§ Among adults aged 15 years and older living with HIV who had not been diagnosed, 21.6% of males and 18.5% of females had severe immunosuppression with CD4 count less than 200 cells/μl.

104
participants in this age group with immunosuppression (66.5%). Among HIV-positive women, those aged 20-24 years had the least immunosuppression (39.3%). Prevalence of immunosuppression overall was lowest among those aged 20-24 years at forty-four percent (44.1%) and highest among those aged 60-64 years at 72.6% (87.4% in men, 65.7% in women). Among HIV-positive persons aged 15 years and older, the median CD4 count was 422 cells/μL and 424 cells/μL for urban and rural areas, respectively. The median CD4 count was lower among males (389 cells/μL) compared to females (438 cells/μL in the urban areas. It was also lower among males (343 cells/μL) compared to females (482 cells/μL) in the rural areas. Females who reported being married or living together had the lowest proportion (49.7%) of immunosuppression as compared to females who reported other marital status. Males who have never married (84.7%) or divorced (85.5%) had higher proportions of immunosuppression as compared to males who were married or living together (70.4%) or widowed (71.9%). Median CD4 count varied by HIV self-reported diagnosis and ART use status; the highest median CD4 count (467 cells/μL) was among those who were previously diagnosed and on ART. Among those who reported no previous HIV diagnosis, males (80.1%) had higher proportion of immunosuppression as compared to females (61.4%).

105
Table 11.3.A M
edian CD4 coun
t and prevalence of imm
unosuppression
Among HIV-positive persons aged 15 years and older, m
edian (Q1, Q
3) CD4 count and percentage with im
munosuppression (<500 cells/μL), by sex, self-reported diagnosis and ART status, and selected
demographic characteristics, THIS 2016-2017
M
ales
Females
Total
Characteristic M
edian (Q
1, Q3)
Percentage < 500 cells/μL
Number
M
edian (Q
1, Q3)
Percentage < 500 cells/μL
Number
M
edian (Q
1, Q3)
Percentage < 500 cells/μL
Number
Self-reported diagnosis and treatm
ent status
Not previously diagnosed 334 (229, 461)
80.1 270
428 (252, 593)
61.4 481
388 (239, 547)
68.7 751
Previously diagnosed, not on ART 414 (190, 640)
(58.9) 32
429 (315, 641)
63.0 51
420 (288, 643)
61.1 83
Previously diagnosed, on ART 406 (271, 565)
64.6 204
493 (352, 673)
50.6 564
467 (328, 644)
54.6 768
Missing
300 (237, 431) 82.7
53
450 (290, 673) 54.3
168
421 (273, 584) 62.4
221
R
esidence
Urban 389 (248, 493)
75.3 169
438 (312, 630)
59.0 575
422 (290, 597)
63.3 744
Rural 343 (238, 521)
72.9 390
482 (311, 656)
52.3 689
424 (266, 603)
60.5 1,079
Tanzania Mainland/Zanzibar
M
ainland 359 (241, 508)
73.8 559
464 (311, 643)
55.8 1,256
422 (277, 602)
61.8 1,815
Urban 389 (248, 493)
75.3 169
438 (311, 630)
59.0 571
422 (290, 597)
63.2 740
Rural 343 (238, 521)
72.9 390
481 (310, 655)
52.4 685
423 (266, 603)
60.6 1,075
Zanzibar *
* 0
*
* 8
*
* 8
Unguja *
* 0
*
* 7
*
* 7
Pemba
* *
0
* *
1
* *
1
R
egion
Dodoma
* *
9
* *
18
278 (195, 463) (74.9)
27 Arusha
* *
3
* *
6
* *
9 Kilim
anjaro *
* 5
*
* 11
*
* 16
Tanga *
* 11
*
* 23
415 (284, 658)
(60.1) 34
Morogoro
* *
8
396 (200, 535) (68.5)
29
378 (202, 498) (73.4)
37 Pw
ani 463 (397, 620)
(65.9) 26
546 (320, 697)
45.8 85
498 (360, 683)
50.8 111
Dar es Salaam
* *
17
432 (309, 590) 60.0
77
428 (308, 576) 61.9
94 Lindi
* *
0
* *
1
* *
1 M
twara
* *
3
* *
6
* *
9 Ruvum
a 390 (263, 545)
(67.1) 41
491 (375, 655)
51.0 69
463 (295, 614)
57.7 110
Iringa 344 (232, 447)
(80.8) 39
451 (288, 616)
54.5 116
410 (252, 593)
61.7 155
Mbeya
331 (195, 382) (87.5)
35
447 (249, 601) 64.7
98
372 (225, 530) 71.0
133 Singida
* *
3
* *
10
* *
13 Tabora
390 (284, 511) 71.4
71
436 (258, 626) 60.2
96
421 (275, 550) 65.6
167 Rukw
a 282 (183, 568)
(63.5) 31
542 (349, 702)
46.5 67
480 (257, 650)
52.6 98
Kigoma
* *
9
* *
14
* *
23 Shinyanga
411 (227, 585) (59.4)
48
446 (313, 648) 60.4
95
430 (281, 628) 60.0
143 Kagera
* *
24
537 (375, 702) (44.2)
33
527 (335, 700) 47.8
57 M
wanza
369 (197, 497) (74.2)
32
489 (342, 660) 50.6
67
445 (293, 603) 59.1
99 M
ara *
* 9
*
* 24
489 (346, 692)
(49.5) 33
Manyara
* *
4
* *
6
* *
10

106
Table 11.3.A M
edian CD4 coun
t and prevalence of imm
unosuppression (continued)
Among HIV-positive persons aged 15 years and older, m
edian (Q1, Q
3) CD4 count and percentage with im
munosuppression (<500 cells/μL), by sex, self-reported diagnosis and ART status, and selected
demographic characteristics, THIS 2016-2017
Characteristic M
ales
Females
Total
Median
(Q1, Q
3) Percentage
< 500 cells/μL Num
ber
Median
(Q1, Q
3) Percentage
< 500 cells/μL Num
ber
Median
(Q1, Q
3) Percentage
< 500 cells/μL Num
ber
Region (continued)
Njom
be *
* 24
427 (323, 581)
61.2 81
416 (304, 581)
63.0 105
Katavi 318 (207, 454)
(80.1) 45
456 (311, 631)
56.6 117
421 (287, 596)
63.6 162
Simiyu
* *
11
* *
20
346 (271, 573) (67.4)
31 Geita
* *
16
426 (369, 638) (58.2)
29
388 (259, 584) (66.5)
45 Songw
e 322 (220, 456)
(79.0) 35
453 (314, 602)
55.6 58
419 (243, 579)
65.7 93
Kaskazini Unguja
* *
0
* *
2
* *
2 Kusini Unguja
* *
0
* *
0
* *
0 M
jini Magharibi
* *
0
* *
5
* *
5 Kaskazini Pem
ba *
* 0
*
* 0
*
* 0
Kusini Pemba
* *
0
* *
1
* *
1
M
arital status
Never married
369 (205, 458) (84.7)
43
423 (291, 588) 62.1
123
416 (279, 546) 68.9
166 M
arried or living together 371 (248, 552)
70.4 409
499 (314, 668)
49.7 612
427 (283, 620)
58.8 1,021
Divorced or separated 311 (190, 426)
85.5 80
439 (342, 610)
62.9 272
420 (278, 577)
68.0 352
Widow
ed 358 (184, 568)
(71.9) 27
440 (266, 628)
58.3 256
425 (262, 628)
59.7 283
Education
No education
324 (169, 476) 76.5
86
432 (250, 641) 59.6
280
395 (239, 613) 64.3
366 Pre-Prim
ary *
* 7
*
* 6
*
* 13
Primary
363 (247, 538) 72.1
396
477 (325, 646) 54.4
840
429 (291, 607) 60.4
1,236 Post Prim
ary Training *
* 8
*
* 15
*
* 23
Secondary (O-Level)
358 (288, 455) 82.2
50
467 (308, 638) 53.8
110
423 (295, 581) 64.3
160 Post-Secondary (O
-Level) Training *
* 8
*
* 9
*
* 17
Secondary (A-Level) *
* 1
*
* 1
*
* 2
Post-Secondary (A-Level) Training *
* 1
*
* 0
*
* 1
University *
* 2
*
* 1
*
* 3
Wealth
quintile
Lowest
345 (273, 503) 74.7
117
499 (286, 648) 49.7
213
430 (281, 605) 59.2
330 Second
331 (234, 542) 70.9
131
473 (343, 673) 55.1
218
424 (267, 588) 61.7
349 M
iddle 372 (239, 510)
73.3 163
473 (312, 675)
53.3 334
425 (266, 626)
60.5 497
Fourth 333 (165, 468)
79.3 96
444 (307, 631)
58.7 292
409 (260, 582)
64.6 388
Highest 427 (297, 519)
70.0 52
431 (310, 605)
60.0 207
431 (308, 589)
62.3 259

107
Table 11.3.A M
edian CD4 coun
t and prevalence of imm
unosuppression (continued)
Among HIV-positive persons aged 15 years and older, m
edian (Q1, Q
3) CD4 count and percentage with im
munosuppression (<500 cells/μL), by sex, self-reported diagnosis and ART status, and selected
demographic characteristics, THIS 2016-2017
M
ales
Females
Total
Characteristic M
edian (Q
1, Q3)
Percentage < 500 cells/μL
Number
M
edian (Q
1, Q3)
Percentage < 500 cells/μL
Number
M
edian (Q
1, Q3)
Percentage < 500 cells/μL
Number
Age
15-19
* *
9
546 (430, 636) (41.4)
30
482 (415, 582) (51.4)
39 20-24
* *
18
597 (418, 797) 39.3
111
551 (359, 715) 44.1
129 25-29
390 (295, 497) (75.3)
47
440 (335, 628) 56.3
158
428 (314, 617) 61.6
205 30-34
384 (221, 480) 77.9
68
494 (309, 690) 50.1
207
439 (277, 601) 58.4
275 35-39
354 (239, 543) 70.6
87
480 (306, 645) 54.5
224
431 (279, 619) 59.4
311 40-44
330 (199, 435) 79.1
113
422 (289, 594) 62.5
174
372 (245, 568) 69.5
287 45-49
368 (193, 551) 66.5
69
396 (240, 594) 61.2
133
379 (239, 593) 63.1
202 50-54
322 (213, 499) 72.0
60
444 (278, 605) 60.3
87
416 (244, 587) 65.3
147 55-59
383 (281, 499) (73.9)
42
425 (367, 576) 61.8
65
416 (346, 556) 66.9
107 60-64
434 (274, 467) (87.4)
26
420 (209, 587) (65.7)
43
433 (267, 512) 72.6
69 65-69
* *
8
* *
16
* *
24 70-74
* *
4
* *
11
* *
15 75-79
* *
6
* *
1
* *
7 ≥80
* *
2
* *
4
* *
6
Total 15-24
369 (222, 547) (68.3)
27
568 (423, 750) 39.9
141
546 (369, 689) 46.2
168 Total 15-49
355 (237, 513) 73.8
411
475 (313, 663) 54.0
1,037
426 (280, 609) 60.4
1,448 Total 50+
375 (249, 498) 73.9
148
424 (280, 591) 63.2
227
414 (270, 575) 67.5
375 Total 15+
359 (241, 508) 73.8
559
464 (311, 643) 55.7
1,264
423 (278, 602) 61.8
1,823 Estim
ates in parentheses are based on a small num
ber (25 to 49) of unweighted cases and should be interpreted w
ith caution. An asterisk indicates that an estim
ate is based on a very small num
ber (less than 25) of unweighted cases and has been suppressed.
The sum of the sam
ple sizes for a given classification may be less than the total sam
ple size because of missing responses to the classification variable.
The interquartile range (IQR) is a m
easure of variability, based on dividing a dataset into quartiles. Quartiles divide a rank-ordered dataset into four equal parts. The values that divide each part are called
the first, second, and third quartiles; and they are denoted by Q1, Q
2, and Q3, respectively.

108
Figure 11.3.A CD4 count distribution among HIV-positive adults aged 15 years and older, by antiretroviral therapy status, THIS 2016-2017
11.4 Late HIV Diagnosis Among HIV-positive adults aged 15 years and older who were unaware of their status (that is, they self-reported being HIV negative or never tested and with no detectable ARVs), 45.1% had a CD4 count less than 350 cells/μL (54.6% of males and 38.4% of females) and 19.8% had a CD4 count less than 200 cells/μL (21.6% of males and 18.5% of females). Likewise, prevalence of severe immunosuppression with CD4 counts less than 200 cells/μL peaked among those residing in rural areas (21.5%), those in the fourth wealth quintile (24.7%), and those aged 45-49 years (38.3%) (Table 11.4.A).

109
Table 11.4.A Late HIV diagnosis Among persons aged 15 years and older who tested HIV positive in THIS, but self-reported HIV negative and with no detectable ARVs, percentage who had a CD4 cell count < 200 cells/mL and < 350 cells/mL by sex, self-reported diagnosis and selected demographic characteristics, THIS 2016-2017 Males Females Total
Characteristic Percentage
< 200 cells/μl1
Percentage < 350
cells/μl1 Number
Percentage < 200
cells/μl1
Percentage < 350
cells/μl1 Number
Percentage < 200
cells/μl1
Percentage < 350
cells/μl1 Number
Residence Urban 15.9 43.6 71 18.1 39.1 174 17.3 40.7 245 Rural 24.7 60.6 182 18.9 37.8 251 21.5 48.2 433
Tanzania Mainland/Zanzibar Mainland 21.6 54.6 253 18.7 38.7 420 19.9 45.3 673
Urban 15.9 43.6 71 18.3 39.4 172 17.4 40.9 243 Rural 24.7 60.6 182 19.0 38.1 248 21.6 48.4 430
Zanzibar * * 0 * * 5 * * 5 Unguja * * 0 * * 5 * * 5 Pemba * * 0 * * 0 * * 0
Region Dodoma * * 5 * * 5 * * 10 Arusha * * 2 * * 3 * * 5 Kilimanjaro * * 3 * * 1 * * 4 Tanga * * 3 * * 10 * * 13 Morogoro * * 5 * * 9 * * 14 Pwani * * 7 * * 21 (3.0) (33.3) 28 Dar es Salaam * * 9 (25.1) (36.1) 32 (25.2) (33.2) 41 Lindi * * 0 * * 0 * * 0 Mtwara * * 2 * * 1 * * 3 Ruvuma * * 19 * * 15 (20.9) (50.2) 34 Iringa * * 9 (30.5) (38.1) 30 (31.1) (47.4) 39 Mbeya * * 15 (39.5) (77.8) 26 (33.9) (67.9) 41 Singida * * 2 * * 4 * * 6 Tabora (14.0) (46.3) 42 (18.2) (47.3) 44 15.9 46.7 86 Rukwa * * 16 (3.2) (18.3) 27 (9.6) (30.9) 43 Kigoma * * 4 * * 4 * * 8 Shinyanga (30.1) (46.5) 25 (11.3) (37.7) 46 18.9 41.3 71 Kagera * * 6 * * 8 * * 14 Mwanza * * 17 * * 24 (19.5) (37.8) 41 Mara * * 2 * * 10 * * 12 Manyara * * 2 * * 1 * * 3 Njombe * * 10 * * 18 (19.9) (40.4) 28 Katavi * * 22 (11.0) (26.8) 42 19.4 42.8 64 Simiyu * * 3 * * 9 * * 12 Geita * * 10 * * 15 (13.7) (44.9) 25 Songwe * * 13 * * 15 (16.5) (41.9) 28 Kaskazini Unguja * * 0 * * 1 * * 1 Kusini Unguja * * 0 * * 0 * * 0 Mjini Magharibi * * 0 * * 4 * * 4 Kaskazini Pemba * * 0 * * 0 * * 0 Kusini Pemba * * 0 * * 0 * * 0
Marital status Never married (5.8) (31.4) 29 (19.4) (31.5) 44 13.7 31.5 73 Married or living together 20.5 55.4 181 15.3 39.6 212 17.9 47.6 393 Divorced or separated (35.3) (67.0) 37 20.7 36.4 98 25.2 45.8 135 Widowed * * 6 24.4 42.6 71 26.6 44.5 77
Education No education (31.3) (56.9) 49 27.4 44.1 113 28.7 48.2 162 Pre-Primary * * 3 * * 3 * * 6 Primary 19.2 53.3 165 14.3 37.7 265 16.3 44.2 430 Post Primary Training * * 3 * * 5 * * 8 Secondary (O-Level) (16.9) (52.6) 29 (18.9) (29.3) 35 17.9 40.9 64 Post-Secondary (O-Level)
Training * * 2 * * 3 * * 5
Secondary (A-Level) * * 1 * * 0 * * 1 Post-Secondary (A-Level)
Training * * 0 * * 0 * * 0
University * * 1 * * 0 * * 1

110
Table 11.4.A Late HIV diagnosis (continued) Among persons aged 15 years and older who tested HIV positive in THIS, but self-reported HIV negative and with no detectable ARVs, percentage who had a CD4 cell count < 200 cells/mL and < 350 cells/mL by sex, self-reported diagnosis and selected demographic characteristics, THIS 2016-2017 Males Females Total
Characteristic Percentage
< 200 cells/μl1
Percentage < 350
cells/μl1 Number
Percentage < 200
cells/μl1
Percentage < 350
cells/μl1 Number
Percentage < 200
cells/μl1
Percentage < 350
cells/μl1
Number
Wealth quintile Lowest 19.9 56.5 64 15.5 36.5 89 17.5 45.4 153 Second 23.5 65.7 55 18.1 39.8 79 20.6 51.5 134 Middle 18.8 50.3 78 16.9 41.1 96 17.9 45.7 174 Fourth (30.8) (58.9) 36 21.5 40.6 97 24.7 47.0 133 Highest * * 20 19.6 33.4 64 17.4 33.1 84
Age 15-19 * * 5 * * 14 * * 19 20-24 * * 14 6.5 13.9 56 6.9 24.9 70 25-29 (7.6) (45.5) 33 13.2 33.8 58 10.9 38.6 91 30-34 (21.4) (42.9) 41 21.1 47.7 82 21.3 45.7 123 35-39 (16.0) (52.4) 44 18.0 39.0 59 17.2 44.5 103 40-44 (25.1) (77.5) 45 17.5 37.7 53 21.2 57.2 98 45-49 (35.6) (46.1) 26 (40.5) (58.0) 32 38.3 52.7 58 50-54 * * 20 * * 20 (33.6) (56.8) 40 55-59 * * 9 * * 20 (23.7) (41.7) 29 60-64 * * 8 * * 18 (13.0) (45.1) 26 65-69 * * 5 * * 4 * * 9 70-74 * * 1 * * 5 * * 6 75-79 * * 2 * * 1 * * 3 ≥80 * * 0 * * 3 * * 3
Total 15-24 * * 19 6.1 12.9 70 6.0 21.8 89 Total 15-49 18.7 52.3 208 17.8 37.0 354 18.2 43.3 562 Total 50+ (34.4) (64.8) 45 21.7 44.9 71 26.9 53.1 116 Total 15+ 21.6 54.6 253 18.5 38.4 425 19.8 45.1 678 1Relates to Global AIDS Monitoring indicator 1.5: Late HIV diagnosis The sum of the sample sizes for a given classification may be less than the total sample size because of missing responses to the classification variable. Estimates in parentheses are based on a small number (25 to 49) of unweighted cases and should be interpreted with caution. An asterisk indicates that an estimate is based on a very small number (less than 25) of unweighted cases and has been suppressed.
11.5 Retention on Antiretroviral Therapy Among PLHIV aged 15 years and older who self-reported ART initiation less than 12 months prior to the survey, 100% of all males and females reported that they were still taking ART at the time of the survey (Table 11.5.A). Among PLHIV aged 15 years and older who self-reported initiating ART 12 months or more prior to the survey, 99.7% reported that they were still taking ART at the time of the survey. This was nearly identical between men and women (99.4% and 99.8% respectively). There was little variation by geographic or socio demographic characteristics. Nearly all (99.8%) PLHIV with detectable ARVs reported they were still on ART. Almost ninety-seven percent (96.8%) of people with no detectable ARVs also reported they were still on ARVs (Table 11.5.B).

111
Table 11.5.A Retention on antiretroviral therapy (ART): people initiating antiretroviral therapy LESS THAN 12 months prior to the survey Among HIV-positive persons aged 15 years and older who self-reported initiating ART less than 12 months prior to the survey, percentage who self-reported still receiving ART, by sex and selected demographic characteristics, THIS 2016-2017 Males Females Total
Characteristic Percentage still receiving ART1 Number Percentage
still receiving ART1 Number Percentage still receiving ART1 Number
Presence of detectable ARVs2
Detectable 100.0 35 100.0 73 100.0 108 Not detectable * 1 * 2 * 3
Residence
Urban * 11 100.0 46 100.0 57 Rural 100.0 25 100.0 31 100.0 56
Tanzania Mainland/Zanzibar
Mainland 100.0 36 100.0 77 100.0 113 Urban * 11 100.0 46 100.0 57 Rural 100.0 25 100.0 31 100.0 56
Zanzibar * 0 * 0 * 0 Unguja * 0 * 0 * 0 Pemba * 0 * 0 * 0
Region
Dodoma * 1 * 0 * 1 Arusha * 0 * 0 * 0 Kilimanjaro * 0 * 1 * 1 Tanga * 0 * 1 * 1 Morogoro * 0 * 0 * 0 Pwani * 2 * 8 * 10 Dar es Salaam * 2 * 7 * 9 Lindi * 0 * 0 * 0 Mtwara * 0 * 0 * 0 Ruvuma * 5 * 7 * 12 Iringa * 3 * 6 * 9 Mbeya * 2 * 12 * 14 Singida * 0 * 0 * 0 Tabora * 1 * 6 * 7 Rukwa * 4 * 3 * 7 Kigoma * 1 * 1 * 2 Shinyanga * 4 * 1 * 5 Kagera * 2 * 3 * 5 Mwanza * 2 * 2 * 4 Mara * 0 * 1 * 1 Manyara * 0 * 0 * 0 Njombe * 4 * 4 * 8 Katavi * 1 * 6 * 7 Simiyu * 0 * 0 * 0 Geita * 0 * 2 * 2 Songwe * 2 * 6 * 8 Kaskazini Unguja * 0 * 0 * 0 Kusini Unguja * 0 * 0 * 0 Mjini Magharibi * 0 * 0 * 0 Kaskazini Pemba * 0 * 0 * 0 Kusini Pemba * 0 * 0 * 0
Marital status Never married * 1 * 7 * 8 Married or living together 100.0 27 100.0 39 100.0 66 Divorced or separated * 7 * 19 100.0 26 Widowed * 1 * 12 * 13

112
Table 11.5.A Retention on antiretroviral therapy (ART): people initiating antiretroviral therapy LESS THAN 12 months prior to the survey (continued) Among HIV-positive persons aged 15 years and older who self-reported initiating ART less than 12 months prior to the survey, percentage who self- reported still receiving ART, by sex and selected demographic characteristics, THIS 2016-2017 Males Females Total
Characteristic Percentage still receiving ART1 Number Percentage
still receiving ART1 Number Percentage still receiving ART1 Number
Education
No education * 4 * 14 * 18 Pre-Primary * 0 * 0 * 0 Primary 100.0 27 100.0 56 100.0 83 Post Primary Training * 0 * 1 * 1 Secondary (O-Level) * 5 * 4 * 9 Post-Secondary (O-Level) Training * 0 * 1 * 1 Secondary (A-Level) * 0 * 1 * 1 Post-Secondary (A-Level) Training * 0 * 0 * 0 University * 0 * 0 * 0
Wealth quintile
Lowest * 4 * 11 * 15 Second * 11 * 9 * 20 Middle * 12 * 18 100.0 30 Fourth * 6 * 22 100.0 28 Highest * 3 * 17 * 20
Age
15-19 * 0 * 2 * 2 20-24 * 2 * 9 * 11 25-29 * 1 * 13 * 14 30-34 * 3 * 14 * 17 35-39 * 7 * 13 * 20 40-44 * 12 * 12 * 24 45-49 * 4 * 5 * 9 50-54 * 4 * 4 * 8 55-59 * 2 * 3 * 5 60-64 * 0 * 2 * 2 65-69 * 0 * 0 * 0 70-74 * 1 * 0 * 1 75-79 * 0 * 0 * 0 ≥80 * 0 * 0 * 0
Total 15-24 * 2 * 11 * 13 Total 15-49 100.0 29 100.0 68 100.0 97 Total 50+ * 7 * 9 * 16 Total 15+ 100.0 36 100.0 77 100.0 113 1Relates to Global AIDS Monitoring indicator 1.3: Retention on antiretroviral therapy at 12 months; 2Antiretroviral (ARV) detection assay included only nevirapine, efavirenz, and lopinavir. Estimates in parentheses are based on a small number (25 to 49) of unweighted cases and should be interpreted with caution. An asterisk indicates that an estimate is based on a very small number (less than 25) of unweighted cases and has been suppressed. The sum of the sample sizes for a given classification may be less than the total sample size because of missing responses to the classification variable

113
Table 11.5.B Retention on antiretroviral therapy (ART): people initiating antiretroviral therapy MORE THAN 12 months prior to the survey Among HIV-positive persons aged 15 years and older who self-reported initiating ART 12 months or more prior to the survey, percentage who self-reported still receiving ART, by sex and selected demographic characteristics, THIS 2016-2017 Males Females Total
Characteristic Percentage
still receiving ART1
Number Percentage
still receiving ART1
Number Percentage
still receiving ART1
Number
Presence of detectable ARVs2
Detectable 100.0 152 99.8 458 99.8 610 Not detectable * 16 * 19 (96.8) 35
Residence
Urban 100.0 60 100.0 241 100.0 301 Rural 99.0 108 99.5 241 99.4 349
Tanzania Mainland/Zanzibar
Mainland 99.4 168 99.8 479 99.7 647 Urban 100.0 60 100.0 239 100.0 299 Rural 99.0 108 99.5 240 99.4 348
Zanzibar * 0 * 3 * 3 Unguja * 0 * 2 * 2 Pemba * 0 * 1 * 1
Region Dodoma * 2 * 11 * 13 Arusha * 0 * 2 * 2 Kilimanjaro * 2 * 6 * 8 Tanga * 5 * 9 * 14 Morogoro * 2 * 10 * 12 Pwani * 13 (100.0) 38 100.0 51 Dar es Salaam * 5 * 24 (100.0) 29 Lindi * 0 * 1 * 1 Mtwara * 1 * 3 * 4 Ruvuma * 14 (100.0) 35 (100.0) 49 Iringa * 18 100.0 57 100.0 75 Mbeya * 10 (100.0) 38 (100.0) 48 Singida * 1 * 5 * 6 Tabora * 16 (96.1) 26 (97.7) 42 Rukwa * 3 * 17 * 20 Kigoma * 3 * 7 * 10 Shinyanga * 10 * 23 (96.7) 33 Kagera * 8 * 17 (100.0) 25 Mwanza * 5 * 19 * 24 Mara * 5 * 9 * 14 Manyara * 2 * 1 * 3 Njombe * 8 (100.0) 41 (100.0) 49 Katavi * 10 (100.0) 44 100.0 54 Simiyu * 7 * 9 * 16 Geita * 4 * 3 * 7 Songwe * 14 * 24 (97.5) 38 Kaskazini Unguja * 0 * 1 * 1 Kusini Unguja * 0 * 0 * 0 Mjini Magharibi * 0 * 1 * 1 Kaskazini Pemba * 0 * 0 * 0 Kusini Pemba * 0 * 1 * 1
Marital status
Never married * 7 (100.0) 45 100.0 52 Married or living together 99.6 127 99.8 210 99.7 337 Divorced or separated * 20 99.6 96 99.2 116 Widowed * 14 100.0 130 100.0 144

114
Table 11.5.B Retention on antiretroviral therapy (ART): people initiating antiretroviral therapy MORE THAN 12 months prior to the survey (continued) Among HIV-positive persons aged 15 years and older who self-reported initiating ART 12 months or more prior to the survey, percentage who self- reported still receiving ART, by sex and selected demographic characteristics, THIS 2016-2017 Males Females Total
Characteristic Percentage still receiving ART1 Number Percentage
still receiving ART1 Number Percentage still receiving ART1 Number
Education
No education * 14 98.8 87 99.0 101 Pre-Primary * 4 * 1 * 5 Primary 99.2 131 100.0 339 99.8 470 Post Primary Training * 3 * 7 * 10 Secondary (O-Level) * 9 (100.0) 45 100.0 54 Post-Secondary (O-Level) Training * 6 * 3 * 9 Secondary (A-Level) * 0 * 0 * 0 Post-Secondary (A-Level) Training * 0 * 0 * 0 University * 1 * 0 * 1
Wealth quintile
Lowest (100.0) 26 98.9 53 99.3 79 Second (96.9) 37 99.4 82 98.7 119 Middle (100.0) 48 100.0 150 100.0 198 Fourth (100.0) 37 100.0 115 100.0 152 Highest * 20 100.0 82 100.0 102
Age
15-19 * 1 * 6 * 7 20-24 * 2 * 20 * 22 25-29 * 2 (100.0) 40 (100.0) 42 30-34 * 10 100.0 68 100.0 78 35-39 * 16 100.0 99 100.0 115 40-44 (96.6) 33 100.0 76 99.0 109 45-49 (100.0) 26 100.0 63 100.0 89 50-54 (100.0) 30 (100.0) 49 100.0 79 55-59 (100.0) 25 (100.0) 36 100.0 61 60-64 * 16 * 16 (100.0) 32 65-69 * 2 * 7 * 9 70-74 * 1 * 2 * 3 75-79 * 4 * 0 * 4 ≥80 * 0 * 0 * 0
Total 15-24 * 3 (97.1) 26 (97.6) 29 Total 15-49 99.0 90 99.7 372 99.6 462 Total 50+ 100.0 78 100.0 110 100.0 188 Total 15+ 99.4 168 99.8 482 99.7 650 1Relates to Global AIDS Monitoring indicator 1.3: Retention on antiretroviral therapy at 12 months; 2Antiretroviral detection assay included only nevirapine, efavirenz, and lopinavir. Estimates in parentheses are based on a small number (25 to 49) of unweighted cases and should be interpreted with caution. An asterisk indicates that an estimate is based on a very small number (less than 25) of unweighted cases and has been suppressed. The sum of the sample sizes for a given classification may be less than the total sample size because of missing responses to the classification variable.
11.6 Antiretroviral Drug Resistance As indicated in section 1.7, a secondary objective of THIS 2016-2017 was to estimate the prevalence of transmitted resistance to ARVs, using samples from HIV-positive participants who were identified as recent HIV infections using the Recent Infection Testing Algorithm (Figure 2.6.B). Among 31 successfully amplified samples from recently infected HIV-positive adults identified in THIS, four had evidence of resistance to ARVs. All four had mutations associated with resistance to non-nucleoside reverse transcriptase inhibitors (NNRTI) and two had mutations associated with resistance to nucleoside reverse transcriptase inhibitors (NRTI). Two had mutations associated with NNRTI and NRTI. None of the individuals had mutations associated with protease inhibitors. (Table 11.6.A)

115
HIV subtypes - Among the subset of samples that underwent genotyping, 40.4% were Subtype C, 38.0% were subtype A, 10.8% were subtype D and 10.8% were of recombinant subtypes. (Table 11.6.B)
Table 11.6.A Resistance to antiretrovirals
Among persons aged 15 years and older who were recently infected with HIV, percentage with resistance to ARVs, by class of ARV resistance, THIS 2016-2017 Percent Number DR Mutations Detected1 Successfully amplified2 93.9 31
Any 12.9 4 D67N, K103N, K219KN, K70KR, M184V, M41L,
T215Y, Y181C, Y188L
NRTI 6.5 2 D67N, K219KN, K70KR, M184V, M41L, T215Y
NNRTI 12.9 4 K103N, Y181C, Y188L
PI 0.0 0
NRTI & NNRTI 6.5 2 D67N, K103N, K219KN, K70KR, M184V, M41L,
T215Y, Y188L
NRTI, NNRTI & PI 0.0 0 1Based on Stanford Database for HIV Drug Resistance Mutation
2Unweighted figures, from a total of 33 cases.
Table 11.6.B HIV Subtype Percent distribution of HIV-positive persons aged 15 years and older that underwent genotyping, by HIV Subtype, THIS 2016-2017 Total Percent Number
Subtype A 38.0 95 Subtype B 0.0 0 Subtype C 40.4 101 Subtype D 10.8 27 Subtype G 0.0 0 Recombinant 10.8 27
Total 100.0 250 Unweighted figures, excluding four samples where subtyping did not give a definitive result.
11.7 Gaps and Unmet Needs
11.8 References 1. World Health Organization. Consolidated guidelines on the use of antiretroviral drugs for treating and
preventing HIV infection. Geneva: World Health Organization; 2016.
§ Among adults above 15 years of age who tested HIV positive in THIS, but who self-reported being HIV negative and had no detectable ARVs in their blood, nearly three-quarters (73.8%) of males were immunosuppressed compared to 55.7% of females.
§ Advanced immunosuppression (CD4 counts less than 350 cells/μ) among undiagnosed PLHIV aged 15 years and older is common (45.1%); it is highest among those aged 50 years and older (53.1%).

116
12.1 Key Findings
12.2 Background Pregnant women living with HIV are at high risk of transmitting HIV to their infants during pregnancy, during birth, or through breastfeeding.1 Over 90% of new infections among infants and young children occur through mother-to-child transmission (MTCT). Without any interventions, between 20% and 45% of infants may become infected through MTCT, with an estimated risk of 5%-10% during pregnancy, 10%-20% during labor and delivery, and 5%-20% through breastfeeding.2 . Current global targets are to eliminate new HIV infections among children by reducing the number of children newly infected to less than 20,000 by 2020, and to reach and sustain 95% of pregnant women living with HIV with lifelong HIV treatment by 20183 To prevent MTCT, the United Nations recommends a comprehensive four-pronged approach including: (1) primary prevention of HIV infection among women of childbearing age; (2) preventing unintended pregnancies among women living with HIV; (3) preventing HIV transmission from women living with HIV to their infants; and (4) providing appropriate treatment, care, and support to mothers living with HIV and their children and families.2 This chapter describes ANC attendance, breastfeeding practices, awareness of a woman’s HIV status prior to or during pregnancy, use of ART during pregnancy in women who were aware of their HIV-positive status during pregnancy, and infant HIV testing through biomarker collected during the survey. 12.3 Antenatal Care Attendance Table 12.3.A presents results on ANC attendance in women aged 15-49 years who gave birth in the last three years preceding the survey. The percentage who attended at least one ANC visit for their most recent birth was 98.9%. There was very little variation across other demographic characteristics and very little regional variation (Table 12.3.A).
▪ Among women aged 15-49 years, 98.9% attended at least one ANC visit for their most recent pregnancy during the three years prior to the survey.
▪ Among all women aged 15-49 who gave birth during the 12 months preceding the survey, 92.4% knew their HIV status.
▪ Among HIV-positive women aged 15-49 years who gave birth during the 12 months preceding the survey, 97.9% received ARVs; 51.9% of these women were newly initiated on ARVs during pregnancy, labor, or delivery.
12 PREVENTION OF MOTHER-TO-CHILD TRANSMISSION

117
Table 12.3.A Antenatal care Among women aged 15-49 years who delivered in the three years preceding the survey, percentage who attended at least one antenatal care visit for her most recent birth, by selected demographic characteristics, THIS 2016-2017
Characteristic Percentage who attended at least one ANC visit Number
Residence Urban 99.3 1,780 Rural 98.7 4,400
Tanzania Mainland/Zanzibar Mainland 98.9 5,858
Urban 99.3 1,691 Rural 98.7 4,167
Zanzibar 100.0 322 Unguja 100.0 219 Pemba 100.0 103
Region Dodoma 99.2 106 Arusha 98.6 82 Kilimanjaro 98.4 69 Tanga 99.0 101 Morogoro 99.3 141 Pwani 100.0 298 Dar es Salaam 99.7 280 Lindi (100.0) 45 Mtwara 100.0 50 Ruvuma 100.0 315 Iringa 100.0 218 Mbeya 99.6 241 Singida 100.0 68 Tabora 97.6 691 Rukwa 98.5 526 Kigoma 99.4 160 Shinyanga 98.6 442 Kagera 99.5 156 Mwanza 98.7 224 Mara 97.6 185 Manyara 100.0 94 Njombe 98.0 151 Katavi 97.4 543 Simiyu 100.0 192 Geita 95.7 206 Songwe 99.0 274 Kaskazini Unguja 100.0 50 Kusini Unguja (100.0) 37 Mjini Magharibi 100.0 132 Kaskazini Pemba (100.0) 48 Kusini Pemba 100.0 55

118
Table 12.3.A Antenatal care (continued) Among women aged 15-49 years who delivered in the three years preceding the survey, percentage who attended at least one antenatal care visit for her most recent birth, by selected demographic characteristics, THIS 2016-2017
Characteristic Percentage who attended at least one ANC visit Number
Marital status Never married 99.5 502 Married or living together 99.0 5,027 Divorced or separated 98.1 563 Widowed 99.5 86
Education No education 98.0 1,192 Pre-Primary (89.7) 36 Primary 99.0 3,832 Post Primary Training (100.0) 40 Secondary (O-Level) 99.7 904 Post-Secondary (O-Level) Training 100.0 102 Secondary (A-Level) * 17 Post-Secondary (A-Level) Training * 11 University (100.0) 43
Wealth quintile Lowest 97.5 1,574 Second 99.4 1,403 Middle 99.0 1,284 Fourth 99.4 1,069 Highest 99.8 848
Age 15-19 99.5 605 20-24 99.3 1,720 25-29 98.6 1,585 30-34 98.4 1,102 35-39 99.4 767 40-44 98.8 340 45-49 97.8 61
Total 15-24 99.3 2,325 Total 15-49 98.9 6,180 The sum of the sample sizes for a given classification may be less than the total sample size because of missing responses to the classification variable. Estimates in parentheses are based on a small number (25 to 49) of unweighted cases and should be interpreted with caution. An asterisk indicates that an estimate is based on a very small number (less than 25) of unweighted cases and has been suppressed.
12.4 Breastfeeding Among women aged 15-49 years who gave birth within the three years preceding the survey,91.6% were currently breastfeeding their last-born children 9-11 months of age. Current breastfeeding decreased to 77.8% among last-born children aged 12-17 months and to 44.5% among last-born children aged 18-23 months. For children last-born to women aged 15-49 years in the three years preceding the survey, current breastfeeding was reported for 43.3% of those whose mothers tested HIV positive during the survey, and for 59.4% of those whose mothers tested HIV negative (Table 12.4.A).

119
Table 12.4.A Breastfeeding status by child's age and mother's HIV status
Percent distribution of last-born children born to women aged 15-49 years in the three years preceding the survey by breastfeeding status, by child's age and mother's HIV status, THIS 2016-2017
Characteristic Never breastfed
Ever breastfed, but not currently
breastfeeding
Currently breastfeeding Total Number
Child's age (months)
0-1 0.3 10.4 89.3 100.0 405 2-3 0.0 8.0 92.0 100.0 442 4-5 0.6 9.6 89.9 100.0 428 6-8 0.1 8.8 91.1 100.0 548 9-11 0.4 8.0 91.6 100.0 548 12-17 0.7 21.4 77.8 100.0 1177 18-23 0.3 55.2 44.5 100.0 933 24-36 0.1 94.0 5.9 100.0 1649
Result of mother's PHIA survey HIV test
HIV positive 1.5 55.2 43.3 100.0 311 HIV negative 0.3 40.3 59.4 100.0 5633 Not tested 0.2 48.8 51.0 100.0 200
Total 0.3 41.3 58.4 100.0 6144 The sum of the sample sizes for a given classification may be less than the total sample size because of missing responses to the classification variable.
12.5 Awareness of Mother’s HIV Status Among women aged 15-49 years who gave birth during the 12 months preceding the survey, 92.4% reported that they knew their HIV status while 90.9% reported having testing for HIV and receiving their test results during ANC for the pregnancy (1.5% reported testing positive and 89.4% reported testing negative). In urban areas, 2.1% of women reported that they already knew about their HIV-positive status, compared to 1.3% in rural areas. A higher percentage of women over the age of 30 years already knew that they were HIV positive (2.4% among ages 30-34 years and 3.2% among ages 35-39 years). In contrast, the percentage of women aged 15-29 years who reported that they already knew their HIV-positive status ranged from 0.4%-1.9%. Among women aged 15-49 years who gave birth during the 12 months preceding the survey, the highest percentages of women reported learning about their HIV-positive status for the first time as a result of ANC testing were in Mbeya (7.0%), Kagera (3.9%), Mwanza (4.9%), Njombe (5.2%), and Geita (3.1%) (Table 12.5.A).

120
Table 12.5.A Prevention of mother-to-child transmission, known HIV status Among women aged 15-49 years who gave birth within the past 12 months, percentage who were tested for HIV during antenatal care and received their results or who already knew they were HIV positive, by selected demographic characteristics, THIS 2016-2017
Tested for HIV during ANC and received results1
Characteristic Percentage who
tested HIV positive
Percentage who tested HIV
negative
Percentage who already knew
they were HIV positive
Total percentage with known HIV status
Number of women who gave birth within the
past 12 months
Residence
Urban 1.6 95.0 2.1 98.7 623 Rural 1.4 87.0 1.3 89.7 1,743
Tanzania Mainland/Zanzibar
Mainland 1.5 89.4 1.6 92.4 2,251 Urban 1.7 94.9 2.1 98.8 590 Rural 1.4 87.0 1.3 89.8 1,661
Zanzibar 0.0 89.7 0.0 89.7 115 Unguja 0.0 91.5 0.0 91.5 73 Pemba (0.0) (85.5) (0.0) (85.5) 42
Region
Dodoma (0.0) (89.0) (0.0) (89.0) 37 Arusha (0.0) (96.3) (0.0) (96.3) 36 Kilimanjaro (0.0) (100.0) (0.0) (100.0) 25 Tanga (2.8) (86.3) (3.2) (92.2) 36 Morogoro 0.0 98.1 1.9 100.0 50 Pwani 0.0 91.5 4.9 96.4 88 Dar es Salaam 0.0 100.0 0.0 100.0 87 Lindi * * * * 18 Mtwara * * * * 17 Ruvuma 2.3 87.4 1.7 91.4 119 Iringa 0.0 89.3 8.4 97.7 77 Mbeya 7.0 86.7 1.2 94.8 87 Singida (0.0) (92.6) (0.0) (92.6) 25 Tabora 0.3 88.3 1.1 89.7 286 Rukwa 1.4 83.5 1.5 86.5 206 Kigoma 2.6 88.0 2.6 93.2 75 Shinyanga 0.5 91.4 2.1 94.0 186 Kagera 3.9 94.8 0.0 98.7 63 Mwanza 4.9 84.2 3.1 92.3 96 Mara 1.2 83.3 0.0 84.5 74 Manyara (0.0) (86.4) (0.0) (86.4) 30 Njombe (5.2) (84.4) (8.8) (98.4) 48 Katavi 1.6 86.6 2.1 90.3 223 Simiyu 0.0 86.5 1.2 87.6 84 Geita 3.1 79.2 1.1 83.4 78 Songwe 0.0 83.7 0.9 84.6 100 Kaskazini Unguja * * * * 19 Kusini Unguja * * * * 7 Mjini Magharibi (0.0) (93.6) (0.0) (93.6) 47 Kaskazini Pemba * * * * 19 Kusini Pemba * * * * 23
Marital status Never married 0.8 91.6 1.1 93.4 215 Married or living together 1.2 89.6 1.5 92.2 1,950 Divorced or separated 4.6 84.7 2.5 91.8 181 Widowed * * * * 20

121
Table 12.5.A Prevention of mother-to-child transmission, known HIV status (continued) Among women aged 15-49 years who gave birth within the past 12 months, percentage who were tested for HIV during antenatal care and received their results or who already knew they were HIV positive, by selected demographic characteristics, THIS 2016-2017
Tested for HIV during ANC and received results1
Characteristic Percentage who tested HIV positive
Percentage who tested HIV negative
Percentage who already knew
they were HIV positive
Total percentage with known HIV status
Number of women who gave birth within the
past 12 months
Education
No education 0.9 85.1 1.8 87.9 471 Pre-Primary * * * * 17 Primary 1.7 88.3 1.6 91.7 1,462 Post Primary Training * * * * 13 Secondary (O-Level) 0.5 95.6 1.3 97.5 333 Post-Secondary (O-Level) Training (0.0) (98.5) (0.0) (98.5) 37 Secondary (A-Level) * * * * 10 Post-Secondary (A-Level) Training * * * * 4 University * * * * 18
Wealth quintile Lowest 1.3 83.4 1.2 85.8 647 Second 1.9 87.9 1.5 91.3 568 Middle 2.3 89.8 2.2 94.2 473 Fourth 1.0 93.1 1.0 95.1 381 Highest 0.7 96.3 2.0 98.9 297
Age
15-19 0.8 85.1 1.0 86.8 322 20-24 1.4 89.9 0.4 91.6 675 25-29 1.4 92.5 1.9 95.7 596 30-34 2.2 89.0 2.4 93.7 406 35-39 1.4 87.9 3.2 92.5 256 40-44 2.2 88.1 1.6 91.9 101 45-49 * * * * 10
Total 15-24 1.2 88.2 0.6 89.9 997 Total 15-49 1.5 89.4 1.5 92.4 2,366 1Relates to PEPFAR PMTCT_STAT_NAT / SUBNAT.
Estimates in parentheses are based on a small number (25 to 49) of unweighted cases and should be interpreted with caution. An asterisk indicates that an estimate is based on a very small number (less than 25) of unweighted cases and has been suppressed. The sum of the sample sizes for a given classification may be less than the total sample size because of missing responses to the classification variable.
12.6 Antiretroviral Therapy Among HIV-Positive Pregnant Women Among self-reported HIV-positive women aged 15-49 years who gave birth within the 12 months preceding the survey, 97.9% reported receiving ARVs during pregnancy: 51.9% were newly initiated on ARVs during pregnancy or during labor and delivery, while 46.1% were already taking ARVs prior to the pregnancy (Table 12.6.A).

122
Table 12.6.A Prevention of mother-to-child transmission, HIV-positive pregnant women who received antiretrovirals Among self-reported HIV-positive women aged 15-49 years who gave birth within the past 12 months, percentage who received antiretrovirals during pregnancy to reduce the risk of mother-to-child-transmission, by selected demographic characteristics, THIS 2016-2017
Characteristic
Percentage who were already on
ARVs prior to pregnancy
Percentage who were newly initiated on ARVs
during pregnancy or labor and delivery
Total percentage who received
ARVs1
Number of HIV-positive women who gave birth within the
past 12 months Residence
Urban * * * 24 Rural 45.9 50.8 96.7 52
Tanzania Mainland/Zanzibar Mainland 46.1 51.9 97.9 76
Urban * * * 24 Rural 45.9 50.8 96.7 52
Zanzibar * * * 0 Unguja * * * 0 Pemba * * * 0
Region
Dodoma * * * 0 Arusha * * * 0 Kilimanjaro * * * 0 Tanga * * * 2 Morogoro * * * 1 Pwani * * * 4 Dar es Salaam * * * 0 Lindi * * * 0 Mtwara * * * 2 Ruvuma * * * 5 Iringa * * * 6 Mbeya * * * 5 Singida * * * 0 Tabora * * * 4 Rukwa * * * 6 Kigoma * * * 4 Shinyanga * * * 5 Kagera * * * 2 Mwanza * * * 8 Mara * * * 1 Manyara * * * 0 Njombe * * * 6 Katavi * * * 9 Simiyu * * * 1 Geita * * * 4 Songwe * * * 1 Kaskazini Unguja * * * 0 Kusini Unguja * * * 0 Mjini Magharibi * * * 0 Kaskazini Pemba * * * 0 Kusini Pemba * * * 0
Marital status
Never married * * * 5 Married or living together 51.1 47.7 98.8 54 Divorced or separated * * * 13 Widowed * * * 4

123
Table 12.6.A Prevention of mother-to-child transmission, HIV-positive pregnant women who received antiretrovirals (continued) Among self-reported HIV-positive women aged 15-49 years who gave birth within the past 12 months, percentage who received antiretrovirals during pregnancy to reduce the risk of mother-to-child-transmission, by selected demographic characteristics, THIS 2016-2017
Characteristic
Percentage who were already on
ARVs prior to pregnancy
Percentage who were newly initiated on ARVs
during pregnancy or labor and delivery
Total percentage who received
ARVs1
Number of HIV- positive women who gave birth within the past 12 months
Education No education * * * 13 Pre-Primary * * * 1 Primary 47.5 49.5 97.0 53 Post Primary Training * * * 1 Secondary (O-Level) * * * 8 Post-Secondary (O-Level) Training * * * 0 Secondary (A-Level) * * * 0 Post-Secondary (A-Level) Training * * * 0 University * * * 0
Wealth quintile
Lowest * * * 14 Second * * * 19 Middle * * * 24 Fourth * * * 10 Highest * * * 9
Age
15-19 * * * 5 20-24 * * * 8 25-29 * * * 21 30-34 * * * 23 35-39 * * * 14 40-44 * * * 5 45-49 * * * 0
Total 15-24 * * * 13 Total 15-49 46.1 51.9 97.9 76 1Relates to Global AIDS Monitoring indicator 2.3: Preventing the mother-to- child transmission of HIV and PMTCT_ART_NAT / SUBNAT. Estimates in parentheses are based on a small number (25 to 49) of unweighted cases and should be interpreted with caution. An asterisk indicates that an estimate is based on a very small number (less than 25) of unweighted cases and has been suppressed. The sum of the sample sizes for a given classification may be less than the total sample size because of missing responses to the classification variable.
12.7 Mother-to-Child Transmission Among infants born to HIV-positive mothers during the 17 months prior to the survey 10.5% were confirmed as HIV positive by virological testing (virological testing was only conducted among infants who had a reactive screening test during HBTC). Among infants born to HIV-positive mothers during the 11 months preceding the survey, 6.1% were confirmed as HIV positive using virological testing. None of the infants whose mothers reported ARV use at the first ANC visit had confirmed HIV infection by virologic testing conducted as part of THIS; the estimates for percentage of infants confirmed HIV-positive, by mother’s self-reported ARV status have been suppressed due to denominator being <25 (Table 12.7.A).

124
Table 12.7.A Mother-to-child transmission of HIV Among infants born in the last 17 months to HIV-positive women aged 15-49 years, percentage confirmed HIV positive, by mother's self-reported ARV and breastfeeding status, THIS 2016-2017
Characteristic Percentage of infants
confirmed HIV positive1, 2
Number of infants born to HIV-
positive women3, 4 Mother's self-reported ARV status
Mother unaware of HIV status during pregnancy * 12 Already on ARVs at first antenatal visit * 11 Newly initiated on ARVs during pregnancy or labor and delivery * 12 Did not receive ARVs during pregnancy * 1 Missing self-reported ARV status * 5
Mother's self-reported breastfeeding status
Ever breastfed the infant (11.0) 40 Never breastfed the infant * 0 Missing self-reported breastfeeding status * 1
Total 0-11 months (6.1) 28 Total 0-17 months (10.5) 41 1Relates to Global AIDS Monitoring indicator 2.2: Mother-to-child transmission of HIV; 2Infants confirmed as HIV positive by virologic testing (virological testing was only conducted among infants who had a reactive screening test); 3Includes only infants who were tested for HIV during the PHIA survey; 4 women who tested HIV positive in the PHIA survey. Weighted figures calculated using btwt0. Estimates in parentheses are based on a small number (25 to 49) of unweighted cases and should be interpreted with caution. An asterisk indicates that an estimate is based on a very small number (less than 25) of unweighted cases and has been suppressed. The sum of the sample sizes for a given classification may be less than the total sample size because of missing responses to the classification variable.
12.8 Gaps and Unmet Needs
12.9 References 1. World Health Organization. Prevention of HIV in infants and young children. Review of evidence and
WHO's activities. Geneva: World Health Organization; 2002. http://www.who.int/hiv/mtct/ReviewofEvidence.pdf 2. De Cock KM, Fowler MG, Mercier E, et al. Prevention of mother-to-child HIV transmission in resource-poor countries: translating research into policy and practice. Journal of the American Medical Association, 2000, 283:1175–1182. 3. Joint United Nations Programme on HIV/AIDS and United States President’s Emergency Plan for AIDS Relief. Start Free, Stay Free, AIDS Free. [Internet]: UNAIDS; (https://free.unaids.org/).
§ ANC HIV testing is lower in rural compared to urban areas. § Approximately half (51.9%) of HIV-positive women reported first initiation on ARVs during
pregnancy. Given the high numbers of infections in young women, there could be more emphasis on diagnosis and treatment of women before they begin childbearing. Evidence shows that MTCT rates are lower if women are on ART before pregnancy.

125
13.1 Key Findings
13.2 Background Tanzania is home to 12 million adolescents aged 10-19 years and 5 million young adults aged 20-24 years.2 Older adolescents and young adults, aged 15-24 years, are more likely to engage in risky sexual behaviors than older adults and have less frequent contact with the healthcare system.2 Efforts to prevent and treat HIV in those aged 10-24 years are critical for long-term epidemic control and overall development of the country. This chapter presents summary findings on adolescents and young adults aged 15-24 years. The chapter includes prevalence of early sexual debut before age 15 years among males and females aged 15-24 years, by marital status, region, and socio-demographic characteristics. Knowledge of HIV prevention, HIV testing, treatment and VLS of HIV; incidence; and prevalence among young males and females aged 15-24 years are also discussed. The chapter includes the 90-90-90 cascade for those aged 15-24 years and gaps and unmet needs. 13.3 Sex Before Age 15 Adolescents and young adults 15-24 years Among young adults aged 15-24 years, a higher proportion of males (14.3%) than females (9.1%) reported having had sex before age 15 years. The total percentage of young adults reporting sexual debut before age 15 years for Tanzania mainland was 12.0% and 2.6% for Zanzibar. Of the males and females aged 15-24 years who had sex before age 15 years, 9.0% lived in urban settings and 13.4% lived in rural settings. Sexual debut before age 15 years varies by region from 22.9% in Dodoma, followed by Tabora, Mtwara, Geita, and Lindi, to 0.0% in Kusini Pemba. Of the majority of those aged 15-24 years who had sex before 15 years of age, 10.1% were never married. A higher proportion of those aged 15-24 years who had no education (21.6%) and those with primary education (14.1%) were found to have had sex before age 15 years as compared to those with secondary (A level) education (1.7%).
§ Among those aged 15-24 years, a higher proportion of males (14.3%) than females (9.1%) reported having had sex before age 15 years.
§ A higher proportion of those aged 15-24 years that were rural residents (13.4%) reported having had sex before 15 years of age compared to those aged 15-24 years that were urban residents (9.0%).
§ A higher proportion of those aged 15-24 years in Tanzania Mainland (12 %) reported having had sex before 15 years of age compared to 2.6% in Zanzibar.
13 ADOLESCENTS AND YOUNG ADULTS

126
Table 13.3.A Sex before the age of 15 Percentage of males and females age 15–24 years who have had sexual intercourse before the age of 15; by sex and selected demographic characteristics, THIS 2016-2017 Males Females Total
Characteristic Percentage
who had sex before age 15
Number Percentage
who had sex before age 15
Number Percentage
who had sex before age
15
Number
Residence Urban 12.7 1,511 5.7 2,169 9.0 3,680 Rural 15.2 3,194 11.4 3,842 13.4 7,036
Tanzania Mainland/Zanzibar Mainland 14.7 4,461 9.3 5,684 12.0 10,145
Urban 13.0 1,433 5.8 2,078 9.2 3,511 Rural 15.5 3,028 11.7 3,606 13.7 6,634
Zanzibar 3.1 244 2.1 327 2.6 571 Unguja 3.6 177 2.8 232 3.2 409 Pemba 1.5 67 0.0 95 0.7 162
Region Dodoma 35.2 59 11.4 76 22.9 135 Arusha (14.7) 46 4.8 85 8.9 131 Kilimanjaro 14.0 63 6.5 94 10.1 157 Tanga 10.3 79 8.7 105 9.5 184 Morogoro 16.5 84 8.4 155 11.7 239 Pwani 12.1 249 7.6 339 9.8 588 Dar es Salaam 12.5 282 4.5 384 8.4 666 Lindi 19.3 50 (8.1) 39 15.3 89 Mtwara (19.8) 49 (11.3) 47 16.2 96 Ruvuma 12.8 260 13.0 288 12.9 548 Iringa 6.5 190 3.4 246 4.9 436 Mbeya 11.8 203 7.0 299 9.2 502 Singida (19.0) 44 (8.1) 48 14.0 92 Tabora 22.7 569 17.7 629 20.4 1,198 Rukwa 14.9 293 12.6 457 13.6 750 Kigoma 11.5 120 7.4 137 9.6 257 Shinyanga 17.2 402 8.6 432 13.3 834 Kagera 7.7 125 8.7 130 8.1 255 Mwanza 12.6 191 10.9 230 11.8 421 Mara 14.8 139 13.7 183 14.2 322 Manyara 17.1 64 7.3 99 11.8 163 Njombe 7.6 110 2.9 144 5.1 254 Katavi 15.6 350 14.0 456 14.8 806 Simiyu 10.0 120 10.0 170 10.0 290 Geita 12.7 148 18.9 154 15.6 302 Songwe 14.0 172 8.4 258 10.9 430 Kaskazini Unguja (7.5) 41 2.1 52 4.8 93 Kusini Unguja (7.8) 36 (6.9) 44 7.4 80 Mjini Magharibi 2.0 100 2.2 136 2.1 236 Kaskazini Pemba (3.7) 27 (0.0) 40 1.7 67 Kusini Pemba (0.0) 40 0.0 55 0.0 95

127
Table 13.3.A Sex before the age of 15 (continued) Percentage of males and females age 15–24 years who have had sexual intercourse before the age of 15; by sex and selected demographic characteristics, THIS 2016-2017 Males Females Total
Characteristic Percentage
who had sex before age 15
Number Percentage
who had sex before age 15
Number Percentage
who had sex before age 15
Number
Marital status Never married 13.5 3,882 5.0 3,048 10.1 6,930 Married or living together 17.5 700 13.9 2,567 14.8 3,267 Divorced or separated 28.0 96 17.1 349 20.0 445 Widowed * 0 * 23 * 23
Education
No education 19.0 345 23.7 611 21.6 956 Pre-Primary (14.7) 27 (13.2) 27 14.0 54 Primary 16.8 2,544 11.4 3,186 14.1 5,730 Post Primary Training 11.7 59 5.3 67 8.7 126 Secondary (O-Level) 10.6 1,511 3.1 1,892 6.9 3,403 Post-Secondary (O-Level) Training 13.9 103 0.0 152 6.4 255 Secondary (A-Level) 0.6 75 (3.8) 45 1.7 120 Post-Secondary (A-Level) Training * 7 * 8 * 15 University (18.7) 32 * 20 12.4 52
Wealth quintile Lowest 16.1 1,021 15.7 1,180 15.9 2,201 Second 15.8 1,006 11.5 1,211 13.8 2,217 Middle 16.5 1,050 9.6 1,303 13.1 2,353 Fourth 12.0 853 4.7 1,128 8.3 1,981 Highest 11.1 775 5.6 1,187 8.0 1,962
Age 15-19 14.7 2,623 9.4 3,067 12.1 5,690 20-24 13.9 2,082 8.7 2,944 11.3 5,026
Total 15-24 14.3 4,705 9.1 6,011 11.7 10,716 Estimates in parentheses are based on a small number (25 to 49) of unweighted cases and should be interpreted with caution. An asterisk indicates that an estimate is based on a very small number (less than 25) of unweighted cases and has been suppressed. The sum of the sample sizes for a given classification may be less than the total sample size because of missing responses to the classification variable.
13.4 Knowledge About HIV Prevention The Tanzania HIV Impact Survey 2016-2017 also collected information on knowledge of HIV prevention, by asking two questions about prevention of sexual transmission of HIV and three questions related to common misconceptions about contracting HIV. Only 37.0% of males aged 15-24 years answered all five HIV knowledge questions correctly with a higher proportion of young men in urban areas (47.7%) responding correctly to all five questions, compared to those in rural areas (31.1%). Among males in this age group, 85.3% responded correctly that you cannot contract HIV by sharing food with an infected person and 71.6% responded correctly that HIV transmission risk can be reduced by consistent condom use. A higher proportion of males in the highest wealth quintile (48.9%) answered all questions correctly, compared to those in the lowest wealth quintile (25.8%). Among young men with A level secondary education, 72.3% answered all questions correctly, compared to 16.5% of those with no education, and 28.8% of those with primary education (Table 13.4.A).

128
Only 36.7% of females aged 15-24 years answered all five HIV knowledge questions correctly. Among females in this age group, 86.8% responded correctly that you cannot contract HIV by sharing food with an infected person, and 66.6% correctly responded that HIV transmission risk can be reduced by consistent condom use. Among young women with post-secondary (O-level) training, 59.8% answered all questions correctly compared to 20.1% of those with no education and 28.8% of those with primary education (Table 13.4.B). Overall, among males and females aged 15-24 years, 36.9% answered all five HIV knowledge questions correctly. Geographically, the highest proportion that responded to all five questions correctly was in Mbeya (48.5%) and the lowest proportion of young adults who responded correctly was in the Kusini Pemba (19.4%). The percentage of those answering all questions correctly varied in terms of wealth and education from 25.2% among those in the lowest wealth quintile to 45.4% among those in the highest wealth quintile, and from 18.5% among those with no education to 66.8% among those with A level secondary education. Correct knowledge was also more frequent among urban residents (45.5%) than among rural residents (31.6%). It also varied among age groups with 42.0% answering all questions correctly among those aged 20-24 years compared to 32.6% in those aged 15-19 years (Table 13.4.C).
Table 13.4.A Young people, knowledge about HIV prevention: Males Among males aged 15-24 years, percentage who correctly identify both ways of preventing the sexual transmission of HIV and reject major misconceptions about HIV transmission,1,2 by selected demographic characteristics, THIS 2016-2017 Percentage who correctly answered the questions:
Characteristic
Can the risk of HIV transmission be
reduced by having sex with only one
uninfected partner who has no other
partners?
Can a person reduce the risk of getting HIV
by using a condom every time they have
sex?
Can a healthy-looking person
have HIV?
Can a person get HIV
from mosquito
bites?
Can a person get HIV by sharing
food with someone who is
infected?
All five questions Number2
Residence Urban 78.7 74.6 84.4 85.5 89.9 47.7 1,511 Rural 70.8 70.0 67.9 78.5 82.7 31.1 3,189
Tanzania Mainland/Zanzibar
Mainland 73.8 72.0 73.8 81.0 85.3 37.4 4,458 Urban 78.9 75.2 84.5 85.6 89.8 48.2 1,434 Rural 71.0 70.3 67.9 78.5 82.9 31.4 3,024
Zanzibar 65.9 57.4 73.3 79.1 82.6 24.6 242 Unguja 66.3 58.2 75.6 80.5 84.9 27.7 176 Pemba 64.5 54.8 65.9 74.5 75.3 14.6 66
Region
Dodoma 70.1 70.7 68.0 69.5 75.2 29.6 59 Arusha (81.7) (68.1) (73.6) (91.2) (89.1) (46.6) 45 Kilimanjaro 75.0 79.1 73.3 88.1 77.9 34.7 63 Tanga 78.5 65.7 74.6 88.7 82.3 34.0 79 Morogoro 74.5 72.0 79.8 79.8 83.3 40.4 84 Pwani 74.0 70.4 77.9 80.4 85.6 38.5 249 Dar es Salaam 79.9 69.6 84.5 86.7 89.5 47.3 282 Lindi 80.9 78.7 79.2 63.5 77.2 40.8 50 Mtwara (78.0) (81.1) (73.7) (82.2) (86.0) (39.5) 49 Ruvuma 73.2 75.6 76.4 72.3 85.1 35.6 260 Iringa 78.7 82.3 78.4 79.0 88.3 41.4 190 Mbeya 77.2 72.4 82.8 92.5 95.7 50.6 203 Singida (79.2) (72.4) (76.8) (88.1) (82.4) (33.2) 44 Tabora 70.0 70.6 60.1 78.2 83.9 29.6 569 Rukwa 75.2 72.1 73.4 79.1 87.1 33.7 293

129
Table 13.4.A Young people, knowledge about HIV prevention: Males (continued) Among males aged 15-24 years, percentage who correctly identify both ways of preventing the sexual transmission of HIV and reject major misconceptions about HIV transmission,1,2 by selected demographic characteristics, THIS 2016-2017 Percentage who correctly answered the questions:
Characteristic
Can the risk of HIV transmission be
reduced by having sex with only one
uninfected partner who has no other
partners?
Can a person reduce the risk of getting HIV
by using a condom every time they have
sex?
Can a healthy-looking person
have HIV?
Can a person get HIV
from mosquito
bites?
Can a person get HIV by sharing
food with someone who is
infected?
All five questions Number2
Region (continued) Kigoma 71.8 72.2 75.9 81.4 85.1 43.2 119 Shinyanga 64.6 70.6 65.6 77.2 83.8 32.8 401 Kagera 74.0 82.2 76.4 75.9 88.5 40.8 125 Mwanza 74.8 76.3 73.4 84.3 85.5 39.0 191 Mara 67.5 66.7 66.7 79.7 84.9 27.7 139 Manyara 61.0 59.5 67.7 74.8 83.1 27.9 64 Njombe 80.8 77.5 79.8 81.8 90.3 47.7 110 Katavi 74.9 73.3 72.0 78.9 85.7 34.9 350 Simiyu 66.7 63.1 61.6 76.6 76.7 25.0 120 Geita 73.6 74.1 70.5 83.5 87.9 35.8 148 Songwe 73.7 66.3 80.4 76.9 89.2 34.9 172 Kaskazini Unguja (66.2) (56.2) (73.4) (71.2) (76.3) (14.9) 41 Kusini Unguja (65.1) (57.3) (71.8) (87.5) (97.5) (29.3) 36 Mjini Magharibi 66.6 58.8 76.8 80.7 83.8 29.7 99 Kaskazini Pemba (55.1) (59.0) (55.9) (73.4) (76.9) (18.3) 27 Kusini Pemba (71.2) (51.7) (73.0) (75.3) (74.1) (12.0) 39
Marital status
Never married 73.1 72.1 73.4 81.6 85.6 37.3 3,879 Married or living together 76.5 69.1 78.5 78.4 83.9 38.4 699 Divorced or separated 80.9 66.9 68.2 74.0 87.6 24.8 96 Widowed * * * * * * 0
Education No education 59.9 52.9 52.6 60.4 73.1 16.5 343 Pre-Primary (63.7) (61.8) (33.6) (90.9) (72.5) (27.7) 27 Primary 69.7 68.2 68.2 76.2 82.0 28.8 2,542 Post Primary Training 92.4 89.3 61.6 90.6 84.6 37.6 59 Secondary (O-Level) 79.7 78.0 84.6 89.5 91.2 49.3 1,510 Post-Secondary (O-Level) Training 78.8 75.6 94.3 92.9 95.1 59.0 103 Secondary (A-Level) 94.7 94.1 88.2 98.0 96.8 72.3 75 Post-Secondary (A-Level) Training * * * * * * 7 University (96.5) (90.7) (98.4) (93.1) (94.8) (75.2) 32
Wealth quintile
Lowest 68.7 66.9 59.8 76.7 80.5 25.8 1,018 Second 71.2 71.7 69.7 74.6 83.9 33.6 1,005 Middle 71.9 70.8 72.7 80.9 83.4 34.1 1,050 Fourth 74.6 74.3 80.6 85.2 89.6 42.9 852 Highest 81.8 74.2 86.0 87.6 89.0 48.9 775
Age
15-19 69.6 70.6 68.3 80.0 82.7 32.2 2,620 20-24 78.4 72.8 80.3 82.1 88.4 42.8 2,080
Total 15-24 73.6 71.6 73.8 81.0 85.3 37.0 4,700 1Relates to Global AIDS Monitoring indicator 5.1: Young people: Knowledge about HIV prevention; 2Includes only participants who answered all five questions. Estimates in parentheses are based on a small number (25 to 49) of unweighted cases and should be interpreted with caution. An asterisk indicates that an estimate is based on a very small number (less than 25) of unweighted cases and has been suppressed. The sum of the sample sizes for a given classification may be less than the total sample size because of missing responses to the classification variable.

130
Table 13.4.B Young people, knowledge about HIV prevention: Females Among females aged 15-24 years, percentage who correctly identify both ways of preventing the sexual transmission of HIV and reject major misconceptions about HIV transmission,1,2 by selected demographic characteristics, THIS 2016-2017 Percentage who correctly answered the questions:
Characteristic
Can the risk of HIV transmission
be reduced by having sex with
only one uninfected
partner who has no other
partners?
Can a person
reduce the risk of
getting HIV by using a condom
every time they have
sex?
Can a healthy-looking person
have HIV?
Can a person get HIV
from mosquito
bites?
Can a person get HIV by sharing
food with someone who is
infected?
All five questions Number2
Residence Urban 77.6 70.9 81.2 87.3 89.7 43.5 2,172 Rural 69.6 63.7 67.4 82.6 84.8 32.0 3,849
Tanzania Mainland/Zanzibar
Mainland 73.0 66.8 72.9 84.5 86.7 36.9 5,694 Urban 77.8 71.0 81.3 87.3 89.7 43.7 2,081 Rural 69.7 63.9 67.2 82.6 84.7 32.2 3,613
Zanzibar 67.8 58.7 75.9 84.3 89.4 29.2 327 Unguja 67.6 61.4 77.7 85.0 91.0 30.8 232 Pemba 68.3 50.6 70.4 81.9 84.4 24.5 95
Region
Dodoma 76.8 69.8 69.4 93.7 95.1 53.2 76 Arusha 67.1 62.3 78.7 82.6 85.7 32.1 85 Kilimanjaro 81.3 61.0 83.0 85.1 91.4 37.5 96 Tanga 74.5 71.2 75.9 85.3 89.6 41.1 107 Morogoro 74.3 68.8 80.5 86.4 87.0 44.0 156 Pwani 73.4 64.7 75.5 87.2 89.4 38.6 339 Dar es Salaam 77.3 70.2 85.0 89.0 89.2 42.6 385 Lindi (74.4) (53.9) (59.8) (77.3) (79.4) (29.2) 40 Mtwara (61.7) (70.4) (79.3) (73.6) (88.3) (26.9) 47 Ruvuma 72.4 70.2 71.8 80.2 91.8 37.0 290 Iringa 82.6 72.8 82.2 87.8 92.9 49.4 245 Mbeya 75.0 75.2 78.6 89.9 92.9 46.8 299 Singida (75.3) (75.8) (72.5) (90.2) (81.2) (43.0) 48 Tabora 63.6 60.1 54.4 80.1 84.7 25.2 628 Rukwa 69.9 62.4 72.7 80.0 85.5 33.4 458 Kigoma 63.0 54.1 65.1 82.3 83.8 20.7 136 Shinyanga 64.9 62.4 60.5 79.0 83.7 29.9 435 Kagera 77.0 70.1 73.6 83.4 82.2 39.4 130 Mwanza 73.6 70.7 65.1 87.2 86.7 34.4 230 Mara 72.4 67.6 70.9 79.4 79.6 27.5 182 Manyara 76.0 59.9 84.6 88.2 84.1 43.8 99 Njombe 78.2 76.9 76.6 85.1 89.7 43.2 144 Katavi 73.0 67.1 69.1 80.6 83.4 35.3 455 Simiyu 68.4 61.0 51.8 80.0 79.0 26.9 173 Geita 70.2 66.9 60.9 82.4 89.0 31.7 154 Songwe 76.2 62.0 76.3 79.7 84.3 30.7 257 Kaskazini Unguja 65.1 48.0 55.4 77.4 92.4 24.6 52 Kusini Unguja (69.3) (72.6) (74.2) (94.2) (93.9) (46.4) 44 Mjini Magharibi 67.7 61.6 82.1 84.6 90.2 28.9 136 Kaskazini Pemba (68.5) (44.8) (63.7) (82.1) (85.3) (22.1) 40 Kusini Pemba 68.1 55.0 75.5 81.7 83.7 26.4 55

131
Table 13.4.B Young people, knowledge about HIV prevention: Females (continued) Among females aged 15-24 years, percentage who correctly identify both ways of preventing the sexual transmission of HIV and reject major misconceptions about HIV transmission,1,2 by selected demographic characteristics, THIS 2016-2017
Characteristic
Can the risk of HIV transmission
be reduced by having sex with
only one uninfected
partner who has no other
partners?
Can a person
reduce the risk of
getting HIV by using a
condom every time they have
sex?
Can a healthy- looking person
have HIV?
Can a person get HIV
from mosquito
bites?
Can a person get HIV by sharing
food with someone who is
infected?
All five questions Number2
Marital status
Never married 72.5 67.5 74.5 87.0 87.7 38.5 3,049 Married or living together 72.7 65.4 71.0 81.5 85.4 34.3 2,577 Divorced or separated 78.0 69.6 71.8 81.6 87.7 36.5 350 Widowed * * * * * * 23
Education
No education 63.1 53.1 53.1 69.8 74.4 20.1 612 Pre-Primary (73.7) (60.9) (56.4) (69.2) (70.5) (20.5) 27 Primary 67.6 60.9 67.2 82.1 83.9 28.8 3,195 Post Primary Training 72.2 69.1 78.7 90.4 90.6 38.1 68 Secondary (O-Level) 81.5 77.1 84.4 90.8 93.2 50.2 1,891 Post-Secondary (O-Level) Training 88.7 77.9 93.9 92.1 96.5 59.8 152 Secondary (A-Level) (87.3) (77.5) (98.6) (88.6) (97.0) (56.3) 45 Post-Secondary (A-Level) Training * * * * * * 8 University * * * * * * 20
Wealth quintile Lowest 66.8 59.1 57.5 78.4 80.6 24.5 1,181 Second 69.0 63.5 67.3 83.0 86.3 31.1 1,214 Middle 70.3 66.2 73.1 84.5 85.4 36.3 1,305 Fourth 77.0 73.2 79.1 89.3 89.5 45.9 1,131 Highest 79.1 69.3 83.3 86.0 90.6 42.5 1,188
Age
15-19 68.6 64.5 69.0 84.5 85.4 32.9 3,066 20-24 77.9 69.0 77.7 84.6 88.4 41.2 2,955
Total 15-24 72.8 66.6 73.0 84.5 86.8 36.7 6,021 1Relates to Global AIDS Monitoring indicator 5.1: Young people: Knowledge about HIV prevention. 2Includes only participants who answered all five questions. Estimates in parentheses are based on a small number (25 to 49) of unweighted cases and should be interpreted with caution. An asterisk indicates that an estimate is based on a very small number (less than 25) of unweighted cases and has been suppressed. The sum of the sample sizes for a given classification may be less than the total sample size because of missing responses to the classification variable.

132
Table 13.4.C Young people, knowledge about HIV prevention: Total
Among males and females aged 15-24 years, percentage who correctly identify both ways of preventing the sexual transmission of HIV and reject major misconceptions about HIV transmission,1,2 by selected demographic characteristics, THIS 2016-2017 Percentage who correctly answered the questions:
Characteristic
Can the risk of HIV transmission
be reduced by having sex with
only one uninfected
partner who has no other
partners?
Can a person
reduce the risk of
getting HIV by using a condom
every time they have
sex?
Can a healthy-looking person
have HIV?
Can a person get HIV from mosquito
bites?
Can a person get HIV by sharing
food with someone who is
infected?
All five questions Number2
Residence
Urban 78.1 72.6 82.7 86.5 89.8 45.5 3,683 Rural 70.2 66.9 67.7 80.5 83.7 31.6 7,038
Tanzania Mainland/Zanzibar
Mainland 73.4 69.4 73.3 82.8 86.0 37.1 10,152 Urban 78.3 72.9 82.8 86.5 89.7 45.8 3,515 Rural 70.4 67.2 67.5 80.5 83.7 31.8 6,637
Zanzibar 66.9 58.1 74.6 81.7 86.1 27.0 569 Unguja 67.0 59.8 76.7 82.8 88.0 29.3 408 Pemba 66.5 52.6 68.2 78.4 80.1 19.8 161
Region
Dodoma 73.5 70.2 68.7 81.9 85.4 41.7 135 Arusha 73.1 64.7 76.6 86.1 87.1 38.0 130 Kilimanjaro 78.3 69.6 78.4 86.5 85.0 36.2 159 Tanga 76.5 68.5 75.3 87.0 86.1 37.6 186 Morogoro 74.4 70.1 80.2 83.7 85.5 42.5 240 Pwani 73.7 67.5 76.7 83.9 87.6 38.5 588 Dar es Salaam 78.6 69.9 84.8 87.8 89.3 44.9 667 Lindi 78.6 69.7 72.2 68.5 78.0 36.6 90 Mtwara 71.1 76.6 76.1 78.5 87.0 34.2 96 Ruvuma 72.8 73.1 74.3 75.9 88.2 36.3 550 Iringa 80.7 77.5 80.3 83.4 90.6 45.4 435 Mbeya 76.0 73.9 80.5 91.1 94.2 48.5 502 Singida 77.4 73.9 74.9 89.0 81.9 37.7 92 Tabora 67.1 65.8 57.5 79.1 84.3 27.6 1,197 Rukwa 72.3 66.8 73.0 79.6 86.3 33.5 751 Kigoma 67.6 63.7 70.8 81.9 84.5 32.6 255 Shinyanga 64.7 66.8 63.3 78.0 83.8 31.5 836 Kagera 75.3 76.9 75.2 79.2 85.7 40.2 255 Mwanza 74.2 73.6 69.4 85.7 86.1 36.8 421 Mara 70.0 67.2 68.8 79.5 82.2 27.6 321 Manyara 69.2 59.7 76.9 82.1 83.7 36.6 163 Njombe 79.4 77.2 78.1 83.5 89.9 45.4 254 Katavi 73.9 70.1 70.5 79.7 84.6 35.1 805 Simiyu 67.5 62.0 56.5 78.3 77.9 26.0 293 Geita 72.1 70.8 66.1 83.0 88.4 33.9 302 Songwe 75.1 63.9 78.2 78.4 86.5 32.6 429 Kaskazini Unguja 65.7 52.2 64.5 74.3 84.2 19.7 93 Kusini Unguja 67.1 64.6 72.9 90.7 95.8 37.5 80 Mjini Magharibi 67.2 60.2 79.5 82.7 87.1 29.3 235 Kaskazini Pemba 62.3 51.4 60.1 78.0 81.4 20.3 67 Kusini Pemba 69.6 53.4 74.3 78.6 79.1 19.4 94

133
Table 13.4.C Young people, knowledge about HIV prevention: Total (continued) Among males and females aged 15-24 years, percentage who correctly identify both ways of preventing the sexual transmission of HIV and reject major misconceptions about HIV transmission,1,2 by selected demographic characteristics, THIS 2016-2017 Percentage who correctly answered the questions:
Characteristic
Can the risk of HIV transmission
be reduced by having sex with
only one uninfected
partner who has no other
partners?
Can a person
reduce the risk of
getting HIV by using a condom
every time they have
sex?
Can a healthy-looking person
have HIV?
Can a person get HIV from mosquito
bites?
Can a person get HIV by sharing
food with someone who is
infected?
All five questions Number2
Marital status Never married 72.9 70.3 73.8 83.7 86.4 37.8 6,928 Married or living together 73.7 66.3 72.9 80.8 85.0 35.4 3,276 Divorced or separated 78.8 68.9 70.9 79.6 87.7 33.5 446 Widowed * * * * * * 23
Education
No education 61.7 53.0 52.9 65.7 73.9 18.5 955 Pre-Primary 68.4 61.4 44.1 80.9 71.5 24.4 54 Primary 68.6 64.5 67.7 79.2 82.9 28.8 5,737 Post Primary Training 82.9 79.8 69.6 90.5 87.5 37.8 127 Secondary (O-Level) 80.6 77.5 84.5 90.2 92.2 49.7 3,401 Post-Secondary (O-Level) Training 84.1 76.8 94.1 92.5 95.8 59.4 255 Secondary (A-Level) 92.2 88.4 91.8 94.8 96.9 66.8 120 Post-Secondary (A-Level) Training * * * * * * 15 University 95.7 92.4 98.9 94.8 95.9 79.4 52
Wealth quintile
Lowest 67.8 63.2 58.7 77.5 80.6 25.2 2,199 Second 70.1 67.8 68.6 78.6 85.0 32.4 2,219 Middle 71.1 68.5 72.9 82.7 84.4 35.2 2,355 Fourth 75.8 73.8 79.8 87.3 89.6 44.4 1,983 Highest 80.3 71.5 84.5 86.7 89.9 45.4 1,963
Age
15-19 69.1 67.6 68.7 82.2 84.0 32.6 5,686 20-24 78.2 70.9 79.0 83.4 88.4 42.0 5,035
Total 15-24 73.2 69.1 73.4 82.7 86.0 36.9 10,721 1Relates to Global AIDS Monitoring indicator 5.1: Young people: Knowledge about HIV prevention. 2Includes only participants who answered all five questions. Estimates in parentheses are based on a small number (25 to 49) of unweighted cases and should be interpreted with caution. An asterisk indicates that an estimate is based on a very small number (less than 25) of unweighted cases and has been suppressed. The sum of the sample sizes for a given classification may be less than the total sample size because of missing responses to the classification variable
13.5 HIV Incidence and Prevalence Overall incidence of HIV infection among young adults aged 15-24 years was estimated at 0.07%, 0.11% among those aged 15-19 years, and 0.03% among those aged 20-24 years (Table 5.3.A). Overall HIV prevalence among ages 15-24 years was 1.4% whereby ages 15-19 years was 0.7% and ages 20-24 years was 2.2% (Table 6.3.C). The disparity in HIV prevalence between males and females is most pronounced among young adults with prevalence among females aged 15-19 years (1.0%) and aged 20-24 years (3.4%) to more than double that of males, (0.4%) and (0.9%), respectively (Table 6.3.C). 13.6 HIV Testing, Treatment, and Viral Load Suppression Among young adults aged 15-24 years, 49.0% reported having ever had HIV testing and received test results; 29.8% of those aged 15-19 years and 71.9% of those aged 20-24 years reported having tested and

134
received their results(Table 7.3.C). The percentage was higher among females 60.0% (Table 7.3.B) and lower among males 37.9% (Table 7.3.A). Among HIV-positive young adults aged 15-24 years, 60.9% were not aware of their HIV status, 34.3% were aware of their HIV status and on ART, while 4.8% were aware of their HIV status but not on ART Among HIV-positive females aged 15-24 years, 59.4% were unaware of their HIV status, 35.8% were aware and on ART, and the remaining 4.8% were aware, but not on ART. Among those HIV-positive males aged 15-24 years, 64.9% were unaware of their HIV status, 30.1% were aware and on ART, while 4.9% were aware, but not on ART. (Tables 8.3.A, 8.3.B, and 8.3.C). Among individuals aged 15-24 years who reported using ARVs, only 45.6% had ARVs detected in their blood. There is disparity between males and females in ARV detection in the blood whereby there was detection of ARVs in 49.3% of females and 32.4% of males. Irrespective of treatment status, VLS was lower among males aged 15-24 years (22.2%) compared to females of the same age group (47.1%), with overall VLS of 41.5% (Tables 8.4.A, 8.4.B, 8.4.C, and 9.4.B). VLS among those from the ages of 15-24 years who are on ART was 83.5%; which is still beneath the 90% goal. This warrants further attention as adolescents and young adults are sexually active and in the reproductive age group. 13.7 Status of the 90-90-90 Goals Based on self-report and detection of ARVs, 50.2% of HIV-positive individuals aged 15-24 years were aware of their status. Among those who were aware of their HIV-positive status, 92.6% were on ART (based on self-report and detection of ARVs), and among them, 83.5% had suppressed viral loads (Table 10.3.B).

135
Figure 13.7.A Adolescent and young adults 90-90-90 (laboratory ARV-adjusted data1 among young adults aged 15-24 years), THIS 2016-2017
1In the antiretroviral (ARV)-adjusted 90-90-90 participants are classified as ‘Aware’ or ‘Diagnosed’ if they self-reported HIV positive before testing HIV positive in THIS and/or had detectable ARVs in their blood. Participants are classified as ‘On Treatment’ if they self-reported that they were on treatment and/or if they had detectable ARVs in their blood. *Inset numbers are conditional proportions. Estimates for ‘On Treatment’ and ‘Viral Suppression’ among males have been suppressed because they are based <25 observations and therefore the bars have not been displayed on the graph above. Estimate for percent diagnosed is based on 44 observations and should be interpreted with caution.
13.8 Gaps and Unmet Needs
13.9 References 1. United Nations, Department of Economic and Social Affairs, Population Division, 2017. World
Population Prospects: The 2017 Revision. DVD, Edition. 2. Hervish A, Clifton D. The Status Report on Adolescents and Young People in Sub-Saharan Africa:
Opportunities and Challenges. Johannesburg and Washington, DC: Population Reference Bureau; 2012.
§ Overall, there is still a challenge in HIV testing among those aged 15-24 years (49.0% were aware of their HIV-status), and the gap is seen more in males (37.9% were aware of their HIV status).
§ The difference in HIV prevalence between females and males is highest in the age group 20-24 years (3.4% among females and 0.9% among males).

136
14.1 Key Findings
14.2 Background Estimates of prevalence of HIV in children, estimates of the number of children living with HIV (CLHIV) and viral suppression among CLHIV are most commonly derived indirectly from clinic-based data or epidemiologic models. For the first time in Tanzania, THIS provides direct measurements of these estimates among children aged 0-14 years. These data provide critical information to help inform identification of needs and gaps with regard to pediatric HIV care and treatment; to guide planning for HIV prevention, care, and treatment services for children; for evaluating PMTCT programs; and for addressing unique needs of children aged 10-14 years. This chapter presents results on the UNAIDS 90-90-90 cascade in children and early adolescents aged 0-14 years, using both parent/guardian-reported data (on awareness of child’s HIV status and ARV use) and data on detectable ARVs. Analyses for the 90-90-90 tables for children were similar to that described for adults in Chapter 10. Parents or guardians were asked about a child’s HIV infection status and ARV use. Data on detectable ARVs were used in combination with self-reported ARV use to define awareness of HIV-positive status and the ARV status of a child. Presence of detectable ARVs among children who were reported as HIV negative was used to reclassify these children as aware. 14.3 HIV Prevalence It is estimated that 0.4% of children under the age of 15 years are infected with HIV (0.3% of males and 0.5% of females) (Table 14.3.A). The prevalence of HIV infection was 0.4% among those under the age of five years, 0.5% among those aged 5-9 years, and 0.3% among those aged 10-14 years (Table 6.3.C). Among those regions with cases, the highest prevalence rates were found in Njombe (2.3%) and Iringa (1.4%) and the lowest in Rukwa (0.1%) (Table 14.3.A).
14 CHILDREN AND EARLY ADOLESCENTS
§ The estimated prevalence of HIV infection among children aged 0-14 years was 0.4 %. § Based on parents’ reports and ARV detection data, it is estimated that 50.1% of children living with
HIV in Tanzania were diagnosed.

137
Table 14.3.A HIV prevalence by demographic characteristics 0-14 years Prevalence of HIV among persons aged 0-14 years, by sex and selected demographic characteristics, THIS 2016-2017 Males Females Total
Characteristic Percentage HIV positive Number Percentage
HIV positive Number Percentage
HIV positive
Number
Residence Urban 0.3 1,229 0.4 1,202 0.4 2,431 Rural 0.3 3,627 0.5 3,558 0.4 7,185
Tanzania Mainland/Zanzibar Mainland 0.3 4,604 0.5 4,490 0.4 9,094
Urban 0.4 1,153 0.5 1,133 0.4 2,286 Rural 0.3 3,451 0.5 3,357 0.4 6,808
Zanzibar 0.0 252 0.0 270 0.0 522 Unguja 0.0 158 0.0 180 0.0 338 Pemba 0.0 94 0.0 90 0.0 184
Region Dodoma 0.0 79 0.0 68 0.0 147 Arusha 0.0 54 0.0 53 0.0 107 Kilimanjaro 1.6 65 0.0 60 0.8 125 Tanga 1.1 84 0.4 84 0.8 168 Morogoro 0.0 92 0.9 108 0.5 200 Pwani 0.8 210 0.0 217 0.4 427 Dar es Salaam 0.0 155 0.0 163 0.0 318 Lindi (0.0) 45 (0.0) 31 0.0 76 Mtwara (0.0) 43 (2.3) 42 1.1 85 Ruvuma 0.0 253 0.0 289 0.0 542 Iringa 0.0 167 2.8 167 1.4 334 Mbeya 1.0 169 0.0 165 0.5 334 Singida (0.0) 47 (2.1) 38 0.9 85 Tabora 0.5 567 0.5 544 0.5 1,111 Rukwa 0.0 380 0.3 383 0.1 763 Kigoma 0.0 158 0.0 137 0.0 295 Shinyanga 0.8 387 0.5 386 0.6 773 Kagera 0.0 121 0.0 119 0.0 240 Mwanza 0.5 210 0.0 191 0.2 401 Mara 0.5 199 0.0 158 0.3 357 Manyara 0.0 60 0.0 64 0.0 124 Njombe 1.3 119 3.3 119 2.3 238 Katavi 0.3 428 1.1 375 0.7 803 Simiyu 0.0 147 0.7 147 0.3 294 Geita 0.5 155 1.6 162 1.0 317 Songwe 0.4 210 0.7 220 0.6 430 Kaskazini Unguja (0.0) 44 (0.0) 36 0.0 80 Kusini Unguja (0.0) 27 (0.0) 32 0.0 59 Mjini Magharibi 0.0 87 0.0 112 0.0 199 Kaskazini Pemba (0.0) 46 (0.0) 42 0.0 88 Kusini Pemba (0.0) 48 (0.0) 48 0.0 96
Total 0-14 0.3 4,856 0.5 4,760 0.4 9,616 Estimates in parentheses are based on a small number (25 to 49) of unweighted cases and should be interpreted with caution. Weighted figures calculated using btwt0.

138
14.4 Status of the 90-90-90 Goals 90-90-90 cascade based on guardian-reported HIV status and ART use and/or detectable ARVs in children: ARV-adjusted awareness of HIV-positive status: Awareness of HIV-positive status and viral load suppression in children: Among HIV-positive children (children who tested positive in THIS), aged 0-14 years, 32.2% were reported by their parent/guardian as having an HIV-positive status. Upon incorporating the results from ARV detection, nearly half (50.1%) of children were either self-reported by a parent to be HIV positive and/or had detectable ARVs in their blood. Of the 22 children who were classified as aware, all of them were on treatment (parent reported and/or ARVs detected), and of the 22 on treatment, nine children had VLS. Because the denominator for the second and third 90 are <25, we report raw numbers here, instead of weighted percentages (Tables 14.4.A and 14.4.B). Among all CLHIV, irrespective of treatment status, only 18.4% had suppressed viral loads.
Table 14.4.A Pediatric 90-90-90 (parent-reported antiretroviral therapy (ART) data; conditional percentages) 90-90-90 targets among people living with HIV aged 0-14 years, by age, THIS 2016-2017
Diagnosed On Treatment Viral Load Suppression (VLS)
Total Among children whose
parent reported that the child is HIV positive
Among children whose parent
reported that the child is on ART
Age
Percentage whose parent
reported that the child is HIV positive
Number Percentage
whose parent reported that the
child is on ART
Number Percentage with VLS Number
0-17 months * 4 * 0 * 0 18-59 months * 11 * 2 * 2
0-4 years * 15 * 2 * 2 5-9 years * 15 * 7 * 7 10-14 years * 14 * 7 * 7 0-14 years (32.2) 44 * 16 * 16 Estimates in parentheses are based on a small number (25 to 49) of unweighted cases and should be interpreted with caution. An asterisk indicates that an estimate is based on a very small number (less than 25) of unweighted cases and has been suppressed.

139
Table 14.4.B Pediatric 90-90-90 (parent-reported laboratory antiretroviral (ARV) data; conditional percentages) 90-90-90 targets among people living with HIV aged 0-14 years, by age, THIS 2016-2017
Diagnosed On Treatment Viral Load Suppression (VLS)
Total Among children whose parent reported that the child is HIV
positive AND/OR with detectable ARVs
Among children with detectable ARVs
AND/OR whose parent reported current ARV
usage for the child
Age
Percentage whose parent
reported that the child is HIV positive
AND/OR with detectable ARVs1
Number
Percentage with detectable ARVs
AND/OR whose parent reported
current ARV usage for the child2
Number Percentage with VLS3 Number
0-17 months * 4 * 2 * 2 18-59 months * 11 * 2 * 2 0-4 years * 15 * 4 * 4 5-9 years * 15 * 9 * 9 10-14 years * 15 * 9 * 9 0-14 years (50.1) 45 * 22 * 22 1Relates to Global AIDS Monitoring indicator 1.1: People living with HIV who know their HIV status, and PEPFAR DIAGNOSED_NAT; 2 Relates to Global AIDS Monitoring indicator 1.2: Retention on antiretroviral therapy at 12 months, and PEPFAR TX_CURR_NAT / SUBNAT; 3Relates to Global AIDS Monitoring indicator 1.4: People living with HIV who have suppressed viral loads, and PEPFAR VL_SUPPRESSION_NAT Estimates in parentheses are based on a small number (25 to 49) of unweighted cases and should be interpreted with caution. An asterisk indicates that an estimate is based on a very small number (less than 25) of unweighted cases and has been suppressed. Weighted figures calculated using btwt0.
14.5 Gaps and Unmet Needs
§ Nearly 50 percent of children under the age of 15 years who are living with HIV have not been diagnosed.
§ Overall among children under the age of 15 years living with HIV, 81.6% did not have VLS.

140
15.1 Key Findings
15.2 Background This chapter describes the prevalence of sexual behaviors that elevate risk of HIV infection. The survey asked questions about high-risk behaviors, including early sexual debut, recent engagement in multiple sexual partnerships, condom use at last sexual intercourse, recent engagement in paid sexual intercourse, and condom use at last sexual intercourse with a nonmarital, noncohabitating partner. With this information, programs can focus their efforts on those individuals most in need of information and most at risk for HIV infection. The TACAIDS and ZAC have developed the National Multi-sectoral Condom Strategy (2016-2018) to ensure sustained use of condoms for HIV, STI, and pregnancy prevention in Tanzania. The strategy will contribute to the increase in risk perception through public education and advocacy. This will translate the current knowledge of HIV/AIDS into avoidance of risky sexual behaviors and increase condom use. Traditional male circumcision used to be performed for religious or cultural reasons in Tanzania. Since 2007, WHO and UNAIDS have recommended voluntary medical male circumcision (VMMC) as a cost-effective strategy to reduce HIV acquisition in men. Beginning in 2010 the Government of Tanzania has created interventions to increase knowledge and information on VMMC. To inform VMMC programs, in THIS, males aged 15 years and older were asked if they had been medically or traditionally circumcised. 15.3 HIV Prevalence by Sexual Behavior When adult participants aged 15 years and older were grouped by age of sexual debut, the prevalence of HIV infection was higher for females than for males among all groupings. HIV prevalence reduced based on age of sexual debut, with 5.6% of those who had sex before the age of 15 years testing positive, compared to 3.9% of those with sexual debut at the age of 25 years or older (Table 15.3.A). Regardless of the number of sexual partners in the last 12 months, females had a higher HIV prevalence than males. The greatest disparity was among those with more than two sexual partners in the last 12 months with HIV prevalence among women (12.0%) that was nearly three times as high as that among
§ Approximately one-third (31.7%) of adults aged 15 years and older who reported having sex in the 12 months preceding the survey with a nonmarital, noncohabitating partner used a condom at last sexual intercourse.
§ Among those who used condoms at last sexual intercourse in the past 12 months, the number of HIV-positive females (13.9%) was higher than HIV-positive males (5.3%).
§ Among adults aged 15 years and older who had sexual debut before the age of 15 years, the prevalence of HIV infection was higher for females (7.0%) than for males (4.4%).
§ The HIV prevalence among men who did not use condoms at their last paid sexual intercourse was lower compared to females (5.9% and 10.7%, respectively).
§ The prevalence of male circumcision is higher in males who were HIV negative (77.4%) than in those who are HIV positive (60.8%).
15 HIV RISK FACTORS

141
men (4.2%). Among males aged 15 years and older, HIV prevalence was lower among those who reported having one partner (3.3%) than in those who reported two or more partners (4.2%) in the 12 months preceding the survey, but the difference is not statistically significant. HIV prevalence among females with two or more partners in the 12 months preceding the survey was more than twice the prevalence in females reporting one partner in the same period of time (12.0% versus 5.6%, respectively; Table 15.3.A). HIV prevalence among persons aged 15 years and older who reported that they used a condom at the last sexual intercourse in the past 12 months was 9.0%, compared to 4.2% among persons who reported that they did not use a condom. The percentage of HIV-positive females who used a condom at the last sexual intercourse in the past 12 months was higher (13.9%) than the percentage among HIV-positive males (5.3%) (Table 15.3.A). The THIS defined paid sexual intercourse as paying or receiving money for sexual intercourse. HIV prevalence in adults aged 15 years and older who reported engaging in paid sexual intercourse in the 12 months preceding the survey was higher than those who did not (7.8% versus 4.7%, respectively). Females who reported having engaged in paid sexual intercourse had nearly twice the HIV prevalence (11.2%) compared to males (5.9%). However, among those females who engaged in paid sexual intercourse, HIV prevalence was similar among those who used a condom during the last paid sexual intercourse (12.0%) and those who did not (10.7%). HIV prevalence in men aged 15 years and older who reported that they engaged in paid sexual intercourse in the 12 months preceding the survey was 5.8%; versus 3.4% among males who did not engage in paid sexual intercourse (Table 15.3.A). The HIV prevalence among men who did not use condoms at their last paid sexual intercourse was lower compared to females (5.9% and 10.7%, respectively).

142
Table 15.3.A HIV prevalence by sexual behavior Prevalence of HIV among persons aged 15 years and older, by sex and sexual behavior characteristics, THIS 2016-2017 Males Females Total
Characteristic Percentage HIV positive Number Percentage
HIV positive Number Percentage HIV positive Number
Age at first sexual intercourse
< 15 4.4 1,466 7.0 1,719 5.6 3,185
15-19 3.8 6,941 7.2 11,332 5.7 18,273
20-24 3.4 2,506 5.9 2,445 4.6 4,951
≥ 25 3.8 905 4.4 414 3.9 1,319
Number of sexual partners in the past 12 months
0 4.5 2,115 8.6 4,010 7.0 6,125
1 3.3 6,121 5.6 10,481 4.7 16,602
≥ 2 4.2 3,445 12.0 1,186 6.0 4,631
Condom use at last sexual intercourse in the past 12 months
Used condom 5.3 1,237 13.9 1,198 9.0 2,435
Did not use condom 3.2 7,279 5.0 10,026 4.2 17,305
No sexual intercourse in the past 12 months 4.5 2,115 8.6 4,010 7.0 6,125
Paid sexual intercourse in the past 12 months
Yes1 5.8 1,158 11.2 813 7.8 1,971
Used condom at last paid sexual intercourse 5.8 514 12.0 311 7.9 825
Did not use condom at last paid sexual intercourse 5.9 619 10.7 492 7.8 1,111
No2 3.4 8,453 5.9 10,959 4.7 19,412
Total 15-24 0.6 4,520 2.1 5,844 1.4 10,364
Total 15-49 3.1 10,971 6.2 14,629 4.7 25,600
Total 15+ 3.4 13,750 6.3 17,829 4.9 31,579 1Includes persons who paid or received money for sexual intercourse. 2No paid sexual intercourse or no sexual intercourse in the past 12 months. The sum of the sample sizes for a given classification may be less than the total sample size because of missing responses to the classification variable.
15.4 Condom Use at Last Sex with a Nonmarital, Noncohabitating Partner Overall among adults aged 15 years and older who reported having sex in the 12 months preceding the survey, 41.8% (50.0% of males and 33.5% of females) reported having sex with a nonmarital, noncohabitating partner during this time. Of these adults, 31.7% (34.9% of males and 27.3% of females) reported using a condom during their last sexual intercourse with a nonmarital, noncohabitating partner (Tables 15.4.A, Table 15.4.B and Table 15.4.C). The percentage of sexually active persons reporting sexual intercourse with a nonmarital, noncohabitating partner in the past 12 months was higher among those residing in urban areas (48.8%) than among those in rural areas (37.6%) (Table 15.4.C). The percentage of sexually active persons reporting sexual intercourse with a nonmarital, noncohabitating partner increased by educational level. Among males, 39.3% with no education reported sexual intercourse with a nonmarital noncohabitating partner, compared to 73.6% among those with secondary (A-level) education (Table 15.4.A). Similarly, for females,

143
22.0% of those with no education and 31.0% of those with primary and 51.0% with secondary education (O-level) reported sexual intercourse with a nonmarital, noncohabitating partner (Table 15.4.B). The percentage reporting condom use at last sexual intercourse with a nonmarital, noncohabitating partner followed a similar pattern, it increased with educational attainment from 19.7% of men and 12.5% of women with no education to 50.9% of men and 38.4% of women with post-secondary (O level) education (Tables 15.4.A and 15.4.B). The percentage of sexually active adults reporting sexual intercourse with nonmarital, noncohabitating partners and condom use at last sexual intercourse with this nonmarital, noncohabitating partner was lower in Zanzibar (15.7%) compared to mainland Tanzania (31.9%). Among sexually active persons aged 15-19 years, 76.4% reported having sex with a nonmarital, noncohabitating partner and 26.5% reported using a condom at last sexual intercourse with this nonmarital, noncohabitating partner, while among those aged 65-69 years, 12.2% reported having sex with a nonmarital, noncohabitating partner and 16.2% reported using a condom at last sex with this nonmarital, noncohabitating partner (Table 15.4.C).
Table 15.4.A Condom use at last sex with a nonmarital, noncohabitating partner: Males Among males age 15 years and older who reported having sex in the past 12 months, percentage who reported having a nonmarital, noncohabitating partner in the past 12 months; among those who reported having sex with a nonmarital, noncohabitating partner in the past 12 months, percentage who reported using a condom the last time they had sex with a nonmarital, noncohabitating partner, by selected demographic characteristics, THIS 2016-2017
Among males who reported having sex in the past 12 months
Among males who reported having sex
with a nonmarital, noncohabitating partner in the past 12 months
Characteristic
Percentage who reported having sex with a
nonmarital, noncohabitating partner in the past 12
months
Number
Percentage who reported using a condom the last time
they had sex with a nonmarital, noncohabitating
partner1
Number
Residence
Urban 55.7 3,115 43.2 1,370 Rural 46.8 6,926 29.5 2,717
Tanzania Mainland/Zanzibar Mainland 50.5 9,653 35.0 4,004
Urban 56.4 2,995 43.4 1,346 Rural 47.1 6,658 29.6 2,658
Zanzibar 25.4 388 19.7 83 Unguja 27.4 280 22.3 66 Pemba 18.6 108 * 17
Region
Dodoma 53.8 167 22.3 78 Arusha 40.2 146 34.0 52 Kilimanjaro 40.2 173 43.4 53 Tanga 49.2 195 47.9 75 Morogoro 54.1 253 33.7 112 Pwani 50.0 567 39.7 231 Dar es Salaam 56.9 588 41.4 277 Lindi 40.4 125 (26.3) 42 Mtwara 49.4 164 32.7 63 Ruvuma 55.8 667 41.4 308 Iringa 47.4 383 53.1 151 Mbeya 51.5 419 51.6 160 Singida 49.6 84 (26.3) 34 Tabora 56.8 1,104 34.6 510 Rukwa 40.8 685 29.1 238 Kigoma 29.2 214 28.7 53 Shinyanga 58.3 720 42.9 342 Kagera 40.3 291 29.9 98 Mwanza 60.9 415 30.8 210

144
Table 15.4.A Condom use at last sex with a nonmarital, noncohabitating partner: Males (continued) Among males age 15 years and older who reported having sex in the past 12 months, percentage who reported having a nonmarital, noncohabitating partner in the past 12 months; among those who reported having sex with a nonmarital, noncohabitating partner in the past 12 months, percentage who reported using a condom the last time they had sex with a nonmarital, noncohabitating partner, by selected demographic characteristics, THIS 2016-2017
Among males who reported having sex in the past 12 months
Among males who reported having sex
with a nonmarital, noncohabitating partner in the past 12 months
Characteristic
Percentage who reported having sex with a
nonmarital, noncohabitating partner in the past 12
months
Number Percentage who reported using
a condom the last time they had sex with a nonmarital, noncohabitating partner1
Number
Region (continued) Mara 55.9 230 25.1 113 Manyara 54.5 143 19.5 63 Njombe 49.5 234 61.2 93 Katavi 47.6 758 36.4 292 Simiyu 46.0 204 39.5 81 Geita 56.1 282 20.4 132 Songwe 36.9 442 41.1 143 Kaskazini Unguja 22.5 53 * 9 Kusini Unguja 29.1 61 * 16 Mjini Magharibi 27.7 166 (27.3) 41 Kaskazini Pemba (16.3) 49 * 7 Kusini Pemba 20.5 59 * 10
Marital status Never married 98.7 2,300 36.2 1,938 Married or living together 26.7 7,097 35.7 1,632 Divorced or separated 93.5 568 26.6 449 Widowed 96.2 71 26.4 63
Education No education 39.3 1,196 19.7 396 Pre-Primary (42.3) 37 * 14 Primary 46.6 6,461 30.1 2,524 Post Primary Training 42.7 151 48.9 55 Secondary (O-Level) 65.7 1,572 45.1 814 Post-Secondary (O-Level) Training 62.2 273 50.9 124 Secondary (A-Level) 73.6 75 (79.9) 40 Post-Secondary (A-Level) Training 41.7 83 (54.3) 32 University 52.1 189 55.3 87
Wealth quintile
Lowest 45.0 2,238 21.9 867 Second 45.9 2,246 28.7 889 Middle 50.3 2,182 33.1 877 Fourth 52.8 1,756 43.5 742 Highest 56.0 1,616 45.5 711
Age 15-19 96.6 902 24.2 769 20-24 80.7 1,591 39.8 1,045 25-29 55.6 1,470 36.4 657 30-34 40.6 1,267 38.3 453 35-39 35.8 1,124 38.2 331 40-44 35.0 997 33.8 301 45-49 30.3 736 33.8 207 50-54 24.1 588 41.5 130 55-59 18.9 440 38.5 82 60-64 12.9 326 (17.0) 45 65-69 14.4 231 (12.7) 33 70-74 10.6 170 * 17 75-79 6.0 98 * 6

145
Table 15.4.A Condom use at last sex with a nonmarital, noncohabitating partner: Males (continued) Among males age 15 years and older who reported having sex in the past 12 months, percentage who reported having a nonmarital, noncohabitating partner in the past 12 months; among those who reported having sex with a nonmarital, noncohabitating partner in the past 12 months, percentage who reported using a condom the last time they had sex with a nonmarital, noncohabitating partner, by selected demographic characteristics, THIS 2016-2017
Among males who reported having sex in the past 12 months
Among males who reported having sex with a nonmarital, noncohabitating partner
in the past 12 months
Characteristic
Percentage who reported having sex with a
nonmarital, noncohabitating partner in the past 12
months
Number
Percentage who reported using A condom the last time thy had sex with a nonmarital, noncohabitating partner1
Number
≥80 13.0 101 * 11 Total 15-24 86.1 2,493 33.5 1,814 Total 15-49 55.9 8,087 35.0 3,763 Total 50+ 17.7 1,954 32.4 324 Total 15+ 50.0 10,041 34.9 4,087 1Relates to Global AIDS Monitoring indicator 3.18: Condom use at last high-risk sex. Estimates in parentheses are based on a small number (25 to 49) of unweighted cases and should be interpreted with caution. An asterisk indicates that an estimate is based on a very small number (less than 25) of unweighted cases and has been suppressed. The sum of the sample sizes for a given classification may be less than the total sample size because of missing responses to the classification variable

146
Table 15.4.B Condom use at last sex with a nonmarital, noncohabitating partner: Females Among females aged 15 years and older who reported having sex in the past 12 months, percentage who reported having a nonmarital, noncohabitating partner in the past 12 months; among those who reported having sex with a nonmarital, noncohabitating partner in the past 12 months, percentage who reported using a condom the last time they had sex with a nonmarital, noncohabitating partner, by selected demographic characteristics, THIS 2016-2017
Among females who reported having sex in the past 12 months
Among females who reported having sex
with a nonmarital, noncohabitating partner
in the past 12 months
Characteristic
Percentage who reported having sex with a nonmarital,
noncohabitating partner in the past 12 months
Number
Percentage who reported using a condom the last time
they had sex with a nonmarital, noncohabitating
partner1
Number
Residence
Urban 42.3 4,216 31.5 1,521 Rural 28.0 7,923 23.4 1,943
Tanzania Mainland/Zanzibar
Mainland 34.0 11,568 27.4 3,407 Urban 43.0 4,052 31.6 1,508 Rural 28.4 7,516 23.6 1,899
Zanzibar 11.2 571 8.1 57 Unguja 13.1 404 (7.7) 48 Pemba 5.3 167 * 9
Region Dodoma 29.6 177 18.9 50 Arusha 28.9 184 (24.1) 49 Kilimanjaro 28.8 212 19.1 57 Tanga 40.0 218 32.9 75 Morogoro 40.0 361 22.6 130 Pwani 36.6 746 28.9 246 Dar es Salaam 45.3 753 28.5 299 Lindi 27.4 124 (6.4) 30 Mtwara 30.8 158 (35.7) 45 Ruvuma 36.2 742 36.3 235 Iringa 35.0 504 32.1 160 Mbeya 40.3 560 36.1 196 Singida 36.5 145 (26.8) 48 Tabora 29.0 1,129 27.9 303 Rukwa 23.3 836 19.8 175 Kigoma 19.6 282 9.8 52 Shinyanga 33.8 805 33.5 239 Kagera 25.3 300 28.1 68 Mwanza 42.8 466 26.3 176 Mara 32.1 318 35.1 98 Manyara 33.2 156 (29.3) 49 Njombe 39.2 328 32.6 106 Katavi 28.8 941 27.5 240 Simiyu 24.0 262 24.7 59 Geita 34.2 329 18.1 99 Songwe 24.5 532 33.1 123 Kaskazini Unguja 9.3 89 * 7 Kusini Unguja 18.7 83 * 15 Mjini Magharibi 12.7 232 (10.9) 26 Kaskazini Pemba 5.1 78 * 4 Kusini Pemba 5.6 89 * 5
Marital status
Never married 97.1 1,630 30.7 1,448 Married or living together 9.2 8,959 28.5 716 Divorced or separated 93.0 1,232 21.1 1,033 Widowed 88.2 312 25.7 261

147
Table 15.4.B Condom use at last sex with a nonmarital, noncohabitating partner: Females (continued) Among females aged 15 years and older who reported having sex in the past 12 months, percentage who reported having a nonmarital, noncohabitating partner in the past 12 months; among those who reported having sex with a nonmarital, noncohabitating partner in the past 12 months, percentage who reported using a condom the last time they had sex with a nonmarital, noncohabitating partner, by selected demographic characteristics, THIS 2016-2017
Among females who reported having sex in the past 12 months
Among females who reported having sex
with a nonmarital, noncohabitating partner
in the past 12 months
Characteristic
Percentage who reported having sex with a nonmarital,
noncohabitating partner in the past 12 months
Number
Percentage who reported using a condom the last time
they had sex with a nonmarital, noncohabitating
partner1
Number
Education
No education 22.0 2,335 12.5 430 Pre-Primary (20.8) 49 * 11 Primary 31.0 7,348 25.9 1,989 Post Primary Training 36.2 107 (27.3) 40 Secondary (O-Level) 51.0 1,847 34.5 787 Post-Secondary (O-Level) Training 49.1 276 38.4 134 Secondary (A-Level) (64.8) 47 (36.8) 29 Post-Secondary (A-Level) Training (38.1) 27 * 10 University 40.0 98 (33.7) 34
Wealth quintile Lowest 26.0 2,540 16.9 605 Second 26.8 2,484 24.5 589 Middle 32.7 2,688 26.5 759 Fourth 38.9 2,305 32.9 766 Highest 41.9 2,117 30.5 743
Age
15-19 61.2 1,376 29.2 737 20-24 41.6 2,332 30.6 812 25-29 32.3 2,145 31.2 562 30-34 27.9 1,780 21.4 417 35-39 25.9 1,431 28.4 346 40-44 27.5 1,115 22.6 277 45-49 24.0 771 17.6 170 50-54 14.2 512 18.2 70 55-59 15.0 267 (13.9) 38 60-64 9.8 196 * 20 65-69 7.8 109 * 10 70-74 5.0 56 * 2 75-79 (7.6) 26 * 2 ≥80 * 23 * 1
Total 15-24 49.2 3,708 29.9 1,549 Total 15-49 35.7 10,950 27.8 3,321 Total 50+ 12.4 1,189 14.6 143 Total 15+ 33.5 12,139 27.3 3,464 1Relates to Global AIDS Monitoring indicator 3.18: Condom use at last high-risk sex. Estimates in parentheses are based on a small number (25 to 49) of unweighted cases and should be interpreted with caution. An asterisk indicates that an estimate is based on a very small number (less than 25) of unweighted cases and has been suppressed. The sum of the sample sizes for a given classification may be less than the total sample size because of missing responses to the classification variable

148
Table 15.4.C Condom use at last sex with a nonmarital, noncohabitating partner: Total Among persons age 15 years and older who reported having sex in the past 12 months, percentage who reported having a nonmarital, noncohabitating partner in the past 12 months; among those who reported having sex with a nonmarital, noncohabitating partner in the past 12 months, percentage who reported using a condom the last time they had sex with a nonmarital, noncohabitating partner, by selected demographic characteristics, THIS 2016-2017
Among persons who reported having sex in the past 12 months
Among persons who reported having sex
with a nonmarital, noncohabitating partner
in the past 12 months
Characteristic
Percentage who reported having sex with a nonmarital,
noncohabitating partner in the past 12 months
Number
Percentage who reported using a condom the last time
they had sex with a nonmarital, noncohabitating
partner1
Number
Residence
Urban 48.8 7,331 37.8 2,891 Rural 37.6 14,849 27.2 4,660
Tanzania Mainland/Zanzibar
Mainland 42.3 21,221 31.9 7,411 Urban 49.5 7,047 37.9 2,854 Rural 38.1 14,174 27.4 4,557
Zanzibar 17.7 959 15.7 140 Unguja 19.8 684 17.2 114 Pemba 11.1 275 (7.5) 26
Region
Dodoma 42.5 344 21.1 128 Arusha 34.5 330 29.9 101 Kilimanjaro 34.5 385 32.4 110 Tanga 44.8 413 41.1 150 Morogoro 46.5 614 28.3 242 Pwani 43.0 1,313 34.8 477 Dar es Salaam 51.1 1,341 35.5 576 Lindi 34.7 249 19.2 72 Mtwara 41.2 322 33.8 108 Ruvuma 46.5 1,409 39.4 543 Iringa 41.0 887 43.5 311 Mbeya 45.7 979 43.9 356 Singida 41.9 229 26.5 82 Tabora 44.3 2,233 32.5 813 Rukwa 32.2 1,521 25.8 413 Kigoma 24.3 496 20.7 105 Shinyanga 46.8 1,525 39.6 581 Kagera 33.4 591 29.3 166 Mwanza 52.3 881 29.0 386 Mara 43.2 548 29.2 211 Manyara 44.6 299 23.2 112 Njombe 43.9 562 47.6 199 Katavi 38.1 1,699 32.8 532 Simiyu 34.8 466 34.2 140 Geita 45.4 611 19.5 231 Songwe 30.7 974 37.8 266 Kaskazini Unguja 14.8 142 * 16 Kusini Unguja 23.5 144 (2.0) 31 Mjini Magharibi 19.9 398 21.9 67 Kaskazini Pemba 9.8 127 * 11 Kusini Pemba 12.2 148 * 15

149
Table 15.4.C Condom use at last sex with a nonmarital, noncohabitating partner: Total (continued) Among persons age 15 years and older who reported having sex in the past 12 months, percentage who reported having a nonmarital, noncohabitating partner in the past 12 months; among those who reported having sex with a nonmarital, noncohabitating partner in the past 12 months, percentage who reported using a condom the last time they had sex with a nonmarital, noncohabitating partner, by selected demographic characteristics, THIS 2016-2017
Among persons who reported having sex in the past 12 months
Among persons who reported having sex
with a nonmarital, noncohabitating partner
in the past 12 months
Characteristic
Percentage who reported having sex with a nonmarital,
noncohabitating partner in the past 12 months
Number
Percentage who reported using a condom the last time
they had sex with a nonmarital, noncohabitating
partner1
Number
Marital status
Never married 98.1 3,930 34.1 3,386 Married or living together 17.8 16,056 33.7 2,348 Divorced or separated 93.2 1,800 23.1 1,482 Widowed 89.7 383 25.9 324
Education
No education 28.7 3,531 16.2 826 Pre-Primary 30.4 86 (18.1) 25 Primary 39.0 13,809 28.4 4,513 Post Primary Training 40.4 258 41.7 95 Secondary (O-Level) 58.7 3,419 40.5 1,601 Post-Secondary (O-Level) Training 56.3 549 45.3 258 Secondary (A-Level) 70.0 122 62.2 69 Post-Secondary (A-Level) Training 40.9 110 (51.6) 42 University 48.3 287 49.7 121
Wealth quintile Lowest 35.7 4,778 20.1 1,472 Second 36.8 4,730 27.2 1,478 Middle 41.6 4,870 30.4 1,636 Fourth 45.7 4,061 38.7 1,508 Highest 48.9 3,733 38.7 1,454
Age
15-19 76.4 2,278 26.5 1,506 20-24 60.3 3,923 36.3 1,857 25-29 43.9 3,615 34.4 1,219 30-34 34.0 3,047 31.0 870 35-39 30.9 2,555 33.9 677 40-44 31.4 2,112 28.8 578 45-49 27.3 1,507 27.0 377 50-54 19.9 1,100 34.0 200 55-59 17.4 707 29.7 120 60-64 11.8 522 11.8 65 65-69 12.2 340 (16.2) 43 70-74 9.1 226 * 19 75-79 6.4 124 * 8 ≥80 11.6 124 * 12
Total 15-24 66.2 6,201 32.0 3,363 Total 15-49 45.6 19,037 32.0 7,084 Total 50+ 15.7 3,143 26.9 467 Total 15+ 41.8 22,180 31.7 7,551 1Relates to Global AIDS Monitoring indicator 3.18: Condom use at last high-risk sex. Estimates in parentheses are based on a small number (25 to 49) of unweighted cases and should be interpreted with caution. An asterisk indicates that an estimate is based on a very small number (less than 25) of unweighted cases and has been suppressed. The sum of the sample sizes for a given classification may be less than the total sample size because of missing responses to the classification variable

150
15.5 Male Circumcision Among males aged 15 years and older, 49.7% reported undergoing medical circumcision and 27.9% reported having a non-medical circumcision. The percentage of males who reported being uncircumcised ranged from 34.4% among those aged 75-79 years to 15.1% among those aged 20-24 years. Among those who tested HIV positive in the survey, 42.5% reported having undergone medical circumcision, while 38.0% self-reported being uncircumcised. Of those who tested HIV negative, 20.2% self-reported not having undergone any form of circumcision, while 49.3% reported having undergone medical circumcision. Coverage of male circumcision also varied by regions. In population dense regions, men not circumcised ranged from 3.5% in Dar es Salaam and 24.4% in Mwanza to 32.6% in Mbeya. Zanzibar and Dodoma had less than 2% of men uncircumcised and Songwe region had the greatest proportion of uncircumcised men (58.4%) (Table 15.5.A). The percentage of males who reported being circumcised varied with age, education, and wealth quintile. The proportion who reported medical circumcision was 83.4% in males with A level secondary education compared to 25.6% of males with no education. The frequency of non-medical circumcision was approximately three times greater in men with no education (35.6%) compared to men with A level secondary education (11.8%). The highest frequency of medical circumcision was reported among those in the highest wealth quintile (69.3%) (Table 15.5.A).
Table 15.5.A Male circumcision Percent distribution of males aged 15 years and older by self-reported circumcision status, by result of PHIA survey HIV test and selected demographic characteristics, THIS 2016-2017 Circumcised1
Uncircumcised Unknown Total Number Characteristic Medical
circumcision Non-medical circumcision
Result of PHIA survey HIV test HIV positive 42.5 18.3 38.0 1.2 100.0 564 HIV negative 49.3 28.0 20.2 2.4 100.0 13,186 Not tested 58.8 31.7 5.9 3.5 100.0 682
Residence
Urban 63.3 25.7 8.0 3.0 100.0 4,446 Rural 42.2 29.2 26.4 2.2 100.0 9,986
Tanzania Mainland/Zanzibar
Mainland 49.2 28.2 20.5 2.1 100.0 13,721 Urban 63.3 25.9 8.2 2.6 100.0 4,231 Rural 41.6 29.4 27.1 1.9 100.0 9,490
Zanzibar 65.1 19.1 0.1 15.7 100.0 711 Unguja 68.6 15.4 0.2 15.8 100.0 511 Pemba 53.7 31.2 0.0 15.1 100.0 200
Region Dodoma 39.1 56.6 1.5 2.7 100.0 247 Arusha 58.6 34.7 4.6 2.1 100.0 195 Kilimanjaro 82.7 14.2 2.6 0.6 100.0 268 Tanga 56.9 37.7 2.1 3.3 100.0 293 Morogoro 46.0 47.6 4.3 2.2 100.0 339 Pwani 32.2 62.1 2.8 2.9 100.0 823 Dar es Salaam 52.6 39.8 3.5 4.1 100.0 826 Lindi 8.5 87.8 2.5 1.2 100.0 161 Mtwara 24.9 68.7 2.0 4.4 100.0 222 Ruvuma 33.1 43.2 23.1 0.6 100.0 895 Iringa 72.7 6.5 20.3 0.5 100.0 584 Mbeya 60.8 5.8 32.6 0.9 100.0 601 Singida 63.3 23.1 5.0 8.7 100.0 153 Tabora 41.9 13.9 42.2 2.0 100.0 1,494

151
Table 15.5.A Male circumcision (continued) Percent distribution of males aged 15 years and older by self-reported circumcision status, by result of PHIA survey HIV test and selected demographic characteristics, THIS 2016-2017 Circumcised1
Uncircumcised Unknown Total Number Characteristic Medical
circumcision Non-medical circumcision
Rukwa 39.1 4.8 54.7 1.4 100.0 922 Kigoma 53.3 10.4 35.0 1.3 100.0 332 Shinyanga 41.3 4.7 53.1 0.9 100.0 1,030 Kagera 41.2 16.1 41.2 1.4 100.0 421 Mwanza 65.2 9.5 24.4 1.0 100.0 605 Mara 40.0 49.3 10.2 0.6 100.0 360 Manyara 52.9 39.6 2.9 4.5 100.0 201 Njombe 59.9 5.4 33.7 1.1 100.0 364 Katavi 53.2 8.4 36.2 2.1 100.0 1,056 Simiyu 43.9 2.4 53.5 0.3 100.0 311 Geita 55.5 8.2 35.1 1.2 100.0 392 Songwe 38.0 2.6 58.4 0.9 100.0 626 Kaskazini Unguja 68.7 14.0 1.0 16.3 100.0 109 Kusini Unguja 56.6 20.6 0.5 22.3 100.0 109 Mjini Magharibi 70.9 14.6 0.0 14.5 100.0 293 Kaskazini Pemba 53.5 34.8 0.0 11.7 100.0 88 Kusini Pemba 53.9 28.3 0.0 17.8 100.0 112
Marital status
Never married 59.8 22.2 14.9 3.1 100.0 4,613 Married or living together 43.6 31.2 23.1 2.1 100.0 8,694 Divorced or separated 49.1 30.7 18.0 2.2 100.0 855 Widowed 29.1 39.3 29.1 2.5 100.0 240
Education No education 25.6 35.6 36.1 2.7 100.0 1,767 Pre-Primary 35.7 38.5 24.7 1.2 100.0 84 Primary 43.5 31.0 23.5 2.0 100.0 8,878 Post Primary Training 64.7 23.1 11.4 0.8 100.0 221 Secondary (O-Level) 69.4 19.9 6.8 3.9 100.0 2,667 Post-Secondary (O-Level) Training 76.9 16.5 4.3 2.2 100.0 348 Secondary (A-Level) 83.4 11.8 1.0 3.8 100.0 134 Post-Secondary (A-Level) Training 72.9 16.8 7.7 2.6 100.0 95 University 87.6 5.7 3.1 3.6 100.0 230
Wealth quintile
Lowest 32.1 31.0 34.9 2.0 100.0 3,198 Second 39.6 29.2 29.8 1.4 100.0 3,210 Middle 48.4 28.3 20.6 2.6 100.0 3,195 Fourth 60.3 28.2 9.1 2.4 100.0 2,518 Highest 69.3 22.8 4.0 3.8 100.0 2,307
Age
15-19 55.6 21.6 19.8 3.0 100.0 2,624 20-24 57.9 24.2 15.1 2.8 100.0 2,082 25-29 56.7 24.8 15.5 3.1 100.0 1,779 30-34 49.8 28.9 18.9 2.4 100.0 1,541 35-39 47.5 29.4 20.4 2.7 100.0 1,373 40-44 46.0 30.1 22.4 1.4 100.0 1,217 45-49 41.0 36.9 21.0 1.2 100.0 915 50-54 40.8 31.6 26.0 1.6 100.0 763 55-59 40.1 32.1 26.4 1.5 100.0 597 60-64 36.1 38.4 24.2 1.2 100.0 482 65-69 26.5 39.6 33.5 0.4 100.0 359 70-74 25.0 39.9 31.8 3.2 100.0 266 75-79 18.1 42.1 34.4 5.4 100.0 199 ≥80 18.6 49.0 30.3 2.1 100.0 235
Total 15-49 52.6 26.4 18.5 2.6 100.0 11,531 Total 50+ 34.0 36.3 27.9 1.8 100.0 2,901

152
Table 15.5.A Male circumcision (continued) Percent distribution of males aged 15 years and older by self-reported circumcision status, by result of PHIA survey HIV test and selected demographic characteristics, THIS 2016-2017 Circumcised1
Uncircumcised Unknown Total Number Characteristic Medical
circumcision Non-medical circumcision
Total 15-64 51.1 27.1 19.3 2.5 100.0 13,373
Total 15+ 49.7 27.9 20.0 2.5 100.0 14,432 1Relates to Global AIDS Monitoring indicator 3.16: Prevalence of male circumcision and PEPFAR VMMC_TOTALCIRC NAT / SUBNAT. The sum of the sample sizes for a given classification may be less than the total sample size because of missing responses to the classification variable.
15.6 Gaps and Unmet Needs
§ There are differences in HIV prevalence by age at sexual debut, with HIV prevalence of 5.6 % among those who had sex before the age of 15 years and HIV prevalence of 3.9 % among those with sexual debut over the age of 25 years.
§ Regardless of number of sexual partners in the last 12 months, females had a higher HIV prevalence than males
§ HIV prevalence of women who had two or more sexual partners in the last 12 months was nearly three times as high (12.0%) compared to men (4.2%).
§ The HIV prevalence among males who did not use condoms at their last paid sexual intercourse was lower compared to females (5.9% and 10.7%, respectively). This suggests additional research is needed to understand the lack of use of condoms amongst HIV-positive men.
§ The prevalence of circumcision was higher (77.3%) among HIV-negative males than in the HIV-positive males (60.8%).

153
16.1 Key Findings
16.2 Background Tanzania has a strong stand against HIV stigma and discrimination. From the onset of the HIV/AIDS epidemic stakeholders including community groups, researchers, and policy makers have worked to address HIV-related discrimination. Among the government efforts to reduce HIV/AIDS stigma is providing care and free HIV treatment services. These efforts allow Tanzania to position itself to scale up stigma and discrimination control activities as part of HIV/AIDS programming. The role that stigma plays in increasing the spread of HIV has been identified in the Tanzanian Policy on HIV/AIDS (2001) and the Health Sector HIV/AIDS Strategic Plan IV (HSHSP 2017-2022).1,2 Stigma reduction is recognized as a key guiding principle that must be addressed by all sectors at all levels. Three programmatically actionable drivers of stigma have been previously identified: 1) lack of recognition of stigma, 2) fear of acquiring HIV through casual contact, and 3) values linking people with HIV to assumed immoral behavior. The National Guide on the Integration of Stigma and Discrimination Reduction in HIV Programs (2009) proposed that awareness can be increased through the creation of information, education, and communication materials that provide information related to HIV stigma.3 To address the second fear, it is proposed that consistent and continuous delivery of information on HIV transmission is needed. Lastly, open and guided discussion about sexual values, prejudices, and context, in which risky behaviors take place, must be promoted. 16.3 Discriminatory Attitudes Towards People Living with HIV One quarter (25.6%) of adults aged 15 years and older who had ever heard of HIV, reported discriminatory attitudes towards people living with HIV (PLHIV) (responded “No” to either of the two questions used to assess discriminatory attitudes). There were slight variations in discriminatory attitudes based on geographic area, marital status, socioeconomic status, and age. About 17.3% of adults aged 15 years and older in urban areas reported discriminatory attitudes towards PLHIV compared to 30.7% of adults in rural areas. Discriminatory attitudes were slightly more prevalent in Zanzibar (30.5%) compared to mainland Tanzania (25.5%). The lowest proportions of persons who reported discriminatory attitudes toward people with HIV were in Njombe (15.0%), Mbeya (15.5%), Dar es Salaam (17.1%), and Iringa (17.5%). Large variation in discriminatory attitudes was observed across different levels of educational attainment;
16 DISCRIMINATORY ATTITUDES TOWARDS PEOPLE LIVING WITH HIV
§ Among adults aged 15 years and older who had ever heard of HIV, 25.6% reported discriminatory attitudes towards PLHIV.
§ More adults in rural areas (30.7%) reported discriminatory attitudes towards PLHIV, compared to those in urban areas (17.3%).
§ Variation in discriminatory attitudes occurs across different levels of educational attainment; 41.7% of those with no education reported discriminatory attitudes in contrast to 12.2% among those with A level secondary education and 9.3% among those with university education.
16 DISCRIMINATORY ATTITUDES TOWARDS PEOPLE LIVING WITH HIV

154
41.7% of those with no education reported discriminatory attitudes in contrast to 12.2% among those with A level secondary education. Similarly, 39.2% of those in the lowest wealth quintile reported discriminatory attitudes compared to 14.6% among those in the highest wealth quintile. Individuals aged 80 years and older had the highest percentages of persons who reported discriminatory attitudes (52.2%). Among those aged 15-79 years, the proportion of persons who reported discriminatory attitudes ranged from 18.6% to 38.2%. Among those aged 15-49 years, the proportion of persons who reported discriminatory attitudes was lower (24.7%) compared to those aged 50 years and older (30.7%) (Table 16.3.A).
Table 16.3.A Discriminatory attitudes toward people living with HIV Among persons aged 15 years and older, percentage who report discriminatory attitudes towards people living with HIV, by selected demographic characteristics, THIS 2016-2017
Would you buy fresh vegetables from a
shopkeeper or vendor if you knew that this person had HIV?
Do you think that children living with HIV should be able
to attend school with children who are HIV negative?
Both questions
Characteristic Percentage who responded "No"
Percentage who responded "No"
Percentage who responded "No" to either of the two questions1
Number
Residence Urban 12.5 8.7 17.3 10,478 Rural 24.3 17.0 30.7 20,512
Tanzania Mainland/Zanzibar
Mainland 19.7 13.8 25.5 29,326 Urban 12.3 8.6 17.1 10,000 Rural 24.2 16.9 30.6 19,326
Zanzibar 23.4 17.9 30.5 1,664 Unguja 18.6 15.4 26.4 1,185 Pemba 38.3 26.0 43.5 479
Region
Dodoma 27.3 17.2 33.2 515 Arusha 20.9 12.7 23.6 453 Kilimanjaro 16.3 12.7 22.6 606 Tanga 23.3 14.8 28.8 638 Morogoro 17.1 11.7 23.7 798 Pwani 17.0 13.4 23.1 1,849 Dar es Salaam 12.0 8.4 17.1 1,866 Lindi 24.2 13.8 28.7 313 Mtwara 19.2 14.3 25.3 403 Ruvuma 18.7 14.4 25.5 1,859 Iringa 12.1 10.7 17.5 1,362 Mbeya 10.0 9.1 15.5 1,389 Singida 18.9 19.3 27.1 351 Tabora 31.2 21.9 38.3 2,851 Rukwa 19.8 13.2 25.4 2,023 Kigoma 28.9 18.5 34.4 729 Shinyanga 22.8 15.4 28.8 2,050 Kagera 23.5 13.7 28.5 822 Mwanza 16.1 11.8 22.1 1,266 Mara 21.9 15.3 28.2 830 Manyara 22.4 17.6 29.3 407 Njombe 11.2 6.7 15.0 897 Katavi 20.7 12.4 25.9 2,251 Simiyu 30.6 19.0 36.6 661 Geita 22.2 14.9 27.8 789

155
Table 16.3.A Discriminatory attitudes toward people living with HIV (continued) Among persons aged 15 years and older, percentage who report discriminatory attitudes towards people living with HIV, by selected demographic characteristics, THIS 2016-2017
Would you buy fresh vegetables from a
shopkeeper or vendor if you knew that this person
had HIV?
Do you think that children living with HIV should be able
to attend school with children who are HIV negative?
Both questions
Percentage who responded "No" Percentage who
responded "No"
Percentage who responded "No" to either of the two
questions1
Number
Region (continued) Songwe 14.2 11.9 20.9 1,348 Kaskazini Unguja 29.4 18.1 35.5 275 Kusini Unguja 19.3 22.6 29.8 232 Mjini Magharibi 16.6 13.5 24.2 678 Kaskazini Pemba 45.4 30.7 49.2 213 Kusini Pemba 32.4 22.1 38.7 266
Marital status Never married 21.4 15.5 28.3 7,990 Married or living together 18.7 12.9 24.0 18,560 Divorced or separated 18.8 12.7 23.8 2,710 Widowed 25.2 17.0 30.9 1,686
Education No education 34.7 24.7 41.7 5,011 Pre-Primary 27.2 18.2 35.3 158 Primary 21.1 13.9 26.7 18,388 Post Primary Training 11.3 6.9 14.2 401 Secondary (O-Level) 10.4 9.1 16.8 5,598 Post-Secondary (O-Level) Training 4.3 4.2 7.9 726 Secondary (A-Level) 7.8 4.7 12.2 208 Post-Secondary (A-Level) Training 1.6 4.7 6.4 132 University 3.7 6.1 9.3 352
Wealth quintile
Lowest 32.0 23.0 39.2 6,347 Second 24.6 15.7 30.6 6,524 Middle 19.8 13.9 25.8 6,986 Fourth 14.3 9.9 19.5 5,725 Highest 9.8 7.7 14.6 5,399
Age 15-19 28.0 18.9 35.2 5,391 20-24 17.7 13.8 24.9 4,844 25-29 14.8 11.3 20.2 4,256 30-34 14.7 11.3 20.5 3,524 35-39 14.3 10.5 18.6 3,059 40-44 17.2 10.9 22.4 2,535 45-49 18.0 10.5 21.7 1,900 50-54 20.7 14.1 25.7 1,563 55-59 23.1 15.7 27.8 1,095 60-64 24.5 13.2 28.5 953 65-69 27.4 19.1 33.6 663 70-74 31.6 19.9 38.2 506 75-79 30.0 21.1 35.6 342 ≥80 45.8 30.3 52.2 359
Total 15-49 18.7 13.3 24.7 25,509 Total 50+ 25.6 16.7 30.7 5,481 Total 15+ 19.8 13.9 25.6 30,990 1Relates to Global AIDS Monitoring indicator 4.1: Discriminatory attitudes towards people living with HIV. 2IIncludes only participants who answered both questions. The sum of the sample sizes for a given classification may be less than the total sample size because of missing responses to the classification variable

156
16.4 Gaps and Unmet Needs
16.5 References 1. United Republic of Tanzania Prime Minister’s Office. National Policy on HIV/AIDS. Dar es Salaam, Tanzania; 2001 2. United Republic of Tanzania Ministry of Health, Community Development, Gender, Elderly and Children.
Health Sector Strategic Plan IV 2015-2020. Dar es Salaam, Tanzania: MoHCDGEC; 2015. 3. United Republic of Tanzania Prime Minister’s Office, Tanzania Commission for AIDS. National Guide on
the Integration of Stigma and Discrimination Reduction in HIV Programs. Dar es Salaam, Tanzania: TACAIDS; 2009.
§ Discriminatory attitudes towards PLHIV are higher among persons aged 50 years and older compared to adults aged 15-49 years (30.7% and 24.7% respectively).
§ Discriminatory attitudes were also higher among those who lived in rural areas, had lower level of educational attainment, and were in lower wealth quintiles.

157
17.1 Key Findings
17.2 Background PLHIV are at risk for acquiring other diseases, including TB, hepatitis B, hepatitis C, syphilis, and other STIs. TB is one of the leading causes of death for PLHIV. A UNAIDS model estimates that there were 27,000 TB-related deaths among PLHIV in Tanzania in 2016 (UNAIDS 2016).1 This chapter describes the TB clinical care cascade for HIV-positive individuals: received care at a TB clinic, TB diagnoses among those receiving care, and treatment among those diagnosed with TB. HBV infection can cause acute or chronic liver infections. It is transmitted through infected blood products, unprotected sex, infected items such as needles, razor blades, dental or medical equipment, unscreened blood transfusion, or from mother to child at birth. Hepatitis C can also cause acute or chronic liver infections. Left untreated, both chronic hepatitis B and chronic hepatitis C can develop into liver cirrhosis or cancer in some patients. These data are the first national estimates of HBV infection and the prevalence of past or present hepatitis C in Tanzania. Syphilis in both women and men is associated with serious complications. It remains the leading cause of perinatal mortality and morbidity in many parts of the world despite widely available and affordable technology for diagnosing and treating infection in pregnant women. Females living with HIV are at greater risk of developing cervical cancer because their weakened immune systems are not able to clear human papillomavirus (HPV) infections. WHO recommends HPV screening and treatment for all sexually-active HIV-positive women.2 This survey provides population-based rates of screening not available from routine clinic data, which do not capture females not in care. This chapter presents cervical cancer screening rates by age and socio-demographic characteristics.
§ Tuberculosis: Among self-reported HIV-positive persons aged 15 years and older, 27.7% reported ever visiting a TB clinic, of which 54.2% were diagnosed with TB, and, of these, 98.7% received TB treatment.
§ Syphilis: The prevalence of having ever been infected and active syphilis infection for adults aged 15 years and older was 5.6% and 0.9 %, respectively. Active syphilis infection was higher among HIV-positive (3.7%) than among HIV-negative (0.8 %) persons.
§ Hepatitis B: Among adults aged 15 years and older, the prevalence of hepatitis B was 3.5%. The highest prevalence of hepatitis B was among those aged 35-39 years (10.2%).
§ Hepatitis C: Prevalence of past or current hepatitis C among adults aged 15-64 years was 1.0% overall.
§ STI: Individuals living with HIV had a higher prevalence of abnormal discharge and ulcers than those not living with HIV.
§ Cervical Cancer: Among HIV-positive women aged 30-49 years, 17.7% reported having ever been screened for cervical cancer.
17 TUBERCULOSIS, SYPHILIS, HEPATITIS B, HEPATITIS C, SEXUALLY TRANSMITTED INFECTION SYMPTOMS, AND CERVICAL CANCER

158
17.3 Tuberculosis Among self-reported HIV-positive persons aged 15 years and older, 27.7% reported ever visiting a TB clinic (29.7% of HIV-positive males compared to 26.9% of HIV-positive females). Among those who ever visited a TB clinic, 54.2% were diagnosed with TB. Among those diagnosed with TB, 100.0% of males and 98.1% of females reported receiving TB treatment (Table 17.3.A).
Table 17.3.A Tuberculosis clinic attendance and services among HIV-positive adults Among self-reported HIV-positive persons aged 15 years and older, percentage who ever visited a TB clinic; among those who had ever visited a TB clinic, percentage who were diagnosed for TB; and among those diagnosed with TB, percentage who were treated for TB, by sex, THIS 2016-2017
Among HIV-positive persons Among HIV-positive
persons who ever visited a TB clinic
Among HIV-positive persons
who were diagnosed with TB
Characteristic Percentage who ever visited a TB
clinic Number
Percentage who were
diagnosed with TB
Number Percentage who
were treated for TB
Number
Sex
Male 29.7 299 55.2 81 (100.0) 45 Female 26.9 803 53.7 197 98.1 95
Total 15+ 27.7 1,102 54.2 278 98.7 140 Estimates in parentheses are based on a small number (25 to 49) of unweighted cases and should be interpreted with caution.
17.4 Syphilis Syphilis is one of the STIs routinely screened among pregnant women attending ANC in Tanzania. An individual from the general population is screened if there are suggestive symptoms at presentation. For THIS, individuals aged 15 years and older were tested to obtain prevalence of syphilis antibodies in the general population as well as active infection. In the general population, among individuals aged 15 years and older tested for syphilis, 5.6% (5.6% males and 5.5% females) were ever infected by syphilis, and, among them, 0.9% (1.0% males and 0.9% females) had active infection (Figure 17.4.A). Active syphilis infection was higher among HIV-positive (3.7%) than among HIV-negative persons (0.8%). Regional variation of infection was also observed ranging from 3.1% in Dodoma to less than 0.1% in Zanzibar. Syphilis infection in rural areas was almost twice as high as urban areas (1.1% versus 0.6%, respectively) (Table 17.4.A).
17 TUBERCULOSIS, SYPHILIS, HEPATITIS B AND C, STI SYMPTOMS, AND CERVICAL CANCER SCREENING
17 TUBERCULOSIS, SYPHILIS, HEPATITIS B AND C, STI SYMPTOMS, AND CERVICAL CANCER SCREENING

159
Table 17.4.A Syphilis prevalence
Prevalence of syphilis (ever infected and active infection) among persons age 15 years and older, by sex, result of THIS HIV test, and selected demographic characteristics, THIS 2016-2017 Males Females Total
Characteristic Percentage
ever infected
Percentage active
infection Number
Percentage ever
infected
Percentage active
infection Number
Percentage ever
infected
Percentage active
infection Number
Result of PHIA survey HIV test
HIV positive 14.1 3.8 564 12.2 3.7 1267 12.8 3.7 1831 HIV negative 5.3 0.9 13186 5.1 0.7 16561 5.2 0.8 29747
Residence Urban 3.6 0.5 4106 4.5 0.7 6033 4.0 0.6 10139 Rural 6.7 1.2 9644 6.2 1.1 11795 6.4 1.1 21439
Tanzania Mainland/Zanzibar Mainland 5.7 1.0 13079 5.7 0.9 16847 5.7 1.0 29926
Urban 3.7 0.5 3902 4.5 0.7 5771 4.1 0.6 9673 Rural 6.8 1.3 9177 6.4 1.1 11076 6.6 1.2 20253
Zanzibar 1.0 0.0 671 0.8 0.0 981 0.9 0.0 1652 Unguja 0.7 0.0 488 0.7 0.0 693 0.7 0.0 1181 Pemba 1.7 0.0 183 1.1 0.0 288 1.4 0.0 471
Region Dodoma 10.5 4.7 226 7.2 1.5 280 8.8 3.1 506 Arusha 6.5 1.3 175 2.2 0.4 255 4.2 0.8 430 Kilimanjaro 1.5 0.0 241 3.0 0.3 341 2.3 0.1 582 Tanga 3.5 0.3 283 2.9 0.6 367 3.2 0.4 650 Morogoro 6.2 0.4 324 4.5 0.6 491 5.2 0.5 815 Pwani 5.4 0.3 764 4.5 0.2 1071 4.9 0.3 1835 Dar es Salaam 1.5 0.1 724 2.0 0.4 1049 1.8 0.2 1773 Lindi 11.0 0.4 156 5.5 0.0 181 8.4 0.2 337 Mtwara 9.2 1.3 206 10.1 1.3 208 9.6 1.3 414 Ruvuma 6.9 0.8 852 6.7 1.0 1062 6.8 0.9 1914 Iringa 6.4 1.0 550 8.9 1.3 792 7.7 1.1 1342 Mbeya 6.4 1.1 559 7.9 1.9 765 7.2 1.5 1324 Singida 5.9 0.4 139 6.6 1.0 193 6.3 0.7 332 Tabora 6.3 1.4 1454 6.9 1.3 1607 6.6 1.4 3061 Rukwa 4.5 0.8 896 5.0 1.2 1183 4.8 1.0 2079 Kigoma 3.6 1.6 329 3.3 0.0 448 3.4 0.8 777 Shinyanga 6.0 0.5 1003 7.3 1.0 1206 6.6 0.7 2209 Kagera 6.1 1.9 410 7.1 1.6 447 6.6 1.7 857 Mwanza 8.0 1.0 584 9.4 1.3 701 8.7 1.1 1285 Mara 4.8 0.6 353 6.1 0.4 511 5.5 0.5 864 Manyara 2.9 0.0 191 2.6 1.3 226 2.7 0.6 417 Njombe 5.2 1.2 349 9.2 2.3 534 7.5 1.8 883 Katavi 4.8 1.0 1024 5.0 0.6 1302 4.9 0.8 2326 Simiyu 5.8 1.0 303 4.9 0.3 424 5.3 0.6 727 Geita 9.1 1.9 384 11.6 3.1 436 10.3 2.5 820 Songwe 6.1 1.3 600 4.3 0.8 767 5.2 1.0 1367 Kaskazini Unguja 1.2 0.0 106 1.0 0.0 177 1.1 0.0 283 Kusini Unguja 0.5 0.0 108 0.0 0.0 126 0.3 0.0 234 Mjini Magharibi 0.7 0.0 274 0.7 0.0 390 0.7 0.0 664 Kaskazini Pemba 2.8 0.0 77 2.4 0.0 129 2.6 0.0 206 Kusini Pemba 0.7 0.0 106 0.0 0.0 159 0.3 0.0 265
Marital status Never married 1.8 0.5 4384 1.2 0.4 3587 1.6 0.4 7971 Married or living together 7.4 1.2 8287 5.9 1.0 10571 6.6 1.1 18858 Divorced or separated 9.5 1.9 820 9.0 1.3 1980 9.2 1.5 2800 Widowed 15.1 3.2 232 10.3 1.6 1660 10.8 1.8 1892

160
Table 17.4.A Syphilis prevalence (continued) Prevalence of syphilis (ever infected and active infection) among persons age 15 years and older, by sex, result of THIS HIV test, and selected demographic characteristics, THIS 2016-2017 Males Females Total
Characteristic Percentage
ever infected
Percentage active
infection Number
Percentage ever
infected
Percentage active
infection Number
Percentage ever
infected
Percentage active
infection Number
Education No education 9.7 2.3 1697 9.4 1.4 4001 9.5 1.7 5698 Pre-Primary 3.5 2.7 80 8.4 1.9 88 6.0 2.3 168 Primary 6.6 1.1 8540 5.8 1.0 10105 6.2 1.0 18645 Post Primary Training 9.3 0.1 211 3.9 0.9 185 7.1 0.4 396 Secondary (O-Level) 1.5 0.3 2508 1.2 0.3 2874 1.4 0.3 5382 Post-Secondary (O-Level) Training
2.1 0.2 322 1.1 0.7 351 1.7 0.4 673
Secondary (A-Level) 2.0 0.0 116 1.9 1.9 68 2.0 0.6 184 Post-Secondary (A-Level) Training 0.0 0.0 79 (0.0) (0.0) 34 0.0 0.0 113
University 1.9 0.0 190 0.3 0.3 110 1.4 0.1 300 Wealth quintile
Lowest 7.3 1.4 3100 6.9 1.0 3789 7.1 1.2 6889 Second 7.0 1.6 3124 7.0 1.3 3763 7.0 1.4 6887 Middle 7.0 1.1 3075 6.3 1.0 4004 6.6 1.1 7079 Fourth 4.2 0.6 2347 4.9 0.9 3219 4.6 0.7 5566 Highest 2.2 0.1 2101 2.6 0.4 3048 2.4 0.3 5149
Pregnancy status Currently pregnant1 NA NA NA 3.2 1.1 1307 NA NA NA Not currently pregnant NA NA NA 5.7 0.9 16252 NA NA NA
Age 15-19 1.5 0.5 2533 1.1 0.4 2999 1.3 0.4 5532 20-24 1.3 0.6 1987 2.1 0.6 2845 1.7 0.6 4832 25-29 2.6 0.6 1670 2.9 1.0 2521 2.7 0.8 4191 30-34 3.1 0.5 1453 4.6 1.1 2061 3.9 0.8 3514 35-39 5.5 0.9 1307 7.3 0.8 1749 6.4 0.8 3056 40-44 8.5 1.1 1144 8.5 1.4 1405 8.5 1.2 2549 45-49 12.9 1.3 877 11.9 1.2 1048 12.4 1.3 1925 50-54 16.8 1.7 728 13.2 1.5 872 15.0 1.6 1600 55-59 14.9 2.3 572 11.9 1.3 580 13.3 1.8 1152 60-64 12.4 3.2 459 10.0 1.5 558 11.0 2.3 1017 65-69 13.0 1.3 344 10.8 0.3 395 11.8 0.8 739 70-74 19.6 5.2 254 9.7 0.5 322 13.8 2.5 576 75-79 16.9 5.4 193 11.5 1.7 221 13.9 3.4 414 ≥80 15.5 2.0 229 12.9 2.9 252 14.1 2.5 481
Total 15-24 1.4 0.5 4520 1.6 0.5 5844 1.5 0.5 10364 Total 15-49 3.8 0.7 10971 4.2 0.8 14628 4.0 0.8 25599 Total 50+ 15.4 2.6 2779 11.6 1.3 3200 13.4 1.9 5979 Total 15+ 5.6 1.0 13750 5.5 0.9 17828 5.6 0.9 31578 1Relates to Global AIDS Monitoring indicator 2.4: Syphilis among pregnant women. Estimates in parentheses are based on a small number (25 to 49) of unweighted cases and should be interpreted with caution
17.5 Hepatitis B Hepatitis B is one of the blood borne diseases routinely screened among individuals donating blood at the blood bank in Tanzania. An individual from the general population is tested if they have suggestive symptoms. As the first survey to test for hepatitis B in a household-based population, THIS tested individual aged 15 years and older to get prevalence of hepatitis B surface antigen (HBsAg) in the general population, indicative of active infection (either acute or chronic). Among adults aged 15 years and older, prevalence of HBV infection for HIV-positive individuals (5.2%) was higher than for HIV-negative individuals (3.4%). There was significant regional variation ranging from 10.7% in Manyara and 7.9% in Mwanza and 0.9% in Katavi. The prevalence of hepatitis B was higher among married or living together individuals (4.6%) than those who were never married (2.1%), divorced or separated (2.7%), and widowed

161
(1.5%). The highest prevalence of hepatitis B was among those aged 35-39 years (10.2%). Among those aged 35-39 years, males had a higher prevalence of hepatitis B than females (13.5% and 7.1%, respectively). Males with no education had higher prevalence of hepatitis B (9.5%) compared to those with secondary (O-level) education (1.6%) (Table 17.5.A).
Table 17.5.A Hepatitis B prevalence Prevalence of hepatitis B (positive for hepatitis B surface antigen) among persons aged 15 years and older, by sex, result of THIS HIV test, and selected demographic characteristics, THIS 2016-2017 Males Females Total
Characteristic Percentage infected Number Percentage
infected Number Percentage infected Number
Result of PHIA survey HIV test HIV positive * 18 0.0 50 5.2 68 HIV negative 3.4 538 3.5 704 3.4 1,242 Not tested * 0 * 0 * 0
Tanzania Mainland/Zanzibar Mainland 4.2 152 4.1 245 4.2 397
Urban 3.6 404 2.8 509 3.2 913 Rural * 0 * 0 * 0
Zanzibar * 0 * 0 * 0 Unguja 3.9 533 3.4 714 3.6 1,247 Pemba 4.4 142 4.2 236 4.3 378
Residence
Urban * 20 (0.0) 27 (0.0) 47 Rural * 3 * 13 * 16
Region Dodoma * 8 * 14 * 22 Arusha * 9 * 10 * 19 Kilimanjaro * 11 * 11 * 22 Tanga * 15 * 17 (2.8) 32 Morogoro * 13 * 22 (2.2) 35 Pwani (2.2) 35 (0.0) 45 1.1 80 Dar es Salaam (0.0) 27 (2.0) 42 1.0 69 Lindi * 6 * 13 * 19 Mtwara * 10 * 9 * 19 Ruvuma (3.9) 43 (11.8) 49 7.7 92 Iringa (2.1) 27 (0.0) 31 1.1 58 Mbeya * 18 (0.0) 34 5.5 52 Singida * 10 * 13 * 23 Tabora (0.0) 49 3.1 65 1.6 114 Rukwa * 22 (2.5) 47 1.5 69 Kigoma * 11 * 17 (5.3) 28 Shinyanga (3.4) 38 1.5 58 2.4 96 Kagera * 17 (0.0) 25 (0.0) 42 Mwanza * 22 * 23 (7.9) 45 Mara * 17 * 21 (6.0) 38 Manyara * 9 * 16 (10.7) 25 Njombe * 15 * 21 (2.4) 36 Katavi (0.0) 36 1.5 53 0.9 89 Simiyu * 17 * 17 (2.6) 34 Geita * 15 * 12 (0.0) 27 Songwe (2.9) 33 (0.0) 29 1.7 62 Kaskazini Unguja * 3 * 7 * 10 Kusini Unguja * 3 * 3 * 6 Mjini Magharibi * 14 * 17 (0.0) 31 Kaskazini Pemba * 2 * 10 * 12 Kusini Pemba * 1 * 3 * 4

162
Table 17.5.A Hepatitis B prevalence (continued) Prevalence of hepatitis B (positive for hepatitis B surface antigen) among persons aged 15 years and older, by sex, result of THIS HIV test, and selected demographic characteristics, THIS 2016-2017 Males Females Total
Characteristic Percentage infected Number Percentage
infected Number Percentage infected Number
Marital status
Never married 1.8 185 2.7 142 2.1 327 Married or living together 5.5 326 3.8 447 4.6 773 Divorced or separated (1.0) 37 3.5 90 2.7 127 Widowed * 7 1.6 74 1.5 81
Education No education 9.5 62 3.4 176 5.0 238 Pre-Primary * 6 * 4 * 10 Primary 4.2 361 3.0 432 3.6 793 Post Primary Training * 9 * 3 * 12 Secondary (O-Level) 1.6 85 3.6 116 2.5 201 Post-Secondary (O-Level) Training * 13 * 12 (5.9) 25 Secondary (A-Level) * 5 * 4 * 9 Post-Secondary (A-Level) Training * 7 * 0 * 7 University * 8 * 6 * 14
Wealth quintile
Lowest 3.8 137 3.1 168 3.4 305 Second 2.2 110 1.9 159 2.0 269 Middle 7.0 128 2.8 176 4.9 304 Fourth 0.0 103 3.0 131 1.5 234 Highest 5.0 78 5.9 120 5.5 198
Age
15-19 2.3 112 1.1 127 1.7 239 20-24 0.7 67 7.9 110 4.3 177 25-29 6.4 61 5.3 110 5.8 171 30-34 1.4 66 1.3 86 1.3 152 35-39 (13.5) 45 7.1 71 10.2 116 40-44 6.1 56 0.0 65 3.0 121 45-49 (4.6) 30 (1.2) 46 2.7 76 50-54 (3.5) 29 (1.4) 38 2.5 67 55-59 (0.0) 26 * 20 (0.0) 46 60-64 (0.0) 25 * 20 (0.0) 45 65-69 * 19 (0.0) 25 (0.0) 44 70-74 * 10 * 18 (4.9) 28 75-79 * 4 * 8 * 12 ≥80 * 6 * 10 * 16
Total 15-49 4.3 437 3.7 615 4.0 1,052 Total 50+ 1.1 119 1.2 139 1.2 258 Total 15+ 3.8 556 3.3 754 3.5 1,310 Estimates in parentheses are based on a small number (25 to 49) of unweighted cases and should be interpreted with caution. An asterisk indicates that an estimate is based on a very small number (less than 25) of unweighted cases and has been suppressed.
17.6 Self-Reported Symptoms and Diagnosis of Sexually Transmitted Infection Among males aged 15 years and older, 5.3% reported having had abnormal discharge from the penis and 7.4% having had an ulcer or sore on or near the penis in the 12 months preceding the survey. Among HIV-positive males aged 15 years and older, 8.3% reported having had abnormal discharge from the penis and 14.3% having had an ulcer, while among HIV-negative males, 5.4% reported having had abnormal discharge from the penis and 7.5% reported having had an ulcer (Table 17.6.A). Abnormal penile discharge was reported with the highest frequency among males aged 20-24 years and aged 25-29 years (6.3%) and with the lowest frequency among those aged 80 years and older (1.6%).

163
Ulcerative symptoms were reported with the highest frequency among males aged 15-24 years (8.9%) (Table 17.6.A). Among females aged 15 and older, 12.0% reported having had abnormal vaginal discharge and 7.5% having had an ulcer or sore on or near the vagina in the 12 months preceding the survey. Among HIV-positive females aged 15 and older, 17.1% reported having had abnormal vaginal discharge and 16.1% having had an ulcer, while among HIV-negative females, 12.0% reported having had abnormal vaginal discharge and 7.1% reported having had an ulcer in the 12 months preceding the survey (Table 17.6.B). Abnormal vaginal discharge was reported with the highest frequency among females aged 45-49 years (15.2%) and with the lowest frequency among those 80 years and older (0.9%). Ulcerative symptoms were reported with the highest frequency among females aged 20-24 years (9.0%) and with the lowest frequency among those 80 years and older (0.6%) (Table 17.6.B). Although a higher percentage of females than males reported having had abnormal genital discharge (12.0% versus 5.3%, respectively), similar percentages of females and males reported having had genital ulcers (7.5% and 7.4%, respectively) (Tables 17.6.A and 17.6.B).
Table 17.6.A Other sexually transmitted infections: Males Among males aged 15 years and older, percentage who self-reported symptoms of a sexually transmitted infection in the 12 months preceding the survey; by HIV status and selected demographic characteristics, THIS 2016-2017 Self-reported symptoms in the past 12 months
Characteristic Percentage who had abnormal discharge from the penis1
Percentage who had an ulcer or sore on or near the penis
Number
Result of PHIA survey HIV test
HIV positive 8.3 14.3 544 HIV negative 5.4 7.5 11,261 Not tested 1.8 2.1 580
Residence
Urban 4.1 6.4 3,784 Rural 6.0 8.0 8,601
Tanzania Mainland/Zanzibar
Mainland 5.4 7.5 11,887 Urban 4.1 6.4 3,642 Rural 6.1 8.1 8,245
Zanzibar 3.0 3.5 498 Unguja 2.8 3.7 358 Pemba 3.7 2.9 140
Region
Dodoma 9.8 10.4 218 Arusha 3.0 4.6 178 Kilimanjaro 2.9 2.8 239 Tanga 4.0 4.7 248 Morogoro 5.7 8.5 298 Pwani 4.0 7.2 708 Dar es Salaam 2.9 4.4 714 Lindi 5.5 4.8 139 Mtwara 5.5 7.9 196 Ruvuma 5.9 8.7 821 Iringa 5.1 8.5 485 Mbeya 6.1 7.6 509 Singida 9.5 13.4 130 Tabora 5.1 8.5 1,348 Rukwa 4.7 8.8 822 Kigoma 2.9 5.8 263

164
Table 17.6.A Other sexually transmitted infections: Males (continued) Among males aged 15 years and older, percentage who self-reported symptoms of a sexually transmitted infection in the 12 months preceding the survey; by HIV status and selected demographic characteristics, THIS 2016-2017 Self-reported symptoms in the past 12 months
Characteristic Percentage who had abnormal discharge from the penis1
Percentage who had an ulcer or sore on or near the penis
Number
Shinyanga 5.6 7.2 879 Kagera 5.1 8.5 351 Mwanza 8.0 8.6 518 Mara 5.7 7.5 283 Manyara 8.2 9.8 174 Njombe 4.9 6.3 323 Katavi 4.1 9.2 916 Simiyu 3.5 8.8 249 Geita 6.9 8.2 335 Songwe 5.3 9.4 543 Kaskazini Unguja 3.9 5.8 72 Kusini Unguja 4.4 3.0 78 Mjini Magharibi 2.3 3.6 208 Kaskazini Pemba 2.9 2.9 62 Kusini Pemba 4.3 2.9 78
Marital status
Never married 5.5 8.0 2,827 Married or living together 5.0 7.1 8,484 Divorced or separated 8.0 9.2 837 Widowed 4.4 4.3 228
Education
No education 5.3 6.1 1,574 Pre-Primary 6.7 7.8 69 Primary 5.6 8.0 7,907 Post Primary Training 5.8 4.1 188 Secondary (O-Level) 4.7 8.1 1,906 Post-Secondary (O-Level) Training 5.3 3.2 323 Secondary (A-Level) 3.8 2.1 99 Post-Secondary (A-Level) Training 2.4 1.5 94 University 3.7 5.6 218
Wealth quintile
Lowest 6.3 7.9 2,782 Second 5.7 8.0 2,795 Middle 5.6 8.7 2,711 Fourth 5.0 6.9 2,151 Highest 3.9 5.5 1,943
Age
15-19 5.5 8.9 1,139 20-24 6.3 8.9 1,843 25-29 6.3 7.9 1,700 30-34 5.8 8.8 1,486 35-39 4.9 6.8 1,330 40-44 5.2 8.1 1,182 45-49 3.9 6.6 893 50-54 4.7 6.0 743 55-59 3.6 5.3 584 60-64 3.9 4.5 471 65-69 5.1 2.3 346 70-74 3.1 3.1 255 75-79 5.3 0.9 190 ≥80 1.6 0.3 223
Total 15-49 5.6 8.1 9,573 Total 50+ 4.1 4.2 2,812 Total 15+ 5.3 7.4 12,385 1Relates to Global AIDS Monitoring indicator 10.4: Men with urethral discharge. The sum of the sample sizes for a given classification may be less than the total sample size because of missing responses to the classification variable

165
Table 17.6.B Other sexually transmitted infections: Females Among females aged 15 years and older, percentage who self-reported symptoms of a sexually transmitted infection in the 12 months preceding the survey; by HIV status and selected demographic characteristics, THIS 2016-2017 Self-reported symptoms in the past 12 months
Characteristic Percentage who had abnormal discharge from the vagina
Percentage who had an ulcer or sore on or near the vagina Number
Result of PHIA survey HIV test HIV positive 17.1 16.1 1,236 HIV negative 12.0 7.1 14,644 Not tested 5.2 1.8 651
Residence Urban 13.0 7.6 5,611 Rural 11.4 7.4 10,920
Tanzania Mainland/Zanzibar
Mainland 12.2 7.6 15,737 Urban 13.2 7.7 5,403 Rural 11.5 7.5 10,334
Zanzibar 5.5 3.6 794 Unguja 6.4 4.2 558 Pemba 2.9 2.0 236
Region
Dodoma 10.7 7.3 279 Arusha 14.1 4.6 245 Kilimanjaro 8.8 4.4 322 Tanga 8.1 6.3 326 Morogoro 8.7 6.7 465 Pwani 8.8 5.0 1,022 Dar es Salaam 13.8 7.7 978 Lindi 4.2 4.3 169 Mtwara 9.2 4.5 204 Ruvuma 10.0 8.1 1,039 Iringa 11.0 6.6 727 Mbeya 11.8 10.5 735 Singida 12.6 12.3 204 Tabora 12.3 7.4 1,511 Rukwa 10.8 8.2 1,079 Kigoma 15.5 10.3 392 Shinyanga 11.3 6.6 1,095 Kagera 20.1 8.9 399 Mwanza 14.3 8.6 649 Mara 13.3 8.4 468 Manyara 13.1 3.5 203 Njombe 9.6 5.6 516 Katavi 14.3 10.6 1,222 Simiyu 10.5 6.5 371 Geita 18.7 14.5 398 Songwe 11.7 7.8 719 Kaskazini Unguja 9.1 2.7 142 Kusini Unguja 2.6 3.0 109 Mjini Magharibi 6.6 4.7 307 Kaskazini Pemba 0.0 1.0 112 Kusini Pemba 5.6 3.0 124
Marital status
Never married 12.6 8.1 2,009 Married or living together 12.3 7.6 10,821 Divorced or separated 14.0 8.6 2,024 Widowed 6.8 4.5 1,664 No education 8.6 5.9 3,896 Pre-Primary 9.3 6.7 81 Primary 13.0 8.0 9,678 Post Primary Training 9.0 6.2 152

166
Table 17.6.B Other sexually transmitted infections: Females (continued) Among females aged 15 years and older, percentage who self-reported symptoms of a sexually transmitted infection in the 12 months preceding the survey; by HIV status and selected demographic characteristics, THIS 2016-2017 Self-reported symptoms in the past 12 months
Characteristic Percentage who had abnormal discharge from the vagina
Percentage who had an ulcer or sore on or near the vagina Number
Secondary (O-Level) 13.0 8.4 2,174 Post-Secondary (O-Level) Training 13.3 5.4 341 Secondary (A-Level) 9.2 6.1 55 Post-Secondary (A-Level) Training (10.4) (7.1) 34 University 14.9 3.1 110
Wealth quintile Lowest 11.3 7.4 3,577 Second 10.6 7.3 3,490 Middle 11.9 7.9 3,686 Fourth 12.8 7.1 3,024 Highest 13.4 7.9 2,749
Age
15-19 10.7 8.9 1,602 20-24 13.5 9.0 2,744 25-29 14.0 8.3 2,578 30-34 13.9 7.7 2,120 35-39 14.3 8.0 1,789 40-44 13.6 8.0 1,442 45-49 15.2 5.6 1,070 50-54 7.7 6.9 884 55-59 7.2 7.4 589 60-64 3.6 2.6 553 65-69 2.7 3.2 395 70-74 5.1 3.6 321 75-79 4.0 1.1 207 ≥80 0.9 0.6 237
Total 15-49 13.5 8.1 13,345 Total 50+ 5.4 4.7 3,186 Total 15+ 12.0 7.5 16,531 Weighted figures calculated using intwt0. Estimates in parentheses are based on a small number (25 to 49) of unweighted cases and should be interpreted with caution. The sum of the sample sizes for a given classification may be less than the total sample size because of missing responses to the classification variable.
17.7 Cervical Cancer Screening Among HIV-Positive Women Among HIV-positive women aged 30-49 years, 17.7% reported having ever been screened for cervical cancer. A slightly higher percentage of women in urban areas (20.5%) than in rural areas (15.1%) reported having ever been screened for cervical cancer. The highest proportions of women who reported having ever been screened for cervical cancer were found in Iringa (27.3%), whereas the lowest proportions were found in Songwe (5.1%). Screening for cervical cancer also differed by women’s education and wealth quintile. Among women with O level secondary education, 28.4% had ever been screened for cervical cancer, compared to 15.2% of women with no education. Among women in the highest wealth quintile, 23.3% had ever been screened compared to only 11.7% of women in the lowest wealth quintile (Table 17.7.A).

167
Table 17.7.A Cervical cancer screening among women living with HIV1
Among HIV-positive women aged 30-49 years, percentage who report being screened for cervical cancer, by selected demographic characteristics, THIS 2016-2017
Characteristic Percentage who report ever
having had a screening test for cervical cancer
Number
Residence Urban 20.5 336 Rural 15.1 403
Tanzania Mainland/Zanzibar Mainland 17.8 734
Urban 20.5 334 Rural 15.1 400
Zanzibar * 5 Unguja * 4 Pemba * 1
Region Dodoma * 10 Arusha * 2 Kilimanjaro * 7 Tanga * 16 Morogoro * 18 Pwani 24.6 56 Dar es Salaam (14.9) 49 Lindi * 1 Mtwara * 5 Ruvuma (13.1) 38 Iringa 27.3 66 Mbeya 8.8 58 Singida * 6 Tabora 8.3 60 Rukwa (11.7) 34 Kigoma * 7 Shinyanga (11.0) 45 Kagera * 16 Mwanza (21.5) 42 Mara * 13 Manyara * 3 Njombe 23.4 50 Katavi 8.8 68 Simiyu * 9 Geita * 18 Songwe (5.1) 37 Kaskazini Unguja * 1 Kusini Unguja * 0 Mjini Magharibi * 3 Kaskazini Pemba * 0 Kusini Pemba * 1

168
Table 17.7.A Cervical cancer screening among women living with HIV1 (continued)
Among HIV-positive women aged 30-49 years, percentage who report being screened for cervical cancer, by selected demographic characteristics, THIS 2016-2017
Characteristic Percentage who report ever
having had a screening test for cervical cancer
Number
Marital status Never married 16.6 57 Married or living together 16.9 379 Divorced or separated 16.9 160 Widowed 21.3 142
Education No education 15.2 134 Pre-Primary * 5 Primary 17.1 540 Post Primary Training * 6 Secondary (O-Level) (28.4) 47 Post-Secondary (O-Level) Training * 7 Secondary (A-Level) * 0 Post-Secondary (A-Level) Training * 0 University * 0
Wealth quintile Lowest 11.7 109 Second 18.4 127 Middle 19.7 197 Fourth 14.7 194 Highest 23.3 112
Age 30-34 12.9 207 35-39 20.1 224 40-44 17.6 175 45-49 21.0 133
Total 30-49 17.7 739 1Relates to Global AIDS Monitoring indicator 10.10: Cervical cancer screening among women living with HIV. Estimates in parentheses are based on a small number (25 to 49) of unweighted cases and should be interpreted with caution. An asterisk indicates that an estimate is based on a very small number (less than 25) of unweighted cases and has been suppressed. The sum of the sample sizes for a given classification may be less than the total sample size because of missing responses to the classification variable.
17.8 Hepatitis C Among adults aged 15-64 years, anti-HCV positivity prevalence, indicative of past or current hepatitis C virus infection, was 1.0% overall, and slightly higher among females (1.2%) than males (0.8%). HIV positivity in combination with anti-HCV positivity was low, with 0.0% of HIV-positive males aged 15-64 years testing positive for anti-HCV and 0.7% of HIV-positive females testing positive for anti-HCV. Among the HIV-negative population aged 15-64 years, 0.8% of men and 1.3% of women tested positive for anti-HCV (Table 17.8.A)

169
Table 17.8.A Prevalence of past or present hepatitis C Prevalence of past or present hepatitis C (positive for hepatitis C virus antibody) among persons aged 15-64 years, by sex, HIV status, and age THIS 2016-2017 Males Females Total
Characteristic Percentage infected Number Percentage
infected Number Percentage infected Number
HIV Positive
15-49 (0.0) 48 0.0 133 0.0 181 15-64 0.0 68 0.7 159 0.5 227
HIV Negative
15-49 0.8 1,749 1.3 2,272 1.1 4,021 15-64 0.8 2,033 1.3 2,614 1.0 4,647
Total
15-49 0.8 1,797 1.2 2,405 1.0 4,202 15-64 0.8 2,101 1.2 2,773 1.0 4,874
Weighted figures calculated using hepCWt.
17.9 Gaps and Unmet Needs
17.10 References 1. Joint United Nations Programme on HIV/AIDS. UNAIDS data tables, 2017. Accessed on September 18, 2018 at http://aidsinfo.unaids.org/
§ Less than one third (27.7%) of PLHIV have visited a TB clinic. § Percentage of people with active syphilis infection was four times higher among PLHIV (3.7%) as
compared to those who were HIV negative (0.8%) § Among those aged 35-39 years, males had a higher prevalence of HBV than females (13.5% and
7.1%, respectively). Males with no education had higher prevalence of HBV (9.5%) compared to those with secondary (O-level) education (1.6%).
§ Among females aged 30-49 years, relatively few had cervical cancer screening (17.7%).

170
HIV continues to cause a significant burden of disease in Tanzania with a prevalence of 4.9% among adults aged 15 years and older corresponding to 1.4 million PLHIV. Overall, ARVs were detected in 54.6% of HIV-positive adults aged 15 years and older. Only half (51.9%) of all PLHIV aged 15 years and older in Tanzania had VLS. There is considerable progress toward achievement of the 2nd and 3rd 90’s of the UNAIDS 90-90-90 targets in adults (based on self-reported and/or detectable ARV data), with 93.6% of those diagnosed receiving ART, and 87.0% of those on ART with VLS. However, diagnosis is a persistent challenge, with 60.6% of PLHIV (ages 15 years and older) having awareness of their HIV-positive status. Therefore, identifying those infected with HIV, but unaware of their status, and linking them to care is critical. The achievement of these targets is essential, not only to prevent HIV-related illness and AIDS-related deaths, but also to prevent transmission and the occurrence of new HIV infections. HIV incidence measured in THIS was 0.24% [95% CI: 0.15%-0.33%] in adults aged 15 years and older, corresponding to approximately 72,000 new cases of HIV infection among adults aged 15 years and older in the country every year. The THIS estimates of national HIV incidence were comparable with previous UNAIDS modeled estimates for the year 2016-17 which provided estimate of 55,000 new cases of HIV infection.1 Increasing coverage of diagnosis, while sustaining high levels of treatment and VLS is key to reducing HIV incidence. By quantifying national population-level HIV incidence and VLS for the first time in Tanzania, THIS has contributed to the understanding of the epidemic. The considerable variation in prevalence of HIV infection and VLS across regions and population groups highlights the need to focus interventions, and to rigorously evaluate and map their availability, accessibility, quality, and effectiveness in specific geographical areas and demographic groups. Iringa (11.3%) and Njombe (11.4%) have the highest prevalence of HIV. Only 56.6% (Iringa) and 60.5% (Njombe) of PLHIV aged 15 years or older in these two regions had VLS. HIV prevalence in urban areas was 6.0% among adults aged 15 years or older. Only 56 % of PLHIV aged 15 years and older in urban areas had VLS. There are disparities by sex in prevalence of HIV infection, as well as coverage of care. The prevalence of HIV infection in the adult population aged 15 years and older is approximately two times higher among females (6.3%) than among males (3.4%). Overall prevalence of VLS is low among PLHIV aged 15 years and older (51.9%). The prevalence of VLS is higher among HIV-positive women (57.2%) aged 15 years and older as compared to HIV-positive men aged 15 years and older (41.5%). These higher rates of VLS among women are consistent with the higher coverage of key interventions such as HIV testing and ART use among women as evidenced by a higher proportion of HIV-positive women aged 15 years and older that were aware of their status and on ART (51.4%) as compared to HIV-positive men aged 15 years and older (38.8%). The high HIV prevalence among adults aged 40-60 years suggests a need to focus on healthy aging among older PLHIV, including a focus on prevention and treatment of non-communicable diseases.
CONCLUSION CONCLUSION

171
Among adults aged 15 years and older, previously diagnosed with HIV but not on ART, the median CD4 count was 420 cells/μL and 61.1% were immunosuppressed (CD4 count less than 500 cells/μL). This finding points to a gap in treatment initiation following diagnosis. Among those adults infected with HIV, but not previously diagnosed, 68.7% were immunosuppressed, and severe immunosuppression with CD4 counts of less than 200 cells/μL was observed in 19.8% (21.6% among males and 18.5% among females). These findings provide further support to the appropriateness of the “Test and Treat” policy introduced in Tanzania in 2016. Current status of the 90-90-90 goals in Tanzania is at 61-94-87 among HIV-positive adults aged 15 years and older, based on self-report and ARV detection data which highlights the need to strengthen programmatic interventions to improve awareness of HIV-positive status. While 70.8% of adult females aged 15 years and older have ever tested for HIV and received their results, only 59.2% of adult males aged 15 years and older have ever tested for HIV. Among adult females aged 15 years and older who are infected with HIV, 64.9% had been diagnosed compared to only 52.2% of their male counterparts. Improving coverage of diagnosis and linkage to care is particularly important among people aged 15-34 years. Only 50.2% of PLHIV aged 15-24 years, and 50.9% of those aged 25-34 years, currently know that they are infected with HIV. Awareness is particularly low among males compared to females. HIV prevalence among children aged 0-14 years is 0.4%. Only 18.4% of CLHIV have VLS, regardless of awareness of HIV-positive status or ART use, indicating a slow progress toward the achievement of the UNAIDS 90-90-90 targets in this population. Only half (50.1%*) of CLHIV in Tanzania were diagnosed. These results suggest a need to improve diagnosis, linkage to treatment, ART adherence, treatment monitoring, and the availability of optimal ART regimens for the pediatric population. Among females aged 15-49 years who gave birth within the year preceding the survey, 92.4% knew their HIV status, and among those who were aware of their HIV-positive status, 97.9% self-reported to have received ARVs, which indicates high coverage of ART provision for PMTCT. In spite of high coverage of key interventions to reduce vertical transmission of HIV, prevalence of HIV infection among infants born to HIV-positive women aged 15-49 years during the 17 months preceding the survey, was high. Among these infants, 6.1%* of those aged 0-11 months and 10.5%* of those aged 0-17 months were identified as infected with HIV based on virological testing conducted during the survey. Condom use with nonmarital, noncohabitating partners remains low. Approximately one-third (31.7%) of adults aged 15 years and older who reported having sex in the 12 months preceding the survey with a nonmarital, noncohabitating partner used a condom at last sexual intercourse. Risk factors for HIV continue to impact females greater than males. Regardless of the number of sexual partners in the last 12 months, females had a higher HIV prevalence than males, in particular, women who had two or more sexual partners in the last 12 months had an HIV prevalence nearly three times as high (12.0%) compared to men (4.2%). Although coverage of ART is high among adults who have been diagnosed with HIV, there are deficits in other areas of HIV care. Among HIV-positive women aged 30-49 years, only 17.7% reported that they had ever been screened for cervical cancer: 15.1% in rural areas and 20.5% in the urban areas. In addition to the prevalence of HIV infection among individuals in a population household-level burden of HIV was estimated in THIS. Having one or more HIV-positive members per household has the potential

172
to impact, not only the health-status, but also the psycho-social and economic well-being of other household members. In THIS, it was estimated that 11.8% of the urban and 8.7% of the rural households in Tanzania had at least one HIV-positive member and that 7.1% of the households had an HIV-positive head of household. About one in nine persons (11.7%) aged 15-24 years reported having sexual intercourse before the age of 15 years. Sexual debut before the age of 15 years was especially high among those with no education. Reproductive health and HIV-prevention programs should focus on delaying the age of sexual debut, with a special effort to adapt strategies for sections of the population with low education levels. Half (52.6%) of men aged 15-49 years reported being medically circumcised; 42.5% and 49.3% of men who tested HIV positive and HIV negative, respectively, reported being medically circumcised. There is a variation of HBV infection prevalence across age groups, with the highest prevalence in those aged 35-39 years (10.2%). Prevalence of past or current hepatitis C among adults aged 15-64 years is 1.0% overall. Among persons aged 15 years or older, prevalence of syphilis was higher among HIV-positive (3.7%) than among HIV-negative persons (0.8%). Approximately one-fourth (27.7%) of PLHIV aged 15 years or older had ever visited a TB clinic, approximately half (54.2%) of whom were diagnosed with TB. Of those diagnosed with TB, nearly all (98.7%) were treated. * Estimates are based on a small number (25 to 49) of unweighted cases and should be interpreted with caution. References 1. Joint United Nations Programme on HIV/AIDS. UNAIDS Data 2017. http://www.unaids.org/sites/default/files/media_asset/2017_data-book_en.pdf

173
Appendix A provides a high-level overview of sampling and weighting procedures for THIS. In-depth details are provided in the Tanzania HIV Impact Survey (THIS) 2016-2017 Technical Report, which may be found online at [https://phia-data.icap.columbia.edu] A.1 Sample Design Overview
The sample design for THIS was a stratified, multistage, probability sample design, with strata defined by the 31 regions of the country, first-stage sampling units defined by enumeration areas (EAs) within strata, second-stage sampling units defined by households within EAs, and finally eligible persons within households. Within each region, the first-stage sampling units (also referred to as primary sampling units or PSUs) were selected with probabilities proportionate to the number of households in the PSU based on the 2012 Population and Housing Census. The allocation of the sample PSUs to the 31 regions was made in a manner designed to achieve specified precision levels for (1) a national estimate of the HIV incidence rate and (2) regional estimates of viral load suppression (VLS). The second-stage sampling units were selected from lists of dwelling units/households compiled by trained staff for each of the sampled PSUs. Upon completion of the listing process, a random systematic sample of dwelling units/households was selected from each PSU at rates designed to yield self-weighting (i.e., equal probability) samples within each region to the extent feasible. Within the sampled households, all eligible adolescents and adults aged 15 years and older were included in the study sample for data collection. All eligible children aged 0-14 years in one third of the sampled households were included in the study for data collection. Population of Inference
The population of inference for THIS is comprised of the de facto household population. The de facto population is comprised of individuals who were present in households (i.e., slept in the household) on the night prior to the household interview. In contrast, the de jure population is comprised of individuals who are usual residents of the household, irrespective of whether or not they slept in the household on the night prior to the household interview. Precision Specifications and Assumptions
The following specifications were used to develop the sample design for THIS. • The relative standard error of the national estimate of annual HIV incidence among persons aged
15-49 years should be 40% or less. • For the 10 high-prevalence regions (i.e., regions with HIV prevalence of 5% or higher), 95%
confidence bounds should be ±0.10 or less for estimates of VLS among all HIV-positive adults aged 15-49 years.
• For the five Zanzibar regions, 10 PSUs were selected for the Urban West region, and four PSUs were selected for each of the remaining regions.
APPENDIX A SAMPLE DESIGN AND IMPLEMENTATION

174
• A total overall sample size (including adults aged 15-49 years, adults aged 50 years or older, and children aged 0-14 years) should yield approximately 40,000 analyzable blood draws.
The following assumptions were used to develop the sample design for THIS 2016-2017. • An overall HIV prevalence rate of 0.051 (5.1%) for adults aged 15-49 years that varies by region
(Table A.1.A).1 • An annual national HIV incidence rate for adults aged 15-49 years of Pa = 0.0037 (0.37%).2 • A mean duration of recent infection (MDRI) of 130 days, yielding an annualization rate of 365/130
= 2.8077. Hence, the estimated incidence rate for MDRI = 130 days is Pm = 0.0037/2.8077 = 0.0013 (0.13%).
• VLS among HIV-positive adults aged 15-49 years in each region of Pvh = 0.50 (50%). This is a conservative assumption because it will overstate the actual variance of VLS.
• An average of 30 occupied sampled households per sampled cluster (PSU). • An intra-cluster correlation of 0.05 for HIV prevalence and VLS. The intra-cluster correlation
provides an average measure of the homogeneity of responses within the first-stage sampling units.
• An occupancy rate of 97.4% for sampled dwellings. Note that this is not included in the calculation of the overall survey response rate, but it does determine the initial numbers of dwelling units to be sampled.3
• An overall household response rate of 98.2% among occupied households.4 • The average number of persons aged 15-49 years per household is 2.07.5 • The percentage of persons in households who are 0-14 years of age is 43.9%.6 • The percentage of persons in households who are 50 years of age or above is 10.0%.7 • Among eligible individuals aged 15 years or older in households completing the household roster,
a biomarker response rate of 80.0%.8 • Among the eligible children aged 0-14 years in households designated for child data collection, a
biomarker response rate of 75.0%. This value is the corresponding biomarker response rate for adults minus 5%.
1 National Bureau of Statistics. Tanzania HIV/AIDS and Malaria Indicator Survey (THMIS) 2011-2012. Dar es Salaam. National Bureau of Statistics; 2012. 2 UNAIDS. 2012 UNAIDS estimate. UNAIDS. Geneva; 2012. 3 Tanzania Commission for AIDS (TACAIDS), Zanzibar AIDS Commission (ZAC), National Bureau of Statistics (NBS), Office of the Chief Government Statistician (OCGS), and ICF International 2013. Tanzania HIV/AIDS and Malaria Indicator Survey 2011-12. Dar es Salaam, Tanzania: TACAIDS, ZAC, NBS, OCGS, and ICF International. 4 Tanzania Commission for AIDS (TACAIDS), Zanzibar AIDS Commission (ZAC), National Bureau of Statistics (NBS), Office of the Chief Government Statistician (OCGS), and ICF International 2013. Tanzania HIV/AIDS and Malaria Indicator Survey 2011-12. Dar es Salaam, Tanzania: TACAIDS, ZAC, NBS, OCGS, and ICF International. 5 National Bureau of Statistics. 2012 Population and Housing Census. Dar es Salaam. National Bureau of Statistics; 2012. 6 National Bureau of Statistics. 2012 Population and Housing Census. Dar es Salaam. National Bureau of Statistics; 2012. 7 National Bureau of Statistics. 2012 Population and Housing Census. Dar es Salaam. National Bureau of Statistics; 2012. 8 Conservative assumption derived from the 2011-12 THMIS.

175
Selection of the Primary Sampling Units
The PSUs for THIS are defined to be the EAs created for the 2012 Tanzania Population and Housing Census. The sampling frame consisted of approximately 106,000 EAs containing an estimated 9.2 million households and 44.9 million persons. A stratified sample of 526 EAs was selected from the sampling frame in accordance with the sample allocation given in Table A.1.A. The 31 strata specified for sampling were the 31 regions of Tanzania, including the five regions in Zanzibar. The EA samples were selected systematically and with probabilities proportionate to a measure of size (MOS) equal to the number of households in the EA based on the 2012 Population and Housing Census. Prior to selection, the EAs were sorted by type of EA (i.e., urban/rural status), district within type of EA, ward within district, village within ward, and finally by EA within village. The sorting of the EAs prior to sample selection induces an implicit geographic stratification. To select the sample from a particular stratum, the cumulative MOS was determined for each EA in the ordered list of EAs, and the sample selections were designated using a sampling interval equal to the total MOS of the EAs in the stratum divided by the number of EAs to be selected and a random starting point. The resulting sample has the property that the probability of selecting an EA within a particular stratum is proportional to the MOS of the EA in the stratum. Details regarding EA substitution and segmentation may be found in the Tanzania HIV Impact Survey (THIS) 2016-2017 Technical Report [https://phia-data.icap.columbia.edu] Selection of Households
For both sampling and analysis purposes, a household is defined to be a group of individuals who reside in a physical structure such as a house, apartment, compound, or homestead, and share in housekeeping arrangements. The physical structure in which people reside is referred to as the dwelling unit, which may contain more than one household meeting the above definition. Households are eligible for participation in the study if they are located within the sampled EA. The selection of households for THIS involved the following steps: (1) listing the dwelling units/households within the sampled EAs; (2) assigning eligibility codes to the listed dwelling unit/household records; (3) selecting the samples of dwelling units/households; and (4) designating a subsample of households for data collection for children. A description of the household listing process as well as a summary of household eligibility may be found in the Tanzania HIV Impact Survey (THIS) 2016-2017 Technical Report [https://phia-data.icap.columbia.edu]. Selection of households utilized an equal probability design. In order to achieve equal probability samples of households within each of the 31 regions of Tanzania, including the five regions in Zanzibar, the sampling rates required to select dwelling units/households within an EA will depend on the difference between the MOS used in sampling and the actual number of dwelling units/households found at the time of listing. Thus, application of these within-EA sampling rates can yield more or less than the desired 30 households in EAs where the sampling MOS differs from the actual listing count. The Tanzania HIV Impact Survey (THIS) 2016-2017 Technical Report [https://phia-data.icap.columbia.edu] provides an in-depth description of the equal probability sample design, as well as a detailed summary of the results of the household selection.

176
Selection of Individuals
The selection of individuals for THIS involved the following steps: (1) compiling a list of all individuals known to reside in the household or who slept in the household during the night prior to data collection; (2) identifying those rostered individuals who are eligible for data collection; and (3) selecting for the study those individuals meeting the age and residency requirements of the study. However, only those individuals who slept in the household the night before the household interview (i.e., the de facto population) were retained for subsequent weighting and analysis. The Tanzania HIV Impact Survey (THIS) 2016-2017 Technical Report [https://phia-data.icap.columbia.edu] provides a brief description of the process for listing and selecting individuals for participation in THIS, and also presents detailed summaries of the distributions of eligible individuals and participants in individual interviews and HIV testing by strata and age.

177
Table A.1.A. Allocation of sample clusters (EAs) and dwelling units and projected sample sizes (number of respondents) by stratum
Region code
Stratum (Region)
Estimated HIV prevalence1
Sample clusters (EAs)
Target dwelling units sampled
Expected house-holds2
Projected number of respondents3 15-49 years
50+ years 0-14 years4
1 Dodoma 0.0284 11 339 330 537 127 520 2 Arusha 0.0318 9 277 270 439 104 426 3 Kilimanjaro 0.0379 10 308 300 488 115 473 4 Tanga 0.0237 10 308 300 488 115 473 5 Morogoro 0.0375 14 431 420 683 161 662 6 Pwani 0.0587 37 1,139 1,110 1,806 426 1,751 7 Dar es Salaam 0.0683 31 985 960 1,562 368 1,514 8 Lindi 0.0290 6 185 180 293 69 284 9 Mtwara 0.0409 8 246 240 391 92 379 10 Ruvuma 0.0693 32 985 960 1,562 368 1,514 11 Iringa 0.0905 25 770 750 1,220 288 1,183 12 Mbeya5 0.0893 26 801 780 1,269 299 1,230 13 Singida 0.0323 7 216 210 342 81 331 14 Tabora 0.0510 41 1,262 1,230 2,001 472 1,940 15 Rukwa 0.0616 35 1,078 1,050 1,709 403 1,656 16 Kigoma 0.0340 11 339 330 537 127 520 17 Shinyanga 0.0732 30 924 900 1,464 345 1,419 18 Kagera 0.0476 16 493 480 781 184 757 19 Mwanza 0.0418 19 585 570 927 219 899 20 Mara 0.0441 12 370 360 586 138 568 21 Manyara 0.0148 7 216 210 342 81 331 22 Njombe 0.1467 18 554 540 879 207 852 23 Katavi 0.0588 37 1,139 1,110 1,806 426 1,751 24 Simiyu 0.0356 9 277 270 439 104 426 25 Geita 0.0465 12 370 360 586 138 568 26 Songwe5 0.0893 26 801 780 1,269 299 1,230 51 Kaskazini Unguja 0.0030 4 123 120 195 46 189 52 Kusini Unguja 0.0030 4 123 120 195 46 189 53 Mjini Magharibi 0.0140 10 308 300 488 115 473 54 Kaskazini Pemba 0.0030 4 123 120 195 46 189 55 Kusini Pemba 0.0030 4 123 120 195 46 189
TOTAL 0.0507 525 16,198 15,780 25,674 6,055 24,886
1Source: 2011-12 Tanzania HIV/AIDS and Malaria Indicator Survey (THMIS). 2Assumes occupancy rate of 96.0%. 3Entries are projected counts based on the assumptions used to develop the sample design. 4All children aged 0-14 years in a random one-third sample of households. 5Songwe is a recently created region, which was originally part of Mbeya.

178
A.2 Weighting Overview
In general, the purpose of weighting survey data from a complex sample design is to (1) compensate for variable probabilities of selection, (2) account for differential nonresponse rates within relevant subsets of the sample, and (3) adjust for possible under-coverage of certain population groups. Weighting is accomplished by assigning an appropriate sampling weight to each responding sampled unit (e.g., a household or person), and using that weight to calculate weighted estimates from the sample. The critical component of the sampling weight is the base weight, which is defined to be the reciprocal of the probability of including a household or person in the sample. The base weights are used to inflate the responses of the sampled units to population levels and are generally unbiased (or consistent) if there is no nonresponse or noncoverage in the sample. When nonresponse or noncoverage occurs in the survey, weighting adjustments are applied to the base weights to compensate for both types of sample omissions. Nonresponse is unavoidable in virtually all surveys of human populations. For THIS, nonresponse can occur at different stages of data collection, for example, (1) before the enumeration of individuals in the household, (2) after household enumeration and selection of persons but before completion of the individual interview, and (3) after completion of the interview but before collection of a viable blood sample. Noncoverage arises when some members of the survey population have no chance of being selected for the sample. For example, noncoverage can occur if the field operations fail to enumerate all dwelling units during the listing process, or if certain household members are omitted from the household rosters. To compensate for such omissions, the post-stratification procedures are used to calibrate the weighted sample counts to available population projections. Methods
The overall weighting approach for THIS includes several steps. Methods and results for each of the steps below are detailed in the Tanzania HIV Impact Survey (THIS) 2016-2017 Technical Report [https://phia-data.icap.columbia.edu]. § Initial checks: Checks of the data files are carried out as part of the survey and data quality control,
and the probabilities of selection for PSUs and households are calculated and checked. § Creation of jackknife replicates: The variables needed to create the jackknife replicates for variance
estimation are established at this point. This step can be implemented immediately after the PSU sample has been selected. All of the subsequent weighting steps described below are applied to the full sample, and to each of the jackknife replicates.
§ Calculation of PSU base weights: The weighting process begins with the calculation and checking of
the sample PSU (EA) base weights as the reciprocals of the overall PSU probabilities of selection. § Calculation of household weights: The next step is to calculate household weights. The household
base weights are calculated as the PSU weights times the reciprocal of the within-PSU household selection probabilities. The household base weights are adjusted first to account for dwelling units, for which it could not be determined whether the dwelling unit contained an eligible household, and then the responding households have their weights adjusted to account for nonresponding eligible

179
households. This adjustment is made based on the EA the households are in, and the resulting weight is the final household weight.
§ Calculation of person-level interview weights: Once the household weights are determined, they are
used to calculate the individual base weights. The individual base weights are then adjusted for nonresponse among the eligible individuals, with a final adjustment for the individual weights to compensate for under-coverage in the sampling process by post-stratifying (i.e., weighting up) to 2017 population projections.
§ Calculation of person-level HIV testing weights: The individual weights adjusted for nonresponse are
in turn the initial weights for the HIV testing data sample, with a further adjustment for nonresponse to HIV testing, and a final post-stratification adjustment to compensate for under-coverage.
§ Application of weighting adjustments to jackknife replicates: All of the adjustment processes are
applied to the full sample and the replicate samples so that the final set of full sample and replicate weights can be used for variance estimation that takes into account the complex sample design and every step of the weighting process.

180
B.1 Specimen Collection and Handling Blood was collected by qualified survey staff from consenting participants. Fourteen milliliters (mL) of venous blood were collected from persons aged 15 years and older, while six mL was collected from persons aged 2-14 years. One mL of capillary blood was collected from children aged 0-2 years using finger-stick for children aged 6-24 months and heel-stick for children aged six months and younger. Blood samples were labeled with a unique barcoded participant identification number and stored in temperature-controlled cooler boxes. At the end of each day, samples were transported to a satellite laboratory for registration in a laboratory information management system, processing into plasma, and dried blood spots (DBS), and storage at -20°C within 24 hours of blood collection. Approximately weekly, samples were transported to National Health Laboratory Quality Assurance and Training Center (NHL-QATC) for additional testing and long-term storage at -80°C. B.2 Household-Based Procedures HIV Rapid Testing
HIV rapid testing was conducted in each household in accordance with Tanzania’s national guidelines (Figure B.2.A). HIV-positive and HIV-indeterminate samples underwent additional testing at a satellite laboratory, as described in Section B.3. For participants who self-reported an HIV-positive status, but tested HIV negative during the survey, additional testing was conducted at NHL-QATC, as described in Section B.3. For children aged 18 months and younger, only the initial rapid test was performed. If the test was reactive, the sample underwent additional testing at NHL-QATC, as described in Section B.3.
APPENDIX B HIV TESTING METHODOLOGY

181
Figure B.2.A Household-based HIV testing algorithm, THIS 2016-2017
CD4 Testing All participants who tested HIV positive and a random sample of five percent of participants who tested HIV negative received a CD4 measurement in the field by qualified survey staff. The measurement was performed using a Pima™ Analyzer and Pima™ CD4 Cartridge (Abbott Molecular Inc., Chicago, Illinois, United States, formerly Alere). Counseling, Referral to Care, and Active Linkage to Care Pre- and post-test counseling were conducted in each household in accordance with Tanzania’s national guidelines. For participants aged 18 years or older, results were communicated directly to the participant. For participants aged 15-17 years, results were communicated to the participant and the parent/guardian together, while for participants less than the age of 15 years, results were communicated directly to the parent or guardian. All participants who consented to HIV testing were asked to share contact information and to select a referral health facility prior to testing. Participants with an HIV-positive test result were referred to HIV care and treatment at the health facility of their choice, while participants with an HIV-indeterminate test result were advised to seek repeated testing at the health facility of their choice in two weeks. Further, HIV-positive participants were asked to consent to be contacted by qualified healthcare personnel, in order to facilitate active linkage to HIV care and treatment in Tanzania’s healthcare system. In rare cases where participants were provided an incorrect HIV test result, self-reported an HIV-positive status, but tested HIV negative during the survey, or required additional collection of blood to complete testing, households were revisited by qualified personnel to provide participants with correct information and guidance on appropriate actions.

182
Quality Assurance and Control
To assure the quality of the performance of field staff conducting HIV testing, proficiency testing, using a panel of blinded HIV-positive and HIV-negative DTS, was evaluated twice during the course of fieldwork. Additionally, sample re-testing was conducted at a satellite lab for (1) the first 50 samples tested by each field staff member, (2) a random sample of five percent of HIV-negative specimens, and (3) all HIV-indeterminate specimens. A limitation of the survey is the potential limitation of rapid tests to detect HIV antibodies among people in the serological window of infection and in HIV-positive patients on ART. Participants in these two categories were not expected to be a significant source of bias. The inability of rapid tests to reliably establish HIV-exposure status of an infant by detecting maternal HIV antibodies among infants aged > 4 months born to HIV positive women, is another inherent limitation of the study. WHO currently recommends rapid tests to be used to establish exposure status only in infants aged less than 4 months. Further analysis will identify how many infants born to HIV-positive women were not identified by a rapid test. B.3 Laboratory-Based Procedures Twenty-eight survey satellite laboratories were established in existing health facility laboratories across the country, and two mobile labs moved with the teams in particularly remote areas. One central laboratory was established at NHL-QATC in Dar es Salaam. Geenius Testing All HIV-positive samples, as well as samples with discrepant or indeterminate results, were tested using the Geenius™ HIV 1/2 Supplemental Assay (Bio-Rad, Hercules, California, United States) (Figure B.3.A). Testing was conducted at NHL-QATC in accordance with the manufacturer’s protocol. HIV TNA Polymerase Chain Reaction HIV deoxyribonucleic acid (DNA) polymerase chain reaction (TNA PCR) was conducted for children aged 18 months and younger who had a reactive HIV test result during household-based testing (Figure B.3.A). Additionally, HIV TNA PCR was evaluated for participants who self-reported an HIV-positive status, but tested HIV negative during the survey, as well as for samples that were HIV positive by the rapid testing algorithm, but were HIV negative or indeterminate by Geenius testing (Figure B.3.B). HIV TNA PCR was conducted using the Abbott Real Time HIV-1 Qualitative Assay (Abbott Molecular, Wiesbaden, Germany) on the Abbott m2000 system at NHL-QATC in accordance with the manufacturer’s protocol. Classification of Final HIV Status For participants aged 18 months or older, the algorithm for classification of final HIV status included results from HIV rapid testing, Geenius testing, and HIV TNA PCR (Figure B.3.A). For participants 18 months of age or younger, the algorithm for classification of final HIV status included results from HIV rapid testing and HIV TNA PCR (Figure B.3.B). Classification of final HIV status was used to determine estimates for HIV prevalence and to inform estimates for HIV incidence.

183
Figure B.3.A Final HIV Status Classification Algorithm (³18 months), THIS 2016-2017

184
Figure B.3.B Final HIV Status Classification Algorithm (<18 months), THIS 2016-2017
Viral Load Testing The Abbott m2000sp was used to prepare plasma samples from confirmed HIV-positive participants for reverse transcription polymerase chain reaction (RT-PCR), using the Abbott m2000 System (Abbott Molecular Inc., Chicago, Illinois, United States). HIV-1 VL (HIV ribonucleic acid (RNA) copies per mL) was then measured using the Abbott m2000rt. The open-mode protocol for the Abbott RealTime HIV-1 assay was used to measure VL from DBS samples from children and from adults with insufficient volume of plasma. Viral load (VL) results were returned to the health facility chosen by each HIV-positive participant. Participants were provided with a referral form during home-based testing and counselling for subsequent retrieval of their results. Survey staff also contacted participants who provided contact information, informing them that their VL results were available at the chosen facility and further advising them to seek care and treatment. HIV Recency Testing Estimation of HIV incidence was based on the classification of confirmed HIV-positive cases as recent or long-term HIV infections. The survey used two laboratory-based testing algorithms to estimate incidence. The first estimate used an algorithm that employed a combination of the HIV-1 Limiting Antigen (LAg) Avidity enzyme immunoassay (Sedia Biosciences Corporation, Portland, Oregon, United States) and VL results (Figure B.3.C). Antiretroviral (ARV) detection results were added to that algorithm for the second estimate (Figure B.3.D). The HIV recent infection testing algorithms were applied to repository specimens from all confirmed HIV-positive participants aged 18 months and older.

185
LAg testing was performed twice, with an initial screening test followed by a confirmatory process: specimens with a normalized optical density (ODn) > 2.0 during initial testing were classified as long-term infections, while those with ODn ≤ 2.0 underwent further testing of the specimen in triplicate. Specimens with median ODn > 1.5 in confirmatory testing were classified as long-term infections. Specimens with median ODn < 0.4 were retested using the HIV diagnostic testing algorithm to confirm HIV-1 seropositivity, and samples identified as HIV-1 seronegative were excluded from the total number of HIV positives and incorporated into the total number of negative specimens for incidence estimation. Specimens with median ODn ≤ 1.5 were classified as infections that were potentially recent, and their VL results were assessed. For the first incidence testing algorithm, specimens with VL <1,000 copies/mL were classified as long-term infections, while those with VL ≥ 1,000 copies/mL were classified as recent infections. For the updated incidence algorithm, those classified as recent infections by the first algorithm were reclassified using ARV detection data. Those specimens in which efavirenz (EFV), lopinavir (LPV), and nevirapine (NVP) were detected were classified as long-term infections and those in which no ARVs were detected remained classified as recent infections.

186
Figure B.3.C HIV-1 Recent Infection Testing Algorithm (LAg/VL algorithm), THIS 2016-2017

187
Figure B.3.D HIV-1 recent infection testing algorithm (LAg/VL/ARV algorithm), THIS 2016-2017
HIV Incidence Estimation Incidence estimates were obtained using the formula recommended by the WHO Incidence Working Group and Consortium for Evaluation and Performance of Incidence Assays. Weighted counts for HIV-negative persons (N); HIV-positive persons (P); numbers tested on the LAg assay (Q); and numbers HIV recent (R) are provided for use in incidence calculations or Joint United Nations Programme on HIV/AIDS Spectrum models (Tables B.3.A, B.3.B). Incidence estimates were calculated using the following parameters: mean duration recent infection (MDRI) = 130 days (95% CI: 118-142 days); proportion false recent (PFR) = 0.00; time cutoff (T) = 1 year. In-depth details are provided in the THIS Technical Report, which may be found online at [https://phia-data.icap.columbia.edu ].

188
Table B.3.A Annual H
IV incidence auxiliary data: N, P, Q
, R, (LAg/V
L1 algorithm
) A
nnual incidence of HIV am
ong persons aged 15-49 and 15+ years, by sex and age, THIS 2016-2017
M
ales
Females
Total
Age
Num
ber H
IV
negative2
(N)
Num
ber H
IV
positive2
(P)
Num
ber tested on LA
g assay2
(Q)
Num
ber H
IV
recent 2
(R)
N
umber
HIV
negative
2
(N)
Num
ber H
IV
positive2
(P)
Num
ber tested on LA
g assay2
(Q)
Num
ber H
IV
recent 2
(R)
N
umber
HIV
negative
2
(N)
Num
ber H
IV
positive2
(P)
Num
ber tested on LA
g assay2
(Q)
Num
ber H
IV
recent 2
(R)
15-24 4491.59
28.41 28.41
0.00
5719.96 124.04
124.04 2.95
10221.15
142.85 142.85
2.63 25-34
3027.61 95.39
95.39 1.62
4262.46
320.54 320.54
10.74
7314.26 391.74
391.74 11.24
35-49 3100.94
227.06 227.06
4.06
3719.33 482.67
482.67 6.30
6837.40
692.60 692.60
10.26 15-49
10635.42 335.58
335.58 5.38
13720.72
908.28 908.28
19.61
24407.40 1192.60
1192.60 23.61
15-64 12289.10
440.90 440.90
7.39
15555.98 1083.02
1083.02 22.34
27895.61
1473.39 1473.39
28.47 15+
13286.64 463.36
463.36 7.57
16711.93
1117.07 1117.07
22.48
30046.19 1532.81
1532.81 28.88
1 LAg/VL: lim
iting antigen/viral load 2 W
eighted number
Note: m
ean duration recent infection (MD
RI) = 130 days (95% CI: 118-142 days); proportion false recent (PFR) = 0.00; tim
e cutoff (T) = 1 year
Table B.3.B A
nnual HIV
incidence auxiliary data: N, P, Q
, R (LAg/V
L/ARV
1 algorithm)
Annual incidence of H
IV among persons aged 15-49 and 15-64 years, by sex and age, using LA
g/VL/A
RVs algorithm
, by sex and age, THIS 2016-2017
M
ales
Females
Total
Age
Num
ber H
IV
negative2
(N)
Num
ber H
IV
positive2
(P)
Num
ber tested on LA
g assay2
(Q)
Num
ber H
IV
recent 2
(R)
N
umber
HIV
negative
2
(N)
Num
ber H
IV
positive2
(P)
Num
ber tested on LA
g assay2
(Q)
Num
ber H
IV
recent 2
(R)
N
umber
HIV
negative
2
(N)
Num
ber H
IV
positive2
(P)
Num
ber tested on LA
g assay2
(Q)
Num
ber H
IV
recent 2
(R)
15-24 4491.59
28.41 28.41
0.00
5719.96 124.04
124.04 2.95
10221.15
142.85 142.85
2.63 25-34
3027.61 95.39
95.39 1.62
4262.46
320.54 320.54
10.74
7314.26 391.74
391.74 11.24
35-49 3100.94
227.06 227.06
4.06
3719.33 482.67
482.67 3.22
6837.40
692.60 692.60
7.44 15-49
10635.42 335.58
335.58 5.38
13720.72
908.28 908.28
16.63
24407.40 1192.60
1192.60 20.96
15-64 12289.10
440.90 440.90
7.39
15555.98 1083.02
1083.02 18.89
27895.61
1473.39 1473.39
25.36 15+
13286.64 463.36
463.36 7.57
16711.93
1117.07 1117.07
19.00
30046.19 1532.81
1532.81 25.73
1 LAg/VL/ARV
: Limiting antigen/viral load/antiretroviral
2 Weighted num
ber N
ote: mean duration recent infection (M
DRI) = 130 days (95%
CI: 118-142 days); proportion false recent (PFR) = 0.00; time cutoff (T) = 1 year

189
Detection of Antiretrovirals To understand recent exposure to ARVs and hence level of antiretroviral therapy coverage, samples from all confirmed HIV-positive participants were evaluated for the presence of selected ARV, using high-resolution liquid chromatography coupled with tandem mass spectrometry to detect ARVs from DBS specimens.2 Three ARVs, two non-nucleoside reverse transcriptase inhibitors, EFV and NVP, and one protease inhibitor, LPV, were used as markers for both first- and second-line regimens, based on the Tanzania’s national treatment guidelines. The ARVs were selected based on their long half-lives, allowing for longer window period from drug exposure to detection. To qualitatively detect ARVs, a single DBS was eluted, and chromatographic separation carried out on a Luna 5 μm column (110 Å, 50 x 2 mm) (Phenomonex, Torrance, California, United States). Each ARV was detected using an API 4000 LC/MS/MS instrument (Applied Biosystems, Foster City, California, United States). Internal standards and in-house quality control cut-off samples, including negative controls, were utilized in each run. This qualitative method used a limit of detection of 0.02 μg/mL for each ARV, with a signal-to-noise ratio of at least 5:1 for all ARVs. Samples with concentrations above 0.02 μg/mL were considered positive for each ARV. Testing was conducted at NHLQATC in Dar es Salaam, Tanzania Genotyping for Detection of Antiretroviral Drug Resistance and HIV Subtyping To determine the extent of transmitted HIV-1 drug resistance mutations among participants in THIS, samples from confirmed HIV-positive participants aged 18 months and younger and HIV-positive participants aged 18 months or older, who were classified as recent infections, as well as an equal or greater number of who were classified as long-term infections, were evaluated using a TaqMan® Single Nucleotide Polymorphisms Genotyping Assay (Applied Biosystems) to identify mutations within the HIV-1 polymerase (pol) gene region, which encodes amino acid substitutions known to be responsible for resistance to specific ARVs. Viral RNA or total nucleic acid from plasma or DBS was extracted using the NucliSENS® easyMAG® (bioMérieux, Marcy-L’Etoile, France) platform. The HIV pol gene was amplified by one-step RT-PCR, which was followed by nested PCR. Sequencing of the approximately one-kilobase amplicons was performed on the ABI 3730 DNA Analyzer (Applied Biosystems).,3,4,5 The customized ReCALL software program was used to edit raw sequences and generate consensus sequences.6 Mutations in the protease and reverse transcriptase genes were classified as potentially associated with drug resistance, according to the Stanford University HIV Drug Resistance Database.7 Sequences with >98% homology were flagged for potential cross-contamination or possible epidemiological links. Internal quality assurance measures and in-house quality control standards were included in each run to validate results. The assay’s sensitivity was established at 1000 copies/mL for plasma and DBS.7 Sequences were also analyzed for potential cross-contamination by phylogenetic analysis from code 6 of the protease gene to code 251 of the reverse transcriptase gene. Subtyping of each sample was performed using the REGA HIV-1 & 2 Automated Subtyping Tool.,9,10 This BioAfrica viral subtyping tool is designed to use phylogenetic methods in order to identify the HIV-1 subtype of a specific sequence. The sequence is analyzed for recombination using boot-scanning methods.

190
B.4 References 1. World Health Organization. Consolidated guidelines on the use of antiretroviral drugs for treating and preventing HIV infection. Geneva: World Health Organization; 2016. https://www.who.int/hiv/pub/arv/arv-2016/en/. 2. Koal T, Burhenne H, Römling R, Svoboda M, Resch K, Kaever V. Quantification of ARV drugs in dried blood spot samples by means of liquid chromatography/tandem mass spectrometry. Rapid Commun Mass Spectrom, 2005, 19(21) 2995-3001. 3. Ruark, A., Dlamini L, Mazibuko N, et al., Love, lust and the emotional context of multiple and concurrent sexual partnerships among young Swazi adults. Afr J AIDS Res. 2014;13(2):133-43. doi: 10.2989/16085906.2014.927781. 4. Uganda Ministry of Health. Uganda AIDS Indicator Survey 2011. Kampala, Uganda: Uganda MOH; 2012. 5. UNAIDS. UNAIDS Report on the global AIDS Epidemic 2010. UNAIDS. Geneva, Switzerland; 2010. 6. Woods CK, Brumme CJ, Liu TF, et al. Automating HIV Drug Resistance Genotyping with RECall, a Freely Accessible Sequence Analysis Tool. J Clin Microbiol. 2012 Jun;50(6):1936-42. doi: 10.1128/JCM.06689-11. 7. Stanford University HIV Drug Resistance Database. Accessed on July 9, 2017 at: http://hivdb.stanford.edu 8. Yang C, McNulty A, Diallo K, et al. Development and application of a broadly sensitive dried-bloodspot-based genotyping assay for global surveillance of HIV-1 drug resistance. J Clin Microbiol. 2010 Sep;48(9):3158-64. doi: 10.1128/JCM.00564-10. 9. Alcantara LCJ, Cassol S, Libin P, et al. A Standardized Framework for Accurate, High-throughput Genotyping of Recombinant and Non-recombinant Viral Sequences. Nucleic Acids Res. 2009 Jul;37(Web Server issue):W634-42. doi: 10.1093/nar/gkp455. 10. de Oliveira T, Deforche K, Cassol S, et al. An Automated Genotyping System for Analysis of HIV-1 and other Microbial Sequences. Bioinformatics. 2005 Oct 1;21(19):3797-800. Epub 2005 Aug 2.

191
Estimates from sample surveys are affected by two types of errors: non-sampling errors and sampling errors. Non-sampling errors result from mistakes made during data collection (e.g., misinterpretation of an HIV test result) and data management (e.g., transcription errors in data entry). While THIS implemented numerous quality assurance and control measures minimize non-sampling errors, these errors are impossible to avoid and difficult to evaluate statistically. In contrast, sampling errors can be evaluated statistically. The sample of respondents selected for THIS is only one of many samples that could have been selected from the same population, using the same design and expected size. Each of these samples would yield results that differ somewhat from the results of the actual sample selected. Sampling errors are a measure of the variability between all possible samples. Although the degree of variability is not known exactly, it can be estimated from the survey results. The standard error, which is the square root of the variance, is the usual measurement of sampling error for a particular statistic (e.g., proportion, rate, count). In turn, the standard error can be used to calculate confidence intervals within which the true value for the population can reasonably be assumed to fall. For example, for any given statistic calculated from a sample survey, the value of that statistic will fall within a range of plus or minus two times the standard error of that statistic in 95 percent of all possible samples of identical size and design. THIS utilized a multistage stratified sample design, which requires complex calculations to obtain sampling errors. Specifically, a variant of the Jackknife repeated replication method was implemented in SAS to estimate variance for proportions (e.g., HIV prevalence), rates (e.g., annual HIV incidence), and counts (e.g., numbers of PLHIV). Each replication considers all but one cluster in the calculation of the estimates. Pseudo-independent replications are thus created. In THIS, a Jackknife replicate is created by randomly deleting one cluster from each variance-estimation stratum and retaining all of the clusters in the remaining strata. A total of 257 variance-estimation strata were created by pairing (or occasionally tripling) the sample clusters in the systematic order in which they had been selected. Hence, 257 replications were created. The variance of a sample-based statistic, y, is calculated as follows:
var(y) = ∑ #$%& (y
k - y)2
where y is the full-sample estimate, and yk is the corresponding estimate for jackknife replicate k (k = 1, 2, ..., K). In addition to the standard error, the design effect for each estimate is also calculated. The design effect is defined as the ratio between the standard error using the given sample design and the standard error that would result if a simple random sample had been used. A design effect of 1.0 indicates that the sample design is as efficient as a simple random sample, while a value greater than 1.0 indicates the increase in the sampling error due to the use of a more complex and less statistically efficient design. Confidence limits for the estimates, which are calculated as
APPENDIX C ESTIMATES OF SAMPLING ERRORS

192
y ± t(0.975; K) '()*(,),
where t(0.975; K) is the 97.5th percentile of a t-distribution with K degrees of freedom, are also computed. Sampling errors for selected variables from THIS are presented in tables C.1 through C.8, and sampling errors for all survey estimates may be found online at [https://phia-data.icap.columbia.edu]. For each variable, sampling error tables include the weighted estimate, unweighted denominator, standard error, design effect, and lower and upper 95 percent confidence limits.

193
Table C.1 Sampling errors: Annual HIV incidence by age, THIS 2016-2017
Age (years) Weighted
estimate (%) Design effect
Lower confidence
limit (%)
Upper confidence
limit (%)
TOTAL
15-24 0.07 0.87 0.00 0.16 25-34 0.43 0.91 0.18 0.68 35-49 0.31 1.30 0.09 0.52 15-49 0.24 0.87 0.14 0.35 15-64 0.25 0.96 0.15 0.36 15+ 0.24 0.98 0.15 0.33
MALES 15-24 0.00 0.00 0.00 0.00 25-34 0.15 0.45 0.00 0.38 35-49 0.37 1.18 0.01 0.72 15-49 0.14 0.88 0.02 0.26 15-64 0.17 0.97 0.05 0.29 15+ 0.16 1.00 0.05 0.27
FEMALES 15-24 0.14 0.98 0.00 0.31 25-34 0.70 1.14 0.29 1.12 35-49 0.24 1.41 0.00 0.51 15-49 0.34 0.91 0.18 0.50 15-64 0.34 1.00 0.19 0.50 15+ 0.32 1.00 0.17 0.46

194
Table C.2 Sampling errors: HIV prevalence by age, THIS 2016-2017
Age Weighted
estimate (%) Unweighted
number Standard error (%)
Lower confidence
limit (%)
Upper confidence
limit (%) TOTAL
0-17 months 0.3 1063 0.1 0.0 0.6
18-59 months 0.4 2563 0.2 0.1 0.8
5-9 0.5 3268 0.1 0.2 0.8
10-14 0.3 2722 0.1 0.2 0.5
0.0 0.0 0.0
Total 0-4 0.4 3626 0.1 0.1 0.7
Total 0-14 0.4 9616 0.1 0.2 0.6
0.0 0.0 0.0
15-19 0.7 5532 0.1 0.4 1.0
20-24 2.2 4832 0.2 1.7 2.7
25-29 4.0 4191 0.4 3.3 4.7
30-34 6.4 3515 0.5 5.3 7.5
35-39 8.6 3056 0.6 7.3 9.9
40-44 9.7 2549 0.7 8.3 11.1
45-49 9.4 1925 0.8 7.7 11.1
50-54 8.4 1600 0.8 6.7 10.1
55-59 8.9 1152 1.1 6.6 11.2
60-64 5.2 1017 0.7 3.7 6.7
Total 15-24 1.4 10364 0.1 1.1 1.6
Total 15-49 4.7 25600 0.2 4.3 5.0
Total 15-64 5.0 29369 0.2 4.7 5.4
Total 15+ 4.9 31579 0.2 4.5 5.2 MALES
0-17 months 0.1 538 0.1 0.0 0.3
18-59 months 0.2 1312 0.1 0.0 0.5
5-9 0.5 1661 0.2 0.0 0.9
10-14 0.3 1345 0.1 0.1 0.6
0.0 0.0 0.0
Total 0-4 0.2 1850 0.1 0.0 0.4
Total 0-14 0.3 4856 0.1 0.1 0.5
0.0 0.0 0.0
15-19 0.4 2533 0.2 0.0 0.7
20-24 0.9 1987 0.3 0.4 1.5
25-29 2.3 1670 0.5 1.2 3.4
30-34 3.9 1453 0.7 2.6 5.3
35-39 5.6 1307 0.7 4.1 7.1
40-44 8.4 1144 1.0 6.3 10.5
45-49 6.8 877 0.9 4.9 8.7
50-54 7.4 728 1.2 4.9 9.9
55-59 8.0 572 1.7 4.6 11.4
60-64 3.6 459 0.9 1.7 5.5 Table C.2 Sampling errors: HIV prevalence by age, THIS 2016-2017

195
Age Weighted
estimate (%) Unweighted
number Standard error (%)
Lower confidence
limit (%)
Upper confidence
limit (%)
Total 15-24 0.6 4520 0.1 0.3 0.9
Total 15-49 3.1 10971 0.2 2.7 3.5
Total 15-64 3.5 12730 0.2 3.1 3.9
Total 15+ 3.4 13750 0.2 3.0 3.7
FEMALES
0-17 months 0.4 525 0.3 0.0 1.0
18-59 months 0.7 1251 0.3 0.0 1.3
5-9 0.5 1607 0.2 0.1 0.8
10-14 0.3 1377 0.1 0.1 0.6
0.0 0.0 0.0
Total 0-4 0.6 1776 0.3 0.1 1.1
Total 0-14 0.5 4760 0.1 0.2 0.7
0.0 0.0 0.0
15-19 1.0 2999 0.2 0.6 1.5
20-24 3.4 2845 0.4 2.6 4.2
25-29 5.6 2521 0.5 4.6 6.6
30-34 8.6 2062 0.8 7.0 10.2
35-39 11.6 1749 1.0 9.4 13.7
40-44 11.0 1405 1.0 8.9 13.0
45-49 12.0 1048 1.4 9.2 14.8
50-54 9.4 872 1.2 7.0 11.8
55-59 9.7 580 1.4 6.8 12.6
60-64 6.5 558 1.0 4.4 8.6
Total 15-24 2.1 5844 0.2 1.7 2.6
Total 15-49 6.2 14629 0.3 5.7 6.7
Total 15-64 6.5 16639 0.3 6.0 7.0
Total 15+ 6.3 17829 0.2 5.8 6.8

196
Table C.3 Sampling errors: HIV prevalence by residence and region, ages 15+ years, THIS 2016-2017
Characteristic Weighted
estimate (%) Unweighted
number Standard error (%)
Lower confidence
limit (%)
Upper confidence
limit (%) TOTAL
RESIDENCE Urban 6.0 10140 0.3 5.5 6.6 Rural 4.2 21439 0.2 3.7 4.6
MAINLAND/ZANZIBAR Tanzania Mainland 5.0 29927 0.2 4.6 5.3 Zanzibar 0.4 1652 0.2 0.1 0.8
REGION Dodoma 5.0 506 1.2 2.6 7.5 Arusha 1.9 430 0.7 0.6 3.3 Kilimanjaro 2.6 582 0.4 1.7 3.4 Tanga 5.0 650 0.9 3.2 6.7 Morogoro 4.2 815 0.6 3.0 5.3 Pwani 5.5 1835 0.6 4.3 6.8 Dar es Salaam 4.7 1773 0.5 3.7 5.6 Lindi 0.3 337 0.3 0.0 0.8 Mtwara 2.0 414 1.1 0.0 4.2 Ruvuma 5.6 1914 0.6 4.4 6.7 Iringa 11.3 1342 1.1 9.0 13.6 Mbeya 9.3 1324 0.9 7.4 11.2 Singida 3.6 332 1.4 0.6 6.5 Tabora 5.1 3061 0.5 4.2 6.0 Rukwa 4.4 2079 0.5 3.4 5.4 Kigoma 2.9 777 0.7 1.6 4.3 Shinyanga 5.9 2209 0.3 5.3 6.5 Kagera 6.5 857 1.1 4.1 8.8 Mwanza 7.2 1285 1.1 4.9 9.4 Mara 3.6 864 0.5 2.5 4.7 Manyara 2.3 418 0.6 1.1 3.5 Njombe 11.4 883 1.9 7.5 15.3 Katavi 5.9 2326 0.8 4.3 7.5 Simiyu 3.9 727 0.8 2.3 5.6 Geita 5.0 820 1.0 3.0 7.0 Songwe 5.8 1367 1.1 3.5 8.1 Kaskazini Unguja 0.6 283 0.5 0.0 1.8 Kusini Unguja 0.0 234 0.0 0.0 0.0 Mjini Magharibi 0.6 664 0.3 0.1 1.1 Kaskazini Pemba 0.0 206 0.0 0.0 0.0 Kusini Pemba 0.3 265 0.3 0.0 0.9

197
Table C.3 Sampling errors: HIV prevalence by residence and region, ages 15+ years, THIS 2016-2017 (continued)
Characteristic Weighted
estimate (%) Unweighted
number Standard error (%)
Lower confidence
limit (%)
Upper confidence
limit (%) MALES
RESIDENCE Urban 3.4 4106 0.3 2.8 4.0 Rural 3.4 9644 0.0 2.9 3.8
MAINLAND/ZANZIBAR Tanzania Mainland 3.5 13079 0.2 3.1 3.8 Zanzibar 0.0 671 0.3 0.0 0.0
REGION Dodoma 3.8 226 0.8 2.1 5.5 Arusha 1.7 175 1.3 0.0 4.4 Kilimanjaro 2.0 241 0.5 0.9 3.0 Tanga 3.7 283 1.1 1.4 6.0 Morogoro 2.2 324 0.8 0.4 3.9 Pwani 3.0 764 0.7 1.6 4.4 Dar es Salaam 2.3 724 0.5 1.2 3.4 Lindi 0.0 156 0.0 0.0 0.0 Mtwara 1.4 206 0.9 0.0 3.2 Ruvuma 4.6 852 0.6 3.4 5.8 Iringa 6.6 550 1.2 4.1 9.2 Mbeya 5.4 559 1.1 3.1 7.8 Singida 1.8 139 1.3 0.0 4.6 Tabora 4.6 1454 0.6 3.3 5.8 Rukwa 3.3 896 0.6 2.0 4.5 Kigoma 2.8 329 0.7 1.3 4.2 Shinyanga 4.3 1003 0.4 3.4 5.2 Kagera 5.8 410 0.8 4.0 7.5 Mwanza 5.0 584 0.6 3.8 6.3 Mara 2.5 353 0.9 0.6 4.4 Manyara 1.9 191 0.9 0.1 3.7 Njombe 6.5 349 1.5 3.4 9.7 Katavi 3.5 1024 0.7 2.1 5.0 Simiyu 3.3 303 1.2 0.8 5.7 Geita 3.7 384 1.2 1.3 6.1 Songwe 5.2 600 0.8 3.5 6.8 Kaskazini Unguja 0.0 106 0.0 0.0 0.0 Kusini Unguja 0.0 108 0.0 0.0 0.0 Mjini Magharibi 0.0 274 0.0 0.0 0.0 Kaskazini Pemba 0.0 77 0.0 0.0 0.0 Kusini Pemba 0.0 106 0.0 0.0 0.0

198
Table C.3 Sampling errors: HIV prevalence by residence and region, ages 15+ years, THIS 2016-2017 (continued)
Characteristic Weighted
estimate (%) Unweighted
number Standard error (%)
Lower confidence
limit (%)
Upper confidence
limit (%) FEMALES
RESIDENCE Urban 8.3 6034 0.4 7.4 9.2 Rural 5.0 11795 0.3 4.4 5.6
MAINLAND/ZANZIBAR Tanzania Mainland 6.4 16848 0.2 5.9 6.9 Zanzibar 0.8 981 0.2 0.2 1.5
REGION
Dodoma 6.2 280 1.7 2.8 9.6 Arusha 2.2 255 0.8 0.6 3.8 Kilimanjaro 3.1 341 0.9 1.3 4.9 Tanga 6.2 367 1.2 3.6 8.7 Morogoro 5.8 491 0.5 4.7 6.8 Pwani 7.7 1071 0.8 6.0 9.5 Dar es Salaam 6.8 1049 0.6 5.5 8.2 Lindi 0.6 181 0.6 0.0 1.7 Mtwara 2.8 208 1.4 0.0 5.6 Ruvuma 6.6 1062 0.9 4.6 8.5 Iringa 15.3 792 2.2 10.8 19.9 Mbeya 12.8 765 1.3 10.1 15.5
Singida 5.1 193 2.0 1.1 9.1
Tabora 5.7 1607 0.6 4.5 6.9
Rukwa 5.5 1183 0.6 4.2 6.8
Kigoma 3.1 448 0.8 1.6 4.7
Shinyanga 7.5 1206 0.6 6.3 8.8
Kagera 7.2 447 1.6 3.9 10.6
Mwanza 9.4 701 1.8 5.6 13.2
Mara 4.5 511 0.9 2.8 6.3
Manyara 2.7 227 0.8 1.0 4.5
Njombe 15.1 534 2.3 10.3 20.0
Katavi 8.2 1302 1.0 6.1 10.4
Simiyu 4.5 424 0.8 2.8 6.3
Geita 6.4 436 1.2 4.0 8.8
Songwe 6.5 767 1.6 3.2 9.8
Kaskazini Unguja 1.1 177 1.0 0.0 3.1
Kusini Unguja 0.0 126 0.0 0.0 0.0
Mjini Magharibi 1.2 390 0.5 0.2 2.2
Kaskazini Pemba 0.0 129 0.0 0.0 0.0
Kusini Pemba 0.6 159 0.5 0.0 1.7

199
Table C.4 Sampling errors: Viral load suppression by age, THIS 2016-2017
Age (years) Weighted
estimate (%) Unweighted
number Standard error (%)
Lower confidence
limit (%)
Upper confidence
limit (%)
TOTAL
0-14 18.4 44 5.9 4.6 32.3
15-24 41.5 171 4.8 31.8 51.1
25-34 43.3 480 3.5 37.8 48.8
35-44 53.9 601 2.9 48.6 59.1
45-54 60.5 349 4.1 53.2 67.7
55-64 63.3 176 6.0 52.0 74.6
65+ 46.6 53 11.9 28.4 64.7
Total 15-24 41.5 171 4.7 31.8 51.1
Total 15-49 49.6 1454 1.8 45.8 53.3
Total 15-64 52.0 1777 1.6 48.6 55.4
Total 15+ 51.9 1830 1.6 48.6 55.1
MALES
0-14 * 19 14.4 0.0 57.6
15-24 22.2 28 9.6 2.5 41.9
25-34 25.7 115 5.2 15.1 36.4
35-44 38.9 202 4.0 30.6 47.2
45-54 56.0 129 4.8 46.1 65.9
55-64 61.5 68 8.5 44.0 79.0
65+ * 21 12.2 28.4 78.6
Total 15-24 22.2 28 9.6 2.5 41.9
Total 15-49 36.1 414 2.8 30.4 41.9
Total 15-64 41.2 542 2.7 35.7 46.7
Total 15+ 41.5 563 2.6 36.1 46.9
FEMALES
0-14 11.7 25 6.7 0.0 23.8
15-24 47.1 143 4.7 37.3 56.9
25-34 50.5 365 2.7 43.3 57.6
35-44 62.5 399 2.5 56.4 68.6
45-54 63.2 220 3.5 54.8 71.7
55-64 64.4 108 5.5 52.1 76.8
65+ 42.9 32 8.8 18.3 67.4
Total 15-24 47.1 143 4.8 37.3 56.9
Total 15-49 56.0 1040 1.9 52.0 60.0
Total 15-64 57.5 1235 1.7 54.0 61.1
Total 15+ 57.2 1267 1.7 53.7 60.7

200
Table C.5 Sampling errors: Viral load suppression by residence and region, ages 15+ years, THIS 2016-2017
Characteristic Weighted
estimate (%) Unweighted
number Standard error (%)
Lower confidence
limit (%)
Upper confidence
limit (%) TOTAL
RESIDENCE Urban 56.0 747 2.1 51.6 60.4 Rural 48.4 1,083 2.3 43.7 53.1
MAINLAND/ZANZIBAR Tanzania Mainland 51.9 1,822 1.6 48.7 55.2 Zanzibar * 8 16.3 0.0 55.9
REGION Dodoma 60.6 27 12.1 35.7 85.5 Arusha * 9 12.1 4.1 54.0 Kilimanjaro * 16 9.7 46.8 86.8 Tanga 47.2 34 4.7 37.4 57.0 Morogoro 45.3 37 10.4 23.9 66.6 Pwani 63.5 111 4.6 53.9 73.0 Dar es Salaam 44.7 95 3.9 36.7 52.7 Lindi * 1 0.0 100.0 100.0 Mtwara * 9 4.6 43.8 62.8 Ruvuma 56.7 111 5.3 45.8 67.5 Iringa 56.6 155 3.7 49.0 64.2 Mbeya 57.4 135 4.7 47.6 67.1 Singida * 13 20.7 0.0 83.1 Tabora 41.2 168 5.1 30.6 51.7 Rukwa 42.9 98 5.5 31.5 54.2 Kigoma * 23 10.8 36.1 80.6 Shinyanga 40.1 143 4.9 30.1 50.1 Kagera 66.0 57 6.1 53.4 78.5 Mwanza 49.6 99 5.0 39.2 60.0 Mara 63.4 34 5.8 51.4 75.4 Manyara * 10 13.1 9.7 63.5 Njombe 60.5 106 6.8 46.6 74.4 Katavi 47.3 162 4.4 38.3 56.4 Simiyu 54.3 31 12.7 28.2 80.4 Geita 32.4 45 5.4 21.3 43.6 Songwe 64.6 93 5.9 52.6 76.7 Kaskazini Unguja * 2 1.1 42.3 46.7 Kusini Unguja * 0 0.0 0.0 0.0 Mjini Magharibi * 5 21.8 0.0 65.9 Kaskazini Pemba * 0 0.0 0.0 0.0 Kusini Pemba * 1 0.0 0.0 0.0
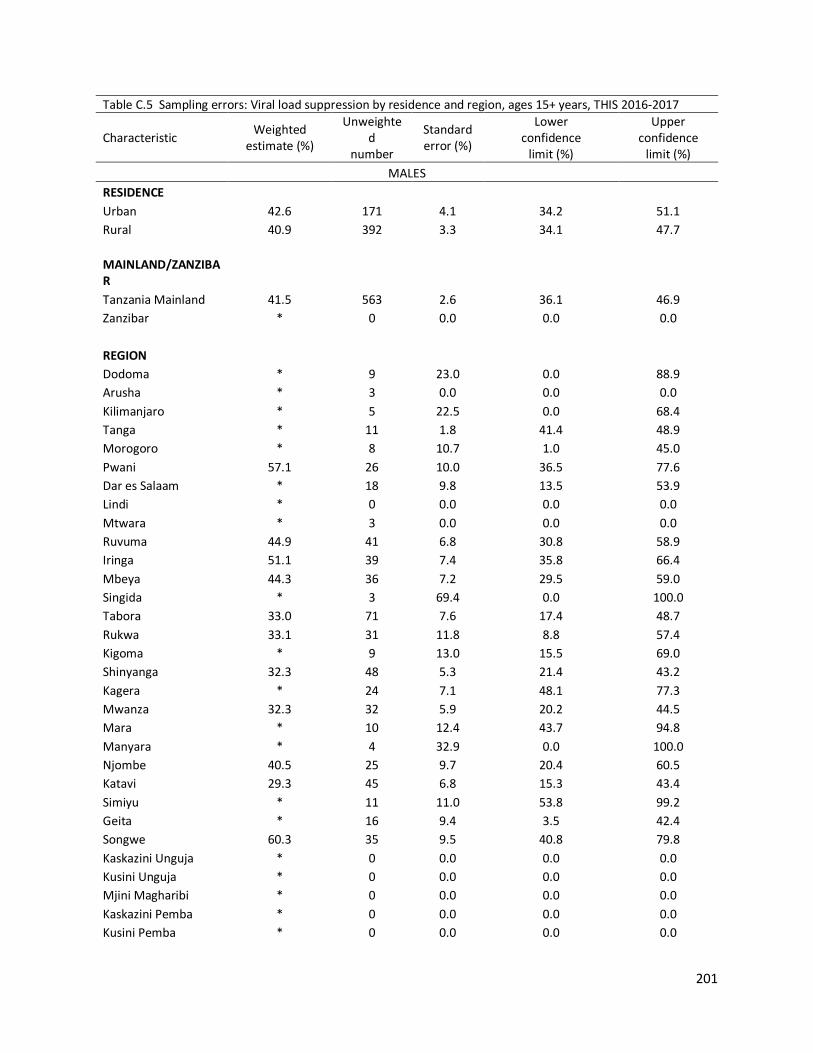
201
Table C.5 Sampling errors: Viral load suppression by residence and region, ages 15+ years, THIS 2016-2017
Characteristic Weighted
estimate (%)
Unweighted
number
Standard error (%)
Lower confidence
limit (%)
Upper confidence
limit (%) MALES
RESIDENCE Urban 42.6 171 4.1 34.2 51.1 Rural 40.9 392 3.3 34.1 47.7
MAINLAND/ZANZIBAR Tanzania Mainland 41.5 563 2.6 36.1 46.9 Zanzibar * 0 0.0 0.0 0.0
REGION Dodoma * 9 23.0 0.0 88.9 Arusha * 3 0.0 0.0 0.0 Kilimanjaro * 5 22.5 0.0 68.4 Tanga * 11 1.8 41.4 48.9 Morogoro * 8 10.7 1.0 45.0 Pwani 57.1 26 10.0 36.5 77.6 Dar es Salaam * 18 9.8 13.5 53.9 Lindi * 0 0.0 0.0 0.0 Mtwara * 3 0.0 0.0 0.0 Ruvuma 44.9 41 6.8 30.8 58.9 Iringa 51.1 39 7.4 35.8 66.4 Mbeya 44.3 36 7.2 29.5 59.0 Singida * 3 69.4 0.0 100.0 Tabora 33.0 71 7.6 17.4 48.7 Rukwa 33.1 31 11.8 8.8 57.4 Kigoma * 9 13.0 15.5 69.0 Shinyanga 32.3 48 5.3 21.4 43.2 Kagera * 24 7.1 48.1 77.3 Mwanza 32.3 32 5.9 20.2 44.5 Mara * 10 12.4 43.7 94.8 Manyara * 4 32.9 0.0 100.0 Njombe 40.5 25 9.7 20.4 60.5 Katavi 29.3 45 6.8 15.3 43.4 Simiyu * 11 11.0 53.8 99.2 Geita * 16 9.4 3.5 42.4 Songwe 60.3 35 9.5 40.8 79.8 Kaskazini Unguja * 0 0.0 0.0 0.0 Kusini Unguja * 0 0.0 0.0 0.0 Mjini Magharibi * 0 0.0 0.0 0.0 Kaskazini Pemba * 0 0.0 0.0 0.0 Kusini Pemba * 0 0.0 0.0 0.0

202
Table C.5 Sampling errors: Viral load suppression by residence and region, ages 15+ years, THIS 2016-2017
Characteristic Weighted
estimate (%) Unweighted
number Standard error (%)
Lower confidence
limit (%)
Upper confidence
limit (%) FEMALES
RESIDENCE Urban 60.8 576 2.2 56.3 65.4 Rural 53.4 691 2.6 48.1 58.7 MAINLAND/ZANZIBAR Tanzania Mainland 57.3 1,259 1.7 53.8 60.8 Zanzibar * 8 16.3 0.0 55.9 REGION Dodoma * 18 6.6 58.5 85.7 Arusha * 6 14.2 18.6 77.2 Kilimanjaro * 11 9.6 70.9 100.0 Tanga * 23 8.1 31.6 65.1 Morogoro 51.9 29 12.3 26.7 77.2
Pwani 65.6 85 4.8 55.7 75.5
Dar es Salaam 48.1 77 4.2 39.4 56.8
Lindi * 1 0.0 100.0 100.0
Mtwara * 6 9.8 64.4 100.0
Ruvuma 64.9 70 6.9 50.8 79.1
Iringa 58.7 116 4.5 49.4 67.9
Mbeya 62.4 99 5.2 51.7 73.1
Singida * 10 18.9 4.2 81.9
Tabora 48.5 97 5.7 36.8 60.3
Rukwa 48.4 67 4.7 38.6 58.1
Kigoma * 14 9.8 51.1 91.4
Shinyanga 44.9 95 6.1 32.4 57.4
Kagera 68.9 33 7.8 52.8 85.0
Mwanza 59.3 67 7.4 44.1 74.5
Mara * 24 12.7 34.4 86.9
Manyara * 6 8.0 13.6 46.4
Njombe 67.2 81 5.8 55.2 79.2
Katavi 55.0 117 3.6 47.6 62.5
Simiyu * 20 11.1 16.7 62.5
Geita 38.4 29 5.7 26.6 50.2
Songwe 68.0 58 6.7 54.1 81.8
Kaskazini Unguja * 2 1.1 42.3 46.7
Kusini Unguja * 0 0.0 0.0 0.0
Mjini Magharibi * 5 21.8 0.0 65.9
Kaskazini Pemba * 0 0.0 0.0 0.0
Kusini Pemba * 1 0.0 0.0 0.0

203
Table C.6 Sampling errors: ARV-adjusted 90-90-90 by age (conditional percentages), TH
IS 2016-2017
Diagnosed
O
n Treatment
Viral Load Suppression
Age (years)
Weighted
estimate
(%)
Unw
eighted num
ber Standard error (%
)
Lower
confidence lim
it (%)
Upper
confidence lim
it (%)
Weighted
estimate
(%)
Unw
eighted num
ber Standard error (%
)
Lower
confidence lim
it (%)
Upper
confidence lim
it (%)
Weighted
estimate
(%)
Unw
eighted num
ber Standard error (%
)
Lower
confidence lim
it (%)
Upper
confidence lim
it (%)
TOTAL
15-24 50.2
167 4.9
40.0 60.4
92.6
77 3.3
85.7 99.4
83.5
70 5.2
72.8 94.1
25-34 50.9
462 3.1
44.6 57.2
88.3
248 4.8
83.1 93.5
88.3
218 2.7
82.7 93.9
35-49 66.7
779 2.4
61.8 71.6
94.4
519 2.5
92.0 96.8
85.4
490 2.1
81.1 89.7
15-49 59.5
1,408 1.8
55.7 63.3
92.5
844 1.2
90.3 94.8
86.0
778 1.7
82.5 89.5
15-64 60.9
1,730 1.7
57.4 64.5
93.7
1,071 1.1
91.9 95.4
87.0
999 1.3
84.3 89.7
15+ 60.6
1,782 1.7
57.2 64.0
93.6
1,101 0.8
91.9 95.4
87.0
1,026 1.3
84.4 89.7
MALES
15-24 35.7
27 11.5
12.1 59.2
*
8 11.9
61.6 100.0
*
7 24.2
2.9 100.0
25-34 32.0
112 8.7
19.1 44.9
76.0
38 18.1
58.0 93.9
84.1
26 7.2
69.2 98.9
35-49 58.7
264 3.2
50.6 66.8
90.6
148 8.7
83.9 97.2
79.8
137 3.7
72.2 87.3
15-49 48.8
403 2.9
41.9 55.6
87.4
194 3.2
81.4 93.5
78.8
170 3.6
71.4 86.2
15-64 52.4
531 2.0
46.3 58.6
89.9
285 2.7
85.8 94.0
83.0
257 2.8
77.3 88.7
15+ 52.2
552 2.0
46.2 58.3
89.6
297 2.0
85.5 93.7
83.2
267 2.7
77.6 88.8
FEMALES
15-24 54.4
140 4.9
44.4 64.5
93.8
69 3.1
87.5 100.0
88.9
63 3.5
81.8 96.0
25-34 59.0
350 3.3
52.1 65.8
91.1
210 4.3
86.0 96.3
89.1
192 2.8
83.3 94.9
35-49 71.3
515 2.7
65.7 76.9
96.3
371 2.5
94.7 97.8
87.9
353 2.5
82.8 93.0
15-49 64.7
1,005 1.9
60.7 68.7
94.4
650 0.7
92.5 96.3
88.4
608 1.8
84.7 92.1
15-64 65.3
1,199 1.8
61.7 69.0
95.2
786 0.5
93.6 96.9
88.5
742 1.5
85.6 91.5
15+ 64.9
1,230 1.7
61.4 68.5
95.3
804 0.8
93.7 96.9
88.6
759 1.4
85.6 91.5

204
Table C.7 Sampling errors: ARV-adjusted 90-90-90 by age (unconditional percentages), 2016-2017
Diagnosed
O
n Treatment
Suppressed Viral Load
Age (years)
Weighted
estimate
(%)
Unw
eighted num
ber Standard error (%
)
Lower
confidence lim
it (%)
Upper
confidence lim
it (%)
W
eighted estim
ate (%
)
Unw
eighted num
ber Standard error (%
)
Lower
confidence lim
it (%)
Upper
confidence lim
it (%)
W
eighted estim
ate (%
)
Unw
eighted num
ber Standard error (%
)
Lower
confidence lim
it (%)
Upper
confidence lim
it (%)
TOTAL
15-24 50.2
167 4.9
40.0 60.4
46.5
167 5.0
36.3 56.7
38.8
167 4.78
28.9 48.6
25-34 50.9
462 3.1
44.6 57.2
44.9
462 2.8
39.1 50.8
39.7
462 2.9
33.6 45.7
35-49 66.7
779 2.4
61.8 71.6
63.0
779 2.5
57.8 68.1
53.8
779 2.3
49.1 58.5
15-49 59.5
1408 1.8
55.7 63.3
55.1
1408 1.9
51.1 59.0
47.3
1408 1.8
43.6 51.1
15-64 60.9
1730 1.7
57.4 64.5
57.1
1730 1.8
53.4 60.7
49.6
1730 1.6
46.3 53.0
15+ 60.6
1,782 1.7
57.2 64.0
56.7
1,782 1.7
53.2 60.2
49.4
1,782 1.6
46.2 52.6
MALES
15-24 35.7
27 11.5
12.1 59.2
30.7
27 11.2
7.6 53.9
16.2
27 9.4
0.0 35.6
25-34 32.0
112 6.3
19.1 44.9
24.3
112 6.1
11.8 36.8
20.4
112 5.8
8.6 32.3
35-49 58.7
264 3.9
50.6 66.8
53.2
264 4.1
44.6 61.7
42.4
264 3.6
35.1 49.7
15-49 48.8
403 3.3
41.9 55.6
42.6
403 3.4
35.6 49.6
33.6
403 3.0
27.5 39.7
15-64 52.4
531 3.0
46.3 58.6
47.1
531 3.0
40.9 53.3
39.1
531 2.8
33.4 44.8
15+ 52.2
552 2.9
46.2 58.3
46.8
552 3.0
40.7 52.9
38.9
552 2.7
33.3 44.5
FEMALES
15-24 54.4
140 4.9
44.4 64.5
51.1
140 4.9
41.0 61.2
45.4
140 4.8
35.5 55.4
25-34 59.0
350 3.3
52.1 65.8
53.7
350 3.2
47.1 60.4
47.9
350 3.6
40.5 55.2
35-49 71.3
515 2.7
65.7 76.9
68.6
515 2.7
63.1 74.1
60.3
515 2.7
54.8 65.8
15-49 64.7
1005 1.9
60.7 68.7
61.1
1005 1.9
57.2 64.9
54.0
1005 1.9
50.1 57.9
15-64 65.3
1199 1.8
61.7 69.0
62.2
1199 1.7
58.7 65.7
55.1
1199 1.7
51.7 58.5
15+ 64.9
1,230 1.7
61.4 68.5
61.9
1,230 1.7
58.4 65.3
54.8
1,230 1.6
51.4 58.2

205
Table C.8 Sampling errors: Number of new infections annually (ages 15-64 years) and number of PLHIV (ages 15 years or older), THIS 2016-2017
Weighted estimate
Standard error
Lower confidence
limit
Upper confidence
limit Number of new infections annually 72123.6 14074.2 43081.5 101165.8
Number of PLHIV* 1532482.9 51495.0 1426426.9 1638539.0 *Persons Living with HIV
206
Tanzania HIV Impact Survey (THIS) 2016-2017 Survey Personnel
PRINCIPAL INVESTIGATORS Albina Chuwa (NBS)
Mayasa Mahfoudh Mwinyi (OCGS) Mulokozi Domitian Aroldia (TACAIDS)
Ali Salim Ali (MoH- Zanzibar) Geoffrey R. Somi (NACP) Farhat Khalid (ZIHHTLP)
Fausta Mosha (NHLQATC) Sasi Jonnalagadda (CDC-Atlanta) Jessica Justman (ICAP-New York)
Elizabeth Gummerson (ICAP-New York) Veronicah Mugisha (ICAP-Tanzania) George Mgomella (CDC- Tanzania)
Co- INVESTIGATORS
Jerome Kamwela (TACAIDS) Emilian Karugendo (NBS) Mariam Kitembe (NBS)
Sylvia Severin Meku (NBS) Fahima Mohammed Issa (OCGS)
Halima Ali Mohammed (ZAC) Farhat Khalid (ZIHHTLP)
Ahmed Khatib (ZAC) Angela Ramadhani Shayo (NACP)
Victor Muchunguzi (NHLQATC) Michael Mwasekaga (CDC Tanzania)
Cecilia Makafu (ICAP Tanzania) Rennatus Mdodo (CDC Tanzania)
Kayla Lavilla(CDC Tanzania) Paul Stupp (CDC Atlanta)
Eyasu H. Teshale (CDC Atlanta) Andrew Voetsch (CDC Atlanta)
Bharat Parekh (CDC Atlanta) Hetal Patel (CDC Atlanta)
Suzue Saito (ICAP New York) Bereket Alemayehu (ICAP New York) Fernando Morales (ICAP Tanzania)
Julius Zelothe (ICAP Tanzania) David Lowrance (CDC Tanzania)
Fernando Morales (ICAP-Tanzania)
PROJECT COORDINATORS
Veronicah Mugisha (Project Director ICAP) Julius Zelothe (Project Coordinator-ICAP) Irenius Ruyobya (Project Director-NBS)
Emilian Karugendo (Project Manager-NBS) Mariam Kitembe (Project Coordinator-NBS) Fahima Mohamed Issa (Project Manager-OCGS)
APPENDIX A SAMPLE DESIGN AND IMPLEMENTATION APPENDIX D SURVEY PERSONNEL

207
FIELDWORK TRAINERS Christina Ndosi (NHLQATC) Jocelyin Rwehumbiza (NBS)
Laurie Cliff Cenge (NBS) Phausta Ntigiti (NBS) Samwel Kawa (NBS)
Johannes Makwandi (NBS) Peter Mangera (NBS) Hellen Hilary (NBS)
Hyansinta Kafulila (NBS) Noah Kamasho (NBS) Neema Halliye (PHLB)
Abdulmajid J. Ramadhani (OCGS) Munir Mdee (NBS)
Demetria Ngirwa (NBS) Hellen Mtove (NBS) James Juma (NACP)
Athuman J. Msuya (NBS) Khamis Msham (OCGS)
Attiye J. Shaame (MoH Zanzibar) Sophia Mohamed (ZIHTLP) Abdullah Othman (OCGS)
Alice Chopeta (ICAP Tanzania) Hussein Mtiro (ICAP Tanzania) Hadija Lema (ICAP Tanzania) Elieza Taluka (ICAP Tanzania)
Gideon J. Mipawa (ICAP Tanzania) Aroldia Mulokozi (TACAIDS)
Sostenes Magezi (Kahama TC Hospital) Emerenciana M. Machibya (Shinyanga Reg. Hosp)
Zainabu Kitembe (PO-RALG)
Peris Urassa (NACP) Peter M. Felesh (Kwimba Hosp.)
Rita Sondengam (ICAP) Takura Kupamupindi (ICAP) Oliver Murangandi (ICAP)
Katie Johnson (ICAP) Andrew Low (ICAP)
Leala Ruangtragool (CDC) Monica Tolentino (WESTAT)
Optatus Malewo (CDC) Rennatus Mdodo (CDC) Sasi Jonnalagadda (CDC) Daisy Duru-Iheoma (CDC)
Hetal Patel (CDC) Belete Teaban (ICAP) Kathryn Lupoli (CDC)
Yvonne Mavengere (ICAP) Sehin Birhanu (CDC) Keisha Jackson (CDC)
Thomas Stevens (CDC) Fieldwork Monitors Julius Zelothe (ICAP) Kayla Lavilla (CDC)
Veronica Mugisha (ICAP) Paige Newenschwander (ICAP)
Stephen Delgado (ICAP) Fahima M. Issa (OCGS) Mariam Kitembe (NBS)
Emilian Karugendo (NBS)
LAB TECHNICIANS
Central & Satellite lab Joseph Mwechi (ICAP)
Elisaphane Munyazesa (ICAP) Josephine E. Farahan (MoHCDGEC)
Lwitiko M. Amos (MoHCDGEC) Loum Benedict (MoHCDGEC) Ameir Hassan (MoHCDGEC)
Stephen Charema (MoHCDGEC) Valence K. Mkula (MoHCDGEC) Asha Ahmed Othman (ZIHTLP)
Ame Khamis Abdallah (MoHCDGEC) Athanas Charles (MoHCDGEC)
Bahati Mfaki (NACP) Tumaini Mlaki (MoHCDGEC)
Asmaa H. Nassor (MoHCDGEC) Annamary Batolela (MoHCDGEC)
Adela J. Kisanga (MoHCDGEC) Asteria K. Bwire (MoHCDGEC) Mohamed Juma (MoHCDGEC)
Bikombo Khamis Said (MoHCDGEC) Salum Nyerere (MoHCDGEC) Cosmas Muya (MoHCDGEC)
Gastone Vicent Massi (MoHCDGEC)

208
Ali Iddi Rambo(MoHCDGEC) Philipo Mathias (MT MERU Hosp.)
James Mziray (MoHCDGEC) Leah Masseke (MoHCDGEC)
Ester Rose (MoHCDGEC)
Intisar Nassor (MoHCDGEC) Mbarak Khamis (MoHCDGEC)
Nadrat Miraji (MoHCDGEC) Sophia Selestine (MoHCDGEC)
Prosper Oscar (MoHCDGEC)
LABORATORY SCIENTISTS National Health Laboratory-Quality Assurance and Training Centre Ebiezel Samson
Annamary Batoleki Esther T Mwavika
Joseph Ainea Mziray Saida Murugwa Betina Katembo Peter Mwakaje
Carolyn Riwa Maria E. Kelly
Ambele Mwafulango Peter B. M Mkama Lawrence Mapunda
Dotto Kalovya Reginald Julius
HOUSEHOLD LISTING TRAINERS
Munir Mdee Abdul-majid Jecha Attiye J. Shaame Athuman Msuya
Deogratias Malamsha Gidion Mipawa
Mariam Kitembe Fahima Issa
Emilian Karugendo Kayla Lavilla
Pule Mphahile Paul Stupp
Rich Motchell Kiwon Lee
Hannah Chuge Julius Zelothe Phausta Ntigiti Eliezer Taluka
Oliver Murangadi
LISTING SUPERVISORS
Noah Komasho Hellen Hilary
Hilda Mashoko Ahmed S Kamugisha
Salehe Chivanga Joyce N. Msoka Frank Mapendo Kulwa Namkaa Suma R. Tebela
Habiba Soud
Kazija Khamis Said Julieth Msuya
Aulea Kokulamuka Johannes Makwandi
Demetria Ngirwa Frank Lyimo
Lilian Chovenye Hemedi Nkunya
Jocelyn Rwehumbiza
LISTERS
Athman Mdoka Halima Said Penina Shao
Jovian Rukambuzi Ines Tibenda
Spensa Lishela
Farida Maghembe Robert Mashika
Atuganile Mwaipungu Elikarim Saidi Lovis Fredrick
Ponziana Makini
Ally Kombo Bakari Shenenga
Nemayan Stephano Ernesta Sabas Herry Gulam Amos Hebert

209
Joel Kibona Neema Christopher
Victor Brown Nelson Mremi Sylivia Joachim
Edmund Rwegelela
Elizeus Novat Geofrey Charles
Ada Lwangili Andrew Madembwe
Paul Mwaisemba
Titus Aloyce Bertha Krey
Haruni R. Nkanjamba Mjaka Rashid Mjaka
Aisha Ally Haji
LISTING DRIVERS
Peter Msofe David Mwaisenye Twaha Bendera
Michael Madembwe Zuberi Mkawa
Maloba Kisanga Benedict Liwoya
Hiari Juma Khamis Omar Salim
Benjamin Makasi Ahmed Ngao
Geofrey. Nyabukika Ally Mohamed
Evarist Msisi Joseph Waya
Baraka Nyambelwa Derick Dominick
Rajab Mzee Rajab
COMMUNITY MOBILIZERS
Mihayo Bupamba Veronica Kazimoto
Idd A. Muruke Albert W. Kapala Goodluck Lyimo Tony Mwanjota Kalisto Lugome
Evarist Tairo Israel Mwakapalala
Gideon Mokiwa Eric B. Luaula
Nestory Mazinza Juma Shaban
Theresia A. Lyimo Moses Kahero
Mwantumu Athumani Alfred G. Gewe Khalid Msabaha
Lathma Iddy Naing’oya Kipuyo
Albert Kulwa Ramadhani Mbega Simon J. Keraryo Wilfred Mwingira
Andrew Punjila Tamali William
Adamson Ramadhani
Morris Lekule Editha Mwanyika
Peter Millinga Badru Abdunuru
Nuru Ramsa Mbarouk Ahmed Hani Mohamed
Margareth Martin Moses Sagala
Safia A. Ali Jokha Bakar
Emmanuel Ghula Salama Njani
Janeth Busanya
DATA COLLECTION FIELD COORDINATORS
Aulea Kokulamka Noah Kamasho
Johannes Makwandi Khadija Lema
Khadija Lema Hussein Mtiro
Khamis Msham Raya Said Salum
TEAM SUPERVISORS
Andrew Gondwe Salama R. Makame
Dickson Peter
Samwel Kawa Monica Masawe Hamida Mvunta

210
Saumu Said Ritha Kileo
Ressy Mashullano Kulwa Namkaa Esther Solomon Respicius Gasper
David Edward Tatu Fundi Salum Ludovick Materu
Tamasha Ngalomba Hemed Nkunya
Ahmad H. Mohamed Suleiman S. Omary
Aisha A. Haji
Hassanaali Mohamed Omar Hussein Khatib
Frank Lyimo Thomas Ndimbo
Joyce Msoka Edwina Lyimo Elias Bugumba
Eusebius Mwinuka Jacob Lufingo
Boniface Simpoli Yohana Lilian Chovenye
Bakary K. Makame Mahamoud R. Juma
INTERVIEWERS
Farida Mbura Johnmark Obura
Gravina David Thomas Lutamla Fatma Ussi Yahya Hawa Namanga
Paul Njau Ruzuna Abdulrahim
Elizaberth Lema Fillo P. Hyera
Nyachiro Mujaya Hellen Gasper
Philibert Ndagala Shinuna Hemed Said
Renifrida Dule Joseph Kilumba Mariam Mkoma
Elizabeth Mhando Jane Naleo
Henry Mosabi Joab Mazengo
Dorophina Komba Khadija Suleiman Omar
Selina Hilary Pricilla Ng'umbi Sharifa Rashidi Rose Kidando Peter Odongo Gabriel Nyunja Tausi Mghenyi
Subira Kassim Kheri
Jacquline Tibenda Gerald Kabyemela
Mwanahamis Issa Haji Restituta Msoka Renata Komba
Suleiman Pandu Ali Elias Katole
Yasin Mkombe Trudbertha Rutakinikwa
Halima Ahmed Mohamed Thereza Mwita Grace Semenda
Felix Mtaki Dorcus Nkwao
Hilda Ndyamukama Mwajuma Fadhil Juma
Kwezi Malale Josiah Samwel Majenje Massi
Khuzaymat Rashid Abdalla Margreth Luhindila
Advella Patrick Salutary Munishy Proscovia Laurean
Baseki Thomas Remija Ng'ingo
Devotha Mhagama Josephine Boniphace
Saleh Mohamed Saleh Manyangu Magembe
James Miruye
Yusuf Nyoni Deograsia Sanga Dorah Mchomvu Elimboto Duma
Esther Kungu Fat-Hu Mohamed Saleh
Innocent Kihongo Halima Msengi
Khadija Ali Juma Kamero Mogesi
Rosta Lyimo Zainabu Mdimi Herman Gondo
Anastella Stephen Lameck Magori
Amina Sleyum Addi Marietha Ng'oge Sarah Sikimaya
Mwasi Masondore Bakar Omar Abass
Robert Mwiza Jokha Mahmoud Iddi
Praxeda Modest Christina Nyagali
Magdalena Mmuni Said Kai Haji
Happiness Liya Samaria Mwanangwa
Tatu Simba Mashaka Shilinde
Raymond Simon Malashi

211
Mayunga Mahona Mohammed Siri Mary Massika
Nora Sanga Muna Sumry
Sylvana Kajanga Nkuyumba Gwanda
Johannes Mwitambote Agness Sanga
Rahma Awadh Salmin Lucia Shipande Rose Meagie Rose Nyaruri
Martin Chamani Hassan Mbega
Edith May Omary Rehema Abdalla Abeid
Cecilia Muganda Mwanahawa Jafari
Neema Sanga Grace Ng'wandu Shabani Mbelwa Simon Staphord
Judith Kiyaya Lucia George
Martha Mnenje Gaudencia Ndumbaro
Mevaji Antony Zawadi Andembwisye
Mwaka Pandu Makame Sibia Mutani
Fatuma Mchome Shamte Fussi
Josephina Milwano Mmanga Seif Massoud
Pili Ng'wadi Mkina Sahani Siwa Myuki
Swibe Monchena Alice J. Mlindoko
Patrick Ngelangela Mwanaidi Shange
Editha Buhha Nunu Ismail Kanduru
Christina Kopwe Ritha Mrope
Gloria Kagaruki Mary Warioba Said Malando Jerome Mchia
Iddi Yahya Mkongoa Hassan M. Mcha Laamud A. Juma
Mohamed Ali Salim
Elizabeth Sokoi Lazaro Munuka Ipyana Masebo
Eva Vicent Raya Ismail Salum
Clemencia Assenga Gloria Akyoo
Hawa Khamis Juma Hawa Lyuu
Revocatus Muswaga Stephen Sabiano Aristariki Mushi Tellence Aloys Anna Ombay
Joseph Malimi Bikombo Abdall Mastur
Dominica Mfaume Brigitha Temba Rhobi Kenyunko Elizabeth Msaki
Marcella Francis Robert Hezekia Nnko Gidion Kinyina Issa Khamis Ali
Ali Juma Mohamed Ramla Abdalla Juma
Fredrick Kasase
DATA COLLECTION DRIVERS
John Fundisha Benedict Liwoya Godfrey Mtoni Derick Dominic Zuberi Mkawa
Ally Kiduara Abdulrahim Hamad Adam Said Nyingo
Jacob Swai Leonard Mwakajinga
Maloba Kisanga Rajab Sheni
Nikata Mohamed Hemed S. Hemed
Godfrey Nyabukika Charles Fallu
Baraka Nyamberwa Yohana Kipangula
Ali Ussi Ali Hiari Juma Juma Gwao
Paulo Mkuwa Andrew Simkonda
Carmel Lema Peter Msofe Vitalis Simon Serafin Matei
Hamdan R. Kiserengo
Twaha Bendera Benjamin Makasi
Shomari Matewele Michael Madembwe
Temu Msula Evarist Msisi Jailos Tinda
Viannel Hyera Leonard Peter Kadawi
Lucas Mgane Ally Kibope
Flavian Rugemalila Laurence Msuya Thadeus Bhura

212
RECRUITMENT, LOGISTICS AND DATA ADMINISTRATORS RECRUITMENT
Gabriel Madembwe Stambuli Mapunda
Raya Hassan Jamal Mbuguyu
Baraka Mahamood Mwanaisha A. Khamis
Said Omar Mohammed Sakina Salim
Abdulmajid J. Ramadhan Abdallah M. Denge
Sabina Raphael
LOGISTICS Juliet Mmary Daudi Nyolobi
Hilda Maliti Ahidi Kisra
Sylvia Remmy Abel Torofino
Kazija Said
DATA ADMINISTRATOR Eliezer Taluka Munir Mdee
Gidion Mipawa Abdullah O. Makame
Alice Chopeta
PROJECT ACCOUNTANT Lwitico Lufingo
Joel Mwendamaka Ali Mwadini Ame
TECHNICAL WORKING GROUP MEMBERS
Veronicah Mugisha (ICAP) Emilian Karugendo(NBS)
Julius Zelothe (ICAP) Elisaphane Munyazesa (ICAP)
Esther Solomon (POPC) Kayla Lavilla (CDC) Mary Kibona (CDC)
Michael Mwasekaga (CDC) Ali S. Ali (MoH Zanzibar)
Farhat J. Khalid (MOH-ZHHITLP) Salma Haji (MoH Zanzibar)
Kathryn Rosecrans(CDC) Subiraga Kaganda(TACAIDS)
Erasmo Malekela (USAID Tanzania) Fahima M. Issa(OCGS)
Jocelyn Rwehumbiza(NBS) Hellen Mtove(NBS)
Elizabeth Gummerson (ICAP) Sasi Jonnalagadda (CDC) George Mgomella (CDC)
Emmanuel Kasheeka (UNAIDS)
Ramadhani Mwiru (CDC) Aleya Khalifa (CDC)
Amos Kahwa (NIMR) Mtebe Majigo (MUHAS)
Charles Massambu (MoHCDGEC) Aroldia Mulokozi(TACAIDS)
Sylvia Meku (NBS) Neema Makyao (NACP) Athuman Msuya (NBS) Optatus Malewo (CDC)
Sylvester Mattunda(CDC) Alison Jenkins (UNICEF) Mariam Kitembe (NBS)
Victor Muchunguzi (NHL-QATC) Geoffrey R. Somi (NACP)
Phausta Ntigiti(NBS) Rennatus Mdodo (CDC) Khadija Khamis (OCGS) Kathy Hageman (CDC)
Heather Menzies (CDC) Ulrike Gilbert (UNICEF)
STEERING COMMITTEE MEMBERS
Leonard L. Maboko (TACAIDS)-Chairperson
David Lowrance (CDC) Ahmed Khatib (ZAC)
Jerome Kamwela (TACAIDS) Richard Ngirwa (TACAIDS)
Aroldia Mulokozi (TACAIDS)
Optatus Malewo (CDC) Machaele Mwasekaga (CDC) Asanterabi Sanganoi (PMO) Steven Motambi (PORALG)
Charles Masambu(MOHCDGEC) Fausta Mosha (NHL-QATC)
Geofrey Somi (NACP)
Veronicah Mugisha(ICAP) Julius Zelothe(ICAP)
Mihayo Bupamba(ICAP) Elisaphane Munyazesa (ICAP)
Emilian Karugendo (NBS) Mariam Kitembe (NBS) Phausta Ntigiti (NBS)

213
Irene Charles (TACAIDS) Mary Kibona (CDC)
Rennatus Mdodo (CDC) Kayla Lavilla (CDC)
Mayasa Mwinyi (OCGS) George Mgomella (CDC)
Warren Naamara (UNAIDS) Ibrahim D. Kalengo (POPC)
Laurent Karindima (NHL-QATC) Karen Hymbaugh (CDC) Kathy Hageman (CDC)
Heather Menzies (CDC)
Halima A. Mohamed (ZAC) Erasmo Malekela (USAID)
Vicky Chuwa (UNICEF) Mainen Moshi (MUHAS) Khadija Khamis (OCGS)
Emmanuel Kasheeka (UNAIDS)
DATA ANALYSIS ADVISORY COMMITTEE MEMBERS Geoffrey Somi
Jeremiah Mushi Fahima Issa
Asha Ussi Khamis Emilian Karugendo Mariam Kitembe
Munir Mdee George Mgomella
Halima Ali Mohammed Julius Zelothe
Veronicah Mugisha Cecilia Makafu
Rennatus Mdodo Kayla Lavilla
Elizabeth Gummerson Kathy Hageman
Sasi Jonnalagadda Candida Moshiro Delfinus Kivenule Aroldia Mulokozi Susan F. Rumisha Renicha McCree Phausta Ntigiti
Ulrike Gilbert (UNICEF)
REPORT WRITERS Veronica Mugisha Emilian Karugendo Mariam Kitembe
Fahima Issa Aroldia Mulokozi
Juma James Elizabeth Gummerson
Sasi Jonnalagadda Lilian Chovenye
Delfinius Kivenule George Mgomella
Takura Kupamupindi Rita Sondengam
Kristin Brown Andrea Low
Cecilia Makafu Kayla Lavilla
Julius Zelothe Phausta Ntigiti
Halima A. Mohamed Yuster L. Manyenga
Diana Faini Joyce Peter Chonjo Rennatus Mdodo Nahima Ahmad Julius Zelothe Hellen Mtove
Boniface Simpoli Daniel Williams
Stephen Delgado
Hellen Mtove Ahmad Hamza Mohamed
Jonathan M. Mshana Aulea Kokulamuka
Ahmed Hani Mohamed Ebiezel Samson
Candida Moshiro Adventina Kato Renicha McCree
Sasi Jonnalagadda Lusajo Kajula
Eric Luaula Ulrike Gilbert
Nikhil Kothegal Elizabeth Radin
TECHNICAL ADVISERS-ICAP at Columbia University Andrea Low
Allison George David Hoos
Elizabeth Gummerson Elizabeth Radin
Oren Mayer Rachel Bray Suzue Saito
Hazel Dube (Zimbabwe) Takura Kupamupindi (SA) Sungani Zidana-Ndovi (SA)
Giles Reid Jessica Justman
Joseph Elias Josh Kreiger
Hannah Chung Rita Sondengam
Sally Findley Yen Pottinger
Blanche Pitt (SA) Bright Phiri (SA)
Charles Wentz (SA)
Kiwon Lee Katie Johnson
Larkin Callaghan Melissa Metz
Nahima Ahmed Stephen Delgado
Steven Wynn Eliezer Takula
Herbert Longwe (SA) Oliver Murangandi (SA)
Pule Mphole (SA)

214
TECHNICAL ADVISERS-CDC Bharat Parekh Drew Voetsch
Hetal Patel Keisha Jackson Kristin Brown Laura Porter Paul Stupp
Sasi Jonnalagadda Steve McCracken
Trudy Dobbs Daniel Yavo
Mervi Detorio
Eyasu Teshale Naeemah Logan Wolfgang Hladik William Levine
Katina Pappas-Deluca Nikhil Kothegal Carin Molchan Dave Lowrance Eunice Mmari
George Mgomella Heather Menzies
Kayla Lavilla
Kevin Cain Renicha McCree Rennatus Mdodo Robert Domaoal
Sylvester Mattunda Michael Mwasekaga
Michelle Roland Ramadhan Mwiru Optatus Malewo
Shanmuigam Vedapuri Mary Kibona
Kathy Hageman
WESTAT
Adam Chu Amanda Fournier
Baifan Li Bhumika Pakai Brandyn Fauble
Katherine Aronson Emmanuel Aluko
Lisa Bowser Lori Andrews Rick Mitchell
Roberto Miglietti Sean Byrne Vivian Wu
Charisse McBride Emily J. Hudak Graham Kalton Harold Bobbitt Jackie Varenne
Kenneth Marshall Kiersten Johnson
Malinda Karunaratne Mamadou Diallo Marie Alexander Sarah Woodruff
Thuzar Myo Myint
Jason Ives Joy Curvan
Julia Shpigenur Jyothi Pabbaraju
Karin Wilson Karla Richie
Laura Alvarez Rojas Lesa Houser
Monica Tolentino Ratha Soumphontphakdy
Ron Klinger Weijia Ren

215
ENGLISH
MINISTRY OF HEALTH TANZANIA MAINLAND AND ZANZIBAR
HIV IMPACT ASSESSMENT
HOUSEHOLD QUESTIONNAIRE
CONFIDENTIAL
TICK IF HOUSEHOLD SELECTED FOR CHILDREN’S SURVEY
HOUSEHOLD IDENTIFICATION
REGION CODE
DISTRICT CODE
WARD/SHEHIA CODE
VILLAGE/ST. CODE
EA CODE
HH NUMBER
REGION NAME: _________________________________________________
DISTRICT NAME: _________________________________________________
WARD/SHEHIA NAME: _________________________________________________ VILLAGE/STREET NAME: _________________________________________________
EA NAME _________________________________________________
NAME OF HOUSEHOLD HEAD: _________________________________________________
INTERVIEWER VISITS
1 2 3 FINAL VISIT
VISIT DATE:
INTERVIEWER NAME:
RESULT*
_______________
_______________
_______________
_______________
_______________
_______________
_______________
_______________
_______________
DAY:
MONTH:
YEAR:
INT. CODE:
RESULT:
APPENDIX E HOUSEHOLD QUESTIONNAIRE

216
NEXT VISIT: DATE
TIME
________________
________________
________________
________________ TOTAL NUMBER
OF VISITS:
TOTAL PERSONS
IN HOUSEHOLD
TOTAL ELIGIBLE WOMEN:
TOTAL ELIGIBLE
MEN:
TOTAL ELIGIBLE CHILDREN:
LINE NO. OF RESPONDENT TO HOUSEHOLD QUESTIONNAIRE
LANGUAGE OF INTERVIEW:
LANGUAGE CODES:
(01) ENGLISH
(02) KISWAHILI
SUPERVISOR: ______________________________
DATE: ______________________________
SUPERVISOR CODE: OFFICE EDITOR:
* RESULTS CODES:
(1) COMPLETED
(2) NO HOUSEHOLD MEMBER AT HOME OR NO COMPETENT RESPONDENT AT HOME AT TIME OF VISIT
(3) ENTIRE HOUSEHOLD ABSENT FOR EXTENDED PERIOD OF TIME
(4) POSTPONED
START TIME
START
Record the start time. USE 24 HOUR TIME. IF START TIME IS 3:12 PM, RECORD 15 HOURS, 12 MINUTES, NOT 03 HOURS, 12 MINUTES.
HOUR:
MINUTES:

217
HOUSEHOLD SCHEDULE
LINE NO. USUAL RESIDENTS AND VISITORS
RELATIONSHIP TO HEAD OF HOUSEHOLD SEX RESIDENCE AGE
Please give me the names of the persons who usually lives in your household or guests of the household who stayed here last night, starting with the head of the household.
AFTER LISTING THE NAME AND RECORDING THE RELATIONSHIP AND SEX FOR EACH PERSON ASK QUESTIONS 2A-2C BELOW TO BE SURE THAT THE SCHEDULE IS COMPLETE.
What is the relationship of (NAME) to the head of the household?
SEE CODES BELOW
Is (NAME) Male or Female?
Does (NAME) usually live here?
Did (NAME) sleep here last night?
IF LESS THAN 5 YEARS, RECORD IN MONTHS.
How old is (NAME)?
Is age of (NAME) recorded in MONTHS/
YEARS?
(1) (2) (3) (4) (5) (6) (7) (8)
1 M F Y N Y N MONTHS
YEARS
2 M F Y N Y N MONTHS
YEARS
3 M F Y N Y N MONTHS
YEARS
4 M F Y N Y N MONTHS
YEARS
5 M F Y N Y N MONTHS
YEARS
6 M F Y N Y N MONTHS
YEARS
7 M F Y N Y N MONTHS
YEARS
8 M F Y N Y N MONTHS
YEARS
9 M F Y N Y N MONTHS
YEARS
10 M F Y N Y N MONTHS
YEARS

218
TICK HERE IF CONTINUATION SHEET USED
CODES FOR COLUMN 3: RELATIONSHIP TO HOUSEHOLD HEAD
2A) Just to make sure I have a complete listing, are there any other persons such as small children or infants that we have not listed?
YES NO
01 = HEAD
02 = WIFE/HUSBAND/PARTNER
03 = SON OR DAUGHTER
04 = SON-IN-LAW/ DAUGHTER-IN-LAW
05 = GRANDCHILD
06 = PARENT
07 = PARENT-IN-LAW
08 = BROTHER/SISTER
09 = CO-WIFE
10 = OTHER RELATIVE
11 = ADOPTED/ FOSTER/STEPCHILD
12 = NOT RELATED
98 = DON’T KNOW
2B) Are there any other people who may not be members of your household such as domestic servants, lodgers, of friends who usually live here?
YES NO
2C) Are there any guests or temporary visitors staying here, or anyone else who stayed here last night who we have not seen?
YES
ADD TO SCHEDULE
NO
LINE NO.
IF (NAME) IS 0-17 YEARS
EMANCIPATION STATUS ORPHAN STATUS/PARENT OR GUARDIAN
Is (NAME) emancipated?
[Emancipated minor: Is a person who is not age 18 or over but who, because she or he is married, or is no longer dependent on the parents, does not require parental permission to participate].
Is (NAME)’s natural mother alive?
Does (NAME)’s natural mother usually live in this household or was a guest last night?
IF YES:
RECORD MOTHER’S LINE NUMBER.
IF NO:
RECORD FEMALE GUARDIAN’S LINE NUMBER OR ‘00’ IF PARENT OR GUARDIAN NOT PRESENT IN HH.
Is (NAME)’s natural
father alive?
Does (NAME)’s natural father usually live in this household or was a guest last night?
IF YES:
RECORD FATHER’S LINE NUMBER.
IF NO:
RECORD MALE GUARDIAN’S LINE NUMBER OR ‘00’ IF PARENT OR GUARDIAN NOT PRESENT IN HH.
(1) (9) (10) (11) (12) (13)
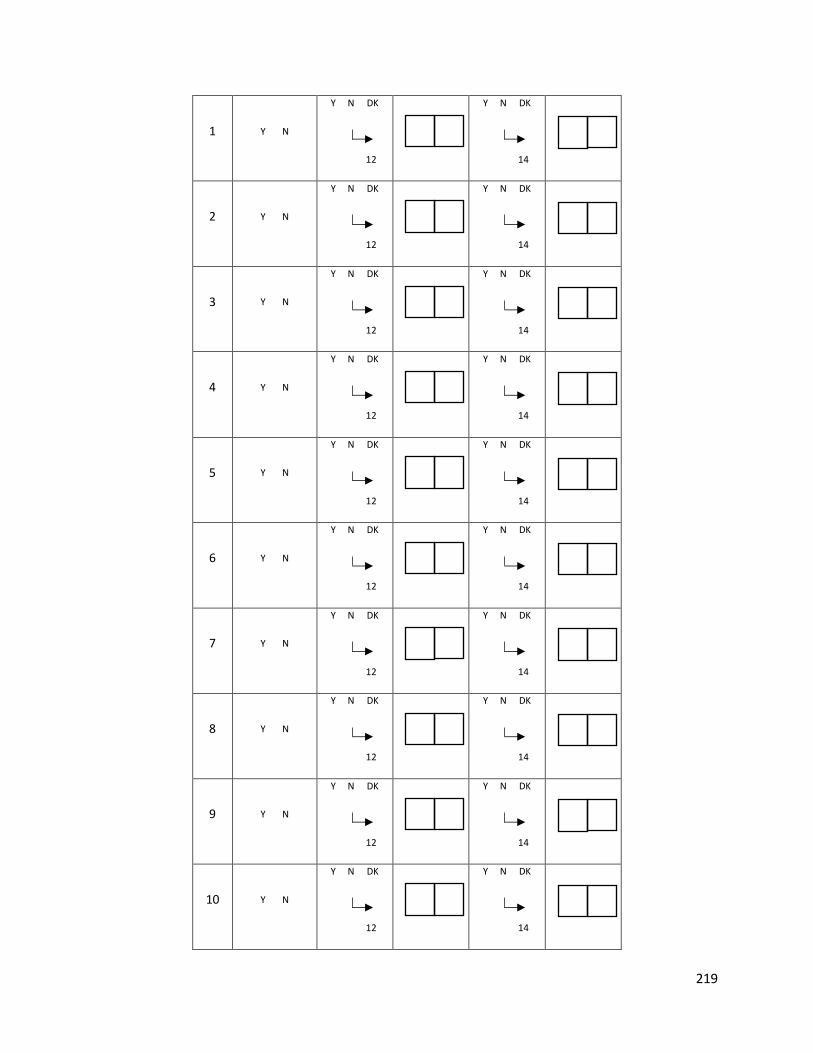
219
1 Y N
Y N DK
12
Y N DK
14
2 Y N
Y N DK
12
Y N DK
14
3 Y N
Y N DK
12
Y N DK
14
4 Y N
Y N DK
12
Y N DK
14
5 Y N
Y N DK
12
Y N DK
14
6 Y N
Y N DK
12
Y N DK
14
7 Y N
Y N DK
12
Y N DK
14
8 Y N
Y N DK
12
Y N DK
14
9 Y N
Y N DK
12
Y N DK
14
10 Y N
Y N DK
12
Y N DK
14

220
LINE NO.
IF (NAME) is 18+ years
SICK PERSON
MOTHER DEAD OR SICK
FATHER DEAD OR SICK
CHECK COLUMNS 7 AND 8, IF UNDER 18
� 19
IF 18 YEARS OR MORE:
Has (NAME) been very sick for at
least 3 months
during the past 12 months, that is
(NAME) was too sick to work or do
normal activities?
CHECK COLUMN 10,
IF COLUMN 10 ‘N’ � 22
IF COLUMN 10 ‘Y’:
Has (NAME)’s
natural mother
been very sick for at
least 3 months
during the past 12
months, that is she was too sick to work or do
normal activities?
IF MOTHER SICK:
Does (NAME)’s natural mother have HIV/AIDS?
CHECK COLUMN 12,
IF COLUMN 12 ‘N’ � 25
IF COLUMN 11 ‘Y’:
Has (NAME)’s natural father
been very sick for at least 3 months
during the past 12 months, that
is he was too sick to work or do
normal activities?
IF FATHER SICK:
Does (NAME)’s natural father
have HIV/AIDS?
IF CHILD’S NATURAL MOTHER HAS DIED (COLUMN 10 ‘N’) OR BEEN SICK (COLUMN
19 ‘Y’), SELECT Y.
IF CHILD’S NATURAL
FATHER HAS DIED
(COLUMN 12‘N’) OR BEEN SICK (COLUMN
22 ‘Y’), SELECT Y.
(1) (18) (19) (20) (22) (23) (25) (26)
1
Y N
Y N
21
Y N DK
Y N
24
Y N DK
Y N
Y N

221
2
Y N
Y N
21
Y N DK
Y N
24
Y N DK
Y N
Y N
3
Y N
Y N
21
Y N DK
Y N
24
Y N DK
Y N
Y N
4
Y N
Y N
21
Y N DK
Y N
24
Y N DK
Y N
Y N
5
Y N
Y N
21
Y N DK
Y N
24
Y N DK
Y N
Y N
6
Y N
Y N
21
Y N DK
Y N
24
Y N DK
Y N
Y N
7
Y N
Y N
21
Y N DK
Y N
24
Y N DK
Y N
Y N
8
Y N
Y N
21
Y N DK
Y N
24
Y N DK
Y N
Y N
9
Y N
Y N
Y N DK
Y N
Y N
Y N
Y N

222
21
24
10
Y N
Y N
21
Y N DK
Y N
24
Y N
Y N
Y N
HOUSEHOLD SCHEDULE HEALTH INSURANCE
LINE NO. SPOUSES AND CO-HABITATING PARTNERS
RECORD THE LINE NUMBER (NAME)’S OF SPOUSE OR PARTNER. IF NO SPOUSE OR PARTNER LEAVE BLANK.
RECORD THE LINE NUMBER (NAME)’S OF SPOUSE OR PARTNER. IF NO SPOUSE OR PARTNER LEAVE BLANK.
RECORD THE LINE NUMBER (NAME)’S OF SPOUSE OR PARTNER. IF NO SPOUSE OR PARTNER LEAVE BLANK.
Is (NAME) covered by any health Insurance?
What is (NAME)'s main type of health insurance NHIF=01 NSSF=02 CHF=03 OTHER EMPLOYER BASED=04 OTHER COMMUNITY BASED MUTUAL =05 PRIVATELY PURCHASED = 07 OTHER (SPECIFY)____=96 DON’T KNOW=98
(1) (27a) (27b) (27c) 28 29
1
Y N DK
GO TO101

223
2 Y N DK
GO TO101
3 Y N DK
GO TO101
4 Y N DK
GO TO101
5 Y N DK
GO TO101
6 Y N DK
GO TO101
7 Y N DK
GO TO101
8 Y N DK
GO TO101
9 Y N DK
GO TO101
10 Y N DK
GO TO101

224
NO. QUESTIONS AND INSTRUCTIONS CODING CATEGORIES SKIP
SUPPORT FOR ORPHANS AND VULNERABLE CHILDREN
101
DO NOT READ: CHECK COLUMN 7 IN THE HOUSEHOLD SCHEDULE. ANY CHILD AGE 0-17 YEARS?
NUMBER OF CHILDREN 0-17 YRS:
HH CHARACT.
102
DO NOT READ: CHECK COLUMN 18 IN THE HOUSEHOLD SCHEDULE. ANY SICK ADULT AGE 18-64 YEARS?
YES………………………………………..……1
NO………………………………………………2
105
103
DO NOT READ: CHECK COLUMN 25 IN THE HOUSEHOLD SCHEDULE. ANY CHILD WHOSE MOTHER HAS DIED OR IS VERY SICK?
YES………………………………………..……1
NO………………………………………………2
105
104
DO NOT READ: CHECK COLUMN 26 IN THE HOUSEHOLD SCHEDULE. ANY CHILD WHOSE FATHER HAS DIED OR IS VERY SICK?
YES………………………………………..……1
NO………………………………………………2
105
HH CHARACT.
IF ‘00’ NONE
CONTINUE TO 102
IF AT LEAST ONE CHILD

225
NO. QUESTIONS AND INSTRUCTIONS CODING CATEGORIES SKIP
105
RECORD NAMES, LINE NUMBERS, AND AGES OF ALL CHILDREN 0-17 WHO ARE IDENTIFIED IN COLUMNS 18, 25, AND 26 AS HAVING A SICK ADULT IN THEIR HOUSEHOLD OR HAVING A MOTHER AND/OR FATHER WHO HAS DIED OR HAS BEEN VERY SICK.
NAME
CHILD (1)
________________
CHILD (2)
________________
CHILD (3)
________________
LINE NUMER (FROM COLUMN 1)
AGE (FROM COLUMN 7)
Ø INTERVIEWER SAY: “I would like to ask you about any formal, organized help or support for children that your household may have received for which you did not have to pay. By formal, organized support, I mean help provided by someone working for a program. This program could be government, private, religious, charity, or community-based.”
106
Now I would like to ask you about the support your household received for (NAME). In the last 12 months, has your household received any medical support for (NAME), such as medical care, supplies, or medicine, for which you did not have to pay?
YES…………………1
NO…………………..2
DON’T KNOW……..8
YES…………………1
NO…………………..2
DON’T KNOW……..8
YES…………………1
NO…………………..2
DON’T KNOW……..8

226
107
In the last 12 months, has your household received any emotional or psychological support for (NAME), such as companionship, counseling from a trained counselor, or spiritual support, which you received at home and for which you did not have to pay?
YES…………………1
NO…………………..2
DON’T KNOW……..8 109
YES…………………1
NO…………………..2
DON’T KNOW……..8 109
YES…………………1
NO…………………..2
DON’T KNOW……..8 109
108
Did your household receive any of this emotional or psychological support for (NAME) in the past 3 months?
YES…………………1
NO…………………..2
DON’T KNOW……..8
YES…………………1
NO…………………..2
DON’T KNOW……..8
YES…………………1
NO…………………..2
DON’T KNOW……..8
109
In the last 12 months, has your household received any material support for (NAME), such as clothing, food, or financial support, for which you did not have to pay?
YES…………………1
NO…………………..2
DON’T KNOW……..8 111
YES…………………1
NO…………………..2
DON’T KNOW……..8 111
YES…………………1
NO…………………..2
DON’T KNOW……..8 111
110
Did your household receive any of this material support for (NAME) in the past 3 months?
YES…………………1
NO…………………..2
DON’T KNOW……..8
YES…………………1
NO…………………..2
DON’T KNOW……..8
YES…………………1
NO…………………..2
DON’T KNOW……..8
111
In the last 12 months, has your household received any social support for (NAME) such as help in household work, training for a caregiver, or legal services, for which you did not have to pay?
YES…………………1
NO…………………..2
DON’T KNOW……..8 CHECK BEFORE 113
YES…………………1
NO…………………..2
DON’T KNOW……..8 CHECK BEFORE 113
YES…………………1
NO…………………..2
DON’T KNOW……..8 CHECK BEFORE 113
112
Did your household receive any of this social support for (NAME) in the past 3 months?
YES…………………1
NO…………………..2
DON’T KNOW……..8
YES…………………1
NO…………………..2
DON’T KNOW……..8
YES…………………1
NO…………………..2
DON’T KNOW……..8

227
113
In the last 12 months, has your household received any support for (NAME)’s schooling, such as allowance, free admission, books, or supplies, for which you did not have to pay?
YES…………………1
NO, DID NOT RECEIVE SUPPORT...………..2
NO, CHILD DOES NOT ATTEND SCHOOL…………...3
DON’T KNOW……..8
SKIP IF CHILD<5 YEARS
YES…………………1
NO, DID NOT RECEIVE SUPPORT...………..2
NO, CHILD DOES NOT ATTEND SCHOOL…………...3
DON’T KNOW……..8
SKIP IF CHILD<5 YEARS
YES…………………1
NO, DID NOT RECEIVE SUPPORT...………..2
NO, CHILD DOES NOT ATTEND SCHOOL…………...3
DON’T KNOW……..8
SKIP IF CHILD<5 YEARS
CONTINUE TO NEXT CHILD IF OTHER CHILDREN WHOSE MOTHER AND/OR FATHER HAS DIED OR IS VERY SICK.
MATRIX END
INTERVIEWER SAYS: “Thank you for the information regarding (NAME).” IF THERE IS ANOTHER CHILD 0-17 YEARS IN THE HOUSEHOLD WHO HAS BEEN IDENTIFIED IN COLUMN 17 AS HAVING A MOTHER/FATHER WHO HAS DIED OR IS VERY SICK BESIDES (NAME) à CONTINUE TO 106 AND ASK ABOUT THE NEXT CHILD. INTERVIEWER SAYS: “Next, I would like to ask you about (NAME)”.
TICK IF CONTINUATION SHEET REQUIRED.
IF NO OTHER CHILDREN, CONTINUE HOUSEHOLD INTERVIEW.
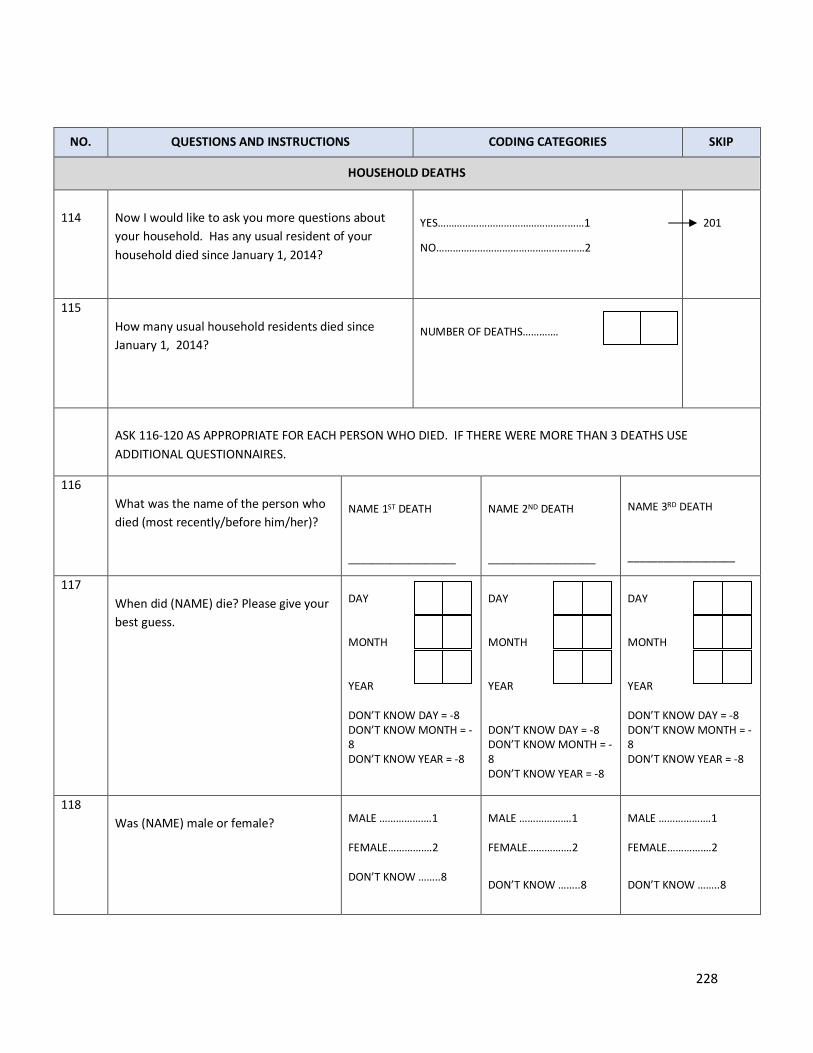
228
NO. QUESTIONS AND INSTRUCTIONS CODING CATEGORIES SKIP
HOUSEHOLD DEATHS
114
Now I would like to ask you more questions about your household. Has any usual resident of your household died since January 1, 2014?
YES………………………………………..……1
NO………………………………………………2
201
115 How many usual household residents died since January 1, 2014?
NUMBER OF DEATHS………….
ASK 116-120 AS APPROPRIATE FOR EACH PERSON WHO DIED. IF THERE WERE MORE THAN 3 DEATHS USE ADDITIONAL QUESTIONNAIRES.
116 What was the name of the person who died (most recently/before him/her)?
NAME 1ST DEATH
__________________
NAME 2ND DEATH
__________________
NAME 3RD DEATH
__________________
117 When did (NAME) die? Please give your best guess.
DAY MONTH YEAR DON’T KNOW DAY = -8 DON’T KNOW MONTH = -8 DON’T KNOW YEAR = -8
DAY MONTH YEAR DON’T KNOW DAY = -8 DON’T KNOW MONTH = -8 DON’T KNOW YEAR = -8
DAY MONTH YEAR DON’T KNOW DAY = -8 DON’T KNOW MONTH = -8 DON’T KNOW YEAR = -8
118 Was (NAME) male or female?
MALE ……………….1 FEMALE…………….2 DON’T KNOW ……..8
MALE ……………….1 FEMALE…………….2
DON’T KNOW ……..8
MALE ……………….1 FEMALE…………….2
DON’T KNOW ……..8

229
119 How old was (NAME) when (he/she) died? RECORD DAYS IF LESS THAN 1 MONTH, MONTHS IF LESS THAN 1 YEAR, AND COMPLETED YEARS IF 1 YEAR OR MORE.
DAYS MONTHS YEARS
DAYS MONTHS YEARS
DAYS MONTHS YEARS
CONTINUE TO NEXT DEATH ACCORDING UP TO THE NUMBER REPORTED FROM 115. TICK IF CONTINUATION SHEET REQUIRED.

230
NO. QUESTIONS AND INSTRUCTIONS CODING CATEGORIES SKIP
HOUSEHOLD CHARACTERISTICS
INTERVIEWER SAY: “Now I would like to ask you more questions about your household.”
201
What is the main source of drinking water for members of your household?
PIPED WATER
PIPED INTO DWELLING………………11
PIPED TO YARD/PLOT………………...12
PUBLIC TAP/STANDPIPE……………..13
TUBE WELL OR BOREHOLE……………21
DUG WELL
PROTECTED WELL…………………….31
UNPROTECTED WELL………………...32
WATER FROM SPRING
PROTECTED SPRING………………….41
UNPROTECTED SPRING……………...42
RAINWATER………………………………..51
TANKER TRUCK…………………………...61
CART WITH SMALL TANK……………….71
SURFACE WATER (RIVER/DAM/LAKE/ POND/STREAM/CANAL)………………....81
BOTTLED WATER………………………...91
OTHER……………………………………...96
___________________________________ (SPECIFY)
202
Did you do anything to the water to make it safer to drink?
YES………………………………………....…1
NO…………………………………………..…2
DON’T KNOW..……………..……………..…8
204

231
203
What do you do to make your water safe for drinking?
BOILING………………………………………1
FILTRATION (CHARCOAL FILTER).……...2
SEDIMENTATION…………………………...3
DISINFECTION (WATERGUARD, CHLORINE)………………………………….4
USE BOTTLED WATER…………………....5
OTHER……………………………………...96
___________________________________ (SPECIFY)

232
204
What kind of toilet facility do members of your household usually use?
FLUSH TO PIPED SEWER SYSTEM ….11
FLUSH TO SEPTIC TANK …................12
FLUSH TO PIT LATRINE ……………….13
FLUSH TO SOMEWHERE ELSE ……….14
FLUSH, DON'T KNOW WHERE …..........15
VENTILATED IMPROVED PIT LATRINE………………………………………..21
PIT LATRINE WITH SLAB (WASHABLE).....................................22
PIT LATRINE WITH SLAB (NOT WASHABLE)……………………………….23
PIT LATRINE WITHOUT SLAB/OPEN PIT..……………………………………………..24
COMPOSTING TOILET…………………….31
BUCKET TOILET …………………………..41
HANGING TOILET/HANGING LATRINE……………………………………….51
NO TOILET/BUSH/FIELD …………………61
OTHER……………………………………96
______________________________ (SPECIFY) T
205
205
Do you share this toilet facility with other households?
YES………………………………………....…1
NO…………………………………………..…2

233
206
How many households use this toilet facility?
NO. OF HOUSEHOLD IF LESS THAN 10
________
10 OR MORE HOUSEHOLDS …………….96
DON’T KNOW ……………………………….98
PREFACE BEFORE QUESTIONS 207-211: Does your household have: 207
Electricity?
YES………………………………………....…1
NO…………………………………………..…2
208
A radio
YES………………………………………....…1
NO…………………………………………..…2
209
A television?
YES………………………………………....…1
NO…………………………………………..…2
210
A telephone/mobile telephone
YES………………………………………....…1
NO…………………………………………..…2
211
A refrigerator
YES………………………………………....…1
NO…………………………………………..…2
212
What type of fuel does your household mainly use for cooking?
ELECTRICITY…………………………………1
LPG / NATURAL GAS………………………..2
BIOGAS………………………………………..3
PARAFFIN / KEROSENE……………………4
COAL, LIGNITE……………………………….5
CHARCOAL FROM WOOD………………….6
FIREWOOD / STRAW………………………..7
DUNG…………………………………………..8
NO FOOD COOKED IN HOUSEHOLD…...95
OTHER………………………………………..96
___________________________________
(SPECIFY)

234
212A
What is the main source of energy for lighting in the Household?
ELECTRICITY…………………………………01
SOLAR…………………………………………02
GAS……………………………………………..03
PARAFFIN-HURRICANE LAMP…………….04
PARAFFIN-PRESSURE LAMP………………05
PARAFFIN-WICK LAMP……………………..06
FIREWOOD……………………………………07
CANDLES………………………………………08
OTHER ___________________________ 96
SPECIFY
213
MAIN MATERIAL OF FLOOR RECORD OBSERVATION.
NATURAL FLOOR
EARTH / SAND…………………………………11
DUNG……………………………………………12
RUDIMENTARY FLOOR
WOOD PLANKS………………………………..21
PALM / BAMBOO………………………………22
FINISHED FLOOR
PARQUET OR POLISHED WOOD………….31
VINYL OR ASPHALT STRIP…………………32
CERAMIC TILES………………………………33
CEMENT/TERAZO……………………………34
CARPET………………………………………..35
OTHER…………………………………………….96
___________________________________ (SPECIFY)

235
214
MAIN MATERIAL OF THE ROOF RECORD OBSERVATION.
NATURAL ROOFING
NO ROOF………………………………………11
THATCH/PALM LEAF (MAKUTI)…………….12
DUNG / MUD…………………………………..13
RUDIMENTARY ROOFING
CORRUGATED IRON (MABATI)……...…….21
TIN CANS………………………………………22
FINISHED ROOFING
ASBESTOS SHEET…………………………..31
CONCRETE……………………………………32
TILES…………………………………………...33
OTHER…………………………………………...96
___________________________________ (SPECIFY)
215
MAIN MATERIAL OF THE EXTERIOR WALLS RECORD OBSERVATION.
NATURAL WALLS
NO WALLS………………………………………11
CANE/PALM/TRUNKS…………………………12
DUNG / MUD……………………………………13
RUDIMENTARY WALLS
BAMBOO WITH MUD………………………….21
STONE WITH MUD…………………………….22
PLYWOOD/CARDBOARD…………………….23
CARTON………………………………………...24
REUSED WOOD………………………….……25
FINISHED WALLS
CEMENT………………………………….………31
STONE WITH LIME/CEMENT………………….32
BRICKS…………………………………...……....33
CEMENT BLOCKS………………………………34
WOOD PLANKS/SHINGLES…………...………35
OTHER……………………………………….…...96
___________________________________
(SPECIFY)
216
How many rooms are used for sleeping?
NUMBER OF ROOMS:
PREFACE BEFORE QUESTIONS 215-218: Does any member of your household own: 217
A bicycle?
YES………………………………………....…1
NO…………………………………………..…2

236
218
A motorcycle or motor scooter?
YES………………………………………....…1
NO…………………………………………..…2
219
A car or truck?
YES………………………………………....…1
NO…………………………………………..…2
220
A boat with a motor?
YES………………………………………....…1
NO…………………………………………..…2
220A
An animal-drawn cart?
YES………………………………………....…1
NO…………………………………………..…2
PREFACE BEFORE QUESTIONS 219-223: Does any member of your household own: 221
Cows?
YES………………………………………....…1
NO…………………………………………..…2
222
Goats/Sheep?
YES………………………………………....…1
NO…………………………………………..…2
223
Poultry (e.g., ducks, chickens)?
YES………………………………………....…1
NO…………………………………………..…2
224
Dogs?
YES………………………………………....…1
NO…………………………………………..…2
225
Other animals (camels, horses, donkeys)?
YES………………………………………....…1
NO…………………………………………..…2
MALARIA & FOOD SECURITY
226* Does your household have any mosquito nets that can
be used while sleeping?
YES………………………………………....…1
NO…………………………………………..…2

237
227*
In the past 4 weeks, was there ever no food to eat of any kind in your household because of lack of resources to get food?
YES……………………………………………1
NO……………………………………………..2
DON’T KNOW………………………………..8
227
228*
How often did this happen in the past 4 weeks?
RARELY (1-2 TIMES)………………………1
SOMETIMES (3-10 TIMES)………………..2
OFTEN (MORE THAN 10 TIMES)………...3
229*
In the past 4 weeks, did you or any household member go to sleep at night hungry because there was not enough food?
YES……………………………………………1
NO……………………………………………..2
DON’T KNOW………………………………..8
229
230*
How often did this happen in the past 4 weeks?
RARELY (1-2 TIMES)………………………1
SOMETIMES (3-10 TIMES)………………..2
OFTEN (MORE THAN 10 TIMES)………...3
231*
In the past four weeks, did you or any household member go a whole day and night without eating anything because there was not enough food?
YES……………………………………………1
NO……………………………………………..2
DON’T KNOW………………………………..8
301
232*
How often did this happen in the past 4 weeks?
RARELY (1-2 TIMES)………………………1
SOMETIMES (3-10 TIMES)………………..2
OFTEN (MORE THAN 10 TIMES)………...3

238
NO. QUESTIONS AND INSTRUCTIONS CODING CATEGORIES SKIP
ECONOMIC SUPPORT
301
Has your household received any of the following forms of external economic support in the last 12 months? SELECT ALL THAT APPLY.
NOTHING ……………………………………..A
CASH TRANSFER (E.G. PENSIONS, DISABILITY GRANTS, CHILD GRANT)…..……………………………………B
ASSISTANCE FOR SCHOOL FEES…….....C
MATERIAL SUPPORT FOR EDUCATION (E.G. UNIFORMS, SCHOOL BOOKS, EDUCATION, TUITION SUPPORT, BURSARIES)…………………………………..D
INCOME GENERATION SUPPORT IN CASH OR KIND (E.G. AGRIGULTURAL INPUTS)………………..……………………...E
FOOD ASSISTANCE PROVIDED AT THE HOUSEHOLD OR EXTERNAL INSTITUTION………….……..…………….....F
MATERIAL OR FINANCIAL SUPPORT FOR SHELTER……………………....……………..G
SOCIAL PENSION……………………....……………..H
OTHER………………………………………..X
___________________________________ (SPECIFY)
DON’T KNOW ………………………………..Z
NOTHING àEND OF SECTION

239
302
Has your household received any of the following forms of external economic support in the last 3 months? SELECT ALL THAT APPLY.
NOTHING ……………………………………..A
CASH TRANSFER (E.G. PENSIONS, DISABILITY GRANTS, CHILD GRANT)…..……………………………………B
ASSISTANCE FOR SCHOOL FEES…….....C
MATERIAL SUPPORT FOR EDUCATION (E.G. UNIFORMS, SCHOOL BOOKS, EDUCATION, TUITION SUPPORT, BURSARIES)…………………………………..D
INCOME GENERATION SUPPORT IN CASH OR KIND (E.G. AGRIGULTURAL INPUTS)………………..……………………...E
FOOD ASSISTANCE PROVIDED AT THE HOUSEHOLD OR EXTERNAL INSTITUTION………….……..…………….....F
MATERIAL OR FINANCIAL SUPPORT FOR SHELTER……………………....……………..G
SOCIAL PENSION……………………....……………..H
OTHER………………………………………..X
___________________________________ (SPECIFY)
DON’T KNOW ………………………………..Z
END OF HOUSEHOLD INTERVIEW
Ø INTERVIEWER SAY: “This is the end of the household survey. Thank you very much for your time and for your responses.”
END TIME
END
Record the end time. USE 24 HOUR TIME. IF START TIME IS 3:12 PM, RECORD 15 HOURS, 12 MINUTES, NOT 03 HOURS, 12 MINUTES.
HOUR:
MINUTES:

240
INTERVIEWER OBSERVATIONS: TO BE COMPLETED AFTER THE INTERVIEW: COMMENTS ABOUT RESPONDENT: _____________________________________________________________________________________________
_____________________________________________________________________________________________
_____________________________________________________________________________________________
_____________________________________________________________________________________________
________
COMMENTS ABOUT SPECIFIC QUESTIONS: _____________________________________________________________________________________________
_____________________________________________________________________________________________
_____________________________________________________________________________________________
_____________________________________________________________________________________________
________
GENERAL QUESTIONS: _____________________________________________________________________________________________
_____________________________________________________________________________________________
_____________________________________________________________________________________________
_____________________________________________________________________________________________
________

241
EN
GLISH
CO
NFID
ENTIA
L
2016 TAN
ZAN
IA PO
PULA
TION
BASED
HIV
IMPA
CT ASSESSM
ENT
IND
IVID
UA
L QU
ESTION
NA
IRE U
NITED
REPUBLIC O
F TAN
ZAN
IA
IDEN
TIFICATIO
N
REG
ION
COD
E
DISTRICT CO
DE
WA
RD/SH
EHIA
CLU
STER NU
MBER
HH
NU
MBER
REGIO
N N
AM
E: _________________________________________________
DISTRICT N
AM
E: _________________________________________________
WA
RD N
AM
E: _________________________________________________ CLU
STER NA
ME:
_________________________________________________
NA
ME A
ND
LINE N
UM
BER O
F IND
IVID
UA
L: _________________________________________________
INTERV
IEWER V
ISITS
1 2
3 FIN
AL V
ISIT
VISIT D
ATE:
INTERV
IEWER N
AM
E:
RESULT*
______________ _______________ _______________
_______________ _______________ _______________
_______________ _______________ _______________
DA
Y:
MO
NTH
:
YEAR:
INT. CO
DE:
RESULT:
N
EXT VISIT: D
ATE
TIME
________________ ________________
________________ ________________
TOTA
L NU
MBER
O
F VISITS:
SUPERV
ISOR: ______________________________
SU
PERVISO
R COD
E:
OFFICE ED
ITOR:
KEYED
BY:
APPENDIX F:
ADULT Q
UESTIONNAIRE

242
DA
TE: ______________________________
* RESULTS CO
DES:
(1) CO
MPLETED
(2) N
OT A
T HO
ME
(3) PO
STPON
ED
(4) REFU
SED
(5) PA
RTLY COM
PLETED
(6) IN
CAPA
CITA
TED
(7) O
THER (SPECIFY)
MO
DU
LE 1: RESPO
ND
ENT BA
CKGRO
UN
D
N
O.
V
ARN
AM
E
QU
ESTION
S
COD
ING
CATEG
ORIES
SKIPS/FILTERS CO
MM
ENTS
IN
DICATO
R
DH
S/AIS
CO
RE
L1 LN
GVQ
X_LNG
LA
NG
UA
GE O
F QU
ESTION
NA
IRE EN
GLISH
= 1
SWA
HILI = 2
C
L2 LN
GVIN
T_LN
G
LAN
GU
AG
E OF IN
TERVIEW
ENG
LISH = 1
SWA
HILI = 2
C
Thank you for agreeing to participate in this survey.
The first set of questions is about your life in general. Afterw
ards, we w
ill move on to other
topics.
N/A
N/A
N/A
101 GEN
DR
IS THE RESPO
ND
ENT M
ALE O
R FEMA
LE?
MA
LE = 1
FEMA
LE = 2
Y; 110 in
THM
IS
C

243
N
O.
V
ARN
AM
E
QU
ESTION
S
COD
ING
CATEG
ORIES
SKIPS/FILTERS CO
MM
ENTS
IN
DICATO
R
DH
S/AIS
CO
RE
102 SCH
LAT H
ave you ever attended school? YES = 1
NO
= 2
DO
N’T KN
OW
= -8 REFU
SED = -9
NO
, DK, REFU
SED
à
12MO
NTAW
AYNIG
HT
Y
C
103 SCH
LCUR
Are you enrolled in school?
YES = 1
NO
= 2 D
ON
’T KNO
W = -8
REFUSED
= -9
DK, REFU
SED à
12MO
NTAW
AYNIG
HT
N
C
104 SCH
LHI
What is the highest level of school you attended:?
IF RESPON
DEN
T MEN
TION
S SECON
DARY O
R POST
SECON
DA
RY TRAININ
G PRO
BE TO ID
ENTIFY IF IT IS
SECON
DA
RY O-LEVEL O
R A-LEVEL
PRE-PRIMA
RY = 0
PRIMARY=1
POST- PRIM
ARY TRAININ
G=2
SECON
DA
RY (O-LEV
EL)= 3 PO
ST SECON
DA
RY (O-LEVEL) TRA
ININ
G= 4
SECON
DA
RY (A-LEV
EL) =5
POST SECO
ND
ARY (A LEV
EL) TRAININ
G =6
UN
IVERSITY =7
DO
N’T KN
OW
= -8
REFUSED
= -9
N
C

244
N
O.
V
ARN
AM
E
QU
ESTION
S
COD
ING
CATEG
ORIES
SKIPS/FILTERS CO
MM
ENTS
IN
DICATO
R
DH
S/AIS
CO
RE
105 SCH
COM
W
hat is the highest grade you completed at that
level?
IF COM
PLETED LESS TH
AN O
NE YEA
R AT THAT LEV
EL
RECORD
‘00’
GRA
DE _____
DO
N’T KN
OW
= -8
REFUSED
= -9
N
Y 106
THM
IS
C
106 12M
ON
TAW
AYN
IGH
T
In the last 12 months, how
many tim
es have you
been away from
home for one or m
ore nights? CO
DE ‘00’ IF N
ON
E.
NU
MBER O
F TIMES _ _
DO
N’T KN
OW
= -8
REFUSED
= -9
NO
NE , D
K,
REFUSED
à109
Y 118
THM
IS
S
107 12M
OAW
AY
MO
NTH
In the last 12 months, have you been aw
ay from
home for m
ore than one month at a tim
e?
YES = 1 N
O = 2
DO
N’T KN
OW
= -8
REFUSED
= -9
Y 119 TH
MIS
S
108 W
ORK12M
O
Have you done any w
ork in the last 12 months for
which you received cash or goods as paym
ent?
YES = 1
NO
= 2
DO
N’T KN
OW
= -8 REFU
SED = -9
NO
, DK, REFU
SED
àN
EXT MO
DU
LE
Y 115 TH
MIS
C

245
N
O.
V
ARN
AM
E
QU
ESTION
S
COD
ING
CATEG
ORIES
SKIPS/FILTERS CO
MM
ENTS
IN
DICATO
R
DH
S/AIS
CO
RE
109 W
ORK7D
AYS H
ave you done any work in the last seven days for
which you received cash or goods as paym
ent?
YES = 1
NO
= 2
DO
N’T KN
OW
= -8 REFU
SED = -9
Y (modified)
113
THM
IS
C
MO
DU
LE 2: MA
RRIAG
E
N
O.
V
ARN
AM
E
QU
ESTION
S
COD
ING
CATEG
ORIES
SKIPS/FILTERS
IN
DICATO
R
DH
S/AIS
CO
RE
Now
I would like to ask you about your current and previous relationships and/or m
arriages.
201
EVERMAR
Have you ever been m
arried or lived together w
ith a [man/w
oman] as if m
arried?
YES = 1 N
O = 2
DO
N’T KN
OW
=-8 REFU
SED = -9
NO
, DK,
REFUSED
à SKIP
TO N
EXT M
OD
ULE
Y 502
THM
IS
C
202
AG
EMA
R H
ow old w
ere you the first time you m
arried or started living w
ith a [man/w
oman] as if
married?
AG
E IN YEARS ___ ___
DO
N’T KN
OW
= 98 REFU
SED = 99
N
Y 512 TH
MIS
C

246
N
O.
V
ARN
AM
E
QU
ESTION
S
COD
ING
CATEG
ORIES
SKIPS/FILTERS
IN
DICATO
R
DH
S/AIS
CO
RE
203
CURM
AR
What is your current m
arital status?: are you m
arried, living together with som
eone as if m
arried, widow
ed, divorced, or separated?
MA
RRIED = 1
LIVING
TOG
ETHER = 2
WID
OW
ED = 3
DIVO
RCED = 4
SEPARATED
= 5 D
ON
’T KNO
W = -8
REFUSED
= -9
WID
OW
ED,
DIVO
RCED,
SEPARATED
, DK,
REFUSED
à
NEXT M
OD
ULE
N
Y 503
THM
IS
C
The next several questions are about your current spouse or partner(s).
204
NU
MW
IF A
ltogether, how m
any wives or live-in partners
do you have?
NU
MBER O
F WIVES O
R PARTNERS _____
DO
N’T KN
OW
= -8 REFU
SED = -9
NO
NE, D
K,
REFUSED
àSKIP
TO N
EXT
MO
DU
LE IF FEM
ALEà
HU
SLIVEW
Y 506
THM
IS
C
205
QXA
1205_LIST/Q
XA1205
The Household Schedule listed [count] household
mem
bers as your wives/partners. PLEA
SE REVIEW
THE LIST BELO
W.
Are all of the listed household m
embers your
wives/partners w
ho live in the household?
YES = 1 N
O = 2
IF NO
àN
PYN
N
C
206
REVWIFEN
M
Is [NAM
E] your wife/partner?
YES = 1 N
O = 2
Y
C

247
N
O.
V
ARN
AM
E
QU
ESTION
S
COD
ING
CATEG
ORIES
SKIPS/FILTERS
IN
DICATO
R
DH
S/AIS
CO
RE
207
REVWIFEH
H D
oes [NAM
E] live in the household? YES = 1 N
O = 2
Y
C
208
NPYN
D
o you have additional spouse(s)/partner(s) that live w
ith you?
YES = 1 N
O = 2
Y
C
209
NPN
UM
H
ow m
any additional spouse(s)/partners(s) live with
you?
NU
MBER O
F WIVES O
R LIVE-IN
PARTN
ERS _ _ D
ON
’T KNO
W = -8
REFUSE TO
AN
SWER = -9
Y 506
THM
IS
C
210
NEW
WN
AME
PLEASE EN
TER THE N
AME O
F THE SPO
USE/PARTN
ER TH
AT LIVES W
ITH TH
E RESPON
DEN
T.
NA
ME __________________
C
211
WIFLIVEEW
H
ow m
any wives or live-in partners do you have
who live elsew
here? CO
DE ‘00’ IF N
ON
E.
NU
MBER O
F AD
DITIO
NA
L SPO
USE(S)/PARTN
ERS ____ ____ D
ON
’T KNO
W = -8
REFUSED
= -9
Y
C
212
HU
SLIVEW
Is your husband or partner living with you now
or is he staying elsew
here?
LIVING
TOG
ETHER = 1
STAYIN
G ELSEW
HERE = 2
DO
N’T KN
OW
= -8 REFU
SE TO A
NSW
ER = -9
STAYIN
G
ELSEWH
ERE, DK,
REFUSED
à
HU
SOTW
IF STAYIN
G
ELSEWH
ERE &
LISTED PARTN
ER
Y 504
THM
IS
C

248
N
O.
V
ARN
AM
E
QU
ESTION
S
COD
ING
CATEG
ORIES
SKIPS/FILTERS
IN
DICATO
R
DH
S/AIS
CO
RE
IN H
H RO
STERà
HH
QXH
US2
IF MALE SKIP
àN
EXT M
OD
ULE
213
HH
QXH
US2
The household schedule listed [NAM
E OF
HU
SBAND
/PARTNER] as your husband/partner w
ho is living here. Is that correct?
YES = 1 N
O = 2
DO
N’T KN
OW
= -8 REFU
SED = -9
Y
C
214
NEW
HSELEC
T Please select the spouse/partner that lives w
ith you. N
AME
Y
C
215
NEW
HN
AM
E
PLEASE EN
TER THE N
AME O
F THE SPO
USE/PARTN
ER TH
AT LIVES W
ITH YO
U
NAM
E OF SPO
USE/PARTN
ER ____ D
ON
’T KNO
W = -8
REFUSED
= -9
Y
C
216
HU
SOTW
IF D
oes your husband or partner have other w
ives or does he live with other w
omen as if
married?
YES = 1 N
O = 2
DO
N’T KN
OW
= -8 REFU
SE TO A
NSW
ER = -9
NO
, DK,
REFUSED
à SKIP
TO N
EXT
MO
DU
LE
Y(m
odified)
506 TH
MIS
C

249
N
O.
V
ARN
AM
E
QU
ESTION
S
COD
ING
CATEG
ORIES
SKIPS/FILTERS
IN
DICATO
R
DH
S/AIS
CO
RE
217
HU
SNW
IF Including yourself, in total, how
many w
ives or live-in partners does your husband or partner have?
NU
MBER O
F WIVES O
R LIVE-IN
PARTN
ERS _ _ D
ON
’T KNO
W = -8
REFUSE TO
AN
SWER = -9
Y 506 TH
MIS
C

250
MO
DU
LE 3: REPRO
DU
CTION
N
O.
V
ARN
AM
E
QU
ESTION
S
COD
ING
CATEG
ORIES
SKIPS/FILTERS
IN
DICATO
R
DH
S/AIS
CO
RE
N
ow I w
ould like to ask you questions about your pregnancies and your children. IF M
ALE SKIP TO
336.
301
PREGN
UM
H
ow m
any times have you been pregnant including
a current pregnancy?
COD
E ‘00’ IF NO
NE.
NU
MBER O
F TIME(S) ____
DO
N’T KN
OW
= -8
REFUSED
= -9
NO
NE, D
K,
REFUSED
à
AV
OID
PREG
N
OT
AV
AILABL
E IN
THM
IS; TH
MIS
(201)
TALKS
ABO
UT
BIRTHS
C
302
LIVEB
Have you ever had a pregnancy that resulted in a
live birth?
A live birth is w
hen the baby shows signs of life,
such as breathing, beating of the heart or
movem
ent.
YES = 1
NO
= 2
DO
N’T KN
OW
= -8 REFU
SED = -9
NO
, DK, REFU
SED
à PREG
NAN
T
N
C
303
CHILD
A2012
How
many live births have you had since the first of
January 2013? CO
DE ‘00’ IF N
ON
E
.
NU
MBER O
F CHILD
REN ____
DO
N’T KN
OW
= -8
REFUSED
= -9
NO
NE, D
K,
REFUSED
à
PREGN
ANT
N
C

251
N
O.
V
ARN
AM
E
QU
ESTION
S
COD
ING
CATEG
ORIES
SKIPS/FILTERS
IN
DICATO
R
DH
S/AIS
CO
RE
N
ow I w
ould like to ask you some questions about the last pregnancy that resulted in a live birth since the first of January, 2013].
304
PRGTW
IN
Did your last pregnancy result in birth to tw
ins or m
ore?
YES = 1 N
O = 2
DO
N’T KN
OW
= -8
REFUSED
= -9
N N
OT
AV
AILABLE IN
THM
IS
APPRO
XIM
ATES TO
214 (01)
C
305
PRGTW
INN
AM
E* W
hat is the name of the [IN
SERT ORD
ER OF BIRTH
] born child from
your last pregnancy that resulted in
a live birth? IF TH
E CHILD
(CHILD
REN) W
AS N
OT N
AMED
BEFORE
DEATH
, INPU
T BIRTH 1.
NAM
E ________ W
ILL BE REPEATED
FOR EA
CH
MU
LTIPLE BIRTH
PRGTW
INN
AME*
306
CHILD
LAST
What is the nam
e of the child from your last
pregnancy that resulted in a live birth? A
live birth is when the baby show
s signs of life,
such as breathing, beating of the heart or m
ovement.
IF THE CH
ILD (CH
ILDREN
) WA
S NO
T NAM
ED BEFO
RE D
EATH, IN
PUT BIRTH
1.
NAM
E ______
N
C
307
PRGCARE
When you w
ere pregnant with (N
AM
E), did you visit a health facility for antenatal care?
YES = 1 N
O = 2
DO
N’T KN
OW
= -8 REFU
SED = -9
YESà H
IVTSBP D
K, REFUSED
à
HIVTSBP
Y N
OT
AV
AILABL
E IN
THM
IS,
available
C

252
N
O.
V
ARN
AM
E
QU
ESTION
S
COD
ING
CATEG
ORIES
SKIPS/FILTERS
IN
DICATO
R
DH
S/AIS
CO
RE
in D
HS/M
IS
2015
308
PREGN
CR W
hat is the main reason you did not visit a clinic for
antenatal care when you w
ere pregnant with
(NA
ME)?
CLINIC W
AS TO
O FA
R AWAY = 1
COU
LD N
OT TAKE TIM
E OFF W
ORK/TO
O
BUSY = 2
COU
LD N
OT A
FFORD
TO PA
Y FOR TH
E VISIT = 3 D
ID N
OT TRU
ST THE CLIN
IC STAFF = 4
RECEIVED CA
RE AT HO
ME = 5
DID
NO
T WAN
T AN H
IV TEST D
ON
E = 6
HU
SBAND
/FAMILY W
OU
LD N
OT LET M
E GO
= 7 U
SED TRA
DITIO
NA
L BIRTH
ATTEN
DAN
T/HEA
LER = 8
COST O
F TRANSPO
RT = 9
RELIGIO
US REA
SON
S = 10
OTH
ER = -96
SPECIFY: ____________________
DO
N’T KN
OW
= -98
REFUSED
= -99
NO
T
AV
AILABLE IN
THM
IS,
available in
DH
S/MIS
2015
N
C
I w
ill now be asking you questions on H
IV testing. Please rem
ember that your responses w
ill be kept confidential and
will not be shared w
ith anyone else.
309
HIVTSBP
Have you ever tested for H
IV before your pregnancy
with (N
AM
E)?
YES = 1
NO
= 2 D
ON
’T KNO
W = -8
REFUSED
= -9
NO
, DK, REFU
SED
à H
IVTO
PG
N
C

253
N
O.
V
ARN
AM
E
QU
ESTION
S
COD
ING
CATEG
ORIES
SKIPS/FILTERS
IN
DICATO
R
DH
S/AIS
CO
RE
310
HIVPSBP
Did you test positive for H
IV before your pregnancy
with (N
AM
E)?
YES = 1
NO
= 2 D
ON
’T KNO
W = -8
REFUSED
= -9
IF NO
, DK,
REFUSED
H
IVTOPG
N
C
311
ARV
FVST
At the tim
e of your first antenatal care visit when
you were pregnant w
ith (NA
ME), w
ere you taking
ARV
s, that is, antiretroviral medications to treat
HIV?
YES = 1
NO
= 2
DO
N’T KN
OW
= -8 REFU
SED = -9
YES à BIRTH
WH
R
NO
, DK,
REFUSED
à
ARV
TKPG
ELECTRON
IC AID IF
DO
N’T KN
OW
N
C
312
HIVTO
PG
During any of your visits to the antenatal care clinic
when you w
ere pregnant with (N
AME), w
ere you
offered an HIV
test?
YES = 1 N
O = 2
DO
N’T KN
OW
= -8
REFUSED
= -9
N
C
313
HIVTRPRG
W
ere you tested for HIV
during any of your antenatal care clinic visits w
hen you were pregnant
with (N
AM
E)?
YES = 1 N
O = 2
DO
N’T KN
OW
= -8
REFUSED
= -9
YES à H
IVRTPG
DK, REFU
SED à
BRTHW
HR
NO
T
AV
AILABLE IN
THM
IS
N
C

254
N
O.
V
ARN
AM
E
QU
ESTION
S
COD
ING
CATEG
ORIES
SKIPS/FILTERS
IN
DICATO
R
DH
S/AIS
CO
RE
314
HIVTSN
R W
hat is the main reason you w
ere not tested for
HIV
during antenatal care with (N
AM
E)?
DID
NO
T WAN
T AN H
IV TEST D
ON
E / DID
NO
T
WAN
T TO KN
OW
MY STATU
S = 1
DID
NO
T RECEIVE PERMISSIO
N FRO
M
SPOU
SE/FAMILY = 2
AFRAID
OTH
ERS WO
ULD
KNO
W A
BOU
T TEST RESU
LTS = 3
DID
NO
T NEED
TEST/LOW
RISK = 4
OTH
ER, (SPECIFY) = 96 D
ON
’T KNO
W = -8
REFUSED
= -9
ALLà
SKIP TO
BIRTHW
HR
.
N
C
315
HIVRTPG
W
hat was the result of your last H
IV test during
your pregnancy with (N
AM
E)?
POSITIVE = 1
NEG
ATIVE = 2 U
NKN
OW
N/ = 3
DID
NO
T RECEIVE RESULTS = 4
DO
N’T KN
OW
= -8 REFU
SED = -9
NEG
ATIVE, UN
K, N
O RESU
LTS, DK,
REF à BIRTH
WH
R
N
C
316
ARV
TKPG
Did you take A
RVs during your pregnancy with
(NAM
E)
YES = 1 N
O = 2
DO
N’T KN
OW
= -8 REFU
SED = -9
YES, SYPHTTKD
K, REFU
SED à
BIRTHW
HR
N
C
317
ARV
NRPG
W
hat was the m
ain reason you did not take ARVs
while you w
ere pregnant with (N
AM
E)?
W
AS N
OT PRESCRIBED
= 1
I FELT HEA
LTHY/N
OT SICK = 2
COST O
F MED
ICATION
S = 3 CO
ST OF TRAN
SPORT = 4
RELIGIO
US REA
SON
S = 5
N
C

255
N
O.
V
ARN
AM
E
QU
ESTION
S
COD
ING
CATEG
ORIES
SKIPS/FILTERS
IN
DICATO
R
DH
S/AIS
CO
RE
WA
S TAKING
TRAD
ITION
AL M
EDICATIO
NS = 6
MED
ICATION
S OU
T OF STO
CK = 7
DID
NO
T WAN
T PEOPLE TO
KNO
W H
IV
STATUS = 8
DID
NO
T RECEIVE PERMISSIO
N FRO
M
SPOU
SE/FAMILY = 9
OTH
ER (SPECIFY)= 96
DO
N’T KN
OW
= -8
REFUSED
= -9
318
SYPHTTK
When you w
ere pregnant were you tested for
syphilis?
YES = 1 N
O = 2
DO
N’T KN
OW
= -8
REFUSED
= -9
NO
, DK, REFU
SED
à BRTH
WH
R
N
Cà
S.
319
SYPHPO
S D
id you test positive for syphilis during your
pregnancy with (N
AM
E)?
YES = 1
NO
= 2
DID
NO
T GET RESU
LT = 3 D
ON
’T KNO
W = -8
REFUSED
= -9
NO
, NO
T GET
RESULT, D
K,
REFUSED
à
BRTHW
HR
N
Cà
S
320
SYPHTRT
Did you get treatm
ent for syphilis during your
pregnancy with (N
AM
E)?
YES = 1
NO
= 2 D
ON
’T KNO
W = -8
REFUSED
= -9
N
CàS
321
BRTHW
HR
Where did you give birth to (N
AME)?
HER H
OM
E =11 O
THER H
OM
E=12
TRAIN
ED BIRTH
ATTEND
ANT PREM
ISES=13
HO
ME, O
THER IN
TRA
NSIT, O
THER
(SPECIFY), DK,
N
Y 314 TH
MIS
C

256
N
O.
V
ARN
AM
E
QU
ESTION
S
COD
ING
CATEG
ORIES
SKIPS/FILTERS
IN
DICATO
R
DH
S/AIS
CO
RE
GO
VERN
MEN
T NATIO
NAL REFERA
L HO
SPITAL
=21 G
OV
ERNM
ENT REG
ION
AL H
OSPITA
L =22 G
OV
ERNM
ENT D
ISTRICT HO
SPITAL=23
GO
VERN
MEN
T HEALTH
CENTRE=24
GO
VERN
MEN
T DISPEN
SARY=25 G
OV
ERNM
ENT CLIN
IC=26 RELIG
IOU
S/VOLU
NTA
RY DISTRICT D
ESIGN
ATED
HO
SPITAL=31
RELIGIO
US/VO
LUN
TARY H
OSPITA
L=32 RELIG
IOU
S/VOLU
NTA
RY HEA
LTH CEN
TRE=33 RELIG
IOU
S/VOLU
NTA
RY DISPEN
SARY =34
RELIGIO
US/VO
LUN
TARY CLIN
IC=35 PRIV
ATE H
OSPITA
L =41 PRIV
ATE H
EALTH CEN
TRE=42 PRIV
ATE D
ISPENSARY=43
PRIVA
TE CLINIC=44
OTH
ER
IN TRA
NSIT = 51
OTH
ER (SPECIFY) = 96
DO
N’T KN
OW
= -8 REFU
SED = -9
REFUSED
à
CHILD
BDATE
322
HIVTO
BR W
ere you offered an HIV test during labor?
YES = 1
NO
= 2
DO
N’T KN
OW
= -8 REFU
SED = -9
N
Y, 621
THM
IS
C

257
N
O.
V
ARN
AM
E
QU
ESTION
S
COD
ING
CATEG
ORIES
SKIPS/FILTERS
IN
DICATO
R
DH
S/AIS
CO
RE
323
HIVTTLB
Did you test for H
IV during labor? YES = 1
NO
= 2
DO
N’T KN
OW
= -8 REFU
SED = -9
NO
, DK, REFU
SED
à CH
ILDBD
ATE
SKIP IF HIV
POSITIVE BEFO
RE LA
BOU
R
N
Y 622
THM
IS
C
324
HIVRSLR
What w
as the result of that test?
POSITIVE = 1
NEG
ATIVE = 2
UN
KNO
WN
/IND
ETERMIN
ATE = 3
DID
NO
T RECEIVE RESULTS = 4
DO
N’T KN
OW
= -8
REFUSED
= -9
NEG
, U
NK/IN
DET,N
O
RESULTS, D
K,
REFUSED
à
CHILD
BDATE
SKIP IF HIV
PO
SITIVE
BEFORE LA
BOU
R
NO
T
AV
AILABLE IN
THM
IS
N
C
325
ARV
OFLB
During labor, w
ere you offered ARVs to protect
[NAM
E] against HIV
? YES = 1 N
O = 2
DO
N’T KN
OW
= -8
REFUSED
= -9
SKIP IF ALREA
DY
ON
ARV
S. N
N
C
326
ARV
TKLB D
uring labor, did you take ARVs to protect (NA
ME)
against HIV?
YES = 1 N
O = 2
DO
N’T KN
OW
= -8
REFUSED
= -9
NO
, DK,
REFUSED
à
CHILD
BDATE
SKIP IF ALREA
DY
ON
A
RVS/TREATM
E
NT/PRO
PHYLAXI
S.
N
C

258
N
O.
V
ARN
AM
E
QU
ESTION
S
COD
ING
CATEG
ORIES
SKIPS/FILTERS
IN
DICATO
R
DH
S/AIS
CO
RE
327
ARV
CNTN
D
id you continue to take the ARV
s after delivery?
YES = 1
NO
= 2
DO
N’T KN
OW
=8 REFU
SED = -9
SKIP IF ALREA
DY
ON
ARV
S.
NO
T A
VAILABLE IN
THM
IS
N
C
328
CHILD
BDATE
When did you give birth to (N
AME)? Please give
your best guess.
DA
Y __ __
DO
N’T KN
OW
DA
Y= -8 REFU
SED D
AY=-9
MO
NTH
__ __ D
ON
’T KNO
W M
ON
TH= -8
REFUSED
MO
NTH
= -9
YEAR __ __ __ __
DO
N’T KN
OW
YEAR=-8
REFUSED
YEAR= -9
N
Y 215
THM
IS
C
329
CHILD
ALIVE
Is (NAM
E) still alive? YES = 1
NO
= 2 D
ON
’T KNO
W = -8
REFUSED
= -9
YES, DK, REFU
SED
à CH
ILDLIV
E IF M
ULTIPLE BIRTH
ASK CH
ILDA
LIVE-CH
ILDM
ORE FO
R
EACH
CHILD
.
N
Y 216
THM
IS
C
330
CHILD
DA
GEY
How
old was [N
AME] w
hen he/she died? KEY 0 IF CH
ILD W
AS LESS TH
AN
ON
E YEAR O
LD.
YEARS___
DO
N’T KN
OW
= -8 REFU
SED= -9
IF >0, DK, REF
àCH
ILDBF
N
C

259
N
O.
V
ARN
AM
E
QU
ESTION
S
COD
ING
CATEG
ORIES
SKIPS/FILTERS
IN
DICATO
R
DH
S/AIS
CO
RE
331
CHILD
DA
GE
MO
H
ow old w
as [Nam
e] in months w
hen he/she died? KEY ‘0’ IF LESS TH
AN O
NE M
ON
TH O
LD.
MO
NTH
S___ D
ON
’T KNO
W = -8
REFUSED
= -9
ALLà
CHILD
BF
C
332
CHILD
LIVE Is (N
AME) living w
ith you?
YES = 1
NO
= 2
NO
à CH
ILDBF
N
Y 218
THM
IS
C
333
CHILD
HH
NU
M
Please select [NAM
E] that lives with you.
SELECT ‘NO
T LISTED IN
HO
USEH
OLD
’ IF CHILD
IS N
OT LISTED
HERE.
HO
USEH
OLD
LINE N
UM
BER ___ N
OT LISTED
IN H
OU
SEHO
LD = 96
N
C
334
CHILD
BF D
id you ever breastfeed (NA
ME)?
YES = 1 N
O, N
EVER BREASTFED
= 2
NO
, CHILD
NO
T ALIVE = 3
DO
N’T KN
OW
= -8 REFU
SED = -9
NO
, NO
T ALIVE,
DK, REFU
SED à
PREGN
ANT
N
Y 315 TH
MIS
C
335
CHILD
BFLON
G
For how long did you breastfeed (N
AME)?
ON
LY ON
E OPTIO
N M
AY BE SELECTED. FO
R
EXAM
PLE, AN
SWER O
NLY IN
WEEKS O
R IN
MO
NTH
S. CO
DE ‘0’ IF LESS TH
AN
1 WEEK.
WEEKS ____
MO
NTH
S ____ STILL BREA
STFEEDIN
G = 96
DO
N’T KN
OW
= -8
REFUSED
= -9
N
Y 316
THM
IS
C
336
CHILD
MO
RE Thank you for the inform
ation regarding (NA
ME).
YES = 1
NO
= 2
YES àRETU
RN TO
CHILD
ALIVE FO
R
MU
LTIPLES
C

260
N
O.
V
ARN
AM
E
QU
ESTION
S
COD
ING
CATEG
ORIES
SKIPS/FILTERS
IN
DICATO
R
DH
S/AIS
CO
RE
DID
THE RESPO
ND
ENT H
AVE M
ORE TH
AN O
NE
CHILD
(I.E. TWIN
S, TRIPLETS)?
N
O.
V
ARN
AME
Q
UESTIO
NS
COD
ING
CATEG
ORIES
SKIPS/FILTERS
IN
DICA
TOR
D
HS/A
IS
CORE
I will now
ask you about current pregnancies.
SKIP IF MA
LE
337
PREGN
ANT
Are you currently pregnant?
YES = 1 N
O = 2
DO
N’T KN
OW
/UN
SURE = -8
REFUSED
= -9
Y 225 TH
MIS
C
I will now
ask you about family planning.
338
AV
OID
PREG A
re you or your partner currently doing som
ething or using any method to delay or
avoid getting pregnant?
YES = 1 N
O = 2
DO
N’T KN
OW
= -8 REFU
SED = -9
NO
DK, REFU
SED
àN
EXT MO
DU
LE
NO
T AVA
ILABLE
IN TH
MIS
Y C
339
CMETH
OD
Which m
ethod are you or your partner using? SELECT ALL TH
AT APPLY.
FEMA
LE STERILIZATION
= A M
ALE STERILIZA
TION
= B
PILL = C IU
D/”CO
IL” = D
INJECTIO
NS = E
IMPLA
NT = F
GF/H
IV-P11 N
OT A
VAILA
BLE IN
THM
IS
Y C

261
N
O.
V
ARN
AME
Q
UESTIO
NS
COD
ING
CATEG
ORIES
SKIPS/FILTERS
IN
DICA
TOR
D
HS/A
IS
CORE
CON
DO
M = G
FEM
ALE CO
ND
OM
= H
RHYTH
M/N
ATURA
L METH
OD
S = I
WITH
DRA
WA
L = J N
OT H
AVIN
G SEX = K
OTH
ER (SPECIFY)= X D
ON
’T KNO
W = Y
REFUSED
= Z
MO
DU
LE 4 CHILD
REN
THE H
OU
SEHO
LD SCH
EDU
LE NO
TED TH
AT [NAM
E OF PA
RTICIPANT] W
ILL FILL OU
T THE CH
ILDREN
’S MO
DU
LE FOR [N
UM
BER OF CH
ILDREN
]. I am
going to ask you a number of questions about your child/children regarding their health and w
here they get their health services. We w
ill ask you about these children: LIST O
F HO
USEH
OLD
MEM
BERS FOR D
ISPLAY ON
LY, DO
NO
T SELECT [LIST O
F CHILD
REN]
NO
.
VA
RNAM
E
QU
ESTION
S
COD
ING
CATEG
ORIES
SKIPS/FILTERS
IN
DICA
TOR
D
HS/A
IS
CORE
I am
going to ask you a number of questions about your child/children regarding their health and w
here they get their health services. We w
ill begin with your youngest
child.

262
N
O.
V
ARN
AME
Q
UESTIO
NS
COD
ING
CATEG
ORIES
SKIPS/FILTERS
IN
DICA
TOR
D
HS/A
IS
CORE
401
KIDIN
S1 N
ow I am
going to ask you questions for [NA
ME].
THE CH
ILD N
AMED
[NAM
E] WA
S LISTED W
ITH LIN
E
NU
MBER [IN
SERT HH
LINE N
UM
BER] IN TH
E
HO
USEH
OLD
LISTING
.
N
N
C
3001 KID
AGEY
How
old is (NAM
E) in years? IF [CH
ILD*] IS LESS TH
AN
1 YEAR O
LD, KEY 0
HERE A
ND
KEY AG
E IN M
ON
THS O
N N
EXT
SCREEN.
AG
E IN YEARS ___
DO
N’T KN
OW
=-8
REFUSED
= -9
AG
E CAN
NO
T BE G
REATER TH
AN
14 YRS IF > 5 à
KIDG
END
ER IF >0 A
ND
<5 à
KIDAG
EF
N
N
C
3002 KID
AGEM
H
ow old is [N
AM
E] in months?
AG
E IN M
ON
THS ____
ALL à
KIDG
END
ER
3003 KID
AGEF
You said that [NAM
E] was [KID
AGEY]. H
ow
many m
onths over [KIDAG
EY*] is [NA
ME]?
MO
NTH
S OVER ____
DO
N’T KN
OW
=-8
REFUSED
= -9
3004 KID
GEN
DER
Is (NA
ME) a boy or girl?
BOY = 1
GIRL = 2
DO
N’T KN
OW
= -8
REFUSED
= -9
N
C

263
N
O.
V
ARN
AME
Q
UESTIO
NS
COD
ING
CATEG
ORIES
SKIPS/FILTERS
IN
DICA
TOR
D
HS/A
IS
CORE
3005 KID
ENRO
LL Is (N
AME) currently enrolled in school?
YES = 1 N
O, CU
RRENTLY N
OT IN
SCHO
OL = 2
NO
, TOO
YOU
NG
TO BE IN
SCHO
OL = 3
DO
N’T KN
OW
= -8
REFUSED
= -9
NO
, TOO
YOU
NG
, DK,
REFUSED
à
KIDCRCM
NO
T AVA
ILABLE IN
THM
IS
N
N
C
3006A
KIDH
IGH
LVL
What is the highest level of school (N
AM
E) has attended?
PRE-PRIMA
RY = 0 PRIM
ARY=1
POST- PRIM
ARY TRAININ
G=2
SECON
DA
RY (O-LEV
EL)= 3 PO
ST SECON
DA
RY SECON
DARY (O
-LEVEL)
TRAIN
ING
= 4
DO
N’T KN
OW
= -8 REFU
SED = -9
IF KIDEN
ROLL = 2
àKID
ENRLSTYR
3006 KID
CLASS
What grade is (N
AM
E) in now?
GRA
DE _____
DO
N’T KN
OW
= -8 REFU
SED = -9
N
N
C
3007 KID
ENRLSTYR
Was (N
AM
E) enrolled in school during the previous school year?
YES = 1 N
O = 2
N
N
C
3008 KID
CLASSLSTY
R
What grade w
as (NA
ME) during the previous
school year?
GRA
DE _____
DO
N’T KN
OW
= -8
REFUSED
= -9
N
N
C

264
N
O.
V
ARN
AME
Q
UESTIO
NS
COD
ING
CATEG
ORIES
SKIPS/FILTERS
IN
DICA
TOR
D
HS/A
IS
CORE
3009 KID
CRCM
Is (NA
ME) circum
cised? Circum
cision is the complete rem
oval of the foreskin from
the penis. I have a picture to
show you w
hat a completely circum
cised penis looks like.
YES = 1 N
O = 2
DO
N’T KN
OW
= -8 REFU
SED = -9
NO
, DK, REFU
SED
à
KIDH
IVTESTEVR SKIP IF FEM
ALE
CHILD
.
N
NO
T AVA
ILABLE
IN TH
MIS
N
C
3010 KID
CRCMPRT
Who circum
cised (NA
ME)?
D
OCTO
R, CLINICA
L OFFICER, O
R NU
RSE = 1
TRAD
ITION
AL CIRCU
MCISER =2
TRAD
ITION
AL BIRTH
ATTEND
AN
T=3 O
THER (SPECIFY) = 6
DO
N’T KN
OW
= -8
N
NO
T AVA
ILABLE
IN TH
MIS
N
C
3011 KID
HIVTESTEV
R H
as (NAM
E) ever been tested for HIV
?
YES = 1 N
O = 2
DO
N’T KN
OW
= -8 REFU
SED = -9
YES à
KIDH
IVTESTLASTM
/
KIDH
IVTESTLASTY
DK, REFU
SED à
KIDV
ISTTBCLIN
N
NO
T AVA
ILABLE
IN TH
MIS
N
C
3012 KID
HIVTESTN
E
VERRSN
W
hy has (NA
ME) never been tested for H
IV? SELECT A
LL THAT A
PPLY.
DO
N'T KN
OW
WH
ERE TO TEST = A
TEST COSTS TO
O M
UCH
= B TRA
NSPO
RT COSTS TO
O M
UCH
= C
TOO
FAR A
WA
Y = D
AFRA
ID O
THERS W
ILL KNO
W A
BOU
T
TEST RESULTS = E
DO
N'T N
EED TEST/LO
W RISK = F
ALL->
KIDV
ISTTBCLIN
NO
T AVA
ILABLE
IN TH
MIS

265
N
O.
V
ARN
AME
Q
UESTIO
NS
COD
ING
CATEG
ORIES
SKIPS/FILTERS
IN
DICA
TOR
D
HS/A
IS
CORE
DID
NO
T RECEIVE PERMISSIO
N FRO
M
SPOU
SE/FAM
ILY = G
AFRA
ID SPO
USE/PARTN
ER/FAM
ILY
WILL KN
OW
RESULTS = H
D
ON
’T WA
NT TO
KNO
W (N
AM
E) HA
S
HIV
= I CA
NN
OT G
ET TREATMEN
T FOR H
IV = J
TEST KITS NO
T AVA
ILABLE = K RELIG
IOU
S REASO
NS = L
OTH
ER (SPECIFY) = X D
ON
’T KNO
W = Y
REFUSED
= Z
3013 KID
HIVTESTLA
STM/KID
HIVTE
STLASTY
What m
onth and year was (N
AM
E)’s last HIV
test done?
MO
NTH
___ ___ D
ON
’T KNO
W M
ON
TH = -8
REFUSED
MO
NTH
= -9 YEAR ___ ___ ___ ____ D
ON
’T KNO
W YEA
R = -8
REFUSED
YEAR = -9
DA
TE RESTRAINTS
N
N
C
3014 KID
HIV
LASTRE
SULT
What w
as (NAM
E)’s last HIV test result?
PO
SITIVE = 1
NEG
ATIVE = 2
UN
KNO
WN
/IND
ETERMIN
ATE = 3
DID
NO
T RECEIVE RESULTS = 4
DO
N’T KN
OW
= -8 REFU
SED = -9
IF NEG
, U
NK/IN
DET, D
ID
NO
T RECEIVE, DK,
REFUSED
à
KIDV
ISTTBCLIN
N
N
C

266
N
O.
V
ARN
AME
Q
UESTIO
NS
COD
ING
CATEG
ORIES
SKIPS/FILTERS
IN
DICA
TOR
D
HS/A
IS
CORE
3015 KID
LPOSM
/KID
LPOSY
What w
as the month and year of [N
AME]’s first
HIV
-positive test result? Please give your best guess.
This will be the very first H
IV-positive test result
that you have received.
PROBE TO
VERIFY DA
TE.
M
ON
TH ___ ___
DO
N’T KN
OW
MO
NTH
= -98 REFU
SED M
ON
TH = -99
YEAR ___ ___ ___ ____
DO
N’T KN
OW
YEAR = -9998
REFUSED
YEAR = -9999
N
N
C
3016 KID
HIV
CARE H
as (NAM
E) ever received HIV m
edical care
from a health care provider (doctor, clinical
officer or nurse)?
YES = 1
NO
= 2 D
ON
’T KNO
W = -8
REFUSED
= -9
YES à
KIDH
IVCAREFIRSTM
/KIDH
IVCA
REFIRSTY D
K, REFUSED
à
KIDCD
4
N
N
C
3017 KID
HIV
CAREN
VR
What is the m
ain reason why (N
AM
E) has never seen a doctor, clinical officer, or nurse
for HIV m
edical care?
FACILITY IS TO
O FA
R AW
AY = 1
I DO
N’T KN
OW
WH
ERE TO G
ET HIV
MED
ICAL CA
RE FOR CH
ILD = 2
COST O
F CARE = 3
COST O
F TRAN
SPORT = 4
I DO
N’T TH
INK
CHILD N
EEDS IT,
HE/SH
E IS NO
T SICK = 5 I FEA
R PEOPLE W
ILL KNO
W TH
AT
CHILD
HA
S HIV IF I TAKE
HIM
/HER TO
A CLINIC = 6
RELIGIO
US REA
SON
S = 7 CH
ILD IS TA
KING
TRAD
ITION
AL MED
ICINE
= 8
KIDCD
$
N
N
C

267
N
O.
V
ARN
AME
Q
UESTIO
NS
COD
ING
CATEG
ORIES
SKIPS/FILTERS
IN
DICA
TOR
D
HS/A
IS
CORE
OTH
ER = 96 SPECIFY: ____________________
DO
N’T KN
OW
= -8 REFU
SED = -9
3018
What m
onth and year did (NA
ME) first see a
doctor, clinical officer or nurse for HIV
medical care?
PROBE TO
VERIFY DATE.
M
ON
TH __________
DO
N’T KN
OW
MO
NTH
= -8 REFU
SED M
ON
TH= -9
YEAR ____________
DO
N’T KN
OW
YEAR =-8
REFUSED
YEAR = -9
N
N
C
3019
What m
onth and year did (NA
ME) last see a
doctor, clinical officer or nurse for HIV
medical care?
M
ON
TH __________
DO
N’T KN
OW
MO
NTH
= -8 REFU
SED M
ON
TH= -9
YEAR ____________ D
ON
’T KNO
W YEA
R =-8
REFUSED
YEAR = -9
IF <7 MO
NTH
S,
DK, REFU
SED,
MISSIN
G D
ATE à
KIDCD
4
N
N
C
3020
What is the m
ain reason for (NA
ME) not
seeing a doctor, clinical officer or nurse for
HIV
medical care for m
ore than 6 months?
FACILITY IS TO
O FA
R AW
AY = 1
I DO
N’T KN
OW
WH
ERE TO G
ET HIV
MED
ICAL CA
RE FOR CH
ILD =2
COST O
F CARE = 3
COST O
F TRAN
SPORT = 4
I DO
N’T TH
INK CH
ILD N
EEDS IT,
HE/SH
E IS NO
T SICK = 5 I FEA
R PEOPLE W
ILL KNO
W TH
AT
CHILD
HA
S HIV IF I TAKE
N
N
C

268
N
O.
V
ARN
AME
Q
UESTIO
NS
COD
ING
CATEG
ORIES
SKIPS/FILTERS
IN
DICA
TOR
D
HS/A
IS
CORE
HIM
/HER TO
A CLINIC =6
RELIGIO
US REA
SON
S = 7 CH
ILD IS TA
KING
TRAD
ITION
AL MED
ICINE
=8 N
O A
PPOIN
TMEN
T SCHED
ULED
/DID
NO
T
MISS M
OST RECEN
T APPO
INTM
ENT= 9
OTH
ER(SPECIFY) = 96
DO
N’T KN
OW
= -8 REFU
SED = -9
3021 KID
CD4
Has (N
AME) ever had a CD
4 count test? The CD
4 count tells you how sick you are w
ith H
IV and if you need to take A
RVs or other H
IV
medications.
YES = 1 N
O = 2
DO
N’T KN
OW
= -8
REFUSED
= -9
NO
, DK, REFU
SED
à KID
ARVS
NO
, DK, REFU
SED &
NEVER IN
HIV
CARE
à KID
VISTTBCLIN
N
N
C
3022 KID
CD4LA
STM
/KIDCD
4LASTY
What m
onth and year was (N
AME) last tested
for his/her CD4 count?
MO
NTH
___ ___ D
ON
’T KNO
W M
ON
TH = -8
REFUSED
MO
NTH
= -9 YEAR ___ ___ ___ ___ D
ON
’T KNO
W YEA
R = -8 REFU
SED YEA
R = -9
SKIP TO
KIDV
ISTTBCLIN IF
NEVER IN
HIV
CA
RE.
N
N
C
3023 KID
ARVS
Has (N
AME) ever taken A
RVs, that is,
medications to treat his/her H
IV infection?
YES = 1 N
O = 2
DO
N’T KN
OW
= -8 REFU
SED = -9
YES à
KIDARV
SFIRST7/KIDA
RVSFIRSTM
DK, REFU
SED à
KIDSEPTRIN
N
N
C

269
N
O.
V
ARN
AME
Q
UESTIO
NS
COD
ING
CATEG
ORIES
SKIPS/FILTERS
IN
DICA
TOR
D
HS/A
IS
CORE
ELECTRON
IC AID IF
DO
N’T KN
OW
3024 KID
ARVSN
VRR
SN
What is the m
ain reason (NA
ME) has never
taken ARV
s?
CHILD
IS NO
T ELIGIBLE FO
R
TREATM
ENT=1
HEA
LTH CA
RE PROVID
ER DID
NO
T
PRESCRIBE =2 H
IV M
EDICIN
ES NO
T AV
AILA
BLE = 3
DO
NO
T THIN
K CHILD
NEED
S IT, H
E/SHE IS N
OT SICK = 4
COST O
F MED
ICATIO
NS =5
COST O
F TRAN
SPORT = 6
RELIGIO
US REA
SON
S = 7 CH
ILD IS TA
KING
TRAD
ITION
AL
MED
ICATIO
NS = 8
OTH
ER(SPECIFY) = 96
DO
N’T KN
OW
= -8 REFU
SED = -9
ALLà
SKIP TO
KIDSEPTRIN
N
N
C
3025 KID
ARVSFIRST
7/KIDA
RVSFIR
STM
What m
onth and year did (NA
ME) first start
taking ARV
s?
PROBE TO
VERIFY DATE.
MO
NTH
= ____
DO
N’T KN
OW
MO
NTH
= -8 REFU
SED M
ON
TH = -9
YEAR = ____
DO
N’T KN
OW
YEAR = -8
REFUSED
YEAR = -9
M
ER/TX_RET
GA
RPR/4.1 G
F/HIV-I6
N
C

270
N
O.
V
ARN
AME
Q
UESTIO
NS
COD
ING
CATEG
ORIES
SKIPS/FILTERS
IN
DICA
TOR
D
HS/A
IS
CORE
3026 KID
ARVSN
OW
Is (N
AM
E) currently taking ARVs, that is,
antiretroviral medications?
By currently, I mean that (N
AM
E) may have
missed som
e doses but (NA
ME) is still taking
ARV
s.
YES = 1 N
O = 2
DO
N’T KN
OW
= -8 REFU
SED = -9
YES à
KIDARVM
ISS30
DK, REFU
SED à
KIDSEPTRIN
N
N
C
3027 KID
ARVSN
OTR
SN
Can you tell me the m
ain reason why (N
AM
E) is not currently taking A
RVs?
I HA
VE TROU
BLE GIVIN
G CH
ILD A
TABLET EVERYD
AY =1 CH
ILD H
AD
SIDE EFFECTS/RA
SH =
2 FA
CILITY/PHA
RMA
CY TOO
FAR
AW
AY TO
GET M
EDICATIO
N
REGU
LARLY = 3
COST O
F MED
ICATIO
NS =4
COST O
F TRAN
SPORT =5
CHILD
IS HEA
LTHY/,
HE/SH
E IS NO
T SICK = 6
FACILITY W
AS O
UT O
F STO
CK = 7
RELIGIO
US REA
SON
S= 8 CH
ILD IS TA
KING
TRAD
ITION
AL
MED
ICATIO
NS = 9
OTH
ER =96
DO
N’T KN
OW
= -8 REFU
SED = -9
ALL à
KIDSEPTRIN
.
N
N
C

271
N
O.
V
ARN
AME
Q
UESTIO
NS
COD
ING
CATEG
ORIES
SKIPS/FILTERS
IN
DICA
TOR
D
HS/A
IS
CORE
3028 KID
ARVMISS3
0 People som
etimes forget to take all their
ARV
s everyday. In the last 30 days, how m
any days has (N
AM
E) missed taking any A
RV pills?
COD
E ‘0’ IF NO
NE.
DA
YS ___ ___ D
ON
’T KNO
W = -8
REFUSED
= -9
N
N
C
3029 KID
SEPTRIN
Is (NA
ME) currently taking Septrin or
cotrimoxazole?
Septrin or cotrimoxazole is a m
edicine recom
mended for people w
ith HIV
, even if
they have not started treatment for H
IV. It helps prevent certain infections but it is not
treatment for H
IV.
By currently, I mean that (N
AM
E) may have
missed som
e doses but is still taking Septrin
or cotrimoxazole.
YES = 1
NO
= 2 I D
ON
’T KNO
W W
HAT IT IS = 3
REFUSED
= -9
N
N
C
3030 KID
VISTTBCLI
N
Has (N
AME) ever visited a clinic for
tuberculosis for TB diagnosis or treatment?
YES = 1 N
O = 2
DO
N’T KN
OW
= -8 REFU
SED = -9
NO
, DK, REFU
SED à
SKIP TO EN
D O
F
MO
DU
LE
N
N
C
3031 KID
TESTHIVTB
Was (N
AME) tested for H
IV at the TB clinic?
YES = 1 N
O, W
AS N
OT TESTED
FOR H
IV = 2
NO
, WA
S ALREAD
Y HIV
POSITIVE = 3
DO
N’T KN
OW
= -8
REFUSED
= -9
NO
,DK, REFU
SED à
SKIP TO
END
OF
MO
DU
LE
N
N
CàS

272
N
O.
V
ARN
AME
Q
UESTIO
NS
COD
ING
CATEG
ORIES
SKIPS/FILTERS
IN
DICA
TOR
D
HS/A
IS
CORE
3032 KID
DIA
GTB
Have you ever been told by a health care
provider (doctor, clinical officer or nurse) that (N
AM
E) had TB?
YES = 1
NO
=2 D
ON
’T KNO
W = -8
REFUSED
= -9
NO
, DK, REFU
SED à
SKIP TO EN
D O
F M
OD
ULE
N
C
3033 KID
TRTTB W
as (NAM
E) ever treated for TB?
YES = 1
NO
= 2 D
ON
’T KNO
W = -8
REFUSED
= -9
NO
, DK, REFU
SED à
SKIP TO EN
D O
F
MO
DU
LE
N
N
C
3034 KID
TRTTCURR
Is [NA
ME] currently on treatm
ent for TB YES = 1 N
O = 2
DO
N’T KN
OW
= -8 REFU
SED = -9
NO
, DK, REFU
SED à
KID
MO
RE
C
3035 KID
TRTTB6MO
TRT The last tim
e (NA
ME) w
as treated for TB, did
(NA
ME) com
plete at least 6 months of
treatment?
YES = 1
NO
= 2 D
ON
’T KNO
W = -8
REFUSED
= -9
N
N
C

273
N
O.
V
ARN
AME
Q
UESTIO
NS
COD
ING
CATEG
ORIES
SKIPS/FILTERS
IN
DICA
TOR
D
HS/A
IS
CORE
3036 KID
MO
RE Thank you for the inform
ation about (NA
ME).
DO
ES THE RESPO
ND
ENT H
AVE A
NO
THER
CHILD
AG
ED 0-14 YEA
RS?
YES = 1
NO
= 2
YESàRETU
RN TO
KIDIN
S1
C
MO
DU
LE 5: MA
LE CIRCUM
CISION
- ON
LY FOR M
ALE RESPO
ND
ENTS A
GE 15 A
ND
OLD
ER
N
O.
V
ARN
AME
Q
UESTIO
NS
COD
ING
CATEG
ORIES
SKIPS/FILTERS
IN
DICA
TOR
D
HS/A
IS
CORE
I will be asking a few
questions about circumcision. Circum
cision is the complete rem
oval of the foreskin from the
penis. I have a picture to show you w
hat a completely circum
cised penis looks like.
ELECTRON
IC AID IF
REQU
ESTED
501 M
CSTATU
S Som
e men are uncom
fortable talking about circum
cision but it is important for us to have this
information. Som
e men are circum
cised. Are you
circumcised?
YES = 1
NO
= 2 D
ON
’T KNO
W = -8
REFUSED
=9
YES à M
CAG
E
DK, REFU
SED à
SKIP TO
NEXT
MO
DU
LE
MER/V
MM
C_CIRC
Y C
502 M
CPLANS
Are you planning to get circum
cised? YES = 1
NO
= 2 D
ON
’T KNO
W = -8
REFUSED
= -9
ALL à
SKIP TO
NEXT M
OD
ULE.
N
C

274
N
O.
V
ARN
AME
Q
UESTIO
NS
COD
ING
CATEG
ORIES
SKIPS/FILTERS
IN
DICA
TOR
D
HS/A
IS
CORE
503 M
CAGE
How
old were you w
hen you were
circumcised? Please give your best guess.
IF LESS THA
N O
NE YEA
R, COD
E ‘0’.
AG
E IN YEARS ____
DO
N’T KN
OW
= -8
REFUSED
= -9
Y C
504 M
CWH
O
Who did the circum
cision?
DO
CTOR, CLIN
ICAL O
FFICER, OR N
URSE =
1 TRA
DITIO
NA
L / CIRCUM
CISER =2 M
IDW
IFE = 3 O
THER = 96
SPECIFY: ____________________ D
ON
’T KNO
W = -8
REFUSED
= -9
Y C
M
OD
ULE 6: SEXU
AL A
CTIVITY
NO
.
VA
RNA
ME
Q
UESTIO
NS
COD
ING
CATEG
ORIES
SKIPS/FILTERS
IN
DICATO
R
DH
S/AIS
CO
RE
In this part of the interview, I w
ill be asking questions about your sexual relationships and practices. These questions w
ill help us have a better understanding of how they m
ay affect your life and risk for
HIV
.
Let me assure you again that your answ
ers are completely confidential and w
ill not be shared with
anyone. If there are questions that you do not want to answ
er, we can go to the next question.

275
N
O.
V
ARN
AM
E
QU
ESTION
S
COD
ING
CATEG
ORIES
SKIPS/FILTERS
IN
DICATO
R
DH
S/AIS
CO
RE
601A
CON
DO
MW
H
AT
Do you use condom
s?
YES=1
NO
=2 D
ON
’T KNO
W=8
REFUSED
= 9
NO
, DO
N’T KN
OW
,
REFUSED
à
CON
DO
MG
ET
COU
NTRY
AD
DED
601 CO
ND
OM
WH
RPREF
Where do you prefer to get condom
s?
SELECT ALL TH
AT APPLY.
DO
N’T KN
OW
= A
CLINIC/H
OSPITAL = A
KIOSK/SH
OP = B
PHA
RMA
CY = C
LOCA
L FREE DISPEN
SER = D
FRIEND
S/PEERS = E
SEXUA
L PARTNER(S) = F
HEA
LTH FA
CILITY=G
BAR=H
GU
EST HO
USE=I
OTH
ER, (SPECIFY) = X D
ON
’T KNO
W = Y
DO
N’T KN
OW
, REFU
SED à
CON
DO
MBRA
ND
Y CO
UN
TRY
AD
DED
501A
CON
DO
MBRA
ND
What is the brand nam
e of the condoms you are using?
IF DO
N'T KN
OW
THE B
RAN
D, A
SK TO SEE TH
E PACKA
GE.
SALAM
A=01
MSD
=02 D
UM
E=03
ROU
GH
RIDER=04
FAM
ILIA=05
OTH
ER (SPECIFY)=X D
ON
’T KNO
W=Y
CO
UN
TRY
AD
DED

276
N
O.
V
ARN
AM
E
QU
ESTION
S
COD
ING
CATEG
ORIES
SKIPS/FILTERS
IN
DICATO
R
DH
S/AIS
CO
RE
602 CO
ND
OM
GET
If you wanted a condom
, would it be easy for you to
get one?
YES = 1
NO
= 2 D
ON
’T KNO
W = -8
REFUSED
= -9
YES ,DK,
REFUSED
à
FIRSTSXAG
E
Y
S
603 CO
ND
OM
NO
T
EASYRSN
Why is it not easy for you to get a condom
? SELECT A
LL THA
T APPLY.
CON
DO
MS N
OT AV
AILABLE/TO
O FA
R = A N
OT CO
NVEN
IENT = B
COSTS TO
O M
UCH
= C
EMBA
RASSED
TO G
ET CON
DO
MS =D
D
O N
OT W
ANT O
THERS TO
KNO
W = E
DO
NO
T KNO
W W
HERE TO
GET CO
ND
OM
S =
F OTH
ER, (SPECIFY) = X
DO
N’T KN
OW
= Y
REFUSED
= Z
N
S
604 FIRSTSXA
GE
How
old were you w
hen you had vaginal sex for the
very first time?
Vaginal sex is w
hen a penis enters a vagina.
AG
E IN YEARS _ _
NEVER H
AD
VAG
INA
L SEX = 96 D
ON
’T KNO
W = -8
REFUSED
= -9
GA
RPR/1.2
GF/H
IV-O
1
Y C
605 A
NALSXEVER
People have sex in different ways. Som
e have vaginal sex. Som
e have anal sex. Anal sex is when a
penis enters a person’s anus. Have you ever had
anal sex?
YES = 1 N
O = 2
DO
N’T KN
OW
= -8 REFU
SED = -9
NO
, DK, REFU
SED
NEVER V
AG
INA
L
OR A
NA
L SEX à
NEXT M
OD
ULE
N
Cà
S

277
N
O.
V
ARN
AM
E
QU
ESTION
S
COD
ING
CATEG
ORIES
SKIPS/FILTERS
IN
DICATO
R
DH
S/AIS
CO
RE
606 FIRSTAN
ALAG
E
How
old were you w
hen you had anal sex for the
very first time?
AG
E IN YEARS _ _
DO
N’T KN
OW
= -8 REFU
SED = -9
N
Cà
S
607 FIRSTSEXCN
DM
VG
NL
The first time you had vaginal sex, w
as a condom
used?
YES = 1
NO
= 2 D
ON
’T KNO
W = -8
REFUSED
= -9
N
—S, ALT
507A
FIRSTSEXCND
MAN
AL The first tim
e you had anal sex, was a condom
used?
YES = 1 N
O = 2
DO
N’T KN
OW
= -8
REFUSED
= -9
S, A
LT
608 PART12M
ON
UM
People often have sex with different people over
their lifetime. In total, w
ith how m
any different people have you had sex in the last 12 m
onths? IF N
ON
E COD
E ‘0’.
IF NU
MBER O
F PARTNERS IS
GREATER TH
AN 100, W
RITE ' 100'.
NU
MBER O
F SEXUA
L PARTN
ERS IN LA
ST 12
MO
NTH
S __ __ __ D
ON
’T KNO
W = -8
REFUSED
= -9
IF 0 PARTNERS IN
LAST 12 M
ON
THS
à N
EXT MO
DU
LE
GA
RPR/1.3 &
1.4
GF/H
IV-O
2 &
HIV
-O3
Y C

278
N
O.
V
ARN
AM
E
QU
ESTION
S
COD
ING
CATEG
ORIES &
SKIPS/FILTERS
IND
ICATOR
D
HS/A
IS
CORE
Now
I would like to ask you som
e questions about the people you have had sex with in the last 12 m
onths. Let me assure you again that your answ
ers are completely confidential and w
ill not be told to
anyone. I will first ask you about your m
ost recent partner. A
SK ON
LY ABO
UT TH
E LAST 3 PERSO
NS TH
E PARTICIPANT H
AS H
AD
SEX WITH
.
609 PARTLIVEW
D
oes your person you had sex with live in this
household?
YES = 1 N
O = 2
NOà
PARTINIT
N
C
610 PARTH
HLIN
E Please select the nam
e below from
the household m
embership list. Please identify the person you
had sex with..
[LIST] N
OT LISTED
IN
HO
USEH
OLD
= 96
LISTED
à
PARTRELATION
N
C
611 PARTIN
IT I w
ould like to ask you for the initials of this person
so I can keep track. They do not have to be the
actual initials of your partner.
INITIALS
____ ____
N
C
612 PARTRELATI
ON
What is your relationship w
ith (INITIA
LS)?
HU
SBAND
/WIFE = 1
LIVE-IN
PARTN
ER = 2
PARTNER, N
OT LIVIN
G
WITH
RESPON
DEN
T = 3
EX-SPOU
SE/EX-PARTN
ER = 4
FRIEND
/ACQ
UAIN
TAN
CE = 5
SEX WO
RKER = 6
SEX WO
RKER CLIENT =7
STRANG
ER =8
OTH
ER (SPECIFY)= 96 D
ON
’T KNO
W = -8
Y
C

279
N
O.
V
ARN
AM
E
QU
ESTION
S
COD
ING
CATEG
ORIES &
SKIPS/FILTERS
IND
ICATOR
D
HS/A
IS
CORE
REFUSED
= -9
613 PARTG
END
Is (IN
ITIALS) m
ale or female?
MA
LE = 1 FEM
ALE = 2
DO
N’T KN
OW
= -8
REFUSED
= -9
N
C
614 PARTA
GE
How
old is (INITIA
LS)? Please give your best guess.
AG
E IN YEARS ____
DO
N’T KN
OW
= -8
REFUSED
= -9
N
C
615 PARTSEXTYP
E The last tim
e you had sex with (IN
ITIALS), did you
have vaginal sex, anal sex or both?
VA
GIN
AL = 1
AN
AL = 2
BOTH
= 3 D
ON
’T KNO
W =-8
REFUSED
= -9 SKIP IF SAM
E SEX
RELATION
SHIP.
N
S
616 PARTLA
STCN
DM
The last time you had sex w
ith (INITIA
LS) was a
condom used?
YES = 1
NO
= 2 D
ON
’T KNO
W = -8
REFUSED
= -9
GA
RPR/1.4
GF/H
IV-O
3
Y C
617 PARTLA
STETO
H
The last time you had sex w
ith (INITIA
LS), did either
of you drink alcohol beforehand?
O
NLY I W
AS D
RINKIN
G
= 1
ON
LY PARTNER W
AS
DRIN
KING
= 2
N
S

280
N
O.
V
ARN
AM
E
QU
ESTION
S
COD
ING
CATEG
ORIES &
SKIPS/FILTERS
IND
ICATOR
D
HS/A
IS
CORE
BOTH
WERE
DRIN
KING
= 3
NEITH
ER = 4 D
ON
’T KNO
W = -8
REFUSED
= -9
618 PARTCO
ND
FREQ
VA
G
In the last 12 months, how
often did you use
condoms w
ith (INITIA
LS) when having vaginal sex?
Was it alw
ays, most of the tim
e, sometim
es, rarely
or never?
ALW
AYS = 1
MO
ST OF TH
E TIME =
2 SOM
ETIMES = 3
RARELY = 4 N
EVER = 5
NO
VAG
INA
L SEX IN
THE LA
ST 12 M
ON
THS = 3
DO
N’T KN
OW
= -8
REFUSED
= -9
SKIP IF N
EVER HA
D
VA
GIN
AL SEX.
N
S
619 PARTCO
ND
F
REQAN
AL
In the last 12 months, how
often did you use condom
s with (IN
ITIALS) w
hen having anal sex? Was
it always, m
ost of the time, som
etimes, rarely or
never?
ALW
AYS = 1 M
OST O
F THE TIM
E =
2 SOM
ETIMES = 3
RARELY = 4
NEVER = 5
NO
ANA
L SEX IN TH
E LA
ST 12 MO
NTH
S = 6
DO
N’T KN
OW
= -8 REFU
SED = -9
SKIP IF N
EVER HA
D
AN
AL SEX
N
S

281
N
O.
V
ARN
AM
E
QU
ESTION
S
COD
ING
CATEG
ORIES &
SKIPS/FILTERS
IND
ICATOR
D
HS/A
IS
CORE
620 PARTLA
STSU
P
Did you enter into a sexual relationship w
ith
(INITIA
LS) because (INITIA
LS) provided you with, or
you expected that (INITIALS) w
ould provide you
with gifts, help you to pay for things or help you in
other ways?
YES = 1
NO
= 2 D
ON
’T KNO
W = -8
REFUSED
= -9
N
O, D
K, REFUSED
à
PARTAG
AIN
SKIP IF SEX WO
RKER
OR CLIEN
T
N
C
621 PARTLA
STSUPREC
In the last 12 months, w
hat have you received from
(INITIA
LS)?
READ
RESPON
SES ALO
UD
.
SELECT ALL TH
AT APPLY.
DID
NO
T RECEIVE
AN
YTHIN
G = A
MO
NEY = B
FOO
D = C
SCHO
OL FEES = D
EMPLO
YMEN
T = E G
IFTS/FAVO
RS = F
TRAN
SPORT = G
SHELTER/REN
T = H
PROTECTIO
N = I
OTH
ER (SPECIFY) = X
DO
N’T KN
OW
= Y REFU
SED = Z
SKIP IF SPO
USE, LIV
E-
IN PA
RTNER, SEX
WO
RKER OR CLIEN
T
N
C
622 PARTA
GAIN
D
o you expect to have sex with (IN
ITIALS) again?
YES =1
NO
=2
DO
N’T KN
OW
= -8
REFUSED
= -9
N
C
623 PARTKN
OW
HIV
Does (IN
ITIALS) know your H
IV status? H
IV status
could mean you are H
IV negative or HIV
positive.
YES = 1
NO
= 2
N
C

282
N
O.
V
ARN
AM
E
QU
ESTION
S
COD
ING
CATEG
ORIES &
SKIPS/FILTERS
IND
ICATOR
D
HS/A
IS
CORE
DO
N’T KN
OW
= -8
REFUSED
= -9
624 PARTH
IVSAT
What is the H
IV status of (IN
ITIALS)?
READ
RESPON
SES ALO
UD
I THIN
K (INITIA
LS) IS PO
SITIVE = 1
(INTIA
LS) TOLD
ME
HE/SH
E IS POSITIVE = 2
POSITIVE, TESTED
TOG
ETHER = 3
I THIN
K (INITIA
LS) IS
NEG
ATIVE = 4
(INITIA
LS) TOLD
ME
HE/SH
E IS NEG
ATIVE =
5 NEG
ATIVE, TESTED
TOG
ETHER=6
DO
N’T KN
OW
STATUS =
7 REFUSED
= -9
N
C
625 SXPREPS
DO
ES THE RESPO
ND
ENT H
AVE AN
OTH
ER PARTNER
IN TH
E LAST 12 M
ON
THS?
YES = 1
NO
= 2
I will now
ask you
about the person you have had sex w
ith
previous to (INITIA
LS).
YES à
PARTLIVEW
N
C
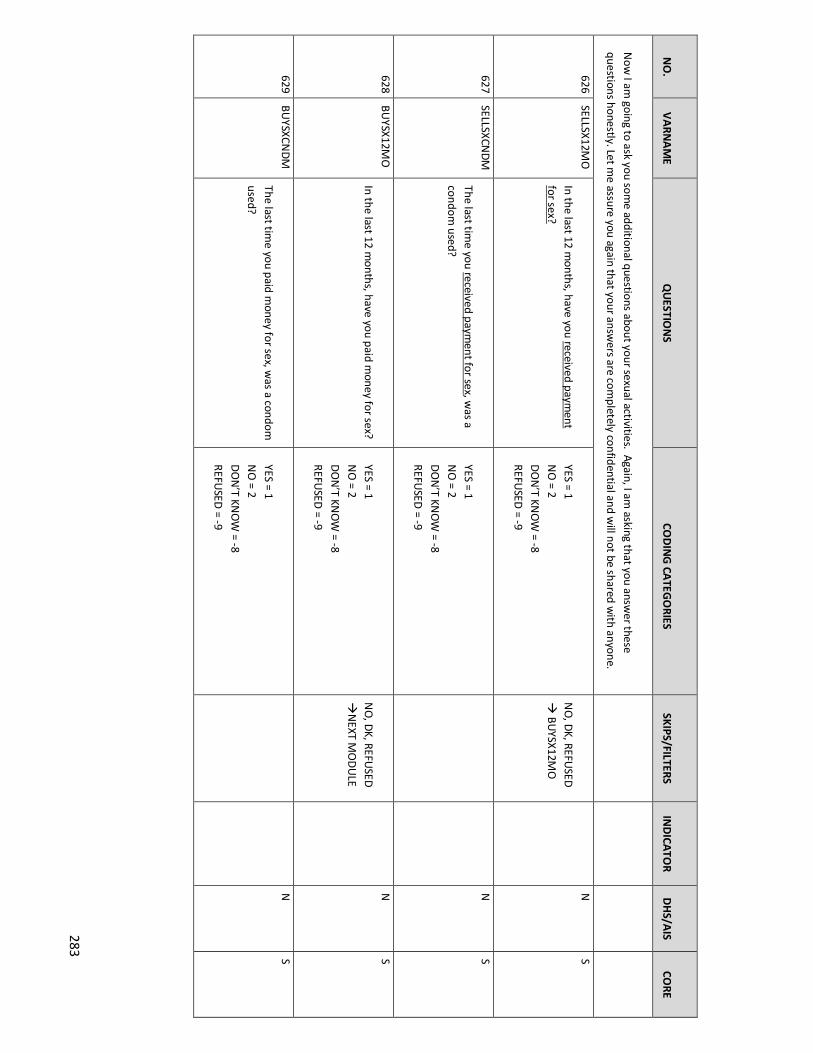
283
N
O.
V
ARN
AM
E
QU
ESTION
S
COD
ING
CATEG
ORIES
SKIPS/FILTERS
IN
DICATO
R
DH
S/AIS
CO
RE
Now
I am going to ask you som
e additional questions about your sexual activities. Again, I am asking that you answ
er these
questions honestly. Let me assure you again that your answ
ers are completely confidential and w
ill not be shared with anyone.
626 SELLSX12M
O
In the last 12 months, have you received paym
ent for sex?
YES = 1 N
O = 2
DO
N’T KN
OW
= -8 REFU
SED = -9
NO
, DK, REFU
SED
à BU
YSX12MO
N
S
627 SELLSXCN
DM
The last tim
e you received payment for sex, w
as a condom
used?
YES = 1 N
O = 2
DO
N’T KN
OW
= -8
REFUSED
= -9
N
S
628 BU
YSX12MO
In the last 12 m
onths, have you paid money for sex?
YES = 1 N
O = 2
DO
N’T KN
OW
= -8
REFUSED
= -9
NO
, DK, REFU
SED
àN
EXT MO
DU
LE
N
S
629 BU
YSXCND
M
The last time you paid m
oney for sex, was a condom
used?
YES = 1
NO
= 2 D
ON
’T KNO
W = -8
REFUSED
= -9
N
S

284
MO
DU
LE B: HIV
/AID
S KNO
WLED
GE A
ND
ATTITU
DES
N
O.
V
ARN
AME
Q
UESTIO
NS
COD
ING
CATEG
ORIES
SKIPS/FILTERS
IN
DICA
TOR
D
HS/A
IS
CORE
Now
I will ask you questions on your know
ledge of HIV
.
701
ON
EPARTN
R Can the risk of H
IV transm
ission be reduced by
having sex with only one uninfected partner
who has no other partners?
YES = 1
NO
= 2 D
ON
’T KNO
W = 3
REFUSED
= -9
G
ARPR/1.1
GF/H
IV-C-P1 Y
S
0
MO
SQU
ITO
Can a person get HIV
from m
osquito bites? YES = 1
NO
= 2 D
ON
’T KNO
W = 3
REFUSED
= -9
G
ARPR/1.1
GF/H
IV-C-P1 Y
S
1
CON
DO
MS
Can a person reduce their risk of getting HIV by
using a condom every tim
e they have sex?
YES = 1
NO
= 2 D
ON
’T KNO
W = 3
REFUSED
= -9
G
ARPR/1.1
GF/H
IV-C-P1 Y
S
2
SHA
REFOO
D Can a person get H
IV by sharing food w
ith
someone w
ho has HIV?
YES = 1
NO
= 2 D
ON
’T KNO
W = 3
REFUSED
= -9
G
ARPR/1.1
GF/H
IV-C-P1 Y
S

285
N
O.
V
ARN
AME
Q
UESTIO
NS
COD
ING
CATEG
ORIES
SKIPS/FILTERS
IN
DICA
TOR
D
HS/A
IS
CORE
3
HEA
LTHYIN
F Can a healthy-looking person have H
IV? YES = 1 N
O = 2
DO
N’T KN
OW
= 3 REFU
SED = -9
G
ARPR/1.1
GF/H
IV-C-P1 Y
S
Now
I would like to ask you som
e questions about people’s attitudes towards people living w
ith HIV.
4
BUYFO
OD
Would you buy fresh vegetables from
a shop keeper or vendor if you knew
the person has
HIV?
YES = 1 N
O = 2
DO
N’T KN
OW
/NO
T SURE/D
EPEND
S = -8 REFU
SED = -9
G
ARPR 8.1
N
S
5
KIDSSCH
OO
L D
o you think children living with H
IV should be allow
ed to attend school with children w
ho do
not have HIV?
YES = 1 N
O = 2
DO
N’T KN
OW
/NO
T SURE/D
EPEND
S = -8 REFU
SED = -9
G
ARPR 8.1
N
S
6
FEARTEST
Do you think people hesitate to take an H
IV
test because they are afraid of how other
people will react if the test result is positive for
HIV?
YES = 1 N
O = 2
DO
N’T KN
OW
/NO
T SURE/D
EPEND
S = -8 REFU
SED = -9
N
S

286
N
O.
V
ARN
AME
Q
UESTIO
NS
COD
ING
CATEG
ORIES
SKIPS/FILTERS
IN
DICA
TOR
D
HS/A
IS
CORE
7
FAM
SHAM
E D
o you agree or disagree with the follow
ing statem
ent: I would be asham
ed if someone in
my fam
ily had HIV
.
AG
REE = 1 D
ISAG
REE = 2 D
ON
’T KNO
W/N
OT SU
RE/DEPEN
DS = -8
REFUSED
= -9
N
CàS
MO
DU
LE 7: HIV
TESTING
N
O.
V
ARN
AME
Q
UESTIO
NS
COD
ING
CATEG
ORIES
SKIPS/FILTERS
IN
DICA
TOR
D
HS/A
IS
CORE
I would now
like to ask you some questions about H
IV testing.
601
HIVTSTEV
ER H
ave you ever tested for HIV?
YES = 1 N
O = 2
DO
N’T KN
OW
= -8 REFU
SED = -9
YES à
HIVTSLSTM
/HIV
TSLSTY
DK, REFU
SEDà
SKIP TO
END
OF
MO
DU
LE
CON
STRAINT IF
REPORTED
TESTING
G
ARPR/H
TC-TST/G
F HIV
p.7
Y
C
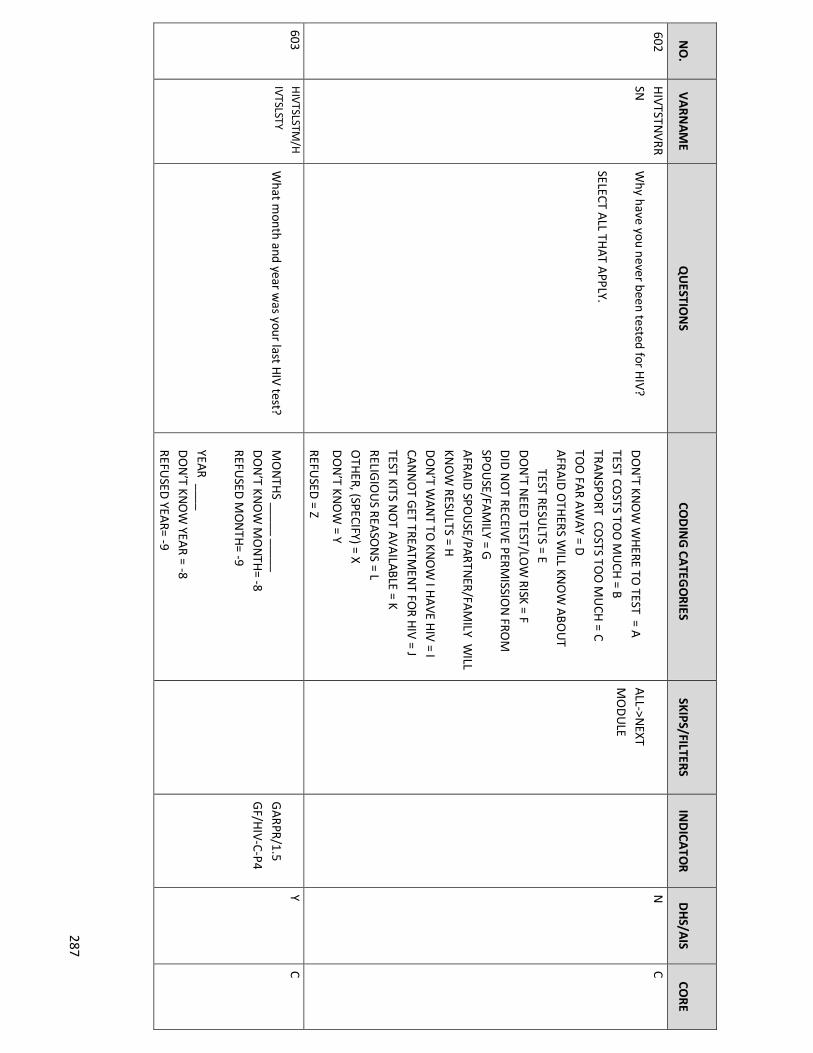
287
N
O.
V
ARN
AME
Q
UESTIO
NS
COD
ING
CATEG
ORIES
SKIPS/FILTERS
IN
DICA
TOR
D
HS/A
IS
CORE
602 H
IVTSTNV
RRSN
W
hy have you never been tested for HIV?
SELECT ALL TH
AT APPLY.
DO
N'T KN
OW
WH
ERE TO TEST = A
TEST COSTS TO
O M
UCH
= B TRA
NSPO
RT COSTS TO
O M
UCH
= C
TOO
FAR A
WA
Y = D
AFRA
ID O
THERS W
ILL KNO
W A
BOU
T
TEST RESULTS = E
DO
N'T N
EED TEST/LO
W RISK = F
DID
NO
T RECEIVE PERMISSIO
N FRO
M
SPOU
SE/FAM
ILY = G
AFRA
ID SPO
USE/PARTN
ER/FAM
ILY WILL
KNO
W RESU
LTS = H
DO
N’T W
AN
T TO KN
OW
I HA
VE HIV
= I CA
NN
OT G
ET TREATMEN
T FOR H
IV = J
TEST KITS NO
T AVA
ILABLE = K RELIG
IOU
S REASO
NS = L
OTH
ER, (SPECIFY) = X D
ON
’T KNO
W = Y
REFUSED
= Z
ALL->N
EXT M
OD
ULE
N
C
603 H
IVTSLSTM/H
IVTSLSTY W
hat month and year w
as your last HIV test?
MO
NTH
S _____ _____
DO
N’T KN
OW
MO
NTH
= -8 REFU
SED M
ON
TH= -9
YEAR ____
DO
N’T KN
OW
YEAR = -8
REFUSED
YEAR= -9
G
ARPR/1.5
GF/H
IV-C-P4
Y C

288
N
O.
V
ARN
AME
Q
UESTIO
NS
COD
ING
CATEG
ORIES
SKIPS/FILTERS
IN
DICA
TOR
D
HS/A
IS
CORE
604 H
IVTSTLOCATI
ON
W
here was the last test done?
VCT FA
CILITY = 1 M
OBILE V
CT = 2
AT H
OM
E = 3 H
EALTH
CLINIC / FA
CIITY = 4
HO
SPITAL O
UTPA
TIENT CLIN
IC = 5 TB CLIN
IC =6
STI CLINIC = 7
HO
SPITAL IN
PATIENT W
ARD
S = 8
BLOO
D D
ON
ATIN
G CEN
TER = 9 A
NC CLIN
IC = 10
CAM
PAIG
NS = 11
SOCIA
L EVEN
TS = 12
OTH
ER = -96 D
ON
’T KNO
W = -8
REFUSED
= -9
N
Yes “W
here w
as the
test done? (429)”
(Different
response
categories
C
605 H
IVTSTRSLT W
hat was the result of that H
IV test?
POSITIV
E = 1 N
EGATIVE = 2
DID
NO
T RECEIVE THE RESU
LT = 3 D
ON
’T KNO
W = -8
REFUSED
= -9
NEG
,
UN
CERTAIN/IN
D,
NO
RESULT, D
K, REFà
SKIP TO EN
D
OF M
OD
ULE
GA
RPR/1.5 G
F/HIV-C-P4
N
C
608 H
IVTFPOSM
/
HIVTFPO
SY W
hat was the m
onth and year of your first H
IV-positive test result? Please give your best
guess.
MO
NTH
___ ___ D
ON
’T KNO
W M
ON
TH = -8
REFUSED
MO
NTH
= -9 YEAR ___ ___ ___ ____
N
N
C

289
N
O.
V
ARN
AME
Q
UESTIO
NS
COD
ING
CATEG
ORIES
SKIPS/FILTERS
IN
DICA
TOR
D
HS/A
IS
CORE
This will be the very first H
IV-positive test result
that you have received.
PROBE TO
VERIFY DATE.
DO
N’T KN
OW
YEAR = -8
REFUSED
YEAR = -9
609 H
IVPO
STOLD
O
f the following people, w
ho have you told that you are H
IV positive? CH
ECK ALL THAT A
PPLY.
NO
ON
E = A SPO
USE/SEX PARTN
ER = B D
OCTO
R = C FRIEN
D = D
SIBLIN
G = E
PAREN
TS= F O
THER (SPECIFY)= X
DO
N’T KN
OW
= Y REFU
SED = Z
N
N
C
Now
I would like to ask you questions about your experiences w
ith health care providers.
610 H
IVSTA
THID
E In the last 12 m
onths, when you sought health
care in a facility where your H
IV status is not
known, did you feel you needed to hide your
HIV
status?
YES = 1
NO
, NO
NEED
TO H
IDE = 2
NO
, DID
NO
T ATTEND
HEA
LTH FA
CILITY
IN LA
ST 12 MO
NTH
S =3 D
ON
’T KNO
W = -8
REFUSED
= -9
N
N
C

290
N
O.
V
ARN
AME
Q
UESTIO
NS
COD
ING
CATEG
ORIES
SKIPS/FILTERS
IN
DICA
TOR
D
HS/A
IS
CORE
611 H
IVSTA
TDEN
IED
CARE In the last 12 m
onths, have you been denied health services including dental care, because of your H
IV status?
YES = 1 N
O = 2
NO
ON
E KNO
WS M
Y STATUS = 3
DO
N’T KN
OW
= -8
REFUSED
= -9
N
N
C
MO
DU
LE 8: HIV
STATU
S, CARE A
ND
TREA
TMEN
T
N
O.
V
ARN
AME
Q
UESTIO
NS
COD
ING
CATEG
ORIES
SKIPS/FILTERS
IN
DICA
TOR
D
HS/A
IS
CORE
Now
I’m going to ask you m
ore about your experience with H
IV support, care and treatm
ent.
SKIP TO N
EXT M
OD
ULE IF N
OT
HIV
POSITIVE
701
HIV
CARE A
fter learning you had HIV, have you ever
received HIV
medical care from
a health care provider (doctor, clinical officer or nurse)?
YES = 1
NO
= 2 D
ON
’ T KNO
W = -8
REFUSED
= -9
YES à
HIV
CFM/H
IVCFY
DK, REFU
SED à
SKIP
TO EN
D O
F M
OD
ULE
N
N
C

291
N
O.
V
ARN
AME
Q
UESTIO
NS
COD
ING
CATEG
ORIES
SKIPS/FILTERS
IN
DICA
TOR
D
HS/A
IS
CORE
702
HIV
CNO
TRSN
What is the m
ain reason why you have never
received HIV
medical care from
a health care
provider (doctor, clinical officer, or nurse)?
FACILITY IS TO
O FA
R AW
AY = 1
I DO
N’T KN
OW
WH
ERE TO G
ET HIV
MED
ICAL CA
RE = 2 CO
ST OF CA
RE = 3
COST O
F TRAN
SPORT = 4
I DO
NO
T NEED
IT/I FEEL HEA
LTHY/N
OT
SICK = 5 I FEA
R PEOPLE W
ILL KNO
W TH
AT I HA
VE
HIV
IF I GO
TO A
CLINIC = 6
RELIGIO
US REA
SON
S = 7
I’M TA
KING
TRAD
ITION
AL M
EDICIN
E= 8 O
THER, (SPECIFY) = 96
DO
N’T KN
OW
= -8 REFU
SED = -9
ALLà
CD
4TESTEVER
N
N
C
703 7 H
IVCFM
/HIV
C
FY W
hat month and year did you first see a health
care provider (doctor, clinical officer or nurse) for H
IV medical care?
PROBE TO
VERIFY DATE.
MO
NTH
___ ___
DO
N’T KN
OW
MO
NTH
= 98 REFU
SED M
ON
TH = 99
YEAR ___ ___ ___ ____
DO
N’T KN
OW
YEAR = 9998
REFUSED
YEAR = 9999
N
N
C
704
HIV
CLM/H
IVC
LY W
hat month and year did you last see a health
care provider (doctor, clinical officer or nurse) for H
IV medical care?
MO
NTH
___ ___
DO
N’T KN
OW
MO
NTH
= 98 REFU
SED M
ON
TH= 99
YEAR ___ ___ ___ ____
DO
N’T KN
OW
YEAR = 9998
IF < 7 MO
NTH
S,
DK, REFU
SED à
CD4TESTEVER
N
N
C

292
N
O.
V
ARN
AME
Q
UESTIO
NS
COD
ING
CATEG
ORIES
SKIPS/FILTERS
IN
DICA
TOR
D
HS/A
IS
CORE
REFUSED
= 9999
705 7 H
IVCN
OT6M
O
What is the m
ain reason for not seeing a
health care provider (doctor, clinical officer or nurse) for H
IV m
edical care for more than 6
months?
THE FA
CILITY IS TOO
FAR A
WA
Y = 1
I DO
N’T KN
OW
WH
ERE TO G
ET HIV
M
EDICA
L CARE = 2
COST O
F CARE = 3
COST O
F TRAN
SPORT = 4
I DO
NO
T NEED
IT/I FEEL HEA
LTHY/N
OT
SICK = 5
I FEAR PEO
PLE WILL KN
OW
THAT I H
AVE
HIV
IF I GO
TO A
CLINIC = 6
I’M TA
KING
TRAD
ITION
AL M
EDICIN
E= 7 RELIG
IOU
S REASO
NS = 8
NO
APPO
INTM
ENT SCH
EDU
LED/D
ID N
OT
MISS M
OST RECEN
T APPO
INTM
ENT = 9
OTH
ER, (SPECIFY) = 96 D
ON
’T KNO
W = -8
REFUSED
= -9
N
N
S
706
CD4TESTEVER
Have you ever had a CD
4 count test? The CD
4 count tells you the level of your im
mune status and how
sick you are with H
IV
and if you need to take ARV
s or other HIV
medications.
YES = 1 N
O = 2
DO
N’T KN
OW
= -8 REFU
SED = -9
NO
, DK, REFU
SED
à ARV
STAKENEV
NEVER IN
HIV
CARE à
SKIP TO
END
OF M
OD
ULE
N
N
C

293
N
O.
V
ARN
AME
Q
UESTIO
NS
COD
ING
CATEG
ORIES
SKIPS/FILTERS
IN
DICA
TOR
D
HS/A
IS
CORE
707
CD4TTM
/CD4
TTY W
hat month and year w
ere you last tested for your CD
4 count?
MO
NTH
___ ___
DO
N’T KN
OW
MO
NTH
= -8 REFU
SED M
ON
TH = -9
YEAR ___ ___ ___ ____ D
ON
’T KNO
W YEA
R = -8 REFU
SED YEA
R = -9
SKIP TO EN
D O
F M
OD
ULE IF
NEVER IN
HIV
CA
RE.
N
N
C
708 7 A
RVSTAKEN
E
V H
ave you ever taken ARV
s, that is, medications
to treat HIV infection?
YES = 1 N
O = 2
DO
N’T KN
OW
= -8 REFU
SED = -9
YESà
ARV
FTM/ARV
FTY D
K, REFUSED
à
SKIP TO EN
D O
F
MO
DU
LE
N
N
C
709 7 A
RVSN
OTTAK
E W
hat is the main reason you have never taken
ARV
s?
NO
T ELIGIBLE FO
R TREATM
ENT=1
HEA
LTH CA
RE PROVID
ER DID
NO
T PRESCRIBE = 2
HIV
MED
ICINES N
OT A
VA
ILABLE = 3
I FEEL HEA
LTHY/N
OT SICK = 4
COST O
F MED
ICATIO
NS = 5
COST O
F TRAN
SPORT = 6
RELIGIO
US REA
SON
S = 7 TA
KING
TRAD
ITION
AL MED
ICATION
S = 8
NO
T ATTEN
DIN
G H
IV CLINIC = 9
STIGM
A/ KEEP H
IV STATUS SECRET =10
OTH
ER, (SPECIFY) = 96 D
ON
’T KNO
W = -8
REFUSED
= -9
ALLà
SKIP TO EN
D
OF M
OD
ULE
.
N
N
C

294
N
O.
V
ARN
AME
Q
UESTIO
NS
COD
ING
CATEG
ORIES
SKIPS/FILTERS
IN
DICA
TOR
D
HS/A
IS
CORE
710 710 A
RVFTM
/ARVFTY
What m
onth and year did you first start taking A
RVs?
PROBE TO
VERIFY DATE.
MO
NTH
_____ D
ON
’T KNO
W M
ON
TH = -98
REFUSED
MO
NTH
= -99 YEAR _____ D
ON
’T KNO
W YEA
R = -9998
REFUSED
YEAR = -9999
M
ER/TX_RET G
ARPR/4.1
GF/H
IV-I6
N
C
711
ARV
SCURREN
T A
re you currently taking ARV
s, that is, antiretroviral m
edications? By currently, I m
ean that you may have m
issed som
e doses but you are still taking ARV
s.
YES = 1 N
O=2
DO
N’T KN
OW
= -8
REFUSED
= -9
YESàA
RVSM
ISSDAY
S
DK, REFU
SED à
SKIP TO
NU
TRITION
E
MER/TX_CU
RR G
ARPR/4.1
GF/H
IV-T1
N
C
712 712 A
RVSN
OTCU
R
RSN
Can you tell me the m
ain reason why you are
not currently taking ARVs?
I HA
VE TROU
BLE TAKIN
G A TABLET
EVERYDAY = 1
I HA
D SID
E EFFECTS = 2 FA
CILITY TOO
FAR A
WA
Y FOR M
E TO G
ET
MED
ICINE REG
ULA
RLY = 3 CO
ST OF M
EDICA
TION
S =4 CO
ST OF TRA
NSPO
RT = 5
I FEEL HEA
LTHY/N
OT SICK =6
FACILITY W
AS O
UT O
F STOCK = 7
RELIGIO
US REA
SON
S = 8 TA
KING
TRAD
ITION
AL MED
ICATION
S = 9
STIGM
A/ KEEP H
IV STATUS SECRET =10
OTH
ER, (SPECIFY) = 96
DO
N’ T KN
OW
= -8
ALL à
SKIP TO
NU
TRITION
.
N
N
C

295
N
O.
V
ARN
AME
Q
UESTIO
NS
COD
ING
CATEG
ORIES
SKIPS/FILTERS
IN
DICA
TOR
D
HS/A
IS
CORE
REFUSED
= -9
713 713 A
RVSM
ISSDA
YS
People sometim
es forget to take all of their
ARV
s everyday. In the last 30 days, how m
any days have you m
issed taking any of your ARV
pills?
COD
E ‘0’ IF NO
NE.
NU
MBER O
F DAYS ______
DO
N’T KN
OW
= -8 REFU
SED = -9
N
N
C
714 714 N
UTRITIO
N
Were you given a nutritional supplem
ent or referred for a nutritional consult or both?
NO
, NEV
ER GIVEN
SU
PPLEMEN
T/REFERRED = 1
YES, GIVEN
SUPPLEM
ENT = 2
YES, REFERRED = 3
BOTH
GIV
EN SU
PPLEMEN
T AN
D REFERRED
= 4
DO
N’T KN
OW
= -8 REFU
SED = -9
N
N
S
715 715 SPTG
RGO
H
ave you ever attended a support group for people living w
ith HIV
?
YES= 1 N
O = 2
DO
N’T KN
OW
= -8 REFU
SED = -9
NO
, DK,
REFUSED
àN
EXT M
OD
ULE
N
N
S

296
N
O.
V
ARN
AME
Q
UESTIO
NS
COD
ING
CATEG
ORIES
SKIPS/FILTERS
IN
DICA
TOR
D
HS/A
IS
CORE
716 716 SPTG
RREC W
hich of the following do you receive from
the support group related to your H
IV infection? REA
D EA
CH RESPO
NSE.
SELECT ALL TH
AT APPLY.
NO
THIN
G = A
COU
NSELIN
G/H
EALTH
Y LIVING
MESSAG
ES = A REM
IND
ED O
F IMPO
RTAN
CE OF TAKIN
G
ARV
s REGU
LARLY = B REM
IND
ED TO
KEEP HIV A
PPOIN
TMEN
TS = C REFILLS O
R PICKING
UP A
RV MED
ICATIO
NS
= D
PSYCHO
SOCIA
L SUPPO
RT = E LIVELIH
OO
D/M
ATERIA
L SUPPO
RT = F N
OTH
ING
= A O
THER (SPECIFY) = X
DO
N’T KN
OW
= Y REFU
SED = Z
N
N
S

297
MO
DU
LE 9: TUBERCU
LOSIS A
ND
OTH
ER HEA
LTH ISSU
ES
N
O.
V
ARN
AME
Q
UESTIO
NS
COD
ING
CATEG
ORIES
SKIPS/FILTERS
IN
DICA
TOR
D
HS/A
IS
CORE
Now
we w
ill ask you about tuberculosis or TB. SKIP
INSTRU
CTION
IF IN
HIV CA
RE.
801
TBCLINV
ISIT H
ave you ever visited a TB clinic for TB
diagnosis or treatment?
YES = 1
NO
=2 D
ON
’T KNO
W = -8
REFUSED
= -9
NO
, DK, REFU
SED
à SKIP TO
NEXT
MO
DU
LE
N
N
C
802
TBDIA
GN
H
ave you ever been told by a health care
provider (doctor, clinical officer or nurse) that you had TB?
YES = 1
NO
=2 D
ON
’T KNO
W = -8
REFUSED
= -9
NO
, DK, REFU
SED
à SKIP TO
NEXT
MO
DU
LE
N
N
C
803
TBTREATED
Were you ever treated for TB?
YES = 1
NO
= 2 D
ON
’T KNO
W = -8
REFUSED
= -9
NO
, DK, REFU
SED
à SKIP TO
NEXT
MO
DU
LE
N
N
C
804
TBTTREATCUR
R
Are you currently on treatm
ent for TB? YES = 1
NO
= 2 D
ON
’T KNO
W = -8
REFUSED
= -9
NO
, DK, REFU
SED
àSKIP TO
END
OF
MO
DU
LE
N
N
C

298
N
O.
V
ARN
AME
Q
UESTIO
NS
COD
ING
CATEG
ORIES
SKIPS/FILTERS
IN
DICA
TOR
D
HS/A
IS
CORE
805
TBTREAT6M
OFU
LL The last tim
e you were treated for TB, did you
complete at least 6 m
onths of treatment?
YES = 1 N
O, M
EDICIN
E WA
S STOPPED
IN LESS
THA
N 6 M
ON
THS = 2
DO
N’T KN
OW
= -8
REFUSED
= -9
NO
, DK, REFU
SED
àSKIP TO
END
OF
MO
DU
LE
N
N
C
Now
I’m going to ask you about tests a health care provider can do to check for cervical cancer. The cervix connects
the uterus to the vagina. The tests a health care provider can do to check for cervical cancer are called a Pap smear,
HPV
test and VIA test.
For a Pap smear and H
PV test, a health care provider puts a small stick inside the vagina to w
ipe the cervix and sends the sam
ple to the laboratory. For a VIA test, a healthcare w
orker puts vinegar on the cervix and looks to see if the
cervix changes color.
SKIP TO N
EXT
MO
DU
LE IF MALE.
8805 CERV
CNTST
Have you ever been screened for cervical
cancer?
YES = 1
NO
= 2 D
ON
’T KNO
W = -8
REFUSED
= -9
NO
, DK, REFU
SED
àN
EXT MO
DU
LE
N
N
CàS
806 CERV
CNTSM
/CERV
CNTSY
What m
onth and year was your last screen for
cervical cancer?
MO
NTH
___ ___
DO
N’T KN
OW
MO
NTH
= -98 REFU
SED = -99
YEAR ___ ___ ___ ___
DO
N’T KN
OW
YEAR = -9998
REFUSED
YEAR = -9999
N
N
Cà
S

299
N
O.
V
ARN
AME
Q
UESTIO
NS
COD
ING
CATEG
ORIES
SKIPS/FILTERS
IN
DICA
TOR
D
HS/A
IS
CORE
807 CERV
CNRSLT
What w
as the result of your last screening for cervical cancer?
NO
RMAL/N
EGATIV
E = 1 A
BNO
RMA
L/POSITIV
E = 2
SUSPECT CA
NCER = 3
UN
CLEAR/INCO
NCLU
SIVE = 4
DID
NO
T RECEIVE RESULTS = 5
DO
N’T KN
OW
= -8
REFUSED
= -9
NO
RMAL,
SUSPECT CA
NCER,
UN
CLEAR, DID
N
OT RECEIVE, D
K,
REFUSED
à N
EXT M
OD
ULE
N
N
CàS
808 CERV
CNTRT
Did you receive treatm
ent after your last screening for cervical cancer? D
id you receive treatm
ent on the same day or on a different
day?
YES, I WA
S TREATED O
N TH
E SAM
E DA
Y = 1 YES, I RECEIV
ED TREATM
ENT O
N A
DIFFEREN
T DAY = 2
NO
= 3
REFUSED
= -8 D
ON
’T KNO
W = -9
N
N
CàS
Now
I would like to ask you questions about sexual health.
SKIP TO N
EXT M
OD
ULE IF
NEVER H
AD
SEX.
919 812 V
GD
ISCHARG
E D
uring the last 12 months, have you had an
abnormal discharge from
your vagina or
experienced pelvic pain? This may include an
unusual smell, color, or texture.
YES = 1 N
O = 2
DO
N’T KN
OW
= -8 REFU
SED = -9
SKIP IF MA
LE.
N
Y
S
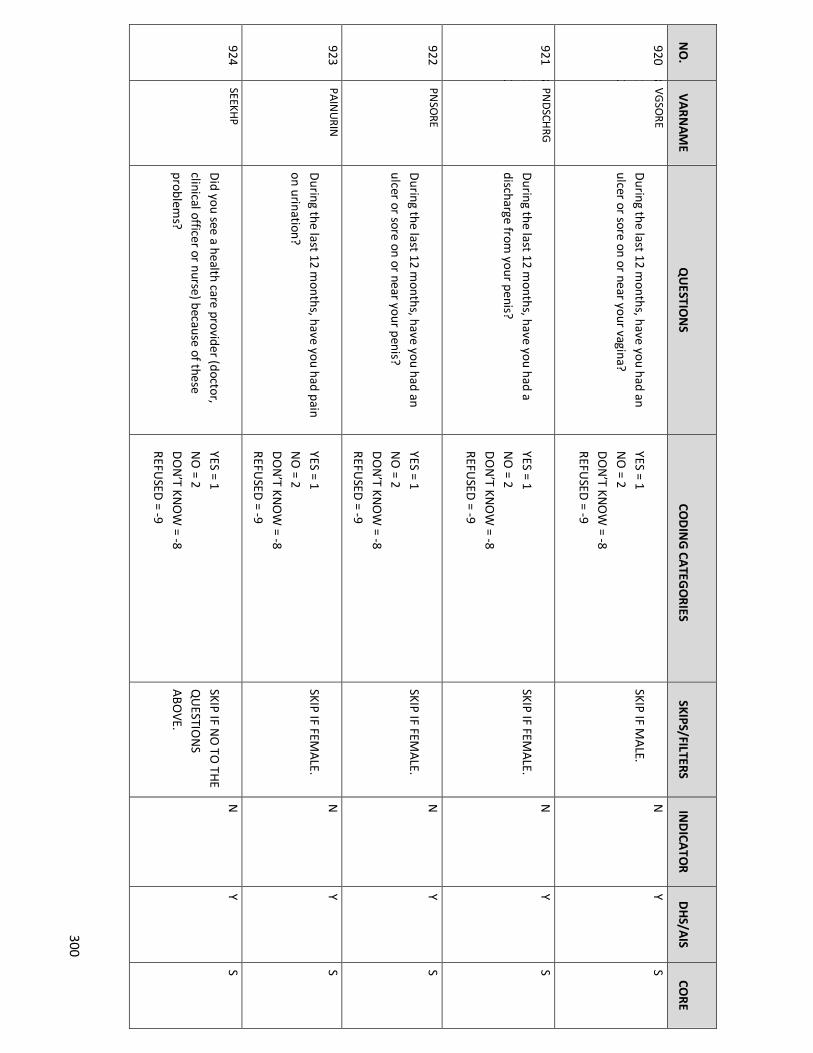
300
N
O.
V
ARN
AME
Q
UESTIO
NS
COD
ING
CATEG
ORIES
SKIPS/FILTERS
IN
DICA
TOR
D
HS/A
IS
CORE
920 812 V
GSO
RE D
uring the last 12 months, have you had an
ulcer or sore on or near your vagina?
YES = 1 N
O = 2
DO
N’T KN
OW
= -8 REFU
SED = -9
SKIP IF MA
LE. N
Y
S
921 812 PN
DSCH
RG D
uring the last 12 months, have you had a
discharge from your penis?
YES = 1
NO
= 2 D
ON
’T KNO
W = -8
REFUSED
= -9
SKIP IF FEMA
LE. N
Y
S
922
PNSO
RE D
uring the last 12 months, have you had an
ulcer or sore on or near your penis?
YES = 1
NO
= 2 D
ON
’T KNO
W = -8
REFUSED
= -9
SKIP IF FEMA
LE. N
Y
S
923
PAIN
URIN
D
uring the last 12 months, have you had pain
on urination?
YES = 1
NO
= 2 D
ON
’T KNO
W = -8
REFUSED
= -9
SKIP IF FEMA
LE. N
Y
S
924
SEEKHP
Did you see a health care provider (doctor,
clinical officer or nurse) because of these problem
s?
YES = 1
NO
= 2 D
ON
’T KNO
W = -8
REFUSED
= -9
SKIP IF NO
TO TH
E
QU
ESTION
S A
BOVE.
N
Y S

301
OPTIO
NA
L MO
DU
LE C: ALCO
HO
L USE/N
ON
-PRESCRIPTION
DRU
G U
SE/TOBA
CCO
N
O.
V
ARN
AME
Q
UESTIO
NS
COD
ING
CATEG
ORIES
SKIPS/FILTERS
IN
DICA
TOR
D
HS/A
IS
CORE
The next few questions w
ill be on your use of alcohol and non-prescription drugs. Remem
ber, all the answers you provide w
ill be kept confidential.
A1
ALCFREQ
H
ow often do you have a drink containing
alcohol?
NEVER = 0
MO
NTH
LY OR LESS = 1
2-4 TIMES A M
ON
TH = 2
2-3 TIMES A W
EEK = 3 4 O
R MO
RE TIMES A
WEEK = 4
DO
N’T KN
OW
= -8 REFU
SED = -9
NEVER , D
K,
REFUSED
à
IDEVER
N
S
A2
ALCN
UM
DAY
How
many drinks containing alcohol do you
have in a typical day?
NO
NE O
R LESS THA
N O
NE = 0
1 OR 2= 1
3 OR 4= 2
5 OR 6 =3
7 TO 9 = 4
10 OR M
ORE = 5
DO
N’T KN
OW
= -8 REFU
SED = -9
N
S
A3
ALCSIXM
ORE
How
often do you have six or more drinks on
one occasion?
NEVER = 0
LESS THA
N M
ON
THLY = 1
MO
NTH
LY = 2 W
EEKLY= 3 D
AILY O
R ALM
OST D
AILY = 4
DO
N’T KN
OW
= -8 REFU
SED = -9
N
S

302
N
O.
V
ARN
AME
Q
UESTIO
NS
COD
ING
CATEG
ORIES
SKIPS/FILTERS
IN
DICA
TOR
D
HS/A
IS
CORE
A4
IDEVER
Some people inject drugs w
ith a needle and syringe for pleasure. H
ave you ever injected
drugs for pleasure?
YES = 1 N
O = 2
DO
N’T KN
OW
= -8 REFU
SED = -9
NO
, DK, REFU
SEDà
N
EXT MO
DU
LE
N
S
A5
ID30D
AY
Have you injected drugs w
ith a needle and
syringe in the last 30 days?
YES = 1
NO
= 2 D
ON
’T KNO
W= -8
REFUSED
= -9
NO
, DK, REFU
SED à
NEXT M
OD
ULE
N
S
A6
ID30D
SHR
When you have injected drugs during the last
30 days, have you shared the syringe or needle w
ith other people?
YES = 1
NO
= 2 D
ON
’T KNO
W= -8
REFUSED
= -9
N
S
MO
DU
LE 10: GEN
DER N
ORM
S
Now
I would like to ask you question on attitudes and decision-m
aking in your home.
901 H
EALTH
C W
ho usually makes decisions about health
care for yourself: you, your (spouse/partner), you and your (spouse/partner) together, or
someone else?
I DO
= 1
SPOU
SE/PARTN
ER = 2 W
E BOTH
DO
= 3
SOM
EON
E ELSE = 4
SKIP IF NO
T
MA
RRIED/LIV
ING
TOG
ETHER
N
C

303
DO
N’T KN
OW
= -8 REFU
SED = -9
902 M
ON
EY W
ho generally decides about how the m
oney
you receive is spent: you, your (spouse/partner), you and your
(spouse/partner) together, or someone else?
I D
O = 1
SPOU
SE/PARTN
ER = 2 W
E BOTH
DO
= 3
SOM
EON
E ELSE = 4 D
ON
’T KNO
W = -8
REFUSED
= -9
SKIP IF NO
T
MA
RRIED/LIV
ING
TOG
ETHER
N
C
1001 O
KHITSEX
Do you believe it is right for a m
an to hit or beat his w
ife if she refuses to have sex with
him?
YES = 1 N
O = 2
DO
N’T KN
OW
= -8 REFU
SED = -9
N
S
MO
DU
LE D: V
IOLEN
CE
N
O.
V
ARN
AME
Q
UESTIO
NS
CO
DIN
G CA
TEGO
RIES
SKIPS/FILTERS
IND
ICATO
R
DH
S/AIS
CO
RE
You have been selected to be asked questions on other important aspects of a person’s life. I know
that some of these
questions are very personal. How
ever, your answers are im
portant for helping to understand the condition of men and
wom
en in Tanzania. Let me assure you that your answ
ers are completely confidential and w
ill not be told to anyone and no one in your household w
ill know that you w
ere asked these questions.
By sex, I mean vaginal, anal, oral sex or the insertion of an object into your vagina or anus. V
aginal sex is when a penis
enters a vagina. Anal sex is w
hen a penis enters an anus (butt). Oral sex is w
hen a partner puts his/her mouth on
his/her partner’s penis or vagina.
SELECT ON
LY 1 W
OM
AN
PER
HO
USEH
OLD
.

304
N
O.
V
ARN
AME
Q
UESTIO
NS
CO
DIN
G CA
TEGO
RIES
SKIPS/FILTERS
IND
ICATO
R
DH
S/AIS
CO
RE
11001
CMPLSXEV
ER H
ow m
any times in your life has anyone tried
to make you have sex against your w
ill but did not succeed? This includes som
eone using
harassment, threats, tricks, or physical force.
COD
E ‘00’ IF NO
NE.
NO
NE = 2
DO
N’T KN
OW
= -8
REFUSED
= -9
NO
NE, D
K,
REFUSED
à
FRCSXEVERALT
N
S, A
LT
11002
CMPLSXAG
E H
ow old w
ere you the first time som
eone tried
to make you have sex against your w
ill but did not succeed?
AG
E IN YEARS ____
DO
N’T KN
OW
= -8 REFU
SED = -9
N
CàS
1100
3
CMPLSXFSTG
N
DR
The first time som
eone tried to make you have
sex against your will but did not succeed, w
as
the person male or fem
ale? If it was m
ore than one person, w
hat was the sex(m
ale/female) of
the person you knew the best?
MA
LE = 1 FEM
ALE = 2
DO
N’T KN
OW
= -8 REFU
SED = -9
N
S

305
N
O.
V
ARN
AME
Q
UESTIO
NS
CO
DIN
G CA
TEGO
RIES
SKIPS/FILTERS
IND
ICATO
R
DH
S/AIS
CO
RE
11004
CMPLSXFSTREL
The first time this happened, w
hat was your
relationship to the person who did this? If it
was m
ore than one person, what w
as your
relationship with the person you knew
the best?
BOYFRIEN
D/G
IRLFRIEND
/LIVE-IN
PARTN
ER/SPOU
SE = 1 EX-BO
YFRIEND
/GIRLFRIEN
D/PA
RTNER/SPO
USE = 2 RELA
TIVE/FAM
ILY MEM
BER =3 CLA
SSMA
TE/SCHO
OLM
ATE = 4
TEACH
ER = 5 PO
LICE/SECURITY O
FFICER/MILITA
RY= 6 EM
PLOYER = 7
NEIG
HBO
R =8 CO
MM
UN
ITY/ RELIG
IOU
S LEAD
ER =9 FRIEN
D = 10
STRAN
GER = 11
OTH
ER (SPECIFY) = 96 D
ON
’T KNO
W = -8
REFUSED
= -9
N
S
1100
5
CMPLSX12M
O
In the last 12 months, did anyone try to m
ake you have sex against your w
ill but did not
succeed? This includes someone using
harassment, threats, tricks, or physical force.
YES = 1 N
O = 2
DO
N’T KN
OW
= -8 REFU
SED = -9
NO
, DK, REFU
SED
à FRCSXEVERA
LT
N
S
1100
6
CMPLSXLSTG
N
DR
The last time som
eone tried to make you have
sex against your will but did not succeed, w
as
the person male or fem
ale? If it was m
ore than one person, w
hat was the sex (m
ale/female) of
the person you knew the best?
MA
LE = 1 FEM
ALE = 2
DO
N’T KN
OW
= -8 REFU
SED = -9
N
S

306
N
O.
V
ARN
AME
Q
UESTIO
NS
CO
DIN
G CA
TEGO
RIES
SKIPS/FILTERS
IND
ICATO
R
DH
S/AIS
CO
RE
11007
CMPLSXLSTREL
The last time this happened, w
hat was your
relationship to the person who did this? If it
was m
ore than one person, what w
as your
relationship with the person you knew
the best?
BOYFRIEN
D/G
IRLFRIEND
/LIVE-IN
PARTN
ER/SPOU
SE = 1 EX-BO
YFRIEND
/GIRLFRIEN
D/PA
RTNER/SPO
USE = 2 RELA
TIVE/FAM
ILY MEM
BER = 3 CLA
SSMA
TE/SCHO
OLM
ATE = 4
TEACH
ER = 5 PO
LICE/SECURITY O
FFICER/MILITA
RY= 6 EM
PLOYER = 7
NEIG
HBO
R = 8 CO
MM
UN
ITY/ RELIG
IOU
S LEAD
ER = 9 FRIEN
D = 10
STRAN
GER = 11
OTH
ER (SPECIFY)= 96 D
ON
’T KNO
W = -8
REFUSED
= -9
N
S
1100
8
FRCSXEVERAL
T
How
many tim
es has anyone ever forced you to have sex against your w
ill and succeeded?
This includes someone using harassm
ent, threats, tricks, or physical force.
COD
E ‘00’ IF NO
NE.
NU
MBER O
F TIMES_____
DO
N’T KN
OW
= -8
REFUSED
= -9
NO
NE, D
K, REFU
SED FO
R
BOTH
FRCSXEVERALT &
CM
PLSXEVER à
V
LNC
NO
NE, D
K,
REFUSED
FOR
FRCSXEVERALT
BUT Y FO
R CM
PLSXEVERà
UN
WN
TSEEK
N
S, A
LT

307
N
O.
V
ARN
AME
Q
UESTIO
NS
CO
DIN
G CA
TEGO
RIES
SKIPS/FILTERS
IND
ICATO
R
DH
S/AIS
CO
RE
11009
FRCSXAG
EALT H
ow old w
ere you the first time som
eone
forced you to have sex and succeeded?
AG
E IN YEARS _____
DO
N’T KN
OW
= -8 REFU
SED = -9
N
S, ALT
11010
FRCSXFSTGN
DRA
LT The first tim
e someone forced you to have sex
and succeeded, was the person m
ale or fem
ale? If it was m
ore than one person, what
was the sex (m
ale/female) of the person you
knew the best?
MA
LE = 1
FEMA
LE = 2 D
ON
’T KNO
W = -8
REFUSED
= -9
N
S, ALT
1101
1
FRCSXRELATA
L
T W
hat was this person’s relationship to you? If
it was m
ore than one person, what w
as the
relationship with the person you knew
the best?
BOYFRIEN
D/G
IRLFRIEND
/LIVE-IN
PARTN
ER/SPOU
SE = 01 EX-BO
YFRIEND
/GIRLFRIEN
D/PA
RTNER/SPO
USE =0 2 RELA
TIVE/FAM
ILY MEM
BER = 03 CLA
SSMA
TE/SCHO
OLM
ATE = 04
TEACH
ER = 05 PO
LICE/SECURITY O
FFICER/MILITA
RY= 06 EM
PLOYER = 07
NEIG
HBO
R = 08 CO
MM
UN
ITY/ RELIG
IOU
S LEAD
ER = 09 FRIEN
D = 10
STRAN
GER = 11
OTH
ER = 96 D
ON
’T KNO
W = -98
REFUSED
= -99
N
S, ALT
11012
UN
WN
TSEEK
HEA
LTHCA
RE PROFESSIO
NA
L = A
N
Cà
S

308
N
O.
V
ARN
AME
Q
UESTIO
NS
CO
DIN
G CA
TEGO
RIES
SKIPS/FILTERS
IND
ICATO
R
DH
S/AIS
CO
RE
After any of these unw
anted sexual experiences, did you try to seek professional
help or services from any of the follow
ing? SELECT A
LL THAT A
PPLY.
POLICE O
R OTH
ER SECURITY PERSO
NN
EL = B SO
CIAL W
ORKER, CO
UN
SELOR O
R NO
N-
GO
VERNM
ENTAL O
RGA
NIZATIO
N = C
RELIGIO
US LEA
DER = D
I D
ID N
OT TRY TO
SEEK HELP = E
OTH
ER (SPECIFY)= X D
ON
’T KNO
W = Y
REFUSED
= Z
SKIP TO
UN
WN
TSXTELL IF
SOU
GH
T HELP .
1101
3
UN
WN
TSXNO
H
LP W
hat was the m
ain reason that you did not try to seek professional help or services?
DID
NO
T KNO
W SERVICES W
ERE A
VA
ILABLE = 1
SERVICES NO
T AVA
ILABLE = 2
AFRA
ID O
F GETTIN
G IN
TROU
BLE = 3
ASH
AM
ED FO
R SELF/FAM
ILY = 4 CO
ULD
NO
T AFFO
RD SERVICES = 5
DID
NO
T THIN
K IT WA
S A PRO
BLEM =6
FELT IT WA
S MY FA
ULT = 7
AFRA
ID O
F BEING
ABA
ND
ON
ED = 8
DID
NO
T NEED
/WA
NT SERV
ICES = 9
AFRA
ID O
F MA
KING
SITUATIO
N W
ORSE =
10 O
THER (SPECIFY)= 96
DO
N’T KN
OW
= -8 REFU
SED = -9
N
Cà
S
1013A
UN
WN
TSXTELL
Did you tell anyone about these sexual
experiences?
YES=1 N
O=2
DO
N’T KN
OW
= -8 REFU
SED = -9
CO
UN
TRY AD
DED

309
N
O.
V
ARN
AME
Q
UESTIO
NS
CO
DIN
G CA
TEGO
RIES
SKIPS/FILTERS
IND
ICATO
R
DH
S/AIS
CO
RE
11014
VLN
C H
as anyone ever done any of these things to you:
-
Punched, kicked, whipped, or beat
you with an object
- Slapped you, threw
something at you
that could hurt you, pushed you or shoved you
- Choked, sm
othered, tried to drown
you, or burned you intentionally
- U
sed or threatened you with a knife,
gun or other weapon?
YES = 1
NO
= 2 D
ON
’T KNO
W = -8
REFUSED
= -9
NO
, DK, REFU
SED
à EN
D O
F
MO
DU
LE
N
Cà
S
11015
VLN
CFRSTAG
E H
ow old w
ere you the first time one of these
things happened to you?
AG
E IN YEARS _____
DO
N’T KN
OW
= -8 REFU
SED = -9
N
CàS
11016
VLN
C12MO
TIMES
In the last 12 months, how
many tim
es has
someone:
- Punched, kicked, w
hipped, or beat you w
ith an object
- Slapped you, threw
something at you
that could hurt you, pushed you or
shoved you -
Choked, smothered, tried to drow
n
you, or burned you intentionally -
Used or threatened you w
ith a knife,
gun or other weapon?
NO
T IN LA
ST 12 MO
NTH
S = 1
ON
CE = 2 FEW
= 3
MA
NY = 4
DO
N’T KN
OW
= -8
REFUSED
= -9
NO
T IN LA
ST 12
MO
NTH
Sà
VLN
CLSTGN
DR
N
Cà
S

310
N
O.
V
ARN
AME
Q
UESTIO
NS
CO
DIN
G CA
TEGO
RIES
SKIPS/FILTERS
IND
ICATO
R
DH
S/AIS
CO
RE
11017
VLN
C12MO
PTN
R In the last 12 m
onths, has a partner done any
of these things to you? -
Punched, kicked, whipped, or beat
you with an object
- Slapped you, threw
something at you
that could hurt you, pushed you or shoved you
- Choked, sm
othered, tried to drown
you, or burned you intentionally
- U
sed or threatened you with a knife,
gun or other weapon?
By partner, I mean a live-in partner w
hether or not you w
ere married at the tim
e.
YES =1
NO
, PARTN
ER DID
NO
T = 2 N
O, D
ID N
OT H
AVE A
LIVE-IN
PARTNER IN
THE LA
ST 12 MO
NTH
S = 3 D
ON
’T KNO
W = -8
REFUSED
= -9
G
ARPR 7.1
N
CàS
11018
VLN
CLSTGN
DR
The last time any of these things happened,
was the person m
ale or female? If it w
as more
than one person, what w
as the sex (m
ale/female) of the person you knew
the
best?
MA
LE = 1
FEMA
LE = 2 D
ON
’T KNO
W = -8
REFUSED
= -9
N
S

311
N
O.
V
ARN
AME
Q
UESTIO
NS
CO
DIN
G CA
TEGO
RIES
SKIPS/FILTERS
IND
ICATO
R
DH
S/AIS
CO
RE
1101
VLN
CLSTREL The last tim
e any of these things happened,
what w
as this person’s relationship to you? If it w
as more than one person, w
hat was your
relationship with the person you knew
the best?
BOYFRIEN
D/G
IRLFRIEND
/LIVE-IN
PARTN
ER/SPOU
SE = 1 EX-BO
YFRIEND
/GIRLFRIEN
D/PA
RTNER/SPO
USE = 2 RELA
TIVE/FAM
ILY MEM
BER = 3 CLA
SSMA
TE/SCHO
OLM
ATE = 4
TEACH
ER = 5 PO
LICE/SECURITY O
FFICER/MILITA
RY= 6 EM
PLOYER = 7
NEIG
HBO
R = 8 CO
MM
UN
ITY/ RELIG
IOU
S LEAD
ER = 9 FRIEN
D = 10
STRAN
GER = 11
OTH
ER (SPECIFY) = 96 D
ON
’T KNO
W = -8
REFUSED
= -9
N
S
1101
9
VLN
CLSTPRPA
GE
The last time any of these things happened,
how old w
as the perpetrator?
SAM
E AGE = 1
YOU
NG
ER = 2 LESS TH
AN
10 YEARS OLD
ER = 3 10+ YEA
RS OLD
ER =4 D
ON
’T KNO
W = 8
REFUSED
= 9
CO
UN
TR
Y ADD
ED
SERVICES FOR PH
YSICAL VIO
LENCE
1102
0
SEEKHELP
Thinking about all the experiences that we just
discussed, whether som
eone has done the follow
ing: -
Punched, kicked whipped or beat you
with an object
I DID
NO
T TRY TO SEEK H
ELP = A H
EALTH
CARE PRO
FESSION
AL = B
POLICE O
R OTH
ER SECURITY PERSO
NN
EL = C
TRY TO SEEK
HELP à
SKIP TO
END
OF M
OD
ULE
N
Cà
S
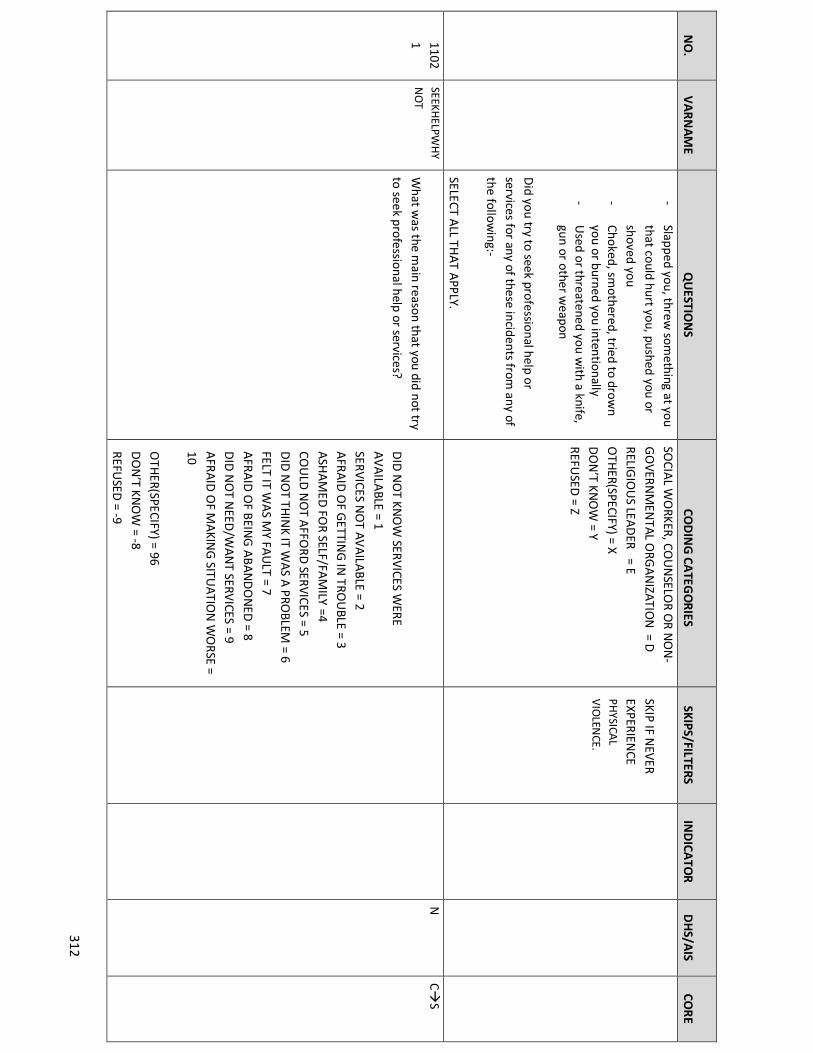
312
N
O.
V
ARN
AME
Q
UESTIO
NS
CO
DIN
G CA
TEGO
RIES
SKIPS/FILTERS
IND
ICATO
R
DH
S/AIS
CO
RE
- Slapped you, threw
something at you
that could hurt you, pushed you or
shoved you -
Choked, smothered, tried to drow
n you or burned you intentionally
- U
sed or threatened you with a knife,
gun or other weapon
Did you try to seek professional help or
services for any of these incidents from any of
the following:-
SELECT ALL TH
AT APPLY.
SOCIA
L WO
RKER, COU
NSELO
R OR N
ON
-G
OVERN
MEN
TAL ORG
AN
IZATION
= D
RELIGIO
US LEA
DER = E
OTH
ER(SPECIFY) = X
DO
N’T KN
OW
= Y REFU
SED = Z
SKIP IF NEVER
EXPERIENCE
PHYSICA
L
VIO
LENCE.
11021
SEEKHELPW
HY
NO
T W
hat was the m
ain reason that you did not try
to seek professional help or services?
DID
NO
T KNO
W SERVICES W
ERE A
VA
ILABLE = 1
SERVICES NO
T AVA
ILABLE = 2
AFRA
ID O
F GETTIN
G IN
TROU
BLE = 3 A
SHA
MED
FOR SELF/FA
MILY =4
COU
LD N
OT A
FFORD
SERVICES = 5 D
ID N
OT TH
INK IT W
AS A
PROBLEM
= 6
FELT IT WA
S MY FA
ULT = 7
AFRA
ID O
F BEING
ABA
ND
ON
ED = 8
DID
NO
T NEED
/WA
NT SERV
ICES = 9 A
FRAID
OF M
AKIN
G SITU
ATION
WO
RSE =
10 O
THER(SPECIFY) = 96
DO
N’T KN
OW
= -8
REFUSED
= -9
N
CàS

313
N
O.
V
ARN
AME
Q
UESTIO
NS
CO
DIN
G CA
TEGO
RIES
SKIPS/FILTERS
IND
ICATO
R
DH
S/AIS
CO
RE
11022
Thank you for sharing your personal experiences w
ith me. I know
it may have been
difficult for you to talk about your experiences w
ith me. If you w
ould like to talk further about these experiences, I can refer you to a place that can provide you w
ith help. PRO
VID
E PARTICIPAN
T WITH
LIST OF
ORG
AN
IZATIO
NS.
SKIP IF N
EVER EXPERIEN
CE PH
YSICAL
VIO
LENCE.
N
C Cà
S
Thank you for sharing your personal experiences w
ith me. If you w
ant to talk further about these experiences, I can refer you to a place that can provide you w
ith help.
SKIP IF >18 YEA
RS
OLD
SKIP IF N
EVER SO
LD SEX
N
C
Thank you for taking the time to participate in
this survey. Your responses will be very
helpful to the Ministry of H
ealth to better
understand how to im
prove health programs
in the country.
PROV
IDE PARTICIPA
NT W
ITH LIST O
F
ORG
AN
IZATIO
NS, IF N
OT A
LREADY G
IVEN.
N
C

314
NO.
VARNAME
QUESTIO
NS AND FILTERS CO
DING CATEG
ORIES
SKIP/FILTERS CO
MM
ENTS INDICATO
R DHS/AIS
CORE
THIS Q
UESTIO
NN
AIRE IS ADM
INISTERED
TO ELIG
IBLE CHILD
REN A
GED
BETWEEN
10-14 YEARS AFTER IN
FORM
ED PA
RENTA
L/GU
ARD
IAN
CON
SENT A
ND
MIN
OR A
SSENT.
EN
TER LINE N
UM
BER OF TH
E CHILD
FROM
THE H
OU
SEHO
LD LISTIN
G: ____
ENTER N
AM
E OF CH
ILD: ____
MO
DU
LE1: SOCIO
-DEM
OG
RAPH
IC CHARA
CTERISTICS
NO
VA
RNA
ME
QU
ESTION
S CO
DIN
G CATEG
ORIES
SKIPS IN
DICATO
R D
HS/A
IS CO
RE
101 A
DG
END
ER IS TH
E RESPON
DEN
T MA
LE OR FEM
ALE?
MA
LE = 1
FEMA
LE = 2
N
N
C
102 A
DA
GE
How
old were you at your last birthday?
AG
E IN CO
MPLETED
YEARS __ __
DO
N’T KN
OW
AGE = -98
REFUSED
= -99
N
N
C
103 A
DEN
SCH
Are you currently enrolled in school?
YES = 1 N
O = 2
DO
N’T KN
OW
= -8
IF NO
, DK,
REFUSED
à
AD
NO
SCHREA
S
N
N
C
APPENDIX G: E
ARLY ADOLESCENT Q
UESTIONNAIRE

315
REFUSED
= -9
104
AD
MISCH
During the last school w
eek, did you miss any
school days for any reason?
YES = 1 N
O = 2
DO
N’T KN
OW
= -8 REFU
SED = -9
NO
, DK, REFU
SED
àA
DCU
RGRD
N
N
C
105 A
DM
ISCHRE
AS
Why did you m
iss school?
I HA
VE BEEN SICK = 1
I DO
N’T FEEL SA
FE TRAVELIN
G TO
SCHO
OL
= 2 I D
ON
’T FEEL SAFE W
HILE IN
SCHO
OL = 3
I DO
N’T LIKE SCH
OO
L = 4 I H
AVE TO
LOO
K AFTER M
Y FAM
ILY= 5
THERE’S N
OT EN
OU
GH
MO
NEY TO
SEND
M
E TO SCH
OO
L = 6
SCHO
OL IS TO
O FA
R AW
AY = 7 I H
AVE TO
WO
RK = 8
I HA
VE A CH
ILD O
R I AM PREG
NA
NT(G
IRLS O
NLY) = 9
I MISSED
TOO
MU
CH SCH
OO
L BECAU
SE OF
MY PERIO
D (M
ENSTRU
ATIO
N) (G
IRLS
ON
LY) = 10 O
THER = -96
DO
N’T KN
OW
= -8 REFU
SED = -9
N
N
C
105A
AD
LVLSCH
What is the highest level of school you attended?
PRE-PRIMA
RY = 0
PRIMARY=1
POST- PRIM
ARY TRAININ
G=2
SECON
DA
RY (O-LEV
EL)= 3
DO
N’T KN
OW
= -8
REFUSED
= -9

316
106 A
DCU
RGRD
W
hat grade/form are you in now
?
GRA
DE/FO
RM ____
N
N
C
107 A
DLSTYRG
R
D
What grade/form
were you in last year?
GRA
DE/FO
RM ____
ALLà
AD
HIV
PREV
N
N
C
108 A
DN
OSCH
RE
AS
Why do you N
OT go to school?
(PROBE FO
R THE M
AIN
/MO
ST IMPO
RTAN
T
REASO
N)
I HA
VE BEEN SICK = 1
I DO
N’T FEEL SA
FE TRAVELIN
G TO
SCHO
OL
= 2
I DO
N’T FEEL SA
FE WH
ILE IN SCH
OO
L = 3 I D
ON
’T LIKE SCHO
OL = 4
I HA
VE TO LO
OK A
FTER MY FA
MILY= 5
THERE’S N
OT EN
OU
GH
MO
NEY TO
SEND
ME TO
SCHO
OL = 6
SCHO
OL IS TO
O FA
R AW
AY = 7
I HA
VE TO W
ORK = 8
I HA
VE A CH
ILD O
R I AM PREG
NA
NT(G
IRLS
ON
LY) = 9 I M
ISSED TO
O M
UCH
SCHO
OL BECA
USE O
F
MY PERIO
D (M
ENSTRU
ATIO
N) (G
IRLS O
NLY) = 10
FAILED
NATIO
NA
L EXAM
S=11 CRO
WD
ED CLA
SSROO
MS/H
IGH
STUD
ENT
TEACH
ER RATIO=12
DISA
BILITY=13
OTH
ER (SPECIFY)= -96 D
ON
’T KNO
W = -8
REFUSED
= -9
N
N
C-

317
109 A
DA
TND
SCH H
ave you ever attended school?
YES = 1
NO
= 2 D
ON
’T KNO
W =-8
REFUSED
= -9
NO
, DK,
REFUSED
à
AD
HIVPREV
N
N
C
110 A
DLSTREG
SC
H W
hen was the last tim
e you regularly attended school? W
ould you say it was less than a year
ago or more than a year ago?
LESS THA
N 1 YEA
R = 1 1 YEA
R OR LO
NG
ER = 2
DO
N’T KN
OW
=-8 REFU
SED = -9
N
N
C
111 A
DH
IGRD
W
hat is the highest grade/form that you have
completed?
PRE-PRIMA
RY = 0
PRIMARY=1
POST- PRIM
ARY TRAININ
G=2
SECON
DA
RY (O-LEV
EL)= 3
POST SECO
ND
ARY (O
-LEVEL) TRAININ
G= 4
N
N
C
MO
DU
LE 2: HIV
PREVEN
TION
INTERVEN
TION
S
201 A
DH
RDH
IV
Have you ever heard of H
IV?
YES = 1
NO
= 2 D
ON
’T KNO
W = -8
REFUSED
= -9
IF NO
, DK,
REFUSED
à
AD
YKWCO
N
N
N
C
202 A
DH
RDH
IVL
OC
From w
here have you heard about HIV?
PROBE: A
nywhere else?
RECORD
ALL M
ENTIO
NED
SCHO
OLS/TEA
CHERS = A
PAREN
TS/GU
ARD
IAN
/FAM
ILY = B FRIEN
DS = C
RELIGIO
US LEA
DERS = D
IN
TERNET = E
MO
BILE PHO
NE = F
HEA
LTH
PROV
IDERS/D
OCTO
RS/NU
RSES/CLINICA
L O
FFICERS = G
N
N
S

318
TELEVISIO
N/FILM
= H
RAD
IO = I
COM
MU
NITY H
EALTH
WO
RKERS = J
OTH
ER= X D
ON
’T KNO
W = Y
REFUSED
= Z 203
AD
DISH
IV H
ave you ever discussed HIV
with your parents
or guardian?
YES = 1 N
O = 2
DO
N’T KN
OW
= -8 REFU
SED = -9
N
N
C
204 A
DH
IVPREV H
ave you taken part in any of the following
HIV
prevention programs?
SHO
W CH
ILD LO
GO
FOR EA
CH PRO
GRA
M
SELECT ALL TH
AT APPLY
FAM
ILIES MATTER PRO
GRAM
= A
SISTER TO SISTER = B
YOU
TH FO
R YOU
= C
YOU
TH FO
R REAL = D
PO
SITIVE TA
LK = E
AID
S ACTIO
N CLU
B = F TU
SEME SCH
OO
L CLUB=G
FEMIN
A-H
IP YOU
TH CLU
BS=H
OTH
ER SCHO
OL CLU
BS=I
SHU
GA
RAD
IO LISTEN
ING
CLUB=J
MA
BINTI TU
SHIKE H
ATAM
U=K
MA
LE CHA
MPIO
NS=L
OTH
ER (SPECIFY) = X
DO
N’T KN
OW
= Y REFU
SED = Z
‘DO
N’T KN
OW
’,
‘REFUSED
’ CA
NN
OT BE
SELECTED W
ITH
AN
Y OTH
ER
CATEG
ORY.
N
N
C
205 A
DH
IVSCH
MTG
A
bout how m
any times have you participated
in a school meeting or class period about
HIV
/AID
S in the past 12 months?
NO
NE = 1
1-4 TIMES= 2
5-9 TIMES = 3
10 OR M
ORE TIM
ES = 4 D
ON
’T KNO
W = -8
SKIP IF NEVER
ATTEN
DED
SCH
OO
L
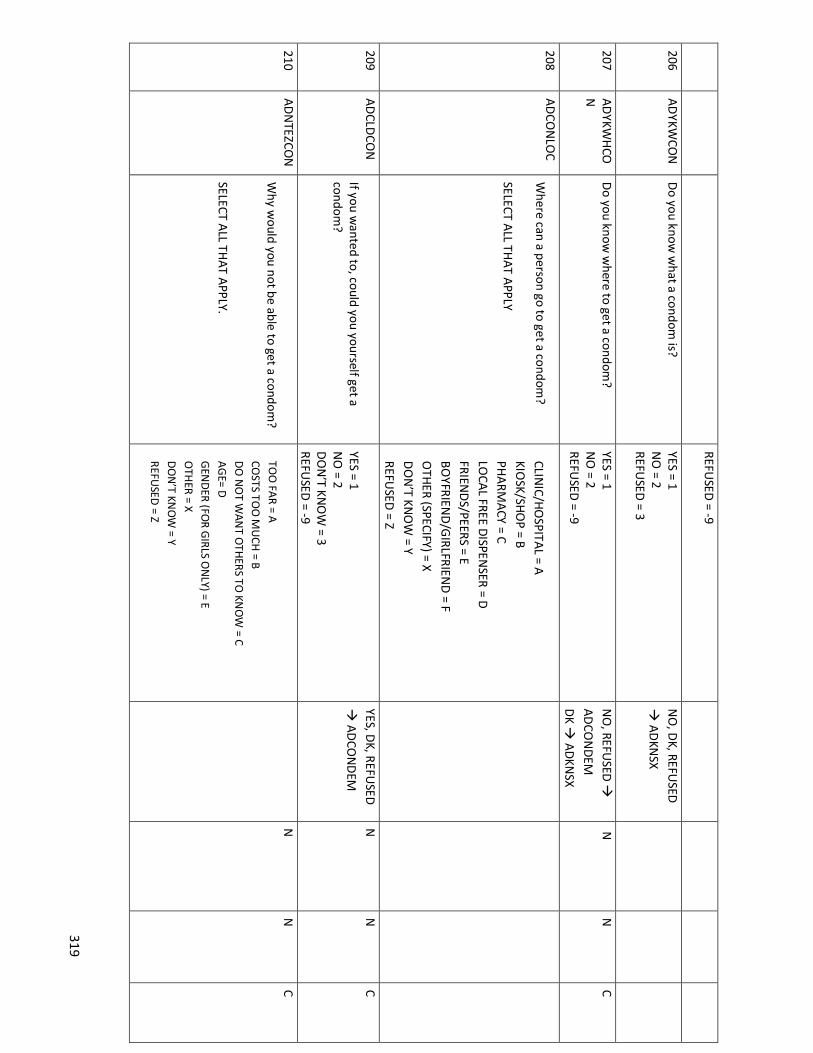
319
REFUSED
= -9
206 A
DYKW
CON
D
o you know w
hat a condom is?
YES = 1 N
O = 2
REFUSED
= 3
NO
, DK, REFU
SED
à A
DKN
SX
207 A
DYKW
HCO
N
Do you know
where to get a condom
? YES = 1 N
O = 2
REFUSED
= -9
NO
, REFUSED
à
AD
CON
DEM
DK à
AD
KNSX
N
N
C
208 A
DCO
NLO
C W
here can a person go to get a condom?
SELECT ALL TH
AT APPLY
CLINIC/H
OSPITA
L = A KIO
SK/SHO
P = B
PHA
RMA
CY = C LO
CAL FREE D
ISPENSER = D
FRIEND
S/PEERS = E BO
YFRIEND
/GIRLFRIEN
D = F
OTH
ER (SPECIFY) = X D
ON
’T KNO
W = Y
REFUSED
= Z
209 A
DCLD
CON
If you w
anted to, could you yourself get a condom
?
YES = 1 N
O = 2
DO
N’T KN
OW
= 3 REFU
SED = -9
YES, DK, REFU
SED
à A
DCO
ND
EM
N
N
C
210 A
DN
TEZCON
W
hy would you not be able to get a condom
? SELECT A
LL THAT A
PPLY.
TOO
FAR = A
COSTS TO
O M
UCH
= B D
O N
OT W
ANT O
THERS TO
KNO
W = C
AG
E= D
GEN
DER (FO
R GIRLS O
NLY) = E
OTH
ER = X
DO
N’T KN
OW
= Y
REFUSED
= Z
N
N
C

320
211 A
DCO
ND
EM
Have you ever seen a m
ale condom
demonstration?
By a condom dem
onstration, I mean som
eone like a nurse, peer educator or other trained adult show
ed you how a m
ale condom is
correctly used.
YES = 1 N
O = 2
DO
N’T KN
OW
= 3 REFU
SED = -9
N
N
S
212 A
DCO
NEXCL
S H
as a teacher ever explained to your class about the proper use of condom
s?
YES = 1 N
O = 2
DO
N’T KN
OW
= -8 REFU
SED = -9
SKIP IF NEVER
ATTEN
DED
SCH
OO
L
The next questions ask about sexual behavior. There is no right or wrong answ
er. Your responses will not be linked to you in any w
ay or shared with anyone, including your
parents. PLEA
SE LOO
K OU
T FOR SIG
NS O
F DISTRESS IN
CHILD
WH
EN A
SKING
THE FO
LLOW
ING
SEXUAL BEH
AV
IOR Q
UESTIO
NS. IF TH
E CHILD
SEEMS D
ISTRESSED, A
SK CHILD
IF HE/SH
E W
AN
TS TO STO
P THE IN
TERVIEW
.
MO
DU
LE 3: SEXUA
L BEHA
VIO
R
301 A
DKN
SX D
o you know w
hat sex is? YES = 1
NO
= 2 D
ON
’T KNO
W = -8
REFUSED
= -9
IF RESPON
SE = NO
,
DK,
REFUSED
àAD
LGH
I
V
N
N
C
302 A
DH
DVG
SX
Have you ever had sex?
YES = 1
NO
= 2 D
ON
’T KNO
W = -8
NO
, DK,
REFUSED
àAD
LGH
IV
N
N
C

321
By sex, we m
ean vaginal sex. With vaginal
sex, we m
ean a penis enters a vagina.
REFUSED
= -9
303 A
DSXA
GE
H
ow old w
ere you when you had sex for
the first time?
A
GE IN
YEARS __ __
D
ON
’T KNO
W = -8
REFUSED
= -9
N
N
C
304 A
DW
HYSX
The first time you had sex, w
as it because you w
anted to or because you were
forced?
WA
NTED
TO = 1
FORCED
= 2 D
ON
’T KNO
W = -8
REFUSED
= -9
WA
NTED
, DK,
REFUSED
à
AD
SXFRSN
N
N
C
305 A
DSXFRC
The first
time
you had
sex, w
ere you
physically forced or were you pressured into
having sex through harassment, threats or
tricks?
PHYSICA
LLY FORCED
= 1 PRESSU
RED = 2
DO
N’T KN
OW
= -8 REFU
SED = -9
ALL à
AD
FPSXAGE
N
N
C
306 A
DSXFRSN
W
hat was the m
ain reason that you had sex for the first tim
e? D
O
NO
T LIST;
PROBE
IF RESPO
ND
ENT
AN
SWERS M
ORE TH
AN
ON
E
IT JUST H
APPEN
ED = 1
MY FRIEN
DS PRESSU
RED M
E TO
HA
VE SEX = 2
TO SH
OW
MY LO
VE/TO FEEL LO
VED = 3
I WA
NTED
TO H
AVE SEX = 4
MY BO
YFRIEND
/GIRLFRIEN
D
WA
NTED
TO H
AVE SEX = 5
FOR M
ON
EY / GIFTS / FA
VOU
RS = 6
I WA
NTED
TO H
AVE A
BABY = 7 O
THER (SPECIFY) = -6
DO
N’T KN
OW
= -8 REFU
SED = -9
N
N
C

322
307 A
DFPSXA
GE
How
old was the person you first had sex
with? Please give your best guess.
PROBE IF N
ECESSARY (A
BOU
T YOU
R AGE,
YOU
NG
ER, OLD
ER?)
AG
E IN YEARS_____
DO
N’T KN
OW
= -8 REFU
SED = -9
N
N
C
308 A
DFSXCO
N
The first time you had sex, w
as a condom
used?
YES = 1 N
O = 2
DO
N’T KN
OW
= -8
REFUSED
= -9
SKIP IF DO
N’T
KNO
W W
HAT
CON
DO
M IS (IN
H
IV PREVEN
TION
MO
DU
LE)
N
N
C
309 A
DD
IFPSX In total, how
many different people have
you had sex with? Please give your best
guess.
N
UM
BER OF PA
RTNERS __ __
DO
N’T KN
OW
= -8
REFUSED
= -9
CON
STRAINT
CAN
NO
T BE ‘0’
N
N
C
310 A
DLTSXCO
N
The last time you had sex w
as a condom
used?
YES = 1 N
O = 2
DO
N’T KN
OW
= -8 REFU
SED = -9
SKIP IF DO
N’T
KNO
W W
HAT
CON
DO
M IS
(FROM
HIV
PREVENTIO
N
MO
DU
LE)
N
N
C
311 A
DO
FTCON
How
often do you use a condom during sex?
A
LWA
YS = 1
SOM
ETIMES = 2
NEVER = 5
DO
N’T REM
EMBER = 6
DO
N’T KN
OW
= -8 REFU
SED = -9
SKIP IF DO
N’T
KNO
W W
HAT
CON
DO
M IS
(FROM
HIV
PREVENTIO
N
MO
DU
LE)
N
N
S

323
312 A
DM
ATSU
P H
ave you ever had sex with som
eone because he/she provided you w
ith, or you expected that he/she w
ould provide you w
ith gifts, help you to pay for thing or help you in other w
ays such as giving you food or paying for school fees?
YES = 1 N
O = 2
DO
N’T KN
OW
= -8 REFU
SED = -9
N
N
C
313 A
DPREG
Have you ever been or are you currently
pregnant? YES = 1 N
O = 2
DO
N’T KN
OW
= -8 REFU
SED = -9
GIRLS O
NLY.; if N
O
à A
DTPSX
N
N
C
313A
AD
PREGO
UT
What
was
the outcom
e of
the last
pregnancy? STILL PREG
NA
NT = 1
LIVE BIRTH =2
MISCA
RRIAG
E = 3
STILLBIRTH = 4
DO
N’T KN
OW
= -8 REFU
SED = -9
CO
UN
T
RY A
DD
ED
314 A
DTPSX
Have
you ever
talked w
ith a
parent or
guardian about sex?
YES = 1
NO
= 2 D
ON
’T KNO
W = -8
REFUSED
= -9
N
N
C
MO
DU
LE 4: SOCIA
L NO
RMS, IN
TENTIO
N TO
ABSTA
IN, SELF-EFFICA
CY AN
D A
SSERTIVEN
ESS
Now
I would like to ask you som
e questions about the future.

324
401 A
DFRH
VSX
Do you think all, m
any, some, a few
or none of your friends are having sex?
ALL = 1
MO
ST = 2 SO
ME = 3
A FEW
= 4 N
ON
E = 5 D
ON
’T KNO
W/D
ON
’T KNO
W W
HAT SEX IS= -
8 REFUSED
= -9
SKIP IF AD
KNSX =
NO
, DKN
, REFUSED
N
N
C
402 A
DPRFSX
Do you feel pressured by your friends to have
sex?
YES = 1 N
O = 2
DO
N’T KN
OW
= -8 REFU
SED = -9
SKIP IF AD
KNSX =
NO
, DKN
, REFUSED
N
N
C
403 A
DN
OSX
If you did not w
ant to have sex with som
eone, could you tell him
/her that you do not want to
have sex with him
/her?
YES = 1 N
O = 2
DO
N’T KN
OW
= -8 REFU
SED = -9
SKIP IF AD
KNSX =
NO
, DKN
, REFUSED
N
N
C
M
OD
ULE 5: H
IV RISK PERCEPTION
501 A
DLG
HIV
How
likely do you think it is for you to get HIV?
VERY LIKELY = 1
SOM
EWH
AT LIKELY = 2 N
OT LIKELY = 3
I ALREA
DY H
AVE H
IV = 4 D
ON
’T KNO
W = -8
REFUSED
= -9
IF NO
T LIKELY, DK,
REFUSED
à
AD
MRN
LHIV
IF I ALREAD
Y HA
VE H
IV à
NEXT
MO
DU
LE SKIP IF A
DH
RDH
IV =N
O, D
K, REFUSED
N
N
P

325

326
MO
DU
LE 6: HIV
KNO
WLED
GE
N
ow I w
ould like to ask you some questions about w
hat you know about som
e things related to HIV.
SKIP TO N
EXT MO
DU
LE IF AD
HRD
HIV = N
O, D
K, REF
601 A
DRED
NO
SX
Can a person reduce their chance of getting
HIV
by not having sex?
YES = 1
NO
= 2 D
ON
’T KNO
W = 3
REFUSED
= -9
N
N
C
602 A
DRED
CON
Can a person reduce their chance of getting
HIV
by using condoms w
hen having sex?
YES = 1
NO
= 2 D
ON
’T KNO
W = 3
REFUSED
= -9
N
N
C
603 A
DLKSH
IV Can a healthy-looking person have H
IV or
AID
S?
YES = 1
NO
= 2 D
ON
’T KNO
W = 3
REFUSED
= -9
N
N
S
604 A
DM
HIV
UBB
Can a mother w
ith HIV
or AIDS pass H
IV to
her unborn baby?
YES = 1
NO
= 2 D
ON
’T KNO
W = 3
REFUSED
= -9
N
N
S

327
605 A
DM
EDLL
Are there m
edicines that people with H
IV or A
IDS can take to help them
live longer?
YES = 1 N
O = 2
DO
N’T KN
OW
= 3 REFU
SED = -9
N
N
C
606 A
DCIRH
IV Can m
ale circumcision help prevent H
IV
infection? Circum
cision is the removal of the foreskin
from a penis.
YES = 1
NO
= 2 D
ON
’T KNO
W = 3
REFUSED
= -9
N
N
C
M
OD
ULE7: H
IV TESTING
I would now
like to ask you some questions about H
IV testing.
SKIP TO N
EXT MO
DU
LE IF AD
HRD
HIV = N
O, D
K, REF
701 A
DEVTEST
To what extent do you agree w
ith the
following statem
ent: Everyone should get tested for H
IV.
Do you strongly agree, agree, disagree, or
strongly disagree?
STRON
GLY AG
REE = 1
AG
REE = 2 D
ISAG
REE = 3
STRON
GLY D
ISAG
REE = 4 D
ON
’T KNO
W = -8
REFUSED
= -9
N
N
S
702 A
DH
IVON
LY To w
hat extent do you agree with the
following statem
ent: Only persons w
ho think they m
ight have HIV
should get an HIV
test.
STRON
GLY AG
REE = 1
AG
REE = 2 D
ISAG
REE = 3
STRON
GLY D
ISAG
REE = 4 D
ON
’T KNO
W = -8
REFUSED
= -9
N
N
S

328
Do you strongly agree, agree, disagree, or
strongly disagree?
703 A
DTSH
IV H
ave you ever been tested for HIV?
YES = 1
NO
= 2 D
ON
’T KNO
W = -8
REFUSED
= -9
IF NO
, DK,
REFUSED
àN
EXT M
OD
ULE
N
N
C
704 A
DRCRSH
IV
Did you receive the results of any of your
HIV
tests?
YES = 1 N
O = 2
DO
N’T KN
OW
= -8 REFU
SED = -9
IF NO
, DK,
REFUSED
àN
EXT
MO
DU
LE
N
N
C
705 A
DRSH
IV W
hat was the result of that H
IV test?
SOM
E PARTICIPAN
TS MAY REPO
RT BEING
TESTED M
ORE TH
AN
ON
CE. IF THEY REPO
RT G
ETTING
A PO
SITIVE RESULT A
ND
AN
OTH
ER
RESULT (I.E. A
PREVIOU
S NEG
ATIVE RESULT),
SELECT POSITIV
E
HIV
POSITIVE = 1
HIV
NEG
ATIVE = 2 U
NKN
OW
N = 3
REFUSED
= -9
IF HIV
NEG
ATIVE, U
NKN
OW
N,
REFUSED
à N
EXT M
OD
ULE
N
N
C
706 A
DH
IVCLM
/ A
DH
IVCLY
What m
onth and year did you last see a health care provider (doctor, clinical officer
or nurse) for HIV m
edical care?
MO
NTH
______ D
ON
’T KNO
W M
ON
TH_______
YEAR_______ D
ON
’T KNO
W YEA
R________
NEVER SEEN
PROVID
ER FOR H
IV CARE
SKIP IF 301=NO
, D
K, REFUSED
CO
UN
TRY
AD
DED
707 A
DA
RVSTA
KEN
EV
Have you ever taken A
RVs, that is, m
edicines
to treat your HIV infection?
YES = 1
NO
= 2 D
ON
’T KNO
W = -8
REFUSED
= -9
IF NO
, DK O
R
REFUSED
, SKIP TO
604B
COU
NT
RY A
DD
ED

329
SKIP IF 201=NO
,
DK, REFU
SED
708 A
DTXH
IV A
re you currently on ARV
s (treatment for
HIV
)?
YES = 1
NO
= 2 D
ON
’T KNO
W = -8
REFUSED
= -9
IF YES, DK,
REFUSED
, SKIP TO
604B
SKIP IF 201=NO
, D
K, REFUSED
N
N
C GO
BA
CK
709 A
DA
RVSN
OT
CURRSN
Can you tell me the m
ain reason why you
are not currently taking ARV
s? STIG
MA
/DO
N’T W
AN
T PEOPLE TO
KNO
W
MY STATU
S =01 H
AV
E SIDE EFFECTS/RA
SH = 02
FACILITY/PH
ARM
ACY TO
O FA
R AW
AY TO
GET M
EDICA
TION
REGU
LARLY = 03
COST O
F MED
ICATIO
NS =04
COST O
F TRAN
SPORT =05
I AM
HEALTH
Y/NO
T SICK = 06 FA
CILITY WA
S OU
T OF STO
CK = 07 RELIG
IOU
S REASO
NS= 08
I AM
TAKIN
G TRA
DITIO
NAL M
EDICATIO
NS =
09 O
THER (SPECIFY) =96
SKIP IF 301=NO
, D
K, REFUSED
COU
NT
RY
AD
DED
710 A
DH
IVDIFF
What one thing do you find m
ost difficult about living w
ith HIV?
I DO
N’T FIN
D IT D
IFFICULT = 1
ILLNESS O
R MED
ICINE SID
E EFFECTS = 2 A
CCESS TO M
EDICA
L/SOCIA
L SERVICES = 3
FINA
NCIA
L COSTS = 4
ARV
AD
HEREN
CE = 5 STIG
MA = 6
DISCLO
SURE IN
GEN
ERAL = 7
FEAR FO
R HEALTH
/FUTU
RE = 8 O
THER = 96
SPECIFY____________________ D
K =88 REFU
SED= 99
SKIP IF 301=NO
,
DK, REFU
SED
COU
NT
RY A
DD
ED

330
MO
DU
LE 9: ALCO
HO
L AN
D D
RUG
S
I would like to ask you som
e questions about alcohol and drugs or substances that you may have taken that w
ere not given to you by doctor. Your answers w
ill not be told to anyone, even your parents.
901 A
DH
DA
LC
Have you ever drunk alcohol?
YES = 1 N
O = 2
DO
N’T KN
OW
= -8 REFU
SED = -9
IF NO
, DK,
REFUSED
à
AD
TRDRG
SHO
W G
RAPH
IC OF
COM
MO
N
ALCO
HO
LIC
BEVERAGES.
N
N
S
902 A
DM
NO
ND
RK D
uring the past 1 month, on how
many
days did you have at least one drink containing alcohol?
NU
MBER O
F DAYS ____
DO
N’T KN
OW
= -8 REFU
SED = -9
MA
X = 31
N
N
C
903 A
DTRD
RG
Have you ever tried drugs such as D
RUG
A,
DRU
G B, D
RUG
C, or others?
YES = 1 N
O = 2
DO
N’T KN
OW
= -8 REFU
SED = -9
IF NO
, DK,
REFUSED
à
AD
SHFD
HIV
AD
APT Q
UESTIO
N
TO LO
CAL
CON
TEXT.
N
N
S

331
904 A
DD
RUG
S It’s possible that som
e people in our com
munities use drugs.
What drugs have you ever tried?
DO
NO
T READ
RESPON
SES. PRO
BE FOR M
ULTIPLE RESPO
NSES.
NO
NE = A
MIRA
A = B BH
AN
G = C
GLU
E = D
KUBER = E
MA
ND
RAZ = F CO
CAIN
E = G
HERO
IN = H
O
THER (SPECIFY) = X
DO
N’T KN
OW
= Y REFU
SED = Z
.
N
N
S
Module 10: PA
RENTAL SU
PPORT
1001 A
DPA
RFRTM
Do your parents/guardians really know
w
hat you were doing w
ith your free time
when you w
ere not at school or work?
ALW
AYS = 1
MO
ST OF TH
E TIME = 2
SOM
ETIMES = 3
RARELY = 4
NEVER = 5
DO
N’T KN
OW
= -8 REFU
SED = -9
N
N
S
1002 A
DO
BTNW
OP
AR
Do you som
etimes have to obtain som
e item
s without getting any m
oney from
your parents or caregivers:- REA
D A
LL RESPON
SES
CLOTH
ING
= A SH
OES = B
SOA
P AN
D O
R BOD
Y OIL = C
HO
USEH
OLD
SUPPLIES = D
SCH
OO
L SUPPLIES = E
TRAN
SPORTATIO
N TO
SCHO
OL = F
MEA
LS AW
AY FRO
M H
OM
E = G
NO
NE = H
O
THER (SPECIFY) = X
DO
N’T KN
OW
= Y REFU
SED = Z

332
MO
DU
LE 11: VIO
LENCE
Now
I would like to ask you questions about som
e other important aspects of a person’s life. I know
that some of these questions are very personal. H
owever, your answ
ers are
important for helping to understand the condition of children in [Tanzania]. Let m
e assure you that your answers are com
pletely confidential and will not be told to anyone.
1101 A
DA
TTCK H
as anyone ever done any of these things to
you:
- Punched, kicked, w
hipped, or beat you w
ith an object -
Choked, smothered, tried to drow
n
you, or burned you intentionally -
Used or threatened you w
ith a
knife, gun or other weapon?
YES = 1
NO
= 2 D
ON
’T KNO
W = -8
REFUSED
= -9
N
N
C
1102
AD
TCHW
OPM
H
as anyone ever touched you in a sexual
way w
ithout your permission, but did not try
and force you to have sex?
Touching in a sexual way w
ithout permission
includes fondling, pinching, grabbing, or
touching you on or around your sexual body parts.
YES = 1
NO
= 2 D
ON
’T KNO
W = -8
REFUSED
= -9
IF NO
, DK,
REFUSED
à
AD
SXNTSCC
N
N
C

333
1103 A
DFTREL
The first time this sexual touching
happened, what w
as your relationship to the person w
ho did this? If it was m
ore than one person, w
hat was your relationship w
ith the person you knew
the best?
BOYFRIEN
D/G
IRLFRIEND
/SPOU
SE = 1 RELA
TIVE/FAM
ILY MEM
BER = 2
CLASSM
ATE/SCH
OO
LMA
TE = 3 TEA
CHER = 4
POLICE/SECU
RITY OFFICER/M
ILITARY= 5
EMPLO
YER = 6
NEIG
HBO
R = 7 CO
MM
UN
ITY
RELIGIO
US LEA
DER = 8
FRIEND
= 9
STRAN
GER = 10
OTH
ER = 96
DO
N’T KN
OW
= -8 REFU
SED = -9
N
N
C
1104 A
DSXN
TSCC H
as anyone ever tried to make you have sex
against your will but did not succeed?
YES = 1
NO
= 2 D
ON
’T KNO
W = -8
REFUSED
= -9
N
N
S
1105 A
DPRSXSCC
Has anyone ever pressured you to have sex,
through harassment, threats or tricks and did
succeed?
YES = 1 N
O = 2
DO
N’T KN
OW
= -8 REFU
SED = -9
N
N
C
1106 A
DFRCSCC
Has anyone ever physically forced you to
have sex and did succeed?
YES = 1
NO
= 2 D
ON
’T KNO
W = -8
REFUSED
= -9
N
N
C

334
1107 A
DFRCREL
The first time you w
ere pressured or forced to have sex, w
hat was your relationship to
the person who did this?
BOYFRIEN
D/G
IRLFRIEND
/SPOU
SE = 1 RELA
TIVE/FAM
ILY MEM
BER = 2
CLASSM
ATE/SCH
OO
LMA
TE = 3 TEA
CHER = 4
POLICE/SECU
RITY OFFICER/M
ILITARY= 5
EMPLO
YER = 6
NEIG
HBO
R = 7 CO
MM
UN
ITY
RELIGIO
US LEA
DER = 8
FRIEND
= 9 STRA
NG
ER = 10
OTH
ER (SPECIFY) = 96 D
ON
’T KNO
W = -8
REFUSED
= -9
SKIP IF A
DPRSXSCC IS
NO
, DK, REFU
SED
AN
D A
DFRCSCC IS
NO
, DK, REFU
SED
N
N
S
1108 A
DPRO
SVC
After any of these unw
anted sexual
experiences, did you try to seek professional help or services from
any of the following?
READ
RESPON
SES ALO
UD
SELECT A
LL THAT A
PPLY.
HEA
LTHCA
RE PROFESSIO
NA
L = A
POLICE O
R OTH
ER SECURITY PERSO
NN
EL = B SO
CIAL W
ORKER, CO
UN
SELOR O
R NG
O = C
RELIGIO
US LEA
DER = D
I D
ID N
OT TRY TO
SEEK HELP = E
OTH
ER (SPECIFY) = X D
ON
’T KNO
W = Y
REFUSED
= Z
ALL BU
T I DID
N
OT TRY TO
SEEK
HELPà
ADSXTELL
SKIP IF
AD
TCHW
OPM
= N
O, D
K, REFUSED
& A
DSXN
TSCC = N
O, D
K, REFUSED
& A
DPRSXSCC =
NO
, DK, REFU
SED,
& A
DFRCSCC =
NO
, DK, REFU
SED
N
N
C

335
1109 A
DRSPRSV
C W
hat was the m
ain reason that you did not try to seek professional help or services?
DID
NO
T KNO
W SERVICES W
ERE AV
AILABLE
= 1
SERVICES NO
T AVA
ILABLE = 2
AFRA
ID O
F GETTIN
G IN
TROU
BLE = 3
ASH
AM
ED FO
R SELF/FAM
ILY = 4 CO
ULD
NO
T AFFO
RD SERVICES = 5
DID
NO
T THIN
K IT WA
S A PRO
BLEM = 6
FELT IT WA
S MY FA
ULT = 7
AFRA
ID O
F BEING
ABA
ND
ON
ED = 8
DID
NO
T NEED
/WA
NT SERV
ICES = 9 A
GE = 10
GEN
DER = 11
OTH
ER = 96
DO
N’T KN
OW
= -8 REFU
SED = -9
N
N
C
1110 A
DSXTELL
After any of these unw
anted sexual experiences, did you tell anyone about it?
YES = 1 N
O = 2
DO
N’T KN
OW
= -8 REFU
SED = -9
NO
, DK, REFU
SED
àEN
D
N
N
C
1111 A
DSXD
ISC W
hom did you tell about any of these
unwanted sexual experiences
READ
RESPON
SES ALO
UD
SELECT A
LL THAT A
PPLY
PAREN
T/GU
ARD
IAN
= A
SIBLING
= B TEA
CHER= C
FRIEND
/CLASSM
ATE = D
OTH
ER FAM
ILY MEM
BER = E
RELIGIO
US LEA
DER = F
PROFESSIO
NA
L SERVICE PRO
VID
ERS=G
OTH
ER (SPECIFY) = X D
ON
’T KNO
W = Y
REFUSED
= Z
S

336
1113 A
DREFERRA
L Thank you for sharing your personal experiences w
ith me. I know
it may have been difficult for you
to talk about your experiences with m
e. If you w
ould like to talk further about these experiences, I can refer you to a place that can provide you w
ith help. PRO
VIDE PA
RTICIPANT W
ITH LIST O
F
ORG
ANIZA
TION
S.
SKIP IF N
EVER EXPERIEN
CED
SEXUA
L OR
PHYSICA
L V
IOLEN
CE.
COM
MEN
TS FROM
INTERV
IEWER:
_______________________________________________________________________________________________________________________________________________________________________________________________________________________________________________________________________________________________________________________________________________________________

337
Interviewer reads: What language do you prefer for our discussion today? ___English ___Kiswahili Hello. My name is___________. I would like to invite you to take part in this research study/survey about HIV in Tanzania. The Tanzania and Zanzibar AIDS Commissions, the National Bureau of Statistics, and the Office of the Chief Government Statistician are leading this survey in collaboration with the United States Centers for Disease Control and Prevention and ICAP at Columbia University. What is the purpose of this survey? HIV is the virus that causes AIDS. AIDS is a very serious illness. This survey will help us know how many people in Tanzania have HIV and need health services. We expect about 40,000 men, women, and children from 15,000 households throughout Tanzania to join this survey. If you join, your taking part will help the Ministry of Health Zanzibar/Ministry of Health, Community Development, Gender, Elderly and Children (MOHCGEC)/make HIV services better in the country.
What do you have to do if you agree to take part? There are three parts to this survey. The household interview, the individual interviews and blood testing. We would like to ask you some questions about the people staying in your household and about some of the things you have. The household interview will take up to 30 minutes.
After the household interview, we will invite you and others staying in your household to take part in individual interviews and then offer testing for HIV, syphilis, hepatitis B and hepatitis C to some individuals.
What are the potential risks? You may feel uncomfortable about some of the questions I will ask. You can refuse to answer any question. You may stop the interview at any time.
As with all surveys, there is a chance that confidentiality could be compromised. We are doing everything we can to minimize this risk.
What are the potential benefits? There may be no direct benefit to you but the information you provide to us will be used to improve the health of Tanzanians. Your responses will help the Ministry of Health to develop more effective programs to fight HIV.
APPENDIX H: CONSENT FORMS

338
What are the alternatives to taking part? You can decide not to not take part in this survey, your taking part in this household interview is entirely voluntary. Your decision to take part or not take part will not affect your health care. What about confidentiality? All information you give us will be kept strictly confidential, even from you family. The consent forms with your name will be kept separate from the answers you give in this interview. Your name will not appear when we share survey results. Your answers to the questions will be identified only by a number. (INTERVIEWER INDICATE INFORMATION BELOW ON CONSENT FORM, DO NOT READ ALOUD) The following individuals and agencies will be able to look at your interview records to help oversee the conduct of this survey:
§ Staff members from the Institutional Review Boards or Ethics Committees overseeing the conduct of this survey to ensure that we are protecting your rights as a participant. These include the National Insititute for Medical Research (NIMR) and the Zanzibar Medical Ethics Council (ZAMEC) in Tanzania and the Institutional Review Boards at the Centers for Disease Control and Prevention (CDC; Atlanta, USA), Columbia University Medical Center, and Westat (a statistical survey research organization)
§ The U.S. Office of Human Research Protections and other government agencies that oversee the safety of human subjects to ensure we are protecting your rights as a person in this survey
§ Survey staff and monitors (INTERVIEWER READ FROM HERE)
The information we collect from you will not be released outside of the groups listed above unless there is an issue of safety. Your permission to allow us to use and share your information with the groups above will expire three years after the end of the survey.
Who should you contact if you have questions? If you want to leave the survey, have any questions about the survey, or feel that you have been harmed by taking part, you should contact any of the Principal Investigators listed below:, or
(INTERVIEWER INDICATE ADDRESSES ON CONSENT FORM, DO NOT READ ALOUD) Dr. Albina Chuwa National Bureau of Statistics, 18 Kivukoni Road, Dar Es Salaam P.O Box 796, 11992 Dar es Salaam, Tanzania. Tel: +255 (0) 22-2122722/3 Email: [email protected] Mr Emilian Karugendo National Bureau of Statistics, 18 Kivukoni Road, Dar Es Salaam P.O Box 796, 11992 Dar es Salaam, Tanzania. Tel: +255 (0) 22-2122722/3 [email protected]; or

339
Mayasa Mahfoudh Mwinyi Office of the Chief Government Statistician P.O Box 2321, Zanzibar. Telephone number: +255 242231869 Email: [email protected] If you decide to leave the study, no more information will be collected from you. We will make every effort to delete the information we have collected from you. However, after today, we cannot guarantee we will be able to delete information that has already been shared. If you have any questions about your rights as a person in this survey, you can contact either of the following persons:
Dr Mwele Malechela The Director General National Institute for Medical Research (NIMR) 3 Barack Obama Drive P. O. Box 9653, Dar es Salaam, Tanzania Tel: +255-22-2121400 Fax: +255-22-2121360 Email: [email protected] | [email protected]
Dr Msafiri L Marijani Zanzibar Medical Research and Ethics Committee (ZAMREC) Ministry of Health, Mnazi Mmoja Hospital, Michenzani - Zanzibar P.O.BOX 672. Zanzibar Email: [email protected] Telephone number: +25 577 6663303
(INTERVIEWER READ FROM HERE)
Are there any costs?
There is no cost to you for answering the questions in the household interview other than your time. You should also know that you will not be paid to answer these questions.
Do you want to ask me anything about the survey?
Verbal Consent Statement
I have read this form and/orsomeone has read it to me. Any questions that I had have been answered
satisfactorily. I agree to take part in the household interview. I know that after choosing to be in the
interview, I may withdraw at any time. My taking part is voluntary. I have been offered a copy of this
consent form.
If you agree to take part in the household interview, please state the following statement:

340
”I agree to take part in the household interview” ____Check this box if participant agrees to participate in the household interview
If you do not agree to take part in the household interview, please state the following statement: ”I do not wish to take part in the household interview” ____Check this box if participant refuses to participate in the household interview
Printed name of head of household_________________________________
Signature of person obtaining consent________________________________ Date: ___/___/___
Printed name of person obtaining consent_____________________________
Survey staff ID number _________________________________

341
Consent/Permission from Parent/Guardian for blood draw for children ages 0-9years
Interviewer reads:
What language do you prefer for our discussion today?
___English ___Kiswahili
Hello. My name is_________________. We are doing a research study/survey throughout Tanzania to learn more about HIV in the country. The Tanzania and Zanzibar AIDS Commissions, the National Bureau of Statistics and the Office of the Chief Government Statistician are leading this survey in collaboration with the United States Centers for Disease Control and Prevention (CDC) and ICAP at Columbia University.
[IF PARTICIPANT HAS BEEN THROUGH HOUSEHOLD CONSENT ]
What do you have to do if you agree to take part? If you agree to join this survey, we will ask you questions about your age, your marriage and sexual behavior, any behavior that puts you at greater risk of HIV infection, your knowledge about HIV, if you ever had an HIV test, whether you know your HIV status and if you have any experience with HIV prevention and treatment services. This interview will take about 50 minutes. After the interview, I will offer you blood tests for HIV and syphilis. We will give you a separate opportunity to agree to the blood testing. You can agree to the interview, but not agree to the blood testing. Lastly, it is possible that you may be eligible to take part in future studies related to the health of Tanzanians. At the end of this form, I will ask for permission to contact you in the next two years if such an opportunity occurs. What are the potential risks? The risks to taking part in the interview are small. You may feel uncomfortable about some of the questions I will ask. You can refuse to answer any question. As with all surveys, there is a chance that confidentiality could be compromised. We are doing everything we can to minimize this risk.
What are the potential benefits? There may be no direct benefit to you but your taking part in this survey could help us learn more about HIV in Tanzania. It can also help us learn about how well HIV prevention and treatment programs are working. What are alternatives to taking part? You can decide not to take part in this interview. Your decision to take part or not take part will not affect your healthcare.

342
à GO TO CONSENT STATEMENT
[IF PARTICIPANT HAS NOT BEEN THROUGH HOUSEHOLD CONSENT] Why are we doing this survey? HIV is the virus that causes AIDS. AIDS is a very serious illness. This survey will help us know how many people in Tanzania have HIV and need health services. We expect about 40,000 men, women, and children from 15,000 households throughout Tanzania to join this survey. If you join, your taking part will help the Ministry of Health Zanzibar/Ministry of Health, Community Development, Gender, Elderly and Children (MOHCGEC)/make HIV services better in the country.
What do you have to do if you agree to take part? If you agree to join this survey, we will ask you questions about your age, if you had any experience with HIV services, and your sexual behaviors. This interview will take about 50 minutes. After the interview, I will offer you blood tests for HIV and syphilis. We will give you a separate opportunity to agree to the blood testing. You can agree to the interview, but not agree to the blood testing. Lastly, it is possible that you may be eligible to take part in future studies related to the health of Tanzanians. At the end of this form, I will ask for permission to contact you in the next two years, if such an opportunity occurs. What are the potential risks? The risks to taking part in the interview are small. You may feel uncomfortable about some of the questions I will ask. You can refuse to answer any question.
As with all surveys, there is a chance that confidentiality could be compromised. We are doing everything we can to minimize this risk.
What are the potential benefits? There may be no direct benefit to you but your taking part in this survey could help us learn more about HIV in Tanzania. It can also help us learn about how well HIV prevention and treatment programs are working. What are alternatives to taking part? You can decide not to take part in this interview. Your decision to take part or not take part will not affect your healthcare. What about confidentiality? All the information you give us will be kept strictly confidential, even from you family and will not be shown outside of the survey team. The consent forms with your name will be kept separate from the answers you give in this interview. Your name will not appear when we share survey results. Your answers to the questions will be identified only by a number.

343
(INTERVIEWER INDICATE INFORMATION BELOW ON CONSENT FORM, DO NOT READ ALOUD) The following individuals and agencies will be able to look at your interview record to help oversee the conduct of this survey:
§ Staff members from the Institutional Review Boards or Ethics Committees overseeing the conduct of this survey to ensure that we are protecting your rights as a participant. These include the National Institute of Medical Research (NIMR) and Zanzibar Medical EthicsCouncil (ZMEC), and the Institutional Review Boards at the Centers for Disease Control and Prevention (CDC; Atlanta, USA), Columbia University Medical Center and Westat (a statistical survey research organization)
§ The U.S. Office of Human Research Protections and other government agencies that oversee the safety of human subjectsto ensure we are protecting your rights as a participant in this survey
§ Survey staff and monitors (INTERVIEWER READ FROM HERE)
The information we collect from you will not be released outside of the groups listed above unless there is an issue of safety. Your permission to allow us to use and share your information with the groups above will expire three years after the end of the survey.
Who should you contact if you have questions? If you want to leave the survey, have any questions about the survey, or feel that you have been harmed by taking part, you should contact any of the Principal Investigators listed below: , or
(INTERVIEWER INDICATE ADDRESSES ON CONSENT FORM, DO NOT READ ALOUD) Dr. Albina Chuwa National Bureau of Statistics, 18 Kivukoni Road, Dar Es Salaam P.O Box 796, 11992 Dar es Salaam, Tanzania. Tel: +255 (0) 22-2122722/3 Email: [email protected] Mr Emilian Karugendo National Bureau of Statistics, 18 Kivukoni Road, Dar Es Salaam P.O Box 796, 11992 Dar es Salaam, Tanzania. Tel: +255 (0) 22-2122722/3 [email protected]; Mayasa Mahfoudh Mwinyi Office of the Chief Government Statistician P.O Box 2321, Zanzibar. Telephone number: +255 242231869 Email: [email protected] If you decide to leave the study, no more information will be collected from you. We will make every effort to delete the information we have collected from you. However, after today, we cannot guarantee we will be able to delete information that has already been shared.

344
If you have any questions about your rights as a person in this survey, you can contact either of the following persons:
Dr Mwele Malechela The Director General National Institute for Medical Research (NIMR) 3 Barack Obama Drive P. O. Box 9653, Dar es Salaam, Tanzania Tel: +255-22-2121400 Fax: +255-22-2121360 Email: [email protected] | [email protected]
Dr Msafiri L Marijani Zanzibar Medical Research and Ethics Committee (ZAMREC) Ministry of Health, Mnazi Mmoja Hospital, Michenzani - Zanzibar P.O.BOX 672. Zanzibar Email: [email protected] Telephone number: +25 577 6663303
(INTERVIEWER READ FROM HERE)
Are there any costs? There is no cost to you for answering the questions in the interview except for your time. You should also know that you will not be paid to answer these questions.
Do you want to ask me anything about the survey? Verbal Consent Statement
I have read this form, and/or someone has read it to me. Any questions that I had were answered satisfactorily. I agree to take part in the individual interview. I know that after choosing to be in the individual interview, I may withdraw at any time. My taking part is voluntary. I have been offered a copy of this consent form.
1. If you agree to take part in the individual interview, please state the following statement: ”I agree to take part in the individual interview” ____Check this box if participant agrees to participate in the individual interview
If you do not agree to take part in the individual interview, please state the following statement: ”I do not wish to take part in the individual interview” ____Check this box if participant refuses to participate in the individual interview
2. FUTURE RESEARCH: It is possible that you may be eligible to take part in future studies related to health
in Tanzania. We are asking for your permission to contact you in the next two years if such an opportunity

345
occurs. If we contact you, we will give you details about the new study and ask you to sign a separate
consent form at that time. You may decide at that time that you do not want to take part in that study.
If you do not wish to be contacted about future studies, it does not affect your involvement in this
study.
If you agree to be contacted about future studies, please state the following statement
”I agree to be contacted for future studies”
____Check this box if participant agrees to be contacted for future studies
If you do not agree to be contacted about future studies, please state the following statement
”I do not wish to be contacted for future studies” ____Check this box if participant refuses to be contacted for future studies
Printed name of participant________________________________________
Participant ID number ____________________________________________
Signature of person obtaining consent________________________________ Date: ___/___/___
Printed name of person obtaining consent_____________________________
Survey staff ID number _________________________________

346
Interviewer reads: What language do you prefer for our discussion today? ___English ___Swahili Now I would like to ask you to let your child take part in the research study/survey. Your child’s taking part will help the Ministry of Health, Community Development, Gender, Elderly and Children (MOHCGEC)/Ministry of Health make HIV services better in Tanzania. The Tanzania and Zanzibar AIDS Commissions, the National Bureau of Statistics, and the Office of the Chief Government Statistician are leading this survey in collaboration with the United States Centers for Disease Control and Prevention and ICAP at Columbia University. [IF PARENT/GUARDIAN HAS BEEN THROUGH CONSENT PROCESS FOR INTERVIEW/BLOOD DRAW] What will happen to your child if you agree to allow your child to take part?
If you and your child agree, the following will happen, as described in your own consent:
• [IF CHILD IS <2 YEARS OLD] A trained nurse will take a few drops of blood (about 1 mL) from your child’s finger or heel to perform an HIV test here in your home.
• [IF CHILD IS 2-9 YEARS OLD] We will take about 6 mL (about one teaspoonful) of blood from your child’s arm. If it is not possible to take blood from your child’s arm, we will take a few drops of blood from your child’s finger or heel.
• We will give you the results of these blood tests today. We will not share the results with your child unless you ask us to do so.
• If your child tests positive for HIV o we will also test the amount of CD4 cells in his/her blood and give you the result today. o His/her blood will be sent to a laboratory to measure his/her viral load and the results will be
returned the health facility of your choice in about 10 weeks. o We will give you a referral form so that you and your child can consult with a doctor or nurse to
learn more about his/her HIV test, CD4 count, and overall health. o We may also do other additional tests related to HIV. If we have test results that might guide your
child’s care or treatment and you provide us with your contact information, we will contact you to tell you how you and your child’s doctor or nurse may get these results.
• We will ask for your permission to store your child’s leftover blood for future research tests. This sample will be stored for an indefinite amount of time but your child’s name will be on the sample for only three years. During this three year period we will attempt to tell you about any test results that are important for your child’s health. If you do not agree to future research tests to your child’s blood samples, we will destroy your child’s blood samples after survey-related testing has been completed.
347
[For children aged 0-<18 months only] The body makes antibodies to fight HIV. Antibodies from a mother with HIV can enter the baby’s blood during pregnancy. The test we perform on your child today will let us know if your child has been exposed to HIV. If it is positive, it does not mean your child has the virus in his/her blood. It just confirms that he/she has been exposed to HIV. We will need to send your child’s blood to a lab for a special test to confirm if he/she has HIV. We will send the result to the health facility of your choice in about ten weeks from now. If you provide us with your contact information, we will contact you to inform you that the results have been sent to the facility and encourage you to go to the health facility to discuss your child’s HIV test results with a doctor or nurse. What are the potential risks? The needle stick may be uncomfortable for your child, and may include bleeding and rarely, infection where the needle enters the skin. Experienced staff will do the tests under safe and clean conditions in order to protect your child against any risk. You and your child may learn that your child is infected with HIV. Learning about your child’s HIV infection may cause some emotional discomfort. We will provide counseling on how to cope with learning that your child has HIV and tell you where you may go for your child’s care and treatment. As with all surveys, there is a chance that confidentiality could be compromised. We are doing everything we can to minimize this risk. What are the potential benefits? The main benefit for your child to be in the survey is the chance to learn more about his/her health today. If your child has HIV, you will learn where to take your child for treatment. If you already know that your child is HIV positive and he/she is on treatment, the CD4 and viral load tests can help your child’s doctor or nurse judge how well the treatment is working. Your child taking part in this survey could help us learn more about children, HIV in Tanzania and how well HIV prevention and treatment programs are working. What are alternatives to taking part? Your child may stop participation at any time. This will not affect your child’s healthcare in any way. What about confidentiality?
Your child’s test results will be kept strictly confidential. Your child’s name and the consent forms will be kept separate from his/her health information. Your name and your child’s name will not appear when we share survey results. The information we collect from your child will be identified by a number and not by your name or your child’s name. à GO TO PERMISSION STATEMENT

348
[IF PARENT/GUARDIAN HAS NOT BEEN THROUGH CONSENT PROCESS FOR BLOOD DRAW READ THE FOLLOWING]
What is the purpose of the survey? HIV is the virus that causes AIDS. AIDS is a very serious illness. This survey will help us know how many people in Tanzania have HIV and need health services. This survey will help us learn more about HIV, AIDS and the health of children in Tanzania. We expect about 40,000 men, women, and children from 15,000 households throughout Tanzania to join this survey. If you join, your taking part will help the Ministry of Health Zanzibar/Ministry of Health, Community Development, Gender, Elderly and Children (MOHCGEC)/make HIV services better in the country. What will happen to your child if you agree to allow your child to take part?
If you agree to allow your child to take part in the survey, and he/she is less than 2 years, a trained nurse will take a few drops of blood (about 1 mL) from your child’s finger or heel to perform an HIV test here in your home and give you the results today. If your child is 2 to 9 years of age, we will take about 6 mL (one teaspoonful) of blood from your child’s arm. If it is not possible to take blood from your child’s arm, then we will try to take a few drops of blood from your child’s finger or heel. We will provide counseling about the results today and discuss with you how to share the test results with your child if you decide to share them with him/her. If you would like, we can discuss the test results together with your child. The entire testing and counseling session will take about 40 minutes. If your child tests positive for HIV, we will also test the amount of CD4 cells in his/her blood and give you the result today. CD4 cells are the part of the immune system that fight HIV infection and other diseases. We will also test the amount of CD4 cells in some children without HIV. We will give you a referral form and information on today’s test results so that you and your child can consult with a doctor or nurse to learn more about his/her HIV test, CD4 count, and overall health. In addition, if your child tests positive for HIV, we will send his/her blood to a laboratory to measure his/her viral load. Viral load is the amount of HIV in the blood. Your child’s viral load test results will be ready in about ten weeks from now. If you provide us with your contact information, we will contact you to let you know the results are ready and encourage you to go to your health facility of choice to discuss your child’s viral load results with a doctor or nurse. We may also do other additional tests related to HIV. If we have test results that might guide your child’s care or treatment and you provide us with contact information, we will contact you to tell you how you and your child’s doctor or nurse may get these results. [For children aged 0-<18 months only] The body makes antibodies to fight HIV. Antibodies from a mother with HIV can enter the baby’s blood during pregnancy. The test we perform on your child today will let us know if your child has been exposed to HIV. If it is positive, it does not mean your child has the virus in his/her blood. It just confirms that he/she has been exposed to HIV. We will need to send your child’s blood to a lab for a special test to confirm if he/she has HIV. We will send

349
the result to the health facility of your choice in about ten weeks from now. If you provide us with your contact information, we will contact you to inform you that the results have been sent to the facility and encourage you to go to the health facility to discuss your child’s HIV test results with a doctor or nurse. What will happen to your child’s leftover blood? We would like to ask your permission to store your child’s leftover blood for future research tests. These tests may be for HIV or other health issues which are important to the health of Tanzanians, such as nutrition or immunization. This sample will be stored for an indefinite amount of time but your child’s name will be on the sample for only three years. During this three year period we will attempt to tell you about any test results that are important for your child’s health. Your child’s leftover blood will not be sold or used for commercial reasons. If you do not agree to future research tests to your child’s blood samples, we will destroy your child’s blood samples after survey-related testing has been completed. What are the potential risks? The needle stick may be uncomfortable for your child, and may include bleeding and rarely, infection where the needle enters the skin. Experienced staff will do the tests under safe and clean conditions in order to protect your child against any risk. You and your child may learn that your child is infected with HIV. Learning about your child’s HIV infection may cause some emotional discomfort. We will provide counseling on how to cope with learning that your child has HIV and tell you where you may go for your child’s care and treatment. As with all surveys, there is a chance that confidentiality could be compromised. We are doing everything we can to minimize this risk. What are the potential benefits? The main benefit for your child to be in the survey is the chance to learn more about his/her health today. Some children who take part will test positive for HIV. If this happens to your child, the benefit is that you will learn his/her HIV status and will learn where to take your child for life-saving treatment. Care and treatment provided by the Ministry of Health is free. If you already know that your child is HIV positive and he/she is on treatment, the CD4 and viral load tests can help your child’s doctor or nurse judge how well the treatment is working. Your child taking part in this survey could help us learn more about children and HIV in Tanzania and how well HIV prevention and treatment programs are working. What are alternatives to taking part? You can decide to allow or not allow your child to take part in this survey. Or you can decide to allow your child to get his or her blood tested for HIV, but not agree to have his or her blood stored for future testing. Your decision to allow your child to take part or not take part in this survey will not affect your child’s health care in any way. What about confidentiality? Your child’s test results will be kept strictly confidential. Your child’s name and the consent forms will be kept separate from his/her health information. Your name and your child’s name will not appear when we share survey results. The information we collect from your child will be identified by a number and not by your name or your child’s name. (INTERVIEWER INDICATE INFORMATION BELOW ON CONSENT FORM, DO NOT READ ALOUD)

350
The following individuals and agencies will be able to look at your child’s survey records to help oversee the conduct of this survey:
§ Staff members from the Institutional Review Boards or Ethics Committees overseeing the conduct of this survey to ensure that we are protecting your child’s rights as a participant. These include the National Institute for Medical Research (NIMR) and the Zanzibar Medical Ethics Council (ZAMEC) in Tanzania and the Institutional Review Boards at the Centers for Disease Control and Prevention (CDC; Atlanta, USA), Columbia University Medical Center, and Westat (a statistical survey research organization)
§ The U.S. Office of Human Research Protections and other government agencies that oversee the safety of human subjects to ensure we are protecting your child’s rights as a participant in this survey
§ Survey staff and monitors
(INTERVIEWER READ FROM HERE)
The information we collect from your child will not be released outside of the survey groups listed above unless there is an issue of safety. Your permission to allow us to use and share your child’s name and contact information with the groups above will end three years after the end of the survey. Who should you contact if you have questions? If you want to leave the survey, have any questions about the survey, or feel that you have been harmed by taking part, you should contact any of the Principal Investigators listed below: (INTERVIEWER INDICATE ADDRESSES ON CONSENT FORM, DO NOT READ ALOUD) Dr. Albina Chuwa National Bureau of Statistics, 18 Kivukoni Road, Dar Es Salaam P.O Box 796, 11992 Dar es Salaam, Tanzania. Tel: +255 (0) 22-2122722/3 Email: [email protected] Mr. Emilian Karugendo National Bureau of Statistics, 18 Kivukoni Road, Dar Es Salaam P.O Box 796, 11992 Dar es Salaam, Tanzania. Tel: +255 (0) 22-2122722/3 [email protected]; or Mayasa Mahfoudh Mwinyi Office of the Chief Government Statistician P.O Box 2321, Zanzibar. Telephone number: +255 242231869 Email: [email protected] If you decide to leave the study, no more information will be collected from you. We will make every effort to delete the information we have collected from you. However, after today, we cannot guarantee we will be able to delete information that has already been shared.

351
If you have any questions about your rights as a person in this survey, you can contact either of the following persons:
Dr Mwele Malechela The Director General National Institute for Medical Research (NIMR) 3 Barack Obama Drive P. O. Box 9653, Dar es Salaam, Tanzania Tel: +255-22-2121400 Fax: +255-22-2121360 Email: [email protected] | [email protected]
Dr Msafiri L Marijani Zanzibar Medical Research and Ethics Committee (ZAMREC) Ministry of Health, Mnazi Mmoja Hospital, Michenzani - Zanzibar P.O.BOX 672. Zanzibar Email: [email protected] Telephone number: +25 577 6663303
(INTERVIEWER READ FROM HERE)
Are there any costs? There is no cost to you for your child being in the survey except for your time. You should also know that neither you nor your child will be paid for your child to be in the survey.
Do you want to ask me anything about your child’s taking part in the survey?
Verbal Consent Statement I have read this form, and/or someone has read it to me. Any questions I had have been answered satisfactorily. I agree for my child to take part in this survey. I know that after allowing my child to take part, I may change my mind and withdraw him/her from taking part in this survey at any time. I have been offered a copy of this consent form.
1. If you agree that your child will give blood for HIV and related testing, please state the following statement: ”I agree for my child to give blood for HIV and related testing” ____Check this box if parent/guardian agrees to allow their child participate in the blood draw

352
If you do not agree for us to ask your child to give blood for HIV and related testing and, please state the following statement: ”I do not wish for my child to take part in blood testing today” ____Check this box if participant/guardian refuses to allow their child participate in the blood draw
(If agrees to participate in blood draw proceed to the next question)
2. If you agree to have your child’s leftover blood stored for future research please state the following statement: ”I agree to have my child’s leftover blood stored for future research” ____Check here if participant agrees to have their child’s leftover blood stored for future research.
If you do not agree to have your blood stored for future research, please state the following statement: ”I do not wish to have my child’s leftover blood stored for future research” ____Check here if participant refuses to have their child’s leftover blood stored for future research.
Printed name of parent/guardian________________________________________
Parent/guardian ID number________________________________(If applicable. If not applicable check here __)
Signature of person obtaining consent_______________________________ Date: ___/___/___
Printed name of person obtaining consent____________________________
Survey staff ID number _________________________________
Child’s name (print) ___________________________________ Child’s participant ID number ___________________________________

353
Permission from Parents/guardians for Interview and Blood Draw of Children, ages 10-17
Interviewer reads:
What language do you prefer for our discussion today?
___English ___Swahili Now I would like to ask you to give us permission to invite your child to take part in the research study/survey. Your child’s participation will help the Ministry of Health, Community Development, Gender, Elderly and Children (MOHCGEC)/Zanzibar Ministry of Health (MOH), make HIV services better in Tanzania. The Tanzania and Zanzibar AIDS Commissions, the National Bureau of Statistics, and the Office of the Chief Government Statistician are leading this survey in collaboration with the United States Centers for Disease Control and Prevention and ICAP at Columbia University. [IF PARENT/GUARDIAN HAS BEEN THROUGH CONSENT PROCESS FOR INTERVIEW/BLOOD DRAW] What would happen to your child if you agree to allow your child to take part?
If you and your child agree, the following will happen, as described in your own consent:
• We will invite your child to do an interview. We will ask your child questions on behaviors that may put him/her at risk for HIV, his/her exposure to HIV prevention and care programs and knowledge of his/her own HIV status. The interview will take about 30 minutes.
• We will offer him/her a blood test for HIV, and syphilis. Like HIV, syphilis is an infection that can cause very serious illnesses if left untreated.
• To do the HIV and syphilis tests in your home, a trained nurse will take about one teaspoon of blood (about 6mL) from your child’s arm, if aged 10-14 years and about one tablespoon (about 14 mL) of blood from your child’s arm, if aged 15-17 years to perform the tests for HIV and syphilis. If it is not possible to take blood from your child’s arm, then we will try to take a few drops of blood from your child’s finger.
• [For children 15-17 years old] Your child may also be randomly selected today for Hepatitis B or C testing to be done at the lab. We will not return the Hepatitis C results if your child test positive for Hepatitis C. If your child tests positive for Hepatitis B we will send the results to your health facility and we will contact you and let you know if you provide us with your contact information. We will let you know today if your child is selected for Hep B testing.
• We will discuss the results with you and your child if you decide to share the test results with your child.
• If your child tests positive for HIV, o We will also test the amount of CD4 cells in his/her blood and give you the result today. o His/her blood will also be sent to a laboratory to measure his/her viral load and the results will be
returned to your preferred health facility in about 10 weeks

354
o We will give you a referral form so you and your child can consult with a doctor regarding his/her HIV test, CD4 count, and viral load results
o We may also do other additional tests related to HIV. If we have test results that might guide your child’s care or treatment and you provide us with contact information, we will contact you to tell you how you and your child’s doctor or nurse may get these results.
• We will also test your child’s blood for syphilis. If your child tests positive for syphilis, we will refer you to the nearest appropriate health facility for further testing for your child.
• We will ask for your permission to store your child’s leftover blood for future research tests for an indefinite amount of time. If you do not agree to future research tests to your child’s blood samples, we will destroy your child’s blood samples after survey-related testing has been completed.
• You can agree to the interview, but not agree to the blood testing. Or agree for interview and blood testing but not for future storage of blood.
[For parents/guardians of children aged 15-17 only] It is also possible that your child may be eligible to participate in future studies related to health in Tanzania. We will also ask your child for permission to contact them in the next two years if such an opportunity occurs. Your child may also be randomly selected today for Hepatitis B or hepatitis C testing to be done at the lab. If your child is tested for Hepatitis B and test positive, his/her results will be returned to your health facility and we will contact you and let you know if you provide us with your contact information. We will let you know today if your child is selected for Hep B testing. If they are tested for Hepatitis C, the results will not be returned. What are the potential risks? Your child may feel uncomfortable about some of the questions I will ask. Your child can refuse to answer any question. The needle may be uncomfortable for your child and may include bleeding and rarely, infection where the needle enters the skin. Experienced staff will do the tests under safe and clean conditions in order to protect your child against any risk. You and your child may learn that your child is infected with HIV and/or syphilis. Learning about your child’s HIV and/or syphilis infection may cause some emotional discomfort. We will provide counseling on how to cope with learning that your child has HIV and/or syphilis, and tell you where you may go for care and treatment for your child. Lastly, as with all surveys, there is a chance that confidentiality could be compromised. We are doing everything we can to minimize this risk. What are the potential benefits? The main benefit for your child to be in the survey is the chance to learn more about his/her health today. If your child has HIV and or/syphilis, you will learn where to take your child for treatment. If you already know that your child is HIV positive and he/she is on treatment, the CD4 and viral load tests can help your child’s doctor or nurse judge how well the treatment is working. Your child taking part in this survey could help us learn more about children, HIV and syphilis in Tanzania. What are alternatives to taking part? Your child may stop taking part at any time. This will not affect your child’s healthcare in any way

355
What about confidentiality? Your child’s test results will be kept strictly confidential. Your child’s name and the permission and assent forms will be kept separate from his/her health information. Your name and your child’s name will not appear when we share survey results. When we share results, the information we collect from your child will be identified by a number and not by your name or your child’s name. à GO TO PERMISSION STATEMENT [IF PARENT/GUARDIAN HAS NOT BEEN THROUGH CONSENT PROCESS FOR INTERVIEW/BLOOD DRAW] What is the purpose of the survey?
HIV is the virus that causes AIDS. AIDS is a very serious illness. This survey will help us know how many people in Tanzania have HIV and need health services. This survey will also help us learn more about HIV, AIDS and the health of children in Tanzania. We expect about 40,000 men, women, and children from 15,000 households throughout Tanzania to join this survey. If your child joins, his/her taking part will help the Ministry of Health Zanzibar/Ministry of Health, Community Development, Gender, Elderly and Children (MOHCGEC)/make HIV services better in the country. What would happen to your child if you agree to allow your child to take part? If you agree to allow us to invite your child to take part in the survey, we will invite your child to do an interview with us and then offer him/her a blood test for HIV and syphilis. Like HIV, syphilis is an infection that can cause very serious illnesses if left untreated. In the interview we will ask what your child knows about HIV. We will ask your child questions on behaviors that may put him/her at risk for HIV, his/her exposure to HIV prevention and care programs and knowledge of his/her own HIV status. The interview will take about 30 minutes. If you agree, after the interview a trained nurse will take about one teaspoon of blood (about 5mL) from your child’s arm, if aged 10-14 years, and about one tablespoon (about 14 mL) of blood from your child’s arm if aged 15-17 years to perform the tests for HIV and syphilis here in your home and give you the results today. If it is not possible to take blood from your child’s arm, then we will try to take a few drops of blood from your child’s finger. We will provide counseling about the results and discuss with you how to share the test results with your child. If you would like, we can discuss the test results together with your child. The entire testing and counseling session will take about 40 minutes. If your child tests positive for HIV, we will also test the amount of CD4 cells in his/her blood and give you the result today. CD4 cells are the part of the immune system that fight HIV infection and other diseases. We will also test the amount of CD4 cells in some children without HIV. We will give you a referral form and information so that you and your child can consult with a doctor or nurse to learn more about his/her HIV test, syphilis test, CD4 count, viral load, and health. In addition, if your child tests positive for HIV, we will send his/her blood to a laboratory to measure his/her viral load. Viral load is the amount of HIV in the blood. Your child’s viral load test results will be ready in about ten weeks from now. If you provide us with your contact information, we will contact you to let you know the results

356
are ready and encourage you to go to your health facility to discuss your child’s viral load results with a doctor or nurse. We may also do other additional tests related to HIV. If we have test results that might guide your child’s care or treatment and you provide us with contact information, we will contact you to tell you how you and your child’s doctor or nurse may get these results. We will also test your child’s blood for syphilis. If your child tests positive for syphilis, we will refer you to the nearest appropriate health facility for further testing for your child. [For parents/guardians of children aged 15-17 only] It is also possible that your child may be eligible to take part in future studies related to health in Tanzania. We will also ask your child for permission to contact them in the next two years if such an opportunity occurs. What will happen to your child’s leftover blood? We would like to ask your permission to store your child’s leftover blood for future research tests. These tests may be for HIV or other health issues which are important to the health of Tanzanians, such as nutrition or immunization. This sample will be stored for an indefinite amount of time but your child’s name will be on the sample for only three years. During this three year period, we will attempt to tell you about any test results that are important for your child’s health. Your child’s leftover blood will not be sold or used for commercial reasons. If you do not agree to future research tests to your child’s blood samples, we will destroy your child’s blood samples after survey-related testing has been completed. You can agree to the interview, but not agree to the blood testing. Or agree for interview and blood testing but not for future storage of blood. What are the potential risks? Your child may feel uncomfortable about some of the questions I will ask. Your child does not need to answer any question(s) if they feel the question(s) are too personal or if it makes them uncomfortable. The needle stick may be uncomfortable for your child and may include bleeding and rarely, infection where the needle enters the skin. Experienced staff will do the tests under safe and clean conditions in order to protect your child against any risk. You and your child may learn that your child is infected with HIV and/or syphilis. Learning about your child’s HIV and/or syphilis may cause some emotional discomfort. We will provide counseling on how to cope with learning that your child has HIV and/or syphilis, and tell you where you may go for care and treatment for your child. Lastly, as with all surveys, there is a chance that confidentiality could be compromised. We are doing everything we can to minimize this risk.
What are the potential benefits? The main benefit for your child to be in the survey is the chance to learn more about his/her health today. Some children who take part will test positive for HIV and/or syphilis. If this happens to your child, the benefit is that you will learn his/her HIV and syphilis status and will learn where to take your child for life-saving treatment. Care

357
and treatment provided by the Ministry of Health is free. If you already know that your child is HIV positive and he/she is on treatment, the CD4 and viral load tests can help your child’s doctor or nurse judge how well the treatment is working. Your child taking part in this survey could help us learn more about children, HIV and syphilis in Tanzania andhow well HIV prevention and treatment programs are working. What are alternatives to taking part? You can decide to not allow your child to take part in the survey. Or you can allow your child to take part in the interview, but not the blood testing. Or you can allow your child to take part in the interview and blood testing, but not agree to allow your child’s leftover blood to be stored for future studies. Your decision to allow your child to take part or not take part in this survey will not affect your child’s health care in any way. What about confidentiality?
Your child’s test results will be kept strictly confidential. Your child’s name and the permission and assent forms will be kept separate from his/her health information. Your name and your child’s name will not appear when we share survey results. The information we collect from your child will be identified by a number and not by your name or your child’s name. (INTERVIEWER INDICATE INFORMATION BELOW ON CONSENT FORM, DO NOT READ ALOUD) The following individuals and agencies will be able to look at your child’s survey records to help oversee the conduct of this survey:
§ Staff members from the Institutional Review Boards or Ethics Committees overseeing the conduct of this survey to ensure that we are protecting your child’s rights as a participant. These include the National Insititute for Medical Research (NIMR) and the Zanzibar Medical Ethics Council (ZAMEC) in Tanzania and the Institutional Review Boards at the Centers for Disease Control and Prevention (CDC; Atlanta, USA), Columbia University Medical Center and Westat (a statistical survey research organization)
§ The U.S. Office of Human Research Protections and other government agencies that oversee the safety of human subjectsto ensure we are protecting your child’s rights as a person in this survey
§ Survey staff and monitors

358
(INTERVIEWER READ FROM HERE) The information we collect from your child will not be released outside of the survey groups listed above unless there is an issue of safety. Your permission to allow us to use and share your child’s name and contact information with the groups above will end three years after the end of the survey. Who should you contact if you have questions? If you want to leave the survey, have any questions about the survey, or feel that you have been harmed by taking part, you should contact any of the Principal Investigators below: (INTERVIEWER INDICATE ADDRESSES ON CONSENT FORM, DO NOT READ ALOUD) Dr. Albina Chuwa National Bureau of Statistics, 18 Kivukoni Road, Dar Es Salaam P.O Box 796, 11992 Dar es Salaam, Tanzania. Tel: +255 (0) 22-2122722/3 Email: [email protected] Mr. Emilian Karugendo National Bureau of Statistics, 18 Kivukoni Road, Dar Es Salaam P.O Box 796, 11992 Dar es Salaam, Tanzania. Tel: +255 (0) 22-2122722/3 [email protected]; or Mayasa Mahfoudh Mwinyi Office of the Chief Government Statistician P.O Box 2321, Zanzibar. Telephone number: +255 242231869 Email: [email protected]
If you decide withdraw your child from the study, no more information will be collected from your child. We will make every effort to delete the information we have collected from your child. However, after today, we cannot guarantee we will be able to delete information that has already been shared.
If you have any questions about your child’s rights as a person in this survey, you can contact:
Dr Mwele Malechela The Director General National Institute for Medical Research (NIMR) 3 Barack Obama Drive P. O. Box 9653, Dar es Salaam, Tanzania Tel: +255-22-2121400 Fax: +255-22-2121360 Email: [email protected] | [email protected]
Dr Msafiri L Marijani Zanzibar Medical Research and Ethics Committee (ZAMREC) Ministry of Health, Mnazi Mmoja Hospital, Michenzani - Zanzibar P.O.BOX 672. Zanzibar Email: [email protected] Telephone number: +25 577 6663303

359
(INTERVIEWER READ FROM HERE)
Are there any costs? There is no cost to you for your child being in the survey other than your time. You should also know that neither you nor your child will be paid for your child to be in the survey. Do you want to ask me anything about your child’s taking part in the survey?
Verbal Permission Statement I have read this form, and/or someone has read it to me. Any questions I had have been answered satisfactorily. I agree for my child to take part in this survey. I know that after allowing my child to take part, I may change my mind and withdraw him/her from taking part in this survey at any time. I have been offered a copy of this permission form.
2. If you agree for us to ask your child to do the interview, please state the following statement:”I give permission to the study team to ask my child to take part in the interview” ____Check this box if parent/guardian agrees to allow us to ask his/her child to take part in the interview If you do not agree for us to ask your child to do interview, please state the following statement: ”I do not wish for the study team to ask my child to take part in the interview” ____Check this box if parent/guardian refuses to allow the study team to ask his/her child to take part in the interview (If permission given proceed to the next question)
3. If you agree for us to ask your child to give blood for HIV and syphilis testing, and related testing and Hepatitis B or C testing for your child aged 15-17 years, please state the following statement: ”I give permission for the study team to ask my child to give blood for HIV, syphilis and related testing and Hepatitis B or C testing for my child aged 15-17 years” ____Check this box if parent/guardian gives permission for study team to ask his/her child to take part in the blood draw If you do not agree for us to ask your child to give blood for HIV, syphilis and related testing and Hepatitis B or C for your child age 15-17, please state the following statement: ”I do not wish for the study team to ask my child to take part in blood testing today” ____Check this box if parent/guardian refuses to allow the study team to ask his/her child to take part in the blood draw (If permission given, proceed to the next question)
4. If you agree for us to ask your child to have your child’s leftover blood stored for future research , please state the following statement:

360
”I give permission for the study team to ask my child to have his/her leftover blood stored for future research” ____Check this box if parent/guardian gives permission for study team to ask his/her child to have his/her leftover blood stored for future research. If you do not agree to have your blood stored for future research, please state the following statement: ”I do not wish for the study team to ask my child to have his/her leftover blood stored for future research” ____Check this box if parent/guardian refuses to have study team ask his/her child to have his/her leftover blood stored for future research.
5. [ONLY FOR PARENTS OF CHILDREN aged 15 – 17] If you agree for us to contact your child in the next two years to participate in future studies related to health in Tanzania, please state the following statement: ”I give permission for the study team to contact my child about participation in future studies” ____Check this box if parent/guardian gives permission for study team to ask his/her child about participating in future studies.
If you do not agree for us to contact your child to participate in future studies, please state the following statement:
”I do not wish for the study team to contact my child about participation in future studies”
____Check this box if parent/guardian refuses to have study team ask his/her child about participating in future studies.
Printed name of parent/guardian________________________________________
Parent/guardian ID number________________________________ (If applicable. If not applicable check here __)
Signature of person obtaining permission_____________________ Date: ___/___/___
Printed name of person obtaining permission____________________________
Survey staff ID number _________________________________
Child’s name (print) ___________________________________ Child’s participant ID number ___________________________________

361
Assent for Interview of children, ages 10-14
Interviewer reads:
What language do you prefer to use for this discussion?
___English ___Kiswahili Hello. My name is___________. We have talked to your parent/guardian and they said it was okay to invite you to take part in a survey. Surveys help us learn new things.
Your participation in this survey will help the Ministry of Health, Community Development, Gender, Elderly and Children (MOHCGEC)/Zanzibar Ministry of Health (MOH), make HIV services better in Tanzania.
This form talks about our survey and the choice that you have to take part in it. I want you to ask me any questions that you have. You can ask questions any time. Why are we doing this survey? HIV is the virus that causes AIDS. AIDS is a very serious illness. This survey will help us know how many people in Tanzania have HIV and need health services. We are also doing this survey to help us learn more about the health of children in Tanzania. We plan to ask thousands of children like you to join this survey. We would like to invite you to join this survey too. This form might have some words that you may not have heard before. Please ask me to explain anything that you do not understand. What would happen if you joined this survey? If you decide to join the survey, here is what would happen:
• We will ask you questions related to your knowledge about HIV, your exposure to HIV prevention and care services, your knowledge about your own HIV infection status. We will also ask you if you experienced any behaviors that may increase your chance of getting HIV. The interview will take place in private here in your home or an area around your home.
• The interview will take about 30 minutes. • After we ask you the questions, we will also ask you if it is okay to take some of your blood to test for
HIV and syphilis. Like HIV, syphilis is a germ that can make people very sick. We will also ask you if we can store your leftover blood for future surveys. You can agree to the interview, but not agree to the blood testing.
Could bad things happen to you if you joined this survey? You may feel uncomfortable answering some of the questions I will ask. If I ask you any questions you don’t want to answer, just let me know and I will go to the next question. You can stop the interview at any time.

362
As with all surveys, there is a chance that confidentiality could be compromised. We are doing everything we can to minimize this risk. Could the survey help you? Being in this survey may not help you. But you may help us figure out ways to help other children and learn more about HIV in Tanzania. Taking part in this survey is important. What else should you know about this survey? If you don’t want to be in the survey, you don’t have to be. Nobody will get upset with you if you do not want to join the survey. It is also OK to say ‘yes’ and change your mind later. You can stop being in the survey at any time. If you want to stop, please tell us.
We will not tell other people that you are in this survey and will not share information about you to anyone who does not work on the survey. Any information about you will have a number on it instead of your name.
The following individuals and agencies will be able to look at your survey records: § Survey staff and monitors § Staff members from groups that protect your rights as a person taking part in a survey to make sure that
we are protecting your rights If you have any questions about the survey, feel that you have been harmed by taking part, or no longer want to take part in the survey, you can contact any of the Principal Investigators listed below: (INTERVIEWER INDICATE ADDRESSES ON ASSENT FORM, DO NOT READ ALOUD) Dr. Albina Chuwa Email: [email protected] Mr. Emilian Karugendo National Bureau of Statistics, 18 Kivukoni Road, Dar Es Salaam P.O Box 796, 11992 Dar es Salaam, Tanzania. Tel: +255 (0) 22-2122722/3 [email protected]; or Mayasa Mahfoudh Mwinyi Office of the Chief Government Statistician P.O Box 2321, Zanzibar. Telephone number: +255 242231869 Email: [email protected]

363
If you have any questions about your rights as a person in this survey, you can contact:
Dr Mwele Malechela The Director General National Institute for Medical Research (NIMR) 3 Barack Obama Drive P. O. Box 9653, Dar es Salaam, Tanzania Tel: +255-22-2121400 Fax: +255-22-2121360 Email: [email protected] | [email protected]
Dr Msafiri L Marijani Zanzibar Medical Research and Ethics Committee (ZAMREC) Ministry of Health, Mnazi Mmoja Hospital, Michenzani - Zanzibar P.O.BOX 672. Zanzibar Email: [email protected] Telephone number: +25 577 6663303
(INTERVIEWER READ FROM HERE) You should also know that you will not be paid to be in the study.
You can ask questions any time. Take the time you need to make your choice.
Do you want to ask me anything?
Verbal Consent Statement 1. If you agree to take part in the individual interview, please state the following statement:
”I agree to take part in the individual interview” ____Check this box if participant agreed to participate in the individual interview
If you do not agree to take part in the individual interview, please state the following statement: ”I do not wish to take part in the individual interview” ____Check this box if participant refuses to participate in the individual interview
Printed name of child ________________________________________ Child’s participant ID number ____________________________________________ Printed name of parent/guardian_____________________________
Signature of person obtaining assent______________________________ Date: ___/___/___ Printed name of person obtaining assent____________________________ Survey staff ID number _________________________________

364
Assent for Interview, ages 15-17
Interviewer reads:
What language do you prefer to use for this discussion? ___English ___Kiswahili Hello. My name is___________. I have talked to your parent/guardian and they said it was okay to invite you take part in a research/survey about HIV in Tanzania. A survey is a way to learn about something by interviewing and testing many people. Your participation in this survey will help the Ministry of Health, Community Development, Gender, Elderly and Children (MOHCGEC)/Zanzibar Ministry of Health (MOH), make HIV services better in Tanzania. This form talks about our survey and the choice that you have to take part in it. I want you to ask me any questions that you have. You can ask questions any time. Why are we doing this survey? HIV is the virus that causes AIDS. AIDS is a very serious illness. This survey will help us know how many people in Tanzania have HIV and need health services. We are also doing this survey to help us learn more about HIV, AIDS and the health of children in Tanzania. This form might have some words in it that are not familiar to you. Please ask me to explain anything that you do not understand. What would happen if you joined this survey? If you agree to join,here is what would happen:
• We will ask you questions related to your knowledge about HIV, your exposure to HIV prevention and care services, your knowledge about your own HIV infection status. We will also ask you if you experienced any behaviors that may increase your chance of getting HIV.
• The interview will take about 50 minutes. • After the interview, we will ask you if it is okay to take some of your blood to test for HIV and syphilis. You
do not have to agree to the blood testing now. We will give you a separate opportunity to agree to the blood testing. You can agree to the interview, but not agree to the blood testing.
Could bad things happen to you if you joined the survey? The risks in being in the survey are small. We will do everything we can to keep your information private. However, we cannot promise complete confidentiality. You may feel uncomfortable about some of the questions I will ask. If I ask you any questions you don’t want to answer, just let me know and I will go to the next question. You can stop the interview at any time.

365
As with all surveys, there is a chance that confidentiality could be compromised. We are doing everything we can to minimize this risk. Could this survey help you? Being in this survey may not help you. But you may help us figure out ways to help other children and learn more about HIV in Tanzania. Taking part in this survey is important. What else should you know about this survey?
If you don’t want to be in the survey, you don’t have to be. Nobody will get upset with you if you do not want to join the survey. Your decision to take part or not take part will not affect your healthcare. Will you share my answers in the interview with other people? All the information you share with us during the interview will be kept confidential. We will not tell your family about any of your responses. The consent forms with your name will be kept separate from your answers to the questions, which will only be identified by a number. Your name will not appear on any survey results. Only people working on the survey will have access to the data during the survey.
The following individuals and agencies will be able to look at your interview records to help oversee the conduct of this survey:
§ Survey staff and monitors § Staff members from groups that protect your rights as a person taking part in a survey to make sure that
we are protecting your rights
Who should you contact if you have questions? If you want to leave the survey, have any questions about the survey, or feel that you have been harmed by taking part, you should contact any of the Principal Investigators listed below: (INTERVIEWER INDICATE ADDRESSES ON ASSENT FORM, DO NOT READ ALOUD) Dr. Albina Chuwa National Bureau of Statistics, 18 Kivukoni Road, Dar Es Salaam P.O Box 796, 11992 Dar es Salaam, Tanzania. Tel: +255 (0) 22-2122722/3 Email: [email protected] Mr. Emilian Karugendo National Bureau of Statistics, 18 Kivukoni Road, Dar Es Salaam P.O Box 796, 11992 Dar es Salaam, Tanzania. Tel: +255 (0) 22-2122722/3 [email protected]; or Mayasa Mahfoudh Mwinyi Office of the Chief Government Statistician P.O Box 2321, Zanzibar. Telephone number: +255 242231869

366
Email: [email protected] If you have any questions about your rights as a person in this survey, you can contact:
Dr Mwele Malechela The Director General National Institute for Medical Research (NIMR) 3 Barack Obama Drive P. O. Box 9653, Dar es Salaam, Tanzania Tel: +255-22-2121400 Fax: +255-22-2121360 Email: [email protected] | [email protected]
Dr Msafiri L Marijani Zanzibar Medical Research and Ethics Committee (ZAMREC) Ministry of Health, Mnazi Mmoja Hospital, Michenzani - Zanzibar P.O.BOX 672. Zanzibar Email: [email protected] Telephone number: +25 577 6663303
(INTERVIEWER READ FROM HERE) Are there any costs to taking part in the interview? There is no cost to you for answering the questions in the interview except for your time. You should also know that you will not be paid to answer these questions. You can ask questions any time. Take the time you need to make your choice. Do you want to ask me anything? Verbal Assent Statement I have read this form, and/or someone has read it to me. Any questions that I had were answered satisfactorily. I agree to take part in the individual interview. I have been offered a copy of this assent form.
Verbal Assent Statement
2. If you agree to take part in the individual interview, please state the following statement:
”I agree to take part in the individual interview” ____Check this box if participant agreed to participate in the individual interview

367
If you do not agree to take part in the individual interview, please state the following statement: ”I do not wish to take part in the individual interview” ____Check this box if participant refuses to participate in the individual interview
2. FUTURE RESEARCH: It is possible that you may be eligible to take part in future studies related to health in Tanzania. We are asking for your permission to contact you in the next two years if such an opportunity occurs. If we contact you, we will give you details about the new study and ask you to sign a separate assent form at that time. You may decide at that time that you do not want to take part in that study.
If you do not wish to be contacted about future studies, it does not affect your involvement in this study. If you agree to be contacted in the future, please state the following statement: ”I agree to be contacted about future studies” ____Check this box if participant agreed to be contacted about future studies
If you do not agree to be contacted about future studies, please state the following statement: ”I do not wish to be contacted about future studies” ____Check this box if participant refuses to be contacted about future studies
Printed name of participant________________________________________
Participant ID number ___________________________________________________
Printed name of parent/guardian_____________________________
Signature of person obtaining assent_____________________ ___________ Date: ___/___/___
Printed name of person obtaining assent_____________________________ Survey staff ID number _________________________________

368
Consent for Interview from Emancipated Minors Age 15-17
Nurse counselor/Interviewer reads:
What language do you prefer to use for this discussion? ___English ___Kiswahili Hello. My name is___________. I would like to invite you to take part in a research study/survey about HIV in Tanzania. A survey is a way to learn about something by interviewing and testing many people. Your participation will help the Ministry of Health, Community Development, Gender, Elderly and Children (MOHCGEC)/Zanzibar Ministry of Health (MOH), make HIV services better in Tanzania. The Tanzania and Zanzibar AIDS Commissions, the National Bureau of Statistics, and the Office of the Chief Government Statistician are leading this survey in collaboration with the United States Centers for Disease Control and Prevention and ICAP at Columbia University. This form talks about our survey and the choice that you have to take part in it. I want you to ask me any questions that you have. You can ask questions any time. Why are we doing this survey? HIV is the virus that causes AIDS. AIDS is a very serious illness. This survey will help us know how many people in Tanzania have HIV and need health services. We are also doing this survey to help us learn more about HIV, AIDS and the health of children in Tanzania. We expect about 40,000 men, women, and children from 15,000 households throughout Tanzania to join this survey. We would like to invite you to join this survey too. If you join, your taking part will help the Ministry of Health Zanzibar/Ministry of Health, Community Development, Gender, Elderly and Children (MOHCGEC)/make HIV services better in the country. We plan to ask thousands of young people like you to join this survey. We would like to invite you to join this survey too. This form might have some words that you may not have heard before. Please ask us to explain anything that you do not understand. What would happen if I join this survey? If you decide to join the survey, here is what would happen:
• We will ask you questions related to your knowledge about HIV, your exposure to HIV prevention and care services, your knowledge about your own HIV infection status. We will also ask you if you experienced any behaviors that may increase your chance of getting HIV.
• The interview will take about 50 minutes. • After the interview, we will ask you if it is okay to take some of your blood to test for HIV and
syphilis. You do not have to agree to the blood testing now. We will give you a separate opportunity to agree to the blood testing. You can agree to the interview, but not agree to the blood testing.

369
Could bad things happen to you if you joined the survey? The risks in being in the survey are small. We will do everything we can to keep your information private. However, we cannot promise complete confidentiality. You may feel uncomfortable about some of the questions I will ask. If I ask you any questions you don’t want to answer, just let me know and I will go to the next question. You can stop the interview at any time.
As with all surveys, there is a chance that confidentiality could be compromised. We are doing everything we can to minimize this risk Could this survey help you? Being in this survey may not help you. But you may help us figure out ways to help other children and learn more about HIV in Tanzania. What else should you know about this survey? If you don’t want to be in the survey, you don’t have to be. Nobody will get upset with you if you do not want to join the survey. Your decision to take part or not take part will not affect your healthcare, but we hope you will agree to answer these questions since your views are important.
Will you share my answers in the interview with other people? All the information you share with us during the interview will be kept confidential. We will not tell your family about any of your responses. The consent forms with your name will be kept separate from your answers to the questions, which will only be identified by a number. Your name will not appear on any survey results. Only people working on the survey will have access to the data during the survey.
The following individuals and agencies will be able to look at your interview records to help oversee the conduct of this survey:
§ Survey staff and monitors § Staff members from groups that protect your rights as a person taking part in a survey to make sure that
we are protecting your rights The information we collect from you will not be released outside of the groups listed above unless there is an issue of safety. If we learn of anything that could harm you, we will contact you on where you can receive support. Your permission to allow us to use and share your information with the groups above will expire three years after the end of the survey.
Who should you contact if you have questions? If you want to leave the survey, have any questions about the survey, or feel that you have been harmed by taking part, you should contact any of the Principal Investigators listed below: (INTERVIEWER INDICATE ADDRESSES ON CONSENT FORM, DO NOT READ ALOUD) Dr. Albina Chuwa National Bureau of Statistics, 18 Kivukoni Road, Dar Es Salaam P.O Box 796, 11992 Dar es Salaam, Tanzania. Tel: +255 (0) 22-2122722/3

370
Email: [email protected] Mr. Emilian Karugendo National Bureau of Statistics, 18 Kivukoni Road, Dar Es Salaam P.O Box 796, 11992 Dar es Salaam, Tanzania. Tel: +255 (0) 22-2122722/3 [email protected]; or Mayasa Mahfoudh Mwinyi Office of the Chief Government Statistician P.O Box 2321, Zanzibar. Telephone number: +255 242231869 Email: [email protected] If you decide to leave the study, no more information will be collected from you. We will make every effort to delete the information we have collected from you. However, after today, we cannot guarantee we will be able to delete information that has already been shared. If you have any questions about your rights as a participant in this survey, you can contact:
Dr Mwele Malechela The Director General National Institute for Medical Research (NIMR) 3 Barack Obama Drive P. O. Box 9653, Dar es Salaam, Tanzania Tel: +255-22-2121400 Fax: +255-22-2121360 Email: [email protected] | [email protected]
Dr Msafiri L Marijani Zanzibar Medical Research and Ethics Committee (ZAMREC) Ministry of Health, Mnazi Mmoja Hospital, Michenzani - Zanzibar P.O.BOX 672. Zanzibar Email: [email protected] Telephone number: +25 577 6663303
(INTERVIEWER READ FROM HERE)
Are there any costs to taking part in the interview? There is no cost to you for answering the questions in the interview except for your time. You should also know that you will not be paid to answer these questions. You can ask questions any time. Take the time you need to make your choice. Do you want to ask me anything?

371
Verbal Consent Statement I have read this form, and/or someone has read it to me. Any questions that I had were answered satisfactorily. I agree to take part in the individual interview. I know that after choosing to be in this individual interview, I may withdraw at any time. My taking part is voluntary. I have been offered a copy of this consent form.
6. If you agree to take part in the individual interview, please state the following statement: ”I agree to take part in the individual interview” ____Check this box if participant agrees to participate in the individual interview
If you do not agree to take part in the individual interview, please state the following statement: ”I do not wish to take part in the individual interview” ____Check this box if participant refuses to participate in the individual interview
7. FUTURE RESEARCH: It is possible that you may be eligible to participate in future studies related to
health in Tanzania. We are asking for your permission to contact you in the next two years if such an
opportunity occurs. If we contact you, we will give you details about the new study and ask you to sign
a separate consent form at that time. You may decide at that time that you do not want to take part in
that study.
If you do not wish to be contacted about future studies, it does not affect your involvement in this
study.
If you agree to be contacted about future studies, please state the following statement
”I agree to be contacted for future studies”
____Check this box if participant agrees to be contacted for future studies
If you do not agree to be contacted about future studies, please state the following statement
”I do not wish to be contacted for future studies” ____Check this box if participant refuses to be contacted for future studies
Printed name of participant ________________________________________
Participant ID number ____________________________________________
Signature of person obtaining consent_______________________________ Date: ___/___/___ Printed name of person obtaining consent____________________________ Survey staff ID number _________________________________

372
Consent for Blood Draw, Ages 18+
Interviewer reads:
What language do you prefer to use for this discussion?
___English ___Kiswahili As a part of this survey, we are giving people who take part a chance to learn if they have HIV and/or syphilis. HIV and syphilis are infections that can cause very serious illness if left untreated. We are also asking people if we can keep some of their blood for future testing. What would happen to you if you agree to take part in the blood testing?
If you agree to the HIV, and syphilis blood testing a trained nurse will take about one tablespoon or about 14 mL of blood from your arm. If it is not possible to take blood from your arm, then we will try to take a few drops of blood from your finger. We will give you the results of these blood tests today. We will provide counseling about the results. The testing and counseling session will take about 40 minutes. If you test positive for HIV, we will also test the amount of CD4 cells in your blood and give you the result today. CD4 cells are the part of the immune system that fight HIV infection and other diseases. We will also test the amount of CD4 cells in some people without HIV. We will also do other additional tests related to HIV. If we have test results that might guide your care or treatment and you provide us with contact information, we will contact you to tell you how may get these results. We will give you a referral form to take to the nearest Ministry of Health-approved health facility you select and information on today’s test results so that you can consult with a doctor or nurse to learn more about your HIV test, CD4 count, and overall health. If you test positive for HIV, we will also send your blood to a laboratory to measure your viral load. Viral load is the amount of HIV in the blood. Your viral load test results will be ready in about ten weeks. When the results are ready, we will send the results to your health facilitiy of choice. If you provide us with your contact information, we will contact you to let you know the results are ready, and encourage you to go to your health facility to discuss your viral load results with a doctor or nurse. You may also be randomly selected today for Hepatitis B or C testing to be done at the lab. We will not return the Hepatitis C results if you are tested for Hepatitis C. If you test positive for Hepatitis B we will send the results to your health facility and we will contact you and let you know if you provide us with your contact information. We will let you know today if you are selected for Hep B testing. If you test positive for syphilis, we will refer you to the nearest appropriate health facility for further testing.

373
What will happen to your leftover blood? We would also like your permission to store your leftover blood for future research tests. These tests may be about HIV or other health issues which are important to the health of Tanzanians, like nutrition or immunization. This sample will be stored for an indefinite amount of time but your name will be on the sample for only three years. During this three year period we will attempt to tell you about any test results that are important to your health. Your leftover blood will not be sold or used for commercial reasons. If you do not agree to future research tests of your blood samples, we will destroy your blood samples after survey-related testing has been completed. What are the potential risks? The risks in drawing blood are very small. The needle may hurt and may include bleeding and rarely, infection where the needle enters the skin. Experienced staff will do the test under safe and clean conditions in order to protect you against any risk. You may learn that you are infected with HIV and/or syphilis. Learning that you have HIV and/or syphilis may cause some emotional discomfort. We will provide counseling on how to cope with learning that you have HIV and/or syphilis, and tell you where you may go for care and treatment. As with all surveys, there is a chance that confidentiality could be compromised. We are doing everything we can to minimize this risk What are the potential benefits? The main benefit is the chance to learn more about your health today. If you test HIV negative and/or syphilis negative, or Hep B negative you will learn about what you can do to stay negative. Some people who take part will test positive for HIV and/or syphilis and/or Hep B and will learn where to go for life-saving treatment. If you already know that you are HIV positive and are on treatment, the CD4 and viral load tests can help your doctor or nurse judge how well the treatment is working. Your taking part in this blood testing could help us learn more about HIV and syphilis in Tanzania and how well HIV prevention and treatment programs are working. What are alternatives to taking part?
You can decide to not take part in the blood testing. Or you can decide to take part in the blood testing, but not agree to allow your leftover blood to be stored for future studies. Your decision to take part or not take part in the blood testing will not affect your health care in any way. What about confidentiality?
Your blood test results will be kept strictly confidential. The consent forms with your name will be kept separate from your health information. Your name will not appear when we share survey results. The information we collect from you will be identified by a number and not by your name. Only people working on the survey will have access to the data during the survey. (INTERVIEWER INDICATE INFORMATION BELOW ON CONSENT FORM, DO NOT READ ALOUD)

374
The following individuals and agencies will be able to look at your records to help oversee the conduct of this survey:
§ Staff members from the Institutional Review Boards or Ethics Committees overseeing the conduct of this survey to ensure that we are protecting your rights as a participant. These include the National Insititute for Medical Research (NIMR) and the Zanzibar Medical Ethics Council (ZAMEC) in Tanzania and the Institutional Review Boards at the Centers for Disease Control and Prevention (CDC; Atlanta, USA), Columbia University Medical Center and Westat (a statistical survey research organization)
§ The U.S. Office of Human Research Protections and other government agencies that oversee the safety of human subjects to ensure we are protecting your rights as a participant in this survey
§ Survey staff and monitors
(INTERVIEWER READ FROM HERE) The information we collect from you will not be released outside of the survey groups listed above unless there is an issue of safety. Your permission to allow us to use and share your name and contact information with the groups above will end three years after the end of the survey. Who should you contact if you have questions? If you want to leave the survey, have any questions about the survey, or feel that you have been harmed by taking part, you should contact any of the Principal Investigators listed below: (INTERVIEWER INDICATE ADDRESSES ON CONSENT FORM, DO NOT READ ALOUD) Dr. Albina Chuwa National Bureau of Statistics, 18 Kivukoni Road, Dar Es Salaam P.O Box 796, 11992 Dar es Salaam, Tanzania. Tel: +255 (0) 22-2122722/3 Email: [email protected] Mr. Emilian Karugendo National Bureau of Statistics, 18 Kivukoni Road, Dar Es Salaam P.O Box 796, 11992 Dar es Salaam, Tanzania. Tel: +255 (0) 22-2122722/3 [email protected]; or Mayasa Mahfoudh Mwinyi Office of the Chief Government Statistician P.O Box 2321, Zanzibar. Telephone number +255 242231869 Email: [email protected] If you decide to leave the study, no more information will be collected from you. We will make every effort to delete the information we have collected from you. However, after today, we cannot guarantee we will be able to delete information that has already been shared. If you have any questions about your rights as a person in this survey, you can contact:

375
Dr Mwele Malechela The Director General National Institute for Medical Research (NIMR) 3 Barack Obama Drive P. O. Box 9653, Dar es Salaam, Tanzania Tel: +255-22-2121400 Fax: +255-22-2121360 Email: [email protected] | [email protected]
Dr Msafiri L Marijani Zanzibar Medical Research and Ethics Committee (ZAMREC) Ministry of Health, Mnazi Mmoja Hospital, Michenzani - Zanzibar P.O.BOX 672. Zanzibar Email: [email protected] Telephone number: +25 577 6663303
(INTERVIEWER READ FROM HERE)
Are there any costs? There is no cost to you for receiving the blood tests today except for your time. You should also know that you will not be paid to receive the blood tests. Do you want to ask me anything about:
• Taking your blood for HIV and/or syphilis testing? • Testing in the laboratory? • Storage of blood for future research testing?
Verbal Consent Statement I have read this form, and/or someone has read it to me. Any questions that I had were answered satisfactorily. I know that after choosing to be in this survey, I may withdraw at any time. My taking part is voluntary. I have been offered a copy of this consent form.
8. If you agree to give blood for HIV, Hepatitis B or C and syphilis testing and related testing, please state the following statement: ‘ ”I agree to give blood for HIV, hepatitis B or C and syphilis testing and related testing” ____Check this box if participant agreed to blood draw and testing.
If you do not agree to give blood for HIV, hepatitis B or C and syphilis testing and related testing, please state the following statement: ”I do not wish to take part in blood testing today” ____Check this box if participant refuses blood draw, testing.
(If agrees to blood testing proceed to next question)

376
9. If you agree to have your leftover blood stored for future research, please state the following statement: ”I agree to have my leftover blood stored for future research” ____Check this box if participant agrees to have their leftover blood stored for future research
If you do not agree to have your blood stored for future research, please state the following statement: ”I do not wish to have my leftover blood stored for future research” ____Check this box if participant refuses to have their leftover blood stored for future research
Printed name of participant________________________________________ Participant ID number ____________________________________________
Signature of person obtaining consent________________________________ Date: ___/___/___ Printed name of person obtaining consent_____________________________ Survey staff ID number _________________________________

377
Assent for Blood Draw, Ages 15-17
Nurse counselor/Interviewer reads:
What language do you prefer for our discussion today?
___English ___Kiswahili Hello. My name is___________. I will now give you information about the blood testing part of this research study/survey. As a part of this survey, we are giving people who take part a chance to learn if they have HIV and/or syphilis. HIV and syphilis are infections that can make someone very sick if treatment is not given. We are also asking people if we can keep some of their blood for future testing. What would happen if you joined the blood testing part of this survey? If you decide to join the blood testing part of the survey, here is what would happen:
• We will use a needle to take some of your blood from your arm or finger and then we would test your blood for HIV and syphilis today in your home.
• It will take about 40 minutes to do the test and to talk to your parents about the results.
• If you test positive for HIV, we will do another test on the blood we have already collected to measure the cells in your blood that fight HIV and other infections. We will also measure these cells from some children without HIV. We will do this test here at your home.
• If you test positive for HIV, we will send your blood to a laboratory to measure the amount of HIV in your blood.
• We will ask you if we can use some of your blood for future testing. These tests will help us learn more about the health of people in Tanzania. This sample will be stored for a long period of time, but your name will be on it for only three years. During this three year period, we will try to tell your parents/guardians about any test results that are important to your health. Your leftover blood will not be sold. If you do not agree to future testing of your blood, we will destroy your blood after survey related testing has finished.
Could bad things happen if you take the blood tests? The needle may hurt and may include bleeding and rarely, infection where the needle enters the skin. This will go away after a while. We will do our best to make it hurt as little as possible. Experienced nurses will do the test under safe and clean conditions to protect you from any risks. You can say ‘no’ to what we ask you to do for the survey at any time and we will stop. You may learn that you are infected with HIV and/or syphilis. Learning that you have HIV and/or syphilis may cause some emotional discomfort. We will provide counseling on how to cope with learning that you have HIV and/or syphilis, and tell you where you may go for care and treatment.

378
As with all surveys, there is a chance that confidentiality could be compromised. We are doing everything we can to minimize this risk. Could the blood testing help you? Taking the blood test may help you learn if you have HIV and/or syphilis . After the blood test, we would give your tests results to your parent/guardian and they would decide on the best time to tell you the results. If you have HIV and/or syphilis we will tell your parent/guardian where they can take you for medical care and treatment. Treatment for HIV and syphilis is free. We hope to learn about HIV healthcare needs in this survey to help other children in Tanzania in the future. What else should you know about the blood testing part of this survey?
If you don’t want to take the blood tests, you don’t have to. Nobody will get upset if you do not want to get your blood tested. You can say ‘Yes’ to the blood testing and future studies. Or you can say ‘yes’ to the blood testing, but ‘No’ to future testing. You can also say ‘Yes’ and change your mind later. You can stop the blood testing at any time. If you want to stop, please tell us. We will not tell other people that you took a blood test today.We will not share information about you to anyone who does not work on the survey. Any information we share about you will have a number on it instead of your name.
The following individuals and agencies will be able to look at your blood testing records: § Survey staff and monitors § Staff members from groups that protect your rights as a person taking part in a survey to ensure that we
are protecting your rights Who should you contact if you have questions? If you have any questions about the survey or blood test, feel that you have been harmed by taking part, or no longer want to participate in the survey, you can contact any of the Principal Investigators listed below: (INTERVIEWER INDICATE ADDRESSES ON ASSENT FORM, DO NOT READ ALOUD) Dr. Albina Chuwa National Bureau of Statistics, 18 Kivukoni Road, Dar Es Salaam P.O Box 796, 11992 Dar es Salaam, Tanzania. Tel: +255 (0) 22-2122722/3 Email: [email protected] Mr. Emilian Karugendo National Bureau of Statistics, 18 Kivukoni Road, Dar Es Salaam P.O Box 796, 11992 Dar es Salaam, Tanzania. Tel: +255 (0) 22-2122722/3 [email protected] Mayasa Mahfoudh Mwinyi Office of the Chief Government Statistician P.O Box 2321, Zanzibar. Telephone number: +255 242231869 Email: [email protected]

379
If you have any questions about your rights as a participant in this survey, you can contact:
Dr Mwele Malechela The Director General National Institute for Medical Research (NIMR) 3 Barack Obama Drive P. O. Box 9653, Dar es Salaam, Tanzania Tel: +255-22-2121400 Fax: +255-22-2121360 Email: [email protected] | [email protected]
Dr Msafiri L Marijani Zanzibar Medical Research and Ethics Committee (ZAMREC) Ministry of Health, Mnazi Mmoja Hospital, Michenzani - Zanzibar P.O.BOX 672. Zanzibar Email: [email protected] Telephone number: +25 577 6663303
(INTERVIEWER READ FROM HERE)
Will you or your parent/guardian have to pay to receive blood testing? There is no cost to you or your parent/guardian for receiving blood testing today except for your time. You should also know that you and your parent/guardian will not be paid for receiving blood testing.
Take the time you need to make your choice. Do you want to ask me anything about:
• Taking your blood for HIV and syphilis testing? • Testing in the laboratory? • Storage of blood for future research testing?
Verbal Assent
1. If you agree to give blood for HIV, syphilis testing and related testing, please state the following statement:
”I agree to give blood for HIV and syphilis testing and related testing” ____Check this box if participant agreed to blood testing and related testing.
If you do not agree to give blood for HIV and syphilis testing and related testing, please state the following statement: ”I do not wish to take part in blood testing today” ____Check this box if participant refuses to participate in blood draw and related testing.
(If agrees to blood testing and related testing, proceed to the next question)

380
2. If you agree to give your blood for future testing, please state the following statement: ”I agree to have my leftover blood stored for future research” ____Check this box if participant agrees to have his/her leftover blood stored for future research.
If you do not agree to have your blood stored for future research, please state the following statement: ”I do not wish to have my leftover blood stored for future research” ____Check this box if participant refuses to have his/her blood stored for future research.
Printed name of child ________________________________________
Child’s participant ID number ____________________________________________ Printed name of parent/guardian_____________________________
Signature of person obtaining assent_______________________________ Date: ___/___/___ Printed name of person obtaining assent____________________________ Survey staff ID number _________________________________

381
Nurse counselor/Interviewer reads:
What language do you prefer to use for this discussion?
___English ___Kiswahili Hello. My name is___________. I will give you information about the blood testing part of this research study/survey. As a part of this survey, we are giving people who take part a chance to learn if they have HIV and/or syphilis. HIV and syphilis are infections that can make someone very sick if treatment is not provided. We are also asking people if we can keep some of their blood for future testing. This form might have some words in it that you may not understand. Please ask me to explain anything that you do not understand. You can ask me questions any time. What would happen if you joined the blood testing part of this survey? If you decide to join the blood testing part of the survey, here is what would happen:
• We will use a needle to take some of your blood from your arm and then we would test your blood for HIV and syphilis today in your home.
• It will take about 40 minutes to do the test and to talk to your parents/guardian about the results. • If you test positive for HIV, we will do another test on the blood we have already collected to measure the
cells in your blood that fight HIV and other infections. We will also measure these cells from some children without HIV. We will do this test here at your home.
• If you test positive for HIV, we will send your blood to a laboratory to measure the amount of HIV in your blood.
• You may also be randomly selected today for Hepatitis B or C testing to be done at the lab. We will not return the Hepatitis C results if you are tested for Hepatitis C. If you test positive for Hepatitis B we will send the results to your health facility and we will contact you and let you know if you provide us with your contact information. We will let you know today if you are selected for Hep B testing.
• Lastly, we will ask you if we can use some of your blood for future testing. These tests will help us learn more about the health of people in Tanzania. This sample will be stored for a long period of time, but your name will be on it for only three years. During this three year period, we will try to tell your parents/guardians about any test results that are important to your health. Your leftover blood will not be sold. If you do not agree to future testing of your blood, we will destroy your blood after survey related testing has finished.

382
Could bad things happen if you take the blood tests? The needle may hurt and may include bleeding and rarely, infection where the needle enters the skin. This will go away after a while. We will do our best to make it hurt as little as possible. Experienced nurses will do the test under safe and clean conditions to protect you from any risks. You can say ‘No’ to what we ask you to do for the survey at any time and we will stop. In addition, you may learn that you are infected with HIV and/or syphilis. Learning that you have HIV and/or syphilis may cause some emotional discomfort. If your parent/guardian agrees, we will provide counseling on how to cope with learning that you have HIV and/or syphilis, and tell your parent/guardian where you may go for care and treatment. As with all surveys, there is a chance that confidentiality could be compromised. We are doing everything we can to minimize this risk. Could the blood testing help you? Taking the blood test may help you learn if you have HIV and or syphilis. After the blood test, we would give your tests results to your parent/guardian and they would decide on the best time to tell you the results. If you have HIV and/or syphilis, we will tell your parent/guardian where they can take you for medical care and treatment. Treatment for HIV and syphilis is free. We hope to learn about HIV healthcare needs in this survey. What else should you know about the blood testing part of this survey? If you don’t want to take the blood tests, you don’t have to. Nobody will get upset if you do not want to get your blood tested. You can say ‘Yes’ to the blood testing and future studies. Or you can say ‘Yes’ to the blood testing, but ‘No’ to future testing. You can also say ‘Yes’ and change your mind later. You can stop the blood testing at any time. If you want to stop, please tell us. Your decision to take part or not take part in the blood testing will not affect your health care in any way. We will not tell other people that you took a blood test today. We will not share information about you to anyone who does not work on the survey. Any information we share about you will have a number on it instead of your name. The following individuals and agencies will be able to look at your blood testing records:
§ Survey staff and monitors § Staff members from groups that protect your rights as a person taking part in a survey to ensure that we
are protecting your rights
Who should you contact if you have questions? If you have any questions about the survey or blood test, feel that you have been harmed by taking part, or no longer want to participate in the survey, you can contact any of the Principal Investigators listed below: (INTERVIEWER INDICATE ADDRESSES ON CONSENT FORM, DO NOT READ ALOUD) Dr. Albina Chuwa National Bureau of Statistics, 18 Kivukoni Road, Dar Es Salaam P.O Box 796, 11992 Dar es Salaam, Tanzania. Tel: +255 (0) 22-2122722/3 Email: [email protected] Mr. Emilian Karugendo
383
National Bureau of Statistics, 18 Kivukoni Road, Dar Es Salaam P.O Box 796, 11992 Dar es Salaam, Tanzania. Tel: +255 (0) 22-2122722/3 [email protected]; Mayasa Mahfoudh Mwinyi Office of the Chief Government Statistician P.O Box 2321, Zanzibar. Telephone number +255 242231869 Email: [email protected] If you have any questions about your rights as a person in this survey, you can contact:
Dr Mwele Malechela The Director General National Institute for Medical Research (NIMR) 3 Barack Obama Drive P. O. Box 9653, Dar es Salaam, Tanzania Tel: +255-22-2121400 Fax: +255-22-2121360 Email: [email protected] | [email protected]
Dr Msafiri L Marijani Zanzibar Medical Research and Ethics Committee (ZAMREC) Ministry of Health, Mnazi Mmoja Hospital, Michenzani - Zanzibar P.O.BOX 672. Zanzibar Email: [email protected] Telephone number: +25 577 6663303
(INTERVIEWER READ FROM HERE)
Will you or your parent/guardian have to pay to receive blood testing? There is no cost to you or your parent/guardian for receiving blood testing today except for your time. You should also know that you and your parent/guardian will not be paid for receiving blood testing.
Take the time you need to make your choice. Do you want to ask me anythingabout:
• Taking your blood for HIV and/or syphilis testing? • Testing in the laboratory? • Storage of blood for future research testing?
If you want to get a blood test and give your blood for research after we talk, please write your name below. We will write our name too. This shows we talked about the blood testing and that you want to take part.

384
Verbal Assent statement I have read this form, and/or someone has read it to me. Any questions that I had have been answered satisfactorily. I know that after choosing to be in this survey, I may withdraw at any time. My taking part is voluntary. I have been offered a copy of this assent form.
10. If you agree to give blood for HIV, Hepatitis B or C and syphilis testing and related testing, please state
the following statement: ‘ ”I agree to give blood for HIV, hepatitis B or C and syphilis testing and related testing” ____Check this box if participant agreed to blood draw and related testing.
If you do not agree to give blood for HIV, hepatitis B or C and syphilis testing and related testing, please state the following statement: ”I do not wish to take part in blood testing today” ____Check this box if participant refuses blood draw and related testing.
(If agrees to blood testing proceed to next question)
11. If you agree to have your leftover blood stored for future research, please state the following statement:
”I agree to have my leftover blood stored for future research” ____Check this box if participant agrees to have their leftover blood stored for future research
If you do not agree to have your blood stored for future research, please state the following statement: ”I do not wish to have my leftover blood stored for future research” ____Check this box if participant refuses to have their leftover blood stored for future research
Printed name of participant________________________________________
Participant ID number ____________________________________________
Printed name of parent/guardian_____________________________
Signature of person obtaining assent_______________________________ Date: ___/___/___
Printed name of person obtaining assent____________________________
Survey staff ID number _________________________________

385
Consent for Blood Draw Emancipated Minors, Ages 15-17
Nurse counselor/Interviewer reads:
What language do you prefer to use for this discussion?
___English ___Kiswahili Hello. My name is___________. I will give you information about the blood testing part of this research study/survey. As a part of this survey, we are giving people who take part a chance to learn if they have HIV and/or syphilis. HIV and syphilis are infections that can make someone very sick if treatment is not given. We are also asking people if we can keep some of their blood for future testing. This form might have some words in it that you may not understand. Please ask me to explain anything that you do not understand. You can ask me questions any time. What would happen if you joined the blood testing part of this survey? If you decide to join the blood testing part of the survey, here is what would happen:
• We will use a needle to take some of your blood from your arm and then we would test your blood for HIV and syphilis today in your home.
• It will take about 40 minutes to do the test • If you test positive for HIV, we will do another test on the blood we have already collected to measure the
cells in your blood that fight HIV and other infections. We will also measure these cells from some children without HIV. We will do this test here at your home.
• If you test positive for HIV, we will send your blood to a laboratory to measure the amount of HIV in your blood.
• You may also be randomly selected today for Hepatitis B or Hepatitis C testing to be done at the lab. We will not return the Hepatitis C results if you are tested for Hepatitis C. If you test positive for Hepatitis B we will send the results to your health facility and we will contact you and let you know if you provide us with your contact information. We will let you know today if you are selected for Hep B testing.
• Lastly, we will ask you if we can use some of your blood for future testing. These tests will help us learn more about the health of people in Tanzania. This sample will be stored for a long period of time, but your name will be on it for only three years. During this three year period, we will try to tell you about any test results that are important to your health. Your leftover blood will not be sold. If you do not agree to future testing of your blood, we will destroy your blood after survey related testing has finished.
Could bad things happen if you take the blood tests? The needle may hurt and may include bleeding and rarely, infection where the needle enters the skin. This will go away after a while. We will do our best to make it hurt as little as possible. Experienced nurses will do the test under safe and clean conditions to protect you from any risks. You can say ‘No’ to what we ask you to do for the survey at any time and we will stop.

386
In addition, you may learn that you are infected with HIV and/or syphilis. Learning that you have HIV and/or syphilis may cause some emotional discomfort. We will provide counseling on how to cope with learning that you have HIV and/or syphilis, and tell you where you may go for care and treatment. As with all surveys, there is a chance that confidentiality could be compromised. We are doing everything we can to minimize this risk. Could the blood testing help you? Taking the blood test may help you learn if you have HIV and or syphilis. After the blood test, we would give you your tests. If you have HIV and/or syphilis, we will tell you where you can go for medical care and treatment. Treatment for HIV and syphilis is free. We hope to learn about HIV healthcare needs in this survey. What else should you know about the blood testing part of this survey?
If you don’t want to take the blood tests, you don’t have to. Nobody will get upset if you do not want to get your blood tested. You can say ‘Yes’ to the blood testing and future studies. Or you can say ‘Yes’ to the blood testing, but ‘No’ to future testing. You can also say ‘Yes’ and change your mind later. You can stop the blood testing at any time. If you want to stop, please tell us. Your decision to take part or not take part in the blood testing will not affect your health care in any way. We will not tell other people that you took a blood test today. We will not share information about you to anyone who does not work on the survey. Any information we share about you will have a number on it instead of your name.
The following individuals and agencies will be able to look at your blood testing records: § Survey staff and monitors § Staff members from groups that protect your rights as a survey participant to ensure that we are
protecting your rights as a participant
The information we collect from you will not be released outside of the groups listed above unless there is an issue of safety. If we learn of anything that could harm you, we will contact you on where you can receive support. Your permission to allow us to use and share your information with the groups above will expire three years after the end of the survey. Who should you contact if you have questions? If you have any questions about the survey or blood test, feel that you have been harmed by taking part, or no longer want to take part in the survey, you can contact any of the Principal Investigators listed below:
387
(INTERVIEWER INDICATE ADDRESSES ON CONSENT FORM, DO NOT READ ALOUD) Dr. Albina Chuwa National Bureau of Statistics, 18 Kivukoni Road, Dar Es Salaam P.O Box 796, 11992 Dar es Salaam, Tanzania. Tel: +255 (0) 22-2122722/3 Email: [email protected] Mr Emilian Karugendo National Bureau of Statistics, 18 Kivukoni Road, Dar Es Salaam P.O Box 796, 11992 Dar es Salaam, Tanzania. Tel: +255 (0) 22-2122722/3 or [email protected]; or Mayasa Mahfoudh Mwinyi Office of the Chief Government Statistician P.O Box 2321, Zanzibar. Telephone number +255 242231869 Email: [email protected] If you decide to leave the study, no more information will be collected from you. We will make every effort to delete the information we have collected from you. However, after today, we cannot guarantee we will be able to delete information that has already been shared. If you have any questions about your rights as a person in this survey, you can contact:
Dr Mwele Malechela The Director General National Institute for Medical Research (NIMR) 3 Barack Obama Drive P. O. Box 9653, Dar es Salaam, Tanzania Tel: +255-22-2121400 Fax: +255-22-2121360 Email: [email protected] | [email protected]
Dr Msafiri L Marijani Zanzibar Medical Research and Ethics Committee (ZAMREC) Ministry of Health, Mnazi Mmoja Hospital, Michenzani - Zanzibar P.O.BOX 672. Zanzibar Email: [email protected] Telephone number: +25 577 6663303
(INTERVIEWER READ FROM HERE)
Will you have to pay to receive blood testing? There is no cost to you for receiving blood testing today except for your time. You should also know that you will not be paid for receiving blood testing.

388
Take the time you need to make your choice.
Do you want to ask me anythingabout:
• Taking your blood for HIV and/or syphilis testing? • Testing in the laboratory? • Storage of blood for future research testing?
If you want to get a blood test and give your blood for research after we talk, please write your name below. We will write our name too. This shows we talked about the blood testing and that you want to take part.
Verbal Consent statement\ I have read this form, and/or someone has read it to me. Any questions that I had have been answered satisfactorily. I know that after choosing to be in this survey, I may withdraw at any time. My taking part is voluntary. I have been offered a copy of this consent form.
12. If you agree to give blood for HIV, Hepatitis B or C and syphilis testing and related testing, please state
the following statement: ‘
”I agree to give blood for HIV and related testing, hepatitis B or C and syphilis testing and related testing” ____Check this box if participant agreed to blood draw and related testing.
If you do not agree to give blood for HIV, hepatitis B or C and syphilis testing and related testing, please state the following statement: ”I do not wish to take part in blood testing today” ____Check this box if participant refuses blood draw and related testing.
(If agrees to blood testing proceed to next question)
13. If you agree to have your leftover blood stored for future research, please state the following statement: ”I agree to have my leftover blood stored for future research” ____Check this box if participant agrees to have their leftover blood stored for future research
If you do not agree to have your blood stored for future research, please state the following statement: ”I do not wish to have my leftover blood stored for future research” ____Check this box if participant refuses to have their leftover blood stored for future research
Printed name of participant________________________________________
Participant ID number ____________________________________________
Signature of person obtaining consent_______________________________ Date: ___/___/___
Printed name of person obtaining consent____________________________
Survey staff ID number _________________________________

389
Consent & Permission for Interview and Blood Draw, ages 0-17
Interviewer reads:
What language do you prefer for our discussion today?
___English ___Swahili Now I would like to ask you to give us consent/permission to invite your eligible child/children to take part in the research study/survey. Your child’s participation will help the Ministry of Health, Community Development, Gender, Elderly and Children (MOHCGEC)/Zanzibar Ministry of Health (MOH), make HIV services better. What is the purpose of the survey? HIV is the virus that causes AIDS. AIDS is a very serious illness. This survey will help us know how many people in Tanzania have HIV and need health services. This survey will help us learn more about HIV, AIDS and the health of children in Tanzania. We expect about 40,000 men, women, and children from 15,000 households throughout Tanzania to join this survey. If your child joins this survey, his/her taking part will help the Ministry of Health Zanzibar/Ministry of Health, Community Development, Gender, Elderly and Children (MOHCGEC)/make HIV services better in the country. What would happen to your child if you agree to allow your child to take part? If you and your child agree, the following will happen: Interview Procedures
• [IF CHILD IS 10-17 YEARS OLD] We will invite your child to do an interview. We will ask your child questions related to his/her knowledge about HIV, exposure to HIV prevention and care services, knowledge about his/her own HIV infection status. We will also ask your child about any behaviors that may increase his/her chance of getting HIV.
• The interview will take about 30 minutes.
Blood Procedures • [IF CHILD IS <2 YEARS OLD] A trained nurse will take a few drops of blood (about 1 mL) from your child’s
finger or heel to perform an HIV test here in your home. • [IF CHILD IS 2-9 YEARS OLD] We will take about 6 mL (about one teaspoonful) of blood from your child’s
arm. If it is not possible to take blood from your child’s arm, we will take a few drops of blood from your child’s finger or heel to perform an HIV test here in your home.
• [IF CHILD IS 10-17 YEARS OLD] A trained nurse will take about one teaspoon of blood (about 6mL) from your child’s arm, if aged 10-14 years and about one tablespoon (about 14 mL) of blood from your child’s arm aged 15-17 years to perform the tests for HIV and syphilis. If it is not possible to take blood from your child’s arm, then we will try to take a few drops of blood from your child’s finger. We will offer him/her a

390
blood test for HIV, and syphilis. Like HIV, syphilis is an infection that can cause very serious illnesses if left untreated.
• [IF CHILD IS 0-9 YEARS OLD] We will give you the results of these blood tests today. We will not share the results with your child unless you ask us to do so.
• [IF CHILD IS 10-17 YEARS OLD] We will discuss the results with you and your child if you decide to share the test results with your child.
• If your child tests positive for HIV, o We will also test the amount of CD4 cells in his/her blood and give you the result today. o His/her blood will also be sent to a laboratory to measure his/her viral load and the results will be
returned to your preferred health facility in about 10 weeks o We will give you a referral form so you and your child can consult with a doctor regarding his/her
HIV test, CD4 count, and viral load results o We may also do other additional tests related to HIV. If we have test results that might guide your
child’s care or treatment and you provide us with contact information, we will contact you to tell you how you and your child’s doctor or nurse may get these results.
• [IF CHILD IS 10-17 YEARS OLD] We will also test your child’s blood for syphilis. If your child tests positive for syphilis, we will refer you to the nearest appropriate health facility for further testing for your child.
• We would like to ask your consent/permission to store your child’s leftover blood for future research tests. These tests may be for HIV or other health issues which are important to the health of Tanzanians, such as nutrition or immunization. This sample will be stored for an indefinite amount of time but your child’s name will be on the sample for only three years. During this three year period, we will attempt to tell you about any test results that are important for your child’s health. Your child’s leftover blood will not be sold or used for commercial reasons. If you do not agree to future research tests to your child’s blood samples, we will destroy your child’s blood samples after survey-related testing has been completed.
• [IF CHILD IS 15-17 YEARS OLD] It is also possible that your child may be eligible to participate in future studies related to health in Tanzania. We will also ask your child for permission to contact them in the next two years if such an opportunity occurs. Your child may also be randomly selected today for Hepatitis B testing at the lab. If your child is tested for Hepatitis B and test positive, his/her results will be returned to your health facility and we will contact you and let you know if you provide us with your contact information. We will let you know today if your child is selected for Hepatitis B testing. Your child may also be selected for Hepatitis C testing which will also be done in the lab. We will not be returning the Hepatitis C test results back to you.
• [IF CHILD IS 0-<18 MONTHS] The body makes antibodies to fight HIV. Antibodies from a mother with HIV can enter the baby’s blood during pregnancy. The test we perform on your child today will let us know if your child has been exposed to HIV. If it is positive, it does not mean your child has the virus in his/her blood. It just confirms that he/she has been exposed to HIV. We will need to send your child’s blood to a lab for a special test to confirm if he/she has HIV. We will send the result to the health facility of your choice in about ten weeks from now. If you provide us with your contact information, we will contact you to inform you that the results have been sent to the facility and encourage you to go to the health facility to discuss your child’s HIV test results with a doctor or nurse.

391
What are the potential risks? [IF CHILD IS 0-9 YEARS OLD] The needle may be uncomfortable for children and may include bleeding and rarely, infection where the needle enters the skin. Experienced staff will do the tests under safe and clean conditions in order to protect your child against any risk. You and your child may learn that your child is infected with HIV. Learning about your child’s HIV infection may cause some emotional discomfort. We will provide counseling on how to cope with learning that your child has HIV and tell you where you may go for care and treatment for your child. Lastly, as with all surveys, there is a chance that confidentiality could be compromised. We are doing everything we can to minimize this risk.
[IF CHILD IS 10-17 YEARS OLD] Your child may feel uncomfortable about some of the questions I will ask during the interview. Your child can refuse to answer any question. The needle may be uncomfortable for children and may include bleeding and rarely, infection where the needle enters the skin. Experienced staff will do the tests under safe and clean conditions in order to protect your child against any risk. You and your child may learn that your child is infected with HIV and/or syphilis. Learning about your child’s HIV or syphilis infection may cause some emotional discomfort. We will provide counseling on how to cope with learning that your child has HIV or syphilis and tell you where you may go for care and treatment for your child. Lastly, as with all surveys, there is a chance that confidentiality could be compromised. We are doing everything we can to minimize this risk.
What are the potential benefits? The main benefit for your child to be in the survey is the chance to learn more about his/her health today. [IF CHILD IS 10-17 YEARS OLD] If your child has HIV and/or syphilis, you will learn where to take your child for treatment. If you already know that your child is HIV positive and he/she is on treatment, the CD4 and viral load tests can help your child’s doctor or nurse judge how well the treatment is working. Your child taking part in this survey could help us learn more about children, HIV and syphilis in Tanzania. [IF CHILD IS 0-9 YEARS OLD] If your child has HIV, you will learn where to take your child for treatment. If you already know that your child is HIV positive and he/she is on treatment, the CD4 and viral load tests can help your child’s doctor or nurse judge how well the treatment is working. Your child taking part in this survey could help us learn more about children, HIV in Tanzania.

392
What are alternatives to taking part? [IF CHILD IS 0-9 YEARS OLD] You can decide to not allow your eligible children aged 0-9 years to take part in the blood testing. Your decision to allow your children to take part or not take part in this survey will not affect your children’s health care in any way. [IF CHILD IS 10-17 YEARS OLD] You can decide not to have the study team ask your eligible children to take part in the interview or blood testing. Or you can allow your eligible children to take part in the interview, but not the blood testing. Or you can allow your eligible children to take part in the interview and blood testing, but not agree to allow your children’s leftover blood to be stored for future studies. Your decision to allow your children to take part or not take part in this survey will not affect your children’s health care in any way.
What about confidentiality? Your child’s test results will be kept strictly confidential. Your child’s name and the consent/permission and assent forms will be kept separate from his/her health information. Your name and your child’s name will not appear when we share survey results. When we share results, the information we collect from your child will be identified by a number and not by your name or your child’s name. (INTERVIEWER INDICATE INFORMATION BELOW ON CONSENT FORM, DO NOT READ ALOUD) The following individuals and agencies will be able to look at your child’s survey records to help oversee the conduct of this survey:
§ Staff members from the Institutional Review Boards or Ethics Committees overseeing the conduct of this survey to ensure that we are protecting your child’s rights as a participant. These include the National Institute for Medical Research (NIMR) and the Zanzibar Medical Ethics Council (ZAMEC) in Tanzania and the Institutional Review Boards at the Centers for Disease Control and Prevention (CDC; Atlanta, USA), Columbia University Medical Center and Westat (a statistical survey research organization)
§ The U.S. Office of Human Research Protections and other government agencies that oversee the safety of human subjects to ensure we are protecting your child’s rights as a person in this survey
§ Survey staff and monitors (INTERVIEWER READ FROM HERE)
The information we collect from your child will not be released outside of the survey groups listed above unless there is an issue of safety. Your permission to allow us to use and share your child’s name and contact information with the groups above will end three years after the end of the survey. Who should you contact if you have questions? If you want your child to leave the survey, have any questions about the survey, or feel that you child has been harmed by taking part, you should contact any of the Principal Investigators below:

393
(INTERVIEWER INDICATE ADDRESSES ON CONSENT FORM, DO NOT READ ALOUD) Dr. Albina Chuwa National Bureau of Statistics, 18 Kivukoni Road, Dar es Salaam P.O Box 796, 11992 Dar es Salaam, Tanzania. Tel: +255 (0) 22-2122722/3 Email: [email protected] Mr. Emilian Karugendo National Bureau of Statistics, 18 Kivukoni Road, Dar es Salaam P.O Box 796, 11992 Dar es Salaam, Tanzania. Tel: +255 (0) 22-2122722/3 [email protected]; or Mayasa Mahfoudh Mwinyi Office of the Chief Government Statistician P.O Box 2321, Zanzibar. Telephone number: +255 242231869 Email: [email protected] If you decide withdraw your child from the study, no more information will be collected from your child. We will make every effort to delete the information we have collected from your child. However, after today, we cannot guarantee we will be able to delete information that has already been shared. If you have any questions about your child’s rights as a person in this survey, you can contact:
Dr Mwele Malechela The Director General National Institute for Medical Research (NIMR) 3 Barack Obama Drive P. O. Box 9653, Dar es Salaam, Tanzania Tel: +255-22-2121400 Fax: +255-22-2121360 Email: [email protected] | [email protected]
Dr Msafiri L Marijani Zanzibar Medical Research and Ethics Committee (ZAMREC) Ministry of Health, Mnazi Mmoja Hospital, Michenzani - Zanzibar P.O.BOX 672. Zanzibar Email: [email protected] Telephone number: +25 577 6663303
(INTERVIEWER READ FROM HERE)
Are there any costs?

394
There is no cost to you for your child being in the survey other than your time. You should also know that neither you nor your child will be paid for your child to be in the survey.
Do you want to ask me anything about your child’s taking part in the survey?
Verbal Consent/Permission Statement I have read this form, and/or someone has read it to me. Any questions I had have been answered satisfactorily. I know that after allowing my child to take part, I may change my mind and withdraw him/her from taking part in this survey at any time. I have been offered a copy of this consent/permission form.
14. If you agree for us to ask your eligible child/children aged 10-17 years to do the interview, please state the following statement: “I give permission to the study team to ask my eligible child/children aged 10-17 years to take part in the interview.” ____Check this box if parent/guardian agrees to allow us to ask his/her eligible child/children to take part in the interview If you do not agree for us to ask your eligible child/children aged 10-17 years to do interview, please state the following statement: ”I do not wish for the study team to ask my eligible child/children aged 10-17 years to take part in the interview.” ____Check this box if parent/guardian refuses to allow the study team to ask his/her eligible child/children to take part in the interview (If permission given, proceed to the next question)
15. If you agree that your eligible child/children, ages 0-9 years, give blood for HIV testing and related testing and for us to ask your eligible child/children, ages 10-17 years, to give blood for HIV and syphilis testing and related testing and Hepatitis B or C testing for children, ages 15-17 years, please state the following statement: ”I agree for my eligible child/children, ages 0-9 years, to give blood for HIV and related testing and for the study team to ask my eligible child/children, ages 10-17 years, to give blood for HIV and syphilis testing and related testing, and for the study team to ask my eligible child/children, ages 15-17 years to give blood for HIV, hepatitis B or C, and syphilis testing and related testing.” ____Check this box if parent/guardian gives consent/permission for the study team to ask his/her eligible child/children to give blood for testing. If you do not agree that your eligible child/children ages 0-9 give blood for HIV testing and related testing or for us to ask your eligible child/children ages 10-17 to give blood for HIV and syphilis testing and related testing, or for us to ask your eligible child/children ages 15-17 to give blood for HIV, hepatitis B or C, and syphilis testing and related testing, please state the following statement: ”I do not wish for the study team to ask my eligible child/children to take part in blood testing today.” ____Check this box if parent/guardian refuses to allow the study team to ask his/her eligible child/children ages 0-17 to give blood for testing. (If permission given, proceed to the next question)

395
16. If you agree that your eligible child/children ages 0-9 leftover blood be stored for future research and for us to ask your eligible child/children ages 10-17 to have his/her leftover blood stored for future research , please state the following statement: ”I agree for the study team to have the leftover blood of my eligible child/children ages 0-9 stored for future research and for the study team to ask my eligible child/children ages 10-17 to have his/her leftover blood stored for future research.” ____Check this box if parent/guardian gives consent/permission for study team to ask his/her eligible child/children to have his/her leftover blood stored for future research or to have their eligible child/children’s leftover blood stored for future research. If you do not agree to have your eligible child/children ages 0-9 leftover blood stored for future research or for the study team to ask your eligible child/children ages 10-17 to have his/her leftover blood stored for future research, please state the following statement: ”I do not wish to have the leftover blood of my child/children ages 0-9 stored for future research or for the study team to ask my eligible child/children ages 10-17 to have their leftover blood stored for future research.” ____Check this box if parent/guardian refuses to have their eligible child’s leftover blood stored for future research, or to have study team ask his/her eligible child/children to have his/her leftover blood stored for future research.
17. If you agree for us to contact your eligible child/children ages 15-17 in the next two years to participate in future studies related to health in Tanzania, please state the following statement: ”I give permission for the study team to contact my eligible child/children ages 15-17 about participation in future studies.” ____Check this box if parent/guardian gives permission for study team to ask his/her eligible child/children about participating in future studies.
If you do not agree for us to contact your eligible child/children ages 15-17 to participate in future studies, please state the following statement:
”I do not wish for the study team to contact my eligible child/children ages 15-17 about participation in future studies.”
____Check this box if parent/guardian refuses to have study team ask his/her eligible child/children about participating in future studies.
Printed name of parent/guardian________________________________________
Parent/guardian ID number________________________________ (If applicable. If not applicable check here __)
Signature of person obtaining consent/permission_____________________ Date: ___/___/___

396
Printed name of person obtaining consent/permission____________________________
Survey staff ID number _________________________________
Child/Children’s name(s) (print) _________________________________________________________ Child/Children’s participant ID number (s) __________________________________________________
397
Consent to Share Contact Information for Active Linkage to Care of THIS Participants, 18+ years
What language do you prefer for our discussion today? ___English ___Kiswahili Purpose of consent
You had a positive HIV test today. We have provided you with a referral form to bring to a health clinic and seek HIV treatment and care. We would like to help you in accessing the health care that you need. If you agree, we may be able to provide your contact information and HIV test results to health care workers from the Ministry of Health (MOH)/ the Ministry of Health, Community Development, Gender, Elderly and Children (MOHCGEC) or to a partner that the MOH/ the MOHCGEC work with. This health care worker will contact you to talk to you about HIV and help you go for HIV care. Anyone who is provided with your details will be experienced in providing support to people living with HIV and will be trained in maintaining confidentiality.
What do you have to do if you agree to take part? If you agree for your information to be shared and to be contacted, we will provide your name, phone number (if you provided it to us) and your address to those health care providers to provide you with support. The health care worker can contact you by SMS, phone or in person.
What about confidentiality?
Your HIV test results and your contact information will not be shared with any other parties aside from what was specified in the other consent forms, and with this support organization. They will also do their utmost to maintain your confidentiality. However, we cannot guarantee complete confidentiality.
What are the potential risks? As with all surveys, there is a chance that confidentiality could be compromised. We are doing everything we can to minimize this risk. What are the potential benefits? A health care worker will assist you in accessing the health care that you need. Who should you contact if you have questions? If you change your mind or have any questions or feel that you have been harmed by taking part, you should contact any of the Principal Investigators listed below: Principal Investigator: Dr. Albina Chuwa National Bureau of Statistics, 18 Kivukoni Road, Dar Es Salaam P.O Box 796, 11992 Dar es Salaam, Tanzania. Tel: +255 (0) 22-2122722/3 Email: [email protected]

398
Mr Emilian Karugendo National Bureau of Statistics, 18 Kivukoni Road, Dar Es Salaam P.O Box 796, 11992 Dar es Salaam, Tanzania. Tel: +255 (0) 22-2122722/3 [email protected]; or Mayasa Mahfoudh Mwinyi Office of the Chief Government Statistician P.O Box 2321, Zanzibar. Telephone number: +255 242231869 Email: [email protected] If you have any questions about your rights as a person in this survey, you can contact either of the following persons:
Dr Mwele Malechela The Director General National Institute for Medical Research (NIMR) 3 Barack Obama Drive P. O. Box 9653, Dar es Salaam, Tanzania Tel: +255-22-2121400 Fax: +255-22-2121360 Email: [email protected] | [email protected]
Dr Msafiri L Marijani Zanzibar Medical Research and Ethics Committee (ZAMREC) Ministry of Health, Mnazi Mmoja Hospital, Michenzani - Zanzibar P.O.BOX 672. Zanzibar Email: [email protected] Telephone number: +25 577 6663303
Consent Statement
Any questions that I had were answered satisfactorily. I have been offered a copy of this consent form.
If you agree to allow us to share your contact information with the MOH/ the MOHCGEC or a partner that MOH/MOHCGEC works with who can help you go to a clinic to receive HIV treatment, care and support, please state the following:
“I agree to allow my contact information to be shared with the MOH/ the MOHCGEC or a partner that the MOH/MOHCGEC works with, to help me go to a clinic to receive HIV treatment, care and support”
____Check this box if participant AGREES to have their contact information shared with MOH/MOHCGEC
or their partner

399
If you DO NOT agree to allow us to share your contact information with MOH/ the MOHCGEC or a partner that MOH/ the MOHCGEC works with who can help you go to a clinic to receive treatment, care and support, please state the following:
“I DO NOT agree to allow my contact information to be shared with the MOH/MOHCGEC or a partner
that the MOH/MOHCGEC works with, to help me go to a clinic to receive HIV treatment, care and support” ____Check this box if participant DOES NOT AGREE to have their contact information shared with
MOH/MOHCGEC or their partner
1. If yes, do you agree to be contacted by?
SMS ______Yes ______No Phone call ______Yes ______No In person ______Yes ______No
Participant ID number ____________________________________________
Signature of person obtaining consent_______________________________ Date: ___/___/___
Printed name of person obtaining consent_____________________________
Survey staff ID number _________________________________

400
Consent to Share Contact Information for Active Linkage to Care of THIS Participants, parents of children
0-17years
What language do you prefer for our discussion today? ___English ___Kiswahili
Purpose of consent
Your child had a positive HIV test today. We have provided you with a referral form so that you and your child can take to a health clinic and seek HIV treatment and care. We would like to help you and your child in accessing the health care that your child needs. If you agree, we might be able to provide your contact information and your child’s HIV results to health care workers from the Ministry of Health (MOH)/ the Ministry of Health, Community Development, Gender, Elderly and Children (MOHCGEC) or a partner that the Ministry of Health works with. This counselor will contact you to talk to you and your child about HIV and help you and your child go for HIV care. Anyone who is provided with you and your child’s details will be experienced in providing support to people living with HIV and will be trained in maintaining confidentiality.
What do you have to do if you agree to take part? If you agree for your child’s information to be shared, and to be contacted, we will provide your name, phone number (if you provided it to us) and your address to those health care workers to provide you with support. The health care worker can contact you by SMS, phone or in person.
What about confidentiality? Your HIV test results and your contact information will not be shared with any other parties aside from what was specified in the other consent forms, and with this support organization. They will also do their utmost to maintain your confidentiality. However, we cannot guarantee complete confidentiality.
What are the potential risks? As with all surveys, there is a chance that confidentiality could be compromised. We are doing everything we can to minimize this risk.
What are the potential benefits? A health care worker will assist you in accessing the health care needed by your child. Who should you contact if you have questions? If you change your mind or have any questions or feel that you have been harmed by taking part, you should contact any of the Principal Investigators listed below:

401
Principal Investigator: Dr. Albina Chuwa National Bureau of Statistics, 18 Kivukoni Road, Dar Es Salaam P.O Box 796, 11992 Dar es Salaam, Tanzania. Tel: +255 (0) 22-2122722/3 Email: [email protected] Mr Emilian Karugendo National Bureau of Statistics, 18 Kivukoni Road, Dar Es Salaam P.O Box 796, 11992 Dar es Salaam, Tanzania. Tel: +255 (0) 22-2122722/3 [email protected]; or Mayasa Mahfoudh Mwinyi Office of the Chief Government Statistician P.O Box 2321, Zanzibar. Telephone number: +255 242231869 Email: [email protected] If you have any questions about your rights as a person in this survey, you can contact either of the following persons:
Dr Mwele Malechela The Director General National Institute for Medical Research (NIMR) 3 Barack Obama Drive P. O. Box 9653, Dar es Salaam, Tanzania Tel: +255-22-2121400 Fax: +255-22-2121360 Email: [email protected] | [email protected]
Dr Msafiri L Marijani Zanzibar Medical Research and Ethics Committee (ZAMREC) Ministry of Health, Mnazi Mmoja Hospital, Michenzani - Zanzibar P.O.BOX 672. Zanzibar Email: [email protected] Telephone number: +25 577 6663303
Consent Statement
Any questions that I had were answered satisfactorily. I have been offered a copy of this consent form.
If you agree to allow us to share your child’s contact information with MOH/ the MOHCGEC or a partner that MOH or the MOHCGEC work with who can help you and your child go to a clinic to receive HIV treatment, care and support, please state the following:

402
“I agree to allow my child’s contact information to be shared with the MOH/ the MOHCGEC or a partner that the MOH or the MOHCGEC work with, to help me and my child go to a clinic to
receive HIV treatment, care and support” ____Check this box if participant AGREES to have their child’s contact information shared with
MOH/ the MOHCGEC or their partner
If you DO NOT agree to allow us to share your child’s contact information with MOH/ the MOHCGEC or a partner that MOH/MOHCGEC works with who can help you and your child go to a clinic to receive treatment, care and support, please state the following:
“I DO NOT agree to allow my child’s contact information to be shared with the MOH/ the MOHCGEC or a partner that the MOH or the MOHCGEC works with, to help me and my child go to a clinic to receive HIV treatment, care and support”
____Check this box if participant DOES NOT AGREE to have their child’s contact information
shared with MOH/ the MOHCGEC or their partner
2. If yes, do you agree to be contacted by?
SMS ______Yes ______No Phone call ______Yes ______No In person ______Yes ______No
Parent/guardian’s Participant ID number ____________________________________________
Child’s Participant ID number ___________________________________
Signature of person obtaining consent________________________________ Date: ___/___/___
Printed name of person obtaining consent_____________________________
Survey staff ID number _________________________________

403