Taking China's Beijing-Tianjin-Hebei region as an example
9
Contents lists available at ScienceDirect Ecological Economics journal homepage: www.elsevier.com/locate/ecolecon Estimating inter-regional payments for ecosystem services: Taking China’s Beijing-Tianjin-Hebei region as an example Yongsheng Lin a , Zhanfeng Dong b , Wei Zhang c,d, *, Hongyu Zhang c a Market Economy Research Center of China, Beijing Normal University, Beijing, 100875 China b Environmental Audit Center, Chinese Academy of Environmental Planning, Beijing, 100012, China c State Environmental Protection Key Laboratory of Environmental Planning and Policy Simulation, Chinese Academy of Environmental Planning, Beijing, 100012, China d The Center for Beijing-Tianjin-Hebei Regional Environment, Chinese Academy of Environmental Planning, Beijing 100012, China ARTICLE INFO Keywords: Inter-regional payments for ecosystem services Beijing-Tianjin-Hebei region Multi-regional input-output model PES standards ABSTRACT The inter-regional payments for ecosystem services (PES) is an important policy to promote regional ecological and environmental cooperation. However, the existing inter-regional PES standard in China may underestimate the value of ecosystem services and omit the value of transferred pollutants due to inter-regional trade. A reasonable framework of inter-regional PES standards is necessary for the policymakers, especially in Beijing- Tianjin-Hebei (BTH) region with the most serious environmental problem in China. This paper employed the method of environmental impact evaluation and multi-regional input-output model (MRIO) to build a frame- work of inter-regional PES estimation, which both contained the regional spillover value of ecosystem services and the regional transfer value of pollutants. Finally, we estimate the amount of inter-regional payment for ecosystem services within BTH region. The results indicated that the PES standards within BTH region were 13.8 billion yuan and 19.2 billion yuan from Beijing, Tianjin to Hebei province in 2012, which accounted for 0.77 % and 1.49 % of their GDP in 2012. These PES standards are effective for regional ecological and environmental cooperation within BTH region and a multi-dimensional marketization mechanism should be implemented to reinforce inter-regional payment for ecosystem services, which may pave the way for other regions or countries. 1. Introduction One of the most important tasks that economists face in designing ecological or environmental policies is to evaluate the economic value of ecosystem services (ES) and implement the payments for ecosystem services (PES) (Pagiola and Platais, 2006; Farley and Costanza, 2010). PES refers to a volunteer transaction between the user and the supplier of ecosystem services, while a conditional payment is based on the ecosystem services generated by the natural resources management agreement between them (Wunder, 2015). Here, ES is a generalized concept that includes both environmental services, such as absorbing pollutants and purifying environment, and other services like life sup- porting, providing raw materials, recreation and aesthetic enjoyment. In China, PES will act as an important constitutional arrangement for the construction of eco-civilization and will be very helpful in pro- tecting the natural environment and promoting regional ecological and environmental cooperation in China (Hu et al.,2019). As an incentive mechanism aimed at encouraging ecosystem service suppliers to provide ecosystem services with positive externality or characteristics of public goods, PES is regarded as an application of Coase’s theory to ecological and environmental policies (Coase,1960) and is introduced to address the market failure to account for ex- ternalities. PES schemes offer financial incentives in exchange for the maintenance of ES provision (Van Hecken et al., 2015a). PES has been adopted as a mechanism designed and implemented at an international level to drive political commitments, policies and measures (Angelsen et al.,2012). Besides it has also been adopted by several national gov- ernments through a number of initiatives, often with explicit links to policies (Singh et al., 2015). So far, PES has been widely discussed and examined by international scholars, focusing on the definition, subjects, objects and standards (Wunder, 2005). One of the most popular definitions of PES was originally given by Wunder (2005) from the Center for International Forestry Research (CIFOR), who thought that PES usually involved four features: PES must be a voluntary behavior; ecosystem services can be clearly clas- sified as a certain method of land use to ensure that ecosystem services https://doi.org/10.1016/j.ecolecon.2019.106514 Received 21 June 2019; Received in revised form 23 September 2019; Accepted 21 October 2019 ⁎ Corresponding author at: State Environmental Protection Key Laboratory of Environmental Planning and Policy Simulation, Chinese Academy of Environmental Planning, Beijing, 100012, China. E-mail address: [email protected] (W. Zhang). Ecological Economics 168 (2020) 106514 0921-8009/ © 2019 Elsevier B.V. All rights reserved. T
-
Upload
khangminh22 -
Category
Documents
-
view
1 -
download
0
Transcript of Taking China's Beijing-Tianjin-Hebei region as an example

Contents lists available at ScienceDirect
Ecological Economics
journal homepage: www.elsevier.com/locate/ecolecon
Estimating inter-regional payments for ecosystem services: Taking China’sBeijing-Tianjin-Hebei region as an example
Yongsheng Lina, Zhanfeng Dongb, Wei Zhangc,d,*, Hongyu Zhangc
aMarket Economy Research Center of China, Beijing Normal University, Beijing, 100875 Chinab Environmental Audit Center, Chinese Academy of Environmental Planning, Beijing, 100012, Chinac State Environmental Protection Key Laboratory of Environmental Planning and Policy Simulation, Chinese Academy of Environmental Planning, Beijing, 100012, Chinad The Center for Beijing-Tianjin-Hebei Regional Environment, Chinese Academy of Environmental Planning, Beijing 100012, China
A R T I C L E I N F O
Keywords:Inter-regional payments for ecosystem servicesBeijing-Tianjin-Hebei regionMulti-regional input-output modelPES standards
A B S T R A C T
The inter-regional payments for ecosystem services (PES) is an important policy to promote regional ecologicaland environmental cooperation. However, the existing inter-regional PES standard in China may underestimatethe value of ecosystem services and omit the value of transferred pollutants due to inter-regional trade. Areasonable framework of inter-regional PES standards is necessary for the policymakers, especially in Beijing-Tianjin-Hebei (BTH) region with the most serious environmental problem in China. This paper employed themethod of environmental impact evaluation and multi-regional input-output model (MRIO) to build a frame-work of inter-regional PES estimation, which both contained the regional spillover value of ecosystem servicesand the regional transfer value of pollutants. Finally, we estimate the amount of inter-regional payment forecosystem services within BTH region. The results indicated that the PES standards within BTH region were 13.8billion yuan and 19.2 billion yuan from Beijing, Tianjin to Hebei province in 2012, which accounted for 0.77 %and 1.49 % of their GDP in 2012. These PES standards are effective for regional ecological and environmentalcooperation within BTH region and a multi-dimensional marketization mechanism should be implemented toreinforce inter-regional payment for ecosystem services, which may pave the way for other regions or countries.
1. Introduction
One of the most important tasks that economists face in designingecological or environmental policies is to evaluate the economic valueof ecosystem services (ES) and implement the payments for ecosystemservices (PES) (Pagiola and Platais, 2006; Farley and Costanza, 2010).PES refers to a volunteer transaction between the user and the supplierof ecosystem services, while a conditional payment is based on theecosystem services generated by the natural resources managementagreement between them (Wunder, 2015). Here, ES is a generalizedconcept that includes both environmental services, such as absorbingpollutants and purifying environment, and other services like life sup-porting, providing raw materials, recreation and aesthetic enjoyment.In China, PES will act as an important constitutional arrangement forthe construction of eco-civilization and will be very helpful in pro-tecting the natural environment and promoting regional ecological andenvironmental cooperation in China (Hu et al.,2019).
As an incentive mechanism aimed at encouraging ecosystem service
suppliers to provide ecosystem services with positive externality orcharacteristics of public goods, PES is regarded as an application ofCoase’s theory to ecological and environmental policies (Coase,1960)and is introduced to address the market failure to account for ex-ternalities. PES schemes offer financial incentives in exchange for themaintenance of ES provision (Van Hecken et al., 2015a). PES has beenadopted as a mechanism designed and implemented at an internationallevel to drive political commitments, policies and measures (Angelsenet al.,2012). Besides it has also been adopted by several national gov-ernments through a number of initiatives, often with explicit links topolicies (Singh et al., 2015). So far, PES has been widely discussed andexamined by international scholars, focusing on the definition, subjects,objects and standards (Wunder, 2005).
One of the most popular definitions of PES was originally given byWunder (2005) from the Center for International Forestry Research(CIFOR), who thought that PES usually involved four features: PESmust be a voluntary behavior; ecosystem services can be clearly clas-sified as a certain method of land use to ensure that ecosystem services
https://doi.org/10.1016/j.ecolecon.2019.106514Received 21 June 2019; Received in revised form 23 September 2019; Accepted 21 October 2019
⁎ Corresponding author at: State Environmental Protection Key Laboratory of Environmental Planning and Policy Simulation, Chinese Academy of EnvironmentalPlanning, Beijing, 100012, China.
E-mail address: [email protected] (W. Zhang).
Ecological Economics 168 (2020) 106514
0921-8009/ © 2019 Elsevier B.V. All rights reserved.
T

are provided; there are at least one purchaser and one supplier ofecosystem services; and the supplier can receive PES only when he orshe supplies ecosystem services (Wunder, 2005). Subsequently, someresearchers expanded the content of PES (Mao et al., 2002; Muradianet al., 2010; Sommerville et al., 2009; Tacconi, 2012). Wunder's defi-nition of PES has been widely criticized as too restrictive and normative(Muradian et al., 2010). In recent years, two main challenges to theconcept of PES have emerged with one political and the other con-ceptual (Daniel et al., 2017).
The political challenge to PES was that it reflected a wider ideologyof market environmentalism, emphasizing the commodification andmarketization of ecosystem services (Kosoy and Corbera, 2010). Themarket view of resource management relied on harnessing self-interestthrough individual incentives and therefore risked ‘crowding out’ in-trinsic motivations and pro-social behavior not based on instrumentalrationality (Midler et al., 2015; Muradian and Rival, 2013). The in-evitable ‘itemisation’ of ecosystem serviced as a precondition of theircommodification in PES schemes was criticized as an ideologicalstrategy for the neoliberalization of nature (Boisvert et al., 2013;Brockington, 2011; Peluso, 2012), just like the logic of ‘selling nature tosave it’ (McAfee, 1999).
The conceptual critique held that most PES programs ‘did not satisfythe strict criteria of markets (high commoditization; high con-ditionality; voluntariness)’ (Muradian and Rival, 2013). First, makingES into commodities was often difficult, as most ES were either publicgoods or common pool resources, which needed significant organiza-tional and political efforts and interventions to make them becometradable commodities (Muradian and Rival, 2013). Secondly, many PEScases failed to meet the conditionality criteria (Muradian et al., 2010).Thirdly, in many cases, the voluntary character of the transaction wasnot given (Kosoy et al., 2007). Furthermore, transaction costs in PESschemes were usually very high, which obviously contradicted theCoasean ideal of a market-based resolution of externalities. As the in-termediaries played a crucial role in the process of setting up PESschemes, which made transaction costs increase (Vatn, 2010). Theparticipants in PES are sellers and buyers. The sellers usually refer toecosystem services suppliers. As the land use type can impact thequantity and quality of ecosystem services, sellers of PES are mostlyland owners. The buyers can be divided into two types: the ecosystemservices user, who is also referred to as user payment, and the third partyrepresenting the ecosystem services user, who is also referred to asgovernment payment (Engel et al., 2008). In practice, the governmentsare the main participants of PES projects both in developed countriesand developing countries (Schomers and Matzdorf, 2013). The objectsof PES are activity types or ecosystem services. Changes in land use typewill affect the ecosystem services by altering biodiversity, systematicecological processes, and the environment (Ouyang and Zheng, 2009).
Among the related literatures about PES, most of them focused onoptimization models for contract and payments design (Ajayi et al.,2012), ES mapping (Daily et al., 2009), spatial targeting for the optimalselection of ES providers (Schomers et al.,2015) and cross-farm co-operation incentives among ES providers (Parkhurst and Shogren,2007; Wunder et al., 2008). However, they remained theorized in socialand political terms, resulting in a weak understanding of the role ofculture, agency, social diversity and power relations in the shaping ofPES institutions and their outcomes (Van Hecken et al., 2015b). Thenresearchers started to consider PES as ‘political projects’ by offering ananalytical tool for investigating power relations, political decisions,place specific ideas and social norms in the construction and operationof PES schemes (Daniel et al., 2017). Some scholars thought that thepromised efficiency gains of PES were hard to demonstrate, and re-commended conceptual modifications for PES from a hybrid institu-tional or ‘ecological economics’ perspective (Muradian et al., 2010).
The most difficult part of PES, both in theory and in practice, is theassessment of the economic value of ecosystem services and the es-tablishment of the PES standard (Song, 2018). If the standard is too
high, the buyer of PES can hardly afford the corresponding cost, whichwill be a huge burden on local governments. If it is too low, the seller ofPES may not have the incentive to protect the ecosystem and the en-vironment. Extensive literatures have focused on this issue, and there isa consensus that the PES standard should lie between the opportunitycost (lower limit) of protecting the ecosystem and the ecosystem ser-vices value (ESV) (upper limit) (Wunder, 2007; Ribaudo and Savage,2014). During the implementation procedure, many PES projects choseto set up standards in line with the opportunity cost, such as the Grainfor Green Project (GGP) and the Grassland Ecological Protection Project(GEP) of China (Li and Liu, 2010; Lin et al., 2017), the Cropland Re-tirement Project (CRP) and Environmental Quality Incentive Project(EQIP) of America (Claassen et al., 2008), and additional projects inCosta Rica, Mexico, etc. (Kalacska et al., 2008).
However, opportunity cost measures the revenue forgone by usingthe next best alternative use, which is difficult to be precisely quanti-fied. For example, a local government will have various alternative usesif not protecting its ecosystem, such as developing pollution-intensiveindustries, building commercial apartments, or constructing any otherinfrastructures, etc., so which is the next best alternative use and how tocalculate all the possible revenue from this use? Besides, the opportu-nity cost is the lower limit of PES, which underestimates PES standardand omits the value of ecosystem services themselves, especially thevalue of transferred pollutants due to inter-regional trade (Zhao et al.,2015; Yang et al., 2018). Because the primary aim of PES is to correctthe market failure of externalities in the field of ecology and environ-ment (see Appendix A in Supplementary material), it is necessary totake the value of ecosystem services spillover (positive externalities)and the value of trade-embodied pollutants (negative externalities) intoaccount to set up more reasonable PES standards. Fortunately, therewere some existing researches valuing the trade-embodied pollutionemissions, which provided significant perspective for the estimation ofthe inter-regional PES (Wang et al., 2017; Jiang et al., 2017; Xia et al.,2018)
Our major contribution to existing studies is to develop a formulacalculating inter-regional PES standards, based on the regional spillovervalue of ecosystem services and the value of regional transferred pol-lutants. With this formula, the calculation of PES standards will notneed to measure the opportunity costs anymore. The next section in-troduces the evolution of PES policies and practices in China, followedby a section presenting the framework of inter-regional PES estimation.Then, we describe a detailed case and address the application toBeijing-Tianjin-Hebei (BTH) region with empirical analysis. The finalsection discusses the model results and draws some conclusions.
2. Evolution of PES policies in China
The evolution of China’s PES policies can be summarized by fourcharacteristics: policy status becoming more important, areas involvedin PES becoming much more comprehensive, more stakeholders in-volved in PES, and more reasonable compensation principles.
First, the policy status is becoming more important. The statementof PES did not emerge in any laws or policy files but instead was im-plicitly embedded in environmental regulations from 1978 to 2004,rewarding actors with better performances in protecting the forest andgrassland. In China’s 11th Five-Year Plan in 2005, the Chinese govern-ment proposed to build a PES mechanism based on the principles that“the person or firm who exploited natural resources or polluted theenvironment should be responsible for its protection, and the person orfirm who benefited from better ecosystems and natural environmentshould pay the benefit.” Since then, a series of specific policies relatedto PES has been implemented, such as Guidance on implementation ofPES pilot work (in 2007), Measures (Pilot) of transfer payment in nationalkey ecological functional zones (in 2009), General Office of the StateCouncil’s opinion about acceleration of PES (in 2016), TreasuryDepartment’s guidance on establishing and accelerating long-run mechanism
Y. Lin, et al. Ecological Economics 168 (2020) 106514
2

of PES and protection in the Yangtze Economic Zone (in 2018), and Actionplan for establishing a marketized and multidimensional mechanism of PES(in 2019).
Secondly, areas involved in PES are becoming much comprehensive,ranging from the only forest, grassland and mine resources to also in-cluding important areas, such as Prohibited Development Zones (PDZs)and Key Ecological Functional Areas (KEFAs). The number of cities andcounties that can receive transfer payments in KEFAs increased from451 in 2010 to 816 in 2017. In addition, the PES of ecological redlineand the comprehensive PES of Qinghai Sanjiangyuan National Parkhave begun to be actively studied and explored. The PES of the riverbasin has been extended from intra-province to inter-province. To date,17 provinces have already implemented intra-province PES of riverbasins. Many river basins, such as Xin’anjiang, Jiuzhoujiang, Tingjiang-Hanjiang and Dongjiang, have signed inter-regional PES agreementsupstream and downstream of inter-province river basins. After theimplementation of the Ocean ecological civilization construction act(2015–2020), many places such as Shandong, Tianjin and Xiamen havebuilt ocean PES mechanisms, emphasizing sea pollution abatement.Shandong and Henan Provinces have begun to explore the PES of airquality.
Thirdly, more stakeholders are involved in PES. As PES methods inChina have changed from mainly focusing on vertical PES to combiningvertical and inter-regional PES, utilizing marketized and multi-dimensional tools and fiscal transfer payments by the central govern-ment. More and more stakeholders are participating in PES, includinggovernment and related sectors at all levels, as well as many firms andindividuals.
Finally, the compensation principles become more reasonable.China’s PES practices followed by the polluter pays principle in the1980s were confined to direct production costs or ecological construc-tion costs for ecosystem and environmental protection. Since 2005, thebeneficiary pays principle has been reflected in the PES practices, whichmeans that the party who developed should protect the environment,and the party who benefited from the environment should pay PES,where ecological protection costs, opportunity costs of development,and ecosystem services value have been taken into account.
In the past decades, great achievements have been made for China’sPES research, policies and practices; however, there are still someproblems to be addressed. For example, there are few inter-province orinter-regional PES cases that have been established, which will preventeffective regional environmental cooperation. There is still no unifiedformula to calculate PES standards; and there are no comprehensivePES cases taking both integrative ecosystem services and main pollu-tants interregional transferring into account.
Since China’s reform and opening-up in 1978, the PES policy andpractices have been continually optimized to facilitate environmentalprotection (Wang et al., 2019a, 2019b). However, there are still someshortcomings preventing neighboring areas from constructing effectivecooperative governance mechanisms based on the principles of sharingcosts and benefits, known as cooperative governance (Wang et al.,2019a, 2019b). Whereas the synergetic development of the BTH regionis one of China’s national strategies, and the ecological and environ-mental cooperation within this region is deemed as the most importantissue due to severe environmental problems, such as the cross-boundaryhaze and water pollution (Huang and Luo,2017). Measuring the amountof inter-regional PES within BTH region will be helpful for regionalecological and environmental cooperation (Fu et al., 2018; Song et al.,2018).
3. The framework of inter-regional PES estimation
An ideal institution for PES usually meets four principles (Lin et al.,2019). The first principle is parity, which means that the governmentrank or administrative level in PES must be the same, for example,province/state-to-province/state or city to city. If there is no such
parity, for example, one government is subject to or is less powerfulthan another, then the amount of PES would tend to be underestimatedor overestimated, and PES enforcement would be affected. The secondis measurability, which means that the economic value of an ecologicalservice can be measured as precisely as possible. The third principle isadditionality. Similar to a typical consumer’s behavior, paying moneyand receiving goods from shops, one local government will also pay PESto another local government; meanwhile, it must receive correspondingadditional ecological services from other regions or transfer its pollu-tants to other regions. The final principle is conditionality. Whether alocal government can receive PES from another must depend on someconditions, one of which is that the local government truly takes po-sitive measures to protect its ecology and environment, rather than thelocal government doing nothing since it naturally possesses a goodnatural ecological environment. Taking this into account, the exactamount of PES should not be set up merely according to the economicvalue of the ecological services offered by some local regions for acertain period. To what extent the local government takes positive ac-tion to protect its ecological environment must also be taken into ac-count.
3.1. Models to calculate the standards of PES
Existing studies about estimation of PES usually employ pureeconometric model based on willing to accept (WTA) (Kang et al.,2019), arithmetic model aiming to evaluate environmental benefitsgenerated from certain types of ecosystems (Ranjan, 2019), or oppor-tunity cost method to calculate the horizontal transfer payment (Liuet al., 2019). However, few of them can construct a consistent model tocalculate the standards of PES, taking both the positive externality(ecosystem services spillover effect) and the negative externality (re-gional transfer of pollutants) into account, which will be our maincontribution in this paper.
Taking two regions as an example, region r and region s, PESs-r re-presents the amount of money that region s pays to region r.
= +− − −PES VESS VPSs r r s s r (1)
where VESSr-s is the value of the ecosystem services that spills over fromregion r to region s and VPSs-r is the value (also called abatement cost)of the pollutants transferred from region s to region r.
3.1.1. Calculating the value of VESSThe value of the ecosystem services between region r and region s
are calculated by the following equation.
=+
× ×
= < <
−VESSM
ESV β
M N β
11
1, 2, 3... ; 0 1
r sr
r r
r (2)
where Mr is the number of regions adjacent to region r. Here, we sup-pose that region s is one neighbor of region r, which can share theecosystem services of region r equally with region r and other neighborsof region r. ESVr is the ecosystem services value of region r, βr re-presents to what extent region r has tried to protect its ecosystem,where βr = 0 means there are no policies to protect the ecosystem inregion r, and βr = 1 means region r has tried its best to protect itsnatural ecological environment. Beijing, Tianjin and Hebei have two,two and seven neighboring regions, respectively; therefore, M forBeijing, Tianjin and Hebei are 2, 2, 7.
Chinese central government released a green development assess-ment guide for each province in December 2016 (NationalDevelopment and Reform Commission (NDRC), 2016), which containsa green development indicator (GDI) and six sub-indicators: resourceusage, environment treatment, environment quality, ecosystem pro-tection, growth quality and green life. Both the GDI and its 6 sub-in-dicators have a full score of 100 according to assessment guide.
Here, we employed two sub-indicators, environmental treatment
Y. Lin, et al. Ecological Economics 168 (2020) 106514
3
and ecosystem protection, in our paper to measure the extent to whichthe local government positively protects its ecosystem and natural en-vironment. The first assessment report of green development for eachprovince has been released at the end of 2017, containing the scores ofthe above-mentioned two sub-indicators for Beijing, Tianjin and Hebei.
To get the value of β, we have,
=+
βG G( )/2
100rrenv
reco
(3)
Here, Grenv and Gr
eco are province r’s scores of sub-indicators, environ-mental treatment and ecosystem protection. Each province’s scores canbe found in the released report. We use the arithmetic average of theabove two scores (divided by 100) to represent region r’s β value. Aftercalculation, the β value of Beijing, Tianjin and Hebei are 0.85, 0.74 and0.80, respectively.
To calculate ESVr, we divided the ecosystem of region r into 6 ca-tegories based on various types of land use, including cropland (ES1),forest (ES2), grassland (ES3), shrubland (ES4), wetland (ES5), andwater (ES6).
∑= ×=
ESV ES Pr k rk k1
6(4)
where ESrk is the area of ecosystem category k in region r. Pk indicatesthe economic value of per unit area of ecosystem category k.
3.1.2. Calculating the value of VPSFor VPSs-r, we employ the multi-regional input-output Model
(MRIO), calculating the number of net pollutants transferring from re-gion s to region r and then estimating the value of these pollutants. TheMRIO can describe the industries’ interactions and the relationshipsbetween the consumption of the final goods and the total output amongall the regions with a multi-regional input-output table (Miller andBlair, 2009; Wiedmann et al., 2011). Combining the MRIO and theresources and environment data enables us to reveal exactly how muchresources are depleted and how many pollutants are emitted by otherregions due to one specific region’s final goods consumption (Fenget al., 2013; Peters, 2008; Su and Ang, 2011; Zhang et al., 2018).Suppose that there are n production sectors and m regions, r and s areregions, and i and j are the production sectors. According to the identityof MRIO, we have
∑ ∑ ∑= + +x z y eir
s j ijrs
s irs
ir
(5)
where, xir is the total output of sector i in region r, which is a n×1
matrix; zijrs denotes part of output of sector i in region r assigned to
sector j in region s as input, which is a n×n matrix; yirs denotes part of
output of sector i in region r assigned to region s as final goods con-sumption, which is a n×m matrix; and ei
r is the export of sector i inregion r.
Let =a z x/ijrs
ijrs
js denote the direct consumption coefficient; then, Eq.
(4) can be written as follows:
∑ ∑ ∑= + +x a x y eir
s j ijrs
js
s irs
ir
(6)
Then, let =X x( )ir , =Y y( )i
rs , =E e( )ir , so Eq. (5) can be written by
= + +X AX Y E (7)
Eq. (5) can, therefore, be transformed as follows:
= − +−X I A Y E( ) ( )1 (8)
The output X induced by domestic consumption and export can beexpressed by
= − −X I A P( ) 1 (9)
where I is an identity matrix, and − −I A( ) 1 is the Leontief’s inversematrix in MRIO. P = Y+E is a column matrix combining domesticconsumption and exports. Let = − −L I A( ) 1, whose element lij
rs denotesthe output of sector i in region r consumed directly and indirectly by
sector j in region s per unit of final goods.Let = ×F f( )r
ir
n 1, and =f g x/ir
ir
ir denote the pollution emissions per
unit of output for sector i in region r (ton/yuan), where gir is the
quantity of pollution emissions for sector i in region r.Therefore, we have
=−E F LPr sr s (10)
=−E F LPs rs r (11)
Here, =− ×E e( )s r ijsr
mn mn, where eijsr measures the pollutant emissions
transferred from sector j in region r to sector i in region s due to theconsumption and exports of region r. Then, we can obtain VPSs-r asfollowing,
= ×−−VPS v
Eηs r
trt s r
t
t (12)
Where t represent pollutant (SO2, NOx, COD and NH3-N); vrt is pollutant
t’s emission tax rate in region r, indicating the tax required for each unitof pollutant t. −VPSs r
t represent the monetary value of transferred pol-lutant t from region s to region r.
3.2. Data sources
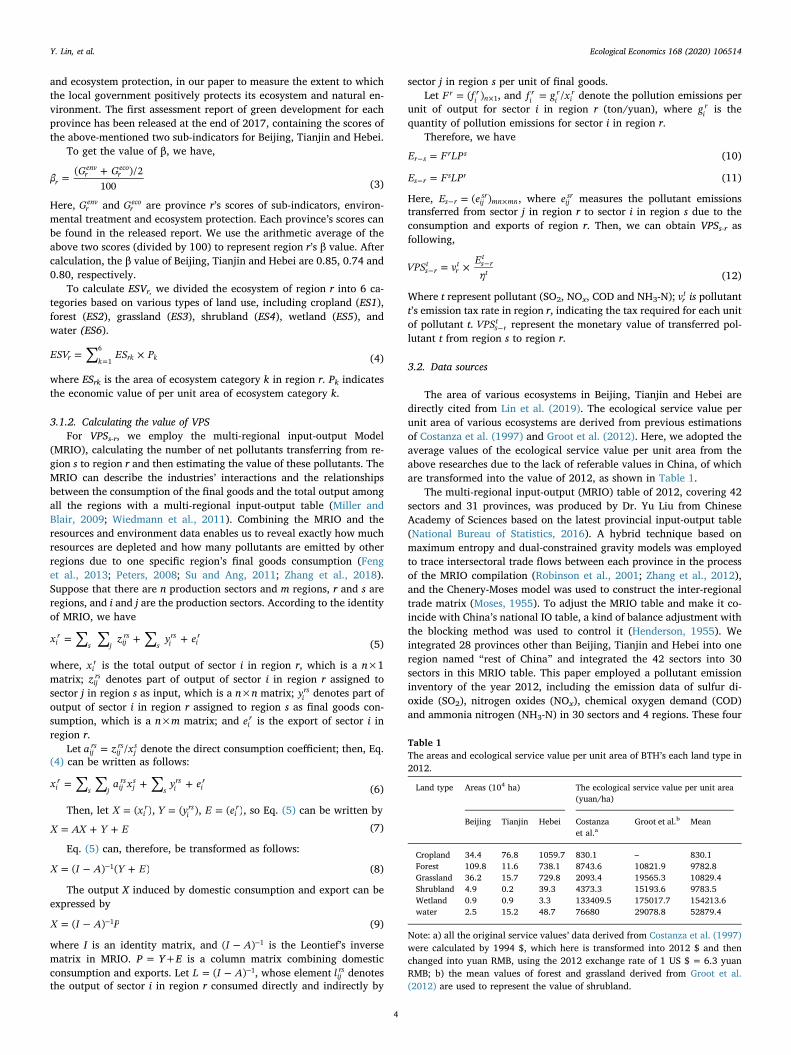
The area of various ecosystems in Beijing, Tianjin and Hebei aredirectly cited from Lin et al. (2019). The ecological service value perunit area of various ecosystems are derived from previous estimationsof Costanza et al. (1997) and Groot et al. (2012). Here, we adopted theaverage values of the ecological service value per unit area from theabove researches due to the lack of referable values in China, of whichare transformed into the value of 2012, as shown in Table 1.
The multi-regional input-output (MRIO) table of 2012, covering 42sectors and 31 provinces, was produced by Dr. Yu Liu from ChineseAcademy of Sciences based on the latest provincial input-output table(National Bureau of Statistics, 2016). A hybrid technique based onmaximum entropy and dual-constrained gravity models was employedto trace intersectoral trade flows between each province in the processof the MRIO compilation (Robinson et al., 2001; Zhang et al., 2012),and the Chenery-Moses model was used to construct the inter-regionaltrade matrix (Moses, 1955). To adjust the MRIO table and make it co-incide with China’s national IO table, a kind of balance adjustment withthe blocking method was used to control it (Henderson, 1955). Weintegrated 28 provinces other than Beijing, Tianjin and Hebei into oneregion named “rest of China” and integrated the 42 sectors into 30sectors in this MRIO table. This paper employed a pollutant emissioninventory of the year 2012, including the emission data of sulfur di-oxide (SO2), nitrogen oxides (NOx), chemical oxygen demand (COD)and ammonia nitrogen (NH3-N) in 30 sectors and 4 regions. These four
Table 1The areas and ecological service value per unit area of BTH’s each land type in2012.
Land type Areas (104 ha) The ecological service value per unit area(yuan/ha)
Beijing Tianjin Hebei Costanzaet al.a
Groot et al.b Mean
Cropland 34.4 76.8 1059.7 830.1 – 830.1Forest 109.8 11.6 738.1 8743.6 10821.9 9782.8Grassland 36.2 15.7 729.8 2093.4 19565.3 10829.4Shrubland 4.9 0.2 39.3 4373.3 15193.6 9783.5Wetland 0.9 0.9 3.3 133409.5 175017.7 154213.6water 2.5 15.2 48.7 76680 29078.8 52879.4
Note: a) all the original service values’ data derived from Costanza et al. (1997)were calculated by 1994 $, which here is transformed into 2012 $ and thenchanged into yuan RMB, using the 2012 exchange rate of 1 US $ = 6.3 yuanRMB; b) the mean values of forest and grassland derived from Groot et al.(2012) are used to represent the value of shrubland.
Y. Lin, et al. Ecological Economics 168 (2020) 106514
4
pollutants have become officially mandatory control pollutants inChina’s National Total Emission Control (NTEC) policy since 2006,which can represent China's situation of air and water pollution (Zhanget al., 2015). This pollutant emissions inventory was derived from theChina Environmental Statistics (CES) database. Noted that both theMRIO table and emission inventory were used in our previous re-searches (Zhang et al., 2018, 2019).
To simplify the discharge fee of various pollutants, China’s Ministryof Environmental Protection (MEP) designed a new measure named“pollutant equivalent (PE)”, which allows aggregating different types ofpollutants according to their environmental and health impacts by as-signing a specific coefficient representing their respective damage toeach pollutant. Here, the conversion coefficients of each pollutant to PEare shown in Table 2. In other words, per kg PE equal to 0.95, 0.95, 1and 0.8 kg of SO2, NOx, COD and NH3-N based on the impacts of in-dividual pollutant on air quality or public health (Zhang et al., 2018).On the other hand, according to the law of environmental protection taxof China (Standing Committee of the Twelfth National People’sCongress of China, 2016), the tax amount for each PE of atmosphericpollutants and water pollutants are among 1.2∼12 yuan and 1.4∼14yuan, respectively. Each province can determine local specific taxamount within this scope according to actual conditions. Because theBTH region is the most polluted region in China, so three provinces,Beijing, Tianjin and Hebei, all significantly increased their local tax rateof air pollutants (SO2 and NOx) and water pollutants (COD and NH3-N)(Table 2).
4. Empirical analysis
4.1. Ecosystem services regional spillover value within BTH region
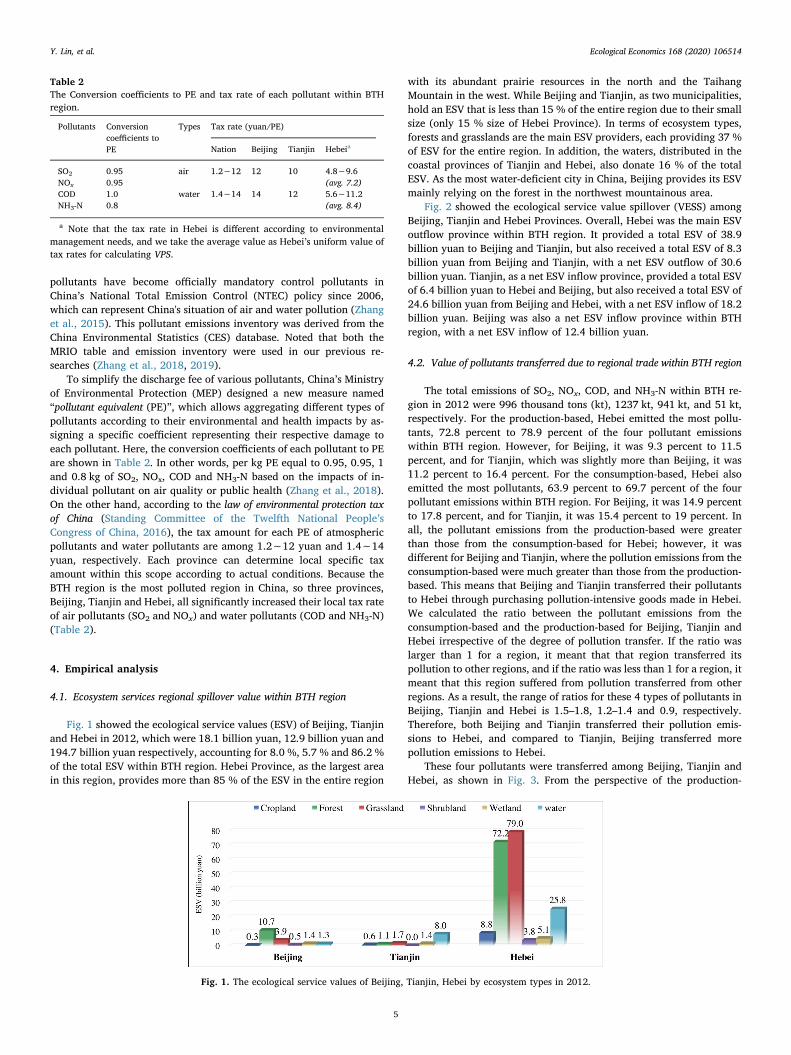
Fig. 1 showed the ecological service values (ESV) of Beijing, Tianjinand Hebei in 2012, which were 18.1 billion yuan, 12.9 billion yuan and194.7 billion yuan respectively, accounting for 8.0 %, 5.7 % and 86.2 %of the total ESV within BTH region. Hebei Province, as the largest areain this region, provides more than 85 % of the ESV in the entire region
with its abundant prairie resources in the north and the TaihangMountain in the west. While Beijing and Tianjin, as two municipalities,hold an ESV that is less than 15 % of the entire region due to their smallsize (only 15 % size of Hebei Province). In terms of ecosystem types,forests and grasslands are the main ESV providers, each providing 37 %of ESV for the entire region. In addition, the waters, distributed in thecoastal provinces of Tianjin and Hebei, also donate 16 % of the totalESV. As the most water-deficient city in China, Beijing provides its ESVmainly relying on the forest in the northwest mountainous area.
Fig. 2 showed the ecological service value spillover (VESS) amongBeijing, Tianjin and Hebei Provinces. Overall, Hebei was the main ESVoutflow province within BTH region. It provided a total ESV of 38.9billion yuan to Beijing and Tianjin, but also received a total ESV of 8.3billion yuan from Beijing and Tianjin, with a net ESV outflow of 30.6billion yuan. Tianjin, as a net ESV inflow province, provided a total ESVof 6.4 billion yuan to Hebei and Beijing, but also received a total ESV of24.6 billion yuan from Beijing and Hebei, with a net ESV inflow of 18.2billion yuan. Beijing was also a net ESV inflow province within BTHregion, with a net ESV inflow of 12.4 billion yuan.
4.2. Value of pollutants transferred due to regional trade within BTH region
The total emissions of SO2, NOx, COD, and NH3-N within BTH re-gion in 2012 were 996 thousand tons (kt), 1237 kt, 941 kt, and 51 kt,respectively. For the production-based, Hebei emitted the most pollu-tants, 72.8 percent to 78.9 percent of the four pollutant emissionswithin BTH region. However, for Beijing, it was 9.3 percent to 11.5percent, and for Tianjin, which was slightly more than Beijing, it was11.2 percent to 16.4 percent. For the consumption-based, Hebei alsoemitted the most pollutants, 63.9 percent to 69.7 percent of the fourpollutant emissions within BTH region. For Beijing, it was 14.9 percentto 17.8 percent, and for Tianjin, it was 15.4 percent to 19 percent. Inall, the pollutant emissions from the production-based were greaterthan those from the consumption-based for Hebei; however, it wasdifferent for Beijing and Tianjin, where the pollution emissions from theconsumption-based were much greater than those from the production-based. This means that Beijing and Tianjin transferred their pollutantsto Hebei through purchasing pollution-intensive goods made in Hebei.We calculated the ratio between the pollutant emissions from theconsumption-based and the production-based for Beijing, Tianjin andHebei irrespective of the degree of pollution transfer. If the ratio waslarger than 1 for a region, it meant that that region transferred itspollution to other regions, and if the ratio was less than 1 for a region, itmeant that this region suffered from pollution transferred from otherregions. As a result, the range of ratios for these 4 types of pollutants inBeijing, Tianjin and Hebei is 1.5–1.8, 1.2–1.4 and 0.9, respectively.Therefore, both Beijing and Tianjin transferred their pollution emis-sions to Hebei, and compared to Tianjin, Beijing transferred morepollution emissions to Hebei.
These four pollutants were transferred among Beijing, Tianjin andHebei, as shown in Fig. 3. From the perspective of the production-
Table 2The Conversion coefficients to PE and tax rate of each pollutant within BTHregion.
Pollutants Conversioncoefficients toPE
Types Tax rate (yuan/PE)
Nation Beijing Tianjin Hebeia
SO2 0.95 air 1.2∼12 12 10 4.8∼9.6(avg. 7.2)NOx 0.95
COD 1.0 water 1.4∼14 14 12 5.6∼11.2(avg. 8.4)NH3-N 0.8
a Note that the tax rate in Hebei is different according to environmentalmanagement needs, and we take the average value as Hebei’s uniform value oftax rates for calculating VPS.
Fig. 1. The ecological service values of Beijing, Tianjin, Hebei by ecosystem types in 2012.
Y. Lin, et al. Ecological Economics 168 (2020) 106514
5

based, Tianjin and Hebei undertook a relatively higher share of pollu-tion emissions for other provinces of China than did Beijing, with 13percent to 18 percent, 13 percent to 16 percent, and 9 percent to 10percent, respectively. From the perspective of the consumption-based,Beijing transferred the highest share of pollution emissions to otherprovinces, amounting from 40 percent to 50 percent. For Tianjin, it was27 percent to 37 percent, and for Hebei, it was 1 percent to 3 percent.Overall, the pollution emissions that Hebei undertook for other pro-vinces were much more than it transferred to other provinces. Theemissions of SO2, NOx, COD, NH3-N that Hebei undertook for otherprovinces were 99 kt, 111 kt, 87 kt and 5 kt higher, respectively, thanthe emissions that Hebei transferred to other provinces. However, thepollution emissions that Beijing and Tianjin transferred to other pro-vinces were much greater than those that they undertook for otherprovinces. The emissions of SO2, NOx, COD, NH3-N that Beijing trans-ferred to other provinces were 73 kt, 26 kt, 78 kt and 32 kt higher, re-spectively, than those that it undertook for other provinces. The emis-sions of SO2, NOx, COD, NH3-N Tianjin transferred to other provinceswere 47 kt, 40 kt, 2.7 kt and 2 kt higher, respectively, than those that itundertook for other provinces (Fig. 4).
During the course of regional trade within BTH region, developedregions (such as Beijing and Tianjin) usually transfer large amounts ofpollution emissions to less developed regions (such as Hebei) throughgoods and services consumption. Fig. 5 shows the main pollutantemissions transferred among Beijing, Tianjin and Hebei. For the re-gional trade within BTH region, Hebei was the only province with a netinflow of pollutant emissions, and both Beijing and Tianjin transferredpollution emissions to Hebei. For air pollution, there was a net inflow of64 kt of SO2 and 69 kt of NOx transfer to Hebei from Beijing, 65 percentand 62.3 percent of Hebei’s total net inflow of SO2 and NOx, respec-tively. All other residual parts of Hebei’s total net inflow of SO2 andNOx came from Tianjin. For water pollution, Beijing and Tianjin
contributed nearly fifty percent of the net inflow of COD and NH3-N toHebei.
According to Eq. (12), we calculated the net transfer value of tradehidden pollutant emission referring to the tax rate of each pollutant andobtained the net trade-induced VPS of four pollutants among provinces.According to the results (Fig. 5e), Beijing had a total outflow VPS of1636 million yuan, among which 1394 million yuan VPS was trans-ferred to Hebei through trade, accounting for 85 %, indicating thatBeijing needed Hebei to bear 1394 million yuan pollution control ex-penses; while 242 million yuan VPS was transferred to Tianjin, ac-counting for 15 %. Tianjin also transferred a VPS of 976 million yuan toHebei during the trade with Hebei, indicating that Tianjin needed Hebeito bear 976 million yuan for pollution control. In the process of tradewith Beijing and Tianjin, Hebei Province incurred a total cost of 2371million yuan for pollution control.
4.3. The PES standards within BTH region
According to the above results, Beijing and Tianjin benefited fromthe positive externality of BTH, receiving 12.4 billion yuan and 18.2billion yuan net VESS from Hebei, respectively. Additionally, they alsobenefited from the negative externality of BTH, transferring a largenumber of pollutants to Hebei Province, which needs Hebei to payadditional 2.4 billion yuan for removing pollutant emissions caused byconsumption of Beijing and Tianjin. Considering that Hebei has pro-vided above ecological services for the other two cities, for the sake offairness, this paper recommends that the standard of PES to Hebeiprovince is set at 33 billion yuan within BTH region. Specifically,Beijing and Tianjin should pay 13.8 billion yuan and 19.2 billion yuanrespectively to Hebei province for ecological services (Fig. 6).
Fig. 2. Regional spillover of VESS within BTH region in 2012.
Fig. 3. Pollution emissions from production-based and consumption-based within BTH region (2012). Note that the number on the right side of this bar chartis the ratio between pollution emissions from the consumption-based and from the production-based, with a number larger than 1 indicating that emissions from theconsumption-based were more than from the production-based, and vice versa.
Y. Lin, et al. Ecological Economics 168 (2020) 106514
6

5. Discussion and conclusion
It was pointed out in China’s overall plan of ecological civilizationsystem reform that the water conservation area (WCA) within BTH re-gion should carry out inter-regional PES mechanisms. Cooperative de-velopment outline for the areas around Bo Hai also encouraged relativeregions to build up inter-regional PES institutions, launching a pilotproject of inter-regional PES between ecologically protected areas andbeneficial areas of river basins. To date, inter-regional PES mechanisms,vertical PES accompanied by inter-regional PES in the forms of moneyand technique, have been established between the city of Beijing andZhangjiakou, northwest of BTH region. During the period of2009–2016, ecological fiscal transfer from the central government toZhangjiakou increased from 0.19 billion yuan to 0.95 billion yuan, andcounterpart funding from local governments (Hebei Province and cityof Zhangjiakou) increased from 23 million yuan in 2009 to 53 millionyuan in 2015 (Environment Daily of China, 2018). In 2016, coordinatedby China’s Ministry of Environment Protection (MEP) and Ministry ofFinance (MOF), Hebei and Tianjin signed the Agreement of inter-regionalPES upstream and downstream of the Luan River to Tianjin, in which Hebeiand Tianjin should co-establish environmental compensation funds,each contributing 0.1 billion yuan per year from 2016 to 2018.
According to this agreement, Hebei should ensure and improve thewater quality of the Luan River through non-point-source pollutionabatement. If the water quality achieves or surpasses the establishedannual target, Tianjin will transfer all the funds in that year to HebeiProvince, besides China’s central government will reward Hebei Pro-vince 0.3 billion yuan at most per year depending on the detailed waterquality of the Luan River to Tianjin for pollution abatement. In 2018,Hebei and Beijing signed the Agreement of inter-regional PES for the WCAof the Chao and Bai River Basin upstream of the Miyun reservoir(2018–2020), according to which, water quality and behaviors in theupstream would be examined. Beijing had already paid 0.2 billion yuanin advance to Hebei in 2018 and would audit the account in 2019 bytargets achieved. At the same time, Beijing and Hebei will launch a pilotproject of integrated environmental protection at the upstream of theMiyun reservoir.
The PES of the river basin within BTH region did transform certainamounts of money into environmental pollution abatement. As thewater quality of the river basin was improved in the short term, manytasks appeared at the same time, especially the fiscal burdens andsubsequent social responsibilities for the upstream area of the riverbasin. To protect the water resources of Beijing and Tianjin, which liesdownstream of the river basin, the cities of Chengde, Zhangjiakou and
Fig. 4. Pollutant emissions transferred from BTH to other provinces and the share of total emissions emitted in 2012.
Fig. 5. Net trade-induced pollutants emissions and related VPS transfers within BTH region in 2012. Note that the size of Beijing, Tianjin and Hebei in (a)–(e)does not represent the actual area.
Y. Lin, et al. Ecological Economics 168 (2020) 106514
7
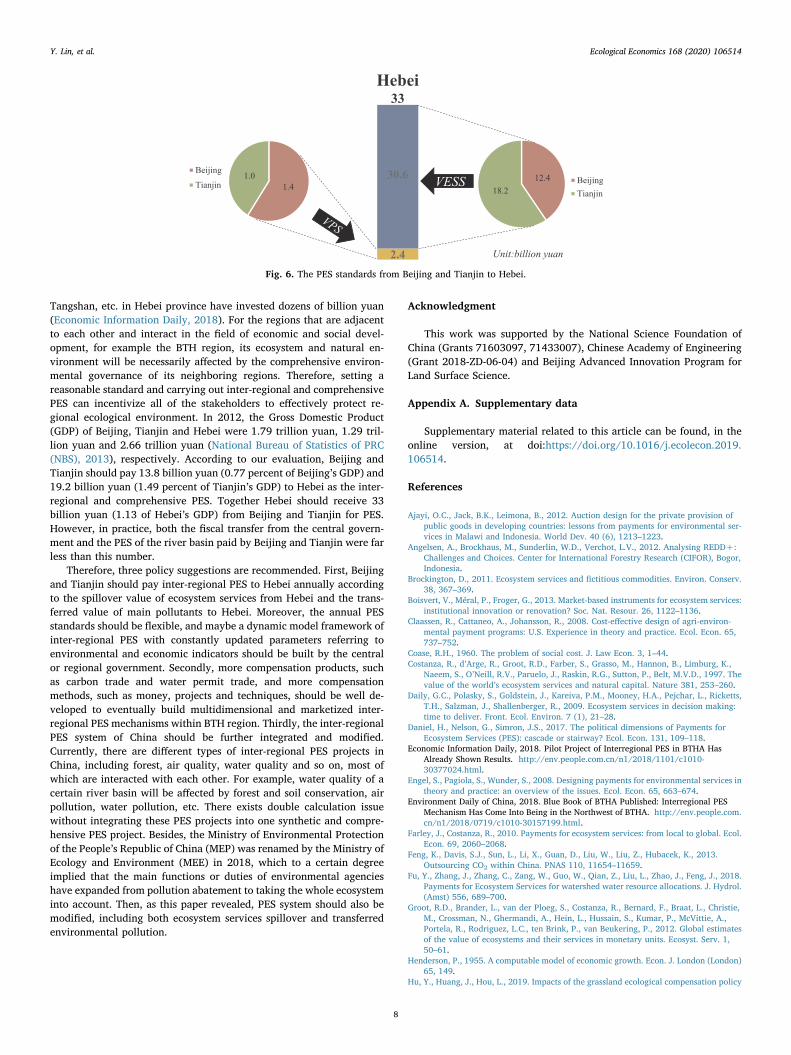
Tangshan, etc. in Hebei province have invested dozens of billion yuan(Economic Information Daily, 2018). For the regions that are adjacentto each other and interact in the field of economic and social devel-opment, for example the BTH region, its ecosystem and natural en-vironment will be necessarily affected by the comprehensive environ-mental governance of its neighboring regions. Therefore, setting areasonable standard and carrying out inter-regional and comprehensivePES can incentivize all of the stakeholders to effectively protect re-gional ecological environment. In 2012, the Gross Domestic Product(GDP) of Beijing, Tianjin and Hebei were 1.79 trillion yuan, 1.29 tril-lion yuan and 2.66 trillion yuan (National Bureau of Statistics of PRC(NBS), 2013), respectively. According to our evaluation, Beijing andTianjin should pay 13.8 billion yuan (0.77 percent of Beijing’s GDP) and19.2 billion yuan (1.49 percent of Tianjin’s GDP) to Hebei as the inter-regional and comprehensive PES. Together Hebei should receive 33billion yuan (1.13 of Hebei’s GDP) from Beijing and Tianjin for PES.However, in practice, both the fiscal transfer from the central govern-ment and the PES of the river basin paid by Beijing and Tianjin were farless than this number.
Therefore, three policy suggestions are recommended. First, Beijingand Tianjin should pay inter-regional PES to Hebei annually accordingto the spillover value of ecosystem services from Hebei and the trans-ferred value of main pollutants to Hebei. Moreover, the annual PESstandards should be flexible, and maybe a dynamic model framework ofinter-regional PES with constantly updated parameters referring toenvironmental and economic indicators should be built by the centralor regional government. Secondly, more compensation products, suchas carbon trade and water permit trade, and more compensationmethods, such as money, projects and techniques, should be well de-veloped to eventually build multidimensional and marketized inter-regional PES mechanisms within BTH region. Thirdly, the inter-regionalPES system of China should be further integrated and modified.Currently, there are different types of inter-regional PES projects inChina, including forest, air quality, water quality and so on, most ofwhich are interacted with each other. For example, water quality of acertain river basin will be affected by forest and soil conservation, airpollution, water pollution, etc. There exists double calculation issuewithout integrating these PES projects into one synthetic and compre-hensive PES project. Besides, the Ministry of Environmental Protectionof the People’s Republic of China (MEP) was renamed by the Ministry ofEcology and Environment (MEE) in 2018, which to a certain degreeimplied that the main functions or duties of environmental agencieshave expanded from pollution abatement to taking the whole ecosysteminto account. Then, as this paper revealed, PES system should also bemodified, including both ecosystem services spillover and transferredenvironmental pollution.
Acknowledgment
This work was supported by the National Science Foundation ofChina (Grants 71603097, 71433007), Chinese Academy of Engineering(Grant 2018-ZD-06-04) and Beijing Advanced Innovation Program forLand Surface Science.
Appendix A. Supplementary data
Supplementary material related to this article can be found, in theonline version, at doi:https://doi.org/10.1016/j.ecolecon.2019.106514.
References
Ajayi, O.C., Jack, B.K., Leimona, B., 2012. Auction design for the private provision ofpublic goods in developing countries: lessons from payments for environmental ser-vices in Malawi and Indonesia. World Dev. 40 (6), 1213–1223.
Angelsen, A., Brockhaus, M., Sunderlin, W.D., Verchot, L.V., 2012. Analysing REDD+:Challenges and Choices. Center for International Forestry Research (CIFOR), Bogor,Indonesia.
Brockington, D., 2011. Ecosystem services and fictitious commodities. Environ. Conserv.38, 367–369.
Boisvert, V., Méral, P., Froger, G., 2013. Market-based instruments for ecosystem services:institutional innovation or renovation? Soc. Nat. Resour. 26, 1122–1136.
Claassen, R., Cattaneo, A., Johansson, R., 2008. Cost-effective design of agri-environ-mental payment programs: U.S. Experience in theory and practice. Ecol. Econ. 65,737–752.
Coase, R.H., 1960. The problem of social cost. J. Law Econ. 3, 1–44.Costanza, R., d’Arge, R., Groot, R.D., Farber, S., Grasso, M., Hannon, B., Limburg, K.,
Naeem, S., O’Neill, R.V., Paruelo, J., Raskin, R.G., Sutton, P., Belt, M.V.D., 1997. Thevalue of the world’s ecosystem services and natural capital. Nature 381, 253–260.
Daily, G.C., Polasky, S., Goldstein, J., Kareiva, P.M., Mooney, H.A., Pejchar, L., Ricketts,T.H., Salzman, J., Shallenberger, R., 2009. Ecosystem services in decision making:time to deliver. Front. Ecol. Environ. 7 (1), 21–28.
Daniel, H., Nelson, G., Simron, J.S., 2017. The political dimensions of Payments forEcosystem Services (PES): cascade or stairway? Ecol. Econ. 131, 109–118.
Economic Information Daily, 2018. Pilot Project of Interregional PES in BTHA HasAlready Shown Results. http://env.people.com.cn/n1/2018/1101/c1010-30377024.html.
Engel, S., Pagiola, S., Wunder, S., 2008. Designing payments for environmental services intheory and practice: an overview of the issues. Ecol. Econ. 65, 663–674.
Environment Daily of China, 2018. Blue Book of BTHA Published: Interregional PESMechanism Has Come Into Being in the Northwest of BTHA. http://env.people.com.cn/n1/2018/0719/c1010-30157199.html.
Farley, J., Costanza, R., 2010. Payments for ecosystem services: from local to global. Ecol.Econ. 69, 2060–2068.
Feng, K., Davis, S.J., Sun, L., Li, X., Guan, D., Liu, W., Liu, Z., Hubacek, K., 2013.Outsourcing CO2 within China. PNAS 110, 11654–11659.
Fu, Y., Zhang, J., Zhang, C., Zang, W., Guo, W., Qian, Z., Liu, L., Zhao, J., Feng, J., 2018.Payments for Ecosystem Services for watershed water resource allocations. J. Hydrol.(Amst) 556, 689–700.
Groot, R.D., Brander, L., van der Ploeg, S., Costanza, R., Bernard, F., Braat, L., Christie,M., Crossman, N., Ghermandi, A., Hein, L., Hussain, S., Kumar, P., McVittie, A.,Portela, R., Rodriguez, L.C., ten Brink, P., van Beukering, P., 2012. Global estimatesof the value of ecosystems and their services in monetary units. Ecosyst. Serv. 1,50–61.
Henderson, P., 1955. A computable model of economic growth. Econ. J. London (London)65, 149.
Hu, Y., Huang, J., Hou, L., 2019. Impacts of the grassland ecological compensation policy
Fig. 6. The PES standards from Beijing and Tianjin to Hebei.
Y. Lin, et al. Ecological Economics 168 (2020) 106514
8

on household livestock production in China: an empirical study in Inner Mongolia.Ecol. Econ. 161, 248–256.
Huang, J., Luo, Y., 2017. Study on problems and countermeasures of eco-compensation inBeijing-Tianjin-Hebei region. J. Hebei Univ. Sci. Technol. (Social Sciences) 17,27–32.
Jiang, L., Wang, F., Zhang, W., Liu, Y., Tian, Y., 2017. Research of fairness of inter-provincial air pollution governance input based on trade-embodied environment costand economic benefits trade-off: a case study of Pan-Beijing-Tianjin-Hebei region.Urban Dev. Stud. 24, 72–80 (in Chinese).
Kalacska, M., Sanchez-Azofeifa, G.A., Rivard, B., Calvo-Alvarado, J.C., Quesada, M.,2008. Baseline assessment for environmental services payments from satellite ima-gery: A case study from Costa Rica and Mexico. J Environ. Manag. 88, 348–359.
Kang, M., Siry, J., Colson, G., Ferreir, S., 2019. Do forest property characteristics reveallandowners’ willingness to accept payments for ecosystem services contracts insoutheast Georgia, U.S.? Ecol. Econ. 161, 144–152.
Kosoy, N., Corbera, E., 2010. Payments for ecosystem services as commodity fetishism.Ecol. Econ. 69, 1228–1236.
Kosoy, N., Martinez-Tuna, M., Muradian, R., Martinez-Alier, J., 2007. Payments for en-vironmental services in watersheds: insights from a comparative study of three casesin Central America. Ecol. Econ. 61, 446–455.
Li, W., Liu, M., 2010. Several strategic thoughts on China’s eco-compensation mechanism.Resour. Sci. 32, 791–796.
Lin, Y., Guo, Z., Zheng, Y., Zhang, L., Huang, H., 2019. Net horizontal payments forecosystem services: an application in the Beijing-Tianjin-Hebei Region of China. J.Resour. Ecol. 10, 63–68.
Lin, Y., Zheng, Y., Zong, X., 2017. Ecological compensation basline of alpine wetland inthe Chinese Zoige Plateau. J. Beijing Normal Univ. (Natural Science) 53, 105–110 (inChinese).
Liu, P., Li, W., Yu, Y., Tang, R., Guo, X., Wang, B., Yang, B., Zhang, L., 2019. How muchwill cash forest encroachment in rainforests cost? A case from valuation to paymentfor ecosystem services in China. Ecol.Serv. 38, 100949.
Mao, X., Zhong, Y., Zhang, S., 2002. Conception, theory and mechanism of eco-com-pensation. China Popul. Resour. Environ. 12, 38–41.
McAfee, K., 1999. Selling nature to save it? Biodiversity and green developmentalism.Environ. Plan. 17, 133–154.
Midler, E., Pascual, U., Drucker, A.G., Narloch, U., Soto, J.L., 2015. Unraveling the effectsof payments for ecosystem services on motivations for collective action. Ecol. Econ.120, 394–405.
Miller, R.E., Blair, P.D., 2009. Input-Output Analysis: Foundations and Extensions.Cambridge University Press, Cambridge, UK.
Moses, L.N., 1955. The stability of interregional trading patterns and input-output ana-lysis. Am. Econ. Rev. 45, 803–832.
Muradian, R., Corbera, E., Pascual, U., Kosoy, N., May, P.H., 2010. Reconciling theoryand practice: an alternative conceptual framework for understanding payments forenvironmental services. Ecol. Econ. 69, 1202–1208.
Muradian, R., Rival, L., 2013. Governing the Provision of Ecosystem Services. Springer,London and New York.
National Development and Reform Commission (NDRC), 2016. Green DevelopmentIndicator System. (accessed 12 December 2016, in Chinese). http://www.ndrc.gov.cn/gzdt/201612/t20161222_832304.html.
National Bureau of Statistics of PRC (NBS), 2013. China Statistical Yearbook 2013. ChinaStatistics Press, Beijing, China (in Chinese).
National Bureau of Statistics, 2016. China Regional Input Output Table in 2012. ChinaStatistics Press, Beijing (in Chinese).
Ouyang, Z., Zheng, H., 2009. Ecological mechanisms of ecosystem services. Acta Ecol.Sinica 29, 6183–6188.
Pagiola, S., Platais, G., 2006. Payments for Environment Serivces: From Theory toPractice. World Bank, Washington, DC.
Parkhurst, G.M., Shogren, J.F., 2007. Spatial incentives to coordinate contiguous habitat.Ecol. Econ. 64, 344–355.
Peluso, N.L., 2012. What’s nature got to do with it? A situated historical perspective onsocio-natural commodities: socio-natural commodities: situated histories. Dev.Chang. 43, 79–104.
Peters, G.P., 2008. From production-based to consumption-based national emission in-ventories. Ecol. Econ. 65, 13–23.
Ranjan, R., 2019. Deriving double dividends through linking payments for ecosystemservices to environmental entrepreneurship: the case of the invasive weed Lantanacamara. Ecol. Econ. 164, 106380.
Ribaudo, M., Savage, J., 2014. Controlling non-additional credits from nutrient man-agement in water quality trading programs through eligibiity baseline stringency.
Ecol. Econ. 105, 233–239.Robinson, S., Cattaneo, A., El-Said, M., 2001. Updating and estimating a social accounting
matrix using cross entropy methods. Econ. Syst. Res. 13, 47–64.Schomers, S., Matzdorf, B., 2013. Payments for ecosystem services: a review and com-
parison of developing and industrialized countries. Ecosyst. Serv. 6, 16–30.Schomers, S., Sattles, C., Matzdorf, B., 2015. An analytical framework for assessing the
potential of intermediaries to improve the performance of payments for ecosystemservices. Land Use Policy 4, 58–70.
Singh, S.J., Smetschka, B., Ringhofer, L., Grima, N., Petridis, P., Biely, K., 2015. SMCEToolkit: OPTamos Software Tool (Options for Participatory Transformation andManagement of Sustainable Land Use).
Sommerville, M.M., Jones, J.P.G., Milner-Gulland, E.J., 2009. A revised conceptual fra-mework for payments for environmental services. Ecol. Soc. 14.
Standing Committee of the Twelfth National People’s Congress of China, 2016.Environmental Protection Tax Law of the People’s Republic of China. (accessed 25December 2016, in Chinese). http://www.npc.gov.cn/npc/c12435/201612/c305c6c912054177bbc3143628983e87.shtml.
Song, B., Zhang, Y., Zhang, L., Zhang, F., 2018. A top-down framework for cross-regionalpayments for ecosystem services. J. Clean. Prod. 182, 238–245.
Song, X., 2018. Global estimates of ecosystem service value and change: taking into ac-count uncertainties in satellite-based land cover data. Ecol. Econ. 143, 227–235.
Su, B., Ang, B.W., 2011. Multi-region input-output analysis of CO2 emissions embodied intrade: the feedback effects. Ecol. Econ. 71, 42–53.
Tacconi, L., 2012. Redefining payments for environmental services. Ecol. Econ. 73,29–36.
Van Hecken, G., Bastiaensen, J., Windey, C., 2015a. The frontiers of the debate on pay-ments for ecosystem services a proposal for innovative future research. Inst. Dev.Policy Manag.
Van Hecken, G., Bastiaensen, J., Windey, C., 2015b. Towards a power-sensitive and so-cially-informed analysis of payments for ecosystem services (PES): addressing thegaps in the current debate. Ecol. Econ. 120, 117–125.
Vatn, A., 2010. An institutional analysis of payments for environmental services. Ecol.Econ. 69, 1245–1252.
Wang, F., Liu, B., Zhang, B., 2017. Embodied environmental damage in interregionaltrade: a MRIO-based assessment within China. J. Clean. Prod. 140, 1236–1246.
Wang, J., Chen, L., Zhang, Y., Li, G., Sun, F., 2019a. Research progress and practice ofecological compensation in China and abroad. Environ. Sustain. Dev. 44, 121–125.
Wang, Q., Wang, X., Lu, S., Guo, B., 2019b. The basis of economic theory on the ecolo-gical compensation and its practice in China. For. Econ. 1, 3–21.
Wiedmann, T., Wilting, H.C., Lenzen, M., Lutter, S., Palm, V., 2011. Quo Vadis MRIO?Methodological, data and institutional requirements for multi-region input-outputanalysis. Ecol. Econ. 70, 1937–1945.
Wunder, S., 2005. Payments for Environmental Services: Some Nuts and Bolts. Center forInternational Forestry Research, Indonesia.
Wunder, S., 2007. The efficiency of payments for environmental services in tropicalconservation. Conserv. Biol. 21, 48–58.
Wunder, S., Engel, S., Pagiola, S., 2008. Taking stock: a comparative analysis of paymentsfor environmental services programs in developed and developing countries. Ecol.Econ. 65, 834–852.
Wunder, S., 2015. Revisiting the concept of payments for environmental services. Ecol.Econ. 117, 234–243.
Xia, Y., Guan, D., Meng, J., Li, Y., Shan, Y., 2018. Assessment of the pollu-tion–health–economics nexus in China. Atmos. Chem. Phys. 18, 14433–14443.
Yang, X., Zhang, W., Fan, J., Yu, J., Zhao, H., 2018. Transfers of embodied PM2.5emissions from and to the North China region based on a multiregional input-outputmodel. Environ. Pollut. 235, 381–393.
Zhang, W., Wang, J., Zhang, B., Bi, J., Jiang, H., 2015. Can China comply with its 12thfive-year plan on industrial emissions control: a structural decomposition analysis.Environ. Sci. Technol. 49, 4816–4824.
Zhang, W., Liu, Y., Feng, K., Hubacek, K., Wang, J., Liu, M., Jiang, L., Jiang, H., Liu, N.,Zhang, P., 2018. Revealing environmental inequality hidden in China’s inter-regionaltrade. Environ. Sci. Technol. 52, 7171–7181.
Zhang, Y., Liu, Y., Li, J., 2012. The methodology and compilation of China Multi-RegionalInput-Output model. Stat. Res. 29, 3–9 (in Chinese).
Zhang, Z., Duan, Y., Zhang, W., 2019. Economic gains and environmental costs fromChina’s exports: regional inequality and trade heterogeneity. Ecol. Econ. 164,106340.
Zhao, H., Zhang, Q., Davis, S., Guan, D., Liu, Z., Huo, H., Lin, J., Liu, W., He, K., 2015.Assessment of China’s virtual air pollution transport embodied in trade by a con-sumption-based emission inventory. Atmos. Chem. Phys. 15, 5443–5456.
Y. Lin, et al. Ecological Economics 168 (2020) 106514
9