A 3D Model of the Inner City of Beijing
10
A 3D Model of the Inner City of Beijing CHAN Chiu-Shui 1 , DANG Anrong 2 and TONG Ziyu 3 1 Department of Architecture / VRAC, Iowa State University, USA 2 School of Architecture, Tsinghua University, China 3 Department of Architecture, Southeast University, China Keywords: Urban spatial structure, 3D city modeling, GIS, remote sensing, virtual environments Abstract: This study has two major concentrations: 1) exploring methods of creating a digital city model, and 2) applying the model to study urban spatial structure, an issue of particular interest and importance to urban planners. Based on existing studies that address mainly on two-dimensional urban structure, this paper focuses on the three-dimensional (3D) structure relating to the 3D urban form. Given their greater clarity and possibilities for quantitative analysis, both the 3D digital urban model and GIS spatial overlay analysis method hold tremendous potential for analyzing and predicting future urban form. In this project, the Xidan Business District in Beijing’s Inner City is the area of study selected to implement the digital-city application. Under the hypothesis that the existing urban spatial structure is determined by the city’s urban planning scheme and current urban marketing forces, it is found that actual urban development does not follow planning restrictions on zoning and building height regulations. Some contradictions and conflicts, such as building location and height, appeared in the studied district. The specific reasons for the discrepancies need to be further studied. 1 INTRODUCTION For 800 years, the city of Beijing has been designed to function as the capital of China. The original urban planning concepts were guided by certain aspects of Chinese culture and philosophy, which are reflected in the urban forms preserved in the Inner City. Throughout its historical evolution, the area’s urban form has been affected dramatically by socio-cultural, economic and political changes; furthermore, urban problems and conflicts have emerged. For example, the Inner City district is facing challenges due to issues of modernization and alterations in skyline shapes, landmark images, traffic patterns, and land-use allocations. For urban planners, design practitioners and planning scholars, appropriate tools to aid urban study and the decision-making processes are needed, but these ideas have not been fully explored. A three-dimensional (3D) digital city would be such a tool; however, a digital city that can be virtually displayed and viewed in full scale would be more useful for this purpose. This paper depicts 3D visualization of a digital city, the methods used for geometric modeling, the results of the virtual models and
Transcript of A 3D Model of the Inner City of Beijing
A 3D Model of the Inner City of Beijing
CHAN Chiu-Shui1, DANG Anrong2 and TONG Ziyu3
1 Department of Architecture / VRAC, Iowa State University, USA 2 School of Architecture, Tsinghua University, China 3 Department of Architecture, Southeast University, China
Keywords: Urban spatial structure, 3D city modeling, GIS, remote sensing, virtual environments
Abstract: This study has two major concentrations: 1) exploring methods of creating a digital city model, and 2) applying the model to study urban spatial structure, an issue of particular interest and importance to urban planners. Based on existing studies that address mainly on two-dimensional urban structure, this paper focuses on the three-dimensional (3D) structure relating to the 3D urban form. Given their greater clarity and possibilities for quantitative analysis, both the 3D digital urban model and GIS spatial overlay analysis method hold tremendous potential for analyzing and predicting future urban form. In this project, the Xidan Business District in Beijing’s Inner City is the area of study selected to implement the digital-city application. Under the hypothesis that the existing urban spatial structure is determined by the city’s urban planning scheme and current urban marketing forces, it is found that actual urban development does not follow planning restrictions on zoning and building height regulations. Some contradictions and conflicts, such as building location and height, appeared in the studied district. The specific reasons for the discrepancies need to be further studied.
1 INTRODUCTION
For 800 years, the city of Beijing has been designed to function as the capital of China. The original urban planning concepts were guided by certain aspects of Chinese culture and philosophy, which are reflected in the urban forms preserved in the Inner City. Throughout its historical evolution, the area’s urban form has been affected dramatically by socio-cultural, economic and political changes; furthermore, urban problems and conflicts have emerged. For example, the Inner City district is facing challenges due to issues of modernization and alterations in skyline shapes, landmark images, traffic patterns, and land-use allocations.
For urban planners, design practitioners and planning scholars, appropriate tools to aid urban study and the decision-making processes are needed, but these ideas have not been fully explored. A three-dimensional (3D) digital city would be such a tool; however, a digital city that can be virtually displayed and viewed in full scale would be more useful for this purpose. This paper depicts 3D visualization of a digital city, the methods used for geometric modeling, the results of the virtual models and

3D Modeling of the Inner City of Beijing
generational processes, and one exercise in applying and evaluating the model (an urban spatial structure analysis).
2 URBAN SPATIAL STRUCTURE
Urban spatial structure is defined as an organizational representation that includes both 2D urban pattern and 3D urban form. Since the 1960s, urban spatial structure has been one of the many foci in research exploring factors that affect the evolution of urban growth—for instance, how urban economic development would affect the functional characteristics of a city and its optimal size (Capello and Camagni 2000); how economic, housing and land reform have changed Chinese cities (Wu and Yeh 1999); and the impact of urban pattern to ecological conditions (Alberti et al. 2002). These studies showed the significance of analyzing a city’s urban spatial structure.
From the 1980s onward, cellular automata has been one of the computer-simulation methods used widely for describing urban spatial evolution and for explaining how and why cities grow (Batty 1991, White and Engelen 1993; Couclelis 1997; Batty et al. 1999; Barredo et al. 2003). Other studies have applied information technology to construct a digital city (Blundell 1999; Pietsch 2001) for visualization and urban study purposes. This research intends to develop a digital model based on virtual reality technology (Langendorf 1995; Dodge et al. 1998; Chan et al. 2004) to provide an interactive simulation and analysis environment for studying the urban spatial structure. This virtual city model includes volumetric city blocks and related urban data for study. The Inner City of Beijing has been selected as the subject of study.
3 3D MODEL OF AN URBAN SPATIAL STRUCTURE
Beijing is a dynamic city that combines traditional housing, historical palaces, and modern skyscrapers together in a metropolitan environment. Undergoing rapid growth, the city faces various urban issues that challenge planners and policy makers. Thus, it is critical to explore new possibilities and new tools that would aid urban decision making. This serves the purposes of this project.
Methods for developing a digital city model have been well explored in many projects done at universities in Europe, America and Asia through the use of various geometric modeling systems (Jepson and Friedman 1998). Other methods include applying computer vision, graphic technologies, and 3D laser scanners to digitally archive historical monuments and restore cultural heritage objects (Ikeuchi 2004). Some of these projects have generated beautiful models in the virtual reality environment. However, few projects have been designed to be a full-scale display in an immersive setting. This project intends to concentrate on the digital study of urban spatial structure; thus, two models were constructed—an abstracted volumetric model and an urban model displaying existing conditions with realistic
2

building heights and appearances. Each model has both a PC and virtual-reality version.
3.1 Data acquisition
The most interesting issues in modeling a city relate to the problems of gathering and maintaining tremendous amounts of urban data, and the accuracy of building data. For creating a volumetric city model, methods were strictly based on the information given on the building-height regulation map issued by the Beijing Urban Planning Commission in 1990. Figure 1 shows the map with 14 different colors representing different land-use and height restrictions. However, to create a model that represents the current city is more difficult. Particularly, the technological limitations of a 3D laser scanner present challenges for scanning buildings in a large-scale urban environment, and the inaccessibility of accurate, detailed drawings from authorities makes the data acquisition process more challenging. Fortunately, various data-acquisition methods have been tested on the city maps provided by associates at the Beijing University of Technology. Different algorithms were applied to the sets of building drawings provided by the Beijing Urban Planning Commission. And extra algorithms were developed in this project to serve its specific purposes.
Figure 1 Building-height regulation map and satellite photo of the Inner City.
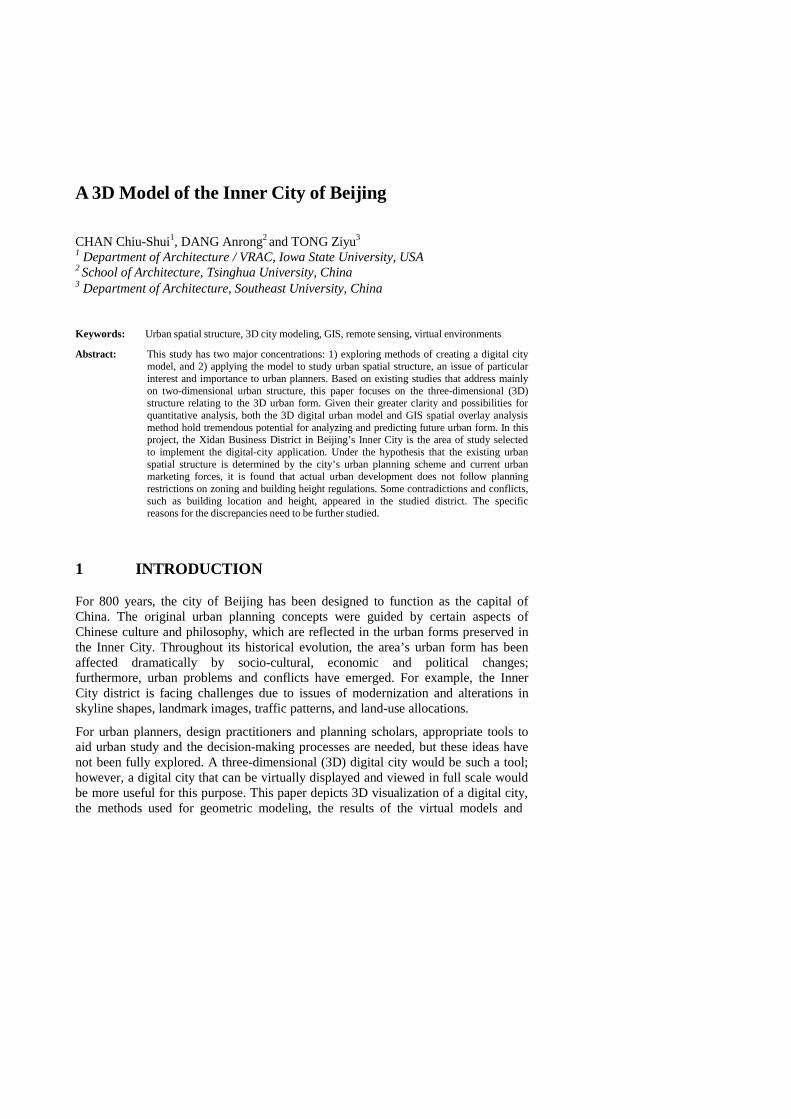
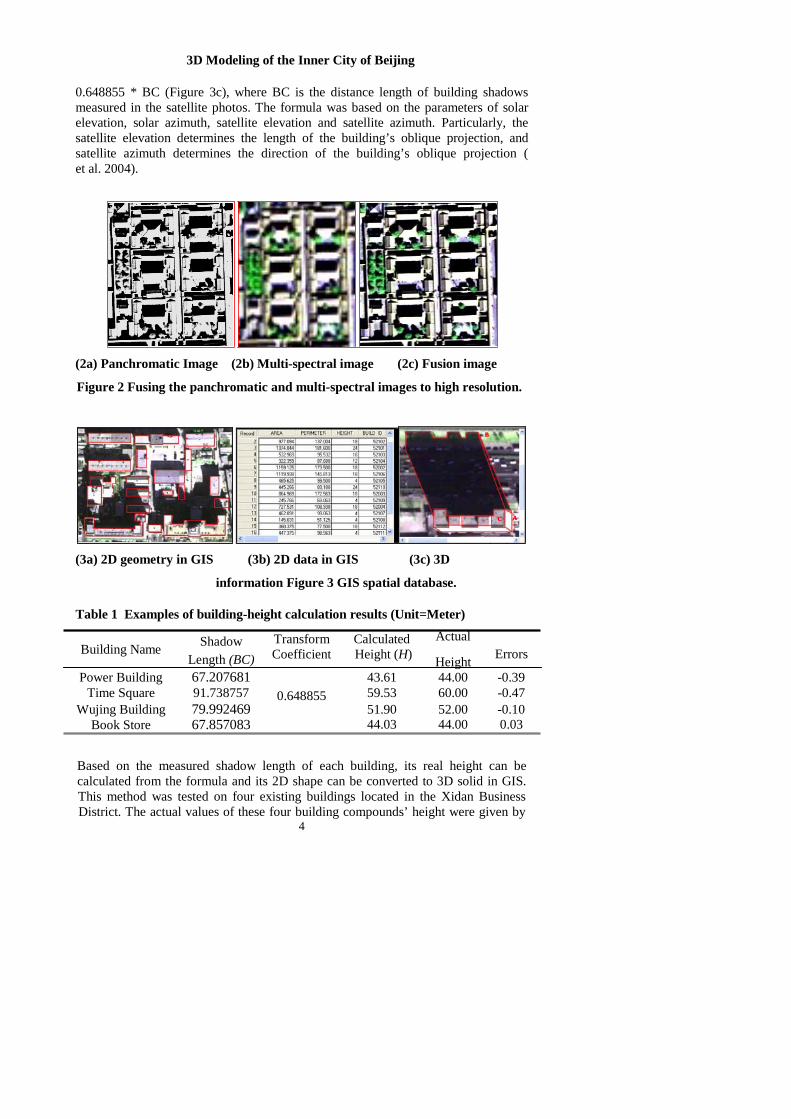
One algorithm applied techniques available in remote sensing (RS) and geographic information systems (GIS) to fetch 3D information from satellite photos obtained on October 18, 2001 (see Figure 1). The satellite photos consisted of a 61-centimeter panchromatic black-and-white image (Figure 2a) and a 2.44-meter multi-spectral colourful image (Figure 2b). Manipulated through ERDAS image-processing software, these two images were fused into a clear and colourful city image (Figure 2c). The second component of the algorithm was to export the image into GIS for generating 2D geometry for each building (Figure 3a), which has a set of data including ID number, area square footage, perimeter, building height, and related city regulations attached to each geometry (Figure 3b). The 3D information for each building refers to the existing building height, calculated from the formula of H =
3
3D Modeling of the Inner City of Beijing
B
C A
0.648855 * BC (Figure 3c), where BC is the distance length of building shadows measured in the satellite photos. The formula was based on the parameters of solar elevation, solar azimuth, satellite elevation and satellite azimuth. Particularly, the satellite elevation determines the length of the building’s oblique projection, and satellite azimuth determines the direction of the building’s oblique projection ( et al. 2004).
(2a) Panchromatic Image (2b) Multi-spectral image (2c) Fusion image
Figure 2 Fusing the panchromatic and multi-spectral images to high resolution.
B
C
A
(3a) 2D geometry in GIS (3b) 2D data in GIS (3c) 3D
information Figure 3 GIS spatial database.
Table 1 Examples of building-height calculation results (Unit=Meter)
Building Name Shadow Length (BC)
Transform Coefficient
Calculated Height (H)
Actual
Height Errors
Power Building 67.207681 43.61 44.00 -0.39 Time Square 91.738757 0.648855 59.53 60.00 -0.47
Wujing Building 79.992469 51.90 52.00 -0.10 Book Store 67.857083 44.03 44.00 0.03
Based on the measured shadow length of each building, its real height can be calculated from the formula and its 2D shape can be converted to 3D solid in GIS. This method was tested on four existing buildings located in the Xidan Business District. The actual values of these four building compounds’ height were given by
4

the city. Results of the eight measurements (Table 1 lists only four values) indicated that the possible errors ran from 0.03 to -0.47 meters. Thus, it is concluded that the methodology applied in this algorithm is valid and reliable.
3.2 Modeling process
The generated volumetric city model with the regulated building heights in GIS can be converted to VRML for visual display, which serves as an abstract representation (or a graphic representation of urban text codes) of the city (Figure 4). In this model, the different colors represent the regulated building height of each block.
Figure 4 Volumetric model of the Inner City of Beijing in VRML format.
Figure 5 Detailed MAX model and combined model.
The existing city model was constructed by measuring buildings’ shadow length to achieve accurate representations of height. In order to show a more realistic city vista, detailed models were constructed using digital photographs through texture mapping in 3D MAX. A photograph of every façade was taken on site and exported to AutoCAD to obtain accurate dimensions before being applied in 3D MAX to achieve a realistic appearance ( 2003). Results of combining the existing city model and detailed model are shown as an example in Figure 5; these have the potential to be used as a tool for studying the spatial structure of the city.
5
3D Modeling of the Inner City of Beijing
In terms of showing the model in virtual full scale, the PC models were converted into VRML models using OpenSG as the graphic scene generator for the virtual reality display. OpenSG is controlled by the VR Juggler program to create immersive 3D graphics in the CAVE virtual environment. Combining 3D projectors, 3D goggles and a wireless tracker, a digital model can be viewed and accessed interactively in the immersive CAVE environment.
3.3 Modeling results
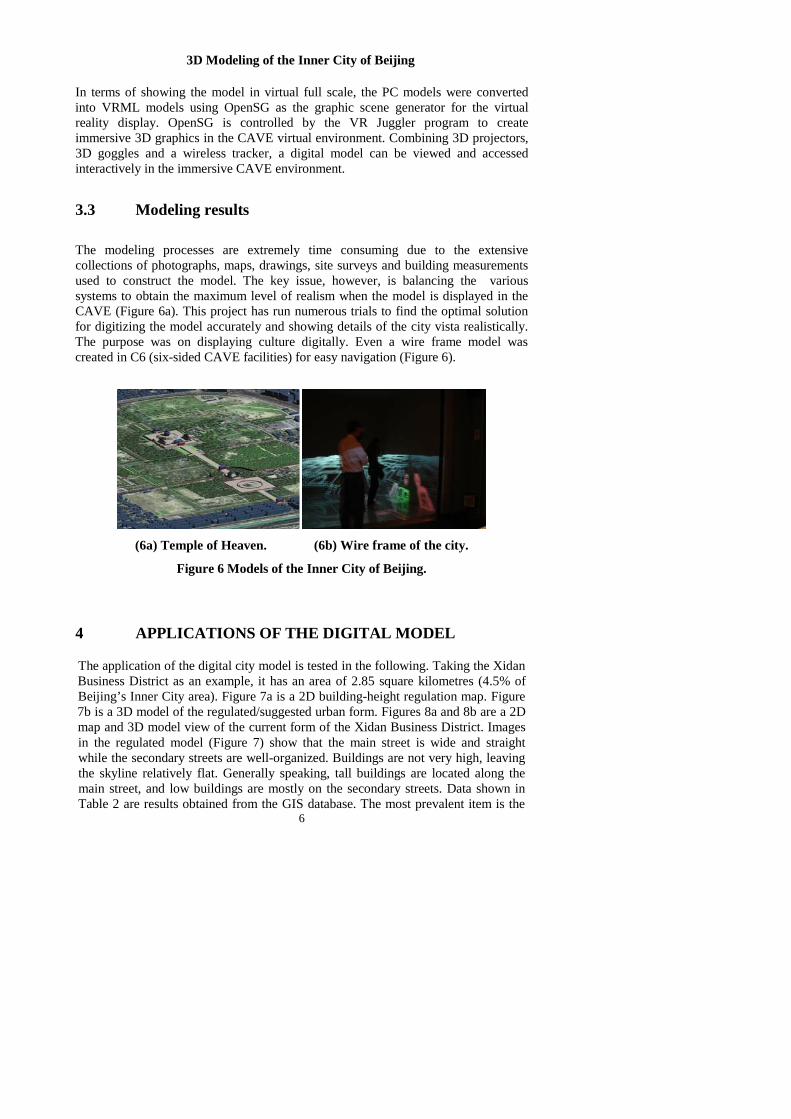
The modeling processes are extremely time consuming due to the extensive collections of photographs, maps, drawings, site surveys and building measurements used to construct the model. The key issue, however, is balancing the various systems to obtain the maximum level of realism when the model is displayed in the CAVE (Figure 6a). This project has run numerous trials to find the optimal solution for digitizing the model accurately and showing details of the city vista realistically. The purpose was on displaying culture digitally. Even a wire frame model was created in C6 (six-sided CAVE facilities) for easy navigation (Figure 6).
(6a) Temple of Heaven. (6b) Wire frame of the city.
Figure 6 Models of the Inner City of Beijing. 4 APPLICATIONS OF THE DIGITAL MODEL
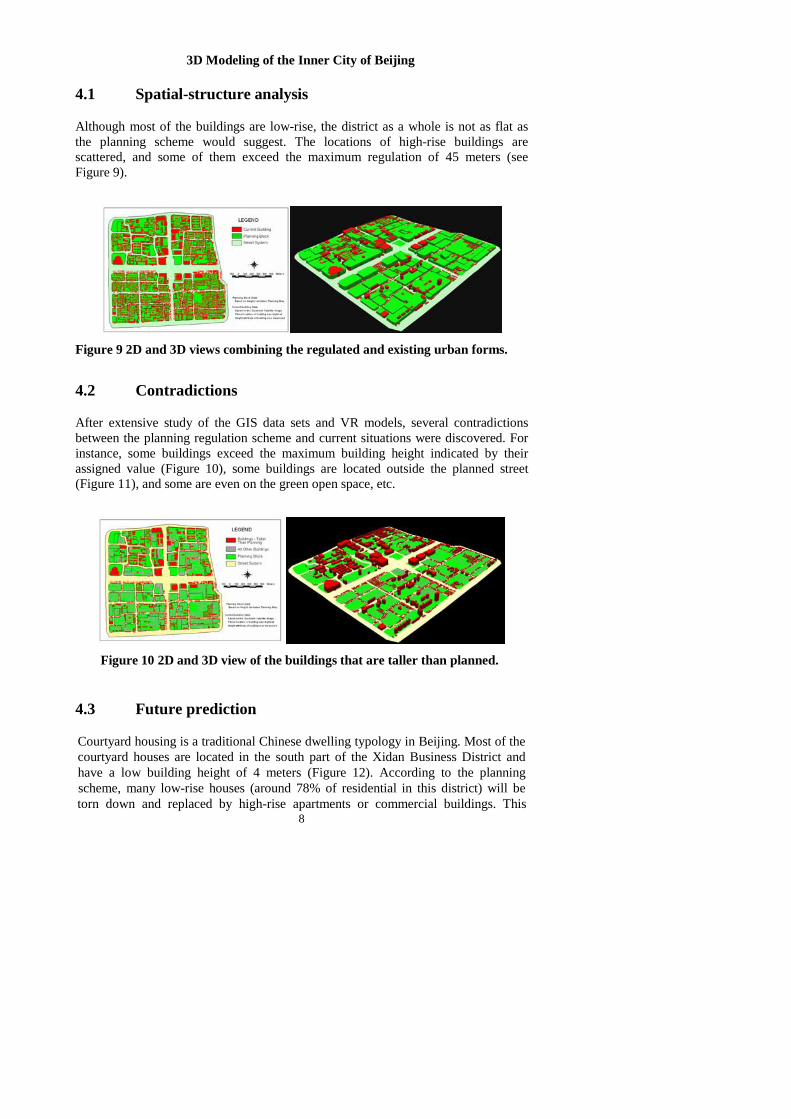
The application of the digital city model is tested in the following. Taking the Xidan Business District as an example, it has an area of 2.85 square kilometres (4.5% of Beijing’s Inner City area). Figure 7a is a 2D building-height regulation map. Figure 7b is a 3D model of the regulated/suggested urban form. Figures 8a and 8b are a 2D map and 3D model view of the current form of the Xidan Business District. Images in the regulated model (Figure 7) show that the main street is wide and straight while the secondary streets are well-organized. Buildings are not very high, leaving the skyline relatively flat. Generally speaking, tall buildings are located along the main street, and low buildings are mostly on the secondary streets. Data shown in Table 2 are results obtained from the GIS database. The most prevalent item is the
6
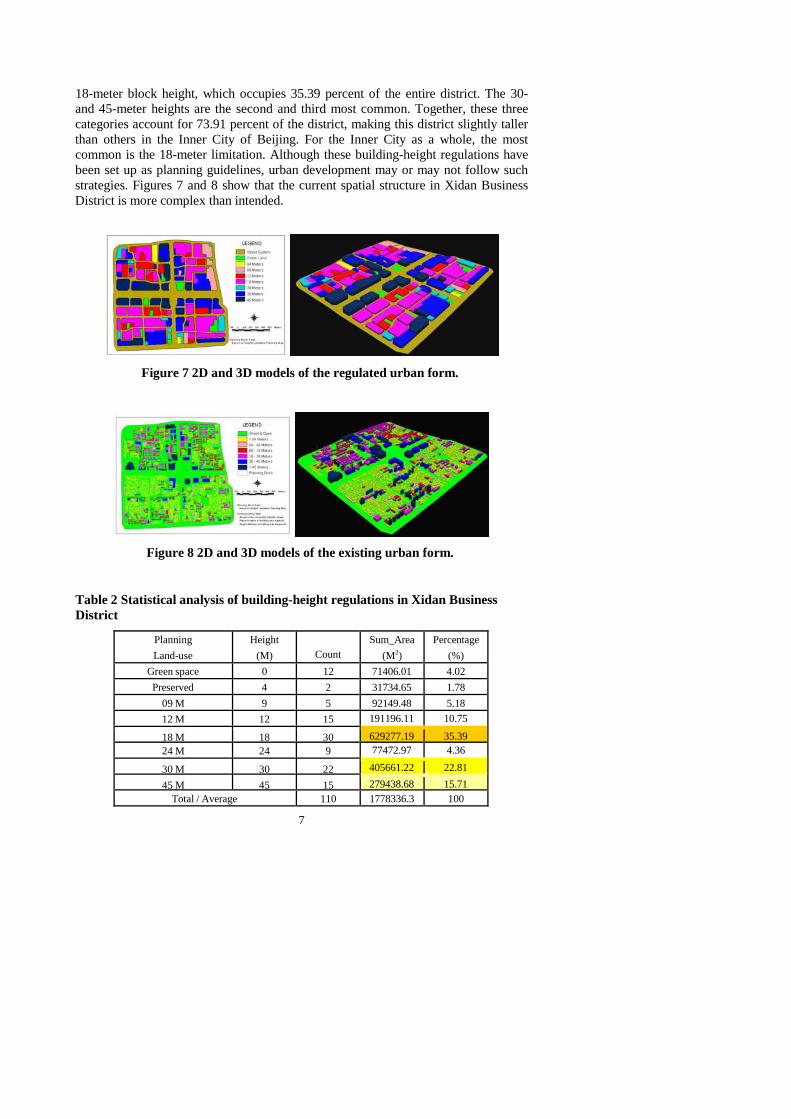
18-meter block height, which occupies 35.39 percent of the entire district. The 30- and 45-meter heights are the second and third most common. Together, these three categories account for 73.91 percent of the district, making this district slightly taller than others in the Inner City of Beijing. For the Inner City as a whole, the most common is the 18-meter limitation. Although these building-height regulations have been set up as planning guidelines, urban development may or may not follow such strategies. Figures 7 and 8 show that the current spatial structure in Xidan Business District is more complex than intended.
Figure 7 2D and 3D models of the regulated urban form.
Figure 8 2D and 3D models of the existing urban form.
Table 2 Statistical analysis of building-height regulations in Xidan Business District
Planning Land-use
Height (M)
Count
Sum_Area (M2)
Percentage (%)
Green space 0 12 71406.01 4.02 Preserved 4 2 31734.65 1.78
09 M 9 5 92149.48 5.18 12 M 12 15 191196.11 10.75 18 M 18 30 629277.19 35.39 24 M 24 9 77472.97 4.36 30 M 30 22 405661.22 22.81 45 M 45 15 279438.68 15.71
Total / Average 110 1778336.3 100 7
3D Modeling of the Inner City of Beijing
4.1 Spatial-structure analysis
Although most of the buildings are low-rise, the district as a whole is not as flat as the planning scheme would suggest. The locations of high-rise buildings are scattered, and some of them exceed the maximum regulation of 45 meters (see Figure 9).
Figure 9 2D and 3D views combining the regulated and existing urban forms.
4.2 Contradictions
After extensive study of the GIS data sets and VR models, several contradictions between the planning regulation scheme and current situations were discovered. For instance, some buildings exceed the maximum building height indicated by their assigned value (Figure 10), some buildings are located outside the planned street (Figure 11), and some are even on the green open space, etc.
Figure 10 2D and 3D view of the buildings that are taller than planned.
4.3 Future prediction
Courtyard housing is a traditional Chinese dwelling typology in Beijing. Most of the courtyard houses are located in the south part of the Xidan Business District and have a low building height of 4 meters (Figure 12). According to the planning scheme, many low-rise houses (around 78% of residential in this district) will be torn down and replaced by high-rise apartments or commercial buildings. This
8

indicates that courtyard housing will gradually disappear in some areas of the Inner City of Beijing.
Figure 11 2D and 3D views of the buildings located outside the planned blocks.
Figure 12 2D and 3D views of courtyard houses in Xidan Business District.
5 CONCLUSION
The methods of creating a VR model by combining GIS and RS have shown a number of advantages for studying urban spatial structures. The model created in the GIS provides a clear database with functions for quantitative analysis on various urban issues that cannot be easily identified without the aid of a digital model. For the Xidan Business District, the urban spatial structure has been determined mainly by the urban planning scheme with a number of issues involved. It is found that the current urban development does not conform to planning restrictions on zoning and building height. Some contradictions on building location and height occurred in the studied district. The specific reasons behind the discrepancies between the urban planning scheme and the current development need to be further studied.
REFERENCES
Alberti, M., D. Booth, K Hill, and J. Marzluff. 2002. The Impact of Urban Patterns on Ecosystem Dynamics. National Science Foundation Report.
9

3D Modeling of the Inner City of Beijing
Barredo, J. I., M. Kasanko, N. McCormick, and C. Lavalle. 2003. Modeling dynamic spatial processes: simulation of urban future scenarios through cellular automata. Landscape and Urban Planning, 64(3), 145-160.
Batty, M. 1991. Cities as fractals: simulating growth and form. In Fractals and chaos, eds. T. Crilly, R. Earnshaw, and H. Jones, 41-69, New York: Springer- Verlag.
Batty, M., Y. Xie, and Z. Sun. 1999. Modeling urban dynamics through GIS-based cellular automata. Computers, Environment and Urban Systems, 23(3): 205- 233.
Blundell, J., A. Williams, and J. Lintonbon. 1999. The Sheffield Urban Study Project. Architectural Research Quarterly, 3(3), 235-244.
Capello, R., and R. Camagni. 2000. Beyond Optimal City Size: An Evaluation of Alternative Urban Growth Patterns, Urban Studies, 37(9): 1479–1496.
Chan, C. S., Tong, A. Dang, and J. Qian. 2003. Virtual Reality Modeling of Traditional Chinese Architecture, In Proceedings of the Ninth International Conference on Virtual Systems and MultiMedia, 13-22.
Chan, C. S., A. Dang, and Z. Tong. 2004. Utilizing RS and GIS techniques to create a VR model of the Inner City of Beijing. In Proceedings of the Tenth International Conference on Virtual Systems and MultiMedia, 574-583.
Couclelis, H. 1997. From cellular automata to urban models: new principles for model development and implementation. Environment and Planning B: Planning & Design, 24: 165-174.
Dodge, M., S. Doyle, A. Smith, and S. Fleetwood. 1998. Towards the Virtual City: VR & Internet GIS for Urban Planning, Virtual Reality and Geographical Information Systems, Birkbeck College.
Jepson, W. and S. Friedman. 1998. Virtual L. A.: Urban Simulation in Los Angeles. Planning Magazine, the Journal of the Amercian Planning Association, 4-7.
Ikeuchi, K. 2004. Digitally Archiving Cultural Heritage. In Proceedings of the Tenth International Conference on Virtual Systems and MultiMedia, 13-17.
Langendorf, R. 1995. Visualization in Urban Planning and Design. Environment and Planning B: Planning and Design, 22: 343-358.
Pietsch, S., A. Radford, and R. Woodbury. 2001 Making and Using a City Model: Adelaide, Australia. In Proceedings of the 19th eCAADe Conference, 442-447.
White, R. and G. Engelen.1993. Cellular automata and fractal urban form: a cellular modeling approach to the evolution of urban land use patterns. Environment and Planning B: Planning & Design, 25: 1175-1199.
Wu, F. and A. G. O. Yeh. 1999. Urban Spatial Structure in a Transitional Economy: The Case of Guangzhou. Journal of the American Planning Association, 65(4): 377-394.
10