Taking Advantage of Education Data: Advanced Data Analysis and Reporting in Virtual Learning...
6
111 ELECTRONICS AND ELECTRICAL ENGINEERING ISSN 1392 – 1215 2011. No. 8(114) ELEKTRONIKA IR ELEKTROTECHNIKA EDUCATION IN ELECTRONICS AND ELECTRICAL ENGINEERING T 000 STUDIJOS ELEKTRONIKOJE IR ELETROTECHNIKOJE Taking Advantage of Education Data: Advanced Data Analysis and Reporting in Virtual Learning Environments V. Podgorelec, S. Kuhar University of Maribor, Faculty of Electrical Engineering and Computer Science, Smetanova ulica 17, SI-2000 Maribor, Slovenia, phone: +386 2 220 7353, e-mail: [email protected] Introduction Virtual learning environments (VLEs) increasingly serve as important infrastructural features of universities that enable teachers to provide students with different representations of knowledge and to enhance interaction between teachers and students and amongst students themselves [1]. VLEs can be informally defined as a software system designed to support teaching and learning in an educational setting; VLEs usually provide online tools for assessment, communication, uploading of content, etc. Whilst traditional teaching methods, such as face-to- face lectures, tutorials, lab assignments, and mentoring, remain dominant in the educational sector, universities are investing heavily in learning technologies, to facilitate improvements with respect to the quality of learning [2]. Similarly, in parallel with the renovation of all study programs at our faculty in accordance with the directions of Bologna Process during the last five years (from 2006 to 2010), we have introduced a virtual learning environment (VLE) in the study process. Based on the evaluation of available open-source systems, with the emphasis on active community, stable development status, good documentation, didactical objective and focus on the presentation of content or communication functionalities, Moodle was selected as our final choice [3]. Moodle is known for its good basic features, great extensibility and even contains some potentially adaptive features [4]. Moodle has been also accepted by our university as the official VLE. It has been in use at our department for several years now and both students and teaching staff are satisfied with its performance and usability [5]. It has to be added that Moodle has a rapidly increasing popularity at universities worldwide and new features are developed continuously. However, although universities worldwide are increasingly introducing VLEs [6], they are primarily used as an addendum to traditional teaching methods, serving as a communication channel where information for students, course materials and assignments are published, quizzes prepared, etc [7]. Some research has been done on how to take advantage of existing educational data within VLEs, for example in terms of their promotion of value attitudes and motivation development [8]. But what is almost completely overlooked is a vast collection of data about students, their habits and behavior. All the assessment data is also available in VLEs, together with in-depth logs of student activities. All this data represent a potentially valuable source which is not adequately considered. The data could be used to make learning process easier and more comfortable, it can provide immediate feedback to students, it can show where students’ weaknesses are and guide students to appropriate learning materials, etc [9]. The potential value of data stored about customers and its practical implications are well known and extensively used in business environment [10]. Two main, inter-connected focuses within this scope are: a) the prediction of customers’ behavior for timely optimization of company’s actions, and b) the improvement of quality of given services. The advantage of stored data is made by appropriate analysis of the data and efficient representation of information. As students can be seen as customers within universities, the analysis and representation of educational data should improve the efficiency and quality of the study process, which is the main service given to the students. As the proper implementation of information technology made a revolution in work productivity and effectiveness, why not use it also in education [11]. It is the objective of this paper to present the results of our research on how to take advantage of educational data collected within a VLE for timely collection of students’ performance, habits and needs. In this manner, the emphasis was given on the efficient selection and representation of important data available within a VLE to educators. As the information dashboards are recently gaining importance in business environment, we studied them from the educational point of view and designed two dashboards to be used within Moodle system with the simplicity and efficiency of use in our minds. The dashboards visualize the key performance indicators of students’ performance and can be as such used as a tool for on-time detection of problems and for discovering of the http://dx.doi.org/10.5755/j01.eee.114.8.708
Transcript of Taking Advantage of Education Data: Advanced Data Analysis and Reporting in Virtual Learning...
111
ELECTRONICS AND ELECTRICAL ENGINEERING ISSN 1392 – 1215 2011. No. 8(114) ELEKTRONIKA IR ELEKTROTECHNIKA
EDUCATION IN ELECTRONICS AND ELECTRICAL ENGINEERING T 000
STUDIJOS ELEKTRONIKOJE IR ELETROTECHNIKOJE
Taking Advantage of Education Data: Advanced Data Analysis and Reporting in Virtual Learning Environments
V. Podgorelec, S. Kuhar University of Maribor, Faculty of Electrical Engineering and Computer Science, Smetanova ulica 17, SI-2000 Maribor, Slovenia, phone: +386 2 220 7353, e-mail: [email protected]
Introduction
Virtual learning environments (VLEs) increasingly
serve as important infrastructural features of universities that enable teachers to provide students with different representations of knowledge and to enhance interaction between teachers and students and amongst students themselves [1]. VLEs can be informally defined as a software system designed to support teaching and learning in an educational setting; VLEs usually provide online tools for assessment, communication, uploading of content, etc. Whilst traditional teaching methods, such as face-to-face lectures, tutorials, lab assignments, and mentoring, remain dominant in the educational sector, universities are investing heavily in learning technologies, to facilitate improvements with respect to the quality of learning [2].
Similarly, in parallel with the renovation of all study programs at our faculty in accordance with the directions of Bologna Process during the last five years (from 2006 to 2010), we have introduced a virtual learning environment (VLE) in the study process. Based on the evaluation of available open-source systems, with the emphasis on active community, stable development status, good documentation, didactical objective and focus on the presentation of content or communication functionalities, Moodle was selected as our final choice [3]. Moodle is known for its good basic features, great extensibility and even contains some potentially adaptive features [4]. Moodle has been also accepted by our university as the official VLE. It has been in use at our department for several years now and both students and teaching staff are satisfied with its performance and usability [5]. It has to be added that Moodle has a rapidly increasing popularity at universities worldwide and new features are developed continuously.
However, although universities worldwide are increasingly introducing VLEs [6], they are primarily used as an addendum to traditional teaching methods, serving as a communication channel where information for students, course materials and assignments are published, quizzes prepared, etc [7]. Some research has been done on how to
take advantage of existing educational data within VLEs, for example in terms of their promotion of value attitudes and motivation development [8]. But what is almost completely overlooked is a vast collection of data about students, their habits and behavior. All the assessment data is also available in VLEs, together with in-depth logs of student activities. All this data represent a potentially valuable source which is not adequately considered. The data could be used to make learning process easier and more comfortable, it can provide immediate feedback to students, it can show where students’ weaknesses are and guide students to appropriate learning materials, etc [9].
The potential value of data stored about customers and its practical implications are well known and extensively used in business environment [10]. Two main, inter-connected focuses within this scope are: a) the prediction of customers’ behavior for timely optimization of company’s actions, and b) the improvement of quality of given services. The advantage of stored data is made by appropriate analysis of the data and efficient representation of information. As students can be seen as customers within universities, the analysis and representation of educational data should improve the efficiency and quality of the study process, which is the main service given to the students. As the proper implementation of information technology made a revolution in work productivity and effectiveness, why not use it also in education [11].
It is the objective of this paper to present the results of our research on how to take advantage of educational data collected within a VLE for timely collection of students’ performance, habits and needs. In this manner, the emphasis was given on the efficient selection and representation of important data available within a VLE to educators. As the information dashboards are recently gaining importance in business environment, we studied them from the educational point of view and designed two dashboards to be used within Moodle system with the simplicity and efficiency of use in our minds. The dashboards visualize the key performance indicators of students’ performance and can be as such used as a tool for on-time detection of problems and for discovering of the
http://dx.doi.org/10.5755/j01.eee.114.8.708
112
real motivational factors. When combined with advanced data analysis, they enable a teacher to discover students’ performance patterns, predict problems, focus on problematic topics, find motivational elements, etc. Hopefully, the process shall also lead towards discovering some new knowledge and unknown insights [12].
In the following sections the information dashboards are introduced first, after which some traditional and new approaches to statistical reporting within VLEs are discussed. Next, the results of a survey on teachers’ needs about data monitoring in VLEs are presented, following by the description of the designed dashboards based on the survey results and our findings on data visualization in the business environment. Some implications of using the advanced data visualization within Moodle are presented and finally, the paper concludes with some final thoughts.
Information dashboards
Dashboards are widely known in business community
since they are commonly used as a tool for representing data. These applications let users monitor the status of key performance indicators (KPIs) at a glance and alert them when performance deviates from predefined targets. As Malik [13] acknowledges, a dashboard is a rich computer interface with charts, reports, visual indicators, and alert mechanisms that are consolidated into a dynamic and relevant information platform. A performance dashboard is according to Eckerson [14] a multilayered application built on business intelligence and data integration infrastructure that enables organizations to measure, monitor, and manage business performance more effectively. Few [15] emphasizes the power of dashboards as they offer a unique and powerful solution to an organization's need for information. On the other hand he warns about poorly designed implementations that commonly cause inefficient and ineffective communication. Only if those who implement them understand visual perception and apply that understanding through design principles and practices that are aligned with the way people see and think can dashboards gain tremendous power to communicate.
Few defines dashboards as a visual display of the most important information needed to achieve one or more objectives; consolidated and arranged on a single screen so the information can be monitored at a glance. They are mostly visual because graphics can often communicate with greater efficiency and richer meaning than text alone. For the user to gain as much information as possible at a glance, the dashboards must present all the information in one screen and abbreviated in the form of summaries or exceptions. Only then a dashboard is able to quickly point out that something deserves user’s attention and might require action [15].
The dashboards can be categorized in three groups according to the type of business activity that they support [15]. Dashboards for strategic purposes focus on high-level measures of performance and can include predictions; with static and simple gauges they enable quick access to the information needed for decision making. Dashboards that support data analysis provide rich comparisons, detailed history overview and focus less on the performance evaluators. Dashboards for operational purposes need to
show real-time data and have to be capable of attracting the user’s attention if a measure falls outside given norms.
Statistical reporting in VLEs
VLEs are nowadays widely used among universities
worldwide. They represent internet based environment, where the instructors can distribute information to students, produce content material, prepare assignments and tests, engage in discussions, manage distance classes and enable collaborative learning with forums, chats, file storage areas, news services etc [16]. VLEs also collect large amounts of educational data which is very valuable for analyzing students’ behavior. The systems collect most students’ activities such as reading, writing, taking tests, performing various tasks and monitoring their progress [16]. The gathered information can be used to analyze students’ behavior and the effectiveness of course design, to predict students’ performance and their final mark, to group students according to their preferences, and to improve the educational process [17].
Many authors found that teachers rarely use this complex statistical data since it is predominantly numerical, and often incomprehensible, with a poor logical organization that is difficult to follow [17]. Getting a clear vision of individual’s or collaborate course progress is difficult and time consuming for instructors [17].
Simple statistics, queries or visualization algorithms and intuitive tools are needed to give to teachers/tutors an overall view of how a class is doing [18]. These modules must incorporate an easy to use interface that doesn’t require choosing algorithms or their parameters and offer good visualization techniques to provide meaningful results to educators.
Even though the authors agree on needed simplification, none of them offers a solution that would provide a reporting tool similar to those commonly used in business. Therefore we are proposing one.
The survey
We performed a survey that helped us gain
information about the statistic data educators would like to monitor within VLEs. For this purpose we conducted a survey among educators on Faculty of Electrical Engineering and Computer Science Maribor that use Moodle as an assisting tool in face-to-face teaching. Both lecturers and teaching assistants were included in the survey, where some of the questions were role based and for that reason differed.
The online survey has been sent to 183 educators at different apartments at our faculty, 34% of them were lecturers and 66% teaching assistants. The survey consisted of different questions regarding the objectives of using Moodle, the importance of students’ results, the anticipated influence factors of the students’ success, the frequency and experience of using Moodle, the type of data monitored/exported, the requirements for the visualization of data, the needs for better statistical reporting from Moodle, etc.
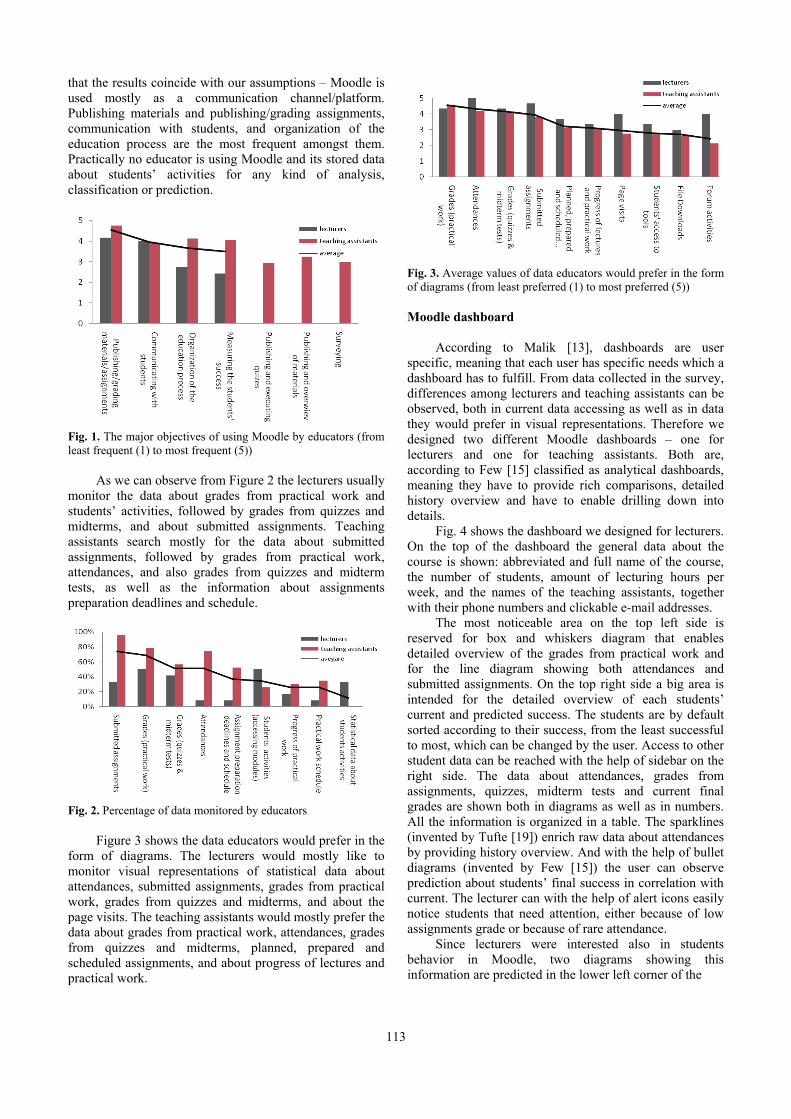
Figure 1 shows the major objectives and the frequency of using Moodle by the educators. It can be seen
113
that the results coincide with our assumptions – Moodle is used mostly as a communication channel/platform. Publishing materials and publishing/grading assignments, communication with students, and organization of the education process are the most frequent amongst them. Practically no educator is using Moodle and its stored data about students’ activities for any kind of analysis, classification or prediction.
Fig. 1. The major objectives of using Moodle by educators (from least frequent (1) to most frequent (5))
As we can observe from Figure 2 the lecturers usually
monitor the data about grades from practical work and students’ activities, followed by grades from quizzes and midterms, and about submitted assignments. Teaching assistants search mostly for the data about submitted assignments, followed by grades from practical work, attendances, and also grades from quizzes and midterm tests, as well as the information about assignments preparation deadlines and schedule.
Fig. 2. Percentage of data monitored by educators
Figure 3 shows the data educators would prefer in the
form of diagrams. The lecturers would mostly like to monitor visual representations of statistical data about attendances, submitted assignments, grades from practical work, grades from quizzes and midterms, and about the page visits. The teaching assistants would mostly prefer the data about grades from practical work, attendances, grades from quizzes and midterms, planned, prepared and scheduled assignments, and about progress of lectures and practical work.
Fig. 3. Average values of data educators would prefer in the form of diagrams (from least preferred (1) to most preferred (5))
Moodle dashboard
According to Malik [13], dashboards are user
specific, meaning that each user has specific needs which a dashboard has to fulfill. From data collected in the survey, differences among lecturers and teaching assistants can be observed, both in current data accessing as well as in data they would prefer in visual representations. Therefore we designed two different Moodle dashboards – one for lecturers and one for teaching assistants. Both are, according to Few [15] classified as analytical dashboards, meaning they have to provide rich comparisons, detailed history overview and have to enable drilling down into details.
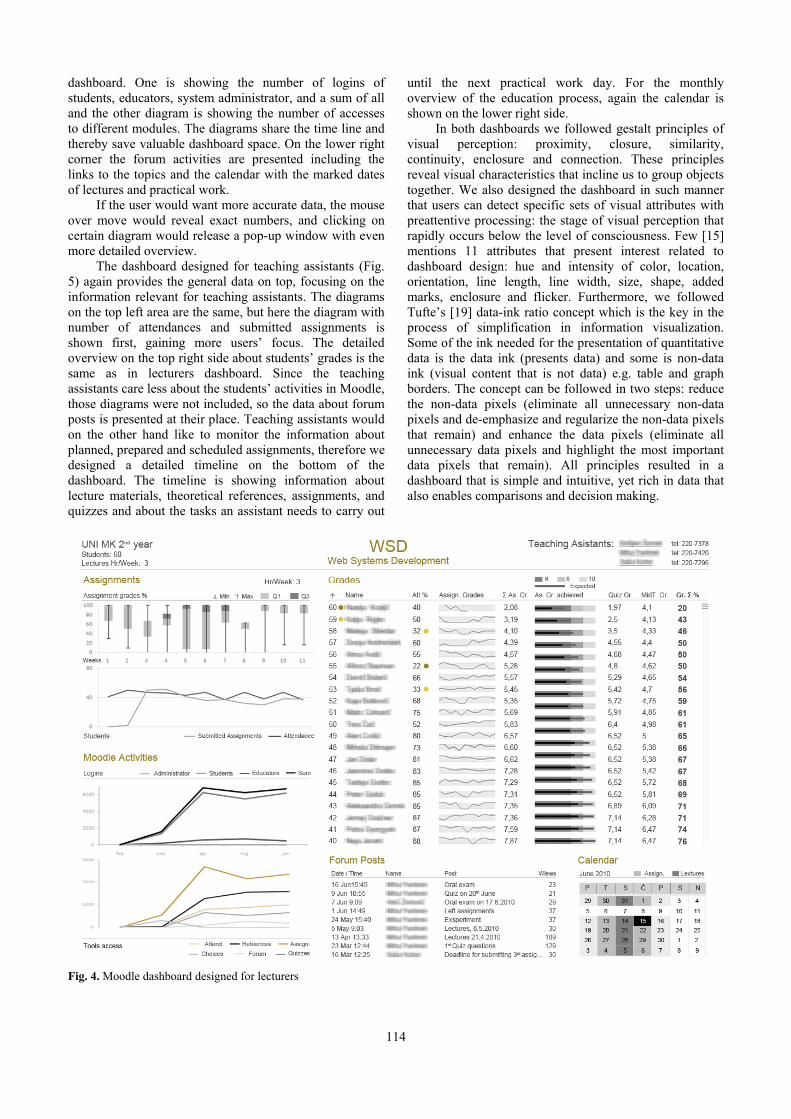
Fig. 4 shows the dashboard we designed for lecturers. On the top of the dashboard the general data about the course is shown: abbreviated and full name of the course, the number of students, amount of lecturing hours per week, and the names of the teaching assistants, together with their phone numbers and clickable e-mail addresses.
The most noticeable area on the top left side is reserved for box and whiskers diagram that enables detailed overview of the grades from practical work and for the line diagram showing both attendances and submitted assignments. On the top right side a big area is intended for the detailed overview of each students’ current and predicted success. The students are by default sorted according to their success, from the least successful to most, which can be changed by the user. Access to other student data can be reached with the help of sidebar on the right side. The data about attendances, grades from assignments, quizzes, midterm tests and current final grades are shown both in diagrams as well as in numbers. All the information is organized in a table. The sparklines (invented by Tufte [19]) enrich raw data about attendances by providing history overview. And with the help of bullet diagrams (invented by Few [15]) the user can observe prediction about students’ final success in correlation with current. The lecturer can with the help of alert icons easily notice students that need attention, either because of low assignments grade or because of rare attendance.
Since lecturers were interested also in students behavior in Moodle, two diagrams showing this information are predicted in the lower left corner of the
114
dashboard. One is showing the number of logins of students, educators, system administrator, and a sum of all and the other diagram is showing the number of accesses to different modules. The diagrams share the time line and thereby save valuable dashboard space. On the lower right corner the forum activities are presented including the links to the topics and the calendar with the marked dates of lectures and practical work.
If the user would want more accurate data, the mouse over move would reveal exact numbers, and clicking on certain diagram would release a pop-up window with even more detailed overview.
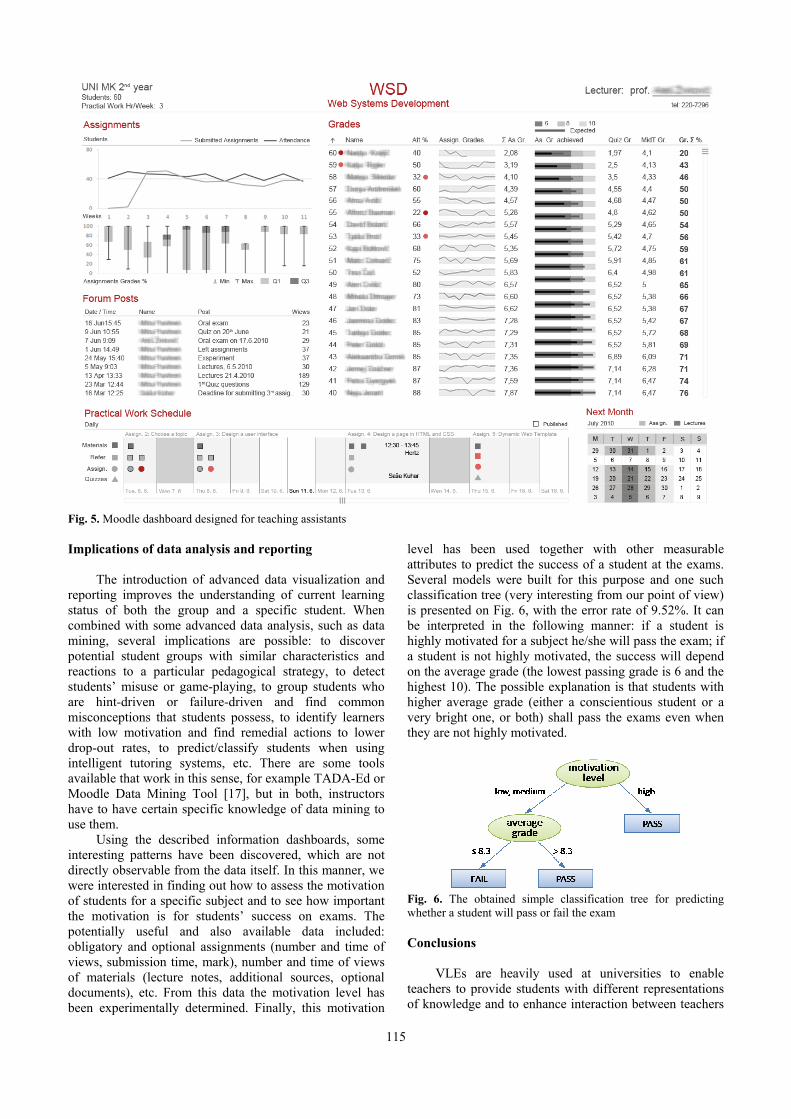
The dashboard designed for teaching assistants (Fig. 5) again provides the general data on top, focusing on the information relevant for teaching assistants. The diagrams on the top left area are the same, but here the diagram with number of attendances and submitted assignments is shown first, gaining more users’ focus. The detailed overview on the top right side about students’ grades is the same as in lecturers dashboard. Since the teaching assistants care less about the students’ activities in Moodle, those diagrams were not included, so the data about forum posts is presented at their place. Teaching assistants would on the other hand like to monitor the information about planned, prepared and scheduled assignments, therefore we designed a detailed timeline on the bottom of the dashboard. The timeline is showing information about lecture materials, theoretical references, assignments, and quizzes and about the tasks an assistant needs to carry out
until the next practical work day. For the monthly overview of the education process, again the calendar is shown on the lower right side.
In both dashboards we followed gestalt principles of visual perception: proximity, closure, similarity, continuity, enclosure and connection. These principles reveal visual characteristics that incline us to group objects together. We also designed the dashboard in such manner that users can detect specific sets of visual attributes with preattentive processing: the stage of visual perception that rapidly occurs below the level of consciousness. Few [15] mentions 11 attributes that present interest related to dashboard design: hue and intensity of color, location, orientation, line length, line width, size, shape, added marks, enclosure and flicker. Furthermore, we followed Tufte’s [19] data-ink ratio concept which is the key in the process of simplification in information visualization. Some of the ink needed for the presentation of quantitative data is the data ink (presents data) and some is non-data ink (visual content that is not data) e.g. table and graph borders. The concept can be followed in two steps: reduce the non-data pixels (eliminate all unnecessary non-data pixels and de-emphasize and regularize the non-data pixels that remain) and enhance the data pixels (eliminate all unnecessary data pixels and highlight the most important data pixels that remain). All principles resulted in a dashboard that is simple and intuitive, yet rich in data that also enables comparisons and decision making.
Fig. 4. Moodle dashboard designed for lecturers
115
Fig. 5. Moodle dashboard designed for teaching assistants Implications of data analysis and reporting
The introduction of advanced data visualization and
reporting improves the understanding of current learning status of both the group and a specific student. When combined with some advanced data analysis, such as data mining, several implications are possible: to discover potential student groups with similar characteristics and reactions to a particular pedagogical strategy, to detect students’ misuse or game-playing, to group students who are hint-driven or failure-driven and find common misconceptions that students possess, to identify learners with low motivation and find remedial actions to lower drop-out rates, to predict/classify students when using intelligent tutoring systems, etc. There are some tools available that work in this sense, for example TADA-Ed or Moodle Data Mining Tool [17], but in both, instructors have to have certain specific knowledge of data mining to use them.
Using the described information dashboards, some interesting patterns have been discovered, which are not directly observable from the data itself. In this manner, we were interested in finding out how to assess the motivation of students for a specific subject and to see how important the motivation is for students’ success on exams. The potentially useful and also available data included: obligatory and optional assignments (number and time of views, submission time, mark), number and time of views of materials (lecture notes, additional sources, optional documents), etc. From this data the motivation level has been experimentally determined. Finally, this motivation
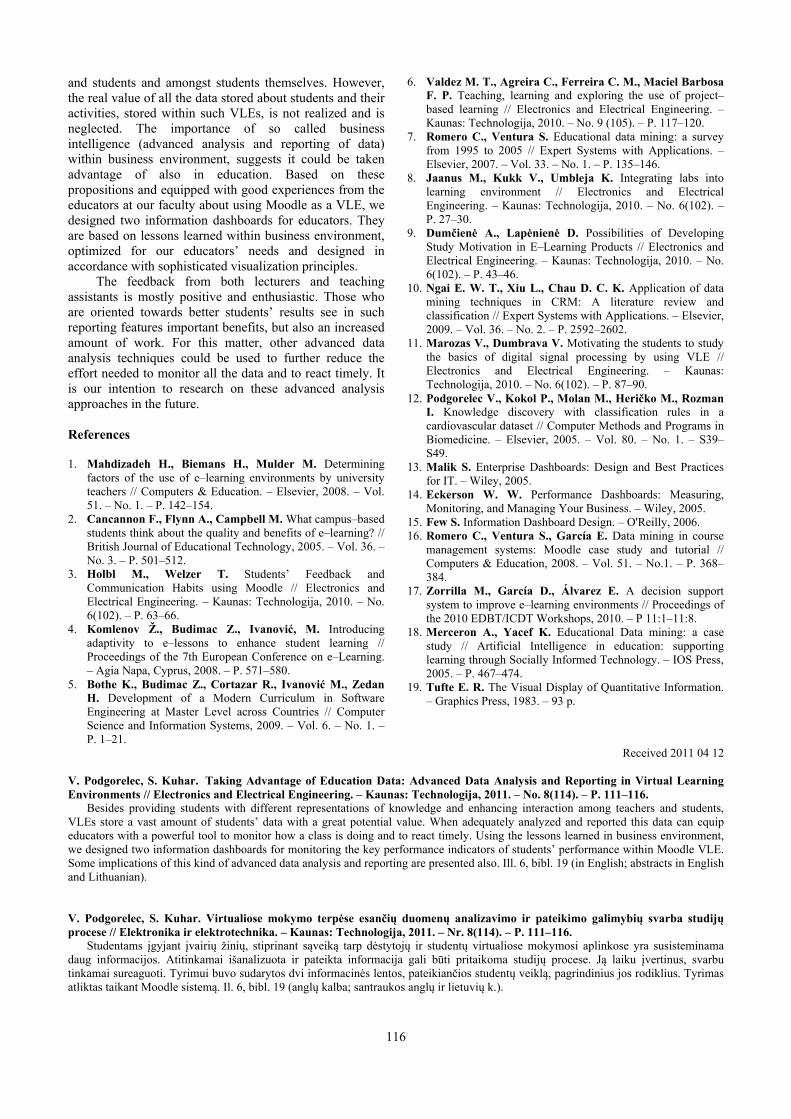
level has been used together with other measurable attributes to predict the success of a student at the exams. Several models were built for this purpose and one such classification tree (very interesting from our point of view) is presented on Fig. 6, with the error rate of 9.52%. It can be interpreted in the following manner: if a student is highly motivated for a subject he/she will pass the exam; if a student is not highly motivated, the success will depend on the average grade (the lowest passing grade is 6 and the highest 10). The possible explanation is that students with higher average grade (either a conscientious student or a very bright one, or both) shall pass the exams even when they are not highly motivated.
Fig. 6. The obtained simple classification tree for predicting whether a student will pass or fail the exam
Conclusions
VLEs are heavily used at universities to enable
teachers to provide students with different representations of knowledge and to enhance interaction between teachers
116
and students and amongst students themselves. However, the real value of all the data stored about students and their activities, stored within such VLEs, is not realized and is neglected. The importance of so called business intelligence (advanced analysis and reporting of data) within business environment, suggests it could be taken advantage of also in education. Based on these propositions and equipped with good experiences from the educators at our faculty about using Moodle as a VLE, we designed two information dashboards for educators. They are based on lessons learned within business environment, optimized for our educators’ needs and designed in accordance with sophisticated visualization principles.
The feedback from both lecturers and teaching assistants is mostly positive and enthusiastic. Those who are oriented towards better students’ results see in such reporting features important benefits, but also an increased amount of work. For this matter, other advanced data analysis techniques could be used to further reduce the effort needed to monitor all the data and to react timely. It is our intention to research on these advanced analysis approaches in the future.
References
1. Mahdizadeh H., Biemans H., Mulder M. Determining
factors of the use of e–learning environments by university teachers // Computers & Education. – Elsevier, 2008. – Vol. 51. – No. 1. – P. 142–154.
2. Cancannon F., Flynn A., Campbell M. What campus–based students think about the quality and benefits of e–learning? // British Journal of Educational Technology, 2005. – Vol. 36. – No. 3. – P. 501–512.
3. Holbl M., Welzer T. Students’ Feedback and Communication Habits using Moodle // Electronics and Electrical Engineering. – Kaunas: Technologija, 2010. – No. 6(102). – P. 63–66.
4. Komlenov Ž., Budimac Z., Ivanović, M. Introducing adaptivity to e–lessons to enhance student learning // Proceedings of the 7th European Conference on e–Learning. – Agia Napa, Cyprus, 2008. – P. 571–580.
5. Bothe K., Budimac Z., Cortazar R., Ivanović M., Zedan H. Development of a Modern Curriculum in Software Engineering at Master Level across Countries // Computer Science and Information Systems, 2009. – Vol. 6. – No. 1. – P. 1–21.
6. Valdez M. T., Agreira C., Ferreira C. M., Maciel Barbosa F. P. Teaching, learning and exploring the use of project–based learning // Electronics and Electrical Engineering. – Kaunas: Technologija, 2010. – No. 9 (105). – P. 117–120.
7. Romero C., Ventura S. Educational data mining: a survey from 1995 to 2005 // Expert Systems with Applications. – Elsevier, 2007. – Vol. 33. – No. 1. – P. 135–146.
8. Jaanus M., Kukk V., Umbleja K. Integrating labs into learning environment // Electronics and Electrical Engineering. – Kaunas: Technologija, 2010. – No. 6(102). – P. 27–30.
9. Dumčienė A., Lapėnienė D. Possibilities of Developing Study Motivation in E–Learning Products // Electronics and Electrical Engineering. – Kaunas: Technologija, 2010. – No. 6(102). – P. 43–46.
10. Ngai E. W. T., Xiu L., Chau D. C. K. Application of data mining techniques in CRM: A literature review and classification // Expert Systems with Applications. – Elsevier, 2009. – Vol. 36. – No. 2. – P. 2592–2602.
11. Marozas V., Dumbrava V. Motivating the students to study the basics of digital signal processing by using VLE // Electronics and Electrical Engineering. – Kaunas: Technologija, 2010. – No. 6(102). – P. 87–90.
12. Podgorelec V., Kokol P., Molan M., Heričko M., Rozman I. Knowledge discovery with classification rules in a cardiovascular dataset // Computer Methods and Programs in Biomedicine. – Elsevier, 2005. – Vol. 80. – No. 1. – S39–S49.
13. Malik S. Enterprise Dashboards: Design and Best Practices for IT. – Wiley, 2005.
14. Eckerson W. W. Performance Dashboards: Measuring, Monitoring, and Managing Your Business. – Wiley, 2005.
15. Few S. Information Dashboard Design. – O'Reilly, 2006. 16. Romero C., Ventura S., García E. Data mining in course
management systems: Moodle case study and tutorial // Computers & Education, 2008. – Vol. 51. – No.1. – P. 368–384.
17. Zorrilla M., García D., Álvarez E. A decision support system to improve e–learning environments // Proceedings of the 2010 EDBT/ICDT Workshops, 2010. – P 11:1–11:8.
18. Merceron A., Yacef K. Educational Data mining: a case study // Artificial Intelligence in education: supporting learning through Socially Informed Technology. – IOS Press, 2005. – P. 467–474.
19. Tufte E. R. The Visual Display of Quantitative Information. – Graphics Press, 1983. – 93 p.
Received 2011 04 12
V. Podgorelec, S. Kuhar. Taking Advantage of Education Data: Advanced Data Analysis and Reporting in Virtual Learning Environments // Electronics and Electrical Engineering. – Kaunas: Technologija, 2011. – No. 8(114). – P. 111–116.
Besides providing students with different representations of knowledge and enhancing interaction among teachers and students, VLEs store a vast amount of students’ data with a great potential value. When adequately analyzed and reported this data can equip educators with a powerful tool to monitor how a class is doing and to react timely. Using the lessons learned in business environment, we designed two information dashboards for monitoring the key performance indicators of students’ performance within Moodle VLE. Some implications of this kind of advanced data analysis and reporting are presented also. Ill. 6, bibl. 19 (in English; abstracts in English and Lithuanian). V. Podgorelec, S. Kuhar. Virtualiose mokymo terpėse esančių duomenų analizavimo ir pateikimo galimybių svarba studijų procese // Elektronika ir elektrotechnika. – Kaunas: Technologija, 2011. – Nr. 8(114). – P. 111–116.
Studentams įgyjant įvairių žinių, stiprinant sąveiką tarp dėstytojų ir studentų virtualiose mokymosi aplinkose yra susisteminama daug informacijos. Atitinkamai išanalizuota ir pateikta informacija gali būti pritaikoma studijų procese. Ją laiku įvertinus, svarbu tinkamai sureaguoti. Tyrimui buvo sudarytos dvi informacinės lentos, pateikiančios studentų veiklą, pagrindinius jos rodiklius. Tyrimas atliktas taikant Moodle sistemą. Il. 6, bibl. 19 (anglų kalba; santraukos anglų ir lietuvių k.).