Islam in Tajikistan: Actors, Discourses, Conflicts - The Web site ...
Upload
khangminh22Category
view
1download
0
TAJIKISTAN HEALTH SERVICES
IMPROVEMENT PROJECT
IMPACT EVALUATION OF A PERFORMANCE BASED FINANCING PROGRAM
APRIL 2019
Page 2
1 ACKNOWLEDGEMENTS
The impact evaluation study was implemented by task team consisting of Huihui Wang (TTL, GHN03), Aneesa Arur
(previous TTL, GHN02), Jeanette Walldorf (consultant), Tashrik Ahmed (consultant), Damien de Walque (PI, DECHD) and Gil
Shapira (PI, DECHD).
This report was produced and written by Tashrik Ahmed, Damien de Walque and Gil Shapira.
For support and inputs during the study design and implementation, the team would like to thank Wezi Msisha (SACKB),
Ha Nguyen (GHN03), Kate Mandeville (GHN03), Mutriba Latypova (GHN03), Sabrina Qandenova, Sarvinoz Barfieva and
Rouselle Lavado.
The Ministry of Health provided valuable feedback on the design of the impact evaluation as well as on the findings which
are presented in this report. The evaluation was supported by the project implementation unit of the Tajikistan Health
Services Improvement Project (HSIP), under the leadership of Mahbuba Mustafaevna. In particular, the team would like to
acknowledge the work of Fatima Gaibova and Saodat Mirsaburova on the citizen report cars and collaborative quality
improvement interventions.
Zerkalo Analytics led the data collection, under supervision of the impact evaluation team.
The financial contributions of the Health Results Innovation Trust Fund (HRITF) are gratefully acknowledged.

Page 3
2 GLOSSARY ANC Antenatal Care (prenatal care)
ARI Acute Respiratory Infection
CQI Collaborative Quality Improvement
CRC Citizens Report Card
DALY Disability-Adjusted Life Years
DHS Demographic and Health Survey
ECA Europe and Central Asia
HRITF Health Results Innovation Trust Fund
HSIP Health Services Improvement Project
IE Impact Evaluation
IPC Infection Prevention and Control
IMCI Integrated Management of Childhood Illness
IUD Intrauterine device
LAM Lactational Amenorrhea Method
MCH Maternal and Child Health
MOH Ministry of Health
NCD Non-communicable Disease
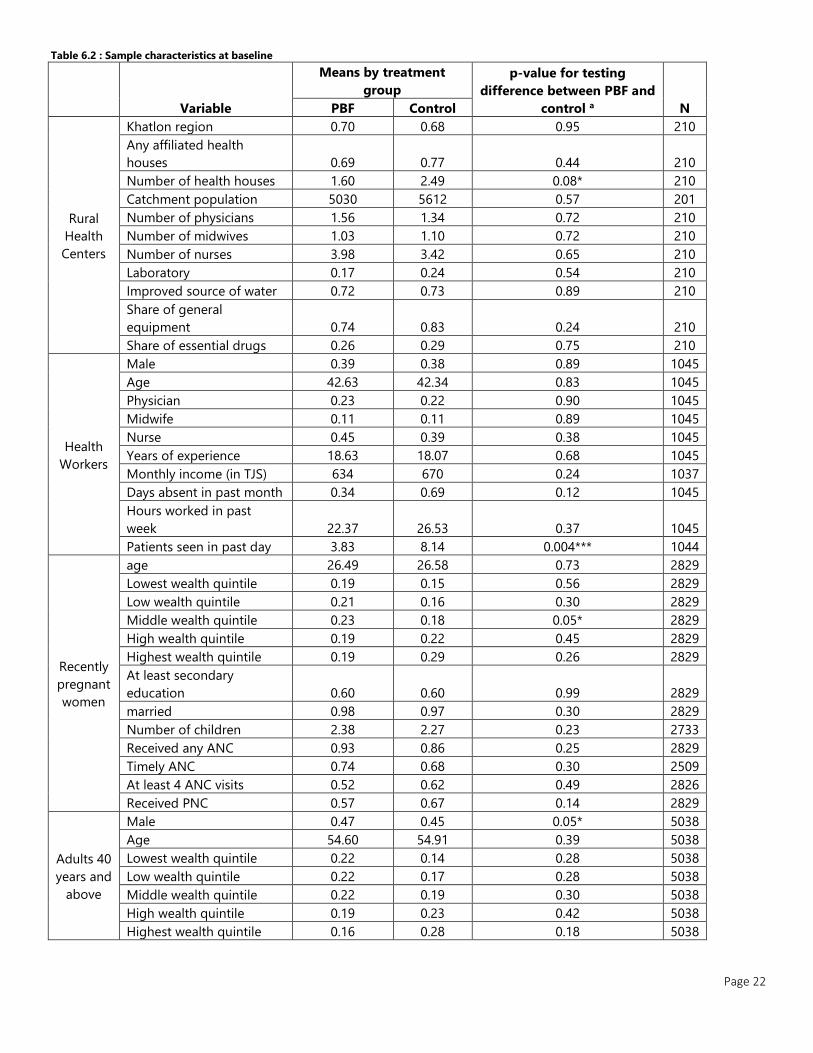
NGO Non-governmental Organization
OECD Organization for Economic Cooperation and Development
ORS Oral Rehydration Solution
ORT Oral Rehydration Therapy
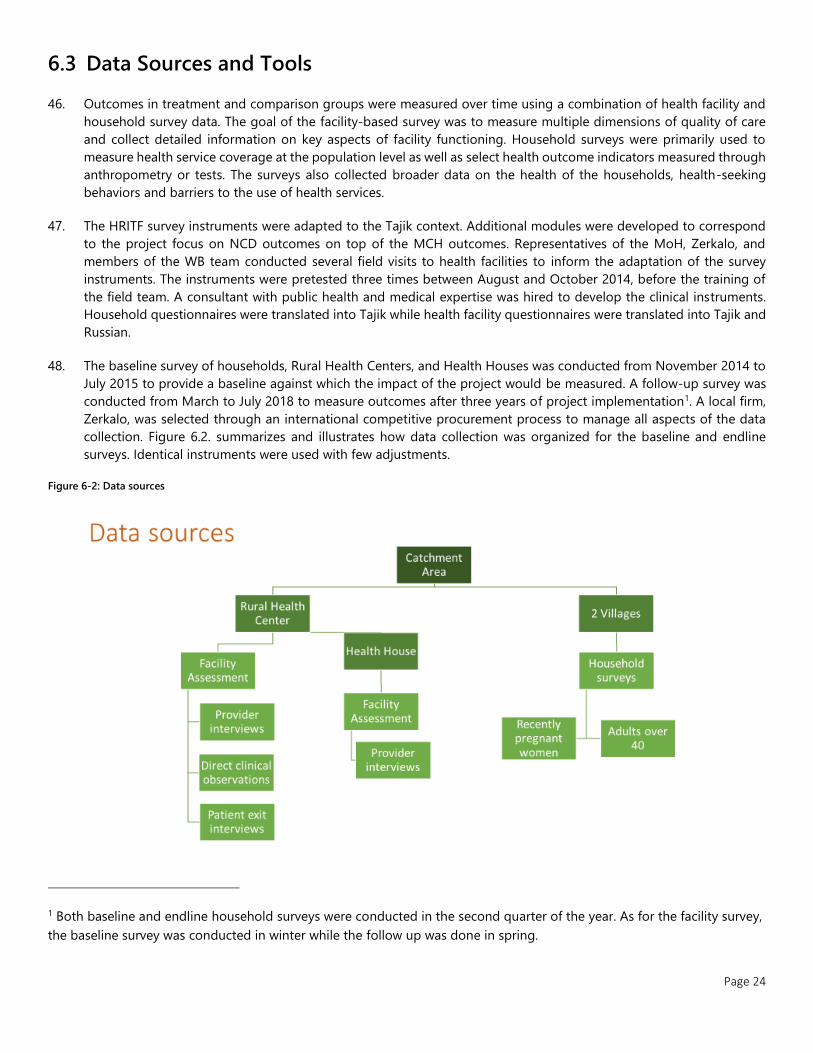
PBF Performance-Based Financing
PHC Primary Healthcare
PPP Purchasing Power Parity
RBF Results Based Financing
RHC Rural Health Center
UNICEF United Nations Children's Fund
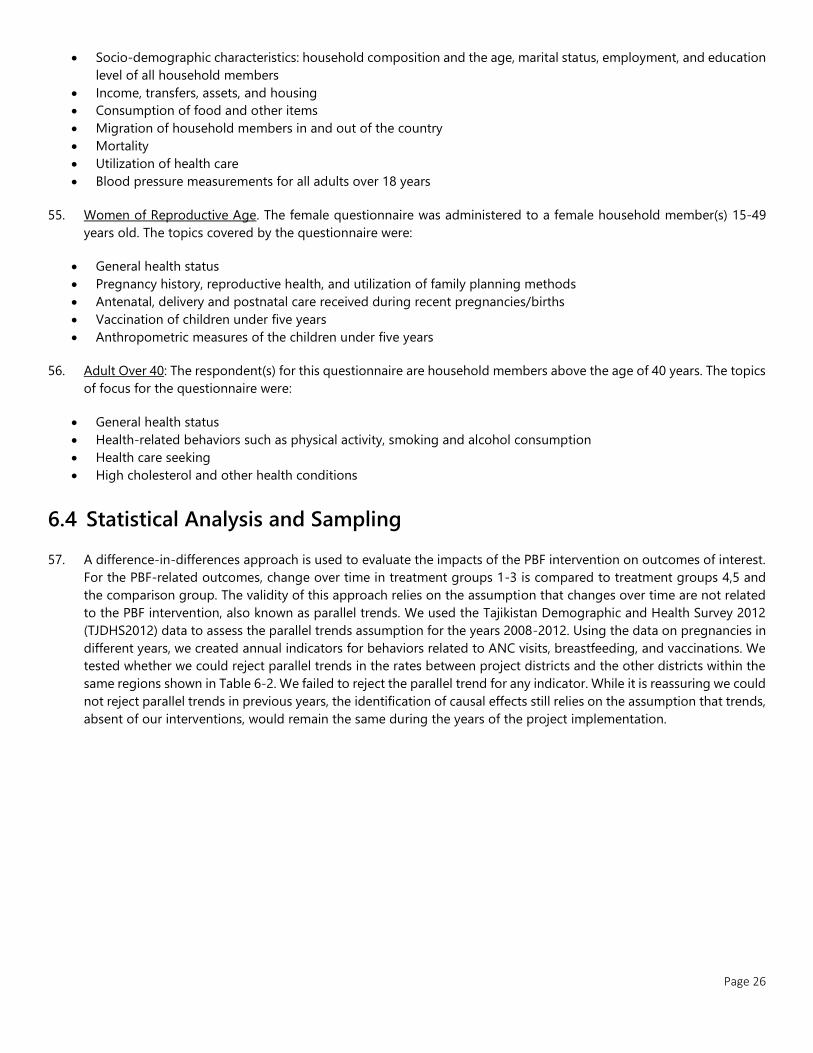
USSR Union of Soviet Socialist Republics
YLL Years of Life Lost
Page 4
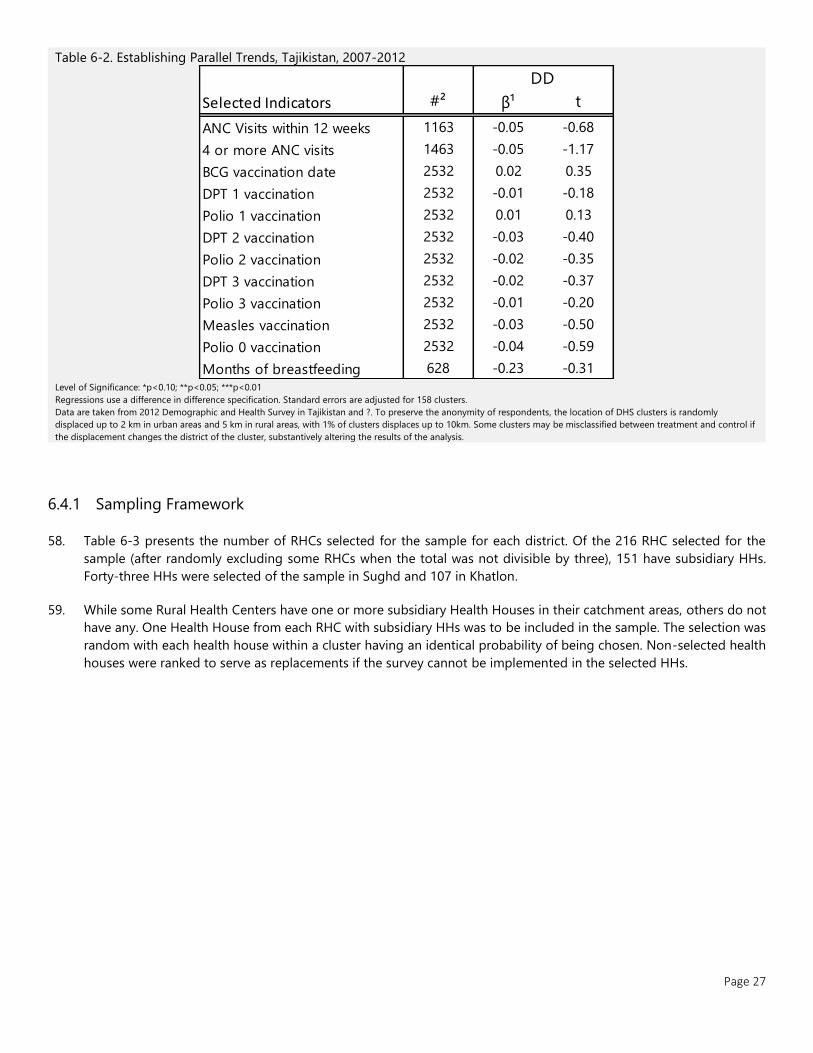
3 CONTENTS
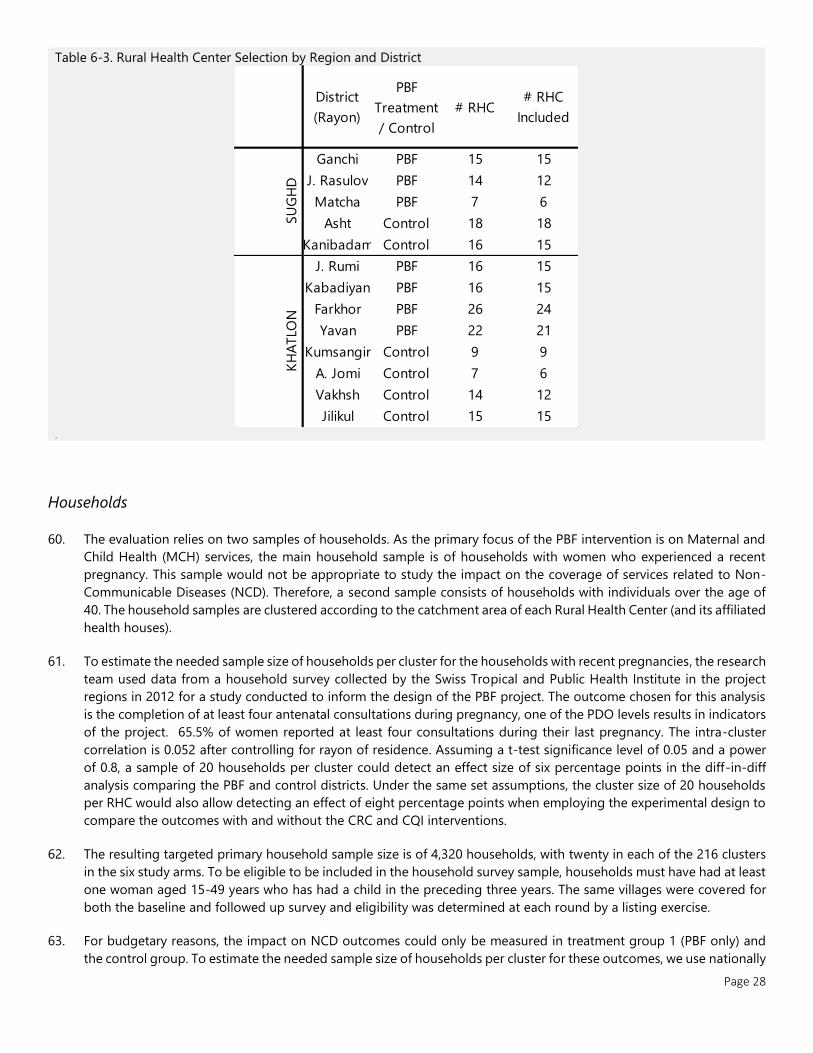
1 ACKNOWLEDGEMENTS ....................................................................................................................................................... 2
2 GLOSSARY ............................................................................................................................................................................. 3
3 CONTENTS ............................................................................................................................................................................. 4
3.1 FIGURES ................................................................................................................................................................................................................... 5
3.2 TABLES ..................................................................................................................................................................................................................... 5
3.3 APPENDIX ................................................................................................................................................................................................................ 6
4 EXECUTIVE SUMMARY ........................................................................................................................................................ 7
5 BACKGROUND ...................................................................................................................................................................... 9
5.1 PROJECT CONTEXT ................................................................................................................................................................................................. 9
5.2 INTERVENTIONS .................................................................................................................................................................................................... 11
6 METHODS AND DATA ....................................................................................................................................................... 17
6.1 STUDY OBJECTIVES ............................................................................................................................................................................................... 17
6.2 STUDY DESIGN ..................................................................................................................................................................................................... 17
6.3 DATA SOURCES AND TOOLS ............................................................................................................................................................................... 21
6.4 STATISTICAL ANALYSIS AND SAMPLING ............................................................................................................................................................ 23
6.5 ETHICAL CLEARANCE ............................................................................................................................................................................................ 27
6.6 DESCRIPTION OF SAMPLE .................................................................................................................................................................................... 28
7 RESULTS OF PERFORMANCE-BASED FINANCING......................................................................................................... 33
7.1 HEALTH FACILITIES, HEALTH WORKERS, AND QUALITY OF CARE ................................................................................................................... 33
7.2 HOUSEHOLD ......................................................................................................................................................................................................... 43
8 RESULTS OF CQI AND CRC INTERVENTIONS ................................................................................................................. 49
8.1 HEALTH FACILITY, HEALTH WORKERS, AND QUALITY OF CARE ...................................................................................................................... 49
8.2 HEALTH WORKER ................................................................................................................................................................................................. 52
8.3 HOUSEHOLD ......................................................................................................................................................................................................... 56
9 DISCUSSION ........................................................................................................................................................................ 60
10 APPENDICES .................................................................................................................................................................... 62
10.1 SAMPLE SUMMARY .............................................................................................................................................................................................. 62
10.2 DISAGGREGATED INDICATORS OF PBF IMPACT ................................................................................................................................................ 63
10.3 DISAGGREGATED INDICATORS FOR CQI/CRC IMPACT ................................................................................................................................... 77
10.4 INDICATOR MEANS BY TREATMENT ARM .......................................................................................................................................................... 91
11 REFERENCES .................................................................................................................................................................. 103

Page 5
3.1 Figures Figure 5-1. Selected World Development Indicators for Tajikistan, Europe & Central Asia, and OECD members ...................... 11
Figure 5-2: Evaluation and intervention timeline ................................................................................................................................................... 16
Figure 6-1 Map Rural Health Centers and Project Areas in Western Tajikistan ...................................................................................... 20
Figure 6-2: Data sources .................................................................................................................................................................................................. 21
3.2 Tables Table 5-1 Incentivized Services by Quantity and Quality ............................................................................................................................... 14
Table 6-1 Study Arms ................................................................................................................................................................................................... 18
Table 6-2. Sample characteristics at baseline .......................................................................................................................................................... 19
Table 6-3. Establishing Parallel Trends, Tajikistan, 2007-2012 .......................................................................................................................... 24
Table 6-4. Rural Health Center Selection by Region and District .................................................................................................................... 25
Table 6-5. RHC catchment size by Treatment Arm and Region, 2018 ........................................................................................................... 28
Table 6-6. RHC Health Worker characteristics by Treatment Arm and Region, 2018 ............................................................................. 29
Table 6-7. Household characteristics by Treatment Arm and Region, 2018 ............................................................................................... 30
Table 6-8. Characteristics of recently pregnant women by Treatment Arm and Region, 2018 ........................................................... 31
Table 6-9. Characteristics of children by Treatment Arm and Region, 2018 ............................................................................................... 32
Table 7-1. Rural Health Facility and Health House Analytical Sample Size by Round ............................................................................. 33
Table 7-2. Impact of PBF on Structural Quality and Infrastructure ................................................................................................................. 34
Table 7-3. Impact of PBF on Equipment Availability ............................................................................................................................................. 35
Table 7-4. Impact of PBF on Service Availability ..................................................................................................................................................... 36
Table 7-5. Impact of PBF on Administration and Management Indicators in the Last 1 Year ............................................................. 37
Table 7-6. Rural Health Facility and Health House Analytical Sample Size by Round ............................................................................. 38
Table 7-7. Impact of PBF on Health Workers ........................................................................................................................................................... 39
Table 7-8. Impact of PBF on performance on standardized clinical vignettes ........................................................................................... 40
Table 7-9. Exit Interviews and Direct Observations Analytical Sample Size by Round ............................................................................ 41
Table 7-10. Association between PBF and Patient Exit Interview Indicators ............................................................................................... 41
Table 7-11. Association between PBF and Direct Observation Indicators in Rural Health Centers ................................................... 42
Table 7-12. Household Sample Sizes by Round ..................................................................................................................................................... 43
Table 7-13. Impact of PBF on health service delivery and outcomes for older adults ............................................................................ 44
Table 7-14. Impact of PBF on health service delivery and outcomes for recently pregnant women ................................................ 45
Table 7-15. Impact of PBF on health service delivery and outcomes for children .................................................................................... 46
Table 7-16. Impact of PBF on Community Perceptions towards Health Facility ........................................................................................ 48
Table 8-1. CQI and CRC impact on Structural Quality and Infrastructure .................................................................................................... 49
Table 8-2. CQI and CRC impact on Equipment Availability ................................................................................................................................ 50
Table 8-3. CQI and CRC impact on Service Availability ....................................................................................................................................... 51
Table 8-4. CQI and CRC impact on Administration and Management.......................................................................................................... 52
Table 8-5. CQI and CRC impact on Health Workers.............................................................................................................................................. 52
Table 8-6. CQI and CRC impact on performance on standardized clinical vignettes .............................................................................. 53
Table 8-7. CQI and CRC impact on Patient Exit Interview Indicators ............................................................................................................. 54
Table 8-8. CQI and CRC impact on Direct Observation Indicators .................................................................................................................. 55
Table 8-9. CQI and CRC impact on health service delivery and outcomes for older adults ................................................................. 56
Table 8-10. CQI and CRC impact on health service delivery and outcomes for recently pregnant women .................................. 57
Table 8-11. CQI and CRC impact on health service delivery and outcomes for children....................................................................... 58
Table 8-12. CQI and CRC impact on Community Perceptions towards Health Facility .......................................................................... 59
Table 10-1. Size of sampled population by treatment arm, Tajikistan, 2015 & 2018 .............................................................................. 62
Page 6
3.3 Appendix Table A10.2-1: PBF Impact and Factor Scores for Rural Health Centers ....................................................................................................... 64
Table A10.2-2: PBF Impact and Factor Scores for Health Houses ................................................................................................................... 65
Table A10.2-3: PBF Impact on Disaggregated Indicators for RHC Health Workers ................................................................................. 66
Table A10.2-4: PBF Impact on Disaggregated Indicators for HH Health Worker Satisfaction ............................................................. 67
Table A10.2-5: PBF Impact on Disaggregated Indicators for Patient Satisfaction .................................................................................... 68
Table A10.2-6: PBF Impact on Disaggregated Indicators for Direct Observation of Adult Consultations ...................................... 69
Table A10.2-7: PBF Impact on Disaggregated Indicators for Direct Observation of Child Consultations ....................................... 70
Table A10.2-8: PBF Impact on Disaggregated Indicators for CV-1 ................................................................................................................. 71
Table A10.2-9: PBF Impact on Disaggregated Indicators for CV-2 ................................................................................................................. 72
Table A10.2-10: PBF Impact on Disaggregated Indicators for CV-3 ............................................................................................................... 73
Table A10.2-11: PBF Impact on Disaggregated Indicators for CV-4 ............................................................................................................... 74
Table A10.2-12: PBF Impact on Disaggregated Indicators for CV-5 ............................................................................................................... 75
Table A10.2-13: PBF Impact on Disaggregated Indicators for CV-6 ............................................................................................................... 76
Table A10.3-1: CQI/CRC Impact on Disaggregated Indicators for Rural Health Centers ....................................................................... 78
Table A10.3-2: CQI/CRC Impact on Disaggregated Indicators for Health Houses ................................................................................... 79
Table A10.3-3: CQI/CRC Impact on Disaggregated Indicators for RHC Health Workers ....................................................................... 80
Table A10.3-4: CQI/CRC Impact on Disaggregated Indicators for HH Health Worker Satisfaction ................................................... 81
Table A10.3-5: CQI/CRC Impact on Disaggregated Indicators for Patient Satisfaction .......................................................................... 82
Table A10.3-6: CQI/CRC Impact on Disaggregated Indicators for Direct Observation of Adult Consultations ............................ 83
Table A10.3-7: CQI/CRC Impact on Disaggregated Indicators for Direct Observation of Child Consultations ............................ 84
Table A10.3-8: CQI/CRC Impact on Disaggregated Indicators for CV-1 ....................................................................................................... 85
Table A10.3-9: CQI/CRC Impact on Disaggregated Indicators for CV-2 ....................................................................................................... 86
Table A10.3-10: CQI/CRC Impact on Disaggregated Indicators for CV-3 .................................................................................................... 87
Table A10.3-11: CQI/CRC Impact on Disaggregated Indicators for CV-4 .................................................................................................... 88
Table A10.3-12: CQI/CRC Impact on Disaggregated Indicators for CV-5 .................................................................................................... 89
Table A10.3-13: CQI/CRC Impact on Disaggregated Indicators for CV-6 .................................................................................................... 90
Table A10.4-1: Infrastructure Indicator Means by Treatment Arm .................................................................................................................. 91
Table A10.4-2: Equipment Indicator Means by Treatment Arm ....................................................................................................................... 92
Table A10.4-3: Health Facility Service Availability Indicator Means by Treatment Arm ......................................................................... 93
Table A10.4-4: Administration Indicator Means by Treatment Arm ............................................................................................................... 94
Table A10.4-5: Health Worker Indicator Means by Treatment Arm ............................................................................................................... 94
Table A10.4-6: Exit Interview Indicator Means by Treatment Arm .................................................................................................................. 95
Table A10.4-7: Direct Observation Indicator Means by Treatment Arm ....................................................................................................... 96
Table A10.4-8: Clinical Vignette Indicator Means by Treatment Arm ............................................................................................................ 98
Table A10.4-9: Older Adult Health Indicator Means by Treatment Arms ..................................................................................................... 99
Table A10.4-10: Maternal Health Indicator Means by Treatment Arm ....................................................................................................... 100
Table A10.4-11: Child Health Indicator Means by Treatment Arm .............................................................................................................. 101
Table A10.4-12: Satisfaction with health services Indicator Means by Treatment Arm ....................................................................... 102

Page 7
4 EXECUTIVE SUMMARY
1. This report summarizes the impact of the performance based financing (PBF) component of the Health Services
Improvement Project (HSIP) for Tajikistan. The goal of HSIP is to contribute to the improvement of the coverage
and quality of basic primary health care (PHC) services in rural health facilities in selected districts. HSIP supports PBF
in Khatlon and Sughd regions, in eight districts. Performance-based financing in Tajikistan incentivizes the coverage
and quality of family planning, antenatal and postnatal care, child vaccination and growth monitoring, and
hypertension and blood pressure management. The focus on both maternal and child health (MCH) indicators and
non-communicable disease in adults over-40 reflects the dual burden of disease in Tajikistan.
2. This impact analysis relies on a difference-in-difference analysis which compared the change in trends between the
PBF facilities and control facilities. A baseline survey was conducted between November 2014 and July 2015, and
fieldwork for the follow-up survey took place from April to July of 2018. The final analytical sample included 210 rural
health centers, 139 health houses, and 4910 households at baseline and 5689 households at follow up.
3. Overall, we found many improvements in utilization and quality of care in both treatment and control districts over
the study period.
4. PBF is an efficient mechanism in improving readiness and quality of care. The results of the evaluation suggest
that PBF significantly improved many aspects of quality of care: availability of equipment and supplies, infrastructure,
service availability and content of care.
5. The evaluation finds large increases in infrastructure and equipment indicators. Equipment availability had
benefits beyond patient services, such as infection prevention and control and vaccine storage. Improvements were
noted even for indicators which are a national priority, such as increasing the availability of water. The evaluation also
reported an improvement in the availability in most drugs and in provider competency, measured through clinical
vignettes.
6. The evaluation shows evidence the improvements in structural quality and provider knowledge also translated into
better content of care, as measured by direct clinical observations. For example, providers in the PBF facilities are
significantly more likely to perform key physical exams such as measure blood pressure of adult patients and measure
the height and weight of children under 5.
7. The effect of PBF on healthcare utilization is mixed. While we find strong evidence of improved quality at the
primary level and observe that the communities noticed the change, we find more moderate impacts on utilization of
health services by the community. With respect to adult health, we find positive impact of 8 percentage points on the
likelihood adults over 40 had their blood pressure measured by a health professional in the preceding year. With
respect to maternal and child health services, we find a 14 percentage-point increase in the rate of women who
received timely postnatal care. However, we do not find statistically significant impacts on timing and number of
antenatal consultations, child growth monitoring or vaccination. We also do not find an impact on family planning
coverage.
8. We find no evidence of negative spillovers on unincentivized services. We also found evidence for an increase in
the proportion of adults who reported using RHC or HH services, and a corresponding reduction the proportion of
community members who passed over local PHC in favor of urban health centers or hospitals.
9. Benefits extended to health workers and community members. PBF increased providers satisfaction. The
population noticed the improvements in the facilities and reported better engagement between the facilities and
communities.
Page 8
10. The results from the impact evaluation of PBF in Tajikistan are overall in line with the global evidence about
PBF. Indeed, in many countries, PBF reforms have had mixed results in increasing utilization, while often leading to
better results for quality of care (see Kandpal 2017 for an overview). The quality of care impacts measured in Tajikistan
are actually among the strongest in the portfolio of impact evaluations because they go beyond structural quality
(infrastructure and equipment) and also include significant improvements in the content of care as measured by direct
clinical observations with heath providers more likely to perform specific examinations during the visit.
11. This evaluation of performance-based financing (PBF) in Tajikistan shows that supply-side incentives to health facilities
and health providers are effective in improving the quality of the care, including the content of care, provided.
However, it appears that those supply-side incentives are not always sufficient to reach target coverage rates among
mothers and their young children and adult patients. These results suggest that demand-side barriers might limit
improvements in coverage. It might therefore be useful to further explore the role financial and non-financial barriers
play on the demand side. Further, it might be interesting to pilot and evaluate the use of demand-side incentives,
alongside supply-side incentives, as an approach to increase child and adult health utilization and outcomes.
12. This study evaluates also the impacts of two other interventions, collaborative quality improvement and citizen
report cards, using a randomized design. Collaborative Quality Improvement (CQI) assists facilities in establishing a
quality improvement framework and flow charts for case management. Citizen’s Score Cards (CRC) establish dialogue
and expectations with catchment communities. The results of these interventions are presented separately from that
of PBF for several reasons. First, while the PBF pilot started in 2015, these two interventions were only introduced in
the end of 2016 and therefore had less time to impact outcomes. Second, much less resources were spent on the
design, implementation and monitoring of these interventions. Third, these interventions are narrower in scope
relative to the PBF. For these reasons, a direct comparison of PBF, CRC and CQI is not appropriate.
13. For the Citizen Report Card intervention, no significant impacts are found when compared to the control arm.
When CRC was implemented jointly with PBF, outcomes are overall similar to those in the PBF only arm. The only
difference was found with respect to satisfaction of adults over 40. Relative to those living in the catchment areas of
PBF only RHCs, the adults in the CRC+PBF areas were more likely to report improvements with respect to the attitude
of providers, collaboration between RHCs and communities, facility infrastructure and quality of health services.
14. In comparison to the comparison arm, children in the Collaborative Quality Improvement arm were less likely to
be underweight by 7 percentage points. While the results do not show impacts of CQI on utilization of health
services and on knowledge of providers, they indicate that providers in the CQI arm better perform growth monitoring
tasks and are more likely to discuss nutrition in general during under-5 curative consultations.
5 BACKGROUND
5.1 Project Context
5.1.1 Country Context
15. Tajikistan is a mountainous and landlocked former Soviet republic in Central Asia. The 2017 population is an
estimated 8.93 million persons.1 About three-quarters of the country live in rural areas, and over a third are under the
age of 14.2 Tajikistan has seen significant advances since the conclusion of the civil war in 1997. Industrialization has
driven high rates of economic growth over the past decade, and literacy rates are nearly 100%. However, the country
remains the poorest among former USSR states, classified by World Bank as a low-income country.2 Remittances
constitute much of economic input, estimated to be the third highest in the world at 31.6%.2 About 54.2% of the
population falls below the $3.20 (2011 PPP) International Poverty Line benchmark for lower-middle-income countries,
with a poverty gap of 18.9%.2
16. There are four levels of administration, the republican (national), oblast (province), rayon (district), and jamoat
(municipality). Climate and availability of arable land vary drastically between oblasts, changing with elevation.
Geographic differences and difficult terrain compound inherited political forces resulting in significant regional
disparities; particularly in basic transportation and utilities infrastructure. Water and reliable electricity are unavailable
or obsolete in many parts of the country.
5.1.2 Health System and Outcomes
17. The Tajik population is young and growing. Life expectancy at birth has risen to 71.1 years, with a total fertility rate
of 3.8.2 Consistent progress has been made in reducing maternal and child mortality, though the Millennium
Development Goals targets were not achieved and progress between districts is uneven. Combined with a decrease
in morbidity of communicable disease, Tajikistan now faces a dual burden of chronic and infectious, nutritional, and
maternal disease. Chronic disease burden in Tajikistan is growing, comprise 53% of Disability-Adjusted Life Years
(DALYs).3 Cardiovascular diseases account for 20% of Years of Life Lost as of 2017, while maternal and neonatal
conditions accounted for 16% of YLLs. Hypertension is poorly detected and managed in Tajikistan. As of 2012, 11% of
the adult population reported having a heart check-up, and 42% a reported having a blood pressure test during the
previous 12 months. Less than half (45%) of those with high blood pressure were aware of their status, and only 31%
were prescribed treatment.
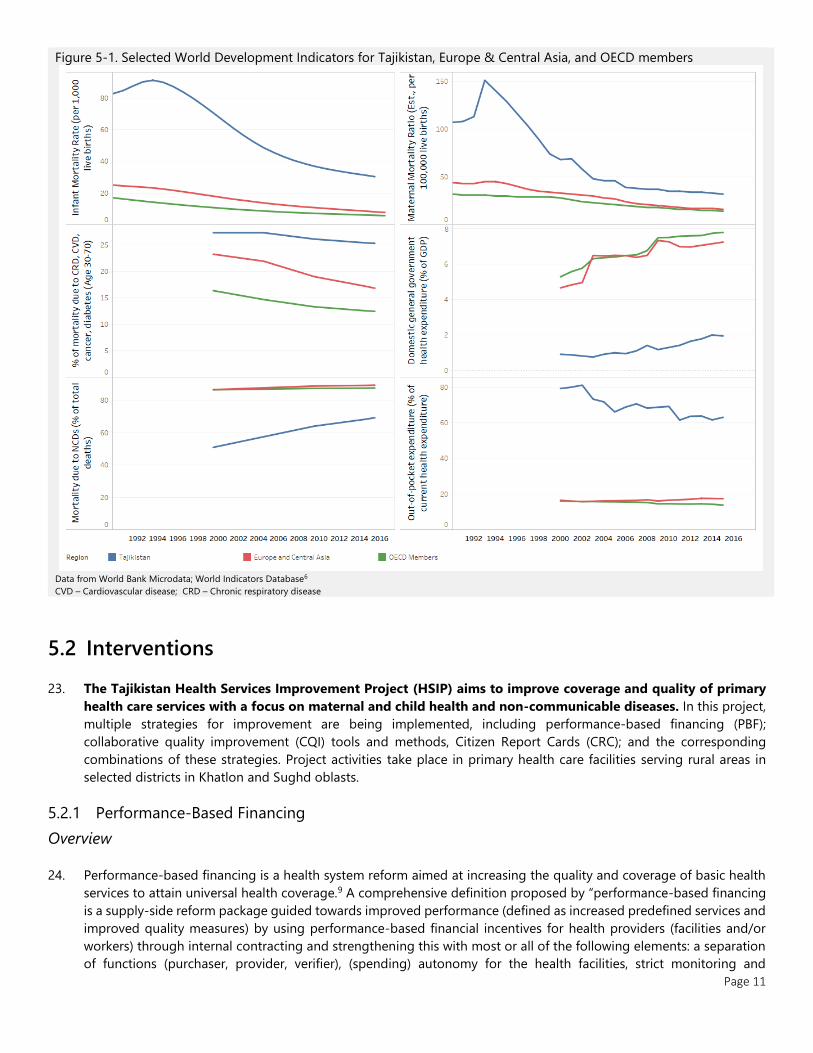
18. At 1.9%, public health expenditure on health is near the bottom of countries in the Europe and Central Asian (ECA)
regional group.2 Private out-of-pocket spending accounts for the majority (63%) of health outlays, and both informal
and formal user fees are common.4 Public spending on subnational health service delivery is locally directed, adding
to the uneven distribution of resources across oblasts.
19. Tajikistan’s health system is heavily centralized. Health services are provided overwhelmingly within the public
sector, focusing historically on hospital care and curative rather than preventative care.4 This model became
unaffordable during the early years of Tajikistan's transition from the Soviet Republic; after independence informal
out-of-pocket payments became customary.
20. The structure of service delivery differs between urban and rural settings. In urban areas, the rayon health centers
provide the first level of health service, rayon hospitals deliver basic secondary care, and oblast and national hospitals
can cater to specialized needs. Rural health centers (RHCs, subordinate to rayon health centers) provide basic
secondary and primary care. RHCs may also manage ‘health houses’, which serve isolated or large kishlaks (villages)
and jamoats (municipalities). Health houses offer basic medical care (vaccinations, prenatal care, immunizations, first
aid) and medical referrals in remote areas. The level of service provided at the health house is matched against the
available resources and infrastructure, and some basic services such as institutionalized delivery and hypertension
Page 10
management are not offered universally. Staff at both health houses and RHCs spend a portion of their time
supplementing clinic hours with home visits. Rural-urban and geopolitical disparities in care-seeking persist as
coverage rates for key services are much lower in rural than in urban areas.
21. Critical gaps persist in the quality of care. Previous efforts to improve the financing, capacity and physical
infrastructure at the Primary Health Care (PHC) level did not translate into sufficient improvements in quality of care.
Supervision of PHC workers is irregular, and training is not performed systematically. In 2012 at the onset of this
project, no Integrated Management of Childhood Illness (IMCI)-trained nurse worked in any of the 20 PHC facilities
surveyed in the Sughd region. At least 60% of surveyed PHC facilities did not have the recommended supplies and
equipment, and a significant proportion did not have essential antibiotics to treat common childhood illnesses.
22. The Tajik population is inadequately covered by basic services such as nutrition counseling or family planning,
especially in rural areas. Only 63% of children under-5 years of age who had symptoms of acute respiratory infection
(ARI) and 57% with fever were taken to an appropriate health care provider.5 Treatment for childhood diarrhea was
sought from a health provider for 54 percent of the time. Six in ten of the children who had diarrhea were given fluids
prepared from an oral rehydration solution (ORS) package. Coverage of antenatal care (ANC) is better. About 79
percent of pregnant women report they saw a health professional at least once for ANC (82.7% in urban areas and
77.7% in rural areas, Tajikistan DHS 2012). 87 percent of deliveries were assisted by a skilled provider, and 76.5 percent
of all women delivered in a health facility (87.4% in urban areas and 73.6% in rural areas, Tajikistan DHS 2012). Though
considerable progress has been made, Tajikistan has not yet achieved the targeted reductions in maternal and child
mortality specified by MDGs 4 and 5 originally planned for 2015 (Figure 5-1). Infant mortality decreased from 72.9
deaths per 1,000 livebirths in 2000 to 30.3 in 2016, and the Children Under-five (CU5) mortality rate decreased from
91 to 34.6. Both remain higher than the target rates of 25 and 30, respectively.2 Child mortality is driven by high rates
of malnutrition, micronutrient deficiencies, and preventable illness. Prevalence of stunting in children under 5 is 26.8%,
and acute infections are the leading cause of deaths in the post-neonatal period.2 Acute respiratory illness (ARI),
pneumonia, and acute diarrhea account for more than 50% of reported child deaths within the first year of life, a
persistent pattern over the last eight years.6 Poor MCH outcomes are driven by systematic health sector issues,
including substantial shortfalls in state funding, aging infrastructure, and outdated knowledge and skills among health
workers. These barriers reduce access to and quality of care at all levels.7 Overall, among the two regions in which the
evaluation was conducted, Sughd has health outcomes and utilizations above the national average (e.g. U5 mortality:
40, at least one ANC visit: 94.1%, in facility delivery: 93.3%, Tajikistan DHS 2012), while Khatlon is below the national
average (e.g. U5 mortality: 61, at least one ANC visit: 66.8%, in facility delivery: 67.4%, Tajikistan DHS 2012).
Page 11
Figure 5-1. Selected World Development Indicators for Tajikistan, Europe & Central Asia, and OECD members
Data from World Bank Microdata; World Indicators Database6
CVD – Cardiovascular disease; CRD – Chronic respiratory disease
5.2 Interventions
23. The Tajikistan Health Services Improvement Project (HSIP) aims to improve coverage and quality of primary
health care services with a focus on maternal and child health and non-communicable diseases. In this project,
multiple strategies for improvement are being implemented, including performance-based financing (PBF);
collaborative quality improvement (CQI) tools and methods, Citizen Report Cards (CRC); and the corresponding
combinations of these strategies. Project activities take place in primary health care facilities serving rural areas in
selected districts in Khatlon and Sughd oblasts.
5.2.1 Performance-Based Financing
Overview
24. Performance-based financing is a health system reform aimed at increasing the quality and coverage of basic health
services to attain universal health coverage.9 A comprehensive definition proposed by “performance-based financing
is a supply-side reform package guided towards improved performance (defined as increased predefined services and
improved quality measures) by using performance-based financial incentives for health providers (facilities and/or
workers) through internal contracting and strengthening this with most or all of the following elements: a separation
of functions (purchaser, provider, verifier), (spending) autonomy for the health facilities, strict monitoring and

Page 12
verification of services, community involvement, result-based planning and accountability arrangements.”8 This
definition reflects the variety in implementation and design as PBF interventions are adapted to country context. The
common underlying mechanism is the provision of supply-side incentives by purchasing a set of specified health
services, conditional on the quality of service provision.
25. The dual burden of MCH and NCDs in Tajikistan and poor service provision suggested, based on the emerging
international evidence, that the use of PBF as a potentially powerful tool to improve primary health care (PHC) in
Tajikistan. Although demand side activities to motivate the population to access PHC services were also considered, a
feasibility assessment done in 2012 concluded that it was still too early to pilot such an approach in Tajikistan. As such
the initial focus would be on supply side interventions, with possible inclusion of a demand side approach at a later
stage.
26. The hypothesis is that supply-side pay for performance scheme which links facility payments and health worker
performance bonuses to service outputs and quality of priority PHC services at facility level could:
• Create incentives to improve the coverage and quality of priority PHC services
• Motivate health workers to use their skills and knowledge to achieve results
• Lower informal payments by increasing payments for health workers while increasing their accountability for
results
• Improve facility functioning by giving managers autonomy to use RBF resources to procure inputs needed to
deliver health services
• Increase resources for priority PHC services by supplementing funds and in-kind support facilities receive through
the existing mechanisms and sources
Program Structure
27. Facilities receive financial incentives every quarter according to the volume of services delivered and an overall quality
score. Providers reported that PBF payments were received in a timely manner. Quantity and quality are rewarded in
combination to avoid unintended effects on provider behavior; quality payment is a proportion of quantity payment.
The selected incentives deliberately emphasize preventative rather than curative services to avoid excessive or
unwarranted service provision. All indicators are measured by health facilities using their registers and patient records,
verified by district health teams and the State Health Activities Supervision Services (SHASS) agency. Quality of care is
scored by a quality checklist, conducted during the SHASS visits. UNICEF conducted 7 rounds of additional external
independent counter verification to confirm the reporting by the facilities, both in terms of quantity of services
provided and in terms of quality of care assessment. A maximum of 70% of PBF payments to the facilities can be
distributed as bonuses to clinical staff, with 30% allocated towards reinvestment in the facility. District health teams
approve action plans developed by the facilities to approve these reinvestments.
Performance-based financing in Tajikistan incentivizes maternal and child health and hypertension services, and
general quality of care. Following the midterm review of the project in 2017, the specific indicators were revised. The
indicators of service quantity and the corresponding incentives, before and after the manual revision, are listed in
Page 13
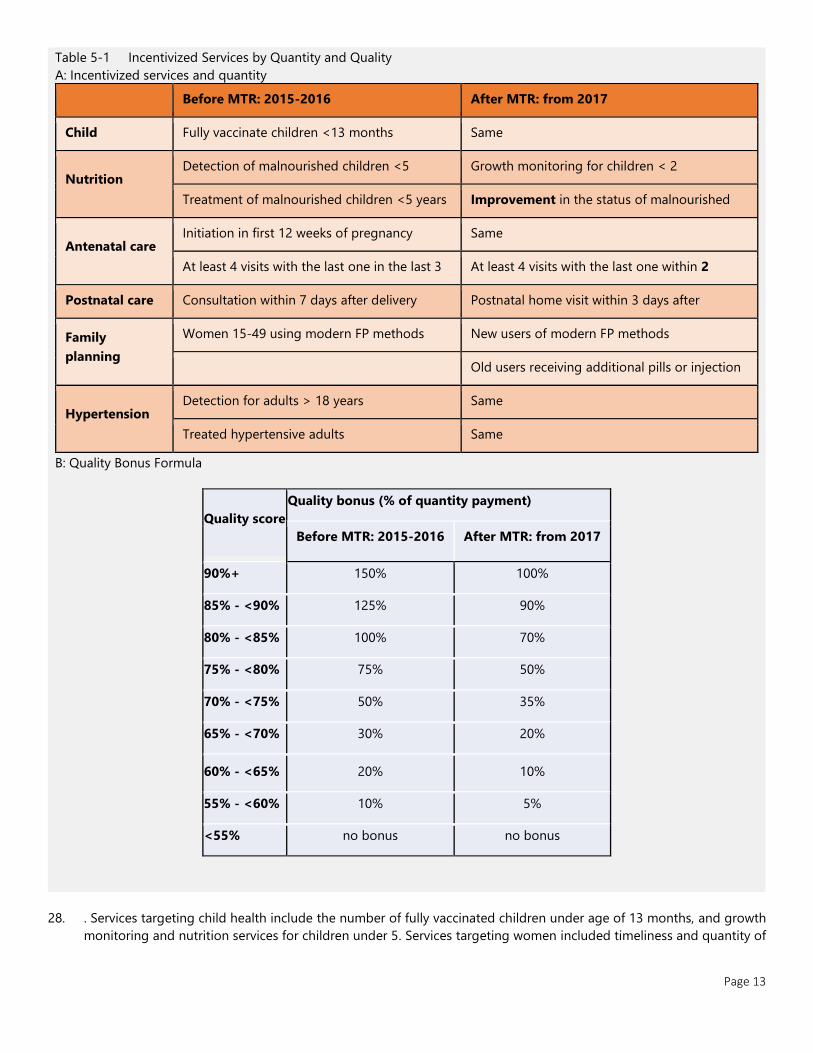
Table 5-1 Incentivized Services by Quantity and Quality
A: Incentivized services and quantity
Before MTR: 2015-2016 After MTR: from 2017
Child
vaccination
Fully vaccinate children <13 months Same
Nutrition Detection of malnourished children <5 Growth monitoring for children < 2
Treatment of malnourished children <5 years Improvement in the status of malnourished
children <5 years
Antenatal care Initiation in first 12 weeks of pregnancy Same
At least 4 visits with the last one in the last 3
weeks of pregnancy
At least 4 visits with the last one within 2
weeks of expected delivery Postnatal care Consultation within 7 days after delivery Postnatal home visit within 3 days after
discharge from delivery facility
Family
planning
Women 15-49 using modern FP methods New users of modern FP methods
Old users receiving additional pills or injection
Hypertension Detection for adults > 18 years Same
Treated hypertensive adults Same
B: Quality Bonus Formula
Quality score
Quality bonus (% of quantity payment)
Before MTR: 2015-2016 After MTR: from 2017
90%+ 150% 100%
85% - <90% 125% 90%
80% - <85% 100% 70%
75% - <80% 75% 50%
70% - <75% 50% 35%
65% - <70% 30% 20%
60% - <65% 20% 10%
55% - <60% 10% 5%
<55% no bonus no bonus
28. . Services targeting child health include the number of fully vaccinated children under age of 13 months, and growth
monitoring and nutrition services for children under 5. Services targeting women included timeliness and quantity of

Page 14
ANC visits, postnatal care visits, and contraceptive use. Hypertension services target increasing the number of
diagnoses, and the number of hypertensive patients on treatment.
Page 15
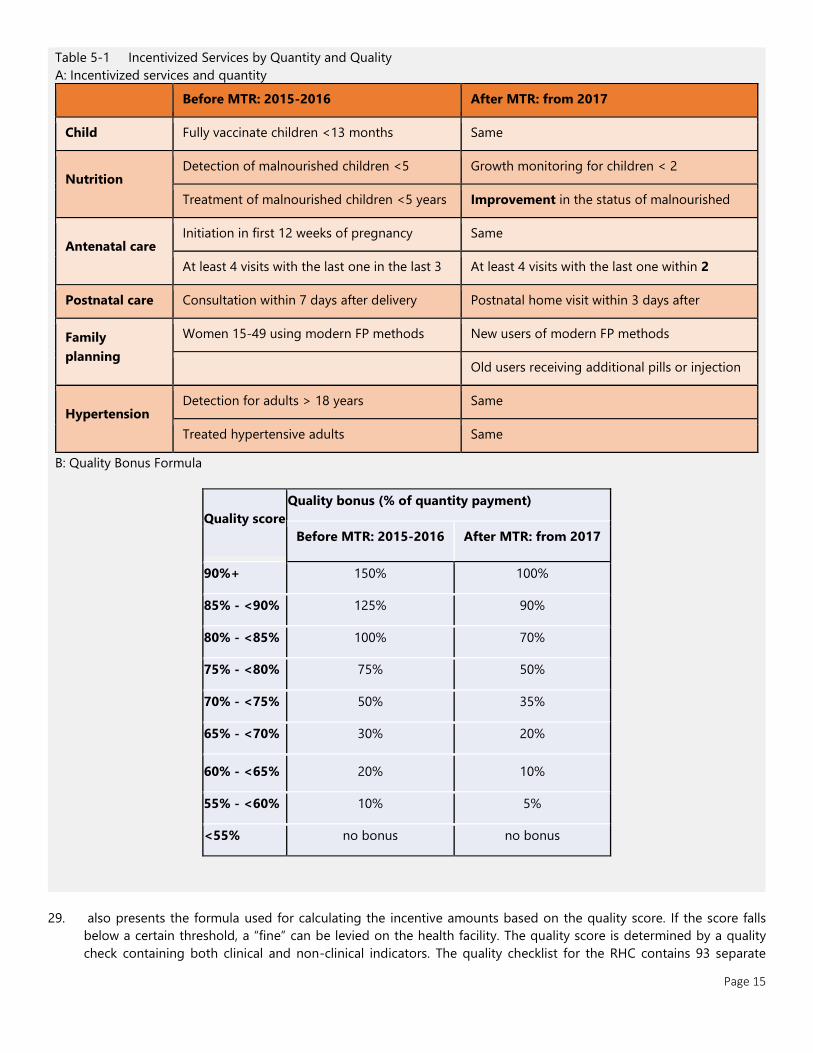
Table 5-1 Incentivized Services by Quantity and Quality
A: Incentivized services and quantity
Before MTR: 2015-2016 After MTR: from 2017
Child
vaccination
Fully vaccinate children <13 months Same
Nutrition Detection of malnourished children <5 Growth monitoring for children < 2
Treatment of malnourished children <5 years Improvement in the status of malnourished
children <5 years
Antenatal care Initiation in first 12 weeks of pregnancy Same
At least 4 visits with the last one in the last 3
weeks of pregnancy
At least 4 visits with the last one within 2
weeks of expected delivery Postnatal care Consultation within 7 days after delivery Postnatal home visit within 3 days after
discharge from delivery facility
Family
planning
Women 15-49 using modern FP methods New users of modern FP methods
Old users receiving additional pills or injection
Hypertension Detection for adults > 18 years Same
Treated hypertensive adults Same
B: Quality Bonus Formula
Quality score
Quality bonus (% of quantity payment)
Before MTR: 2015-2016 After MTR: from 2017
90%+ 150% 100%
85% - <90% 125% 90%
80% - <85% 100% 70%
75% - <80% 75% 50%
70% - <75% 50% 35%
65% - <70% 30% 20%
60% - <65% 20% 10%
55% - <60% 10% 5%
<55% no bonus no bonus
29. also presents the formula used for calculating the incentive amounts based on the quality score. If the score falls
below a certain threshold, a “fine” can be levied on the health facility. The quality score is determined by a quality
check containing both clinical and non-clinical indicators. The quality checklist for the RHC contains 93 separate

Page 16
indicators in ten categories. Health house checklists are a subset, containing 60 indicators in 8 categories, reflecting
the reduced number of services provided. The category with indicators about laboratory services and non-
communicable diseases are only relevant for RHCs. The quality checklist includes indicators directly related to the
incentivized services but also includes quality indicators related to non-incentivized services such as diarrhea and ARI.
Examples of Non-clinical items include items related to hygiene and cleanliness, an organization of patient files, HMIS
records, stock of drugs and supplies, as well as (financial) management issues.
Page 17
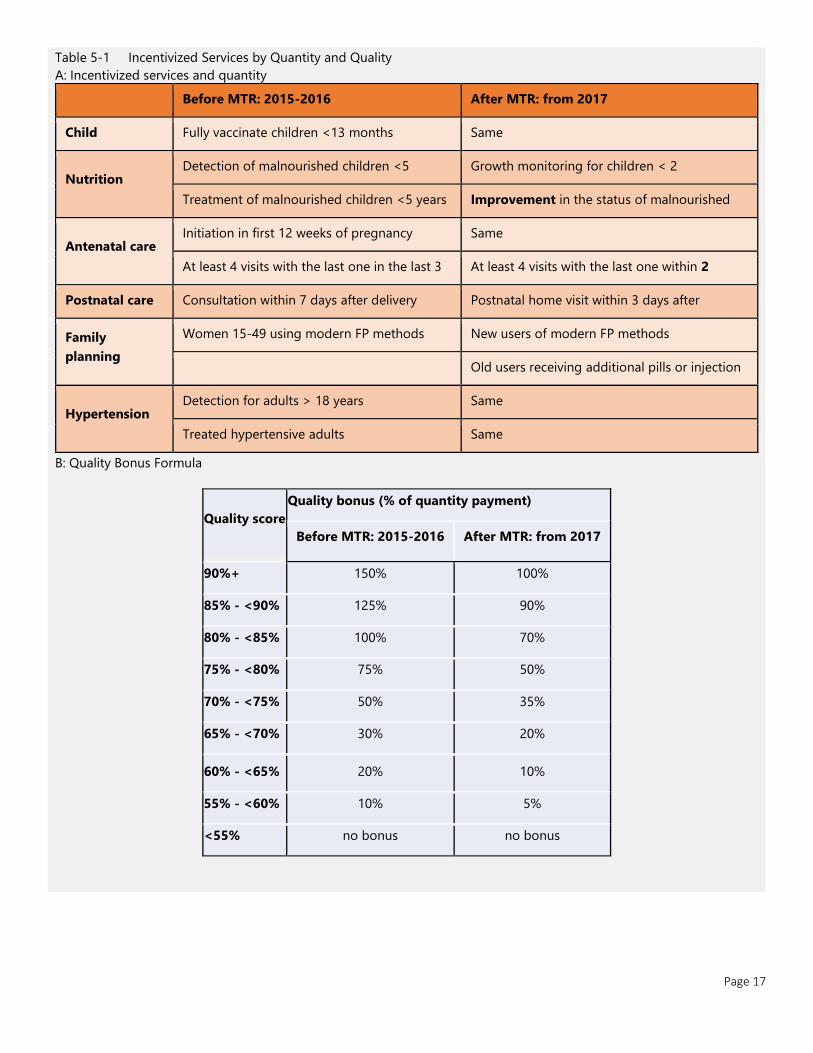
Table 5-1 Incentivized Services by Quantity and Quality
A: Incentivized services and quantity
Before MTR: 2015-2016 After MTR: from 2017
Child
vaccination
Fully vaccinate children <13 months Same
Nutrition Detection of malnourished children <5 Growth monitoring for children < 2
Treatment of malnourished children <5 years Improvement in the status of malnourished
children <5 years
Antenatal care Initiation in first 12 weeks of pregnancy Same
At least 4 visits with the last one in the last 3
weeks of pregnancy
At least 4 visits with the last one within 2
weeks of expected delivery Postnatal care Consultation within 7 days after delivery Postnatal home visit within 3 days after
discharge from delivery facility
Family
planning
Women 15-49 using modern FP methods New users of modern FP methods
Old users receiving additional pills or injection
Hypertension Detection for adults > 18 years Same
Treated hypertensive adults Same
B: Quality Bonus Formula
Quality score
Quality bonus (% of quantity payment)
Before MTR: 2015-2016 After MTR: from 2017
90%+ 150% 100%
85% - <90% 125% 90%
80% - <85% 100% 70%
75% - <80% 75% 50%
70% - <75% 50% 35%
65% - <70% 30% 20%
60% - <65% 20% 10%
55% - <60% 10% 5%
<55% no bonus no bonus
Page 18
5.2.2 Collaborative Quality Improvement
30. The Collaborative Quality Improvement intervention responds to concerns that performance incentives may
not produce improvements if providers lack the necessary competencies, data, and knowledge. CQI introduces
and collaboratively creates a toolset aimed at defining, monitoring, and improving clinical care for services. In
Tajikistan, CQI focused on child malnutrition, acute respiratory infections, and hypertension.
31. The principal quality improvement tool is a flowsheet, used to track and remind clinicians of the recommended
process for each visit. Flowsheets were developed for monitoring hypertension and nutrition, managing pneumonia
and diagnosing hypertension. Quality metrics were developed for each of these areas, including measuring the
percentage of patients with blood pressure under control; a composite index of appropriate drug management (e.g.
use of ACE inhibitors in diabetes); lifestyle; malnutrition (stunting, wasting, underweight); dietary habits (e.g.
breastfeeding, introduction of complementary foods at age 6 months), and clinical interventions (e.g. vitamin
supplementation). Indicators are tracked in a database, populated by the flowsheets. Reports allowed patient-level
notifications such as identifying patients in poor control needing more intensive treatment, overdue for visits. Clinic
staff were trained on how to submit monthly quality improvement plans. All tools were refined during extensive field
testing.
5.2.3 Citizen Score Cards
32. The Citizen Report Card aims to strengthen the accountability of health facilities to their local constituents.
Within a wider suite of approaches, information and accountability interventions have emerged as potential policy
solutions to improving the performance of public service providers.9 Scorecards are an active form of accountability
as they involve meetings of citizens and providers to engage in the planning and supervision of local health care
services and to facilitate interaction and priority-setting among local actors. The core functions of report cards are to
aggregate and communicate information on health care outputs (quantity and quality) to track performance and
enhancing accountability.
33. Report cards can improve health sector outcomes by informing patients as well as providers.10 First, by communicating
standards of care to providers who may be unaware of their performance relative to their peers or clinical standards,
report cards may intrinsically motivate some providers to increase their effort or learning and the quality of care they
deliver. Second, where choice is available, report cards can enable patients to select higher quality providers. This can
improve both the average quality of care received, as patients sort into better providers, and the absolute quality of
care available, as providers respond to changes in patient demand by improving their quality ratings.11 Reporting
initiatives can also engage local stakeholders and providers even where there is little or no choice between providers,
for instance by encouraging communities to demand improvements on particular aspects of service provision. Overall,
health care report cards have been associated with better matching of providers and patients12, lower mortality,13 and
improvements in various process and outcome indicators,14 in a range of contexts.
34. In contrast to high income countries, where report cards are a well-established part of performance-based
accountability systems, there are only a few documented reporting initiatives in low- and middle-income settings.15
Preliminary assessments suggest an overall improvement although the impacts for individual indicators are more
mixed ( MEASURE 2003 ). In a community-based monitoring program in Malawi, local organizations also used report
cards to support participatory decision processes but generated priority areas and scoring for the report card through
focus groups rather than surveys.16 A randomized experiment in Uganda used household and facility surveys to report
on a curated list of measure such as quality of services, informal user fees, and utilization. Facilitators from local NGOs
used participatory methods to disseminate the information during a series of meetings with community members and
facility staff, with the aim of raising awareness, identifying common priorities and developing ‘action plans’ to effect
improvements.14 The findings suggest this intervention stimulated community monitoring and provider effort,14 and
led to improvements in utilization and health outcomes which persisted over four years.17 This research also suggests
complementing participatory interventions with specific information about providers’ performance may help
communities identify problems which can be addressed by local action of users or health care workers.17
Page 19
35. In the Tajikistan program, the Citizen Report Cards was introduced from September 2015 to 2018. Between September
2015 and May 2016, the intervention was developed, the meetings schedule and content were prepared and piloted
and 2 facilitators were recruited. During the evaluation period, 3 rounds of meetings with the population and health
staff were carried out. Meetings with the population were held without the presence of the health staff, in Jamoats. A
total of 288 meetings were held reaching a population with 4900 participants. In addition, similar meetings were
conducted separately with the health staff, for a total of 288 meetings with 1,440 attendants. Both meetings discussed
the facility report card calculated based using first the baseline survey data (first rounds) and the data from the PBF
program (subsequent rounds). After discussing the report card, both meetings focused on formulating action points
for improvement that could be included in a joint action plan. The organization of meetings with the population and
the invitation of participants in all districts was arranged with the support of Jamoats and Mahalla Committees in
target villages. The necessary assistance in organizing meetings with the health staff in pilot and control RHCs was
provided by the district PHC management– Managers of the District Health Centers.
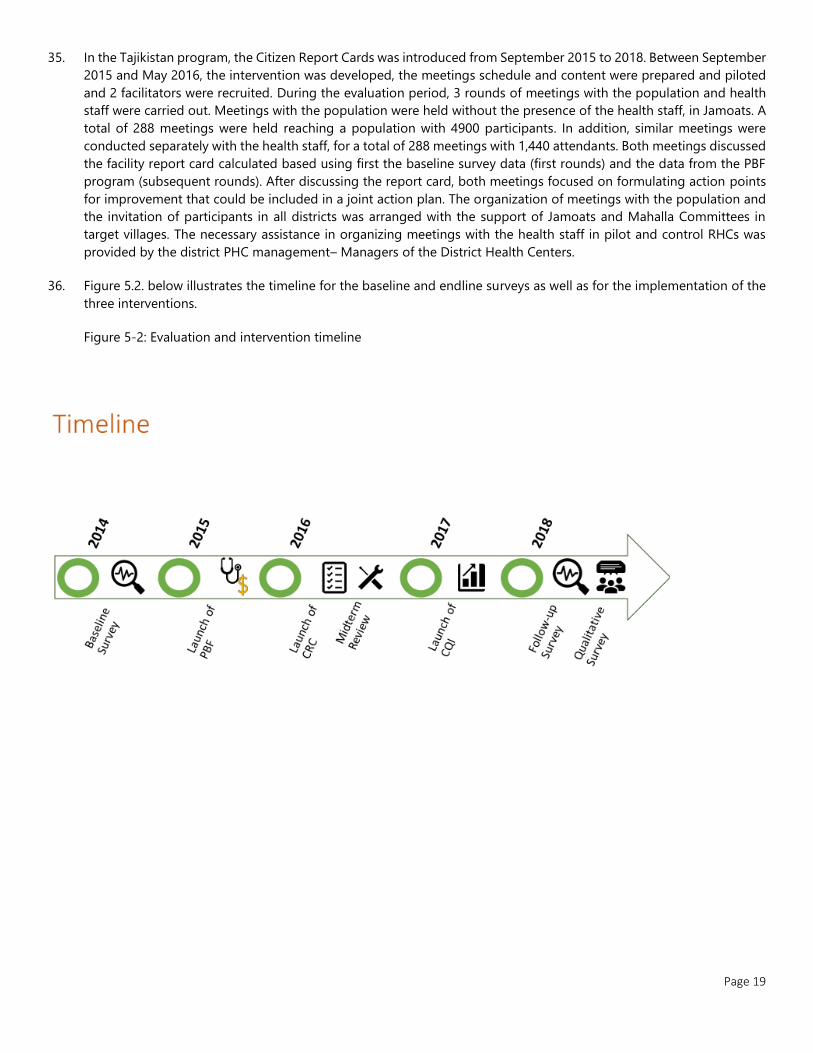
36. Figure 5.2. below illustrates the timeline for the baseline and endline surveys as well as for the implementation of the
three interventions.
Figure 5-2: Evaluation and intervention timeline
Page 20
6 METHODS AND DATA
6.1 Study Objectives
38. The policy objective of this Impact Evaluation (IE) is to build evidence on the impact of the performance-based
financing (PBF) project in Tajikistan. More specifically, the IE would seek to ascertain: (i) the impact of the PBF model
implemented in Tajikistan; and (ii) whether PBF is more effective if implemented in conjunction with additional low-
cost interventions (Collaborative Quality Improvement (CQI), Citizen Report Cards (CRC)). The results from the IE will
help to inform the Ministry of Health (MOH) on whether PBF should be scaled-up to additional primary health care
(PHC) level institutions in other regions.
39. Since PBF, collaborative quality improvement, and citizen scorecards have never been implemented in large scale in
Tajikistan; it is to be expected the results from the IE will be useful for designing national PHC policy in Tajikistan, and
they will also contribute to the larger body of knowledge on these interventions.
40. Three primary research question focuses on the impact of the different intervention on coverage and quality of care:
1. What are the effects of PBF on the coverage and quality of targeted health services?
2. What are the effects of the CQI and CRC intervention on quality and coverage of health services relative to business-
as-usual?
3. What are the incremental effects of the CQI and CRC interventions when they are implemented in combination with
PBF?
41. The main targeted outcomes the IE measures fall into three main groups: (a) PHC service coverage indicators
specifically focusing on maternal and child health (MCH) and non-communicable disease (NCD), (b) quality of care
indicators, and (c) selected health outcome indicators to be measured through anthropometry or tests. Although the
project tries to improve maternal and child health outcomes, detecting such outcomes might require years and a very
large sample. Therefore, as reflected in the research questions above, the IE will focus mostly on the intermediate
outputs of the project, i.e., service coverage and quality, and equity, and may not have adequate power to detect
statistically significant changes in health outcomes.
6.2 Study Design
6.2.1 Empirical Strategy
42. The IE employs both difference-in-difference and experimental approaches to identify the impact of the different
combinations of interventions. Assignment to PBF was not random. Three districts in the Sughd region and four
districts in the Khatlon region were selected to implement the program. The availability of functional facilities, basic
medical equipment, and trained staff were pre-requisites for implementation of the PBF scheme in the project districts.
All Rural Health Centers in these seven districts are covered by the program. Nine additional districts (two in Sughd
and seven in Khatlon) were selected as control districts. The selection of control districts was guided by geographical
proximity to treatment districts and similarity regarding the number of health facilities and doctors per capita. The
districts were also selected so the number of RHCs in treatment and control groups in each region would be similar.
The MOH reported that no new interventions were introduced since the launch of the program in the control districts
and could not identify a major project targeting the same indicators.
43. A randomized evaluation design is used to answer primary research questions 2 and 3 evaluating the effects of the
additional CRC and CQI interventions on outcomes when implemented by themselves or beside the PBF scheme.
Page 21
Within the chosen 16 districts (treatment and control districts), of an RHCs were randomly assigned to implement
Collaborative Quality Improvement, Citizen Score Cards, or neither of these two interventions. The blocked-by-district
randomization seeks to ensure the different study groups are comparable regarding observed and unobserved
characteristics which could affect treatment outcomes so average differences in outcome can be causally attributed.
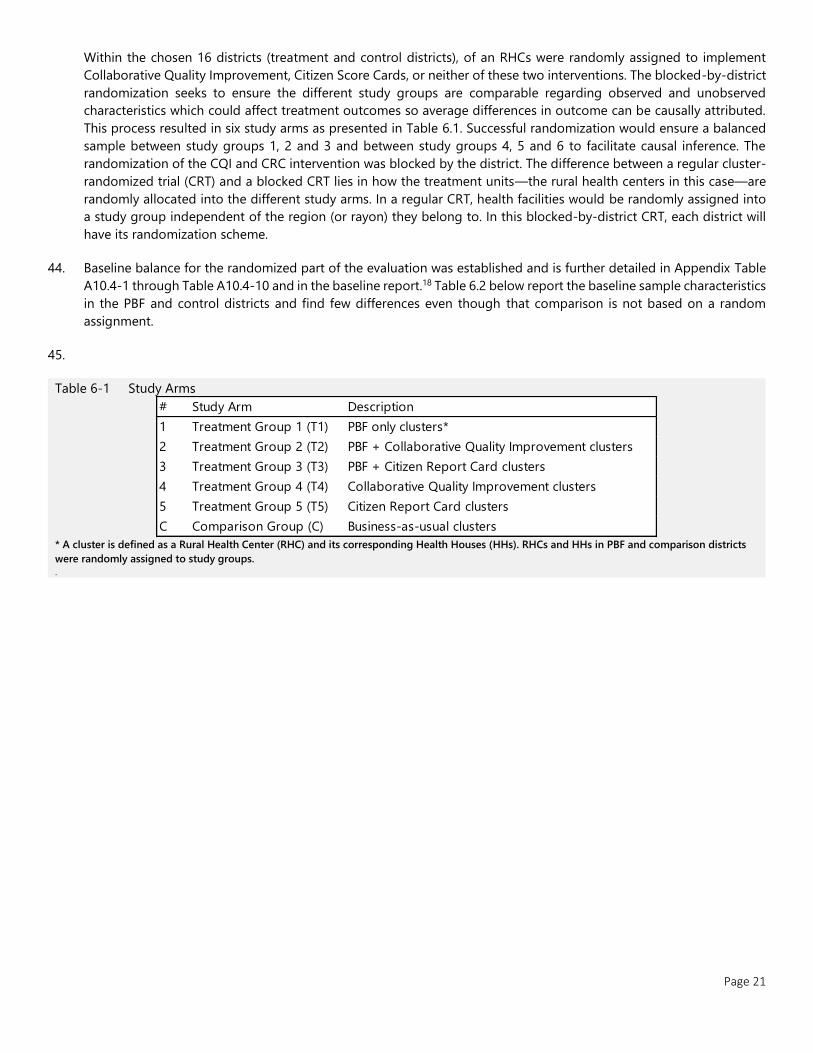
This process resulted in six study arms as presented in Table 6.1. Successful randomization would ensure a balanced
sample between study groups 1, 2 and 3 and between study groups 4, 5 and 6 to facilitate causal inference. The
randomization of the CQI and CRC intervention was blocked by the district. The difference between a regular cluster-
randomized trial (CRT) and a blocked CRT lies in how the treatment units—the rural health centers in this case—are
randomly allocated into the different study arms. In a regular CRT, health facilities would be randomly assigned into
a study group independent of the region (or rayon) they belong to. In this blocked-by-district CRT, each district will
have its randomization scheme.
44. Baseline balance for the randomized part of the evaluation was established and is further detailed in Appendix Table
A10.4-1 through Table A10.4-10 and in the baseline report.18 Table 6.2 below report the baseline sample characteristics
in the PBF and control districts and find few differences even though that comparison is not based on a random
assignment.
45.
Table 6-1 Study Arms
* A cluster is defined as a Rural Health Center (RHC) and its corresponding Health Houses (HHs). RHCs and HHs in PBF and comparison districts
were randomly assigned to study groups.
.
# Study Arm Description
1 Treatment Group 1 (T1) PBF only clusters*
2 Treatment Group 2 (T2) PBF + Collaborative Quality Improvement clusters
3 Treatment Group 3 (T3) PBF + Citizen Report Card clusters
4 Treatment Group 4 (T4) Collaborative Quality Improvement clusters
5 Treatment Group 5 (T5) Citizen Report Card clusters
C Comparison Group (C) Business-as-usual clusters
Page 22
Table 6.2 : Sample characteristics at baseline
Variable
Means by treatment
group
p-value for testing
difference between PBF and
control a N PBF Control
Rural
Health
Centers
Khatlon region 0.70 0.68 0.95 210
Any affiliated health
houses 0.69 0.77 0.44 210
Number of health houses 1.60 2.49 0.08* 210
Catchment population 5030 5612 0.57 201
Number of physicians 1.56 1.34 0.72 210
Number of midwives 1.03 1.10 0.72 210
Number of nurses 3.98 3.42 0.65 210
Laboratory 0.17 0.24 0.54 210
Improved source of water 0.72 0.73 0.89 210
Share of general
equipment 0.74 0.83 0.24 210
Share of essential drugs 0.26 0.29 0.75 210
Health
Workers
Male 0.39 0.38 0.89 1045
Age 42.63 42.34 0.83 1045
Physician 0.23 0.22 0.90 1045
Midwife 0.11 0.11 0.89 1045
Nurse 0.45 0.39 0.38 1045
Years of experience 18.63 18.07 0.68 1045
Monthly income (in TJS) 634 670 0.24 1037
Days absent in past month 0.34 0.69 0.12 1045
Hours worked in past
week 22.37 26.53 0.37 1045
Patients seen in past day 3.83 8.14 0.004*** 1044
Recently
pregnant
women
age 26.49 26.58 0.73 2829
Lowest wealth quintile 0.19 0.15 0.56 2829
Low wealth quintile 0.21 0.16 0.30 2829
Middle wealth quintile 0.23 0.18 0.05* 2829
High wealth quintile 0.19 0.22 0.45 2829
Highest wealth quintile 0.19 0.29 0.26 2829
At least secondary
education 0.60 0.60 0.99 2829
married 0.98 0.97 0.30 2829
Number of children 2.38 2.27 0.23 2733
Received any ANC 0.93 0.86 0.25 2829
Timely ANC 0.74 0.68 0.30 2509
At least 4 ANC visits 0.52 0.62 0.49 2826
Received PNC 0.57 0.67 0.14 2829
Adults 40
years and
above
Male 0.47 0.45 0.05* 5038
Age 54.60 54.91 0.39 5038
Lowest wealth quintile 0.22 0.14 0.28 5038
Low wealth quintile 0.22 0.17 0.28 5038
Middle wealth quintile 0.22 0.19 0.30 5038
High wealth quintile 0.19 0.23 0.42 5038
Highest wealth quintile 0.16 0.28 0.18 5038
Page 23
At least secondary
education 0.65 0.62 0.71 5038
Married 0.88 0.85 0.02** 5038
Blood pressure measured
in past year 0.50 0.45 0.50 5038
Data from Baseline survey. a The tests are based on ordinary least square regressions with standard errors clustered at the district level.
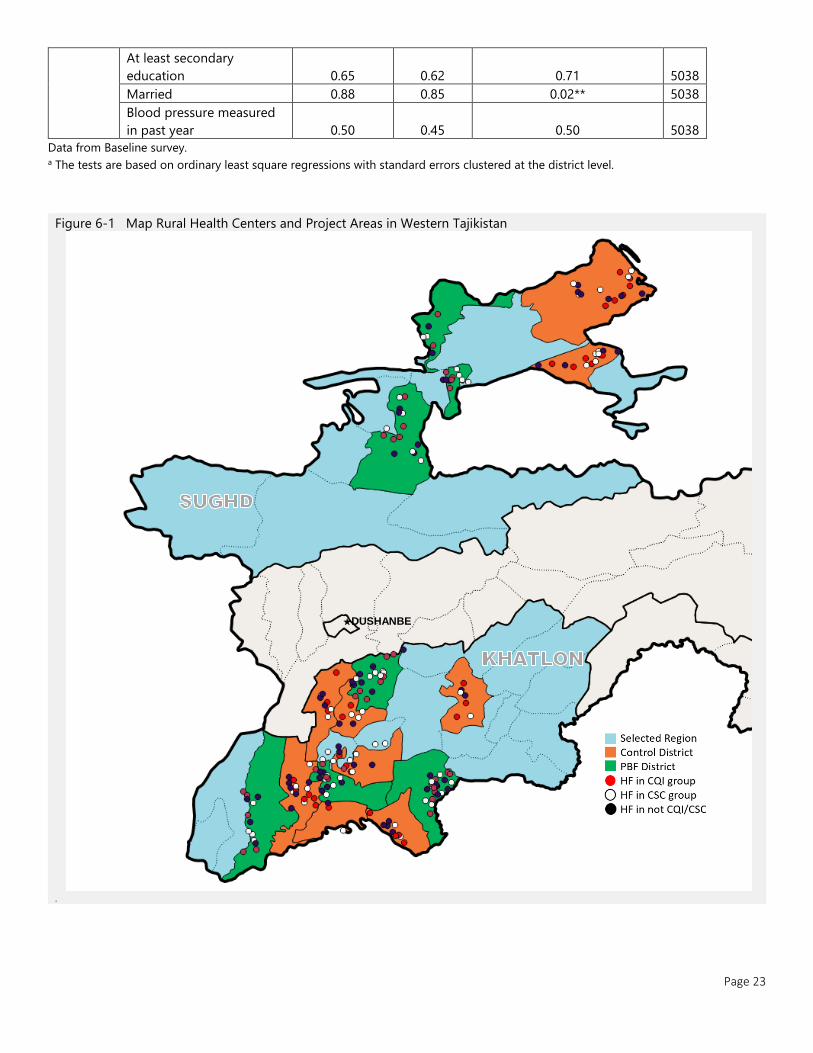
Figure 6-1 Map Rural Health Centers and Project Areas in Western Tajikistan
.
★DUSHANBE
Page 24
6.3 Data Sources and Tools
46. Outcomes in treatment and comparison groups were measured over time using a combination of health facility and
household survey data. The goal of the facility-based survey was to measure multiple dimensions of quality of care
and collect detailed information on key aspects of facility functioning. Household surveys were primarily used to
measure health service coverage at the population level as well as select health outcome indicators measured through
anthropometry or tests. The surveys also collected broader data on the health of the households, health-seeking
behaviors and barriers to the use of health services.
47. The HRITF survey instruments were adapted to the Tajik context. Additional modules were developed to correspond
to the project focus on NCD outcomes on top of the MCH outcomes. Representatives of the MoH, Zerkalo, and
members of the WB team conducted several field visits to health facilities to inform the adaptation of the survey
instruments. The instruments were pretested three times between August and October 2014, before the training of
the field team. A consultant with public health and medical expertise was hired to develop the clinical instruments.
Household questionnaires were translated into Tajik while health facility questionnaires were translated into Tajik and
Russian.
48. The baseline survey of households, Rural Health Centers, and Health Houses was conducted from November 2014 to
July 2015 to provide a baseline against which the impact of the project would be measured. A follow-up survey was
conducted from March to July 2018 to measure outcomes after three years of project implementation1. A local firm,
Zerkalo, was selected through an international competitive procurement process to manage all aspects of the data
collection. Figure 6.2. summarizes and illustrates how data collection was organized for the baseline and endline
surveys. Identical instruments were used with few adjustments.
Figure 6-2: Data sources
1 Both baseline and endline household surveys were conducted in the second quarter of the year. As for the facility survey,
the baseline survey was conducted in winter while the follow up was done in spring.
Page 25
6.3.1 Facility-Based Surveys
49. Health Facility Assessment: A complete health facility survey was conducted in RHCs, whereas for health houses a
shorter survey was implemented. The facility assessment module seeks to collect data on key aspects of facility
functioning and structural aspects of quality of care. The respondent for this module were the individuals in charge of
the health facility at the time when the survey team visits the health facility. The main themes to be covered by the
facility assessment include:
• Facility staffing, including the staffing complement of the facility, staff on duty at the time of the survey team’s visit
and staff present at the time of the survey team’s visit
• Facility infrastructure and equipment
• Availability of drugs, consumables, and supplies at the health facility
• Supervision
• Record keeping and reporting to the Health Management Information System
• Service volumes
50. Health Worker Questionnaire: A random sample of 4 health workers was to be taken at each of the RHCs and HHs
included in the sample. Eligible health workers include doctors, nurses, midwife/auxiliary midwife, and any other health
worker providing MCH or NCD care. In facilities with less than four health workers on their staff roster, all eligible
health workers were to be interviewed. The main themes to be covered by this module include roles, responsibilities,
and characteristics of the interviewed health worker; Staff satisfaction and motivation; technical knowledge on MCH
and NCDs. Knowledge was assessed by provider vignettes on MCH and NCD protocols and diagnosis.
51. Direct Observation of Patient-Provider Interactions: The goal of the direct observations is to assess adherence to
protocols regarding Integrated Management of Childhood Illness (IMCI) and hypertension management. At each Rural
Health Center, up to 15 children under-five and up to 15 adults over 40 years who are potential candidates for
hypertension identification/management services were to be selected. A member of the survey team observed
consultations using a structured format to note whether key desired actions were carried out. In the case of patients
under five, the instrument focuses on whether IMCI protocols are followed. For adults over 40 years, the instrument
focuses on whether MoH and international protocols are followed. The direct observations were implemented only in
RHCs.
52. Patient Exit Interviews: The same set of patients who were selected for the direct observations of patient-provider
interactions were also selected for exit interviews. If the patient is a child, the child’s caregiver was interviewed. The
exit interviews collected data on the patients’ perceived quality of care and satisfaction with the care given. Additional
information was collected on the socio-economic background and the general health of the patient. Like the direct
observations, the exit interviews were only administered in RHCs.
6.3.2 Household Survey
53. The household survey is composed of three questionnaires: the main household questionnaire, a female and child
questionnaire, and a questionnaire for adults over 40 years. The main household questionnaire was implemented in
all households. According to the sampling strategy, separate samples were to be selected for household with a
member recently pregnant and households with adults over 40.
54. Main household questionnaire: The main respondent for the household-level questionnaire is the head of household
and spouse, although a few modules were administered to each member of the household. The respondent could ask
for support from other household members on specific questions regarding the household. Both anthropometric and
blood pressure measurements were conducted three times with each respondent. The household questionnaire
focused on the following topics:
Page 26
• Socio-demographic characteristics: household composition and the age, marital status, employment, and education
level of all household members
• Income, transfers, assets, and housing
• Consumption of food and other items
• Migration of household members in and out of the country
• Mortality
• Utilization of health care
• Blood pressure measurements for all adults over 18 years
55. Women of Reproductive Age. The female questionnaire was administered to a female household member(s) 15-49
years old. The topics covered by the questionnaire were:
• General health status
• Pregnancy history, reproductive health, and utilization of family planning methods
• Antenatal, delivery and postnatal care received during recent pregnancies/births
• Vaccination of children under five years
• Anthropometric measures of the children under five years
56. Adult Over 40: The respondent(s) for this questionnaire are household members above the age of 40 years. The topics
of focus for the questionnaire were:
• General health status
• Health-related behaviors such as physical activity, smoking and alcohol consumption
• Health care seeking
• High cholesterol and other health conditions
6.4 Statistical Analysis and Sampling
57. A difference-in-differences approach is used to evaluate the impacts of the PBF intervention on outcomes of interest.
For the PBF-related outcomes, change over time in treatment groups 1-3 is compared to treatment groups 4,5 and
the comparison group. The validity of this approach relies on the assumption that changes over time are not related
to the PBF intervention, also known as parallel trends. We used the Tajikistan Demographic and Health Survey 2012
(TJDHS2012) data to assess the parallel trends assumption for the years 2008-2012. Using the data on pregnancies in
different years, we created annual indicators for behaviors related to ANC visits, breastfeeding, and vaccinations. We
tested whether we could reject parallel trends in the rates between project districts and the other districts within the
same regions shown in Table 6-2. We failed to reject the parallel trend for any indicator. While it is reassuring we could
not reject parallel trends in previous years, the identification of causal effects still relies on the assumption that trends,
absent of our interventions, would remain the same during the years of the project implementation.
Page 27
Table 6-2. Establishing Parallel Trends, Tajikistan, 2007-2012
Level of Significance: *p<0.10; **p<0.05; ***p<0.01
Regressions use a difference in difference specification. Standard errors are adjusted for 158 clusters.
Data are taken from 2012 Demographic and Health Survey in Tajikistan and ?. To preserve the anonymity of respondents, the location of DHS clusters is randomly
displaced up to 2 km in urban areas and 5 km in rural areas, with 1% of clusters displaces up to 10km. Some clusters may be misclassified between treatment and control if
the displacement changes the district of the cluster, substantively altering the results of the analysis.
6.4.1 Sampling Framework
58. Table 6-3 presents the number of RHCs selected for the sample for each district. Of the 216 RHC selected for the
sample (after randomly excluding some RHCs when the total was not divisible by three), 151 have subsidiary HHs.
Forty-three HHs were selected of the sample in Sughd and 107 in Khatlon.
59. While some Rural Health Centers have one or more subsidiary Health Houses in their catchment areas, others do not
have any. One Health House from each RHC with subsidiary HHs was to be included in the sample. The selection was
random with each health house within a cluster having an identical probability of being chosen. Non-selected health
houses were ranked to serve as replacements if the survey cannot be implemented in the selected HHs.
Selected Indicators #² β¹ t
ANC Visits within 12 weeks 1163 -0.05 -0.68
4 or more ANC visits 1463 -0.05 -1.17
BCG vaccination date 2532 0.02 0.35
DPT 1 vaccination 2532 -0.01 -0.18
Polio 1 vaccination 2532 0.01 0.13
DPT 2 vaccination 2532 -0.03 -0.40
Polio 2 vaccination 2532 -0.02 -0.35
DPT 3 vaccination 2532 -0.02 -0.37
Polio 3 vaccination 2532 -0.01 -0.20
Measles vaccination 2532 -0.03 -0.50
Polio 0 vaccination 2532 -0.04 -0.59
Months of breastfeeding 628 -0.23 -0.31
DD
Page 28
Table 6-3. Rural Health Center Selection by Region and District
.
Households
60. The evaluation relies on two samples of households. As the primary focus of the PBF intervention is on Maternal and
Child Health (MCH) services, the main household sample is of households with women who experienced a recent
pregnancy. This sample would not be appropriate to study the impact on the coverage of services related to Non-
Communicable Diseases (NCD). Therefore, a second sample consists of households with individuals over the age of
40. The household samples are clustered according to the catchment area of each Rural Health Center (and its affiliated
health houses).
61. To estimate the needed sample size of households per cluster for the households with recent pregnancies, the research
team used data from a household survey collected by the Swiss Tropical and Public Health Institute in the project
regions in 2012 for a study conducted to inform the design of the PBF project. The outcome chosen for this analysis
is the completion of at least four antenatal consultations during pregnancy, one of the PDO levels results in indicators
of the project. 65.5% of women reported at least four consultations during their last pregnancy. The intra-cluster
correlation is 0.052 after controlling for rayon of residence. Assuming a t-test significance level of 0.05 and a power
of 0.8, a sample of 20 households per cluster could detect an effect size of six percentage points in the diff-in-diff
analysis comparing the PBF and control districts. Under the same set assumptions, the cluster size of 20 households
per RHC would also allow detecting an effect of eight percentage points when employing the experimental design to
compare the outcomes with and without the CRC and CQI interventions.
62. The resulting targeted primary household sample size is of 4,320 households, with twenty in each of the 216 clusters
in the six study arms. To be eligible to be included in the household survey sample, households must have had at least
one woman aged 15-49 years who has had a child in the preceding three years. The same villages were covered for
both the baseline and followed up survey and eligibility was determined at each round by a listing exercise.
63. For budgetary reasons, the impact on NCD outcomes could only be measured in treatment group 1 (PBF only) and
the control group. To estimate the needed sample size of households per cluster for these outcomes, we use nationally
District
(Rayon)
PBF
Treatment
/ Control
# RHC# RHC
Included
Ganchi PBF 15 15
J. Rasulov PBF 14 12
Matcha PBF 7 6
Asht Control 18 18
Kanibadam Control 16 15
J. Rumi PBF 16 15
Kabadiyan PBF 16 15
Farkhor PBF 26 24
Yavan PBF 22 21
Kumsangir Control 9 9
A. Jomi Control 7 6
Vakhsh Control 14 12
Jilikul Control 15 15
SU
GH
DK
HA
TLO
N
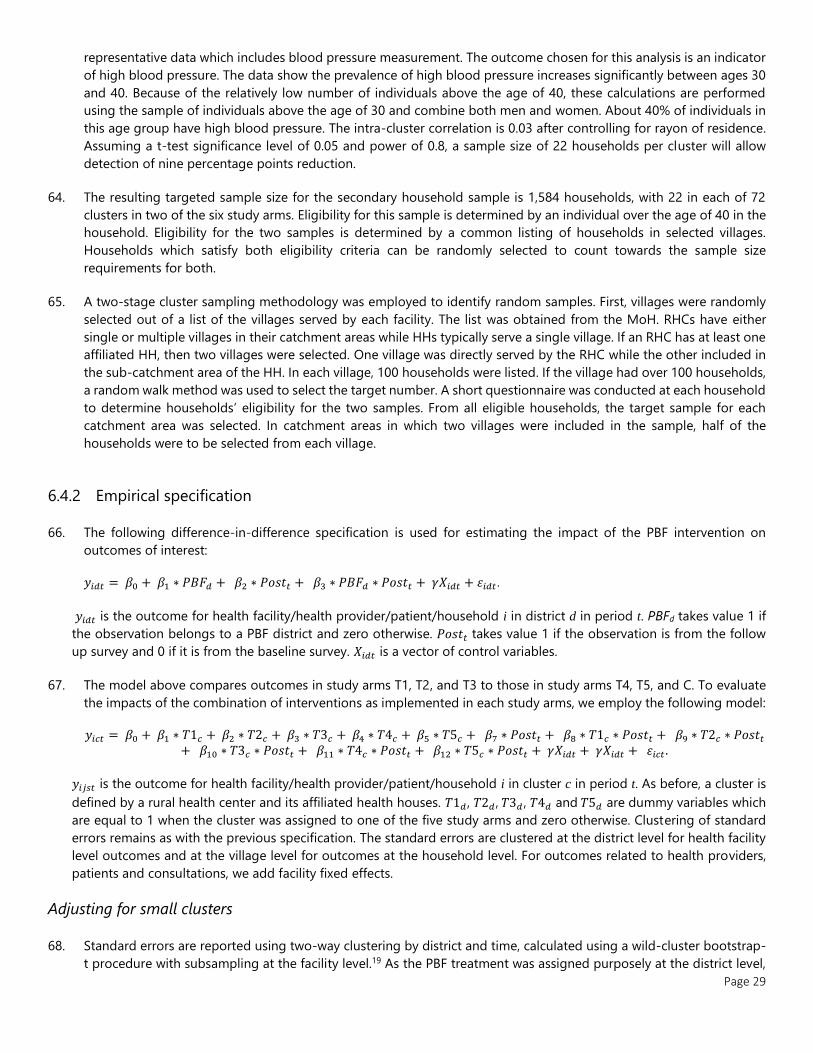
Page 29
representative data which includes blood pressure measurement. The outcome chosen for this analysis is an indicator
of high blood pressure. The data show the prevalence of high blood pressure increases significantly between ages 30
and 40. Because of the relatively low number of individuals above the age of 40, these calculations are performed
using the sample of individuals above the age of 30 and combine both men and women. About 40% of individuals in
this age group have high blood pressure. The intra-cluster correlation is 0.03 after controlling for rayon of residence.
Assuming a t-test significance level of 0.05 and power of 0.8, a sample size of 22 households per cluster will allow
detection of nine percentage points reduction.
64. The resulting targeted sample size for the secondary household sample is 1,584 households, with 22 in each of 72
clusters in two of the six study arms. Eligibility for this sample is determined by an individual over the age of 40 in the
household. Eligibility for the two samples is determined by a common listing of households in selected villages.
Households which satisfy both eligibility criteria can be randomly selected to count towards the sample size
requirements for both.
65. A two-stage cluster sampling methodology was employed to identify random samples. First, villages were randomly
selected out of a list of the villages served by each facility. The list was obtained from the MoH. RHCs have either
single or multiple villages in their catchment areas while HHs typically serve a single village. If an RHC has at least one
affiliated HH, then two villages were selected. One village was directly served by the RHC while the other included in
the sub-catchment area of the HH. In each village, 100 households were listed. If the village had over 100 households,
a random walk method was used to select the target number. A short questionnaire was conducted at each household
to determine households’ eligibility for the two samples. From all eligible households, the target sample for each
catchment area was selected. In catchment areas in which two villages were included in the sample, half of the
households were to be selected from each village.
6.4.2 Empirical specification
66. The following difference-in-difference specification is used for estimating the impact of the PBF intervention on
outcomes of interest:
𝑦𝑖𝑑𝑡 = 𝛽0 + 𝛽1 ∗ 𝑃𝐵𝐹𝑑 + 𝛽2 ∗ 𝑃𝑜𝑠𝑡𝑡 + 𝛽3 ∗ 𝑃𝐵𝐹𝑑 ∗ 𝑃𝑜𝑠𝑡𝑡 + 𝛾𝑋𝑖𝑑𝑡 + 𝜀𝑖𝑑𝑡.
𝑦𝑖𝑑𝑡 is the outcome for health facility/health provider/patient/household i in district d in period t. PBFd takes value 1 if
the observation belongs to a PBF district and zero otherwise. 𝑃𝑜𝑠𝑡𝑡 takes value 1 if the observation is from the follow
up survey and 0 if it is from the baseline survey. 𝑋𝑖𝑑𝑡 is a vector of control variables.
67. The model above compares outcomes in study arms T1, T2, and T3 to those in study arms T4, T5, and C. To evaluate
the impacts of the combination of interventions as implemented in each study arms, we employ the following model:
𝑦𝑖𝑐𝑡 = 𝛽0 + 𝛽1 ∗ 𝑇1𝑐 + 𝛽2 ∗ 𝑇2𝑐 + 𝛽3 ∗ 𝑇3𝑐 + 𝛽4 ∗ 𝑇4𝑐 + 𝛽5 ∗ 𝑇5𝑐 + 𝛽7 ∗ 𝑃𝑜𝑠𝑡𝑡 + 𝛽8 ∗ 𝑇1𝑐 ∗ 𝑃𝑜𝑠𝑡𝑡 + 𝛽9 ∗ 𝑇2𝑐 ∗ 𝑃𝑜𝑠𝑡𝑡
+ 𝛽10 ∗ 𝑇3𝑐 ∗ 𝑃𝑜𝑠𝑡𝑡 + 𝛽11 ∗ 𝑇4𝑐 ∗ 𝑃𝑜𝑠𝑡𝑡 + 𝛽12 ∗ 𝑇5𝑐 ∗ 𝑃𝑜𝑠𝑡𝑡 + 𝛾𝑋𝑖𝑑𝑡 + 𝛾𝑋𝑖𝑑𝑡 + 𝜀𝑖𝑐𝑡 .
𝑦𝑖𝑗𝑠𝑡 is the outcome for health facility/health provider/patient/household i in cluster c in period t. As before, a cluster is
defined by a rural health center and its affiliated health houses. 𝑇1𝑑 , 𝑇2𝑑 , 𝑇3𝑑 , 𝑇4𝑑 and 𝑇5𝑑 are dummy variables which
are equal to 1 when the cluster was assigned to one of the five study arms and zero otherwise. Clustering of standard
errors remains as with the previous specification. The standard errors are clustered at the district level for health facility
level outcomes and at the village level for outcomes at the household level. For outcomes related to health providers,
patients and consultations, we add facility fixed effects.
Adjusting for small clusters
68. Standard errors are reported using two-way clustering by district and time, calculated using a wild-cluster bootstrap-
t procedure with subsampling at the facility level.19 As the PBF treatment was assigned purposely at the district level,

Page 30
clustering accounts for correlated errors between and within clusters and avoid over-rejection. Customary cluster-
robust variance estimates using the T-distribution were not suitable, as the number of clusters is small (16) and cluster
size varies, violating the assumption of asymptotic consistency. Standard-errors are corrected for the small sample by
applying the wild cluster bootstrap in postestimation. Estimations of CQI/CRC impact are reported using standard
method regressions as they were randomized at the RHC level. The main model was calculated using the reghdfe
package, with bootstrap postestimation using boottest, both in STATA13/SE.
Covariates
69. Wealth indices were calculated separately for household and patient exit interviews. The wealth index estimates the
living standard of the household or patients, relative to the living standard of the other households in the sample. In
this study, the wealth index for households was calculated using self-reported data including consumer item
ownership, amount and value owned land, the value of rentals, number and types of animals owned, household
infrastructure, the source of water, heating, and electricity, and number household members per room. For patient
exit surveys, the wealth index was calculated from asset and animal ownership, materials used for dwelling
infrastructure, and a number of people living per room. The resulting index is calculated from the first component of
principal component analysis, apportioned into quintiles. This method is also used by the Demographic and Health
Survey; results will differ as the population in this survey is entirely rural.
6.5 Ethical clearance
70. The Committee on Ethics of the Ministry of Health and Social Protection reviewed the study design, fieldwork
protocols, and the instruments and granted ethical clearance for the study on October 24th, 2014.
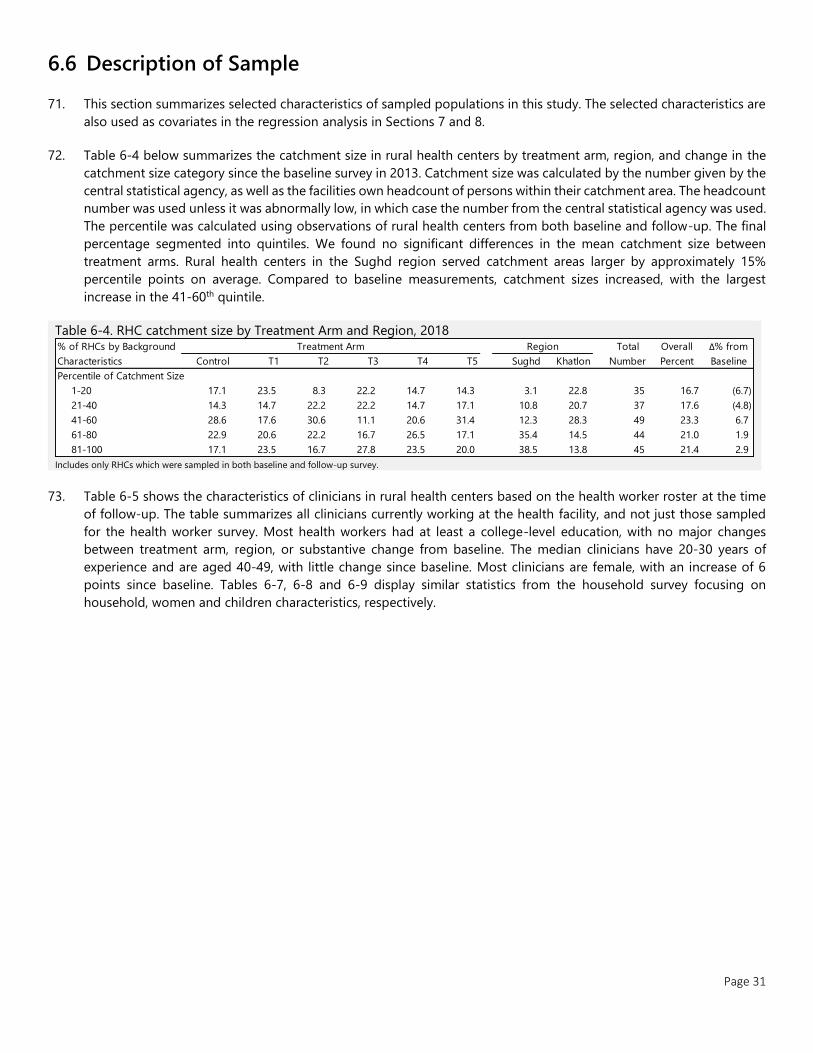
Page 31
6.6 Description of Sample
71. This section summarizes selected characteristics of sampled populations in this study. The selected characteristics are
also used as covariates in the regression analysis in Sections 7 and 8.
72. Table 6-4 below summarizes the catchment size in rural health centers by treatment arm, region, and change in the
catchment size category since the baseline survey in 2013. Catchment size was calculated by the number given by the
central statistical agency, as well as the facilities own headcount of persons within their catchment area. The headcount
number was used unless it was abnormally low, in which case the number from the central statistical agency was used.
The percentile was calculated using observations of rural health centers from both baseline and follow-up. The final
percentage segmented into quintiles. We found no significant differences in the mean catchment size between
treatment arms. Rural health centers in the Sughd region served catchment areas larger by approximately 15%
percentile points on average. Compared to baseline measurements, catchment sizes increased, with the largest
increase in the 41-60th quintile.
Table 6-4. RHC catchment size by Treatment Arm and Region, 2018
Includes only RHCs which were sampled in both baseline and follow-up survey.
73. Table 6-5 shows the characteristics of clinicians in rural health centers based on the health worker roster at the time
of follow-up. The table summarizes all clinicians currently working at the health facility, and not just those sampled
for the health worker survey. Most health workers had at least a college-level education, with no major changes
between treatment arm, region, or substantive change from baseline. The median clinicians have 20-30 years of
experience and are aged 40-49, with little change since baseline. Most clinicians are female, with an increase of 6
points since baseline. Tables 6-7, 6-8 and 6-9 display similar statistics from the household survey focusing on
household, women and children characteristics, respectively.
Control T1 T2 T3 T4 T5 Sughd Khatlon
Percentile of Catchment Size
1-20 17.1 23.5 8.3 22.2 14.7 14.3 3.1 22.8 35 16.7 (6.7)
21-40 14.3 14.7 22.2 22.2 14.7 17.1 10.8 20.7 37 17.6 (4.8)
41-60 28.6 17.6 30.6 11.1 20.6 31.4 12.3 28.3 49 23.3 6.7
61-80 22.9 20.6 22.2 16.7 26.5 17.1 35.4 14.5 44 21.0 1.9
81-100 17.1 23.5 16.7 27.8 23.5 20.0 38.5 13.8 45 21.4 2.9
Δ% from
Baseline
Overall
Percent
% of RHCs by Background
Characteristics
Treatment Arm Region Total
Number

Page 32
Table 6-5. RHC Health Worker characteristics by Treatment Arm and Region, 2018
Control T1 T2 T3 T4 T5 Sughd Khatlon
Level of Education
Secondary 0.8 0.3 0.6 5.3 0.3 - 0.6 1.6 23 1.1 0.8
College 73.4 78.5 72.6 73.4 74.6 76.6 74.0 75.6 1,523 74.8 4.6
PostGraduate 25.9 20.8 26.8 21.3 25.1 23.4 25.4 22.7 489 24.0 (5.4)
None - 0.3 - - - - - 0.1 1
Years of Experience
0-10 31.1 34.5 34.8 40.1 47.6 40.5 35.1 43.5 371 38.5 (12.6)
20-30 52.4 43.4 40.0 40.8 41.7 43.7 45.4 41.5 422 43.8 11.4
30+ 16.5 22.1 25.2 19.0 10.7 15.8 19.5 15.0 170 17.7 1.2
Health Worker Position
Doctor or medical officer 15.0 19.5 23.4 20.3 16.0 14.6 23.4 12.8 364 17.9 8.8
Clinical officer 3.4 0.7 0.9 0.3 2.4 0.8 1.1 1.9 31 1.5 (0.1)
Hospital administrator 5.5 5.7 6.2 6.3 6.0 6.8 2.6 9.4 124 6.1 (3.5)
Nurse 51.5 57.0 54.8 58.8 51.6 49.3 50.6 56.3 1,090 53.5 (11.7)
Midwife 6.9 7.4 4.4 4.7 6.8 6.8 5.1 7.2 126 6.2 3.8
OBGYN 1.8 0.7 0.3 - 1.6 2.0 1.7 0.6 23 1.1 1.1
Nursing assistant 1.6 - 2.5 2.7 3.4 2.8 0.9 3.4 45 2.2 1.5
Lab technologist 0.3 0.3 - 0.3 - - 0.3 - 3 0.1 (0.8)
Lab technician 2.6 1.7 1.9 1.3 1.6 2.5 3.3 0.8 40 2.0 0.3
Feldsher 5.0 3.7 1.2 1.0 3.4 3.7 3.4 2.8 63 3.1 3.1
Other clinical 6.3 3.4 4.4 4.3 7.3 10.7 7.7 4.9 127 6.2 (2.6)
Health Worker Gender
Female 72.3 69.8 67.0 70.4 79.1 78.0 80.7 66.0 1,488 73.1 6.0
Male 27.7 30.2 33.0 29.6 20.9 22.0 19.3 34.0 548 26.9 (6.0)
Health Worker Age
20-29 19.3 22.5 20.9 22.6 25.1 19.4 17.0 25.9 440 21.6 2.4
30-39 23.0 19.5 19.3 19.6 20.9 25.4 21.1 21.7 436 21.4 0.5
40-49 32.2 25.8 24.3 31.2 29.8 31.0 34.5 24.3 595 29.2 (1.1)
50-59 19.0 24.5 25.9 22.3 19.9 16.9 20.6 21.7 431 21.2 (0.8)
60-69 6.3 7.0 8.4 3.3 3.9 6.8 6.4 5.5 121 5.9 (1.1)
70+ 0.3 0.7 1.2 1.0 0.3 0.6 0.3 0.9 13 0.6 0.2
Overall
Percent
Δ% from
Baseline
End
line
% of RHCs Clinicians by
Background Characteristics
Treatment Arm Region Total
Number
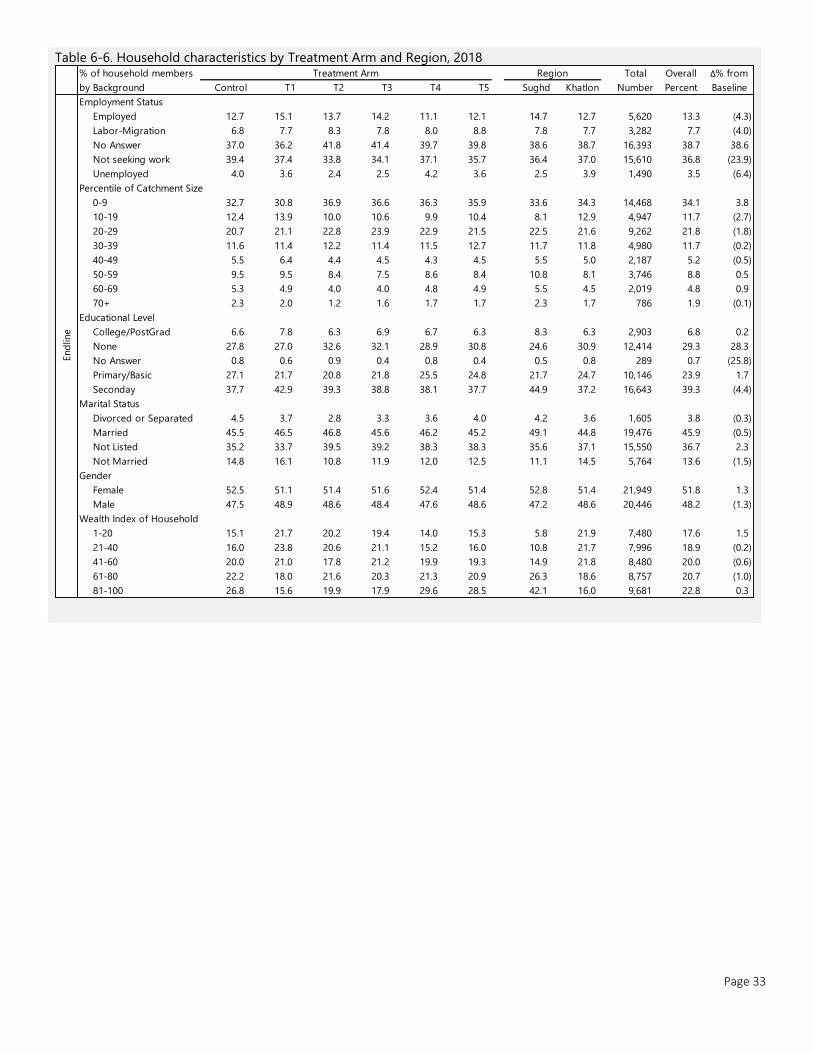
Page 33
Table 6-6. Household characteristics by Treatment Arm and Region, 2018
Control T1 T2 T3 T4 T5 Sughd Khatlon
Employment Status
Employed 12.7 15.1 13.7 14.2 11.1 12.1 14.7 12.7 5,620 13.3 (4.3)
Labor-Migration 6.8 7.7 8.3 7.8 8.0 8.8 7.8 7.7 3,282 7.7 (4.0)
No Answer 37.0 36.2 41.8 41.4 39.7 39.8 38.6 38.7 16,393 38.7 38.6
Not seeking work 39.4 37.4 33.8 34.1 37.1 35.7 36.4 37.0 15,610 36.8 (23.9)
Unemployed 4.0 3.6 2.4 2.5 4.2 3.6 2.5 3.9 1,490 3.5 (6.4)
Percentile of Catchment Size
0-9 32.7 30.8 36.9 36.6 36.3 35.9 33.6 34.3 14,468 34.1 3.8
10-19 12.4 13.9 10.0 10.6 9.9 10.4 8.1 12.9 4,947 11.7 (2.7)
20-29 20.7 21.1 22.8 23.9 22.9 21.5 22.5 21.6 9,262 21.8 (1.8)
30-39 11.6 11.4 12.2 11.4 11.5 12.7 11.7 11.8 4,980 11.7 (0.2)
40-49 5.5 6.4 4.4 4.5 4.3 4.5 5.5 5.0 2,187 5.2 (0.5)
50-59 9.5 9.5 8.4 7.5 8.6 8.4 10.8 8.1 3,746 8.8 0.5
60-69 5.3 4.9 4.0 4.0 4.8 4.9 5.5 4.5 2,019 4.8 0.9
70+ 2.3 2.0 1.2 1.6 1.7 1.7 2.3 1.7 786 1.9 (0.1)
Educational Level
College/PostGrad 6.6 7.8 6.3 6.9 6.7 6.3 8.3 6.3 2,903 6.8 0.2
None 27.8 27.0 32.6 32.1 28.9 30.8 24.6 30.9 12,414 29.3 28.3
No Answer 0.8 0.6 0.9 0.4 0.8 0.4 0.5 0.8 289 0.7 (25.8)
Primary/Basic 27.1 21.7 20.8 21.8 25.5 24.8 21.7 24.7 10,146 23.9 1.7
Seconday 37.7 42.9 39.3 38.8 38.1 37.7 44.9 37.2 16,643 39.3 (4.4)
Marital Status
Divorced or Separated 4.5 3.7 2.8 3.3 3.6 4.0 4.2 3.6 1,605 3.8 (0.3)
Married 45.5 46.5 46.8 45.6 46.2 45.2 49.1 44.8 19,476 45.9 (0.5)
Not Listed 35.2 33.7 39.5 39.2 38.3 38.3 35.6 37.1 15,550 36.7 2.3
Not Married 14.8 16.1 10.8 11.9 12.0 12.5 11.1 14.5 5,764 13.6 (1.5)
Gender
Female 52.5 51.1 51.4 51.6 52.4 51.4 52.8 51.4 21,949 51.8 1.3
Male 47.5 48.9 48.6 48.4 47.6 48.6 47.2 48.6 20,446 48.2 (1.3)
Wealth Index of Household
1-20 15.1 21.7 20.2 19.4 14.0 15.3 5.8 21.9 7,480 17.6 1.5
21-40 16.0 23.8 20.6 21.1 15.2 16.0 10.8 21.7 7,996 18.9 (0.2)
41-60 20.0 21.0 17.8 21.2 19.9 19.3 14.9 21.8 8,480 20.0 (0.6)
61-80 22.2 18.0 21.6 20.3 21.3 20.9 26.3 18.6 8,757 20.7 (1.0)
81-100 26.8 15.6 19.9 17.9 29.6 28.5 42.1 16.0 9,681 22.8 0.3
End
line
% of household members
by Background
Treatment Arm Region Total
Number
Overall
Percent
Δ% from
Baseline

Page 34
Table 6-7. Characteristics of recently pregnant women by Treatment Arm and Region, 2018
Control T1 T2 T3 T4 T5 Sughd Khatlon
Age of women
15-19 12.1 12.2 12.9 12.7 14.5 13.9 8.8 14.6 815 13.0 13.0
20-24 35.4 32.0 35.2 34.7 37.6 32.4 36.9 33.7 2,162 34.6 (1.2)
25-29 31.7 33.3 32.0 33.5 29.1 32.4 33.3 31.5 1,998 32.0 (2.6)
35+ 20.8 22.5 19.8 19.2 18.8 21.4 20.9 20.2 1,275 20.4 (9.2)
Parity
0 0.7 0.6 0.7 0.7 1.1 1.4 0.8 0.9 63 0.8 0.7
1 22.9 22.0 22.9 22.5 23.3 21.9 17.5 24.5 1,686 22.6 (29.8)
2 20.0 19.2 18.1 18.1 19.6 17.4 20.5 18.1 1,399 18.8 7.5
3 21.0 20.7 21.8 22.3 20.3 21.5 25.1 19.8 1,586 21.3 9.2
4 17.0 17.5 19.2 17.7 18.6 17.3 23.1 15.9 1,332 17.9 8.1
5+ 18.4 20.0 17.3 18.6 17.1 20.5 13.1 20.7 1,391 18.7 4.4
Gravidity
1 20.9 20.5 20.4 20.5 21.3 20.7 15.1 22.8 1,545 20.7 (30.0)
2 19.4 17.7 16.9 17.8 18.8 17.1 20.0 17.2 1,341 18.0 7.0
3 21.1 19.6 23.2 22.6 21.4 20.5 25.0 20.1 1,596 21.4 8.7
4 16.7 18.8 19.2 18.1 17.9 18.3 23.2 16.2 1,351 18.1 7.9
5 9.8 10.7 10.6 10.4 8.3 9.8 5.6 11.6 740 9.9 1.7
6+ 12.1 12.6 9.8 10.6 12.3 13.6 11.2 12.1 884 11.9 4.7
Employment Status
Employed 9.1 12.0 12.0 14.8 6.9 8.1 9.8 10.6 776 10.4 2.8
Labor-Migration 0.4 0.4 0.4 0.2 0.4 0.7 0.9 0.3 32 0.4 0.2
No Answer 1.8 1.3 1.6 1.9 1.5 1.2 2.5 1.2 116 1.6 1.4
Not seeking work 88.5 85.6 85.7 82.7 90.3 89.2 86.4 87.3 6,492 87.1 (4.0)
Unemployed 0.3 0.7 0.3 0.3 1.0 0.7 0.3 0.6 41 0.5 (0.4)
Educational Level
College/PostGrad 5.7 6.4 5.2 5.1 6.5 5.1 9.8 4.1 422 5.7 2.2
None 9.5 3.8 5.8 4.2 6.5 9.6 1.3 8.7 498 6.7 5.7
No Answer 0.4 0.9 0.7 0.2 0.6 0.3 0.1 0.6 37 0.5 (22.0)
Primary/Basic 25.0 22.8 21.2 23.8 22.2 22.3 14.4 26.1 1,710 22.9 2.5
Seconday 59.3 66.2 67.2 66.6 64.2 62.7 74.3 60.4 4,790 64.2 11.7
Marital Status
Divorced or Separated 5.8 4.2 3.7 4.8 4.4 4.6 3.9 4.9 345 4.6 (0.5)
Married 76.0 77.7 79.4 79.4 76.3 77.8 77.5 77.8 5,793 77.7 2.9
Not Married 18.2 18.1 16.9 15.8 19.3 17.6 18.6 17.4 1,319 17.7 (2.4)
Lives with In-laws
No 39.5 48.8 50.9 52.0 40.8 41.1 41.4 46.8 3,379 45.3 (1.3)
Yes 60.5 51.2 49.1 48.0 59.2 58.9 58.6 53.2 4,078 54.7 1.3
Wealth Index of Household
1-20 12.2 21.0 19.5 18.5 12.2 14.2 6.3 19.7 1,199 16.1 (1.8)
21-40 15.3 24.6 20.5 20.1 14.3 16.4 11.7 20.9 1,372 18.4 (1.5)
41-60 19.9 21.8 16.9 20.5 20.1 19.8 13.3 22.3 1,478 19.8 (0.7)
61-80 22.8 16.4 22.4 21.2 22.3 21.5 26.0 19.4 1,580 21.2 1.0
81-100 29.9 16.2 20.7 19.7 31.0 28.1 42.7 17.7 1,828 24.5 3.0
Overall
Percent
Δ% from
Baseline
% of pregnant women by
Background Characteristics
Treatment Arm Region Total
Number
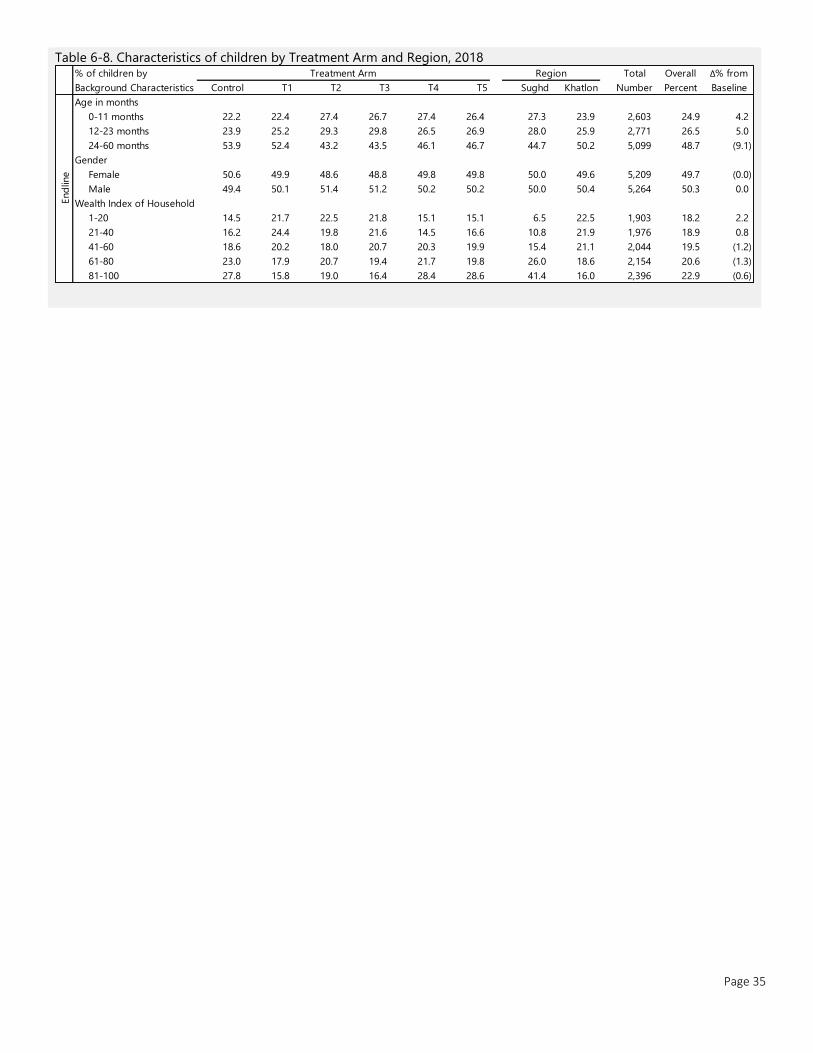
Page 35
Table 6-8. Characteristics of children by Treatment Arm and Region, 2018
Control T1 T2 T3 T4 T5 Sughd Khatlon
Age in months
0-11 months 22.2 22.4 27.4 26.7 27.4 26.4 27.3 23.9 2,603 24.9 4.2
12-23 months 23.9 25.2 29.3 29.8 26.5 26.9 28.0 25.9 2,771 26.5 5.0
24-60 months 53.9 52.4 43.2 43.5 46.1 46.7 44.7 50.2 5,099 48.7 (9.1)
Gender
Female 50.6 49.9 48.6 48.8 49.8 49.8 50.0 49.6 5,209 49.7 (0.0)
Male 49.4 50.1 51.4 51.2 50.2 50.2 50.0 50.4 5,264 50.3 0.0
Wealth Index of Household
1-20 14.5 21.7 22.5 21.8 15.1 15.1 6.5 22.5 1,903 18.2 2.2
21-40 16.2 24.4 19.8 21.6 14.5 16.6 10.8 21.9 1,976 18.9 0.8
41-60 18.6 20.2 18.0 20.7 20.3 19.9 15.4 21.1 2,044 19.5 (1.2)
61-80 23.0 17.9 20.7 19.4 21.7 19.8 26.0 18.6 2,154 20.6 (1.3)
81-100 27.8 15.8 19.0 16.4 28.4 28.6 41.4 16.0 2,396 22.9 (0.6)
End
line
Δ% from
Baseline
% of children by
Background Characteristics
Treatment Arm Region Total
Number
Overall
Percent
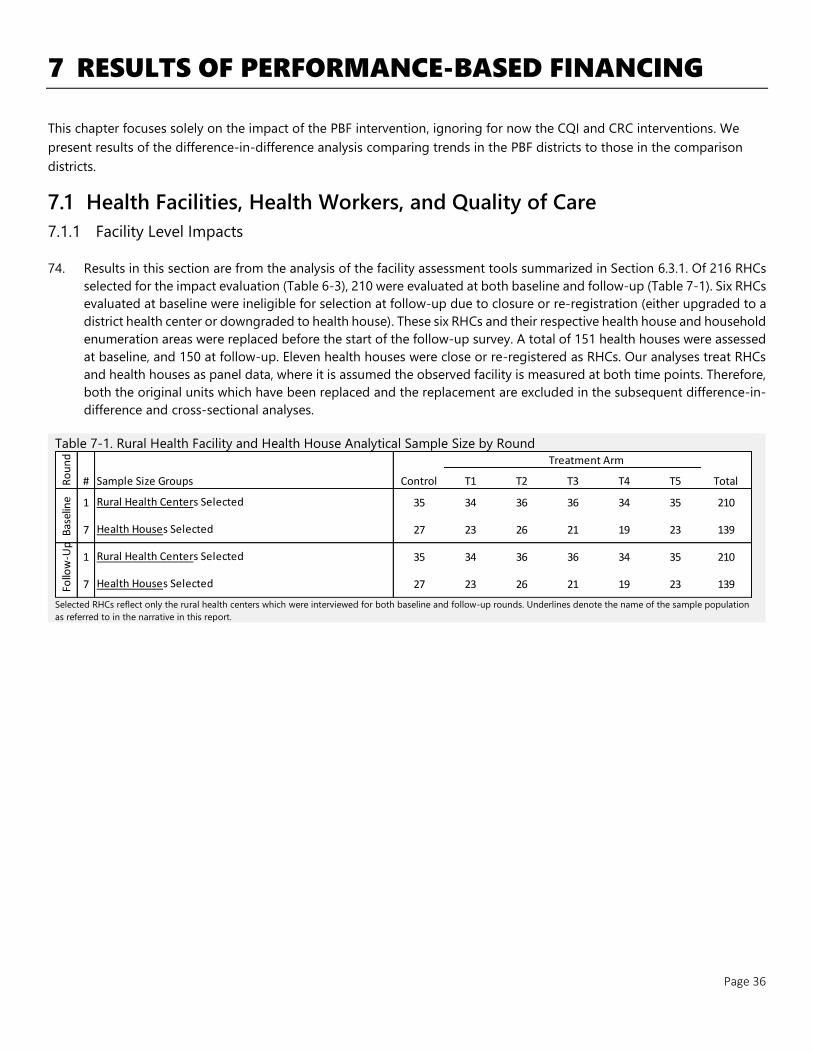
Page 36
7 RESULTS OF PERFORMANCE-BASED FINANCING
This chapter focuses solely on the impact of the PBF intervention, ignoring for now the CQI and CRC interventions. We
present results of the difference-in-difference analysis comparing trends in the PBF districts to those in the comparison
districts.
7.1 Health Facilities, Health Workers, and Quality of Care
7.1.1 Facility Level Impacts
74. Results in this section are from the analysis of the facility assessment tools summarized in Section 6.3.1. Of 216 RHCs
selected for the impact evaluation (Table 6-3), 210 were evaluated at both baseline and follow-up (Table 7-1). Six RHCs
evaluated at baseline were ineligible for selection at follow-up due to closure or re-registration (either upgraded to a
district health center or downgraded to health house). These six RHCs and their respective health house and household
enumeration areas were replaced before the start of the follow-up survey. A total of 151 health houses were assessed
at baseline, and 150 at follow-up. Eleven health houses were close or re-registered as RHCs. Our analyses treat RHCs
and health houses as panel data, where it is assumed the observed facility is measured at both time points. Therefore,
both the original units which have been replaced and the replacement are excluded in the subsequent difference-in-
difference and cross-sectional analyses.
Table 7-1. Rural Health Facility and Health House Analytical Sample Size by Round
Selected RHCs reflect only the rural health centers which were interviewed for both baseline and follow-up rounds. Underlines denote the name of the sample population
as referred to in the narrative in this report.
Treatment Arm
Sample Size Groups Control T1 T2 T3 T4 T5 Total
1 35 34 36 36 34 35 210
7 27 23 26 21 19 23 139
1 35 34 36 36 34 35 210
7 27 23 26 21 19 23 139Follo
w-U
p
Rural Health Centers Selected
Health Houses Selected
Ro
un
d
#
Bas
elin
e Rural Health Centers Selected
Health Houses Selected
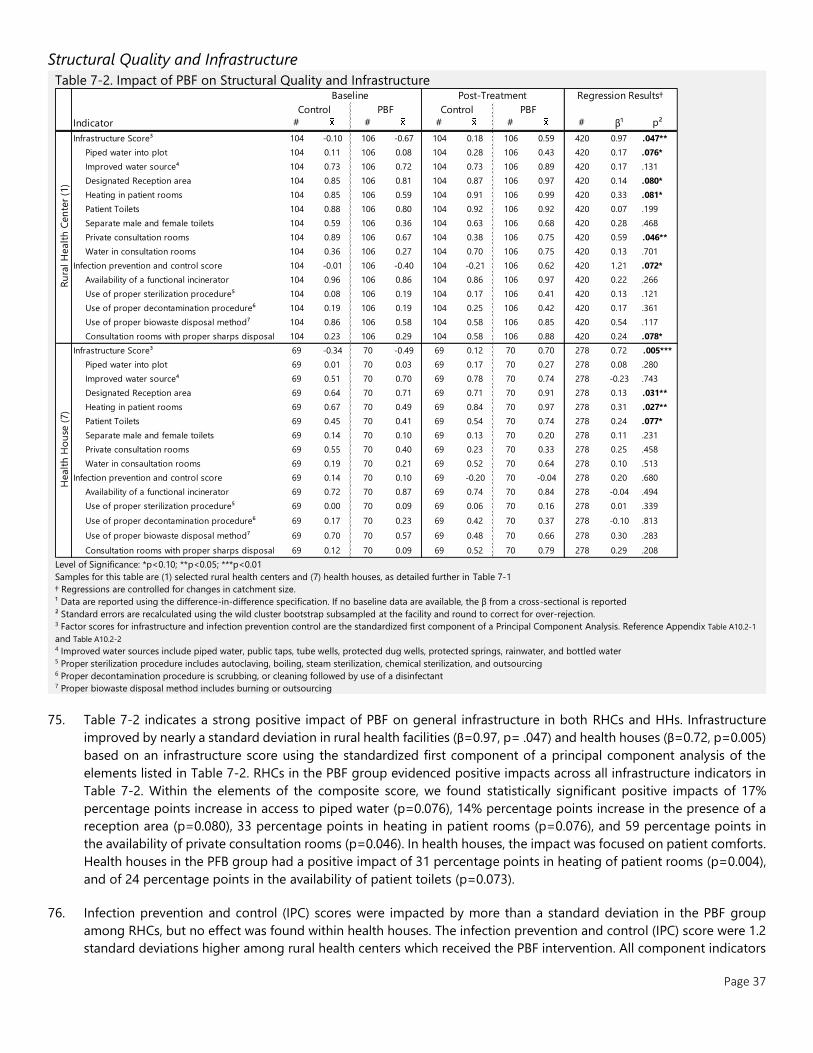
Page 37
Structural Quality and Infrastructure
Table 7-2. Impact of PBF on Structural Quality and Infrastructure
Level of Significance: *p<0.10; **p<0.05; ***p<0.01
Samples for this table are (1) selected rural health centers and (7) health houses, as detailed further in Table 7-1
† Regressions are controlled for changes in catchment size.
¹ Data are reported using the difference-in-difference specification. If no baseline data are available, the β from a cross-sectional is reported
² Standard errors are recalculated using the wild cluster bootstrap subsampled at the facility and round to correct for over-rejection. 3 Factor scores for infrastructure and infection prevention control are the standardized first component of a Principal Component Analysis. Reference Appendix Table A10.2-1
and Table A10.2-2 4 Improved water sources include piped water, public taps, tube wells, protected dug wells, protected springs, rainwater, and bottled water 5 Proper sterilization procedure includes autoclaving, boiling, steam sterilization, chemical sterilization, and outsourcing 6 Proper decontamination procedure is scrubbing, or cleaning followed by use of a disinfectant 7 Proper biowaste disposal method includes burning or outsourcing
75. Table 7-2 indicates a strong positive impact of PBF on general infrastructure in both RHCs and HHs. Infrastructure
improved by nearly a standard deviation in rural health facilities (β=0.97, p= .047) and health houses (β=0.72, p=0.005)
based on an infrastructure score using the standardized first component of a principal component analysis of the
elements listed in Table 7-2. RHCs in the PBF group evidenced positive impacts across all infrastructure indicators in
Table 7-2. Within the elements of the composite score, we found statistically significant positive impacts of 17%
percentage points increase in access to piped water (p=0.076), 14% percentage points increase in the presence of a
reception area (p=0.080), 33 percentage points in heating in patient rooms (p=0.076), and 59 percentage points in
the availability of private consultation rooms (p=0.046). In health houses, the impact was focused on patient comforts.
Health houses in the PFB group had a positive impact of 31 percentage points in heating of patient rooms (p=0.004),
and of 24 percentage points in the availability of patient toilets (p=0.073).
76. Infection prevention and control (IPC) scores were impacted by more than a standard deviation in the PBF group
among RHCs, but no effect was found within health houses. The infection prevention and control (IPC) score were 1.2
standard deviations higher among rural health centers which received the PBF intervention. All component indicators
Indicator # # # # # β¹ p²
Infrastructure Score³ 104 -0.10 106 -0.67 104 0.18 106 0.59 420 0.97 .047**
Piped water into plot 104 0.11 106 0.08 104 0.28 106 0.43 420 0.17 .076*
Improved water source⁴ 104 0.73 106 0.72 104 0.73 106 0.89 420 0.17 .131
Designated Reception area 104 0.85 106 0.81 104 0.87 106 0.97 420 0.14 .080*
Heating in patient rooms 104 0.85 106 0.59 104 0.91 106 0.99 420 0.33 .081*
Patient Toilets 104 0.88 106 0.80 104 0.92 106 0.92 420 0.07 .199
Separate male and female toilets 104 0.59 106 0.36 104 0.63 106 0.68 420 0.28 .468
Private consultation rooms 104 0.89 106 0.67 104 0.38 106 0.75 420 0.59 .046**
Water in consultation rooms 104 0.36 106 0.27 104 0.70 106 0.75 420 0.13 .701
Infection prevention and control score 104 -0.01 106 -0.40 104 -0.21 106 0.62 420 1.21 .072*
Availability of a functional incinerator 104 0.96 106 0.86 104 0.86 106 0.97 420 0.22 .266
Use of proper sterilization procedure⁵ 104 0.08 106 0.19 104 0.17 106 0.41 420 0.13 .121
Use of proper decontamination procedure⁶ 104 0.19 106 0.19 104 0.25 106 0.42 420 0.17 .361
Use of proper biowaste disposal method⁷ 104 0.86 106 0.58 104 0.58 106 0.85 420 0.54 .117
Consultation rooms with proper sharps disposal 104 0.23 106 0.29 104 0.58 106 0.88 420 0.24 .078*
Infrastructure Score³ 69 -0.34 70 -0.49 69 0.12 70 0.70 278 0.72 .005***
Piped water into plot 69 0.01 70 0.03 69 0.17 70 0.27 278 0.08 .280
Improved water source⁴ 69 0.51 70 0.70 69 0.78 70 0.74 278 -0.23 .743
Designated Reception area 69 0.64 70 0.71 69 0.71 70 0.91 278 0.13 .031**
Heating in patient rooms 69 0.67 70 0.49 69 0.84 70 0.97 278 0.31 .027**
Patient Toilets 69 0.45 70 0.41 69 0.54 70 0.74 278 0.24 .077*
Separate male and female toilets 69 0.14 70 0.10 69 0.13 70 0.20 278 0.11 .231
Private consultation rooms 69 0.55 70 0.40 69 0.23 70 0.33 278 0.25 .458
Water in consaultation rooms 69 0.19 70 0.21 69 0.52 70 0.64 278 0.10 .513
Infection prevention and control score 69 0.14 70 0.10 69 -0.20 70 -0.04 278 0.20 .680
Availability of a functional incinerator 69 0.72 70 0.87 69 0.74 70 0.84 278 -0.04 .494
Use of proper sterilization procedure⁵ 69 0.00 70 0.09 69 0.06 70 0.16 278 0.01 .339
Use of proper decontamination procedure⁶ 69 0.17 70 0.23 69 0.42 70 0.37 278 -0.10 .813
Use of proper biowaste disposal method⁷ 69 0.70 70 0.57 69 0.48 70 0.66 278 0.30 .283
Consultation rooms with proper sharps disposal 69 0.12 70 0.09 69 0.52 70 0.79 278 0.29 .208
Ru
ral H
ealt
h C
en
ter
(1)
Control PBF Control
Healt
h H
ou
se (
7)
PBF
Baseline Post-Treatment Regression Results†
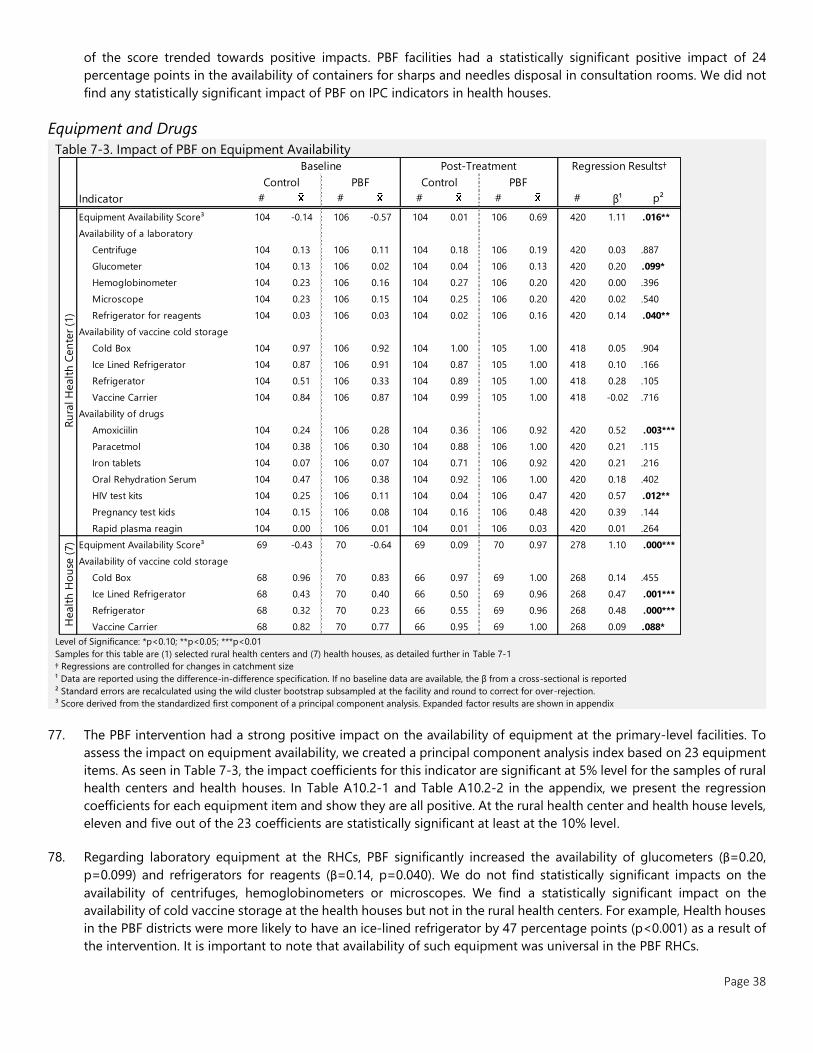
Page 38
of the score trended towards positive impacts. PBF facilities had a statistically significant positive impact of 24
percentage points in the availability of containers for sharps and needles disposal in consultation rooms. We did not
find any statistically significant impact of PBF on IPC indicators in health houses.
Equipment and Drugs
Table 7-3. Impact of PBF on Equipment Availability
Level of Significance: *p<0.10; **p<0.05; ***p<0.01
Samples for this table are (1) selected rural health centers and (7) health houses, as detailed further in Table 7-1
† Regressions are controlled for changes in catchment size
¹ Data are reported using the difference-in-difference specification. If no baseline data are available, the β from a cross-sectional is reported
² Standard errors are recalculated using the wild cluster bootstrap subsampled at the facility and round to correct for over-rejection.
³ Score derived from the standardized first component of a principal component analysis. Expanded factor results are shown in appendix
77. The PBF intervention had a strong positive impact on the availability of equipment at the primary-level facilities. To
assess the impact on equipment availability, we created a principal component analysis index based on 23 equipment
items. As seen in Table 7-3, the impact coefficients for this indicator are significant at 5% level for the samples of rural
health centers and health houses. In Table A10.2-1 and Table A10.2-2 in the appendix, we present the regression
coefficients for each equipment item and show they are all positive. At the rural health center and health house levels,
eleven and five out of the 23 coefficients are statistically significant at least at the 10% level.
78. Regarding laboratory equipment at the RHCs, PBF significantly increased the availability of glucometers (β=0.20,
p=0.099) and refrigerators for reagents (β=0.14, p=0.040). We do not find statistically significant impacts on the
availability of centrifuges, hemoglobinometers or microscopes. We find a statistically significant impact on the
availability of cold vaccine storage at the health houses but not in the rural health centers. For example, Health houses
in the PBF districts were more likely to have an ice-lined refrigerator by 47 percentage points (p<0.001) as a result of
the intervention. It is important to note that availability of such equipment was universal in the PBF RHCs.
Indicator # # # # # β¹ p²
Equipment Availability Score³ 104 -0.14 106 -0.57 104 0.01 106 0.69 420 1.11 .016**
Availability of a laboratory
Centrifuge 104 0.13 106 0.11 104 0.18 106 0.19 420 0.03 .887
Glucometer 104 0.13 106 0.02 104 0.04 106 0.13 420 0.20 .099*
Hemoglobinometer 104 0.23 106 0.16 104 0.27 106 0.20 420 0.00 .396
Microscope 104 0.23 106 0.15 104 0.25 106 0.20 420 0.02 .540
Refrigerator for reagents 104 0.03 106 0.03 104 0.02 106 0.16 420 0.14 .040**
Availability of vaccine cold storage
Cold Box 104 0.97 106 0.92 104 1.00 105 1.00 418 0.05 .904
Ice Lined Refrigerator 104 0.87 106 0.91 104 0.87 105 1.00 418 0.10 .166
Refrigerator 104 0.51 106 0.33 104 0.89 105 1.00 418 0.28 .105
Vaccine Carrier 104 0.84 106 0.87 104 0.99 105 1.00 418 -0.02 .716
Availability of drugs
Amoxiciilin 104 0.24 106 0.28 104 0.36 106 0.92 420 0.52 .003***
Paracetmol 104 0.38 106 0.30 104 0.88 106 1.00 420 0.21 .115
Iron tablets 104 0.07 106 0.07 104 0.71 106 0.92 420 0.21 .216
Oral Rehydration Serum 104 0.47 106 0.38 104 0.92 106 1.00 420 0.18 .402
HIV test kits 104 0.25 106 0.11 104 0.04 106 0.47 420 0.57 .012**
Pregnancy test kids 104 0.15 106 0.08 104 0.16 106 0.48 420 0.39 .144
Rapid plasma reagin 104 0.00 106 0.01 104 0.01 106 0.03 420 0.01 .264
Equipment Availability Score³ 69 -0.43 70 -0.64 69 0.09 70 0.97 278 1.10 .000***
Availability of vaccine cold storage
Cold Box 68 0.96 70 0.83 66 0.97 69 1.00 268 0.14 .455
Ice Lined Refrigerator 68 0.43 70 0.40 66 0.50 69 0.96 268 0.47 .001***
Refrigerator 68 0.32 70 0.23 66 0.55 69 0.96 268 0.48 .000***
Vaccine Carrier 68 0.82 70 0.77 66 0.95 69 1.00 268 0.09 .088*
Ru
ral H
ealt
h C
en
ter
(1)
Healt
h H
ou
se (
7)
Control PBF Control
Baseline Post-Treatment Regression Results†
PBF
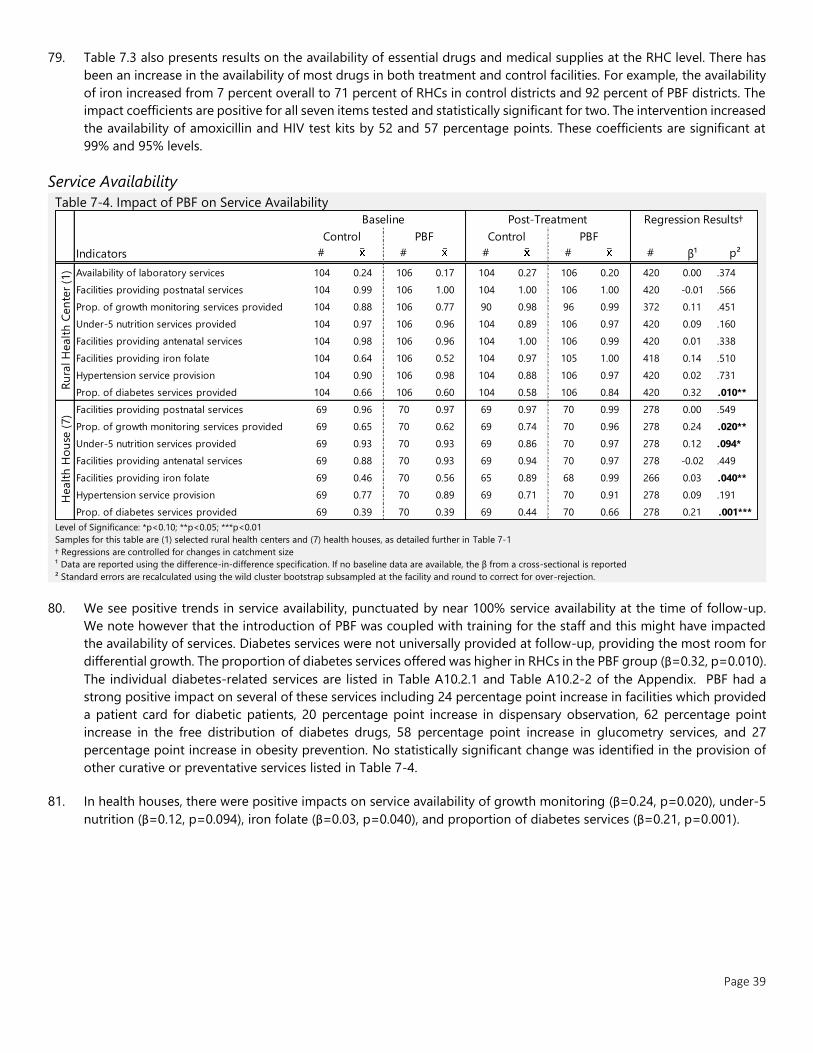
Page 39
79. Table 7.3 also presents results on the availability of essential drugs and medical supplies at the RHC level. There has
been an increase in the availability of most drugs in both treatment and control facilities. For example, the availability
of iron increased from 7 percent overall to 71 percent of RHCs in control districts and 92 percent of PBF districts. The
impact coefficients are positive for all seven items tested and statistically significant for two. The intervention increased
the availability of amoxicillin and HIV test kits by 52 and 57 percentage points. These coefficients are significant at
99% and 95% levels.
Service Availability
Table 7-4. Impact of PBF on Service Availability
Level of Significance: *p<0.10; **p<0.05; ***p<0.01
Samples for this table are (1) selected rural health centers and (7) health houses, as detailed further in Table 7-1
† Regressions are controlled for changes in catchment size
¹ Data are reported using the difference-in-difference specification. If no baseline data are available, the β from a cross-sectional is reported
² Standard errors are recalculated using the wild cluster bootstrap subsampled at the facility and round to correct for over-rejection.
80. We see positive trends in service availability, punctuated by near 100% service availability at the time of follow-up.
We note however that the introduction of PBF was coupled with training for the staff and this might have impacted
the availability of services. Diabetes services were not universally provided at follow-up, providing the most room for
differential growth. The proportion of diabetes services offered was higher in RHCs in the PBF group (β=0.32, p=0.010).
The individual diabetes-related services are listed in Table A10.2.1 and Table A10.2-2 of the Appendix. PBF had a
strong positive impact on several of these services including 24 percentage point increase in facilities which provided
a patient card for diabetic patients, 20 percentage point increase in dispensary observation, 62 percentage point
increase in the free distribution of diabetes drugs, 58 percentage point increase in glucometry services, and 27
percentage point increase in obesity prevention. No statistically significant change was identified in the provision of
other curative or preventative services listed in Table 7-4.
81. In health houses, there were positive impacts on service availability of growth monitoring (β=0.24, p=0.020), under-5
nutrition (β=0.12, p=0.094), iron folate (β=0.03, p=0.040), and proportion of diabetes services (β=0.21, p=0.001).
Indicators # # # # # β¹ p²
Availability of laboratory services 104 0.24 106 0.17 104 0.27 106 0.20 420 0.00 .374
Facilities providing postnatal services 104 0.99 106 1.00 104 1.00 106 1.00 420 -0.01 .566
Prop. of growth monitoring services provided 104 0.88 106 0.77 90 0.98 96 0.99 372 0.11 .451
Under-5 nutrition services provided 104 0.97 106 0.96 104 0.89 106 0.97 420 0.09 .160
Facilities providing antenatal services 104 0.98 106 0.96 104 1.00 106 0.99 420 0.01 .338
Facilities providing iron folate 104 0.64 106 0.52 104 0.97 105 1.00 418 0.14 .510
Hypertension service provision 104 0.90 106 0.98 104 0.88 106 0.97 420 0.02 .731
Prop. of diabetes services provided 104 0.66 106 0.60 104 0.58 106 0.84 420 0.32 .010**
Facilities providing postnatal services 69 0.96 70 0.97 69 0.97 70 0.99 278 0.00 .549
Prop. of growth monitoring services provided 69 0.65 70 0.62 69 0.74 70 0.96 278 0.24 .020**
Under-5 nutrition services provided 69 0.93 70 0.93 69 0.86 70 0.97 278 0.12 .094*
Facilities providing antenatal services 69 0.88 70 0.93 69 0.94 70 0.97 278 -0.02 .449
Facilities providing iron folate 69 0.46 70 0.56 65 0.89 68 0.99 266 0.03 .040**
Hypertension service provision 69 0.77 70 0.89 69 0.71 70 0.91 278 0.09 .191
Prop. of diabetes services provided 69 0.39 70 0.39 69 0.44 70 0.66 278 0.21 .001***
Regression Results†
Healt
h H
ou
se (
7)
Ru
ral H
ealt
h C
en
ter
(1)
Baseline Post-Treatment
Control PBF Control PBF
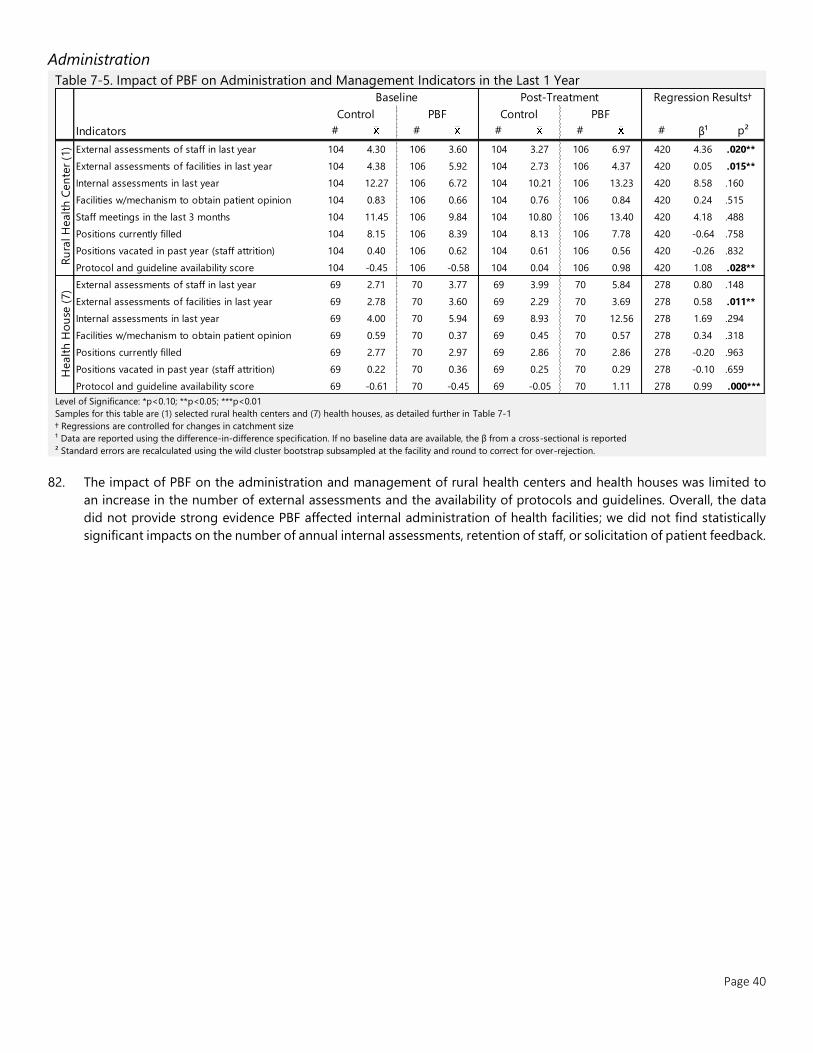
Page 40
Administration
Table 7-5. Impact of PBF on Administration and Management Indicators in the Last 1 Year
Level of Significance: *p<0.10; **p<0.05; ***p<0.01
Samples for this table are (1) selected rural health centers and (7) health houses, as detailed further in Table 7-1
† Regressions are controlled for changes in catchment size
¹ Data are reported using the difference-in-difference specification. If no baseline data are available, the β from a cross-sectional is reported
² Standard errors are recalculated using the wild cluster bootstrap subsampled at the facility and round to correct for over-rejection.
82. The impact of PBF on the administration and management of rural health centers and health houses was limited to
an increase in the number of external assessments and the availability of protocols and guidelines. Overall, the data
did not provide strong evidence PBF affected internal administration of health facilities; we did not find statistically
significant impacts on the number of annual internal assessments, retention of staff, or solicitation of patient feedback.
Indicators # # # # # β¹ p²
External assessments of staff in last year 104 4.30 106 3.60 104 3.27 106 6.97 420 4.36 .020**
External assessments of facilities in last year 104 4.38 106 5.92 104 2.73 106 4.37 420 0.05 .015**
Internal assessments in last year 104 12.27 106 6.72 104 10.21 106 13.23 420 8.58 .160
Facilities w/mechanism to obtain patient opinion 104 0.83 106 0.66 104 0.76 106 0.84 420 0.24 .515
Staff meetings in the last 3 months 104 11.45 106 9.84 104 10.80 106 13.40 420 4.18 .488
Positions currently filled 104 8.15 106 8.39 104 8.13 106 7.78 420 -0.64 .758
Positions vacated in past year (staff attrition) 104 0.40 106 0.62 104 0.61 106 0.56 420 -0.26 .832
Protocol and guideline availability score 104 -0.45 106 -0.58 104 0.04 106 0.98 420 1.08 .028**
External assessments of staff in last year 69 2.71 70 3.77 69 3.99 70 5.84 278 0.80 .148
External assessments of facilities in last year 69 2.78 70 3.60 69 2.29 70 3.69 278 0.58 .011**
Internal assessments in last year 69 4.00 70 5.94 69 8.93 70 12.56 278 1.69 .294
Facilities w/mechanism to obtain patient opinion 69 0.59 70 0.37 69 0.45 70 0.57 278 0.34 .318
Positions currently filled 69 2.77 70 2.97 69 2.86 70 2.86 278 -0.20 .963
Positions vacated in past year (staff attrition) 69 0.22 70 0.36 69 0.25 70 0.29 278 -0.10 .659
Protocol and guideline availability score 69 -0.61 70 -0.45 69 -0.05 70 1.11 278 0.99 .000***
Regression Results†
Ru
ral H
ealt
h C
en
ter
(1)
Healt
h H
ou
se (
7)
Baseline Post-Treatment
Control PBF Control PBF
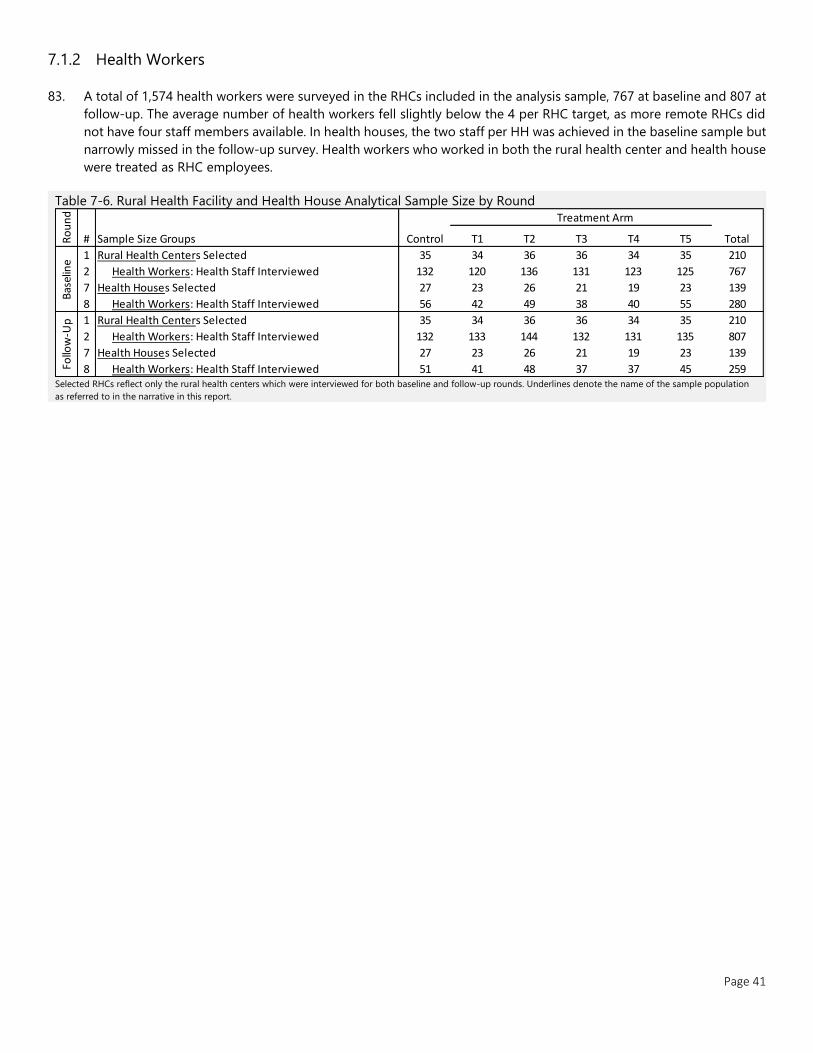
Page 41
7.1.2 Health Workers
83. A total of 1,574 health workers were surveyed in the RHCs included in the analysis sample, 767 at baseline and 807 at
follow-up. The average number of health workers fell slightly below the 4 per RHC target, as more remote RHCs did
not have four staff members available. In health houses, the two staff per HH was achieved in the baseline sample but
narrowly missed in the follow-up survey. Health workers who worked in both the rural health center and health house
were treated as RHC employees.
Table 7-6. Rural Health Facility and Health House Analytical Sample Size by Round
Selected RHCs reflect only the rural health centers which were interviewed for both baseline and follow-up rounds. Underlines denote the name of the sample population
as referred to in the narrative in this report.
Treatment Arm
Sample Size Groups Control T1 T2 T3 T4 T5 Total
1 35 34 36 36 34 35 210
2 132 120 136 131 123 125 767
7 27 23 26 21 19 23 139
8 56 42 49 38 40 55 280
1 35 34 36 36 34 35 210
2 132 133 144 132 131 135 807
7 27 23 26 21 19 23 139
8 51 41 48 37 37 45 259Follo
w-U
p Rural Health Centers Selected
Health Workers: Health Staff Interviewed
Health Houses Selected
Health Workers: Health Staff Interviewed
Ro
un
d
#
Bas
elin
e
Rural Health Centers Selected
Health Workers: Health Staff Interviewed
Health Houses Selected
Health Workers: Health Staff Interviewed
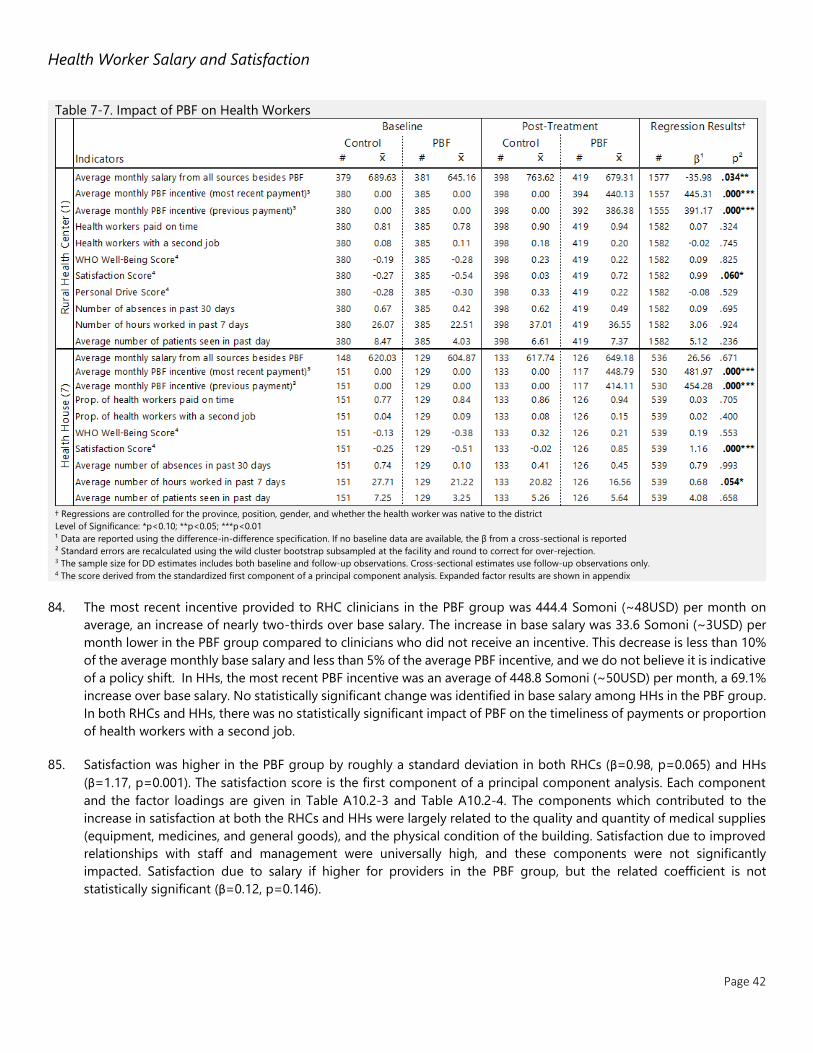
Page 42
Health Worker Salary and Satisfaction
Table 7-7. Impact of PBF on Health Workers
† Regressions are controlled for the province, position, gender, and whether the health worker was native to the district
Level of Significance: *p<0.10; **p<0.05; ***p<0.01
¹ Data are reported using the difference-in-difference specification. If no baseline data are available, the β from a cross-sectional is reported
² Standard errors are recalculated using the wild cluster bootstrap subsampled at the facility and round to correct for over-rejection. 3 The sample size for DD estimates includes both baseline and follow-up observations. Cross-sectional estimates use follow-up observations only. 4 The score derived from the standardized first component of a principal component analysis. Expanded factor results are shown in appendix
84. The most recent incentive provided to RHC clinicians in the PBF group was 444.4 Somoni (~48USD) per month on
average, an increase of nearly two-thirds over base salary. The increase in base salary was 33.6 Somoni (~3USD) per
month lower in the PBF group compared to clinicians who did not receive an incentive. This decrease is less than 10%
of the average monthly base salary and less than 5% of the average PBF incentive, and we do not believe it is indicative
of a policy shift. In HHs, the most recent PBF incentive was an average of 448.8 Somoni (~50USD) per month, a 69.1%
increase over base salary. No statistically significant change was identified in base salary among HHs in the PBF group.
In both RHCs and HHs, there was no statistically significant impact of PBF on the timeliness of payments or proportion
of health workers with a second job.
85. Satisfaction was higher in the PBF group by roughly a standard deviation in both RHCs (β=0.98, p=0.065) and HHs
(β=1.17, p=0.001). The satisfaction score is the first component of a principal component analysis. Each component
and the factor loadings are given in Table A10.2-3 and Table A10.2-4. The components which contributed to the
increase in satisfaction at both the RHCs and HHs were largely related to the quality and quantity of medical supplies
(equipment, medicines, and general goods), and the physical condition of the building. Satisfaction due to improved
relationships with staff and management were universally high, and these components were not significantly
impacted. Satisfaction due to salary if higher for providers in the PBF group, but the related coefficient is not
statistically significant (β=0.12, p=0.146).
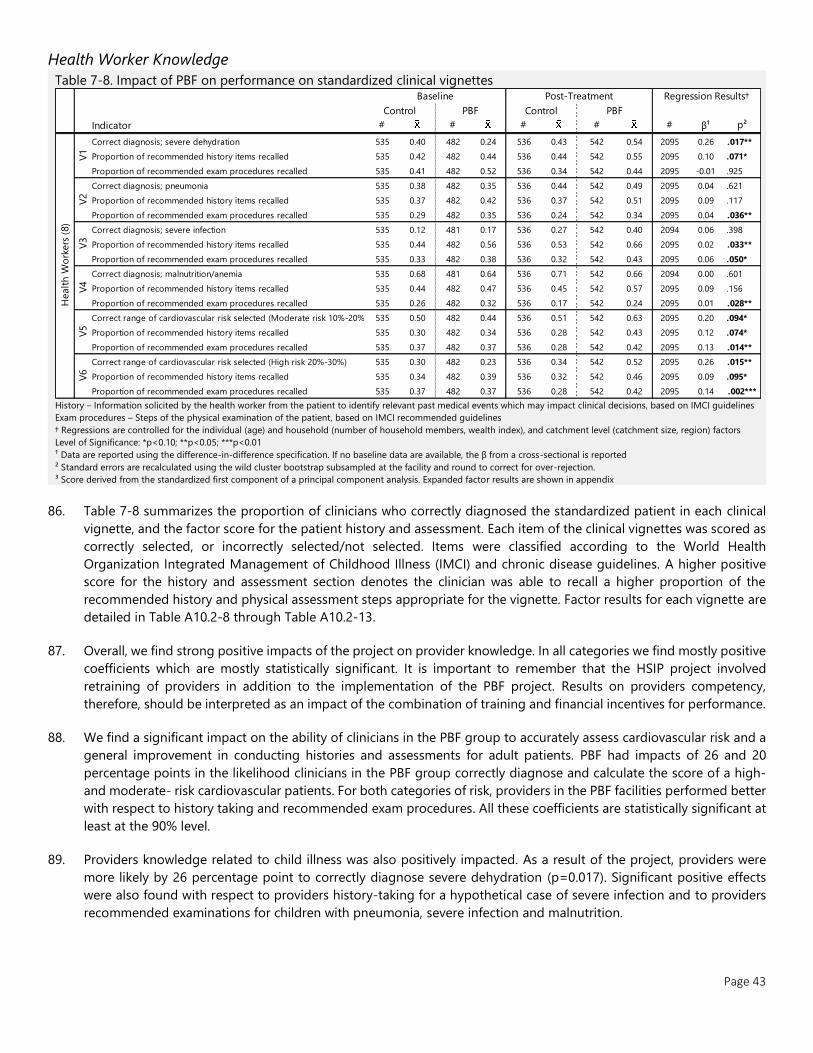
Page 43
Health Worker Knowledge
Table 7-8. Impact of PBF on performance on standardized clinical vignettes
History – Information solicited by the health worker from the patient to identify relevant past medical events which may impact clinical decisions, based on IMCI guidelines
Exam procedures – Steps of the physical examination of the patient, based on IMCI recommended guidelines
† Regressions are controlled for the individual (age) and household (number of household members, wealth index), and catchment level (catchment size, region) factors
Level of Significance: *p<0.10; **p<0.05; ***p<0.01
¹ Data are reported using the difference-in-difference specification. If no baseline data are available, the β from a cross-sectional is reported
² Standard errors are recalculated using the wild cluster bootstrap subsampled at the facility and round to correct for over-rejection.
³ Score derived from the standardized first component of a principal component analysis. Expanded factor results are shown in appendix
86. Table 7-8 summarizes the proportion of clinicians who correctly diagnosed the standardized patient in each clinical
vignette, and the factor score for the patient history and assessment. Each item of the clinical vignettes was scored as
correctly selected, or incorrectly selected/not selected. Items were classified according to the World Health
Organization Integrated Management of Childhood Illness (IMCI) and chronic disease guidelines. A higher positive
score for the history and assessment section denotes the clinician was able to recall a higher proportion of the
recommended history and physical assessment steps appropriate for the vignette. Factor results for each vignette are
detailed in Table A10.2-8 through Table A10.2-13.
87. Overall, we find strong positive impacts of the project on provider knowledge. In all categories we find mostly positive
coefficients which are mostly statistically significant. It is important to remember that the HSIP project involved
retraining of providers in addition to the implementation of the PBF project. Results on providers competency,
therefore, should be interpreted as an impact of the combination of training and financial incentives for performance.
88. We find a significant impact on the ability of clinicians in the PBF group to accurately assess cardiovascular risk and a
general improvement in conducting histories and assessments for adult patients. PBF had impacts of 26 and 20
percentage points in the likelihood clinicians in the PBF group correctly diagnose and calculate the score of a high-
and moderate- risk cardiovascular patients. For both categories of risk, providers in the PBF facilities performed better
with respect to history taking and recommended exam procedures. All these coefficients are statistically significant at
least at the 90% level.
89. Providers knowledge related to child illness was also positively impacted. As a result of the project, providers were
more likely by 26 percentage point to correctly diagnose severe dehydration (p=0.017). Significant positive effects
were also found with respect to providers history-taking for a hypothetical case of severe infection and to providers
recommended examinations for children with pneumonia, severe infection and malnutrition.
Indicator # # # # # β¹ p²
Correct diagnosis; severe dehydration 535 0.40 482 0.24 536 0.43 542 0.54 2095 0.26 .017**
Proportion of recommended history items recalled 535 0.42 482 0.44 536 0.44 542 0.55 2095 0.10 .071*
Proportion of recommended exam procedures recalled 535 0.41 482 0.52 536 0.34 542 0.44 2095 -0.01 .925
Correct diagnosis; pneumonia 535 0.38 482 0.35 536 0.44 542 0.49 2095 0.04 .621
Proportion of recommended history items recalled 535 0.37 482 0.42 536 0.37 542 0.51 2095 0.09 .117
Proportion of recommended exam procedures recalled 535 0.29 482 0.35 536 0.24 542 0.34 2095 0.04 .036**
Correct diagnosis; severe infection 535 0.12 481 0.17 536 0.27 542 0.40 2094 0.06 .398
Proportion of recommended history items recalled 535 0.44 482 0.56 536 0.53 542 0.66 2095 0.02 .033**
Proportion of recommended exam procedures recalled 535 0.33 482 0.38 536 0.32 542 0.43 2095 0.06 .050*
Correct diagnosis; malnutrition/anemia 535 0.68 481 0.64 536 0.71 542 0.66 2094 0.00 .601
Proportion of recommended history items recalled 535 0.44 482 0.47 536 0.45 542 0.57 2095 0.09 .156
Proportion of recommended exam procedures recalled 535 0.26 482 0.32 536 0.17 542 0.24 2095 0.01 .028**
Correct range of cardiovascular risk selected (Moderate risk 10%-20%) 535 0.50 482 0.44 536 0.51 542 0.63 2095 0.20 .094*
Proportion of recommended history items recalled 535 0.30 482 0.34 536 0.28 542 0.43 2095 0.12 .074*
Proportion of recommended exam procedures recalled 535 0.37 482 0.37 536 0.28 542 0.42 2095 0.13 .014**
Correct range of cardiovascular risk selected (High risk 20%-30%) 535 0.30 482 0.23 536 0.34 542 0.52 2095 0.26 .015**
Proportion of recommended history items recalled 535 0.34 482 0.39 536 0.32 542 0.46 2095 0.09 .095*
Proportion of recommended exam procedures recalled 535 0.37 482 0.37 536 0.28 542 0.42 2095 0.14 .002***
Healt
h W
ork
ers
(8)
V1
V2
V3
V4
V5
V6
Baseline Post-Treatment Regression Results†
Control PBF Control PBF

Page 44
7.1.3 Consultations
Table 7-9. Exit Interviews and Direct Observations Analytical Sample Size by Round
Selected RHCs reflect only the rural health centers which were interviewed for both baseline and follow-up rounds. Underlines denote the name of the sample population
as referred to in the narrative in this report.
90. Baseline samples for exit interviews of adult and child consultations and direct observations of adult and child
consultations fell below the targeted size. Taking clinical observations as an example, data were available for a total
of 260 observations in 103 facilities. We presume the limited window for interviewer teams to capture eligible exit
interviews was compounded by a high prevalence of home visits due to the winter weather and contributed to the
small sample size. These issues were addressed in the follow-up survey, both by increasing the window from one to
three days and including home visits if the intended sample size is not projected to be reached based on the first day
of evaluation. The following analysis uses follow-up data in a cross-sectional analysis for indicators in these sections.
Patient Experience
Table 7-10. Association between PBF and Patient Exit Interview Indicators
† Regressions are controlled for patient wealth, patient gender, and patient age, and attending health worker position, age, and gender
Level of Significance: *p<0.10; **p<0.05; ***p<0.01
¹ Data are reported using the difference-in-difference specification. If no baseline data are available, the β from a cross-sectional is reported
² Standard errors are recalculated using the wild cluster bootstrap subsampled at the facility and round to correct for over-rejection.
³ Score derived from the standardized first component of a principal component analysis. Expanded factor results are shown in appendix
91. We found no significant association between PBF and overall patient satisfaction, cost, or travel time. Patient
satisfaction was calculated as an index from a 9 point agree/disagree questionnaire. None of the individual indicators
resulted in a statistically significant difference on rural health centers. The proportion of respondents satisfied was
88% or higher for all items. Conducting the exit interviews on the ground of the facilities might have impacted reported
satisfaction. Detailed results on the satisfaction of exit interview respondents can be found in Table 10.2.5.
Treatment Arm
Sample Size Groups Control T1 T2 T3 T4 T5 Total
1 35 34 36 36 34 35 210
3 36 60 73 72 31 22 294
4 39 64 76 71 41 25 316
5 37 64 71 76 38 27 313
6 51 70 75 71 54 32 353
1 35 34 36 36 34 35 210
3 255 300 360 345 180 180 1620
4 255 375 375 315 285 210 1815
5 540 540 540 540 525 540 3225
6 315 375 390 315 302 255 1952
Ro
un
d
#
Bas
elin
e
Rural Health Centers Selected
Adult DO: Direct clinical observations of adults > 40
Child DO: Direct clinical observation of children < 5
Adult Exit: Exit Interviews for consultation of adults > 40
Child Exit: Exit Interviews for consultation of children < 5
Follo
w-U
p
Rural Health Centers Selected
Adult DO: Direct clinical observations of adults > 40
Child DO: Direct clinical observation of children < 5
Adult Exit: Exit Interviews for consultation of adults > 40
Child Exit: Exit Interviews for consultation of children < 5
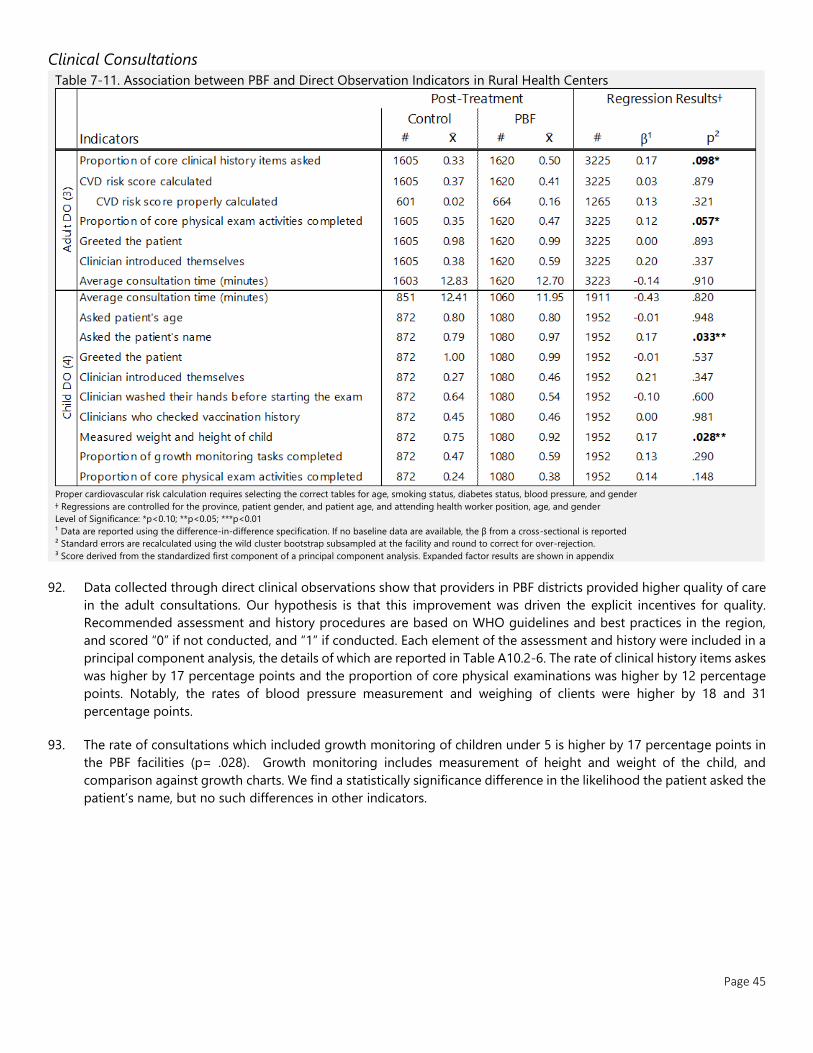
Page 45
Clinical Consultations
Table 7-11. Association between PBF and Direct Observation Indicators in Rural Health Centers
Proper cardiovascular risk calculation requires selecting the correct tables for age, smoking status, diabetes status, blood pressure, and gender
† Regressions are controlled for the province, patient gender, and patient age, and attending health worker position, age, and gender
Level of Significance: *p<0.10; **p<0.05; ***p<0.01
¹ Data are reported using the difference-in-difference specification. If no baseline data are available, the β from a cross-sectional is reported
² Standard errors are recalculated using the wild cluster bootstrap subsampled at the facility and round to correct for over-rejection.
³ Score derived from the standardized first component of a principal component analysis. Expanded factor results are shown in appendix
92. Data collected through direct clinical observations show that providers in PBF districts provided higher quality of care
in the adult consultations. Our hypothesis is that this improvement was driven the explicit incentives for quality.
Recommended assessment and history procedures are based on WHO guidelines and best practices in the region,
and scored “0” if not conducted, and “1” if conducted. Each element of the assessment and history were included in a
principal component analysis, the details of which are reported in Table A10.2-6. The rate of clinical history items askes
was higher by 17 percentage points and the proportion of core physical examinations was higher by 12 percentage
points. Notably, the rates of blood pressure measurement and weighing of clients were higher by 18 and 31
percentage points.
93. The rate of consultations which included growth monitoring of children under 5 is higher by 17 percentage points in
the PBF facilities (p= .028). Growth monitoring includes measurement of height and weight of the child, and
comparison against growth charts. We find a statistically significance difference in the likelihood the patient asked the
patient’s name, but no such differences in other indicators.
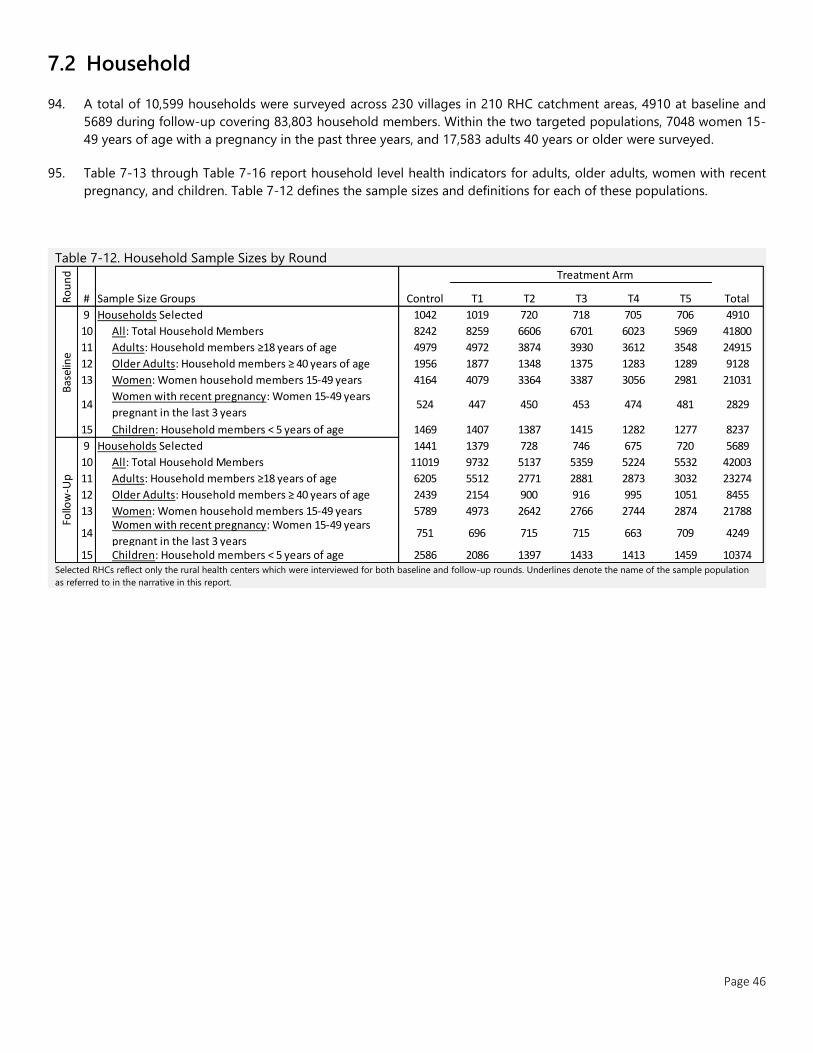
Page 46
7.2 Household
94. A total of 10,599 households were surveyed across 230 villages in 210 RHC catchment areas, 4910 at baseline and
5689 during follow-up covering 83,803 household members. Within the two targeted populations, 7048 women 15-
49 years of age with a pregnancy in the past three years, and 17,583 adults 40 years or older were surveyed.
95. Table 7-13 through Table 7-16 report household level health indicators for adults, older adults, women with recent
pregnancy, and children. Table 7-12 defines the sample sizes and definitions for each of these populations.
Table 7-12. Household Sample Sizes by Round
Selected RHCs reflect only the rural health centers which were interviewed for both baseline and follow-up rounds. Underlines denote the name of the sample population
as referred to in the narrative in this report.
Treatment Arm
Sample Size Groups Control T1 T2 T3 T4 T5 Total
9 1042 1019 720 718 705 706 4910
10 8242 8259 6606 6701 6023 5969 41800
11 4979 4972 3874 3930 3612 3548 24915
12 1956 1877 1348 1375 1283 1289 9128
13 4164 4079 3364 3387 3056 2981 21031
14 524 447 450 453 474 481 2829
15 1469 1407 1387 1415 1282 1277 8237
9 1441 1379 728 746 675 720 5689
10 11019 9732 5137 5359 5224 5532 42003
11 6205 5512 2771 2881 2873 3032 23274
12 2439 2154 900 916 995 1051 8455
13 5789 4973 2642 2766 2744 2874 21788
14 751 696 715 715 663 709 4249
15 2586 2086 1397 1433 1413 1459 10374
Ro
un
d
#
Children: Household members < 5 years of age
Bas
elin
eFo
llow
-Up
All: Total Household Members
Adults: Household members ≥18 years of age
Older Adults: Household members ≥ 40 years of age
Women: Women household members 15-49 yearsWomen with recent pregnancy: Women 15-49 years
pregnant in the last 3 years
Older Adults: Household members ≥ 40 years of age
Women: Women household members 15-49 years
Women with recent pregnancy: Women 15-49 years
pregnant in the last 3 years
Children: Household members < 5 years of age
Households Selected
Households Selected
All: Total Household Members
Adults: Household members ≥18 years of age
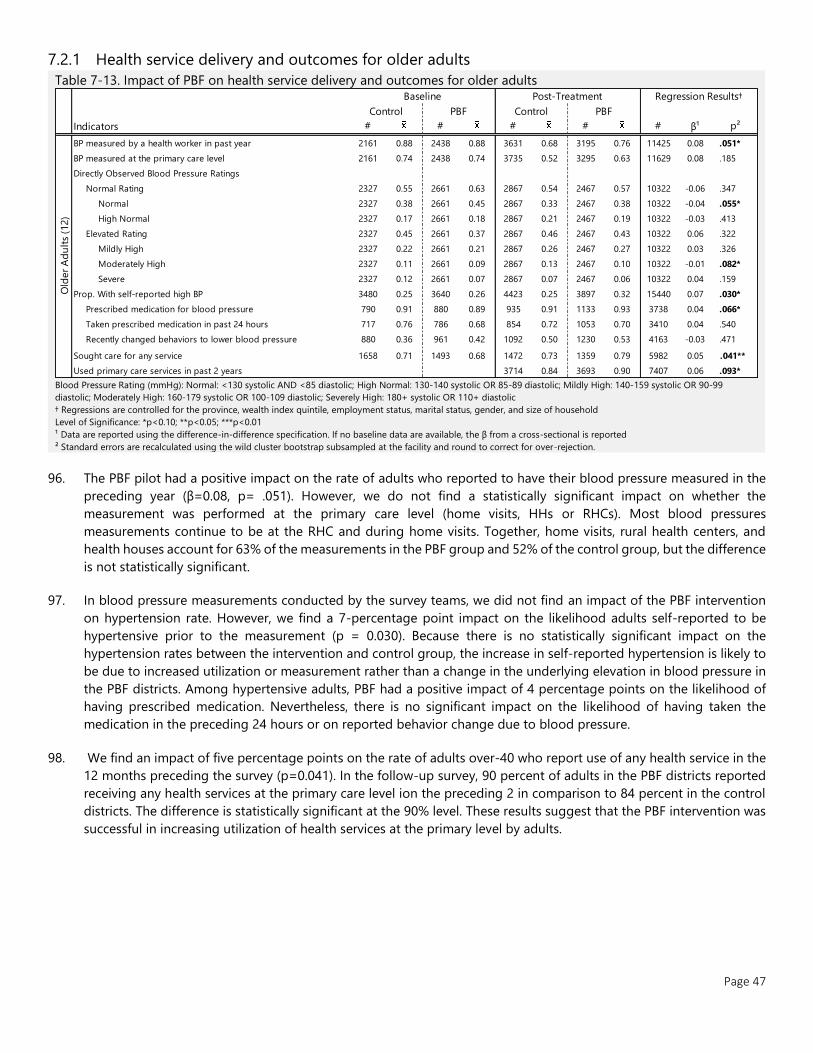
Page 47
7.2.1 Health service delivery and outcomes for older adults
Table 7-13. Impact of PBF on health service delivery and outcomes for older adults
Blood Pressure Rating (mmHg): Normal: <130 systolic AND <85 diastolic; High Normal: 130-140 systolic OR 85-89 diastolic; Mildly High: 140-159 systolic OR 90-99
diastolic; Moderately High: 160-179 systolic OR 100-109 diastolic; Severely High: 180+ systolic OR 110+ diastolic
† Regressions are controlled for the province, wealth index quintile, employment status, marital status, gender, and size of household
Level of Significance: *p<0.10; **p<0.05; ***p<0.01
¹ Data are reported using the difference-in-difference specification. If no baseline data are available, the β from a cross-sectional is reported
² Standard errors are recalculated using the wild cluster bootstrap subsampled at the facility and round to correct for over-rejection.
96. The PBF pilot had a positive impact on the rate of adults who reported to have their blood pressure measured in the
preceding year (β=0.08, p= .051). However, we do not find a statistically significant impact on whether the
measurement was performed at the primary care level (home visits, HHs or RHCs). Most blood pressures
measurements continue to be at the RHC and during home visits. Together, home visits, rural health centers, and
health houses account for 63% of the measurements in the PBF group and 52% of the control group, but the difference
is not statistically significant.
97. In blood pressure measurements conducted by the survey teams, we did not find an impact of the PBF intervention
on hypertension rate. However, we find a 7-percentage point impact on the likelihood adults self-reported to be
hypertensive prior to the measurement (p = 0.030). Because there is no statistically significant impact on the
hypertension rates between the intervention and control group, the increase in self-reported hypertension is likely to
be due to increased utilization or measurement rather than a change in the underlying elevation in blood pressure in
the PBF districts. Among hypertensive adults, PBF had a positive impact of 4 percentage points on the likelihood of
having prescribed medication. Nevertheless, there is no significant impact on the likelihood of having taken the
medication in the preceding 24 hours or on reported behavior change due to blood pressure.
98. We find an impact of five percentage points on the rate of adults over-40 who report use of any health service in the
12 months preceding the survey (p=0.041). In the follow-up survey, 90 percent of adults in the PBF districts reported
receiving any health services at the primary care level ion the preceding 2 in comparison to 84 percent in the control
districts. The difference is statistically significant at the 90% level. These results suggest that the PBF intervention was
successful in increasing utilization of health services at the primary level by adults.
Indicators # # # # # β¹ p²
BP measured by a health worker in past year 2161 0.88 2438 0.88 3631 0.68 3195 0.76 11425 0.08 .051*
BP measured at the primary care level 2161 0.74 2438 0.74 3735 0.52 3295 0.63 11629 0.08 .185
Directly Observed Blood Pressure Ratings
Normal Rating 2327 0.55 2661 0.63 2867 0.54 2467 0.57 10322 -0.06 .347
Normal 2327 0.38 2661 0.45 2867 0.33 2467 0.38 10322 -0.04 .055*
High Normal 2327 0.17 2661 0.18 2867 0.21 2467 0.19 10322 -0.03 .413
Elevated Rating 2327 0.45 2661 0.37 2867 0.46 2467 0.43 10322 0.06 .322
Mildly High 2327 0.22 2661 0.21 2867 0.26 2467 0.27 10322 0.03 .326
Moderately High 2327 0.11 2661 0.09 2867 0.13 2467 0.10 10322 -0.01 .082*
Severe 2327 0.12 2661 0.07 2867 0.07 2467 0.06 10322 0.04 .159
Prop. With self-reported high BP 3480 0.25 3640 0.26 4423 0.25 3897 0.32 15440 0.07 .030*
Prescribed medication for blood pressure 790 0.91 880 0.89 935 0.91 1133 0.93 3738 0.04 .066*
Taken prescribed medication in past 24 hours 717 0.76 786 0.68 854 0.72 1053 0.70 3410 0.04 .540
Recently changed behaviors to lower blood pressure 880 0.36 961 0.42 1092 0.50 1230 0.53 4163 -0.03 .471
Sought care for any service 1658 0.71 1493 0.68 1472 0.73 1359 0.79 5982 0.05 .041**
Used primary care services in past 2 years 3714 0.84 3693 0.90 7407 0.06 .093*
Old
er
Ad
ult
s (1
2)
Baseline Post-Treatment Regression Results†
Control PBF Control PBF
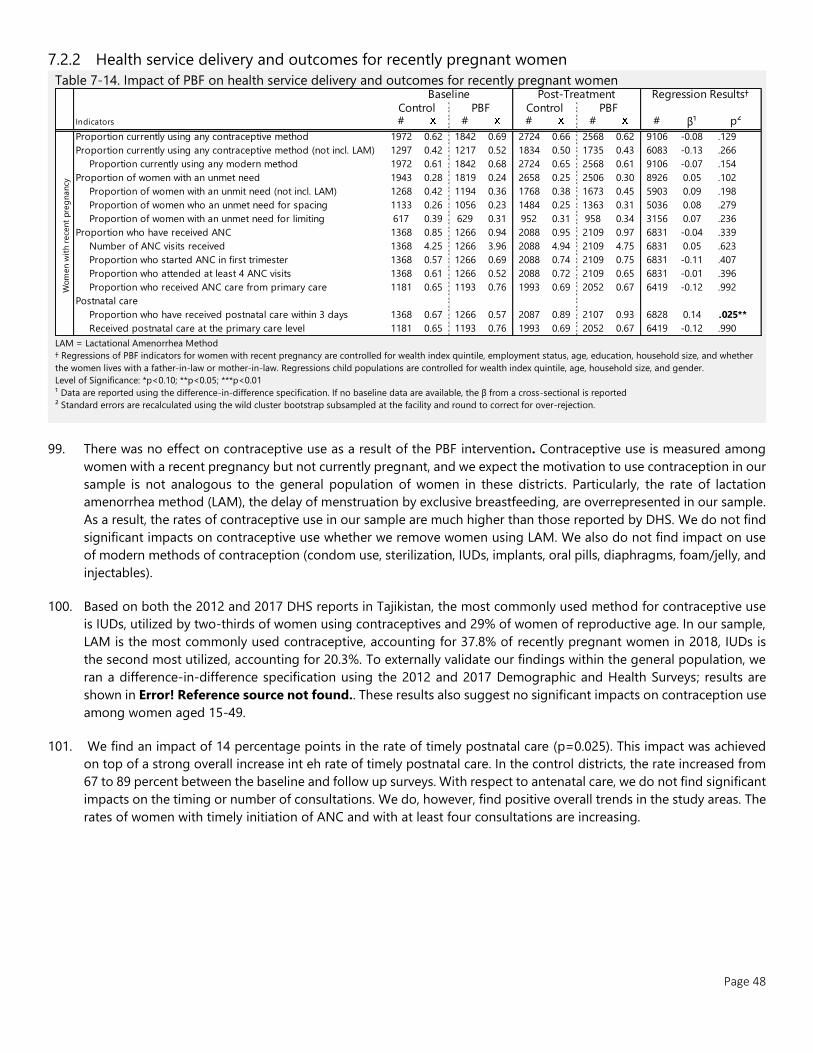
Page 48
7.2.2 Health service delivery and outcomes for recently pregnant women
Table 7-14. Impact of PBF on health service delivery and outcomes for recently pregnant women
LAM = Lactational Amenorrhea Method
† Regressions of PBF indicators for women with recent pregnancy are controlled for wealth index quintile, employment status, age, education, household size, and whether
the women lives with a father-in-law or mother-in-law. Regressions child populations are controlled for wealth index quintile, age, household size, and gender.
Level of Significance: *p<0.10; **p<0.05; ***p<0.01
¹ Data are reported using the difference-in-difference specification. If no baseline data are available, the β from a cross-sectional is reported
² Standard errors are recalculated using the wild cluster bootstrap subsampled at the facility and round to correct for over-rejection.
99. There was no effect on contraceptive use as a result of the PBF intervention. Contraceptive use is measured among
women with a recent pregnancy but not currently pregnant, and we expect the motivation to use contraception in our
sample is not analogous to the general population of women in these districts. Particularly, the rate of lactation
amenorrhea method (LAM), the delay of menstruation by exclusive breastfeeding, are overrepresented in our sample.
As a result, the rates of contraceptive use in our sample are much higher than those reported by DHS. We do not find
significant impacts on contraceptive use whether we remove women using LAM. We also do not find impact on use
of modern methods of contraception (condom use, sterilization, IUDs, implants, oral pills, diaphragms, foam/jelly, and
injectables).
100. Based on both the 2012 and 2017 DHS reports in Tajikistan, the most commonly used method for contraceptive use
is IUDs, utilized by two-thirds of women using contraceptives and 29% of women of reproductive age. In our sample,
LAM is the most commonly used contraceptive, accounting for 37.8% of recently pregnant women in 2018, IUDs is
the second most utilized, accounting for 20.3%. To externally validate our findings within the general population, we
ran a difference-in-difference specification using the 2012 and 2017 Demographic and Health Surveys; results are
shown in Error! Reference source not found.. These results also suggest no significant impacts on contraception use
among women aged 15-49.
101. We find an impact of 14 percentage points in the rate of timely postnatal care (p=0.025). This impact was achieved
on top of a strong overall increase int eh rate of timely postnatal care. In the control districts, the rate increased from
67 to 89 percent between the baseline and follow up surveys. With respect to antenatal care, we do not find significant
impacts on the timing or number of consultations. We do, however, find positive overall trends in the study areas. The
rates of women with timely initiation of ANC and with at least four consultations are increasing.
Indicators # # # # # β¹ p²
Proportion currently using any contraceptive method 1972 0.62 1842 0.69 2724 0.66 2568 0.62 9106 -0.08 .129
Proportion currently using any contraceptive method (not incl. LAM) 1297 0.42 1217 0.52 1834 0.50 1735 0.43 6083 -0.13 .266
Proportion currently using any modern method 1972 0.61 1842 0.68 2724 0.65 2568 0.61 9106 -0.07 .154
Proportion of women with an unmet need 1943 0.28 1819 0.24 2658 0.25 2506 0.30 8926 0.05 .102
Proportion of women with an unmit need (not incl. LAM) 1268 0.42 1194 0.36 1768 0.38 1673 0.45 5903 0.09 .198
Proportion of women who an unmet need for spacing 1133 0.26 1056 0.23 1484 0.25 1363 0.31 5036 0.08 .279
Proportion of women with an unmet need for limiting 617 0.39 629 0.31 952 0.31 958 0.34 3156 0.07 .236
Proportion who have received ANC 1368 0.85 1266 0.94 2088 0.95 2109 0.97 6831 -0.04 .339
Number of ANC visits received 1368 4.25 1266 3.96 2088 4.94 2109 4.75 6831 0.05 .623
Proportion who started ANC in first trimester 1368 0.57 1266 0.69 2088 0.74 2109 0.75 6831 -0.11 .407
Proportion who attended at least 4 ANC visits 1368 0.61 1266 0.52 2088 0.72 2109 0.65 6831 -0.01 .396
Proportion who received ANC care from primary care 1181 0.65 1193 0.76 1993 0.69 2052 0.67 6419 -0.12 .992
Postnatal care
Proportion who have received postnatal care within 3 days 1368 0.67 1266 0.57 2087 0.89 2107 0.93 6828 0.14 .025**
Received postnatal care at the primary care level 1181 0.65 1193 0.76 1993 0.69 2052 0.67 6419 -0.12 .990
Wom
en w
ith r
ece
nt
pre
gnancy
Baseline Post-Treatment Regression Results†
Control PBF Control PBF
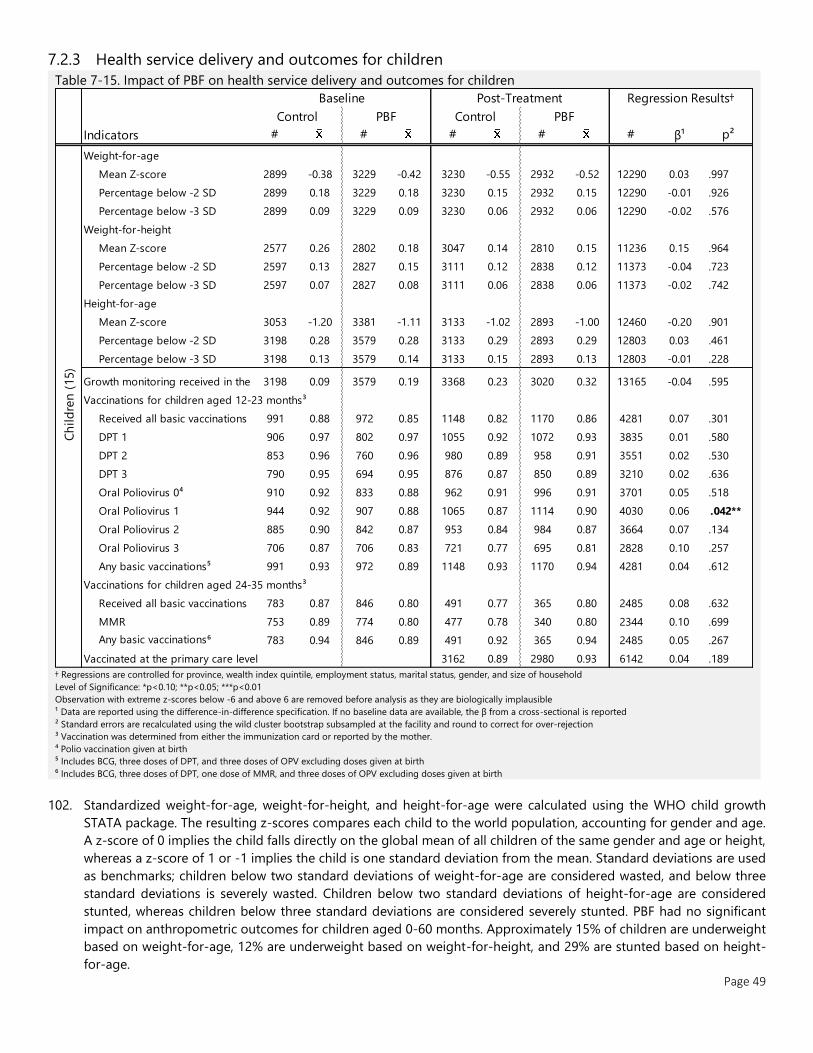
Page 49
7.2.3 Health service delivery and outcomes for children
Table 7-15. Impact of PBF on health service delivery and outcomes for children
† Regressions are controlled for province, wealth index quintile, employment status, marital status, gender, and size of household
Level of Significance: *p<0.10; **p<0.05; ***p<0.01
Observation with extreme z-scores below -6 and above 6 are removed before analysis as they are biologically implausible
¹ Data are reported using the difference-in-difference specification. If no baseline data are available, the β from a cross-sectional is reported
² Standard errors are recalculated using the wild cluster bootstrap subsampled at the facility and round to correct for over-rejection
³ Vaccination was determined from either the immunization card or reported by the mother.
⁴ Polio vaccination given at birth
⁵ Includes BCG, three doses of DPT, and three doses of OPV excluding doses given at birth
⁶ Includes BCG, three doses of DPT, one dose of MMR, and three doses of OPV excluding doses given at birth
102. Standardized weight-for-age, weight-for-height, and height-for-age were calculated using the WHO child growth
STATA package. The resulting z-scores compares each child to the world population, accounting for gender and age.
A z-score of 0 implies the child falls directly on the global mean of all children of the same gender and age or height,
whereas a z-score of 1 or -1 implies the child is one standard deviation from the mean. Standard deviations are used
as benchmarks; children below two standard deviations of weight-for-age are considered wasted, and below three
standard deviations is severely wasted. Children below two standard deviations of height-for-age are considered
stunted, whereas children below three standard deviations are considered severely stunted. PBF had no significant
impact on anthropometric outcomes for children aged 0-60 months. Approximately 15% of children are underweight
based on weight-for-age, 12% are underweight based on weight-for-height, and 29% are stunted based on height-
for-age.
Indicators # # # # # β¹ p²
Weight-for-age
Mean Z-score 2899 -0.38 3229 -0.42 3230 -0.55 2932 -0.52 12290 0.03 .997
Percentage below -2 SD 2899 0.18 3229 0.18 3230 0.15 2932 0.15 12290 -0.01 .926
Percentage below -3 SD 2899 0.09 3229 0.09 3230 0.06 2932 0.06 12290 -0.02 .576
Weight-for-height
Mean Z-score 2577 0.26 2802 0.18 3047 0.14 2810 0.15 11236 0.15 .964
Percentage below -2 SD 2597 0.13 2827 0.15 3111 0.12 2838 0.12 11373 -0.04 .723
Percentage below -3 SD 2597 0.07 2827 0.08 3111 0.06 2838 0.06 11373 -0.02 .742
Height-for-age
Mean Z-score 3053 -1.20 3381 -1.11 3133 -1.02 2893 -1.00 12460 -0.20 .901
Percentage below -2 SD 3198 0.28 3579 0.28 3133 0.29 2893 0.29 12803 0.03 .461
Percentage below -3 SD 3198 0.13 3579 0.14 3133 0.15 2893 0.13 12803 -0.01 .228
Growth monitoring received in the past 6 months3198 0.09 3579 0.19 3368 0.23 3020 0.32 13165 -0.04 .595
Vaccinations for children aged 12-23 months³
Received all basic vaccinations 991 0.88 972 0.85 1148 0.82 1170 0.86 4281 0.07 .301
DPT 1 906 0.97 802 0.97 1055 0.92 1072 0.93 3835 0.01 .580
DPT 2 853 0.96 760 0.96 980 0.89 958 0.91 3551 0.02 .530
DPT 3 790 0.95 694 0.95 876 0.87 850 0.89 3210 0.02 .636
Oral Poliovirus 0⁴ 910 0.92 833 0.88 962 0.91 996 0.91 3701 0.05 .518
Oral Poliovirus 1 944 0.92 907 0.88 1065 0.87 1114 0.90 4030 0.06 .042**
Oral Poliovirus 2 885 0.90 842 0.87 953 0.84 984 0.87 3664 0.07 .134
Oral Poliovirus 3 706 0.87 706 0.83 721 0.77 695 0.81 2828 0.10 .257
Any basic vaccinations⁵ 991 0.93 972 0.89 1148 0.93 1170 0.94 4281 0.04 .612
Vaccinations for children aged 24-35 months³
Received all basic vaccinations 783 0.87 846 0.80 491 0.77 365 0.80 2485 0.08 .632
MMR 753 0.89 774 0.80 477 0.78 340 0.80 2344 0.10 .699
Any basic vaccinations⁶ 783 0.94 846 0.89 491 0.92 365 0.94 2485 0.05 .267
Vaccinated at the primary care level 3162 0.89 2980 0.93 6142 0.04 .189
Baseline Post-Treatment Regression Results†
Control PBF Control PBF
Ch
ild
ren
(15)

Page 50
103. We do not find significant impact on the rate of children under 5 who had their weight and height measured in the
preceding 6 months nor on vaccination coverage. We do measure an overall increase in the rate of growth monitoring
between baseline and follow-up. The rate of children 12-23 month with all basic vaccinations, however, was high at
baseline and has not statistically change.
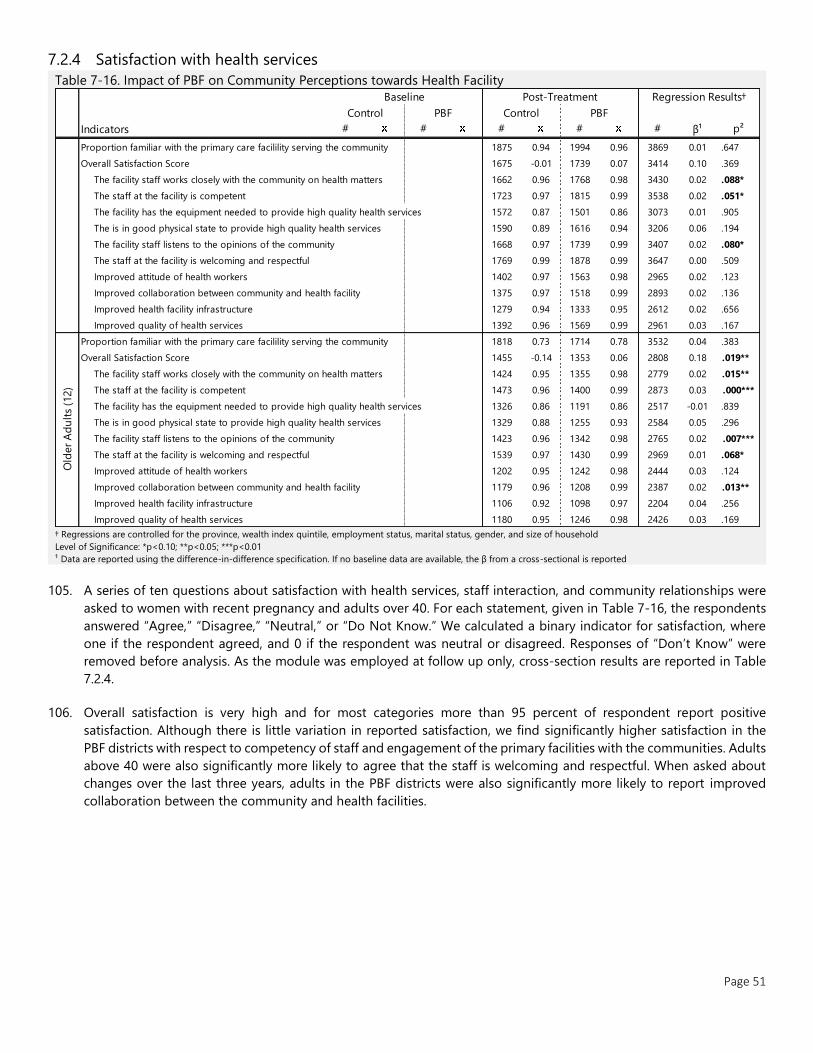
Page 51
7.2.4 Satisfaction with health services
Table 7-16. Impact of PBF on Community Perceptions towards Health Facility
† Regressions are controlled for the province, wealth index quintile, employment status, marital status, gender, and size of household
Level of Significance: *p<0.10; **p<0.05; ***p<0.01
¹ Data are reported using the difference-in-difference specification. If no baseline data are available, the β from a cross-sectional is reported
105. A series of ten questions about satisfaction with health services, staff interaction, and community relationships were
asked to women with recent pregnancy and adults over 40. For each statement, given in Table 7-16, the respondents
answered “Agree,” “Disagree,” “Neutral,” or “Do Not Know.” We calculated a binary indicator for satisfaction, where
one if the respondent agreed, and 0 if the respondent was neutral or disagreed. Responses of “Don’t Know” were
removed before analysis. As the module was employed at follow up only, cross-section results are reported in Table
7.2.4.
106. Overall satisfaction is very high and for most categories more than 95 percent of respondent report positive
satisfaction. Although there is little variation in reported satisfaction, we find significantly higher satisfaction in the
PBF districts with respect to competency of staff and engagement of the primary facilities with the communities. Adults
above 40 were also significantly more likely to agree that the staff is welcoming and respectful. When asked about
changes over the last three years, adults in the PBF districts were also significantly more likely to report improved
collaboration between the community and health facilities.
Indicators # # # # # β¹ p²
Proportion familiar with the primary care facilility serving the community 1875 0.94 1994 0.96 3869 0.01 .647
Overall Satisfaction Score 1675 -0.01 1739 0.07 3414 0.10 .369
The facility staff works closely with the community on health matters 1662 0.96 1768 0.98 3430 0.02 .088*
The staff at the facility is competent 1723 0.97 1815 0.99 3538 0.02 .051*
The facility has the equipment needed to provide high quality health services 1572 0.87 1501 0.86 3073 0.01 .905
The is in good physical state to provide high quality health services 1590 0.89 1616 0.94 3206 0.06 .194
The facility staff listens to the opinions of the community 1668 0.97 1739 0.99 3407 0.02 .080*
The staff at the facility is welcoming and respectful 1769 0.99 1878 0.99 3647 0.00 .509
Improved attitude of health workers 1402 0.97 1563 0.98 2965 0.02 .123
Improved collaboration between community and health facility 1375 0.97 1518 0.99 2893 0.02 .136
Improved health facility infrastructure 1279 0.94 1333 0.95 2612 0.02 .656
Improved quality of health services 1392 0.96 1569 0.99 2961 0.03 .167
Proportion familiar with the primary care facilility serving the community 1818 0.73 1714 0.78 3532 0.04 .383
Overall Satisfaction Score 1455 -0.14 1353 0.06 2808 0.18 .019**
The facility staff works closely with the community on health matters 1424 0.95 1355 0.98 2779 0.02 .015**
The staff at the facility is competent 1473 0.96 1400 0.99 2873 0.03 .000***
The facility has the equipment needed to provide high quality health services 1326 0.86 1191 0.86 2517 -0.01 .839
The is in good physical state to provide high quality health services 1329 0.88 1255 0.93 2584 0.05 .296
The facility staff listens to the opinions of the community 1423 0.96 1342 0.98 2765 0.02 .007***
The staff at the facility is welcoming and respectful 1539 0.97 1430 0.99 2969 0.01 .068*
Improved attitude of health workers 1202 0.95 1242 0.98 2444 0.03 .124
Improved collaboration between community and health facility 1179 0.96 1208 0.99 2387 0.02 .013**
Improved health facility infrastructure 1106 0.92 1098 0.97 2204 0.04 .256
Improved quality of health services 1180 0.95 1246 0.98 2426 0.03 .169
Old
er
Ad
ult
s (1
2)
Baseline Post-Treatment Regression Results†
Control PBF Control PBF
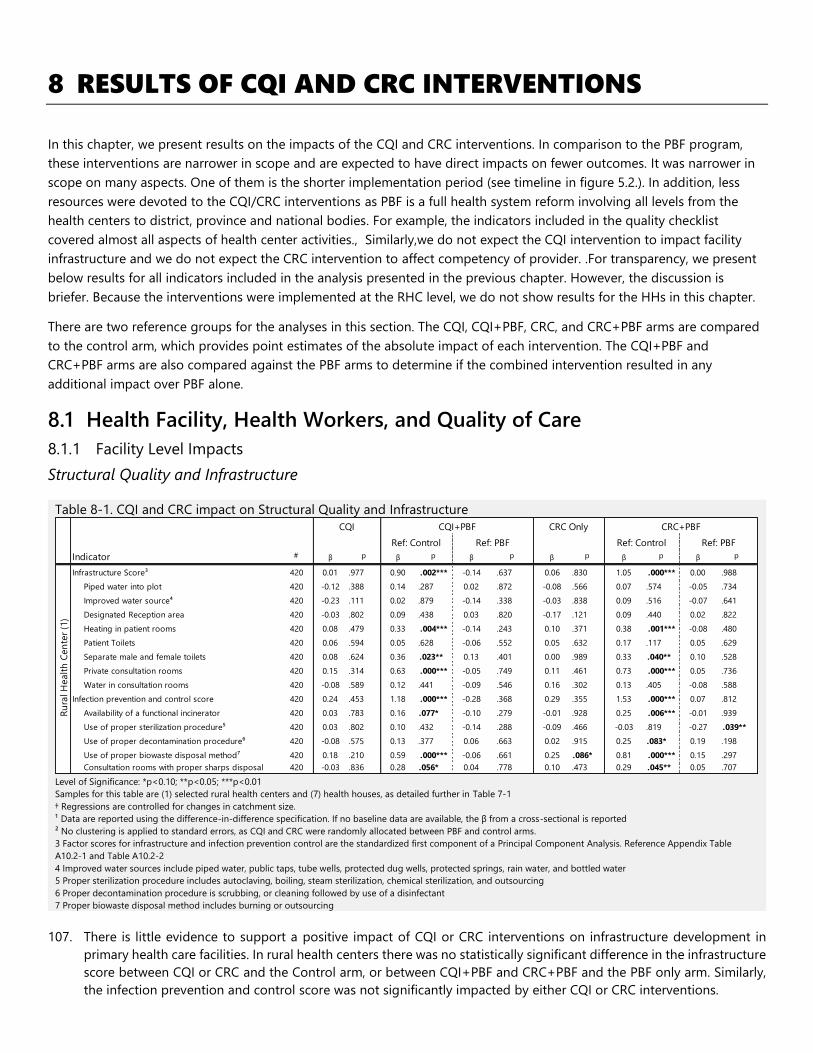
8 RESULTS OF CQI AND CRC INTERVENTIONS
In this chapter, we present results on the impacts of the CQI and CRC interventions. In comparison to the PBF program,
these interventions are narrower in scope and are expected to have direct impacts on fewer outcomes. It was narrower in
scope on many aspects. One of them is the shorter implementation period (see timeline in figure 5.2.). In addition, less
resources were devoted to the CQI/CRC interventions as PBF is a full health system reform involving all levels from the
health centers to district, province and national bodies. For example, the indicators included in the quality checklist
covered almost all aspects of health center activities., Similarly,we do not expect the CQI intervention to impact facility
infrastructure and we do not expect the CRC intervention to affect competency of provider. .For transparency, we present
below results for all indicators included in the analysis presented in the previous chapter. However, the discussion is
briefer. Because the interventions were implemented at the RHC level, we do not show results for the HHs in this chapter.
There are two reference groups for the analyses in this section. The CQI, CQI+PBF, CRC, and CRC+PBF arms are compared
to the control arm, which provides point estimates of the absolute impact of each intervention. The CQI+PBF and
CRC+PBF arms are also compared against the PBF arms to determine if the combined intervention resulted in any
additional impact over PBF alone.
8.1 Health Facility, Health Workers, and Quality of Care
8.1.1 Facility Level Impacts
Structural Quality and Infrastructure
Table 8-1. CQI and CRC impact on Structural Quality and Infrastructure
Level of Significance: *p<0.10; **p<0.05; ***p<0.01
Samples for this table are (1) selected rural health centers and (7) health houses, as detailed further in Table 7-1
† Regressions are controlled for changes in catchment size.
¹ Data are reported using the difference-in-difference specification. If no baseline data are available, the β from a cross-sectional is reported
² No clustering is applied to standard errors, as CQI and CRC were randomly allocated between PBF and control arms.
3 Factor scores for infrastructure and infection prevention control are the standardized first component of a Principal Component Analysis. Reference Appendix Table
A10.2-1 and Table A10.2-2
4 Improved water sources include piped water, public taps, tube wells, protected dug wells, protected springs, rain water, and bottled water
5 Proper sterilization procedure includes autoclaving, boiling, steam sterilization, chemical sterilization, and outsourcing
6 Proper decontamination procedure is scrubbing, or cleaning followed by use of a disinfectant
7 Proper biowaste disposal method includes burning or outsourcing
107. There is little evidence to support a positive impact of CQI or CRC interventions on infrastructure development in
primary health care facilities. In rural health centers there was no statistically significant difference in the infrastructure
score between CQI or CRC and the Control arm, or between CQI+PBF and CRC+PBF and the PBF only arm. Similarly,
the infection prevention and control score was not significantly impacted by either CQI or CRC interventions.
Indicator # β p β p β p β p β p β p
Infrastructure Score³ 420 0.01 .977 0.90 .002*** -0.14 .637 0.06 .830 1.05 .000*** 0.00 .988
Piped water into plot 420 -0.12 .388 0.14 .287 0.02 .872 -0.08 .566 0.07 .574 -0.05 .734
Improved water source⁴ 420 -0.23 .111 0.02 .879 -0.14 .338 -0.03 .838 0.09 .516 -0.07 .641
Designated Reception area 420 -0.03 .802 0.09 .438 0.03 .820 -0.17 .121 0.09 .440 0.02 .822
Heating in patient rooms 420 0.08 .479 0.33 .004*** -0.14 .243 0.10 .371 0.38 .001*** -0.08 .480
Patient Toilets 420 0.06 .594 0.05 .628 -0.06 .552 0.05 .632 0.17 .117 0.05 .629
Separate male and female toilets 420 0.08 .624 0.36 .023** 0.13 .401 0.00 .989 0.33 .040** 0.10 .528
Private consultation rooms 420 0.15 .314 0.63 .000*** -0.05 .749 0.11 .461 0.73 .000*** 0.05 .736
Water in consultation rooms 420 -0.08 .589 0.12 .441 -0.09 .546 0.16 .302 0.13 .405 -0.08 .588
Infection prevention and control score 420 0.24 .453 1.18 .000*** -0.28 .368 0.29 .355 1.53 .000*** 0.07 .812
Availability of a functional incinerator 420 0.03 .783 0.16 .077* -0.10 .279 -0.01 .928 0.25 .006*** -0.01 .939
Use of proper sterilization procedure⁵ 420 0.03 .802 0.10 .432 -0.14 .288 -0.09 .466 -0.03 .819 -0.27 .039**
Use of proper decontamination procedure⁶ 420 -0.08 .575 0.13 .377 0.06 .663 0.02 .915 0.25 .083* 0.19 .198
Use of proper biowaste disposal method⁷ 420 0.18 .210 0.59 .000*** -0.06 .661 0.25 .086* 0.81 .000*** 0.15 .297
Consultation rooms with proper sharps disposal 420 -0.03 .836 0.28 .056* 0.04 .778 0.10 .473 0.29 .045** 0.05 .707
Ru
ral H
ealt
h C
en
ter
(1)
CQI CRC OnlyCQI+PBF CRC+PBF
Ref: Control Ref: PBF Ref: Control Ref: PBF
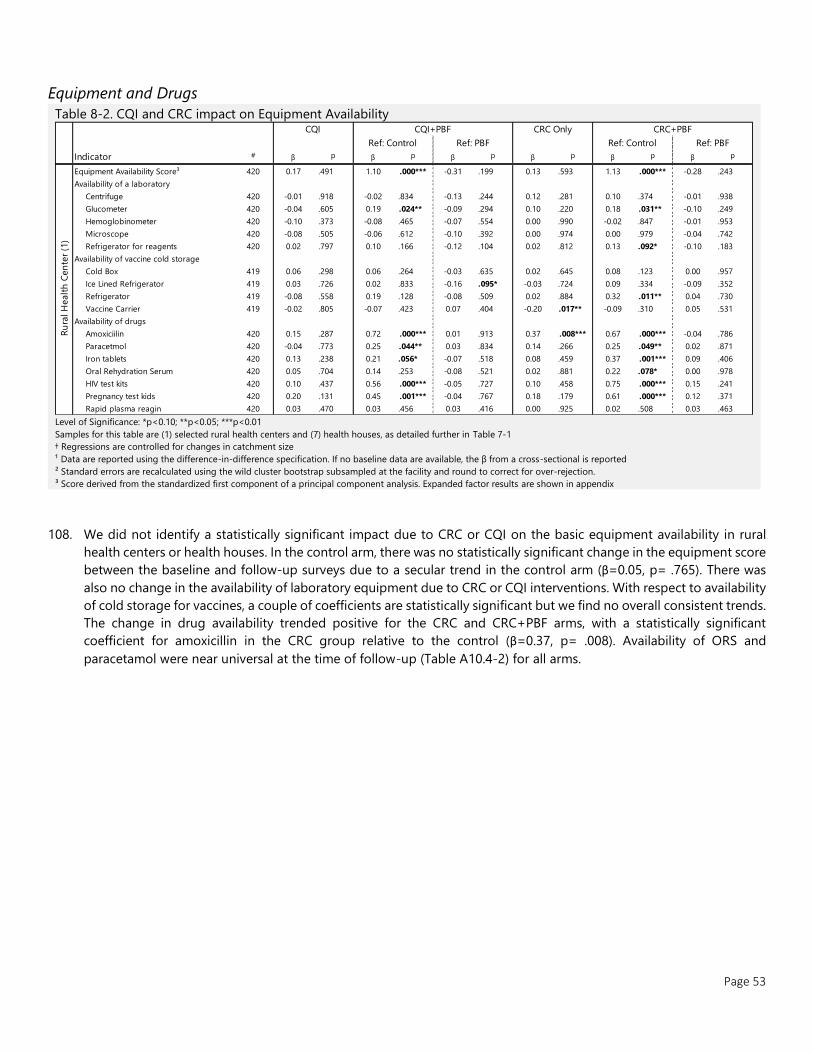
Page 53
Equipment and Drugs
Table 8-2. CQI and CRC impact on Equipment Availability
Level of Significance: *p<0.10; **p<0.05; ***p<0.01
Samples for this table are (1) selected rural health centers and (7) health houses, as detailed further in Table 7-1
† Regressions are controlled for changes in catchment size
¹ Data are reported using the difference-in-difference specification. If no baseline data are available, the β from a cross-sectional is reported
² Standard errors are recalculated using the wild cluster bootstrap subsampled at the facility and round to correct for over-rejection.
³ Score derived from the standardized first component of a principal component analysis. Expanded factor results are shown in appendix
108. We did not identify a statistically significant impact due to CRC or CQI on the basic equipment availability in rural
health centers or health houses. In the control arm, there was no statistically significant change in the equipment score
between the baseline and follow-up surveys due to a secular trend in the control arm (β=0.05, p= .765). There was
also no change in the availability of laboratory equipment due to CRC or CQI interventions. With respect to availability
of cold storage for vaccines, a couple of coefficients are statistically significant but we find no overall consistent trends.
The change in drug availability trended positive for the CRC and CRC+PBF arms, with a statistically significant
coefficient for amoxicillin in the CRC group relative to the control (β=0.37, p= .008). Availability of ORS and
paracetamol were near universal at the time of follow-up (Table A10.4-2) for all arms.
Indicator # β p β p β p β p β p β p
Equipment Availability Score³ 420 0.17 .491 1.10 .000*** -0.31 .199 0.13 .593 1.13 .000*** -0.28 .243
Availability of a laboratory
Centrifuge 420 -0.01 .918 -0.02 .834 -0.13 .244 0.12 .281 0.10 .374 -0.01 .938
Glucometer 420 -0.04 .605 0.19 .024** -0.09 .294 0.10 .220 0.18 .031** -0.10 .249
Hemoglobinometer 420 -0.10 .373 -0.08 .465 -0.07 .554 0.00 .990 -0.02 .847 -0.01 .953
Microscope 420 -0.08 .505 -0.06 .612 -0.10 .392 0.00 .974 0.00 .979 -0.04 .742
Refrigerator for reagents 420 0.02 .797 0.10 .166 -0.12 .104 0.02 .812 0.13 .092* -0.10 .183
Availability of vaccine cold storage
Cold Box 419 0.06 .298 0.06 .264 -0.03 .635 0.02 .645 0.08 .123 0.00 .957
Ice Lined Refrigerator 419 0.03 .726 0.02 .833 -0.16 .095* -0.03 .724 0.09 .334 -0.09 .352
Refrigerator 419 -0.08 .558 0.19 .128 -0.08 .509 0.02 .884 0.32 .011** 0.04 .730
Vaccine Carrier 419 -0.02 .805 -0.07 .423 0.07 .404 -0.20 .017** -0.09 .310 0.05 .531
Availability of drugs
Amoxiciilin 420 0.15 .287 0.72 .000*** 0.01 .913 0.37 .008*** 0.67 .000*** -0.04 .786
Paracetmol 420 -0.04 .773 0.25 .044** 0.03 .834 0.14 .266 0.25 .049** 0.02 .871
Iron tablets 420 0.13 .238 0.21 .056* -0.07 .518 0.08 .459 0.37 .001*** 0.09 .406
Oral Rehydration Serum 420 0.05 .704 0.14 .253 -0.08 .521 0.02 .881 0.22 .078* 0.00 .978
HIV test kits 420 0.10 .437 0.56 .000*** -0.05 .727 0.10 .458 0.75 .000*** 0.15 .241
Pregnancy test kids 420 0.20 .131 0.45 .001*** -0.04 .767 0.18 .179 0.61 .000*** 0.12 .371
Rapid plasma reagin 420 0.03 .470 0.03 .456 0.03 .416 0.00 .925 0.02 .508 0.03 .463
Ref: Control Ref: PBF Ref: Control Ref: PBF
Ru
ral H
ealt
h C
en
ter
(1)
CQI CQI+PBF CRC Only CRC+PBF
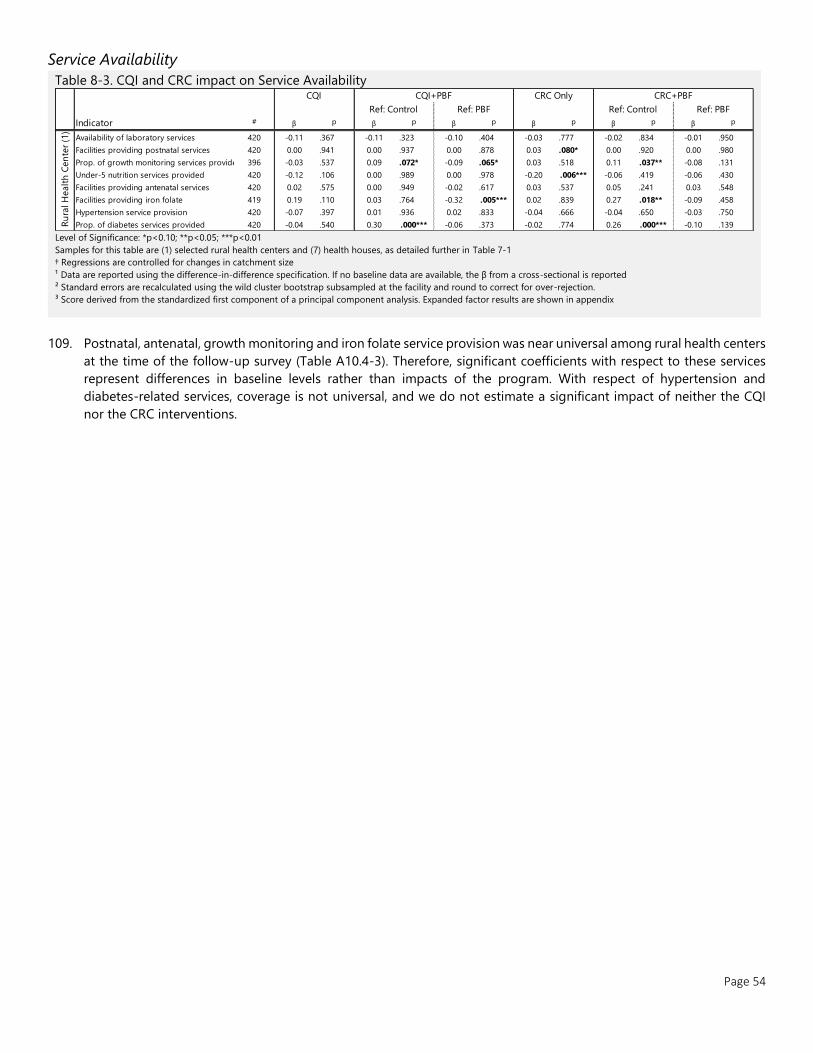
Page 54
Service Availability
Table 8-3. CQI and CRC impact on Service Availability
Level of Significance: *p<0.10; **p<0.05; ***p<0.01
Samples for this table are (1) selected rural health centers and (7) health houses, as detailed further in Table 7-1
† Regressions are controlled for changes in catchment size
¹ Data are reported using the difference-in-difference specification. If no baseline data are available, the β from a cross-sectional is reported
² Standard errors are recalculated using the wild cluster bootstrap subsampled at the facility and round to correct for over-rejection.
³ Score derived from the standardized first component of a principal component analysis. Expanded factor results are shown in appendix
109. Postnatal, antenatal, growth monitoring and iron folate service provision was near universal among rural health centers
at the time of the follow-up survey (Table A10.4-3). Therefore, significant coefficients with respect to these services
represent differences in baseline levels rather than impacts of the program. With respect of hypertension and
diabetes-related services, coverage is not universal, and we do not estimate a significant impact of neither the CQI
nor the CRC interventions.
Indicator # β p β p β p β p β p β p
Availability of laboratory services 420 -0.11 .367 -0.11 .323 -0.10 .404 -0.03 .777 -0.02 .834 -0.01 .950
Facilities providing postnatal services 420 0.00 .941 0.00 .937 0.00 .878 0.03 .080* 0.00 .920 0.00 .980
Prop. of growth monitoring services provided 396 -0.03 .537 0.09 .072* -0.09 .065* 0.03 .518 0.11 .037** -0.08 .131
Under-5 nutrition services provided 420 -0.12 .106 0.00 .989 0.00 .978 -0.20 .006*** -0.06 .419 -0.06 .430
Facilities providing antenatal services 420 0.02 .575 0.00 .949 -0.02 .617 0.03 .537 0.05 .241 0.03 .548
Facilities providing iron folate 419 0.19 .110 0.03 .764 -0.32 .005*** 0.02 .839 0.27 .018** -0.09 .458
Hypertension service provision 420 -0.07 .397 0.01 .936 0.02 .833 -0.04 .666 -0.04 .650 -0.03 .750
Prop. of diabetes services provided 420 -0.04 .540 0.30 .000*** -0.06 .373 -0.02 .774 0.26 .000*** -0.10 .139
Ref: Control Ref: PBF Ref: Control Ref: PBF
Ru
ral H
ealt
h C
en
ter
(1)
CQI CQI+PBF CRC Only CRC+PBF
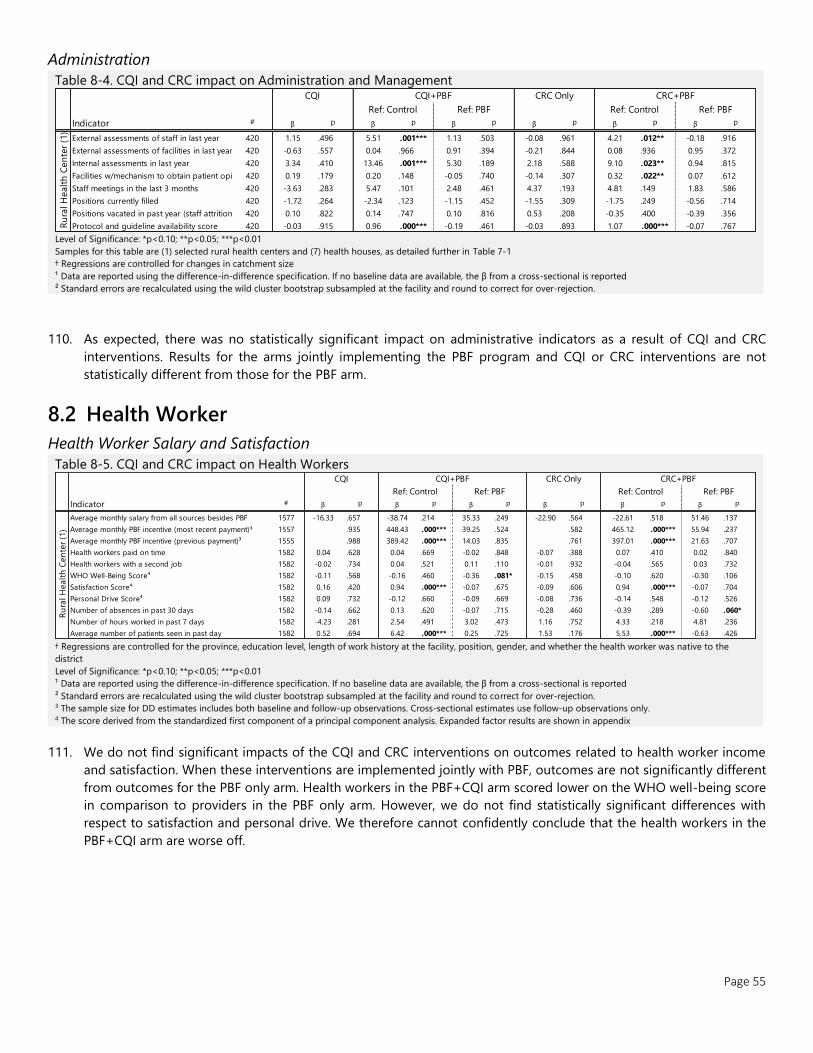
Page 55
Administration
Table 8-4. CQI and CRC impact on Administration and Management
Level of Significance: *p<0.10; **p<0.05; ***p<0.01
Samples for this table are (1) selected rural health centers and (7) health houses, as detailed further in Table 7-1
† Regressions are controlled for changes in catchment size
¹ Data are reported using the difference-in-difference specification. If no baseline data are available, the β from a cross-sectional is reported
² Standard errors are recalculated using the wild cluster bootstrap subsampled at the facility and round to correct for over-rejection.
110. As expected, there was no statistically significant impact on administrative indicators as a result of CQI and CRC
interventions. Results for the arms jointly implementing the PBF program and CQI or CRC interventions are not
statistically different from those for the PBF arm.
8.2 Health Worker
Health Worker Salary and Satisfaction
Table 8-5. CQI and CRC impact on Health Workers
† Regressions are controlled for the province, education level, length of work history at the facility, position, gender, and whether the health worker was native to the
district
Level of Significance: *p<0.10; **p<0.05; ***p<0.01
¹ Data are reported using the difference-in-difference specification. If no baseline data are available, the β from a cross-sectional is reported
² Standard errors are recalculated using the wild cluster bootstrap subsampled at the facility and round to correct for over-rejection. 3 The sample size for DD estimates includes both baseline and follow-up observations. Cross-sectional estimates use follow-up observations only. 4 The score derived from the standardized first component of a principal component analysis. Expanded factor results are shown in appendix
111. We do not find significant impacts of the CQI and CRC interventions on outcomes related to health worker income
and satisfaction. When these interventions are implemented jointly with PBF, outcomes are not significantly different
from outcomes for the PBF only arm. Health workers in the PBF+CQI arm scored lower on the WHO well-being score
in comparison to providers in the PBF only arm. However, we do not find statistically significant differences with
respect to satisfaction and personal drive. We therefore cannot confidently conclude that the health workers in the
PBF+CQI arm are worse off.
Indicator # β p β p β p β p β p β p
External assessments of staff in last year 420 1.15 .496 5.51 .001*** 1.13 .503 -0.08 .961 4.21 .012** -0.18 .916
External assessments of facilities in last year 420 -0.63 .557 0.04 .966 0.91 .394 -0.21 .844 0.08 .936 0.95 .372
Internal assessments in last year 420 3.34 .410 13.46 .001*** 5.30 .189 2.18 .588 9.10 .023** 0.94 .815
Facilities w/mechanism to obtain patient opinion420 0.19 .179 0.20 .148 -0.05 .740 -0.14 .307 0.32 .022** 0.07 .612
Staff meetings in the last 3 months 420 -3.63 .283 5.47 .101 2.48 .461 4.37 .193 4.81 .149 1.83 .586
Positions currently filled 420 -1.72 .264 -2.34 .123 -1.15 .452 -1.55 .309 -1.75 .249 -0.56 .714
Positions vacated in past year (staff attrition) 420 0.10 .822 0.14 .747 0.10 .816 0.53 .208 -0.35 .400 -0.39 .356
Protocol and guideline availability score 420 -0.03 .915 0.96 .000*** -0.19 .461 -0.03 .893 1.07 .000*** -0.07 .767
Ref: Control Ref: PBF Ref: Control Ref: PBF
Ru
ral H
ealt
h C
en
ter
(1)
CQI CQI+PBF CRC Only CRC+PBF
Indicator # β p β p β p β p β p β p
Average monthly salary from all sources besides PBF 1577 -16.33 .657 -38.74 .214 35.33 .249 -22.90 .564 -22.61 .518 51.46 .137
Average monthly PBF incentive (most recent payment)³ 1557 .935 448.43 .000*** 39.25 .524 .582 465.12 .000*** 55.94 .237
Average monthly PBF incentive (previous payment)³ 1555 .988 389.42 .000*** 14.03 .835 .761 397.01 .000*** 21.63 .707
Health workers paid on time 1582 0.04 .628 0.04 .669 -0.02 .848 -0.07 .388 0.07 .410 0.02 .840
Health workers with a second job 1582 -0.02 .734 0.04 .521 0.11 .110 -0.01 .932 -0.04 .565 0.03 .732
WHO Well-Being Score⁴ 1582 -0.11 .568 -0.16 .460 -0.36 .081* -0.15 .458 -0.10 .620 -0.30 .106
Satisfaction Score⁴ 1582 0.16 .420 0.94 .000*** -0.07 .675 -0.09 .606 0.94 .000*** -0.07 .704
Personal Drive Score⁴ 1582 0.09 .732 -0.12 .660 -0.09 .669 -0.08 .736 -0.14 .548 -0.12 .526
Number of absences in past 30 days 1582 -0.14 .662 0.13 .620 -0.07 .715 -0.28 .460 -0.39 .289 -0.60 .060*
Number of hours worked in past 7 days 1582 -4.23 .281 2.54 .491 3.02 .473 1.16 .752 4.33 .218 4.81 .236
Average number of patients seen in past day 1582 0.52 .694 6.42 .000*** 0.25 .725 1.53 .176 5.53 .000*** -0.63 .426
Ru
ral H
ealt
h C
en
ter
(1)
CQI CQI+PBF CRC Only CRC+PBF
Ref: Control Ref: PBF Ref: Control Ref: PBF
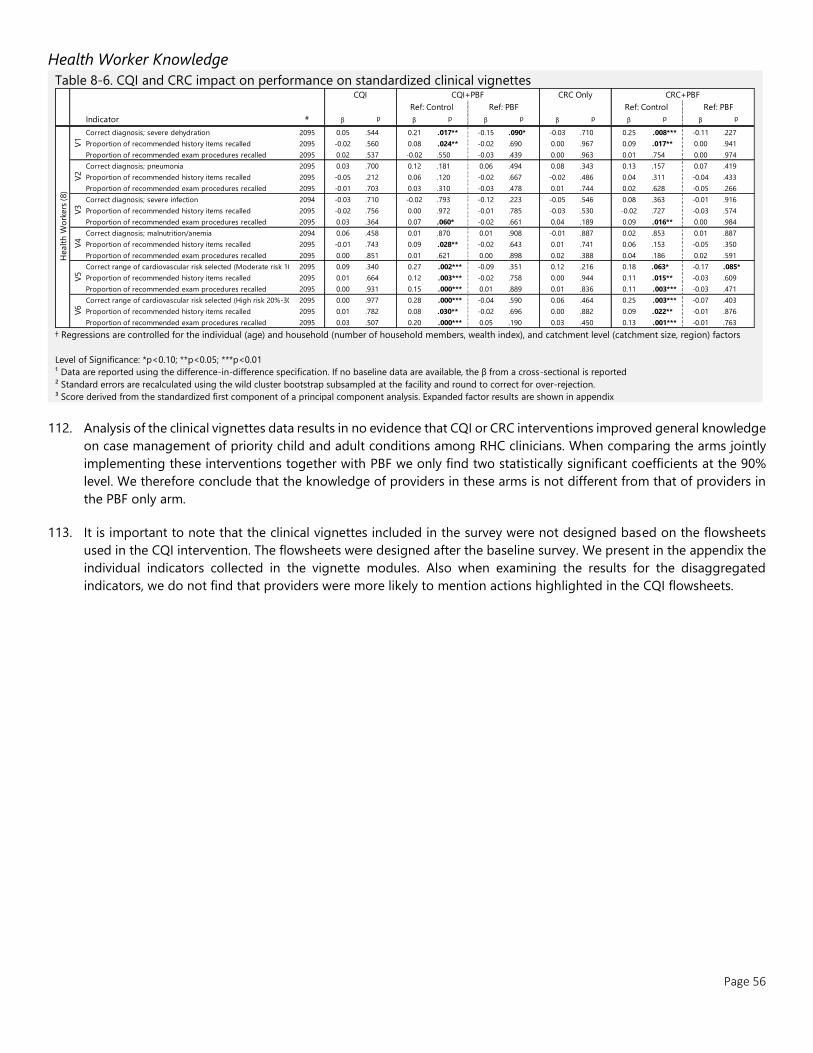
Page 56
Health Worker Knowledge
Table 8-6. CQI and CRC impact on performance on standardized clinical vignettes
† Regressions are controlled for the individual (age) and household (number of household members, wealth index), and catchment level (catchment size, region) factors
Level of Significance: *p<0.10; **p<0.05; ***p<0.01
¹ Data are reported using the difference-in-difference specification. If no baseline data are available, the β from a cross-sectional is reported
² Standard errors are recalculated using the wild cluster bootstrap subsampled at the facility and round to correct for over-rejection.
³ Score derived from the standardized first component of a principal component analysis. Expanded factor results are shown in appendix
112. Analysis of the clinical vignettes data results in no evidence that CQI or CRC interventions improved general knowledge
on case management of priority child and adult conditions among RHC clinicians. When comparing the arms jointly
implementing these interventions together with PBF we only find two statistically significant coefficients at the 90%
level. We therefore conclude that the knowledge of providers in these arms is not different from that of providers in
the PBF only arm.
113. It is important to note that the clinical vignettes included in the survey were not designed based on the flowsheets
used in the CQI intervention. The flowsheets were designed after the baseline survey. We present in the appendix the
individual indicators collected in the vignette modules. Also when examining the results for the disaggregated
indicators, we do not find that providers were more likely to mention actions highlighted in the CQI flowsheets.
Indicator # β p β p β p β p β p β p
Correct diagnosis; severe dehydration 2095 0.05 .544 0.21 .017** -0.15 .090* -0.03 .710 0.25 .008*** -0.11 .227
Proportion of recommended history items recalled 2095 -0.02 .560 0.08 .024** -0.02 .690 0.00 .967 0.09 .017** 0.00 .941
Proportion of recommended exam procedures recalled 2095 0.02 .537 -0.02 .550 -0.03 .439 0.00 .963 0.01 .754 0.00 .974
Correct diagnosis; pneumonia 2095 0.03 .700 0.12 .181 0.06 .494 0.08 .343 0.13 .157 0.07 .419
Proportion of recommended history items recalled 2095 -0.05 .212 0.06 .120 -0.02 .667 -0.02 .486 0.04 .311 -0.04 .433
Proportion of recommended exam procedures recalled 2095 -0.01 .703 0.03 .310 -0.03 .478 0.01 .744 0.02 .628 -0.05 .266
Correct diagnosis; severe infection 2094 -0.03 .710 -0.02 .793 -0.12 .223 -0.05 .546 0.08 .363 -0.01 .916
Proportion of recommended history items recalled 2095 -0.02 .756 0.00 .972 -0.01 .785 -0.03 .530 -0.02 .727 -0.03 .574
Proportion of recommended exam procedures recalled 2095 0.03 .364 0.07 .060* -0.02 .661 0.04 .189 0.09 .016** 0.00 .984
Correct diagnosis; malnutrition/anemia 2094 0.06 .458 0.01 .870 0.01 .908 -0.01 .887 0.02 .853 0.01 .887
Proportion of recommended history items recalled 2095 -0.01 .743 0.09 .028** -0.02 .643 0.01 .741 0.06 .153 -0.05 .350
Proportion of recommended exam procedures recalled 2095 0.00 .851 0.01 .621 0.00 .898 0.02 .388 0.04 .186 0.02 .591
Correct range of cardiovascular risk selected (Moderate risk 10%-20%)2095 0.09 .340 0.27 .002*** -0.09 .351 0.12 .216 0.18 .063* -0.17 .085*
Proportion of recommended history items recalled 2095 0.01 .664 0.12 .003*** -0.02 .758 0.00 .944 0.11 .015** -0.03 .609
Proportion of recommended exam procedures recalled 2095 0.00 .931 0.15 .000*** 0.01 .889 0.01 .836 0.11 .003*** -0.03 .471
Correct range of cardiovascular risk selected (High risk 20%-30%)2095 0.00 .977 0.28 .000*** -0.04 .590 0.06 .464 0.25 .003*** -0.07 .403
Proportion of recommended history items recalled 2095 0.01 .782 0.08 .030** -0.02 .696 0.00 .882 0.09 .022** -0.01 .876
Proportion of recommended exam procedures recalled 2095 0.03 .507 0.20 .000*** 0.05 .190 0.03 .450 0.13 .001*** -0.01 .763
Ref: Control Ref: PBF Ref: Control Ref: PBF
CQI CQI+PBF CRC Only CRC+PBF
V5
V6
Healt
h W
ork
ers
(8)
V1
V2
V3
V4
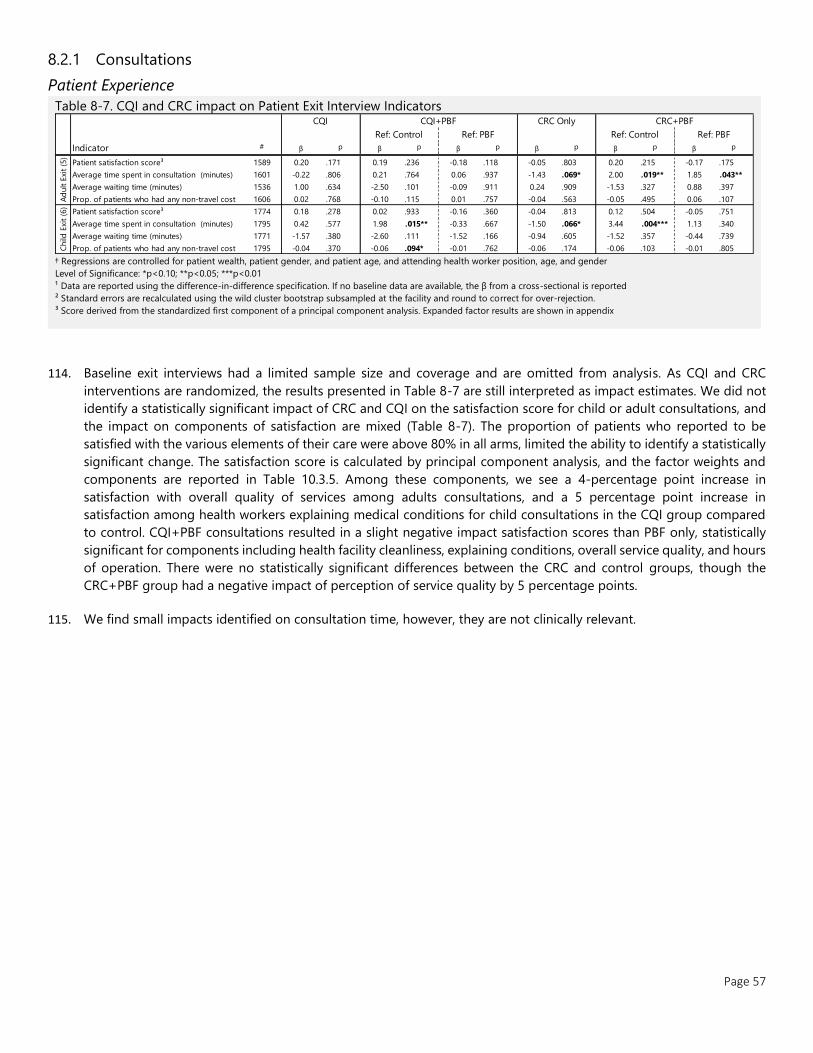
Page 57
8.2.1 Consultations
Patient Experience
Table 8-7. CQI and CRC impact on Patient Exit Interview Indicators
† Regressions are controlled for patient wealth, patient gender, and patient age, and attending health worker position, age, and gender
Level of Significance: *p<0.10; **p<0.05; ***p<0.01
¹ Data are reported using the difference-in-difference specification. If no baseline data are available, the β from a cross-sectional is reported
² Standard errors are recalculated using the wild cluster bootstrap subsampled at the facility and round to correct for over-rejection.
³ Score derived from the standardized first component of a principal component analysis. Expanded factor results are shown in appendix
114. Baseline exit interviews had a limited sample size and coverage and are omitted from analysis. As CQI and CRC
interventions are randomized, the results presented in Table 8-7 are still interpreted as impact estimates. We did not
identify a statistically significant impact of CRC and CQI on the satisfaction score for child or adult consultations, and
the impact on components of satisfaction are mixed (Table 8-7). The proportion of patients who reported to be
satisfied with the various elements of their care were above 80% in all arms, limited the ability to identify a statistically
significant change. The satisfaction score is calculated by principal component analysis, and the factor weights and
components are reported in Table 10.3.5. Among these components, we see a 4-percentage point increase in
satisfaction with overall quality of services among adults consultations, and a 5 percentage point increase in
satisfaction among health workers explaining medical conditions for child consultations in the CQI group compared
to control. CQI+PBF consultations resulted in a slight negative impact satisfaction scores than PBF only, statistically
significant for components including health facility cleanliness, explaining conditions, overall service quality, and hours
of operation. There were no statistically significant differences between the CRC and control groups, though the
CRC+PBF group had a negative impact of perception of service quality by 5 percentage points.
115. We find small impacts identified on consultation time, however, they are not clinically relevant.
Indicator # β p β p β p β p β p β p
Patient satisfaction score³ 1589 0.20 .171 0.19 .236 -0.18 .118 -0.05 .803 0.20 .215 -0.17 .175
Average time spent in consultation (minutes) 1601 -0.22 .806 0.21 .764 0.06 .937 -1.43 .069* 2.00 .019** 1.85 .043**
Average waiting time (minutes) 1536 1.00 .634 -2.50 .101 -0.09 .911 0.24 .909 -1.53 .327 0.88 .397
Prop. of patients who had any non-travel cost 1606 0.02 .768 -0.10 .115 0.01 .757 -0.04 .563 -0.05 .495 0.06 .107
Patient satisfaction score³ 1774 0.18 .278 0.02 .933 -0.16 .360 -0.04 .813 0.12 .504 -0.05 .751
Average time spent in consultation (minutes) 1795 0.42 .577 1.98 .015** -0.33 .667 -1.50 .066* 3.44 .004*** 1.13 .340
Average waiting time (minutes) 1771 -1.57 .380 -2.60 .111 -1.52 .166 -0.94 .605 -1.52 .357 -0.44 .739
Prop. of patients who had any non-travel cost 1795 -0.04 .370 -0.06 .094* -0.01 .762 -0.06 .174 -0.06 .103 -0.01 .805
CRC+PBF
Ref: Control Ref: PBF Ref: Control Ref: PBF
CQI CQI+PBF CRC Only
Ad
ult E
xit
(5)
Child
Exi
t (6
)
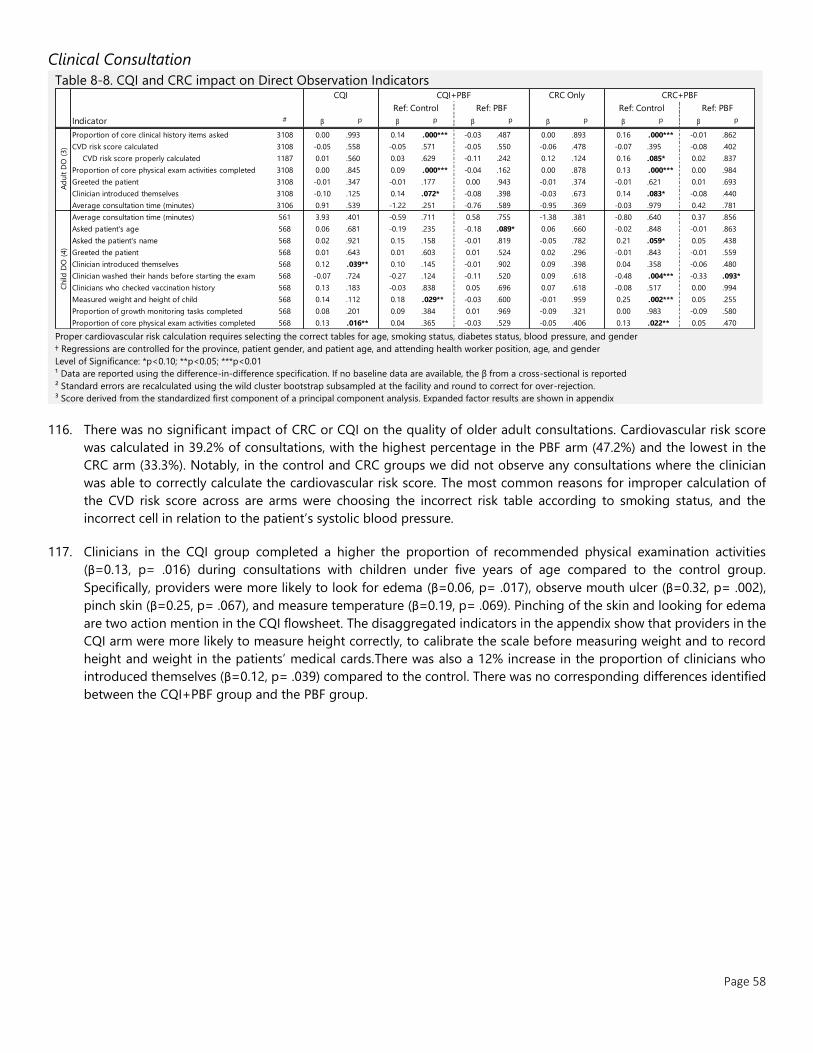
Page 58
Clinical Consultation
Table 8-8. CQI and CRC impact on Direct Observation Indicators
Proper cardiovascular risk calculation requires selecting the correct tables for age, smoking status, diabetes status, blood pressure, and gender
† Regressions are controlled for the province, patient gender, and patient age, and attending health worker position, age, and gender
Level of Significance: *p<0.10; **p<0.05; ***p<0.01
¹ Data are reported using the difference-in-difference specification. If no baseline data are available, the β from a cross-sectional is reported
² Standard errors are recalculated using the wild cluster bootstrap subsampled at the facility and round to correct for over-rejection.
³ Score derived from the standardized first component of a principal component analysis. Expanded factor results are shown in appendix
116. There was no significant impact of CRC or CQI on the quality of older adult consultations. Cardiovascular risk score
was calculated in 39.2% of consultations, with the highest percentage in the PBF arm (47.2%) and the lowest in the
CRC arm (33.3%). Notably, in the control and CRC groups we did not observe any consultations where the clinician
was able to correctly calculate the cardiovascular risk score. The most common reasons for improper calculation of
the CVD risk score across are arms were choosing the incorrect risk table according to smoking status, and the
incorrect cell in relation to the patient’s systolic blood pressure.
117. Clinicians in the CQI group completed a higher the proportion of recommended physical examination activities
(β=0.13, p= .016) during consultations with children under five years of age compared to the control group.
Specifically, providers were more likely to look for edema (β=0.06, p= .017), observe mouth ulcer (β=0.32, p= .002),
pinch skin (β=0.25, p= .067), and measure temperature (β=0.19, p= .069). Pinching of the skin and looking for edema
are two action mention in the CQI flowsheet. The disaggregated indicators in the appendix show that providers in the
CQI arm were more likely to measure height correctly, to calibrate the scale before measuring weight and to record
height and weight in the patients’ medical cards.There was also a 12% increase in the proportion of clinicians who
introduced themselves (β=0.12, p= .039) compared to the control. There was no corresponding differences identified
between the CQI+PBF group and the PBF group.
Indicator # β p β p β p β p β p β p
Proportion of core clinical history items asked 3108 0.00 .993 0.14 .000*** -0.03 .487 0.00 .893 0.16 .000*** -0.01 .862
CVD risk score calculated 3108 -0.05 .558 -0.05 .571 -0.05 .550 -0.06 .478 -0.07 .395 -0.08 .402
CVD risk score properly calculated 1187 0.01 .560 0.03 .629 -0.11 .242 0.12 .124 0.16 .085* 0.02 .837
Proportion of core physical exam activities completed 3108 0.00 .845 0.09 .000*** -0.04 .162 0.00 .878 0.13 .000*** 0.00 .984
Greeted the patient 3108 -0.01 .347 -0.01 .177 0.00 .943 -0.01 .374 -0.01 .621 0.01 .693
Clinician introduced themselves 3108 -0.10 .125 0.14 .072* -0.08 .398 -0.03 .673 0.14 .083* -0.08 .440
Average consultation time (minutes) 3106 0.91 .539 -1.22 .251 -0.76 .589 -0.95 .369 -0.03 .979 0.42 .781
Average consultation time (minutes) 561 3.93 .401 -0.59 .711 0.58 .755 -1.38 .381 -0.80 .640 0.37 .856
Asked patient's age 568 0.06 .681 -0.19 .235 -0.18 .089* 0.06 .660 -0.02 .848 -0.01 .863
Asked the patient's name 568 0.02 .921 0.15 .158 -0.01 .819 -0.05 .782 0.21 .059* 0.05 .438
Greeted the patient 568 0.01 .643 0.01 .603 0.01 .524 0.02 .296 -0.01 .843 -0.01 .559
Clinician introduced themselves 568 0.12 .039** 0.10 .145 -0.01 .902 0.09 .398 0.04 .358 -0.06 .480
Clinician washed their hands before starting the exam 568 -0.07 .724 -0.27 .124 -0.11 .520 0.09 .618 -0.48 .004*** -0.33 .093*
Clinicians who checked vaccination history 568 0.13 .183 -0.03 .838 0.05 .696 0.07 .618 -0.08 .517 0.00 .994
Measured weight and height of child 568 0.14 .112 0.18 .029** -0.03 .600 -0.01 .959 0.25 .002*** 0.05 .255
Proportion of growth monitoring tasks completed 568 0.08 .201 0.09 .384 0.01 .969 -0.09 .321 0.00 .983 -0.09 .580
Proportion of core physical exam activities completed 568 0.13 .016** 0.04 .365 -0.03 .529 -0.05 .406 0.13 .022** 0.05 .470
CRC+PBF
Ref: Control Ref: PBF Ref: Control Ref: PBF
Ad
ult D
O (
3)
Child
DO
(4)
CQI CQI+PBF CRC Only

Page 59
8.3 Household
8.3.1 Health service delivery and outcomes for older adults
Table 8-9. CQI and CRC impact on health service delivery and outcomes for older adults
Blood Pressure Rating (mmHg): Normal: <130 systolic AND <85 diastolic; High Normal: 130-140 systolic OR 85-89 diastolic; Mildly High: 140-159 systolic OR 90-99
diastolic; Moderately High: 160-179 systolic OR 100-109 diastolic; Severely High: 180+ systolic OR 110+ diastolic
† Regressions are controlled for the province, wealth index quintile, employment status, marital status, gender, and size of household
Level of Significance: *p<0.10; **p<0.05; ***p<0.01
¹ Data are reported using the difference-in-difference specification. If no baseline data are available, the β from a cross-sectional is reported
² Standard errors are recalculated using the wild cluster bootstrap subsampled at the facility and round to correct for over-rejection.
118. We do not find that CQI or CRC affected the coverage of blood pressure measurement or the prevalence of
hypertension. The proportion of older adults with clinician-diagnosed blood pressure is lower by seven percentage
points in the CQI (β=-0.07, p= .040) and CSC arms (β=-0.07, p= .042) compared to control, as well as seven percentage
points lower in the CQI+PBF group (β=-0.07, p= .030) compared to the control group. Since the intervention did not
affect measurement of blood pressure or hypertension rates, we are unable to interpret these findings.
Indicator # β p β p β p β p β p β p
BP measured by a health worker in past year 11425 0.00 .987 0.06 .030** -0.05 .146 0.00 .932 0.07 .034** -0.04 .288
BP measured at the primary care level 11629 -0.03 .562 0.12 .002*** 0.03 .452 0.00 .973 0.07 .123 -0.02 .765
Directly Observed Blood Pressure Ratings
Normal Rating 10322 -0.01 .758 -0.05 .233 0.00 .906 0.03 .462 -0.02 .731 0.04 .306
Normal 10322 -0.02 .719 -0.01 .759 0.04 .332 0.02 .552 0.02 .716 0.07 .115
High Normal 10322 0.00 .950 -0.04 .176 -0.04 .251 0.01 .730 -0.03 .281 -0.03 .381
Elevated Rating 10322 0.01 .758 0.05 .233 0.00 .906 -0.03 .462 0.02 .731 -0.04 .306
Mildly High 10322 0.01 .781 0.03 .296 -0.02 .570 0.02 .492 0.00 .939 -0.04 .135
Moderately High 10322 0.02 .431 -0.02 .497 0.01 .815 -0.06 .011** -0.02 .415 0.00 .838
Severe 10322 -0.01 .627 0.04 .131 0.01 .749 0.00 .964 0.03 .297 0.00 .869
Prop. With self-reported high BP 15440 -0.07 .040** -0.02 .507 -0.07 .030** -0.07 .042** 0.03 .460 -0.03 .484
Prescribed medication for blood pressure 3738 0.05 .165 0.07 .024** 0.01 .725 0.01 .657 0.02 .603 -0.04 .160
Taken prescribed medication in past 24 hours 3410 0.03 .664 0.01 .884 -0.07 .269 0.01 .911 0.12 .084* 0.04 .486
Recently changed behaviors to lower blood pressure 4163 0.05 .436 0.02 .764 0.05 .558 -0.02 .751 -0.11 .114 -0.09 .191
Old
er
Ad
ult
s (1
2)
Ref: Control Ref: PBF Ref: Control Ref: PBF
CQI CQI+PBF CRC Only CRC+PBF
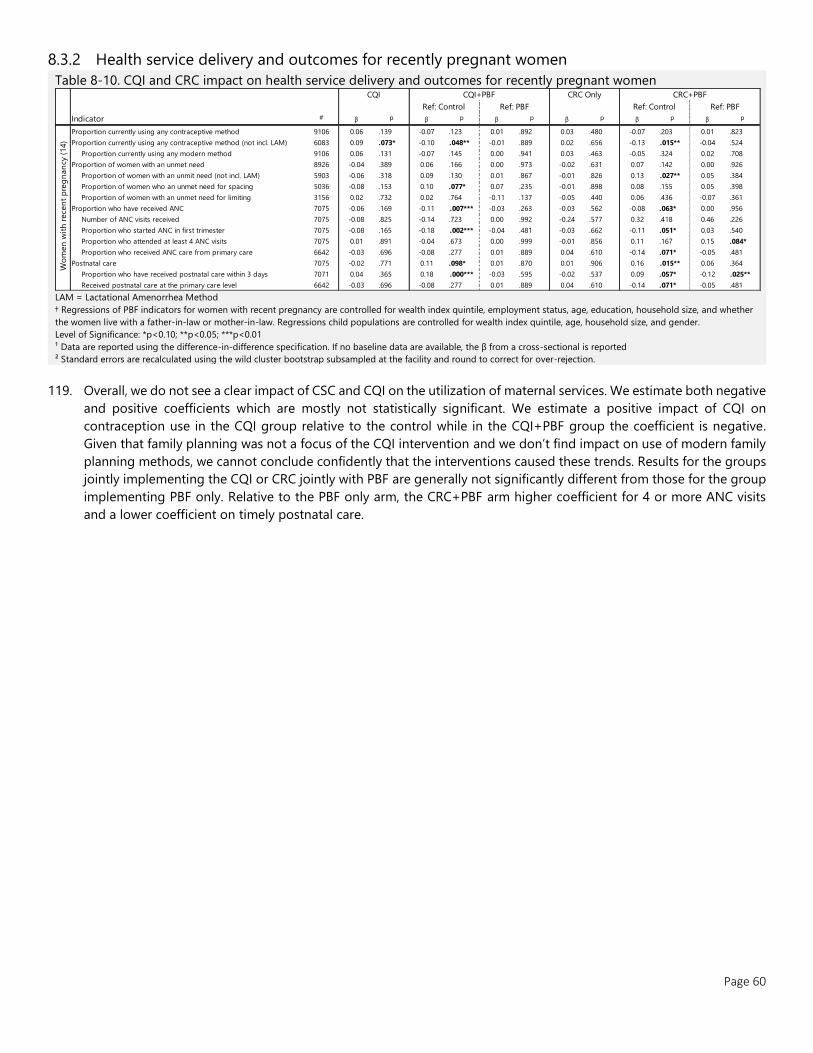
Page 60
8.3.2 Health service delivery and outcomes for recently pregnant women
Table 8-10. CQI and CRC impact on health service delivery and outcomes for recently pregnant women
LAM = Lactational Amenorrhea Method
† Regressions of PBF indicators for women with recent pregnancy are controlled for wealth index quintile, employment status, age, education, household size, and whether
the women live with a father-in-law or mother-in-law. Regressions child populations are controlled for wealth index quintile, age, household size, and gender.
Level of Significance: *p<0.10; **p<0.05; ***p<0.01
¹ Data are reported using the difference-in-difference specification. If no baseline data are available, the β from a cross-sectional is reported
² Standard errors are recalculated using the wild cluster bootstrap subsampled at the facility and round to correct for over-rejection.
119. Overall, we do not see a clear impact of CSC and CQI on the utilization of maternal services. We estimate both negative
and positive coefficients which are mostly not statistically significant. We estimate a positive impact of CQI on
contraception use in the CQI group relative to the control while in the CQI+PBF group the coefficient is negative.
Given that family planning was not a focus of the CQI intervention and we don’t find impact on use of modern family
planning methods, we cannot conclude confidently that the interventions caused these trends. Results for the groups
jointly implementing the CQI or CRC jointly with PBF are generally not significantly different from those for the group
implementing PBF only. Relative to the PBF only arm, the CRC+PBF arm higher coefficient for 4 or more ANC visits
and a lower coefficient on timely postnatal care.
Indicator # β p β p β p β p β p β p
Proportion currently using any contraceptive method 9106 0.06 .139 -0.07 .123 0.01 .892 0.03 .480 -0.07 .203 0.01 .823
Proportion currently using any contraceptive method (not incl. LAM) 6083 0.09 .073* -0.10 .048** -0.01 .889 0.02 .656 -0.13 .015** -0.04 .524
Proportion currently using any modern method 9106 0.06 .131 -0.07 .145 0.00 .941 0.03 .463 -0.05 .324 0.02 .708
Proportion of women with an unmet need 8926 -0.04 .389 0.06 .166 0.00 .973 -0.02 .631 0.07 .142 0.00 .926
Proportion of women with an unmit need (not incl. LAM) 5903 -0.06 .318 0.09 .130 0.01 .867 -0.01 .826 0.13 .027** 0.05 .384
Proportion of women who an unmet need for spacing 5036 -0.08 .153 0.10 .077* 0.07 .235 -0.01 .898 0.08 .155 0.05 .398
Proportion of women with an unmet need for limiting 3156 0.02 .732 0.02 .764 -0.11 .137 -0.05 .440 0.06 .436 -0.07 .361
Proportion who have received ANC 7075 -0.06 .169 -0.11 .007*** -0.03 .263 -0.03 .562 -0.08 .063* 0.00 .956
Number of ANC visits received 7075 -0.08 .825 -0.14 .723 0.00 .992 -0.24 .577 0.32 .418 0.46 .226
Proportion who started ANC in first trimester 7075 -0.08 .165 -0.18 .002*** -0.04 .481 -0.03 .662 -0.11 .051* 0.03 .540
Proportion who attended at least 4 ANC visits 7075 0.01 .891 -0.04 .673 0.00 .999 -0.01 .856 0.11 .167 0.15 .084*
Proportion who received ANC care from primary care 6642 -0.03 .696 -0.08 .277 0.01 .889 0.04 .610 -0.14 .071* -0.05 .481
Postnatal care 7075 -0.02 .771 0.11 .098* 0.01 .870 0.01 .906 0.16 .015** 0.06 .364
Proportion who have received postnatal care within 3 days 7071 0.04 .365 0.18 .000*** -0.03 .595 -0.02 .537 0.09 .057* -0.12 .025**
Received postnatal care at the primary care level 6642 -0.03 .696 -0.08 .277 0.01 .889 0.04 .610 -0.14 .071* -0.05 .481
Ref: Control Ref: PBF Ref: Control Ref: PBF
Wo
men
wit
h r
ece
nt
pre
gn
an
cy (
14)
CQI CQI+PBF CRC Only CRC+PBF

Page 61
8.3.3 Health service delivery and outcomes for children
Table 8-11. CQI and CRC impact on health service delivery and outcomes for children
† Regressions are controlled for the province, wealth index quintile, employment status, marital status, gender, and size of household
Level of Significance: *p<0.10; **p<0.05; ***p<0.01
¹ Data are reported using the difference-in-difference specification. If no baseline data are available, the β from a cross-sectional is reported
² Standard errors are recalculated using the wild cluster bootstrap subsampled at the facility and round to correct for over-rejection
³ Vaccination was determined from either the immunization card or reported by the mother.
⁴ Polio vaccination given at birth
⁵ Includes BCG, three doses of DPT, and three doses of OPV excluding doses given at birth
⁶ Includes BCG, three doses of DPT, one dose of MMR, and three doses of OPV excluding doses given at birth
Observation with extreme z-scores below -6 and above six are removed before analysis as they are biologically implausible
120. Children under five years of age in the CQI group were less likely to be underweight (β=-0.07, p= .010) by seven
percentage points (p = 0.010) and on average had higher weight (β=0.25, p= .116), though this was not a statistically
significant difference. We did not identify any impact of CRC on anthropometric measures, though all CQI and CRC
arms trended towards positive anthropometric outcomes. In the CQI+PBF group, there was a 10-percentage point
impact in the proportion of children aged 12-23 months who received all basic vaccinations compared to control
(β=0.10, p= .018), and 6 percentage points more than the PBF-only group though the difference was not significant
at the 10% level (β=0.06, p= .201). Children aged 12-23 months in the CQI+PBF group also had higher rates of
vaccinations for the DPT sequence compared to both control and PBF. Children aged 12-23 months in the CSC-group
had a 7% increase in receiving at least one basic vaccination compared to control (β=0.07, p= .057). The difference
was also 7% in the CSC+PBF group, 2% more than the PBF group though the difference was not significant (β=0.02,
p= .647). These improvements did not persist in children aged 24-35 months.
Indicator # β p β p β p β p β p β p
Weight-for-age
Mean Z-score 12290 0.25 .116 0.13 .382 0.03 .851 0.07 .619 0.13 .355 0.03 .840
Percentage below -2 SD 12290 -0.07 .010*** -0.04 .125 -0.03 .155 0.00 .914 -0.03 .213 -0.03 .265
Percentage below -3 SD 12290 -0.01 .607 -0.02 .192 -0.02 .278 0.01 .801 -0.01 .489 -0.01 .649
Weight-for-height
Mean Z-score 11236 0.13 .445 0.26 .144 0.11 .571 0.14 .469 0.22 .193 0.07 .696
Percentage below -2 SD 11373 -0.04 .167 -0.07 .005*** -0.03 .334 -0.03 .374 -0.04 .083* 0.00 .922
Percentage below -3 SD 11373 -0.01 .459 -0.04 .039** -0.02 .289 -0.01 .496 -0.03 .139 -0.01 .641
Height-for-age
Mean Z-score 12460 0.28 .114 -0.17 .309 -0.08 .593 0.10 .617 0.09 .632 0.18 .295
Percentage below -2 SD 12803 -0.02 .588 0.04 .236 0.02 .513 -0.01 .772 -0.01 .740 -0.03 .372
Percentage below -3 SD 12803 -0.01 .705 -0.01 .697 -0.01 .759 0.00 .912 -0.03 .376 -0.02 .386
Growth monitoring received in the past 6 months 13165 0.05 .308 -0.05 .346 -0.08 .210 0.03 .468 0.01 .873 -0.02 .756
Vaccinations for children aged 12-23 months³
Received all basic vaccinations 4281 -0.03 .536 0.10 .018** 0.06 .201 0.04 .371 0.08 .120 0.03 .516
DPT 1 3835 0.01 .727 0.04 .081* 0.05 .062* -0.01 .694 -0.01 .748 -0.01 .871
DPT 2 3551 0.00 .981 0.06 .042** 0.06 .050* -0.01 .843 -0.01 .794 -0.01 .796
DPT 3 3210 0.00 .971 0.07 .058* 0.09 .017** -0.03 .460 -0.01 .811 0.01 .765
Oral Poliovirus 0⁴ 3701 -0.03 .311 0.04 .292 -0.01 .868 0.06 .137 0.06 .150 0.01 .769
Oral Poliovirus 1 4030 -0.04 .279 0.06 .142 0.02 .667 0.05 .289 0.07 .106 0.03 .535
Oral Poliovirus 2 3664 -0.06 .166 0.07 .175 0.05 .393 0.04 .376 0.06 .192 0.05 .420
Oral Poliovirus 3 2828 -0.07 .270 0.12 .084* 0.11 .155 0.05 .469 0.09 .214 0.08 .313
Any basic vaccinations⁵ 4281 -0.01 .694 0.04 .218 -0.01 .755 0.07 .026** 0.07 .057* 0.02 .647
Vaccinations for children aged 24-35 months³
Received all basic vaccinations 2485 -0.03 .641 0.04 .623 -0.10 .129 -0.07 .369 0.00 .982 -0.14 .077*
MMR 2344 -0.05 .430 0.04 .607 -0.11 .157 -0.06 .437 0.01 .909 -0.14 .099*
Any basic vaccinations⁶ 2485 -0.06 .101 0.01 .859 -0.02 .767 -0.05 .271 0.03 .468 0.01 .834
Vaccinated at the primary care level 6142 0.03 .339 0.05 .079* -0.01 .645 0.02 .642 0.06 .059* -0.01 .760
Ch
ild
ren
(15)
CRC+PBF
Ref: Control Ref: PBF Ref: Control Ref: PBF
CQI CQI+PBF CRC Only
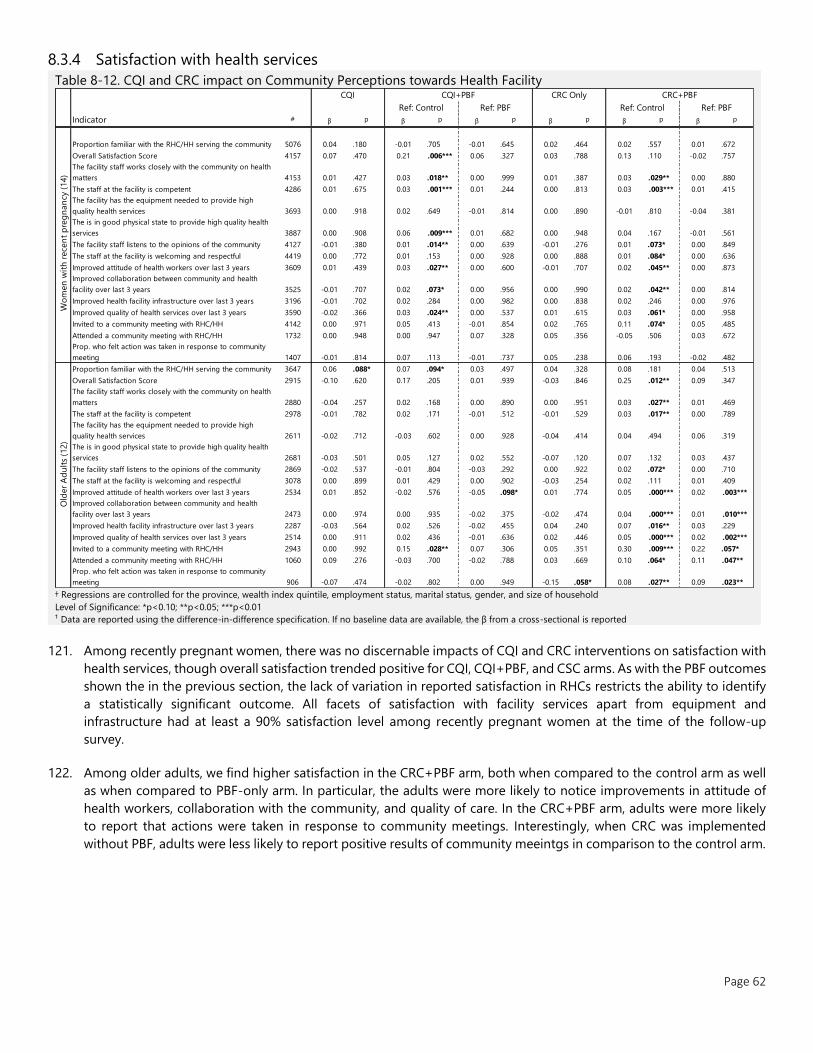
Page 62
8.3.4 Satisfaction with health services
Table 8-12. CQI and CRC impact on Community Perceptions towards Health Facility
† Regressions are controlled for the province, wealth index quintile, employment status, marital status, gender, and size of household
Level of Significance: *p<0.10; **p<0.05; ***p<0.01
¹ Data are reported using the difference-in-difference specification. If no baseline data are available, the β from a cross-sectional is reported
121. Among recently pregnant women, there was no discernable impacts of CQI and CRC interventions on satisfaction with
health services, though overall satisfaction trended positive for CQI, CQI+PBF, and CSC arms. As with the PBF outcomes
shown the in the previous section, the lack of variation in reported satisfaction in RHCs restricts the ability to identify
a statistically significant outcome. All facets of satisfaction with facility services apart from equipment and
infrastructure had at least a 90% satisfaction level among recently pregnant women at the time of the follow-up
survey.
122. Among older adults, we find higher satisfaction in the CRC+PBF arm, both when compared to the control arm as well
as when compared to PBF-only arm. In particular, the adults were more likely to notice improvements in attitude of
health workers, collaboration with the community, and quality of care. In the CRC+PBF arm, adults were more likely
to report that actions were taken in response to community meetings. Interestingly, when CRC was implemented
without PBF, adults were less likely to report positive results of community meeintgs in comparison to the control arm.
Indicator # β p β p β p β p β p β p
Proportion familiar with the RHC/HH serving the community 5076 0.04 .180 -0.01 .705 -0.01 .645 0.02 .464 0.02 .557 0.01 .672
Overall Satisfaction Score 4157 0.07 .470 0.21 .006*** 0.06 .327 0.03 .788 0.13 .110 -0.02 .757
The facility staff works closely with the community on health
matters 4153 0.01 .427 0.03 .018** 0.00 .999 0.01 .387 0.03 .029** 0.00 .880
The staff at the facility is competent 4286 0.01 .675 0.03 .001*** 0.01 .244 0.00 .813 0.03 .003*** 0.01 .415
The facility has the equipment needed to provide high
quality health services 3693 0.00 .918 0.02 .649 -0.01 .814 0.00 .890 -0.01 .810 -0.04 .381
The is in good physical state to provide high quality health
services 3887 0.00 .908 0.06 .009*** 0.01 .682 0.00 .948 0.04 .167 -0.01 .561
The facility staff listens to the opinions of the community 4127 -0.01 .380 0.01 .014** 0.00 .639 -0.01 .276 0.01 .073* 0.00 .849
The staff at the facility is welcoming and respectful 4419 0.00 .772 0.01 .153 0.00 .928 0.00 .888 0.01 .084* 0.00 .636
Improved attitude of health workers over last 3 years 3609 0.01 .439 0.03 .027** 0.00 .600 -0.01 .707 0.02 .045** 0.00 .873
Improved collaboration between community and health
facility over last 3 years 3525 -0.01 .707 0.02 .073* 0.00 .956 0.00 .990 0.02 .042** 0.00 .814
Improved health facility infrastructure over last 3 years 3196 -0.01 .702 0.02 .284 0.00 .982 0.00 .838 0.02 .246 0.00 .976
Improved quality of health services over last 3 years 3590 -0.02 .366 0.03 .024** 0.00 .537 0.01 .615 0.03 .061* 0.00 .958
Invited to a community meeting with RHC/HH 4142 0.00 .971 0.05 .413 -0.01 .854 0.02 .765 0.11 .074* 0.05 .485
Attended a community meeting with RHC/HH 1732 0.00 .948 0.00 .947 0.07 .328 0.05 .356 -0.05 .506 0.03 .672
Prop. who felt action was taken in response to community
meeting 1407 -0.01 .814 0.07 .113 -0.01 .737 0.05 .238 0.06 .193 -0.02 .482
Proportion familiar with the RHC/HH serving the community 3647 0.06 .088* 0.07 .094* 0.03 .497 0.04 .328 0.08 .181 0.04 .513
Overall Satisfaction Score 2915 -0.10 .620 0.17 .205 0.01 .939 -0.03 .846 0.25 .012** 0.09 .347
The facility staff works closely with the community on health
matters 2880 -0.04 .257 0.02 .168 0.00 .890 0.00 .951 0.03 .027** 0.01 .469
The staff at the facility is competent 2978 -0.01 .782 0.02 .171 -0.01 .512 -0.01 .529 0.03 .017** 0.00 .789
The facility has the equipment needed to provide high
quality health services 2611 -0.02 .712 -0.03 .602 0.00 .928 -0.04 .414 0.04 .494 0.06 .319
The is in good physical state to provide high quality health
services 2681 -0.03 .501 0.05 .127 0.02 .552 -0.07 .120 0.07 .132 0.03 .437
The facility staff listens to the opinions of the community 2869 -0.02 .537 -0.01 .804 -0.03 .292 0.00 .922 0.02 .072* 0.00 .710
The staff at the facility is welcoming and respectful 3078 0.00 .899 0.01 .429 0.00 .902 -0.03 .254 0.02 .111 0.01 .409
Improved attitude of health workers over last 3 years 2534 0.01 .852 -0.02 .576 -0.05 .098* 0.01 .774 0.05 .000*** 0.02 .003***
Improved collaboration between community and health
facility over last 3 years 2473 0.00 .974 0.00 .935 -0.02 .375 -0.02 .474 0.04 .000*** 0.01 .010***
Improved health facility infrastructure over last 3 years 2287 -0.03 .564 0.02 .526 -0.02 .455 0.04 .240 0.07 .016** 0.03 .229
Improved quality of health services over last 3 years 2514 0.00 .911 0.02 .436 -0.01 .636 0.02 .446 0.05 .000*** 0.02 .002***
Invited to a community meeting with RHC/HH 2943 0.00 .992 0.15 .028** 0.07 .306 0.05 .351 0.30 .009*** 0.22 .057*
Attended a community meeting with RHC/HH 1060 0.09 .276 -0.03 .700 -0.02 .788 0.03 .669 0.10 .064* 0.11 .047**
Prop. who felt action was taken in response to community
meeting 906 -0.07 .474 -0.02 .802 0.00 .949 -0.15 .058* 0.08 .027** 0.09 .023**
CRC+PBF
Ref: Control Ref: PBF Ref: Control Ref: PBF
Wo
men
wit
h r
ece
nt
pre
gn
an
cy (
14)
Old
er
Ad
ult
s (1
2)
CQI CQI+PBF CRC Only

Page 63
9 DISCUSSION
The impact evaluation shows evidence of strong impacts of the HSIP project on many dimensions of quality of care. The
PBF intervention significantly increased availability of equipment and supplies at the primary health centers. It had positive
effects on infrastructure and measures of infection prevention and control, such as availability of boxes for sharps and
needles. As a result of the program, health facilities increased the types of services they offer, especially at the health
house level. We also find positive impacts on provider competency, measured through clinical vignettes. Most importantly,
we find evidence that the improvements in structural quality and provider knowledge also translated into better content of
care. For example, providers in the PBF facilities are significantly more likely to perform key physical exams such as
measure blood pressure of adult patients and measure the height and weight of children under 5.
The PBF pilot had positive impacts on health providers. Their income increased by about two thirds thanks to performance
bonuses. In addition, providers reported higher satisfaction. Satisfaction with respect to the quantity and quality of
equipment and medicine and the physical condition of the facilities were especially impacted.
We also find suggestive evidence that the population’s perceptions of the primary health centers have improved. During
the follow-up survey, individuals living in PBF districts reported significantly higher perceived competency of providers and
that the facilities work closely with the community. Adults over 40 also reported that the collaboration between the
facilities and communities improved during the three years of project implementation.
While we find strong evidence of improved quality at the primary level and observe that the communities noticed the
change, we find more moderate impacts on utilization of health services by the community. With respect to adult health,
we find positive impact of 8 percentage points on the likelihood adults over 40 had their blood pressure measured by a
health professional in the preceding year. With respect to maternal and child health services, we find a 14 percentage-
point increase in the rate of women who received timely postnatal care. However, we do not find statistically significant
impacts on timing and number of antenatal consultations, child growth monitoring or vaccination. We also do not find an
impact on family planning coverage, but it must be stressed that our sample of recently pregnant women is not optimal
for measuring this outcome. For all targeted services, we do not find the PBF program impacting whether individuals
receive the services at the primary level, where providers received financial incentives, or at higher levels such as district
health centers or hospitals.
What drove the positive results at the facility level? First, providers might have simply responded to the financial incentives
by exerting more effort to improve quality and engage with the communities. Second, the program ensured that resources
reached the rural facilities and facilities decided how to invest the 30% of the PBF bonuses in their infrastructure. Third,
providers were better paid and more satisfied with respect to their working conditions, which might have motivated them.
Fourth, the program introduced a multi-layered system of supervision and verification. Facilities were not only monitored
more closely, but the PBF tools and the work on the action plans might have provided guidance towards better
performance. Lastly, many providers were retrained in the context of the HSIP program. Some of the improvements,
especially with respect to clinical quality, might be directly linked to these trainings.
Why do we not see stronger impacts on utilization? One explanation could be that the PBF pilot covered only primary
health facilities. While the quality of these facilities improved, they still offer a narrower package of services relative to
higher level facilities. For example, only about a fifth of RHCs offer laboratory services. Pharmacies are often located near
the higher-level facilities in areas with higher population density, which means that patient might have to anyway travel
outside their localities. About a third of our sample used higher level facilities for receiving ANC and the rate did not
significantly change between baseline and follow-up. It could be that while the quality of HHs and RHCs improved, the
choice of going to a higher-level facility is still more attractive for many. Another explanation may be that behavioral
change might take time to materialize and that with more time, utilization of the rural primary health facilities will increase.
It is important to note that for some of the indicators, the overall coverage was already high in baseline. Close to 90% of
Page 64
women received ANC and the same rate of children aged 12-23 months received all basic vaccinations. With respect to
some indicators, we find overall positive trends even if we do not find impact of the PBF pilot when we compare with the
control districts. Between the baseline and follow-up surveys, the rate of women in the control districts that received any
antenatal consultation increased from 85% to 95%. The rate of women who initiated their ANC during the first trimester
increased from 57% to 74%.
We find no evidence of negative spillovers on unincentivized services. The facility-based survey collected data on service
utilization reported in the facility registers, including on services not covered by the program such as curative care
consultations for children and adults. There is no significant impact of PBF on the volume of these services in the three
months preceding the survey. We note though that quality of data reported by the facilities might be impacted by the PBF
intervention and therefore this evidence should be interpreted as suggestive. We do find, however, a positive impact of 5
percentage points on the rate of adults over 40 who reported to receive any medical care. Adults in the PBF districts are
also more likely, by 6 percentage points, to report receiving any service at the primary level in the preceding two years.
This suggests that there might have been positive spillovers on unincentivized services.
The results from the impact evaluation of PBF in Tajikistan are overall in line with the global evidence about PBF. Indeed, in
many countries, PBF reforms have had mixed results in increasing utilization, while often leading to better results for
quality of care (see Kandpal 2017 for an overview). The quality of care impacts measured in Tajikistan are among the
strongest in the portfolio of impact evaluations because they go beyond structural quality (infrastructure and equipment)
and also include significant improvements in the content of care as measured by direct clinical observations with heath
providers more likely to perform specific examinations during the visit.
This study evaluates also the impacts of two other interventions, collaborative quality improvement and citizen report
card. We separate our discussion of these interventions from that of PBF for several reasons. First, while the PBF pilot
started in 2015, these two interventions were only introduced in the end of 2016 and therefore had less time to impact
outcomes. Second, much less resources were spent on the design, implementation and monitoring of these interventions.
Third, these interventions are narrower in scope relative to the PBF. For these reasons, a direct comparison of PBF, CRC
and CQI is not appropriate.
For the CRC intervention, we find no significant impacts when compared to the control arm. When CRC was implemented
jointly with PBF, outcomes are overall similar to those in the PBF only arm. The only difference was found with respect to
satisfaction of adults over 40. Relative to those living in the catchment areas of PBF only RHCs, the adults in the CRC+PBF
areas were more likely to report improvements with respect to the attitude of providers, collaboration between RHCs and
communities, facility infrastructure and quality of health services.
In comparison to the comparison arm, children in the CQI arm were less likely to be underweight by 7 percentage points.
Although we do not find impacts of CQI on utilization of health services and on general knowledge of providers, we do
find that providers in the CQI arm better performed growth monitoring tasks and were more likely to perform other tasks
highlighted in the CQI flowsheets such as checking for anemia and swelling and discussing child feeding. The reduction in
rate of underweight children was driven by the Khatlon region and was measured in the summer, when diarrhea is
common. These results might therefore be more related to temporary fluctuations in weight in children with diarrhea
rather than to long term underweight. Nevertheless, these results suggest that CQI is a promising low-cost intervention for
the Tajik context.
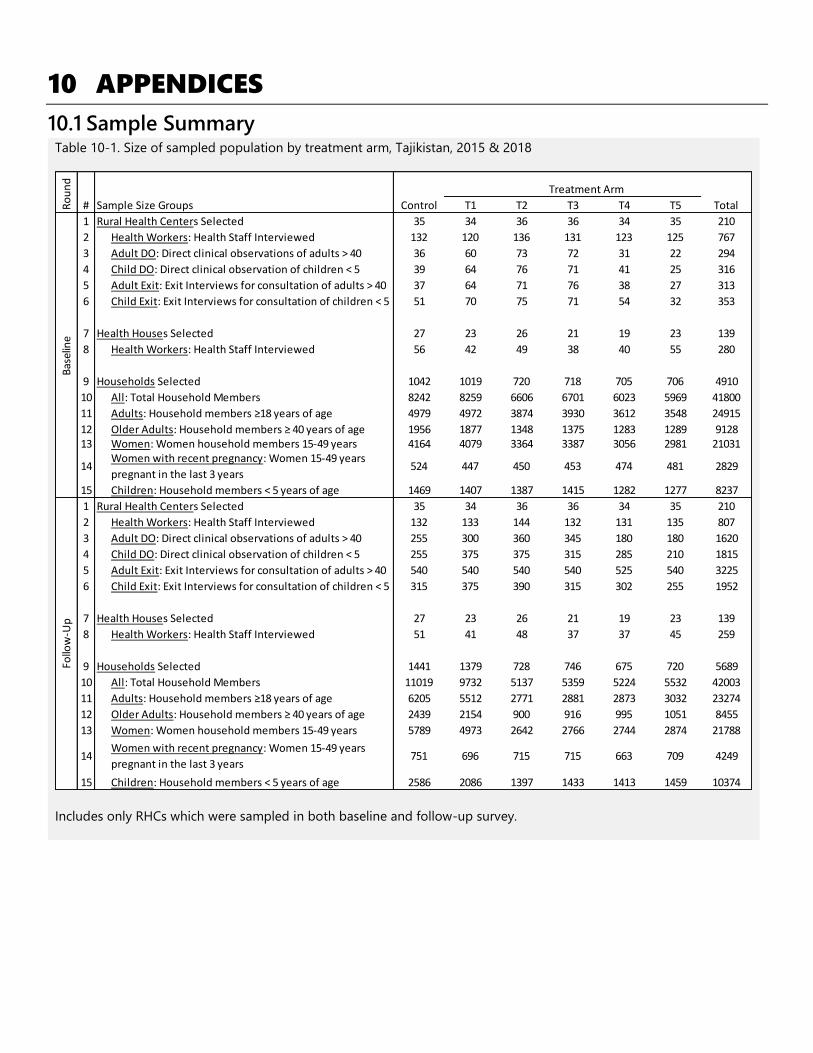
10 APPENDICES
10.1 Sample Summary Table 10-1. Size of sampled population by treatment arm, Tajikistan, 2015 & 2018
Includes only RHCs which were sampled in both baseline and follow-up survey.
Treatment Arm
Sample Size Groups Control T1 T2 T3 T4 T5 Total
1 35 34 36 36 34 35 210
2 132 120 136 131 123 125 767
3 36 60 73 72 31 22 294
4 39 64 76 71 41 25 316
5 37 64 71 76 38 27 313
6 51 70 75 71 54 32 353
7 27 23 26 21 19 23 139
8 56 42 49 38 40 55 280
9 1042 1019 720 718 705 706 4910
10 8242 8259 6606 6701 6023 5969 41800
11 4979 4972 3874 3930 3612 3548 24915
12 1956 1877 1348 1375 1283 1289 912813 4164 4079 3364 3387 3056 2981 21031
14 524 447 450 453 474 481 2829
15 1469 1407 1387 1415 1282 1277 8237
1 35 34 36 36 34 35 210
2 132 133 144 132 131 135 807
3 255 300 360 345 180 180 1620
4 255 375 375 315 285 210 1815
5 540 540 540 540 525 540 3225
6 315 375 390 315 302 255 1952
7 27 23 26 21 19 23 139
8 51 41 48 37 37 45 259
9 1441 1379 728 746 675 720 5689
10 11019 9732 5137 5359 5224 5532 42003
11 6205 5512 2771 2881 2873 3032 23274
12 2439 2154 900 916 995 1051 8455
13 5789 4973 2642 2766 2744 2874 21788
14 751 696 715 715 663 709 4249
15 2586 2086 1397 1433 1413 1459 10374
Households Selected
Follo
w-U
pB
asel
ine
Women: Women household members 15-49 years
Children: Household members < 5 years of age
Rural Health Centers Selected
Health Workers: Health Staff Interviewed
Adult DO: Direct clinical observations of adults > 40
Child DO: Direct clinical observation of children < 5
Adult Exit: Exit Interviews for consultation of adults > 40
Child Exit: Exit Interviews for consultation of children < 5
Older Adults: Household members ≥ 40 years of age
Women: Women household members 15-49 years
Ro
un
d
#
Women with recent pregnancy: Women 15-49 years
pregnant in the last 3 years
Rural Health Centers Selected
Health Workers: Health Staff Interviewed
Adult DO: Direct clinical observations of adults > 40
Child DO: Direct clinical observation of children < 5
Adult Exit: Exit Interviews for consultation of adults > 40
Child Exit: Exit Interviews for consultation of children < 5
Health Houses Selected
Health Workers: Health Staff Interviewed
All: Total Household Members
Adults: Household members ≥18 years of age
Older Adults: Household members ≥ 40 years of age
Women with recent pregnancy: Women 15-49 years
pregnant in the last 3 years
Children: Household members < 5 years of age
Health Houses Selected
Health Workers: Health Staff Interviewed
Households Selected
All: Total Household Members
Adults: Household members ≥18 years of age

Page 66
10.2 Disaggregated Indicators of PBF Impact Selected indicators in the impact tables of the main report represent the aggregation of multiple elements. Aggregation
was conducted in two ways, for elements with an underlying latent factor, survey data of multiple correlated elements
were summarized using an unrotated principal component analysis. The first component of the factor was extracted and
standardized (mean of 0 with standard deviation of 1) and assumed to summarize the overarching ‘score’ for the category
of indicators. For process indicators, we reported the crude average of elements. The following tables present the detailed
results of these analysis, including the component correlations of each element, and an element by element regression
with PBF impact.
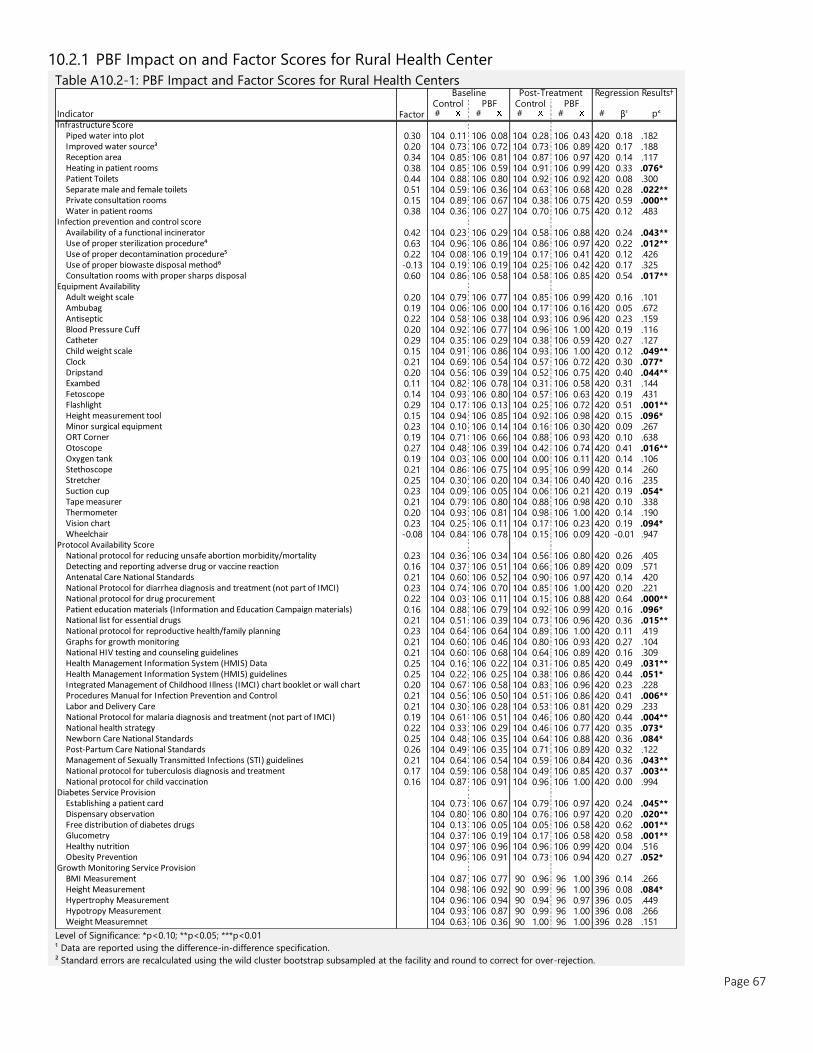
Page 67
10.2.1 PBF Impact on and Factor Scores for Rural Health Center
Table A10.2-1: PBF Impact and Factor Scores for Rural Health Centers
Level of Significance: *p<0.10; **p<0.05; ***p<0.01
¹ Data are reported using the difference-in-difference specification.
² Standard errors are recalculated using the wild cluster bootstrap subsampled at the facility and round to correct for over-rejection.
Indicator # # # # # β¹ p²
Infrastructure ScorePiped water into plot 0.30 104 0.11 106 0.08 104 0.28 106 0.43 420 0.18 .182 Improved water source³ 0.20 104 0.73 106 0.72 104 0.73 106 0.89 420 0.17 .188 Reception area 0.34 104 0.85 106 0.81 104 0.87 106 0.97 420 0.14 .117 Heating in patient rooms 0.38 104 0.85 106 0.59 104 0.91 106 0.99 420 0.33 .076* Patient Toilets 0.44 104 0.88 106 0.80 104 0.92 106 0.92 420 0.08 .300 Separate male and female toilets 0.51 104 0.59 106 0.36 104 0.63 106 0.68 420 0.28 .022** Private consultation rooms 0.15 104 0.89 106 0.67 104 0.38 106 0.75 420 0.59 .000** Water in patient rooms 0.38 104 0.36 106 0.27 104 0.70 106 0.75 420 0.12 .483
Infection prevention and control scoreAvailability of a functional incinerator 0.42 104 0.23 106 0.29 104 0.58 106 0.88 420 0.24 .043** Use of proper sterilization procedure⁴ 0.63 104 0.96 106 0.86 104 0.86 106 0.97 420 0.22 .012** Use of proper decontamination procedure⁵ 0.22 104 0.08 106 0.19 104 0.17 106 0.41 420 0.12 .426 Use of proper biowaste disposal method⁶ -0.13 104 0.19 106 0.19 104 0.25 106 0.42 420 0.17 .325 Consultation rooms with proper sharps disposal 0.60 104 0.86 106 0.58 104 0.58 106 0.85 420 0.54 .017**
Equipment AvailabilityAdult weight scale 0.20 104 0.79 106 0.77 104 0.85 106 0.99 420 0.16 .101 Ambubag 0.19 104 0.06 106 0.00 104 0.17 106 0.16 420 0.05 .672 Antiseptic 0.22 104 0.58 106 0.38 104 0.93 106 0.96 420 0.23 .159 Blood Pressure Cuff 0.20 104 0.92 106 0.77 104 0.96 106 1.00 420 0.19 .116 Catheter 0.29 104 0.35 106 0.29 104 0.38 106 0.59 420 0.27 .127 Child weight scale 0.15 104 0.91 106 0.86 104 0.93 106 1.00 420 0.12 .049** Clock 0.21 104 0.69 106 0.54 104 0.57 106 0.72 420 0.30 .077* Dripstand 0.20 104 0.56 106 0.39 104 0.52 106 0.75 420 0.40 .044** Exambed 0.11 104 0.82 106 0.78 104 0.31 106 0.58 420 0.31 .144 Fetoscope 0.14 104 0.93 106 0.80 104 0.57 106 0.63 420 0.19 .431 Flashlight 0.29 104 0.17 106 0.13 104 0.25 106 0.72 420 0.51 .001** Height measurement tool 0.15 104 0.94 106 0.85 104 0.92 106 0.98 420 0.15 .096* Minor surgical equipment 0.23 104 0.10 106 0.14 104 0.16 106 0.30 420 0.09 .267 ORT Corner 0.19 104 0.71 106 0.66 104 0.88 106 0.93 420 0.10 .638 Otoscope 0.27 104 0.48 106 0.39 104 0.42 106 0.74 420 0.41 .016** Oxygen tank 0.19 104 0.03 106 0.00 104 0.00 106 0.11 420 0.14 .106 Stethoscope 0.21 104 0.86 106 0.75 104 0.95 106 0.99 420 0.14 .260 Stretcher 0.25 104 0.30 106 0.20 104 0.34 106 0.40 420 0.16 .235 Suction cup 0.23 104 0.09 106 0.05 104 0.06 106 0.21 420 0.19 .054* Tape measurer 0.21 104 0.79 106 0.80 104 0.88 106 0.98 420 0.10 .338 Thermometer 0.20 104 0.93 106 0.81 104 0.98 106 1.00 420 0.14 .190 Vision chart 0.23 104 0.25 106 0.11 104 0.17 106 0.23 420 0.19 .094* Wheelchair -0.08 104 0.84 106 0.78 104 0.15 106 0.09 420 -0.01 .947
Protocol Availability ScoreNational protocol for reducing unsafe abortion morbidity/mortality 0.23 104 0.36 106 0.34 104 0.56 106 0.80 420 0.26 .405 Detecting and reporting adverse drug or vaccine reaction 0.16 104 0.37 106 0.51 104 0.66 106 0.89 420 0.09 .571 Antenatal Care National Standards 0.21 104 0.60 106 0.52 104 0.90 106 0.97 420 0.14 .420 National Protocol for diarrhea diagnosis and treatment (not part of IMCI) 0.23 104 0.74 106 0.70 104 0.85 106 1.00 420 0.20 .221 National protocol for drug procurement 0.22 104 0.03 106 0.11 104 0.15 106 0.88 420 0.64 .000** Patient education materials (Information and Education Campaign materials) 0.16 104 0.88 106 0.79 104 0.92 106 0.99 420 0.16 .096* National list for essential drugs 0.21 104 0.51 106 0.39 104 0.73 106 0.96 420 0.36 .015** National protocol for reproductive health/family planning 0.23 104 0.64 106 0.64 104 0.89 106 1.00 420 0.11 .419 Graphs for growth monitoring 0.21 104 0.60 106 0.46 104 0.80 106 0.93 420 0.27 .104 National HIV testing and counseling guidelines 0.21 104 0.60 106 0.68 104 0.64 106 0.89 420 0.16 .309 Health Management Information System (HMIS) Data 0.25 104 0.16 106 0.22 104 0.31 106 0.85 420 0.49 .031** Health Management Information System (HMIS) guidelines 0.25 104 0.22 106 0.25 104 0.38 106 0.86 420 0.44 .051* Integrated Management of Childhood Illness (IMCI) chart booklet or wall chart 0.20 104 0.67 106 0.58 104 0.83 106 0.96 420 0.23 .228 Procedures Manual for Infection Prevention and Control 0.21 104 0.56 106 0.50 104 0.51 106 0.86 420 0.41 .006** Labor and Delivery Care 0.21 104 0.30 106 0.28 104 0.53 106 0.81 420 0.29 .233 National Protocol for malaria diagnosis and treatment (not part of IMCI) 0.19 104 0.61 106 0.51 104 0.46 106 0.80 420 0.44 .004** National health strategy 0.22 104 0.33 106 0.29 104 0.46 106 0.77 420 0.35 .073* Newborn Care National Standards 0.25 104 0.48 106 0.35 104 0.64 106 0.88 420 0.36 .084* Post-Partum Care National Standards 0.26 104 0.49 106 0.35 104 0.71 106 0.89 420 0.32 .122 Management of Sexually Transmitted Infections (STI) guidelines 0.21 104 0.64 106 0.54 104 0.59 106 0.84 420 0.36 .043** National protocol for tuberculosis diagnosis and treatment 0.17 104 0.59 106 0.58 104 0.49 106 0.85 420 0.37 .003** National protocol for child vaccination 0.16 104 0.87 106 0.91 104 0.96 106 1.00 420 0.00 .994
Diabetes Service ProvisionEstablishing a patient card 104 0.73 106 0.67 104 0.79 106 0.97 420 0.24 .045** Dispensary observation 104 0.80 106 0.80 104 0.76 106 0.97 420 0.20 .020** Free distribution of diabetes drugs 104 0.13 106 0.05 104 0.05 106 0.58 420 0.62 .001** Glucometry 104 0.37 106 0.19 104 0.17 106 0.58 420 0.58 .001** Healthy nutrition 104 0.97 106 0.96 104 0.96 106 0.99 420 0.04 .516 Obesity Prevention 104 0.96 106 0.91 104 0.73 106 0.94 420 0.27 .052*
Growth Monitoring Service ProvisionBMI Measurement 104 0.87 106 0.77 90 0.96 96 1.00 396 0.14 .266 Height Measurement 104 0.98 106 0.92 90 0.99 96 1.00 396 0.08 .084* Hypertrophy Measurement 104 0.96 106 0.94 90 0.94 96 0.97 396 0.05 .449 Hypotropy Measurement 104 0.93 106 0.87 90 0.99 96 1.00 396 0.08 .266 Weight Measuremnet 104 0.63 106 0.36 90 1.00 96 1.00 396 0.28 .151
Regression Results†
Factor
Baseline Post-TreatmentControl PBF Control PBF

Page 68
10.2.2 PBF Impact on Disaggregated Indicators for Health Houses
Table A10.2-2: PBF Impact and Factor Scores for Health Houses
Level of Significance: *p<0.10; **p<0.05; ***p<0.01
¹ Data are reported using the difference-in-difference specification.
² Standard errors are recalculated using the wild cluster bootstrap subsampled at the facility and round to correct for over-rejection.
Indicator # # # # # β¹ p²
Infrastructure Score
Piped water into plot 0.32 69 0.01 70 0.03 69 0.17 70 0.27 278 0.08 .439
Improved water source³ 0.10 69 0.51 70 0.70 69 0.78 70 0.74 278 -0.23 .131
Reception area 0.30 69 0.64 70 0.71 69 0.71 70 0.91 278 0.13 .241
Heating in patient rooms 0.41 69 0.67 70 0.49 69 0.84 70 0.97 278 0.31 .004**
Patient Toilets 0.47 69 0.45 70 0.41 69 0.54 70 0.74 278 0.24 .184
Separate male and female toilets 0.44 69 0.14 70 0.10 69 0.13 70 0.20 278 0.11 .127
Private consultation rooms 0.22 69 0.55 70 0.40 69 0.23 70 0.33 278 0.25 .073*
Water in patient rooms 0.40 69 0.19 70 0.21 69 0.52 70 0.64 278 0.10 .565
Infection prevention and control score
Consultation rooms with proper sharps disposal -0.09 69 0.12 70 0.09 69 0.52 70 0.79 278 0.29 .142
Availability of a functional incinerator 0.64 69 0.72 70 0.87 69 0.74 70 0.84 278 -0.04 .716
Use of proper sterilization procedure⁴ -0.40 69 0.00 70 0.09 69 0.06 70 0.16 278 0.01 .890
Use of proper biowaste disposal method⁶ 0.64 69 0.70 70 0.57 69 0.48 70 0.66 278 0.30 .129
Use of proper decontamination procedure⁵ -0.05 69 0.17 70 0.23 69 0.42 70 0.37 278 -0.10 .734
Equipment Availability Score
Adult weight scale 0.30 69 0.51 70 0.41 69 0.55 70 0.96 278 0.50 .005**
Ambubag 0.14 69 0.00 70 0.00 69 0.06 70 0.10 278 0.04 .524
Antiseptic 0.29 69 0.45 70 0.23 69 0.86 70 0.96 278 0.32 .055*
Blood Pressure Cuff 0.28 69 0.90 70 0.73 69 0.97 70 1.00 278 0.20 .133
Catheter 0.23 69 0.10 70 0.13 69 0.17 70 0.24 278 0.04 .598
Child weight scale 0.29 69 0.71 70 0.61 69 0.81 70 0.99 278 0.27 .013**
Clock 0.18 69 0.30 70 0.30 69 0.25 70 0.50 278 0.26 .116
Dripstand 0.21 69 0.14 70 0.19 69 0.22 70 0.56 278 0.30 .126
Exambed -0.03 69 0.67 70 0.70 69 0.03 70 0.20 278 0.14 .237
Fetoscope 0.05 69 0.88 70 0.81 69 0.52 70 0.50 278 0.05 .807
Flashlight 0.28 69 0.01 70 0.07 69 0.12 70 0.56 278 0.38 .000**
Height measurement tool 0.26 69 0.72 70 0.70 69 0.70 70 0.97 278 0.30 .012**
Minor surgical equipment 0.05 69 0.01 70 0.01 69 0.00 70 0.04 278 0.04 .187
ORT Corner 0.24 69 0.17 70 0.37 69 0.51 70 0.83 278 0.12 .360
Otoscope 0.10 69 0.03 70 0.09 69 0.01 70 0.11 278 0.04 .432
Oxygen tank 0.14 69 0.00 70 0.00 69 0.00 70 0.04 278 0.04 .156
Stethoscope 0.31 69 0.70 70 0.56 69 0.87 70 0.99 278 0.25 .102
Stretcher 0.11 69 0.04 70 0.03 69 0.06 70 0.10 278 0.06 .223
Suction cup 0.13 69 0.00 70 0.00 69 0.01 70 0.03 278 0.01 .539
Tape measurer 0.27 69 0.68 70 0.69 69 0.75 70 0.94 278 0.18 .253
Thermometer 0.27 69 0.90 70 0.83 69 0.99 70 1.00 278 0.08 .417
Vision chart 0.09 69 0.01 70 0.01 69 0.04 70 0.04 278 0.00 .991
Wheelchair -0.02 69 0.33 70 0.36 69 0.06 70 0.04 278 -0.04 .783
Protocol Availability Score
National protocol for reducing unsafe abortion morbidity/mortality 0.22 69 0.12 70 0.14 69 0.38 70 0.66 278 0.25 .159
Detecting and reporting adverse drug or vaccine reaction 0.19 69 0.22 70 0.27 69 0.52 70 0.86 278 0.28 .064*
Antenatal Care National Standards 0.22 69 0.28 70 0.36 69 0.71 70 0.91 278 0.12 .279
National Protocol for diarrhea diagnosis and treatment 0.24 69 0.42 70 0.41 69 0.55 70 0.91 278 0.37 .063*
National protocol for drug procurement 0.22 69 0.00 70 0.07 69 0.14 70 0.89 278 0.67 .000** Patient education materials (Information and Education Campaign
materials) 0.15 69 0.65 70 0.70 69 0.86 70 0.91 278 0.01 .941
National list for essential drugs 0.20 69 0.23 70 0.21 69 0.43 70 0.90 278 0.48 .003**
National protocol for reproductive health/family planning 0.24 69 0.35 70 0.37 69 0.67 70 0.96 278 0.27 .186
Graphs for growth monitoring 0.22 69 0.30 70 0.33 69 0.54 70 0.87 278 0.31 .041**
National HIV testing and counseling guidelines 0.18 69 0.32 70 0.51 69 0.38 70 0.64 278 0.07 .722
Health Management Information System (HMIS) Data 0.25 69 0.04 70 0.16 69 0.19 70 0.63 278 0.33 .058*
Health Management Information System (HMIS) guidelines 0.25 69 0.06 70 0.20 69 0.20 70 0.73 278 0.38 .053*
Integrated Management of Childhood Illness 0.20 69 0.49 70 0.46 69 0.74 70 0.87 278 0.17 .470
Procedures Manual for Infection Prevention and Control 0.21 69 0.36 70 0.31 69 0.28 70 0.74 278 0.52 .006**
Labor and Delivery Care 0.22 69 0.06 70 0.23 69 0.42 70 0.63 278 0.04 .872
National Protocol for malaria diagnosis and treatment 0.18 69 0.33 70 0.31 69 0.20 70 0.57 278 0.39 .016**
National health strategy 0.21 69 0.12 70 0.09 69 0.28 70 0.56 278 0.31 .156
Newborn Care National Standards 0.24 69 0.17 70 0.27 69 0.39 70 0.71 278 0.23 .323
Post-Partum Care National Standards 0.24 69 0.26 70 0.30 69 0.38 70 0.70 278 0.28 .234
Management of Sexually Transmitted Infections (STI) guidelines 0.22 69 0.32 70 0.36 69 0.35 70 0.66 278 0.27 .209
National protocol for tuberculosis diagnosis and treatment 0.18 69 0.36 70 0.26 69 0.23 70 0.59 278 0.46 .030**
National protocol for child vaccination 0.19 69 0.61 70 0.71 69 0.78 70 0.99 278 0.10 .454
Diabetes Service Provision
Establishing a patient card 69 0.41 70 0.27 69 0.52 70 0.96 278 0.57 .015**
Dispensary observation 69 0.48 70 0.53 69 0.52 70 0.86 278 0.29 .030**
Free distribution of diabetes drugs 69 0.01 70 0.06 69 0.00 70 0.23 278 0.19 .036**
Glucometry 69 0.00 70 0.00 69 0.03 70 0.09 278 0.06 .176
Healthy nutrition 69 0.74 70 0.81 69 0.96 70 1.00 278 -0.03 .815
Obesity Prevention 69 0.70 70 0.69 69 0.64 70 0.83 278 0.20 .273
Growth Monitoring Service Provision
BMI Measurement 69 0.57 70 0.44 69 0.65 70 0.90 278 0.37 .012**
Height Measurement 69 0.88 70 0.79 69 0.88 70 1.00 278 0.21 .022**
Hypertrophy Measurement 69 0.78 70 0.80 69 0.71 70 0.97 278 0.24 .113
Hypotropy Measurement 69 0.71 70 0.76 69 0.78 70 0.97 278 0.14 .307
Weight Measuremnet 69 0.29 70 0.31 69 0.70 70 0.94 278 0.22 .235
Factor
Baseline Post-Treatment Regression
Control PBF Control PBF
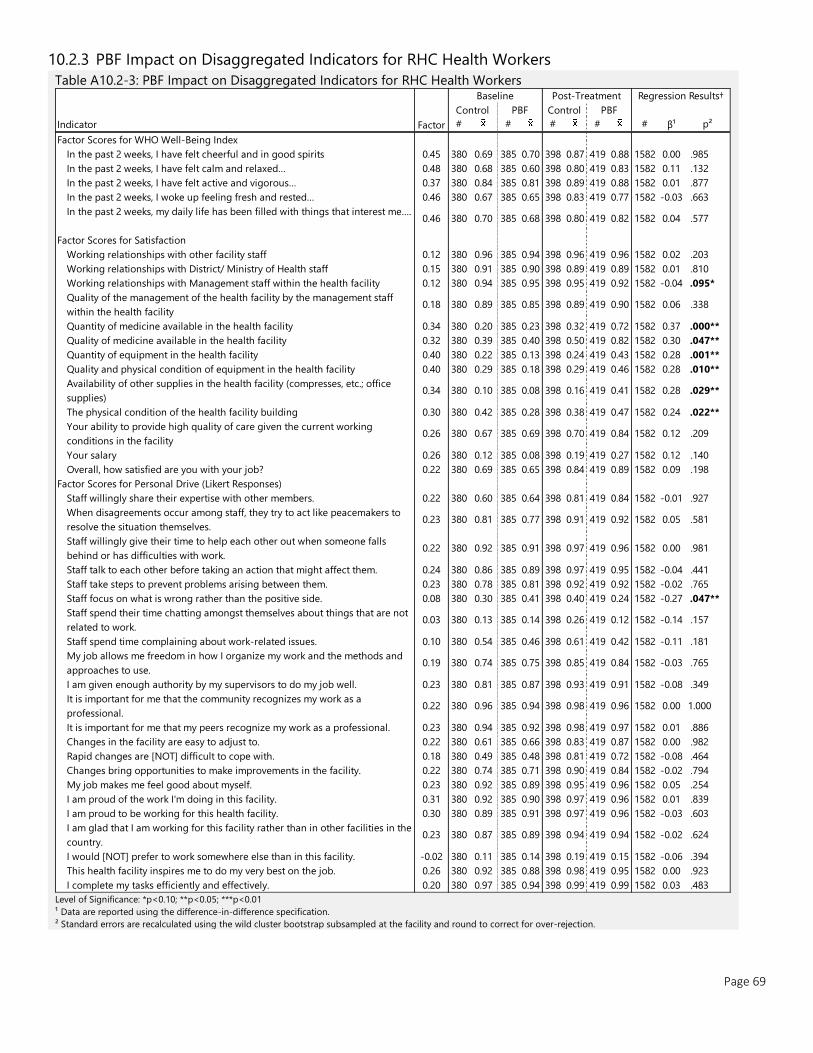
Page 69
10.2.3 PBF Impact on Disaggregated Indicators for RHC Health Workers
Table A10.2-3: PBF Impact on Disaggregated Indicators for RHC Health Workers
Level of Significance: *p<0.10; **p<0.05; ***p<0.01
¹ Data are reported using the difference-in-difference specification.
² Standard errors are recalculated using the wild cluster bootstrap subsampled at the facility and round to correct for over-rejection.
Indicator # # # # # β¹ p²
Factor Scores for WHO Well-Being Index
In the past 2 weeks, I have felt cheerful and in good spirits 0.45 380 0.69 385 0.70 398 0.87 419 0.88 1582 0.00 .985
In the past 2 weeks, I have felt calm and relaxed… 0.48 380 0.68 385 0.60 398 0.80 419 0.83 1582 0.11 .132
In the past 2 weeks, I have felt active and vigorous… 0.37 380 0.84 385 0.81 398 0.89 419 0.88 1582 0.01 .877
In the past 2 weeks, I woke up feeling fresh and rested… 0.46 380 0.67 385 0.65 398 0.83 419 0.77 1582 -0.03 .663
In the past 2 weeks, my daily life has been filled with things that interest me….0.46 380 0.70 385 0.68 398 0.80 419 0.82 1582 0.04 .577
Factor Scores for Satisfaction
Working relationships with other facility staff 0.12 380 0.96 385 0.94 398 0.96 419 0.96 1582 0.02 .203
Working relationships with District/ Ministry of Health staff 0.15 380 0.91 385 0.90 398 0.89 419 0.89 1582 0.01 .810
Working relationships with Management staff within the health facility 0.12 380 0.94 385 0.95 398 0.95 419 0.92 1582 -0.04 .095*
Quality of the management of the health facility by the management staff
within the health facility0.18 380 0.89 385 0.85 398 0.89 419 0.90 1582 0.06 .338
Quantity of medicine available in the health facility 0.34 380 0.20 385 0.23 398 0.32 419 0.72 1582 0.37 .000**
Quality of medicine available in the health facility 0.32 380 0.39 385 0.40 398 0.50 419 0.82 1582 0.30 .047**
Quantity of equipment in the health facility 0.40 380 0.22 385 0.13 398 0.24 419 0.43 1582 0.28 .001**
Quality and physical condition of equipment in the health facility 0.40 380 0.29 385 0.18 398 0.29 419 0.46 1582 0.28 .010**
Availability of other supplies in the health facility (compresses, etc.; office
supplies)0.34 380 0.10 385 0.08 398 0.16 419 0.41 1582 0.28 .029**
The physical condition of the health facility building 0.30 380 0.42 385 0.28 398 0.38 419 0.47 1582 0.24 .022**
Your ability to provide high quality of care given the current working
conditions in the facility0.26 380 0.67 385 0.69 398 0.70 419 0.84 1582 0.12 .209
Your salary 0.26 380 0.12 385 0.08 398 0.19 419 0.27 1582 0.12 .140
Overall, how satisfied are you with your job? 0.22 380 0.69 385 0.65 398 0.84 419 0.89 1582 0.09 .198
Factor Scores for Personal Drive (Likert Responses)
Staff willingly share their expertise with other members. 0.22 380 0.60 385 0.64 398 0.81 419 0.84 1582 -0.01 .927
When disagreements occur among staff, they try to act like peacemakers to
resolve the situation themselves.0.23 380 0.81 385 0.77 398 0.91 419 0.92 1582 0.05 .581
Staff willingly give their time to help each other out when someone falls
behind or has difficulties with work.0.22 380 0.92 385 0.91 398 0.97 419 0.96 1582 0.00 .981
Staff talk to each other before taking an action that might affect them. 0.24 380 0.86 385 0.89 398 0.97 419 0.95 1582 -0.04 .441
Staff take steps to prevent problems arising between them. 0.23 380 0.78 385 0.81 398 0.92 419 0.92 1582 -0.02 .765
Staff focus on what is wrong rather than the positive side. 0.08 380 0.30 385 0.41 398 0.40 419 0.24 1582 -0.27 .047**
Staff spend their time chatting amongst themselves about things that are not
related to work.0.03 380 0.13 385 0.14 398 0.26 419 0.12 1582 -0.14 .157
Staff spend time complaining about work-related issues. 0.10 380 0.54 385 0.46 398 0.61 419 0.42 1582 -0.11 .181
My job allows me freedom in how I organize my work and the methods and
approaches to use.0.19 380 0.74 385 0.75 398 0.85 419 0.84 1582 -0.03 .765
I am given enough authority by my supervisors to do my job well. 0.23 380 0.81 385 0.87 398 0.93 419 0.91 1582 -0.08 .349
It is important for me that the community recognizes my work as a
professional.0.22 380 0.96 385 0.94 398 0.98 419 0.96 1582 0.00 1.000
It is important for me that my peers recognize my work as a professional. 0.23 380 0.94 385 0.92 398 0.98 419 0.97 1582 0.01 .886
Changes in the facility are easy to adjust to. 0.22 380 0.61 385 0.66 398 0.83 419 0.87 1582 0.00 .982
Rapid changes are [NOT] difficult to cope with. 0.18 380 0.49 385 0.48 398 0.81 419 0.72 1582 -0.08 .464
Changes bring opportunities to make improvements in the facility. 0.22 380 0.74 385 0.71 398 0.90 419 0.84 1582 -0.02 .794
My job makes me feel good about myself. 0.23 380 0.92 385 0.89 398 0.95 419 0.96 1582 0.05 .254
I am proud of the work I'm doing in this facility. 0.31 380 0.92 385 0.90 398 0.97 419 0.96 1582 0.01 .839
I am proud to be working for this health facility. 0.30 380 0.89 385 0.91 398 0.97 419 0.96 1582 -0.03 .603
I am glad that I am working for this facility rather than in other facilities in the
country.0.23 380 0.87 385 0.89 398 0.94 419 0.94 1582 -0.02 .624
I would [NOT] prefer to work somewhere else than in this facility. -0.02 380 0.11 385 0.14 398 0.19 419 0.15 1582 -0.06 .394
This health facility inspires me to do my very best on the job. 0.26 380 0.92 385 0.88 398 0.98 419 0.95 1582 0.00 .923
I complete my tasks efficiently and effectively. 0.20 380 0.97 385 0.94 398 0.99 419 0.99 1582 0.03 .483
Factor
Baseline Post-Treatment Regression Results†
Control PBF Control PBF
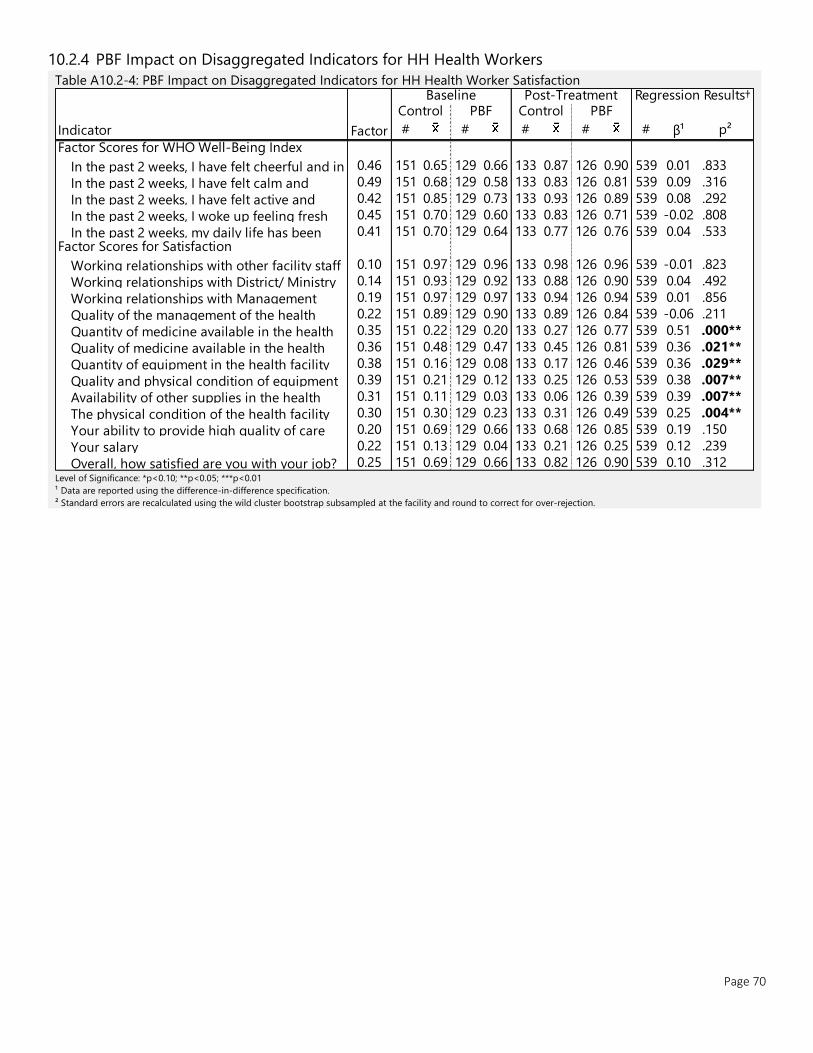
Page 70
10.2.4 PBF Impact on Disaggregated Indicators for HH Health Workers
Table A10.2-4: PBF Impact on Disaggregated Indicators for HH Health Worker Satisfaction
Level of Significance: *p<0.10; **p<0.05; ***p<0.01
¹ Data are reported using the difference-in-difference specification.
² Standard errors are recalculated using the wild cluster bootstrap subsampled at the facility and round to correct for over-rejection.
Indicator # # # # # β¹ p²
Factor Scores for WHO Well-Being Index
In the past 2 weeks, I have felt cheerful and in 0.46 151 0.65 129 0.66 133 0.87 126 0.90 539 0.01 .833
In the past 2 weeks, I have felt calm and 0.49 151 0.68 129 0.58 133 0.83 126 0.81 539 0.09 .316
In the past 2 weeks, I have felt active and 0.42 151 0.85 129 0.73 133 0.93 126 0.89 539 0.08 .292
In the past 2 weeks, I woke up feeling fresh 0.45 151 0.70 129 0.60 133 0.83 126 0.71 539 -0.02 .808
In the past 2 weeks, my daily life has been 0.41 151 0.70 129 0.64 133 0.77 126 0.76 539 0.04 .533 Factor Scores for Satisfaction
Working relationships with other facility staff 0.10 151 0.97 129 0.96 133 0.98 126 0.96 539 -0.01 .823
Working relationships with District/ Ministry 0.14 151 0.93 129 0.92 133 0.88 126 0.90 539 0.04 .492
Working relationships with Management 0.19 151 0.97 129 0.97 133 0.94 126 0.94 539 0.01 .856
Quality of the management of the health 0.22 151 0.89 129 0.90 133 0.89 126 0.84 539 -0.06 .211
Quantity of medicine available in the health 0.35 151 0.22 129 0.20 133 0.27 126 0.77 539 0.51 .000**
Quality of medicine available in the health 0.36 151 0.48 129 0.47 133 0.45 126 0.81 539 0.36 .021**
Quantity of equipment in the health facility 0.38 151 0.16 129 0.08 133 0.17 126 0.46 539 0.36 .029**
Quality and physical condition of equipment 0.39 151 0.21 129 0.12 133 0.25 126 0.53 539 0.38 .007**
Availability of other supplies in the health 0.31 151 0.11 129 0.03 133 0.06 126 0.39 539 0.39 .007**
The physical condition of the health facility 0.30 151 0.30 129 0.23 133 0.31 126 0.49 539 0.25 .004**
Your ability to provide high quality of care 0.20 151 0.69 129 0.66 133 0.68 126 0.85 539 0.19 .150
Your salary 0.22 151 0.13 129 0.04 133 0.21 126 0.25 539 0.12 .239
Overall, how satisfied are you with your job? 0.25 151 0.69 129 0.66 133 0.82 126 0.90 539 0.10 .312
Factor
Baseline Post-Treatment Regression Results† Control PBF Control PBF
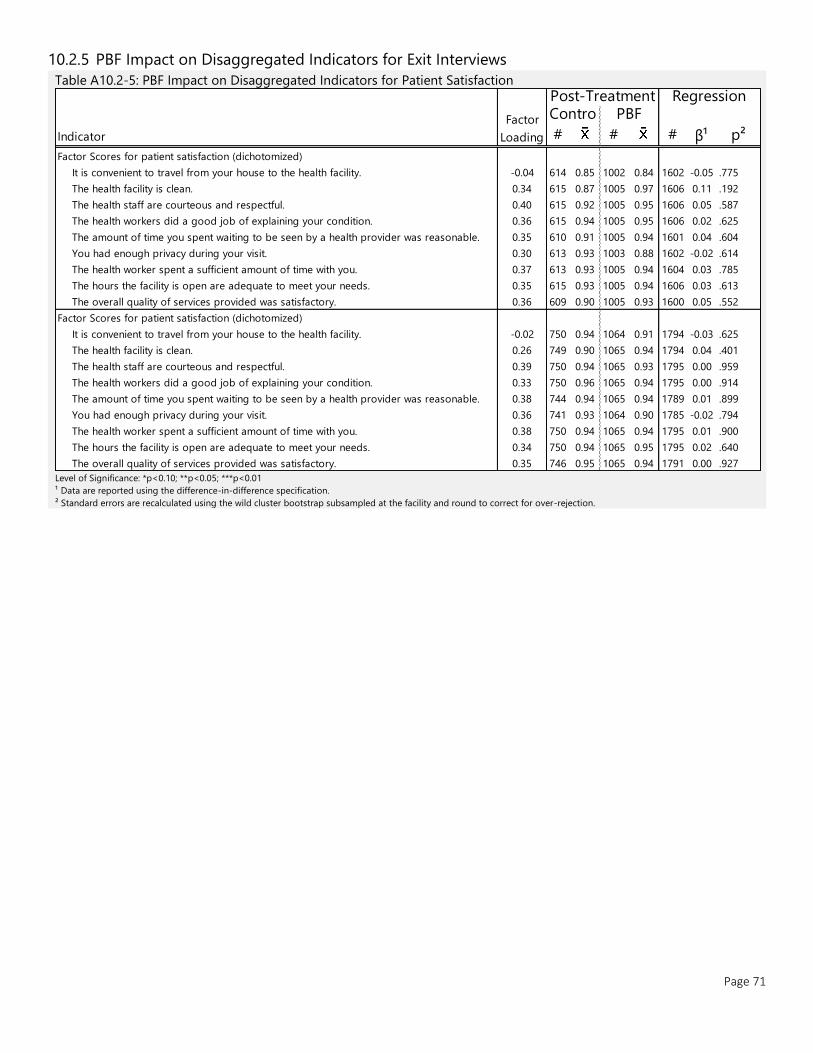
Page 71
10.2.5 PBF Impact on Disaggregated Indicators for Exit Interviews
Table A10.2-5: PBF Impact on Disaggregated Indicators for Patient Satisfaction
Level of Significance: *p<0.10; **p<0.05; ***p<0.01
¹ Data are reported using the difference-in-difference specification.
² Standard errors are recalculated using the wild cluster bootstrap subsampled at the facility and round to correct for over-rejection.
Indicator # # # β¹ p²
Factor Scores for patient satisfaction (dichotomized)
It is convenient to travel from your house to the health facility. -0.04 614 0.85 1002 0.84 1602 -0.05 .775
The health facility is clean. 0.34 615 0.87 1005 0.97 1606 0.11 .192
The health staff are courteous and respectful. 0.40 615 0.92 1005 0.95 1606 0.05 .587
The health workers did a good job of explaining your condition. 0.36 615 0.94 1005 0.95 1606 0.02 .625
The amount of time you spent waiting to be seen by a health provider was reasonable. 0.35 610 0.91 1005 0.94 1601 0.04 .604
You had enough privacy during your visit. 0.30 613 0.93 1003 0.88 1602 -0.02 .614
The health worker spent a sufficient amount of time with you. 0.37 613 0.93 1005 0.94 1604 0.03 .785
The hours the facility is open are adequate to meet your needs. 0.35 615 0.93 1005 0.94 1606 0.03 .613
The overall quality of services provided was satisfactory. 0.36 609 0.90 1005 0.93 1600 0.05 .552
Factor Scores for patient satisfaction (dichotomized)
It is convenient to travel from your house to the health facility. -0.02 750 0.94 1064 0.91 1794 -0.03 .625
The health facility is clean. 0.26 749 0.90 1065 0.94 1794 0.04 .401
The health staff are courteous and respectful. 0.39 750 0.94 1065 0.93 1795 0.00 .959
The health workers did a good job of explaining your condition. 0.33 750 0.96 1065 0.94 1795 0.00 .914
The amount of time you spent waiting to be seen by a health provider was reasonable. 0.38 744 0.94 1065 0.94 1789 0.01 .899
You had enough privacy during your visit. 0.36 741 0.93 1064 0.90 1785 -0.02 .794
The health worker spent a sufficient amount of time with you. 0.38 750 0.94 1065 0.94 1795 0.01 .900
The hours the facility is open are adequate to meet your needs. 0.34 750 0.94 1065 0.95 1795 0.02 .640
The overall quality of services provided was satisfactory. 0.35 746 0.95 1065 0.94 1791 0.00 .927
Factor
Loading
Post-Treatment Regression Contro PBF
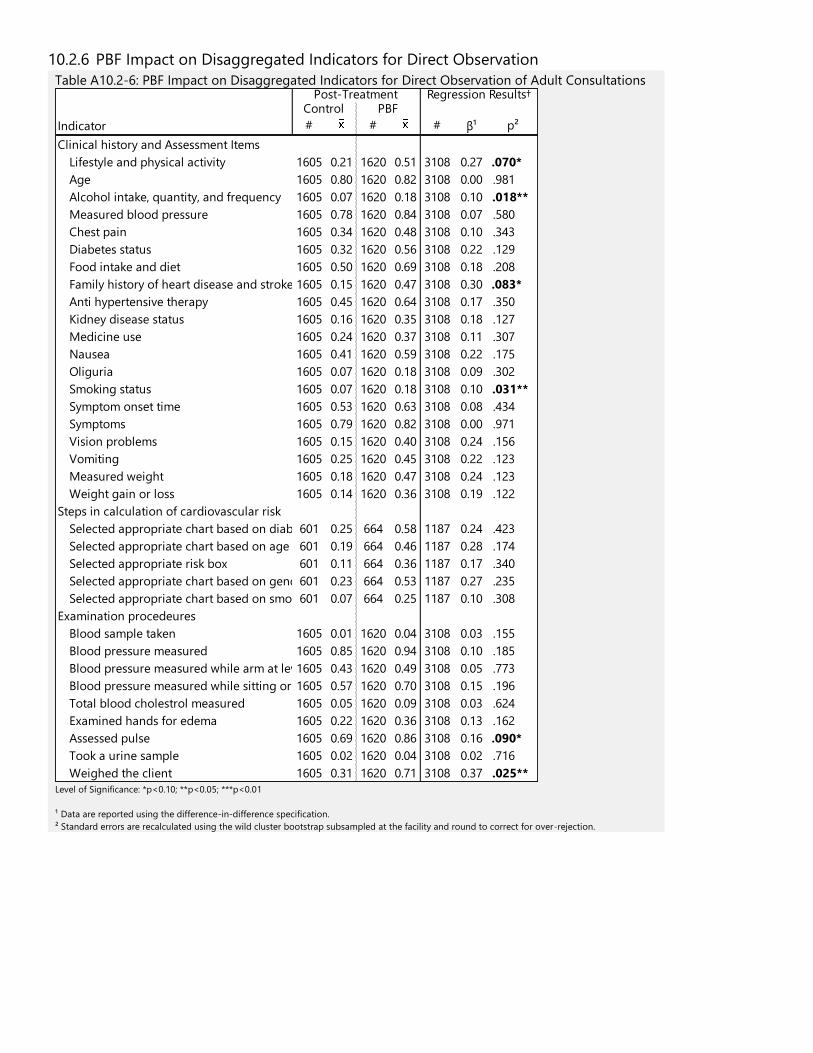
10.2.6 PBF Impact on Disaggregated Indicators for Direct Observation
Table A10.2-6: PBF Impact on Disaggregated Indicators for Direct Observation of Adult Consultations
Level of Significance: *p<0.10; **p<0.05; ***p<0.01
¹ Data are reported using the difference-in-difference specification.
² Standard errors are recalculated using the wild cluster bootstrap subsampled at the facility and round to correct for over-rejection.
Indicator # # # β¹ p²
Clinical history and Assessment Items
Lifestyle and physical activity 1605 0.21 1620 0.51 3108 0.27 .070*
Age 1605 0.80 1620 0.82 3108 0.00 .981
Alcohol intake, quantity, and frequency 1605 0.07 1620 0.18 3108 0.10 .018**
Measured blood pressure 1605 0.78 1620 0.84 3108 0.07 .580
Chest pain 1605 0.34 1620 0.48 3108 0.10 .343
Diabetes status 1605 0.32 1620 0.56 3108 0.22 .129
Food intake and diet 1605 0.50 1620 0.69 3108 0.18 .208
Family history of heart disease and stroke 1605 0.15 1620 0.47 3108 0.30 .083*
Anti hypertensive therapy 1605 0.45 1620 0.64 3108 0.17 .350
Kidney disease status 1605 0.16 1620 0.35 3108 0.18 .127
Medicine use 1605 0.24 1620 0.37 3108 0.11 .307
Nausea 1605 0.41 1620 0.59 3108 0.22 .175
Oliguria 1605 0.07 1620 0.18 3108 0.09 .302
Smoking status 1605 0.07 1620 0.18 3108 0.10 .031**
Symptom onset time 1605 0.53 1620 0.63 3108 0.08 .434
Symptoms 1605 0.79 1620 0.82 3108 0.00 .971
Vision problems 1605 0.15 1620 0.40 3108 0.24 .156
Vomiting 1605 0.25 1620 0.45 3108 0.22 .123
Measured weight 1605 0.18 1620 0.47 3108 0.24 .123
Weight gain or loss 1605 0.14 1620 0.36 3108 0.19 .122
Steps in calculation of cardiovascular risk
Selected appropriate chart based on diabetes601 0.25 664 0.58 1187 0.24 .423
Selected appropriate chart based on age 601 0.19 664 0.46 1187 0.28 .174
Selected appropriate risk box 601 0.11 664 0.36 1187 0.17 .340
Selected appropriate chart based on gender601 0.23 664 0.53 1187 0.27 .235
Selected appropriate chart based on smoking status601 0.07 664 0.25 1187 0.10 .308
Examination procedeures
Blood sample taken 1605 0.01 1620 0.04 3108 0.03 .155
Blood pressure measured 1605 0.85 1620 0.94 3108 0.10 .185
Blood pressure measured while arm at level with heart1605 0.43 1620 0.49 3108 0.05 .773
Blood pressure measured while sitting or lateral position1605 0.57 1620 0.70 3108 0.15 .196
Total blood cholestrol measured 1605 0.05 1620 0.09 3108 0.03 .624
Examined hands for edema 1605 0.22 1620 0.36 3108 0.13 .162
Assessed pulse 1605 0.69 1620 0.86 3108 0.16 .090*
Took a urine sample 1605 0.02 1620 0.04 3108 0.02 .716
Weighed the client 1605 0.31 1620 0.71 3108 0.37 .025**
Post-Treatment Regression Results† Control PBF
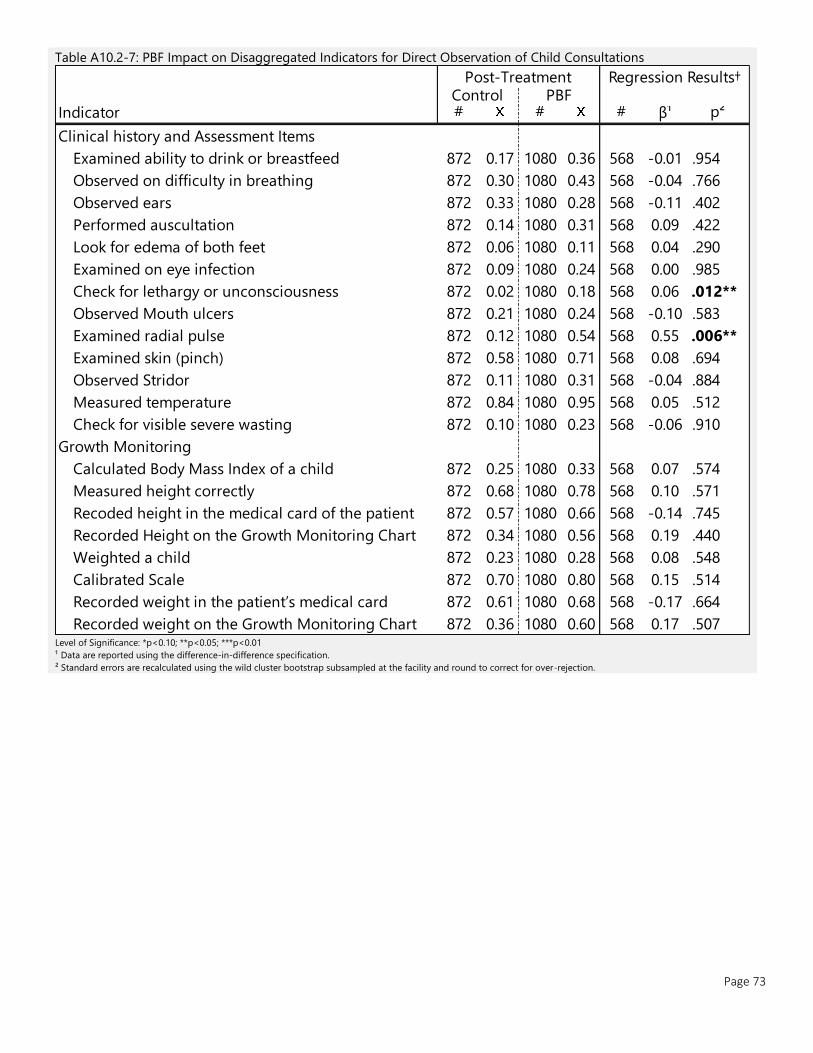
Page 73
Table A10.2-7: PBF Impact on Disaggregated Indicators for Direct Observation of Child Consultations
Level of Significance: *p<0.10; **p<0.05; ***p<0.01
¹ Data are reported using the difference-in-difference specification.
² Standard errors are recalculated using the wild cluster bootstrap subsampled at the facility and round to correct for over-rejection.
Indicator # # # β¹ p²
Clinical history and Assessment Items
Examined ability to drink or breastfeed 872 0.17 1080 0.36 568 -0.01 .954
Observed on difficulty in breathing 872 0.30 1080 0.43 568 -0.04 .766
Observed ears 872 0.33 1080 0.28 568 -0.11 .402
Performed auscultation 872 0.14 1080 0.31 568 0.09 .422
Look for edema of both feet 872 0.06 1080 0.11 568 0.04 .290
Examined on eye infection 872 0.09 1080 0.24 568 0.00 .985
Check for lethargy or unconsciousness 872 0.02 1080 0.18 568 0.06 .012**
Observed Mouth ulcers 872 0.21 1080 0.24 568 -0.10 .583
Examined radial pulse 872 0.12 1080 0.54 568 0.55 .006**
Examined skin (pinch) 872 0.58 1080 0.71 568 0.08 .694
Observed Stridor 872 0.11 1080 0.31 568 -0.04 .884
Measured temperature 872 0.84 1080 0.95 568 0.05 .512
Check for visible severe wasting 872 0.10 1080 0.23 568 -0.06 .910
Growth Monitoring
Calculated Body Mass Index of a child 872 0.25 1080 0.33 568 0.07 .574
Measured height correctly 872 0.68 1080 0.78 568 0.10 .571
Recoded height in the medical card of the patient 872 0.57 1080 0.66 568 -0.14 .745
Recorded Height on the Growth Monitoring Chart 872 0.34 1080 0.56 568 0.19 .440
Weighted a child 872 0.23 1080 0.28 568 0.08 .548
Calibrated Scale 872 0.70 1080 0.80 568 0.15 .514
Recorded weight in the patient’s medical card 872 0.61 1080 0.68 568 -0.17 .664
Recorded weight on the Growth Monitoring Chart 872 0.36 1080 0.60 568 0.17 .507
Post-Treatment Regression Results† Control PBF
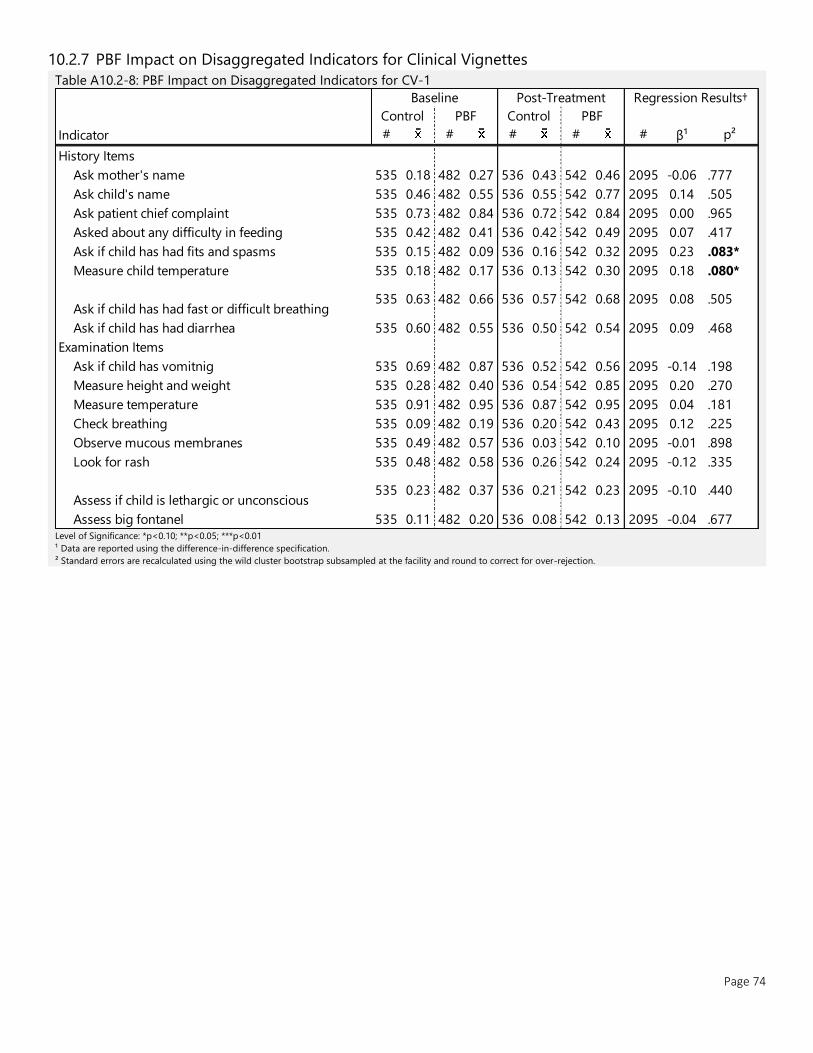
Page 74
10.2.7 PBF Impact on Disaggregated Indicators for Clinical Vignettes
Table A10.2-8: PBF Impact on Disaggregated Indicators for CV-1
Level of Significance: *p<0.10; **p<0.05; ***p<0.01
¹ Data are reported using the difference-in-difference specification.
² Standard errors are recalculated using the wild cluster bootstrap subsampled at the facility and round to correct for over-rejection.
Indicator # # # # # β¹ p²
History Items
Ask mother's name 535 0.18 482 0.27 536 0.43 542 0.46 2095 -0.06 .777
Ask child's name 535 0.46 482 0.55 536 0.55 542 0.77 2095 0.14 .505
Ask patient chief complaint 535 0.73 482 0.84 536 0.72 542 0.84 2095 0.00 .965
Asked about any difficulty in feeding 535 0.42 482 0.41 536 0.42 542 0.49 2095 0.07 .417
Ask if child has had fits and spasms 535 0.15 482 0.09 536 0.16 542 0.32 2095 0.23 .083*
Measure child temperature 535 0.18 482 0.17 536 0.13 542 0.30 2095 0.18 .080*
Ask if child has had fast or difficult breathing535 0.63 482 0.66 536 0.57 542 0.68 2095 0.08 .505
Ask if child has had diarrhea 535 0.60 482 0.55 536 0.50 542 0.54 2095 0.09 .468
Examination Items
Ask if child has vomitnig 535 0.69 482 0.87 536 0.52 542 0.56 2095 -0.14 .198
Measure height and weight 535 0.28 482 0.40 536 0.54 542 0.85 2095 0.20 .270
Measure temperature 535 0.91 482 0.95 536 0.87 542 0.95 2095 0.04 .181
Check breathing 535 0.09 482 0.19 536 0.20 542 0.43 2095 0.12 .225
Observe mucous membranes 535 0.49 482 0.57 536 0.03 542 0.10 2095 -0.01 .898
Look for rash 535 0.48 482 0.58 536 0.26 542 0.24 2095 -0.12 .335
Assess if child is lethargic or unconscious535 0.23 482 0.37 536 0.21 542 0.23 2095 -0.10 .440
Assess big fontanel 535 0.11 482 0.20 536 0.08 542 0.13 2095 -0.04 .677
Baseline Post-Treatment Regression Results†
Control PBF Control PBF

Page 75
Table A10.2-9: PBF Impact on Disaggregated Indicators for CV-2
Level of Significance: *p<0.10; **p<0.05; ***p<0.01
¹ Data are reported using the difference-in-difference specification.
² Standard errors are recalculated using the wild cluster bootstrap subsampled at the facility and round to correct for over-rejection.
Indicator # # # # # β¹ p²
History Items
Ask mother’s name 535 0.17 482 0.26 536 0.42 542 0.43 2095 -0.08 .629
Ask mother child’s name 535 0.45 482 0.54 536 0.50 542 0.77 2095 0.19 .321
Ask the mother what is a child’s problem535 0.66 482 0.84 536 0.67 542 0.77 2095 -0.08 .430
Ask whether a child had measles within last 3
months535 0.04 482 0.07 536 0.05 542 0.23 2095 0.15 .056*
Ask whether a child cough 535 0.50 482 0.52 536 0.33 542 0.53 2095 0.18 .100
Ask whether a child vomiting 535 0.51 482 0.50 536 0.45 542 0.51 2095 0.06 .667
Ask whether a child had convulsions 535 0.24 482 0.22 536 0.20 542 0.33 2095 0.16 .177
Examination Items
Measure weight and height 535 0.32 482 0.42 536 0.57 542 0.84 2095 0.18 .305
Measure temperature 535 0.92 482 0.90 536 0.91 542 0.94 2095 0.05 .125
Check z-scores for height and weight on growth
chart535 0.14 482 0.35 536 0.19 542 0.26 2095 -0.13 .278
Observe if child is convulsing 535 0.19 482 0.15 536 0.09 542 0.20 2095 0.15 .220
Count the breath in one minute 535 0.33 482 0.42 536 0.18 542 0.29 2095 0.01 .930
Look and feel for stiff neck 535 0.05 482 0.11 536 0.05 542 0.13 2095 0.02 .888
Look for runny nose 535 0.20 482 0.27 536 0.19 542 0.24 2095 -0.02 .865
Look for rash 535 0.42 482 0.49 536 0.13 542 0.23 2095 0.03 .692
Look for red eyes 535 0.21 482 0.29 536 0.14 542 0.20 2095 -0.02 .864
Observe chest indrawing 535 0.11 482 0.13 536 0.07 542 0.16 2095 0.07 .505
Look and listen for stridor and wheezing 535 0.30 482 0.27 536 0.16 542 0.21 2095 0.08 .421
Baseline Post-Treatment Regression Results†
Control PBF Control PBF
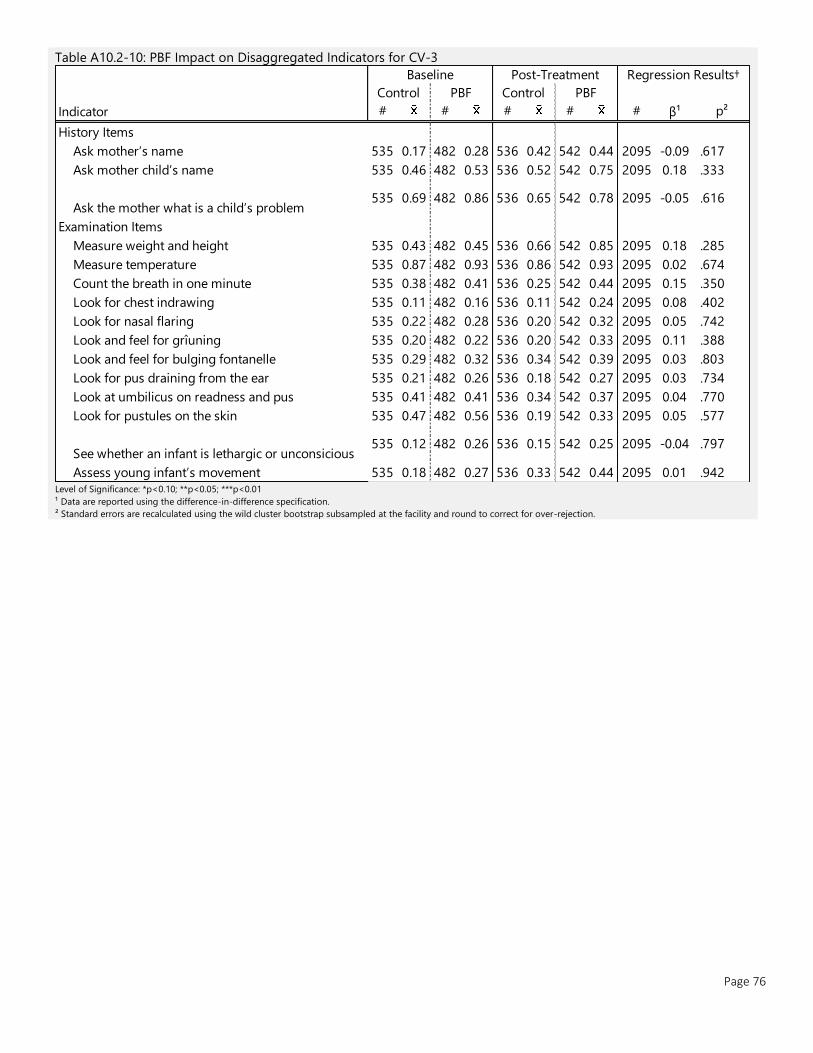
Page 76
Table A10.2-10: PBF Impact on Disaggregated Indicators for CV-3
Level of Significance: *p<0.10; **p<0.05; ***p<0.01
¹ Data are reported using the difference-in-difference specification.
² Standard errors are recalculated using the wild cluster bootstrap subsampled at the facility and round to correct for over-rejection.
Indicator # # # # # β¹ p²
History Items
Ask mother’s name 535 0.17 482 0.28 536 0.42 542 0.44 2095 -0.09 .617
Ask mother child’s name 535 0.46 482 0.53 536 0.52 542 0.75 2095 0.18 .333
Ask the mother what is a child’s problem535 0.69 482 0.86 536 0.65 542 0.78 2095 -0.05 .616
Examination Items
Measure weight and height 535 0.43 482 0.45 536 0.66 542 0.85 2095 0.18 .285
Measure temperature 535 0.87 482 0.93 536 0.86 542 0.93 2095 0.02 .674
Count the breath in one minute 535 0.38 482 0.41 536 0.25 542 0.44 2095 0.15 .350
Look for chest indrawing 535 0.11 482 0.16 536 0.11 542 0.24 2095 0.08 .402
Look for nasal flaring 535 0.22 482 0.28 536 0.20 542 0.32 2095 0.05 .742
Look and feel for grîuning 535 0.20 482 0.22 536 0.20 542 0.33 2095 0.11 .388
Look and feel for bulging fontanelle 535 0.29 482 0.32 536 0.34 542 0.39 2095 0.03 .803
Look for pus draining from the ear 535 0.21 482 0.26 536 0.18 542 0.27 2095 0.03 .734
Look at umbilicus on readness and pus 535 0.41 482 0.41 536 0.34 542 0.37 2095 0.04 .770
Look for pustules on the skin 535 0.47 482 0.56 536 0.19 542 0.33 2095 0.05 .577
See whether an infant is lethargic or unconsicious535 0.12 482 0.26 536 0.15 542 0.25 2095 -0.04 .797
Assess young infant’s movement 535 0.18 482 0.27 536 0.33 542 0.44 2095 0.01 .942
Baseline Post-Treatment Regression Results†
Control PBF Control PBF
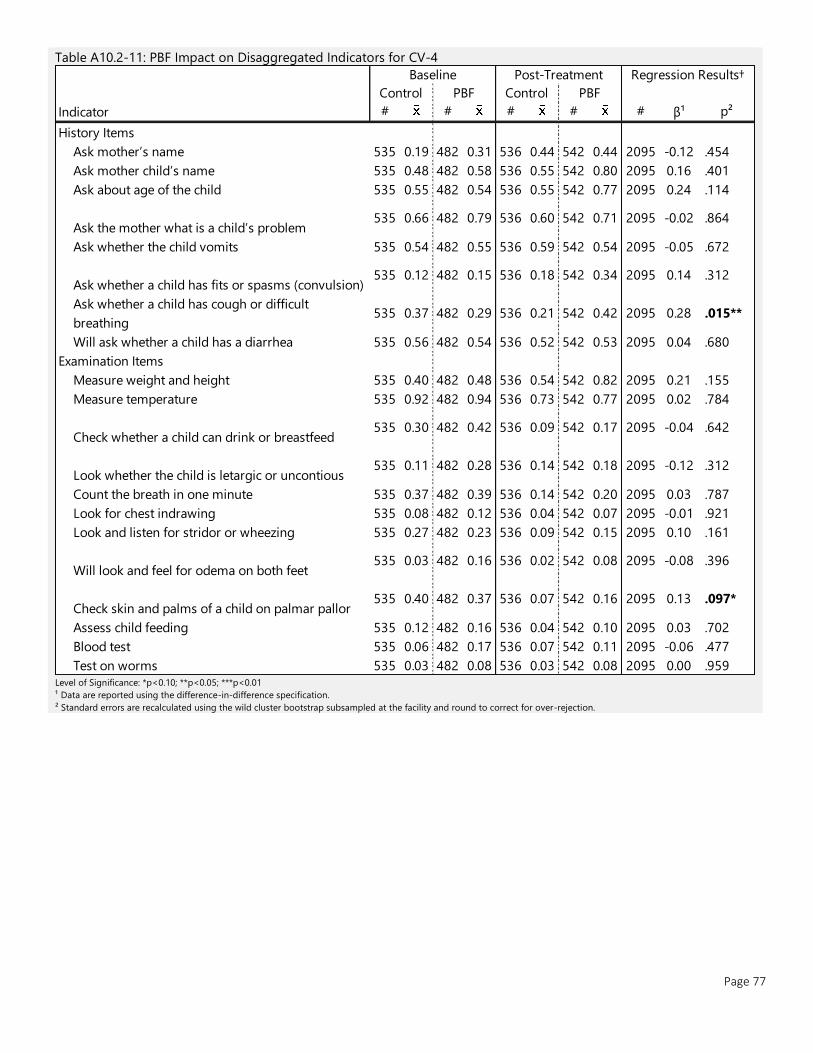
Page 77
Table A10.2-11: PBF Impact on Disaggregated Indicators for CV-4
Level of Significance: *p<0.10; **p<0.05; ***p<0.01
¹ Data are reported using the difference-in-difference specification.
² Standard errors are recalculated using the wild cluster bootstrap subsampled at the facility and round to correct for over-rejection.
Indicator # # # # # β¹ p²
History Items
Ask mother’s name 535 0.19 482 0.31 536 0.44 542 0.44 2095 -0.12 .454
Ask mother child’s name 535 0.48 482 0.58 536 0.55 542 0.80 2095 0.16 .401
Ask about age of the child 535 0.55 482 0.54 536 0.55 542 0.77 2095 0.24 .114
Ask the mother what is a child’s problem535 0.66 482 0.79 536 0.60 542 0.71 2095 -0.02 .864
Ask whether the child vomits 535 0.54 482 0.55 536 0.59 542 0.54 2095 -0.05 .672
Ask whether a child has fits or spasms (convulsion)535 0.12 482 0.15 536 0.18 542 0.34 2095 0.14 .312
Ask whether a child has cough or difficult
breathing535 0.37 482 0.29 536 0.21 542 0.42 2095 0.28 .015**
Will ask whether a child has a diarrhea 535 0.56 482 0.54 536 0.52 542 0.53 2095 0.04 .680
Examination Items
Measure weight and height 535 0.40 482 0.48 536 0.54 542 0.82 2095 0.21 .155
Measure temperature 535 0.92 482 0.94 536 0.73 542 0.77 2095 0.02 .784
Check whether a child can drink or breastfeed535 0.30 482 0.42 536 0.09 542 0.17 2095 -0.04 .642
Look whether the child is letargic or uncontious535 0.11 482 0.28 536 0.14 542 0.18 2095 -0.12 .312
Count the breath in one minute 535 0.37 482 0.39 536 0.14 542 0.20 2095 0.03 .787
Look for chest indrawing 535 0.08 482 0.12 536 0.04 542 0.07 2095 -0.01 .921
Look and listen for stridor or wheezing 535 0.27 482 0.23 536 0.09 542 0.15 2095 0.10 .161
Will look and feel for odema on both feet535 0.03 482 0.16 536 0.02 542 0.08 2095 -0.08 .396
Check skin and palms of a child on palmar pallor535 0.40 482 0.37 536 0.07 542 0.16 2095 0.13 .097*
Assess child feeding 535 0.12 482 0.16 536 0.04 542 0.10 2095 0.03 .702
Blood test 535 0.06 482 0.17 536 0.07 542 0.11 2095 -0.06 .477
Test on worms 535 0.03 482 0.08 536 0.03 542 0.08 2095 0.00 .959
Baseline Post-Treatment Regression Results†
Control PBF Control PBF
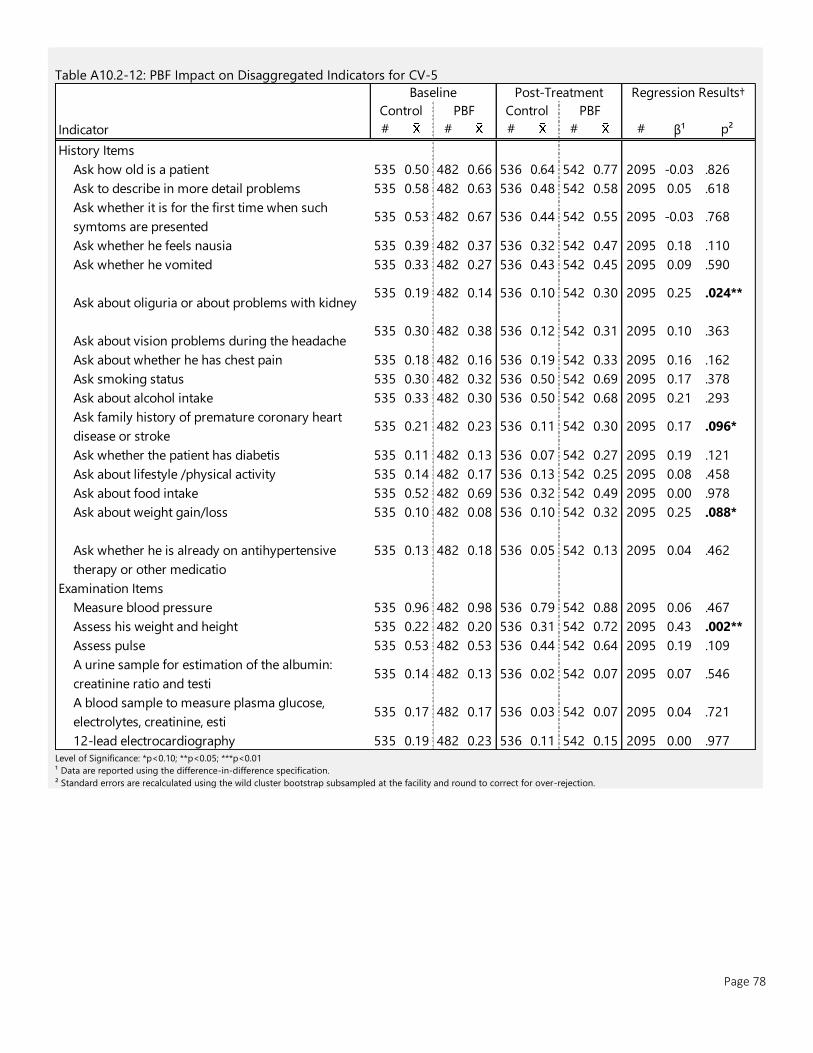
Page 78
Table A10.2-12: PBF Impact on Disaggregated Indicators for CV-5
Level of Significance: *p<0.10; **p<0.05; ***p<0.01
¹ Data are reported using the difference-in-difference specification.
² Standard errors are recalculated using the wild cluster bootstrap subsampled at the facility and round to correct for over-rejection.
Indicator # # # # # β¹ p²
History Items
Ask how old is a patient 535 0.50 482 0.66 536 0.64 542 0.77 2095 -0.03 .826
Ask to describe in more detail problems 535 0.58 482 0.63 536 0.48 542 0.58 2095 0.05 .618
Ask whether it is for the first time when such
symtoms are presented535 0.53 482 0.67 536 0.44 542 0.55 2095 -0.03 .768
Ask whether he feels nausia 535 0.39 482 0.37 536 0.32 542 0.47 2095 0.18 .110
Ask whether he vomited 535 0.33 482 0.27 536 0.43 542 0.45 2095 0.09 .590
Ask about oliguria or about problems with kidney535 0.19 482 0.14 536 0.10 542 0.30 2095 0.25 .024**
Ask about vision problems during the headache535 0.30 482 0.38 536 0.12 542 0.31 2095 0.10 .363
Ask about whether he has chest pain 535 0.18 482 0.16 536 0.19 542 0.33 2095 0.16 .162
Ask smoking status 535 0.30 482 0.32 536 0.50 542 0.69 2095 0.17 .378
Ask about alcohol intake 535 0.33 482 0.30 536 0.50 542 0.68 2095 0.21 .293
Ask family history of premature coronary heart
disease or stroke535 0.21 482 0.23 536 0.11 542 0.30 2095 0.17 .096*
Ask whether the patient has diabetis 535 0.11 482 0.13 536 0.07 542 0.27 2095 0.19 .121
Ask about lifestyle /physical activity 535 0.14 482 0.17 536 0.13 542 0.25 2095 0.08 .458
Ask about food intake 535 0.52 482 0.69 536 0.32 542 0.49 2095 0.00 .978
Ask about weight gain/loss 535 0.10 482 0.08 536 0.10 542 0.32 2095 0.25 .088*
Ask whether he is already on antihypertensive
therapy or other medicatio
535 0.13 482 0.18 536 0.05 542 0.13 2095 0.04 .462
Examination Items
Measure blood pressure 535 0.96 482 0.98 536 0.79 542 0.88 2095 0.06 .467
Assess his weight and height 535 0.22 482 0.20 536 0.31 542 0.72 2095 0.43 .002**
Assess pulse 535 0.53 482 0.53 536 0.44 542 0.64 2095 0.19 .109
A urine sample for estimation of the albumin:
creatinine ratio and testi535 0.14 482 0.13 536 0.02 542 0.07 2095 0.07 .546
A blood sample to measure plasma glucose,
electrolytes, creatinine, esti535 0.17 482 0.17 536 0.03 542 0.07 2095 0.04 .721
12-lead electrocardiography 535 0.19 482 0.23 536 0.11 542 0.15 2095 0.00 .977
Baseline Post-Treatment Regression Results†
Control PBF Control PBF
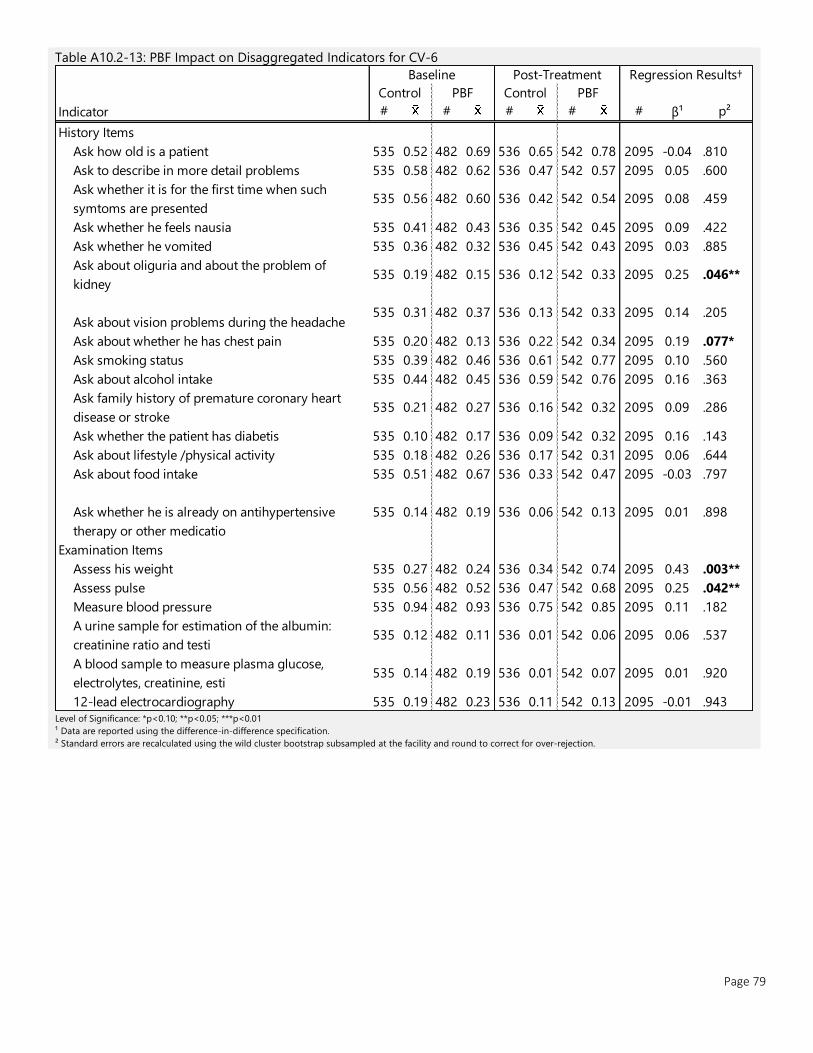
Page 79
Table A10.2-13: PBF Impact on Disaggregated Indicators for CV-6
Level of Significance: *p<0.10; **p<0.05; ***p<0.01
¹ Data are reported using the difference-in-difference specification.
² Standard errors are recalculated using the wild cluster bootstrap subsampled at the facility and round to correct for over-rejection.
Indicator # # # # # β¹ p²
History Items
Ask how old is a patient 535 0.52 482 0.69 536 0.65 542 0.78 2095 -0.04 .810
Ask to describe in more detail problems 535 0.58 482 0.62 536 0.47 542 0.57 2095 0.05 .600
Ask whether it is for the first time when such
symtoms are presented535 0.56 482 0.60 536 0.42 542 0.54 2095 0.08 .459
Ask whether he feels nausia 535 0.41 482 0.43 536 0.35 542 0.45 2095 0.09 .422
Ask whether he vomited 535 0.36 482 0.32 536 0.45 542 0.43 2095 0.03 .885
Ask about oliguria and about the problem of
kidney535 0.19 482 0.15 536 0.12 542 0.33 2095 0.25 .046**
Ask about vision problems during the headache535 0.31 482 0.37 536 0.13 542 0.33 2095 0.14 .205
Ask about whether he has chest pain 535 0.20 482 0.13 536 0.22 542 0.34 2095 0.19 .077*
Ask smoking status 535 0.39 482 0.46 536 0.61 542 0.77 2095 0.10 .560
Ask about alcohol intake 535 0.44 482 0.45 536 0.59 542 0.76 2095 0.16 .363
Ask family history of premature coronary heart
disease or stroke535 0.21 482 0.27 536 0.16 542 0.32 2095 0.09 .286
Ask whether the patient has diabetis 535 0.10 482 0.17 536 0.09 542 0.32 2095 0.16 .143
Ask about lifestyle /physical activity 535 0.18 482 0.26 536 0.17 542 0.31 2095 0.06 .644
Ask about food intake 535 0.51 482 0.67 536 0.33 542 0.47 2095 -0.03 .797
Ask whether he is already on antihypertensive
therapy or other medicatio
535 0.14 482 0.19 536 0.06 542 0.13 2095 0.01 .898
Examination Items
Assess his weight 535 0.27 482 0.24 536 0.34 542 0.74 2095 0.43 .003**
Assess pulse 535 0.56 482 0.52 536 0.47 542 0.68 2095 0.25 .042**
Measure blood pressure 535 0.94 482 0.93 536 0.75 542 0.85 2095 0.11 .182
A urine sample for estimation of the albumin:
creatinine ratio and testi535 0.12 482 0.11 536 0.01 542 0.06 2095 0.06 .537
A blood sample to measure plasma glucose,
electrolytes, creatinine, esti535 0.14 482 0.19 536 0.01 542 0.07 2095 0.01 .920
12-lead electrocardiography 535 0.19 482 0.23 536 0.11 542 0.13 2095 -0.01 .943
Baseline Post-Treatment Regression Results†
Control PBF Control PBF
10.3 Disaggregated Indicators for CQI/CRC Impact Survey data of multiple correlated elements were summarized using an unrotated principal component analysis. The first
component of the factor was extracted and standardized (mean of 0 with standard deviation of 1) and assumed to
summarize the overarching ‘score’ for the category of indicators. The following tables present the detailed results of these
analysis, including the component correlations of each element, and an element by element regression with CQI/CRC
impact.
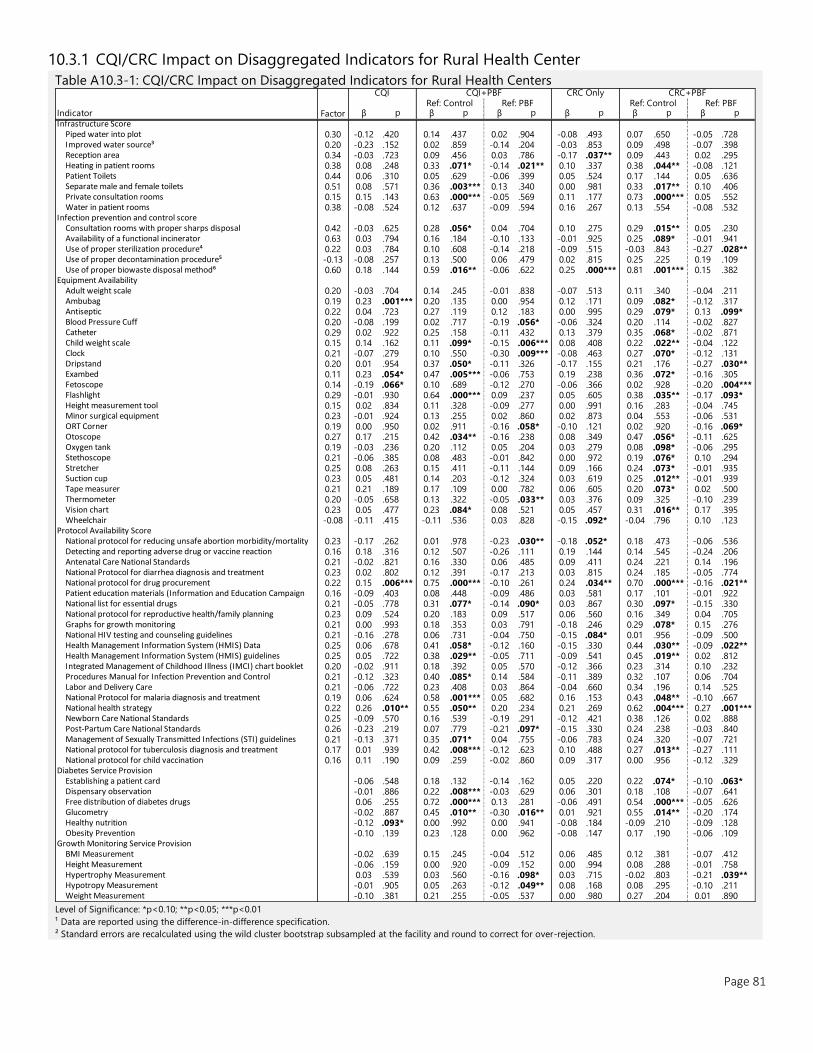
Page 81
10.3.1 CQI/CRC Impact on Disaggregated Indicators for Rural Health Center
Table A10.3-1: CQI/CRC Impact on Disaggregated Indicators for Rural Health Centers
Level of Significance: *p<0.10; **p<0.05; ***p<0.01
¹ Data are reported using the difference-in-difference specification.
² Standard errors are recalculated using the wild cluster bootstrap subsampled at the facility and round to correct for over-rejection.
Indicator β p β p β p β p β p β p
Infrastructure ScorePiped water into plot 0.30 -0.12 .420 0.14 .437 0.02 .904 -0.08 .493 0.07 .650 -0.05 .728 Improved water source³ 0.20 -0.23 .152 0.02 .859 -0.14 .204 -0.03 .853 0.09 .498 -0.07 .398 Reception area 0.34 -0.03 .723 0.09 .456 0.03 .786 -0.17 .037** 0.09 .443 0.02 .295 Heating in patient rooms 0.38 0.08 .248 0.33 .071* -0.14 .021** 0.10 .337 0.38 .044** -0.08 .121 Patient Toilets 0.44 0.06 .310 0.05 .629 -0.06 .399 0.05 .524 0.17 .144 0.05 .636 Separate male and female toilets 0.51 0.08 .571 0.36 .003*** 0.13 .340 0.00 .981 0.33 .017** 0.10 .406 Private consultation rooms 0.15 0.15 .143 0.63 .000*** -0.05 .569 0.11 .177 0.73 .000*** 0.05 .552 Water in patient rooms 0.38 -0.08 .524 0.12 .637 -0.09 .594 0.16 .267 0.13 .554 -0.08 .532
Infection prevention and control scoreConsultation rooms with proper sharps disposal 0.42 -0.03 .625 0.28 .056* 0.04 .704 0.10 .275 0.29 .015** 0.05 .230 Availability of a functional incinerator 0.63 0.03 .794 0.16 .184 -0.10 .133 -0.01 .925 0.25 .089* -0.01 .941 Use of proper sterilization procedure⁴ 0.22 0.03 .784 0.10 .608 -0.14 .218 -0.09 .515 -0.03 .843 -0.27 .028** Use of proper decontamination procedure⁵ -0.13 -0.08 .257 0.13 .500 0.06 .479 0.02 .815 0.25 .225 0.19 .109 Use of proper biowaste disposal method⁶ 0.60 0.18 .144 0.59 .016** -0.06 .622 0.25 .000*** 0.81 .001*** 0.15 .382
Equipment AvailabilityAdult weight scale 0.20 -0.03 .704 0.14 .245 -0.01 .838 -0.07 .513 0.11 .340 -0.04 .211 Ambubag 0.19 0.23 .001*** 0.20 .135 0.00 .954 0.12 .171 0.09 .082* -0.12 .317 Antiseptic 0.22 0.04 .723 0.27 .119 0.12 .183 0.00 .995 0.29 .079* 0.13 .099* Blood Pressure Cuff 0.20 -0.08 .199 0.02 .717 -0.19 .056* -0.06 .324 0.20 .114 -0.02 .827 Catheter 0.29 0.02 .922 0.25 .158 -0.11 .432 0.13 .379 0.35 .068* -0.02 .871 Child weight scale 0.15 0.14 .162 0.11 .099* -0.15 .006*** 0.08 .408 0.22 .022** -0.04 .122 Clock 0.21 -0.07 .279 0.10 .550 -0.30 .009*** -0.08 .463 0.27 .070* -0.12 .131 Dripstand 0.20 0.01 .954 0.37 .050* -0.11 .326 -0.17 .155 0.21 .176 -0.27 .030** Exambed 0.11 0.23 .054* 0.47 .005*** -0.06 .753 0.19 .238 0.36 .072* -0.16 .305 Fetoscope 0.14 -0.19 .066* 0.10 .689 -0.12 .270 -0.06 .366 0.02 .928 -0.20 .004***Flashlight 0.29 -0.01 .930 0.64 .000*** 0.09 .237 0.05 .605 0.38 .035** -0.17 .093* Height measurement tool 0.15 0.02 .834 0.11 .328 -0.09 .277 0.00 .991 0.16 .283 -0.04 .745 Minor surgical equipment 0.23 -0.01 .924 0.13 .255 0.02 .860 0.02 .873 0.04 .553 -0.06 .531 ORT Corner 0.19 0.00 .950 0.02 .911 -0.16 .058* -0.10 .121 0.02 .920 -0.16 .069* Otoscope 0.27 0.17 .215 0.42 .034** -0.16 .238 0.08 .349 0.47 .056* -0.11 .625 Oxygen tank 0.19 -0.03 .236 0.20 .112 0.05 .204 0.03 .279 0.08 .098* -0.06 .295 Stethoscope 0.21 -0.06 .385 0.08 .483 -0.01 .842 0.00 .972 0.19 .076* 0.10 .294 Stretcher 0.25 0.08 .263 0.15 .411 -0.11 .144 0.09 .166 0.24 .073* -0.01 .935 Suction cup 0.23 0.05 .481 0.14 .203 -0.12 .324 0.03 .619 0.25 .012** -0.01 .939 Tape measurer 0.21 0.21 .189 0.17 .109 0.00 .782 0.06 .605 0.20 .073* 0.02 .500 Thermometer 0.20 -0.05 .658 0.13 .322 -0.05 .033** 0.03 .376 0.09 .325 -0.10 .239 Vision chart 0.23 0.05 .477 0.23 .084* 0.08 .521 0.05 .457 0.31 .016** 0.17 .395 Wheelchair -0.08 -0.11 .415 -0.11 .536 0.03 .828 -0.15 .092* -0.04 .796 0.10 .123
Protocol Availability ScoreNational protocol for reducing unsafe abortion morbidity/mortality 0.23 -0.17 .262 0.01 .978 -0.23 .030** -0.18 .052* 0.18 .473 -0.06 .536 Detecting and reporting adverse drug or vaccine reaction 0.16 0.18 .316 0.12 .507 -0.26 .111 0.19 .144 0.14 .545 -0.24 .206 Antenatal Care National Standards 0.21 -0.02 .821 0.16 .330 0.06 .485 0.09 .411 0.24 .221 0.14 .196 National Protocol for diarrhea diagnosis and treatment 0.23 0.02 .802 0.12 .391 -0.17 .213 0.03 .815 0.24 .185 -0.05 .774 National protocol for drug procurement 0.22 0.15 .006*** 0.75 .000*** -0.10 .261 0.24 .034** 0.70 .000*** -0.16 .021** Patient education materials (Information and Education Campaign 0.16 -0.09 .403 0.08 .448 -0.09 .486 0.03 .581 0.17 .101 -0.01 .922 National list for essential drugs 0.21 -0.05 .778 0.31 .077* -0.14 .090* 0.03 .867 0.30 .097* -0.15 .330 National protocol for reproductive health/family planning 0.23 0.09 .524 0.20 .183 0.09 .517 0.06 .560 0.16 .349 0.04 .705 Graphs for growth monitoring 0.21 0.00 .993 0.18 .353 0.03 .791 -0.18 .246 0.29 .078* 0.15 .276 National HIV testing and counseling guidelines 0.21 -0.16 .278 0.06 .731 -0.04 .750 -0.15 .084* 0.01 .956 -0.09 .500 Health Management Information System (HMIS) Data 0.25 0.06 .678 0.41 .058* -0.12 .160 -0.15 .330 0.44 .030** -0.09 .022** Health Management Information System (HMIS) guidelines 0.25 0.05 .722 0.38 .029** -0.05 .711 -0.09 .541 0.45 .019** 0.02 .812 Integrated Management of Childhood Illness (IMCI) chart booklet 0.20 -0.02 .911 0.18 .392 0.05 .570 -0.12 .366 0.23 .314 0.10 .232 Procedures Manual for Infection Prevention and Control 0.21 -0.12 .323 0.40 .085* 0.14 .584 -0.11 .389 0.32 .107 0.06 .704 Labor and Delivery Care 0.21 -0.06 .722 0.23 .408 0.03 .864 -0.04 .660 0.34 .196 0.14 .525 National Protocol for malaria diagnosis and treatment 0.19 0.06 .624 0.58 .001*** 0.05 .682 0.16 .153 0.43 .048** -0.10 .667 National health strategy 0.22 0.26 .010** 0.55 .050** 0.20 .234 0.21 .269 0.62 .004*** 0.27 .001***Newborn Care National Standards 0.25 -0.09 .570 0.16 .539 -0.19 .291 -0.12 .421 0.38 .126 0.02 .888 Post-Partum Care National Standards 0.26 -0.23 .219 0.07 .779 -0.21 .097* -0.15 .330 0.24 .238 -0.03 .840 Management of Sexually Transmitted Infections (STI) guidelines 0.21 -0.13 .371 0.35 .071* 0.04 .755 -0.06 .783 0.24 .320 -0.07 .721 National protocol for tuberculosis diagnosis and treatment 0.17 0.01 .939 0.42 .008*** -0.12 .623 0.10 .488 0.27 .013** -0.27 .111 National protocol for child vaccination 0.16 0.11 .190 0.09 .259 -0.02 .860 0.09 .317 0.00 .956 -0.12 .329
Diabetes Service ProvisionEstablishing a patient card -0.06 .548 0.18 .132 -0.14 .162 0.05 .220 0.22 .074* -0.10 .063* Dispensary observation -0.01 .886 0.22 .008*** -0.03 .629 0.06 .301 0.18 .108 -0.07 .641 Free distribution of diabetes drugs 0.06 .255 0.72 .000*** 0.13 .281 -0.06 .491 0.54 .000*** -0.05 .626 Glucometry -0.02 .887 0.45 .010** -0.30 .016** 0.01 .921 0.55 .014** -0.20 .174 Healthy nutrition -0.12 .093* 0.00 .992 0.00 .941 -0.08 .184 -0.09 .210 -0.09 .128 Obesity Prevention -0.10 .139 0.23 .128 0.00 .962 -0.08 .147 0.17 .190 -0.06 .109
Growth Monitoring Service ProvisionBMI Measurement -0.02 .639 0.15 .245 -0.04 .512 0.06 .485 0.12 .381 -0.07 .412 Height Measurement -0.06 .159 0.00 .920 -0.09 .152 0.00 .994 0.08 .288 -0.01 .758 Hypertrophy Measurement 0.03 .539 0.03 .560 -0.16 .098* 0.03 .715 -0.02 .803 -0.21 .039** Hypotropy Measurement -0.01 .905 0.05 .263 -0.12 .049** 0.08 .168 0.08 .295 -0.10 .211 Weight Measurement -0.10 .381 0.21 .255 -0.05 .537 0.00 .980 0.27 .204 0.01 .890
CQI CQI+PBF CRC Only CRC+PBFRef: Control Ref: PBF Ref: Control Ref: PBF
Factor
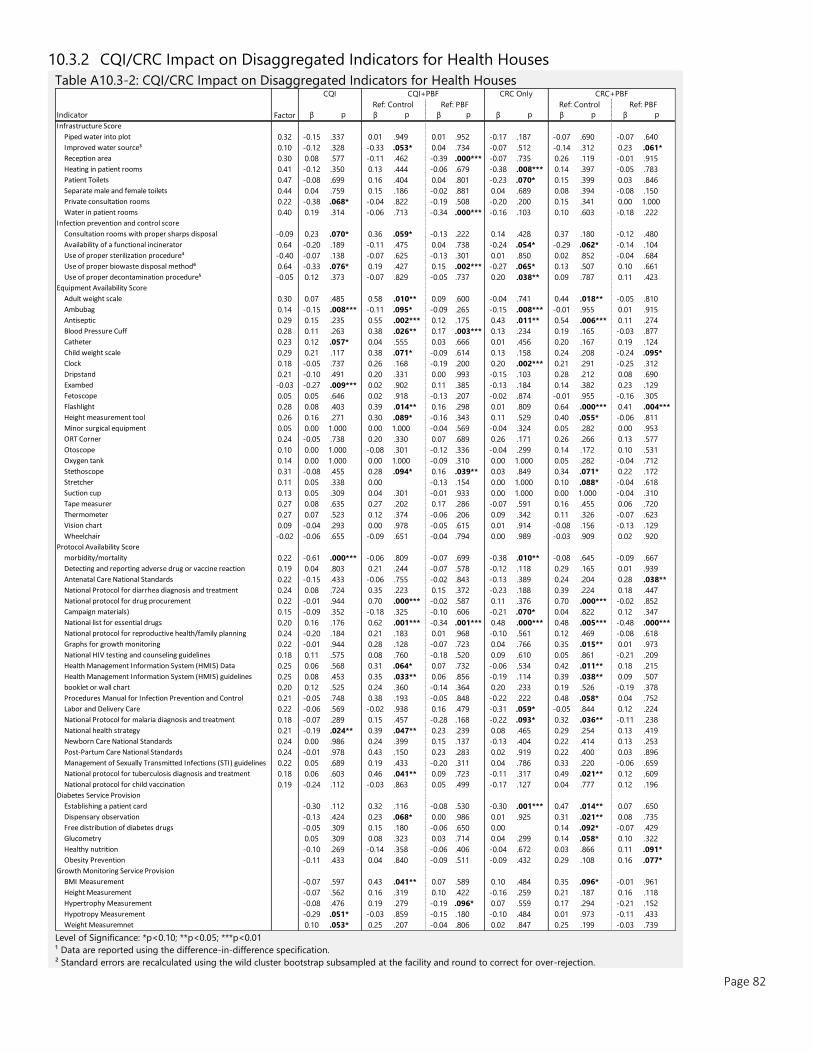
Page 82
10.3.2 CQI/CRC Impact on Disaggregated Indicators for Health Houses
Table A10.3-2: CQI/CRC Impact on Disaggregated Indicators for Health Houses
Level of Significance: *p<0.10; **p<0.05; ***p<0.01
¹ Data are reported using the difference-in-difference specification.
² Standard errors are recalculated using the wild cluster bootstrap subsampled at the facility and round to correct for over-rejection.
Indicator β p β p β p β p β p β p
Infrastructure Score
Piped water into plot 0.32 -0.15 .337 0.01 .949 0.01 .952 -0.17 .187 -0.07 .690 -0.07 .640
Improved water source³ 0.10 -0.12 .328 -0.33 .053* 0.04 .734 -0.07 .512 -0.14 .312 0.23 .061*
Reception area 0.30 0.08 .577 -0.11 .462 -0.39 .000*** -0.07 .735 0.26 .119 -0.01 .915
Heating in patient rooms 0.41 -0.12 .350 0.13 .444 -0.06 .679 -0.38 .008*** 0.14 .397 -0.05 .783
Patient Toilets 0.47 -0.08 .699 0.16 .404 0.04 .801 -0.23 .070* 0.15 .399 0.03 .846
Separate male and female toilets 0.44 0.04 .759 0.15 .186 -0.02 .881 0.04 .689 0.08 .394 -0.08 .150
Private consultation rooms 0.22 -0.38 .068* -0.04 .822 -0.19 .508 -0.20 .200 0.15 .341 0.00 1.000
Water in patient rooms 0.40 0.19 .314 -0.06 .713 -0.34 .000*** -0.16 .103 0.10 .603 -0.18 .222
Infection prevention and control score
Consultation rooms with proper sharps disposal -0.09 0.23 .070* 0.36 .059* -0.13 .222 0.14 .428 0.37 .180 -0.12 .480
Availability of a functional incinerator 0.64 -0.20 .189 -0.11 .475 0.04 .738 -0.24 .054* -0.29 .062* -0.14 .104
Use of proper sterilization procedure⁴ -0.40 -0.07 .138 -0.07 .625 -0.13 .301 0.01 .850 0.02 .852 -0.04 .684
Use of proper biowaste disposal method⁶ 0.64 -0.33 .076* 0.19 .427 0.15 .002*** -0.27 .065* 0.13 .507 0.10 .661
Use of proper decontamination procedure⁵ -0.05 0.12 .373 -0.07 .829 -0.05 .737 0.20 .038** 0.09 .787 0.11 .423
Equipment Availability Score
Adult weight scale 0.30 0.07 .485 0.58 .010** 0.09 .600 -0.04 .741 0.44 .018** -0.05 .810
Ambubag 0.14 -0.15 .008*** -0.11 .095* -0.09 .265 -0.15 .008*** -0.01 .955 0.01 .915
Antiseptic 0.29 0.15 .235 0.55 .002*** 0.12 .175 0.43 .011** 0.54 .006*** 0.11 .274
Blood Pressure Cuff 0.28 0.11 .263 0.38 .026** 0.17 .003*** 0.13 .234 0.19 .165 -0.03 .877
Catheter 0.23 0.12 .057* 0.04 .555 0.03 .666 0.01 .456 0.20 .167 0.19 .124
Child weight scale 0.29 0.21 .117 0.38 .071* -0.09 .614 0.13 .158 0.24 .208 -0.24 .095*
Clock 0.18 -0.05 .737 0.26 .168 -0.19 .200 0.20 .002*** 0.21 .291 -0.25 .312
Dripstand 0.21 -0.10 .491 0.20 .331 0.00 .993 -0.15 .103 0.28 .212 0.08 .690
Exambed -0.03 -0.27 .009*** 0.02 .902 0.11 .385 -0.13 .184 0.14 .382 0.23 .129
Fetoscope 0.05 0.05 .646 0.02 .918 -0.13 .207 -0.02 .874 -0.01 .955 -0.16 .305
Flashlight 0.28 0.08 .403 0.39 .014** 0.16 .298 0.01 .809 0.64 .000*** 0.41 .004***
Height measurement tool 0.26 0.16 .271 0.30 .089* -0.16 .343 0.11 .529 0.40 .055* -0.06 .811
Minor surgical equipment 0.05 0.00 1.000 0.00 1.000 -0.04 .569 -0.04 .324 0.05 .282 0.00 .953
ORT Corner 0.24 -0.05 .738 0.20 .330 0.07 .689 0.26 .171 0.26 .266 0.13 .577
Otoscope 0.10 0.00 1.000 -0.08 .301 -0.12 .336 -0.04 .299 0.14 .172 0.10 .531
Oxygen tank 0.14 0.00 1.000 0.00 1.000 -0.09 .310 0.00 1.000 0.05 .282 -0.04 .712
Stethoscope 0.31 -0.08 .455 0.28 .094* 0.16 .039** 0.03 .849 0.34 .071* 0.22 .172
Stretcher 0.11 0.05 .338 0.00 -0.13 .154 0.00 1.000 0.10 .088* -0.04 .618
Suction cup 0.13 0.05 .309 0.04 .301 -0.01 .933 0.00 1.000 0.00 1.000 -0.04 .310
Tape measurer 0.27 0.08 .635 0.27 .202 0.17 .286 -0.07 .591 0.16 .455 0.06 .720
Thermometer 0.27 0.07 .523 0.12 .374 -0.06 .206 0.09 .342 0.11 .326 -0.07 .623
Vision chart 0.09 -0.04 .293 0.00 .978 -0.05 .615 0.01 .914 -0.08 .156 -0.13 .129
Wheelchair -0.02 -0.06 .655 -0.09 .651 -0.04 .794 0.00 .989 -0.03 .909 0.02 .920
Protocol Availability ScoreNational protocol for reducing unsafe abortion
morbidity/mortality 0.22 -0.61 .000*** -0.06 .809 -0.07 .699 -0.38 .010** -0.08 .645 -0.09 .667
Detecting and reporting adverse drug or vaccine reaction 0.19 0.04 .803 0.21 .244 -0.07 .578 -0.12 .118 0.29 .165 0.01 .939
Antenatal Care National Standards 0.22 -0.15 .433 -0.06 .755 -0.02 .843 -0.13 .389 0.24 .204 0.28 .038**
National Protocol for diarrhea diagnosis and treatment 0.24 0.08 .724 0.35 .223 0.15 .372 -0.23 .188 0.39 .224 0.18 .447
National protocol for drug procurement 0.22 -0.01 .944 0.70 .000*** -0.02 .587 0.11 .376 0.70 .000*** -0.02 .852 Patient education materials (Information and Education
Campaign materials) 0.15 -0.09 .352 -0.18 .325 -0.10 .606 -0.21 .070* 0.04 .822 0.12 .347
National list for essential drugs 0.20 0.16 .176 0.62 .001*** -0.34 .001*** 0.48 .000*** 0.48 .005*** -0.48 .000***
National protocol for reproductive health/family planning 0.24 -0.20 .184 0.21 .183 0.01 .968 -0.10 .561 0.12 .469 -0.08 .618
Graphs for growth monitoring 0.22 -0.01 .944 0.28 .128 -0.07 .723 0.04 .766 0.35 .015** 0.01 .973
National HIV testing and counseling guidelines 0.18 0.11 .575 0.08 .760 -0.18 .520 0.09 .610 0.05 .861 -0.21 .209
Health Management Information System (HMIS) Data 0.25 0.06 .568 0.31 .064* 0.07 .732 -0.06 .534 0.42 .011** 0.18 .215
Health Management Information System (HMIS) guidelines 0.25 0.08 .453 0.35 .033** 0.06 .856 -0.19 .114 0.39 .038** 0.09 .507 Integrated Management of Childhood Illness (IMCI) chart
booklet or wall chart 0.20 0.12 .525 0.24 .360 -0.14 .364 0.20 .233 0.19 .526 -0.19 .378
Procedures Manual for Infection Prevention and Control 0.21 -0.05 .748 0.38 .193 -0.05 .848 -0.22 .222 0.48 .058* 0.04 .752
Labor and Delivery Care 0.22 -0.06 .569 -0.02 .938 0.16 .479 -0.31 .059* -0.05 .844 0.12 .224
National Protocol for malaria diagnosis and treatment 0.18 -0.07 .289 0.15 .457 -0.28 .168 -0.22 .093* 0.32 .036** -0.11 .238
National health strategy 0.21 -0.19 .024** 0.39 .047** 0.23 .239 0.08 .465 0.29 .254 0.13 .419
Newborn Care National Standards 0.24 0.00 .986 0.24 .399 0.15 .137 -0.13 .404 0.22 .414 0.13 .253
Post-Partum Care National Standards 0.24 -0.01 .978 0.43 .150 0.23 .283 0.02 .919 0.22 .400 0.03 .896
Management of Sexually Transmitted Infections (STI) guidelines 0.22 0.05 .689 0.19 .433 -0.20 .311 0.04 .786 0.33 .220 -0.06 .659
National protocol for tuberculosis diagnosis and treatment 0.18 0.06 .603 0.46 .041** 0.09 .723 -0.11 .317 0.49 .021** 0.12 .609
National protocol for child vaccination 0.19 -0.24 .112 -0.03 .863 0.05 .499 -0.17 .127 0.04 .777 0.12 .196
Diabetes Service Provision
Establishing a patient card -0.30 .112 0.32 .116 -0.08 .530 -0.30 .001*** 0.47 .014** 0.07 .650
Dispensary observation -0.13 .424 0.23 .068* 0.00 .986 0.01 .925 0.31 .021** 0.08 .735
Free distribution of diabetes drugs -0.05 .309 0.15 .180 -0.06 .650 0.00 0.14 .092* -0.07 .429
Glucometry 0.05 .309 0.08 .323 0.03 .714 0.04 .299 0.14 .058* 0.10 .322
Healthy nutrition -0.10 .269 -0.14 .358 -0.06 .406 -0.04 .672 0.03 .866 0.11 .091*
Obesity Prevention -0.11 .433 0.04 .840 -0.09 .511 -0.09 .432 0.29 .108 0.16 .077*
Growth Monitoring Service Provision
BMI Measurement -0.07 .597 0.43 .041** 0.07 .589 0.10 .484 0.35 .096* -0.01 .961
Height Measurement -0.07 .562 0.16 .319 0.10 .422 -0.16 .259 0.21 .187 0.16 .118
Hypertrophy Measurement -0.08 .476 0.19 .279 -0.19 .096* 0.07 .559 0.17 .294 -0.21 .152
Hypotropy Measurement -0.29 .051* -0.03 .859 -0.15 .180 -0.10 .484 0.01 .973 -0.11 .433
Weight Measuremnet 0.10 .053* 0.25 .207 -0.04 .806 0.02 .847 0.25 .199 -0.03 .739
CQI CQI+PBF CRC Only CRC+PBF
Ref: Control Ref: PBF Ref: Control Ref: PBF
Factor
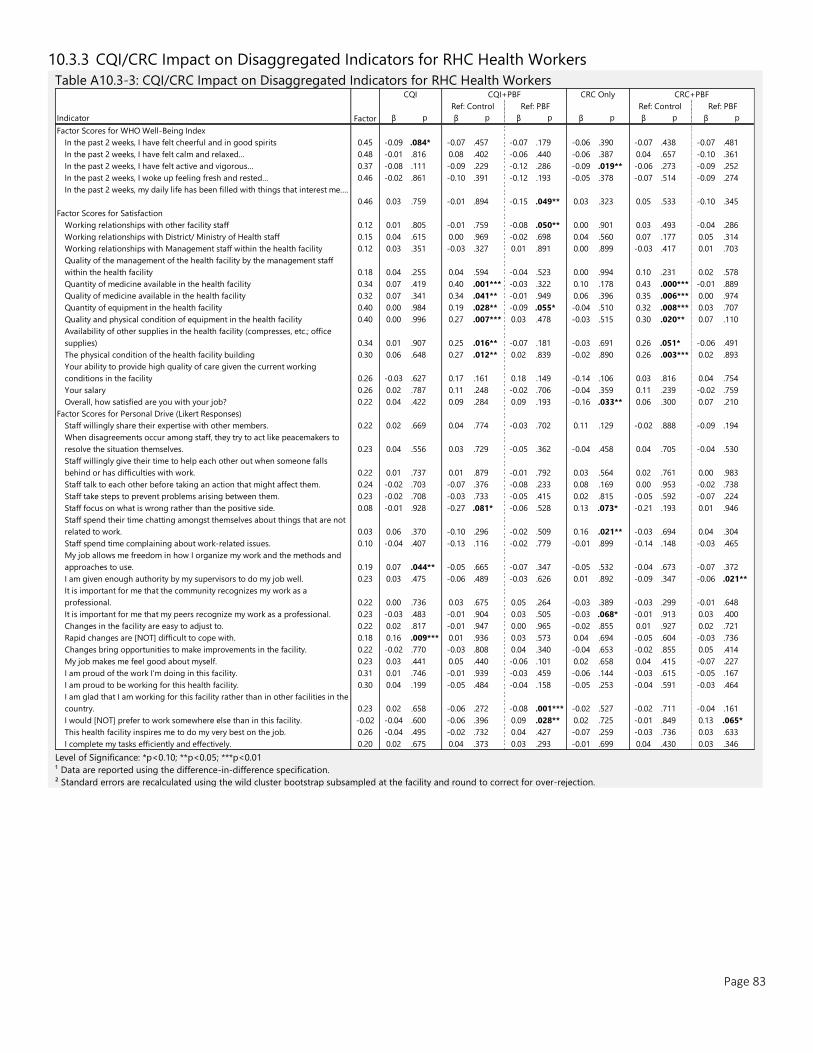
Page 83
10.3.3 CQI/CRC Impact on Disaggregated Indicators for RHC Health Workers
Table A10.3-3: CQI/CRC Impact on Disaggregated Indicators for RHC Health Workers
Level of Significance: *p<0.10; **p<0.05; ***p<0.01
¹ Data are reported using the difference-in-difference specification.
² Standard errors are recalculated using the wild cluster bootstrap subsampled at the facility and round to correct for over-rejection.
Indicator β p β p β p β p β p β p
Factor Scores for WHO Well-Being Index
In the past 2 weeks, I have felt cheerful and in good spirits 0.45 -0.09 .084* -0.07 .457 -0.07 .179 -0.06 .390 -0.07 .438 -0.07 .481
In the past 2 weeks, I have felt calm and relaxed… 0.48 -0.01 .816 0.08 .402 -0.06 .440 -0.06 .387 0.04 .657 -0.10 .361
In the past 2 weeks, I have felt active and vigorous… 0.37 -0.08 .111 -0.09 .229 -0.12 .286 -0.09 .019** -0.06 .273 -0.09 .252
In the past 2 weeks, I woke up feeling fresh and rested… 0.46 -0.02 .861 -0.10 .391 -0.12 .193 -0.05 .378 -0.07 .514 -0.09 .274
In the past 2 weeks, my daily life has been filled with things that interest me….
0.46 0.03 .759 -0.01 .894 -0.15 .049** 0.03 .323 0.05 .533 -0.10 .345
Factor Scores for Satisfaction
Working relationships with other facility staff 0.12 0.01 .805 -0.01 .759 -0.08 .050** 0.00 .901 0.03 .493 -0.04 .286
Working relationships with District/ Ministry of Health staff 0.15 0.04 .615 0.00 .969 -0.02 .698 0.04 .560 0.07 .177 0.05 .314
Working relationships with Management staff within the health facility 0.12 0.03 .351 -0.03 .327 0.01 .891 0.00 .899 -0.03 .417 0.01 .703
Quality of the management of the health facility by the management staff
within the health facility 0.18 0.04 .255 0.04 .594 -0.04 .523 0.00 .994 0.10 .231 0.02 .578
Quantity of medicine available in the health facility 0.34 0.07 .419 0.40 .001*** -0.03 .322 0.10 .178 0.43 .000*** -0.01 .889
Quality of medicine available in the health facility 0.32 0.07 .341 0.34 .041** -0.01 .949 0.06 .396 0.35 .006*** 0.00 .974
Quantity of equipment in the health facility 0.40 0.00 .984 0.19 .028** -0.09 .055* -0.04 .510 0.32 .008*** 0.03 .707
Quality and physical condition of equipment in the health facility 0.40 0.00 .996 0.27 .007*** 0.03 .478 -0.03 .515 0.30 .020** 0.07 .110
Availability of other supplies in the health facility (compresses, etc.; office
supplies) 0.34 0.01 .907 0.25 .016** -0.07 .181 -0.03 .691 0.26 .051* -0.06 .491
The physical condition of the health facility building 0.30 0.06 .648 0.27 .012** 0.02 .839 -0.02 .890 0.26 .003*** 0.02 .893
Your ability to provide high quality of care given the current working
conditions in the facility 0.26 -0.03 .627 0.17 .161 0.18 .149 -0.14 .106 0.03 .816 0.04 .754
Your salary 0.26 0.02 .787 0.11 .248 -0.02 .706 -0.04 .359 0.11 .239 -0.02 .759
Overall, how satisfied are you with your job? 0.22 0.04 .422 0.09 .284 0.09 .193 -0.16 .033** 0.06 .300 0.07 .210
Factor Scores for Personal Drive (Likert Responses)
Staff willingly share their expertise with other members. 0.22 0.02 .669 0.04 .774 -0.03 .702 0.11 .129 -0.02 .888 -0.09 .194
When disagreements occur among staff, they try to act like peacemakers to
resolve the situation themselves. 0.23 0.04 .556 0.03 .729 -0.05 .362 -0.04 .458 0.04 .705 -0.04 .530
Staff willingly give their time to help each other out when someone falls
behind or has difficulties with work. 0.22 0.01 .737 0.01 .879 -0.01 .792 0.03 .564 0.02 .761 0.00 .983
Staff talk to each other before taking an action that might affect them. 0.24 -0.02 .703 -0.07 .376 -0.08 .233 0.08 .169 0.00 .953 -0.02 .738
Staff take steps to prevent problems arising between them. 0.23 -0.02 .708 -0.03 .733 -0.05 .415 0.02 .815 -0.05 .592 -0.07 .224
Staff focus on what is wrong rather than the positive side. 0.08 -0.01 .928 -0.27 .081* -0.06 .528 0.13 .073* -0.21 .193 0.01 .946
Staff spend their time chatting amongst themselves about things that are not
related to work. 0.03 0.06 .370 -0.10 .296 -0.02 .509 0.16 .021** -0.03 .694 0.04 .304
Staff spend time complaining about work-related issues. 0.10 -0.04 .407 -0.13 .116 -0.02 .779 -0.01 .899 -0.14 .148 -0.03 .465
My job allows me freedom in how I organize my work and the methods and
approaches to use. 0.19 0.07 .044** -0.05 .665 -0.07 .347 -0.05 .532 -0.04 .673 -0.07 .372
I am given enough authority by my supervisors to do my job well. 0.23 0.03 .475 -0.06 .489 -0.03 .626 0.01 .892 -0.09 .347 -0.06 .021**
It is important for me that the community recognizes my work as a
professional. 0.22 0.00 .736 0.03 .675 0.05 .264 -0.03 .389 -0.03 .299 -0.01 .648
It is important for me that my peers recognize my work as a professional. 0.23 -0.03 .483 -0.01 .904 0.03 .505 -0.03 .068* -0.01 .913 0.03 .400
Changes in the facility are easy to adjust to. 0.22 0.02 .817 -0.01 .947 0.00 .965 -0.02 .855 0.01 .927 0.02 .721
Rapid changes are [NOT] difficult to cope with. 0.18 0.16 .009*** 0.01 .936 0.03 .573 0.04 .694 -0.05 .604 -0.03 .736
Changes bring opportunities to make improvements in the facility. 0.22 -0.02 .770 -0.03 .808 0.04 .340 -0.04 .653 -0.02 .855 0.05 .414
My job makes me feel good about myself. 0.23 0.03 .441 0.05 .440 -0.06 .101 0.02 .658 0.04 .415 -0.07 .227
I am proud of the work I'm doing in this facility. 0.31 0.01 .746 -0.01 .939 -0.03 .459 -0.06 .144 -0.03 .615 -0.05 .167
I am proud to be working for this health facility. 0.30 0.04 .199 -0.05 .484 -0.04 .158 -0.05 .253 -0.04 .591 -0.03 .464
I am glad that I am working for this facility rather than in other facilities in the
country. 0.23 0.02 .658 -0.06 .272 -0.08 .001*** -0.02 .527 -0.02 .711 -0.04 .161
I would [NOT] prefer to work somewhere else than in this facility. -0.02 -0.04 .600 -0.06 .396 0.09 .028** 0.02 .725 -0.01 .849 0.13 .065*
This health facility inspires me to do my very best on the job. 0.26 -0.04 .495 -0.02 .732 0.04 .427 -0.07 .259 -0.03 .736 0.03 .633
I complete my tasks efficiently and effectively. 0.20 0.02 .675 0.04 .373 0.03 .293 -0.01 .699 0.04 .430 0.03 .346
CQI CQI+PBF CRC Only CRC+PBF
Ref: Control Ref: ControlRef: PBF Ref: PBF
Factor
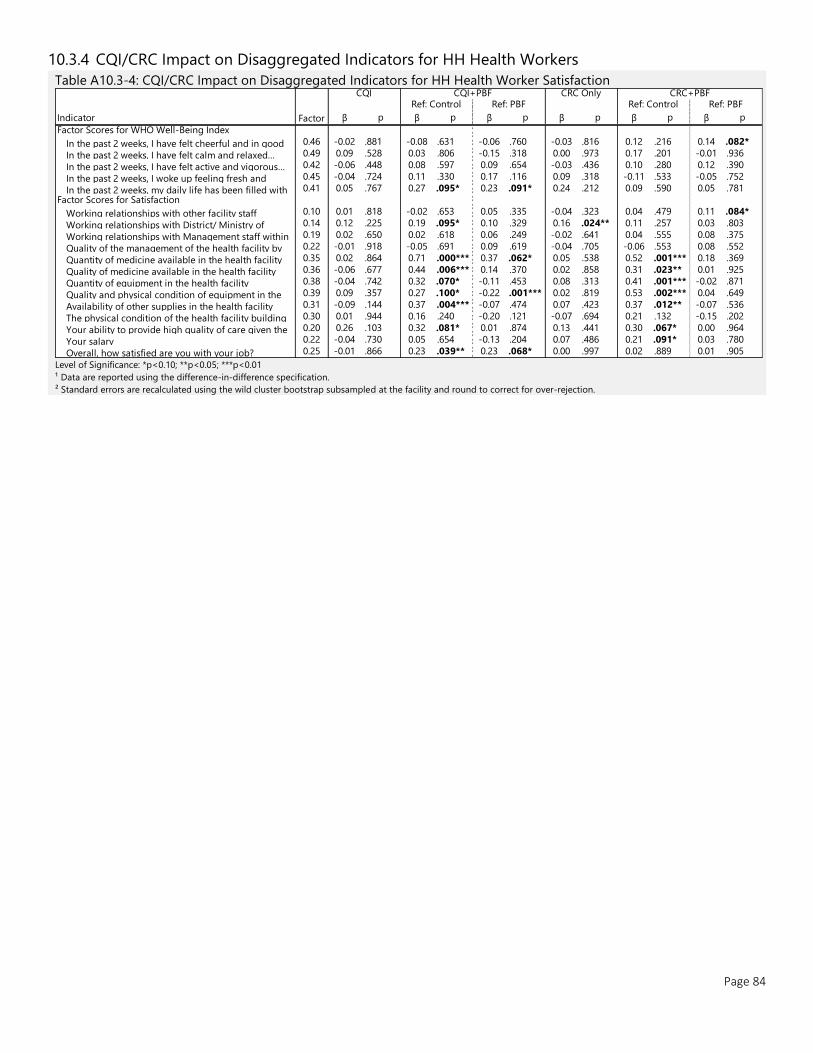
Page 84
10.3.4 CQI/CRC Impact on Disaggregated Indicators for HH Health Workers
Table A10.3-4: CQI/CRC Impact on Disaggregated Indicators for HH Health Worker Satisfaction
Level of Significance: *p<0.10; **p<0.05; ***p<0.01
¹ Data are reported using the difference-in-difference specification.
² Standard errors are recalculated using the wild cluster bootstrap subsampled at the facility and round to correct for over-rejection.
Indicator β p β p β p β p β p β p
Factor Scores for WHO Well-Being Index
In the past 2 weeks, I have felt cheerful and in good 0.46 -0.02 .881 -0.08 .631 -0.06 .760 -0.03 .816 0.12 .216 0.14 .082*
In the past 2 weeks, I have felt calm and relaxed… 0.49 0.09 .528 0.03 .806 -0.15 .318 0.00 .973 0.17 .201 -0.01 .936
In the past 2 weeks, I have felt active and vigorous… 0.42 -0.06 .448 0.08 .597 0.09 .654 -0.03 .436 0.10 .280 0.12 .390
In the past 2 weeks, I woke up feeling fresh and 0.45 -0.04 .724 0.11 .330 0.17 .116 0.09 .318 -0.11 .533 -0.05 .752
In the past 2 weeks, my daily life has been filled with 0.41 0.05 .767 0.27 .095* 0.23 .091* 0.24 .212 0.09 .590 0.05 .781
Factor Scores for Satisfaction
Working relationships with other facility staff 0.10 0.01 .818 -0.02 .653 0.05 .335 -0.04 .323 0.04 .479 0.11 .084*
Working relationships with District/ Ministry of 0.14 0.12 .225 0.19 .095* 0.10 .329 0.16 .024** 0.11 .257 0.03 .803
Working relationships with Management staff within 0.19 0.02 .650 0.02 .618 0.06 .249 -0.02 .641 0.04 .555 0.08 .375
Quality of the management of the health facility by 0.22 -0.01 .918 -0.05 .691 0.09 .619 -0.04 .705 -0.06 .553 0.08 .552
Quantity of medicine available in the health facility 0.35 0.02 .864 0.71 .000*** 0.37 .062* 0.05 .538 0.52 .001*** 0.18 .369
Quality of medicine available in the health facility 0.36 -0.06 .677 0.44 .006*** 0.14 .370 0.02 .858 0.31 .023** 0.01 .925
Quantity of equipment in the health facility 0.38 -0.04 .742 0.32 .070* -0.11 .453 0.08 .313 0.41 .001*** -0.02 .871
Quality and physical condition of equipment in the 0.39 0.09 .357 0.27 .100* -0.22 .001*** 0.02 .819 0.53 .002*** 0.04 .649
Availability of other supplies in the health facility 0.31 -0.09 .144 0.37 .004*** -0.07 .474 0.07 .423 0.37 .012** -0.07 .536
The physical condition of the health facility building 0.30 0.01 .944 0.16 .240 -0.20 .121 -0.07 .694 0.21 .132 -0.15 .202
Your ability to provide high quality of care given the 0.20 0.26 .103 0.32 .081* 0.01 .874 0.13 .441 0.30 .067* 0.00 .964
Your salary 0.22 -0.04 .730 0.05 .654 -0.13 .204 0.07 .486 0.21 .091* 0.03 .780
Overall, how satisfied are you with your job? 0.25 -0.01 .866 0.23 .039** 0.23 .068* 0.00 .997 0.02 .889 0.01 .905
Factor
CQI CQI+PBF CRC Only CRC+PBFRef: Control Ref: PBF Ref: Control Ref: PBF
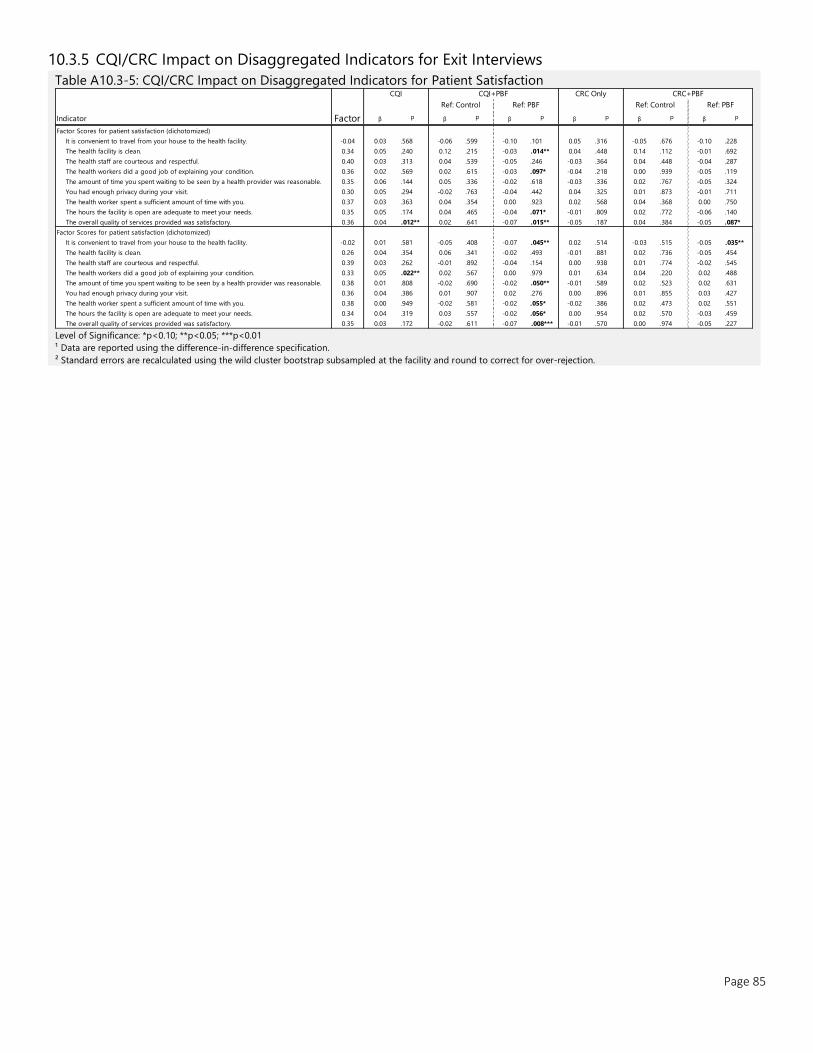
Page 85
10.3.5 CQI/CRC Impact on Disaggregated Indicators for Exit Interviews
Table A10.3-5: CQI/CRC Impact on Disaggregated Indicators for Patient Satisfaction
Level of Significance: *p<0.10; **p<0.05; ***p<0.01
¹ Data are reported using the difference-in-difference specification.
² Standard errors are recalculated using the wild cluster bootstrap subsampled at the facility and round to correct for over-rejection.
Indicator β p β p β p β p β p β p
Factor Scores for patient satisfaction (dichotomized)
It is convenient to travel from your house to the health facility. -0.04 0.03 .568 -0.06 .599 -0.10 .101 0.05 .316 -0.05 .676 -0.10 .228
The health facility is clean. 0.34 0.05 .240 0.12 .215 -0.03 .014** 0.04 .448 0.14 .112 -0.01 .692
The health staff are courteous and respectful. 0.40 0.03 .313 0.04 .539 -0.05 .246 -0.03 .364 0.04 .448 -0.04 .287
The health workers did a good job of explaining your condition. 0.36 0.02 .569 0.02 .615 -0.03 .097* -0.04 .218 0.00 .939 -0.05 .119
The amount of time you spent waiting to be seen by a health provider was reasonable. 0.35 0.06 .144 0.05 .336 -0.02 .618 -0.03 .336 0.02 .767 -0.05 .324
You had enough privacy during your visit. 0.30 0.05 .294 -0.02 .763 -0.04 .442 0.04 .325 0.01 .873 -0.01 .711
The health worker spent a sufficient amount of time with you. 0.37 0.03 .363 0.04 .354 0.00 .923 0.02 .568 0.04 .368 0.00 .750
The hours the facility is open are adequate to meet your needs. 0.35 0.05 .174 0.04 .465 -0.04 .071* -0.01 .809 0.02 .772 -0.06 .140
The overall quality of services provided was satisfactory. 0.36 0.04 .012** 0.02 .641 -0.07 .015** -0.05 .187 0.04 .384 -0.05 .087*
Factor Scores for patient satisfaction (dichotomized)
It is convenient to travel from your house to the health facility. -0.02 0.01 .581 -0.05 .408 -0.07 .045** 0.02 .514 -0.03 .515 -0.05 .035**
The health facility is clean. 0.26 0.04 .354 0.06 .341 -0.02 .493 -0.01 .881 0.02 .736 -0.05 .454
The health staff are courteous and respectful. 0.39 0.03 .262 -0.01 .892 -0.04 .154 0.00 .938 0.01 .774 -0.02 .545
The health workers did a good job of explaining your condition. 0.33 0.05 .022** 0.02 .567 0.00 .979 0.01 .634 0.04 .220 0.02 .488
The amount of time you spent waiting to be seen by a health provider was reasonable. 0.38 0.01 .808 -0.02 .690 -0.02 .050** -0.01 .589 0.02 .523 0.02 .631
You had enough privacy during your visit. 0.36 0.04 .386 0.01 .907 0.02 .276 0.00 .896 0.01 .855 0.03 .427
The health worker spent a sufficient amount of time with you. 0.38 0.00 .949 -0.02 .581 -0.02 .055* -0.02 .386 0.02 .473 0.02 .551
The hours the facility is open are adequate to meet your needs. 0.34 0.04 .319 0.03 .557 -0.02 .056* 0.00 .954 0.02 .570 -0.03 .459
The overall quality of services provided was satisfactory. 0.35 0.03 .172 -0.02 .611 -0.07 .008*** -0.01 .570 0.00 .974 -0.05 .227
Factor
CQI CQI+PBF CRC Only CRC+PBF
Ref: Control Ref: PBF Ref: Control Ref: PBF
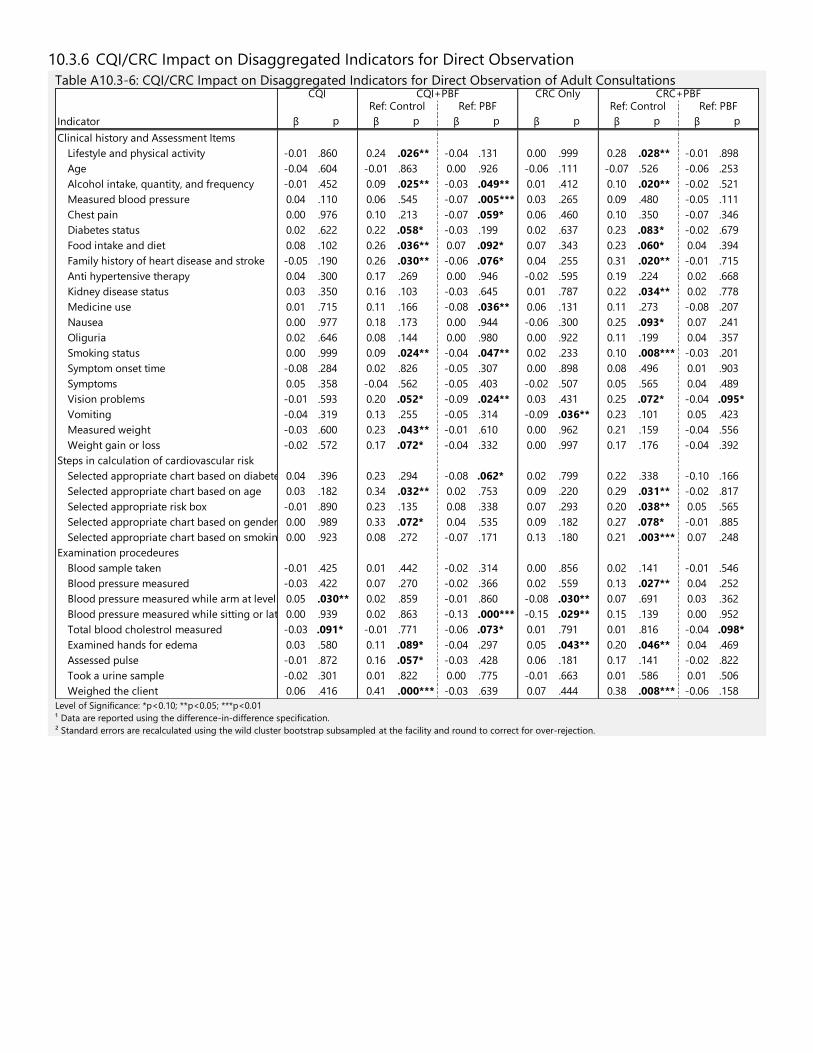
10.3.6 CQI/CRC Impact on Disaggregated Indicators for Direct Observation
Table A10.3-6: CQI/CRC Impact on Disaggregated Indicators for Direct Observation of Adult Consultations
Level of Significance: *p<0.10; **p<0.05; ***p<0.01
¹ Data are reported using the difference-in-difference specification.
² Standard errors are recalculated using the wild cluster bootstrap subsampled at the facility and round to correct for over-rejection.
Indicator β p β p β p β p β p β p
Clinical history and Assessment Items
Lifestyle and physical activity -0.01 .860 0.24 .026** -0.04 .131 0.00 .999 0.28 .028** -0.01 .898
Age -0.04 .604 -0.01 .863 0.00 .926 -0.06 .111 -0.07 .526 -0.06 .253
Alcohol intake, quantity, and frequency -0.01 .452 0.09 .025** -0.03 .049** 0.01 .412 0.10 .020** -0.02 .521
Measured blood pressure 0.04 .110 0.06 .545 -0.07 .005*** 0.03 .265 0.09 .480 -0.05 .111
Chest pain 0.00 .976 0.10 .213 -0.07 .059* 0.06 .460 0.10 .350 -0.07 .346
Diabetes status 0.02 .622 0.22 .058* -0.03 .199 0.02 .637 0.23 .083* -0.02 .679
Food intake and diet 0.08 .102 0.26 .036** 0.07 .092* 0.07 .343 0.23 .060* 0.04 .394
Family history of heart disease and stroke -0.05 .190 0.26 .030** -0.06 .076* 0.04 .255 0.31 .020** -0.01 .715
Anti hypertensive therapy 0.04 .300 0.17 .269 0.00 .946 -0.02 .595 0.19 .224 0.02 .668
Kidney disease status 0.03 .350 0.16 .103 -0.03 .645 0.01 .787 0.22 .034** 0.02 .778
Medicine use 0.01 .715 0.11 .166 -0.08 .036** 0.06 .131 0.11 .273 -0.08 .207
Nausea 0.00 .977 0.18 .173 0.00 .944 -0.06 .300 0.25 .093* 0.07 .241
Oliguria 0.02 .646 0.08 .144 0.00 .980 0.00 .922 0.11 .199 0.04 .357
Smoking status 0.00 .999 0.09 .024** -0.04 .047** 0.02 .233 0.10 .008*** -0.03 .201
Symptom onset time -0.08 .284 0.02 .826 -0.05 .307 0.00 .898 0.08 .496 0.01 .903
Symptoms 0.05 .358 -0.04 .562 -0.05 .403 -0.02 .507 0.05 .565 0.04 .489
Vision problems -0.01 .593 0.20 .052* -0.09 .024** 0.03 .431 0.25 .072* -0.04 .095*
Vomiting -0.04 .319 0.13 .255 -0.05 .314 -0.09 .036** 0.23 .101 0.05 .423
Measured weight -0.03 .600 0.23 .043** -0.01 .610 0.00 .962 0.21 .159 -0.04 .556
Weight gain or loss -0.02 .572 0.17 .072* -0.04 .332 0.00 .997 0.17 .176 -0.04 .392
Steps in calculation of cardiovascular risk
Selected appropriate chart based on diabetes 0.04 .396 0.23 .294 -0.08 .062* 0.02 .799 0.22 .338 -0.10 .166
Selected appropriate chart based on age 0.03 .182 0.34 .032** 0.02 .753 0.09 .220 0.29 .031** -0.02 .817
Selected appropriate risk box -0.01 .890 0.23 .135 0.08 .338 0.07 .293 0.20 .038** 0.05 .565
Selected appropriate chart based on gender 0.00 .989 0.33 .072* 0.04 .535 0.09 .182 0.27 .078* -0.01 .885
Selected appropriate chart based on smoking status0.00 .923 0.08 .272 -0.07 .171 0.13 .180 0.21 .003*** 0.07 .248
Examination procedeures
Blood sample taken -0.01 .425 0.01 .442 -0.02 .314 0.00 .856 0.02 .141 -0.01 .546
Blood pressure measured -0.03 .422 0.07 .270 -0.02 .366 0.02 .559 0.13 .027** 0.04 .252
Blood pressure measured while arm at level with heart0.05 .030** 0.02 .859 -0.01 .860 -0.08 .030** 0.07 .691 0.03 .362
Blood pressure measured while sitting or lateral position0.00 .939 0.02 .863 -0.13 .000*** -0.15 .029** 0.15 .139 0.00 .952
Total blood cholestrol measured -0.03 .091* -0.01 .771 -0.06 .073* 0.01 .791 0.01 .816 -0.04 .098*
Examined hands for edema 0.03 .580 0.11 .089* -0.04 .297 0.05 .043** 0.20 .046** 0.04 .469
Assessed pulse -0.01 .872 0.16 .057* -0.03 .428 0.06 .181 0.17 .141 -0.02 .822
Took a urine sample -0.02 .301 0.01 .822 0.00 .775 -0.01 .663 0.01 .586 0.01 .506
Weighed the client 0.06 .416 0.41 .000*** -0.03 .639 0.07 .444 0.38 .008*** -0.06 .158
CRC Only CRC+PBFRef: Control Ref: Control Ref: PBFRef: PBF
CQI CQI+PBF
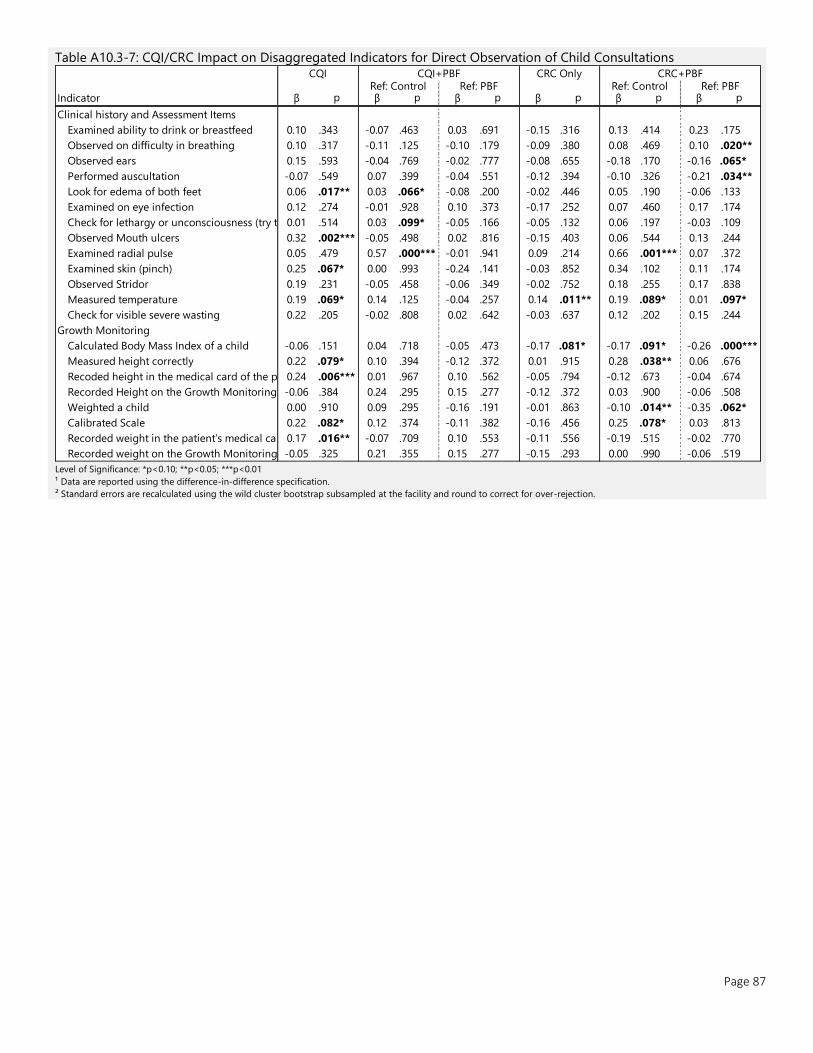
Page 87
Table A10.3-7: CQI/CRC Impact on Disaggregated Indicators for Direct Observation of Child Consultations
Level of Significance: *p<0.10; **p<0.05; ***p<0.01
¹ Data are reported using the difference-in-difference specification.
² Standard errors are recalculated using the wild cluster bootstrap subsampled at the facility and round to correct for over-rejection.
Indicator β p β p β p β p β p β p
Clinical history and Assessment Items
Examined ability to drink or breastfeed 0.10 .343 -0.07 .463 0.03 .691 -0.15 .316 0.13 .414 0.23 .175
Observed on difficulty in breathing 0.10 .317 -0.11 .125 -0.10 .179 -0.09 .380 0.08 .469 0.10 .020**
Observed ears 0.15 .593 -0.04 .769 -0.02 .777 -0.08 .655 -0.18 .170 -0.16 .065*
Performed auscultation -0.07 .549 0.07 .399 -0.04 .551 -0.12 .394 -0.10 .326 -0.21 .034**
Look for edema of both feet 0.06 .017** 0.03 .066* -0.08 .200 -0.02 .446 0.05 .190 -0.06 .133
Examined on eye infection 0.12 .274 -0.01 .928 0.10 .373 -0.17 .252 0.07 .460 0.17 .174
Check for lethargy or unconsciousness (try to wake up the child)0.01 .514 0.03 .099* -0.05 .166 -0.05 .132 0.06 .197 -0.03 .109
Observed Mouth ulcers 0.32 .002*** -0.05 .498 0.02 .816 -0.15 .403 0.06 .544 0.13 .244
Examined radial pulse 0.05 .479 0.57 .000*** -0.01 .941 0.09 .214 0.66 .001*** 0.07 .372
Examined skin (pinch) 0.25 .067* 0.00 .993 -0.24 .141 -0.03 .852 0.34 .102 0.11 .174
Observed Stridor 0.19 .231 -0.05 .458 -0.06 .349 -0.02 .752 0.18 .255 0.17 .838
Measured temperature 0.19 .069* 0.14 .125 -0.04 .257 0.14 .011** 0.19 .089* 0.01 .097*
Check for visible severe wasting 0.22 .205 -0.02 .808 0.02 .642 -0.03 .637 0.12 .202 0.15 .244
Growth Monitoring
Calculated Body Mass Index of a child -0.06 .151 0.04 .718 -0.05 .473 -0.17 .081* -0.17 .091* -0.26 .000***
Measured height correctly 0.22 .079* 0.10 .394 -0.12 .372 0.01 .915 0.28 .038** 0.06 .676
Recoded height in the medical card of the patient0.24 .006*** 0.01 .967 0.10 .562 -0.05 .794 -0.12 .673 -0.04 .674
Recorded Height on the Growth Monitoring Chart-0.06 .384 0.24 .295 0.15 .277 -0.12 .372 0.03 .900 -0.06 .508
Weighted a child 0.00 .910 0.09 .295 -0.16 .191 -0.01 .863 -0.10 .014** -0.35 .062*
Calibrated Scale 0.22 .082* 0.12 .374 -0.11 .382 -0.16 .456 0.25 .078* 0.03 .813
Recorded weight in the patient’s medical card0.17 .016** -0.07 .709 0.10 .553 -0.11 .556 -0.19 .515 -0.02 .770
Recorded weight on the Growth Monitoring Chart-0.05 .325 0.21 .355 0.15 .277 -0.15 .293 0.00 .990 -0.06 .519
CQI CQI+PBF CRC Only CRC+PBFRef: Control Ref: PBF Ref: Control Ref: PBF
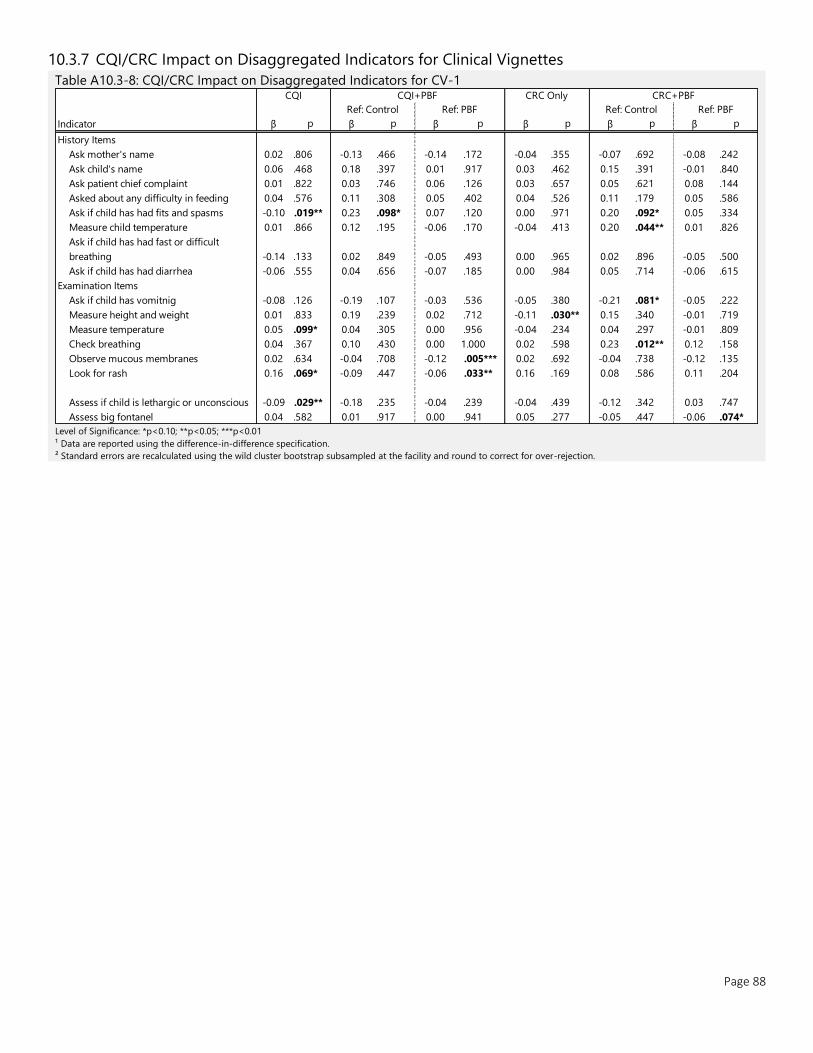
Page 88
10.3.7 CQI/CRC Impact on Disaggregated Indicators for Clinical Vignettes
Table A10.3-8: CQI/CRC Impact on Disaggregated Indicators for CV-1
Level of Significance: *p<0.10; **p<0.05; ***p<0.01
¹ Data are reported using the difference-in-difference specification.
² Standard errors are recalculated using the wild cluster bootstrap subsampled at the facility and round to correct for over-rejection.
Indicator β p β p β p β p β p β p
History Items
Ask mother's name 0.02 .806 -0.13 .466 -0.14 .172 -0.04 .355 -0.07 .692 -0.08 .242
Ask child's name 0.06 .468 0.18 .397 0.01 .917 0.03 .462 0.15 .391 -0.01 .840
Ask patient chief complaint 0.01 .822 0.03 .746 0.06 .126 0.03 .657 0.05 .621 0.08 .144
Asked about any difficulty in feeding 0.04 .576 0.11 .308 0.05 .402 0.04 .526 0.11 .179 0.05 .586
Ask if child has had fits and spasms -0.10 .019** 0.23 .098* 0.07 .120 0.00 .971 0.20 .092* 0.05 .334
Measure child temperature 0.01 .866 0.12 .195 -0.06 .170 -0.04 .413 0.20 .044** 0.01 .826
Ask if child has had fast or difficult
breathing -0.14 .133 0.02 .849 -0.05 .493 0.00 .965 0.02 .896 -0.05 .500
Ask if child has had diarrhea -0.06 .555 0.04 .656 -0.07 .185 0.00 .984 0.05 .714 -0.06 .615
Examination Items
Ask if child has vomitnig -0.08 .126 -0.19 .107 -0.03 .536 -0.05 .380 -0.21 .081* -0.05 .222
Measure height and weight 0.01 .833 0.19 .239 0.02 .712 -0.11 .030** 0.15 .340 -0.01 .719
Measure temperature 0.05 .099* 0.04 .305 0.00 .956 -0.04 .234 0.04 .297 -0.01 .809
Check breathing 0.04 .367 0.10 .430 0.00 1.000 0.02 .598 0.23 .012** 0.12 .158
Observe mucous membranes 0.02 .634 -0.04 .708 -0.12 .005*** 0.02 .692 -0.04 .738 -0.12 .135
Look for rash 0.16 .069* -0.09 .447 -0.06 .033** 0.16 .169 0.08 .586 0.11 .204
Assess if child is lethargic or unconscious -0.09 .029** -0.18 .235 -0.04 .239 -0.04 .439 -0.12 .342 0.03 .747
Assess big fontanel 0.04 .582 0.01 .917 0.00 .941 0.05 .277 -0.05 .447 -0.06 .074*
CQI CQI+PBF CRC Only CRC+PBF
Ref: Control Ref: PBFRef: Control Ref: PBF
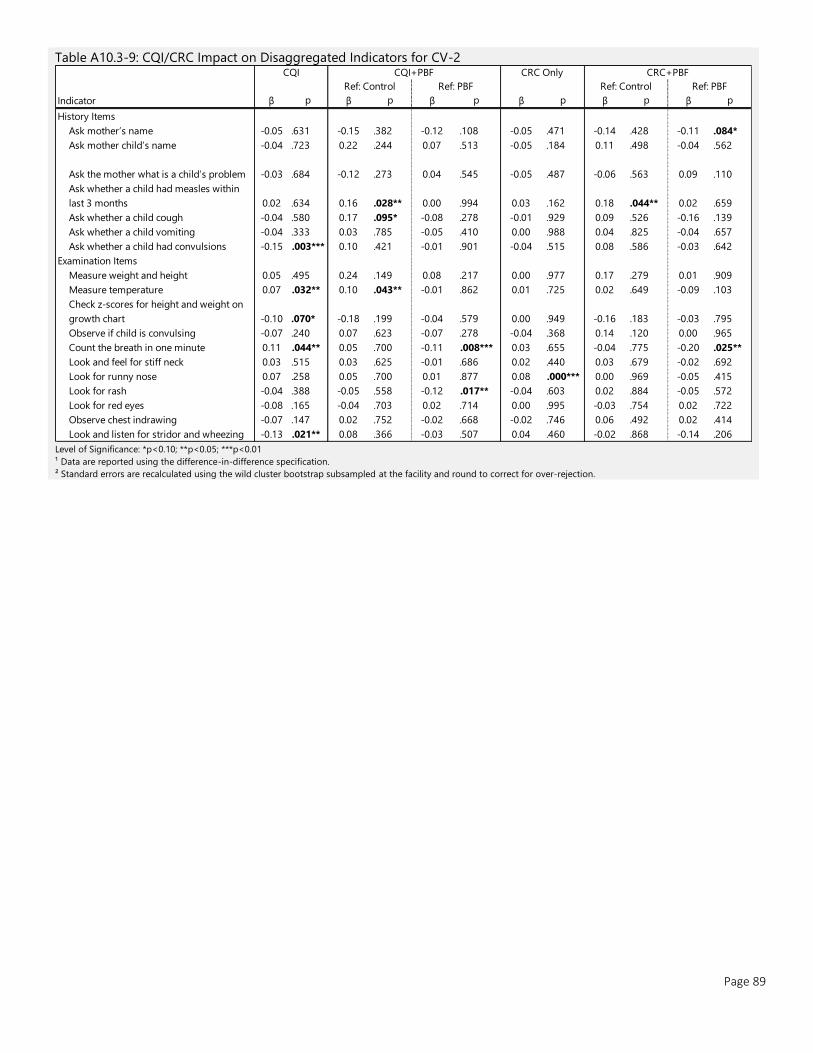
Page 89
Table A10.3-9: CQI/CRC Impact on Disaggregated Indicators for CV-2
Level of Significance: *p<0.10; **p<0.05; ***p<0.01
¹ Data are reported using the difference-in-difference specification.
² Standard errors are recalculated using the wild cluster bootstrap subsampled at the facility and round to correct for over-rejection.
Indicator β p β p β p β p β p β p
History Items
Ask mother’s name -0.05 .631 -0.15 .382 -0.12 .108 -0.05 .471 -0.14 .428 -0.11 .084*
Ask mother child’s name -0.04 .723 0.22 .244 0.07 .513 -0.05 .184 0.11 .498 -0.04 .562
Ask the mother what is a child’s problem -0.03 .684 -0.12 .273 0.04 .545 -0.05 .487 -0.06 .563 0.09 .110
Ask whether a child had measles within
last 3 months 0.02 .634 0.16 .028** 0.00 .994 0.03 .162 0.18 .044** 0.02 .659
Ask whether a child cough -0.04 .580 0.17 .095* -0.08 .278 -0.01 .929 0.09 .526 -0.16 .139
Ask whether a child vomiting -0.04 .333 0.03 .785 -0.05 .410 0.00 .988 0.04 .825 -0.04 .657
Ask whether a child had convulsions -0.15 .003*** 0.10 .421 -0.01 .901 -0.04 .515 0.08 .586 -0.03 .642
Examination Items
Measure weight and height 0.05 .495 0.24 .149 0.08 .217 0.00 .977 0.17 .279 0.01 .909
Measure temperature 0.07 .032** 0.10 .043** -0.01 .862 0.01 .725 0.02 .649 -0.09 .103
Check z-scores for height and weight on
growth chart -0.10 .070* -0.18 .199 -0.04 .579 0.00 .949 -0.16 .183 -0.03 .795
Observe if child is convulsing -0.07 .240 0.07 .623 -0.07 .278 -0.04 .368 0.14 .120 0.00 .965
Count the breath in one minute 0.11 .044** 0.05 .700 -0.11 .008*** 0.03 .655 -0.04 .775 -0.20 .025**
Look and feel for stiff neck 0.03 .515 0.03 .625 -0.01 .686 0.02 .440 0.03 .679 -0.02 .692
Look for runny nose 0.07 .258 0.05 .700 0.01 .877 0.08 .000*** 0.00 .969 -0.05 .415
Look for rash -0.04 .388 -0.05 .558 -0.12 .017** -0.04 .603 0.02 .884 -0.05 .572
Look for red eyes -0.08 .165 -0.04 .703 0.02 .714 0.00 .995 -0.03 .754 0.02 .722
Observe chest indrawing -0.07 .147 0.02 .752 -0.02 .668 -0.02 .746 0.06 .492 0.02 .414
Look and listen for stridor and wheezing -0.13 .021** 0.08 .366 -0.03 .507 0.04 .460 -0.02 .868 -0.14 .206
CQI CQI+PBF CRC Only CRC+PBF
Ref: Control Ref: PBF Ref: Control Ref: PBF
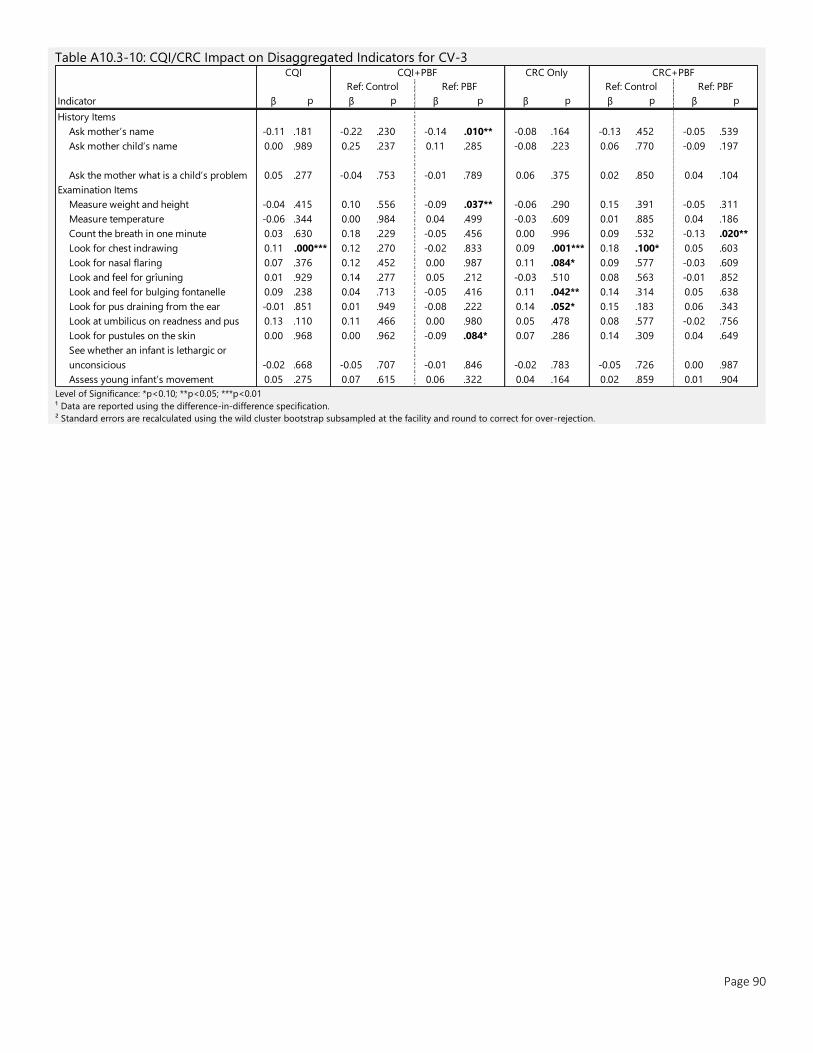
Page 90
Table A10.3-10: CQI/CRC Impact on Disaggregated Indicators for CV-3
Level of Significance: *p<0.10; **p<0.05; ***p<0.01
¹ Data are reported using the difference-in-difference specification.
² Standard errors are recalculated using the wild cluster bootstrap subsampled at the facility and round to correct for over-rejection.
Indicator β p β p β p β p β p β p
History Items
Ask mother’s name -0.11 .181 -0.22 .230 -0.14 .010** -0.08 .164 -0.13 .452 -0.05 .539
Ask mother child’s name 0.00 .989 0.25 .237 0.11 .285 -0.08 .223 0.06 .770 -0.09 .197
Ask the mother what is a child’s problem 0.05 .277 -0.04 .753 -0.01 .789 0.06 .375 0.02 .850 0.04 .104
Examination Items
Measure weight and height -0.04 .415 0.10 .556 -0.09 .037** -0.06 .290 0.15 .391 -0.05 .311
Measure temperature -0.06 .344 0.00 .984 0.04 .499 -0.03 .609 0.01 .885 0.04 .186
Count the breath in one minute 0.03 .630 0.18 .229 -0.05 .456 0.00 .996 0.09 .532 -0.13 .020**
Look for chest indrawing 0.11 .000*** 0.12 .270 -0.02 .833 0.09 .001*** 0.18 .100* 0.05 .603
Look for nasal flaring 0.07 .376 0.12 .452 0.00 .987 0.11 .084* 0.09 .577 -0.03 .609
Look and feel for grîuning 0.01 .929 0.14 .277 0.05 .212 -0.03 .510 0.08 .563 -0.01 .852
Look and feel for bulging fontanelle 0.09 .238 0.04 .713 -0.05 .416 0.11 .042** 0.14 .314 0.05 .638
Look for pus draining from the ear -0.01 .851 0.01 .949 -0.08 .222 0.14 .052* 0.15 .183 0.06 .343
Look at umbilicus on readness and pus 0.13 .110 0.11 .466 0.00 .980 0.05 .478 0.08 .577 -0.02 .756
Look for pustules on the skin 0.00 .968 0.00 .962 -0.09 .084* 0.07 .286 0.14 .309 0.04 .649
See whether an infant is lethargic or
unconsicious -0.02 .668 -0.05 .707 -0.01 .846 -0.02 .783 -0.05 .726 0.00 .987
Assess young infant’s movement 0.05 .275 0.07 .615 0.06 .322 0.04 .164 0.02 .859 0.01 .904
CQI CQI+PBF CRC Only CRC+PBF
Ref: Control Ref: PBF Ref: Control Ref: PBF

Page 91
Table A10.3-11: CQI/CRC Impact on Disaggregated Indicators for CV-4
Level of Significance: *p<0.10; **p<0.05; ***p<0.01
¹ Data are reported using the difference-in-difference specification.
² Standard errors are recalculated using the wild cluster bootstrap subsampled at the facility and round to correct for over-rejection.
Indicator β p β p β p β p β p β p
History Items
Ask mother’s name -0.02 .840 -0.16 .372 -0.09 .177 -0.03 .667 -0.17 .349 -0.10 .230
Ask mother child’s name 0.07 .459 0.24 .255 0.05 .572 0.04 .557 0.13 .485 -0.06 .193
Ask about age of the child 0.06 .107 0.32 .079* 0.14 .111 -0.04 .631 0.22 .148 0.03 .596
Ask the mother what is a child’s problem 0.01 .912 0.01 .925 0.04 .300 0.04 .483 0.01 .933 0.04 .388
Ask whether the child vomits -0.04 .477 -0.12 .289 -0.06 .076* -0.09 .291 -0.09 .547 -0.03 .713
Ask whether a child has fits or spasms
(convulsion) -0.06 .187 0.08 .605 -0.08 .361 0.00 .980 0.12 .343 -0.04 .518
Ask whether a child has cough or difficult
breathing -0.03 .423 0.27 .000*** -0.05 .469 0.06 .158 0.29 .045** -0.03 .629
Will ask whether a child has a diarrhea -0.09 .071* 0.04 .659 -0.11 .178 0.10 .313 -0.03 .721 -0.18 .070*
Examination Items
Measure weight and height 0.03 .720 0.21 .197 0.08 .185 -0.07 .136 0.23 .142 0.09 .081*
Measure temperature 0.04 .539 0.05 .477 0.02 .692 -0.01 .914 -0.01 .819 -0.04 .148
Check whether a child can drink or
breastfeed -0.08 .219 -0.04 .637 0.12 .082* -0.01 .797 0.01 .940 0.17 .030**
Look whether the child is letargic or
uncontious -0.05 .253 -0.19 .187 -0.07 .308 0.03 .619 -0.07 .585 0.05 .483
Count the breath in one minute 0.04 .544 0.05 .662 -0.07 .207 0.03 .644 0.01 .945 -0.11 .142
Look for chest indrawing 0.03 .398 0.04 .709 0.01 .883 0.07 .063* 0.01 .911 -0.02 .493
Look and listen for stridor or wheezing -0.01 .870 0.11 .131 -0.01 .876 0.04 .459 0.09 .242 -0.03 .530
Will look and feel for odema on both feet -0.01 .579 -0.06 .510 0.00 1.000 0.04 .088* -0.07 .402 -0.01 .895
Check skin and palms of a child on palmar
pallor 0.02 .649 0.08 .261 -0.07 .093* 0.03 .608 0.20 .027** 0.05 .358
Assess child feeding -0.03 .417 0.03 .762 -0.01 .877 0.06 .114 0.06 .369 0.02 .366
Blood test 0.00 .958 -0.09 .368 -0.04 .583 0.02 .721 -0.01 .906 0.04 .221
Test on worms -0.03 .246 -0.02 .807 -0.02 .703 0.02 .413 0.03 .646 0.03 .277
CQI CQI+PBF CRC Only CRC+PBF
Ref: Control Ref: PBF Ref: Control Ref: PBF
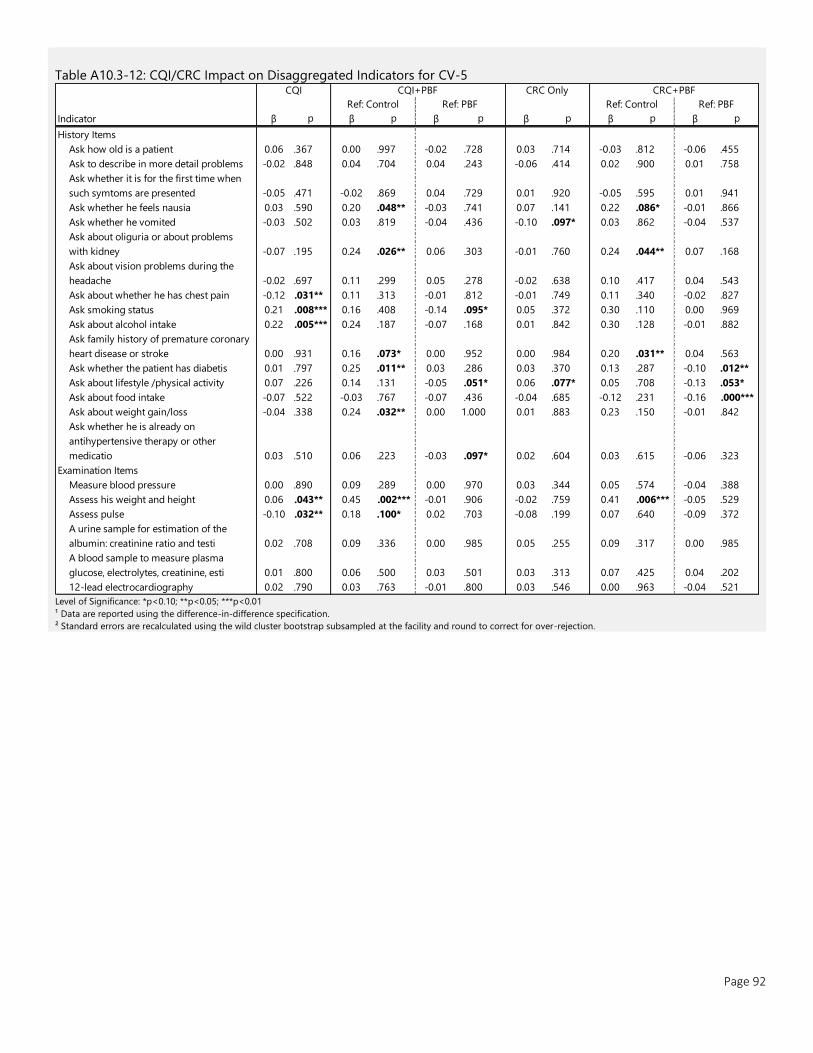
Page 92
Table A10.3-12: CQI/CRC Impact on Disaggregated Indicators for CV-5
Level of Significance: *p<0.10; **p<0.05; ***p<0.01
¹ Data are reported using the difference-in-difference specification.
² Standard errors are recalculated using the wild cluster bootstrap subsampled at the facility and round to correct for over-rejection.
Indicator β p β p β p β p β p β p
History Items
Ask how old is a patient 0.06 .367 0.00 .997 -0.02 .728 0.03 .714 -0.03 .812 -0.06 .455
Ask to describe in more detail problems -0.02 .848 0.04 .704 0.04 .243 -0.06 .414 0.02 .900 0.01 .758
Ask whether it is for the first time when
such symtoms are presented -0.05 .471 -0.02 .869 0.04 .729 0.01 .920 -0.05 .595 0.01 .941
Ask whether he feels nausia 0.03 .590 0.20 .048** -0.03 .741 0.07 .141 0.22 .086* -0.01 .866
Ask whether he vomited -0.03 .502 0.03 .819 -0.04 .436 -0.10 .097* 0.03 .862 -0.04 .537
Ask about oliguria or about problems
with kidney -0.07 .195 0.24 .026** 0.06 .303 -0.01 .760 0.24 .044** 0.07 .168
Ask about vision problems during the
headache -0.02 .697 0.11 .299 0.05 .278 -0.02 .638 0.10 .417 0.04 .543
Ask about whether he has chest pain -0.12 .031** 0.11 .313 -0.01 .812 -0.01 .749 0.11 .340 -0.02 .827
Ask smoking status 0.21 .008*** 0.16 .408 -0.14 .095* 0.05 .372 0.30 .110 0.00 .969
Ask about alcohol intake 0.22 .005*** 0.24 .187 -0.07 .168 0.01 .842 0.30 .128 -0.01 .882
Ask family history of premature coronary
heart disease or stroke 0.00 .931 0.16 .073* 0.00 .952 0.00 .984 0.20 .031** 0.04 .563
Ask whether the patient has diabetis 0.01 .797 0.25 .011** 0.03 .286 0.03 .370 0.13 .287 -0.10 .012**
Ask about lifestyle /physical activity 0.07 .226 0.14 .131 -0.05 .051* 0.06 .077* 0.05 .708 -0.13 .053*
Ask about food intake -0.07 .522 -0.03 .767 -0.07 .436 -0.04 .685 -0.12 .231 -0.16 .000***
Ask about weight gain/loss -0.04 .338 0.24 .032** 0.00 1.000 0.01 .883 0.23 .150 -0.01 .842
Ask whether he is already on
antihypertensive therapy or other
medicatio 0.03 .510 0.06 .223 -0.03 .097* 0.02 .604 0.03 .615 -0.06 .323
Examination Items
Measure blood pressure 0.00 .890 0.09 .289 0.00 .970 0.03 .344 0.05 .574 -0.04 .388
Assess his weight and height 0.06 .043** 0.45 .002*** -0.01 .906 -0.02 .759 0.41 .006*** -0.05 .529
Assess pulse -0.10 .032** 0.18 .100* 0.02 .703 -0.08 .199 0.07 .640 -0.09 .372
A urine sample for estimation of the
albumin: creatinine ratio and testi 0.02 .708 0.09 .336 0.00 .985 0.05 .255 0.09 .317 0.00 .985
A blood sample to measure plasma
glucose, electrolytes, creatinine, esti 0.01 .800 0.06 .500 0.03 .501 0.03 .313 0.07 .425 0.04 .202
12-lead electrocardiography 0.02 .790 0.03 .763 -0.01 .800 0.03 .546 0.00 .963 -0.04 .521
CQI CQI+PBF CRC Only CRC+PBF
Ref: Control Ref: PBF Ref: Control Ref: PBF
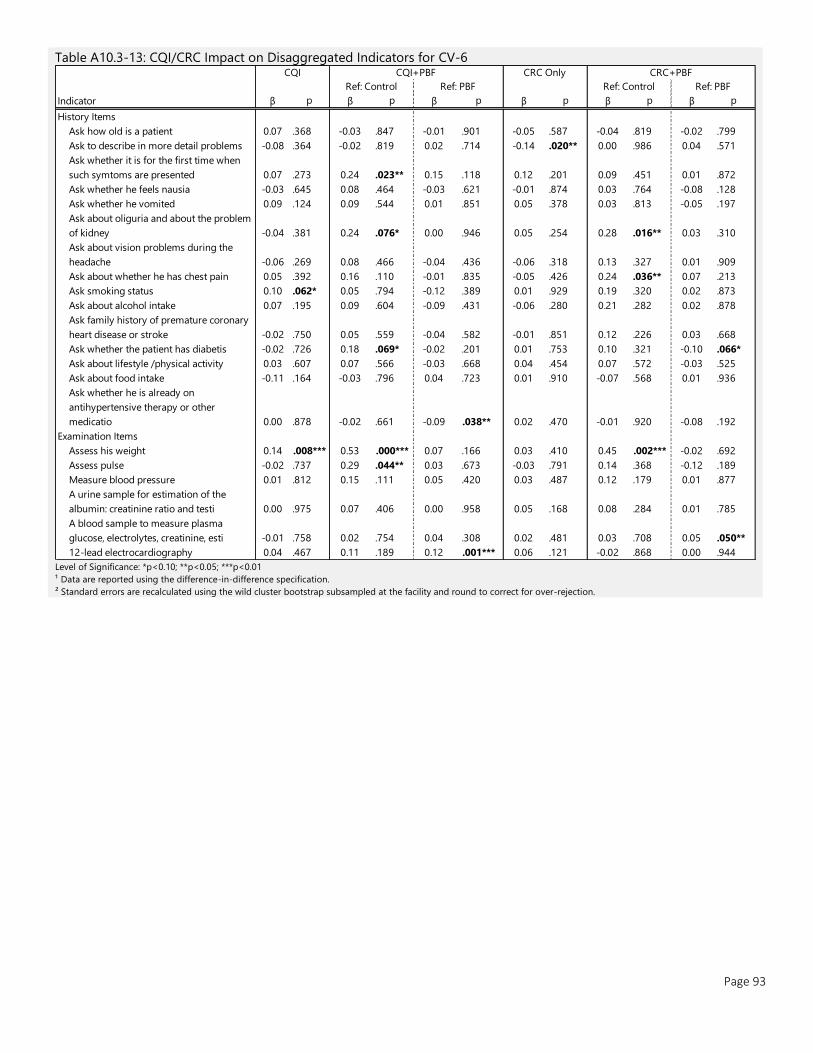
Page 93
Table A10.3-13: CQI/CRC Impact on Disaggregated Indicators for CV-6
Level of Significance: *p<0.10; **p<0.05; ***p<0.01
¹ Data are reported using the difference-in-difference specification.
² Standard errors are recalculated using the wild cluster bootstrap subsampled at the facility and round to correct for over-rejection.
Indicator β p β p β p β p β p β p
History Items
Ask how old is a patient 0.07 .368 -0.03 .847 -0.01 .901 -0.05 .587 -0.04 .819 -0.02 .799
Ask to describe in more detail problems -0.08 .364 -0.02 .819 0.02 .714 -0.14 .020** 0.00 .986 0.04 .571
Ask whether it is for the first time when
such symtoms are presented 0.07 .273 0.24 .023** 0.15 .118 0.12 .201 0.09 .451 0.01 .872
Ask whether he feels nausia -0.03 .645 0.08 .464 -0.03 .621 -0.01 .874 0.03 .764 -0.08 .128
Ask whether he vomited 0.09 .124 0.09 .544 0.01 .851 0.05 .378 0.03 .813 -0.05 .197
Ask about oliguria and about the problem
of kidney -0.04 .381 0.24 .076* 0.00 .946 0.05 .254 0.28 .016** 0.03 .310
Ask about vision problems during the
headache -0.06 .269 0.08 .466 -0.04 .436 -0.06 .318 0.13 .327 0.01 .909
Ask about whether he has chest pain 0.05 .392 0.16 .110 -0.01 .835 -0.05 .426 0.24 .036** 0.07 .213
Ask smoking status 0.10 .062* 0.05 .794 -0.12 .389 0.01 .929 0.19 .320 0.02 .873
Ask about alcohol intake 0.07 .195 0.09 .604 -0.09 .431 -0.06 .280 0.21 .282 0.02 .878
Ask family history of premature coronary
heart disease or stroke -0.02 .750 0.05 .559 -0.04 .582 -0.01 .851 0.12 .226 0.03 .668
Ask whether the patient has diabetis -0.02 .726 0.18 .069* -0.02 .201 0.01 .753 0.10 .321 -0.10 .066*
Ask about lifestyle /physical activity 0.03 .607 0.07 .566 -0.03 .668 0.04 .454 0.07 .572 -0.03 .525
Ask about food intake -0.11 .164 -0.03 .796 0.04 .723 0.01 .910 -0.07 .568 0.01 .936
Ask whether he is already on
antihypertensive therapy or other
medicatio 0.00 .878 -0.02 .661 -0.09 .038** 0.02 .470 -0.01 .920 -0.08 .192
Examination Items
Assess his weight 0.14 .008*** 0.53 .000*** 0.07 .166 0.03 .410 0.45 .002*** -0.02 .692
Assess pulse -0.02 .737 0.29 .044** 0.03 .673 -0.03 .791 0.14 .368 -0.12 .189
Measure blood pressure 0.01 .812 0.15 .111 0.05 .420 0.03 .487 0.12 .179 0.01 .877
A urine sample for estimation of the
albumin: creatinine ratio and testi 0.00 .975 0.07 .406 0.00 .958 0.05 .168 0.08 .284 0.01 .785
A blood sample to measure plasma
glucose, electrolytes, creatinine, esti -0.01 .758 0.02 .754 0.04 .308 0.02 .481 0.03 .708 0.05 .050**
12-lead electrocardiography 0.04 .467 0.11 .189 0.12 .001*** 0.06 .121 -0.02 .868 0.00 .944
CQI CQI+PBF CRC Only CRC+PBF
Ref: Control Ref: PBF Ref: Control Ref: PBF
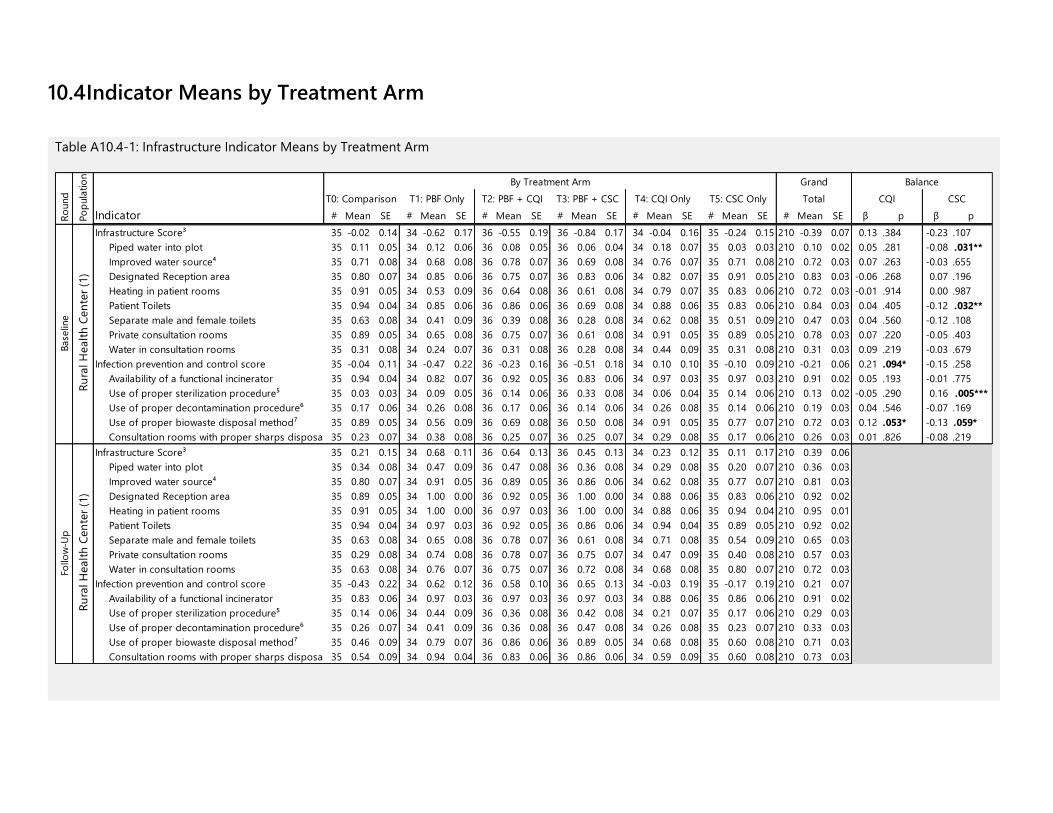
10.4 Indicator Means by Treatment Arm
Table A10.4-1: Infrastructure Indicator Means by Treatment Arm
Indicator # Mean SE # Mean SE # Mean SE # Mean SE # Mean SE # Mean SE # Mean SE β p β p
Infrastructure Score³ 35 -0.02 0.14 34 -0.62 0.17 36 -0.55 0.19 36 -0.84 0.17 34 -0.04 0.16 35 -0.24 0.15 210 -0.39 0.07 0.13 .384 -0.23 .107
Piped water into plot 35 0.11 0.05 34 0.12 0.06 36 0.08 0.05 36 0.06 0.04 34 0.18 0.07 35 0.03 0.03 210 0.10 0.02 0.05 .281 -0.08 .031**
Improved water source⁴ 35 0.71 0.08 34 0.68 0.08 36 0.78 0.07 36 0.69 0.08 34 0.76 0.07 35 0.71 0.08 210 0.72 0.03 0.07 .263 -0.03 .655
Designated Reception area 35 0.80 0.07 34 0.85 0.06 36 0.75 0.07 36 0.83 0.06 34 0.82 0.07 35 0.91 0.05 210 0.83 0.03 -0.06 .268 0.07 .196
Heating in patient rooms 35 0.91 0.05 34 0.53 0.09 36 0.64 0.08 36 0.61 0.08 34 0.79 0.07 35 0.83 0.06 210 0.72 0.03 -0.01 .914 0.00 .987
Patient Toilets 35 0.94 0.04 34 0.85 0.06 36 0.86 0.06 36 0.69 0.08 34 0.88 0.06 35 0.83 0.06 210 0.84 0.03 0.04 .405 -0.12 .032**
Separate male and female toilets 35 0.63 0.08 34 0.41 0.09 36 0.39 0.08 36 0.28 0.08 34 0.62 0.08 35 0.51 0.09 210 0.47 0.03 0.04 .560 -0.12 .108
Private consultation rooms 35 0.89 0.05 34 0.65 0.08 36 0.75 0.07 36 0.61 0.08 34 0.91 0.05 35 0.89 0.05 210 0.78 0.03 0.07 .220 -0.05 .403
Water in consultation rooms 35 0.31 0.08 34 0.24 0.07 36 0.31 0.08 36 0.28 0.08 34 0.44 0.09 35 0.31 0.08 210 0.31 0.03 0.09 .219 -0.03 .679
Infection prevention and control score 35 -0.04 0.11 34 -0.47 0.22 36 -0.23 0.16 36 -0.51 0.18 34 0.10 0.10 35 -0.10 0.09 210 -0.21 0.06 0.21 .094* -0.15 .258
Availability of a functional incinerator 35 0.94 0.04 34 0.82 0.07 36 0.92 0.05 36 0.83 0.06 34 0.97 0.03 35 0.97 0.03 210 0.91 0.02 0.05 .193 -0.01 .775
Use of proper sterilization procedure⁵ 35 0.03 0.03 34 0.09 0.05 36 0.14 0.06 36 0.33 0.08 34 0.06 0.04 35 0.14 0.06 210 0.13 0.02 -0.05 .290 0.16 .005***
Use of proper decontamination procedure⁶ 35 0.17 0.06 34 0.26 0.08 36 0.17 0.06 36 0.14 0.06 34 0.26 0.08 35 0.14 0.06 210 0.19 0.03 0.04 .546 -0.07 .169
Use of proper biowaste disposal method⁷ 35 0.89 0.05 34 0.56 0.09 36 0.69 0.08 36 0.50 0.08 34 0.91 0.05 35 0.77 0.07 210 0.72 0.03 0.12 .053* -0.13 .059*
Consultation rooms with proper sharps disposal 35 0.23 0.07 34 0.38 0.08 36 0.25 0.07 36 0.25 0.07 34 0.29 0.08 35 0.17 0.06 210 0.26 0.03 0.01 .826 -0.08 .219
Infrastructure Score³ 35 0.21 0.15 34 0.68 0.11 36 0.64 0.13 36 0.45 0.13 34 0.23 0.12 35 0.11 0.17 210 0.39 0.06
Piped water into plot 35 0.34 0.08 34 0.47 0.09 36 0.47 0.08 36 0.36 0.08 34 0.29 0.08 35 0.20 0.07 210 0.36 0.03
Improved water source⁴ 35 0.80 0.07 34 0.91 0.05 36 0.89 0.05 36 0.86 0.06 34 0.62 0.08 35 0.77 0.07 210 0.81 0.03
Designated Reception area 35 0.89 0.05 34 1.00 0.00 36 0.92 0.05 36 1.00 0.00 34 0.88 0.06 35 0.83 0.06 210 0.92 0.02
Heating in patient rooms 35 0.91 0.05 34 1.00 0.00 36 0.97 0.03 36 1.00 0.00 34 0.88 0.06 35 0.94 0.04 210 0.95 0.01
Patient Toilets 35 0.94 0.04 34 0.97 0.03 36 0.92 0.05 36 0.86 0.06 34 0.94 0.04 35 0.89 0.05 210 0.92 0.02
Separate male and female toilets 35 0.63 0.08 34 0.65 0.08 36 0.78 0.07 36 0.61 0.08 34 0.71 0.08 35 0.54 0.09 210 0.65 0.03
Private consultation rooms 35 0.29 0.08 34 0.74 0.08 36 0.78 0.07 36 0.75 0.07 34 0.47 0.09 35 0.40 0.08 210 0.57 0.03
Water in consultation rooms 35 0.63 0.08 34 0.76 0.07 36 0.75 0.07 36 0.72 0.08 34 0.68 0.08 35 0.80 0.07 210 0.72 0.03
Infection prevention and control score 35 -0.43 0.22 34 0.62 0.12 36 0.58 0.10 36 0.65 0.13 34 -0.03 0.19 35 -0.17 0.19 210 0.21 0.07
Availability of a functional incinerator 35 0.83 0.06 34 0.97 0.03 36 0.97 0.03 36 0.97 0.03 34 0.88 0.06 35 0.86 0.06 210 0.91 0.02
Use of proper sterilization procedure⁵ 35 0.14 0.06 34 0.44 0.09 36 0.36 0.08 36 0.42 0.08 34 0.21 0.07 35 0.17 0.06 210 0.29 0.03
Use of proper decontamination procedure⁶ 35 0.26 0.07 34 0.41 0.09 36 0.36 0.08 36 0.47 0.08 34 0.26 0.08 35 0.23 0.07 210 0.33 0.03
Use of proper biowaste disposal method⁷ 35 0.46 0.09 34 0.79 0.07 36 0.86 0.06 36 0.89 0.05 34 0.68 0.08 35 0.60 0.08 210 0.71 0.03
Consultation rooms with proper sharps disposal 35 0.54 0.09 34 0.94 0.04 36 0.83 0.06 36 0.86 0.06 34 0.59 0.09 35 0.60 0.08 210 0.73 0.03
By Treatment Arm Grand Balance
T0: Comparison T1: PBF Only CQI CSCT2: PBF + CQI T3: PBF + CSC T4: CQI Only T5: CSC Only Total
Ru
ral H
ealt
h C
en
ter
(1)
Base
line
Follo
w-U
pR
ound
Po
pula
tio
nR
ura
l H
ealt
h C
en
ter
(1)
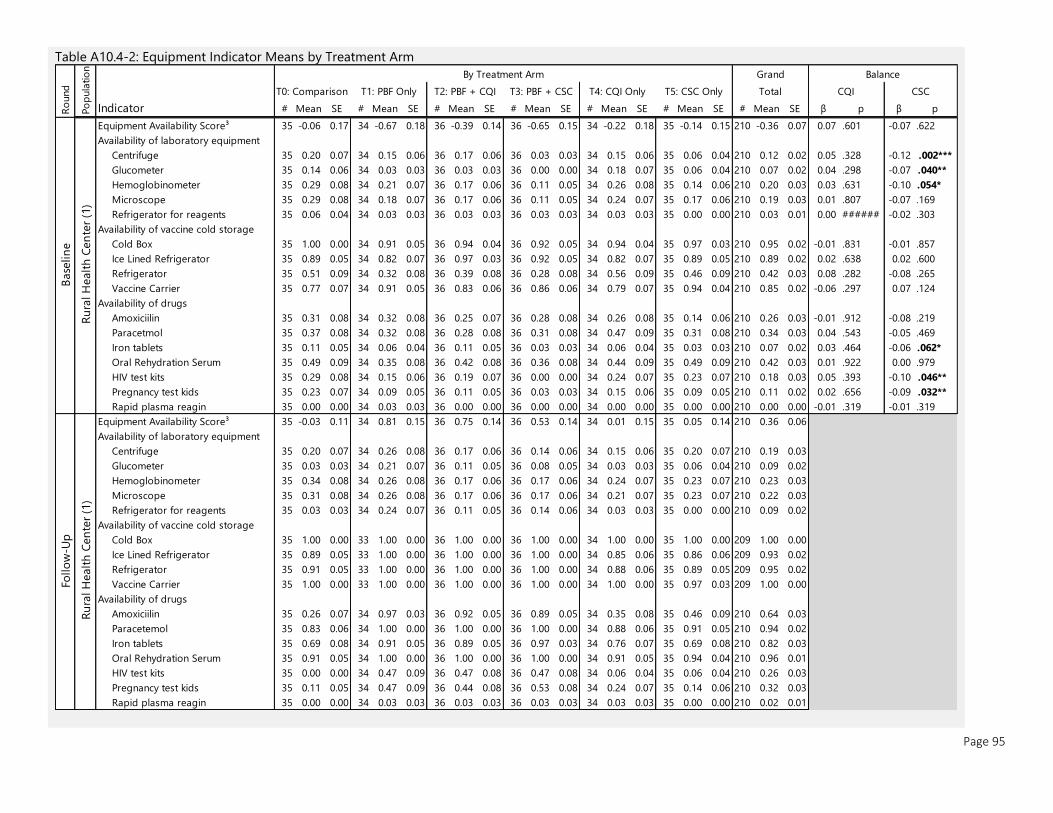
Page 95
Table A10.4-2: Equipment Indicator Means by Treatment Arm
Indicator # Mean SE # Mean SE # Mean SE # Mean SE # Mean SE # Mean SE # Mean SE β p β p
Equipment Availability Score³ 35 -0.06 0.17 34 -0.67 0.18 36 -0.39 0.14 36 -0.65 0.15 34 -0.22 0.18 35 -0.14 0.15 210 -0.36 0.07 0.07 .601 -0.07 .622
Availability of laboratory equipment
Centrifuge 35 0.20 0.07 34 0.15 0.06 36 0.17 0.06 36 0.03 0.03 34 0.15 0.06 35 0.06 0.04 210 0.12 0.02 0.05 .328 -0.12 .002***
Glucometer 35 0.14 0.06 34 0.03 0.03 36 0.03 0.03 36 0.00 0.00 34 0.18 0.07 35 0.06 0.04 210 0.07 0.02 0.04 .298 -0.07 .040**
Hemoglobinometer 35 0.29 0.08 34 0.21 0.07 36 0.17 0.06 36 0.11 0.05 34 0.26 0.08 35 0.14 0.06 210 0.20 0.03 0.03 .631 -0.10 .054*
Microscope 35 0.29 0.08 34 0.18 0.07 36 0.17 0.06 36 0.11 0.05 34 0.24 0.07 35 0.17 0.06 210 0.19 0.03 0.01 .807 -0.07 .169
Refrigerator for reagents 35 0.06 0.04 34 0.03 0.03 36 0.03 0.03 36 0.03 0.03 34 0.03 0.03 35 0.00 0.00 210 0.03 0.01 0.00 ###### -0.02 .303
Availability of vaccine cold storage
Cold Box 35 1.00 0.00 34 0.91 0.05 36 0.94 0.04 36 0.92 0.05 34 0.94 0.04 35 0.97 0.03 210 0.95 0.02 -0.01 .831 -0.01 .857
Ice Lined Refrigerator 35 0.89 0.05 34 0.82 0.07 36 0.97 0.03 36 0.92 0.05 34 0.82 0.07 35 0.89 0.05 210 0.89 0.02 0.02 .638 0.02 .600
Refrigerator 35 0.51 0.09 34 0.32 0.08 36 0.39 0.08 36 0.28 0.08 34 0.56 0.09 35 0.46 0.09 210 0.42 0.03 0.08 .282 -0.08 .265
Vaccine Carrier 35 0.77 0.07 34 0.91 0.05 36 0.83 0.06 36 0.86 0.06 34 0.79 0.07 35 0.94 0.04 210 0.85 0.02 -0.06 .297 0.07 .124
Availability of drugs
Amoxiciilin 35 0.31 0.08 34 0.32 0.08 36 0.25 0.07 36 0.28 0.08 34 0.26 0.08 35 0.14 0.06 210 0.26 0.03 -0.01 .912 -0.08 .219
Paracetmol 35 0.37 0.08 34 0.32 0.08 36 0.28 0.08 36 0.31 0.08 34 0.47 0.09 35 0.31 0.08 210 0.34 0.03 0.04 .543 -0.05 .469
Iron tablets 35 0.11 0.05 34 0.06 0.04 36 0.11 0.05 36 0.03 0.03 34 0.06 0.04 35 0.03 0.03 210 0.07 0.02 0.03 .464 -0.06 .062*
Oral Rehydration Serum 35 0.49 0.09 34 0.35 0.08 36 0.42 0.08 36 0.36 0.08 34 0.44 0.09 35 0.49 0.09 210 0.42 0.03 0.01 .922 0.00 .979
HIV test kits 35 0.29 0.08 34 0.15 0.06 36 0.19 0.07 36 0.00 0.00 34 0.24 0.07 35 0.23 0.07 210 0.18 0.03 0.05 .393 -0.10 .046**
Pregnancy test kids 35 0.23 0.07 34 0.09 0.05 36 0.11 0.05 36 0.03 0.03 34 0.15 0.06 35 0.09 0.05 210 0.11 0.02 0.02 .656 -0.09 .032**
Rapid plasma reagin 35 0.00 0.00 34 0.03 0.03 36 0.00 0.00 36 0.00 0.00 34 0.00 0.00 35 0.00 0.00 210 0.00 0.00 -0.01 .319 -0.01 .319
Equipment Availability Score³ 35 -0.03 0.11 34 0.81 0.15 36 0.75 0.14 36 0.53 0.14 34 0.01 0.15 35 0.05 0.14 210 0.36 0.06
Availability of laboratory equipment
Centrifuge 35 0.20 0.07 34 0.26 0.08 36 0.17 0.06 36 0.14 0.06 34 0.15 0.06 35 0.20 0.07 210 0.19 0.03
Glucometer 35 0.03 0.03 34 0.21 0.07 36 0.11 0.05 36 0.08 0.05 34 0.03 0.03 35 0.06 0.04 210 0.09 0.02
Hemoglobinometer 35 0.34 0.08 34 0.26 0.08 36 0.17 0.06 36 0.17 0.06 34 0.24 0.07 35 0.23 0.07 210 0.23 0.03
Microscope 35 0.31 0.08 34 0.26 0.08 36 0.17 0.06 36 0.17 0.06 34 0.21 0.07 35 0.23 0.07 210 0.22 0.03
Refrigerator for reagents 35 0.03 0.03 34 0.24 0.07 36 0.11 0.05 36 0.14 0.06 34 0.03 0.03 35 0.00 0.00 210 0.09 0.02
Availability of vaccine cold storage
Cold Box 35 1.00 0.00 33 1.00 0.00 36 1.00 0.00 36 1.00 0.00 34 1.00 0.00 35 1.00 0.00 209 1.00 0.00
Ice Lined Refrigerator 35 0.89 0.05 33 1.00 0.00 36 1.00 0.00 36 1.00 0.00 34 0.85 0.06 35 0.86 0.06 209 0.93 0.02
Refrigerator 35 0.91 0.05 33 1.00 0.00 36 1.00 0.00 36 1.00 0.00 34 0.88 0.06 35 0.89 0.05 209 0.95 0.02
Vaccine Carrier 35 1.00 0.00 33 1.00 0.00 36 1.00 0.00 36 1.00 0.00 34 1.00 0.00 35 0.97 0.03 209 1.00 0.00
Availability of drugs
Amoxiciilin 35 0.26 0.07 34 0.97 0.03 36 0.92 0.05 36 0.89 0.05 34 0.35 0.08 35 0.46 0.09 210 0.64 0.03
Paracetemol 35 0.83 0.06 34 1.00 0.00 36 1.00 0.00 36 1.00 0.00 34 0.88 0.06 35 0.91 0.05 210 0.94 0.02
Iron tablets 35 0.69 0.08 34 0.91 0.05 36 0.89 0.05 36 0.97 0.03 34 0.76 0.07 35 0.69 0.08 210 0.82 0.03
Oral Rehydration Serum 35 0.91 0.05 34 1.00 0.00 36 1.00 0.00 36 1.00 0.00 34 0.91 0.05 35 0.94 0.04 210 0.96 0.01
HIV test kits 35 0.00 0.00 34 0.47 0.09 36 0.47 0.08 36 0.47 0.08 34 0.06 0.04 35 0.06 0.04 210 0.26 0.03
Pregnancy test kids 35 0.11 0.05 34 0.47 0.09 36 0.44 0.08 36 0.53 0.08 34 0.24 0.07 35 0.14 0.06 210 0.32 0.03
Rapid plasma reagin 35 0.00 0.00 34 0.03 0.03 36 0.03 0.03 36 0.03 0.03 34 0.03 0.03 35 0.00 0.00 210 0.02 0.01
Grand Balance
T0: Comparison T1: PBF Only T2: PBF + CQI T3: PBF + CSC T4: CQI Only T5: CSC Only Total CQI CSC
Follo
w-U
p
Ru
ral H
ealt
h C
en
ter
(1)
Ru
ral H
ealt
h C
en
ter
(1)
By Treatment ArmR
ound
Po
pula
tio
n
Base
lin
e

Page 96
Table A10.4-3: Health Facility Service Availability Indicator Means by Treatment Arm
Indicator # Mean SE # Mean SE # Mean SE # Mean SE # Mean SE # Mean SE # Mean SE β p β p
Availability of laboratory services 35 0.29 0.08 34 0.21 0.07 36 0.19 0.07 36 0.11 0.05 34 0.26 0.08 35 0.17 0.06 210 0.20 0.03 0.04 .556 -0.10 .081*
Facilities providing postnatal services 35 1.00 0.00 34 1.00 0.00 36 1.00 0.00 36 1.00 0.00 34 1.00 0.00 35 0.97 0.03 210 1.00 0.00 0.01 .319 -0.01 .317
Prop. of growth monitoring services provided35 0.87 0.03 34 0.72 0.04 36 0.81 0.03 36 0.78 0.03 34 0.91 0.02 35 0.85 0.03 210 0.82 0.01 0.05 .070* -0.01 .635
Under-5 nutrition services provided 35 0.94 0.04 34 0.97 0.03 36 0.94 0.04 36 0.97 0.03 34 0.97 0.03 35 1.00 0.00 210 0.97 0.01 -0.01 .612 0.03 .194
Facilities providing antenatal services 35 1.00 0.00 34 0.94 0.04 36 1.00 0.00 36 0.94 0.04 34 0.97 0.03 35 0.97 0.03 210 0.97 0.01 0.02 .314 -0.02 .445
Facilities providing iron folate 35 0.69 0.08 34 0.38 0.08 36 0.69 0.08 36 0.47 0.08 34 0.53 0.09 35 0.71 0.08 210 0.58 0.03 0.05 .488 0.02 .825
Hypertension service provision 35 0.89 0.05 34 1.00 0.00 36 0.97 0.03 36 0.97 0.03 34 0.88 0.06 35 0.94 0.04 210 0.94 0.02 -0.02 .553 0.02 .481
Prop. of diabetes services provided 35 0.67 0.04 34 0.59 0.03 36 0.61 0.03 36 0.59 0.03 34 0.67 0.04 35 0.64 0.04 210 0.63 0.01 0.02 .591 -0.02 .508
Availability of laboratory services 35 0.34 0.08 34 0.26 0.08 36 0.17 0.06 36 0.17 0.06 34 0.24 0.07 35 0.23 0.07 210 0.23 0.03
Facilities providing postnatal services 35 1.00 0.00 34 1.00 0.00 36 1.00 0.00 36 1.00 0.00 34 1.00 0.00 35 1.00 0.00 210 1.00 0.00
Prop. of growth monitoring services provided30 0.97 0.01 33 1.00 0.00 33 0.99 0.01 30 0.99 0.01 29 0.97 0.03 31 0.98 0.01 186 0.98 0.01
Under-5 nutrition services provided 35 0.97 0.03 34 1.00 0.00 36 0.97 0.03 36 0.94 0.04 34 0.88 0.06 35 0.83 0.06 210 0.93 0.02
Facilities providing antenatal services 35 1.00 0.00 34 0.97 0.03 36 1.00 0.00 36 1.00 0.00 34 1.00 0.00 35 1.00 0.00 210 1.00 0.00
Facilities providing iron folate 35 0.94 0.04 33 1.00 0.00 36 1.00 0.00 36 1.00 0.00 34 0.97 0.03 35 1.00 0.00 209 0.99 0.01
Hypertension service provision 35 0.89 0.05 34 1.00 0.00 36 0.97 0.03 36 0.94 0.04 34 0.82 0.07 35 0.91 0.05 210 0.92 0.02
Prop. of diabetes services provided 35 0.60 0.04 34 0.88 0.02 36 0.84 0.03 36 0.79 0.03 34 0.57 0.04 35 0.56 0.03 210 0.71 0.02
By Treatment Arm Grand
Ru
ral H
ealt
h C
en
ter
(1)
Balance
T0: Comparison T1: PBF Only T2: PBF + CQI T3: PBF + CSC T4: CQI Only T5: CSC Only Total CQI CSC
Follo
w-U
p
Ru
ral H
ealt
h C
en
ter
(1)
Ro
und
Po
pula
tio
n
Base
lin
e
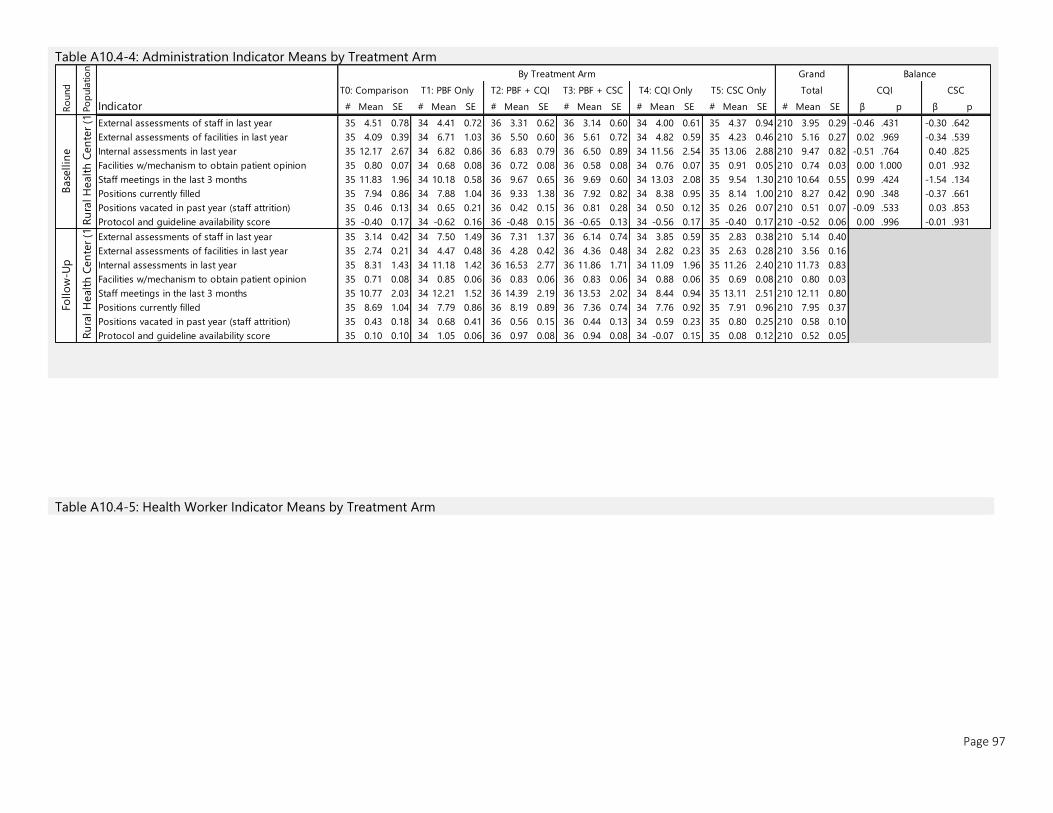
Page 97
Table A10.4-4: Administration Indicator Means by Treatment Arm
Table A10.4-5: Health Worker Indicator Means by Treatment Arm
Indicator # Mean SE # Mean SE # Mean SE # Mean SE # Mean SE # Mean SE # Mean SE β p β p
External assessments of staff in last year 35 4.51 0.78 34 4.41 0.72 36 3.31 0.62 36 3.14 0.60 34 4.00 0.61 35 4.37 0.94 210 3.95 0.29 -0.46 .431 -0.30 .642
External assessments of facilities in last year 35 4.09 0.39 34 6.71 1.03 36 5.50 0.60 36 5.61 0.72 34 4.82 0.59 35 4.23 0.46 210 5.16 0.27 0.02 .969 -0.34 .539
Internal assessments in last year 35 12.17 2.67 34 6.82 0.86 36 6.83 0.79 36 6.50 0.89 34 11.56 2.54 35 13.06 2.88 210 9.47 0.82 -0.51 .764 0.40 .825
Facilities w/mechanism to obtain patient opinion 35 0.80 0.07 34 0.68 0.08 36 0.72 0.08 36 0.58 0.08 34 0.76 0.07 35 0.91 0.05 210 0.74 0.03 0.00 1.000 0.01 .932
Staff meetings in the last 3 months 35 11.83 1.96 34 10.18 0.58 36 9.67 0.65 36 9.69 0.60 34 13.03 2.08 35 9.54 1.30 210 10.64 0.55 0.99 .424 -1.54 .134
Positions currently filled 35 7.94 0.86 34 7.88 1.04 36 9.33 1.38 36 7.92 0.82 34 8.38 0.95 35 8.14 1.00 210 8.27 0.42 0.90 .348 -0.37 .661
Positions vacated in past year (staff attrition) 35 0.46 0.13 34 0.65 0.21 36 0.42 0.15 36 0.81 0.28 34 0.50 0.12 35 0.26 0.07 210 0.51 0.07 -0.09 .533 0.03 .853
Protocol and guideline availability score 35 -0.40 0.17 34 -0.62 0.16 36 -0.48 0.15 36 -0.65 0.13 34 -0.56 0.17 35 -0.40 0.17 210 -0.52 0.06 0.00 .996 -0.01 .931
External assessments of staff in last year 35 3.14 0.42 34 7.50 1.49 36 7.31 1.37 36 6.14 0.74 34 3.85 0.59 35 2.83 0.38 210 5.14 0.40
External assessments of facilities in last year 35 2.74 0.21 34 4.47 0.48 36 4.28 0.42 36 4.36 0.48 34 2.82 0.23 35 2.63 0.28 210 3.56 0.16
Internal assessments in last year 35 8.31 1.43 34 11.18 1.42 36 16.53 2.77 36 11.86 1.71 34 11.09 1.96 35 11.26 2.40 210 11.73 0.83
Facilities w/mechanism to obtain patient opinion 35 0.71 0.08 34 0.85 0.06 36 0.83 0.06 36 0.83 0.06 34 0.88 0.06 35 0.69 0.08 210 0.80 0.03
Staff meetings in the last 3 months 35 10.77 2.03 34 12.21 1.52 36 14.39 2.19 36 13.53 2.02 34 8.44 0.94 35 13.11 2.51 210 12.11 0.80
Positions currently filled 35 8.69 1.04 34 7.79 0.86 36 8.19 0.89 36 7.36 0.74 34 7.76 0.92 35 7.91 0.96 210 7.95 0.37
Positions vacated in past year (staff attrition) 35 0.43 0.18 34 0.68 0.41 36 0.56 0.15 36 0.44 0.13 34 0.59 0.23 35 0.80 0.25 210 0.58 0.10
Protocol and guideline availability score 35 0.10 0.10 34 1.05 0.06 36 0.97 0.08 36 0.94 0.08 34 -0.07 0.15 35 0.08 0.12 210 0.52 0.05
Grand Balance
T0: Comparison T1: PBF Only T2: PBF + CQI T3: PBF + CSC T4: CQI Only T5: CSC Only CQI CSCTotal
Follo
w-U
p
Ru
ral H
ealt
h C
en
ter
(1)
Base
llin
eR
ound
By Treatment Arm
Po
pula
tio
nR
ura
l H
ealt
h C
en
ter
(1)
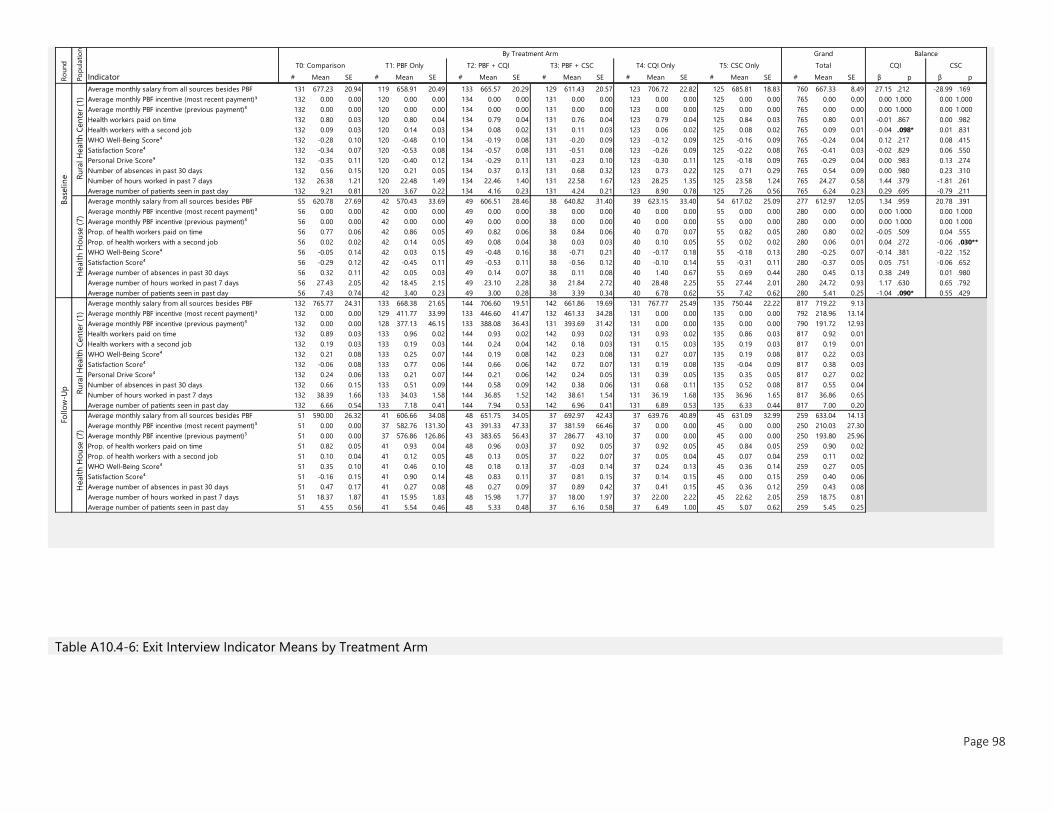
Page 98
Table A10.4-6: Exit Interview Indicator Means by Treatment Arm
Indicator # Mean SE # Mean SE # Mean SE # Mean SE # Mean SE # Mean SE # Mean SE β p β p
Average monthly salary from all sources besides PBF 131 677.23 20.94 119 658.91 20.49 133 665.57 20.29 129 611.43 20.57 123 706.72 22.82 125 685.81 18.83 760 667.33 8.49 27.15 .212 -28.99 .169
Average monthly PBF incentive (most recent payment)³ 132 0.00 0.00 120 0.00 0.00 134 0.00 0.00 131 0.00 0.00 123 0.00 0.00 125 0.00 0.00 765 0.00 0.00 0.00 1.000 0.00 1.000
Average monthly PBF incentive (previous payment)³ 132 0.00 0.00 120 0.00 0.00 134 0.00 0.00 131 0.00 0.00 123 0.00 0.00 125 0.00 0.00 765 0.00 0.00 0.00 1.000 0.00 1.000
Health workers paid on time 132 0.80 0.03 120 0.80 0.04 134 0.79 0.04 131 0.76 0.04 123 0.79 0.04 125 0.84 0.03 765 0.80 0.01 -0.01 .867 0.00 .982
Health workers with a second job 132 0.09 0.03 120 0.14 0.03 134 0.08 0.02 131 0.11 0.03 123 0.06 0.02 125 0.08 0.02 765 0.09 0.01 -0.04 .098* 0.01 .831
WHO Well-Being Score⁴ 132 -0.28 0.10 120 -0.48 0.10 134 -0.19 0.08 131 -0.20 0.09 123 -0.12 0.09 125 -0.16 0.09 765 -0.24 0.04 0.12 .217 0.08 .415
Satisfaction Score⁴ 132 -0.34 0.07 120 -0.53 0.08 134 -0.57 0.08 131 -0.51 0.08 123 -0.26 0.09 125 -0.22 0.08 765 -0.41 0.03 -0.02 .829 0.06 .550
Personal Drive Score⁴ 132 -0.35 0.11 120 -0.40 0.12 134 -0.29 0.11 131 -0.23 0.10 123 -0.30 0.11 125 -0.18 0.09 765 -0.29 0.04 0.00 .983 0.13 .274
Number of absences in past 30 days 132 0.56 0.15 120 0.21 0.05 134 0.37 0.13 131 0.68 0.32 123 0.73 0.22 125 0.71 0.29 765 0.54 0.09 0.00 .980 0.23 .310
Number of hours worked in past 7 days 132 26.38 1.21 120 22.48 1.49 134 22.46 1.40 131 22.58 1.67 123 28.25 1.35 125 23.58 1.24 765 24.27 0.58 1.44 .379 -1.81 .261
Average number of patients seen in past day 132 9.21 0.81 120 3.67 0.22 134 4.16 0.23 131 4.24 0.21 123 8.90 0.78 125 7.26 0.56 765 6.24 0.23 0.29 .695 -0.79 .211
Average monthly salary from all sources besides PBF 55 620.78 27.69 42 570.43 33.69 49 606.51 28.46 38 640.82 31.40 39 623.15 33.40 54 617.02 25.09 277 612.97 12.05 1.34 .959 20.78 .391
Average monthly PBF incentive (most recent payment)³ 56 0.00 0.00 42 0.00 0.00 49 0.00 0.00 38 0.00 0.00 40 0.00 0.00 55 0.00 0.00 280 0.00 0.00 0.00 1.000 0.00 1.000
Average monthly PBF incentive (previous payment)³ 56 0.00 0.00 42 0.00 0.00 49 0.00 0.00 38 0.00 0.00 40 0.00 0.00 55 0.00 0.00 280 0.00 0.00 0.00 1.000 0.00 1.000
Prop. of health workers paid on time 56 0.77 0.06 42 0.86 0.05 49 0.82 0.06 38 0.84 0.06 40 0.70 0.07 55 0.82 0.05 280 0.80 0.02 -0.05 .509 0.04 .555
Prop. of health workers with a second job 56 0.02 0.02 42 0.14 0.05 49 0.08 0.04 38 0.03 0.03 40 0.10 0.05 55 0.02 0.02 280 0.06 0.01 0.04 .272 -0.06 .030**
WHO Well-Being Score⁴ 56 -0.05 0.14 42 0.03 0.15 49 -0.48 0.16 38 -0.71 0.21 40 -0.17 0.18 55 -0.18 0.13 280 -0.25 0.07 -0.14 .381 -0.22 .152
Satisfaction Score⁴ 56 -0.29 0.12 42 -0.45 0.11 49 -0.53 0.11 38 -0.56 0.12 40 -0.10 0.14 55 -0.31 0.11 280 -0.37 0.05 0.05 .751 -0.06 .652
Average number of absences in past 30 days 56 0.32 0.11 42 0.05 0.03 49 0.14 0.07 38 0.11 0.08 40 1.40 0.67 55 0.69 0.44 280 0.45 0.13 0.38 .249 0.01 .980
Average number of hours worked in past 7 days 56 27.43 2.05 42 18.45 2.15 49 23.10 2.28 38 21.84 2.72 40 28.48 2.25 55 27.44 2.01 280 24.72 0.93 1.17 .630 0.65 .792
Average number of patients seen in past day 56 7.43 0.74 42 3.40 0.23 49 3.00 0.28 38 3.39 0.34 40 6.78 0.62 55 7.42 0.62 280 5.41 0.25 -1.04 .090* 0.55 .429
Average monthly salary from all sources besides PBF 132 765.77 24.31 133 668.38 21.65 144 706.60 19.51 142 661.86 19.69 131 767.77 25.49 135 750.44 22.22 817 719.22 9.13
Average monthly PBF incentive (most recent payment)³ 132 0.00 0.00 129 411.77 33.99 133 446.60 41.47 132 461.33 34.28 131 0.00 0.00 135 0.00 0.00 792 218.96 13.14
Average monthly PBF incentive (previous payment)³ 132 0.00 0.00 128 377.13 46.15 133 388.08 36.43 131 393.69 31.42 131 0.00 0.00 135 0.00 0.00 790 191.72 12.93
Health workers paid on time 132 0.89 0.03 133 0.96 0.02 144 0.93 0.02 142 0.93 0.02 131 0.93 0.02 135 0.86 0.03 817 0.92 0.01
Health workers with a second job 132 0.19 0.03 133 0.19 0.03 144 0.24 0.04 142 0.18 0.03 131 0.15 0.03 135 0.19 0.03 817 0.19 0.01
WHO Well-Being Score⁴ 132 0.21 0.08 133 0.25 0.07 144 0.19 0.08 142 0.23 0.08 131 0.27 0.07 135 0.19 0.08 817 0.22 0.03
Satisfaction Score⁴ 132 -0.06 0.08 133 0.77 0.06 144 0.66 0.06 142 0.72 0.07 131 0.19 0.08 135 -0.04 0.09 817 0.38 0.03
Personal Drive Score⁴ 132 0.24 0.06 133 0.21 0.07 144 0.21 0.06 142 0.24 0.05 131 0.39 0.05 135 0.35 0.05 817 0.27 0.02
Number of absences in past 30 days 132 0.66 0.15 133 0.51 0.09 144 0.58 0.09 142 0.38 0.06 131 0.68 0.11 135 0.52 0.08 817 0.55 0.04
Number of hours worked in past 7 days 132 38.39 1.66 133 34.03 1.58 144 36.85 1.52 142 38.61 1.54 131 36.19 1.68 135 36.96 1.65 817 36.86 0.65
Average number of patients seen in past day 132 6.66 0.54 133 7.18 0.41 144 7.94 0.53 142 6.96 0.41 131 6.89 0.53 135 6.33 0.44 817 7.00 0.20
Average monthly salary from all sources besides PBF 51 590.00 26.32 41 606.66 34.08 48 651.75 34.05 37 692.97 42.43 37 639.76 40.89 45 631.09 32.99 259 633.04 14.13
Average monthly PBF incentive (most recent payment)³ 51 0.00 0.00 37 582.76 131.30 43 391.33 47.33 37 381.59 66.46 37 0.00 0.00 45 0.00 0.00 250 210.03 27.30
Average monthly PBF incentive (previous payment)³ 51 0.00 0.00 37 576.86 126.86 43 383.65 56.43 37 286.77 43.10 37 0.00 0.00 45 0.00 0.00 250 193.80 25.96
Prop. of health workers paid on time 51 0.82 0.05 41 0.93 0.04 48 0.96 0.03 37 0.92 0.05 37 0.92 0.05 45 0.84 0.05 259 0.90 0.02
Prop. of health workers with a second job 51 0.10 0.04 41 0.12 0.05 48 0.13 0.05 37 0.22 0.07 37 0.05 0.04 45 0.07 0.04 259 0.11 0.02
WHO Well-Being Score⁴ 51 0.35 0.10 41 0.46 0.10 48 0.18 0.13 37 -0.03 0.14 37 0.24 0.13 45 0.36 0.14 259 0.27 0.05
Satisfaction Score⁴ 51 -0.16 0.15 41 0.90 0.14 48 0.83 0.11 37 0.81 0.15 37 0.14 0.15 45 0.00 0.15 259 0.40 0.06
Average number of absences in past 30 days 51 0.47 0.17 41 0.27 0.08 48 0.27 0.09 37 0.89 0.42 37 0.41 0.15 45 0.36 0.12 259 0.43 0.08
Average number of hours worked in past 7 days 51 18.37 1.87 41 15.95 1.83 48 15.98 1.77 37 18.00 1.97 37 22.00 2.22 45 22.62 2.05 259 18.75 0.81
Average number of patients seen in past day 51 4.55 0.56 41 5.54 0.46 48 5.33 0.48 37 6.16 0.58 37 6.49 1.00 45 5.07 0.62 259 5.45 0.25
By Treatment Arm Grand
Po
pula
tio
nH
ealt
h H
ou
se (
7)
Follo
w-U
p Ru
ral H
ealt
h C
en
ter
(1)
Healt
h H
ou
se (
7)
Balance
T0: Comparison T1: PBF Only T2: PBF + CQI T3: PBF + CSC T4: CQI Only T5: CSC Only CQI CSCTotal
Ru
ral H
ealt
h C
en
ter
(1)
Base
lin
eR
ound
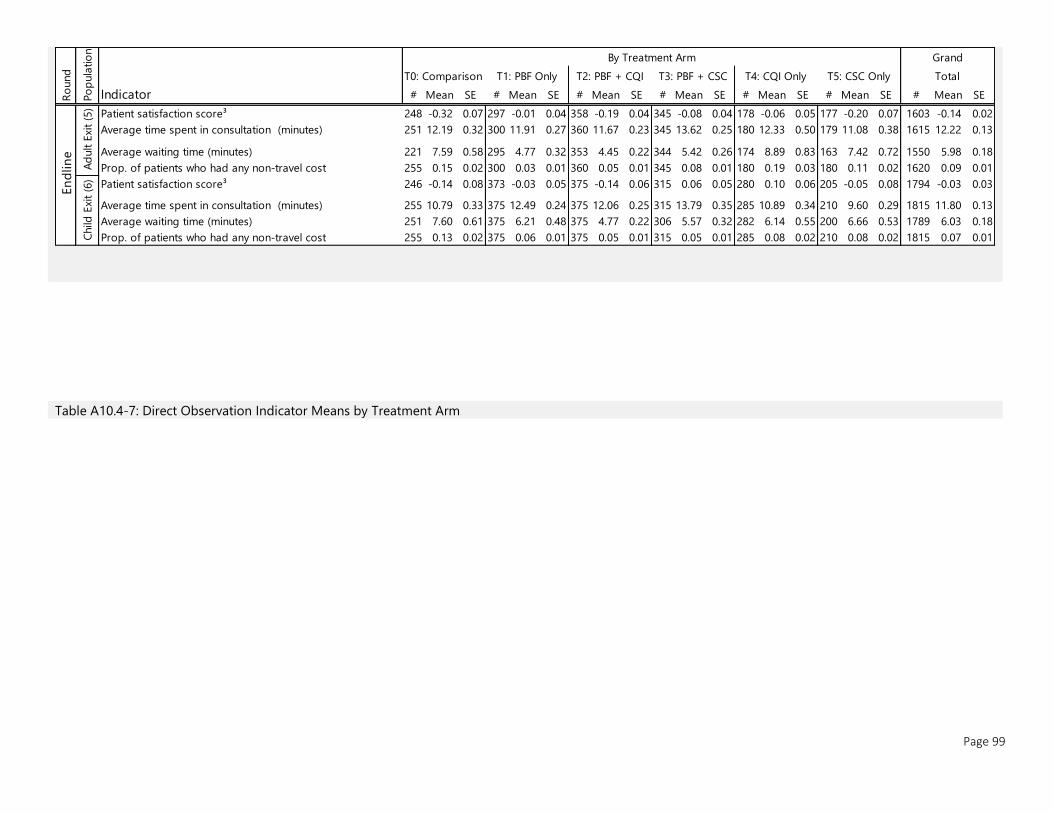
Page 99
Table A10.4-7: Direct Observation Indicator Means by Treatment Arm
Indicator # Mean SE # Mean SE # Mean SE # Mean SE # Mean SE # Mean SE # Mean SE
Patient satisfaction score³ 248 -0.32 0.07 297 -0.01 0.04 358 -0.19 0.04 345 -0.08 0.04 178 -0.06 0.05 177 -0.20 0.07 1603 -0.14 0.02
Average time spent in consultation (minutes) 251 12.19 0.32 300 11.91 0.27 360 11.67 0.23 345 13.62 0.25 180 12.33 0.50 179 11.08 0.38 1615 12.22 0.13
Average waiting time (minutes) 221 7.59 0.58 295 4.77 0.32 353 4.45 0.22 344 5.42 0.26 174 8.89 0.83 163 7.42 0.72 1550 5.98 0.18
Prop. of patients who had any non-travel cost 255 0.15 0.02 300 0.03 0.01 360 0.05 0.01 345 0.08 0.01 180 0.19 0.03 180 0.11 0.02 1620 0.09 0.01
Patient satisfaction score³ 246 -0.14 0.08 373 -0.03 0.05 375 -0.14 0.06 315 0.06 0.05 280 0.10 0.06 205 -0.05 0.08 1794 -0.03 0.03
Average time spent in consultation (minutes) 255 10.79 0.33 375 12.49 0.24 375 12.06 0.25 315 13.79 0.35 285 10.89 0.34 210 9.60 0.29 1815 11.80 0.13
Average waiting time (minutes) 251 7.60 0.61 375 6.21 0.48 375 4.77 0.22 306 5.57 0.32 282 6.14 0.55 200 6.66 0.53 1789 6.03 0.18
Prop. of patients who had any non-travel cost 255 0.13 0.02 375 0.06 0.01 375 0.05 0.01 315 0.05 0.01 285 0.08 0.02 210 0.08 0.02 1815 0.07 0.01
Ro
und
Po
pula
tio
n
By Treatment Arm GrandEn
dlin
e
Ad
ult E
xit
(5)
Child
Exi
t (6
)T0: Comparison T1: PBF Only T2: PBF + CQI T3: PBF + CSC T4: CQI Only T5: CSC Only Total
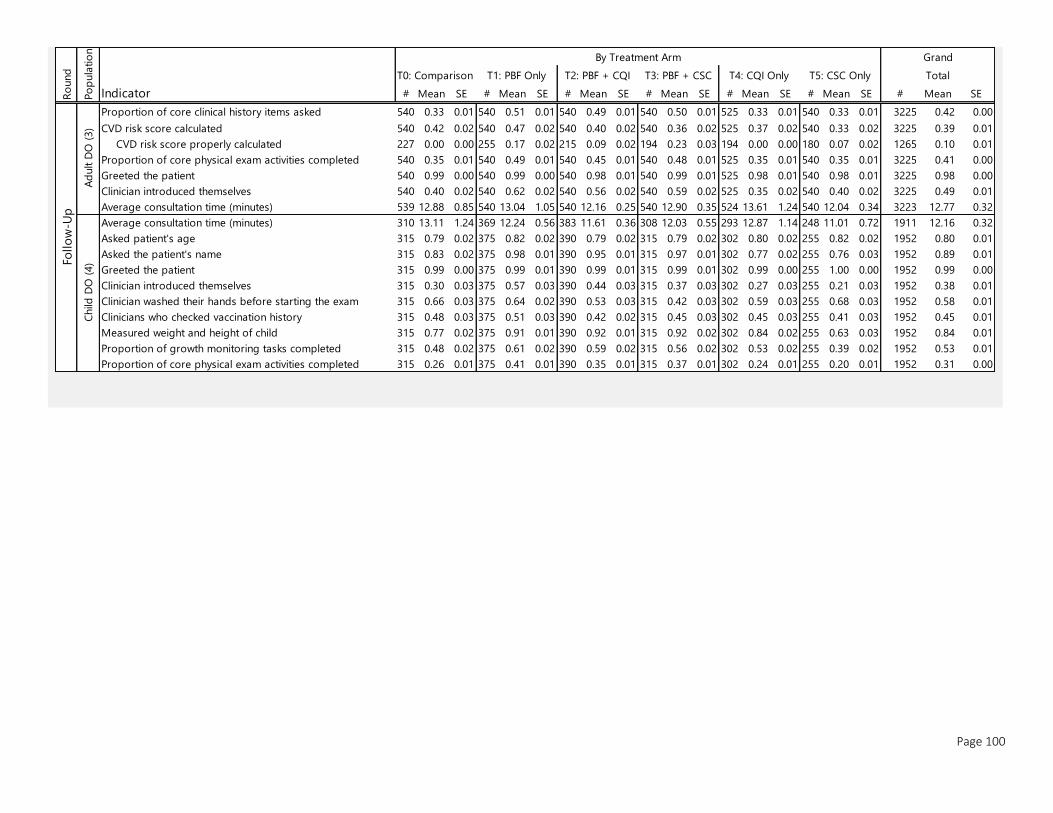
Page 100
Indicator # Mean SE # Mean SE # Mean SE # Mean SE # Mean SE # Mean SE # Mean SE
Proportion of core clinical history items asked 540 0.33 0.01 540 0.51 0.01 540 0.49 0.01 540 0.50 0.01 525 0.33 0.01 540 0.33 0.01 3225 0.42 0.00
CVD risk score calculated 540 0.42 0.02 540 0.47 0.02 540 0.40 0.02 540 0.36 0.02 525 0.37 0.02 540 0.33 0.02 3225 0.39 0.01
CVD risk score properly calculated 227 0.00 0.00 255 0.17 0.02 215 0.09 0.02 194 0.23 0.03 194 0.00 0.00 180 0.07 0.02 1265 0.10 0.01
Proportion of core physical exam activities completed 540 0.35 0.01 540 0.49 0.01 540 0.45 0.01 540 0.48 0.01 525 0.35 0.01 540 0.35 0.01 3225 0.41 0.00
Greeted the patient 540 0.99 0.00 540 0.99 0.00 540 0.98 0.01 540 0.99 0.01 525 0.98 0.01 540 0.98 0.01 3225 0.98 0.00
Clinician introduced themselves 540 0.40 0.02 540 0.62 0.02 540 0.56 0.02 540 0.59 0.02 525 0.35 0.02 540 0.40 0.02 3225 0.49 0.01
Average consultation time (minutes) 539 12.88 0.85 540 13.04 1.05 540 12.16 0.25 540 12.90 0.35 524 13.61 1.24 540 12.04 0.34 3223 12.77 0.32
Average consultation time (minutes) 310 13.11 1.24 369 12.24 0.56 383 11.61 0.36 308 12.03 0.55 293 12.87 1.14 248 11.01 0.72 1911 12.16 0.32
Asked patient's age 315 0.79 0.02 375 0.82 0.02 390 0.79 0.02 315 0.79 0.02 302 0.80 0.02 255 0.82 0.02 1952 0.80 0.01
Asked the patient's name 315 0.83 0.02 375 0.98 0.01 390 0.95 0.01 315 0.97 0.01 302 0.77 0.02 255 0.76 0.03 1952 0.89 0.01
Greeted the patient 315 0.99 0.00 375 0.99 0.01 390 0.99 0.01 315 0.99 0.01 302 0.99 0.00 255 1.00 0.00 1952 0.99 0.00
Clinician introduced themselves 315 0.30 0.03 375 0.57 0.03 390 0.44 0.03 315 0.37 0.03 302 0.27 0.03 255 0.21 0.03 1952 0.38 0.01
Clinician washed their hands before starting the exam 315 0.66 0.03 375 0.64 0.02 390 0.53 0.03 315 0.42 0.03 302 0.59 0.03 255 0.68 0.03 1952 0.58 0.01
Clinicians who checked vaccination history 315 0.48 0.03 375 0.51 0.03 390 0.42 0.02 315 0.45 0.03 302 0.45 0.03 255 0.41 0.03 1952 0.45 0.01
Measured weight and height of child 315 0.77 0.02 375 0.91 0.01 390 0.92 0.01 315 0.92 0.02 302 0.84 0.02 255 0.63 0.03 1952 0.84 0.01
Proportion of growth monitoring tasks completed 315 0.48 0.02 375 0.61 0.02 390 0.59 0.02 315 0.56 0.02 302 0.53 0.02 255 0.39 0.02 1952 0.53 0.01
Proportion of core physical exam activities completed 315 0.26 0.01 375 0.41 0.01 390 0.35 0.01 315 0.37 0.01 302 0.24 0.01 255 0.20 0.01 1952 0.31 0.00
T0: Comparison T1: PBF Only T2: PBF + CQI T3: PBF + CSC T4: CQI Only T5: CSC Only TotalFo
llo
w-U
pR
ound
Po
pula
tio
n
By Treatment Arm Grand
Child
DO
(4)
Ad
ult D
O (
3)
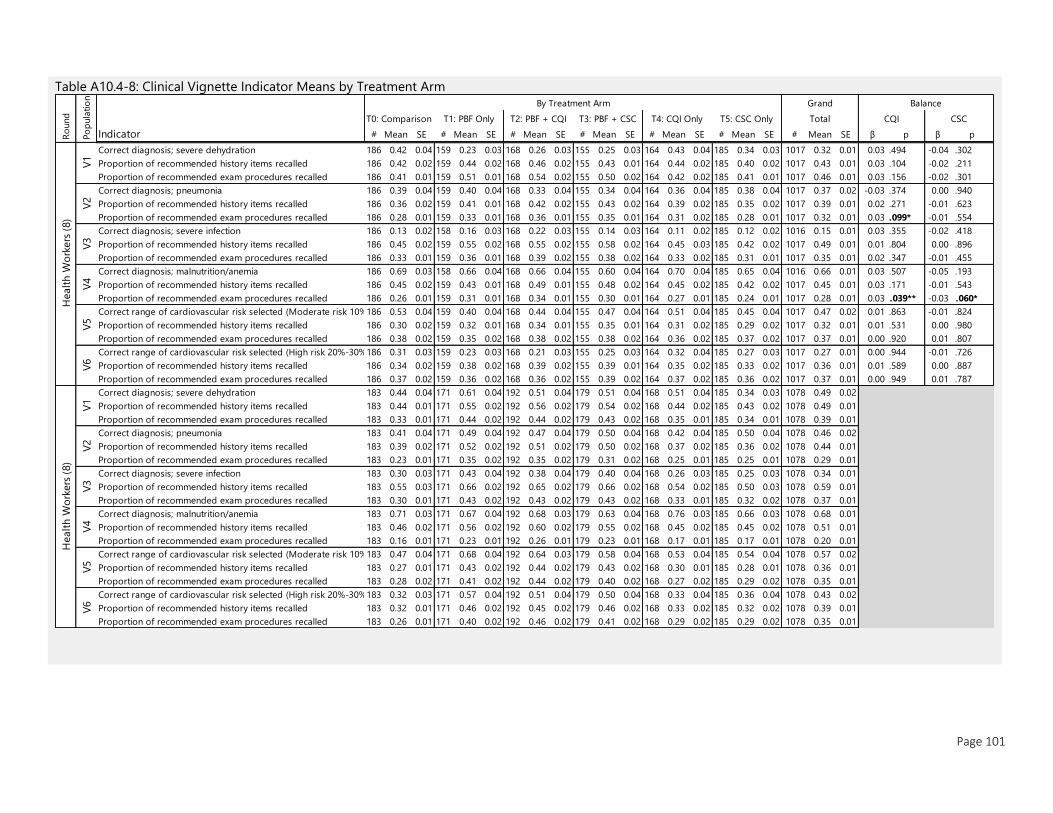
Page 101
Table A10.4-8: Clinical Vignette Indicator Means by Treatment Arm
Indicator # Mean SE # Mean SE # Mean SE # Mean SE # Mean SE # Mean SE # Mean SE β p β p
Correct diagnosis; severe dehydration 186 0.42 0.04 159 0.23 0.03 168 0.26 0.03 155 0.25 0.03 164 0.43 0.04 185 0.34 0.03 1017 0.32 0.01 0.03 .494 -0.04 .302
Proportion of recommended history items recalled 186 0.42 0.02 159 0.44 0.02 168 0.46 0.02 155 0.43 0.01 164 0.44 0.02 185 0.40 0.02 1017 0.43 0.01 0.03 .104 -0.02 .211
Proportion of recommended exam procedures recalled 186 0.41 0.01 159 0.51 0.01 168 0.54 0.02 155 0.50 0.02 164 0.42 0.02 185 0.41 0.01 1017 0.46 0.01 0.03 .156 -0.02 .301
Correct diagnosis; pneumonia 186 0.39 0.04 159 0.40 0.04 168 0.33 0.04 155 0.34 0.04 164 0.36 0.04 185 0.38 0.04 1017 0.37 0.02 -0.03 .374 0.00 .940
Proportion of recommended history items recalled 186 0.36 0.02 159 0.41 0.01 168 0.42 0.02 155 0.43 0.02 164 0.39 0.02 185 0.35 0.02 1017 0.39 0.01 0.02 .271 -0.01 .623
Proportion of recommended exam procedures recalled 186 0.28 0.01 159 0.33 0.01 168 0.36 0.01 155 0.35 0.01 164 0.31 0.02 185 0.28 0.01 1017 0.32 0.01 0.03 .099* -0.01 .554
Correct diagnosis; severe infection 186 0.13 0.02 158 0.16 0.03 168 0.22 0.03 155 0.14 0.03 164 0.11 0.02 185 0.12 0.02 1016 0.15 0.01 0.03 .355 -0.02 .418
Proportion of recommended history items recalled 186 0.45 0.02 159 0.55 0.02 168 0.55 0.02 155 0.58 0.02 164 0.45 0.03 185 0.42 0.02 1017 0.49 0.01 0.01 .804 0.00 .896
Proportion of recommended exam procedures recalled 186 0.33 0.01 159 0.36 0.01 168 0.39 0.02 155 0.38 0.02 164 0.33 0.02 185 0.31 0.01 1017 0.35 0.01 0.02 .347 -0.01 .455
Correct diagnosis; malnutrition/anemia 186 0.69 0.03 158 0.66 0.04 168 0.66 0.04 155 0.60 0.04 164 0.70 0.04 185 0.65 0.04 1016 0.66 0.01 0.03 .507 -0.05 .193
Proportion of recommended history items recalled 186 0.45 0.02 159 0.43 0.01 168 0.49 0.01 155 0.48 0.02 164 0.45 0.02 185 0.42 0.02 1017 0.45 0.01 0.03 .171 -0.01 .543
Proportion of recommended exam procedures recalled 186 0.26 0.01 159 0.31 0.01 168 0.34 0.01 155 0.30 0.01 164 0.27 0.01 185 0.24 0.01 1017 0.28 0.01 0.03 .039** -0.03 .060*
Correct range of cardiovascular risk selected (Moderate risk 10%-20%)186 0.53 0.04 159 0.40 0.04 168 0.44 0.04 155 0.47 0.04 164 0.51 0.04 185 0.45 0.04 1017 0.47 0.02 0.01 .863 -0.01 .824
Proportion of recommended history items recalled 186 0.30 0.02 159 0.32 0.01 168 0.34 0.01 155 0.35 0.01 164 0.31 0.02 185 0.29 0.02 1017 0.32 0.01 0.01 .531 0.00 .980
Proportion of recommended exam procedures recalled 186 0.38 0.02 159 0.35 0.02 168 0.38 0.02 155 0.38 0.02 164 0.36 0.02 185 0.37 0.02 1017 0.37 0.01 0.00 .920 0.01 .807
Correct range of cardiovascular risk selected (High risk 20%-30%)186 0.31 0.03 159 0.23 0.03 168 0.21 0.03 155 0.25 0.03 164 0.32 0.04 185 0.27 0.03 1017 0.27 0.01 0.00 .944 -0.01 .726
Proportion of recommended history items recalled 186 0.34 0.02 159 0.38 0.02 168 0.39 0.02 155 0.39 0.01 164 0.35 0.02 185 0.33 0.02 1017 0.36 0.01 0.01 .589 0.00 .887
Proportion of recommended exam procedures recalled 186 0.37 0.02 159 0.36 0.02 168 0.36 0.02 155 0.39 0.02 164 0.37 0.02 185 0.36 0.02 1017 0.37 0.01 0.00 .949 0.01 .787
Correct diagnosis; severe dehydration 183 0.44 0.04 171 0.61 0.04 192 0.51 0.04 179 0.51 0.04 168 0.51 0.04 185 0.34 0.03 1078 0.49 0.02
Proportion of recommended history items recalled 183 0.44 0.01 171 0.55 0.02 192 0.56 0.02 179 0.54 0.02 168 0.44 0.02 185 0.43 0.02 1078 0.49 0.01
Proportion of recommended exam procedures recalled 183 0.33 0.01 171 0.44 0.02 192 0.44 0.02 179 0.43 0.02 168 0.35 0.01 185 0.34 0.01 1078 0.39 0.01
Correct diagnosis; pneumonia 183 0.41 0.04 171 0.49 0.04 192 0.47 0.04 179 0.50 0.04 168 0.42 0.04 185 0.50 0.04 1078 0.46 0.02
Proportion of recommended history items recalled 183 0.39 0.02 171 0.52 0.02 192 0.51 0.02 179 0.50 0.02 168 0.37 0.02 185 0.36 0.02 1078 0.44 0.01
Proportion of recommended exam procedures recalled 183 0.23 0.01 171 0.35 0.02 192 0.35 0.02 179 0.31 0.02 168 0.25 0.01 185 0.25 0.01 1078 0.29 0.01
Correct diagnosis; severe infection 183 0.30 0.03 171 0.43 0.04 192 0.38 0.04 179 0.40 0.04 168 0.26 0.03 185 0.25 0.03 1078 0.34 0.01
Proportion of recommended history items recalled 183 0.55 0.03 171 0.66 0.02 192 0.65 0.02 179 0.66 0.02 168 0.54 0.02 185 0.50 0.03 1078 0.59 0.01
Proportion of recommended exam procedures recalled 183 0.30 0.01 171 0.43 0.02 192 0.43 0.02 179 0.43 0.02 168 0.33 0.01 185 0.32 0.02 1078 0.37 0.01
Correct diagnosis; malnutrition/anemia 183 0.71 0.03 171 0.67 0.04 192 0.68 0.03 179 0.63 0.04 168 0.76 0.03 185 0.66 0.03 1078 0.68 0.01
Proportion of recommended history items recalled 183 0.46 0.02 171 0.56 0.02 192 0.60 0.02 179 0.55 0.02 168 0.45 0.02 185 0.45 0.02 1078 0.51 0.01
Proportion of recommended exam procedures recalled 183 0.16 0.01 171 0.23 0.01 192 0.26 0.01 179 0.23 0.01 168 0.17 0.01 185 0.17 0.01 1078 0.20 0.01
Correct range of cardiovascular risk selected (Moderate risk 10%-20%)183 0.47 0.04 171 0.68 0.04 192 0.64 0.03 179 0.58 0.04 168 0.53 0.04 185 0.54 0.04 1078 0.57 0.02
Proportion of recommended history items recalled 183 0.27 0.01 171 0.43 0.02 192 0.44 0.02 179 0.43 0.02 168 0.30 0.01 185 0.28 0.01 1078 0.36 0.01
Proportion of recommended exam procedures recalled 183 0.28 0.02 171 0.41 0.02 192 0.44 0.02 179 0.40 0.02 168 0.27 0.02 185 0.29 0.02 1078 0.35 0.01
Correct range of cardiovascular risk selected (High risk 20%-30%)183 0.32 0.03 171 0.57 0.04 192 0.51 0.04 179 0.50 0.04 168 0.33 0.04 185 0.36 0.04 1078 0.43 0.02
Proportion of recommended history items recalled 183 0.32 0.01 171 0.46 0.02 192 0.45 0.02 179 0.46 0.02 168 0.33 0.02 185 0.32 0.02 1078 0.39 0.01
Proportion of recommended exam procedures recalled 183 0.26 0.01 171 0.40 0.02 192 0.46 0.02 179 0.41 0.02 168 0.29 0.02 185 0.29 0.02 1078 0.35 0.01
Ro
und
Po
pula
tio
n
By Treatment Arm Grand Balance
T0: Comparison T1: PBF Only T2: PBF + CQI T3: PBF + CSC T4: CQI Only T5: CSC Only Total CQI CSC
Healt
h W
ork
ers
(8)
V1
V2
V3
V4
V5
V6
Healt
h W
ork
ers
(8)
V1
V2
V3
V4
V5
V6
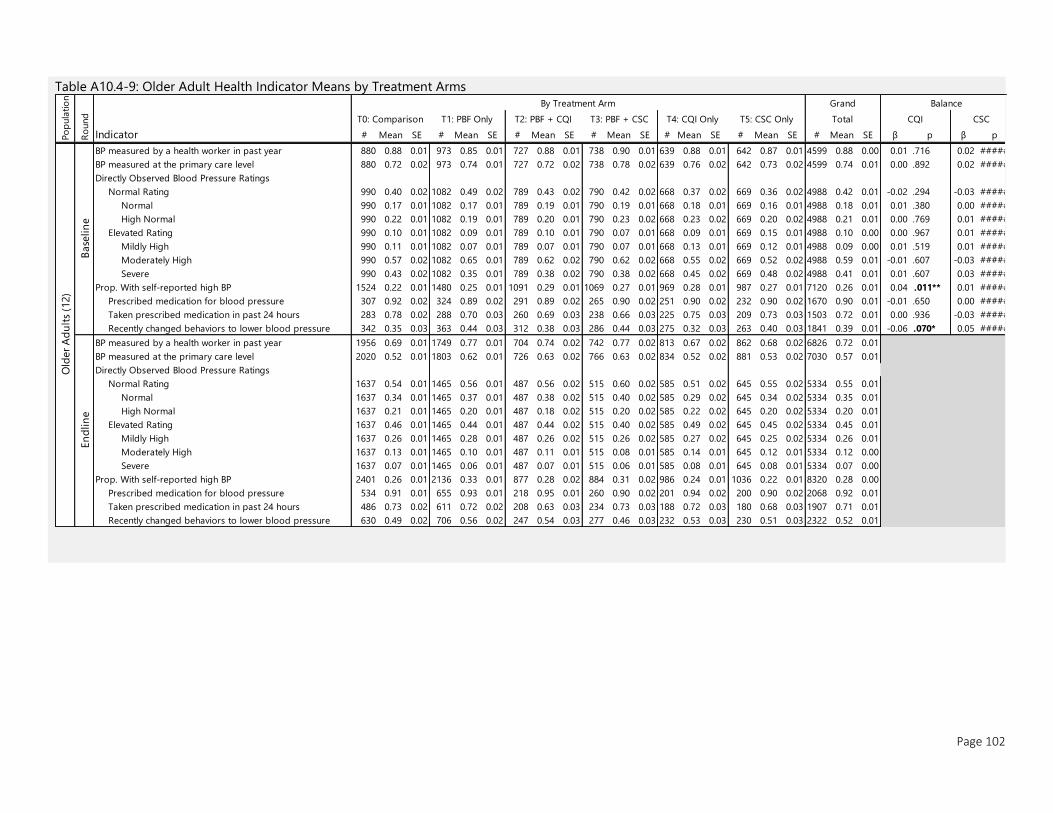
Page 102
Table A10.4-9: Older Adult Health Indicator Means by Treatment Arms
Indicator # Mean SE # Mean SE # Mean SE # Mean SE # Mean SE # Mean SE # Mean SE β p β p
BP measured by a health worker in past year 880 0.88 0.01 973 0.85 0.01 727 0.88 0.01 738 0.90 0.01 639 0.88 0.01 642 0.87 0.01 4599 0.88 0.00 0.01 .716 0.02 #####
BP measured at the primary care level 880 0.72 0.02 973 0.74 0.01 727 0.72 0.02 738 0.78 0.02 639 0.76 0.02 642 0.73 0.02 4599 0.74 0.01 0.00 .892 0.02 #####
Directly Observed Blood Pressure Ratings
Normal Rating 990 0.40 0.02 1082 0.49 0.02 789 0.43 0.02 790 0.42 0.02 668 0.37 0.02 669 0.36 0.02 4988 0.42 0.01 -0.02 .294 -0.03 #####
Normal 990 0.17 0.01 1082 0.17 0.01 789 0.19 0.01 790 0.19 0.01 668 0.18 0.01 669 0.16 0.01 4988 0.18 0.01 0.01 .380 0.00 #####
High Normal 990 0.22 0.01 1082 0.19 0.01 789 0.20 0.01 790 0.23 0.02 668 0.23 0.02 669 0.20 0.02 4988 0.21 0.01 0.00 .769 0.01 #####
Elevated Rating 990 0.10 0.01 1082 0.09 0.01 789 0.10 0.01 790 0.07 0.01 668 0.09 0.01 669 0.15 0.01 4988 0.10 0.00 0.00 .967 0.01 #####
Mildly High 990 0.11 0.01 1082 0.07 0.01 789 0.07 0.01 790 0.07 0.01 668 0.13 0.01 669 0.12 0.01 4988 0.09 0.00 0.01 .519 0.01 #####
Moderately High 990 0.57 0.02 1082 0.65 0.01 789 0.62 0.02 790 0.62 0.02 668 0.55 0.02 669 0.52 0.02 4988 0.59 0.01 -0.01 .607 -0.03 #####
Severe 990 0.43 0.02 1082 0.35 0.01 789 0.38 0.02 790 0.38 0.02 668 0.45 0.02 669 0.48 0.02 4988 0.41 0.01 0.01 .607 0.03 #####
Prop. With self-reported high BP 1524 0.22 0.01 1480 0.25 0.01 1091 0.29 0.01 1069 0.27 0.01 969 0.28 0.01 987 0.27 0.01 7120 0.26 0.01 0.04 .011** 0.01 #####
Prescribed medication for blood pressure 307 0.92 0.02 324 0.89 0.02 291 0.89 0.02 265 0.90 0.02 251 0.90 0.02 232 0.90 0.02 1670 0.90 0.01 -0.01 .650 0.00 #####
Taken prescribed medication in past 24 hours 283 0.78 0.02 288 0.70 0.03 260 0.69 0.03 238 0.66 0.03 225 0.75 0.03 209 0.73 0.03 1503 0.72 0.01 0.00 .936 -0.03 #####
Recently changed behaviors to lower blood pressure 342 0.35 0.03 363 0.44 0.03 312 0.38 0.03 286 0.44 0.03 275 0.32 0.03 263 0.40 0.03 1841 0.39 0.01 -0.06 .070* 0.05 #####
BP measured by a health worker in past year 1956 0.69 0.01 1749 0.77 0.01 704 0.74 0.02 742 0.77 0.02 813 0.67 0.02 862 0.68 0.02 6826 0.72 0.01
BP measured at the primary care level 2020 0.52 0.01 1803 0.62 0.01 726 0.63 0.02 766 0.63 0.02 834 0.52 0.02 881 0.53 0.02 7030 0.57 0.01
Directly Observed Blood Pressure Ratings
Normal Rating 1637 0.54 0.01 1465 0.56 0.01 487 0.56 0.02 515 0.60 0.02 585 0.51 0.02 645 0.55 0.02 5334 0.55 0.01
Normal 1637 0.34 0.01 1465 0.37 0.01 487 0.38 0.02 515 0.40 0.02 585 0.29 0.02 645 0.34 0.02 5334 0.35 0.01
High Normal 1637 0.21 0.01 1465 0.20 0.01 487 0.18 0.02 515 0.20 0.02 585 0.22 0.02 645 0.20 0.02 5334 0.20 0.01
Elevated Rating 1637 0.46 0.01 1465 0.44 0.01 487 0.44 0.02 515 0.40 0.02 585 0.49 0.02 645 0.45 0.02 5334 0.45 0.01
Mildly High 1637 0.26 0.01 1465 0.28 0.01 487 0.26 0.02 515 0.26 0.02 585 0.27 0.02 645 0.25 0.02 5334 0.26 0.01
Moderately High 1637 0.13 0.01 1465 0.10 0.01 487 0.11 0.01 515 0.08 0.01 585 0.14 0.01 645 0.12 0.01 5334 0.12 0.00
Severe 1637 0.07 0.01 1465 0.06 0.01 487 0.07 0.01 515 0.06 0.01 585 0.08 0.01 645 0.08 0.01 5334 0.07 0.00
Prop. With self-reported high BP 2401 0.26 0.01 2136 0.33 0.01 877 0.28 0.02 884 0.31 0.02 986 0.24 0.01 1036 0.22 0.01 8320 0.28 0.00
Prescribed medication for blood pressure 534 0.91 0.01 655 0.93 0.01 218 0.95 0.01 260 0.90 0.02 201 0.94 0.02 200 0.90 0.02 2068 0.92 0.01
Taken prescribed medication in past 24 hours 486 0.73 0.02 611 0.72 0.02 208 0.63 0.03 234 0.73 0.03 188 0.72 0.03 180 0.68 0.03 1907 0.71 0.01
Recently changed behaviors to lower blood pressure 630 0.49 0.02 706 0.56 0.02 247 0.54 0.03 277 0.46 0.03 232 0.53 0.03 230 0.51 0.03 2322 0.52 0.01
En
dlin
e
Old
er
Ad
ult
s (1
2)
T5: CSC Only Total CQI CSC
Base
lin
eR
ound
Po
pula
tio
n
By Treatment Arm Grand Balance
T0: Comparison T1: PBF Only T2: PBF + CQI T3: PBF + CSC T4: CQI Only
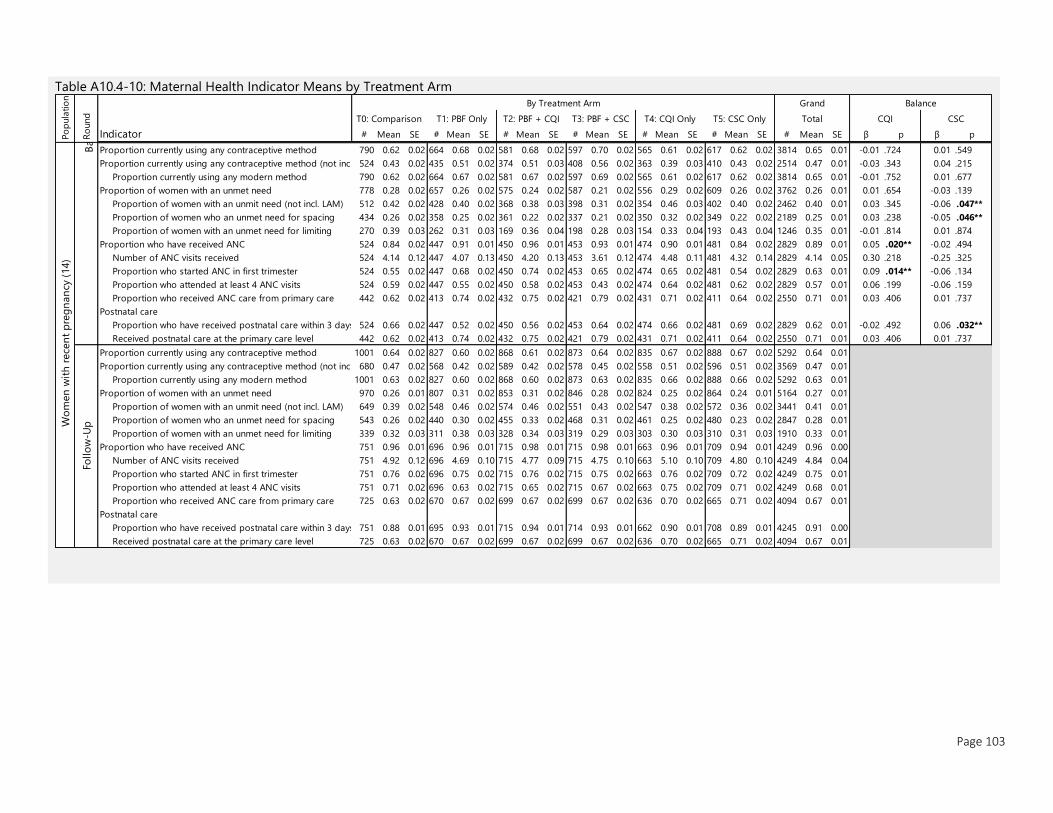
Page 103
Table A10.4-10: Maternal Health Indicator Means by Treatment Arm
Indicator # Mean SE # Mean SE # Mean SE # Mean SE # Mean SE # Mean SE # Mean SE β p β p
Base
lin
e
Proportion currently using any contraceptive method 790 0.62 0.02 664 0.68 0.02 581 0.68 0.02 597 0.70 0.02 565 0.61 0.02 617 0.62 0.02 3814 0.65 0.01 -0.01 .724 0.01 .549
Proportion currently using any contraceptive method (not incl. LAM)524 0.43 0.02 435 0.51 0.02 374 0.51 0.03 408 0.56 0.02 363 0.39 0.03 410 0.43 0.02 2514 0.47 0.01 -0.03 .343 0.04 .215
Proportion currently using any modern method 790 0.62 0.02 664 0.67 0.02 581 0.67 0.02 597 0.69 0.02 565 0.61 0.02 617 0.62 0.02 3814 0.65 0.01 -0.01 .752 0.01 .677
Proportion of women with an unmet need 778 0.28 0.02 657 0.26 0.02 575 0.24 0.02 587 0.21 0.02 556 0.29 0.02 609 0.26 0.02 3762 0.26 0.01 0.01 .654 -0.03 .139
Proportion of women with an unmit need (not incl. LAM) 512 0.42 0.02 428 0.40 0.02 368 0.38 0.03 398 0.31 0.02 354 0.46 0.03 402 0.40 0.02 2462 0.40 0.01 0.03 .345 -0.06 .047**
Proportion of women who an unmet need for spacing 434 0.26 0.02 358 0.25 0.02 361 0.22 0.02 337 0.21 0.02 350 0.32 0.02 349 0.22 0.02 2189 0.25 0.01 0.03 .238 -0.05 .046**
Proportion of women with an unmet need for limiting 270 0.39 0.03 262 0.31 0.03 169 0.36 0.04 198 0.28 0.03 154 0.33 0.04 193 0.43 0.04 1246 0.35 0.01 -0.01 .814 0.01 .874
Proportion who have received ANC 524 0.84 0.02 447 0.91 0.01 450 0.96 0.01 453 0.93 0.01 474 0.90 0.01 481 0.84 0.02 2829 0.89 0.01 0.05 .020** -0.02 .494
Number of ANC visits received 524 4.14 0.12 447 4.07 0.13 450 4.20 0.13 453 3.61 0.12 474 4.48 0.11 481 4.32 0.14 2829 4.14 0.05 0.30 .218 -0.25 .325
Proportion who started ANC in first trimester 524 0.55 0.02 447 0.68 0.02 450 0.74 0.02 453 0.65 0.02 474 0.65 0.02 481 0.54 0.02 2829 0.63 0.01 0.09 .014** -0.06 .134
Proportion who attended at least 4 ANC visits 524 0.59 0.02 447 0.55 0.02 450 0.58 0.02 453 0.43 0.02 474 0.64 0.02 481 0.62 0.02 2829 0.57 0.01 0.06 .199 -0.06 .159
Proportion who received ANC care from primary care 442 0.62 0.02 413 0.74 0.02 432 0.75 0.02 421 0.79 0.02 431 0.71 0.02 411 0.64 0.02 2550 0.71 0.01 0.03 .406 0.01 .737
Postnatal care
Proportion who have received postnatal care within 3 days 524 0.66 0.02 447 0.52 0.02 450 0.56 0.02 453 0.64 0.02 474 0.66 0.02 481 0.69 0.02 2829 0.62 0.01 -0.02 .492 0.06 .032**
Received postnatal care at the primary care level 442 0.62 0.02 413 0.74 0.02 432 0.75 0.02 421 0.79 0.02 431 0.71 0.02 411 0.64 0.02 2550 0.71 0.01 0.03 .406 0.01 .737
Proportion currently using any contraceptive method 1001 0.64 0.02 827 0.60 0.02 868 0.61 0.02 873 0.64 0.02 835 0.67 0.02 888 0.67 0.02 5292 0.64 0.01
Proportion currently using any contraceptive method (not incl. LAM)680 0.47 0.02 568 0.42 0.02 589 0.42 0.02 578 0.45 0.02 558 0.51 0.02 596 0.51 0.02 3569 0.47 0.01
Proportion currently using any modern method 1001 0.63 0.02 827 0.60 0.02 868 0.60 0.02 873 0.63 0.02 835 0.66 0.02 888 0.66 0.02 5292 0.63 0.01
Proportion of women with an unmet need 970 0.26 0.01 807 0.31 0.02 853 0.31 0.02 846 0.28 0.02 824 0.25 0.02 864 0.24 0.01 5164 0.27 0.01
Proportion of women with an unmit need (not incl. LAM) 649 0.39 0.02 548 0.46 0.02 574 0.46 0.02 551 0.43 0.02 547 0.38 0.02 572 0.36 0.02 3441 0.41 0.01
Proportion of women who an unmet need for spacing 543 0.26 0.02 440 0.30 0.02 455 0.33 0.02 468 0.31 0.02 461 0.25 0.02 480 0.23 0.02 2847 0.28 0.01
Proportion of women with an unmet need for limiting 339 0.32 0.03 311 0.38 0.03 328 0.34 0.03 319 0.29 0.03 303 0.30 0.03 310 0.31 0.03 1910 0.33 0.01
Proportion who have received ANC 751 0.96 0.01 696 0.96 0.01 715 0.98 0.01 715 0.98 0.01 663 0.96 0.01 709 0.94 0.01 4249 0.96 0.00
Number of ANC visits received 751 4.92 0.12 696 4.69 0.10 715 4.77 0.09 715 4.75 0.10 663 5.10 0.10 709 4.80 0.10 4249 4.84 0.04
Proportion who started ANC in first trimester 751 0.76 0.02 696 0.75 0.02 715 0.76 0.02 715 0.75 0.02 663 0.76 0.02 709 0.72 0.02 4249 0.75 0.01
Proportion who attended at least 4 ANC visits 751 0.71 0.02 696 0.63 0.02 715 0.65 0.02 715 0.67 0.02 663 0.75 0.02 709 0.71 0.02 4249 0.68 0.01
Proportion who received ANC care from primary care 725 0.63 0.02 670 0.67 0.02 699 0.67 0.02 699 0.67 0.02 636 0.70 0.02 665 0.71 0.02 4094 0.67 0.01
Postnatal care
Proportion who have received postnatal care within 3 days 751 0.88 0.01 695 0.93 0.01 715 0.94 0.01 714 0.93 0.01 662 0.90 0.01 708 0.89 0.01 4245 0.91 0.00
Received postnatal care at the primary care level 725 0.63 0.02 670 0.67 0.02 699 0.67 0.02 699 0.67 0.02 636 0.70 0.02 665 0.71 0.02 4094 0.67 0.01
Grand Balance
T0: Comparison T1: PBF Only T2: PBF + CQI T3: PBF + CSC T4: CQI Only T5: CSC Only CQI CSCTotal
Follo
w-U
pWo
men
wit
h r
ece
nt
pre
gn
an
cy (
14)
Ro
und
Po
pula
tio
n
By Treatment Arm
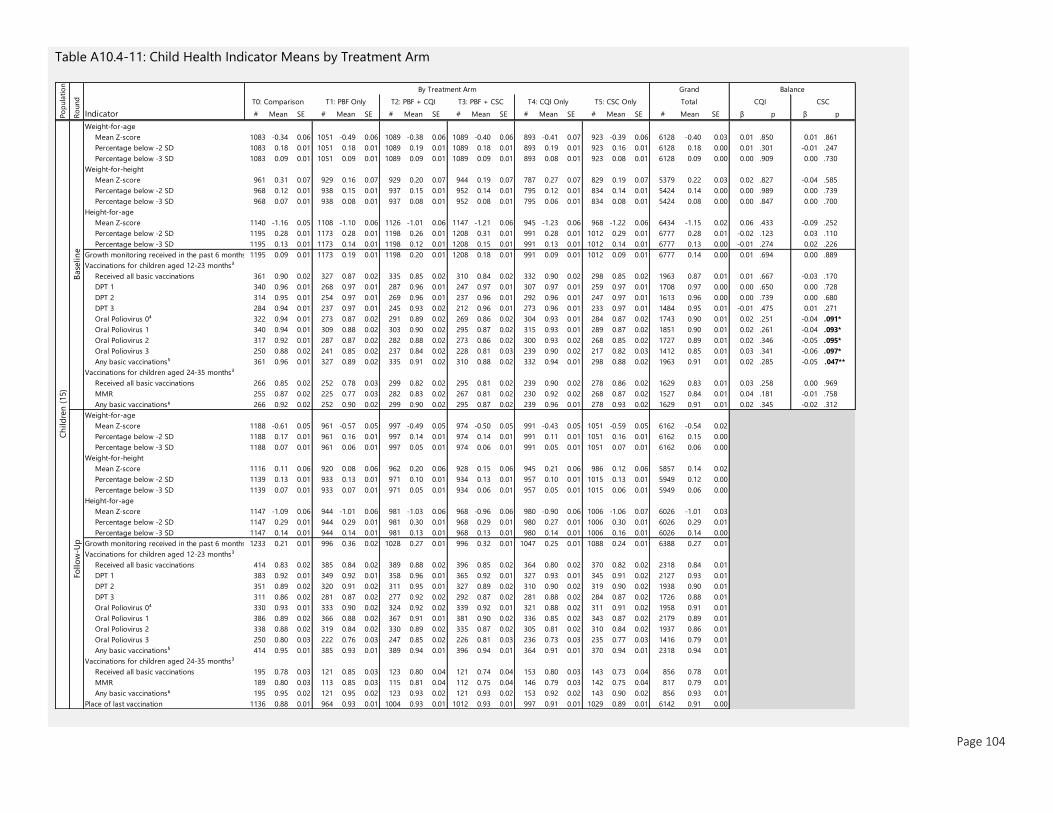
Page 104
Table A10.4-11: Child Health Indicator Means by Treatment Arm
Indicator # Mean SE # Mean SE # Mean SE # Mean SE # Mean SE # Mean SE # Mean SE β p β p
Weight-for-age
Mean Z-score 1083 -0.34 0.06 1051 -0.49 0.06 1089 -0.38 0.06 1089 -0.40 0.06 893 -0.41 0.07 923 -0.39 0.06 6128 -0.40 0.03 0.01 .850 0.01 .861
Percentage below -2 SD 1083 0.18 0.01 1051 0.18 0.01 1089 0.19 0.01 1089 0.18 0.01 893 0.19 0.01 923 0.16 0.01 6128 0.18 0.00 0.01 .301 -0.01 .247
Percentage below -3 SD 1083 0.09 0.01 1051 0.09 0.01 1089 0.09 0.01 1089 0.09 0.01 893 0.08 0.01 923 0.08 0.01 6128 0.09 0.00 0.00 .909 0.00 .730
Weight-for-height
Mean Z-score 961 0.31 0.07 929 0.16 0.07 929 0.20 0.07 944 0.19 0.07 787 0.27 0.07 829 0.19 0.07 5379 0.22 0.03 0.02 .827 -0.04 .585
Percentage below -2 SD 968 0.12 0.01 938 0.15 0.01 937 0.15 0.01 952 0.14 0.01 795 0.12 0.01 834 0.14 0.01 5424 0.14 0.00 0.00 .989 0.00 .739
Percentage below -3 SD 968 0.07 0.01 938 0.08 0.01 937 0.08 0.01 952 0.08 0.01 795 0.06 0.01 834 0.08 0.01 5424 0.08 0.00 0.00 .847 0.00 .700
Height-for-age
Mean Z-score 1140 -1.16 0.05 1108 -1.10 0.06 1126 -1.01 0.06 1147 -1.21 0.06 945 -1.23 0.06 968 -1.22 0.06 6434 -1.15 0.02 0.06 .433 -0.09 .252
Percentage below -2 SD 1195 0.28 0.01 1173 0.28 0.01 1198 0.26 0.01 1208 0.31 0.01 991 0.28 0.01 1012 0.29 0.01 6777 0.28 0.01 -0.02 .123 0.03 .110
Percentage below -3 SD 1195 0.13 0.01 1173 0.14 0.01 1198 0.12 0.01 1208 0.15 0.01 991 0.13 0.01 1012 0.14 0.01 6777 0.13 0.00 -0.01 .274 0.02 .226
Growth monitoring received in the past 6 months 1195 0.09 0.01 1173 0.19 0.01 1198 0.20 0.01 1208 0.18 0.01 991 0.09 0.01 1012 0.09 0.01 6777 0.14 0.00 0.01 .694 0.00 .889
Vaccinations for children aged 12-23 months³
Received all basic vaccinations 361 0.90 0.02 327 0.87 0.02 335 0.85 0.02 310 0.84 0.02 332 0.90 0.02 298 0.85 0.02 1963 0.87 0.01 0.01 .667 -0.03 .170
DPT 1 340 0.96 0.01 268 0.97 0.01 287 0.96 0.01 247 0.97 0.01 307 0.97 0.01 259 0.97 0.01 1708 0.97 0.00 0.00 .650 0.00 .728
DPT 2 314 0.95 0.01 254 0.97 0.01 269 0.96 0.01 237 0.96 0.01 292 0.96 0.01 247 0.97 0.01 1613 0.96 0.00 0.00 .739 0.00 .680
DPT 3 284 0.94 0.01 237 0.97 0.01 245 0.93 0.02 212 0.96 0.01 273 0.96 0.01 233 0.97 0.01 1484 0.95 0.01 -0.01 .475 0.01 .271
Oral Poliovirus 0⁴ 322 0.94 0.01 273 0.87 0.02 291 0.89 0.02 269 0.86 0.02 304 0.93 0.01 284 0.87 0.02 1743 0.90 0.01 0.02 .251 -0.04 .091*
Oral Poliovirus 1 340 0.94 0.01 309 0.88 0.02 303 0.90 0.02 295 0.87 0.02 315 0.93 0.01 289 0.87 0.02 1851 0.90 0.01 0.02 .261 -0.04 .093*
Oral Poliovirus 2 317 0.92 0.01 287 0.87 0.02 282 0.88 0.02 273 0.86 0.02 300 0.93 0.02 268 0.85 0.02 1727 0.89 0.01 0.02 .346 -0.05 .095*
Oral Poliovirus 3 250 0.88 0.02 241 0.85 0.02 237 0.84 0.02 228 0.81 0.03 239 0.90 0.02 217 0.82 0.03 1412 0.85 0.01 0.03 .341 -0.06 .097*
Any basic vaccinations⁵ 361 0.96 0.01 327 0.89 0.02 335 0.91 0.02 310 0.88 0.02 332 0.94 0.01 298 0.88 0.02 1963 0.91 0.01 0.02 .285 -0.05 .047**
Vaccinations for children aged 24-35 months³
Received all basic vaccinations 266 0.85 0.02 252 0.78 0.03 299 0.82 0.02 295 0.81 0.02 239 0.90 0.02 278 0.86 0.02 1629 0.83 0.01 0.03 .258 0.00 .969
MMR 255 0.87 0.02 225 0.77 0.03 282 0.83 0.02 267 0.81 0.02 230 0.92 0.02 268 0.87 0.02 1527 0.84 0.01 0.04 .181 -0.01 .758
Any basic vaccinations⁶ 266 0.92 0.02 252 0.90 0.02 299 0.90 0.02 295 0.87 0.02 239 0.96 0.01 278 0.93 0.02 1629 0.91 0.01 0.02 .345 -0.02 .312
Weight-for-age
Mean Z-score 1188 -0.61 0.05 961 -0.57 0.05 997 -0.49 0.05 974 -0.50 0.05 991 -0.43 0.05 1051 -0.59 0.05 6162 -0.54 0.02
Percentage below -2 SD 1188 0.17 0.01 961 0.16 0.01 997 0.14 0.01 974 0.14 0.01 991 0.11 0.01 1051 0.16 0.01 6162 0.15 0.00
Percentage below -3 SD 1188 0.07 0.01 961 0.06 0.01 997 0.05 0.01 974 0.06 0.01 991 0.05 0.01 1051 0.07 0.01 6162 0.06 0.00
Weight-for-height
Mean Z-score 1116 0.11 0.06 920 0.08 0.06 962 0.20 0.06 928 0.15 0.06 945 0.21 0.06 986 0.12 0.06 5857 0.14 0.02
Percentage below -2 SD 1139 0.13 0.01 933 0.13 0.01 971 0.10 0.01 934 0.13 0.01 957 0.10 0.01 1015 0.13 0.01 5949 0.12 0.00
Percentage below -3 SD 1139 0.07 0.01 933 0.07 0.01 971 0.05 0.01 934 0.06 0.01 957 0.05 0.01 1015 0.06 0.01 5949 0.06 0.00
Height-for-age
Mean Z-score 1147 -1.09 0.06 944 -1.01 0.06 981 -1.03 0.06 968 -0.96 0.06 980 -0.90 0.06 1006 -1.06 0.07 6026 -1.01 0.03
Percentage below -2 SD 1147 0.29 0.01 944 0.29 0.01 981 0.30 0.01 968 0.29 0.01 980 0.27 0.01 1006 0.30 0.01 6026 0.29 0.01
Percentage below -3 SD 1147 0.14 0.01 944 0.14 0.01 981 0.13 0.01 968 0.13 0.01 980 0.14 0.01 1006 0.16 0.01 6026 0.14 0.00
Growth monitoring received in the past 6 months 1233 0.21 0.01 996 0.36 0.02 1028 0.27 0.01 996 0.32 0.01 1047 0.25 0.01 1088 0.24 0.01 6388 0.27 0.01
Vaccinations for children aged 12-23 months³
Received all basic vaccinations 414 0.83 0.02 385 0.84 0.02 389 0.88 0.02 396 0.85 0.02 364 0.80 0.02 370 0.82 0.02 2318 0.84 0.01
DPT 1 383 0.92 0.01 349 0.92 0.01 358 0.96 0.01 365 0.92 0.01 327 0.93 0.01 345 0.91 0.02 2127 0.93 0.01
DPT 2 351 0.89 0.02 320 0.91 0.02 311 0.95 0.01 327 0.89 0.02 310 0.90 0.02 319 0.90 0.02 1938 0.90 0.01
DPT 3 311 0.86 0.02 281 0.87 0.02 277 0.92 0.02 292 0.87 0.02 281 0.88 0.02 284 0.87 0.02 1726 0.88 0.01
Oral Poliovirus 0⁴ 330 0.93 0.01 333 0.90 0.02 324 0.92 0.02 339 0.92 0.01 321 0.88 0.02 311 0.91 0.02 1958 0.91 0.01
Oral Poliovirus 1 386 0.89 0.02 366 0.88 0.02 367 0.91 0.01 381 0.90 0.02 336 0.85 0.02 343 0.87 0.02 2179 0.89 0.01
Oral Poliovirus 2 338 0.88 0.02 319 0.84 0.02 330 0.89 0.02 335 0.87 0.02 305 0.81 0.02 310 0.84 0.02 1937 0.86 0.01
Oral Poliovirus 3 250 0.80 0.03 222 0.76 0.03 247 0.85 0.02 226 0.81 0.03 236 0.73 0.03 235 0.77 0.03 1416 0.79 0.01
Any basic vaccinations⁵ 414 0.95 0.01 385 0.93 0.01 389 0.94 0.01 396 0.94 0.01 364 0.91 0.01 370 0.94 0.01 2318 0.94 0.01
Vaccinations for children aged 24-35 months³
Received all basic vaccinations 195 0.78 0.03 121 0.85 0.03 123 0.80 0.04 121 0.74 0.04 153 0.80 0.03 143 0.73 0.04 856 0.78 0.01
MMR 189 0.80 0.03 113 0.85 0.03 115 0.81 0.04 112 0.75 0.04 146 0.79 0.03 142 0.75 0.04 817 0.79 0.01
Any basic vaccinations⁶ 195 0.95 0.02 121 0.95 0.02 123 0.93 0.02 121 0.93 0.02 153 0.92 0.02 143 0.90 0.02 856 0.93 0.01
Place of last vaccination 1136 0.88 0.01 964 0.93 0.01 1004 0.93 0.01 1012 0.93 0.01 997 0.91 0.01 1029 0.89 0.01 6142 0.91 0.00
Base
lin
e
Ch
ild
ren
(15)
Follo
w-U
p
Total
By Treatment Arm Grand
Ro
und
Po
pula
tio
n
Balance
T0: Comparison T1: PBF Only T2: PBF + CQI T3: PBF + CSC T4: CQI Only T5: CSC Only CQI CSC
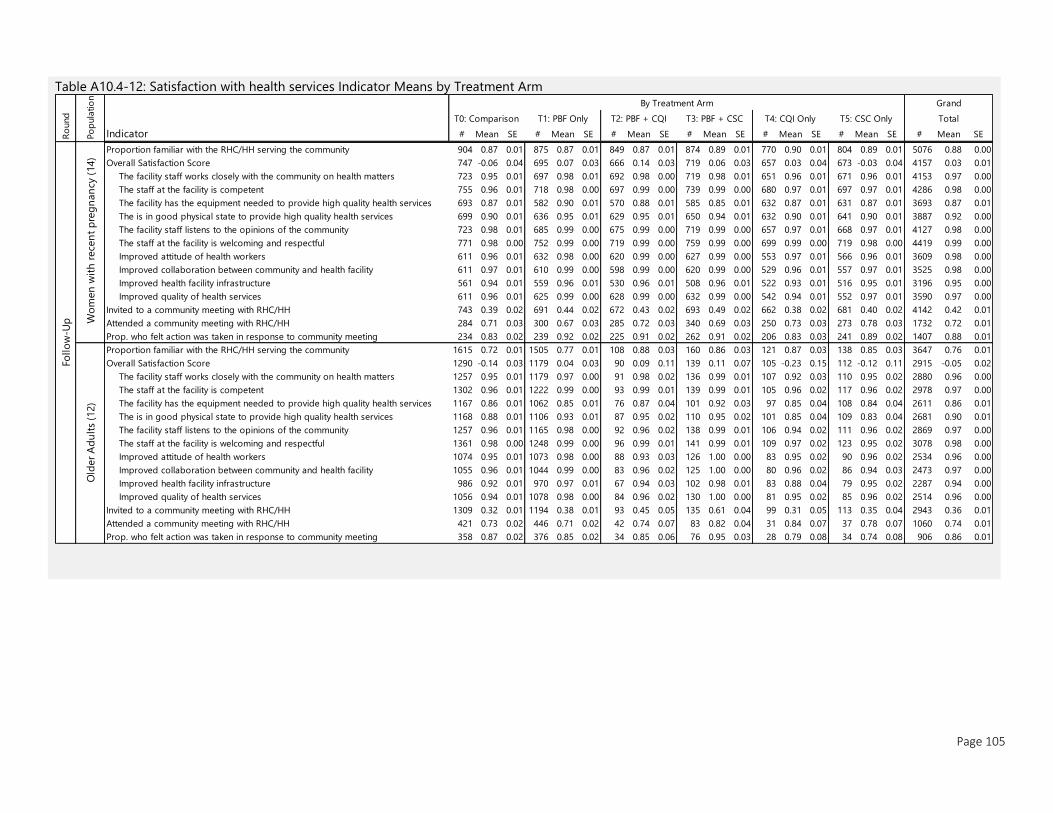
Page 105
Table A10.4-12: Satisfaction with health services Indicator Means by Treatment Arm
Indicator # Mean SE # Mean SE # Mean SE # Mean SE # Mean SE # Mean SE # Mean SE
Proportion familiar with the RHC/HH serving the community 904 0.87 0.01 875 0.87 0.01 849 0.87 0.01 874 0.89 0.01 770 0.90 0.01 804 0.89 0.01 5076 0.88 0.00
Overall Satisfaction Score 747 -0.06 0.04 695 0.07 0.03 666 0.14 0.03 719 0.06 0.03 657 0.03 0.04 673 -0.03 0.04 4157 0.03 0.01
The facility staff works closely with the community on health matters 723 0.95 0.01 697 0.98 0.01 692 0.98 0.00 719 0.98 0.01 651 0.96 0.01 671 0.96 0.01 4153 0.97 0.00
The staff at the facility is competent 755 0.96 0.01 718 0.98 0.00 697 0.99 0.00 739 0.99 0.00 680 0.97 0.01 697 0.97 0.01 4286 0.98 0.00
The facility has the equipment needed to provide high quality health services 693 0.87 0.01 582 0.90 0.01 570 0.88 0.01 585 0.85 0.01 632 0.87 0.01 631 0.87 0.01 3693 0.87 0.01
The is in good physical state to provide high quality health services 699 0.90 0.01 636 0.95 0.01 629 0.95 0.01 650 0.94 0.01 632 0.90 0.01 641 0.90 0.01 3887 0.92 0.00
The facility staff listens to the opinions of the community 723 0.98 0.01 685 0.99 0.00 675 0.99 0.00 719 0.99 0.00 657 0.97 0.01 668 0.97 0.01 4127 0.98 0.00
The staff at the facility is welcoming and respectful 771 0.98 0.00 752 0.99 0.00 719 0.99 0.00 759 0.99 0.00 699 0.99 0.00 719 0.98 0.00 4419 0.99 0.00
Improved attitude of health workers 611 0.96 0.01 632 0.98 0.00 620 0.99 0.00 627 0.99 0.00 553 0.97 0.01 566 0.96 0.01 3609 0.98 0.00
Improved collaboration between community and health facility 611 0.97 0.01 610 0.99 0.00 598 0.99 0.00 620 0.99 0.00 529 0.96 0.01 557 0.97 0.01 3525 0.98 0.00
Improved health facility infrastructure 561 0.94 0.01 559 0.96 0.01 530 0.96 0.01 508 0.96 0.01 522 0.93 0.01 516 0.95 0.01 3196 0.95 0.00
Improved quality of health services 611 0.96 0.01 625 0.99 0.00 628 0.99 0.00 632 0.99 0.00 542 0.94 0.01 552 0.97 0.01 3590 0.97 0.00
Invited to a community meeting with RHC/HH 743 0.39 0.02 691 0.44 0.02 672 0.43 0.02 693 0.49 0.02 662 0.38 0.02 681 0.40 0.02 4142 0.42 0.01
Attended a community meeting with RHC/HH 284 0.71 0.03 300 0.67 0.03 285 0.72 0.03 340 0.69 0.03 250 0.73 0.03 273 0.78 0.03 1732 0.72 0.01
Prop. who felt action was taken in response to community meeting 234 0.83 0.02 239 0.92 0.02 225 0.91 0.02 262 0.91 0.02 206 0.83 0.03 241 0.89 0.02 1407 0.88 0.01
Proportion familiar with the RHC/HH serving the community 1615 0.72 0.01 1505 0.77 0.01 108 0.88 0.03 160 0.86 0.03 121 0.87 0.03 138 0.85 0.03 3647 0.76 0.01
Overall Satisfaction Score 1290 -0.14 0.03 1179 0.04 0.03 90 0.09 0.11 139 0.11 0.07 105 -0.23 0.15 112 -0.12 0.11 2915 -0.05 0.02
The facility staff works closely with the community on health matters 1257 0.95 0.01 1179 0.97 0.00 91 0.98 0.02 136 0.99 0.01 107 0.92 0.03 110 0.95 0.02 2880 0.96 0.00
The staff at the facility is competent 1302 0.96 0.01 1222 0.99 0.00 93 0.99 0.01 139 0.99 0.01 105 0.96 0.02 117 0.96 0.02 2978 0.97 0.00
The facility has the equipment needed to provide high quality health services 1167 0.86 0.01 1062 0.85 0.01 76 0.87 0.04 101 0.92 0.03 97 0.85 0.04 108 0.84 0.04 2611 0.86 0.01
The is in good physical state to provide high quality health services 1168 0.88 0.01 1106 0.93 0.01 87 0.95 0.02 110 0.95 0.02 101 0.85 0.04 109 0.83 0.04 2681 0.90 0.01
The facility staff listens to the opinions of the community 1257 0.96 0.01 1165 0.98 0.00 92 0.96 0.02 138 0.99 0.01 106 0.94 0.02 111 0.96 0.02 2869 0.97 0.00
The staff at the facility is welcoming and respectful 1361 0.98 0.00 1248 0.99 0.00 96 0.99 0.01 141 0.99 0.01 109 0.97 0.02 123 0.95 0.02 3078 0.98 0.00
Improved attitude of health workers 1074 0.95 0.01 1073 0.98 0.00 88 0.93 0.03 126 1.00 0.00 83 0.95 0.02 90 0.96 0.02 2534 0.96 0.00
Improved collaboration between community and health facility 1055 0.96 0.01 1044 0.99 0.00 83 0.96 0.02 125 1.00 0.00 80 0.96 0.02 86 0.94 0.03 2473 0.97 0.00
Improved health facility infrastructure 986 0.92 0.01 970 0.97 0.01 67 0.94 0.03 102 0.98 0.01 83 0.88 0.04 79 0.95 0.02 2287 0.94 0.00
Improved quality of health services 1056 0.94 0.01 1078 0.98 0.00 84 0.96 0.02 130 1.00 0.00 81 0.95 0.02 85 0.96 0.02 2514 0.96 0.00
Invited to a community meeting with RHC/HH 1309 0.32 0.01 1194 0.38 0.01 93 0.45 0.05 135 0.61 0.04 99 0.31 0.05 113 0.35 0.04 2943 0.36 0.01
Attended a community meeting with RHC/HH 421 0.73 0.02 446 0.71 0.02 42 0.74 0.07 83 0.82 0.04 31 0.84 0.07 37 0.78 0.07 1060 0.74 0.01
Prop. who felt action was taken in response to community meeting 358 0.87 0.02 376 0.85 0.02 34 0.85 0.06 76 0.95 0.03 28 0.79 0.08 34 0.74 0.08 906 0.86 0.01
Follo
w-U
p
T0: Comparison T1: PBF Only T2: PBF + CQI T3: PBF + CSC
Wo
men
wit
h r
ece
nt
pre
gn
an
cy (
14)
Old
er
Ad
ult
s (1
2)
Ro
und
Po
pula
tio
n
T4: CQI Only T5: CSC Only Total
By Treatment Arm Grand
11 REFERENCES 1. Government of Tajikistan. Agency on statistics under the President of the Republic of Tajikistan /
Agency on statistics under President of the Republic of Tajikistan. Key Indicators.
https://www.stat.tj/en/. Published 2018. Accessed November 12, 2018.
2. The World Bank. World Development Indicators. 2018.
https://data.worldbank.org/indicator/NY.GDP.MKTP.KD.ZG. Accessed August 30, 2018.
3. Institute for Health Metrics and Evaluation. Global Burden of Disease Country Profile: Tajikistan.
Global Burden of Disease. http://www.healthdata.org/tajikistan. Published 2018. Accessed
December 11, 2018.
4. Khodjamurodov G, Rechel B. Tajikistan Health System Review. Vol 12.; 2010.
http://www.euro.who.int/__data/assets/pdf_file/0009/119691/E94243.pdf. Accessed November 12,
2018.
5. Quality of Child Health Services in Tajikistan.; 2011. doi:62870-TJ.
6. The World Bank. World Bank Development Indicators.; 2014. http://data.worldbank.org/indicator.
7. UNICEF Annual Report Tajikistan.; 2016.
https://www.unicef.org/about/annualreport/files/Tajikistan_2016_COAR.pdf. Accessed November
12, 2018.
8. Renmans D, Holvoet N, Orach CG, Criel B. Opening the “black box” of performance-based
financing in low- and lower middle-income countries: A review of the literature. Health Policy
Plan. 2016;31(9):1297-1309. doi:10.1093/heapol/czw045.
9. Ringold D, Holla A, Koziol M, Srinivasan S. Citizens and Service Delivery: Assessing the Use of Social
Accountability Approaches in Human Development. Washington DC; 2012.
http://documents.worldbank.org/curated/en/426741468331758042/pdf/657450PUB0EPI1065724
B09780821389805.pdf. Accessed November 13, 2018.
10. McGee R, Gaventa J, Barrett G, Calland R. Transaprency and Accountability Innitaitves Report.
2010:1-55. www.transparency-initiative.org%5CnCopyright.
11. Kolstad BJT. American Economic Association Information and Quality When Motivation is
Intrinsic : Evidence from Surgeon Report Cards Author ( s ): Jonathan T . Kolstad Source : The
American Economic Review , Vol . 103 , No . 7 ( DECEMBER 2013 ), pp . 2875-2910 Publish.
2016;103(7):2875-2910. doi:10.1103/PhysRevLett.92.210403.
12. Dranove D, Kessler D, McClellan M, Satterthwaite M. Is More Information Better? The Effects of
“Report Cards” on Health Care Providers. J Polit Econ. 2003;111(3):555-588. doi:10.1086/374180.
13. Cutler D, Huckman R, Landrum MB. The Role of Information in Medical Markets: An Analysis of
Publicly Reported Outcomes in Cardiac Surgery.; 2004.
14. Björkman M, Svensson J. Power to the People : Evidence from a Randomized Field Experiment on
Community-Based Monitoring in Uganda Author ( s ): Martina Björkman and Jakob Svensson
Published by : Oxford University Press Stable URL : http://www.jstor.org/stable/40506242
Accessed : Q J Econ. 2009;124(2):735-769. doi:10.4137/EBO.S10189.Received.
Page 107
15. Mcintyre D, Rogers L, Heier EJ. Overview, History, and Objectives of Performance Measurement.
https://www.ncbi.nlm.nih.gov/pmc/articles/PMC4194707/pdf/hcfr-22-3-007.pdf. Accessed
November 13, 2018.
16. Wild L, Harris D. The Political Economy of Community Scorecards in Malawi November 2011. Odi.
2011;44(November):1-40.
17. Nyqvist MB, de Walque D, Svensson J. Experimental evidence on the long-run impact of
community-based monitoring. Am Econ J Appl Econ. 2017;9(1):33-69. doi:10.1257/app.20150027.
18. Arur A, Walldorf J, Walque D de, Shapira G. Baseline Study for the Impact Evaluation of a
Performance Based Financing ( PBF ) Pilot in Tajikistan. Washington, D.C.; 2017.
19. Cameron AC, Gelbach JB, Miller DL. Bootstrap-Based Improvements for Inference with Clustered
Errors Author ( s ): A . Colin Cameron , Jonah B . Gelbach and Douglas L . Miller Source : The
Review of Economics and Statistics , Vol . 90 , No . 3 ( Aug ., 2008 ), pp . 414-427 Published by : Th.
2016;90(3):414-427.
Copyright © 2022 FDOKUMEN