Table of Contents - NEDA Region IV-A
352
-
Upload
khangminh22 -
Category
Documents
-
view
1 -
download
0
Transcript of Table of Contents - NEDA Region IV-A


Table of Contents Regional Development Council Resolutions v
Message from the Secretary of Socioeconomic Planning vii
Message form the CALABARZON RDC Chairperson ix
Foreword form the NEDA Regional Director xi
Acknowledgement xiii
List of Tables and Figures xvii
Part I: Introduction
Chapter 1: The Long View 5 Chapter 2: Global and Regional Trends and Prospects 11 Chapter 3: Overlay of Economic Growth, Demographic Trends, and
Physical Characteristics 17
Chapter 4: Regional Development Plan 2017-2022 Overall Framework 29 Part II: Enhancing the Social Fabric ("Malasakit)
Chapter 5: Ensuring People-Centered, Clean, and Efficient Governance 37 Chapter 6: Pursuing Swift and Fair Administration of Justice 47 Chapter 7: Promoting Philippine Culture and Values 55 Part III: Inequality-Reducing Transformation ("Pagbabago")
Chapter 8: Expand Economic Opportunities in Agriculture, Forestry, and Fisheries
69
Chapter 9: Expand Economic Opportunities in Industry and Services 85 Chapter 10: Accelerating Human Capital Development 107 Chapter 11: Reducing Vulnerability of Individuals and Families 125 Chapter 12: Building Safe and Secure Communities 139 Part IV: Increasing Growth Potential ("Patuloy na Pag-unlad")
Chapter 13: Reaching for the Demographic Dividend 153 Chapter 14: Vigorously Advancing Science, Technology, and Innovation 165 Part V: Enabling and Supportive Economic Development
Chapter 15: Ensuring Sound Macroeconomic Policy 187 Chapter 16: Leveling the Playing Field 213 Part VI: Foundations for Sustainable Development
Chapter 17: Attaining Just and Lasting Peace 223 Chapter 18: Ensuring Regional Security, Public Order, and Safety 233 Chapter 19: Accelerating Infrastructure Development 245 Chapter 20: Ensuring Ecological Integrity, Clean and Healthy Environment 275

iv Regional Development Plan 2017-2022
Chapter 21: Ensuring Safe, Orderly, and Regular Migration 301 Part VII: Plan Implementation and Monitoring
Chapter 22: Plan Implementation and Monitoring 313 List of Acronyms 317
RDP 2017-2022 Planning Committees 323

Regional Development Plan 2017-2022 | v
RDC Resolution

vi Regional Development Plan 2017-2022
RDC Resolution

Regional Development Plan 2017-2022 | vii
Message
As we embarked on this journey towards real and pivotal change for our country, one of the commitments of this Administration is to reduce inequality and spread economic growth and development to the regions. Being the first medium-term development plan geared to the realization of AmBisyon Natin 2040 or the Filipino people’s collective aspiration for self and the country by 2040, the Philippine Development Plan (PDP) 2017-2022 has been instrumental in laying the necessary foundations for inclusive growth and sustainable development. Acknowledging that key to a growth that leaves no one behind regardless of one’s location, the PDP 2017-2022 is the first development plan to have a dedicated chapter on the National Spatial Strategy (NSS). The NSS banks on three core strategies: regional agglomeration; connectivity; and vulnerability reduction to ensure that all regions have access to basic services and to development opportunities. These strategies are likewise reflected in the Regional Development Plans (RDPs). These Plans highlight their respective region’s comparative advantage and identify possible areas of collaboration among neighboring regions. Three years into the Plan’s implementation, we have witnessed significant strides in regional development. Increasingly, big-ticket infrastructure projects covering various sectors are being distributed among the regions. Apart from improving connectivity in areas where these projects are located, these have likewise facilitated access to better services and created economic opportunities for private sector investors and individuals in terms of doing business and securing employment.

viii Regional Development Plan 2017-2022
These developments, coupled with an enabling environment provided by the passage of key legislations in line with the priorities of the PDP 2017-2022 (i.e., Universal Health Care Law, Universal Access to Quality Tertiary Education Act, and Ease of Doing Business and Efficient Government Service Delivery Act to name a few), we have empowered more Filipinos, most especially those from the regions, to be engaged in and benefit from the country’s expanding economic activities. These key reforms and programs are just the first steps needed in our journey towards AmBisyon Natin 2040. Moving on to the last few years of the Plan’s implementation period, the Regional Development Councils (RDCs) through the NEDA Regional Offices, in close coordination with government agencies and private sector representatives, assessed the gains and recalibrated the strategies to ensure that these are responsive to current and emerging challenges that the regions are facing.
For the rest of the Plan period, NEDA remains committed to pursuing more meaningful reforms and programs for the people, while keeping regional development at the center of our economic growth strategy. With the updated RDPs, we hope to introduce policies and programs for the creation of more and better jobs, improvement of social services, innovative activities, and the rollout of infrastructure projects connecting the countryside to growth centers. To ensure the fruition of our efforts, once again I urge the regions, through the RDCs, to continue to steer the course in the next three years to realize our goal of laying a solid foundation for a stronger and more resilient nation for future generations.

Regional Development Plan 2017-2022 | ix
Message
In 2017, the RDC approved the CALABARZON Regional Development Plan (RDP) 2017-2022. After two years, we assessed our performance in the Region against the Plan targets to see how we are faring. Based on this assessment, the Plan was updated. The Updated RDP focuses on the priority strategies, programs, and projects that will ensure we will realize our targets and our vision. It is to be expected that changes have to be introduced to adopt to the requirements of the current and anticipated economic situations which understandably very much affected by the Taal Volcano eruption and the devastation brought about by the COVID-19 pandemic. I cannot over emphasize the importance of convergence and participatory governance in nation building. We, in the RDC, recognize the crucial roles of both public and private in setting the direction of regional development. The RDC calls for the harmonization of local development plans and the active participation and support of all stakeholders in the implementation of the Updated Plan through the formulation of policies, and proposing programs, projects and activities that are aligned with the Plan targets. With our Updated CALABARZON RDP 2017-2022 and the support of all stakeholders, we are now moving closer to building a secure, comfortable and strongly rooted life for the people of CALABARZON and a brighter and a more secure future for the generations to come.
HERMILANDO I. MANDANAS RDC Chairperson

x Regional Development Plan 2017-2022

Regional Development Plan 2017-2022 | xi
Foreword
As the Region continues to be at the forefront of economic development through its attractive investment opportunities, business-friendly environment, excellent industry sector performance, and rapidly increasing labor force, the challenge shifts to sustaining the Region’s positive performance and maximizing its gains. This will ensure that everyone benefits from the economic growth. The Updated Regional Development Plan (RDP) 2017-2022 highlights the relevant issues and concerns encountered during the first two years of the Plan implementation that may hinder the attainment of the Regional targets. Corresponding strategies, programs and projects that will address the identified issues and concerns make up the Plan. It has twenty-two chapters consisted of strategies focusing on enhancing the social fabric (Malasakit), reducing inequality (Pagbabago), and increasing growth potential (Patuloy na Pag-unlad) and included a new chapter on ensuring safe and orderly migration. This RDP is anchored on the country’s long term vision, the AmBisyon Natin 2040, which visualizes the Philippines to be a “prosperous, predominantly middle-class society where no one is poor” by 2040. It is likewise aligned with the Updated Philippine Development Plan (PDP) which operationalizes the current administration’s 0 to 10 Socioeconomic Agenda. The Regional Development Council, with its several planning committees, spearheaded the formulation of the Updated RDP through a series of consultative workshops. These were participated by representatives from the various sectors of society to guarantee the inclusivity of the Plan and its responsiveness to the needs and demands in the Region. Thus, the Plan is not
xii Regional Development Plan 2017-2022
only made for the people but is created by the people. With this, everyone is encouraged to use the Updated Plan as a guide for development initiatives and to ensure that the Region works within a common development framework and towards the same goals. The priority strategies identified in the Plan will be translated to priority programs, projects and activities (PPAs) which will be the basis of the Regional Development Investment Program. The Plan is annually
assessed by monitoring and evaluation of the achievement of the Plan targets through the Regional Development Report and by monitoring of the implementation of PPAs through the Regional Project Monitoring and Evaluation System. The realization of this Plan is a step towards the realization of our vision of a globally competitive industrial region where its people enjoy a matatag, maginhawa, at panatag na buhay.
LUIS G. BANUA
NEDA Region IV-A Director and RDC Vice-Chairperson
Regional Development Plan 2017-2022 | xiii
Acknowledgment The completion of the CALABARZON Regional Development Plan 2017-2022 Midterm Update was made possible through the collaborative efforts of the members of the Regional Development Council and its partners. We thank the following for their immense contribution in the completion of the Updated Plan:
• Provincial Government of Cavite • Provincial Government of Laguna • Provincial Government of Batangas • Provincial Government of Rizal • Provincial Government of Quezon • Armed Forces of the Philippines, Southern Luzon Command • Bangko Sentral ng Pilipinas-Lucena Branch • Bureau of Fire Protection Region IV-A • Bureau of Fisheries and Aquatic Resources Region IV-A • Bureau of Local Government Finance Region IV-A • Bureau of Jail Management and Penology Region IV-A • Civil Service Commission Region IV • Commission on Audit • Commission on Higher Education Region IV-A • Commission on Human Rights Region IV-A • Commission on Population and Development Region IV-A • Cooperative Development Authority Region IV-A • Development Academy of the Philippines • Department of Agriculture Region IV-A • Department of Agriculture – National Dairy Authority • Department of Agriculture – National Livestock Program • Department of Agriculture – Philippine Crop Insurance Corporation • Department of Agriculture – Agricultural Credit Policy Council • Department of Agriculture – Agricultural Training Institute • Department of Agriculture – Philippine Fiber Industry
Development Authority • Department of Agriculture – Philippine Center for Postharvest Development
and Mechanization • Department of Agriculture – Philippine Coconut Authority Region IV-A • Department of Agriculture – National Food Authority Region IV • Department of Agrarian Reform Region IV-A • Department of Budget and Management Region IV-A • Department of Education Region IV-A • Department of Environment and Natural Resources Region IV-A • Department of Environment and Natural Resources - Environment
Management Bureau Region IV-A

xiv Regional Development Plan 2017-2022
• Department of Environment and Natural Resources Region – Forest Management Bureau
• Department of Energy - Energy Policy and Planning Bureau • Department of Foreign Affairs - Lucena City • Department of Health Region IV-A • Department of Interior and Local Government Region IV-A • Department of Justice – Office of the Regional Prosecutor IV-A • Department of Justice – Parole and Probation Administration Region IV-A • Department of Justice – Public Attorney’s Office Region IV-A • Department of Labor and Employment Region IV-A • Department of Science and Technology Region IV-A • Department of Tourism Region IV-A • Department of Transportation • Department of Public Works and Highways Region IV-A • Department of Social Welfare and Development Field Office IV-A • Department of Trade and Industry Region IV-A • Department of Human Settlements and Urban Development Region IV-A • Home Mutual Development Fund • Intellectual Property Office of the Philippines • Laguna Lake Development Authority • Land Transportation Office Region IV-A • National Commission for Culture and the Arts • National Commission on Indigenous Peoples Region IV • National Electrification Administration • National Home Mortgage Corporation • National Housing Authority Region IV-A • National Irrigation Administration Region IV-A • National Intelligence Coordinating Agency Region IV • Office of the Civil Defense Region IV-A • Office of the Presidential Adviser on Peace Process • Overseas Workers Welfare Administration Region IV-A • Philippine Council for Agriculture, Aquatic and Natural Resources Research
and Development • Philippine Drug Enforcement Agency Region IV-A • Philippine Economic Zone Authority • Philippine Guarantee Corporation • Philippine Health Insurance Corporation Region IV-A • Philippine Information Agency Region IV-A • Philippine National Police Region IV-A • Philippine Ports Authority – Batangas • Philippine Ports Authority – Marquez • Philippine National Railways • Philippine Statistics Authority Region IV-A • Social Housing Finance Corporation • Technical Education and Skills Development Authority Region IV-A • Toll Regulatory Board

Regional Development Plan 2017-2022 | xv
• Batangas State University • Cavite State University • Laguna State Polytechnic University • Southern Luzon State University • University of Rizal System • University of the Philippines – Los Baños • Atikha Overseas Workers and Communities Initiative, Inc. • Cavite Metro Multipurpose Cooperative • Cavite Technical Vocational Educators Association, Inc. • Enrique Zobel Foundation • Kabisig ng Kalahi Inc. • National Council of Women of the Philippines • PATAMABA-Workers in the Informal Sector Enterprise • Philippine Chamber of Commerce & Industry- Cavite, Inc. • Philippine Industrial Estate Association, Inc. • Philippine Institute of Civil Engineers-Batangas Chapter • Philippine Metalworkers’ Alliance • Punta Fuego Village Foundation, Inc. • Regional Tripartite Industrial Peace Council-IV-A, Inc. • Sinag Kalinga Foundation Inc. • Sorosoro Ibaba Devt.Cooperative • Seven Squares Advocacy Cooperative • Teach for the Philippines
To everyone who took part in this shared endeavor, our sincerest gratitude and appreciation.

xvi Regional Development Plan 2017-2022

Regional Development Plan 2017-2022 | xvii
List of Tables and Figures Chapter 1 The Long View
Figure 1.1 The RDP within the context of the Long-Term Development Plan
5
Figure 1.2 Regional Development Plan, 2017-2022 7
Chapter 3 Overlay of Economic Growth, Demographic Trends, and Physical Characteristics
Table 3.1 CALABARZON Political Subdivision, 2015 and 2019 17 Table 3.2 Percentage Distribution of Urban-Rural Population,
CALABARZON, 2000 to 2015 18
Figure 3.1 CALABARZON Network of Settlements, 2015 19 Table 3.3 5-Level Network of Settlements, 2015 20 Figure 3.2 Proposed CALABARZON Transport Solution 26
Chapter 4 Regional Development Plan 2017-2022 Overall Framework
Figure 4.1 The Development Framework 29
Chapter 5 Ensuring People-Centered, Clean, and Efficient Governance
Figure 5.1 Strategic Framework to Ensure People-Centered, Clean, and Efficient Governance
40
Table 5.1 Plan Targets to Ensure People-Centered, Clean and Efficient Governance
40
Chapter 6 Pursuing Swift and Fair Administration of Justice
Table 6.1 Improvement in CALABARZON Justice System, 2016- 2018 47 Table 6.2 Constructed Jail Facilities, 2016–2018 48 Table 6.3 Cases Assisted and Resolved, 2017-2019 48 Table 6.4 Effect of Operationalizing Local Interventions for
Rehabilitation, 2017 – 2018 48
Figure 6.1 Strategic Framework to Pursue Swift and Fair Administration of Justice
49
Table 6.5 Plan Targets to Pursue Swift and Fair Administration of Justice
50
Chapter 7 Promoting Philippine Culture and Values
Figure 7.1 Strategic Framework to Promote Philippine Culture and Values
57
Table 7.1 Plan Targets to Promote Philippine Culture and Values 58

xviii Regional Development Plan 2017-2022
Chapter 8 Expand Economic Opportunities in Agriculture, Forestry, and Fisheries
Table 8.1 Growth Rate of GVA in AHFF (in percent) 69 Table 8.2 Growth Rate of Value of Production by Subsector (in percent,
at constant prices) 69
Table 8.3 Yield of Major Commodities (in MT/Ha, cumulative) 70 Table 8.4 Growth in Volume of Fisheries Production (in percent) 70 Table 8.5 Volume of Priority Fishery Commodities Production (in ‘000
MT, cumulative) 71
Table 8.6 Volume of Production (in ‘000 MT, cumulative) 71 Table 8.7 Technical Support Services Provided 72 Figure 8.1 Strategic Framework to Expand Economic Opportunities in
Agriculture, Forestry, and Fisheries 74
Table 8.8 Plan Targets to Expand Economic Opportunities in Agriculture, Forestry, and Fisheries
74
Table 8.9 Target Growth in Volume of Production (in percentage) 75 Table 8.10 Target Volume of Production (‘000 MT, cumulative) 75 Table 8.11 Target Yield of Coconut (MT/ha, 2020-2022) 75
Chapter 9 Expand Economic Opportunities in Industry and Services
Table 9.1 Industry and Services Target and Actual Growth Rates, CALABARZON, 2016-2018
86
Table 9.2 Gross Regional Domestic Product in the Industry Sector, CALABARZON, 2016-2018
86
Table 9.3 Gross Regional Domestic Product in the Services Sector, CALABARZON, 2016-2018
87
Table 9.4 Employment Generated in the Industry Sector, CALABARZON, 2016-2018
87
Table 9.5 Employment Generated in the Services Sector, CALABARZON, 2016-2018
88
Table 9.6 Employment Generated in the Industry Subsectors by Sex (in ‘000), CALABARZON, 2016-2017
88
Table 9.7 Employment Generated in the Services Subsector by Sex, CALABARZON, 2016-2018
88
Figure 9.1 CALABARZON Economic Zones 90 Table 9.8 Merchandise Exports, Total Approved Investments and
Domestic Sales in CALABARZON, 2016-2018 91
Table 9.9 Target and Actual Tourism Data, CALABARZON, 2016-2019 92 Table 9.10 Number of Negosyo Centers Established per Province per Year,
2015-2018 93
Table 9.11 Consumer Awareness and Access to Economic Opportunities, CALABARZON, 2016 - 2018
94
Figure 9.2 Strategic Framework to Expand Economic Opportunities in Industry and Services
95
Table 9.12 Plan Targets to Expand Economic Opportunities in Industry and Services
96

Regional Development Plan 2017-2022 | xix
Chapter 10 Accelerating Human Capital Development
Table 10.1 Net Enrolment and Completion Rate, CALABARZON, 2016-2019
110
Table 10.2 Employment, Unemployment, and Underemployment Rates, CALABARZON, 2016-2018
111
Figure 10.1 Strategic Framework to Accelerate Human Capital Development
112
Table 10.3 Plan Targets to Accelerate Human Capital Development 113
Chapter 11 Reducing Vulnerability of Individuals and Families
Table 11.1 CALABARZON Health Insurance Indicators, 2016-2018 126 Figure 11.1 Strategic Framework to Reduce Vulnerability of Individual
and Families 131
Table 11.2 Plan Targets to Reduce Vulnerability of Individual and Families
131
Chapter 12 Building Safe and Secure Communities
Table 12.1 National Shelter Program Direct Housing Assistance Annual Accomplishments, 2017-2019
140
Table 12.2 National Shelter Program Indirect Housing Assistance Annual Accomplishments, 2017-2019
141
Table 12.3 Accomplishments in Building a Safe and Resilient Communities
142
Figure 12.1 Strategic Framework to Build Safe and secure Communities 143 Table 12.4 Plan Targets to Build Safe and secure Communities 143 Table 12.5 Direct Housing Provision Targets (in units/households),
2020-2022 144
Table 12.6 Indirect Housing Provision Targets (in units/households), 2020-2022
144
Chapter 13 Reaching for the Demographic Dividend
Table 13.1 CALABARZON Population and Population Growth 153 Figure 13.1 Population Pyramid, CALABARZON, 2010 and 2015 154 Table 13.2 Modern Contraceptives Prevalence Rate (in percent) by
Province, 2017-2018 154
Table 13.3 Maternal Mortality Ratio by Province, 2017-2018 155 Table 13.4 Under-Five Mortality Rate by Province, 2017-2018 155 Table 13.5 Prevalence Rate of Stunting, Wasting, and Obesity of Children
Less Than 5 Years Old and Aged 10-15 in CALABARZON, 2013 and 2015
156
Table 13.6 Number of Enrollees in CALABARZON, 2017-2019 157 Figure 13.2 Strategic Framework to Reach the Demographic Dividend 157 Table 13.7 Plan Targets to Reach the Demographic Dividend 158

xx Regional Development Plan 2017-2022
Chapter 14 Vigorously Advancing Science, Technology, and Innovation
Table 14.1 Number of Technologies Promoted, CALABARZON, 2017-2019
166
Table 14.2 Number of Technologies: Adopted/Utilized, CALABARZON, 2017-2019
166
Table 14.3 Number of Technology Adopters, CALABARZON, 2017-2019 167 Table 14.4 Intellectual Property Rights Registration, CALABARZON,
2017-2019 167
Table 14.5 Intellectual Property Rights Application, CALABARZON, 2017-2019
168
Table 14.6 Number of S&T Interventions Provided, CALABARZON, 2017-2019
168
Table 14.7 Number of Firms Provided with S&T Services, CALABARZON, 2017-2019
168
Table 14.8 Number of Jobs Generated, CALABARZON, 2017-2019 169 Table 14.9 Number of S&T Promotional Activities Conducted,
CALABARZON, 2017-2019 169
Table 14.10 Completed and Published Research, CALABARZON, 2011–2019
170
Table 14.11 Focus of Completed Researches, CALABARZON, 2011–2019 170 Table 14.12 Completed Researches by Sector, CALABARZON, 2011–2019 170 Table 14.13 Number of STEM Enrollees and Graduates in HEIs,
CALABARZON, 2017-2019 171
Table 14.14 Number of STEM enrollees and graduates in senior high school, CALABARZON, 2017-2019
172
Table 14.15 Ongoing STI Linkages in CALABARZON 172 Table 14.16 Changes in Chapter 14 Results Matrix Indicators 174 Table 14.17 Availability of Regional Data for Chapter 14 Result
Matrix Indicators 175
Figure 14.1 Strategic Framework to Vigorously Advance Science, Technology and Innovation
175
Table 14.18 Plan Targets to Vigorously Advance Science, Technology and Innovation
176
Chapter 15 Ensuring Sound Macroeconomic Policy
Table 15.1 Gross Regional Domestic Product by Industrial Origin, CALABARZON (at constant 2000 prices)
188
Table 15.2 Growth Rate of Gross Regional Domestic Product by Industrial Origin
189
Table 15.3 Percent Distribution of Gross Regional Domestic Product 2014-2018
189
Table 15.4 Growth Rate of Agriculture and Fisheries Output (at constant 2000 prices)
191
Table 15.5 Growth Rate of Industry Output (at constant 2000 prices) 192 Table 15.6 Growth Rate of Services Output (at constant 2000 prices) 193

Regional Development Plan 2017-2022 | xxi
Table 15.7 Per Capita Gross Domestic Product in Pesos (at constant 2000 prices)
193
Table 15.8 Employment, Unemployment, and Underemployment Rates in CALABARZON, 2016-2018 (in percent)
194
Table 15.9 Poverty Incidence Among Families, by Region (in percent) 195 Table 15.10 Poverty Incidence among Population, by Region (in percent) 195 Table 15.11 CALABARZON Least Developed Municipalities (based on
2012 & 2015 Small Area Poverty Estimates) 195
Table 15.12 Inflation Rate 197 Table 15.13 Comparison of Inflation Rates in CALABARZON, 2017-2020 197 Table 15.14 Number of Offices by Type of Bank, CALABARZON,
2016-2018 198
Table 15.15 Number of Banks in CALABARZON by Type, by Province, 2016-2018
198
Table 15.16 Total Assets by Type of Bank, CALABARZO, 2016-2018 (in billion pesos)
199
Table 15.17 Bank Density Ratio in CALABARZON, 2016-2018 199 Table 15.18 Number of Automated Teller Machines, CALABARZON,
2016-2018 199
Table 15.19 Deposit Liabilities by Type of Bank, 2016-2018 (in billion pesos)
200
Table 15.20 Net Loan Portfolio by Type of Bank, CALABARZON, 2016-2018 (in billion pesos)
200
Table 15.21 Microfinance Statistics, CALABARZON, 2016-2018 201 Table 15.22 Number of Registered Cooperatives Per Year/Type: 2015-2018 201 Table 15.23 Total Cooperative Assets Based on Encoded AFS
(in billion pesos) 202
Table 15.24 Revenue Type, Actual Collections, CALABARZON 2016-2018 (in million pesos)
202
Table 15.25 Revenue Type, Targets, Accomplishments, CALABARZON 2016-2018 (in million pesos)
202
Figure 15.1 Strategic Framework to Sustain a Sound Macroeconomic Policy
203
Table 15.26 Plan Targets to Sustain a Sound Macroeconomic Policy 203
Chapter 16 Leveling the Playing Field
Figure 16.1 Decomposition of Philippines Product Market Regulations Score for the Philippines
214
Figure 16.2 Strategic Framework to Level the Playing Field 215
Chapter 17 Attaining Just and Lasting Peace
Figure 17.1 Trend of STRPC Power Factors in CALABARZON 224 Figure 17.2 Strategic Framework to Attain Just and Lasting Peace 226 Table 17.1 Plan Targets to Attain Just and Lasting Peace 226

xxii Regional Development Plan 2017-2022
Chapter 18 Ensuring Regional Security, Public Order, and Safety
Figure 18.1 Comparative Index Crime Volume, CALABARZON, 2016-2019
233
Figure 18.2 Index Crime Distribution, CALABARZON, 2018 234 Figure 18.3 Comparative Crime Clearance and Crime Solution Efficiency,
CALABARZON, 2016-2019 235
Figure 18.4 Strategic Framework to Ensure Regional Safety, Public Order and Safety
237
Table18.1 Plan Targets to Ensure Regional Safety, Public Order and Safety
238
Chapter 19 Accelerating Infrastructure Development Table 19.1 National Road Length Increased, By Province,
CALABARZON, 2018 246
Table 19.2 National Road Condition, CALABARZON, 2018 246 Figure 19.1 CALABARZON National Road Network, 2017 246 Table 19.3 Length of Existing Expressways, CALABARZON, 2016 247 Figure 19.2 Map of Existing and Proposed CALABARZON Expressways 248 Figure 19.3 Map of PNR Railway Network 249 Table 19.4 Throughput of Batangas and Lucena Ports in 2016-2018 250 Table 19.5 Household and Sitio Electrification in 2016-2018 251 Table 19.6 Number of Powered-Up Sites with Free Wi-Fi Internet Access
and Pop Established in CALABARZON, 2016-2018 251
Table 19.7 Performance of Irrigated Areas (in hectares), 2016-2018 252 Table 19.8 Ratio of Actual Irrigated Area, and Cropping Intensity,
2016-2018 253
Table 19.9 Access to Sanitation and Safe Water Supply, 2016-2018 253 Table 19.10 Projected Water Supply Demand in Cavite and Rizal Province,
2018-2021 254
Table 19.11 School Infrastructure and Facilities, CALABARZON, 2016-2019
255
Table 19.12 Status of Projects under the School Building Program, 2014-2019
256
Table 19.13 Operational Barangay Health Stations, 2016-2018 256 Table 19.14 Health Care Facilities, CALABARZON, 2017-2019 256 Table 19.15 No. of Licensed Government and Private Hospitals, Authorized
Bed Capacity, 2017-2018 256
Table 19.16 Social Welfare/Protection Facilities, CALABARZON, 2019 257 Table 19.17 Total Occupied Housing Units by Construction Materials of
the Outer Walls and Roof, CALABARZON, 2019 258
Table 19.18 Housing Units, CALABARZON, 2016-2018 258 Figure 19.4 Tenure Status of the Housing Unit and Lot,
CALABARZON, 2015 259
Table 19.19 Type of Evacuation Centers by Province, 2018 259 Table 19.20 BJMP Jail Facility Congestion Rate Distribution 260 Figure 19.5 Strategic Framework to Accelerate Infrastructure Development 261

Regional Development Plan 2017-2022 | xxiii
Table 19.21 Plan Targets to Accelerate Infrastructure Development, 2017-2022
261
Chapter 20 Ensuring Ecological Integrity, Clean and Healthy Environment
Table 20.1 Forest Cover Changes and Forestland Management in CALABARZON, 2018
276
Figure 20.1 Geographic Distribution of Protected Areas in CALABARZON 277 Table 20.2 Status of Terrestrial and Marine Area Management in
CALABARZON, 2018 277
Table 20.3 Caves with Approved Management Plan in CALABARZON, 2018
278
Table 20.4 Caves with Approved Management Plan in CALABARZON, 2018
278
Table 20.5 Free Patents Issued to Beneficiaries in CALABARZON, 2019 279 Table 20.6 Status of Land Administration and Management in
CALABARZON, 2019 279
Table 20.7 Ambient Air Quality in Three Urban Areas of CALABARZON, 2017-2018
281
Table 20.8 Water Quality of Priority River Systems in CALABARZON 281 Table 20.9 Water Quality in 10 Sampling Stations Along Manila Bay 282 Table 20.10 Water Quality Sampling Stations in Selected Recreational
Water Bodies in CALABARZON 283
Table 20.11 Average BOD Level of Laguna Lake from 2017-2019 283 Table 20.12 Total Sanitary Landfills in CALABARZON, 2019 284 Figure 20.2 Map of Environmental Quality Monitoring Stations 285 Table 20.13 10-year Solid Waste Management Plan Compliance in
CALABARZON 276 285
Table 20.14 Status of Solid Waste Management in CALABARZON 276 285 Table 20.15 Indicators, Targets, and Accomplishments for Adaptive
Capacity and Resilience in CALABARZON 286
Figure 20.3 Strategic Framework to Ensure Ecological Integrity, Clean and Healthy Environment
287
Table 20.16 Plan Targets to Ensure Ecological Integrity, Clean and Healthy Environment
288
Chapter 21 Ensuring Safe, Orderly, and Regular Migration
Table 21.1 Proportion of OFW Deployment by Region 303 Figure 21.1 Strategic Framework to Ensure Safe, Orderly and
Regular Migration 304
Table 21.2 Plan Targets to Ensure Safe, Orderly and Regular Migration 305
Chapter 22 Plan Implementation and Monitoring
Table 22.1 Regional Coordination Mechanism for Plan Implementation and Monitoring
315

xxiv Regional Development Plan 2017-2022

Chapter 1 The Long View | 1


Chapter 1 The Long View | 5
Chapter 1
The Long ViewThe CALABARZON Regional Development Plan (RDP) 2017-2022 Midterm Update is anchored on country’s long-term vision or AmBisyon Natin 2040 as well as the image that CALABARZONians desire the Region to be in 2046 as enunciated in the Regional Physical Framework Plan (RPFP), as follows:
The Updated RDP is the first set among a series of six-year plans to pursue AmBisyon Natin 2040 and the RPFP vision in 2046 (Figure 1.1). The RDP is intended to be used by stakeholders and partners as a tool to build on the Region’s promise to become the most livable industrial Region in the country where no one is poor.
As the Region’s development blueprint for the remaining three years, the updated CALABARZON RDP will continue to anchor on the national long-term perspective to aid development managers in identifying ambitious interventions that would address recurring development
issues regardless of the term limits of elected officials. While short and medium-term plans are important, continuity of initiatives is as important as addressing emerging concerns that are brought about by recent trends and phenomena. Thus, each medium-term plan is expected to build on the successes of the previous plan and assess the first three years of implementation, while addressing the remaining gaps. For the remainder of plan implementation, it will continue to focus for the Region to contribute toward laying down the foundations for inclusive growth, a high-trust society, and a globally competitive knowledge economy.
“The country is a prosperous middle-class society where no one is poor. People live long and healthy lives and are smart and innovative. The Philippines is a high-trust society where families thrive in vibrant, culturally diverse, and resilient communities.” – AmBisyon Natin 2040
“CALABARZON: A Region of vibrant economic diversity and vitality with progressive, well-planned town clusters inhabited by God-loving people enjoying globally competitive, balanced and resilient ecosystems.” – RPFP, 2017-2046
Figure 1.1 The RDP within the Context of the Long-Term Development Plan

6 | Regional Development Plan 2017-2022
The updated RDP shall contribute towards realizing the national vision by pursuing initiatives along the four identified areas for strategic action for the next 25 years, as follows:
1. Towards building a prosperous, predominantly middle-class society where no one is poor, nine priority sectors were identified with the greatest potential to contribute to realizing AmBisyon Natin 2040: • Housing and urban development
manufacturing (transport, food processing, housing-related goods and services)
• Connectivity (bridges, airports, roads, communication, ports)
• Education services• Financial services• Health services• Tourism-related services• Agricultural development• Countryside development
Moreover, enterprises in sectors that produce goods and services that meet AmBisyon Natin 2040 (i.e., for which there is a domestic market) and those that are able to participate in global trade will also be given priority and enabling mechanisms:
• Enterprises that generate high-quality jobs
• Enterprises that produces high-quality goods and services competitive prices
2. Towards promoting a long and healthy life:• Programs on quality and affordable
universal health care and social protection
• Quality maternal health and child care • Reproductive health and family
planning programs• Malnutrition programs and facilities
to encourage development of healthy lifestyles
• Natural resources and environment management
3. Towards becoming smarter and more innovative:• Skills to rapidly changing technology
and work requirements • K to 12 Program to continue providing
foundation for a smarter society • Innovative products and ideas pursued
with strong intellectual property rights framework
• Massive R&D (research and development) programs implemented
4. Towards building a high-trust society:• People-centered, effective, and
accountable governance• Public goods and services at all levels of
government are efficiently delivered• Political and electoral reforms to
promote competition and inclusiveness in the political system in place
• Peace agenda for armed conflict-threatened areas pursued
• Social and cultural awareness, and development of deep appreciation of the Filipino nation promoted
For the Region to continue its contribution effectively to the achievement of the national vision, the updating of the RDP used broad-based participatory approaches with the issuance of MC No. 01 series 2019 “Directing the Updating of the Philippine Development Plan and the Public Investment Program or the Period 2017-2022”. The RDC Committees were convened as planning committees (PCs) to conduct sectoral assessment of the previous plan period and finalize the Regional and sectoral development frameworks. The PCs are multi-sectoral in composition, with representatives from the government such as line agencies, government-owned and controlled corporations (GOCCs), state universities and colleges (SUCs), and localgovernment units (LGUs), private or business institutions, and civil society organizations (CSOs).
Chapter 1 The Long View | 7
Government, private, and civil society organizations that are not members of the RDC committees were invited to provide inputs which provided new and broader perspectives that are necessary in the refinement of the sectoral development frameworks.
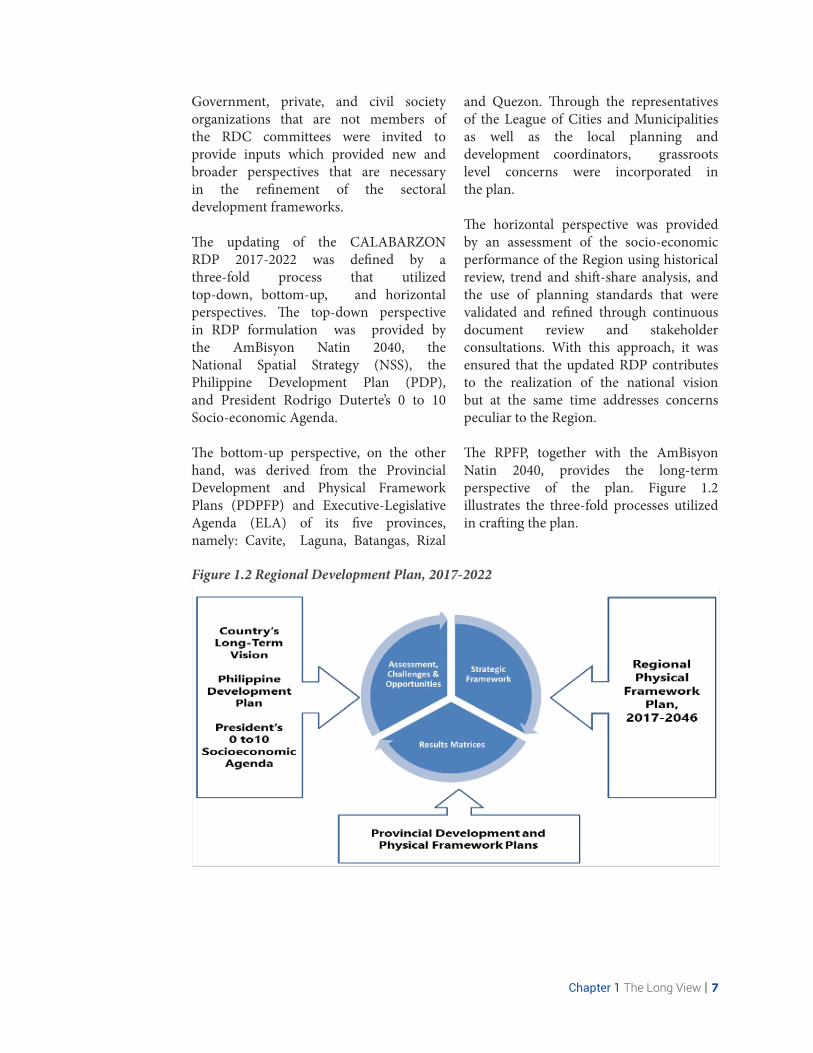
The updating of the CALABARZON RDP 2017-2022 was defined by a three-fold process that utilized top-down, bottom-up, and horizontal perspectives. The top-down perspective in RDP formulation was provided by the AmBisyon Natin 2040, the National Spatial Strategy (NSS), the Philippine Development Plan (PDP), and President Rodrigo Duterte’s 0 to 10 Socio-economic Agenda.
The bottom-up perspective, on the other hand, was derived from the Provincial Development and Physical Framework Plans (PDPFP) and Executive-Legislative Agenda (ELA) of its five provinces, namely: Cavite, Laguna, Batangas, Rizal
and Quezon. Through the representatives of the League of Cities and Municipalities as well as the local planning and development coordinators, grassroots level concerns were incorporated in the plan.
The horizontal perspective was provided by an assessment of the socio-economic performance of the Region using historical review, trend and shift-share analysis, and the use of planning standards that were validated and refined through continuous document review and stakeholder consultations. With this approach, it was ensured that the updated RDP contributes to the realization of the national vision but at the same time addresses concerns peculiar to the Region.
The RPFP, together with the AmBisyon Natin 2040, provides the long-term perspective of the plan. Figure 1.2 illustrates the three-fold processes utilized in crafting the plan.
Figure 1.2 Regional Development Plan, 2017-2022

8 | Regional Development Plan 2017-2022
The updated RDP has adopted the same format of the updated PDP, i.e. seven parts and 22 chapters, including a new chapter on international migration, to facilitate review of plan consistency. Part I consists of the introduction which discusses the long-term vision, the socio-economic and demographic trends, prospects and challenges, spatial strategy, and the development framework. Parts II to VI cover the existing situation, challenges, opportunities, strategic development framework, and the results matrices related to various sectors.
Part II includes the strategies on Enhancing the Social Fabric (“Malasakit”), such as: ensuring people-centered, clean and efficient governance; pursuing swift and fair administration of justice; and promoting Philippine culture and values.
Part III includes the Inequality-Reducing Transformation (“Pagbabago”) strategies, such as: expanding economic opportunities in agriculture, forestry fisheries, industry and services; accelerating human capital development; reducing vulnerability of individuals and families; and building safe and secure communities.
Part IV tackles Increasing Growth Potential (“Patuloy na Pag-unlad”), which includes reaching the demographic dividend, and vigorously advancing science, technology and innovation.
Part V deals with Enabling and Supportive Economic Environment, which discusses the Region’s contributions towards achieving a sound macroeconomic stability and promoting competition.
Part VI presents the Foundations for Sustainable Development, which tackles the Region’s strategies for just and lasting peace; ensuring security, public order and safety; accelerating infrastructure development; and ensuring ecological integrity, migration and development, and clean and healthy environment.
A new chapter on migration and development was added to the Plan in recognition of the economic impacts of Overseas Filipinos remittances and the social costs to their families left behind. Capitalizing on remittances and addressing the social issues on migration are discussed in the chapter.
Part VII discusses plan implementation, coordination, monitoring and evaluation.

Chapter 2 Global and Regional Trends and Prospects | 9

10 | Regional Development Plan 2017-2022

Chapter 2 Global and Regional Trends and Prospects | 11
Chapter 2
Global and Regional Trends and ProspectsCALABARZON continues to be at the forefront as an investment destination because of its huge population size, presence of manufacturing companies, abundance of agricultural produce and raw materials, proximity to NCR, and strategic location.
In 2019, four out of the five provinces in the Region were recognized as the top most competitive provinces in the country through the Cities and Municipalities Competitiveness Index (CMCI). This, coupled with the prioritization of national road projects, the rehabilitation of PNR and the development of ports in Batangas, and the opening of future special economic zones in Mauban, Infanta, Real, Atimonan, Tiaong, and Pagbilao, Quezon would further boost economic growth.
To maximize this potential, it is important to consider upcoming trends and prospects in key various areas such as economics, politics, social, technology and environment.
Political The targets during the first three years of the plan implementation were generally met due to the alignment of local development plans and investment programs with the RDP. However, the delayed passage of the 2019 budget affected economic performance as all new projects were put on hold. On the other hand, the increase in the local government units’ internal revenue allotment in 2022 will provide higher budget for the devolved basic services such as health, agriculture, education, and disaster management. Thus, there is a need to ensure the readiness and the capacity of the LGUs to deliver quality
basic services given the higher budget (See Chapter 5).
While insurgency and challenges on peace and security continue to persist in the Region, military operations have been intensified and the development of a comprehensive peace and development program is being pursued. The Region formulated the Regional Task Force to End Local Communist Armed Conflict which spearheaded the formulation of an action plan to end insurgency and encourage more surrenderees. The action plan includes addressing poverty, land disputes, lack of services and infrastructures, and re-integration of the surrenderees into the community (See Chapter 17).
The proposed shift to federal government system will likely open more opportunities for economic growth in the Region. However, the shift will entail financial costs from the government to fully capacitate and ensure readiness of the Regional and local units to take on national bureaucratic functions. Thus, a systemic approach in shifting to federalism is important to ensure the smooth transition of government functions and to avoid disruption of economic growth.
EconomicIn the past three years, economic activities in the Region continued to expand due to the growth of its industry and services sector, particularly the proliferation of micro, small, and medium enterprises (MSMEs), positive performances from the manufacturing and real estate and renting subsectors, and expansion of construction

12 | Regional Development Plan 2017-2022
activities (See Chapter 15). Further, the presence of economic zones significantly contributed to the economic growth in the Region as it continued to bring local and foreign investments as well as generate employment (See Chapter 9).
To sustain this, the Region will need to generate more investments by promoting business expansions, producing higher quality products and providing services that can compete in the domestic and international markets. The CALABARZON RDC, through its Investment Promotion Group, spearheads the conduct of investment promotion activities to attract investments in the priority areas in the Region. The implementation of TRAIN 2 would also lower corporate income tax and rationalize tax incentives which will make way for new investments.
The Region is also abundant with famous heritage sites, and beautiful land and seascapes which can be developed for eco-tourism. The five provinces provide diverse and unique tourism experience with their beautiful sceneries, arts and crafts, and rich culture. Agri-eco tourism farms are also fast becoming tourist attractions for those into healthy lifestyles.
To support this, there is a need to provide better interRegional connectivity and infrastructures. While the Region already has wider and better roads and ports, there is still need to modernize existing infrastructures to accommodate the influx of tourists, and provide comfortable and better transport services. The Batangas Port which currently serves as an alternative to Manila Port can still be developed to provide transshipment services for international cargoes while the port in Mauban, Quezon can provide support to the cargo load of Batangas. The Build, Build, Build Program of the current administration will not only boost the Region’s construction sub-sector but will also provide for better connectivity as some of its big ticket projects are situated
in CALABARZON.
Social and Demographic The provision of quality services on health and nutrition, education, and employment has been consistent in the Region for the past three years. The implementation of national policies and programs such as Universal Access to Quality Tertiary Education, Universal Health Care Act, Responsible Parenthood and Reproductive Health, First 1000 Days, and Zero Unmet Needs for Family Planning paved the way to the continuous improvement of the social sector in CALABARZON.
Despite the significantly lower prevalence of stunting, wasting, and underweight among children under 5 years of age, the Region will still push for decreasing the prevalence of stunting and malnutrition. The implementation of the First 1000 Days will ensure provision of adequate nutrition to pregnant women and their children. In addition, the full implementation of the Responsible Parenthood and Reproductive Health (RPRH) Act will address issues on adolescent pregnancy, unmet needs for family planning, and maternal care. On the other hand, increasing cases of overweight and obesity, particularly among the working age population, was observed in the Region and thus, the promotion of healthy lifestyle and campaigns on proper diet and exercise will be intensified. The CALABARZON RDC encourages its member agencies, state university and colleges, and LGUs to include specific programs on nutrition in their respective GAD Plan and Budget.
Increasing cases of HIV/AIDS, particularly among men, were also observed in the Region. The enactment of RA 11166 or the Philippine HIV and AIDS Policy Act of 2018 and the creation of its IRR will ensure access to HIV/AIDS-related services and the elimination of social stigma and discrimination surrounding the disease. Likewise, the act seeks to

Chapter 2 Global and Regional Trends and Prospects | 13
eradicate conditions that can aggravate the spread of infections such as poverty and marginalization, and gender inequality. Given the anticipated higher budget of the LGUs, more programs and projects addressing poverty and gender inequality are expected to also support the campaign on reducing prevalence of HIV/AIDS.
Through the Universal Access to Quality Tertiary Education Act, more youth were given access to higher education. However, issues on soft skills, learning facilities, teacher competencies, and academe-industry linkages continue to persist. To address these challenges, implementation of government programs will be strengthened, and creation of more partnerships with the private sector and other non-government organizations will be pursued. With the Philippine Qualifications Framework, the standards for educational qualifications are expected to be more competitive. In response to the persisting jobs-skills mismatch, CALABARZON RDC created the Special Committee on Strengthening Academe-Industry Linkages to facilitate creation and strengthening of academe and industry partnerships in the Region.
CALABARZON continues to be a top destination of domestic migrants and top sending Region of Overseas Filipinos (OFs). To be able to absorb the supply of labor force and maintain the level of unemployment within target, there is a need to create more jobs and increase competitiveness of graduates. Being the top sending Region of OFs, CALABARZON should focus on ensuring that the rights and well-being of OFs and their families are protected. There is a need to intensify social protection programs and government support catering to the specific needs and protection of rights of OFs and their families. Programs and projects on migration and development will also be localized by mainstreaming it into the local development plans.
TechnologyThe Fourth Industrial Revolution (FIRe) is a technology driven change. Technology will affect all sectors of society, government and the economy. Manufacturing and agriculture can be run by robots, artificial intelligence can take over some jobs in the services sector while advanced technologies can replace a multitude of business processes. As such, FIRe will likely result to new jobs, configuring of old jobs which requires new set of competencies, and elimination of old jobs due to adoption of cheaper, more precise, and reliable labor-saving technology. To benefit from FIRe, the Region needs to ensure that graduates have solid foundational competencies to make them highly trainable and adaptable to address the changing skills required for employment.
EnvironmentUntil the end of the Plan period, focus is on maintaining the integrity of biodiversity, improving the air and water quality, and increasing resilience of ecosystems (See Chapter 20).
The adoption and implementation of the Philippine Water Supply and Sanitation Master Plan will ensure the provision of quality water supply in the Region. The Plan will also address the potential issues on solid waste management as areas for sanitary landfills and technologies on sanitation will be included.
In 2019, the rehabilitation of Manila Bay which involved areas in Cavite greatly contributed to the improvement in solid waste management in the area. To sustain this effort, the Region will intensify the ridge-to-reef approach, strengthen the enforcement of environmental laws and ensure conformity to the environmental standards.

14 | Regional Development Plan 2017-2022
There is a need to roll out disaster preparedness activities through finalization of contingency plans, particularly to natural hazards such as earthquake, typhoons, land-slides and flooding. The Region will also need solid disaster mitigation plan, including assessment and audit of critical government buildings and facilities, and business continuity plans for both government and private sector. At the local level, there is a need to fast track completion of all comprehensive land use plans and ensure that strategies on disaster risk reduction and climate change adaption are included.
The preparation of the CALABARZON Flood Control Master Plan was endorsed by the RDC to the Department of Public Works and Highways to address issues on flooding in the Region. The plan will be localized through a series of river basin/watershed workshops in coordination with the League of Local Planners.
Chapter 3 Overlay of Economic Growth, Demogrpahic Trends, and Physical Characteristics | 15

16 | Regional Development Plan 2017-2022

Chapter 3 Overlay of Economic Growth, Demogrpahic Trends, and Physical Characteristics | 17
Chapter 3
Overlay of Economic Growth, Demographic Trends, and Physical CharacteristicsPolitical SubdivisionsCALABARZON is composed of 5 provinces, namely: Batangas, Cavite, Laguna, Quezon and Rizal; 28 congressional districts; 20 cities; 122 municipalities; and
4,011 barangays. The increasing number of cities reflects the rapid urbanization taking place in many parts of the Region. The politico-administrative subdivision of CALABARZON per province is presented in Table 3.1.
Population and urbanization trends, transportation and settlementsThe population of CALABARZON in 2015 reached 14.4 million, which is higher than the NCR population by 1.53 million. With an annual growth rate of 2.58 percent between 2010 and 2015, the Region’s population is expected to double in 2042, a rate that is much faster than that of the Philippines and NCR. The Region’s population density of 888 persons per square kilometer is much lower than NCR’s 20,247 persons per square kilometer, indicating its room for expansion.
Urban-rural growth development shows that the Region has increasing urban
population compared to rural population. From 2000 to 2015, the Region posted increasing urban population with the Province of Rizal having the highest number of urban population among the provinces (Table 3.2).
Population growth in the Region is attributed mainly to in-migration, population momentum, relatively higher birth rate, and increasing life expectancies. The direction of rapid population movement was most evident towards the highly urbanizing and industrializing areas of the region, particularly Cavite, Laguna and Rizal. CALABARZON serves as a catch basin for Metro Manila’s population and industry. This is reflected in the population density of Cavite at 2,857 per square kilometer, Rizal at 2,204 per square kilometer, and Laguna at 1,725 per square
Table 3.1 CALABARZON Political Subdivision, 2015 and 2019
PROVINCECONGRESSIONAL
DISTRICTS CITIES MUNICIPALITIES BARANGAYS
2015 2019 2015 2019 2015 2019 2015 2019
Batangas 6 6 3 4 31 30 1,078 1,078
Cavite 7 8 7 7 16 16 829 829
Laguna 4 6 6 6 24 24 674 674
Quezon 4 4 2 2 39 39 1,242 1,242
Rizal 4 4 1 1 13 13 188 188
Total 25 28 19 20 123 122 4,011 4,011
Source: DILG IV-A, House of Representatives

18 | Regional Development Plan 2017-2022
kilometer. A geospatial analysis shows that the population of CALABARZON is centered somewhere in Laguna and is moving towards Manila.
Urbanization in CALABARZON became more evident with improvements in its infrastructure, roads, transportation and telecommunication facilities, making the region the industrialization showcase of the Philippines. As a result, industrial and technoparks, commercial complexes and residential developments began to emerge with increased intensity in the Region. To date, the provinces of Rizal, Cavite and Laguna have higher percentage of population in urban areas compared to the regional average. Thus, CALABARZON remains to be an attractive prospect for development projects such as residential subdivisions, sports and leisure centers, and industrial complexes.
Transportation and SettlementsThe growth and distribution of settlements in CALABARZON were influenced primarily by the evolution of the Region’s transportation system. In terms of land transport, the national road in CALABARZON increased by 25.2 kilometers from 2016 to 2018 with a total national road length of 2,542.32 kilometers. Further, the length of permanent bridges
increased from 18,547 linear meters in 2016 to 18,575.17 linear meters in 2018, while the number of permanent bridges in CALABARZON decreased to 651 in 2018 from 654 in 2017 due to the undergoing rehabilitation.
Aside from the existing expressways in the Region, there are two ongoing expressway projects in the Region, namely the SLEX Toll Road 4 (TR4) and the Cavite-Laguna Expressway (CALAEX). The SLEX TR4 is a four-lane 66.74 kilometers toll road from Sto. Tomas City, Batangas to Mayao, Lucena City while CALAEX is a 4-lane 45.29 kilometers closed-system toll expressway connecting CAVITEX and SLEX. Both projects are expected to be completed by 2022.
In terms of railways, DOTr is currently implementing the North–South Commuter Railway Project which is a 147 kilometer elevated railway that will run from New Clark City in Capas, Tarlac to Calamba, Laguna, with a total of 36 stations. As of November 2019, the PNR segment from Calamba to Los Baños is already operational.
Despite improvements in land transportation, the Region is still faced by traffic congestions along major roads, road obstructions, deteriorating road conditions, road flooding, insufficient lightings and signages, and limited access to tourist
Table 3.2. Percentage Distribution of Urban-Rural Population, CALABARZON, 2000 to 2015
PROVINCE2000 2010 2015
URBAN RURAL URBAN RURAL URBAN RURAL
Cavite 86.81 13.19 63.1 36.9 72.0 28
Laguna 83.49 16.51 71.9 28.1 75.7 24.3
Batangas 44.35 55.65 32.7 67.3 41.8 58.2
Rizal 95.79 4.21 92.7 7.3 96.3 3.7
Quezon 21.96 78.04 20.2 79.8 29.4 70.6
Lucena City - - 90.8 9.2 92.5 7.5
CALABARZON 67.39 32.61 59.7 40.3 66.4 33.6Sources: 2010 Census of Population, 2000 Census of Population, 1990 Urban Rural Population

Chapter 3 Overlay of Economic Growth, Demogrpahic Trends, and Physical Characteristics | 19
Figure 3.1 CALABARZON Network of Settlements, 2015
destinations, agricultural production areas, and geographically-isolated and disadvantaged areas.
On water transport, the existing ports in Batangas and Quezon Provinces are important transport facilities that connect CALABARZON to island Regions of MIMAROPA and Western Visayas. These port facilities are vital mode of transport for tourism, manufacturing and agriculture-based industries.
Network settlementsFigure 3.1 shows a map of qualitative indication of the kind of centers and, therefore, the role of a settlement based on population size. In general, larger populations yield wider scale of activities, and more varied and complex activities because of greater opportunities for division of labor and specialization.
The map shows that there are only a few settlements in the Region classified in the upper tier or Regions with big population
sizes that perform complex and major roles.
Using the typologies of settlements set by the National Spatial Strategy (NSS), the current settlements patterns of the Region are as follows:
International (or potential international) centers which possess a strong potential to have direct international linkages and comprise of around 1.2 million and larger population. The contiguous areas of San Pedro-Calamba, Bacoor-Dasmarinas, Cainta-Antipolo can be identified as International Centers.
Regional centers have population ranging from 120,000-1.2 million and have markets that serve well beyond their local boundaries. The five regional centers in CALABARZON, namely: Antipolo City, Batangas City, Calamba City, Dasmariñas City and Lucena City serve as regional markets and service centers to several provinces. The five settlements were selected to be part of the network of regional centers in the country primarily

20 | Regional Development Plan 2017-2022
because of their existing or potential market-service center size and/or strategic location. The regional centers are intended to improve internal economic integration as well as establish multiple linkages that provide redundancy and reduce vulnerability.
Metro Dasmariñas, Metro Antipolo, Metro Calamba and Metro Batangas form part of the regional corridor consisting of Mega Manila that serves as the economic heartland of the country, accounting for more than 50 percent of the country’s GDP. On the other hand, Metro Batangas, Metro
Table Table 3.3 5-Level Network of Settlements, 2015CATEGORIES POPULATION CENTERS
Metropolitan Centers
≥1.2 million population National Capital Region Cities
Regional Centers ≥120,000-1.2 million population Antipolo CityCalamba City
Dasmariñas CityBatangas CityLucena City
Sub-Regional Centers
Minimum 120,000 Population Cavite (8)City of BacoorCity of General Trias City of ImusGeneral Mariano AlvarezTanzaTrece Martires CitySilang
Laguna (5)Cabuyao CityCity of BiñanCity of San PedroCity of Santa RosaSan Pablo City
Batangas (4)City of TanauanLipa CityNasugbuSanto Tomas
Quezon (1)Sariaya
Rizal (5)BinangonanCaintaRodriguezSan MateoTaytay
Provincial Centers
50,000-120,000 population Cavite (8)Alfonso Cavite CityCarmona IndangKawitNaicRosario Tagaytay City
Laguna (5)Bay CalauanLos BañosPila Santa Cruz (Capital)
Rizal (6)AngonoBarasMorongTeresa PilillaTanay
Quezon (15)AtimonanCalauag CandelariaCatanauanCity of TayabasGumacaInfantaLopez LucbanMaubanMulanayPagbilaoSan Francisco TagkawayanTiaong
Batangas (14)BalayanBauanCalacaCalataganIbaanLemeryLianMalvarNagcarlanRosario San Jose San Juan San PascualTaal
Local Centers
50,000 and below Cavite (7)AmadeoGeneral Emilio Aguinaldo MagallanesMaragondonMendez-NuñezNoveletaTernate
Rizal (2)Cardona Jala-Jala
Laguna (18)AlaminosCavintiFamyKalayaanLiliwLuisianaLumbanMabitacMagdalena MajayjayPaetePagsanjanPakilPangilRizal Santa Maria SiniloanVictoria
Batangas (16)AgoncilloAlitagtagBaleteCuenca Laurel Lobo Mabini MataasnakahoyPadre Garcia San Luis San Nicolas Santa TeresitaTaysanTalisayTingloyTuy
Quezon (23)AgdanganAlabatBuenavistaBurdeosDolores General Luna General NakarGuinayanganJomalig Macalelon Padre Burgos PanukulanPatnanunganPerezPitogoPlaridelPolilloQuezon Real SampalocSan Antonio San Andres San Narciso

Chapter 3 Overlay of Economic Growth, Demogrpahic Trends, and Physical Characteristics | 21
Lucena and Metro Calapan (MIMAROPA) form one cluster to have a large collective impact on South Luzon and provide a stronger link to the Bondoc Peninsula and the lagging provinces (especially the tourism destinations) of Bicol and MIMAROPA.
Subregional Centers are relatively large settlements that form the market catchments of Regional centers. They also connect to and serve as service centers of smaller provincial and local centers. The areas have a minimum population size of 120,000. As subRegional centers grow, they tend to merge with adjacent Regional centers to form even larger metropolitan areas. A total of 22 settlements in the Region are included in this category.
Provincial centers have population from 50,000-120,000 and have extended city-municipal service coverage but do not go beyond their host province. These centers can support some national chains such as McDonalds, DHL distribution centers, as well as small Regional or provincial airports, hospitals and non-deluxe hotels. There are 48 settlements in this category.
Local centers have population below 50,000 and the most obvious indicator is the presence of some form of food retail—from the local carinderia to a fastfood restaurant—and a local health clinic or similar facility. Less than half (47 percent) of the Region’s settlements are in this fifth tier, comprised of local or rural centers.
Overall Spatial Strategy
Centers, corridors and wedges (CCW) approach
A sound spatial strategy is imperative to achieve the Region’s vision, goals, and development outcomes. In 2011, the CCW approach was adopted as the Region’s spatial strategy (RSS) where various settlements in the Region were grouped according to the said categories. The criteria for identifying and determining the clusters
include contiguity, complementation of roles, growth potentials, and similarities of issues and concerns. The CCW seeks to direct and stimulate development and growth from west to east, as well as strengthen north-south development and access corridors. This approach links urban and rural populations better through greater interplay of economic activities that, in effect, can generate additional income and employment opportunities.
Through the CCW approach, centers or clusters which are presently heavily populated shall be further developed to enhance their roles as administrative centers and hubs of economic activities for industries, commerce, finance and services. The corridor areas1, on the other hand, shall be developed along the existing major transport routes in the Region while the wedges shall be grouped to form smaller, functional clusters to facilitate planning and implementation of programs and projects, with a focus on agri-modernization and settlements development2.
Regional agglomeration, connectivity and vulnerability reduction
The CCW is enhanced to be consistent with the NSS and the Luzon Spatial Development Framework (LSDF).
As espoused by the NSS and the LSDF, the following are considered in updating 1 The strategy of urban corridors, and agriculture and tourism destinations aim for a more balanced interrelationship between the urban and rural, the countryside and hinterlands, tourism, agriculture, and the development of the environment.2 The criteria for identifying and determining the sub-clusters include contiguity, complementation of roles, growth potentials and similarities of issues and concerns. Agri-modernization will be pursued in these clusters as this is the food base of the Region. The wedge clusters are also less dense and may accommodate housing projects especially the areas that are not fit for agriculture production and are nearer the metropolis. Some areas of the REINA, particularly the municipality of General Nakar, are potential housing sites especially with the forthcoming completion of the Marikina- Infanta Road

22 | Regional Development Plan 2017-2022
the RSS: (1) understand the population size, activities and spatial distribution of population; (2) identify and understand trends in terms of the size, activities and spatial distribution of population including growth scenarios and related issues; and (3) identify and discuss specific spatial strategies.
As a whole, the RSS adopted the three inter-related strategies namely: Regional Agglomeration which aims to decongest Metro Manila by promoting scale and agglomeration economies in regional and sub-regional centers and to manage the growth of large and more environmentally constrained metropolitan centers; Connectivity which aims to improve the linkages among settlements and key production areas by connecting rural areas to growth centers or strengthening urban-rural linkages; and integration of Vulnerability Reduction with regional agglomeration and connectivity objectives to develop disaster and climate resilient infrastructure and facilities to reduce vulnerabilities to the impacts of disaster and climate change.
Strategic development clustersConsistent with the Regional Physical Framework Plan 2017-2046, settlements are grouped into strategic development clusters and special development areas. The criteria for identifying and determining the clusters are: contiguity, commonalities in terms of physical configuration, functional roles, and socio-economic potentials and constraints. The development clusters are identified to guide the desired direction for growth given their functional roles to the region’s and country’s economy.
Strategic Development Cluster 1: Cavite and Laguna Industrial and Commercial Cluster
This cluster includes major cities and fast urbanizing municipalities in Northern and Central Cavite and Western Laguna which will serve as the center for industrial and commercial development in the region and will provide the highest level of urban services and amenities to its residents.
Strategic Development Cluster 2: Metro Batangas Cluster
This Metro Batangas cluster covers Batangas City, Lipa City, Tanauan City as well as urbanized municipalities and emerging growth centers of Santo Tomas, Malvar, San Jose, Ibaan, San Pascual, Bauan, and Mabini. The existing heavy and large industries such as petrochemicals, ship building and ship repair, and processing located in Batangas City which will be modernized and expanded to nearby coastal municipalities of San Pascual, Bauan, and Mabini to take advantage of the Batangas Port while ensuring strict protection of marine and coastal resources such as the Verde Island Passage.
Strategic Development Cluster 3: Western Cavite and Batangas Agriculture and Tourism Cluster
This cluster is composed of the upland and coastal municipalities of Cavite and Batangas whose main economic activities are agriculture and services. The agricultural production in this area will supply the agricultural needs of the urban areas of Cavite and Batangas. Considering the ridge to reef approach and DRRM and CCA concerns, developments in the area will be subjected to strict environmental safeguards and monitoring as the upland, protected, and coastal areas can affect the quality of groundwater and the lake water on downstream areas in Cavite, along Metro Manila, and other towns surrounding Taal Lake.

Chapter 3 Overlay of Economic Growth, Demogrpahic Trends, and Physical Characteristics | 23
Strategic Development Cluster 4: Batangas Agri-based and Tourism Cluster
This cluster is composed of predominantly rural municipalities in the eastern side of Batangas. Economic activities in these areas are mostly on livestock, fishing, and agriculture. For higher level of services and economic opportunities, this cluster will relate to the Metro Batangas area.
Strategic Development Cluster 5: Laguna Lakeshore and Banahaw Cluster
This area is composed of municipalities in the western side of Laguna along the coast of Laguna de Bay and other upland municipalities of Rizal, Nagcarlan, Liliw, and Majayjay in Laguna and Lucban in Quezon whose main economic activities are agriculture and fishery. The area will be developed as a food basket, eco- and agri- tourism destination in CALABARZON.
Development of the lakeshore areas will be managed in such a way that it will prevent further pollution of Laguna de Bay. There will be strict enforcement of pollution control standards on effluents discharges to the lake and its tributaries. Proper zoning and adequate buffer zones will be observed and prime agricultural lands adjacent to the shore shall be maintained.
Strategic Development Cluster 6: Laguna-Quezon Agri-Industrial Cluster
This growth cluster, which starts from San Pablo City in Laguna and ends at Pagbilao in Quezon, will sustain its two main economic centers of San Pablo City and Lucena City. San Pablo City will sustain its inland trading, coconut-based processing center and institutional functions for the continuous viability of the largely homogenous inland coconut and upland farming communities surrounding it, while Lucena City shall enhance its trading, commercial, educational, institutional
functions to foster the development of Bondoc Peninsula in Quezon Province, the two provinces of Marinduque and Romblon in MIMAROPA region, and even some municipalities in Northern Bicol.
Protected areas such as Mount Banahaw and Mount San Cristobal and the Iyam-Dumacaa Rivers will be conserved such that any allowable economic activities will not negatively affect environmental quality.
Strategic Development Cluster 7: Infanta-Mauban-Famy Growth Triangle
The Infanta-Mauban-Famy growth triangle is an emerging growth center presenting viable economic opportunities in the eastern portion of CALABARZON. Siniloan in Laguna and Infanta in Quezon will continue to perform their role as centers of economic activity.
Only light to medium industries with appropriate environmental safeguards are encouraged in the cluster as tourism activities featuring the natural environment – beaches, forest, and waterfalls, will be further developed in the areas of Real, Infanta and Mauban.
Strategic Development Cluster 8: Central Quezon Processing Center
This cluster is composed of the municipalities of Atimonan, Plaridel, Gumaca, Padre Burgos, Agdangan, Unisan, Pitogo and the island municipalities of Perez, Alabat, and Quezon. Following the CCW approach, this cluster as a wedge area will be developed for agri-tourism and ecotourism and prime agricultural area will be maintained as part of the food base of the region. Protected and forest areas such as the Quezon National Park will also be conserved and sustainably developed for forest products to be planted, harvested, processed, i.e. Quezon Province’s Herb Pavilion in Atimonan.

24 | Regional Development Plan 2017-2022
Strategic Development Cluster 9: Southern Quezon Institutional Cluster
This cluster is composed of the remaining municipalities in the Bondoc Peninsula. The cluster’s role on food production will be supported through the construction of strategic farm to market roads, provision of modern farming equipment, introduction of best farm practices and inputs. Government services will be made accessible to these remote areas by setting up satellite or field offices to improve human capital development.
Strategic Development Cluster 10: Polillo Island Cluster
This cluster is composed of the municipalities of Panukulan, Burdeos, Polillo, Patnanungan and Jomalig. Critical to the development of this cluster is the construction and improvement of infrastructure, in particular roads and ports and ensuring adequate power and water supply and reliable communication facilities. Services on health and education will also be improved and made accessible for the local communities and as support to economic activities such as tourism. The improvement of ports in Real and Infanta and other water transport facilities connecting to POGI will also be crucial to the development of the islands as this will improve trade and tourism.
Strategic Development Cluster 11: Metro Rizal Industrial and Commercial Cluster
The Metro Rizal Industrial and Commercial Cluster is composed of six highly urbanized municipalities of Cainta, Taytay, Angono, Binangonan, San Mateo, and Rodriguez, and Antipolo City which all belong to Rizal Province. Given their proximity to Metro Manila and, measures will be undertaken to stop encroachment of protected areas. Adequate protection and conservation measures will be put in place
by both national and local government in protected areas as well as in Ancestral Domain areas. On disaster risk reduction, mitigating and adaptive measures will be implemented in Tanay, Rodriguez and San Mateo which are highly susceptible to rain induced landslide and in Taytay, Angono and Binangonan which have low-lying areas which are susceptible to flooding.
Strategic Development Cluster 12: Rizal-Quezon Protection Cluster Owing to the ecological sensitivity of the cluster and the need to preserve biodiversity, its development shall be carefully planned. Protected areas and those with high ecological value in General Nakar, Tanay and Rodriguez will be conserved. Policies, programs and projects shall be implemented for the protection and promotion of the Indigenous Peoples, as well as for the sustainable and equitable development of their ancestral domains.
Laguna Lake Cluster
The Laguna Lake and its surrounding lands covering several municipalities and cities are of vital importance to the development of the region because of the many communities which rely on it for livelihood. Laguna Lake divides 61 LGUs composed of 43 municipalities and 18 cities with an estimated population of six million. This area suffers deteriorating water quality, pollution, illegal structures along the lakeshore, flooding and overfishing, among others.
Waterfront urban development is proposed for the areas surrounding Laguna Lake with a mixed-use approach that includes housing, commerce, trade, tourism and other urban land uses. To realize this, illegal structures along the lakeshore and in the lake, itself shall be removed, prime agriculture lands adjacent to the lakeshore shall be maintained, and reforestation

Chapter 3 Overlay of Economic Growth, Demogrpahic Trends, and Physical Characteristics | 25
of the watershed should be intensified, among others.
Ecotourism with the appropriate environmental protection measures will also be pursued. Because of the declining water quality and due to ecological reasons, the use of urban lands along the lakeshore shall be rationalized and industrial development or expansion will be discouraged. The lake can also serve as a hydro-technology production zone where certain areas will be reserved for innovative lake water treatment that will produce potable water to surrounding LGUs. On connectivity, Laguna Lake will be developed as Metropolitan Manila’s Gateway to CALABARZON.
Taal Lake Cluster
Taal Lake consists of lakeshore communities in 14 LGUs in Batangas which are Talisay, Tanauan City, Balete, Malvar, Lipa City, Mataasnakahoy, Cuenca, Alitagtag, Santa Teresita, Taal, San Nicolas, Agoncillo, Lemery and Laurel. This delineation is based on hydrological consideration, significant local economic activities anchored on the lake and with emphasis on the management of Taal Lake.
The Taal Volcano Protected Landscape will continue to serve as the agriculture, fishery and ecotourism and leisure zone to stimulate the development of a sustainable lakeside communities. Being highly susceptible to volcanic hazards, communities surrounding Taal Lake must put in place appropriate mitigation and preparedness measures such as establishment of comprehensive preparedness, warning and evacuation plan, improvement of early warning alert system, retrofitting of existing buildings and construct new building that are disaster resilient, and enforcement of legal easement along lakes and riverbanks.
Enhance connectivity and strengthening East-West connections
The strengthening of east-west connections entails capitalizing on the existing infrastructure that connects and interconnects the different areas of the region. Figure 3.2 presented the proposed Transportation Solution Map of CALABARZON which shows the existing infrastructures for land, sea and air transportation. Also, in the map is the proposed transportation infrastructures that will further improve connectivity within and outside the region. The proposed national road projects will help in providing land transportation along the pacific coast of CALABARZON as there is a lack of a road network in this area. Other than providing a transportation network these roads will help in spurring development in the municipalities along the Pacific Coast. Mass transportation such as railways was proposed to provide other modes of transportation to the public and will help in decongesting roads. The proposed railway project will also help in improving commuter experience by providing other options in mass transport. The proposed railways will also help in transporting goods in and outside the region; it is also integrated with the seaports in CALABARZON. Further proposed toll roads and expressways will be interconnected with existing toll roads and expressways for a seamless road network that will help alleviate decongested national roads. Proposed seaports and airports will be placed strategically to interconnect with road networks and will be able to service the majority of the population. Overall, the transportation solution map envisions a strengthened east-west connection within the region and a strengthened interconnectivity in and outside of CALABARZON.

26 | Regional Development Plan 2017-2022
East-West connections developed include existing expressways in the Region such as South Luzon Expressway, Manila-Cavite Expressway and Muntinlupa-Cavite Expressway. Ongoing expressway projects that will further enhance East-West connection are the SLEX Toll Road 4 and Cavite-Laguna Expressway. Railway development is also ongoing with the PNR South Long Haul Project and North–South Commuter Railway Project. Waterfront development including water transport facilities within the Laguna de Bay will also contribute to improved East-West connectivity (see Chapter 19).
The preceding discussion presents the overall or Regional spatial development strategy for CALABARZON. However,
there are crucial principles that should govern the implementation of this strategy especially in urban areas. In order to ensure the realization of the vision of the Region, the following principles and strategies3 must be adhered to:
• promotion of mixed-use and multi- use communities
• appropriate land use management • adoption and implementation of good
urban design principles• development of Laguna de Bay as
Metropolitan Manila’s Water Gateway to CALABARZON
• ten principles for livable towns and cities
3 These spatial development principles and strategies were developed in partnership with the architecture and urban/environmental planning firm Palafox Associates
Figure 3.2 Proposed CALABARZON Transport Solution

Chapter 4 The Updated Regional Development Plan 2017-2022 Framework | 27

28 | Regional Development Plan 2017-2022
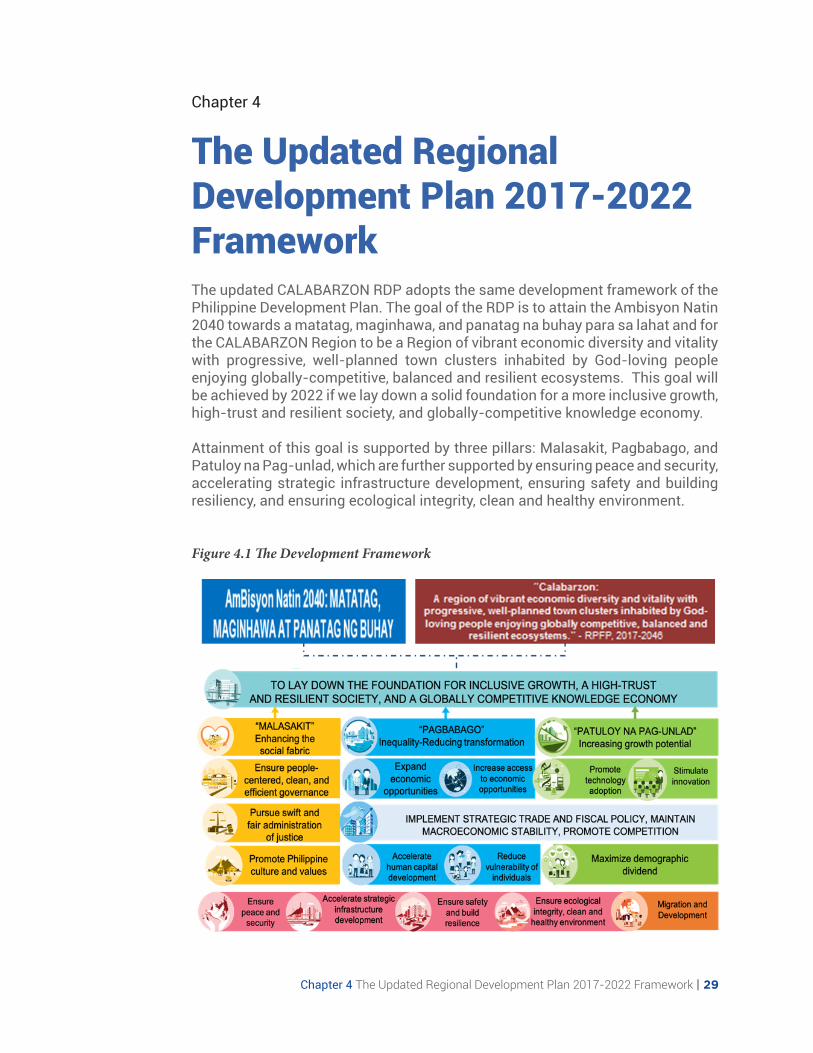
Chapter 4 The Updated Regional Development Plan 2017-2022 Framework | 29
Chapter 4
The Updated Regional Development Plan 2017-2022 FrameworkThe updated CALABARZON RDP adopts the same development framework of the Philippine Development Plan. The goal of the RDP is to attain the Ambisyon Natin 2040 towards a matatag, maginhawa, and panatag na buhay para sa lahat and for the CALABARZON Region to be a Region of vibrant economic diversity and vitality with progressive, well-planned town clusters inhabited by God-loving people enjoying globally-competitive, balanced and resilient ecosystems. This goal will be achieved by 2022 if we lay down a solid foundation for a more inclusive growth, high-trust and resilient society, and globally-competitive knowledge economy.
Attainment of this goal is supported by three pillars: Malasakit, Pagbabago, and Patuloy na Pag-unlad, which are further supported by ensuring peace and security, accelerating strategic infrastructure development, ensuring safety and building resiliency, and ensuring ecological integrity, clean and healthy environment.
Figure 4.1 The Development Framework

30 | Regional Development Plan 2017-2022
Enhancing the social fabric (Malasakit)The aim of “Malasakit” is to regain people’s trust in public institutions and cultivate trust in fellow Filipinos. Effective governance and efficient justice system are essential elements in enhancing the social fabric. Clean and effective governance will be ensured through reduced corruption, seamless service deliver and strengthened civil service, among others. Swift and fair administration of justice will be ensured through enhanced criminal and civil justice and improved sector efficiency and accountability. Culture is considered as one of the pillars to achieve inclusive growth since it caters to a wide range and cross-cutting sectors. Philippine culture and values will be promoted through high regard on diverse culture and strengthened culture-sensitive governance, among others.
Reducing inequality (Pagbabago)The aim of “Pagbabago” is to expand and increase economic opportunities particularly the sub-sectors and economic groups that used to lag behind. Economic opportunities in agriculture, fisheries and forestry (AFF) sectors that will be expanded and access to economic opportunities of small farmers and fisherfolks will be improved through increased access to value-chain, innovative financing, and land and water resources. Further, economic opportunities in the industry and services sectors will be expanded through increased local and foreign investments and improved market access, among others. Meanwhile, economic opportunities for micro small and medium enterprises, cooperatives and overseas Filipinos will be increased through improved access to production networks and financing institutions, among others.
For individuals and people groups, this is focused on improving human capital
and reducing vulnerability. Human capital development will be hastened through improved nutrition, health and lifelong learning opportunities, and increased income-earning ability. Vulnerability will be reduced and socio economic resiliency will be enhanced through safe and secure communities, affordable and secure shelter in well-planned communities, and universal and transformative social protection, among others.
Increasing potential growth (Patuloy na Pag-unlad)The aim of “Patuloy na Pag-unlad” is to sustain and/or further accelerate economic growth. This can be done by graduating to a knowledge economy. Potential growth can be further accelerated by maximizing the gains from demographic dividend and accelerating demographic transition through reduced fertility rate, and improved quality of human capital and savings build-up, among others. Technology adoption will be promoted and innovation will be encouraged. These will be realized through science, technology, and innovation in agriculture, industry, and services sectors and strengthened linkage between research institutions and technology adaptors.
Enabling and supportive economic environmentGrowth will be supported by maintaining macroeconomic stability, established strategic trade and fiscal policy, and enhanced access to financial services. The tax system will be made more efficient, equitable and globally competitive. At the same time, a national competition policy will be implemented to ensure a level playing field and competitive local government units in the delivery of its services.

Chapter 4 The Updated Regional Development Plan 2017-2022 Framework | 31
Foundations for sustainable developmentIn accordance with the overall spatial strategy, the updated RDP will continue to ensure that the physical environment is characterized by a balanced and strategic development of infrastructure while ensuring that there is ecological integrity and a clean and healthy environment. Greater emphasis will be given on the sustainability, safety and resiliency of infrastructure as well as the preservation and conservation of cultural heritage sites in the Region. All these will be underpinned by ensuring security and public order and safety. There will be earnest efforts to secure lasting peace through the resumption of peace talks and pursuing economic justice.

32 | Regional Development Plan 2017-2022

Chapter 1 The Long View | 33

34 | Regional Development Plan 2017-2022

Chapter 5 Ensuring People-Centered, Clean, and Efficient Governance | 35

36 | Regional Development Plan 2017-2022

Chapter 5 Ensuring People-Centered, Clean, and Efficient Governance | 37
Chapter 5
Ensuring People-Centered, Clean and Efficient GovernanceEnsuring citizens’ trust in government through good governance is essential in enhancing the country’s social fabric or “Malasakit”. Good governance is one of the foundations of development and helps ensure that growth is inclusive and sustainable across political administrations.
In the first years of plan implementation, different levels of government exhibited “Malasakit” towards its constituents through improved transparency and citizen engagement, and more efficient service delivery and administrative governance.
The following priority strategies will be implemented to ensure a people-centered, clean, and efficient governance in the Region by 2022: institutionalize and harmonize response and feedback mechanism; implement Ease of Doing Business Act; adopt a Whole of Government Approach in delivery of key services; increase capacities of local governments on the Seal of Good Local Governance, improve ranking in the Cities and Municipalities Competitive Index; and develop competent public servants
Assessment and Challenges Increasing transparency and citizens’ participationThe implementation of RA 9485 or the Anti-Red Tape Act of 2007 and Section 93 of the General Appropriations Act of FY 2012 on the Transparency Seal resulted to compliance of government institutions to make reports publicly available. From 2017 to 2019, all LGUs in the Region were compliant with the Full Disclosure Policy through posting in portals and in conspicuous places. This ensures that the public was well informed on government policies and performance in delivery of public goods and services.
LGUs’ compliance to Full Disclosure Policy was facilitated with the implementation of Department of the Interior and Local Government (DILG) Management System
and the Seal of Good Local Governance (SGLG), wherein Full Disclosure is one of the requirements.
As required by law, LGUs in the Region continued to maintain the representation of CSOs in their Local Development Councils. To strengthen the participation of CSOs in local councils, the DILG continued to provide them trainings.
Gathering citizen’s feedback is a mandatory activity for all government agencies to validate satisfaction level of the public on government services. The Citizen Satisfaction Index Survey is an assessment tool which measures public service delivery of local governments according to awareness, experience and perception of the citizens. It aims to measure the quality, responsiveness and inclusiveness of services

38 | Regional Development Plan 2017-2022
from the perspective of the people as clients and citizens. As of 2018, all cities and only three municipalities (Pagbilao, Pagsanjan and Magallanes) were assessed on the effectiveness of their feedback mechanisms, due to limited budget.
Achieving seamless service deliveryThe Department of Trade and Industry through the National Competitiveness Council initiated the CMCI Survey to rank the competitiveness of cities, municipalities and provinces based on their economic dynamism, government efficiency, infrastructure, and resilience.
In the 2019 CMCI Survey, five CALABARZON LGUs bagged top spots in the following categories: a) Overall Competitiveness - Provincial level was Rizal, for Component Cities was Antipolo City and for 1st and 2nd Class Municipalities was Cainta; b) Resiliency Pillar - 1st and 2nd Class Municipalities was Taytay; c) Resiliency Pillar - Component Cities was Antipolo City; d) Economic Dynamism – Component Cities was General Trias City; and e) Government Efficiency Pillar – for Component Cities was Antipolo City and for 1st and 2nd Class Municipalities was Cainta. The number of awards received by the Region doubled from 12 in 2018 to 25 out of 75 categories in 2019.
Fifty-nine percent of LGUs increased in ranking in 2019 which is more than half of the 26 percent increase in 2018. The institutionalization of the Provincial Competitiveness Councils that replicates functions of the Regional Competitiveness Council and administer filling out of the CMCI survey is one of the reasons for the increase. To sustain and improve LGUs ranking, LGUs need to enhance data collection system and monitor or check accomplished CMCI forms .
Compliance with the standards for processing permits will require streamlining the Business Permit and Licensing System (BPLS) of cities and municipalities. Streamlining involves restructuring the current business permits and licensing systems of LGUs to make them simplified and more efficient. This can be done through the use of technology. LGUs with validated streamlined BPLS decreased from 26 in 2016 to 12 in 2018 due to the limited budget of the DILG for field validation. LGUs capacitated with electronic BPLS also decreased from 13 in 2017 to nine in 2018. Non-compliance was mainly due to inaccessibility or poor internet connection. Other reasons were lack of personnel, no permit and licensing office and increase in the volume of registrants.
On the other hand, the SGLG award measures the performance of LGUs on implementing governance reforms and local development. In 2019, 33 LGUs in CALABARZON were conferred with SGLG recognition which is higher than the 24 LGUs in 2019. LGUs have already learned their shortcomings from the last year’s evaluation. The more rigid assessment requiring LGUs to pass all seven areas is in line with DILG’s objective to continuously push for excellence on local governance. LGUs also conducted crosschecking in the municipal level to make sure that documents to be reviewed by national are already completed.
The signing of RA 11292 or the SGLG Act on July 2019 will promote continuous improvement of LGUs’ performance and ensure continuous funding of the program. A Council of Good Local Governance will also be created that will periodically review performance indicators, incentive awards, and provide capacity building for LGUs that are not able to qualify to ensure proper implementation of the SGLG.

Chapter 5 Ensuring People-Centered, Clean, and Efficient Governance | 39
The SGLG Act also takes into consideration that local governments may have different local contexts such that one or more indicators may be peculiarly inapplicable or extremely different to meet given limitations or circumstances of LGUs.
Enhancing administrative governanceImplementation of Public Financial Management (PFM) improvement measures serve as basis in the release of funds under General Appropriations Act - Local Government Support Fund (i.e. Assistance to Disadvantaged Municipalities and Conditional Matching Grant to Provinces Program) and assistance to national governments. Efficiency, accountability and transparency in the use of public funds is necessary to ensure the direct, immediate, substantial and economical delivery of public services especially to the poor.
In 2018, 93 percent of LGUs in CALABARZON were compliant with the assessed PFM systems, higher than the 86 percent in 2017. Of the 147 LGUs in the Region, 137 were certified including 5 provinces, 10 cities and 122 municipalities. This is a result of continuous trainings on PFM and improved accountability of local chief executives.
Increasing capacity to handle emergencies and disasters
Effective response to disasters, particularly the likes that have never been encountered before poses a challenge to the LGUs.
In the first quarter of 2020, CALABARZON suffered two major blows: the Taal Volcano eruption and the COVID-19 pandemic. These two disasters tested the competency of LGUs in mitigating the impact of
the disasters through quick response in deploying resources and services to those affected.
During the Taal Volcano eruption, the national and local government, private sector, and civil organizations, provided early response through distribution of relief goods and provision of temporary shelters to affected residents. However, in spite of this, there were issues on the delay in the distribution of the relief goods, equitable distribution and some evacuees not receiving any assistance. This is the problem stems from having an outdated list of residents and poor coordination or lack of information on donation hubs.
There is a need to establish a reliable and updated database profiling the residents in every LGU. This can be used as the basis for the distribution of goods and financial assistance provided and enable the LGUs to provide for the needs of the individuals affected by disasters or calamities.
Further, the inconsistencies in the implementation of policies on lockdowns created confusion among the people. During the Taal Volcano eruption lockdown, the basis at the national level was the 14 kilometer radius danger zone, while the local governments used the areas identified in the hazard maps (base surge, tsunami, ballistic projectile). On the COVID 19 pandemic, the national level used the term enhance community quarantine, while local levels used lockdown which caused miscommunication among the LGUs in implementing policies such as establishing checkpoints, use of quarantine passes, and use of masks in public places.
Given these problems, there is a need to strengthen coordination and communication between the NGAs and LGUs in handling emergencies and disasters., local policies must be aligned with national policies and directives to achieve

40 | Regional Development Plan 2017-2022
the desired outcome. The implementation of aligned or consistent policies will increase citizen cooperation, reduce
confusion of the public, prevent problems on peace and order, and increase public trust to the government.
Action PlanStrategic Framework
This medium term development plan aspires to enhance the social fabric by
building a high-trust society. Specifically, it aims to engage and empower citizens fully, achieve seamless service delivery, enhance administrative governance, and strengthen the civil service.
Figure 5.1 Strategic Framework to Ensure People-Centered, Clean, and Efficient Governance
TargetsTable 5.1 Plan Targets to Ensure People-Centered, Clean, and Efficient Governance
INDICATORSBASELINE END OF PLAN TARGET
RESPONSIBLE AGENCY2019 or latest
available data 2020 2021 2022
Anti corruption initiatives improved
LGUs compliant to ARTA sustained/increased
7 (2017) Increasing Increasing 100% CSC
Seamless service delivery achieved
NGAs and GOCCs fully complying with the Citizens Charter achieved
28 (2017) Increasing Increasing 100% CSC
Charter achieved Proportion of LGUs in Competitiveness Ranking increased (SGLG)
26% Increasing Increasing Increasing DTI, DILG, RCC
LGUs with validated streamlined Business Permit Licensing System (BPLS)
12 (2018) Increasing Increasing 100% DILG, DTI, LGUs
RLAs conferred with the CSC Seal of Excellence increased
3 (2016) Increasing Increasing Increasing CSC
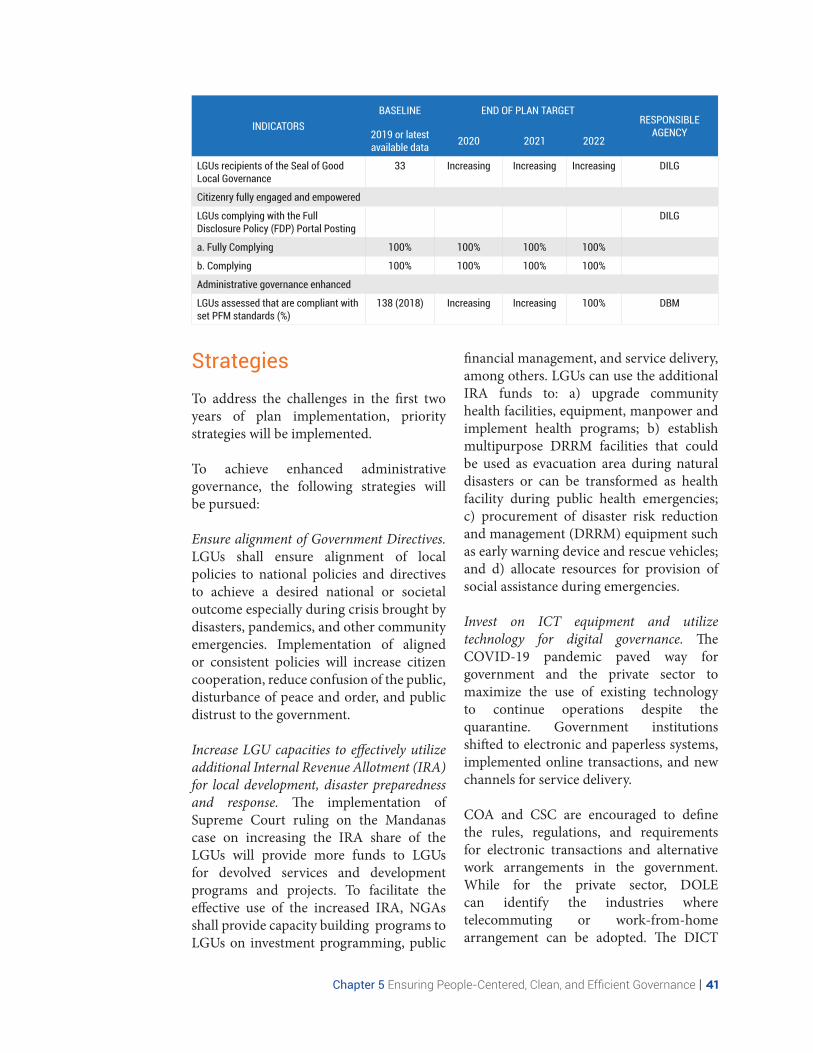
Chapter 5 Ensuring People-Centered, Clean, and Efficient Governance | 41
INDICATORSBASELINE END OF PLAN TARGET
RESPONSIBLE AGENCY2019 or latest
available data 2020 2021 2022
LGUs recipients of the Seal of Good Local Governance
33 Increasing Increasing Increasing DILG
Citizenry fully engaged and empowered
LGUs complying with the Full Disclosure Policy (FDP) Portal Posting
DILG
a. Fully Complying 100% 100% 100% 100%
b. Complying 100% 100% 100% 100%
Administrative governance enhanced
LGUs assessed that are compliant with set PFM standards (%)
138 (2018) Increasing Increasing 100% DBM
StrategiesTo address the challenges in the first two years of plan implementation, priority strategies will be implemented.
To achieve enhanced administrative governance, the following strategies will be pursued:
Ensure alignment of Government Directives. LGUs shall ensure alignment of local policies to national policies and directives to achieve a desired national or societal outcome especially during crisis brought by disasters, pandemics, and other community emergencies. Implementation of aligned or consistent policies will increase citizen cooperation, reduce confusion of the public, disturbance of peace and order, and public distrust to the government.
Increase LGU capacities to effectively utilize additional Internal Revenue Allotment (IRA) for local development, disaster preparedness and response. The implementation of Supreme Court ruling on the Mandanas case on increasing the IRA share of the LGUs will provide more funds to LGUs for devolved services and development programs and projects. To facilitate the effective use of the increased IRA, NGAs shall provide capacity building programs to LGUs on investment programming, public
financial management, and service delivery, among others. LGUs can use the additional IRA funds to: a) upgrade community health facilities, equipment, manpower and implement health programs; b) establish multipurpose DRRM facilities that could be used as evacuation area during natural disasters or can be transformed as health facility during public health emergencies; c) procurement of disaster risk reduction and management (DRRM) equipment such as early warning device and rescue vehicles; and d) allocate resources for provision of social assistance during emergencies.
Invest on ICT equipment and utilize technology for digital governance. The COVID-19 pandemic paved way for government and the private sector to maximize the use of existing technology to continue operations despite the quarantine. Government institutions shifted to electronic and paperless systems, implemented online transactions, and new channels for service delivery.
COA and CSC are encouraged to define the rules, regulations, and requirements for electronic transactions and alternative work arrangements in the government. While for the private sector, DOLE can identify the industries where telecommuting or work-from-home arrangement can be adopted. The DICT

42 | Regional Development Plan 2017-2022
is recommended to provide ICT support to government agencies and LGUs to implement programs such as Digital Government, Digital Work Force, Digital Classrooms, Digital Medicine, among others.
To achieve seamless service delivery, the following strategies will be pursued:
Implement RA 11032 or Ease of Doing Business (EODB) Act. The Act aims to solve bureaucratic red tape by facilitating prompt actions of all government transactions with efficiency. The new law now covers all government transactions compared with the previous ARTA law which caters only the frontline services. Thus, national and local governments must adopt simplified requirements and streamlined processes through automation and investment in ICT resources.
One of these automated and simplified processes is BPLS. To monitor streamlined and electronic BPLS implementation in all LGUs, there is a need to increase the budget for technical assistance and monitoring.
Adopt a Whole-of-Government approach in delivery of key services. Convergence among agencies need to be strengthened and made more efficient to ensure the delivery of basic services to all sectors of society especially the marginalized. The emphasis for Whole-of-Government on reducing poverty (Memorandum Circular No. 59, series of 2016) and peace and development (Executive Order No. 70, series of 2016) has been espoused by the President through recent policy statements.
The implementation of the Mandanas case ruling will increase the IRA for LGUs starting in fiscal year 2022. This will require stronger coordination between the national and local governments as the latter will need to fully implement all devolved services and may assume additional functions.
Increase capacities of LGUs on the SGLG and CMCI. Provision of technical assistance on the SGLG and CMCI indicators and requirements will help LGUs perform better in all aspects of governance. There is also a need to focus assistance on areas of assessment with low or poor performance.
Establish and update database in all LGUs. As part of its mandate, LGUs shall establish and regularly (at least annually) update its database on socio-economic indicators to serve as basis in plan and policy formulation, program and project identification, implementation, and monitoring. This database should include updated data on population, marginalized and vulnerable sectors of the population, and program and project beneficiaries which are crucial to ensure fast, reliable and equitable delivery of government services. The PSA and DILG shall fastrack implementation of the Philippine Identification System and Community-Based Monitoring System as a common database system of LGUs.
Enhance capacities of LGUs in DRRM. LGUs play a very important role in ensuring the safety and well-being of its citizens before, during, and after a disaster. As such, LGUs should update their LDRRM Plan to include preparedness and response measures for public health emergencies such as COVID-19. LGUs affected by the Taal eruption should also update their local disaster plan taking into consideration the experiences and lessons learned. All LGUs should fully utilize their DRRM fund to adequately prepare for disasters (e.g. stockpiling of goods, contingency planning, purchase of equipment and vehicles, community preparedness), ensure coordinated and fast disaster response, and increase resiliency of their locality. Aside from the DRRM fund, LGUs should also look into using their local development fund for medium to long-term DRRM programs and projects.
Chapter 5 Ensuring People-Centered, Clean, and Efficient Governance | 43
Given that LGUs have different levels of resources, higher level LGUs, i.e. province, can augment resources of municipalities with limited financial and technical capacity.
Establish LGU disaster response hub to respond better to large-scale disasters. As gleaned from the Taal Volcano eruption in January 2020 which affected many LGUs, establishing a centralized disaster hub will facilitate proper receipt, accounting, and equitable distribution of donations to the affected communities in the case of large-scale disasters or calamities. The province or capital city/town can serve as a hub. This disaster hub can also be the central repository of data and information on the effects of the disaster to provide basis for decision-making.
To achieve reduced corruption, the following strategies will be pursued:
Sustain Full Disclosure Policy Compliance. Establishment of ICT infrastructures for internet accessibility will enable LGUs to upload information in their respective website for transparency compliance. Posting of Citizen’s Charter and Transparency Seal should be sustained.
Engage citizens in anti-corruption drives. Citizens must be made fully aware of feedback mechanisms wherein they can report corrupt or illegal activities. The proper representation of civil society and business groups in public sector councils or programs is also essential in ensuring transparency and accountability.
To achieve fully engaged and empowered citizenry, the following strategies will be pursued:
Engage citizens in volunteerism and organizational development. Citizens shall be engaged in the implementation of government policies, programs and projects
by encouraging volunteerism and creation of local organizations/associations. Citizens need to be aware that they should be active partners of government in ensuring the success of public programs and projects.
Promote Private-Public Partnership on emergency response. During public emergencies and disasters, private sector donations and initiatives can provide essential assistance to affected individuals. A strong Private-Public partnership can also help ensure continuous supply and flow of essential goods and services during emergencies. In the recent Taal Volcano eruption, overflowing relief assistance was provided by different private individuals and organizations. During COVID-19 outbreak, the private sector helped the government to provide protective gears to frontliners, built quarantine facilities to augment hospital capacities, and provided relief goods to the community. Clear donation procedures, transparent monitoring, and logistics support by LGUs and NGAs can encourage private sector support.
Institutionalize and harmonize response and feedback mechanisms. The Community Satisfaction Index System should be established in all LGUs through the provision of adequate budget for technical assistance, institutionalization, and monitoring. The CSIS, Hotline 888, and other response and feedback systems of government also need to be harmonized to facilitate efficient use of resources and efficiency in operations.
For civil service to be strengthened, the following strategies will be pursued:
Develop and invest in smart and future-ready public servants. Competent human resource is essential in providing quality services to the public. As such, qualification standards in hiring will be upheld and capacity of government personnel will be developed

44 | Regional Development Plan 2017-2022
• Ease of Doing Business Act• Seal of Good Local Governance• Full Disclosure Policy• Cities and Municipalities Competitiveness
Index Survey• Business Permit and Licensing System• Capacity development for LGUs on IRA
utilization, service delivery, and DRRM• DRRM Multipurpose facility and
evacuation centers
• Philippine Identification System• ICT investment for Digital Government,
Digital Work Force, and the like • Establishment of Volunteer Program in
RLAs and LGUs (RA 9418) (i.e. Setting up of Volunteer Desk and Designation of Volunteer Coordination Officer, etc)
Major Programs and Projects
following a career improvement plan including trainings on emerging trends and technologies to make them future-ready.
In relation to the increase in IRA, LGU personnel also need to be fully capacitated and policies must also be in place to enable LGUs to hire or absorb more personnel to carry-out existing and possible additional devolved functions. There is also a need to study and adjust the cap for personnel services as well as make the salary between national government and LGUs more equitable.
Continue to promote shared public service values. Values such as professionalism, excellence, integrity and non- discrimination in public service will be adhered to by all civil servants by raising awareness of civil service values and norms among all government personnel, strictly implementing anti-corruption laws and provision under EODB.
Continue implementation of competency-based recruitment. Competency based recruitment of public servants ensures the public of clean, honest, efficient and professional service. This will eliminate citizens’ doubts on the credibility and competence on public institutions.
Chapter 6 Pursuing Swift and Fair Adminstration of Justice | 45

46 | Regional Development Plan 2017-2022

Chapter 6 Pursuing Swift and Fair Adminstration of Justice | 47
Chapter 6
Pursuing Swift and Fair AdministrationAn effective justice system is an essential element in enhancing the social fabric by increasing the trust of citizens in public institutions which is the core of the Malasakit pillar of the Philippine and Regional Development Plans. Well-functioning civil justice systems protect the rights of all citizens against infringement of the law by others, including by powerful parties and governments. Moreover, an effective and fair judicial system is an essential component of the rule of law (OECD, 2015).
In the first two years of plan implementation, the justice system in CALABARZON improved in terms of delivering favourable dispositions, on time release of qualified inmates, and resolution of human rights cases.
The following main strategies will be pursued to promote swift and fair administration of justice: a) institutionalize the Regional Justice Sector Coordinating Council; b) further streamline and improve processes in the justice system; c) increase access to legal aid, assistance and protection; and d) increase and proper use of resources for decongestion of jails and detention facilities.
Assessment and ChallengesFrom 2017 to 2018, significant improvements in the justice systems were evident in terms of increase in grant of favourable dispositions and qualified inmates released on time (Table 6.1). This was due to the following reforms: a) streamlining of investigation and prosecutorial processes through the launching of the Uniform Manual on Time Allowance and Service of Sentence which harmonized correction procedures; b) launching of Case Decongestion
Project to clear backlogs in preliminary investigations; c) implementing Amendment of the RA 10951, known as, “The Revised Penal Code” which adjusted the amount or value of property and damage of which a penalty is based and the fines imposed; and d) implementing Plea Bargaining Agreement which facilitated the release of qualified inmates on time specifically those under persons deprived of liberty category.
Table 6.1 Improvement in CALABARZON Justice System, 2016- 2018INDICATOR BASELINE (2016) 2017 2018
Grant of Favourable Dispositions (number of cases) n.d 47,668 63,596
Qualified inmates Released on Time (number of inmates) n.d 697 1,158
Congestion Rate (%) 949 963 622Source: CHR Region IV-A and BJMP Region IV-A

48 | Regional Development Plan 2017-2022
Improvement in the case review processes and proceedings coupled with construction of new jail facilities resulted to decongestion of jails and detention facilities. As of 2018, there were 52 existing jail facilities which
increased by 24 percent from 42 jails in 2016 (Table 6.2). Consequently, congestion rate in jail facilities also improved from 936.66 percent in 2016 to 798.69 percent in 2018.
Table 6.2 Constructed Jail Facilities, 2016 – 2018
INDICATOR BASELINE (2016) 2017 2018 2019
(September 30)
Number of Jail Facilities Constructed 11 5 6 6
Number of constructed jail facilities being used 0 0 4 4
Total number of existing jail facilities 42 44 45 46
The delivery of fair and equal justice through case assistance improved (Table 6.3) with the following policies: a) easier access on availing the Community Legal Aid Service Rule which obliged lawyers beginning with those who passed the 2017 bar examinations to render pro bono services to those who would otherwise be denied access to adequate legal services; b) implementation of the Philippine’s Gender Ombud Guidelines which
mandated the Commission on Human Rights to ensure the promotion and protection of women’s rights and to investigate all violations of human rights against women; and c) issuance of the Public Attorney’s Office (PAO) Memorandum Order No. 20 series of 2017 which reconstituted the Victims Assistance Unit at the PAO-Central Office, Regional and District Offices.
Table 6.3 Cases Assisted and Resolved, 2017-2019INDICATOR 2017 2018 2019
PAO assisted cases (%) 71.40 71.45 83.33
CHR cases resolved (number of cases) 129 146 106Source: PAO Region IV-A and CHR Region IV-A
The reoffending rate among convicted offenders decreased and parolees/offenders compliant to the terms and conditions of probation/parole increased (Table 6.4) with the implementation of the rehabilitation
program of the BJMP called the Therapeutic Community Approach Training and conduct of educational activities which made them productive and prepared to be reintegrated back to the society.
Table 6.4 Effect of Operationalizing Local Interventions for Rehabilitation, 2017 – 2018INDICATOR Baseline (2016) 2017 2018
Reoffending rate among convicted offenders (probationers and JICL) (%) n.d. 1.68 0.75
Parolees/offenders compliant to the terms and conditions of probation/parole (%)
n.d. 98.32 99.24
Source: PAO Region IV-A and CHR Region IV-A
In 2020, Enhanced Community Quarantine (ECQ) was declared in Luzon while other parts of the country were placed under community quarantine to minimize the spread of COVID-19. Republic Act No. 11469 known as the Bayanihan to Heal as One Act declared COVID-19 a national emergency.
Provided in the Bayanihan law is the imposition of penalties to those creating, perpetrating, or spreading false information on the COVID-19 which leads to chaos, panic, anarchy, fear or confusion. The media has reported several complaints on the implementation of the ECQ and the Bayanihan Act. Among the complaints were

Chapter 6 Pursuing Swift and Fair Adminstration of Justice | 49
Action Plan
Strategic FrameworkThis chapter follows the PDP Framework (Figure 6.1), aiming to administer justice swift and fairly by enhancing the civil,
criminal, commercial and administrative justice systems and improving the sector efficiency and accountability to regain people’s trust.
excessive use of power by law enforcers, violation of human rights during arrests and confrontation with law enforcers. There were also complaints on the distribution of government cash and goods subsidies to individuals in need. Most disturbing were the reported cases of COVID-19 patients and their families, medical and other essential or “frontline” workers in their communities, being discriminated. There was an increase in physical abuse of women or domestic violence during ECQ. Meanwhile, there were alarming cases on COVID-19 positive inmates and jail security personnel, which
has the potential for the wide spread of the disease in congested jail facilities.
While there was a decreased rate in overall criminality during the ECQ, the above mentioned concerns on the enforcement of laws and safety should also be addressed immediately. Moreover, most of court proceedings, case resolutions, and provision of legal aid have been suspended during the quarantine period. Investments in ICT would ensure continuous operation of the justice system in times of public (health) emergencies.
Figure 6.1 Strategic Framework to Pursue Swift and Fair Administration of Justice

50 | Regional Development Plan 2017-2022
Strategies
Civil, criminal, commercial and administrative justice systems enhanced
Institutionalize the Regional Justice Sector Coordinating Council (RJSCC).The establishment of the Regional Council will facilitate a sensible approach in administering justice by harmonizing justice procedures and systems in the Region
following the national Council. A justice hub to improve access for judicial processes should also be established. A focus group discussion among concerned agencies such as the Department of Justice (DOJ), Supreme Court and the Department of Interior and Local Government may be necessary to kick-start the institutionalization of the Regional Council.
Further streamline and improve processes in the justice system. Streamlining of criminal investigation, prosecution and case
Table 6.5 Plan Targets to Pursue Swift and Fair Administration of Justice
INDICATORSBASELINE END OF PLAN TARGET
RESPONSIBLE AGENCY2019 or latest
available data 2020 2021 2022
Civil, criminal, commercial and administrative justice systems enhanced
Percentage of preliminary investigation backlogs decreased (cumulative)
n.d decreasing decreasing decreasing DOJ
PAO cases assisted 83.33% 71.55% 71.60% 71.65% DOJ-PAO
Court (court-annexed mediation) cases resolved
n.d increasing increasing increasing DOJ-ORP
Grant of favorable dispositions (number of cases)
11,092 increasing increasing increasing DILG-BJMP
Sector efficiency and accountability improved
Number of qualified inmates (based on court orders for release) in city/municipal/district jails released on time maintained
11,823 1421 1588 1754 DILG-BJMP
Congestion rate decreased (cumulative,%)
798.69 846.70% 870. 05% 893. 40% DILG-BJMP
Percentage human rights cases resolved within the prescribed period increased (cumulative)
106 Increasing Increasing Increasing CHR
Prosecutor to court ratio improved (cumulative, %)
n.d Increasing Increasing Increasing DOJ
Public attorney to court ratio improved (cumulative, %)
n.d Increasing Increasing Increasing DOJ-PAO
Conviction rate on all criminal cases increased (cumulative, %)
n.d Increasing Increasing Increasing DOJ
Reoffending rate among convicted offenders decreased (cumulative, %)
0.75% Decreasing Decreasing Decreasing DOJ-Bucor; DOJ-PPA
Rate of parolees/offenders compliant to the terms and conditions of probation/parole
99.24% Increasing Increasing Increasing DOJ-PPA
All requests for free legal assistance/representation acted upon within three (3) working days from date of request maintained
100% 100% 100% 100% DOJ-PAO
Targets

Chapter 6 Pursuing Swift and Fair Adminstration of Justice | 51
management processes through appropriate internal controls is necessary to ensure that cases are decided based on evidence and meritorious consideration. To address the increasing drug-related cases applying for the Plea Bargaining Agreement, the DOJ- Parole and Probation Administration (DOJ-PPA) may see the need to increase their logistics in terms of supplies, office space and plantilla. The PPA and the DOJ-PAO may also need the provision of hazard pay due to their exposure in field works.
Strengthen alternative dispute resolution (ADR) systems. To help decongest the regular courts, there is a need to reinforce the Katarungang Pambarangay Law or the Barangay Justice System as an ADR mechanism. The DILG and DOJ may conduct alternative dispute resolution trainings at the barangay level, while for Philippine National Police (PNP) further improves its mediation skills.
In times of public health emergencies, the Barangay Justice System as an ADR mechanism should also be active and used to immediately address complaints on public discrimination on patients, family of patients and frontline workers, and domestic violence.
Review and strict implementation and monitoring of the Good Conduct Time Allowance (GTCA). In light of recent events, the 2019 Revised Implementing Rules and Regulations of the Republic Act No. 10592 concerning the Good Conduct Time Allowances need to be further reviewed for proper implementation and oversight by the Department of Justice. The revised law categorically excludes heinous crime offenders and will publish names of persons deprived of liberty who may be qualified for release subject to the Data Privacy Act.
Sector efficiency and accountability improved
Increase access to legal aid, assistance and protection. Many economic, structural, and institutional factors hinder access to justice, including the complexity and cost of legal processes, time, and geographical and physical constraints. Access to legal services for the marginalized will be improved through: a) hiring and deployment of paralegals in communities to provide free basic legal advice; b) setting up of community justice centers or one-stop shops for legal services; c) conduct of free legal consultations in rural areas; d) “unbundling” of legal services to reduce costs; and e) use of ICT to make judicial services available online.
Operationalize local intervention for the rehabilitation of drug surrenderers. LGUs will establish and strengthen their rehabilitation programs for drug surrenderers to prepare them for reintegration to the community. Technical assistance can be provided by the DOJ-PPA field offices to LGUs that have no intervention programs and rehabilitation centers. The Bureau of Jail Management and Penology (BJMP) will also continue and expand its Barangay-Based Therapeutic Community Approach Training which is a structured multi-sectoral approach community-based rehabilitation program.
Increase and proper use of resources for decongestion of jails and detention facilities. Although decongestion rate decreased from 963 percent in 2017 to 622 percent in 2018, this is still far from the ideal jail capacity of 1:30 inmates. Thus, more facilities should be constructed as congested jails affect the health and well-being of detainees. Other decongestion activities will continuously be implemented such as the hiring of Case Decongestion Officers and creation of Assisting Courts System and Continuous Trial System. Jail facilities also need to

52 | Regional Development Plan 2017-2022
Major Programs and Projects• Construction, rehabilitation and
renovation of jail facilities • Digital Justice System which include
digital/online case proceedings, legal consultation, centralized case reporting, jail visitation
• Unified database for the whole justice system
• Justice on Wheels• Information drive on mandates and
policies on justice system• Management of complaints of human
rights violations through the improved documentation and database
• Strengthening of small courts and alternative dispute bodies
• Community Reintegration and Livelihood assistance for former inmates and drug offenders
• Adoption of interventions on victim assistance for sexually-abused victims
• Values formation for the youth• Strengthen communication among
concerned agencies
be properly maintained and upgraded by investing ICT system to improve monitoring and managing facilities and inmates.
Moreover, proper allocation and utilization of budget for the operation of jail facilities will have a big impact on the improvement of jail facilities.
Strengthen victim legal protection and assistance. Justice will be made accessible for the marginalized sector of the society through the creation of public assistance desks. The PNP will sustain their women’s and children’s desk.
Strengthen efforts against illegal drugs inside jail facilities. To sustain efforts in anti-illegal drugs activities inside jails, BJMP Region IV-A created the Oplan RODY which seeks to remove personnel involved in illegal drugs and corruption inside jails. Other key areas of the program include the disbandment of gangs, decongestion of jail facilities, and ensuring discipline of personnel and inmates.
Enhance accountability through engaged citizenry. The conduct of various awareness campaigns and fora for citizens on the legal system, their basic rights, and crime prevention should be expanded to more audiences. Legal empowerment will give
people the ability to know and use the law to avoid abuses and push for reforms in the justice system.
Furthermore, a feedback mechanism on the justice system should be institutionalized to make it attuned to the needs of the people and improve its services.
Unify database system. A unified database system for the whole justice system with a single case identification should be established as this will improve efficiency of case documents.
Respect Rule of Law. Implement the law with fairness and equality to all the citizens. Human rights should still prevail in imposing penalties and conduct arrest; thus excessive use or abuse of power should not be tolerated and subject to transparent and swift investigation.
Invest on ICT systems in the justice sector. Establish online legal consultation and centralized case reporting to strengthen public access to legal aid, assistance and protection. Establish digital case proceedings and trial to continue court operations in times of quarantine. Establish and implement online jail visitation to minimize exposure of the persons deprived of liberty to infectious diseases.

Chapter 7 Promoting Philippine Culture and Values | 53

54 | Regional Development Plan 2017-2022

Chapter 7 Promoting Philippine Culture and Values | 55
Chapter 7
Promoting Philippine Culture and ValuesThis chapter discusses the performance of the culture sector in the first half of the plan period and identifies key challenges and strategic interventions to promote Philippine culture and values and further enhance the social fabric.
Culture is considered as one of the pillars to achieve inclusive growth since it caters to a wide range and cross-cutting sectors. In addition, the culture sector must continue to document the Indigenous Knowledge System and Practices (IKSP) to serve as a repository of knowledge on cultural and traditional practices and information, identify culture bearers to ensure that practices are carried over generations, and implement the Philippine Cultural Sta-tistics Framework to generate sound, relevant and accurate data and statistics.
The need for a Filipino identity as a catalyst towards inclusive, sustainable and human-centered development is recognized in the Philippine and Regional Development Plans. The following are the priority areas in this plan period: a) safeguarding and enshrining our cultural heritage; b) achieving equity and inclusion in access to cultural resources and services; and c) sustaining and enhancing cultural assets to foster creativity and innovation for socio- economic growth.
Assessment and ChallengesThe inclusion of a chapter on culture and values in the Philippine and Regional Development Plans contributed in mainstreaming culture and arts. Recognizing the significant role of culture and arts in sustainable development and inclusive-growth is likewise included in the Provincial Development and Physical Framework Plans and Provincial Tourism Plans.
At the local level, culture and arts components were integrated in nine Comprehensive Development Plans (CDPs) in 2017 and 21 in 2018. The unavailability of guidelines in mainstreaming culture and arts in CDPs from the DILG hindered the mainstreaming of this component. In the two-year plan implementation, notable
achievements of the culture sector include increasing percentage of LGUs with Local Culture and Arts Councils (LCAC) and percentage of LGUs which conducted cultural mapping.
Valuing our diverse cultureThe number of cultural centers/hubs and facilities increased from 54 in 2017 to 66 in 2018. This increase can be attributed to the assistance provided by the National Historical Commission of the Philippines to LGUs. Cultural hubs may be a place or community where exchange of ideas, knowledge or talents may take place. These also serve as a platform to provide space and support for networking, creative outputs and cultural community engagements.

56 | Regional Development Plan 2017-2022
The National Commission on Indigenous Peoples (NCIP) reported that there were three documentations conducted on IKSP through the formulation of the Ancestral Domains Sustainable Development and Protection Plan. Culture bearers identified increased to six in 2018 from one and two in 2016 and 2017, respectively. This can be attributed to further recognition of the members of indigenous peoples (IPs) in communities and participation of IPs in development activities.
Cultural mapping is a tool to document and identify tangible and intangible assets in the community. From 2016 to 2017, there was a 200 percent increase in the number of LGUs which conducted cultural mapping while from 2017 to 2018, it increased to 177.78 percent. Provision of technical assistance from the National Commission on Culture and Arts (NCCA), involvement of teachers and Sanguniang Kabaatan, and support of local chief executives to cultural mapping activities assisted in the increase in percentage of LGUs which conducted the said activity. The output of the mapping may be a database which may be used in policy recommendation and community planning and development.
There was also an increase in the number of local festivities in the Region, from 44 in 2016 to 114 in 2017 and to 151 in 2018. These festivities are part of the annual celebration of festivals in LGUs in cooperation with culture and arts councils, civil society organizations, non-government organizations and academe.
The strong self-help cooperative efforts made possible by the bayanihan spirit have faded as well as the sense of community and indigenous community. This loss in belief in higher source of power caused a decline in creative energy. As a consequence, our capacities for extemporaneous chanting and poetic debate such as the traditional balagtasan, dallot, or balitaw, have become almost extinct.
Pagkamalikhain values of creative excellence advancedThe number of LGUs with established LCAC increased from 30.3 percent to 64.7 percent, from 2017 to 2018. The issuance of DILG memorandum circular 2002-81 for LGUs to establish LCAC is instrumental in this positive development.
Cultural sites in the Region also increased from 290 in 2017 to 342 in 2018 as reported in the Philippine Registry of Cultural Property of NCCA as the LGUs documented their cultural properties. The output of the cultural mapping aids in the identification and validation of these cultural sites.
Inculcating values that foster common goodsBased on the study conducted by NEDA, the Philippines does not have a particular exclusionist culture but is quite religious and conservative. Moreover, the Philippines does not have a particular monumentalist culture where communities have clear identities in tradition and have no reason to change and evolve. However, the country is described as being compassionate, generous, willing to help others and exchange favors and service, having a high opinion on oneself, and willing to demonstrate superiority.
Understanding Filipino values is a key in defining and making sense of people’s social and behavioral patterns, and strengthening common identity towards national and Regional goals. The NCCA conducted a study to identify the core and sectoral Filipino values. Results identified 19 core values which include family, education, faith, health and wellness, and basic needs as top five most important values. Values such as family-centered, faith and virtue-based,

Chapter 7 Promoting Philippine Culture and Values | 57
collective, concern for others, education-oriented and ambivalent remained the same through time while focus on economic security and awareness on importance of culture and heritage changed over time.
Culture-sensitive public governance and development strengthenedFormal agreements for inter-agency support on cultural initiatives increased from one to six in 2017 to 2018. These agreements are: 1) conduct of Museum Summit spearheaded by the South Luzon Association of Museums and Mauban Words and their
Historico-Cultural Origins; 2) development of Taal, Batangas and General Trias, 3) Cavite Municipal Built Heritage Inventory; 4) Silang Church Complex plan; and 5) establishment of eco-art hub in Los Baños, Laguna.
To recognize the significant achievement of artists and cultural workers, four LGUs established an award giving body for cultural initiatives. Some of the awarding and incentive system of the Batangas Province include the implementation of Mabini Batangas Awards, Huwarang Pamilyang Pilipino Awards, and Balisong Awards. Likewise, the Regional Development Council also gives awards and recognizes the exemplary achievement in the Region.
Action PlanStrategic FrameworkFigure 7.1 Strategic Framework to Promote Philipine Culture and Values

58 | Regional Development Plan 2017-2022
Chapter 7 is governed by the strategic framework where the main goal is to lay down the foundation for inclusive growth, a high-trust and resilient society, and competitive knowledge economy. The Culture sector will contribute to the attainment of the overall goal by enhancing the social fabric and regaining public trusts through “malasakit”.
To achieve this intermediate goal, the sector outcomes must first be recognized and achieved. This will be made possible through: a) valuing our diverse cultures; b) advancing the creative excellence; c) inculcating the values of common good; d) strengthening culture-sensitive governance and development; e) continue
collecting accurate and up-to-date data on culture and values; f) mainstreaming culture preservation and development; and g) promoting and pursuing the practice of volunteerism in the academe, corporate, non-government and in government agencies.
TargetsOver the remainder of the plan period, from 2020 to 2022, the challenges include mainstreaming and integration of culture and arts components in CDPs and CLUPs, development of cultural management plans, establishment of schools of living traditions, membership of indigenous peoples in local council, and data gaps on culture and arts.
Table 7.1 Plan Targets to Promote Philippine Culture and Values1
INDICATORSBASELINE END OF PLAN TARGET RESPONSIBLE
AGENCYYEAR VALUE 2020 2021 2022
Philippine Culture and Values Promoted
Tolerance and respect for others enhanced n.d
Pride of being Filipino increased (%) 2013 95.3 NCCA
Inclusion of culture in all development plans in key growth areas (Regional)
2017 1 1 1 1 NEDA
Number of Provincial Development Plans with culture components increased
2017 5 - - - NEDA
Number of CDPs/CLUPS with mainstreamed culture and arts increased
2017 9 38 44 TBD DILG (CDP), HLURB (CLUP)
Number of cultural conservation management plans developed across all levels of government
TBD TBD TBD TBD TBD Provincial Government
Percentage of LGUs mainstreaming culture in their local development plans increased
TBD TBD TBD TBD TBD Provincial Government
Our diverse cultures valued
Distribution of cultural infrastructure index 2016 TBD TBD TBD TBD NCCA
Number of documentation conducted on IKSP 2016 1 TBD TBD TBD NCIP
Percentage of LGUs with cultural mapping conducted increased
2016 2.11% 5.63% 6.34% TBD DOT
Number of schools of living tradition increased 2016 1 5 6 TBD NCIP
Increased number of culture bearer identified 2016 1 5 6 TBD NCIP
Increased number of local festivities sustained 2016 44 56 59 TBD DOT
Pagkamalikhan values of creative excellence advanced
Percentage of LGUs with LCAC increased 2016 0.70% TBD TBD TBD Provincial Government
1 There are no current baselines and targets for the indicators because data remain to be gathered and established through a national survey in 2019. Survey results will be released in 2020.

Chapter 7 Promoting Philippine Culture and Values | 59
INDICATORSBASELINE END OF PLAN TARGET RESPONSIBLE
AGENCYYEAR VALUE 2020 2021 2022
Number of arts academies and schools implementing special programs in the arts increased
2016 1 Increasing Increasing TBD DepEd, CHED
Increased number of cultural sites 2016 42 Increasing Increasing TBD Provincial Government
Increased number of cultural activities 2016 9 Increasing Increasing TBD Provincial Government
Increased percentage of filed applications for intellectual property for individual creative works
2016 n.d. Increasing Increasing TBD DTI-IPOPHIL
Values that foster the common good inclucated
Regional grade average on Edukasyon sa Pagpapakatao increased
2019 n.d. TBD TBD TBD DepEd
Regional grade average on Music, Arts, Physical Education and Health increased
2019 n.d. TBD TBD TBD DepEd
Number of agencies with programs that promote Filipino values for the common good at the level of public service increased
2019 0 TBD TBD TBD Culture related agencies
Curricula integrating courses of values used at all year levels in K to 12 enhanced
2016 n.d. -
-
TBD DepEd
Culture-sensitive public governance and development strengthened
Number of formal agreements for inter-agency support for cultural initiatives across all levels of government increased
2017 n.d. Increasing Increasing TBD NCCA
Percentage of required municipalities, cities, and provinces with Indigenous Peoples Mandatory Representation (cumulative)
2015 n.d. Increasing Increasing 100% NCIP
Number of awareness and sensitivity campaign programs on the rights of PWD, IPs, women, youth and children increased
2016 n.d. Increasing Increasing Increasing NCCA
Number of provinces/ cities/municipalities with offices for culture and arts increased
2016 2 Increasing Increasing 5 Provincial Government
Number of provinces/ cities/municipalities with institutionalized GawadngKultura increased
2017 TBD Increasing Increasing 5 DILG
StrategiesContinue collection of accurate and up-to-date data on culture and values The Philippine Cultural Statistics Framework will be continuously implemented by the NCCA and the Philippine Statistics Authority to generate sound, relevant and accurate cultural statistics. This is in support to planning, policy formulation and budget programming, and monitoring of accomplishments on the values, culture and arts development. The Philippine Indigenous People’s Ethnographies Project under the NCIP should also be continuously funded and implemented to strengthen
initiatives for documenting IKSPs and establishing community registries.
A directory of cultural workers and local artists may be established for easy access of information that may be used by Regional line agencies and local government units in provision of response measures and support services for them during disaster and public health emergencies. The directory may also be used as reference during rehabilitation and recovery planning.
These data and statistics will serve as basis in formulating plans to further nurture culture and the arts in the Region.

60 | Regional Development Plan 2017-2022
Our diverse cultures valued
There is a need to promote appreciation of different cultures amongst the Regions and ensure that these individualities are integrated without compromising the notion of a single national identity. To achieve this, different types of culture should be defined, recognized, safeguarded, and promoted.
Develop, produce, disseminate, and liberalize access to information on Filipino culture and values. Promotion and information dissemination can be done through mobile libraries, outreach programs and travelling exhibits in public spaces. Digitization and content development of information on culture and values may be done to produce information, education and communication (IEC) materials.
As disaster and public health emergencies postpone activities during the celebration of local festivals and other cultural activities, LGUs and culture-related agencies and offices should develop IEC materials and promotional campaigns to raise awareness about the festivals and cultural activities.
Mass communication technologies, such as social media and websites, can be used to disseminate these IEC materials to a wide range of stakeholders.
Institutionalize and intensify heritage conservation plans and programs. There is a need to develop a Regional culture awareness program and heritage conservation and development plan guidelines that will be cascaded to the local level. Due to the vulnerability of cultural heritage sites to disasters and human-induced hazards, disaster risk reduction and climate change adaptation should be mainstreamed in the plan to protect and safeguard cultural and heritage sites. Regular conduct of structural audit of these sites should also be reflected in the plan to find critical areas for repair and suggest retrofitting measures to prevent damage of property and loss of life.
Training and education opportunities on conservation and preservation of tangible and intangible resources and on plan preparation must be made available at the local level to increase the pool of local experts who will lead the plan preparation.
Continue the establishment Knowledge Development Centers and Schools of Living Traditions for building capacities of Filipinos.The younger generation may not be completely aware of the different Filipino traditional practices. To ensure that the practices are carried over generations, culture bearers should be identified and the indigenous knowledge system and practices should be continuously documented. The established Schools of Living Tradition (SLT) should be maintained and their number increased to strengthen cultural conservation in the communites.
Expand inclusive cultural structures as civic spaces for dialogue and cultural exchange. Aiming for cultural awareness equates to the development of culture-related facilities and the construction of learning sites. Ensure that the existing structures are used more purposively as to serve as venues for cultural activities.
Recognize the important role of culture in disaster and public health response, health communication, and rehabilitation and recovery planning. Culture is said to be learned, shared, and transmitted to generation through generation and is reflected in a group’s values, beliefs, and practices, among others. Close family ties and family welfare, among the notable Filipino cultures, are some of the factors may be considered in responding in disasters and public health emergencies. Hence, the vital role of culture in response and in rehabilitation and recovery planning should be considered to understand the people’s behavior. This will ensure that response measures, policy recommendations, programs, and projects are appropriate.

Chapter 7 Promoting Philippine Culture and Values | 61
“Pagkamalikhain” value of creative excellence advanced
Creativity in development process should be continuously advocated. This will not only aid in the improvement and popularization of Filipino culture but will also add economic value.
Boost the development of Filipino creativity as tool for social cohesion and push for culture-based industry and creative economy. Elevating arts and culture in Regional and local conversations, such as use of media and identifying culture champions at the local level, will encourage artists. Provision of incentives to artists and media practitioners who support culture-related activities and produce culture-related shows will also serve as mechanism in promoting cultural awareness. Award giving bodies in LGUs will serve as venue in recognizing local artists and cultural workers. Thus, LGUs are encouraged to form award giving bodies to promote culture and arts.
Build public appreciation of Filipino creativity. There is a need to change the mindsets on aesthetic and creativity for a better appreciation of Philippine culture. Providing broader career opportunities for culture and arts will encourage participation from the younger generation in pursuing passion for culture and arts. Use of local language or baybayin calligraphy, especially for signages, logos, name cards, and public art can be encouraged to better appreciate Filipino creativity and local language. Further appreciation of Filipino creativity may be promoted through celebration of festivals and conduct of fairs and events. The Department of Tourism (DOT)’s visitor centers may be used as a venue to exhibit creative local outputs and local commodities.
Promote and hasten the development of Philippine creative economy. The competitiveness and attractiveness of our creative talents and products are being recognized in the international markets.
Thus, it is crucial for the country and the Region to transition to digitization and e-commerce as it is an important source of trade and investment opportunities amidst the development brought by the fourth industrial revolution. Since the concepts of creative economy and creative industry are new, there is a need for common and shared understanding between the government and private sector on this matter.
Values for the common good inculcated
Use various channels of values inculcation. NEDA and NCCA conducted a study on the association of Filipino cultures and personalities and the present and shared core values of Filipinos. Results of the study can be integrated in programs and projects, education curricula, local ordinances and media to promote and inculcate these values. Instilling these values is a step towards a high-trust society.
Increase government efforts for promotion of value that foster the common good. The government should partner with media and civil society organizations in promoting values that fosters common good. Engaging communities to participate in promoting good values can be made.
Encourage the youth to participate in cultural activities and to enroll in culture and arts education programs. There is a need to mainstream cultural education in basic, technical-vocational, and higher education. Inclusion of culture and arts in the curriculum, capacity building and training of teaching personnel and improving the learning materials can encourage the youth to enroll in cultural and arts programs and attend in cultural activities.
Mainstream culture and values in the basic, technical, vocational, and higher education systems. Mainstreaming culture and values in education should start in the primary education as the formative years of children are the periods wherein cognitive, social,

62 | Regional Development Plan 2017-2022
The government will implement the following programs, projects and activities to attain the sector and subsector outcomes:
Our diverse cultures valued
• Construction and enhancement of libraries and museums
• Development of knowledge materials on culture, values and indigenous peoples
• Establishment of Schools of Living Traditions
• Enhancement and conduct of cultural awareness programs and advocacy campaigns
“Pagkamalikhain” or Value of creative excellence advanced
• Development and promotion of Philippine creative economy
• Provision of tax incentives and breaks
for artists and media advocating cultural awareness
• Recognition of individuals and organizations who are champion in promoting, preserving and protecting cultural heritage and arts
Values for the common good inculcated
• Integration of culture and core and shared values in the curricula and various activities of the basic and higher education
• Forge partnerships with media, civil society organizations, and other stakeholders to widen efforts of values inculcation
Major Programs and Projects
and emotional development starts.
Culture-sensitive governance and development strengthened
The government plays a crucial role in mainstreaming the Filipino culture and ensuring that it is protected and preserved.
Pursue institutional reforms for cultural development. Creation and institutionalization of LCAC and ordinances that promote culture will aid in mainstreaming culture and the arts and in recognizing the important role of culture and values in sustainable local development.
Strengthen the protection of the rights of vulnerable sectors to access cultural resources and to live a life free from discrimination and fear. Celebration of the National Indigenous Peoples Month and National Indigenous Peoples Day will mainstream their culture and traditional practices, foster the appreciation of katutubo culture and
traditions, and eliminate discrimination. As such, government offices, academic institutions, private sectors and other stakeholders should join in the said celebrations. Participation in forums and dialogues with the IPs can be done to further learn and appreciate their background, contribution and participation in nation building. Inviting IP representatives during consultation meetings and development planning is encouraged to take note of their comments and opinions on socio- economic concerns.
Use vernacular or local language in IEC materials. The IEC materials of Regional line agencies, LGUs, and private sectors that were developed using vernacular or local language and in layman’s terms will ensure that the intended message and information are communicated clearly to the target audience. This will also avoid confusion and misinformation among the stakeholders.

Chapter 7 Promoting Philippine Culture and Values | 63
Legislative AgendaLEGISLATIVE AGENDA RATIONALE
Support the Creation of Department of Culture Reorganization of NCCA and its functions
Creation of office and plantilla items for culture and arts
To have a better focus on cultural awareness, there should be a position dedicated to the perceived responsibilities
Strengthen incentive system for media and artists: 1) Provision of tax incentives for media that promotes cultural oriented shows/content; 2) Provision of tax breaks for artists
Media is considered as very influential due to many means it can rely and transfer information and message. Providing incentives to media will encourage them to create shows and integrate culture-related contents to their releases. This will also aid in promoting culture awareness.
Issuance of AO on rectification of historical data
Some learning materials provided to schools include errors in historical data, hence, a need to revise and enhance these materials
Provision of guidelines on mainstreaming culture and arts in CDP/CLUP formulation
CDP-TAC checklist includes the integration of culture and arts component in CDP; thus, there is a need for DILG to include guidelines on mainstreaming culture and the arts in local development plan
Culture-sensitive governance and development strengthened
• Conduct of cultural mapping in cities and municipalities
• Provision of trainings and capability building in preparing the Cultural Heritage Development Plan and
integration of culture and values in local development plans
• Representation of IPs in local councils• Participation of the youth, Sangguniang
Kabataan officials, and youth leaders in cultural activities in the communities
• Provision of IEC materials using local language and simple words

64 | Regional Development Plan 2017-2022

Chapter 1 The Long View | 65

66 | Regional Development Plan 2017-2022

Chapter 8 Expanding Economic Opportunities in Agriculture, Forestry and Fisheries | 67

68 | Regional Development Plan 2017-2022

Chapter 8 Expanding Economic Opportunities in Agriculture, Forestry and Fisheries | 69
Chapter 8
Expanding Economic Opportunities in Agriculture, Forestry and FisheriesThis chapter presents the performance of AFF sector in the Region from 2017 to 2018 in terms of achieving the Plan targets. The eruption of the Taal Volcano and COVID-19 pandemic presented new challenges that required a new perspective in defining strategies and designing programs and projects (P/Ps) on resource conservation, sustained production, technology adoption, credit access, technical assistance and support provision, and strong collaboration with the private sector.
AssessmentGross Value Added (GVA)increasedFrom 2016 to 2018, the AFF accounted for an average of about 5.13 percent of the total gross domestic product of CALABARZON. Notwithstanding the positive performance attained in 2018, the gross value added remains below the minimum of 2.3 percent growth target, which is lower than the 2016 performance (Table 8.1). The performance of the AFF was highly affected by the decline in the crops and fisheries sub-sector (Table 8.2) due to numerous typhoons and
depleted fisheries resources. The crops and fisheries sub-sector contributed about 19.5 percent and 19.1 percent, respectively of the 2018 total value of production in AFF.
Crop yield performance slowed downMajority of the priority crops in the Region posted a downtrend in productivity performance vis-à-vis targets from 2017 to 2018 (Table 8.3). The decline in yield was caused by weather disturbances such as typhoons and prolonged dry season
Table 8.1 Growth Rate of GVA in AHFF (in percent) BASELINE
(2016)TARGET ACTUAL
2017 2018 2017 2018
3.4 2.0-3.5 2.3-3.8 -0.60 0.70
Table 8.2 Growth Rate of Value of Production by Subsector (in percent, at constant prices)
SUBSECTOR BASELINE(2016)
TARGET ACTUAL
2017 2018 2017 2018
Crops 2.1 Increasing Increasing -0.80 0.70
Fisheries -0.4 Increasing Increasing -6.30 -7.40
Livestock 7.9 Increasing Increasing 1.60 2.30
Poultry 2.8 Increasing Increasing 1.10 2.80

70 | Regional Development Plan 2017-2022
which resulted to delayed planting and shift to other crops. Government support measures were put in place to improve crop production which mainly includes input provision to assist farmers as they start another cropping season.
On the other hand, some commodities posted a positive performance such as palay, yellow corn, banana, coconut, cacao and abaca. However, among these commodities,
only palay and coconut were able to achieve the target yield with palay attaining 1.25 percent more than the 2018 target and coconut with 2.01 percent and 5.55 percent more than its 2017 and 2018 targets, respectively. The two crops were able to sustain performance since 2016 because of the government’s efforts to rejuvenate and/or rehabilitate old fruit bearing trees, intensive fertilization, hybridization and farm mechanization.
Table 8.3 Yield of Major Commodities (in MT/Ha, cumulative)
CROP BASELINE(2016)
TARGET ACTUAL
2017 2018 2017 2018
Palay 3.50 3.64 3.82 3.53 3.87
White Corn 1.70 1.96 2.39 1.70 1.70
Yellow Corn 3.80 4.00 4.64 3.66 3.82
Banana 4.10 4.24 4.37 4.22 4.26
Coconut 3.10 3.13 3.28 3.19 3.46
Pineapple 22.70 23.38 24.08 23.23 22.25
Mango 3.60 3.80 3.99 2.99 3.05
Sugarcane 60.90 Increasing Increasing 63.60 58.83
Cassava 6.90 9.75 10.15 6.59 5.86
Coffee 0.20 0.30 0.30 0.16 0.15
Cacao 0.04 0.14 0.24 0.04 0.05
Rubber 0.10 No Target No Target 0.05 0.03
Abaca 0.02 No Target No Target 0.03 0.02
Fisheries production declinedThe growth in the volume of fisheries continued to decline from 2016 to 2018 (Table 8.4). The commercial and aquaculture fishery production fell by 18 percent and 11.30 percent, respectively compared to 2017 performance. Municipal fishery, on the other hand, posted 5.70 percent growth in 2017 compared to a negative performance in 2016. However, it also suffered significant decline of 9.5
percent in 2018. The performance of the fishery sub-sector is reflected in the priority fishery commodities (Table 8.5) in the Region resulting to the non-attainment of the targets for 2017 and 2018. Tilapia and Milkfish, which are the major contributors in the total fisheries production of the Region have declining production since 2016 due to the effect of intense heat during the prolonged dry spell and onset of El Niño Phenomenon in 2018. Seaweeds production was highly affected by the ice-ice disease and epiphytes resulting to scarcity of planting materials.
Table 8.4 Growth in Volume of Fisheries Production (in percent)
TYPE BASELINE(2016)
TARGET ACTUAL
2017 2018 2017 2018
Commercial -20.14 1.00 1.00 -6.10 -18.00
Municipal -23.78 2.00 2.00 5.70 -9.50
Aquaculture -0.63 3.00 3.00 -1.20 -11.30

Chapter 8 Expanding Economic Opportunities in Agriculture, Forestry and Fisheries | 71
Table 8.5 Volume of Priority Fishery Commodities Production (in ‘000 MT, cumulative)BASELINE
(2016)TARGET ACTUAL
2017 2018 2017 2018
Tilapia 92.37 98.23 104.12 91.87 92.14
Bangus 67.37 72.15 75.03 71.31 44.7
Seaweeds 3.60 3.82 4.01 0.83 3.30
Tiger Prawns 0.20 0.20 0.21 0.32 0.29
White Shrimp 0.00 0.001 0.001 0.00027 0.001
The decline in the performance of the fisheries sub-sector, especially aquaculture, was also attributed to strengthened implementation of regulatory policies on illegal, unreported and unregulated (IUU) fishing in Laguna Lake1. Nonetheless, the government continues to provide support through the distribution of fishing paraphernalia, provision of livelihood projects and assistance to the marginal fisherfolk, and strengthened linkages with the Local Government Units and other law enforcement agencies to ensure conservation and preserved fisheries resources.
Meanwhile, white shrimps and tiger prawns that are both cultured in marine fish cages and marine fish pens proved their potentials as their production increased in 2017 to 2018 resulting to the attainment of their respective targets. Such performance may be a result of the government’s efforts to promote mariculture as an alternative source of income and sustainable livelihood for fisherfolks.
1 President Rodrigo Duterte during his 2016 State of the Nation Address stated that: “Laguna de Bay shall be transformed into a vibrant economic zone… fish pen and fish cage operators have to reduce their areas of occupation, and that poor fishermen shall have priority in its entitlement.”
Livestock and poultry retains uptrend performanceThe livestock and poultry sub-sector which contributed about 29.5 percent and 31.8 percent of the Region’s total production in AFF in 2018, respectively, continued to sustain its positive growth, while at the same time achieving its targets in 2017 to 2018 (Table 8.6). Hog production in the Region, which constitutes about 92 percent of the total livestock production in 2018, increased by 1.81 percent and 2.66 percent in 2017 and 2018, respectively. The performance was the result of the increased demand to other meats due to bird flu scare in 2017, strict implementation of bio-security measures, and strong collaboration between the government and the private sector. However, goat production, constituting about 2.5 percent of the total livestock production in 2018, increased by 0.53 percent in 2017 but declined by 2.62 percent in 2018. Nonetheless, the government continues the promotion of goat production through the various support services which distributes quality goat stocks to qualified farmers.
Table 8.6 Volume of Production (in ‘000 MT, cumulative)BASELINE
(2016)TARGET ACTUAL
2017 2018 2017 2018
a. Hog 365.10 Increasing Increasing 371.70 381.59
b. Goat 3.80 Increasing Increasing 3.82 3.72
d. Chicken 328.40 Increasing Increasing 328.65 330.94
e. Chicken Egg 140.30 Increasing Increasing 145.02 156.32

72 | Regional Development Plan 2017-2022
Challenges
Chicken and chicken egg production, which constitutes about 70.11 percent and 29.07 percent of the total poultry production in 2018, respectively, posted positive growths resulting to achievement of targets in 2017 and 2018. Chicken production increased by 0.08 percent in 2017 and 0.70 percent in 2018 while chicken egg production increased by 3.36 percent in 2017 and 7.79 percent in 2018. Despite the Bird Flu scare in 2017, the positive performance was attributed to the sustained demand from CALABARZON and National Capital Region, upgrading from conventional to tunnel ventilation system, and strong collaboration with the private sector.
Technical services provided increasedThe harvest area for staple crops provided with technical support services increased, particularly for yellow corn, with 17.71 percent and 16.17 percent increase in 2017 and 2018, respectively. On the other hand, the beneficiaries provided with technical support services for livestock, poultry and dairy surpassed its target by as much as 98.92 percent in 2018. Similarly, the number of fisherfolks provided with
production support increased in 2018 resulting to a surpassed target by as much as 108.95 percent.
In terms of the provision of agricultural and fishery machineries and equipment, the actual accomplishments surpassed the target number of beneficiaries by as much as 113.05 percent and 152.58 percent in 2017 and 2018, respectively. Also, the actual number of beneficiaries provided with extension services surpassed its targets by as much as 11.46 percent and 25.77 percent in 2017 and 2018, respectively.
Additionally, the share of AFF research and development government budget to total AFF GVA increased by 6.99 percent from PHP84.10 million in 2017 to PHP89.98 million in 2018.
Growth in labor productivity increasedThe labor productivity in the AFF has increased by 2.70 percent from PHP134,698 in 2016 to PHP138,331 in 2017. Labor productivity in the AFF increased at an annual average of 7.00 percent since 2010 consistent to the plan targets of increasing growth in productivity.
Table 8.7 Technical Support Services ProvidedBASELINE
(2016)TARGET ACTUAL
2017 2018 2017 2018
Number of Fisherfolk Provided with Production Support Increased
842 1,525 827 1,182 1,728
Number of Group Beneficiaries Provided with Agricultural and Fishery Machineries and Equipment Increased
96 475 194 1,012 490
Number of beneficiaries provided with extension services increased
6,125 10,233 6,827 12,857
The AFF remains vulnerable to weather disturbances which not only affect the volume of harvested crops and fisheries but changes in planting schedules, shifting to other crops, decline in fish unloading and damages in fishery paraphernalia. Likewise,
the sector is highly susceptible to dry spell and El Niño phenomena which results to damages in crop production and fish kill due to increase in temperature.
Fisheries production in the Region is also hampered by the depleting fisheries
Chapter 8 Expanding Economic Opportunities in Agriculture, Forestry and Fisheries | 73
resources due to IUU fishing. In 2018, the country has been flagged by international organizations to implement sustainable fisheries management to allow for spawning of endangered species and reduce stunted growth of fresh water specie leading to increased and sustained fish production.
The livestock and poultry sub-sector is prone to losses due to diseases. The poultry sub-sector was threatened by the Avian Flu in 2017 while the livestock sub-sector was affected by the African Swine Fever in 2019. The vigilance of the government and private sector in implementing preventive and control measures resulted to maintaining a positive performance of the livestock and poultry sub-sector. However, as the livestock and poultry sub-sector remains to be the growth drivers of the AFF sector in the Region, disease management remains a challenge that needs to be addressed.
The Taal Volcano eruption during the onset of 2020 spewed ashes that gave off a necrotic effect to the leaves of the fruit bearing trees and crops resulting to fruit dropping and death of some crops. On the other hand, the livestock and poultry raisers in lockdown barangays were not able to feed their animals resulting to sickness and death of the animals. Most affected were the chicken layers, quails and swine which resulted to lower production of poultry eggs, high mortality on farms and decreased farm gate price of live animals. For the fisheries sub-sector, fish cages were damaged resulting to fishes being released into the lake. This led to the oversupply of fish and lower prices. The misinformation on the safety of the fish caught from the Taal Lake drove prices even
lower as people were afraid to consume fish. Apart from income loss due to the very low prices of fish and production losses, the eruption has also resulted to displacement of livelihood and income of farmers and fisherfolks.
In addition, the AFF sector is at risk from biological hazards such as COVID-19. The pandemic enhanced community quarantine affected the food supply chains, food security and agricultural livelihoods in the Region. The harvesting activities were affected as laborers had great difficulty in going to the farms with the absence of public transport. The restriction on transportation affected the flow of goods resulting to disrupted supply chains of agricultural and fisheries commodities. Relatedly, the ECQ led to lower demand for agricultural produce with the closure of hotels, restaurants and commissaries which are major markets of agricultural and fisheries produce. On the bright side, there is an increased demand for healthy fresh farm produce to strengthen the immune system and combat the virus.
Lastly, the limited data on AFF makes it difficult to estimate the damages and losses which make planning and projections challenging. During the Taal Volcano eruption, the reports from the LGUs were under estimated due to the absence of a database on livestock in the affected areas. Validation could not be conducted due to the continued volcanic activity. Likewise, the data on the number of farmers, organizations, area planted and infrastructure are inadequate which constrains the government in providing appropriate inputs.
Action PlanStrategic FrameworkIn order to achieve the intermediate goal of reduced inequality in economic opportunities, the sector outcomes are to a) expand economic opportunities in
AFF; and b) increase access to economic opportunities of small farmers and fisherfolk. The sector outcomes will be achieved through: a) improved productivity within ecological limit; and b) increased AFF-based enterprises. Also there must

74 | Regional Development Plan 2017-2022
Table 8.8 Plan Targets to Expand Economic Opportunities in Agriculture, Forestry, and Fisheries
INDICATORSBASELINE END OF PLAN TARGET RESPONSIBLE
AGENCY2016 2020 2021 2022
Economic Opportunities in AFF Expanded
Growth rate of GVA in AHFF increased (in %, at constant prices)
3.4 2.5-40 2.6-4.2 2.8-4.5 DA, PSA
Growth rate of Value of Production (in %, at constant prices)
Crops 2.1 Increasing Increasing 2.0-3.0 DA, PSA
Fisheries -0.4 Increasing Increasing 3.4-4.0 BFAR, PSA
Livestock 7.9 Increasing Increasing 3.0-4.0 DA, PSA
Poultry 2.8 Increasing Increasing 2.0-3.0 DA, PSA
Access to Economic Opportunities by Small Farmers and Fisherfolk Increased
Growth in Labor Productivity of Farmers and Fisherfolks (in percent, real terms)
16.8 Increasing Increasing Increasing PSA
Figure 8.1 Strategic Framework to Expand Economic Opportunities in Agriculture, Forestry, and Fisheries
be: a) increased in access to value-chains; b) increased access to innovative financing; c) protected and increased access of
small farmers and fisherfolks to land and water resources; and d) increased access to technology.
TargetsOver the remaining plan period from 2020 to 2022, the main target is to substantially increase the gross value added in AFF from
the 2016 baseline value of 3.4 percent to within 2.8 to 4.5 percent in 2022. The target shall be realized by increasing the value of production in the crops, fisheries, livestock, and poultry sub-sector as well as increasing labor productivity.

Chapter 8 Expanding Economic Opportunities in Agriculture, Forestry and Fisheries | 75
The indicator on increased access to economic opportunities by small farmers and fisherfolk through Labor Productivity of AFF increased was reformulated to Growth in Labor Productivity of Farmers and Fisherfolks Increased to best reflect the targeted output.
Similarly, considering the downtrend performance of the fisheries sector from 2016 to 2018, the targets in the Results Matrix were revised to consider challenges
in production performance. The 2020 to 2022 target in growth in volume of municipal and aquaculture production was reduced (Table 8.9) as well as the volume of production of tilapia, bangus and seaweeds (Table 8.10).
The unit of measurement for the target on coconut yield was revised from hectare to metric tons per hectare to be consistent with the data gathered and reported by the Philippine Coconut Authority.
Table 8.9 Target Growth in Volume of Production (in percentage)PREVIOUS REVISED
2020 2021 2022 2020 2021 2022
Municipal 2.00 2.00 2.00 1.00 1.00 1.00
Aquaculture 3.00 3.00 3.00 1.00 1.00 1.00
Table 8.10 Target Volume of Production (‘000 MT, cumulative)PREVIOUS REVISED
2020 2021 2022 2020 2021 2022
Tilapia 116.99 124.01 131.45 93.06 93.99 94.93
Bangus 81.15 84.40 87.76 45.15 45.60 46.05
Seaweeds 4.42 4.65 4.88 3.34 3.37 3.40
Table 8.11 Target Yield of Coconut (MT/ha, 2020-2022)PREVIOUS (in ha) REVISED (in MT/HA)
2020 2021 2022 2020 2021 2022
1,739,030.40 1,825,981.91 1,917,281.01 3.62 3.80 3.99
Strategies
Expand economic opportunities in AFF
To expand economic opportunities in AFF, there is a need to: a) improve productivity of the AFF within ecological limit; and b) increase AFF-based enterprise.
AFF productivity within ecological limit improved
Resilience of the AFF sector to losses due to climatic conditions, plant diseases and pest infestation need to be strengthened. The sector remains vulnerable to changes in climatic conditions which often result to losses. The sector’s resilience will be
strengthened through the implementation of programs and projects that include the following strategies: (a) establishment of climate-resilient small water-impounding dams in strategic areas for irrigation purposes, especially during El Niño episodes; (b) adoption of improved farm management practices; (c) effective and efficient management of inputs including water; (d) promotion of new technologies including water-saving and management technologies (e.g., broadcasting, drip irrigation, alternate wetting, and drying), stress-tolerant seed varieties, animal breeds, and fish stocks; and (e) construction of more climate resilient farm structures.
In addition, climate change adaptation practices, organic agriculture, urban

76 | Regional Development Plan 2017-2022
agriculture, and will be promoted. Timely and site-specific weather and climate advisories will be provided using advanced information and communication technology in order to reach and serve a greater number of stakeholders.
Sustainable fisheries management. The country has been flagged by international organizations to strengthen its fisheries conservation and management interventions. The following strategies should be further pursued: (a) complete the delineation, delimitation, and zoning of municipal waters to ensure that municipal fisherfolks are given preferential use and exclusive access to resources; (b) strengthen collaborative law enforcement and management of coastal and marine areas particularly against illegal, unreported, and unregulated fishing activities; (c) implement closed fishing season that is based on a comprehensive scientific study to allow for increase in fish stocks; (d) address issues on invasive non-native/alien species; and (d) improve fisheries database system.
Use of appropriate farm and fishery machinery and equipment. The enactment of RA 11203, “An Act Liberalizing the Importation, Exportation and Trading of Rice, Lifting for the Purpose the Quantitative Import Restriction on Rice, and for Other Purposes”, is expected to provide support to rice farmers through the Rice Competitiveness Enhancement Fund (RCEF). The RCEF is expected to provide farm machinery and equipment to improve farm operations, rice seed development, propagation and promotion, expanded rice credit, and extension services.
Moreso, local manufacturing and assembly of machinery and equipment for production, post-harvest, and processing activities in AFF will be highly encouraged. Government will intensify information, education and communication activities on available local machinery (e.g., tractors,
tillers, and harvesters), equipment, (e.g., mechanical dryers, threshers, and milling equipment) and fishing technologies (e.g. fiberglass hull and small engines in fishing boats).
Sustained production and disease prevention. The crops sub-sector production shall be sustained through rejuvenation and/or rehabilitation of old fruit bearing trees, intensive fertilization and hybridization. Moreover, promotion of urban agriculture will be intensified though the establishment of community gardens in barangays with vacant areas where they can plant, propagate, and produce their own vegetable requirements. The community gardens may also serve not only as source of food and livelihood, but also as additional income for those who will sell their surplus.
For fisheries, research facilities such as level 2 laboratories to cater to the emerging diseases of fishery products such as white spot syndrome virus for prawns/shrimps and Tilapia Lake Virus needs to be established.
For the livestock and poultry sub-sectors, government support must be strengthened as the sub-sectors remain to be the growth driver of the AFF in the Region. The country has been at its comparative advantage over other ASEAN counterparts because our geographic location allows us to be less prone to animal and avian diseases. Border protection through checkpoints must be strengthened and biosecurity, or practices that can control the spread of disease-causing organisms in livestock and poultry, must be in place and strictly implemented. Production support services will still be pursued to ensure productivity in the sub-sector such as the Artificial Insemination Program and the establishment of multiplier farms or scaled-up version of the dispersal program where animal stocks are distributed to the farmers.
Chapter 8 Expanding Economic Opportunities in Agriculture, Forestry and Fisheries | 77
AFF-based enterprises increased
New and innovative production and marketing schemes. New forms of linkages such as contract farming and corporate farming which will connect AFF enterprises to markets and other upstream services will be established. The government can facilitate consolidation of harvest and identify common production areas to develop and institutionalize new food supply channels to address the challenge on disrupted supply chains. Likewise, mobile food banks such as the KADIWA ni Ani at Kita will be replicated to ensure food availability, accessibility and price stability. The government has to design simplified procedures for accreditation of “foodlanes” for food suppliers to facilitate transport of farm and fishery commodities.
Government assistance in forms of legislated tax holidays or direct buying from the producers during crisis situations shall be established to ease producers of financial burden and allow them to recover faster.
Provide non-farm livelihood options to seasonal farm and fishery workers. The government will continue to implement community-based employment programs as alternative income sources during off-season to reduce vulnerability of farmers and fisherfolks’ income. Seasonal workers will also be trained on off-farm and non-farm activities to enable them to take advantage of alternative employment opportunities including their involvement in the development of agri-tourism.
Increase access to economic opportunities by small farmers and fisherfolks
To increase access to economic opportunities by small farmers and fisherfolks, there is a need to: a) increase access to value-chains; b) increase access to innovative financing; c) protect and increase
access of small farmers and fisherfolks to land and water resources; and d) increase access to technology.
Increase access to value-chains
Strengthened coordination and convergence. Coordination and convergence among the Departmetn of Agriculture (DA), Department of Agrarian Reform (DAR), Department of Science and Technology (DOST), Department of Environment and Natural Resources (DENR), Department of Trade and Industry (DTI), DILG, and other relevant agencies and local counterparts will be strengthened to further develop the agricultural value chain in the Region. During crisis situation, such coordination will intensify farm production and ensure continuous income for farmers and fisherfolks with unhampered movement of supply and workers involved in the agricultural value chain. The strengthened coordination shall also ensure effective price monitoring and enforcement, and information dissemination.
Similarly, coordination and partnership with the local government units and the private sectors will be strengthened to facilitate implementation of regulations and interventions to sustain production and improve income of the AFF stakeholders.
Strengthening Monitoring. Monitoring the commodities produced, area harvested, and registered farmers and fisherfolks will be strengthened to provide accurate information to decision makers. Moreover, price monitoring during crises will ensure compliance with the Price Act protecting both the producers and consumers.
For fisheries, strengthened monitoring will be the basis for the implementation of necessary interventions on sustained production such as closed fishing season and establishment of fish sanctuaries.

78 | Regional Development Plan 2017-2022
Establishment of Database System. Strengthened monitoring will provide for the establishment of a local database system which can support decision making and validate monitoring reports especially during a crisis. Such reports can be used to estimate damages and losses and identify appropriate interventions.
Clustering of farmers and fisherfolk. Small farmers and fisherfolks will be organized into clusters to create economies of scale. Social preparation such as organization-building and management will be conducted among smallholder farmers and fisherfolk who are not yet organized into associations and cooperatives. Successful clustering models will be replicated and land consolidation/contiguous farming schemes will be encouraged to increase productivity and farmers’ income Efforts to integrate them into larger agribusiness enterprises and institutional buyers will also be pursued.
Continued Palay Procurement. The government to continue procuring palay or unmilled rice from the farmers at a higher price compared to the price offered by traders to help local producers of rice cope with falling prices due to the implementation of the Rice Tariffication Law. The procured local rice stocks will serve as buffer stock allowing the government to respond to calamities and emergencies.
Increase access to innovative financing
Provide easy, fast, accessible, and affordable loan packages. Minimum requirements and simplified procedures will be in place so that farmers and fisherfolks can easily avail of the financial assistance from government. Existing agricultural financing programs, such as the Kapital Access for Young Agripreneurs and the Agri-Negosyo Loan Program, were launched in response to urgent sectoral needs to: a) encourage the youth to engage in agriculture and fisheries
ventures; and b) build the entrepreneurial mindset among our farmers and fishers, consecutively. Eligible borrowers may finance their production, working capital and farm machinery requirements through these ACPC programs. Further, the Survival and Recovery (SURE) Loan Assistance Program continues to provide loan assistance to small farmers and fishers in times of calamities and other environmental or market shocks, to help them regain their capacity to continue their agricultural activities.
Among others, SURE was deployed through the SURE Aid Taal for small farmers and fishers affected by the eruption of Taal Volcano, which comes in two forms: a) emergency loan assistance up to PHP25,000 for immediate and basic needs such as food and medicine; and b) loan recovery assistance up to P150,000 for the rehabilitation of the agri-fishery projects of eligible small farmers and fishers. Furthermore, in relation to the adverse effects of the ECQ due to COVID-19 to the incomes of marginalized, small farmers and fishers (MSFF) and agri-fishery based micro and small enterprises (MSEs), the Expanded SURE Aid and Recovery Project has been in the works aiming to: a) provide loan assistance to MSFF to finance their emergency and production capital requirements; and b) provide working capital loan to agri-fishery based MSEs engaged in agriculture and fisheries food production, delivery of produce/products/commodities and other supply chain activities to ensure the availability of food supply.
Improving the awareness and access of small farmers and fisherfolk on risk insurance. The sector is highly vulnerable to various risks but farmers and fisherfolks have limited knowledge on how to be insured. As such, innovative agricultural insurance schemes such as weather index-based and area-based yield index insurance will

Chapter 8 Expanding Economic Opportunities in Agriculture, Forestry and Fisheries | 79
be promoted through the assistance of the local government units. Agricultural insurance of subsistence farmers and fisherfolks to cover crop, livestock, fisheries and non-crop agricultural asset will be made more accessible to provide protection from losses arising from natural calamities, plant diseases and pest infestations of crops. Also, considering that the various sub-sectors of the AFF are all vulnerable to hazards and climatic conditions, insurance must be available without prejudice to include other non-crop agricultural assets such as the livestock, poultry and unharvested fisheries stock.
Protect and increase access of small farmers and fisherfolks to land and water resources
Revisit Section 20 of the Local Government Code (RA 7160) which authorizes LGUs to reclassify agricultural lands for other uses. This law does not include any provision for sanctions or penalties for LGUs that have reclassified agricultural lands more than the allowable limit (i.e., 15 percent for highly urbanized cities, 10 percent for component cities, and 5 percent for 4th – 6th class municipalities). The passing of the National Land Use Act will pave the way for LGUs to establish baseline information on their various land types to serve basis for land classification and regulate land conversion.
Increase access to technology
Increase investments in R&D for production and post-harvest technologies. This aims to reduce losses, maintain quality and food safety, and increase the value of agricultural and fishery commodities (e.g., ice-making and storage technologies). Investments will be increased to cover the direct cost for R&D, build a critical mass of human resources and improve infrastructure in support of the Harmonized National R&D Agenda for Agriculture, Aquatic and Natural Resources 2017-2022. This agenda espouses the use of
advanced and emerging technologies such as biotechnology, genomics, bioinformatics, nanotechnology, and ICT as tools to find science and technology solutions to AFF problems or to develop new products with significant impact to the sector.
The following will also remain R&D priorities: (a) development of climate- and disaster-responsive technologies and innovations; (b) development of fishery culture system for species with high market potential; and (c) improvement of fishery culture for traditional species.
Enhance capacity of small farmers and fisherfolk to adopt better and new technologies. This will ensure that R&D findings and available technologies will be successfully adopted in the ground. Information dissemination and capacity building of both extension workers and farmers must be continuously strengthened. The local government units, through the OPA and MAOs can assist in engaging farmers and fisherfolks to regular meetings to provide updates on the new programs and projects of the government.
Trainings can also serve as venue to showcase success stories, best practices and introduce non-conventional farming methods to encourage more investors in the AFF especially the youth and the retirees. Existing programs such as Farmer’s Field School will be strengthened and farmers will be encouraged to participate to be informed on the latest technologies and practices for improving productivity such as the use of Certified and Hybrid seeds.
Technologies crucial during calamities and hazardous events shall be promoted such as the digital applications to improve mobility and essential supply chains, and geo-locations for quick response.

80 | Regional Development Plan 2017-2022
SECTOR PROGRAMS/PROJECTS
Crops • Rice Program• Corn Program• HVCDP Program• Organic Agriculture Program • Philippine Rural Development Project• Kaanib Enterprise Development Project
• Coconut Fertilization Project• Kaanib Coco Agro-Industrial Hub• Accelerated Coconut Planting & Replanting • Palay Procurement• Sagip Saka• Crop Diversification Program
Fisheries • Fisheries Development Program • Fisheries Regulatory & Law Enforcement Program• Fisheries Extension Program• Fisheries Policy Program
• National Inland Fisheries Enhancement Program (NIFEP)
• Malinis at Masaganang Karagatan (MMK)
Livestock Livestock Program
Poultry Poultry Program
Credit • Production Loan Easy Access• Farm Machinery Loan Easy Access• Working Capital Loan Easy Access• Survival and Recovery Loan Assistance Program• Sikat Saka Program
• COVID Expanded Survival and Recovery Assistance Program for Rice Farmers/SURE Aid Program
• Farm Tourism Financing Program• Rice Farmers Financial Assistance Program
Insurance • Rice Insurance Program• Corn Insurance Program• High Value Crops Insurance Program
• Livestock Insurance Program• Fisheries Insurance Program• Expanded Agriculture Insurance Program
Marketing • Enhancement of online transactions and deliveries, as well as the improvement of digital connectivity and internet services
• Create digital palengke or supermarkets in partnership with transportation network vehicle service and delivery companies
• Establish and promote online public market system, mobile marketplaces, rolling stores, and foodbanks
• Upscaling of KADIWA ni Ani at Kita Direct Marketing Program
Research and Development
R&D programs on:• Capacity and Needs Assessment of Health Care Facilities, Especially Government Hospitals to Manage
Health Care Wastes• Assessment of Existing Technologies or Processes on Waste Storage and Treatment to Manage New
Viruses• Early Detection and Rapid Response to Manage New Viruses and Other Organisms, and its Relationship
to the EnvironmentResearch, Development & Extension and commercialization of safe, nutritious, medicinal/therapeutic, and well-packaged agri-food productsBalik Scientist
Others • Small Enterprise Technology Upgrading Program• Urban Gardening (conduct of online lectures and provision of start-up kits)• Community Gardening Projects (in collaboration with LGUs and cooperatives)• Capacity building and IEC projects on food safety awareness • Review and development of regulatory measures and standards • Streamlining FDA processes for certification and roll out of developed technologies and products• Information, Education, and Communication campaigns on food safety measures and healthy
dietary habits
The government will implement the following programs and projects that will support the attainment of the targets
for 2020-2022 and subsequently expand economic opportunities in the AFF sector:
Major Programs and Projects

Chapter 8 Expanding Economic Opportunities in Agriculture, Forestry and Fisheries | 81
Legislative AgendaLEGISLATIVE AGENDA RATIONALE
National Land Use Bill The National Land Use Act (NaLUA) aims to ensure the sustainable and efficient use of the country’s land and physical resources. Under the NaLUa, prime agricultural lands shall be protected, thereby, ensuring the viability and sustainability of on-farm employment and rural development. The definition of prime agricultural lands in the NaLUa should represent a sogcially acceptable minimum agricultural land requirement that would maintain a certain level of agricultural industry in a given or spatial context at a given point in time.
Establishment of the Coconut Farmers and Industry Trust Fund
The creation of a Coconut Farmers and Industry Trust Fund aims to consolidate all assets and benefits emanating from the coconut levy and create a Fund to exclusively benefit coconut farmers and farmworkers. Formulation of measures to properly manage, utilize and oversee the use of Coco Levy fund is needed.
Strengthening of the Philippine Crop Insurance Corporation (PCIC)
The proposed bill aims to reorganize the state-owned corporation and increase its authorized capitalization from PHP2 Billion to PHP10 Billion. This will allow the PCIC as the implementing agency of the government’s agricultural insurance program, to increase its’ absorptive capacity so that it can extend insurance coverage to large number of small farmers and fisherfolks that are interested to go into food production by providing enough safeguards and protection from losses due to natural disasters, pests and diseases endemic to crops, mortality of livestock caused by accidents or diseases, and destruction of non-crop agricultural assets due to acts of God including damages to aqua-culture/fisheries.
Magna Carta for Young Farmers This measure aims to promote and protect the rights of young farmers between the ages of 15 and 35 years old, establish programs for young farmers, and institutionalize young farmers’ representation in the agricultural decision-making and policy-making processes. This would address the declining interest of the youth on agriculture and fisheries.
Strengthening the Agricultural and Rural Financing System in the Philippines
The bill aims for an overhaul of the Agri-Agra Reform Credit Act of 2009 (R.A. No. 10000) by providing for a holistic approach that takes into account the broader agriculture financing ecosystem and rural community development requirements. The RA No. 10000 mandates banks to allot at least 10 percent of total loanable funds for agrarian reform beneficiaries and 15 percent for farmers and fisherfolk. Amendments to this law will allow banks to merge their loan allocation to the farm sector as a measure to improve their compliance rates.

82 | Regional Development Plan 2017-2022

Chapter 9 Expanding Economic Opportunities in Industry and Services | 83

84 | Regional Development Plan 2017-2022

Chapter 9 Expanding Economic Opportunities in Industry and Services | 85
Chapter 9
Expanding Economic Opportunities in Industry and ServicesThis Chapter assesses the performance of the industry and services sector, identifies key challenges that constrain the development of the sector and lays down strategies to address the challenges and achieve expanded economic opportunities in industry and services.
Assessment and ChallengesEconomic opportunities in industry and services (I&S) expandedGVA in industry increased
The industry sector remains the economic driver of CALABARZON, accounting for 62.3 percent of the Region’s economy. The industry’s output accelerated growth from 3.6 percent in 2016 to 7.9 percent in 2018 exceeding the high target of 7 percent with a GVA of PHP901.44 Billion. Industry output was driven largely by the sustained performance of the manufacturing sub-sector which grew from 3.7 percent in 2016 to 8.0 percent in 2018. The fast growth rate registered by the construction sub-sector also contributed to the overall output of the industry sector.
Manufacturing GVA as a proportion of GRDP increased
Manufacturing GVA in 2018 stood at PHP842.44 billion, an increase of PHP 116.373 billion from 2016’s PHP 726.07 billion GVA. Manufacturing accounts for 4.1 percentage points of the 7.3 percent growth of the CALABARZON economy.
Manufacturing is mainly driven by the electronics industry making the Region the “Silicon Valley of the Philippines” with big-name locators such as Panasonic, Matsushita, Samsung, TDK-Fujitsu, Toshiba, Mitsui, Philips, Hitachi, Sanyo-Epson, NEC, Music, Temic, Uniden, I-Max, Lite-On, and Clarion.
Also present in the Region are food, beverage, and tobacco, machinery (including electrical machinery), metal and non-metallic, chemical and pharmaceuticals, textile, and automotive sub-industries. The Region is also the home of automotive assemblers in the country such as Ford, Honda, Isuzu, Mitsubishi, Nissan, and Toyota, which are mostly located in the province of Laguna. Thus, Laguna is dubbed as the automotive capital or “the Detroit of the Philippines.”
Steel Asia located a major steel manufacturing operation in Lemery, Batangas, has solidified the position of Batangas as a major industrial hub complementing its role as the petrochemical center of the country. Steel and petrochemicals are among the most important indicators of heavy industrialization.

86 | Regional Development Plan 2017-2022
Table 9.1 Industry and Services Target and Actual Growth Rates, CALABARZON, 2016-2018
BASELINE(2016)
2017 2018
TARGET ACTUAL TARGET ACTUAL
GVA in Industry 3.7 5.0-7.0 7.8 5.2-7.0 7.9
GVA in Services 7.2 6.0-7.6 6.0 6.1-7.7 7.1
Manufacturing GVA as a proportion of GRDP
53.2 increasing 53.5 increasing 53.9
Source: PSA Region IV-A
Table 9.2 Gross Regional Domestic Product in the Industry Sector, CALABARZON, 2016-2018
SECTOROUTPUT (‘000)
BASELINE (2016) 2017 2018
Industry 836,700,049 901,436,149 973,201,658
Mining and Quarrying 2,648,823 2,676,401 2,769,495
Manufacturing 726,067,511 779,303,425 842,437,003
Construction 62,483,768 72,408,093 79,148,432
Electricity, Gas and Water Supply 45,499,947 47,048,230 48,846,728
Growth Rate (%)
Industry 3.6 7.8 7.9
Mining and Quarrying -1.8 1.0 3.5
Manufacturing 3.7 7.4 8.0
Construction 1.0 15.6 9.5
Electricity, Gas and Water Supply 6.7 3.4 3.9Source: PSA Region IV-A
The construction subsector significantly increased from 2016 to 2017 due to residential construction and vast public infrastructure projects like the Cavite-Laguna Expressway and SLEX Toll Road 4. Likewise, mining and quarrying, and electricity, gas and water supply were able to expand from 2016 onwards.
GVA in services is within the target
The industry sector remains the economic The services sector slowed down from 7.2 percent growth in 2016 to 6 percent in 2017 then rebounded to 7.1 percent in 2018 but still within the target.
The services sector accounts for 32.9 percent of the Gross Regional Domestic Product (GRDP) in 2018 slightly decreasing its share from 33.2 percent in 2016. The slight decrease may be attributed to the increase in share of the Industry Sector.
Despite the 0.2 percent decline in growth rate, real estate, renting and business activities sub-sector contributed 9.0 percent share to the GRDP and 27.0 percent of the services sector output.
Manufacturing employment as a proportion of total employment slightly decreased
Manufacturing is the major source of employment in the industry sector at 60 percent and accounts for 16.6 percent in 2018 of the Regional employment.
Employment generated from industry increased
The industry sector employs 27.5 percent of the total employed in the Region. The employment in industry recorded an increase of 63,000 from 2016 to 2018, due

Chapter 9 Expanding Economic Opportunities in Industry and Services | 87
Table 9.3 Gross Regional Domestic Product in the Services Sector, CALABARZON, 2016-2018.
SECTOROUTPUT (‘000)
BASELINE (2016) 2017 2018
Service 453,413,752 480,528,716 5 14,644,480
Transport, Storage & Communication 91,486,723 94,911,531 99,214,592
Trade and Repair of Motor Vehicles, Motorcycles, Personal & Household Goods
103,733,090 107,904,495 1 14,113,623
Financial Intermediation 52,572,153 56,479,741 61,439,169
Real Estate, Renting & Business Activities 121,736,010 130,126,008 1 37,959,712
Public Administration & Defense, Compulsory Social Security
16,447,111 17,918,810 20,688,545
Other Services 67,438,665 73,188,130 81,228,839
Growth Rate (%)
Service 7.3 6.0 7.1
Transport, Storage & Communication 6.6 3.7 4.5
Trade and Repair of Motor Vehicles, Motorcycles, Personal & Household Goods
6.1 4.0 5.8
Financial Intermediation 8.4 7.4 8.8
Real Estate, Renting & Business Activities 7.2 6.9 6.0
Public Administration & Defense, Compulsory Social Security
7.4 8.9 15.5
Other Services 9.3 8.5 11.0Source: PSA Region IV-A
to steady increase in employment generated by new locators in the various industrial parks/economic zone and infrastructure logistics. Employment generation and facilitation initiatives by government and the academe also contributed to increased employment.
There are more male workers employed in industry, most of which are in manufacturing and construction subsectors. Women on
the other hand are also employed mostly in manufacturing.
Employment generated from services increased
The services sector employed 63.6 percent of the total employed in 2018 making it the largest source of employment in the the Region. Employment in the services sector had an upward trend.
Table 9.4 Employment Generated in the Industry Sector, CALABARZON, 2016-20182016 2017 2018
NO. (IN ‘000) % NO. (IN
‘000) % NO. (IN ‘000) %
Industry 1,564 1,514 1,626
Mining and Quarrying 6 0.36 12 0.77 6 0.36
Manufacturing 955 61.09 928 61.30 982 60.36
Electricity, gas, steam and airconditioning supply
17 1.09 17 1.15 24 1.45
Water supply, sewerage, waste management and remediation activities
6 0.36 17 1.15 12 0.73
Construction 580 37.09 539 35.63 603 37.09 Note: Numbers may not sum to total because of roundingSource: PSA Region IV-A
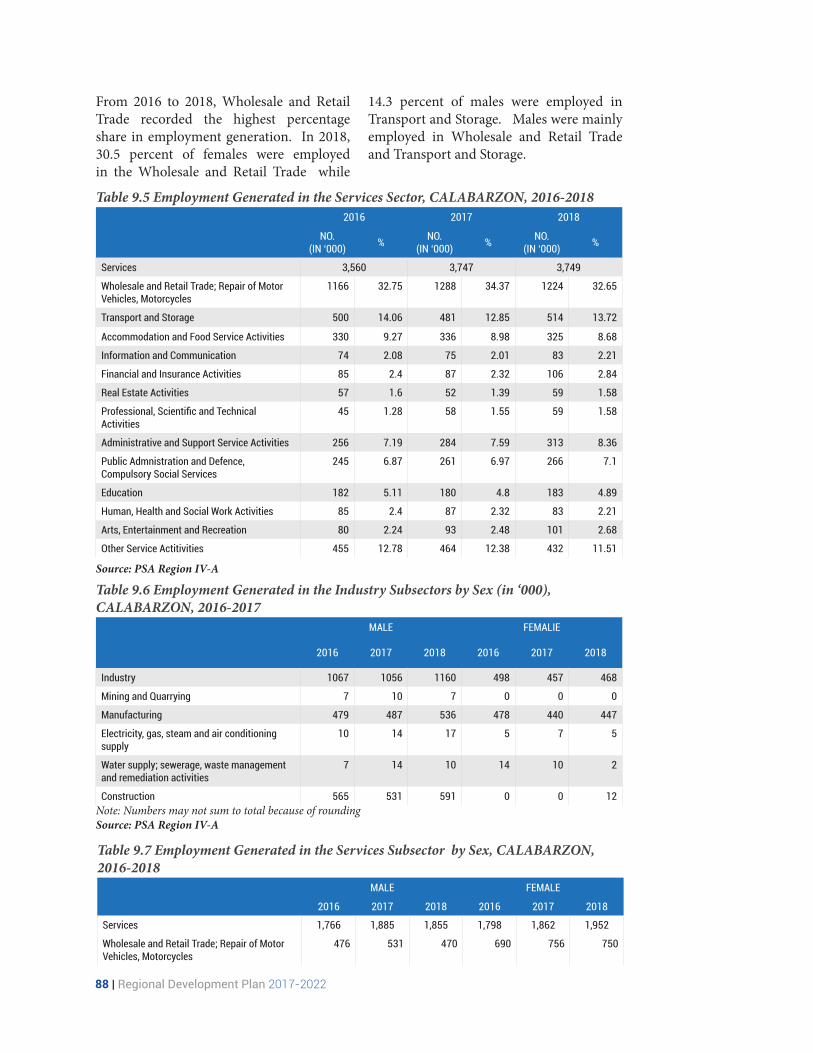
88 | Regional Development Plan 2017-2022
From 2016 to 2018, Wholesale and Retail Trade recorded the highest percentage share in employment generation. In 2018, 30.5 percent of females were employed in the Wholesale and Retail Trade while
14.3 percent of males were employed in Transport and Storage. Males were mainly employed in Wholesale and Retail Trade and Transport and Storage.
Table 9.5 Employment Generated in the Services Sector, CALABARZON, 2016-20182016 2017 2018
NO. (IN ‘000) % NO.
(IN ‘000) % NO. (IN ‘000) %
Services 3,560 3,747 3,749
Wholesale and Retail Trade; Repair of Motor Vehicles, Motorcycles
1166 32.75 1288 34.37 1224 32.65
Transport and Storage 500 14.06 481 12.85 514 13.72
Accommodation and Food Service Activities 330 9.27 336 8.98 325 8.68
Information and Communication 74 2.08 75 2.01 83 2.21
Financial and Insurance Activities 85 2.4 87 2.32 106 2.84
Real Estate Activities 57 1.6 52 1.39 59 1.58
Professional, Scientific and Technical Activities
45 1.28 58 1.55 59 1.58
Administrative and Support Service Activities 256 7.19 284 7.59 313 8.36
Public Admnistration and Defence, Compulsory Social Services
245 6.87 261 6.97 266 7.1
Education 182 5.11 180 4.8 183 4.89
Human, Health and Social Work Activities 85 2.4 87 2.32 83 2.21
Arts, Entertainment and Recreation 80 2.24 93 2.48 101 2.68
Other Service Actitivities 455 12.78 464 12.38 432 11.51
Source: PSA Region IV-A
Table 9.6 Employment Generated in the Industry Subsectors by Sex (in ‘000), CALABARZON, 2016-2017
MALE FEMALIE
2016 2017 2018 2016 2017 2018
Industry 1067 1056 1160 498 457 468
Mining and Quarrying 7 10 7 0 0 0
Manufacturing 479 487 536 478 440 447
Electricity, gas, steam and air conditioning supply
10 14 17 5 7 5
Water supply; sewerage, waste management and remediation activities
7 14 10 14 10 2
Construction 565 531 591 0 0 12 Note: Numbers may not sum to total because of roundingSource: PSA Region IV-A
Table 9.7 Employment Generated in the Services Subsector by Sex, CALABARZON, 2016-2018
MALE FEMALE
2016 2017 2018 2016 2017 2018
Services 1,766 1,885 1,855 1,798 1,862 1,952
Wholesale and Retail Trade; Repair of Motor Vehicles, Motorcycles
476 531 470 690 756 750

Chapter 9 Expanding Economic Opportunities in Industry and Services | 89
Local and foreign investments increasedEconomic zones significantly provide employment and growth in the Region. A total of 55 economic zones were located in CALABARZON (Figure 9.1). Among these, 35 are Manufacturing Special Economic Zones (MSEZ), 9 are IT Centers, 6 are IT Parks, 1 is a Medical Tourism Park (MTP), 2 are Tourism Economic Zones (TEZ) and 2 are Agro-Industrial Economic Zones (AIEZ). Laguna province has 19 economic zones which is the highest among the provinces. Majority of MSEZ are located in Laguna, Cavite and Batangas.
Despite a possible slowdown in the global economy because of the uncertainties resulting from the trade war between the US and China and the possibility of a No-Deal Brexit, investments are expected to continue pouring into the CALABARZON because of major infrastructure development such as road and railway networks, ports, bridges, and other infrastructures.
Many investments being planned particularly in Batangas, such as the biggest poultry project of Jollibee in partnership
with Cargill, an international commodities conglomerate, are focused on the domestic market which is expected to continue to grow at over 6 percent annually. Cargill Joy Poultry Meats Production, Inc. (C-Joy) is programmed to produce 45 million dressed and marinated chickens per year and will generate some 1,000 new jobs.
The establishment of SteelAsia’s manufacturing facility in Barangay Malabanban Sur, Candelaria, Quezon will play a significant role in the development of Quezon province as this will provide jobs and economic opportunities. SteelAsia will be putting up the first and the best modern wire-rod manufacturing facility in the country.
Total approved investments decreased
The Region’s total approved investments continued to decline in 2018 achieving only 58.97 percent or PhP43.25 billion of the PhP73.34 billion target. The PhP36.31 decline in approved investment may be attributed to the investors’ attitude towards the policy direction of the current administration, particularly the impending
MALE FEMALE
2016 2017 2018 2016 2017 2018
Transport and Storage 479 464 494 22 19 22
Accommodation and Food Service Activities 148 166 149 183 172 179
Information and Communication 46 51 55 26 24 29
Financial and Insurance Activities 36 34 45 50 53 61
Real Estate Activities 26 24 28 34 27 34
Professional, Scientific and Technical Activities
20 30 28 26 27 34
Administrative and Support Service Activities 164 183 187 94 104 128
Public Admnistration and Defence, Compulsory Social Services
141 149 145 103 111 120
Education 46 51 55 132 128 177
Human, Health and Social Work Activities 30 30 31 55 60 54
Arts, Entertainment and Recreation 46 54 59 36 36 44
Other Service Actitivities 108 118 111 346 345 317 Note: Numbers may not sum to total because of roundingSource: PSA Region IV-A

90 | Regional Development Plan 2017-2022
Figure 9.1 CALABARZON Economic Zones
passage of the TRAIN 2 or Trabaho Bill. Package 2 of the TRAIN Law. The repeal of exemption from national and local taxes of establishments operating within the Ecozone may have prompted existing investors to withhold their expansion plans while incoming investors hold their investments in abeyance. The decrease in local and foreign investment is also associated with the more competitive investment packages in other countries like Cambodia, Vietnam, and China, which are making them more attractive to foreign investors. Given this circumstance, the government’s outlook towards TRAIN LAW Package 2, and the investors’ attitude towards the government’s policy direction, it is expected for local and foreign investments in the Region to further decline in the coming years if the business climate remains at status quo.
If no new ecozone will be established and if pending expansion proposals in the pipeline remain dormant, a declining trend will be expected, which may eventually affect production.
Despite the decrease in approved local and foreign investment in the Region, Philippine Economic Zone Authority (PEZA) data showed an increase in approved investment in the province of Cavite which tripled the approved investment from PhP4.17 billion in 2017 to PhP16.55 billion in 2018 while the province of Rizal had 37.18 percsent increase in approved investment from PhP0.95 billion in 2017 to PhP1.3 billion in 2018. The increase may be attributed to the opening of new zones and expansion by existing investors. Meanwhile, significant decreases in approved investment were observed in Quezon, Laguna, and Batangas with 100, 57.34, and 49.06 percent decrease, respectively. The decrease, according to PEZA, may be attributed to the fact that investments may have almost, if not, already peaked in the existing ecozones especially in Batangas and Laguna. If no new ecozone will be established and if pending expansion proposals in the pipeline remain dormant, a declining trend will be expected.
Industrial park/economic zones increased their direct employment by 5.17 percent
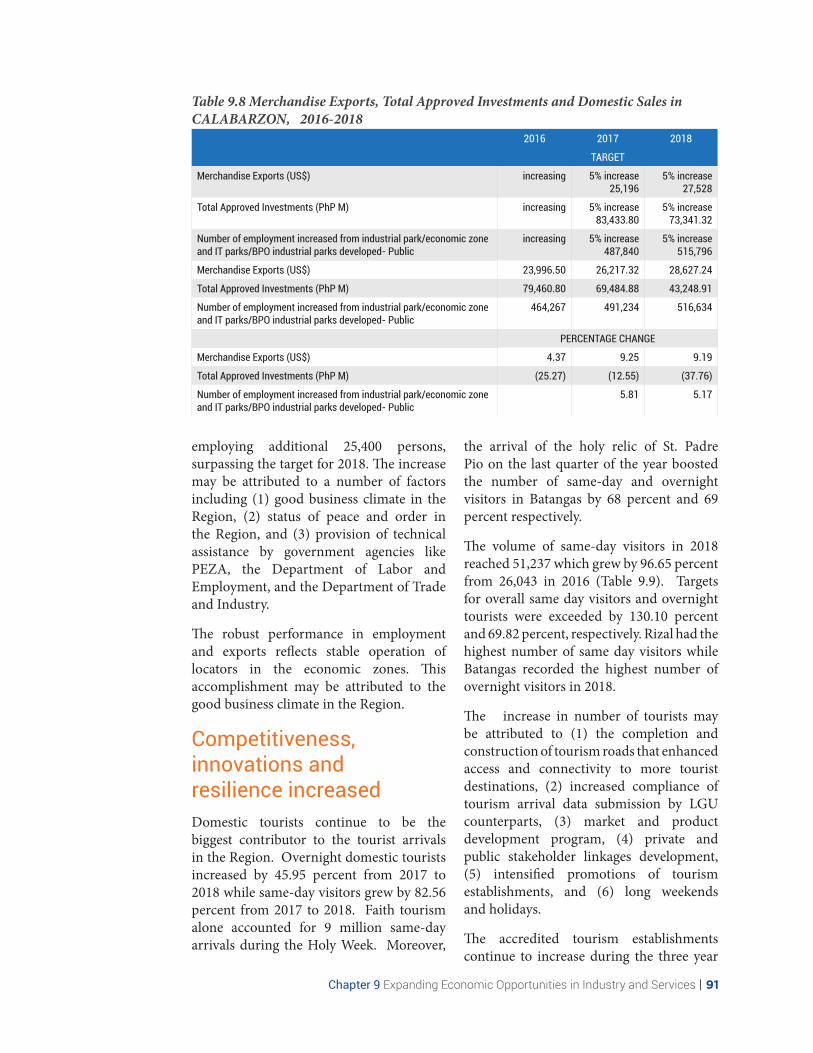
Chapter 9 Expanding Economic Opportunities in Industry and Services | 91
Table 9.8 Merchandise Exports, Total Approved Investments and Domestic Sales in CALABARZON, 2016-2018
2016 2017 2018
TARGET
Merchandise Exports (US$) increasing 5% increase 25,196
5% increase 27,528
Total Approved Investments (PhP M) increasing 5% increase 83,433.80
5% increase 73,341.32
Number of employment increased from industrial park/economic zone and IT parks/BPO industrial parks developed- Public
increasing 5% increase 487,840
5% increase 515,796
Merchandise Exports (US$) 23,996.50 26,217.32 28,627.24
Total Approved Investments (PhP M) 79,460.80 69,484.88 43,248.91
Number of employment increased from industrial park/economic zone and IT parks/BPO industrial parks developed- Public
464,267 491,234 516,634
PERCENTAGE CHANGE
Merchandise Exports (US$) 4.37 9.25 9.19
Total Approved Investments (PhP M) (25.27) (12.55) (37.76)
Number of employment increased from industrial park/economic zone and IT parks/BPO industrial parks developed- Public
5.81 5.17
employing additional 25,400 persons, surpassing the target for 2018. The increase may be attributed to a number of factors including (1) good business climate in the Region, (2) status of peace and order in the Region, and (3) provision of technical assistance by government agencies like PEZA, the Department of Labor and Employment, and the Department of Trade and Industry.
The robust performance in employment and exports reflects stable operation of locators in the economic zones. This accomplishment may be attributed to the good business climate in the Region.
Competitiveness, innovations and resilience increasedDomestic tourists continue to be the biggest contributor to the tourist arrivals in the Region. Overnight domestic tourists increased by 45.95 percent from 2017 to 2018 while same-day visitors grew by 82.56 percent from 2017 to 2018. Faith tourism alone accounted for 9 million same-day arrivals during the Holy Week. Moreover,
the arrival of the holy relic of St. Padre Pio on the last quarter of the year boosted the number of same-day and overnight visitors in Batangas by 68 percent and 69 percent respectively.
The volume of same-day visitors in 2018 reached 51,237 which grew by 96.65 percent from 26,043 in 2016 (Table 9.9). Targets for overall same day visitors and overnight tourists were exceeded by 130.10 percent and 69.82 percent, respectively. Rizal had the highest number of same day visitors while Batangas recorded the highest number of overnight visitors in 2018.
The increase in number of tourists may be attributed to (1) the completion and construction of tourism roads that enhanced access and connectivity to more tourist destinations, (2) increased compliance of tourism arrival data submission by LGU counterparts, (3) market and product development program, (4) private and public stakeholder linkages development, (5) intensified promotions of tourism establishments, and (6) long weekends and holidays.
The accredited tourism establishments continue to increase during the three year

92 | Regional Development Plan 2017-2022
period. (Table 9.9). Growth was propelled by policy initiative1 and aggressive campaign of the government in coordination with LGUs, to extend the accreditation validity period for travel and tour agencies and star-rated accommodation enterprises (Hotel and resorts).
The number of DOT accredited establishments also exceeded the target for 2017 and 2018, with corresponding increase
1 Memorandum Circular No 2015-06 and 2016-03 was implemented to extend the accreditation validity period from 1 year to 2 years
in the number of rooms during the same period. The positive performance was due to massive implementation of RA 9593 or Tourism Act 2009. The law requires all primary tourism establishments to secure DOT accreditation before applying for mayor’s permit.
The targeted number of employees employed by DOT accredited establishments was achieved and posted an increased of 1.68 percent from 2016 to 2017 due to increase of part-time employees.
Table 9.9 Target and Actual Tourism Data, CALABARZON, 2016-2019 BASELINE
(2016)2017 2018
TARGET ACTUAL TARGET ACTUAL
Same day visitors ('000) 26,043 22,048 26,815 22,268 51,237
Number of overnight visitors increased (‘000)
5,095 4,380 5,131 4,410 7,489
Number of accredited tourism establishments
227 211 288 221 309
Number of rooms from DOT accredited accommodation establishments
3,847 3,300 3,502 3,350 4,496
Number of employees employed by DOT accredited establishments
5,934 5,000 7,033 5,100 7,151
Source:DOT Region IV-A
Market access improvedExports increased
The amount of exports increased by US$4.6 Billion from 2016 to 2018 and exceeded the target. The increase in export sales was driven by ecozone establishments meeting their respective targets.
Consumer access to safe & quality goods & services ensured
The targeted level of consumer awareness and satisfaction of quality goods and services in 2018 was achieved. The number of consumer awareness and advocacy initiatives undertaken increased by 22.5 percent from 200 in 2017 to 245 in 2018 due to the collaboration with radio and local television stations, involvement of schools in consumer advocacy program
and interagency collaboration among SUCs and DepEd. The percentage of consumer complaints resolved reached 92 percent or an increase of 15 percent from 2016 to 2017 but slightly declined to 91 percent in 2018. However, overall accomplishment still exceeded the 85 percent target. This is attributed to the establishment of consumer welfare desks in major supermarkets and groceries. In addition, the number of firms/customers provided with testing and calibration services also increased from 1,011 in 2016 to 4,943 in 2018, more than the targeted 5 percent increase. The increase was due to the maintenance of high customer satisfaction rating through delivery of services within the agreed timeframe, maintenance of laboratory personnel proficiency certification for accuracy of test samples, and the maintenance of the ISO 17025 accreditation of the testing and calibration laboratories.

Chapter 9 Expanding Economic Opportunities in Industry and Services | 93
Access to production networks improvedThe establishment of Negosyo Centers in all provinces, cities, and municipalities aims to promote ease of doing business and facilitate access to services such as business registration assistance, business advisory services, business information and advocacy, and monitoring, evaluation and recommendation of business-process improvement for MSMEs.
There are 36 Negosyo Centers established and 72 centers maintained in 2018.
Access to finance improvedThe number of credit cooperatives catering to micro-financing needs of MSMEs grew by 94.4 percent, increasing from 18 in 2016 to 35 in 2018. The positive performance was attributed to the following: a) mass media exposure including the social media; b) National Government Agency (NGA) and LGU assistance to cooperatives; c) Cooperative Development Authority (CDA) partnership with other NGAs like DAR, DTI, DA, and NCIP, among others; d) fora on cooperatives in all provinces; d) duly registered cooperatives which do not transact any business with non-members or the general public are not subject to any taxes and fees imposed under the internal revenue laws and other tax laws (Art. 60, RA 9520); and e) the Transport Modernization Program.
Productivity, efficiency and resiliency improvedNumber of barangay micro business entrerprises registered increased from 2,126 in 2017 to 2,656 in 2018 (BMBE Law). However, the number of small-enterprise technology upgrading program (SETUP) beneficiaries decreased from 61 in 2017 to 54 in 2018 because of budget insufficiency to support the financing assistance to approved projects under the Program. The increase in market price value of technological equipment needed for S&T intervention has driven the cost of the projects beyond the required financing assistance.
ChallengesThe following are the challenges obtaining in the industry sector:
• readiness of capacities to seize opportunities in the supply chain due to the ASEAN integration including free trade agreements with Korea and China
• impact of the TRAIN 2 law on rationalizing the incentive scheme for corporations
• weak link of MSMEs as suppliers of inputs to multi-national and big establishments that dominate the manufacturing subsector
• limited responsiveness and relevance of current education curricula to labor market demands and industry requirements
• volatility in foreign exchange rates and financial markets that continue to pose a challenge to export-oriented industries
Table 9.10 Number of Negosyo Centers Established per Province per Year, 2015-2018
PROVINCENO. OF NEGOSYO CENTERS ESTABLISHED
TOTAL2015 2016 2017 2018
Batangas 3 3 9 10 25
Cavite 2 7 6 9 24
Laguna 3 4 8 7 22
Quezon 2 3 6 10 21
Rizal 2 6 8 0 16
TOTAL 12 23 37 36 108
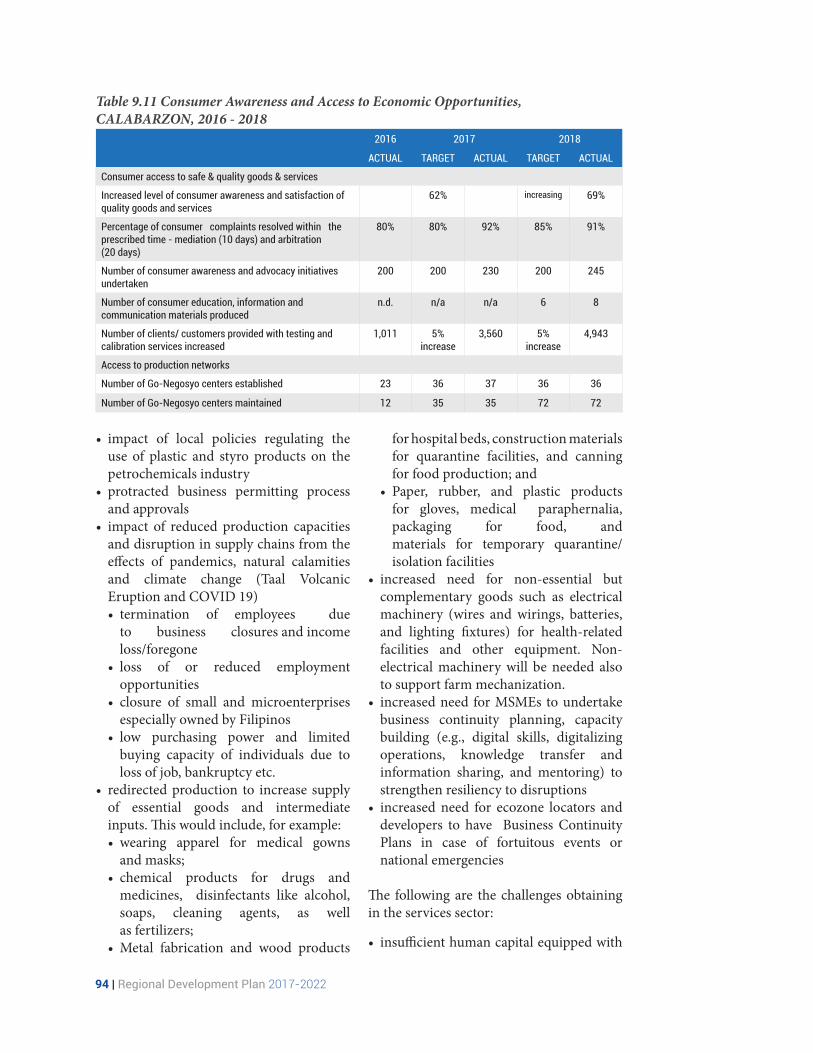
94 | Regional Development Plan 2017-2022
Table 9.11 Consumer Awareness and Access to Economic Opportunities, CALABARZON, 2016 - 2018
2016 2017 2018
ACTUAL TARGET ACTUAL TARGET ACTUAL
Consumer access to safe & quality goods & services
Increased level of consumer awareness and satisfaction of quality goods and services
62% increasing 69%
Percentage of consumer complaints resolved within the prescribed time - mediation (10 days) and arbitration (20 days)
80% 80% 92% 85% 91%
Number of consumer awareness and advocacy initiatives undertaken
200 200 230 200 245
Number of consumer education, information and communication materials produced
n.d. n/a n/a 6 8
Number of clients/ customers provided with testing and calibration services increased
1,011 5% increase
3,560 5% increase
4,943
Access to production networks
Number of Go-Negosyo centers established 23 36 37 36 36
Number of Go-Negosyo centers maintained 12 35 35 72 72
• impact of local policies regulating the use of plastic and styro products on the petrochemicals industry
• protracted business permitting process and approvals
• impact of reduced production capacities and disruption in supply chains from the effects of pandemics, natural calamities and climate change (Taal Volcanic Eruption and COVID 19)• termination of employees due
to business closures and income loss/foregone
• loss of or reduced employment opportunities
• closure of small and microenterprises especially owned by Filipinos
• low purchasing power and limited buying capacity of individuals due to loss of job, bankruptcy etc.
• redirected production to increase supply of essential goods and intermediate inputs. This would include, for example:• wearing apparel for medical gowns
and masks;• chemical products for drugs and
medicines, disinfectants like alcohol, soaps, cleaning agents, as well as fertilizers;
• Metal fabrication and wood products
for hospital beds, construction materials for quarantine facilities, and canning for food production; and
• Paper, rubber, and plastic products for gloves, medical paraphernalia, packaging for food, and materials for temporary quarantine/ isolation facilities
• increased need for non-essential but complementary goods such as electrical machinery (wires and wirings, batteries, and lighting fixtures) for health-related facilities and other equipment. Non-electrical machinery will be needed also to support farm mechanization.
• increased need for MSMEs to undertake business continuity planning, capacity building (e.g., digital skills, digitalizing operations, knowledge transfer and information sharing, and mentoring) to strengthen resiliency to disruptions
• increased need for ecozone locators and developers to have Business Continuity Plans in case of fortuitous events or national emergencies
The following are the challenges obtaining in the services sector:
• insufficient human capital equipped with
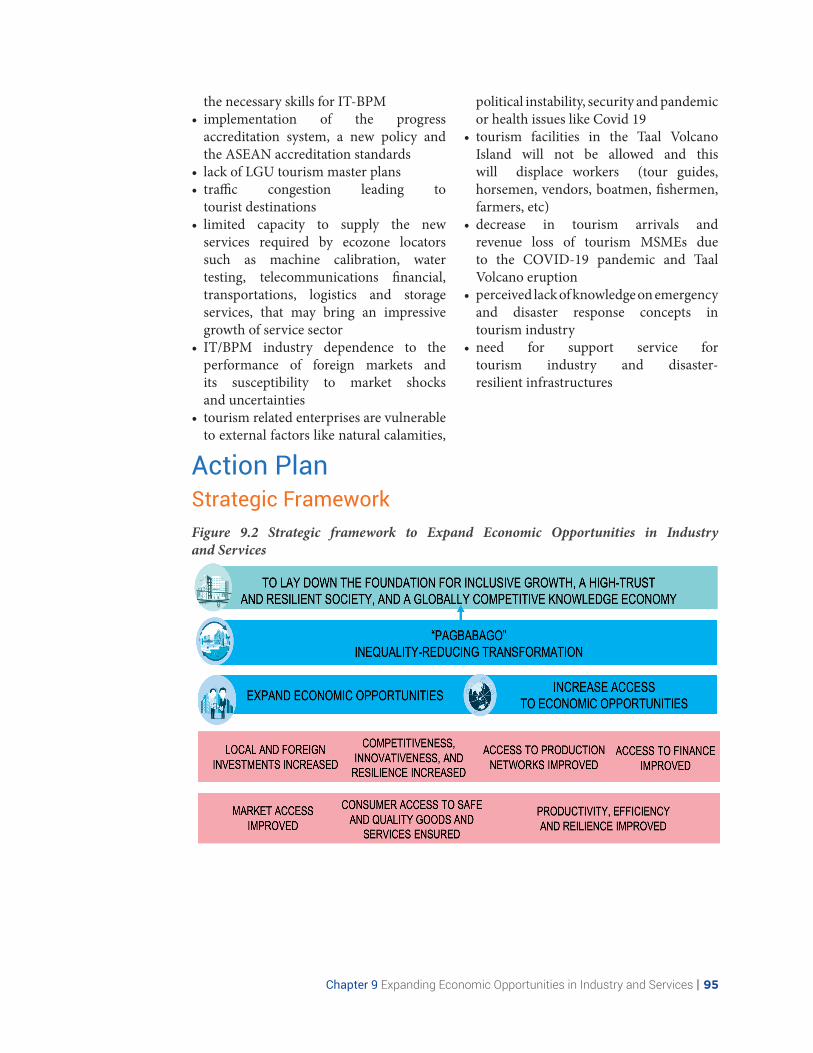
Chapter 9 Expanding Economic Opportunities in Industry and Services | 95
the necessary skills for IT-BPM• implementation of the progress
accreditation system, a new policy and the ASEAN accreditation standards
• lack of LGU tourism master plans• traffic congestion leading to
tourist destinations• limited capacity to supply the new
services required by ecozone locators such as machine calibration, water testing, telecommunications financial, transportations, logistics and storage services, that may bring an impressive growth of service sector
• IT/BPM industry dependence to the performance of foreign markets and its susceptibility to market shocks and uncertainties
• tourism related enterprises are vulnerable to external factors like natural calamities,
political instability, security and pandemic or health issues like Covid 19
• tourism facilities in the Taal Volcano Island will not be allowed and this will displace workers (tour guides, horsemen, vendors, boatmen, fishermen, farmers, etc)
• decrease in tourism arrivals and revenue loss of tourism MSMEs due to the COVID-19 pandemic and Taal Volcano eruption
• perceived lack of knowledge on emergency and disaster response concepts in tourism industry
• need for support service for tourism industry and disaster- resilient infrastructures
Action PlanStrategic FrameworkFigure 9.2 Strategic framework to Expand Economic Opportunities in Industry and Services

96 | Regional Development Plan 2017-2022
Table 9.12 Plan Targets to Expand Economic Opportunities in Industry and Services
INDICATORSBASELINE END OF PLAN TARGET RESPONSIBLE
AGENCY2016 2020 2021 2022
Economic Opportunities in I&S Expanded
Gross Value Added (GVA) in industry increased 3.70% 5.6-7.1 5.8-7.1 6.0-7.2 DTI, PSA
GVA in services increased 7.20% 6.3-7.8 6.4-7.9 6.5-8.0 PSA
Manufacturing GVA as a proportion of GRDP increased
53.20% Increasing Increasing Increasing PSA
Employment generated from industry increased ('000)
1,565 Increasing Increasing Increasing PSA
Male 1,067 Increasing Increasing Increasing PSA
Female 498 Increasing and comprised at
least 40%
Increasing and comprised at
least 40%
Increasing and comprised at
least 40%
PSA
GVA growth rate in the services sector improved (%)
7.3 Increasing Increasing Increasing DTI
Growth in Labor Productivity of Farmers and Fisherfolks (in percent, real terms)
16.8 Increasing Increasing Increasing PSA
Tourism GVA as proportion of GDP increased (%)
n.d. Increasing Increasing Increasing DOT
Manufacturing employment as a proportion of total employment
16.8 Increasing Increasing Increasing PSA
Employment generated from services increased ('000)
3,569 Increasing Increasing Increasing PSA
Tourism employment as a proportion to total employment (%)
n.d. n.d. DOT
Sub-sector Outcome 1.1
Total approved investments increased (PhP M) 79,460.80 5% increase
5% increase
5% increase
PEZA, DTI-BOI. PSA
Number of employment increased from industrial park/economic zone and IT parks/BPO industrial parks developed- Public
464.27 5% increase
5% increase
5% increase
PEZA
Sub-sector Outcome 1.2
Number of same day visitors increased (‘ 000) 26,043 22,716 22,943 23,172 DOT, LGUs
Number of overnight visitors increased (‘000) 5,095 4,470 4,500 4530 DOT, LGUs
Number of accredited tourism establishments 227 244 256 269 DOT, LGUs
Number of rooms from DOT accredited accommodation establishments
3847 3,450 3,500 TBD DOT, LGUs
Number of employees employed by DOT accredited establishments
5,934 5,300 5,400 5,500 DOT, LGUs
Sub-sector Outcome 1.3
Exports increased (US$ M) 23,996.50 5% increase
5% increase
5% increase
PEZA
Sub-sector Outcome 1.4
Increased level of consumer awareness and satisfaction of quality goods and services
- Increasing Increasing TBD DTI
Percentage of consumer complaints resolved within the prescribed time - mediation (10 days) and arbitration (20 days)
80% 96% TBD TBD DTI
Targets

Chapter 9 Expanding Economic Opportunities in Industry and Services | 97
INDICATORSBASELINE END OF PLAN TARGET RESPONSIBLE
AGENCY2016 2020 2021 2022
Number of consumer awareness and advocacy initiatives undertaken
200 200 TBD TBD DTI
Number of consumer education, information and communication materials produced
n.d. 6 TBD TBD DTI
Number of clients/ customers provided with testing and calibration services increased
1,011 5% increase
5% increase
5% increase
DOST
Access to Economic Opportunities in I&S for MSMEs, Cooperatives and OFs increased
Proportion of small-scale industries to total industries
n.d. Increasing Increasing TBD DTI
Sub-sector Outcome 2.1
Number of MSMEs participating in global value chains
n.d. Increasing Increasing TBD DTI
Number of MSMEs/Cooperatives integrated into corporate value chains increased
n.d. Increasing Increasing TBD DTI
Number of Go-Negosyocenters established 23 20 TBD TBD DTI-BSMED
Number of Go-Negosyocenters maintained 12 108 128 128
Sub-sector Outcome 2.2
Proportion of small-scale industries (enterprises) with a loan or line of credit increased
Increasing Increasing TBD DTI-BSMED
Total number of credit cooperatives 18 18 19 19 CDA
Sub-sector Outcome 2.3
Number of barangay micro business enterprises registered increased
n.d. Increasing Increasing TBD DTI, DOLE
Number of shared facilities established 152 Increasing Increasing TBD DTI
Number of small-enterprise technology upgrading program beneficiaries increased
n.d. 5% increase
5% increase
5% increase
DOST
Percentage of BMBE Certificates issued within the prescribed time
N/A DTI
a. BMBE certificates issued within the prescribed time
N/A DTI
b.BMBE certifacation application received N/A DTI
Strategies
Expanded economic opportunities in industry and services
Local and foreign investments increased
• Strengthen promotional activities locally and abroad and encourage reinforcement of linkages and partnership between private and government sector to sustain increase in local and foreign investment
• Pursue aggressive promotion and marketing programs to attract more
foreign direct investments especially those that would bring in new technologies.
• Fully implement the ease of doing business required by law. Streamline agency process as well as standardize requirements form business registration and permit issuances across agencies and various government units.
• Continue investment promotion activities. Promotion investment activities will be intensified that will attract more investments. This will involve Regional trade fairs, localization of roadmaps on priority industries and fora with industry players.

98 | Regional Development Plan 2017-2022
• Continuously promote the entry of new and foreign direct investments in the Region. Orchestrate the convergent efforts and active participation of the RDC, provinces, municipalities and cities in investment promotion.
• Accelerate the expansion and development of economic zones. Priority focus on identified Municipalities in Quezon Province as viable areas for economic zone development. This areas include Mauban, Infanta, Real, Atimonan, Tiaong and Pagbilao per Republic Act No. 8748 also known as the Special Economic Zone Act
• Support endogenization of local economic zones. The establishment of feasible domestic economic zones for MSMEs will be encouraged in capable or competitive local governments through similar incentive systems in traditional PEZA managed economic zones. The domestic economic zones will be integrated with existing economic and Freeport zone activities to improve MSME productivity and strengthen industry backward and forward linkages.
• Review laws, such as, the Republic Act No. 7916 or The Special Economic Zone Act of 1995 that give incentives and advantage to enterprises located in special economic zones given the declining export production, changing global market, and weak link of MSMEs to multi-national and big companies.
• Implement the Comprehensive National Industry Strategy. This will upgrade industries such as manufacturing and services while strengthening backward and forward linkages with domestic and global value chains including MSMEs.
• Sustain the gains in tourism. This will include activities such as market and product development, tourism standards and regulation services, conversion of same-day tourists to overnight tourists, development of other potential tourism sites and tourism circuits in preparation for the increasing foreign tourists and
creation of stronger partnership with the private and public sector. This will also include expansion of the tourism industry to promote development in rural and remote areas with limited economic activities.
• Implement the National Tourism Development Plan 2017-2022. Once approved, the Region will contribute in implementing the plan particularly in improving tourism products and competitiveness in identified tourism development areas in the Region, underscoring convergence of public and private initiatives for inclusive tourism development.
• Improve capacities on Information Technology and Business Processing Management (IT-BPM). Capacity of LGUs, investors, stakeholders and institutions will be enhanced to provide more enabling environment for IT-BPM industry.
Competitiveness, innovativeness and resilience of industries increased
• Enhance enabling environment. An enabling environment is important to sustain and enhance growth of industries in the Region. In order to attain this, a more predictable and responsive policy environment will be promoted and inter-institutional coordination for policy-making and implementation will be strengthened.• Strengthen private sector linkage to
promote tourism through B2B, capacity building and benchmarking activities
• Participation to local and international sales mission, travel fairs
• Media invitation to support Region’s festivals and events spearheaded by LGU or initiated by the private sector
• Intensification of industry skills training to enhance the standard of service provision
• Sustain increase in manufacturing sub-sector through a) capacity building

Chapter 9 Expanding Economic Opportunities in Industry and Services | 99
of farmers/locality for value-adding products; b) provision of machineries and equipment; c) support MSMEs & start-ups to enhance their innovation capabilities; d) review sustainability of One Town One Product (OTOP); and e) create enabling environment for Science and Technology & Innovation investments
• Strict monitoring of compliance to the ARTA, EODB, & BOSS to attract more investments by global and high- value firms.
• Strengthen academe-industry linkages to respond to existing employment demand in the community and to build an innovation and entrepreneurship ecosystem. This will involve developing culture of entrepreneurship among the youth and encourage industries to initiate development of training programs tailored-fit to specific industry skills needed and submit to Technical Education and Skills Development Authority (TESDA) for approval and certification and upgrading of teaching skills to address job- skills mismatch.
• Enhance Research Capabilities of schools/SUCs to provide environment for innovation.
• Spur an entrepreneurial revolution and encourage the formalization and growth of MSMEs through the full implementation of the Go Negosyo Law, MSME Development Plan, and the APEC 2015 Action Agenda to Globalize MSMEs.
• Enhance the country’s competitiveness and address cross-cutting issues that impede the country’s competitiveness
• Encourage businesses to reconfigure/change their product offerings to include essentials. The manufacturing sector will be encouraged to redirect and repurpose their production to increase supply for essential goods and intermediate inputs. Essential goods would include medical PPEs, chemical products for drugs and medicines, disinfectants, cleaning agents, fertilizers, construction materials, food
packaging and other supplies for health-related facilities and activities
• Strengthen the resiliency of the MSMEs. Build the MSME’s resiliency through capacity building in the formulation and implementation of business continuity plans. Trainings will be conducted through web-based interactive seminars or Webinars while mass gatherings are not yet allowed.
• Require PEZA to develop a generic business continuity plan which would be applicable to all zones.
• Rebuild business and consumer confidence due to business closures, job and income loss
Market access improved
• Improve and develop infrastructure facilities (e.g. logistics, transport, broadband connections, power supply) to promote efficient flow of goods and services.
• Fast track the communication programs and projects of Department of Information and Communications Technology (DICT) that will foster connectivity and improve public access to the Internet.
• Establish food tracer. Ascertaining the point of origin of raw inputs such as farm origin will be established and indicated in label of products.
• Invest in R&D and open innovation platform. Aside from the development of new products, more job opportunities will be created to help the local communities.
• Provide timely, accurate, and inexpensive market matching available for MSMEs
• Strengthen value and supply chain linkages to ensure a high level of business performance. Increase in value of the product or service to impress customers and keep investors.
• Link MSMEs to supply needs of government service. Support services to MSMEs will be provided in marketing and transporting of their merchandise

100 | Regional Development Plan 2017-2022
needed to supply government programs for relief distribution, supply of protective personal equipment (PPEs), and feeding program, among others.
• Expand e-commerce and use of Information Communication Technology. Online business transactions will be encouraged to support physical distancing. The government has to fastrack the implementation of ICT programs to ensure fast and reliable internet service for online marketing and telecommuting. Investments on ICT will be encouraged to meet the surge for online transactions, digital platforms and products to provide connectivity with customers and increase sales
• Formulate tourism activities and support to strengthen marketing and promotion of tourism attractions and destinations including packaged tours to domestic market through digital marketing (social media), content marketing, participation in travel and trade fairs and exhibits, familiarization tours, among others
• Strengthen marketing and promotion of tourism attractions and destinations, including packaged tours to domestic market
Consumer access to safe and quality of goods and services ensured
• Promote consumer welfare. This will be done through strict enforcement of regulations and standards to protect consumers against unfair practices such as profiteering and substandard products and increase awareness on consumer rights
• Promote linkages and partnerships. Partnerships with private sector and professional associations will be pursued to strengthen consumer protection mechanisms
• Strict regulation & monitoring of foreign workers & companies
• Strengthen marketing and promotion of tourism attractions and destinations,
including packaged tours to domestic market
• Rehabilitate or reconstruct the damaged roads and restore the use of Taal Circumferential Road as tourism road leading to tourist destination, if still feasible
• Strict implementation on inspection and monitoring of compliance of establishments on safety measures and other requirements
• Reiterate proposed tourism infrastructure projects of LGUs under the DOT-DPWH Convergence Program and consider disaster-resilient infrastructures as part of the planning process to conform to laws on urban planning and building code
Access to economic opportunities increased
Access to production networks improved
• Promote CALABARZON Industry clustering. Broaden implementation of the industry clustering strategy to improve MSMEs’ access to resources and industry markets.
• Support the economic independence of PWDs. The transition to work program of PWDs and Executive Order 417 will be strictly implemented
• Implement mandatory service obligation for government scholars to address the out-migration of locally-developed skills (e.g. foreign language experts as local interpreter, welders and other hospitality-skilled workers)
• Coordinate with employers’ association such as Employers Confederation of the Philippines (ECOP) for possible wage employment opportunities based on assessed skills
• Establish profile database of affected individuals, HHs, tourism stakeholders (tour guides), registered boatmen, farmers/fisher folks, MSMEs and business establishments

Chapter 9 Expanding Economic Opportunities in Industry and Services | 101
Access to finance improved
• Review financial regulations. Current relevant financial regulations will be reviewed to determine the viability of easing caps/limits on savings instruments for deployment to local and international investment opportunities matched with safeguard mechanisms.
• Implement policy adjustments. Relevant financial policies will be reviewed and implemented to provide ease of access to financial services and enable the marginalized sectors and MSMEs to participate in capital markets and expanding their businesses. In addition, program and projects such as the Credit Surety Fund Program will be promoted to increase credit worthiness of MSMEs.
• Enhance role of cooperatives. The roles of cooperatives as target of information and education campaigns will be enriched with inclusion of providing investment packages.
• Explore financing program for MSMEs. Alternative sources of funding to provide accessible, and fast business loans that are designed to help MSME owners to optimize their potential and achieve major growth.
• Provide easier access to business financing and financial services. Soft loans or grants should be provided to MSMEs to restore their livelihood and businesses. Loans may provide zero or lower interest rates, longer term credit programs and with minimal documentary requirements. Partner financial institutions will be encouraged to provide loan moratorium programs to borrowers.
• Prioritize financial support MSMEs especially that have been impacted or closed shop during the ECQ
• Recommend funding institutions to assist MSMEs through any conditional cash assistance program and/or other loan grants available and temporarily waive accreditation fees for tourism enterprises affected by fortuitous events and national emergencies
Productivity, efficiency and resilience improved
• Raise quality of products. Better product quality at par with foreign products. MSMEs will be further developed through shared service facility, SME roving academy, Negosyo Centers of the DTI and SETUP of the DOST
• Improve backbone services. Financial, telecommunication, transport and logistics will be improved to facilitate the movement of knowledge products, technologies, goods and services, and to link MSMEs in domestic and global markets.
• Promote a more inclusive business environment. Capability seminars and trainings for business and tourist establishment personnel on DRR for Persons with disabilities (PWDs) will be conducted and required before issuance of accreditation/business permit. A legislative agenda requiring bus companies to have accessible door lift for PWDs and senior citizen will be pursued.
• provide necessary inputs/raw materials on identified livelihood projects to start-ups for displaced residents and MSMEs affected by the eruption of Taal Volcano
• Institutionalize flexible work patterns and arrangements:• Work offsite • Work from home • 4-day work week • Telework practices
• Provide financial/amelioration package to displaced low-income workers/ wage earners
• Provide fiscal and monetary measures that help protect jobs, sustain the self-employed and support companies’ liquidity and operations and accelerate recovery in the future
• Include specific disaster preparedness modules on capacity building trainings for tourism frontliners and enterprises
• Allow flexibility on policies flexibilities in times of fortuitous events or national emergencies:

102 | Regional Development Plan 2017-2022
Major Programs and Projects• Market and Product Development• Construction of Tourist
Information Center• Establishment and Maintenance of
Negosyo Centers• Shared Service Facility Program• Kapatid Mentor Me Project• OTOP Next Generation• SME Roving Academy (SMERA)• Collaborative R&D Program
for the Academe, Industry and Government Institutions
• Assistance Program for the Environmental Protection Through Energy Efficiency and Environmental Management System and Use of Renewable/Alternative Energy
• Regional Program for Health, Nutrition and Food Safety
• Promotion of S & T Innovations and Entrepreneurship
• Program for Establishment of Food Innovation Center and Food Production Facilities
• Disaster Resiliency Program for MSMEs and business establishments
• DOST-SETUP• Improve and enhance road passability
• IEC materials on the impact of the bill on jobs & investments
• Complete removal of obstructions in national roads (utility post & trees)
• Provision/Improvement of street lights and signages
• Repair and construction of access roads. It involve repair and concreting of existing local roads leading to tourist destinations while waiting for RROW acquisition
• Establishment of feasible domestic economic zones for MSMEs
• Livelihood Starter Kits through the Pangkabuhayan sa PagBangon at Ginhawa (PBG) for MSMEs. Through the project, the displaced employees at tourism sites and self-employed retailers serving tourists as well as the small and vulnerable entrepreneurs who were affected by pandemics and natural calamities
• ICT innovations supported by DOST to strengthen ICT facilities, systems and infrastructure to cope up with the requirements of the new normal. Mobile training laboratories equipped with computers & internet connectivity
• Clinical testing of VCO for COVID-19 (the beneficial effects of VCO among
• Consider extension of the time for lodging goods and waiver storage fees when movement of goods are affected by fortuitous events
• Exercise LGUs autonomy to help enterprises cope with the emergency and/or take initiatives that will help ensure continuous supply of essential goods in the market. The definitive steps may be identified in consultation with the relevant stakeholders that may include business continuity planning in the aftermath of the crisis
• Automate government procedures to minimize changes in doing business or ensure continuous operation even if there are fortuitous events
• Amend Chapter 7 Sec. 34 (D3) of National Internal Revenue Code (NIRC) to provide net loss carry over to all businesses affected by a national emergency and not just those that are starting a business
• Implement tax breaks or postponement of tax payments for SMEs affected by ECQ as they employ a large percentage of the workforce, to keep increasing liquidity
• Waive/subsidize bank interest for loans to help companies affected by national emergencies to reestablish cash flow as operations slowly come back to normal
• Assistance to ecozone workers as per government guidelines

Chapter 9 Expanding Economic Opportunities in Industry and Services | 103
suspect and probable cases of COVID-19. • Training and technical assistance for
business continuity planning through ladderized program and capacity building for cooperatives, management advisory services, livelihood on the Go and business development training.
• Webinars/trainings on business continuity, supply chain management, and intellectual property
• Conduct inventory for possible scale-up on existing DOST-approved manufacturing technologies to prolong food shelf-life, applied science researches on possible alternative materials for PPEs, & utilize SSF & RIICs for MSME manufacturers
• Registry of firms who will participate in the manufacture of essential goods
• Trainings through flexible & blended training arrangements (web based, interactive websites) such as DTI Markprof in YouTube and ASEAN SME Online Academy
• DTI Pondo sa Pagbabago at Pag-asenso (P3), ERF-Enterprise Rehabilitation Financing and SB CARES Covid19 Assistance to Restart Enterprises
• Enterprise Development Assistance for Calamity Affected MSMEs
• DTI PBG • Enterprise Development Assistance at
Grassroots Level prioritizing vulnerable communities affected by health disasters LSP- NSB Livelihood Seeding Program -Negosyo Serbisyo sa Barangay
• Alternative Mode For Consumer Access such as online marketing products, mobile palengke/market/drugstore on wheels should be launched.
• Organize/strengthen tourism/cultural councils and associations
• Development of tourism crisis plan and management strategies
• Inspection of tourism enterprises, site disinfection, provision of equipment, distribution of campaign posters
• Ordinance on extension of business permit and accreditation validity of
tourism enterprises• Skills retooling programs - flexible
and bleded training arrangements for displaced/affected workers
• Scale-up manufacturing technologies for extended food shelf-life
• Science-based alternative materials for PPEs and utilize SSF and RIICs for MSME

104 | Regional Development Plan 2017-2022

Chapter 10 Accelerating Human Capital Development | 105

106 | Regional Development Plan 2017-2022

Chapter 10 Accelerating Human Capital Development | 107
Chapter 10
Accelerating Human Capital Development This Chapter discusses assessment of implementing the Regional plan in the areas of health and nutrition, education and labour. It also presents the gaps and challenges need to be addressed and the opportunities that can be harnessed towards developing human capital and contribute to reducing inequality.
Assessment and ChallengesIn the past three years, CALABARZON has been consistent in providing quality education, health and nutrition, and employment opportunities and services to its populace. The Regional Development Council has also been actively engaging its partners and stakeholders in providing these development initiatives. With the implementation of several laws and policies such as Universal Access to Tertiary Education, First 1000 Days, Universal Health Care Act, and Zero Unmet Needs for Family Planning, enabling mechanisms were well placed to ensure the provision of quality social services. However, more interventions are still needed to be implemented to achieve the Region’s goals in terms of increasing human development potential.
Health and nutritionImproving nutrition situation. Nutrition data from 2013 and 2015 indicated an increasing prevalence of stunting, wasting, and overweight among children under 5. However, the Region fared better than other Regions. Insufficient child nutrition particularly during the first 1000 days of life, as well as lack of family planning, inadequate mother and infant care to address feeding peculiarities, and high prevalence of teenage pregnancy are factors
contributing to malnutrition in the Region. While CALABARZON was able to decrease over-nutrition, much has yet to be done to reduce proliferation of empty calorie food, having more physical activity of children and adults and getting out of the sedentary lifestyle.
The proportion of households with per capita intake below 100 percent dietary energy requirement also decreased from 29.3 percent in 2015 to 26.3 percent in 2019. This is the result of convergence of efforts of both government and private sector in the Region.
The limited capacity of some LGUs in the implementation of health and nutrition programs, absence of Local Nutrition Committee and Population Committee, and limited budget for nutrition programs are among challenges faced by the Region’s health and nutrition.
Improving mortality rates despite not achieving the target for health man power to population ratio. Maternal, infant, neonatal, and under-five mortality rates decreased and exceeded the target for 2019. Maternal mortality rate was significantly reduced from 68 per 100,000 live births in 2016 to only 30 in the first semester of 2019. The decrease was mainly attributed to the improved

108 | Regional Development Plan 2017-2022
service delivery networks with the inclusion of private sectors and the increased number of health facilities accredited by PhilHealth to provide maternity care packages. Further, infant mortality rate continued to decline from 10 percent in 2016 to 8.3 percent during the first semester of 2019. The same was observed for under-five mortality rate, decreasing from 14 percent in 2016 to 13.3 percent in 2019. Meanwhile, there was no recorded neonatal death during the first half of 2019. The accomplishment was brought by the continuous strong advocacy on child health programs.
The proportion of births attended by skilled health personnel and delivered in health facilities also continued to increase and further contributed to the reduced mortality rates. This was the result of upgraded infrastructures of health facilities and birthing homes and deployment of more skilled professionals in the communities, providing for easy implementation and monitoring of health programs in the local government units.
Despite the declining mortality rates, health manpower to population ratio of doctors, nurses, and midwives is still below the target standard ratio. The ratio for doctors to population ratio in 2018 was 1:21,846, an improvement from the 1:56,052 ratio in 2016, but still not within the standard 1:20,000 ratio. Likewise, nurse to population ratio worsen from 1:20,206 in 2016 to 1:21,846 in 2018 and midwife to population ratio further increased from 1:8042 in 2016 to 1:9,541 in 2018. Declining number of manpower was the major reason for unmet targets on health manpower to population ratio due to professionals opting to work abroad and low enrollees for health courses such as midwifery.
The adverse impact of limited health manpower was greatly felt during the latest COVID-19 pandemic where the Department of Health (DOH) resorted
to hiring more health personnel such as doctors, nurses, and medical technicians to attend to the increasing number of infected patients. The pandemic also prompted the government to deploy new medical graduates to provide assistance in fighting against the virus. In addition, one of the most vulnerable group during the pandemic was the medical front liners because they cannot avoid direct contact with the infected patients and some health care personnel ended up contracting the virus.
Moreover, the percentage of one year old fully immunized children declined from 61 percent in 2016 to 31 percent in 2019. The recent Dengvaxia scare was a major factor in the failure to immunize children.
Increasing prevalence rate for modern contraceptive and decreasing proportion of women with unmet need for family planning. The proportion of women aged 15 to 49 years old with unmet need for family planning decreased from 17.8 percent in 2013 to 12 percent in the first semester of 2019. Likewise, use of modern family planning methods significantly increased from 25 percent in 2016 to 47.5 percent in 2018. The strengthened implementation of Executive Order 12 s. 2017 and the implementation of Responsible Parenthood and Reproductive Health Law, brought the improvement in the adoption of modern contraceptives.
The proportion of adolescents, 15-19 years old, who have already begun childbearing also decreased from 8.1 percent in 2013 to 7.6 percent in 2019. The classes on Responsible Parenthood and Family Planning and outreach missions on providing modern contraceptives and information dissemination on Adolescent Health and Youth Development Program may have contributed to this positive outcome.
No new incidence of malaria and decreasing number of tuberculosis incidence while number of diagnosed new HIV cases

Chapter 10 Accelerating Human Capital Development | 109
continued to rise. The Region continued to be malaria-free due to the sustained efforts on elimination and control of malaria, particularly in Laguna, Rizal, and Quezon. The number of tuberculosis cases continued to decline, however, it increased in 2018 to 345 due to multi-drug resistance.
New HIV infections increased from 1,290 cases in 2016 to 1,871 cases in 2018 particularly on men having sex with men. There is a need to expand programs on reproductive health by also considering education on safe sex among the male population.
Population covered by health insurance program maintained. The Region already met its target of 100 percent coverage of health insurance program in 2016 but decreased to 85 percent in 2017. However, health insurance coverage returned to 100 percent in 2018.
Currently, the Region is undergoing socio-economic crisis because of the COVID-19 outbreak where around 11 percent of the confirmed cases came from CALABARZON. The provinces in the Region were also among the areas that are projected to have 90 percent probability of disease outbreak. The recent coronavirus causing COVID-19 disease is among the family of viruses that cause respiratory infections which can lead to serious illnesses and death.
Earlier this year, selected LGUs in CALABARZON also suffered from the eruption of Taal Volcano which posed two major health risks: a) exposure to communicable and infectious disease due to sharing of spaces, bathrooms, and kitchen facilities among the internally displaced population (IDPs); and b) exposure to ashfall which can lead to cardiovascular diseases. Moreover, the eruption also caused traumatic experiences among the families, IDPs, and responders from the local government units.
Basic, higher and technical education Basic education
Net enrolment and completion rate improved. Net enrolment rate in all levels improved from SY 2016-2017 to SY 2018-2019, except in kindergarten which declined in SY 2018-2019. Increased net enrolment rate may be attributed to setting of early registration schedules, school-based feeding program and the voucher program for senior high school. It can also be attributed to the increase in the number of elementary and secondary schools in the Region. Annual Regional targets were attained in the same period. In terms of gender disparity, there was minimal difference in the male and female enrolees for all levels. More male enrolees were observed in kinder, elementary and junior high school while more female enrolees in senior high school.
Similarly, completion rate in elementary and junior high school improved from SY 2016-2017 to SY 2017-2018 and annual Regional targets were achieved. The reorganization of the Regional Committee on Education for All to a Regional Committee on Quality Education for All which monitored the implementation of the K to 12 program may have contributed to the attainment of the Regional targets.
Higher cohort survival rate observed. The Region’s cohort survival rates in elementary level and junior high school were among the highest in the country for SY 2017-2018 at 99 and 91.4 percent, respectively. Cohort survival rates of female students in both elementary and secondary levels were higher at 100 and 94.64 percent, respectively, compared to male students at 98.32 and 88.57 percent. The Pantawid Pamilyang Pilipino Progrram contributed to this outcome as the condition is for children to be in school.

110 | Regional Development Plan 2017-2022
Table 10.1 Net Enrolment and Completion Rate, CALABARZON, 2016-2019BASELINE
(2016)2017 2018 2019
TARGET ACTUAL TARGET ACTUAL TARGET ACTUAL
Net enrolment rate increased (%)
Kinder 82.77 85.64 85.50 88.51 80.45 91.38 Not yet available
Elementary 81.00 84.17 96.31 87.43 97.36 90.51 Not yet available
Junior HS 60.89 66.58 82.51 72.27 86.38 77.96 Not yet available
Senior HS - - 53.90 - 58.33 TBD Not yet available
Completion rate increased (%)
Elementary 95.53 95.41 98.40 95.73 Not yet available
96.05 Not yet available
Junior HS 86.53 88.27 90.72 90.01 Not yet available
91.75 Not yet available
Senior HS - - 98.40 - Not yet available
TBD Not yet available
Source:DepEd Region IV-A
Alternative Learning System (ALS) Intensified. ALS enrolment in 2017 to 2018 increased by about 29.89 percent. Higher male enrolees were also recorded in 2017 and 2019 at 56 and 57 percent, respectively. Increased promotion of the alternative learning system particularly at the rural areas had spurred interest in ALS.
Addressing the demand on K to 12 education inputs remain a challenge. To ensure smooth implementation and attainment of the objectives of the K to 12 program, mechanisms were developed to meet the increased demand in basic education requirements. The convergence program of DepEd and DPWH aims to provide enough school buildings and classrooms for basic education learners including junior and senior high schools. Even though classroom to pupil ratio had improved from 2017 to 2018, classroom to pupil ratio for junior and senior high school was 1:62 which was still behind the standard ratio of 1:40 despite implementation of class shifts. In addition, ICT facilities for education should also be enhanced to provide numerous options in the delivery of the classes and be at par with the other countries. (See Chapter 19)
School days reduced due to class suspensions. The eruption of Taal Volcano in January 2020 suspended school classes in the Region for a number of days but for a longer period in Batangas Province because most of its public schools were used as temporary evacuation centers.
The declaration of ECQ for Luzon due to COVID-19 suspended classes in public and private schools to curb the spread of the virus. In some areas, public schools were also identified as one of the isolation areas of local government units.
These increasing number of class suspensions affected the school calendar days which resulted to make-up classes and/or squeezing the lessons in a shorter period in order for students to acquire the minimum requirement to complete a grade level. The shortened periods reduced the physical contact of teachers to learners which is essential to effectively deliver the lessons.
Higher education and technical and vocational education and training
Faculty-Student Ratio improved. Regional faculty-student ratio in SY 2018-2019 was

Chapter 10 Accelerating Human Capital Development | 111
1:21 with a ratio of 1:28 for SUCs and 1:19 for private HEIs. This was an improvement from a ratio of 1:33 and 1:20 in SY 2016-2017, respectively. Notably, private HEIs have better faculty to student ratio compared to SUCs. Significant proportion of tertiary students went to SUCs due to free tertiary education. The Region ranked 2nd in the country with the most number of tertiary education institutions with its 338 colleges and universities.
Increasing faculty staff competence continued. About half of the faculty in the tertiary education have a post graduate degree. In line with the national goal of improving the competence of our country’s professors and instructors, faculty members of colleges and universities in the Region continue to seek further studies. For SY 2018-2019, 48 percent of professors and instructors in SUCs have a post graduate degree while 52 percent in private higher education institutions (HEIs) have a post graduate degree.
Certification rate of Technical and Vocational Education and Training (TVET) graduates continue to increase. The certification rate of TVET graduates increased from 88.40 percent in 2016 to 92 percent in 2018. Hence, annual Regional and provincial targets in 2017 and 2018 were achieved. Further, similar performance was observed in all provinces. The increase in
certification rate may be attributed to the improvement in the quality and provision of TVET programs.
Challenges encountered in UniFAST implementation. The passage of the Universal Access to Quality Tertiary Education Act increased accessibility of tertiary learners into state universities and colleges, and public technical-vocational institutions. Increased access was made more possible with the continuous implementation of UniFAST. However, challenges were encountered in the implementation of the Tertiary Education Subsidy (TES). There were reports on discrepancies of the beneficiaries of Listahanan vis-à-vis TES with some students included in the Listahan of DSWD were not included in the list of beneficiaries of TES while those not included in the former were able to access TES.
Labor policies
Improved employment situation observed. Continuous expansion of the industry and services sector contributed to the increasing employment rate in the Region. While employment target in 2016 was not attained, the rate of employment increased from 2016 to 2018. Likewise, unemployment and underemployment rate declined from 2016 to 2018 exceeding the annual targets (See Chapter 15).
Table 10.2 Employment, Unemployment, and Underemployment Rates, CALABARZON, 2016-2018
2016 2017 2018
TARGET ACTUAL TARGET ACTUAL TARGET ACTUAL
Employment (%) 93.9-94.1 92.8 91-93 93.0 91-93 93.3
Unemployment (%) 8.6-9.4 7.2 7-9 7.0 7-9 6.7
Underemployment (%) <17.5 15.5 17.5 14.0 17.0 13.1Source: 2019 RSET, PSA Labor Force Survey
Opportunities brought by international and internal migration highly recognized. Recognizing the magnitude of international and internal migration in the Region, implementation of migration and
development (M&D) initiatives were intensified. Mainstreaming of M&D in planning, programs and projects of the government including the local government units is continuously promoted. The

112 | Regional Development Plan 2017-2022
Action PlanStrategic FrameworkThe Regional Development Plan 2017-2022 aims to reduce inequalities in human development outcomes through:
a) improved nutrition and health for all; b) ensured lifelong learning opportunities for all; and c) increased income-earning ability of Filipinos.
Figure 10.1 Strategic Framework to Accelerate Human Capital Development
development of One-Stop Migration Resource Center (OSMRC) in each province ensured that opportunities are properly harnessed and the migration costs were reduced. The convergence efforts of concerned government agencies and the local governments also ensures the protection of the rights of international labor migrants.
Job facilitation services intensified. Beneficiaries of job facilitation such as the Special Program for Employment of
Students (SPES), Government Internship Program (GIP), Jobstart Philippine Program and Employment Facilitation Track increased from 2016 to 2018. This expansion can be attributed to the strengthened partnership of local government units with the industries. Higher number of individuals were also reached by the labor market from 2016 to 2018. One of the challenges encountered, however, was the limited budget for these job facilitation programs.

Chapter 10 Accelerating Human Capital Development | 113
Table 10.3 Plan Targets to Accelerate Human Capital Development
INDICATORSBASELINE END OF PLAN TARGET RESPONSIBLE
AGENCYYEAR VALUE 2020 2021 2022
Nutrition and health for all improved
Life expectancy at birth DOH
Male 2010 69.48 Increasing Increasing 75
Female 2013 75.62 Increasing Increasing 82
Total fertility rate decreased 2013 2.7 2.5 2.5 2.5 DOH, POPCOM
Care at all life stages increased
Maternal mortality ratio (per 100,000 live births) decreased
2016 68 70 70 70 DOH
Infant mortality rate (per 1,000 live births) decreased
2016 10 15 15 15 DOH
Neonatal mortality rate (per 1,000 live births) decreased
2016 7 10 10 10 DOH
Under five mortality rate (per 1,000 live births) decreased
2016 14 22 22 22 DOH
Percentage of 1 year old children fully immunized increased
2016 61% 95% 95% 95% DOH
Premature mortality attributed to cardiovascular disease, cancer, diabetes and chronic respiratory diseased decreased
n.d. DOH
Malaria prevalence (per 100,000 population) decreased
2016 0 0 0 0 DOH
Tuberculosis incidence per 100,000 population decreased
2016 322 322 322 322 DOH
Number of new HIV infections (newly diagnosed cases/year) decreased
2016 1,290 Decreasing Decreasing Decreasing DOH
Health manpower to population ratio within the standard (nurses)
2016 1:20,2016 1:20,000 1:20,000 1:20,000 DOH
Health manpower to population ratio within the standard (midwife)
2016 1:8,042 1:500 1:5000 1:5000 DOH
Prevalence of underweight and severely underweight preschool children (0-71 months) decreased (%)
2016 19 15 14 13 NNC
Prevalence of stunting among children under 5 decreased (%)
2015 27.7 23.7 22.7 21.7 NNC
Prevalence of wasting among children under 5 decreased (%)
n.d. Decreasing Decreasing Decreasing NNC
Prevalence of overweight among children under 5 decreased (%)
n.d. Decreasing Decreasing Decreasing NNC
Proportion of households meeting the 10% recommended energy intake increased
Proportion of HH with per capita intake below 100% dietary energy requirement decreased (10%)
2015 29.30% 25.3% 24.3% 23.3% NNC
Percentage of drug cases who completed treatment increased (%)
2017 270 TBD TBD TBD DOH
Reduced proportion of adolescents (15-19 years old) who have begun childbearing (%)
2013 8.1 7.4 7.2 Decreasing DOH/ POPCOM
Targets

114 | Regional Development Plan 2017-2022
INDICATORSBASELINE END OF PLAN TARGET RESPONSIBLE
AGENCYYEAR VALUE 2020 2021 2022
Access through functional service delivery networks ensured
Proportion of births attended by skilled health personnel increased
2016 91% 96% 99% 99% DOH
Proportion of births delivered in health facilities increased
2016 88% 91% 91% 91% DOH
Proportion of women of reproductive age (15-49 years old) with unmet need for modern family planning decreased
2013 17.80% 10% 8% 6% DOH/POPCOM
Modern contraceptive prevalence rate for modern family planning increased (%)
2016 25 50 60 65 DOH/POPCOM
Health Financing Sustained
Regional Health Insurance Program coverage increased
2016 100% 100% 100% 100% PHIC
Lifelong Learning Opportunities for All
Mean years of schooling increased n.d. Increasing Increasing Increasing DepEd
Functional literacy increased 2013 95 Increasing Increasing 100 DepEd
Quality, accessible, relevant, and liberating basic education for all achieved
Net enrolment rate increased (%)
Kinder 2016 82.77 94.25 97.13 100 DepEd
Elementary 2016 81.00 93.68 96.85 100 DepEd
Junior High School 2016 60.89 83.65 89.34 95 DepEd
Senior High School - - TBD TBD TBD DepEd
Completion rate increased (%)
Elementary 2016 95.53 98.53 99.28 100 DepEd
Junior High School 2016 86.53 93.49 95.23 97 DepEd
Senior High School TBD TBD TBD DepEd
Proportion of junior high school students performing at moving towards mastery, closely approximating mastery and mastered increased (%)
Elementary n.d. Increasing Increasing Increasing DepEd
Junior High School n.d. Increasing Increasing Increasing DepEd
Senior High School n.d. TBD TBD TBD DepEd
Proportion of junior high school students at low mastery reduced
Junior High School n.d. Decreasing Decreasing Decreasing DepEd
Senior High School n.d. TBD TBD TBD DepEd
Elementary drop-out rate decreased (%)
2015 2.27 0.65 0.33 0 DepEd
Junior high school drop-out rate decreased (%)
2015 4.31 2.77 2.39 2 DepEd
Quality of higher education and technical education and research for equity and global competitiveness improved
Certification rate of TVET graduates increased
2016 88.40% 86% 87% 87% TESDA
Percentage of students in the Region awarded scholarships, grants, and other financial assistance increased (%)
2016 54% Increasing Increasing Increasing SUCs, HEIs, CHED
Percentage of tertiary graduates in the Region with degree in science, engineering, manufacturing and construction increased (%)
2016 33% Increasing Increasing Increasing SUCs, HEIs, CHED

Chapter 10 Accelerating Human Capital Development | 115
INDICATORSBASELINE END OF PLAN TARGET RESPONSIBLE
AGENCYYEAR VALUE 2020 2021 2022
Number of patents, licenses, and royalties issued to HEIs in the Region (cumulative) increased
2016 29 Increasing Increasing Increasing SUCs, HEIs
Number of researchers and scientists in the Region increased
2016 140 Increasing Increasing Increasing SUCs, HEIs, CHED
Number of curricula and programs in the Region developed/revised based on multi-disciplinal platforms that foster 21st century competencies increased (cumulative)
2016 91 Increasing Increasing Increasing SUCs, HEIs, CHED
Number of HEIs in the Region engaged in local and global partnerships and collaborations increased
2016 272 Increasing Increasing Increasing SUCs, HEIs
Number of innovation hubs established within HEIs in the Region increased
2016 2 Increasing Increasing Increasing SUCs, HEIs
Income earning ability increased
Beneficiaries of job facilitation and scholarships
Special Program for Employment of Students (SPES)
2016 13,221 TBD TBD TBD DOLE
Government Internship Program (GIP) 2016 938 TBD TBD TBD DOLE
Jobstart Philippine Program 2016 103 TBD TBD TBD DOLE
Private Education Student Financial Assistance (PESFA) Program
2016 1,081 1,562 1,640 1,722 TESDA
Training for Work Scholarship Program (TWSP)
2016 21,694 26,369 27,688 32,026 TESDA
Employment Facilitation (EF) Track 2017 13,709 TBD TBD TBD DSWD-SLP
Expanded Students' Grant-in-aid Program for Poverty Alleviation (ESGPPA)
2016 2,707 TBD TBD TBD SUCs, CHED
Scholarship program for dependent children of sugarcane industry
2016 11 TBD TBD TBD SUCs
Employability improved
Number of higher education graduates engaged in job collaboration increased (cumulative)
2016 1,012 TBD TBD TBD SUCs, HEIs
Labor force participation rate of women increased (%)
2016 52.20% TBD TBD TBD SUCs, HEIs
Number of female students enrolled in advanced education program increased (cumulative)
2016 1,877 TBD TBD TBD SUCs, HEIs
Jobseekers referred for placement through the Public Employment Service
2016 312,714 TBD TBD TBD PESO, DOLE
Individuals reached through the Labor Market Information
2016 529,490 TBD TBD TBD PESO, DOLE
Productivity improved
Labor productivity in industry sector (PhP)
2015 605,255 TBD TBD TBD DTI, DOLE
Labor productivity in services sector (PhP)
2015 137,091 TBD TBD TBD DTI, DOLE

116 | Regional Development Plan 2017-2022
StrategiesTo accelerate human capital development, the following strategies will be undertaken: a) improve the health and nutrition of everyone; b) ensure lifelong learning opportunities for all; and c) increase income earning ability. These strategies are aligned with the Philippine Development Plan 2017-2022 and the AmBisyon Natin 2040 towards Matatag, Maginhawa at Panatag na Buhay.
Nutrition and health for all improved
Care for all life stages guaranteed
Quality nutrition and health care at all life stages provided. The Region will focus its efforts on the improvement of nutrition and health of its citizenry through timely and quality nutrition and health care interventions for all life stages. Specifically, this will be achieved through: a) improvement in prenatal care, safe delivery and new born and infant care through provision of facilities for new born screening; b) full implementation of expanded breast feeding act or Republic Act 10028; c) implementation of the first 1000 days of life program; d) implementation of the RPRH Act; e) improve the interventions in addressing HIV/AIDs and sustain efforts on addressing TB, malaria and other emerging communicable diseases; f) strengthen interventions in addressing non-communicable diseases such as cancer, diabetes and heart diseases; g) address malnutrition in all its forms; and h) inclusion of health programs and projects in gender and development plans to address inequalities in nutrition and health.
Roll out NiEm Plan to LGUs. The National Nutrition Council formulated the Nutrition in Emergencies Plan which can be rolled out to the LGUs to ensure adequate nutrition among children and pregnant and lactating women during disasters.
Provision of safe and nutritious food during emergencies. The nutritional initial needs assessment (NINA) tool to assess the nutritional needs of vulnerable population can be utilized during disasters to determine appropriate nutrition interventions and needed supplies. Community kitchens can also be established in the evacuation centers to ensure that safe and nutritious food are provided during emergencies.
To further promote nutrition in emergencies, campaigns on infant and young child feeding in emergencies, use of micronutrient powder, ready to use therapeutic food, and ready to use supplementary food must be intensified. The implementation of EO 51 or Milk Code, particularly in receiving donations and reliefs must be strengthened
Improve health-seeking behavior targeting the most vulnerable. Most of the nutrition and health concerns in the Region resulted from the limitations in the health-seeking behavior of the population. The Region will intensify its IEC on the nutrition and health services available in the rural health units, local hospitals and private hospitals.
Proper education on HIV and sexually transmitted diseases will also be intensified to decrease infections, ensure proper guidance on the disease of affected persons, and to aid in removing any social stigma that are often associated with the disease.
Promote health care. In addition, appropriate IEC on avoiding communicable diseases such as COVID-19 must be strengthened, including basic healthcare practices such as proper and regular washing of hands, disinfection of surfaces, clothes, and other things, observance of coughing and sneezing etiquette, and proper disposal of tissues and other wastes.

Chapter 10 Accelerating Human Capital Development | 117
Access through functional Service Delivery Networks ensured
Ensure functional and efficient networks of health care providers. Forging of partnerships and convergence of initiatives with private sector and the academe in the delivery of health and nutrition services will help address health and nutrition concerns. The health sector needs to tap proactive private sectors, volunteers, and state universities and colleges in the Region in advocating for and delivery of nutrition and health services.
With the full implementation of the UHC, more health workers are expected to be deployed under the Deployment of Human Resources for Health (HRH) Program of the DOH. This will augment health man power and reach more communities are reached and provided the appropriate medical assistance.
Incentives may also be provided to encourage participation of volunteers as healthcare workers in the locality particularly as Barangay Health Workers, Barangay Nutrition Scholars, Barangay Population Volunteers, and Barangay Health Emergency Response Team. This will ensure the continuous and unhampered service delivery and advocacy for health and nutrition.
Among the challenges in the health sector is the increasing number of healthcare personnel opting to work in another country. To address this, medical professionals and graduates should be provided competitive compensation packages and opportunities for professional development such as scholarship and grants that can make them decide to stay in their current work and serve the country.
Upgrade and equip health facilities and improve human resources for health. With the increasing population (natural and in-
migration) resulting to high density status of the Region, there is a need to upgrade most health facilities including rural health units, local, provincial and Regional hospitals and private health providers. The upgrading of health facilities will also consider gender sensitive and mother-baby friendly facilities.
The current pandemic also calls for adequate healthcare equipment, facilities such as isolation and quarantine rooms, and other essentials such as testing kits and machines for early detection of EIDs. Moreover, health care system shall adopt and maximize the use of telemedicine and ICT services in disease surveillance, prevention, and control. Through remote diagnosis and treatment, more efficient and effective health care service can be provided.
Access to nutrition and health services will be expanded through increasing health manpower-to-population ratio, development of half-way health facilities especially for far flung areas and provision of support infrastructures like road networks and efficient transport systems. Redundant road networks and resilient facilities will be beneficial during calamities and disasters. Nutrition and health caravans will also be provided to rural areas and island municipalities to bring the services closer to the people. Information systems must also be in place.
Improve case handling during disasters and disease outbreaks. To ensure the readiness of the Region for future disease outbreaks, there is also a need to prioritize the protection and ensure the well-being of medical professionals by: a) providing adequate personal protective equipment; and b) support system such as ready access to basic needs (e.g. food, transportation, and security services).
The Region’s healthcare system should also be prepared for disasters and disease outbreaks by ensuring that healthcare

118 | Regional Development Plan 2017-2022
professionals from doctors down to barangay health workers are capacitated in handling such cases through providing proper skills training and capacity building. Capacity development may also include social welfare workers to ensure that they can provide the needed psychosocial support to the affected population.
Health financing sustained
Expand health insurance coverage and social protection. The Region will expand its initiatives in terms of health insurance coverage to maintain its 100 percent health insurance coverage. Available packages covered by the no balance billing (NBB) may be updated and upgraded to include more types of communicable diseases. Proper monitoring on the implementation of the NBB packages will also be employed to ensure that all target beneficiaries are reached and provided with the necessary assistance. PhilHealth may also tie up with other agencies to form more types of customized care packages targeting the most vulnerable groups.
Elicit multi-stakeholder support for health and nutrition. Development Partners may be tapped to provide additional funding to support health and nutrition services in the LGUs especially during disasters and public health emergencies. LGUs may partner with and mobilize the civil society organizations in their localities to provide necessary support in the creation of health and nutrition policies and implementation of programs and projects. The active participation of local development councils and other special organizations in the development planning of the LGUs should also be encouraged.
Lifelong learning opportunities for all ensured
Quality, accessible, relevant and liberating basic education for all
Enhance K to 12 curriculums. Assessment of the K to 12 program implementation to determine attainment of key targets and challenges encountered will be done. The assessment will serve as guide in enhancing the current modules of the K to 12 program to be responsive to the current situations and needs of the basic education sector.
Review of the work immersion guidelines will also be pursued to improve the learning experience of students while meeting the needs of the industries particularly in the advent of the fourth industrial revolution. Aside from the faculty and students, work immersion of senior high school coordinators will also be proposed. Artificial intelligence, internet of things, robotics and 3D printing are among the technologies seen to be dominant in the succeeding years. Skills of graduates should be in line with the requirement of the industries as they are expected to continuously innovate to ensure competitiveness and efficiency.
Support the formulation of a multi-modal and multi-strategy Learning Continuity Plan. Recognizing the severe impact of increasing incidence of disasters and emergence of public health emergencies in the conduct of school classes, there is a need to develop a Learning Continuity Plan that incorporates flexible and blended learning. The use of online and digital platforms to provide lessons whenever face-to-face classes are not possible should be adopted and expanded. The Continuity Pan should consider the status of internet connectivity in the Region and the resources needed by schools and students such as desktops, laptops or iPads.
Intensify career guidance and coaching. Career guidance and coaching is important

Chapter 10 Accelerating Human Capital Development | 119
to ensure that students will choose a track that is appropriate to their skills and interest. This will ensure that their potentials will be properly developed and will be harnessed given the changing needs of the labor market.
Enhance teacher competencies. Increasing competencies of elementary and secondary education teachers is essential to the attainment of quality education. Teachers with a wide-array of knowledge and skills tend to be more effective educators even in complex situations. Promoting further studies will be beneficial to be at par with the ASEAN and global standards. With the passage of the Philippine Qualification Framework, competitiveness of the education sector including the basic education is vital.
Further, with the plan of shifting into a blended learning, teachers’ capacities in using digital and online platforms to deliver their lessons should be enhanced. Capacity building activities should be provided to teachers to properly and effectively use these platforms.
Improve learning facilities. Improvement of the facilities for education both hard and soft infrastructures is necessary to contribute to the attainment of quality, accessible, relevant and liberating basic education for all. This includes expansion and enhancement of the current existing online platform of DepEd which is the DepEd Commons. Investment on developing a national e-learning platform in the basic education including tertiary education should be prioritized. Partnerships between education agencies and private sector can also be pursued to expand access to flexible learning modalities.
To reduce extended use of public schools as evacuation areas, evacuation centers should be constructed at the Regional and local levels. Designs of schools should be
enhanced to incorporate facilities that will enable its use as isolation areas.
Strengthen implementation of government programs for basic education to ensure equal access for all. With the implementation of the K to 12 programs, implementation of government program such as the Balik Aral Program, Senior High School Voucher Program and Education Service Contracting Scheme was enhanced to ensure equal access for all. These programs provide learners with numerous option to take their basic education.
Quality of higher and technical education and research for equity and global competitiveness improved
Intensify promotion and strengthen implementation of government programs to access tertiary education. Through the passage of RA 10931, quality tertiary education was made more accessible. However, proper information in availing these programs should be available to all particularly those residing in the rural areas. In addition, monitoring mechanisms should be strengthened to address the implementation gaps.
Promote culture of research and innovation. Research and innovation are vital in development of capacities and increasing competitiveness. HEIs in the Region promote the culture of research and innovation to further engage in the knowledge-based economy.
Enhance soft-skills of graduates. Development of the 21st century skills such as critical thinking, problem-solving, creativity and imagination, self-direction, initiative, and collaboration and teamwork has to be pursued. Apart from technical skills acquired through formal education and training, these soft-skills are also sought by employers. Learning methods to acquire these skills will be promoted across

120 | Regional Development Plan 2017-2022
the different levels of education.
Further strengthen the academe-industry collaboration. Industry skills requirement is expected to evolve with the anticipated fourth industrial evolution. To minimize the job-skills mismatch, collaboration between the academe and the industry need to be further strengthened. Involvement of the government sector will also be promoted to identify and develop more strategies that will address the job skills mismatch.
Industry demanded TVET programs that are area-specific, flexible, holistic, and product and service oriented will also be prioritized.
Income earning ability-increased
Employability improved
Strengthen employment facilitation services. New entrants to labor market including OFs will be assisted through employment facilitation services of DOLE and the Public Employment Service Office (PESO) of LGUs. These jobseekers will be assisted through coaching, career and pre-employment orientations, and job fairs. Expanding the reach and provision of regular and up-to-date labor market information will also be ensured.
To strengthen the Career Guidance Advocacy Program of DOLE, the Region will promote the implementation of the Youth Employability Framework. Implementation of the framework will strengthen the development of technical and lifeskills of students while promoting the importance of values and attitude. Promotion of Jobstart Philippine Program will be intensified to reach more young jobseekers and provide employment opportunity to all including the out-of-school youth. The program contributes to easing the school to work transition of
youth through enhancing the knowledge and skills acquired in formal education and training. With the full participation of the private sector, the program is expected to continuously contribute in reducing youth that are not in employment, education or training.
Productivity improved
Provide humane work environment. Safety, security and workplace harmony provide enabling environment for employees to be productive.
Ensure adequate social services. Provision of quality social services such as the health programs of the government will contribute in enhancing the labor productivity. Accessible and quality social services for all should be ensured.
Tap the knowledge and skills gained of Overseas Filipino Workers (OFWs). The Balik Scientist provides an opportunity to tap the knowledge and skills gained by OFs while working abroad. Harnessing these knowledge and skills will be beneficial to improve the labor force’s competitiveness and enhance their capabilities.
Productivity improved
Provide humane work environment. Safety, security and workplace harmony provide enabling environment for employees to be productive.
Ensure adequate social services. Provision of quality social services such as the health programs of the government will contribute in enhancing the labor productivity. Accessible and quality social services for all should be ensured.
Tap the knowledge and skills gained of OFWs. The Balik Scientist provides an opportunity to tap the knowledge and skills gained by OFs while working abroad. Harnessing

Chapter 10 Accelerating Human Capital Development | 121
Nutrition and health for all improved
• Infant and new born care program• Maternal health Program• Mental Health Program• Water, sanitation, and hygiene• Vector-borne disease prevention
and control• Disease surveillance and
outbreak response• Safe and nutritious food and nutrition
in emergencies• Existing and emerging communicable
diseases program• Health Promotion and Education• Isolation and Quarantine Facilities • Epidemiological and Surveillance
Capacity Development• Telemedicine• First 1000 Days of Life Program • Counseling, referral and rehabilitation
for substance abuse patients• Food sustainability projects • Community involvement and
sports development • Full implementation of the RPRH Law • Full implementation of No
Balance Billing• Full implementation of Universal Health
Care Act• Adolescent Health and Youth
Development Program
• Adoption of the Regional Plan for Action on Nutrition
• Implementation of AIDS Policy Act of 2018
Lifelong learning opportunities for all ensured
• Balik Aral Program• DepEd Commons• Government Assistance to Students and
Teachers in Private Education• Alternative learning system • Unified Student Financial Assistance
System for Tertiary Education• ICT for Alternative Learning System
(ICT4ALS) Project• Community-based training for
special groups • Implementation of the National
Technical Education and Skills Development Plan (NTESDP) 2018-2022
• e-TESDA• Philippine Qualifications Framework • DepEd-DPWH Convergence Program • Government programs on increasing
access to ICT • Full implementation of First Time
Jobseekers Assistance Act
Major Programs and ProjectsThe Region’s priority programs, projects, and activities to achieve the sectoral and societal outcomes in accelerating human capital development will be implemented
through volunteerism, convergence, and multi-stakeholder partnership approach. The priority interventions of the Region are the following:
these knowledge and skills will be beneficial to improve the labor force’s competitiveness and enhance their capabilities.
Labor mobility and income security enhanced
Enhance labor mobility. Labor mobility will be enhanced through increasing competitiveness by being at par with the
ASEAN and global standards as defined in the Philippines Qualification Framework.
Intensify investments promotion. Promotion of local and foreign investments in the Region will be pursued. Increased investments will contribute to increasing employment opportunities to the Region’s labor force.

122 | Regional Development Plan 2017-2022
Legislative AgendaLEGISLATIVE AGENDA RATIONALE
Sector Outcome A: Nutrition and health for all improved
Local Population Development Act This will provide for the establishment and operation of population offices to ensure the effective implementation of population management strategies and measures at the local level.
Prevention of Adolescent Pregnancy Act This act will facilitate the development of a National Program of Action and Investment Plan for the prevention of teenage pregnancy. The program of action will serve as the national framework for inter- agency and inter- sectoral collaboration at all levels to address the various health, cultural, socio-economic, and institutional determinants of teenage pregnancy.
Amendment of the law on the Barangay Nutrition Scholar (BNS) Program
This is to upgrade incentives and benefits, and ensure security of tenure of BNS. This is essential in the provision of continuous frontline nutrition services to the community. This law would ensure that trained and experienced BNS are carried over by succeeding political administrations.
Alternative Learning System Act This will promote non-formal education and ensure Education for All to provide access as well to disadvantaged individuals.
Chapter 11 Reducing Vulnerabilities of Individuals and Families | 123

124 | Regional Development Plan 2017-2022

Chapter 11 Reducing Vulnerabilities of Individuals and Families | 125
Chapter 11
Reducing Vulnerability of Individuals and FamiliesVulnerable groups include children, women, persons with disability, Indigenous Peoples, elderly persons, overseas Filipinos and their families, and informal sector workers, among others. Reducing vulnerabilities of individuals and families is crucial in attaining sustainable and inclusive growth. It is through vulnerability reduction that individuals and families can rise above socio-economic and environmental challenges and emerge resilient in adversities. This chapter discusses the situation of the most vulnerable groups in the Region and the government’s performance in reducing the risk of these groups. It also includes strategies to attain a universal and transformative social protection program for all and covers the updates on the asset reform in the Region.
Assessment and ChallengesReduction in vulnerabilities of individuals and families was observed in the Region from 2016 to 2018. Various social development and social protection programs contributed to the reduction of inherent and economic risks of the population. Among the notable improvements include reduction in poverty incidence, improvement in child health and nutrition, expansion of social pension and strengthened social protection programs for OFWs and their families left behind. For the next three years, CALABARZON Region will focus on addressing child labor incidence, social costs of international migration, pockets of high poverty, declining national
Inherent vulnerabilitiesPoverty incidence reduced but pockets of high poverty still exist. Since 2009, the Region’s poverty incidence has been declining from 11.9 percent to an estimated 9.1 percent in 2015. It is the second lowest among the Regions, next to NCR with 3.9 percent, and below the national level
of 21.6 percent. The decrease in poverty incidence may be attributed to the fast economic development of the Region and the successful implementation of social protection programs such as: the Pantawid Pamilyang Pilipino Program (4Ps) that benefitted 307,692 poor households in the Region and the Social Pension Program which covered 176,265 indigent senior citizens.
However, despite the low poverty incidence, CALABARZON is 8th highest in terms of magnitude of poverty among the Regions. Out of the 142 cities and municipalities in the Region, 34 LGUs had poverty incidence higher than 21.6 percent. Quezon Province requires more assistance compared to other provinces, as it has the highest poverty incidence in the Region estimated at 22.7 percent and 29 of the 34 LGUs with pockets of poverty are located in the Province. To address the presence of pockets of poverty, CALABARZON came up with prioritization of the 35 convergence areas for poverty alleviation programs and projects of the RDC. This initiative was further

126 | Regional Development Plan 2017-2022
strengthened by the adopt-a-municipality program by state universities and colleges in the Region.
Health insurance coverage increased and out-of-pocket expenditure decreased. Percentage of population covered by PhilHealth insurance increased from 74 percent in 2016 to 103.33 percent in 2018. The Regional health insurance availment rate was maintained at 100 percent from 2016 to 2018 with the effective coordination among LGUs, DSWD and PhilHealth. In addition, the passage of Republic Act 11228 or Act
Providing for the Mandatory Philhealth Coverage for All Persons with Disability and Republic Act 10645 or Act Providing for Mandatory Philhealth Coverage for Senior Citizens contributed to maintaining the 100 percent availment rate. As a result, out-of-pocket expenditure decreased from 70.78 percent in 2016 to 46 percent in 2018. Strict monitoring of No Balance Billing and the increase in the percentage of population covered by PhilHealth insurance significantly contributed to lowering out-of-pocket expenditure.
Table 11.1 CALABARZON Health Insurance Indicators, 2016 to 2018ACCOMPLISHMENTS (IN PERCENT)
2016 2017 2018
Percentage of Population covered by PhilHealth Insurance
74.00 104. 84 103.33
Regional Health Insurance Availment Rate 100.00 85.00 100.0
Out-of-Pocket Expenditure 70.78 50.55 46.00
Vulnerabilities of children reduced. Children are one of the most vulnerable groups especially during the first 1,000 days wherein brain and physical development lay the foundation of future health. Hence, the Region stresses the need to address malnutrition, particularly stunting and wasting. The National Nutrition Survey showed that stunted and wasted children in the country increased from 2015 to 2018 while wasted children slightly decreased for the same time period. Despite the decline in the state of child nutrition and health at the national level, the Region fared better in improving health and nutrition outcomes for children. Quezon province, in particular, was able to reduce stunting and wasting as a result of the Quezon First 1000 days program.
In 2011, a total of 174, 051 children from ages 6 to 17 were already working in CALABARZON. A validation activity in three pilot barangays of Catananuan, Quezon was conducted through the Strategic Help Desk for Information, Education, Livelihood and Other Developmental
Interventions (SHIELD) against child labor project. Results showed that out of the 207 children profiled, 97 were validated as child laborers. With various interventions provided, 90.7 percent or 88 children out of the 97 child laborers were withdrawn from child labor. The number of child laborers assisted from 2016 to 2018 increased because of the implementation of the SHIELD project. However, in spite of these, improvements in child labor incidence, is still six times higher than the target.
Eliminating child labor reduces the vulnerability of children and economic risks of families. The number of families with child laborers provided with financial assistance increased 55 families in 2016 to 100 families reported in 2018. The increase can be attributed to continued profiling of child laborers at the Barangay level and on-site interventions for their families. Although an increase was reported, the continued convergence of DOLE and DSWD, awareness campaign on child labor profilers, and the new guidelines of DOLE for livelihood grants to avoid duplication

Chapter 11 Reducing Vulnerabilities of Individuals and Families | 127
of beneficiaries with those already included in the 4Ps resulted to targeted provision of livelihood assistance only to those eligible beneficiaries.
VAW cases increased. Women aged 15-49 who have experienced spousal violence increased from 18.8 percent in 2013 to 19.7 percent in 2017. The increase in reported cases of VAW may be the result of reporting mechanisms in place, gender and development mainstreaming, localization of Magna Carta of Women. However, the real challenge is to lessen the incidence of spousal violence.
Social pension for the elderly expanded. Social pension reduces the risks of the elderly. The social pension coverage of poor senior citizens surpassed targets and went up from 85,639 in 2016 to 176,265 in 2018. Cavite and Laguna Provinces significantly contributed to the increase in coverage of senior citizen social pension by covering an additional 7,260 and 6,518 individuals with social pension, respectively. Consequently, the proportion of targeted social pension beneficiaries provided with social pension increased from 96 percent in 2016 to 100 percent in 2018. The positive performance may be attributed to regular conduct of consultation dialogues and program implementation review with LGUs and concerned stakeholders. Further, the sustained compliance of all LGUs in the Region to the 1 percent budget allocation for PWDs/Senior Citizens also contributed to the increase in coverage.
Limited interventions for differently-abled persons. Differently abled persons are also vulnerable to many risks because of attitudinal, physical and financial barriers. Despite the sustained compliance of LGUs in the 1 percent budget allocation for programs, projects and activities (PPAs) for PWDs and Senior Citizens, there is a need to incorporate more PWD-responsive PPAs and mainstream their concerns in socio-
economic and sectoral plans.
Convergence for IP concerns intensified. The IPs who are mostly residing in geographically isolated and disadvantaged areas (GIDAs) have difficulty accessing basic services such as health and livelihood services. On September 21, 2018, various IP communities in the Region gathered and came up with a manifesto for IP community development. The manifesto laid down the needs and commitments of the IP communities towards reducing their vulnerabilities. IP communities were identified among the priority convergence areas in the Region. Initial interventions were provided during the RDC outreach program where a total of 97 Dumagat households and 163 elementary pupils benefited from the services provided by various government agencies in the Region. Follow through activities were also coordinated to sustain the interventions provided.
Economic risksSocial protection programs for OFWs strengthened. The number of OFWs from CALABARZON declined from 21 percent in 2016 to 17.9 percent in 2019. However, CALABARZON remains to be the top sending Region of OFWs. To reduce the risks faced by OFWs and their families social protection mechanisms such as mandatory membership to OWWA were implemented. The number of OFW membership to OWWA increased from 564, 609 members in 2016 to 1.34 million in 2018. The actual number of members significantly increased from the targets since the accomplishment is a consolidated data of OFWs in CALABARZON from Local, Regional, and National Database as well as data from OWWA overseas offices. The increase may also be attributed to the implementation of OWWA E-Card, Balik Mangagawa Program and automatic renewal of membership which was implemented during the last quarter of 2018. The partnership with Land

128 | Regional Development Plan 2017-2022
Bank for payment of OWWA membership also facilitated the increase in membership.Consequently, due to mandatory social security coverage and provision of on-site services, the percentage of OFWs covered by social security increased from 301,663 in 2016 to 369,907 in 2018 which was largely contributed by the Provinces of Cavite and Rizal.
The number of distressed and undocumented OFWs provided with assistance also increased from 2016 to 2018 due to the occurrence of Middle East financial troubles which affected OFWs from Cavite, Laguna and Rizal and the undocumented OFWs which are affected by the amnesty for violators of residency law in Kuwait. Assistance to distressed and undocumented OFWs was through various government interventions on international migration such as Balik Pinas, Balik Hanap Buhay Program of DOLE, financial assistance, soft loans, shelter assistance and counseling services provided by concerned agencies and provincial one-stop migration resource centers.
Informal sector workers access to social protection still limited. Workers in the informal sector and contractual or job orders in the formal economy are vulnerable to economic risks because of uncertainty of sources of income or livelihood. To reduce vulnerabilities of workers in the informal sector, an increase in the provision emergency employment and/or income augmentation through livelihood assistance were posted from 10,609 in 2017 to 10,965 in 2019. The increase can be attributed to partnership with LGUs who acted as accredited Co-Partners and through monitoring of assisted projects.
Protocols for social protection of vulnerable population needs to be developed and implemented. The COVID-19 pandemic made most of the population in the world vulnerable, requiring massive social
protection interventions. The enhanced community quarantine or lockdown to lessen the effects of the pandemic without in-placed protocols further increased vulnerabilities of the poor, low-income earners, informal sector workers and OFWs. Challenges in implementing the Social Amelioration Program were noted along with the lack of in-placed protocols for reintegration of OFWs.
Governance and political risksPeace situation remains stable. The Communist Party of the Philippines - New People’s Army Terrorists operating in CALABARZON belongs to the Southern Tagalog Regional Party Committee has presence in 19 barangays. The occurrence of internal conflicts can become cyclical as it has been observed that conflict-prone areas also have high poverty incidence. Interventions, such as the RDC outreach program and Yakap Bayan as well as the creation of Task Force to End Local Communist Armed Conflict were conducted to reach out to LGUs identified as conflict areas and high poverty areas. Since 2017, there were seven outreach and Yakap Bayan activities conducted which benefited more than 1,000 beneficiaries who were composed of students, senior citizens, drug surrenderees and IPs.
Sustainability of programs and projects needs to be ensured. Sustainability of programs and projects are most often affected by the change in political leadership, hence there is a need to reduce risks and institutionalize programs and projects that will contribute to the attainment of the country’s long term vision. There is also a need to ensure that LGUs are ready for implementing devolved functions and major programs given that they will have more responsibility with the approval of the Mandana’s Case or the implementation of the recent Supreme
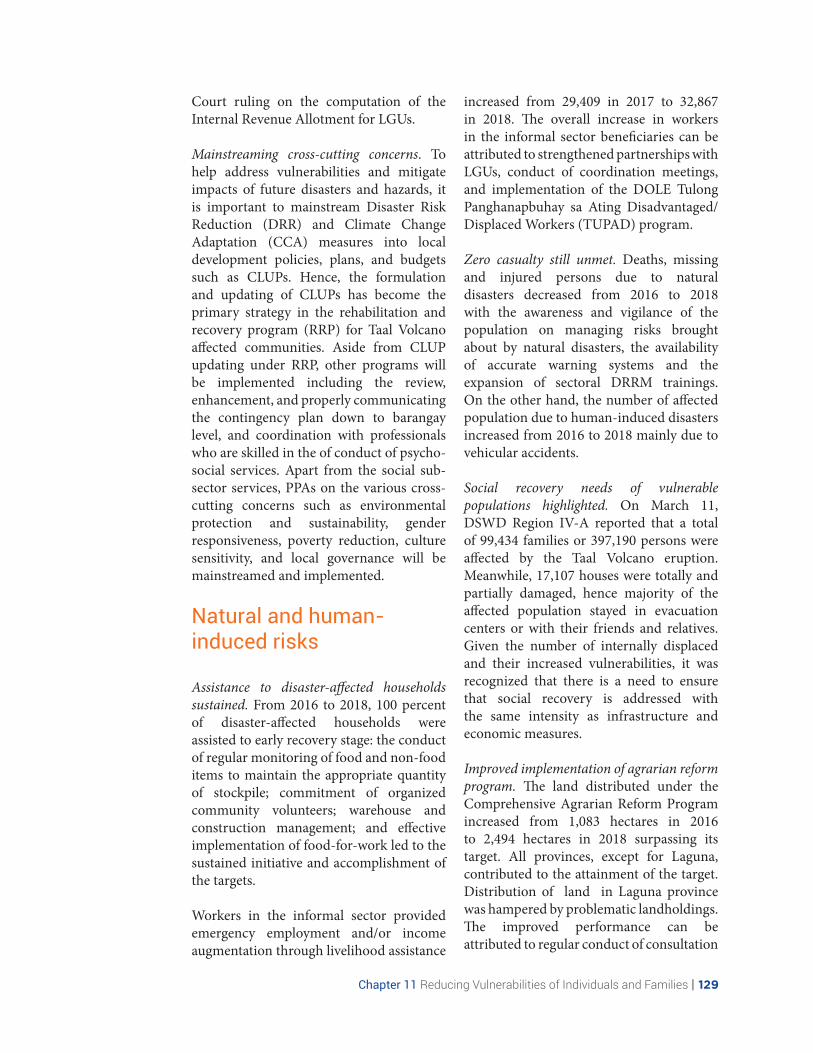
Chapter 11 Reducing Vulnerabilities of Individuals and Families | 129
Court ruling on the computation of the Internal Revenue Allotment for LGUs.
Mainstreaming cross-cutting concerns. To help address vulnerabilities and mitigate impacts of future disasters and hazards, it is important to mainstream Disaster Risk Reduction (DRR) and Climate Change Adaptation (CCA) measures into local development policies, plans, and budgets such as CLUPs. Hence, the formulation and updating of CLUPs has become the primary strategy in the rehabilitation and recovery program (RRP) for Taal Volcano affected communities. Aside from CLUP updating under RRP, other programs will be implemented including the review, enhancement, and properly communicating the contingency plan down to barangay level, and coordination with professionals who are skilled in the of conduct of psycho-social services. Apart from the social sub-sector services, PPAs on the various cross-cutting concerns such as environmental protection and sustainability, gender responsiveness, poverty reduction, culture sensitivity, and local governance will be mainstreamed and implemented.
Natural and human-induced risks
Assistance to disaster-affected households sustained. From 2016 to 2018, 100 percent of disaster-affected households were assisted to early recovery stage: the conduct of regular monitoring of food and non-food items to maintain the appropriate quantity of stockpile; commitment of organized community volunteers; warehouse and construction management; and effective implementation of food-for-work led to the sustained initiative and accomplishment of the targets.
Workers in the informal sector provided emergency employment and/or income augmentation through livelihood assistance
increased from 29,409 in 2017 to 32,867 in 2018. The overall increase in workers in the informal sector beneficiaries can be attributed to strengthened partnerships with LGUs, conduct of coordination meetings, and implementation of the DOLE Tulong Panghanapbuhay sa Ating Disadvantaged/Displaced Workers (TUPAD) program.
Zero casualty still unmet. Deaths, missing and injured persons due to natural disasters decreased from 2016 to 2018 with the awareness and vigilance of the population on managing risks brought about by natural disasters, the availability of accurate warning systems and the expansion of sectoral DRRM trainings. On the other hand, the number of affected population due to human-induced disasters increased from 2016 to 2018 mainly due to vehicular accidents.
Social recovery needs of vulnerable populations highlighted. On March 11, DSWD Region IV-A reported that a total of 99,434 families or 397,190 persons were affected by the Taal Volcano eruption. Meanwhile, 17,107 houses were totally and partially damaged, hence majority of the affected population stayed in evacuation centers or with their friends and relatives. Given the number of internally displaced and their increased vulnerabilities, it was recognized that there is a need to ensure that social recovery is addressed with the same intensity as infrastructure and economic measures.
Improved implementation of agrarian reform program. The land distributed under the Comprehensive Agrarian Reform Program increased from 1,083 hectares in 2016 to 2,494 hectares in 2018 surpassing its target. All provinces, except for Laguna, contributed to the attainment of the target. Distribution of land in Laguna province was hampered by problematic landholdings. The improved performance can be attributed to regular conduct of consultation

130 | Regional Development Plan 2017-2022
dialogue and program implementation review with LGUs and stakeholders, as well as synchronization of targets at the start of the year.
The number of agrarian reform communities (ARCs) served was sustained at 122 from 2016 to 2018 while the number of new agrarian reform beneficiaries’ (ARBs) membership in ARCs significantly decreased from 26, 501 in 2016 to 1,802 in 2018. Despite the decline, the 2018 accomplishment surpassed target in 2018 by 726 new ARBs. However, in terms of the number of ARB organizations served, the Region fell short by 5 ARB organizations for 2018 target. There was also a slight decline of organizations served from 267 in 2016 to 266 in 2018.
Cross-cutting concerns
Harmonization of data collection tools. There has been a clamor among various implementing agencies to harmonize data collection tools of various social development interventions. This includes
tools for child labor profiling, VAW desk monitoring, international migration monitoring tools for both documented and undocumented migrants, and casualties of natural and human-induced hazards.
Collection of local data needs to be strengthened. Local data collection must also be strengthened particularly on data on international migration investment, savings and remittances, ratio of total government spending in social protection to the national budget, Regional data on health and nutrition, particularly on children and data on interventions for differently-abled persons.
Enhancement of the social protection framework. While the Social Protection Operational Framework is being used as reference in the implementation of various social protection programs, there is still a need to enhance the framework and make it more inclusive by expanding social insurance to also cover the informal sector and the unemployed as well as by mainstreaming SP at the local level.
Action Plan
Strategic FrameworkTo ensure reduction in vulnerabilities of individuals and families, there is a need for more coherent social protection programs which promotes integration and convergence of initiatives not only in planning and
implementation but more so in monitoring and evaluation of the outcomes and impacts of various social protection programs. Hence, the strategic framework will focus on reducing inherent vulnerabilities, economic risks, environmental and natural risks, governance and political risks, and other cross-cutting strategies.
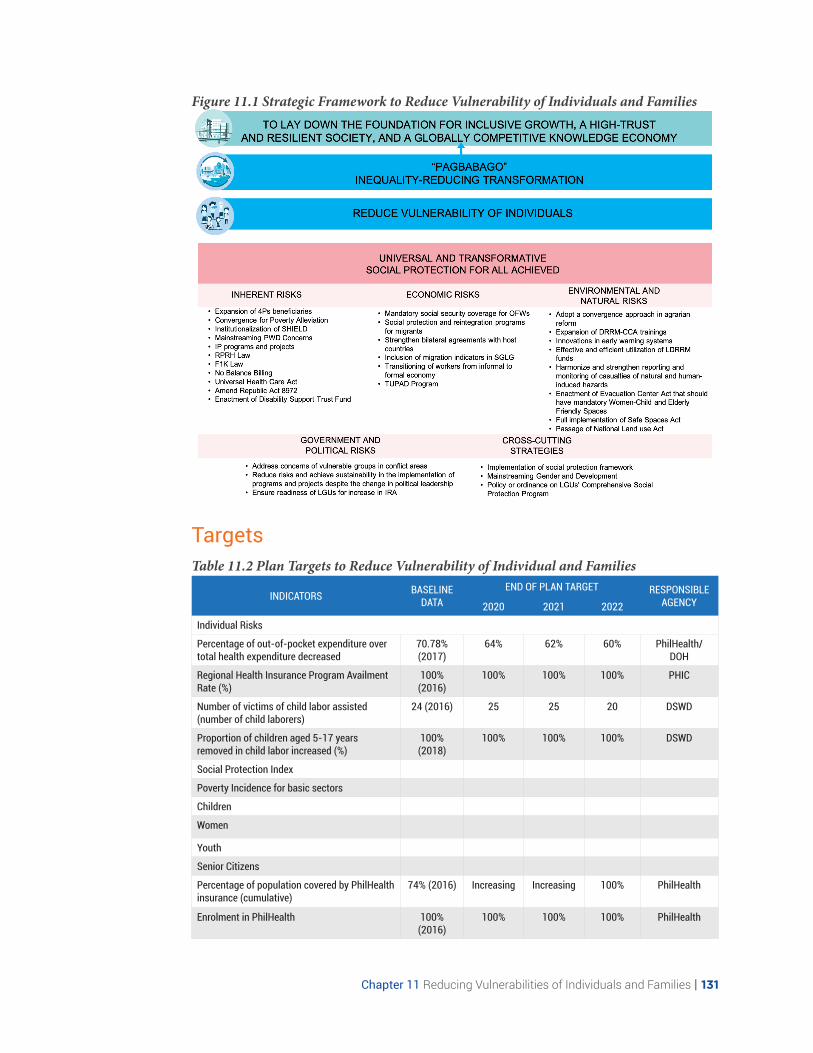
Chapter 11 Reducing Vulnerabilities of Individuals and Families | 131
Table 11.2 Plan Targets to Reduce Vulnerability of Individual and Families
INDICATORS BASELINE DATA
END OF PLAN TARGET RESPONSIBLE AGENCY2020 2021 2022
Individual Risks
Percentage of out-of-pocket expenditure over total health expenditure decreased
70.78% (2017)
64% 62% 60% PhilHealth/ DOH
Regional Health Insurance Program Availment Rate (%)
100% (2016)
100% 100% 100% PHIC
Number of victims of child labor assisted (number of child laborers)
24 (2016) 25 25 20 DSWD
Proportion of children aged 5-17 years removed in child labor increased (%)
100% (2018)
100% 100% 100% DSWD
Social Protection Index
Poverty Incidence for basic sectors
Children
Women
Youth
Senior Citizens
Percentage of population covered by PhilHealth insurance (cumulative)
74% (2016) Increasing Increasing 100% PhilHealth
Enrolment in PhilHealth 100% (2016)
100% 100% 100% PhilHealth
Figure 11.1 Strategic Framework to Reduce Vulnerability of Individuals and Families
Targets

132 | Regional Development Plan 2017-2022
INDICATORS BASELINE DATA
END OF PLAN TARGET RESPONSIBLE AGENCY2020 2021 2022
Coverage of PhilHealth 81% (2016) 94% 97% 100% PhilHealth
Number of poor senior citizens covered by social pension (Senior Citizen's Law) increased (Number of eligible senior citizens who received social pension) f
85,639 (2016)
247,313 259,678 272,658 DSWD
Number of LGUs in compliance to 1% allocation for PWDs/Senior Citizens increased
5 (2016) 136 142 147 DSWD, DILG. DOH, LGUs
Number of Conditional Cash Transfer beneficiaries covered (cumulative)
316,164 (2016)
318,732 318,732 318,732 DSWD
Percentage of women aged 15-49 who have experienced spousal violence
18.8 (2013) - - - PSA
Economic Risks
Percentage of economically active population contributing to SSS pension scheme increased (cumulative)
SSS
Proportion of economically active population with social insurance f (Percentage of households covered by social insurance)
SSS, GSIS
Number of OFW membership to OWWA increased (cumulative)
544,609 (2016)
661,976 695,074 729,828 OWWA
Percentage of OFWs covered by the social security increased
301,663 (2016)
366,673 385,007 404,425 OWWA
Percentage of employed in the government covered by GSIS
37888 (Laguna)
34,77 (Batangas)
TBD TBD TBD GSIS, SSS
Number of families with child laborers provided with livelihood assistance f
55 (2016) - - - DOLE
Percentage of employed in the government covered by GSIS
37888 (Laguna)
34,77 (Batangas)
TBD TBD TBD GSIS, SSS
Number of families with child laborers provided with livelihood assistance f
55 (2016) - - - DOLE
Number of families with child laborers provided with livelihood assistance f
55(2016)
DOLE DSWD
Environmental and Natural Risks
Percentage of Families affected by natural and human-induced disasters provided with relief assistance
100% (2016)
100% 100% 100% DSWD
Number of Households provided Emergency shelter assistance (Percentage of households with damaged houses provided with emergency shelter assistance) f
1,251 (2016)
24,300 21,870 19,683 DSWD
Proportion of emergency loan applications by calamity-affected GSIS members and pensioners granted f
GSIS
Workers in the informal sector provided emergency employment and/or income augmentation thru livelihood assistance
51,437 (2016)
TBD TBD TBD DOLE
Number of deaths attributed to natural disaster per 100,000 population decreased
RDRRMC/PNP
Number of deaths attributed to human-induced disaster per 100,000 population decreased
RDRRMC/PNP

Chapter 11 Reducing Vulnerabilities of Individuals and Families | 133
INDICATORS BASELINE DATA
END OF PLAN TARGET RESPONSIBLE AGENCY2020 2021 2022
Number of missing persons attributed to disaster per 100,000 population decreased
RDRRMC/PNP
Number of missing persons attributed to natural disasters per 100,000 population decreased
RDRRMC/PNP
Land tenure security and protection for IPs and farmers ensured f
1 (2017) 0 2 2 DAR, NCIP
Area distributed under CARP increased through emancipation patent (EP)/ certificate of land ownership award (CLOA) (ha.)
191,676 (2016)
1,282 1,274 1,200 DAR
Agrarian Reform Communities (ARCs) served sustained
122 (2016) 122 122 122 DAR
Number of Agrarian Reform Beneficiaries Organization (ARBOs) served in ARCs & Non-ARCs increased/ sustained
267 (2016) 266 266 267 DAR
Number of New Agrarian Reform Beneficiaries (ARBs) membership in Organization in ARCs increased/sustained
26,501 (2016)
1,685 1,735 1,785 DAR
Governance and Political Risks
Ratio of total government speding in SP to GRDP increased f
Ratio of total government spending in SP to the national budget increased f
Note: a Actual data as of December 2015, or most recent available data. May not necessarily be year-end values b Numerical target is preferred. Should be aligned with national/central office targets.c Source documentd Agency accountable for delivering the outputs/achievement of outcomes (can be multiple)e Lead agency responsible for reporting progress on indicator targets to NEDAf Updated PDP 2017-2022 core indicators
StrategiesThe Region will continue to implement programs and projects, and support policies that will reduce the vulnerability of individuals and families to build resiliency and address the root causes of the various types of risks.
The Region has identified strategies that would focus on improving the implementation of social protection program as follows:
Strengthen convergence mechanism for poverty alleviation. Aside from the sustained implementation of the Regional Poverty Convergence Program, there is also a need to expand 4Ps to include newly identified poor households and conduct of impact assessment of the program. Determination
of social welfare and development index for implementation in2020 to 2022 as well as voluntary exit of families that achieved sufficiency must also be encouraged. Hence, the need to formulate and implement a transition program for graduating 4Ps beneficiaries in partnership with other concerned agencies to ensure that beneficiaries have sustainable means to stay out of poverty.
Strict implementation of programs for children. The Region through the Regional Sub-Committee for the Welfare of Children should strictly monitor the implementation of programs significant to child’s survival, development, protection and participation to help eliminate all forms of abuse such as child labor and trafficking. Among the programs that needs to be prioritized include replication and institutionalization

134 | Regional Development Plan 2017-2022
of the SHIELD Project, reactivation of the CALABARZON Child Labor Committee, harmonization of existing child labor database for efficient targeting, strict monitoring, reporting and fast response on child labor cases and conduct of impact study on Kabuhayan para sa Magulang ng Batang Mangagawa (KASAMA) Program. To combat malnutrition and stunting at the earliest, full implementation of the First 1000 days law, Responsible Parenthood and Reproductive Health law and addressing teenage pregnancy is recommended.
Strict implementation of laws related to persons with disabilites (PWDs). In terms of access and coverage of social pension and services for PWDs, validation and creation of database or registry is crucial. There is also a need to prioritize PWD concerns in the utilization of 1 percent budget allocation for PWDs and senior citizens and mainstream their concerns in socio-economic and other sectoral development plans. The Region will also push for the enactment of disability support trust fund.
Intensify program for OFs and their families. The RDC through the Committee on Migration and Development will continue to conduct programs and recommend policies, to minimize the social risks of OFs and their families and to maximize the economic benefits. Among these programs are the reintegration program for OFWs, Balik Scientist Program, mandatory social security coverage, strengthen mechanisms documenting undocumented migrants, bilateral agreements with host countries, migration and migration-related data at the local level and One-Stop-Migration Resource Centers at the provincial and LGU level.
Adopt the implementation strategies in the Social Protection Operational Framework and Strategy. The Social Protection Operational Framework and Strategy include: 1) scaling up of community-driven development; 2) converging in the delivery
of core responses; 3) building adaptive capacities at all levels of implementation and 4) institutionalizing monitoring and evaluation system. There is also a need to make the social protection framework more inclusive by expanding social insurance to cover the informal sector workers and the unemployed. This will reduce the gap in social insurance coverage which caters only to those in the formal economy.
Increase resiliency of the population to natural and human-induced disaster. The Region still needs to strengthen its DRR-CCA efforts since we have yet to achieve zero casualties target during disaster events. There is a need to intensify trainings on DRRM and increase RDMMC coverage of disaster-related trainings. The Region will also push for proactive disaster preparedness and intensify information and advocacy campaigns. CALABARZON will also push for innovations in early warning systems, effective and efficient utilization of DRRM funds and harmonized monitoring and reporting tools of natural and human-induced disasters. Enactment of evacuation center act with women, child, elderly and differently-abled person’s friendly.
Promote convergence to address cross-cutting concerns. CALABARZON will strengthen its convergence mechanisms to address cross-cutting concerns. Harmonization and localization of data will be prioritized, particularly to address the limitations in providing interventions for child labor, internal and international migrants, and differently-abled persons, among others. The harmonized database and available local data will serves as a basis for formulation of gender-responsive social protection plan.
Improvements in the implementation of the social protection framework will also be prioritized for the next three years. Focus will be on the smooth transition of informal workers to the formal economy and social insurance for the informal and unemployed members of the community. To support
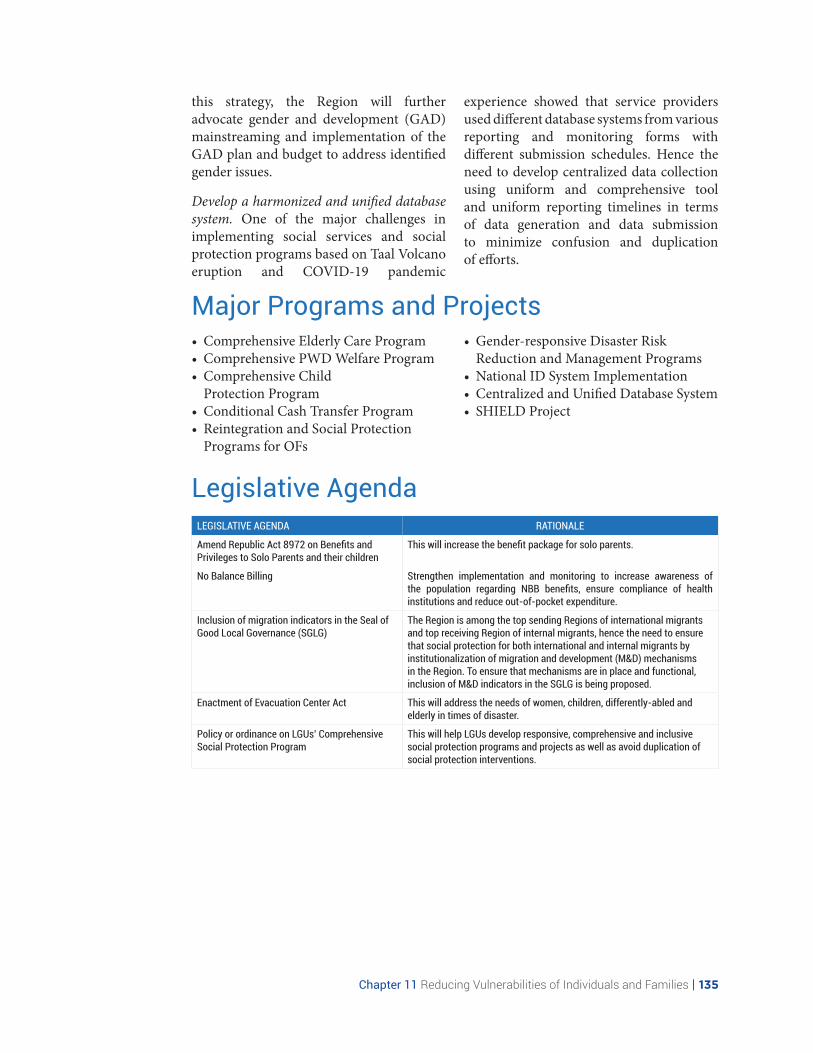
Chapter 11 Reducing Vulnerabilities of Individuals and Families | 135
this strategy, the Region will further advocate gender and development (GAD) mainstreaming and implementation of the GAD plan and budget to address identified gender issues.
Develop a harmonized and unified database system. One of the major challenges in implementing social services and social protection programs based on Taal Volcano eruption and COVID-19 pandemic
experience showed that service providers used different database systems from various reporting and monitoring forms with different submission schedules. Hence the need to develop centralized data collection using uniform and comprehensive tool and uniform reporting timelines in terms of data generation and data submission to minimize confusion and duplication of efforts.
Major Programs and Projects• Comprehensive Elderly Care Program• Comprehensive PWD Welfare Program• Comprehensive Child
Protection Program• Conditional Cash Transfer Program• Reintegration and Social Protection
Programs for OFs
• Gender-responsive Disaster Risk Reduction and Management Programs
• National ID System Implementation• Centralized and Unified Database System • SHIELD Project
Legislative AgendaLEGISLATIVE AGENDA RATIONALE
Amend Republic Act 8972 on Benefits and Privileges to Solo Parents and their children
This will increase the benefit package for solo parents.
No Balance Billing Strengthen implementation and monitoring to increase awareness of the population regarding NBB benefits, ensure compliance of health institutions and reduce out-of-pocket expenditure.
Inclusion of migration indicators in the Seal of Good Local Governance (SGLG)
The Region is among the top sending Regions of international migrants and top receiving Region of internal migrants, hence the need to ensure that social protection for both international and internal migrants by institutionalization of migration and development (M&D) mechanisms in the Region. To ensure that mechanisms are in place and functional, inclusion of M&D indicators in the SGLG is being proposed.
Enactment of Evacuation Center Act This will address the needs of women, children, differently-abled and elderly in times of disaster.
Policy or ordinance on LGUs’ Comprehensive Social Protection Program
This will help LGUs develop responsive, comprehensive and inclusive social protection programs and projects as well as avoid duplication of social protection interventions.

136 | Regional Development Plan 2017-2022

Chapter 12 Building Safe and Secure Communities | 137

138 | Regional Development Plan 2017-2022

Chapter 12 Building Safe and Secure Communities | 139
Chapter 12
Building Safe and Secure CommunitiesShelter is one of the basic physiological needs that humans should satisfy to survive and most of the Filipinos aspire to own a medium-sized home as stated in AmBisyon Natin 2040.
Recognizing the need to build and improve people’s access to safe and secure communities, and to meet the aspirations of Filipinos, the government prioritized, among others, the creation of the Department of Human Settlements and Urban Development (DHSUD) that aims to ensure safe, secure, habitable, sustainable and resilient communities by crafting a national strategy to address provision of housing for all. The creation of DHSUD also aims to shift from a fragmeneted government approach to a more comprehensive and holistic view in improving access to safe and secure human settlements.
Prior to the approval of DHSUD, key shelter agencies have launched the Building Adequate, Livable, Affordable and Inclusive Filipino Communities (BALAI) program which strengthens partnership among shelter agencies and housing developers to narrow down housing backlogs.
This chapter presents the Region’s situation in terms of building safe and secure communities. It also identifies strategies and priority programs, projects and legislative agenda to address the issues and challenges of the housing sector.
Assessment and ChallengesThe Constitution provides that the State shall undertake, in cooperation with the private sector, a continuing program of urban land reform and housing which will make available at affordable cost, decent housing and basic services to under-privileged and homeless citizens in urban centers and resettlement areas.
Prior to the enactment of the 1987 Constitution, the government approved a National Shelter Program (NSP) which aims to assist low- and middle-income families in meeting their housing needs through housing production, community-driven housing programs, retail and development
financing, home mortgages and guarantees, among others.
Direct housing assistanceHousing production for informal settler families resettlement declined. Housing units completed declined from 2016 to 2018 due to delay in the release of funds and in the issuance of permits, licenses, clearances, and other documentary requirements, among others.
Community Mortgage Program take outs improved. The number of Community Mortgage Program take outs improved from

140 | Regional Development Plan 2017-2022
2016 to 2019. The increase maybe attributed to the newly developed modalities, like vertical Community Mortgage Program for vertical housing, to the established partnership of local government units with non-government organization mobilizers who assist families in organizing themselves into associations to qualify for the program, and to the decentralization of Social Housing Finance Corporation (SHFC) operations.
High Density Housing Program implemented but slightly below target. The Region recorded its first high density housing program take outs in 2019, with 2,568 take outs which is below 2019 target of 3,368. Among the reasons for the unmet target is the delay in the project implementation and completion due to failure to comply to site development requirements.
Steady increase in housing loan availment. Housing loan availment steadily increased from 2016 to 2018. The steady increase maybe attributed to the competitive interest rate of 3 percent for Affordable Housing Loan Program and 5.375 percent for End-user Financing Program as well as to the regular conduct of orientations for developer and pre-evaluation of housing loan documents while units are being constructed.
Indirect housing assistanceApproved new guaranty enrolments increased. Approved new guaranty enrolments increased from 8,015 in 2016 to 16,036 in 2018 with the improvements in marketing strategies, such as, provision of discount premiums and rebates, which increased bank clients.
Licensed to sell issued declined. The number of licenses to sell issued has been declining since 2016 as developers could not comply with the establishment of socialized housing projects which is a requirement prior to issuance of license to sell.
LGUs provided CLUP assistance increased. The inclusion of Comprehensive Land Use Plan as one of the criteria for the Seal of Good Local Governance increased the demand for assistance in CLUP preparation.
Housing loan receivables secured improved. The increased in new housing development projects and competitive market rate contributed to the increase in the application for the Housing Loan Receivables Purchase Program.
Table 12.1 National Shelter Program Direct Housing Assistance Annual Accomplishments, 2017-2019
AGENCY BASELINE (2016)
ANNUAL PLAN TARGETS ACCOMPLISHMENTS
2017 2018 2019 2017 2018as of June 2019
A. Housing Productiona NHA 9,215 22,041 20,360 16,554 2,898 1,720 5,229
Resettlement for ISFs 8,590 4,806 4,806 1,000 1,775 1,720 1,000
Resettlement for ISFs (Supreme Court Mandamus)
- 16,112 15,554 15,554 - -- 4,229
AFP/PNP Housing Program 625 1,123 1,123
Settlements Upgrading -- -- -- -- -- -- --
Housing Assistance Program for Calamity Victims
-- -- -- -- -- -- --
Permanent Housing -- -- -- -- -- -- --
HOMA -- -- -- -- -- -- --

Chapter 12 Building Safe and Secure Communities | 141
Table 12.2 National Shelter Program Indirect Housing Assistance Annual Accomplishments, 2017-2019
AGENCY BASELINE (2016)
ANNUAL PLAN TARGETS ACCOMPLISHMENTS
2017 2018 2019 2017 2018as of June 2019
A. New Guaranty Enrolments HGC 7,902 16,036
Socialized Housing 8015 No Target per HGC 235 271
Low-cost Housing No Target per HGC 5,994 13,984
Medium-cost housing No Target per HGC 789 1,256
Open Housing No Target per HGC 884 525
B. License to Sell HLURB 250 114 192 232 227
C. LGUs provided CLUP Assistance
18 7 13 35 50
D. Housing Loan Receivable Purchase Program
NHMFC 2,044 257
Source: HGC, HLURB, NHMFC
AGENCY BASELINE (2016)
ANNUAL PLAN TARGETS ACCOMPLISHMENTS
2017 2018 2019 2017 2018as of June 2019
Others (Vertical Development, Employee's Housing)
-- -- -- -- -- -- --
B. Community-Driven Housing Program
SHFC 2,891 -- -- -- 1,023 2,994 --
Community Mortgage Program 2,891 no Regional breakdown of target 1,023 2,994 --
High Density Housing Program 0 no Regional breakdown of target 0 0 --
C. Retail and Development Financing
HDMF
End-User Financing 7,932 11,415 8,171 8,670 10,265 13,263 7,231
Socialized Housing 2,326 7,353 2,301 2,513 3,113 4,572 2,045
Low-Cost Housing 5,563 3,957 5,701 5,980 7,087 8,592 5,118
Medium Cost Housing 26 88 121 126 42 59 49
Open Market 17 17 48 51 23 40 19
Total Socialized Housingb NHA/ SHFC/ HDMF
14,432 -- -- -- 7,034 9,286 7,274
Total Direct Housing Provision (Excluding HOMA)c
20,038 -- -- -- 14,186 17,977 12,460
Source: HUDCC/DHSUD, NHA, SHFC, HDMFNotes:a In house units onlyb Exclude low-cost, medium-cost and open market housingc Sum of Housing Production, Community Driven Housing Program, and Retail and Development Financingd Include only Laguna, Batangas and Quezon. The data for Cavite and Rizal is with HDMF-NCR and they do not have breakdown per provinces
Despite that majority of the housing programs performed better, the housing sector has identified several challenges that need to be addressed immediately to further improve its performance and meet the housing needs in the Region.
Presence of slums increases the risk of transmission of infectious diseases. The presence of slums characterized by high density and poor living environment increases the risk of transmission of infectious diseases. In the current

142 | Regional Development Plan 2017-2022
Table 12.3 Accomplishments in Building a Safe and Resilient CommunitiesBASELINE VALUE ANNUAL PLAN TARGETS ACCOMPLISHMENTS
MALE FEMALE 2017 2018 2019 2017 2018as of June 2019
Proportion of urban population living in slums, informal settlements or inadequate housing decreased (%) (2015)
2.6 2.4 -- -- -- -- -- --
Proportion of socialized housing targets met to housing needs improved (%)
-- -- -- -- -- -- -- --
Proportion of low-cost housing targets met to housing needs improved (%)
-- -- -- -- -- -- -- --
COVID-19 pandemic, the issues on increased urban population density and the declining quality of the environment were identified as among the contributing factors in the wide spread of the disease, together with other factors such as higher older population, climate, access to health care system, among others. As such, there is a need to fast track the implementation of housing projects either in-city resettlement or Balik Probinsya, Bagong Pag-asa Program to ensure that no family would live in a slum community.
Settlements in hazard prone areas. In the recent Taal Volcano Eruption, there are around 6,803 persons living in Taal Volcano Island which is declared as a permanent danger zone. Moreover, an estimated 525,626 persons are residing in areas surrounding Taal Volcano Island which are susceptible to base surge. As such, there is a need for a permanent housing projects for the families from the Taal Volcano Island and other areas affected by fissures while low environmental impact development coupled with mitigation measures is recommended for other areas susceptible to base surge. Local government units should fast track the preparation of Disaster Risk Reduction and Climate Change Adaptation enhanced Comprehensive Land Use Plans to identify areas and
people susceptible to hazards and to identify appropriate solutions.
Lack of accurate and updated data on housing need to be established. The need for accurate and updated data on housing is fundamental issue that needs to be resolved immediately to better estimate housing needs and improve targeting and profiling of beneficiaries as well as monitoring accomplishments of housing projects. This would also help in identifying families residing in slums and in hazard prone areas.
Implementation issues in the production of housing need to be addressed. Delay in the completion and delivery of housing projects persist due to delay in the release of funds and in the issuance of permits, licenses, clearances, and other documentary requirements, among others. As such, the Region identified and reiterated the need to further strengthen partnership between key shelter agencies and local government units to ease delays in submission of documentary requirements for the release of permits as well as budget.

Chapter 12 Building Safe and Secure Communities | 143
Action PlanStrategic FrameworkUnder the pillar Pagbabago or reducing inequality the sector will continue to strengthen socioeconomic resiliency by continuosly building safe and secure communities through expanding access
to housing opportunities, particularly by 1) accelerating housing production; 2) enhancing affordability of housing for the low-income market; and 3) ensuring livability and sustainability of human settlements.
Figure 12.1 Strategic Framework to Build Safe and Secure Communities
Table 12.4 Plan Targets to Build Safe and secure Communities, 2020-2022BASELINE VALUE ANNUAL PLAN TARGETS
MALE FEMALE 2020 2021 2022
Proportion of urban population living in slums, informal settlements or inadequate housing decreased (%) (2015)
TBD TBD TBD TBD TBD
Proportion of socialized housing targets met to housing needs improved (%)
TBD TBD TBD TBD TBD
Proportion of low-cost housing targets met to housing needs improved (%)
TBD TBD TBD TBD TBD
Number of socialized housing units delivered (Cumulative)* TBD TBD TBD TBD TBD
Number of low-cost housing units delivered (Cumulative)* TBD TBD TBD TBD TBD
Targets

144 | Regional Development Plan 2017-2022
Table 12.5 Direct Housing Provision Targets (in units/households), 2020-2022PROGRAMS AGENCY 2020 2021 2022 TOTAL
Direct Housing Provision Targets
1. NHA Direct Housing Provision without HOMA NHA TBD TBD TBD
Resettlement TBD TBD TBD
Resettlement for Supreme Court Mandamus 16,112 16,112
Settlements Upgrading TBD TBD TBD
Cost Recoverable Housing (Employee's Housing) TBD TBD TBD
High-Impact Projects (Mixed-Used Development) TBD TBD TBD
Housing Assistance Program for Calamity Victims (Permanent Housing only)
TBD TBD TBD
2. Community Mortgage Program SHFC No Regional breakdown of target
3. Retail & Development Financing (End-user Financing) HDMF TBD TBD TBD
3.1 Socialized Housing (SH) TBD TBD TBD
3.2 Low Cost Housing (LC) TBD TBD TBD
3.3 Medium Cost (MC) TBD TBD TBD
3.4 Open Market (OM) Source: DHSUD
Table 12.6 Indirect Housing Provision Targets (in units/households), 2020-2022PROGRAMS AGENCY 2020 2021 2022 TOTAL
Indirect Housing Provision Targets
1. New Guaranty Enrolments HGC To Target; Demand Driven
a. Socialized Housing
- Socialized Housing Loans
- Small Housing Loans
b. Low Cost Housing
c. Medium Cost Housing
d. Open Housing
2. License to Sell (housing units licensed) HLURB TBD TBD TBD
3. LGUs Provided CLUP Assistance TBD TBD TBD
4. Housing Loan Receivable Purchase Program NHMFC TBD TBD TBD
Source: DHSUD
Strategies
Expand access to housing opportunities by accelerating housing production
Adopt viable land acquisition approaches. The utilization of government-owned idle land is one of the initiatives of the government to increase available land for socialized housing. The Region also encourages land banking which refers to the acquisition of land at values based on exisiting use
in advance of actual need to address the availability of land in urban areas in support to the in-city resettlement approach. Likewise, usufruct will be promoted as an alternative form of providing secure tenure to urban poor. The National Urban Development and Housing Framework (NUDHF) also encourages urban infill to optimized existing spaces in built-up areas.
Implement a unified, seamless housing development transactions processing for home buyers and developers. In line with

Chapter 12 Building Safe and Secure Communities | 145
the Ease of Doing Business and Efficient Government Service Delivery Act of 2018, the Region shall support the establishment of a housing One-Stop Processing Center to fast track processing of housing-related permits, clearance and licenses issues by national government agencies and local governement units.
Review effectiveness of the implementation of the balanced housing development. The Region recorded a decline in the issuance of license to sell due to low compliance of developers on the establishment of socialized housing project. The Balanced Housing Development Program Amendments Act of 2016 requires owners and developers of subdivisions and condominium projects to develop an area for socialized housing equivalent to at least 15 percent of the total subdivision area or total subdivision cost, and at least 5% of condominium area or project cost. Hence, there is a need for a comprehensive review of the effectiveness of the implementation of the balanced housing program to institute measures to improve its implementation.
Phased implementation of housing development. A phased implementation of housing projects is necessary to help ensure fiscal discipline and improve budget utilization rate of key shelter agencies.
Enhance housing affordability for low income market
Improve and expand housing finance program coupled with increasing families’ capacity to pay. In line with NUDHF’s strategies to improve affordability of housing projects, the Region also encourages the improvement and expansion of housing finance program like to Community Mortgage Program to increase approved loan applications of informal settler families. Likewise, key shelter agencies in collaboration with economic and social welfare agencies
shall integrate sustainable livelihood and employment as component of socialized housing projects.
Strengthen primary and further develop secondary mortgage markets. The competitive interest rate of 3 percent for Affordable Housing Loan Program and 5.375 percent for End-user Financing Program of Pag-IBIG must be sustained to further improved access of Pag-IBIG members to housing loan take-outs. On the other hand, the secondary mortgage programs of the National Home Mortgage Finance Corporation must be further developed in terms og expanding access and coverage through continued marketing of NHMFC housing programs to originators and their buyers and creating partnership with other financial institutions like cooperatives, rural banks and local governments among others.
Ensure livability and sustainability of human settlements
Fully mainstream program convergence budgeting in housing and resettlement. Program Convergence Budgeting (PCB) is a budgeting approach to facilitate and incentivize coordination between agencies on priority inter-agency programs like housing and resettlement. PCB in housing and resettlement aims to improve coordination among concerned agencies in the delivery of auxiliary services such as school buildings, day care center, health centers and livelihood support services in resettlment sites.
Stricter enforcement of compliance with building code. NGAs and LGUs must strictly monitor compliance of developers, contractors and private homebuilders on standard building and design standards to ensure resilient housing.
Adopt a community-driven development approach in shelter provision. The DHSUD

146 | Regional Development Plan 2017-2022
Major Programs and Projects• Building Adequate, Livable, Affordable
and Inclusive or “BALAI” Program• Regional Resettlement Action Plan• National Informal Settlements
Upgrading Strategy• Public rental housing• Mixed-use housing development• Housing microfinance program• Voucher-type direct subsidies
• Inventory of lands and cadastral survey
shall promote community-driven development (CDD) approach in entire human settlements development process. CDD encourages volunteerism among the housing beneficiaries in terms of selecting project site, designing housing unit, and construction of houses, among others. CDD provides a sense of ownership among the beneficiaries, hence, it may help ensure increase in occupancy rate, improve efficiency in the collection of housing loan amortization, improve estate management and ensure inclusive access to and control of housing and human settlement services and benefits.
Operationalize the National Resettlement Policy Framework. The DHSUD shall fully implement the National Resettlement Policy Framework for informal settler families which will be displaced by the government programs or natural disasters and those residing in hazard prone areas.
Mainstream local shelter planning in the Comprehensive Land Use Plans of cities and municipalities. One of the major challenges of the housing sector is the low compliance of LGUs in the preparation of Local Shelter Plan (LSP) which provides the details on current and projected housing needs and strategies to address housing and urban development concerns. The LSP is an important document that would enable LGUs to effectively implement
their mandate on shelter provision. Hence, there is a need to intensify provision of technical assistance on the formulation of LSPs as well as to incentivize the LSP formulation to encourage LGUs to prioritize the preparation of the Plan.
Fast track the preparation of Resettlement Action Plan for Families Affected by Taal Volcano Eruption. The Taal Shelter Task Force should continue its coordination activities through virtual meetings to fast track the preparation of Resettlement Plan for families from Taal Volcano Island. Participatory approach in developing the Resettlement Plan and in making decisions regarding the site options, shelter designs, and basic requirements, among others should be adopted to ensure the effectiveness and sustainability of the resettlement.
Cross-cutting
Strengthen partnerships with stakeholders. Strengthening partnerships among stakeholders would help fast track the implementation of housing projects as it eases the delays in the release of funds and documentary requirements and improve compliance on balanced housing development. The government will harness the services of volunteers in delivering basic social services, responding to disasters and undertaking humanitarian efforts.

Chapter 12 Building Safe and Secure Communities | 147
Legislative AgendaLEGISLATIVE AGENDA RATIONALE
National Land Use Act The proposed National Land Use Act aims to establish a national land use framework that will define the indicative priorities for land utilization and allocation across settlement, infrastructure, production and protective uses and integrate efforts, monitors development related to land use, and evolve policies, regulations and directions of land use planning process.
Idle Land Tax The passage of a national policy mandating the imposition of idle land tax will push landowners to find economic uses for idle properties, this would impact economic growth and development in rural areas.

148 | Regional Development Plan 2017-2022

Chapter 13 Reaching for the Demographic Dividend | 149

150 | Regional Development Plan 2017-2022
Chapter 13 Reaching for the Demographic Dividend | 151

152 | Regional Development Plan 2017-2022

Chapter 13 Reaching for the Demographic Dividend | 153
Chapter 13
Reaching for the Demographic DividendThe demographic dividend is the economic growth potential that can result from shifts in a population’s age structure, mainly when the share of the working-age population (15 to 64) is larger than the non-working-age share of the population (14 and younger, and 65 and older).During this period, the economy can enjoy a boost economic growth with more of its people are productive than those who are dependents or the non-working population. The Region can reap the effects of the demographic dividend with more talented and skilled people in the labor force.
Major factors that affect demographic dividend are fertility and mortality rates. Meanwhile, factors to maximize the benefits of demographic dividend are improved human capital, employment opportunities and savings build-up.
This chapter discusses the Region’s performance in terms of demographic transition and maximizing the gains from demographic dividend. The priority measures are improving human capital of the youth.
Assessment and ChallengesPopulation sizePopulation is the highest among Regions but growth rate had decreased significantly. In 2015, CALABARZON overtaken NCR as the most populous Region in the country with more than 14 million people. Most significantly, population growth rate decreased from 3.91 percent in 2000 to 2.58 percent in 2015. This can be attributed on the results of extensive reproductive
health programs implemented by the national government and LGUs.
The significant decrease of growth rate reduced the population of children under five years old. This will prompt the Region to hit the demographic sweet spot much earlier than other Regions. Shown in figure 13.1 the population pyramid of CALBARZON in 2010 and 2015.
Table 13.1 CALABARZON Population and Population Growth RatePOPULATION GROWTH RATE (%)
1980 1990 2000 2010 2015 1970-80
1980-90
1990-2000
2000-2010
2010-2015 AVE.
4,603,435 6,349,452 9,320,629 12,609,803 14,414,774 3.21 3.27 3.91 3.07 2.58 3.37
Source: PSA

154 | Regional Development Plan 2017-2022
Table 13.2 Modern Contraceptives Prevalence Rate (in percent) by Province, 2017-2018
PROVINCE2017 2018
TARGET ACTUAL TARGET ACTUAL
CALABARZON 30 37.12 35 47.51
Cavite 37.12 47.62
Laguna 32.37 49.66
Batangas 41.23 43.71
Rizal 45.58 33.16
Quezon 37.28 68.87Source: DOH Region IV-A
Figure 13.1 Population Pyramid, CALABARZON, 2010 and 2015
2010 2015
Mortality rates declinedCrude birth and death rate decreased in 2018 as compared to 2017. Crude birth rate decreased from 12.2 percent in 2017 to 11.16 percent in 2018 meeting the 19.0 percent target. Meanwhile, crude death
rate decreased from 3.84 percent to 3.64 percent compared from the previous year, meeting the 6.0 percent target. This implies that the population, in general, is living in a relatively healthy environment with the assistance of government programs.
Fertility rateAn average of 2.6 babies were born alive to women aged 15-49 in 2018. Based on the 2017 National Demographic and Health Survey, the total fertility rate of women aged 15-49 years old was recorded at 2.6 percent which is within the 2.8 target. This can be attributed to the preventive measures being conducted by different agencies and LGUs, such as responsible parenthood/family session, teenage pregnancy symposium, film showing, among others.
More families observed family planning through the use of modern contraceptives. More families used modern contraceptives as a means of modern family planning as observed in the increase of prevalence rate from 37.12 percent in 2017 to 47.51 percent in 2018, meeting the 35 percent target. The 10.4 percentage points increase in the prevalence rate can be attributed to the implementation of the Executive Order 12, s. 2017 or Zero Unmet Need for Modern Family Planning, increase in the advocacy to LGUs, and multi-stakeholder engagement on the modern family planning. Quezon Province has the highest prevalence rate on use of contraceptives while Rizal has the least at 33.16 percent.
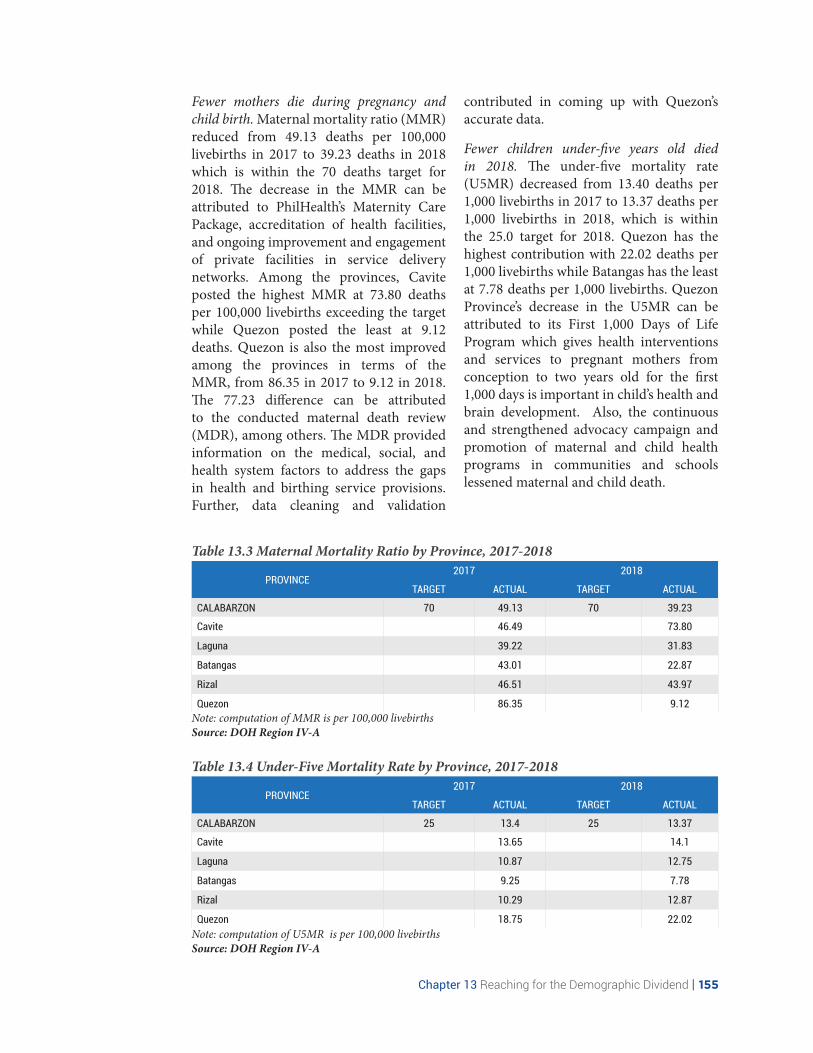
Chapter 13 Reaching for the Demographic Dividend | 155
Table 13.3 Maternal Mortality Ratio by Province, 2017-2018
PROVINCE2017 2018
TARGET ACTUAL TARGET ACTUAL
CALABARZON 70 49.13 70 39.23
Cavite 46.49 73.80
Laguna 39.22 31.83
Batangas 43.01 22.87
Rizal 46.51 43.97
Quezon 86.35 9.12Note: computation of MMR is per 100,000 livebirthsSource: DOH Region IV-A
Table 13.4 Under-Five Mortality Rate by Province, 2017-2018
PROVINCE2017 2018
TARGET ACTUAL TARGET ACTUAL
CALABARZON 25 13.4 25 13.37
Cavite 13.65 14.1
Laguna 10.87 12.75
Batangas 9.25 7.78
Rizal 10.29 12.87
Quezon 18.75 22.02Note: computation of U5MR is per 100,000 livebirthsSource: DOH Region IV-A
Fewer mothers die during pregnancy and child birth. Maternal mortality ratio (MMR) reduced from 49.13 deaths per 100,000 livebirths in 2017 to 39.23 deaths in 2018 which is within the 70 deaths target for 2018. The decrease in the MMR can be attributed to PhilHealth’s Maternity Care Package, accreditation of health facilities, and ongoing improvement and engagement of private facilities in service delivery networks. Among the provinces, Cavite posted the highest MMR at 73.80 deaths per 100,000 livebirths exceeding the target while Quezon posted the least at 9.12 deaths. Quezon is also the most improved among the provinces in terms of the MMR, from 86.35 in 2017 to 9.12 in 2018. The 77.23 difference can be attributed to the conducted maternal death review (MDR), among others. The MDR provided information on the medical, social, and health system factors to address the gaps in health and birthing service provisions. Further, data cleaning and validation
contributed in coming up with Quezon’s accurate data.
Fewer children under-five years old died in 2018. The under-five mortality rate (U5MR) decreased from 13.40 deaths per 1,000 livebirths in 2017 to 13.37 deaths per 1,000 livebirths in 2018, which is within the 25.0 target for 2018. Quezon has the highest contribution with 22.02 deaths per 1,000 livebirths while Batangas has the least at 7.78 deaths per 1,000 livebirths. Quezon Province’s decrease in the U5MR can be attributed to its First 1,000 Days of Life Program which gives health interventions and services to pregnant mothers from conception to two years old for the first 1,000 days is important in child’s health and brain development. Also, the continuous and strengthened advocacy campaign and promotion of maternal and child health programs in communities and schools lessened maternal and child death.

156 | Regional Development Plan 2017-2022
Table 13.5 Prevalence Rate of Stunting, Wasting, and Obesity of Children Less Than 5 Years Old and Aged 10-15 in CALABARZON, 2013 and 2015
LESS THAN 5 YEARS OLD 10-15 YEARS OLD
2013 2015 2013 2015
Stunting 25.2 27.7 27.1 26.2
Wasting 8.8 7.6 15.4 13.9
Obese 9.6 11.8Source: 2015 National Nutrition Survey, DOST-FNRI
Quality of human capital improvedImproving the quality of human capital is key to increase productivity and household income. This is critical in harnessing the demographic dividend.
Improving human capital starts from the womb as healthy babies grow into healthy children. Healthy children have more chances of finishing school and developing their skills into productive and smart adults. A quality education system is already in place to produce educated and skilled labor force with the implementation of K-12 program. Increased infrastructures on education and health facilities are covered in the Build, build, build Program to accommodate classroom and health service demands which will be discussed in Chapter 19.
Stunting is prevalent in the Region. In 2015, 27.7 percent of children under five years old were stunted, higher than the 25.2 percent in 2013. Meanwhile, of children under five years old 7.6 percent were wasted in 2015.
For ages 10-19 years old, 26.2 percent were stunted, 13.9 were wasted, 10.10 percent with chronic energy deficiency, and 11.8 percent were obese in 2015. While stunting and wasting percentage has declined compared to 2013, levels of obesity among 10-15 year-old children increased to 11.8 percent from 9.8 percent in 2013.
Stunting is usually attributed to low birth weight which usually happens when a
mother is undernourished or too young to bear children. Young adolescents have immature reproductive system. Further, teenage mothers, especially those from low-income household, have less access to prenatal check-up and health services. The advent and popularity of mobile gadgets and other technological entertainment consoles, unhealthy eating, and declining popularity of sports and its personalities may have contributed to a sedentary lifestyle among children that led to obesity or overweight.
Kinder to Grade 12 enrollment rate increased. For SY 2018-2019, the enrollment rate increased by 3.50 percent. Enrollees for SY 2017-2018 and 2018-2019 were recorded at 3,678,110 and 3,806,792, respectively. Primary education completion was 98.4 percent and 90.7 percent completion rate also increased for junior high school. These high completion rates can be attributed to the implementation of programs, projects, and activities aligned to K to 12 education curriculum, such as setting of early registration schedules, school-based feeding program and the voucher program for senior high school, and strict implementation of 4Ps beneficiaries for their children to be complete every school year. The high cohort survival rates, 99.0 percent and 91.4 percent for elementary and junior high school, respectively, which measure the efficiency and effectiveness of quality and delivery of education services can be also attributed to the increase in the enrolment and completion rates for SY 2018-2019.

Chapter 13 Reaching for the Demographic Dividend | 157
Table 13.6 Number of Enrollees in CALABARZON, 2017-2019SCHOOL YEAR
2017-2018 2018-2019
Kinder 320,518 343,349
Elementary 1,844,333 1,851,586
Junior High School 1,112,886 1,177,847
Senior High School 400,373 434,394
Total 3,678,110 3,807,176Source: DepEd Region IV-A
Action PlanStrategic FrameworkThe strategy for reaching demographic dividend will be anchored on accelerating the demographic dividend and maximizing gains. Focus areas will include reducing
mortality rate and fertility rates, improving quality of human capital, reducing youth employment, savings build-up, and improving integration of population development.
Figure 13.2 Strategic Framework to Reach the Demographic Dividend
TargetsCALABARZON, with its 14.4 million people will be among the first Regions to transition to the demographic sweet spot. The Region must ensure the continuous implementation of programs and projects
on reducing the total fertility rate (TFR), adolescent and unwanted pregnancy by promoting existing and modern contraceptives. Implementation of the First 1000 Days Act will help produce healthy children and reduce incidence of stunting. Secondary education completion rate must be improved for students’ transition to

158 | Regional Development Plan 2017-2022
Table 13.7 Plan Targets to Reach the Demographic Dividend
INDICATORSBASELINE
DATA (2016)
2019END OF PLAN TARGET
2020 2021 2022
Accelerate demographic transition
Crude birth rate decreased (%) 21.3 18 17 16 Decreasing
Crude death rate decreased (%) 6.4 6 5 5 4
Total fertility rate decreased (total number of births per woman aged 15-49)
3 2.7 2.6 2.5 Decreasing
Modern contraceptive prevalence rate for modern family planning increased (%)
25 40 50 60 65
Reduced proportion of adolescents (15-19 years old) who have begun childbearing (%)
8.1 7.6 7.4 7.2 Decreasing
Reduced young dependency ratio 45.9 Decreasing Decreasing Decreasing Decreasing
Maximize gains from the demographic dividend
Life expectancy at birth
Male 69.5 Increasing Increasing Increasing 75
Female 75.6 Increasing Increasing Increasing 82
Maternal mortality ratio per 100,000 live birth decreased 68 70 70 70 70
Under-five mortality rate (per 1,000 live births) decreased 14 25 22 22 22
Prevalence of stunting among children under 5 decreased (%) 27.7 24.7 23.7 22.7 21.7
tertiary education to achieve an educated work force. This can be realized with free college education in government SUCs. Foreign investments are being pursued to create quality jobs for the educated work force. The high productivity of the labor force upon reaching the demographic dividend and promotion of financial literacy will result to increased savings, thus the banking sector should be ready to accommodate new accounts.
Current challenges need to be addressed to avoid hindrances before and during demographic dividend. These challenges are: a) high fertility rate of poor households; b) unemployment and underemployment rate of young workers ages 20-24; c) mitigating the probable decline of youth enrolling in higher education due to projected lower income of families, and d) creating new job opportunities.
In order to reach and eventually reap the benefits of the demographic dividend, strategies must be focused on the following: 1) reducing fertility rate to achieve the 2.1 fertility rate that is consistent with stable population; 2) reducing the incidence of teenage pregnancy should also be pursued for young females to finish their education and participate in the labor force; 3) improving the quality of youth human capital (education and health) to improve skills and readiness to high paying jobs; 4) creating more jobs and economic opportunities to achieve higher youth employment rate and low dependency ratio; and 5) enabling financial environment to promote and increase savings during working years to serve as buffer during retirement years.

Chapter 13 Reaching for the Demographic Dividend | 159
StrategiesThe following are the recommendations to reach and harness the demographic dividend:
Improvement of health and nutrition. It is very improtant to have a healthy population to maximize productivity. To ensure a healthy population these are need to be pursued: full implentation of universal health care; continous conduct and advocacy on child health programs; increase health practioners and human resource; strengthen advocacy importance of on health and nutrition; rigorous implementation of the First 1K; improve acces to health services and cheap nutritious food; and complete immunization of children.
Reduce unplanned pregnancies. Adolescent and teenage pregnancies have to be addressed in order for females to reach their full potentials and be more economically productive, instead of staying at home caring for their children at a young age. To address unplanned pregnancies, these are needed to be pursued: Peer counseling; effective sex education; involvement of parents; and women empowerment through GAD advocacies.
Increase labor force participation rate of women. Increasing male and female participation in the labor force are essential to maximize the gains in demographic dividend. The following strategies will be pursued: establishment of more Day-Care Centers; pursue off–site work or free lancing and flexible work hours; additional parental leave for males and females; and continued advocacy on equal participation of men and women in household work (school and media advocacy).
Intensify human capital development. High participation in the labor force is only one element in maximizing demographic
dividend. Quality education should also be achieved by majority of the working class to have higher paying jobs, resulting to higher productivity and possible savings. To attain quality human capital, these are needed to be pursued: improve access to quality education; labor education for graduating students; jobs skills matching; career counseling; labor and employment forecasting.
Mitigate the probable decline of youth enrolling in higher education. Due to COVID-19 pandemic, the Regional economy is predicted to have about zero growth in 2020, hence, average family income of households is seen to decline. Because of this, parents may not be able to send their children to higher education. The following strategies will be pursued to address the issue:
• offer online-adult learning • support the increase in budget
of the education sector for free tertiary education
Create new job opportunities. New job opportunities will be arising from the following activities: upskilling, reskilling and retooling of workers, digital and alternative learning, food delivery, online medical consultations, processing of agricultural and fishery produce, production of essential goods and facilities for health promotion and improved sanitation, e-commerce and cashless payment, exports of medical equipment, supplies and testing kits, research and development, and implementation of rehabilitation and recovery and Build-Build-Build projects including construction of warehouses, slaughterhouses and cold storage facilities.
The government will have to promote these new areas for job creation, even pump prime the production of essential goods and facilities, and provide incentives to investors.

160 | Regional Development Plan 2017-2022
Major Programs and ProjectsImplementation of the following programs and projects by concerned government agencies and LGUs will greatly help the Region achieve the benefits of the demographic sweet spot:
• School Feeding Programs by the DepEd• Provision of multi-vitamins to pregnant
women by the DOH and POPCOM• Pantawid Pamilyang Pilipino Program by
the DSWD• Online Tertiary Education
Courses Programs
• Negosyo Centers (Business Advisory Services)
• P3 or Pondo sa Pagbabago at Pagasenso Enterprise Rehabilitation Fund
• Livelihood Seeding Program-Negosyo sa Barangay
• DOST’s SETUP• DA ALPAS’ Program• Financial Literacy Program• Livelihood Program
CHALLENGES RECOMMENDED STRATEGIES IMPLEMENTING AGENCIES
Increasing unmet need for family planning
• Streamline, fast track, and decentralize procurement of FP commodities• Intensify communication campaign on modern FP and responsible parenting• Strengthen the population management and reproductive health policies and
programs:-address unmet demand for family planning and unwanted pregnancies-increase the age at first birth-increase birth spacing
• Improve distribution of FP commodities to RHUs• Increase multi-stakeolder participation• Employ trained FP/RPRH focals in health facilities
DOH,PoPCom,
LGUs
Increasing cases of teenage pregnancy
• Expand the implementation of Youth Formation and Career Guidance Program• Enhance DepEd’s Reproductive Health Curriculum• Intensify the implementation of Adolescent and Youth Health Program• Intensify the information and education campaign on values formation and sexuality• Improve access to reproductive health
DOH,PoPCom,
DepEd, LGUs
High prevalence of stunting and wasting among children under five years of age
• Expand the health care program focusing on infant, young women, and mothers• Continuous conduct and advocacy on child health programs• Increase health practioners and human resource• Strengthen IEC on health and nutrition• Intensify advocacy on healthy lifestyle among mothers and children• Rigorous implementation of the First 1K • Improve nutrition and access to health services• Complete immunization of children
NNC, LGUs, DOH
High youth unemployment
Job-skill mismatch among SHS and college graduates
• Improve access to quality education• Strengthen government and private sector partnerships• Strengthen academe and industry linkages• Facilitate employment of fresh graduates through Job Fairs and facilitation services• Expand the reach of JobStart program
DOLE, DepEd,
CHED, SUCs
Low savings rate among household
• Mainstream the implementation of economic and financial literacyprograms• Improve access to different financial products
BSP and other
financial institutions
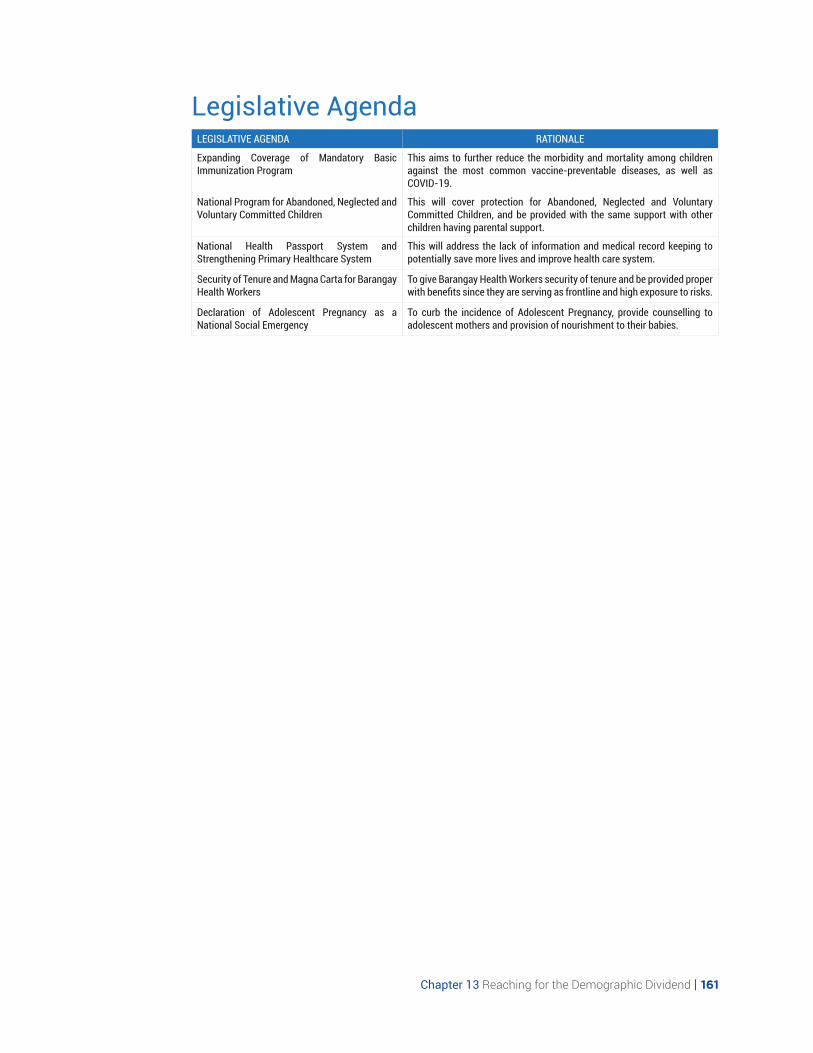
Chapter 13 Reaching for the Demographic Dividend | 161
Legislative AgendaLEGISLATIVE AGENDA RATIONALE
Expanding Coverage of Mandatory Basic Immunization Program
This aims to further reduce the morbidity and mortality among children against the most common vaccine-preventable diseases, as well as COVID-19.
National Program for Abandoned, Neglected and Voluntary Committed Children
This will cover protection for Abandoned, Neglected and Voluntary Committed Children, and be provided with the same support with other children having parental support.
National Health Passport System and Strengthening Primary Healthcare System
This will address the lack of information and medical record keeping to potentially save more lives and improve health care system.
Security of Tenure and Magna Carta for Barangay Health Workers
To give Barangay Health Workers security of tenure and be provided proper with benefits since they are serving as frontline and high exposure to risks.
Declaration of Adolescent Pregnancy as a National Social Emergency
To curb the incidence of Adolescent Pregnancy, provide counselling to adolescent mothers and provision of nourishment to their babies.

162 | Regional Development Plan 2017-2022

Chapter 14 Vigorously Advancing Science, Technology and Innovation | 163

164 | Regional Development Plan 2017-2022
Chapter 14 Vigorously Advancing Science, Technology and Innovation | 165
Chapter 14
Vigorously Advancing Science, Technology and InnovationThis chapter assesses CALABARZON’s performance in promoting science, technology, and innovation (STI) which plays a key role in the country’s socio-economic progress. The programs and services contribute to the development of the lives of Filipino people in the Region. Efforts in leveling-up the support for research and development, education, technology transfer and commercialization, smart systems, and food safety initiatives are the core competencies tthat will propel STI towards a knowledge-based economy creating more opportunities for livelihoods and boost the Regional economy.
Assessment and ChallengesSTI utilization in the agriculture, industry, and services sectors increased
Technology
Number of Promoted Technologies Increased. There was an average increase of 64 percent in the number of technologies promoted from 2017 to 2019. Performance targets for the three year period were also exceeded (Table 14.1). The increase is attributed through the conduct of various promotional activities such as seminars, technical trainings, fora clinics, and engaged media presence during fairs, exhibits, and caravans.
Out of the 199 technologies promoted, 93 are from publicly-funded R&D. The increase is attributed through the conduct of various promotional activities such as Regional and provincial fora, fairs and exhibits on DOST programs, projects, and technologies to stakeholders. Promotional activities launched include Regional S&T Week, Regional Invention Contest and Exhibits and Teknolohiya at Inobasyon, Kaagapay
ng Micro Enterprises, participation to Los Baños Science Community Foundation, Inc.’s Syensaya, DTI Region IV-A’s Kalakal CALABARZON, Quezon’s Niyog-niyugan Festival, and invitation to school/university fairs and exhibits.
The establishment of a Regional media network also contributed to the trend, as well as the distribution of promotional collaterals, and news feeds on technologies including programs and services offered by the government. The implementation of a Communication Plan on STI for audiences GIDA communities likewise contributed to the adoption of new technologies. The consistent use of real-time social media platforms in promoting technologies that features the conduct of technology trainings in the Region also contributed to the increase.Number of Adopted Technologies Increased. In terms of the number of technologies adopted/utilized, there was an average 56 percent increase, from 44 in 2017 to 100 in 2018 to 84 in 2019 (Table 14.2).In 2019, the number of adopted technologies declined compared to 2018 because of the difficulty in identifying potential adopters of

166 | Regional Development Plan 2017-2022
publicly-funded technologies. In addition, most of the identified customers were already served during the previous years and have adopted their in-house information systems. Nonetheless, 2019 target of 48 technologies was surpassed by 75 percent with 84 adopted technologies. Relatedly, the DOST has strengthened its partnership with Regional line agencies, HEIs/SUCs to address the issue and accelerate the transfer/deployment of technologies. This was done through increased utilization of negosyo centers, entrepreneurial organizations, technology business incubators, R&D centers and food innovation centers from HEIs/SUCs). Additional staff was also hired in 2020 to improve utilization of local R&D outputs and competitiveness.
Most of these technologies were from the support mechanisms such as the SETUP, Community-Based Projects
(CBPs) and Community Empowerment through Science and Technology (CEST). The SETUP assisted the MSMEs to adopt commercially available and/or publicly-funded technologies to increase competitiveness through operational efficiency and productivity. Local Grants-In-Aid Projects also contributed to improve their capacity and productivity in AFF (Agriculture, Fisheries, and Forestry), food processing, metals and engineering, and GDH (gifts, decors, and handicrafts).
The technologies that were adopted include Science & Technology Academic and Research-Based Openly Operated Kiosk Stations (STARBOOKS), Carrageenan Plant Growth Promoter, Tubig Talino and Complementary Feeding Program, Tsunami Early Warning System and Automatic Rain Gauge (ARG).
Table 14.2 Number of Technologies: Adopted/Utilized, CALABARZON, 2017-2019
INDICATOR BASELINE VALUETARGET ACCOMPLISHMENT
2017 2018 2019 2017 2018 2019
Number of technologies: adopted/utilized
0 44 88 44 56 66
Note: data as of Sept 2019Source: DOST Region IV-A
Number of Technology Adopters Increased. Majority of the reported adopters or users of new technology are the LGUs. The average increase of 80 percent from 2017 to 2019 (Table 14.3), was made possible through deployment, technology transfer agreements, promotion, and commercialization services, and conduct of S&T promotional activities. In addition, the incorporation of technology interventions in major programs such as SETUP, CEST, and Community Based Projects led to an increase of technology adopters.
Innovation
Performance in improving existing technologies and creating new ones weakened. The number of Filipino patents granted decreased from 3 in 2017 to none in 2018. However, two patents were granted in 2019. The number of Filipino industrial designs registered declined from 100 in 2017 to 81 in 2018 to 48 in 2019. On the other hand, the number of Filipino utility models performed better, increasing from 18 in 2017 to 45 in 2018 to 39 in 2019.
Table 14.1 Number of Technologies Promoted, CALABARZON, 2017-2019
INDICATOR BASELINE VALUETARGET ACCOMPLISHMENT
2017 2018 2019 2017 2018 2019
Number of technologies: promoted
0 51 100 51 158 165
Note: data as of Sept 2019Source: DOST Region IV-A

Chapter 14 Vigorously Advancing Science, Technology and Innovation | 167
In terms of the number of filings for Filipino intellectual property rights (IPR), patents and utility models applications increased from 37 in 2017 to 64 in 2018; and from 67 in 2017 to 82 in 2018, respectively. However, the number of Filipino industrial designs filed decreased from 72 in 2017 to 49 in 2018.
The reason for the low level of IPRs granted or registered was due to the long processing time that is dependent on the submission of documents. Issuance of patents takes four years from the time of application (18 months waiting time, 6 months upon application). On the other hand, industrial designs and utility models have an average waiting time of 9 months and 10 months, respectively. The IPOPHL as the government’s oversight body cannot determine in advance from what specific location/Region the IP applicant will come from, hence the increase or decrease in the Regional IPR grants/registrations is not determined. Additionally, target setting at the Regional level was only started in 2019. Furthermore, IPOPHL has limited number of intellectual property satellite offices
(IPSOs) and innovation and the technology support offices (ITSOs) to cater to the IPR applicants. IPSOs serve as branch offices of IPOPHL situated throughout Luzon, Visayas, and Mindanao, and housed in DTI offices, while ITSOs are universities and institution-partners of IPOPHL that have been equipped with in-house patent libraries.
Investments in STI-based start-ups, enterprises, and spin-offs increased
Number of S&T interventions within the target. Targets on S&T interventions provided were surpassed from 2017 to 2019 (Table 14.6) due to the effort of field operations and provincial S&T centers to provide support to MSMEs, industries and others in CALABARZON. As per DOST, data for 2017 still included number of laboratory services provided by their agency. However, refinements were made in their key performance indicators in 2018 (number of laboratory services provided became a separate indicator of the agency), thus decreasing the number starting 2018.
Table 14.3 Number of Technology Adopters, CALABARZON, 2017-2019
INDICATOR BASELINE VALUETARGET ACCOMPLISHMENT
2017 2018 2019 2017 2018 2019
Number of technology adopters increased
0 40 44 40 95 103
Note: data as of Sept 2019Source: DOST Region IV-A
Table 14.4 Intellectual Property Rights Registrations, CALABARZON, 2017-2019
INDICATOR BASELINE VALUETARGET ACCOMPLISHMENT
2017 2018 2019 2017 2018 2019
Number of Filipino patents granted increased (cumulative)
2 1 3 0 2
Number of Filipino utility models registered increased (cumulative)
30 25 18 45 39
Number of Filipino industrial designs registered increased (cumulative)
48 58 100 81 48
Note: as of January 15, 2020Source: IPOPHL

168 | Regional Development Plan 2017-2022
Number of Firms Provided with S&T Services is within the target. The number of firms assisted decreased from 1,370 in 2017 to 2,851 in 2018 but increased to 1,490 in 2019. However, the performance is above the targets set for the period (Table 14.7). The drastic increase of firms provided with S&T services in 2018 is due to a seasonal training event conducted on that year in Batangas Province which drew massive number of participating firms which became beneficiaries of technology services
by DOST Region IV-A. Majority of these customers were beneficiaries of various capacity building interventions.
Most of the intervention and assistance provided was capacity building through provision of technology trainings, fora clinics, seminars, and consultancy services such as Manufacturing Productivity Extension Program, Food Safety Training, Cleaner Production/Energy Audit, Biogas, Testing and Calibration Services, and Packaging and Labelling Assistance.
Table 14.5 Intellectual Property Rights Applications, CALABARZON, 2017-2019
INDICATOR BASELINE VALUETARGET ACCOMPLISHMENT
2017 2018 2019 2017 2018 2019
Number of Filipino patents filed increased
42 49 37 64 43
Number of Filipino utility model filed increased
48 89 67 82 81
Number of Filipino industrial design filed increased
50 49 72 49 87
Note: data as of January 15, 2020
Table 14.6 Number of S&T Interventions Provided, CALABARZON, 2017-2019
INDICATOR BASELINE VALUETARGET ACCOMPLISHMENT
2017 2018 2019 2017 2018 2019
Number of S&T Interventions provided
408 502 535 1,008 761 802
Source: DOST Region IV-A
Table 14.7 Number of Firms Provided with S&T Services, CALABARZON, 2017-2019
INDICATOR BASELINE VALUE
TARGET ACCOMPLISHMENT
2017 2018 2019 2017 2018 2019
Number of Firms Provided with S&T Services 822 1,408 1,120 1,370 2,851 1,490
Source: DOST Region IV-A
Number of jobs generated decreased. The 2,643 jobs generated in 2018 and 2,145 jobs generated in 2019 fell short of the 2,500 target and was lower than the 2,866 jobs generated in 2017 (Table 14.8). The decrease was attributed to the insufficient SETUP funds for 2018 and the difficulty accounting for the “backward and forward” jobs created”. The automation of manual processes of MSME led them to reduce their need for manpower.
Number of S&T promotional activities conducted increased. The S&T promotional activities conducted from 2017 to 2019 showed an increasing trend. These were conducted through different media platforms and mobilization of provincial information officers to reach communities needing technological interventions (Table 14.9).
The major S&T promotional activities were Teknolohiya at Inobasyon, Kaagapay ng Micro Enterprises (TIKME), National and Regional S&T Week, S&T Caravans, and Regional invention contest and exhibits.

Chapter 14 Vigorously Advancing Science, Technology and Innovation | 169
Creative capacity for knowledge and technology generation, acquisition, and adoption enhancedThe culture and value of critical thinking and innovative behavior especially among
the youth is important to encourage interest in research and technology design. The promotion of STI is incorporated in the teaching strategies for basic and secondary education.
Table 14.8 Number of Jobs Generated, CALABARZON, 2017-2019
INDICATOR BASELINE VALUETARGET ACCOMPLISHMENT
2017 2018 2019 2017 2018 2019
Number of jobs generated 2,500 2,500 2,500 2,866 2,046 2,145
Source: DOST Region IV-A
Table 14.9 Number of S&T Promotional Activities Conducted, CALABARZON, 2017-2019
INDICATOR BASELINE VALUETARGET ACCOMPLISHMENT
2017 2018 2019 2017 2018 2019
Number of S&T promotional activities conducted
0 5 5 3 11 15
Source: DOST Region IV-A
Number of R&D Centers and Innovation hubs maintained. In 2018, two R&D Centers were established in addition to the four innovation centers being maintained and monitored by DOST Region IV-A. The two R&D Centers are the Regional Design and Creation Hub for Innovation in MSMEs and Education (RDCHIME) and the Center for Hazard and Environmental Resource Mapping (CHERM).
The RDCHIME aims to strengthen partnership/ties between DOST and academic sector in enhancing design, animation and creative industry in the Region. The CHERM aims to empower and develop resilient communities through an S&T based hazard prevention and mitigation system harmonizing/integrating maps into layers or overlay which can be customized for LGUs, investors, developers, and others.
On the other hand, the four innovation centers include two Innovation, Design and Development (IDD) laboratories in partnership with Laguna State Polytechnic University (LSPU) in San Pablo City, Laguna and Cavite State University (CvSU) in Rosario, Cavite; and two Food Innovation Centers (FICs) in partnership
with University of the Philippines Los Baños (UPLB) in Los Baños, Laguna and Batangas State University (BatStateU) in Batangas City.
As of 2019, a total of seven R&D facilities/innovation laboratories were operating and maintained by DOST Region IV-A (two IDD laboratories in LSPU San Pablo and CavSU Rosario, RDCHIME in Rizal, CHERM in Quezon, two FICs in UPLB and BatStateU, and CALABARZON Food Solution Hub in LSPU Sta. Cruz).
Number of R&D proposals increased. R&D proposals submitted by SUCs are evaluated and endorsed to funding agencies through consortia. Twelve proposals were evaluated and endorsed for 2019, higher than 2018 (six). Most of these proposals are from agriculture (4), industry/emerging technology (3), DRRM (2) and others.
Number of researches uploaded in EXPLORE decreased. The R&D projects are streamlined and consolidated through R&D information system Exchange of Probes, Learnings and Outputs of Researches (EXPLORE) which was developed and maintained by DOST IV-A. It gives information on the completed and on-going researches in the Region.

170 | Regional Development Plan 2017-2022
A total of 16 SUCs/agencies are currently subscribed and contributed 508 entries in the EXPLORE database.
The EXPLORE System enables researchers of consortia member-agencies, SUCs and research institutions to see the researches already conducted. This minimizes duplication and saves research funds.
The number of completed researches increased 2 points from 2016 to 2017 but started to decline from 2018 to 2019 (Table 14.10). The number of published researches also decreased from 2016 to 2017, and with no published researches uploaded in EXPLORE in 2018 and 2019. R&D activities are important keys to technological innovations that are beneficial to growth of numerous sectors and industries. Publications of researches in referred journals attest to the quality. This is necessary to raise and ensure the quality of R&D. Technological innovations commonly took off from R&D projects.
Thirty-three point six percent of the completed research projects were mainly focused on governance, infrastructure, land utilization and social protection, while 23.10 percent were on education. More than 10 percent of the researches were focused on agriculture and fisheries, and manufacturing and services. Less than 10 percent were on environment protection, natural resource management and disaster risk reduction, and information and communications technology-business process management. Only about 5 percent were conducted for health and nutrition (Table 14.11).
The completed researches for 2016 to 2019 were conducted by the state universities and colleges including partner institutions in the private sector (Table 14.12).
Balik Scientist engagement is yet to be started. The government’s program initiative to engage a Balik Scientist in the area of microbiology detection kit development project is yet to be started.
Table 14.10 Completed and Published Research, CALABARZON, 2011–20192011 2012 2013 2014 2015 2016 2017 2018 2019
Completed 17 34 48 87 56 37 107 26 19
Published 4 10 17 58 28 12 11 0 0Source: DOST Region IV-A’s EXPLORE database as of September 2019
Table 14.11 Focus of Completed Researches, CALABARZON, 2011–2019TOPICS PERCENT SHARE
Others (Governance, Infrastructure, & Land Utilization, Social Protection) 33.60%
Education 23.10%
Agriculture & Fisheries 12.00%
Manufacturing & Services 11.60%
Environmental Protection, Natural Resource Mgt & Disaster Risk & Reduction 8.11%
Information and Communications Technology-Business Process Management 6.75%
Health &Nutrition 4.83%Source: DOST Region IV-A’s EXPLORE database as of September 2019
Table 14.12 Completed Researches by Sector, CALABARZON, 2011–20192011 2012 2013 2014 2015 2016 2017 2018 2019
All 16 34 39 47 33 37 107 26 19
Gov’t 4 8 10 6 4 0 0 0 0
HEI State 9 15 23 31 12 37 107 26 19
HEI Private 0 3 5 5 6 0 0 0 0
Private Non Profit 3 8 1 5 11 0 0 0 0Source: DOST Region IV-A’s EXPLORE database as of September 2019

Chapter 14 Vigorously Advancing Science, Technology and Innovation | 171
Accomplishment in 2019 includes coordination with former Balik Scientist for preliminary work on the proposed project and determination of baseline data and annual targets for the Region.
Number of in-house R&D projects maintained. In-house R&D projects conducted from 2017 to 2019 period were mostly ICT-based: Rx-Detec, Sensing Environmental Parameters through Telemetry (SENTRY), Deployment of Early Warning Systems (DEWS), 21st Century Learning Environment Model (CLEM) Classroom, and DARIUS. 2017 and 2018 marked the start of the conceptualization and development of said ICT projects while 2019 was dedicated to rolling out the ICT systems to adopters.
Number of STEM graduates in HEIs increased. In terms of youth involvement in S&T, the number of Science, Technology, Engineering, and Mathematics (STEM) graduates in HEIs increased from 10,050 in Academic Year (AY) 2016- 2017 to 11,495 in 2017-2018. This pertains to graduates of degree programs in Science, Technology, Engineering, and Mathematics in the tertiary education (college). The reason for the increase is the graduation of the 5th year engineering students and returning students.
Number of STEM enrollees in HEIs decreased. In contrast, the number of enrollees under STEM of HEIs decreased from 66,926 in AY 2016-2017 to 54,161 in AY 2017-2018. The reason is that the students have enrolled to other non-STEM degree programs, and
that some SUCs do not submit data on enrollment to CHED (Table 14.13).
Number of STEM enrollees in high school increased. On the other hand, the enrollees in high school under STEM increased from 69,708 in SY 2017-2018 to 74,550 in SY 2018-2019 to 87,782 in SY 2019-2020 (Table 14.14). This pertains to the STEM academic strand under the K-12 Basic Education Program of Department of Education. The constant increase is attributed to the following reasons: a) increase in capacity on schools offering STEM academic track strand; b) strong senior high school program campaign and career guidance orientation for Grade 10 learners; c) strong partnerships from stakeholders; d) sustainable scholarship programs and voucher system of Private Education Assistance Committee; and e) learner preference as preparatory track for their collegiate course. On the other hand, for STEM graduates in high school, the number decreased from 36,078 in SY 2017-2018 to 29,622 in SY 2018-2019. The decrease is attributed to the following reasons: a) shifting/transfer to other track/strand; b) migration/transfer of residency; c) financial difficulties leading to dropping out; and d) high maintaining grade in STEM strand.
Open collaboration among actors in the STI ecosystem strengthened
A total of 13 ongoing STI collaborations in the Region is spearheaded by DOST Region IV-A (Table 14.15). It includes the sectors of industry, health, education, ICT, and DRRM.
Table 14.13 Number of STEM Enrollees and Graduates in HEIs, CALABARZON, 2017-2019
INDICATOR BASELINE VALUE
TARGET ACCOMPLISHMENT
AY ‘16-‘17
AY ‘17-‘18
AY ‘18-‘19
AY ‘16-‘17
AY ‘17-‘18
AY ‘18-‘19
Number of STEM enrollees in HEIs increased (in million, cumulative)
43,335 44,461 45,587 46,713 69,708 74,550 87,782
Number of STEM graduates in HEIs increased
37,414 41,028 42,835 36,078 29,622 Not yet available
Source: CHED Region IV

172 | Regional Development Plan 2017-2022
Table 14.14 Number of STEM enrollees and graduates in senior high school, CALABARZON, 2017-2019
INDICATOR BASELINE VALUE
TARGET ACCOMPLISHMENT
AY ‘17-‘18
AY ‘18-‘19
AY ‘19-‘20
AY ‘17-‘18
AY ‘18-‘19
AY ‘19-‘20
Number of STEM track enrollees in senior high school increased
43,335 44,461 45,587 46,713 69,708 74,550 87,782
Number of STEM graduates in senior high school increased
37,414 41,028 42,835 36,078 29,622 Not yet available
Source: DepEd Region IV-A
Table 14.15 Ongoing STI Linkages in CALABARZONSECTOR STI Collaborations in CALABARZON
Industry 1. Enhanced Community Empowerment through Science and Technology (ECEST) Program resulted in the development of the Value Chain Approach on Island Economy, as approved by Regional Development Council (RDC) through Resolution No. IV-A 112-2017). This strategy strengthened the convergence among NGAs and LGUs through creation of an enabling environment for economic growth of GIDA communities.
2. Establishment of Makapuno Island Project fostered strong partnership among government agencies, NGOs and private sectors, rallying for the common goal of establishing a Makapuno Island in Alabat, Quezon.
3. Halal Verification Lab aims to strengthen and promote the Halal industry in the country through Republic Act No. 10817 or the “Philippine Halal Export Development and Promotion Act”. The certifying bodies, Muslim organizations, regulatory agencies/ government agencies and MSMEs collaborate with the stakeholders of Halal. It was established through the financial support of the Philippine Council for Industry, Energy and Emerging Technology Research and Development (PCIEERD).
Health RxBox is a telemedicine device capable of capturing medical signals through built-in medical sensors, storing data in an electronic medical record (Community Health Information Tracking System–CHITS), and transmitting health information via internet to a clinical specialist in the Philippine General Hospital for expert advice. RxBox aims to provide better health services in GIDA in the Philippines. The project is co-fund-ed by the DOST in partnership with its attached agencies. It is developed by the UP Manila National Telehealth Center and UP Diliman Electronics and Electrical Engineering Institute.
Biotek-M dengue aqua kit helps diagnose dengue after two or three days from the onset of the illness. The test kits were developed by made by Manila Health Tek Inc.
Food Safety Human Resource Development Project (FSHRDP) pursued to develop competent service providers (trainers, consultants, and laboratory analysts) who shall serve as experts in providing food safety-related trainings, consultancy, technical services, and laboratory analyses, and to accelerate the effective implementation of Republic Act 10611 or the Food Safety Act of 2013.
Education 21st CLEM enhances technological knowledge and skills of educators and students
The 21st CLEM project provides facility for mobility and connectivity to teachers enabling them to effectively facilitate student learning and create productive learning environments where students can develop the skills they need at present and the future. The project aims to enhance learning practices, human support and physical environments facilitating the development of 21st-century skills of both teachers and learners in four common cores: Communication, Collaboration, Critical Thinking, and Creativity.
The CLEM as a support system to teaching and learning science and mathematics was pilot tested in August 2018 in five public schools in LIPA City support the K-12 track on Science, Technology, Engineering and Mathematics.
STARBOOKS digital library that serves as one-stop repository of S&T information that can be updated regularly.
ICT Data Analytics-Ready Info Unified System (DARIUS) for Agile Delivery of S&T Services Project aims for faster consolidation of reports and responses, thus creating a stronger linkage within DOST Regional offices across the Philippines.

Chapter 14 Vigorously Advancing Science, Technology and Innovation | 173
SECTOR STI Collaborations in CALABARZON
ICT MAPUA Automatic ID System for Fibeglass Rescue Boat. DOST Region IV-A utilized the Automatic Identification System (AIS) developed by Mapua University, R&D output funded by DOST-PCIEERD, by installing the boats with this tracking system. This technology can monitor the utilization of boats and ensure safety at sea.
SMART Cities aims to drive development in the cities creating truly inclusive growth ensuring that no one is left behind
DRRM/Assistance Program for the Environmental Protection through Energy Efficiency and Environmen-tal Management System and Use of Renewable/Alternative Energy:
1. Infrastructure Audit is a need-driven intervention to help LGUs to conduct infrastructure audit through the use of the infra-audit manual and to institutionalize the practice of auditing structural integrity of buildings against any environmental risks to prevent the loss of life and resources due to structural damage. This is in partnership with Association of Structural Engineers, Office of Civil Defense, among others.
2. Center for Hazard and Environment Resource Mapping (CHERM) provides mapping services and a composite picture of communities for surveillance, monitoring, resources assessment, and emergency response to LGUs, SUCs, line agencies and other groups.
3. Biogas System waste management tool and energy generation technology that uses locally available materials and an environment-friendly alternative.
ChallengesThe following are the challenges:
Difficulty in acquiring timely and relevant STI data. Many of the indicators in the Chapter 14 Results Matrix (RM) have no standard indicators used by all responsible agencies. This resulted to inconsistencies in data generated and released by concerned government agencies. Hence, performance and progress of the STI sector is difficult to monitor and assess.. In addition, private companies have reservations in providing their own R&D data. Also, most private companies in the Region are only subsidiary of big manufacturing companies abroad, which focus mainly on production but not in R&D.A total of 26 indicators in Chapter 14 RM were identified during the plan formulation in 2017. This increased to 27 indicators during the preparation of the Updated RDP. Also, the Indicators were added and removed during the annual validation process (Table 14.16).
However, seven of the 30 indicators have no Regional data (target and accomplishment), while two indicators have Regional data on accomplishment only but no targets (Table 14.17).
Available data on indicators for R&D Expenditure by Region and by Sector, R&D expenditure as a proportion of GRDP, and R&D Personnel and Researchers per million population is obsolete1. However, a R&D Survey for 2017 data is ongoing and expected to be published in 2020. Moreover, the DOST has engaged the UPLB’s Institute of Statistics to generate the data on R&D expenditure as a proportion of GDP and number of researchers, scientists, and engineers (RSEs) for the DOST has sourced out to the UPLB’s Institute of Statistics2. The data production is expected to be completed by 2020.
Similarly, there is lack of timely and relevant data to keep track of the STI’s development and its contribution to the country’s economic growth despite the earlier initiatives of developing the statistics for STI. The dearth of STI statistics makes it challenging to develop the indicators to monitor the STI sector targets in the PDP and RDP 2017-2022 and those related target indicators in Sustainable Development Goals.
Aside from the challenges discussed, the following were also noted: a) lack of standard indicators used and generated
1 As published in the DOST’s Compendium of S&T Statistics dated December 20152 Excerpted from the Updated Philippine Development Plan (PDP) 2017-2022

174 | Regional Development Plan 2017-2022
Table 14.16 Changes in Chapter 14 Results Matrix Indicators INIDICATORS REMARKS
Added
R&D expenditure as a proportion of GRDP increased (in percent, cumulative)
Patterned in the PDP RM, but no available latest Regional data from DOST. Latest data is as of 2013
Number of Researchers, Scientists and Engineers (RSEs) per million population increased (cumulative)
Patterned in the PDP RM, but no available Regional data from DOST. Latest data only are on R&D Personnel by Region and By Sector and Number of Researchers by Region and Sector of Performance only (as of 2013 based on DOST’s Compendium of S&T Statistics published in December 2015)
Number of Firms Provided with S&T Services Requested to be added by DOST Region IV-A since their function is more on operations and roll-out of DOST Programs in the Region
No. of Small Enterprise Technology Upgrading Program (SETUP) Beneficiaries Assisted
Requested to be added by DOST Region IV-A since their function is more on operations and roll-out of DOST Programs in the Region
No. of Community-Based Projects (CBP) Assisted Requested to be added by DOST Region IV-A since their function is more on operations and roll-out of DOST Programs in the Region
Number of jobs generated
Removed
Number of patents applied increased Number of patents registered increased Number of utility model applied increased Number of utility model registered increased Number of industrial design applied increased Number of industrial design registered increased
Below indicators already exist: Number of Filipino patents granted increased (cumulative) Number of Filipino utility models registered increased (cumulative) Number of Filipino industrial designs registered increased (cumulative)
Number of technologies: utilized Number of technologies: commercialized
Below indicator already exist: Number of technologies: adopted/utilized
Number of Innovation Hubs Established (in Outcome 1.1)
There is already “Number of innovation centers established/maintained”
Number of interventions provided to startups Number of startups assisted
Below indicators already exist: Number of S&T interventions provided Number of customers (firms) assisted
Proportion of (Regional) intellectual property expenditure to GRDP increased
IPOPHL has already informed the PSA that they cannot gather the data on this
Number of GIS-capable LGUs per province based on number of CLUPs reviewed by PLGU
Suggested to be added by representative from the Province during the formulation/validation workshop of 2017 RDR. Determined not relevant and cannot be regularly measured
Removed
Number of scientific articles published in International Scientific Indexing (ISI)/Scopus Index Journal by Filipino authors increased
No available data in the Region as DOST Region IV-A
Number of R&D centers established No longer being measured by DOST Region IV-A
Number of R&D projects implemented Not being targeted annually by DOST Region IV-A
Number of products commercialized No longer being measured by DOST Region IV-A and has no targets because it is dependent on proposals submitted for evaluation
Communication Plan implemented Not being targeted annually by DOST Region IV-A
Regional R&D agenda formulated Not being targeted annually by DOST Region IV-A
by STI concerned agencies; b) decrease in number of IP applications and registrations in the Region; c) low number of enrolees in STEM in HEIs; d) shortage of available technologies for disaster prevention, mitigation and response (in the case of Taal Volcano Eruption and COVID-19
pandemic); e) lack of awareness of general public of available locally-made technologies for disaster prevention, mitigation and response; and f) less support given to local scientists/innovators and local R&D.

Chapter 14 Vigorously Advancing Science, Technology and Innovation | 175
INIDICATORS REMARKS
Regional Development Research Agenda Formulated
Not being targeted annually by DOST Region IV-A
Number of collaborative R&D projects implemented Not being targeted annually by DOST Region IV-A
Number of international collaborations established Not being targeted annually by DOST Region IV-A
Table 14.17 Availability of Regional Data for Chapter 14 Result Matrix IndicatorsNO TARGETS & ACTUAL DATA ACTUAL DATA ONLY
• R&D expenditure as a proportion of GRDP increased (in percent, cumulative)• Number of Researchers, Scientists and Engineers (RSEs) per million population
Increased (cumulative)• Percentage of tertiary graduates in the Region with degree in science,
engineering, manufacturing and construction increased (%)• Number of Balik Scientists Engaged increased (cumulative)• Number of collaborations between HEIs and industries increased (cumulative)• Number of collaborations between HEIs and government increased (NGAs and
LGUs) (cumulative)• Number of STI-related international cooperation of HEIs increased (cumulative)
• Number of STEM enrolees in higher education institutes (HEIs) increased (in million, cumulative)
• Number of STEM graduates in HEIs increased
Action PlanStrategic FrameworkFigure 14.1 Strategic Framework to Vigorously Advance Science, Technology and Innovation

176 | Regional Development Plan 2017-2022
Table 14.18 Plan Targets to Vigorously Advance Science, Technology and Innovation
INDICATORSBASELINE END OF PLAN TARGET RESPONSIBLE
AGENCYYEAR VALUE 2020 2021 2022
Technology Adoption Promoted and Accelerated
STI (science, technology and innovation) utilization in agriculture, industry and services sectors increased
Number of Filipino patents granted increased (cumulative)
1 1 2 IPOPHIL
Number of Filipino utility models registered increased (cumulative)
27 29 31 IPOPHIL
Number of Filipino industrial designs registered increased (cumulative)
61 64 67 IPOPHIL
Number of Filipino patents filed increased 2015 42 51 53 55 IPOPHIL
Number of Filipino utility model filed increased 2015 48 100 112 125 IPOPHIL
Number of Filipino industrial design filed increased
2015 50 65 66 67 IPOPHIL
Number of technologies: promoted 2018 100 100 100 DOST
Number of technologies: adopted/utilized 2018 88 88 88 DOST
Number of technology adopters increased 2018 45 45 45 DOST
Investments in STI-based start-ups, enterprises, and spin-offs increased
Number of innovation centers established/maintained
2016 2 1 DOST
Proposed Proxy Indicator - Number of S&T Interventions provided
10,912 11,997 13,192 DOST
Proposed Proxy Indicator - Number of Firms Provided with S&T Services
2,201 2,416 2,651 DOST
Proposed Proxy Indicator - No. of Small Enterprise Technology Upgrading Program (SETUP) Beneficiaries Assisted
2013 37 DOST
Proposed Proxy Indicator - No. of CBP Beneficiaries Assisted
2013 17 DOST
Number of jobs generated DOST
Number of S&T promotional activities conducted
DOST
Innovation Stimulated
Creative Capacity for knowledge and technology generation, acquisition and adoptions enhanced
R&D expenditure as a proportion of GRDP increased (in percent, cumulative)
DOST
Number of Researchers, Scientists and Engineers (RSEs) per million population Increased (cumulative)
2016 DOST
Number of STEM enrollees in higher education institutes (HEIs) increased (in million, cumulative)
2016 CHED
Number of STEM graduates in HEIs increased CHED
Percentage of tertiary graduates in the Region with degree in science, engineering, manufacturing and construction increased (%)
2016 33% Increasing Increasing Increasing SUCs, HEIs, CHED
Number of STEM track enrollees in senior high school increased
2016 43,335 47,839 48,965 50,091 DepEd
Number of STEM graduates in senior high school increased
2016 37,414 44,729 46,629 48,588 DepEd
Targets

Chapter 14 Vigorously Advancing Science, Technology and Innovation | 177
INDICATORSBASELINE END OF PLAN TARGET RESPONSIBLE
AGENCYYEAR VALUE 2020 2021 2022
Number of Balik Scientists Engaged increased (cumulative)
TBD TBD TBD TBD DOST
Number of R&D proposals evaluated and endorsed
DOST
Number of in-house R&D projects conducted 2016 2 DOST
Sub-sector Outcome 2.2 Open collaboration among actors in the STI ecosystem strengthened
Number of collaborations between HEIs and industries increased (cumulative)
2016 CHED
Number of collaborations between HEIs and government increased (NGAs and LGUs) (cumulative)
2016 CHED
Number of STI-related international cooperation of HEIs increased (cumulative)
2016 CHED
StrategiesThe following are priority strategies in support of the subsector outcomes:
STI utilization in agriculture, industry and services sectors increased
Continued promotion of commercialization and utilization of technologies from publicly funded R&D
• Increase public awareness of DOST’s programs, projects and technologies through its mainstream media (radio and TV), social media platforms (e.g. using Facebook ads to increase reach), S&T fairs, seminars, conventions, exhibits and invention contests
• Mainstream the Inclusive Innovation Industrial Strategy (i3S) of Board of Investments and the Inclusive Filipinnovation and Entrepreneurship Roadmap of DTI, DOST, NEDA, DICT, DA, DepEd, CHED and the Start-up Systems Program 2019-2023 by DOST, DTI and DICT
I3S is an industrial policy aimed at growing innovative and globally-competitive manufacturing, agriculture and services sectors while strengthening their linkages into the domestic and global value chains. Meanwhile, the Inclusive Filipinnovation and Entrepreneurship Roadmap is a five-
year roadmap for the sustainable growth of the Philippine startup ecosystem. It covers six key elements: (a) strong government-academe-industry collaboration; (b) human capital development; (c) access to funding and finance; (d) innovation policy and commercialization of research; (e) entrepreneurial culture and support for startups, MSMEs, and large enterprises to become more innovative; and (f) development of industry clusters to position innovative industries for rapid growth. To be implemented through the Regional inclusive innovation centers (RIICs) (DTI).
• Utilize locally-available technology and innovation for disaster prevention, mitigation and response developed by DOST and its attached agencies in partnership with the local public and private academe and scientific industry partners
• Provide support, and unify efforts to spearhead local and national R&D in different fields/sectors to address problems of epidemics/pandemics
• Mobilize and repurpose unutilized DOST testing equipment to hospitals and other health facilities
• Conduct training and mobilize scientists in molecular biology and related skills to engage in R&D for virus epidemics/pandemics and related diseases
178 | Regional Development Plan 2017-2022
Create an intellectual property culture
• Streamline processes for IPR application/registration to reduce turn-around time
• Expand IPOPHL’s Mind2Market Program by enjoining more government-partners
The Mind2Market program aims to assist innovators throughout their IP journey, from creation, development to commercialization. Current government partners are the Board of Investments, the DTI’s Bureau of Small and Medium Enterprise Development, and the Philippine Rice Research Institute.
• Intensify IP awareness, education and information initiative campaign for MSMEs in the Region through basic orientation seminars, one-on-one consultations/IP clinics, patent drafting seminars, and capability building seminar/workshops
• Extend the implementation of the Trademark Incentive Project (Juana Make A Mark) to engage the MSMEs in brand developing and IP protection
Juana Make a Mark is a trademark registration incentive program that provides reduced cost for eligible MSMEs.
• Expand and strengthen presence of IPOPHL through setting up more ITSOs and its satellite offices within the Region to improve performance of IPR applications
ITSOs are universities or higher educational institutions that houses patent libraries and assist innovators in patent preparation and applications.
• Push for the implementation of the National Intellectual Property Strategy (NIPS) Project to promote cooperation between stakeholders in the STI ecosystem
The NIPS Project aims to craft deliberate and focused strategic approaches to address
issues and concerns that hinder Filipinos from benefiting fully from the IP system.
• Consider reduction of fees in IPR applications
• CHED and IPOPHL to promote better awareness of the first IP elective course and IP modules integrated in relevant courses such as Science, Technology, Literature, Music, the Arts
Investments in STI-based start-ups, enterprises and spin-offs increased
Encourage more innovative financing mechanisms and private sector investments
Scale-up the Science for Change Program (S4CP) to ensure that the outputs of the government’s support to research and innovation are demand-driven.
The Program aims to accelerate the science, technology and innovation through massive increase on investment on science and technology, human resource development and R&D.
Continued provision of support mechanism for start-ups and MSMEs
• Widen implementation of SETUP 2.0 and Grants-In-Aid-Community Based Projects, especially in GIDA areas within the Region
• Support and fast track the implementation of the newly enacted RA 11337 or the “Innovative Startup Act” of 2019
This law creates a Philippine Startup Development Program that provides benefits and incentives for startups and “startup enablers”, by giving them access to startup development programs (capacity building, exchange programs, training), linking them to potential investors, mentors, collaborators, and customers both locally and abroad, and remove restrictions that hamper their establishment and growth.
Chapter 14 Vigorously Advancing Science, Technology and Innovation | 179
Creative capacity for knowledge and technology generation, acquisition and adoptions enhanced
Promote critical thinking and innovative behaviour
• Intensify promotion of STEM courses in HEIs
• Provide scholarships for STEM courses in all senior high schools and HEIs
• Expand DOST-Science Education Institute’s (DOST-SEI) Science Teacher Academy for the Regions (STAR) project to improve the teaching and learning of science and mathematics at the primary and secondary levels and schools, including other HEIs in the Region
• Mainstream, expand and accelerate implementation of the Innovation for Social Impact Partnership (ISIP) Project to more HEIs in the Region
ISIP is a three-year project that aims to support promising innovative Social Enterprises (SEs) in the Philippines to collectively contribute to the achievement, acceleration, and sustainability of the Sustainable Development Goals (SDGs). It is a project co-implemented by the United Nations Development Programme (UNDP), and PhilDev Foundation, supported by the Australian Embassy in the Philippines. SEs will be provided technical support and improved capacity to access capital and attract impact investors (www.isip-ph.com).
• Intensify promotion of Technopreneurship 101 Course (Engineering Entrepreneurship or Entrepreneurship for Engineers)3 to the academe
Technopreneurship 101 is a basic entrepreneurship course crafted for 3 A basic entrepreneurship course crafted for engineering and technology courses into the college curricula in 2018. It is designed to explore the entrepreneurial mindset and culture utilizing a technology or engineering background of the engineering students (PhilDev)
engineering and technology courses into the college curricula in 2018. It is designed to explore the entrepreneurial mindset and culture utilizing a technology or engineering background of the engineering students (PhilDev).
Increase funding for human resource development
Increase budget to expand the undergraduate and graduate scholarship programs of DOST-SEI to further encourage students to pursue STI courses
Support the Region’s research and development agenda
Promote the CALABARZON Regional Development Research Agenda 2018-2022 and CALABARZON Information and Communications Technology Plan 2018-2022 to the academe, government agencies, local government units, private firms through all forms of media and methodologies
Strengthening the STI Infrastructure
• Promote the R&D and innovation centers in the Region to the private firms, academe, local government units and government agencies, through all forms of media and methodologies
• Develop more innovation hubs (technology business incubation, food innovation centers and other similar mechanisms)
Promote policies supportive of technology development and innovation
• Strengthen the promotion of RA 8439 or Magna Carta for Scientists, Engineers, Researchers and other S&T Personnel in the Government and RA 11035 or the “Balik Scientist Act” to the academe, government agencies, local government units, private firms through all forms of media and methodologies, to achieve and

180 | Regional Development Plan 2017-2022
Major Programs and Projects
maintain the talent and manpower to sustain the drive for STI
• Provide more budgetary support and incentives to local scientists/innovators and R&D
• Increase R&D budget of the oversight and attached agencies
Open collaboration among actors in the STI ecosystem strengthened
Establish strong linkages between STI actors
Forge partnership with PhilDev to expand the ISIP Project to the Region
Boost efforts to produce and gather relevant and up-to-date STI statisticsImprove efforts to produce timely and relevant data collection of Regional
disaggregated and inter-agency reports generated to keep track of the STI-related SDG indicators and its contribution to the RDP 2017-2022:
• DOST to consolidate list of Regional data indicators on baseline targets and performance accomplishments to effectively monitor the STI sector at the Regional level
• Mainstreaming of the results of the NEDA R&D Scoping Study on STI Statistics
• Adoption of STI statistical framework for Regional utilization of data gathering, identifying data gaps, policy making, monitoring of the RDP/RM indicators
• Strengthen CHED oversight on requiring all SUCs and HEIs to submit data on enrolment and graduates in their Higher Education Management Information System (HEMIS)
PURPOSE PROGRAMS AND PROJECTS
Technology Adoption Promoted and Accelerated and Innovation Stimulated
1. SETUP 2.02. Grants-In-Aid-Community Based Projects (GIA-CBP)3. Establishment/upgrading of innovation hubs in support of S4CP and Niche Centers in the Regions
for R&D (NICER) under the Collaborative R&D Program for the Academe, Industry and Government Institutions:• Makapuno R&D Center in Quezon Province• Tropical Wine and Distilled Spirits R&D Center in Quezon Province• Micro-Hydro R&D Center in Rizal Province• Productivity Design R&D Center in Cavite Province
4. CEST Program and Agroforestry Support Program for Enhancing Resiliency of Community-Based Forest Management Areas (ASPIRE-CBFM)
5. S&T fairs promoting S&T innovations and entrepreneurship for STI advocacy6. Support program on ICT Innovations and harmonization of Data Analytics-Ready Info Unified
System (DARIUS) 7. Enhancement of research capabilities of schools/SUCs to provide an environment for innovation
through theRDCHIME and 21st CLEM Classroom 8. Support programs for disaster prevention and mitigation and project on CHERM9. Advancing the global competitiveness of the food manufacturers in CALABARZON through programs
on Food Safety, Nutrition, and Health10. Technology Innovation for Commercialization (TECHNICOM) Program11. National Intellectual Property Strategy Project12. Trademark Incentive Projects - “Juana Make A Mark”, “Juana Invent” and “Juana Design”13. Mind2Market Program
Disaster Prevention, Mitigation and Response
Taal Volcano Eruption1. Technologies development/provision:
• maps of the Taal Volcano and its surrounding areas generated during the Disaster Risk and Exposure Assessment for Mitigation (DREAM)
• effective, easy to install/use, collapsible toilet bowl • Emergency Food Reserve Sagip Nutrifood Powder, an energy food in powder form, made from
a mixture of cassava, malunggay, camote, and monggo intended to feed hungry victims, and as alternative healthy food additive to various food products

Chapter 14 Vigorously Advancing Science, Technology and Innovation | 181
PURPOSE PROGRAMS AND PROJECTS
• Ready-to-Eat sweet potato and cassava cubes in syrup that can be eaten by victims outright with no need for cooking or any preparation
• designs for evacuation tents, crushing machine for spent medical vials, agro-machineries designs for livelihood purposes.
• weather forecasting and other related phenomena • volcanoes and earthquakes monitoring
2. extension/refund deferment of financial obligation to MSME beneficiaries that were temporarily closed due to the ECQ and those affected by the eruption
3. R&D on the utilization of ash fall for bricks and hollow blocks 4. alternative source of livelihood to selected LGUs affected by the eruption
COVID-19 PandemicDisease Awareness:
• Pinoy Animation Laban sa COVID-19 infomercials • eTURO Webinar Series on Engaging Communities and Networks (WE CaN!!)
Disease Detection:1. Online Web and Mobile Applications
• DOST Mobile App • COVID-19 CORe (Communication, Ongoing projects, Research) web portal • Feasibility Analysis of Syndromic Surveillance Using a Spatio-Temporal Epidemiological Modeler
for Early Detection of Diseases (FASSSTER) and TANOD COVID-19 • Contact-tracing apps and systems• Personal health assessment and monitoring tools• Goods and supplies delivery system • LGU-level community monitoring:• Relief Allocation Management, Distribution, and Monitoring (RAMDAM) • satellite images mobilization to monitor areas of interest during community quarantine
2. Development and deployment of testing kits, health and protective supplies, equipment and facilities• GenAmplifyTM CoronaVirus Disease-2019 rRT-PCR Detection Kit• RxBoxes • GINHAWA ventilator • respiratory venturi valves • SaniPod • specimen collection booths • 3D printed face shields mass production • bamboo-framed face shields • mobile AI-enabled thermal scanners • non-contact thermal scanners for frontliners • reusable and water repellant face masks • high performance computing resources to COVID-19 R&D project of Folding@Home • upgrading of DOH’s network capacity to 1000Mbps through PREGINET to support its activities
such as the use of multiple network-based communication platforms, data transfers, research, telemedicine, and other network-supported activities.
• quarantine centers • sterilization services using e-beam for medical devices • CHERM Hazard Mapping for COVID -19• prototyping & development of biological control equipment for personal protection (faceshield/
mechanical ventilator production) • free analysis in the DOST Regional Standards and Testing Laboratory of ethanol content of
lambanog and of the non-branded alcohol-based products supplied to LGUs, hospitals and other government institutions prior to use.
• operationalization of DOST Region IV-A’s Ideation, Design Development Laboratory in LSPU San Pablo capable of producing PPEs (face shield templates and ventilator valve prototypes from 3D prints, among others
• volunteer services 3. Disease Cure
• virgin coconut oil trial • World Health Organization’s Solidarity Treatment Trials • Drug Discovery Program - Lagundi, Tawa Tawa • development and animal and clinical testing of vaccines and drugs for COVID-19
4. Research Study pertaining to the Disease• Clinical Characteristics and Transmission Patterns of COVID-19 in Confirmed Cases and their
Contacts in the Philippines

182 | Regional Development Plan 2017-2022
PURPOSE PROGRAMS AND PROJECTS
• In-vitro Study on the Efficacy of Lauric Acid and its Derivatives against SARS-CoV-2 • Study on the Transmission patterns of COVID-19• R & D on novel food technologies adapted for food security during disruptions like typhoons
and pandemics • Study on “Emotions, Feelings and Behaviors during the COVID-19 Pandemic” to see how people feel
and respond to the pandemic• other researches on COVID-19 in different areas:
• In the area of epidemiology, modelling studies, which are mostly mathematical, can help better understand how the epidemic will evolve. Input of health data into these disease models, as the epidemic progresses, will be very important to provide government planners scientific projections on how this epidemic will progress. The data generated will be very helpful in forward planning by concerned government agencies to anticipate, prepare and dampen the effects of this epidemic on different aspects of national life, including the economy.
• In the area of diagnostics, whereas current tests are focused on the detection of the virus in affected patients, tests determining the presence of antibodies mounted by the human hosts should also be developed. These antibody-based assays will help determine the patients who were truly infected, whether symptomatic or asymptomatic. It may catch the cases missed by the tests for detecting infection as these tests may have been done too early or too late in the disease. The tests to detect antibodies will determine the true burden of disease and as well as provide added information on the infectiousness, transmission dynamics and progression of the disease. These tests may also be used for predicting chances for development of complications as well as mortality, especially if the antibodies are proven to be neutralizing antibodies.
• In the area of therapeutics, the country should participate in clinical trials that would have already been initiated by other countries to help us better understand patient responses to this therapy and determine whether different genetic backgrounds, cultures and environment may affect patient response. Moreover, participation in these multi-country studies can facilitate its availability in our country when the results become significant.
• In the area of prevention and the development of vaccines, knowing more about the virus, its genetic makeup and how fast it mutates or changes will accelerate its development. Characterizing the molecular and genetic structure as isolated from patients in the Philippines can be contributed to the international database that will serve as references for vaccine development. This will ensure that the vaccines developed can induce protection against all of the circulating SarsCoV2 viruses isolated from patients anywhere else in the world.
• In the area of host factors, genetic biomarkers may be identified that may either predispose or make people less susceptible to the infection. They may also be used to determine risk for severity of disease and complications.
5. Support to the Movement of Health Workers and Essential Goods• RapidPassPH
6. Support to Households and Communities affected by the Disease Pandemic• GALING-PCAARRD Kontra COVID-19 Program • Ready-To-Eat Foods (arroz caldo) distribution • livelihood technologies online, home-based educational materials, and webinars • home-based study using e-learning methods and materials to all students of Philippine Science
High School System campuses in the Philippines• online access to consultants with expertise on food safety, business management, using the
OneExpert • enrolment of qualified products of SETUP and GRANTS-IN-AID programs beneficiaries to DOST’s
OneStore Program to expand their market penetration via online selling• three months payment deferment to SETUP Beneficiaries
Legislative AgendaLEGISLATIVE AGENDA DESCRIPTION
An Act Establishing the Science for Change Program (S4CP)
The proposed law aims to accelerate investments in S&T and boost scientific innovations and inventions, and research and development to further enhance the country’s global competitiveness. The S4CP Bill consists of four components - Program expansion, new programs, grand plan for S&T human resource development, and accelerated research and development program
Provincial Science and Technology Office (PSTO) Act
This bill aims to strengthen the Provincial S&T Centers by improving the organizational structure and human resource complement to address the increasing demand for S&T services in the provinces

Chapter 13 Reaching for the Demographic Dividend | 183

184 | Regional Development Plan 2017-2022

Chapter 15 Sound Macroeconomic Policy | 185

186 | Regional Development Plan 2017-2022

Chapter 15 Sound Macroeconomic Policy | 187
Chapter 15
Sound Macroeconomic PolicyThis chapter assesses the macroeconomic performance of the Region in the first half of the plan period and identifies key challenges and strategic interventions to expand and increase economic opportunities towards growth and development.
The overall economic situation of CALABARZON improved with rapidly paced economic growth driven mainly by the manufacturing sector. Growth targets for 2017 and 2018 were met; however targets for the agriculture sector were not met. Employment and underemployment levels also improved despite the growing population and work force in the Region due to more employment opportunities in industry. While inflation peaked to as high as 4.8 percent in 2018, it was kept within the Regional target of below five percent. Despite these economic gains, eradicating poverty in the Region remains a challenge as shown by persistent poverty in rural and predominantly agricultural areas. Furthermore, the role of local government units in delivering social services and bringing about local development is highlighted with the coming increase of the internal revenue allotment.
In the first semester of 2020, two major crises occurred that will affect economic prospects of the country and the CALABARZON Region. These are the Taal Volcano eruption in January which significantly affected the provinces of Batangas and Cavite, and the COVID-19 pandemic. In order to prevent the fast spread of the virus of the President declared an ECQ in the entire Luzon. This halted operations of many businesses and movement of people, goods, and services. Mitigating the adverse effects of the COVID-19 pandemic and the Taal Volcano eruption to the e economy, particularly on prices, employment, income and poverty is crucial for the Region to be able to meet its economic growth targets for the remaining half of the plan period.
To attain macroeconomic stability, the Region will have to: a) increase and sustain high economic growth; b) diversify to new investment areas with high value and market potential; c) improve overall business climate through infrastructure development and regulatory reforms; d) increase competitiveness of its workforce; e) create economic opportunities in lagging and rural areas to reduce poverty; f) promote price stability; g) develop sound fiscal policies for inclusive financial systems; h) strengthen capacity of local governments on financial management; and i) increase assistance to vulnerable groups to avert increased poverty risks in the sectors that were severely affected by major disasters.

188 | Regional Development Plan 2017-2022
Sustained economic growthCALABARZON sustained a rapidly paced economic growth at an annual average of 6.3 percent from 2016 to 2018 and remained as the second-largest contributor in terms of share of its Gross Regional Domestic Product (GRDP) to the national output.
From 2017 to 2018, the Region’s economy experienced high growth fueled by the strong performance of the industry sector. In 2017, the Region was able to recover from the low growth in the previous year with improved performance of the manufacturing and real estate and renting subsectors and surge in
construction activities. With a growth of 6.7 percent, the Region was able to meet the upper end of its plan target.
High growth was sustained in 2018 which reached 7.3 percent with the continued expansion of the manufacturing sector by 8 percent that accounts for 54 percent of the Region’s economy. This marks the highest recorded growth since 2013 and exceeds the upper end of the plan target at 7.1 percent.
Continuous efforts of government in putting in place a conducive environment for generating more investments and value-adding of local and export products have contributed to the positive performance of the economy.
Assessment and Challenges
Table 15.1 Gross Regional Domestic Product by Industrial Origin, CALABARZON (at constant 2000 prices)
SECTOROUTPUT (IN PHP ‘000)
2016 2017 2018
GROSS RegionAL DOMESTIC PRODUCT 1,364,736,594 1,456,341,332 1,562,497,002
Agri, Hunting, Forestry and Fishing 74,622,793.00 74,146,533.00 74,650,856.00
Agriculture and Forestry 57,277,196.00 57,738,750.00 59,290,723.00
Fishing 17,345,598.00 16,407,782.00 15,360,142.00
Industry Sector 836,700,049 901,666,083 973,201,658
Mining and Quarrying 2,648,823.00 2,676,401.00 2,769,495.00
Manufacturing 726,067,511.00 779,711,982.00 842,437,003.00
Construction 62,483,768.00 72,252,342.00 79,148,432.00
Electricity, Gas and Water Supply 45,499,947.00 47,025,358.00 48,846,728.00
Services Sector 453,413,752.00 480,528,716.00 514,644,480.00
Transport, Storage & Communication 91,486,723.00 94,911,531.00 99,214,592.00
Trade and Repair of Motor Vehicles, Motorcycles, Personal & Household Goods
103,733,090.00 107,904,495.00 114,113,623.00
Financial Intermediation 52,572,153.00 56,479,741.00 61,439,169.00
Real Estate, Renting & Business Activities
121,736,010.00 130,126,008.00 137,959,712.00
Public Administration & Defense, Compulsory Social Security
16,447,111.00 17,918,810.00 20,688,545.00
Other Services 55,031,923 56,216,928 81,228,839
Source: Philippine Statistics Authority (PSA)

Chapter 15 Sound Macroeconomic Policy | 189
Table 15.2 Growth Rate of Gross Regional Domestic Product by Industrial Origin (at constant 2000 prices)
SECTORGROWTH RATE (%)
2016 2017 2018
GRDP Growth Target 6.6-7.6 5.2-6.8 5.3-7.1
GRDP Growth (Actual) 4.8 6.7 7.3
Agri, Hunting, Forestry and Fishing 3.4 -0.6 0.7
Agriculture and Forestry 4.6 0.8 2.7
Fishing -0.3 -5.4 -6.4
Industry Sector 3.7 7.8 7.9
Mining and Quarrying -1.8 1.0 3.5
Manufacturing 3.7 7.4 8.0
Construction 1.0 15.6 9.5
Electricity, Gas and Water Supply 6.7 3.4 3.9
Services Sector 7.3 6.0 7.1
Transport, Storage & Communication 6.6 3.7 4.5
Trade and Repair of Motor Vehicles, Motorcycles, Personal & Household Goods
6.1 4.0 5.8
Financial Intermediation 8.4 7.4 8.8
Real Estate, Renting & Business Activities 7.2 6.9 6.0
Public Administration & Defense, Compulsory Social Security 7.4 8.9 15.5
Other Services 9.3 8.5 11.0Source: Philippine Statistics Authority (PSA)
Table 15.3 Percent Distribution of Gross Regional Domestic Product 2014 to 2018, (at constant 2000 prices)
INDUSTRY 2016 2017 2018
AHFF 5.5 5.1 4.8
Agriculture and Forestry 4.2 4.0 3.8
Fishing 1.3 1.1 1.0
Industry 61.3 61.9 62.3
Mining and Quarrying 0.2 0.2 0.2
Manufacturing 53.2 53.5 53.9
Construction 4.6 5.0 5.1
Electricity, Gas and Water Supply 3.3 3.2 3.1
Services 33.2 33.0 32.9
Transport, Storage & Communication 6.7 6.5 6.3
Trade and Repair of Motor Vehicles, Motorcycles, Personal & Household Goods 7.6 7.4 7.3
Financial Intermediation 3.8 3.9 3.9
Real Estate, Renting & Business Activities 8.9 8.9 8.8
Public Administration & Defense, Compulsory Social Security 1.2 1.2 1.3
Other Services 5.0 5.0 5.2
Source: Philippine Statistics Authority (PSA)

190 | Regional Development Plan 2017-2022
The Taal Volcano eruption significantly affected the municipalities and cities in the provinces of Batangas and Cavite surrounding the Taal Lake. The eruption has an estimated impact of PHP 8.42 billion1, equivalent to 0.33 percent of the Region’s 2018 GRDP. Due to the calamity, agricultural and industrial production and some operations in the services sector were disrupted. The biggest losses were incurred by the production sector amounting to PHP 4.45 billion due to the large losses suffered by the agriculture subsector, accounting for 65 percent of total losses in the sector.
On March 16, 2020 President Rodrigo Duterte declared an Enhanced Community Quarantine in the entire Luzon effective from March 17 to April 13, 2020 due to the sharp increase in the number of COVID-19 positive cases and to stem the further community transmission of the virus. The ECQ halted the operation of many establishments in the industry and services sector which were deemed “non-essential” or otherwise not exempted (e.g. BPO industry). For the agriculture sector, disruption in the flow of agricultural produce is expected to result to income losses among farmers and fisherfolks. For the industry sector, most manufacturing establishments will have bigger losses due to work interruption and the need to comply with the new health and safety requirements after the ECQ. Only those involved in food and health supply chains are expected to retain their production levels. The services sector is most likely to suffer the biggest income losses due to tight restrictions that heavily affected retail trade, air transport, and tourism activities.
The ECQ will have a significant impact on the Philippines’ and CALABARZON Region’s economic performance with disruption in economic activities, reducing supply and freezing consumption by limiting flows of trade, tourism, and commodities. 1 Rehabilitation and Recovery Program for Taal Volcano Affected Areas (Chapter 3 – Damage Assessment), (NEDA Region IV-A, April 2020)
Based on NEDA’s estimates2, both external and internal impacts of the COVID-19 pandemic can lead to a reduction in the Philippine’s real GDP growth to -1.0 to 0.0 percent in 2020. Among the Regions, CALABARZON is expected to incur the largest amount of losses, estimated at PHP 314.63 billion or 41 percent of the total losses in the country based on the initial estimated impact of Luzon ECQ3.
The country’s economic outlook in 2020 and in the coming years will also be affected by the global economic recession brought about by the COVID-19 pandemic and continuing trade tensions among major global economies. Thus, government needs to implement swift, appropriate, and holistic measures to reduce impacts to the economy and vulnerable groups in society. Prioritization of programs and projects to avert contraction in the most affected sectors, enhancements on the implementation, coverage and reach of social protection programs, and recalibration of strategies to ensure a more resilient economy with reduced vulnerabilities against natural and public health disasters are also important measures in the transition to a ‘new normal’ economy.
Agriculture and fisheries
The agriculture and fisheries sector showed no significant growth and remains to be the lagging economic sector of the Region. The sector posed a negative growth of 0.6 percent in 2017 and achieved only a third of the lower end of its target growth in 2018. The dismal performance of the fisheries subsector negated the marginal growth in the agriculture subsector and resulted to a contraction of the whole sector in 2017. Supply shocks were also experienced due to changing weather patterns and occurrence of Avian Influenza.
2 National Economic Development Authority. (April 17, 2020). Defining the New Normal and Ways Forward.3 Inter-agency Task Force Technical Working Group For Anticipatory and Forward Planning. (2020). We Recover as One.

Chapter 15 Sound Macroeconomic Policy | 191
Table 15.4 Growth Rate of Agriculture and Fisheries Output (at constant 2000 prices)Region/YEAR 2015-2016 2016-2017 2017-2018
Philippines -1.2 4.0 0.9
NCR 2.5 0.7 0.4
CALABARZON (Actual) 3.4 -0.6 0.7
CALABARZON (Target) 3.2-4.2 2.0-3.5 2.2-3.7Source: Philippine Statistics Authority (PSA)
In 2018, fisheries further declined to 6.4 percent due to closure of fish ponds and limited supply and inferior quality of fingerlings. Meanwhile, agriculture exhibited an upturn of 2.7 percent growth due to the improvement of both crops and livestock subsectors resulting to a slight recovery of the whole sector at 0.7 percent. Unsustainable fishing practices need to be addressed to meet the sector targets for the remaining half of the plan period.
Despite the small share of the agriculture and fisheries sector to the Region’s economy, CALABARZON ranks as the second highest in terms of national agricultural output next to Central Luzon. The Region is the top producer of various agricultural commodities in the country, including roundscad (1st), tilapia (2nd), eggplant (3rd), calamansi (2nd), chicken eggs (1st), chicken (2nd), hog (2nd), and cattle (3rd).
Heavy ashfall due to the Taal Volcano Eruption in January 2020 damaged crops and fish cages and affected 11,178 farmers and 6,923 fisherfolks in municipalities around the Taal Lake4, which were mostly agriculture-based economies. Production in the following agricultural commodities incurred the highest losses in the affected municipalities of Batangas and Cavite: fisheries (37 percent of total for all sectors), crops (19 percent), and livestock (3 percent). For fisheries, a total of 60.71 hectares of fish cages and 51.20 hectares of fishponds of tilapia and milkfish were damaged. Meanwhile, around 89 percent of total losses in crops subsector were incurred by high value crops, majority of which occurred in Tagaytay City which accounts for 44 percent of total losses in the subsector.
The enforcement of ECQ affected the delivery of agricultural inputs and outputs within and outside the Region due to the presence of numerous checkpoints
4 The Taal Volcano Eruption affected the following 12 municipalities and three cities around the Western Portion of the Taal Lake: Agoncillo, Alitagtag, Balete, Cuenca, Laurel, Lemery, Lipa City, Malvar, Mataasnakahoy, San Nicolas, Sta. Teresita, Taal, Talisay, Tanauan City, and Tagaytay City (Post-Disaster Needs Assessment Report, 2020)
and restricted movement of agricultural workers. Local farmers also found it difficult to sell their products due to limited market operating hours and curfew imposed by the LGUs. Based on the business rapid assessment survey for agriculture and fisheries sector, the direct losses from unsold produce in the Region is estimated at PHP 26.3 million which accounts for the biggest proportion of losses among the Regions at 36 percent (Inter-agency Task Force Technical Working Group For Anticipatory and Forward Planning (TWG-AFP), 2020).
Industry
Contributing more than two-thirds to total Regional output, the industry sector remains as the main driver of economic growth in CALABARZON. Output growth accelerated and exceeded targets in 2017 and 2018. This can be attributed to the sharp improvement in the performance of manufacturing from 3.7 in 2016 to 8.0 in 2018.
All other subsectors posted positive growth from 2016 to 2018 with varying trends. Both mining and quarrying, and electricity, gas and water supply were able to expand from

192 | Regional Development Plan 2017-2022
Table 15.5 Growth Rate of Industry Output(at constant 2000 prices)Region/YEAR 2015-2016 2016-2017 2017-2018
Philippines 8.0 7.1 6.7
NCR 5.1 2.0 0.5
CALABARZON (Actual) 3.6 7.8 7.9
CALABARZON (Target) 5.5-6.5 5.0-7.0 5.2-7.0
Source: Philippine Statistics Authority (PSA)
2016 onwards. Meanwhile, construction more than doubled from 2016 to 2017 at 15.6 percent but declined from 2017 to 2018 to 9.5 percent.
Contributing an average share of 86.6 percent in the past eight years, manufacturing is consistently the main source of total industry output in the Region. The fast-paced growth in manufacturing can be attributed to the high performance of the export and foreign markets and continuous demand for electronic products, machinery and transport equipment, metals and chemicals.
CALABARZON remains as the industrial powerhouse of the country with the biggest share to total industrial output at 31 percent in 2018.
Based on the guidelines on ECQ, private establishments that provide basic necessities5 will continue to operate on a skeletal workforce; thus, these sectors will have lower losses. However, the following sectors which are not exempted from the suspension of business operations will sustain higher losses: manufacturing industries not involved in food and health supply chains, non-export oriented industries, construction, and mining and quarrying. 5 Per ECQ Guidelines, only the private establishments providing basic necessities and such activities related to food and medicine production, i.e., public markets, supermarkets, groceries, convenience stores, hospitals, medical clinics, pharmacies and drug stores, food preparation and delivery services, water-refilling stations, manufacturing and processing plants of basic food products and medicines, banks, money transfer services, power, energy, water and telecommunications supplies and facilities, shall be open during the quarantine period(https://www.officialgazette.gov.ph/downloads/2020/03mar/20200316-MEMORANDUM-FROM-ES RRD.pdf?fbclid=IwAR1JhY1sy_nU49m3_GQT04ivaAGKWyg3vBmasz9mp96t59wnCrHkEH1gMcM))
As the result of the ECQ, the industry sector in CALABARZON incurred foregone revenue of PHP 287.6 billion which is 49.3 percent of the total losses in the country. The Region suffered its biggest loss in manufacturing wherein foregone revenue is estimated at PHP 282.4 billion, which accounts for 89 percent of the initial total impact of the ECQ in CALABARZON (TWG-AFP, 2020).
Services
The Region has the second largest share in the national output of the services sector next to the National Capital Region. Recovering from a downturn in 2017, the services sector achieved the upper end of its
target for 2018 with a growth of 7.1 percent. This can be attributed to high growth recorded in most of its subsectors, namely: public administration (15.5 percent); other services (11 percent); and financial intermediation (8.8 percent). Other sources of growth in the sector include increased government spending on operations, maintenance and personnel services; robust banking and lending activities; and strong household consumption.
The Services Sector in the Region was also affected by the enforcement of ECQ in Luzon due to the closure of shopping malls and other commercial establishments, suspension of transportation services, and

Chapter 15 Sound Macroeconomic Policy | 193
the decline in the tourist arrivals because of travel restrictions. Meanwhile, food preparation and delivery services, banks and money transfer services, hospital, and business process outsourcing activities are expected to incur lower losses since these sectors were exempted from work suspension based on the ECQ Guidelines.
NEDA reported that the direct economic impact of COVID for the Philippines is expected to be most evident in travel and tourism, remittances, consumption, and trade, while economic losses sustained due to the enforcement of the ECQ will be biggest in retail trade (mall closures), air transport (closure of airports and cancellation of flights), and other manufacturing and service activities that are not part of food and health-related supply chains.
Among the affected Regions, CALABARZON suffered the biggest foregone revenue in tourism at PHP 8.59 billion or 23 percent of the total based on the 2018 data on tourist arrivals. Meanwhile, the foregone revenue in terms of retail trade is estimated at PHP 18.4 billion or 18.8 percent of the country’s total, the second-highest next to NCR6
Per capita GDP
The Region’s per capita GRDP grew at annual average of 3.5 percent from 2016 to 2018. Among Regions, CALABARZON has the second highest per capita GRDP of PhP 104,708. This reflects the sustained economic performance of the Region despite its increasing population. 6 Report of the Inter-agency Task Force Technical Working Group for Anticipatory and Forward Planning. (As of April 2020). We Recover as One.
Table 15.6 Growth Rate of Services Output (at constant 2000 prices)Region/YEAR 2015-2016 2016-2017 2017-2018
Philippines 7.5 6.8 6.8
NCR 8.0 7.1 5.8
CALABARZON (Actual) 7.3 6.0 7.1
CALABARZON (Target) 9.0-10.0 6.0-7.6 6.1-7.7Source: Philippine Statistics Authority (PSA)
Table 15.7 Per Capita Gross Domestic Product in Pesos (at constant 2000 prices)Region/YEAR 2016 2017 2018
Philippines 78,682 82,593 86,370
NCR 232,739 244,589 253,893
CALABARZON 94,811 99,346 104,708 Source: Philippine Statistics Authority (PSA)
Labor and employment
CALABARZON, having the biggest population in the country, also has the largest labor force at 10,096 persons with a labor force participation rate of 62.7 percent in 2018.
Favorable trends of declining unemployment and underemployment rates and increasing levels of employment generation were observed from 2016 to 2018. Unemployment rate was kept within
the plan target of 7 to 9 percent and was even recorded at 6.6 percent in 2018. Meanwhile, underemployment gradually declined from 15.5 percent in 2016 to 13.4 percent in 2018, meeting its annual targets and indicating the availability of quality or adequately paying jobs.
The improved employment situation reflects the continuous generation of job opportunities in the Region brought about by increased economic activities in the services and industry sectors which has
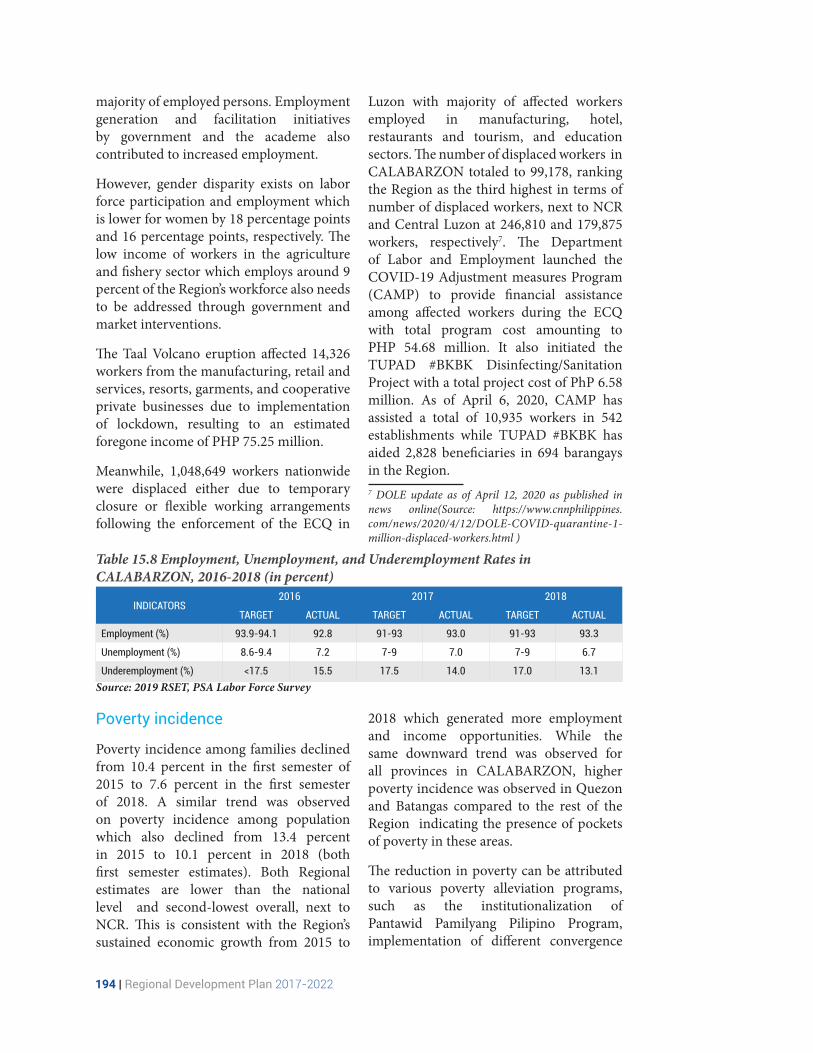
194 | Regional Development Plan 2017-2022
Table 15.8 Employment, Unemployment, and Underemployment Rates in CALABARZON, 2016-2018 (in percent)
INDICATORS2016 2017 2018
TARGET ACTUAL TARGET ACTUAL TARGET ACTUAL
Employment (%) 93.9-94.1 92.8 91-93 93.0 91-93 93.3
Unemployment (%) 8.6-9.4 7.2 7-9 7.0 7-9 6.7
Underemployment (%) <17.5 15.5 17.5 14.0 17.0 13.1Source: 2019 RSET, PSA Labor Force Survey
majority of employed persons. Employment generation and facilitation initiatives by government and the academe also contributed to increased employment.
However, gender disparity exists on labor force participation and employment which is lower for women by 18 percentage points and 16 percentage points, respectively. The low income of workers in the agriculture and fishery sector which employs around 9 percent of the Region’s workforce also needs to be addressed through government and market interventions.
The Taal Volcano eruption affected 14,326 workers from the manufacturing, retail and services, resorts, garments, and cooperative private businesses due to implementation of lockdown, resulting to an estimated foregone income of PHP 75.25 million.
Meanwhile, 1,048,649 workers nationwide were displaced either due to temporary closure or flexible working arrangements following the enforcement of the ECQ in
Luzon with majority of affected workers employed in manufacturing, hotel, restaurants and tourism, and education sectors. The number of displaced workers in CALABARZON totaled to 99,178, ranking the Region as the third highest in terms of number of displaced workers, next to NCR and Central Luzon at 246,810 and 179,875 workers, respectively7. The Department of Labor and Employment launched the COVID-19 Adjustment measures Program (CAMP) to provide financial assistance among affected workers during the ECQ with total program cost amounting to PHP 54.68 million. It also initiated the TUPAD #BKBK Disinfecting/Sanitation Project with a total project cost of PhP 6.58 million. As of April 6, 2020, CAMP has assisted a total of 10,935 workers in 542 establishments while TUPAD #BKBK has aided 2,828 beneficiaries in 694 barangays in the Region.7 DOLE update as of April 12, 2020 as published in news online(Source: https://www.cnnphilippines.com/news/2020/4/12/DOLE-COVID-quarantine-1-million-displaced-workers.html )
Poverty incidence
Poverty incidence among families declined from 10.4 percent in the first semester of 2015 to 7.6 percent in the first semester of 2018. A similar trend was observed on poverty incidence among population which also declined from 13.4 percent in 2015 to 10.1 percent in 2018 (both first semester estimates). Both Regional estimates are lower than the national level and second-lowest overall, next to NCR. This is consistent with the Region’s sustained economic growth from 2015 to
2018 which generated more employment and income opportunities. While the same downward trend was observed for all provinces in CALABARZON, higher poverty incidence was observed in Quezon and Batangas compared to the rest of the Region indicating the presence of pockets of poverty in these areas.
The reduction in poverty can be attributed to various poverty alleviation programs, such as the institutionalization of Pantawid Pamilyang Pilipino Program, implementation of different convergence

Chapter 15 Sound Macroeconomic Policy | 195
Table 15.9 Poverty Incidence Among Families, by Region (in percent)AREA 2012 2015 2018
PHILIPPINES 19.7 17.9 12.1
NCR 2.6 2.8 1.5
Region IV-A 8.3 9.1 5.0
Batangas 14.7 16.9 8.4
Cavite 2.6 6.1 3.7
Laguna 4.6 3.6 2.7
Quezon 20.3 18.4 9.3
Rizal 5.0 4.1 3.3Source: PSA
Table 15.10 Poverty Incidence among Population, by Region (in percent)AREA 2012 2015 2018
PHILIPPINES 25.2 23.3 16.6
NCR 3.6 4.1 2.3
Region IV-A 10.9 12.2 7.1
Batangas 19 21.4 11.2
Cavite 3.4 9 5.3
Laguna 6.4 4.9 3.9
Quezon 27.5 24.4 13.4
Rizal 6.1 6.1 4.5Source: PSA
initiatives of government agencies, and expansion of social protection programs such as social pension and health care coverage that have helped augment the income of poor and marginalized households.
The Region achieved its annual targets for poverty incidence among population and among families in 2018. In terms of magnitude, the number of poor Filipinos in the Region went down from 1.8 million in 2015 to 1.1 million in 2018 which translates to around 700,000 individuals in the Region that were lifted from poverty between this period. Among families, the number was down to 189,100 in 2018 from 308,000 in 2015 or 118,900 families out of poverty.
The Regional Development Council launched the Community Outreach and Yakap-Bayan Community Mobilization Program in 2017 to bring development
support to the 35 least developed municipalities in the Region with poverty incidence higher than the national level. As of 2019, outreach activities were conducted in Lian, Laiya, Calatagan, and San Juan in Batangas, Tagcauayan in Quezon, and Mabitac in Laguna.
Through the various government interventions aimed towards poverty reduction coupled with increased economic and income opportunities, the number of least developed municipalities in CALABARZON has declined from 35 in 2012 to 26 in 2015 (Table 15.11).
The Taal Volcano eruption and the COVID-19 outbreak affected poor households and individuals, whose source of livelihoods are vulnerable to income shocks. Households engaged in agriculture and fishing were heavily affected by the eruption as the sector sustained 65 percent

196 | Regional Development Plan 2017-2022
of total losses due to the disaster. Even after the disaster, not all farmers can immediately resume their livelihood as many of the agriculture areas have been affected by ashfall and need to be cleared.
Meanwhile, the imposition of home quarantine and suspension of “non-essential” business and mass public transport amid the COVID-19 outbreak caused the displacement of workers and placed restrictions on the ability of households in meeting their basic daily necessities. The most affected are minimum and daily wage earners, and those in the informal economy.
The combined impacts of the two disasters in terms of displacement of workers, income shocks, cost of illness, among others, can increase the risk of vulnerable families to fall into or fall deeper into poverty which in turn could hamper the achievement of poverty reduction targets in the Region. Thus, social protection and amelioration programs need to be provided quickly to address negative impacts to the marginalized.
Inflation
The prices of basic commodities followed a steep increasing trend from 0.9 percent in 2016 to 4.8 percent in 2018 due to
supply-side pressures in food and energy prices. The combined effects of shortage in the supply of rice due to the delayed rice importation of NFA in early 2018 combined with external issues including higher world oil price, and peso depreciation triggered high inflation for the entire second semester of 2018. Higher taxes on oil, cigarettes and sweetened beverages also contributed to inflation.
Regional and national rates reached peak levels in September 2018 at 6.2 percent and 6.7 percent, respectively. Both slowed down consistently towards the end of the fourth quarter of 2018, where it dipped below the Regional target of 5 percent and further declined at the onset of first quarter 2019 as the impacts of a stronger peso, monetary policy adjustments of the BSP, implementation of rice tariffication, and reduction in global oil prices materialized. The government also implemented measures to ease the impact of inflation on vulnerable sectors such as unconditional cash transfers and fuel vouchers.
The same upward trend in inflation is reflected among the provinces. However, Batangas and Quezon both exceeded the Regional inflation rate in 2018, at 4.9 percent and 5.9 percent, respectively which
Table 15.11 CALABARZON Least Developed Municipalities (based on 2012 & 2015 Small Area Poverty Estimates)
PROVINCEMUNICIPALITY
2012 2015
Batangas 1. Laurel2. Tingloy3. Lobo
4. Calatagan5. San Juan
1. Calatagan2. Laurel3. Tingloy
Laguna 1. Mabitac
Quezon 1. Jomalig2. Patnanungan3. San Andres4. Burdeos5. Buenavista6. Panukulan7. San Francisco8. San Narciso9. General Nakar10. Mulanay11. Agdangan12. Perez
13. Atimonan14.General Luna15. Tagkawayan16. Polilio17. Catanauan18. Macalelon19. Real20.Guinayangan21. Pitogo22. Calauag23.Padre Burgos24. Mauban
25. Quezon26. San Antonio27. Unisan28. Sariaya29. Lopez
1. Atimonan2. Buenavista3. Burdeos4. Calauag5. Catanuan6. General Luna7. General Nakar8. Guinayangan9. Jomalig10. Lopez11. Macalelon12. Mulanay
13. Panukulan14.Patnanungan15. Perez16. Pitogo17. Polillo18. Quezon19. Real20. San Andres21.San Francisco22. San Narciso23. Tagkawayan

Chapter 15 Sound Macroeconomic Policy | 197
may indicate supply deficiencies and access difficulties of major commodities.
During the first quarter of 2020, inflation rate in the Region faced both upward and downward pressures. The eruption of the Taal Volcano in January 2020 resulted to an increase in commodity prices in the Region. While the Regional inflation rate for January 2020 is lower compared to January 2019, however, month-on-month change in inflation rate accelerated with an increase of 0.4 index points from 3.1 percent in December 2019 to 3.5 percent in January 2020.
There was a faster uptick in inflation from December 2019 to January 2020, compared to the same period prior to the disaster. This can be attributed to the disruption in supply of agricultural commodities brought by the Taal Volcano eruption. As expected, the inflationary effects during the period
of the disaster were most evident in the affected provinces of Batangas and Cavite (Table 15.13).
Meanwhile, the COVID-19 Pandemic and the increasing number of positive cases in the country led to the month-long enforcement of the ECQ in Luzon effective March 17, 2020. The policy which required the suspension of mass public transport, home quarantine and restricted movement of people, and social distancing placed limitations on consumer spending. A nationwide state of calamity was also declared which called for the imposition of price freeze in all basic commodities effective until May 15, 2020.
The effects of the COVID-19 pandemic combined with the sharp decline in fuel price in the world market, posed an overall downward pressure to prices at the national and Regional level. National inflation rate
Table 15.12 Inflation RateRegion/PROVINCE 2016 2017 2018
Region IV-A 0.9 2.9 4.8
Batangas 2.1 3.0 4.7
Cavite -0.1 2.0 4.8
Laguna 0.4 3.5 4.9
Quezon 0.9 2.9 4.2
Rizal 1.4 4.0 5.9Source: 2019 RSET, PSA
Table 15.13 Comparison of Inflation Rates in CALABARZON, 2017-2020
Region/PROVINCE
PRE-DISASTER POST-DISASTER
2017-2018 2018-2019 2019-2020
Inflation (%) Inflation (%) Inflation (%)
Dec2017
Jan2018
Change (Dec’17 VS Jan
’18)
Dec2018
Jan2019
Change (Dec’18 to Jan
’19)
Dec2019
Jan2020
Change (Dec’19 VS Jan
’20)
Region IV-A 2.9 2.9 0.00 4.8 4.3 -0.50 3.1 3.5 0.40
Batangas 2.5 2.6 0.10 6.4 5.3 -1.10 2.2 3.5 1.30
Cavite 2.9 2.7 -0.20 4.5 4.1 -0.40 4.1 4.7 0.60
Laguna 2.4 2.8 0.40 4.6 3.9 -0.70 2.1 2.5 0.40
Quezon 4.9 5.5 0.60 3.5 3.3 -0.20 3.3 3 -0.30
Rizal 2.5 2.5 0.00 4.6 4.7 0.10 3.8 3.6 -0.20Source:Data derived from PSA Region IV-A
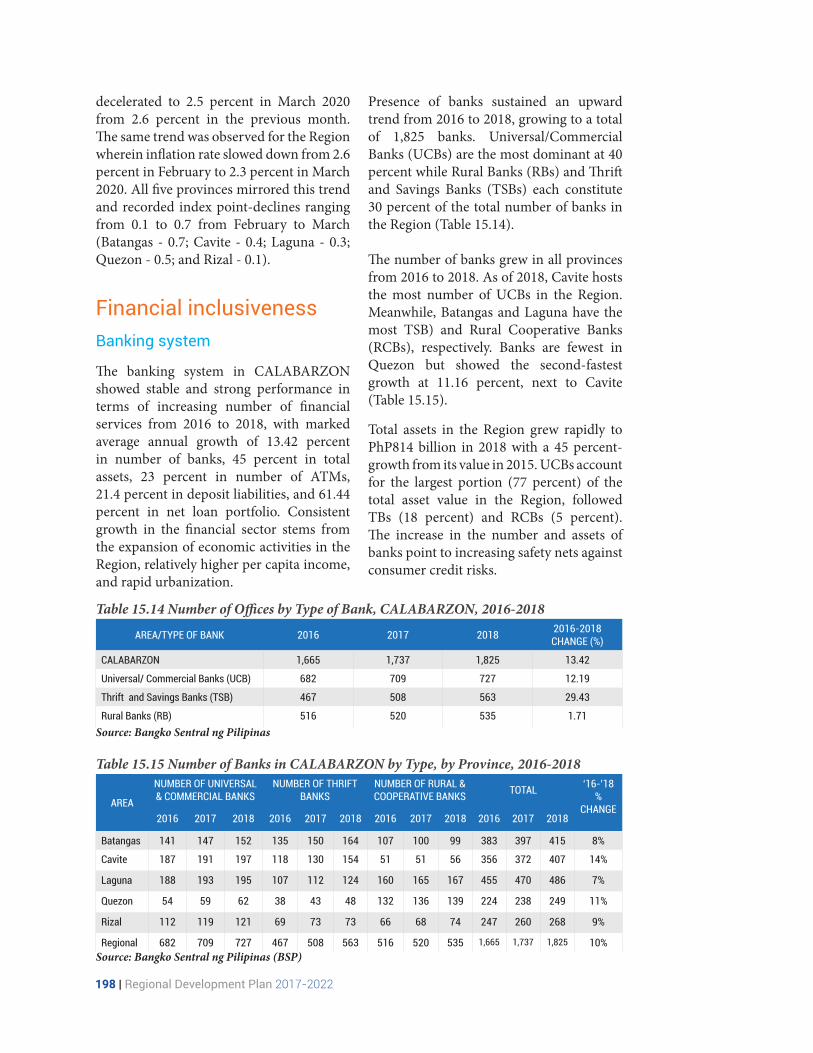
198 | Regional Development Plan 2017-2022
Table 15.15 Number of Banks in CALABARZON by Type, by Province, 2016-2018
AREA
NUMBER OF UNIVERSAL & COMMERCIAL BANKS
NUMBER OF THRIFT BANKS
NUMBER OF RURAL & COOPERATIVE BANKS TOTAL ‘16-’18
%CHANGE
2016 2017 2018 2016 2017 2018 2016 2017 2018 2016 2017 2018
Batangas 141 147 152 135 150 164 107 100 99 383 397 415 8%
Cavite 187 191 197 118 130 154 51 51 56 356 372 407 14%
Laguna 188 193 195 107 112 124 160 165 167 455 470 486 7%
Quezon 54 59 62 38 43 48 132 136 139 224 238 249 11%
Rizal 112 119 121 69 73 73 66 68 74 247 260 268 9%
Regional 682 709 727 467 508 563 516 520 535 1,665 1,737 1,825 10%Source: Bangko Sentral ng Pilipinas (BSP)
decelerated to 2.5 percent in March 2020 from 2.6 percent in the previous month. The same trend was observed for the Region wherein inflation rate slowed down from 2.6 percent in February to 2.3 percent in March 2020. All five provinces mirrored this trend and recorded index point-declines ranging from 0.1 to 0.7 from February to March (Batangas - 0.7; Cavite - 0.4; Laguna - 0.3; Quezon - 0.5; and Rizal - 0.1).
Financial inclusivenessBanking system
The banking system in CALABARZON showed stable and strong performance in terms of increasing number of financial services from 2016 to 2018, with marked average annual growth of 13.42 percent in number of banks, 45 percent in total assets, 23 percent in number of ATMs, 21.4 percent in deposit liabilities, and 61.44 percent in net loan portfolio. Consistent growth in the financial sector stems from the expansion of economic activities in the Region, relatively higher per capita income, and rapid urbanization.
Presence of banks sustained an upward trend from 2016 to 2018, growing to a total of 1,825 banks. Universal/Commercial Banks (UCBs) are the most dominant at 40 percent while Rural Banks (RBs) and Thrift and Savings Banks (TSBs) each constitute 30 percent of the total number of banks in the Region (Table 15.14).
The number of banks grew in all provinces from 2016 to 2018. As of 2018, Cavite hosts the most number of UCBs in the Region. Meanwhile, Batangas and Laguna have the most TSB) and Rural Cooperative Banks (RCBs), respectively. Banks are fewest in Quezon but showed the second-fastest growth at 11.16 percent, next to Cavite (Table 15.15).
Total assets in the Region grew rapidly to PhP814 billion in 2018 with a 45 percent-growth from its value in 2015. UCBs account for the largest portion (77 percent) of the total asset value in the Region, followed TBs (18 percent) and RCBs (5 percent). The increase in the number and assets of banks point to increasing safety nets against consumer credit risks.
Table 15.14 Number of Offices by Type of Bank, CALABARZON, 2016-2018
AREA/TYPE OF BANK 2016 2017 2018 2016-2018CHANGE (%)
CALABARZON 1,665 1,737 1,825 13.42
Universal/ Commercial Banks (UCB) 682 709 727 12.19
Thrift and Savings Banks (TSB) 467 508 563 29.43
Rural Banks (RB) 516 520 535 1.71Source: Bangko Sentral ng Pilipinas

Chapter 15 Sound Macroeconomic Policy | 199
Table 15.16 Total Assets by Type of Bank, CALABARZON, 2016-2018 (in billion pesos)
AREA/TYPE OF BANK 2016 2017 2018 2016-2018CHANGE (%)
CALABARZON 624.50 717.43 813.90 45.24
Universal/ Commercial Banks (UCB) 511.88 540.14 626.31 39.56
Thrift and Savings Banks (TSB) 75.08 136.21 143.33 92.60
Rural and Cooperative Banks (RCB) 37.54 41.08 44.26 19.04Source: Bangko Sentral ng Pilipinas
Table 15.17 Bank Density Ratio in CALABARZON, 2016-2018
PROVINCEBANK DENSITY RATIO
2016 2017 2018
Batangas 11 12 12.2
Cavite 15 16 17.7
Laguna 15 16 16.2
Quezon 5 6 6.1
Rizal 18 19 19.1
CALABARZON 12 12 12.9Source: Bangko Sentral ng Pilipinas
The bank density ratio in CALABARZON marginally increased from 12 percent in 2016 to 13 percent in 2018 which translates to 12 banks providing financial services for each city and municipality in the Region. Rizal consistently showed the highest bank density from 2016 to 2018 while Quezon had the lowest, falling well below the Regional ratio.
ATMs installed in the Region increased by 23 percent within three years. As of 2018, CALABARZON has a total of 3,167 ATMs (Table 15.18). Both onsite and offsite ATMs showed growth in the same period. UCBs dominate the ATM population accounting for 83 percent, followed by TBs (14
percent) and RCBs (2 percent). Improved accessibility of basic financial transactions is one of the benefits of increasing number of ATM machines.
Deposit liabilities showed consistent growth from 2016 to 2018. In 2018, UCBs contribute the highest proportion (84 percent) to the total value of deposit liabilities, followed by TSBs (12 percent) and RCBs (4 percent) (Table 15.19). Increasing value of deposit liabilities indicate increasing trust of consumers to the banking system.
The value of net loan portfolio increased rapidly from 2016 to 2018, accumulating a growth of 62 percent by the end of the
Table 15.18 Number of Automated Teller Machines, CALABARZON, 2016-2018
AREA/TYPE OF BANK 2016 2017 2018 2016-2018CHANGE (%)
CALABARZON 2,848 3,023 3,167 23.42
Onsite 1,421 1,483 1,518 16.68
Universal and Commercial Banks 1,076 1,135 1,168 19.43
Thrift Banks 269 272 278 12.10
Rural and Cooperative Banks 76 76 72 (4.00)
Offsite 1,427 1,540 1,649 30.36
Universal and Commercial Banks 1,250 1,358 1,474 34.12
Thrift Banks 167 169 171 6.21
Rural and Cooperative Banks 10 13 4 (20.00)Source: Bangko Sentral ng Pilipinas

200 | Regional Development Plan 2017-2022
Table 15.19 Deposit Liabilities by Type of Bank, 2016-2018 (in billion pesos)
AREA/TYPE OF BANK 2016 2017 2018 2016-2018CHANGE (%)
CALABARZON 731.26 812.38 887.76 21.40
Universal & Commercial Banks 614.61 673.45 744.14 21.08
Thrift Banks 81.02 96.81 107.40 32.56
Rural & Cooperative Banks 35.62 42.12 36.22 1.68Source: Bangko Sentral ng Pilipinas
Table 15.20 Net Loan Portfolio by Type of Bank, CALABARZON, 2016-2018 (in billion pesos)
AREA/TYPE OF BANK 2016 2017 2018 2016-2018CHANGE (%)
CALABARZON 143.51 190.50 233.12 62.44
Universal & Commercial Banks 81.82 126.19 165.19 101.89
Thrift Banks 47.11 48.89 55.68 18.19
Rural & Cooperative Banks 14.58 15.43 12.25 -15.98Source: Bangko Sentral ng Pilipinas
period (Table 15.20). UCBs exceeded this rate, marking a growth of 102 percent in 2018. Thrift banks also showed growth at 18 percent while RCBs registered a negative growth of 16 percent. In 2018, net loan portfolio totalled to 233 billion pesos, 71 percent of which is sourced from UCBs.
The Region continues to face the following issues in terms of ensuring an inclusive and resilient financial sector: a) limited access points and increasing concentration in urban centers which discourage capital market participation and access to business financing among the marginalized sectors and rural communities; b) stringent requirements by banks which discourage
MSMEs and the informal sector in availing financial services; and c) need to improve mobilization of financial resources into viable investments and savings mechanisms.
Microfinance services and cooperatives
Microfinance institutions cater to the needs of the low-income sector for financial services. Compared to the formal banking sector, financial products and services are offered by microfinance institutions with fewer requirements.
Overall, provision of microfinance services improved in the Region as the amount of loans outstanding and savings component
exhibited high and rapid growth from 2016 to 2018. Value and delivery of microfinance services showed strong performance despite the marginal decline in number of microfinance-oriented banks from 33 in 2016 to 32 in 2018. The amount of loans outstanding was valued at PhP 55 billion in 2018, marking a 63 percent growth for the past three years. Savings component more than doubled within the period, accruing to a total of PhP 28 billion in 2018. The number of borrowers grew by 28 percent within a span of three years which indicate
increased delivery of microfinance products and services to the low-income population.
CALABARZON has a total of 139 registered cooperatives in 2018 (Table 15.22). This indicates a growth of 78 percent from 2016 to 2018. It also exceeded its annual targets for the period and achieved 70 percent above its target in 2018. Increase in number of cooperatives is attributed to increasing demand for transport and credit cooperatives. Majority of the registered cooperatives in the Region are under the transport type with 50 cooperatives

Chapter 15 Sound Macroeconomic Policy | 201
Table 15.21 Microfinance Statistics, CALABARZON, 2016-2018
2016 2017 2018 GROWTH(2016-2018)
Number of banks 33 31 32 -3.03
Amount of loans outstanding (in million pesos) PHP 33,939.75 PHP 42,540.56 PHP 55,412.20 63.27
Number of borrowers 4,742,118 5,616,989 6,067,566 27.95
Savings Component (in million pesos) PHP 15,944.18 PHP 21,596.06 PHP 28,822.10 80.77Source: Bangko Sentral ng Pilipinas (RSET 2019)
Table 15.22 Number of Registered Cooperatives Per Year/Type: 2015-2018TYPE 2016 2017 2018
Advocacy 0 0 0
Agrarian 2 0 0
Agriculture 9 35 13
Bank 0 0 0
Consumers 18 19 20
Credit 19 32 35
Dairy 0 0 0
Federation 2 0 1
Fishermen 0 0 0
Health 0 0 0
Housing 0 0 0
Labor 0 0 0
Marketing 9 5 7
Multipurpose 0 0 0
Producers 9 10 7
Service 0 1 2
Transport 7 22 50
Union 0 0 0
Water 1 1 3
Worker 2 0 1
Total 78 125 139Source: CDA-Calamba Extension Office
followed by credit type with 35 cooperatives. Under the Public Utility Jeepney (PUJ) Modernization Program, jeepney drivers and operators are required to be organized into a formal group to be able to apply for transport routes and financial assistance.
Total cooperative assets in the Region more than doubled from PhP21.5 billion in 2016 to PhP71.1 billion in 2018 (Table 15.26). The large increase can be attributed to the increased number of cooperatives and improved accuracy of data collection due to transition from manual encoding to online encoding.
Local government resource mobilization
LGUs are mandated to implement development initiatives for the general welfare of its citizens and to achieve its local development goals. Upgrading of income levels and having more revenue channels aside IRA from the national government is needed to increase funds for development projects and facilitate financial self-reliance of LGUs.

202 | Regional Development Plan 2017-2022
Table 15.23 Total Cooperative Assets Based on Encoded AFS (in billion pesos)
2015 2016 2017 2018 2015-2018% increase
19.596 21.5 82.6 71.1 130.7%Source: CDA-Calamba Extension Office
Table 15.24 Revenue Type, Actual Collections, CALABARZON, 2016-2018 (in million pesos)
2016ACTUAL
(MILLION)
2017ACTUAL
(MILLION)
2016-2017 % increase/
(decrease)
2018ACTUAL
(MILLION)
2 0 1 7 - 2 0 1 8 % increase/(decrease)
Real Property Tax 12,813.30 15,061.96 17.55 16,448.62 9.21
Business Tax 10,402.20 12,336.76 18.60 14,594.41 18.30
Fees and Charges 3,655.10 4,238.02 15.95 4,887.00 15.31
Economic Enterprises 2,062.20 2,070.83 0.42 2,593.01 25.22Source: Bureau of Local Government Finance (BLGF) – CALABARZON
Total revenue collections of LGUs increased from 2016 to 2018 (Table 15.27). In 2018, the largest growth in revenue collections was sourced from economic enterprises (25 percent), followed by business taxes (18 percent), fees and charges (15 percent), and real property tax (9 percent).
Attainment of targets also improved within the three-year period. In 2016, the target collection was achieved for fees and charges only. In 2018, business taxes, fees and charges and economic enterprises surpassed their targets while real property tax accomplished 99.52 percent (Table 15.25).
The general increase in collections could be attributed to the implementation of the
automated Business Permits and Licensing System, updating of the local revenue code of the LGUs, capacity buildings on financial management, and regular evaluation of treasury and assessment operations.
Considering the increase of IRA share starting with the 2022 budget cycle with the implementation of the Supreme Court Ruling on the Mandanas Case, proper budgeting and utilization of additional funds will be essential to ensure improvement in the delivery of all devolved services. Meanwhile, the implementation of the Executive Order No. 17 will pose a challenge in the collections of real property tax among LGUs.
Table 15.25 Revenue Type, Targets, Accomplishments, CALABARZON, 2016-2018 (in million pesos)
REVENUE TYPE2016 2017 2018
TARGET (MILLION)
ACTUAL(MILLION)
% ATTAINED
TARGET (MILLION)
ACTUAL(MILLION)
% ATTAINED
TARGET (MILLION)
ACTUAL(MILLION)
% ATTAINED
Real Property Tax 15,276.37 12,813.30 83.88% 15,107.45 15,061.96 99.70% 16,528.03 16,448.62 99.52%
Business Tax 10,453.67 10,402.20 99.51% 18,881.38 12,336.76 65.34% 11,603.15 14,594.41 125.78%
Fees and Charges 3,243.89 3,655.10 112.68% 3,937.68 4,238.02 107.63% 4,214.06 4,887.00 115.97%
Economic Enterprises 2,115.1 2,062.20 97.50% 1,934.88 2,070.83 107.03% 2,062.25 2,593.01 125.74%
Source: BLGF – CALABARZON

Chapter 15 Sound Macroeconomic Policy | 203
Figure 15.1 Strategic Framework to Sustain a Sound Macroeconomic Policy
Table 15.26 Plan Targets to Sustain a Sound Macroeconomic Policy
INDICATORSBASELINE
2018 END OF PLAN TARGET1 RESPONSIBLE AGENCY
VALUE 2020 2021 2022
GRDP growth rates increased (%) 7.3 5.7-7.2 5.9-7.2 6.0-7.3 PSA
Agricultures and fisheries growth rates increased (%)
0.7 2.5-4.0 2.6-4.2 2.8-4.5 PSA
Industry growth rates increased (%) 7.9 5.6-7.1 5.8-7.1 6.0-7.2 PSA
Services growth rates increased (%) 7.1 6.3-7.8 6.4-7.9 6.5-8.0 PSA
Poverty incidence by population reduced (%)
10.1 6.5 6 5.5 PSA
Poverty incidence among families reduced (%)
7.6 4.7 4.4 4 PSA
Employment level generation increased ('000)
5,913 Increasing Increasing TBD PSA, DOLE
Unemployment rate kept within of 7-9% maintained
6.6 7-9% 7-9% 7-9% PSA
1 Macroeconomic targets for 2020- 2022 may be subject to change due to rebasing of GDP from 2000 to 2018 and revising to account for the impact of the Covid-19 Pandemic to the economy. The adjustment of targets for the remaining years of the plan period would require more information given the data limitations on its impacts to local supply chains, and that there is still no definitive projections on when the pandemic will likely end.
Action PlanStrategic Framework
Targets

204 | Regional Development Plan 2017-2022
INDICATORSBASELINE
2018 END OF PLAN TARGET1 RESPONSIBLE AGENCY
VALUE 2020 2021 2022
Underemployment rate of less than 17.5% achieved
13.40% 16.00% 15.50% 15.00% PSA
Maintained below 5% inflation rate achieved
4.8 <↓5% <5% <↓5% PSA, BSP
Ratio of local source of LGU income to total current operating income increased (%)
36.38% 36.20% 35.70% 37% BLGF
Financial (bank) system total assets growth rate increased
13% Increasing Increasing Increasing BSP
Number of banks increased
a. Universal & Commercial Banks 727 Increasing Increasing Increasing BSP
b. Thrift Banks 563 Increasing Increasing Increasing BSP
c. Rural & Cooperative Banks 535 Increasing Increasing Increasing BSP
Annual value of microfinance services delivery
a. Number of microfinance oriented banks increased
32 Increasing Increasing Increasing BSP
b. Number of borrowers increased 1,566,569 Increasing Increasing Increasing BSP
c. Amount of loans outstanding (PhP) 16,348.60 Increasing Increasing Increasing BSP
d. Savings component (inPhP million) increased
7,965.70 Increasing Increasing Increasing BSP
Bank Density Ratio increased 13 Increasing Increasing Increasing BSP
Number of banks per 100,000 population
Increasing Increasing Increasing BSP
Number of ATMs (on-site/off-site) increased
a. On-site 1,518 Increasing Increasing Increasing BSP
b. Off-site 1,649 Increasing Increasing Increasing BSP
Number of Non-Banks Financial Institutions
a. Financing Companies with QBS 11 Increasing Increasing Increasing BSP
b. Pawnshops 1,539 Increasing Increasing Increasing BSP
c. FXD/MC 137 Increasing Increasing Increasing BSP
d. FXD/MC/RA 1,323 Increasing Increasing Increasing BSP
e. RA 630 Increasing Increasing Increasing BSP
Revenue collection efficiency improved (in PHP million)
a. Real Property Tax 16,448.62 16,898.00 17,589.00 18,008.00 DOF-BLGF
b. Business Tax 14,594.41 14,078.00 14,816.00 14,947.00 DOF-BLGF
c. Fees and Charges 4,887.00 5,306.00 6,118.00 7,054.00 DOF-BLGF
d. Economic Enterprises 2,593.01 2,156.00 2,165.00 2,174.00 DOF-BLGF
Number of registered cooperatives increased
139 84 85 86 CDA
Total number of credit cooperatives 35 18 19 19 CDA
Total cooperative assets increased (in PhP billion)
71.1 22.4 22.6 22.8 CDA

Chapter 15 Sound Macroeconomic Policy | 205
StrategiesTo address the challenges encountered in the first two years of plan implementation, strategic interventions are identified. These interventions aim to ensure attainability of macroeconomic targets by the end of the plan period.
Improve the productivity of the agriculture and fisheries sector
The sector showed stagnant growth in the production of crops, marginal growth in the livestock and poultry subsector and consistent contraction in the fisheries subsector.
In order to achieve growth targets, the productivity of the sector must be enhanced through strengthening of efforts on: a) farm modernization through the use of technologies in production such as farm mechanization and farm irrigation to reduce production costs; b) crop diversification to lower risk to production losses due to climatic shocks; c) diversification into commodities with high value-adding and market potential; d) agribusiness development and increase private sector participation; e) enforcement of sustainable fisheries management by all levels of government; and f) increase productivity of aquaculture products through research and development and infrastructure development.
Product standards will also be improved through the collaboration among academe, research institutions, private sector, and government agencies.
To address the impact of disasters and pandemics on agricultural production and ensure continuity of the supply chain, farmers and fisherfolks will be provided production assistance in terms of farming and fishing inputs, machineries, facilities, equipment, trainings for alternative
livelihood and market access. Market access interventions include alternative market opportunities such as mobile markets and direct purchase of LGUs of agricultural products from local farmers and fisherfolk for local consumption or as relief goods. There is also a need to establish an online marketing system for agricultural commodities that will improve the linkage of farmers to digital platforms.
Farmers and fisherfolks should also be given assistance in the form of zero or low interest loans during natural and public health disasters and outbreaks of animal diseases (e.g. avian influenza, ASF, etc.) to ensure continuous production and prevent fluctuations in agricultural supply chains.
Sustain growth momentum in industry and services sector
To sustain the upward growth of industry and services, there is a need to improve the Region’s competitiveness through infrastructure development (e.g. logistics, transport, broadband connections, power supply) to promote efficient flow of goods and services and improve ease of doing business to attract more investments by global and high-value firms. To make growth inclusive, MSMEs will be strengthened through industrial deepening1, expansion of export capacities, technology and market assistance, and improvement of access to credit programs.
For the services sector, growth can be increased by: a) providing a favorable investment climate for information technology-business process outsourcing and other modern services in urban areas; and b) expansion of the tourism industry to promote development in rural and remote areas with limited economic activities.
CALABARZON will also further capitalize on its high number of economic zones 1 refers to the formation of local linkages and the creation of a robust local supplier base(Kuroiwa, 2015)

206 | Regional Development Plan 2017-2022
by promoting key export products in the Region by consolidating trade promotion activities and maximizing product visibility through the use of social media and online platforms. These interventions will be coordinated and continued in the Region through the RDC Investment Promotion Group.
Once the ECQ is lifted and the pandemic is contained, rebuilding consumer and business confidence is critical to bring to normal state economic activities in the Region. This is included in the Phase 2 of NEDA’s response to the pandemic which aims to rebuild consumer and business confidence through the following interventions: implementation of staggered work and business hours; provide emergency loans to businesses and emergency production assistance to farmers fisherfolk, and MSME; and provide emergency loans to consumers, among others.
In line with this, DTI implemented interventions through the following issuances to provide support and assistance to affected businesses:• Memorandum Circular 20-12, ‘Guidelines
on the Concessions on Residential Rents; Commercial Rents of MSMEs’ was issued to provide grace period of 30 days to residential and commercial rents with due date within the ECQ
• Memorandum Circular 20-08 amending Memorandum Circular No. 20-06, ‘Ensuring Unhampered Movement of Cargo and Transit of Personnel of Business Establishments Allowed to Operate During the Enhanced Community Quarantine of Luzon’ which prevents the delay and impediment to the transport of goods and movement of employees in selected sectors.
The DTI can continue to implement the Pondo sa Pagbabago at Pag-asenso Enterprise Rehabilitation Financing facility
to provide support to micro and small businesses affected by the COVID-19 Outbreak and other related disasters. Under this loan facility, micro enterprises with assets worth up to Php 3 million may borrow PHP 10,0000 up to PHP 200,000 and small enterprises with assets amounting to up to PHP 10 million may borrow up to PHP 500,000 at an interest rate of 5 percent. In addition, a one-month moratorium may be imposed on loan payments of MSME borrowers and partner financial institutions.
Further, the Shared Service Facilities (SSF) Project / Fabrication Laboratories (FabLabs) as a public-private partnership initiative may be put in place as shared system on machinery, equipment, tools, systems, accessories and other auxiliary items, skills and knowledge to enhance MSMEs competitiveness by increasing their production capacities and improving product quality, resulting to increased markets, increased sales, and further contributing to jobs generation
For the manufacturing sector, industries affected by value chain disruptions can maximize trading with other smaller export and import markets given that its major trading partners, China and the United States of America, are heavily affected by the COVID-19 pandemic. Subject to easing of policy restrictions, export-oriented businesses can also market their products for domestic consumption.
There is also a need to aggressively promote tourism in view of the large losses in the sector as a result of travel restrictions. Campaigns to promote the various tourist destinations of the Region targeting both the domestic and foreign tourists should be widely disseminated once the COVID-19 pandemic is under control and will not pose major health risks. To attract more tourists, discounted travel packages can be offered by travel agencies and other tourism establishments.

Chapter 15 Sound Macroeconomic Policy | 207
Provide economic opportunities and livelihoods to reduce poverty
Most of the areas with high poverty incidence in the Region are located in rural or remote areas and have limited economic activities. Thus, more economic opportunities must be created in industry and services sector and agricultural products must be made competitive to increase income levels.
To close the gap on poverty targets and address the poverty-inducing effects of disasters and pandemics, the following programs and activities need to be prioritized: a) development and implementation of context-specific poverty reduction programs that will improve productivity and provide sustainable livelihoods to the poor and income-vulnerable households and individuals; b) strengthening convergence programs across agencies and between the public and private sector; c) institutionalization of Kapit-Bisig Laban sa Kahirapan - National Community-Driven Development Program (KALAHI-NCDDP) and adoption of local governments of the program; d) implementation of Social Amelioration Program to all low-income households and other groups heavily affected by stringent quarantine protocols; e) continue implementation of poverty alleviation programs like Pantawid Pamilyang Pilipino Program, livelihood and employment generation programs; f) provision of assistance to lagging LGUs to prepare and implement development plans and/or poverty action plans, and increase local resource mobilization/income; and g) provision of differentiated social service programs with priority focus on severely affected areas and highly vulnerable population.
There is also a need to harmonize government poverty interventions to improve the effectivity of social development programs. The continuation and expansion
of the coverage of 4Ps and the social pension program, and effective transition programs for 4P household graduates are also crucial in sustaining poverty reduction in the Region.
The nationwide implementation of the Community Based Monitoring System and the National Identification System should also be fast-tracked in order to have an effective and efficient profiling system of households from barangay to the city and municipal levels that will provide sound basis in targeting and monitoring poverty alleviation and other development programs by the government.
Produce competitive workforce
In order to improve the employability of the Region’s workforce and attract skills and knowledge-based investors to the Region, the following strategies will continue to be implemented: a) provision of quality and accessible basic education for all; b) improvement of curricula and training programs in line with industry requirements or needs; c) increasing the accessibility and affordability of skills upgrading and continuing learning programs for professionals ; and d) strengthening of accreditation of academe and training centers.
Maintain stable inflation rate
There is a need to ensure and maintain adequacy of agricultural commodities and food supply to avoid supply-side pressure to prices. Thus, it is important to reduce the vulnerability of farmers to changing weather through promotion of climate-resilient practices, provision of market development services, and improvement in the availability and access to agricultural insurance.
The continued implementation of rice tariffication is also crucial in maintaining

208 | Regional Development Plan 2017-2022
the price stability of rice which comprises a huge portion of food prices. Support to local food production, efficient transport of goods, and fair market competition will also be pursued to maintain a low and stable inflation. Provide employment opportunities to displaced workers and emergency loans to affected MSMEs and agricultural workers
The enforcement of ECQ in Luzon resulted to the displacement of many workers particularly those in the informal sector. In order to avoid prolonged unemployment, alternative livelihood programs and employment opportunities should be made available to the affected workers. In addition, profiling of displaced workers vis-à-vis the provision of seminars and training programs for skills upgrading should be done in order to increase the employability of displaced workers in other alternative sectors. The TUPAD Program should be continuously implemented to provide emergency employment to displaced workers. Existing mechanisms such as SSS unemployment and sickness benefits, referral and re-employment program, and other labor market interventions should be utilized.
In particular, the provision and enhanced coverage of SSS unemployment insurance should be prioritized to augment income of displaced workers and maintain their standard of living while fully engaged in a job search. This will enable displaced workers to effectively look for jobs that match their skills, prevent underemployment, and encourage displaced workers to seek work in the formal sector. The adoption of a universal income guarantee can also be explored to address income insecurity among displaced workers and cushion the welfare impacts of unemployment by ensuring that the affected workforce is provided with the minimum income needed to meet their basic daily necessities.
To help cover their income losses and support resumption of operations, affected MSMEs and agricultural workers will be provided with emergency loans with low interest rate. Tax cuts for MSMEs can also be explored to provide financial relief. This can be in the form of business permit tax cuts, payroll tax cuts, VAT breaks/exemptions, tax rebates, and deferred payments of contributions and taxes.
Pursue strategic infrastructure to stimulate growth and develop ICT infrastructure to boost e-commerce and productivity
To stimulate growth and as part of recovery efforts from the pandemic, the Region will pursue strategic infrastructure on transportation, telecommunications, and public health. Strategic infrastructure pertains to crucial, highly beneficial, and implementation-ready projects that will generate significant employment and Regional or area-wide economic benefits. Government spending on key infrastructure projects will also produce multiplier effects to the economy in terms of employment generation and boosting consumption and investment spending.
ICT plays an even bigger role in ensuring the productivity of organizations in times of emergencies like quarantine. Thus, the ICT infrastructure in the country must be developed to support the needs of businesses and the government to have a digital platform for their operations and services, and for households and individuals to be able to work from home effectively and access essential services online. Internet broadband services at par with global standards and internet connectivity in public places should be prioritized to help the economy adjust to a “new normal” that is better prepared for large-scale emergencies like pandemics.

Chapter 15 Sound Macroeconomic Policy | 209
Institutionalize Business Continuity Planning in the public and private sector
Business Continuity Plans (BCP) will help ensure the continuity of operations and services in times of emergency and disasters. For the government sector, efforts to develop Public Service Continuity Plan for local government units and national government agencies need to be institutionalized to help ensure the continuity of essential government functions.
Business Continuity Plan is also important for the ecozone locators and to private establishments such as MSMEs. The Plan will provide for the assessment of the possible hazards and impacts of natural disasters to the operational functions of the ecozones/business firms, including the response mechanism and quick recovery measures for the industries to continue to operate, avoid disruptions, and rebuild businesses for a certain period of time. Policies or incentives can be given to the private businesses to encourage preparation of BCP. This would contribute to building resilient economic supply chains and communities.
Formulate a rehabilitation and recovery program to mitigate losses and sustain growth
One of the pillars of the Duterte administration’s socioeconomic strategy against COVID-19 is the preparation of an economic recovery plan at the national level that will create jobs and sustain growth. To support the national economic recovery plan, Regions through NEDA’s lead, will also come up with their own rehabilitation and recovery program which aims to mitigate economic losses from the pandemic and the quarantine, “define” the new normal of economic activities through specific strategies and also to recommend a platform to convey the right information to the public to gain trust and confidence.
A major component of these rehabilitation and recovery programs are immediate and medium-term public investment requirements (programs and projects) on specific sectors on health, social protection, education, industry and services, agriculture and fisheries, governance, security, environment, and transportation. The recovery program will include differentiated interventions to help the affected industries recover from losses, ensure continuity of operations, and encourage retention of existing workers to prevent negative demand shocks to labor.
Addressing the challenges among the various financial systems will result to achieving a resilient and inclusive monetary and financial sector. The following strategies shall be pursued: a) enhance and strengthen LGU resource mobilization in the Region; b) improve financial inclusion mechanism; and c) strengthen and improve enabling environment for the financial system.
Enhance and strengthen LGU resource mobilization in the Region
In order to further increase the share of local sources of revenue, the following programs and activities should be prioritized: a) update local revenue code and schedule of market values; b) assist LGUs to determine, establish, and operate other sources of revenues such as local economic enterprises; c) continue capacity building and strengthening of public financial management in the LGUs; d) conduct regular evaluation of treasury and assessment operations; and e) continue improvement and simplification of regulations and processes on business registration and licensing and tax payment through the use of technology.
With the increase of LGU’s IRA share starting in FY 2022, additional funds must be allocated to social services, thereby increasing the share of social services to

210 | Regional Development Plan 2017-2022
Major Programs and Projects• Agribusiness and Agri-
entrepreneurship programs• Investment Promotion activities through
the RDC Investment Promotion Group• DICT’s National Internet Connectivity • Implementation of the Export
Development Plan and MSME Development Plan
• Continued implementation of 4Ps and Social Pension program and better targeting of beneficiaries
• Roll-out of the Rice Competitiveness Enhancement Fund
• Roll-out of Universal Health Care
• Automation of business registration and licensing and tax payment systems
• Capacity building and strengthening of public financial management in LGUs
• DOLE’s TUPAD Program• Social Amelioration Program• Kadiwa on Wheels• Pondo sa Pagbabago at Pag-asenso
for MSMEs• Credit guarantee program for
small businesses• Community Based Monitoring System• National Identification System
current operating expense in LGUs. To support this strategy, LGUs must be further capacitated by relevant NGAs in social service delivery. Public awareness on the role of LGUs in social service delivery can also be raised to improve accountability of development outcomes at the local level.
Improve financial inclusion mechanism
Continue to build, strengthen, and establish financial systems and institutions in the Region to create more financial access points that deliver financial services at affordable cost to all segments of society.
Increasing access to credit among MSMEs, farmers, and other low-income sectors would improve their financial capacities and result to increased productivity. In order to strengthen the capacities
of cooperatives, improvement in the convergence of cooperative development programs with other government agencies must also be pursued. This can be achieved by increasing the assistance of NGAs and LGUs to cooperatives and establishing CDA partnerships with other NGAs (e.g. CDA-DAR, CDA-DTI, CDA-DA, CDA- NCIP, DOLE).
Strengthen and improve enabling environment for the financial system
In order to build a strong and resilient financial sector, the following must be accomplished: continual improvement of the monitoring of financial climate; enforcement of policy and pricing incentives to reduce barriers to investment; and investments in human, institutional and technical capacities.

Chapter 16 Leveling the Playing Field | 211

212 | Regional Development Plan 2017-2022

Chapter 16 Leveling the Playing Field | 213
Chapter 16
Leveling the Playing Field CALABARZON, known as the industrial powerhouse of the country for having the highest industry output and the second biggest contribution to the national economy, still has yet to realize its greatest potential for development. Its potential to be the leading economic growth area is impeded by the limited competition in the market and the low competitiveness of various localities in the Region as investment destinations. Improving the investment climate in the Region is necessary to be able to attract new investors as well as encourage existing firms to expand their businesses to boost economic development. The presence of more market players will support healthy market competition and will improve consumer welfare by providing consumers a wider choice of goods and services at lower prices.
Established on 2016, the Philippine Competition Commission is mandated to implement the National Competition Policy (NCP) and enforce Republic Act No. 10667 or the Philippine Competition Act. Three years since its creation, the PCC has made strides on prohibiting anticompetitive agreements, abuses of market dominance, and anticompetitive mergers and acquisitions. It has also conducted various advocacy activities to mainstream competition principles and advocate for pro-competitive government policies.
At the Regional level, market competition is being supported through the competitiveness of LGUs which set the investment climate for local and international firms. The CMCI Survey is being continuously undertaken to encourage LGUs to make their area more investor-friendly.
To develop an enabling environment for market competition, the following main strategies will be pursued: a) simplify and streamline government requirements and processes pursuant to RA 11032 or Ease of Doing Business Act; b) strengthen the Regional and Provincial Competiveness Councils; and c) intensify advocacy activities on competition law, policies, and concepts to develop a pro- competition culture.
Assessment and Challenges
Competition environment CAt the national level, the Philippines improved its level of competitiveness by ranking 56th in the 2018 Global Competitiveness Index (GCI), a 12 place rise from the 2017 rankings which applied the same methodology. Among the nine ASEAN member states, the Philippines ranked fifth. While the country fared well
in terms of business dynamism, market size, financial system, and labor market, it needs to improve on its institutional performance, infrastructure, ICT adoption, and innovation. Inefficient government bureaucracy ranks first in the most problematic factors reported in GCI followed by lack of infrastructure, corruption, and tax regulations complexity.

214 | Regional Development Plan 2017-2022
Findings of a World Bank Report1 in November 2018 show inequitable and non-mandatory application of policies and 1 Miralles Murciego, et. al. 2018. Fostering Competition in the Philippines: The Challenge of Restrictive Regulations (English). Washington, D.C. : World Bank Group.
overly-restricted regulations that discourage market entrants and tolerate existing firms to enjoy market power. Data supports that there are more monopoly, duopoly, and oligopoly in the Philippines than other countries in South East Asia.
In 2018, Republic Act No. 11032, an act promoting Ease of Doing Business and efficient delivery of government services, was approved in support to the Anti-Red Tape Act of 2007. The act required government agencies and LGUs to reengineer their process to streamline and reduce processing time of all government transactions. This include automation of procedures such as the Business Permit Licensing System (BPLS) which can now be transacted online. The percentage of LGUs in the Region which are BPLS compliant increased from 63 percent in 2016 to 67 percent in 2017.
The CMCI is continuously implemented by DTI to rank the competitiveness of cities, municipalities and provinces based on their economic dynamism, government efficiency, infrastructure facilities, and resiliency. These indicators are based on global competitiveness standards to improve national competitiveness when the indicators are adapted at the local level. The economic dynamism pillar reflects
the economic activity and productivity of an LGU.
DTI annually awards the most competitive local government units who participate in the CMCI survey. CALABARZON LGUs have been included in top rankings since the start of the CMCI survey.
In 2018 and 2019, all 142 LGUs of CALABARZON participated in the CMCI Survey. During the 2019 awarding, the Region received 33 percent of the awards, higher than the 32 percent of the awards received in 2016 and 16 percent of the awards received in 2018. The province of Rizal maintained its position as the most competitive province in the country followed by Laguna and Cavite, respectively. Antipolo City was the overall most competitive component city while Cainta, Rizal topped among the 1st and 2nd level class municipalities category. Fifty-nine percent of LGUs increased in ranking in 2019 which is more than half of the 26 percent increase in 2018.
Figure 16.1. Decomposition of Philippines Product Market Regulations Score for the Philippines

Chapter 16 Leveling the Playing Field | 215
The institutionalization of the Provincial Competitiveness Councils that replicates functions of the Regional Competitiveness Council and administers filling out of the CMCI survey contributed to the increase of awards received by the LGUs in CALABARZON. While the results of the 2019 CMCI were remarkable, there is still a need to sustain the ranking through the provision of technical assistance of PCC and RCC and to conduct an in-depth analysis to identify the gaps or areas where improvement and assistance to LGUs are needed.
Geographically isolated areas experience more challenges in market competition since natural barriers limits the number of market players. This results to high product prices, poor service, or creation of artificial markets. In 2018, the prices of basic commodities increased for the whole country due to supply-side difficulties. Inflation reached 4.8 percent in the Region while inflation in the provinces of Quezon and Batangas reach as high as 5.9 and 4.9 percent. Market monopoly, bipoly, and oligolopy of basic commodities and difficulty in accessing remote areas in these provinces could have contributed to the increase in prices.
Another example is the grueling transportation of quarry materials from Quezon or Rizal that results to high price of quarry finished product. Stronger government regulatory presence in these areas and improved infrastructure are needed to stabilize the price and allow the entrance of new market players.
Market players in the regional economy As of December 2018, CALABARZON has 55 operating economic zones, 35 of which are manufacturing special economic zones. A total of 2,019 locators operate in these ecozones.
At the national level, the PCC has prepared issues papers to better understand competition issues across industries including manufacturing, rice, pharmaceuticals, air and public land transport, and poultry and livestock. By studying the structure and performance of these industries, these papers will enable PCC to scan for possible anti-competitive practices and guide the crafting of pro-competitive laws and regulations.
Action PlanStrategic FrameworkThe Region will support the PCC in the implementation of the NCP. Healthy
market competition will bring about improvements in market efficiency and consumer welfare.
Figure 16.2 Strategic Framework to Level the Playing Field

216 | Regional Development Plan 2017-2022
StrategiesFor the remaining plan period, Regional strategies will focus on improving the competitiveness of LGUs to provide a conducive environment for healthy market competition characterized by a diverse and vibrant local economy, stability in prices, and quality goods and services.
Simplify and streamline government requirements and processes pursuant to RA 11032 or Ease of Doing Business Act
The EODB and Efficient Government Service Delivery Act of 2018 seeks to expedite government transactions by cutting the red tape in government agencies. It is expected that this Act will improve the competitiveness of the country. In line with this, all LGUs are called to comply with the Business One-Stop Shop (BOSS) which is the business permit licensing system that will process business permits and license, among others.
Strengthen the Regional and Provincial Competiveness Councils to improve CMCI rankings
Regional competitiveness will be pursued to ensure that the right conditions for a working competitive market are provided. These will be done through: a) allocation of budget for CMCI implementation and monitoring; b) conduct of in-depth analysis to identify CMCI gaps or areas where LGUs are lagging or fare poorly; c) strengthen the Regional and Provincial Competiveness Councils to be able to provide coordinated assistance to LGUs on areas where interventions are needed based on performance studies/analysis; d) continuous CMCI orientations and trainings; e) improve data collection and monitoring systems of CMCI forms; and f) maintain the CMCI CALABARZON website.
Review and amend potentially anti-competitive local legislations and policies that may substantially prevent, restrict, or lessen competition
According to a World Bank Report in 2018, developing and implementing an effective competition policy framework in the Philippines will be critical to unleash the country’s growth potential. Removing these restrictions will add at least 0.2 percent to the economic growth every year.
RA 7160 or the Local Government Code empowers local authorities to enact laws. Some LGUs have passed local ordinances to protect their local business establishments that tend to discourage new market entrants or even prevent business expansion of existing firms. The local development and legislative councils were capacitated to identify policies that might discourage competition at the local level and are expected to amend or issue local policies that will encourage setting up of more businesses.
There is a need to review RA 7916 also known as The Special Economic Zone Act of 1995 to encourage market competition in export-oriented industries, rationalize tax incentives to locators, increase competitiveness of local firms, and better integrate MSMEs into big and global value chains.
Intensify advocacy activities on competition law, policies, and concepts to develop a pro-competition culture
Critical to the success in the implementation of the Philippine Competition Act (PCA) is to build a culture of competition among government, private or business sector, civil society, and the public which can help deter anti-competitive behaviour and practices. The conduct of fora, seminars, and dialogues need to be continued to be able to substantially increase the level

Chapter 16 Leveling the Playing Field | 217
of awareness and understanding on competition law, policies and concepts of more stakeholders especially at the local level. More importantly, the different roles of stakeholders in implementing the PCA need to be highlighted during these advocacy activities.
Promote consumer welfare
More market players can raise the quality of products and services, reduce prices, and broaden consumer choice; thereby promoting consumer welfare.
Adopt convergence approach to address natural barriers to competition
Convergence approach will be pursued to address the development constraints, especially among GIDAs. Infrastructure support, especially on ICT, transportation, among others, will be prioritized in the GIDAs.
Legislative AgendaLEGISLATIVE AGENDA DESCRIPTION
Retail Trade Liberalization Act Relaxing the rules for foreign investors will contribute to a more competitive local players, more employment opportunities, wider variety of quality products, and high inflow of new technology.
Public Service Act Amending the law to provide a clear statutory definition of “public utility” will encourage foreign investments, increase market competition, and promote consumer welfare.
Foreign Investments Act Removing restrictions on professionals will attract more skilled foreign professionals who can help Filipinos gain more knowledge and skills; thus, enhancing their competitiveness in both domestic and international labor markets. The reduction in the number of mandatory direct local hires in foreign-owned SMEs will help increase foreign direct investments.

218 | Regional Development Plan 2017-2022

Chapter 13 Reaching for the Demographic Dividend | 219

220 | Regional Development Plan 2017-2022

Chapter 17 Attaining Just and Lasting Peace | 221

222 | Regional Development Plan 2017-2022
Chapter 17 Attaining Just and Lasting Peace | 223
Chapter 17
Attaining Just and Lasting Peace This chapter discusses the peace situation in CALABARZON in the first half of plan implementation and the strategies and interventions of the government that promote peace and address root causes of conflicts.
In general, the peace situation in the Region remains stable due to intensified efforts of the military and other government agencies to reduce the capability of militant groups, community engagement to reduce armed conflicts, reintegration program for former rebels, and various development interventions to remote and conflict affected or vulnerable areas.
The following main strategies will be pursued to ensure just and lasting peace: settlement of all internal armed-conflicts through localized peace talks; strengthen convergence efforts within government and between the public and private sector; develop infrastructures to improve accessibility of conflict-affected areas; and implement conflict-sensitive and peace promoting catch-up socioeconomic development for communities in conflict-affected and conflict-vulnerable areas.
Assessment and ChallengesThe Communist Party of the Philippines - New People’s Army Terrorists (CNTs) operating in CALABARZON belongs to the Southern Tagalog Regional Party Committee (STRPC) which affects a total of 19 barangays in the Region. As of the first quarter of 2019, STRPC is estimated to have 138 fighters maintaining 163 firearms. Among their violent activities recorded in the first semester of 2019 were two cases of arson in two private construction companies in Quezon Province.
Figure 17.1 shows the trend of STRPC capabilities in CALABARZON in terms of firearms, manpower and number of affected barangays from 2017 to first quarter of 2019. The number of affected barangays has continuously decreased from 38 in 2017 to 19 in the first quarter of 2019 which are found in the provinces of Cavite, Batangas,
Rizal and Quezon. Firearms also declined from 202 to 163, equivalent to 19 percent decrease. The slight increase in STRPC manpower from 125 in 2017 to 158 in 2018 may be attributed to the changes in campaign priority of the Armed Forces of the Philippines (AFP). This was the same period that the AFP focused its effort in fighting militant groups in Marawi City, Lanao del Sur. Overall, the decrease in STRPC capabilities may be attributed to enhanced community engagement in conflict affected and vulnerable barangays and better delivery of government services and livelihood opportunities.
In April 2018, the government launched the Enhanced Comprehensive Local Integration Program (E-CLIP) that seeks to harmonize all government programs for the reintegration of former rebels in society.

224 | Regional Development Plan 2017-2022
The E-CLIP provides flexible programs based on the profile of its beneficiaries. Its major components are the CLIP being administered by the DILG which provides financial assistance to former rebels; the Payapa at Masaganang Pamayanan or PAMANA Program being administered by the Office of the Presidential Adviser on the Peace Process; and the various programs of the government for education, livelihood and skills training. PAMANA is a convergence program that extends development interventions to isolated, hard-to-reach and conflict-affected communities. The program’s interventions in the Region include the following: a) construction of the fourth phase of the FY 2018 PAMANA-DPWH Concreting of Bagupaye-Anonang-Magsaysay Farm-to-Market Road Project in the Municipality
of Mulanay, Quezon amounting to PHP 141,935,000.001; b) implementation of ten FY 2018 PAMANA-DSWD Sustainable Livelihood Program (SLP) in selected Municipalities of Quezon amounting to a total of PHP3,000,000.002; and c) enrolment of 70 former combatants and/or their next-of-kin under the FY 2019 PAMANA-PHIC Health Insurance Program. These programs contributed to the significant increase in the number of CTG surrenderers in the Region from six in 2017 to 90 surrenderers as of August 2019.
1 89.88% physically completed as reported by the DPWH Quezon III DEO during the 11th Regular OPAPP-DPWH Coordination Meeting held last 12 December 2019 in Quezon City.2 Ongoing as reported by the DSWD SLP during the PAMANA Inter-Agency Meeting held last 13 December 2019 in Quezon City
The Whole-of-Nation approach addresses root causes of insurgency by harmonizing the delivery of basic services and ensuring active participation of all sectors of society. This was institutionalized by the Executive Order No. 70 s. 2018 (EO 70) signed on December 4, 2018 which also created the National Task Force to End Local Communist Armed Conflict (NTF-ELCAC). In support to the EO 70, the CALABARZON RDC and Regional Peace and Order Council (RPOC) signed the creation of Regional Task Force to End Local Communist Armed Conflict
(RTF-ELCAC) on February 26, 2019. As of May 14, 2020, local Task Forces have been created in all 5 provinces, 18 cities and 117 municipalities, and 3,806 barangays. Declarations of persona-non-grata against the Communist Party of the Philippines (CPP) and the New People’s Army (NPA) were also issued by all five provinces, 17 cities and 97 municipalities and 3,062 barangays. Among the issues cited by some LGUs in the implementation of EO 70 are lack of guidelines or legal basis on declaring CPP-NPA as persona-non-grata.
Figure 17.1 Trend of STRPC Power Factors in CALABARZON
Source: AFP

Chapter 17 Attaining Just and Lasting Peace | 225
In September 2019, the NTF-ELCAC issued Joint Memorandum Circular No. 01 series of 2019 which provides the guidelines on the operationalization of EO 70 through the creation of Regional/Local Task Forces-ELCAC towards inclusive sustainable peace and development. There are 12 clusters identified for the NTF and RTF which will facilitate the convergence of efforts of different agencies and local governments. The circular also streamlined the identification of peace and development programs, projects, and activities in existing development planning, investment programming, and monitoring mechanisms.
Cooperation and volunteerism were evident in peace and development activities in the Region. The private sector participated in community outreach activities in conflict-affected areas through provision of goods and services. The government also continued to engage and encourage community participation in its peace-building efforts through programs such as the Retooled Community Support Program of the DILG and the Community Mobilization Program of the PNP.
Other challenges encountered by the Region in the implementation of EO 70 was the poor coordination among concerned agencies resulting to delay in delivery of services. For instance, there is still no assigned agency to monitor former rebels’ activities after the reintegration process. The government’s focus in addressing the emergency health crisis brought by COVID-19 pandemic in 2020 may also affect the implementation of planned programs and projects for peace development as resources are re-allocated to respond to the pandemic.
Despite the declaration of unilateral ceasefire of both the government and the CTGs during the COVID-19 situation, there were still reports of armed encounters between both parties. Clashes happened as government troops were conducting
community work and providing security assistance to other government agencies as part of their COVID-19 response activities. On March 28, an armed encounter happened in Rodriguez, Rizal leaving two dead, one from the government troops and the other from the CTG. Similarly, on April 2, 2020, a clash with CTGs in Mulanay, Quezon ensued as government troops responded to an information that around 20 NPA members were extorting money from residents in the area.
In order to counter the peace efforts of the government, the CNTs have established strategies to espouse anti-government propaganda strategies and exploit issues to discredit the government. Among the common issues in the Region exploited by CNTs are contractualization, company retrenchment or closures, relocation of informal settler families, genuine agrarian reform program, issues on social welfare programs and projects, and contested government projects. The construction of infrastructure projects in the Region is being exploited and hindered by the CNTs as part of their propaganda to gain support from the people.
The sustained support from the members of CALABARZON RTF-ELCAC for its activities and the institutionalization of local task forces will be important in addressing the non-military component of insurgency in the Region through the delivery of basic services and resolve the issues being exploited by the CNTs.

226 | Regional Development Plan 2017-2022
Figure17.2 Strategic Framework to Attain Just and Lasting Peace
Table 17.1 Plan Targets to Attain Just and Lasting Peace
INDICATORSBASELINE
2018 END OF PLAN TARGET RESPONSIBLE AGENCY
VALUE 2020 2021 2022
Number of barangays affected by internal armed conflict decreased.
21 AFP/PNP/LGU
Reduced CPP-NPA manpower through surrender 90 AFP
Number of surrendered firearms increased 38 31 33 35 AFP, PNP, LGU,
OPAPP
Net enrolment rate in primary education increased (in conflict-affected areas)
94.87 (2017) 99.38% 99.70% 100.00% DepEd, OPAPP
Net enrolment rate in secondary education increased (in conflict-affected areas)
81.14 (2017) 95.90% 97.95% 100.00% DepEd, OPAPP
Number of PAMANA projects implemented in conflict affected barangays
24 OPAPP
Strategic FrameworkThe RDP 2017-2022 aims to attain just and lasting peace. Two subsector outcomes were identified: 1) peace agreements
with all internal armed conflict groups successfully negotiated and implemented; and 2) protect and develop communities in conflict-affected and conflict- vulnerable communities.
Action Plan
Targets

Chapter 17 Attaining Just and Lasting Peace | 227
StrategiesTo support these outcomes, the following priority strategies will be implemented:
Peace agreements with all internal armed conflict groups successfully negotiated and implemented
Effectively implement the National and Local Plans to End Local Communist Armed Conflict 2019-2022 that will operationalize the whole-of-nation approach to address local communist and other armed conflicts. The government has shifted its approach in addressing the communist insurgency, from a national government-led peace negotiation to localized peace engagements, with LGUs playing a major role.
Effectively undertake localized peace engagements. The NTF-ELCAC mechanism will be utilized to end local communist armed conflict through a whole-of-nation approach including conduct of community problem-solving sessions and local peace dialogues with local insurgent groups. In particular, capacity enhancement for local chief executives on the conduct of local peace engagements will be pursued to ensure that these are undertaken based on mutual confidence and trust, and that the desired outcomes of the local peace process are achieved.
Communities in conflict-affected and conflict-vulnerable areas protected and developed
As part of convergent peace and development efforts embodied in EO 70, the government aims to provide more effective and faster delivery of social services and prevent geographically- isolated and disadvantaged areas and marginalized sectors from being vulnerable to conflict and radicalization. The Region will support convergence efforts to address root causes of insecurity to avoid issues
being exploited by rebel groups and also to effectively address root causes of conflict.
Strengthen convergence efforts within government and between the public and private sector. In line with the Whole of Nation approach, convergence efforts through the implementation of EO 70 up to local level shall be prioritized. The delivery of basic services will be enhanced through well targeted and sustainable assistance and by involving all stakeholders from public, private sectors, civil society organizations and other volunteer groups. Local government units and communities shall be empowered and engaged through programs such as the Retooled Community Support Program of the DILG and Community Mobilization Program of the Philippine National Police, among others.
In order to address some of the issues in the implementation of EO 70 such as the delay of delivery of services to former rebels, the RTF shall follow-up on deliverables of concerned agencies, regularly provide update on status during RTF-ELCAC meetings, and assign an agency to monitor post-reintegration activities of former rebels.
Completion of the Comprehensive Agrarian Reform Program (CARP). Since land issues is one of the most exploited issues, the Comprehensive Agrarian Reform Program has to be fully completed in order to put an end to land ownership conflicts. Capacity building and other support mechanism to ensure productivity of farmer beneficiaries shall also be pursued.
Develop infrastructures to improve accessibility of conflict-affected areas. Insufficient or lack of farm-to-market road is identified as one of the causes of insurgency as difficulty in transporting agricultural products can reduce income levels. Construction of farm-to-market roads, bridges, and infrastructures

228 | Regional Development Plan 2017-2022
connecting rural/remote areas to urban/market centers will be pursued to enhance economic activity. The establishment of other critical infrastructure and facilities such as water supply, power, and communications in conflict-affected and/or rural areas also need to be prioritized in support to the local economy.
Implement conflict-sensitive and peace promoting (CSPP) catch-up socioeconomic development for communities in conflict-affected and conflict-vulnerable areas. The PAMANA program will continue to focus on the implementation of peace-promoting and catch-up socioeconomic development under the Six-Point Peace and Development Agenda. It involves strengthening of convergence and complementation with other local and national government initiatives, including the implementation of the Re-tooled Community Support Program (RCSP), a convergence mechanism formulated to strengthen government initiatives through implementation of LGU-driven programs and projects. As such, close coordination with identified local government units and the AFP will be undertaken especially in far-flung communities and areas with security risks.
Mainstreaming of CSPP approaches in plans and programs of LGUs will be pursued to make sure that a peace lens is adopted in all programs and projects for these areas. Among these is the issuance of a policy instrument which will facilitate the mainstreaming of CSPP approaches in the CDPs of LGUs. The mainstreaming of CSPP approaches in processes of local planning will also highlight the important role of LGUs and local special bodies in conflict prevention and peacebuilding.
Mainstreaming of peace education. Peace education in schools and communities will continuously be pursued to develop pro-peace knowledge and attitudes that will
help prevent conflict, resolve conflicts peacefully, and create conducive conditions to peace.
Increase the volume of security forces. In order to sustain the government’s gains against CNTs in conflict-affected areas there is a need to augment and strengthen the Region’s security forces. The AFP will pursue measures to increase quota allocation of Citizen Armed Force Geographical Unit or CAFGU Active Auxiliary (CAA) to be deployed in the northern part of Quezon.
Compliance to labor laws. To promote industrial peace, the government will continuously ensure that all businesses comply with labor laws. Labor disputes will be dealt properly and with urgency.

Chapter 17 Attaining Just and Lasting Peace | 229
Major Programs and Projects• Adopt-a-Municipality Mechanism• Advocacy for peace agreements and
peaceful settlements with all internal armed conflict groups
• Anti-Cybercrime Prevention Act• Build Build Build Program• Capacity Development for LGUs on
Local Peace Engagements • Community Mobilization Program• Community Problem-solving Sessions • Community Support Program• CARP• Construction of access roads and farm-
to-market roads in geographically isolated and disadvantaged areas
• Convergence programs for poverty alleviation such as the implementation of the poverty convergence plan for identified poverty convergence areas
• Enhanced Comprehensive Local Integration Program
• Incentives and awards to promote compliance among establishments
• Intelligence activites• Labor Laws Compliance System • Local Peace Dialogues • Massive information drive on peace
and land issues in remote areas of Tagkawayan, Quezon
• PantawidPamilyang Pilipino Program• Payapa at Masaganang Pamayanan• Purchase of Personal
Protective Equipment• Regional Development Council
Outreach Activities• Regional Task Force to End Local
Communist Armed Conflict• Re-tooled Community Support Program
Legislative AgendaLEGISLATIVE AGENDA DESCRIPTION
Guidelines and procedures in declaring of CPP-NPA as persona-non-grata
This will help safeguard the LGUs from the presence and influence of CTGs in the communities.

230 | Regional Development Plan 2017-2022

Chapter 18 Ensuring Security, Public Order, and Safety | 231

232 | Regional Development Plan 2017-2022

Chapter 18 Ensuring Security, Public Order, and Safety | 233
Chapter 18
Ensuring Security, Public Order, and SafetyThis chapter assesses the security, public order and safety situation in the Region. It provides strategies and interventions to ensure a conducive environment for Regional and national development.
For the remaining plan period, the following priority strategies will be pursued to attain a high level of security, public order and safety: adopt whole-of-nation approach; take tough stance against criminality; strengthen collaboration among law enforcement agencies; maximize use of technology to curb crime and support law enforcement; full implementation of the Barangay Drug Clearing Program; reorient and sustain implementation of non-traditional systems for responding to crime and emergencies; and strengthen community based reformation programs and centers for drug offenders.
Assessment and ChallengesReducing criminalityFor the past three years, there was a notable decrease of crimes in the Region as a result of intensified anti-criminality operations of various government security agencies. Index crime volume went down to 8,473 in 2018 from 12,969 in 2016, a 35 percent decrease. Index crimes are crimes against
persons and property such as murder, homicide, physical injury, rape, robbery, theft, carnapping motor vehicles and motor cycles, and cattle rustling. Consequently, index crime rate decreased to 4.73 percent exceeding its target of 6.84 percent. This means that the volume of index crimes relative to the population of the Region decreased.
Figure 18.1 Comparative Index Crime Volume, CALABARZON, 2016-2019
Source: PNP
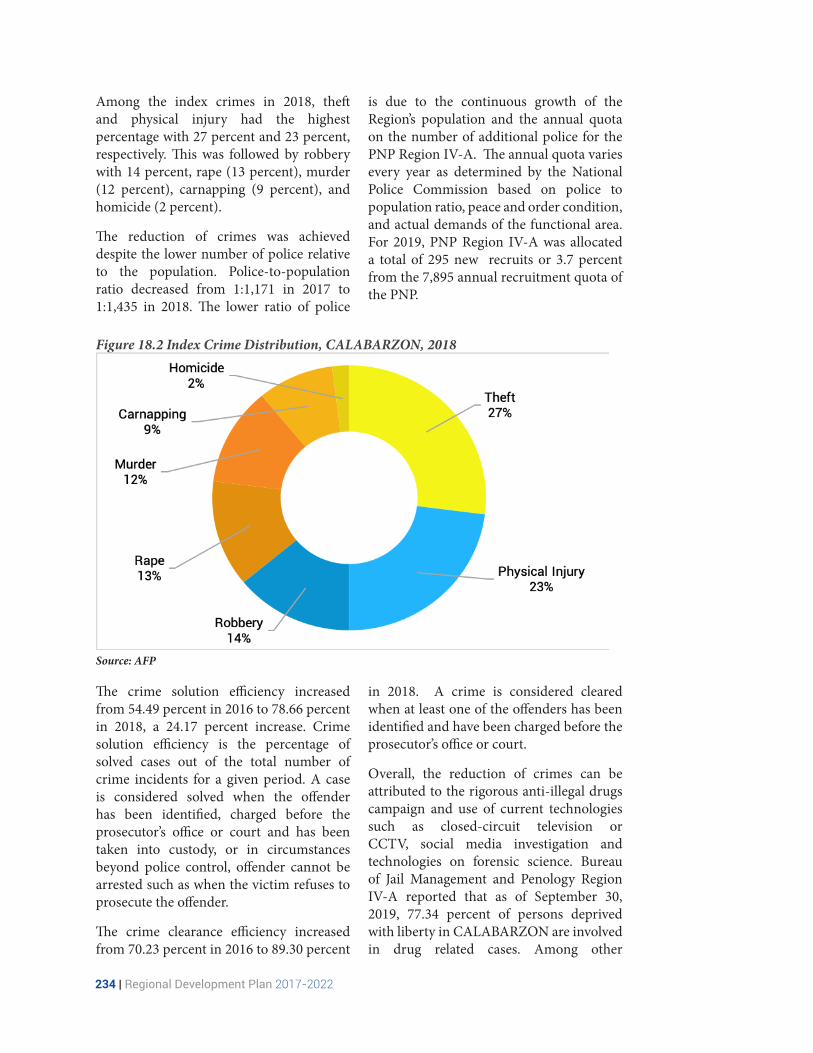
234 | Regional Development Plan 2017-2022
Among the index crimes in 2018, theft and physical injury had the highest percentage with 27 percent and 23 percent, respectively. This was followed by robbery with 14 percent, rape (13 percent), murder (12 percent), carnapping (9 percent), and homicide (2 percent).
The reduction of crimes was achieved despite the lower number of police relative to the population. Police-to-population ratio decreased from 1:1,171 in 2017 to 1:1,435 in 2018. The lower ratio of police
is due to the continuous growth of the Region’s population and the annual quota on the number of additional police for the PNP Region IV-A. The annual quota varies every year as determined by the National Police Commission based on police to population ratio, peace and order condition, and actual demands of the functional area. For 2019, PNP Region IV-A was allocated a total of 295 new recruits or 3.7 percent from the 7,895 annual recruitment quota of the PNP.
The crime solution efficiency increased from 54.49 percent in 2016 to 78.66 percent in 2018, a 24.17 percent increase. Crime solution efficiency is the percentage of solved cases out of the total number of crime incidents for a given period. A case is considered solved when the offender has been identified, charged before the prosecutor’s office or court and has been taken into custody, or in circumstances beyond police control, offender cannot be arrested such as when the victim refuses to prosecute the offender.
The crime clearance efficiency increased from 70.23 percent in 2016 to 89.30 percent
in 2018. A crime is considered cleared when at least one of the offenders has been identified and have been charged before the prosecutor’s office or court.
Overall, the reduction of crimes can be attributed to the rigorous anti-illegal drugs campaign and use of current technologies such as closed-circuit television or CCTV, social media investigation and technologies on forensic science. Bureau of Jail Management and Penology Region IV-A reported that as of September 30, 2019, 77.34 percent of persons deprived with liberty in CALABARZON are involved in drug related cases. Among other
Figure 18.2 Index Crime Distribution, CALABARZON, 2018
Source: AFP

Chapter 18 Ensuring Security, Public Order, and Safety | 235
interventions that helped reduce crimes in the Region are police-community programs like the OPLAN “Katok” that checks on loose and expired firearms, Community Mobilization Program involving the clustering of households that serve as first responders on crimes and other public safety concerns, increased police presence in populated areas, conduct of check points and aggressive campaign against wanted persons, guns-for-hire and private armed groups.
The Region will continue to pursue collaboration with communities and other stakeholders in its fight against all forms of crimes to promote security, public order and safety. These include participation of communities through the Community Mobilization Program and similar initiatives which will put in place a strong and sustainable community defense system against lawlessness and criminality.
Drugs infiltrationThere was a decrease in the number of barangays affected by illegal drugs in Region with the implementation of the Barangay Drug Clearing Program, intensified anti-illegal drugs operations and anti-drug campaign. As of July 2019,
the Philippine Drug Enforcement Agency (PDEA) reported a total of 1,503 barangays still affected by illegal drugs from 2,025 barangays in 2016. The presence of illegal drug trade in the Region is due to the proximity of CALABARZON to NCR and connectivity through its ports and highways. Shabu and Marijuana are still the primary and secondary drugs of choice in the Region, respectively. A series of recoveries in Quezon and Bicol shorelines revealed the presence of cocaine in the Region.
In 2018, a total of 11,327 anti-illegal drug operations were conducted by government security agencies which resulted in the arrest of 18,086 persons, filing of 7, 135 cases in court and confiscation of 18,623.51 grams of shabu and 18,528.95 grams of marijuana amounting to PHP 80,713,665.63.
In support to the current administration’s campaign against illegal drugs, government agencies and other private sector organizations in the Region formulated the Yakap Bayan: Community Mobilization and Support Program Action (YB:CMSP) Plan in January 2018. The plan contains strategies and interventions to address issues on peace and security, particularly the problem on illegal drugs. It was later strengthened in
Figure 18.3 Comparative Crime Clearance and Crime Solution Efficiency, CALABARZON, 2016-2018
Source: PNP

236 | Regional Development Plan 2017-2022
March 2018 through a Memorandum of Agreement among key security agencies and other development partners. The MOA ensures alignment of programs, projects and activities to the YB:CMSP Plan. Since 2018, several convergence activities have been conducted, including five outreach activities in convergence areas in the provinces of Batangas, Laguna, and Quezon. Convergence areas are priority areas in the Region for development interventions. The latter aims to provide coordinated assistance for inclusive growth & sustainable development.
Public safetyIn 2020, public order and safety was affected by two emergencies. On January 12, 2020, Taal volcano spewed ashes that reached as far as Central Luzon Region in the north and MIMAROPA Region in the south, resulting to the immediate evacuation of people in high risk areas and cancellation of classes and work. The eruption affected 12 municipalities and 3 cities in the provinces of Batangas and Cavite. It adversely affected about 110,000 families and damaged houses, public buildings, establishments and roads.
Lockdowns were implemented by affected LGUs in Batangas to prevent evacuated families from returning to their homes because of the threat from the Taal Volcano. However, there were reports of looting in locked down areas and enforcers had difficulty securing the area due to the risk brought by the possible volcanic eruption.
The monitoring of COVID-19 cases started in CALABARZON on March 13, 2020. As of April 8, 2020, CALABARZON had 223 confirmed cases, 25 deaths, and 9 recoveries. On March 16, 2020 President Rodrigo Duterte declared an ECQ in the entire Luzon effective from March 17 to April 13, 2020 and was later on extended to April 30, 2020 due to the sharp increase in the number of COVID-19 positive cases. Policemen and some military personnel
were assigned to man key checkpoints to ensure the restricted movement of people and non-essential activities. Communities and private individuals also volunteered to man local checkpoints within barangays.
Some of the issues confronted from these disasters are the lack of coordination among concerned agencies and local government units, inconsistency of reports on number of affected individuals and families, lack of protective equipment specially for frontliners, and lack of awareness of stakeholders on lockdown, quarantine, and disaster response procedures. Several security issues were also encountered such as poor compliance of some individuals to lockdown or quarantine regulations, civil disturbance, and even violence or crime towards frontliners.
Apart from natural disasters, individuals and families are also at risks because of internal conflicts, particularly those living in GIDAs of the Region. There were 19 conflict-affected barangays with rebel groups which suffered from low economic development due to peace and order issues. Moreover, it was observed that conflict prone areas also have high poverty incidence.
Overseas Filipinos’ securityOFs and their families are also exposed to economic risks due to the culture, structural changes and economic crises in foreign countries where they are working. The government continues to support OFs abroad through the provision of legal and social assistance. The number of Filipino migrants who availed government’s reintegration services decreased from 436 in 2016 to 348 in 2018. Different government programs such as the Livelihood Development Assistance Program, Balik Pinay! Balik Hanapbuhay!, and Financial Awareness Seminars are part
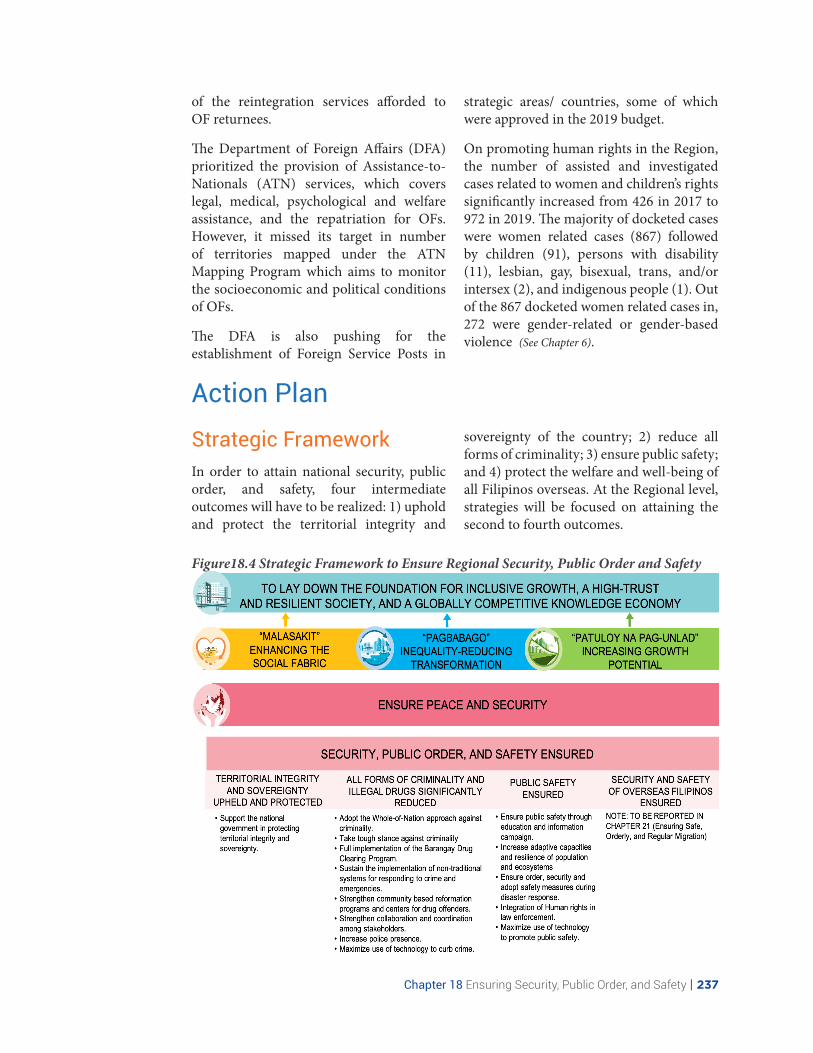
Chapter 18 Ensuring Security, Public Order, and Safety | 237
Action Plan
Figure18.4 Strategic Framework to Ensure Regional Security, Public Order and Safety
of the reintegration services afforded to OF returnees.
The Department of Foreign Affairs (DFA) prioritized the provision of Assistance-to-Nationals (ATN) services, which covers legal, medical, psychological and welfare assistance, and the repatriation for OFs. However, it missed its target in number of territories mapped under the ATN Mapping Program which aims to monitor the socioeconomic and political conditions of OFs.
The DFA is also pushing for the establishment of Foreign Service Posts in
strategic areas/ countries, some of which were approved in the 2019 budget.
On promoting human rights in the Region, the number of assisted and investigated cases related to women and children’s rights significantly increased from 426 in 2017 to 972 in 2019. The majority of docketed cases were women related cases (867) followed by children (91), persons with disability (11), lesbian, gay, bisexual, trans, and/or intersex (2), and indigenous people (1). Out of the 867 docketed women related cases in, 272 were gender-related or gender-based violence (See Chapter 6).
Strategic FrameworkIn order to attain national security, public order, and safety, four intermediate outcomes will have to be realized: 1) uphold and protect the territorial integrity and
sovereignty of the country; 2) reduce all forms of criminality; 3) ensure public safety; and 4) protect the welfare and well-being of all Filipinos overseas. At the Regional level, strategies will be focused on attaining the second to fourth outcomes.

238 | Regional Development Plan 2017-2022
StrategiesThe following priority strategies will be implemented:
Territorial integrity and sovereignty upheld and protected
Support the national government in protecting territorial integrity and sovereignty. The Region will be supportive of government efforts to protect territorial integrity and sovereignty, especially in addressing the issue on the West Philippine Sea.
All forms of criminality and illegal drugs reduced
Adopt the Whole-of-Nation approach. In support to the Whole-of-Nation approach institutionalized through Executive Order No. 70, the Region will strengthen its partnerships with all sectors including communities and other security forces for a more convergent approach against criminality. Communities at the barangay level will be encouraged to participate through various community interventions. Collaboration will also be applied in
Table18.1 Plan Targets to Ensure Regional Safety, Public Order and Safety
INDICATORSBASELINE
2018 END OF PLAN TARGET RESPONSIBLE AGENCY
VALUE 2020 2021 2022
Index crime volume reduced 8,473 10,563 10,035 9,533 DILG, PNP
Number of homicide victims reduced
184 187 177 168 DILG, PNP
Number of murder cases reduced 1,000 1,244 1,182 1,112 DILG, PNP
Crime solution efficiency rate improved
78.66 81 86 91% DILG, PNP
Crime clearance efficiency rate improved
91.45 90.39 98.53 100 DILG, PNP
Average monthly index crime rate reduced
4.73 5.85 5.33 4.79 DILG, PNP
Average monthly non-index crime rate reduced
21.96 16.03 14.59 13.13 DILG, PNP
Index crime solution efficiency improved
51.78 51.90 56.57 62.23 DILG, PNP
Non-index crime solution efficiency improved
84.45 58.38 63.63 70 DILG, PNP
Number of cleared drug affected barangays increased
664 715 PNP, PDEA
Number of law enforcers recruited and trained increased
593 1000 1000 1000 DILG, PNP
Police to Citizen ratio increased 1:1,435 1:887 '1:835 '1:788 DILG, PNP
Ratio of Firefighter to Population 1:7,507 1:7,527 1:7,388 1:7,248 BFP
Ratio of Fire truck to firefighter 1:6 1:7 1:7 1:8 BFP
Fire safety inspector- establishments ratio
450:1 418:1 406:1 398:1 BFP
Number of deaths due to fire incidents decreased
33 42 42 42 BFP
Loss and damages due to natural disasters (Chapter 20)
OCD
Loss and damages due to human-induced disasters (Chapter 20)
OCD
Targets

Chapter 18 Ensuring Security, Public Order, and Safety | 239
rehabilitating and integrating offenders back to society to ensure a holistic and participative approach towards sustaining public order and safety. Among the government programs that support this strategy and promotes volunteerism in communities are the Department of the Interior and Local Government’s Mamamayan Ayaw Sa Anomalya-Mamamayan Ayaw Sa Illegal na Droga (MASA-MASID) program and PNP’s Community Mobilization Program (CMP). MASA-MASID and CMP are government’s platform for stronger collaboration between the LGU, community, and national government to fight criminality, corruption, and illegal drugs.
Take tough stance against criminality. The PNP will continue to intensify its campaign against eight focus crimes such as murder, homicide, theft, robbery, carnapping of two-wheeled and four-wheeled vehicles, physical injuries and rape side by side with the war on illegal drugs and will pursue its internal cleansing programs, ridding its ranks of corrupt, misfits and ‘scalawags’ in uniform.
Full implementation of the Barangay Drug Clearing Program. The program was designed to provide a more effective and efficient measure towards preventing and eradicating illegal drugs through the assistance of local government units in drug-clearing operations. It involves the creation of Barangay Anti-Drug Abuse Councils (BADACs) in all barangays. To make BADACs fully functional, the Department of the Interior and Local Government, Dangerous Drugs Board and PDEA -will reorient and re-tool BADAC officers and conduct regular monitoring of BADAC activities.
Sustain the implementation of non-traditional systems for responding to crime and emergencies. The establishment of hotlines for fast and effective response to
crimes and emergencies, e.g. emergency hotline (911) in all barangays, are encouraged to be funded. Programs and projects that promote community based interventions in addressing crimes and emergencies shall also be supported such as the Ugnayan ng Barangay At Simbahan or UBAS, a strategic partnership of barangays, church and other faith-based organizations, and the Department of the Interior and Local Government for good governance and for the common good.
Strengthen community based reformation programs and centers for drug offenders. In January 2018, the regulation which laid the groundwork for “Balay Silangan” was approved through DDB Board Regulation No. 2 series of 2018. The program offers temporary refuge for drug offenders with the objective of reforming drug offenders into self-sufficient and law-abiding members of society. This serves as an alternative intervention for drug personalities who are not eligible to be admitted in treatment and rehabilitation facilities supervised by the Department of Health. In CALABARZON, Santa Rosa City and Lipa City have already established reformation centers.The Philippine Drug Enforcement Agency Region IV-A is currently working closely with LGUs to adopt the reformation program and replicate it in their localities.
Strengthen collaboration among law enforcement agencies (LEAs). Despite the active campaign against crime, there is still a need for more collaboration among LEAs for the success and sustainability of peace and development initiatives. There should be a close coordination and intelligence sharing of all LEAs.
Strengthen collaboration and coordination among stakeholders. In order to provide prompt action during disasters and address miscommunication and inconsistency of data or policies being released to the public, existing coordination and collaboration

240 | Regional Development Plan 2017-2022
protocols need to be improved. Despite the active campaign against crime, there is still a need for stronger collaboration among LGUs, government agencies including LEAs for the success and sustainability of peace and development initiatives. There should be a close coordination and sharing of information among stakeholders.
Increase police presence. The large and growing population in Region IV-A necessitates the need to increase the number of police in the Region. The current police-to-population ratio in the Region is far from the standard of 1:500. Thus, there is a need to intensify the hiring of policemen, review and increase the quota for additional police force, and increase the budget for personnel services.
Maximize use of technology to curb crime and promote public safety. The Region recognizes the role of technology in addressing crimes and ensuring public safety such as the use of closed-circuit television or CCTV in improving law enforcement and the use of drones to improve the fire-fighting efficiency of the Bureau of Fire Protection. Implementation of laws, passage of bills and other interventions that promote technology and crime prevention shall be supported such as the Philippine ID System Law and SIM Card Registration Bill and Emergency Hotline (911) in all barangays. Cybersecurity measures shall be strengthened and closely monitored through upgrading and regular security checks of government and other critical websites (e.g. banks/financing institutions). Meanwhile, cybercrime shall also be addressed through information campaigns to the public on protection of personal information and accounts.
Public safety ensured
Ensure public safety through education and information campaign. Crime prevention and fire safety through education and information campaign will be sought
to ensure public safety. Disaster Risk Reduction Management, crime awareness, and preventive drug education must be taught in schools. Moreover, the family as a basic unit of the community should take an active role in building the moral values of the youth.
Increase adaptive capacities and resilience of population and ecosystems (See Chapter 11 and 20). The Region will strengthen implementation of DRRM-CCAM, improving the timely and adequate response to disasters and increase resiliency of the population.
Ensure order, security and adopt safety measures during disaster response. Security risks brought by disasters need to be addressed immediately to maintain public order; hence, the Region will plan and integrate security measures in DRRM and other emergency situations. Security protocols will be implemented to prevent crimes such as looting and keep individuals safe and away from danger areas. Safety issues during disaster response such as evacuation of individuals will also be addressed especially the safety of vulnerable groups including the elderly and persons with disability.
Maintaining public order during emergencies such as pandemics will entail the following actions: a) regular, clear and strong coordination among levels of government and between policy-makers and implementers such as uniformed personnel on the implementation of protocols and guidelines; b) effective risk communication to households and individuals on uniform protocols, i.e. quarantine or lockdown regulations; c) heightened community surveillance on reports of misbehaviour, crime or violence, with the assistance of local government units; d) ensure maintenance of law and order in affected areas; e) establishment of checkpoints to implement lockdowns

Chapter 18 Ensuring Security, Public Order, and Safety | 241
Major Programs and Projects• Arrest of High Value Targets• Assistance-to-Nationals• Balay Silangan• Balik Pinay! Balik Hanapbuhay!• Barangay/City/ Municipality/Provincial
Anti-Drug Abuse Council • Barangay Drug Clearing Program• BantayTurista• Community Mobilization Program• Drug Free Workplace Program• Executive Order No. 70
Umbrella Program• Establishment of Emergency
Operations Center• Establishment of Emergency Hotlines• Financial Awareness Seminars• Fire Safety and Awareness Campaign• High Impact Operations to arrest
drug groups• High resolution closed-circuit television
cameras in barangays and in all business establishments
• IEC through social media • Legal assistance to victims of crimes
e.g. discrimination• Livelihood Development
Assistance Program• Oplan Harabas. Surprise drug testing for
public utility vehicles • Oplan Sagip Batang Solvent• Police Integrated Patrol System• Project Double Barrel Alpha• Purchase of PPEs• Regulation of websites or applications
that promote crimes through the Cybercrime Prevention Act of 2012 or Republic Act No. 10175
• Ugnayan ng Barangay at mgaSimbahan• Values formation for the youth• Yakap Bayan: Community Mobilization
and Support Program
or community quarantines; f) provision of logistical support such as quarantine buses/shuttle to ensure delivery of healthcare and public services; and g) ensure protection of frontline health workers and security personnel.
Integration of Human rights in law enforcement. Recognizing the value of human rights; the Region will integrate human rights into law enforcement by sustaining human rights officer in law enforcement agencies. Investigation and resolution of human rights violation cases will also be expedited and partnerships with state and non-state duty bearers will be forged to help address human rights violations.
Maximize use of technology to promote public safety. Technologies such as drones for improving the fire-fighting efficiency of the Bureau of Fire Protection shall be utilized. Online videoconferencing tools shall also be used during lockdowns or quarantine period to ensure continouous delivery of public services and maintain public order and safety. Early warning systems and other warning equipment that could reach remote disaster-prone areas, and communication tools such as mobile texting and social media shall be utilized.
Security and safety of OFs ensured
The strategies to ensure the security and safety of OFs are cross-referenced in Chapter 21, Ensuring Safe, Orderly, and Regular Migration.
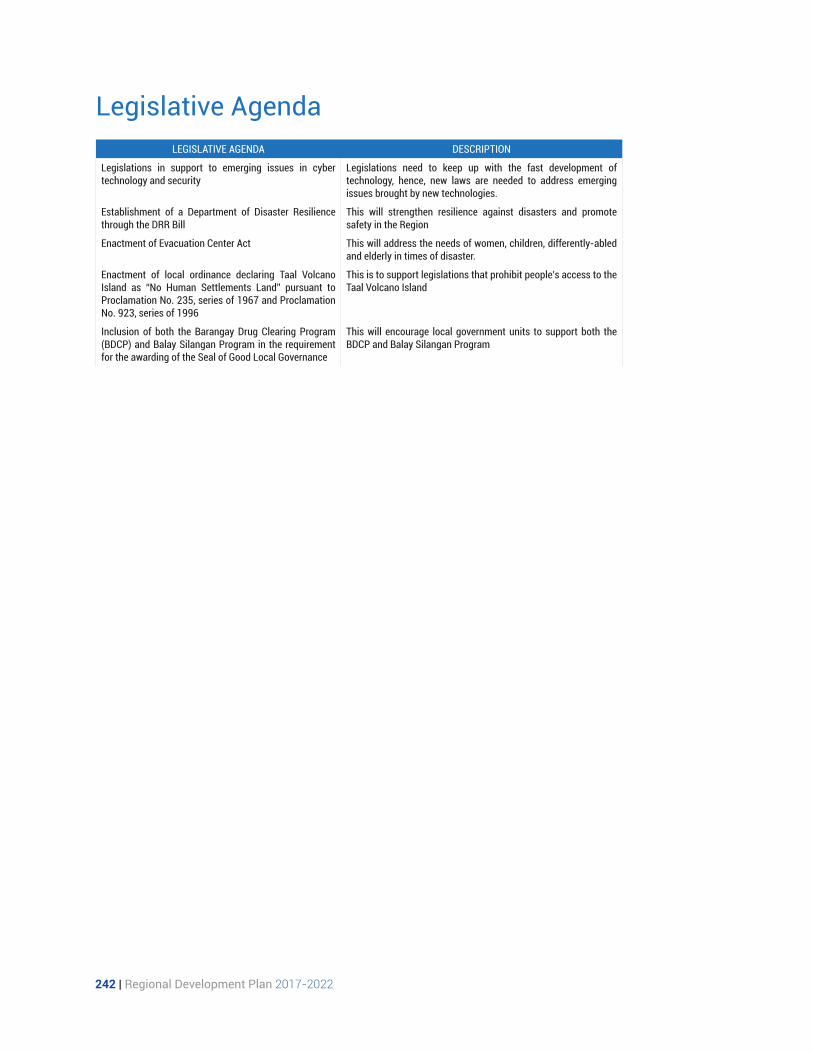
242 | Regional Development Plan 2017-2022
Legislative AgendaLEGISLATIVE AGENDA DESCRIPTION
Legislations in support to emerging issues in cyber technology and security
Legislations need to keep up with the fast development of technology, hence, new laws are needed to address emerging issues brought by new technologies.
Establishment of a Department of Disaster Resilience through the DRR Bill
This will strengthen resilience against disasters and promote safety in the Region
Enactment of Evacuation Center Act This will address the needs of women, children, differently-abled and elderly in times of disaster.
Enactment of local ordinance declaring Taal Volcano Island as “No Human Settlements Land” pursuant to Proclamation No. 235, series of 1967 and Proclamation No. 923, series of 1996
This is to support legislations that prohibit people’s access to the Taal Volcano Island
Inclusion of both the Barangay Drug Clearing Program (BDCP) and Balay Silangan Program in the requirement for the awarding of the Seal of Good Local Governance
This will encourage local government units to support both the BDCP and Balay Silangan Program

Chapter 19 Accelerating Infrastructure Development | 243

244 | Regional Development Plan 2017-2022

Chapter 19 Accelerating Infrastructure Development | 245
Chapter 19
Accelerating Infrastructure DevelopmentIn order to achieve the national goal of inclusive growth, accelerated and strategic infrastructure development will be pursued. The Region will implement infrastructure projects in transportation, flood control, water resources, power and energy, social welfare, and information and communication technology. These infrastructures aim to support economic development, safe environment, and mobility of people, goods and services.
Assessment and ChallengesLand transportRoads and bridges
The length of national roads in CALABARZON increased by 25.20 kilometers from 2016 to 2018. As of June 2018, the total national road length in the Region is 2,542.32 kilometers. The increase in road length was attributed to the newly completed and converted national roads. Quezon has the longest length of national roads constructed as it has the biggest land area. No new additional road was constructed in 2019 because DPWH focused on road widening projects.
As of 2018, a total of 52.77 kilometers of road are undergoing road conversion based from the online 2018 DPWH Atlas. The completed roads awaiting conversion are the Tiaong Bypass Road and Candelaria Bypass Road in Quezon. Ongoing bypass and diversion roads that are being constructed are the Lipa City-Padre Garcia Diversion Road, Batangas City-San Pascual-Bauan Bypass Road, Sta. Rosa –Tagaytay-Ulat Bypass Road, Alaminos-San Pablo City Bypass Road, Sariaya Bypass Road among others. These projects are expected to decongest the existing roads and improve interconnectivity in the Region. A map of the existing national road network is shown in Figure 19.1.
Existing national roads in priority corridors were continuously being widened to increase vehicle capacity and decongest the urban centers. From 2016 to 2018, a total of 47.88 kilometers of priority national roads were widened. However, the increased in the vehicle capacity of these widened roads is yet to be realized due to the presence of obstructions along the RROW which pose danger to the other motorists and the general public. Only 50.48 percent of the national roads are in good condition as of 2018 (Table 19.2). The target for national roads improvement for 2018 was not met because of limited funding for road rehabilitation projects. Another issue observed in the Region is the absence of road plans in the congressional districts making budget prioritization difficult. During the Taal Volcano Eruption, traffic jams were observed along the road networks surrounding the Taal Volcano Protected Landscape. The existing road networks in the affected areas cannot accommodate the volume of vehicles in case of immediate evacuation. Recently, the community lockdowns brought by the COVID-19 Pandemic also adversely affected the transportation of essential personnel and goods, and the construction of transportation projects.

246 | Regional Development Plan 2017-2022
The length of permanent bridges increased from 18,547 linear meters in 2016 to 18,575.17 linear meters in 2018, while the number of permanent bridges in Region decreased to 651 in 2018 from 654 in 2017 due to the undergoing rehabilitation of these bridges.
Expressway
The total length of expressways or toll roads in the Region is 105.87 kilometers (Table 19.3). The South Luzon Expressway (SLEX) in Metro Manila extends to Calamba City (Toll Road 2) and Sto. Tomas Batangas (Toll
Table 19.1 National Road Length Increased, By Province, CALABARZON, 2018PROVINCE 2016 TOTAL LENGTH (KM) 2018 TOTAL LENGTH (KM) INCREASE
Cavite 438.84 438.84 -
Laguna 349.49 349.49 -
Batangas 536.39 555.48 -
Rizal 232.57 232.49 -
Quezon 941.00 966.02 25.2
CALABARZON 2,517.30 2,542.32 25.2Source: DPWH IV-A
Figure 19.1 CALABARZON National Road Network 2017
Source: DPWH
Table 19.2 National Road Condition, CALABARZON, 2018CONDITION LENGTH (IN KM)
Good 1,283.42 km (50.48%)
Fair 632.73 km (24.89%)
Poor 209.46 km (8.24%)
Bad 74.72 km (2.94%)
No assessment 342.00 km (13.45%)Source: DPWH IV-A
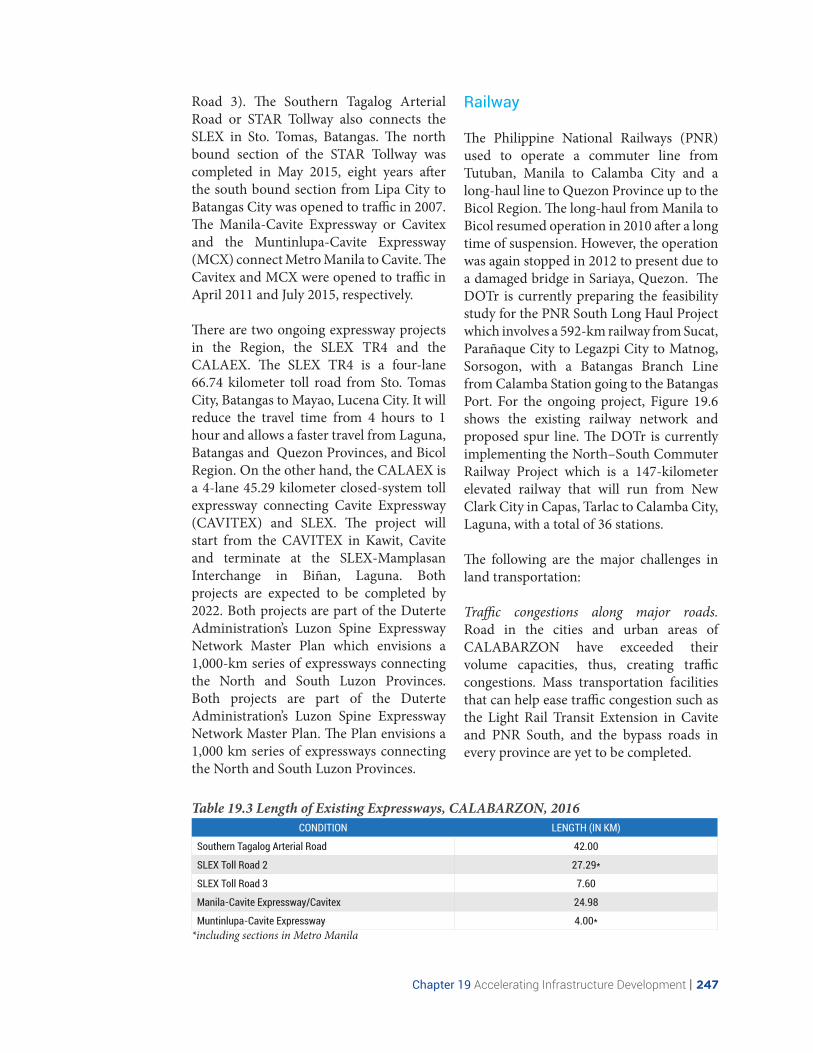
Chapter 19 Accelerating Infrastructure Development | 247
Table 19.3 Length of Existing Expressways, CALABARZON, 2016CONDITION LENGTH (IN KM)
Southern Tagalog Arterial Road 42.00
SLEX Toll Road 2 27.29*
SLEX Toll Road 3 7.60
Manila-Cavite Expressway/Cavitex 24.98
Muntinlupa-Cavite Expressway 4.00**including sections in Metro Manila
Road 3). The Southern Tagalog Arterial Road or STAR Tollway also connects the SLEX in Sto. Tomas, Batangas. The north bound section of the STAR Tollway was completed in May 2015, eight years after the south bound section from Lipa City to Batangas City was opened to traffic in 2007. The Manila-Cavite Expressway or Cavitex and the Muntinlupa-Cavite Expressway (MCX) connect Metro Manila to Cavite. The Cavitex and MCX were opened to traffic in April 2011 and July 2015, respectively.
There are two ongoing expressway projects in the Region, the SLEX TR4 and the CALAEX. The SLEX TR4 is a four-lane 66.74 kilometer toll road from Sto. Tomas City, Batangas to Mayao, Lucena City. It will reduce the travel time from 4 hours to 1 hour and allows a faster travel from Laguna, Batangas and Quezon Provinces, and Bicol Region. On the other hand, the CALAEX is a 4-lane 45.29 kilometer closed-system toll expressway connecting Cavite Expressway (CAVITEX) and SLEX. The project will start from the CAVITEX in Kawit, Cavite and terminate at the SLEX-Mamplasan Interchange in Biñan, Laguna. Both projects are expected to be completed by 2022. Both projects are part of the Duterte Administration’s Luzon Spine Expressway Network Master Plan which envisions a 1,000-km series of expressways connecting the North and South Luzon Provinces.Both projects are part of the Duterte Administration’s Luzon Spine Expressway Network Master Plan. The Plan envisions a 1,000 km series of expressways connecting the North and South Luzon Provinces.
Railway
The Philippine National Railways (PNR) used to operate a commuter line from Tutuban, Manila to Calamba City and a long-haul line to Quezon Province up to the Bicol Region. The long-haul from Manila to Bicol resumed operation in 2010 after a long time of suspension. However, the operation was again stopped in 2012 to present due to a damaged bridge in Sariaya, Quezon. The DOTr is currently preparing the feasibility study for the PNR South Long Haul Project which involves a 592-km railway from Sucat, Parañaque City to Legazpi City to Matnog, Sorsogon, with a Batangas Branch Line from Calamba Station going to the Batangas Port. For the ongoing project, Figure 19.6 shows the existing railway network and proposed spur line. The DOTr is currently implementing the North–South Commuter Railway Project which is a 147-kilometer elevated railway that will run from New Clark City in Capas, Tarlac to Calamba City, Laguna, with a total of 36 stations.
The following are the major challenges in land transportation:
Traffic congestions along major roads. Road in the cities and urban areas of CALABARZON have exceeded their volume capacities, thus, creating traffic congestions. Mass transportation facilities that can help ease traffic congestion such as the Light Rail Transit Extension in Cavite and PNR South, and the bypass roads in every province are yet to be completed.

248 | Regional Development Plan 2017-2022
Figure 19.2 Map of Existing and Proposed CALABARZON Expressways
Source: TRB
Obstructions on Road Widening Projects. The utility posts and trees located within the road-right-of-way are traffic hazards and cause delay in road widening projects. Coordination meetings among DPWH, DENR, DILG, LGUs, utility companies and other stakeholders are being undertaken to facilitate the removal of these road obstructions. DPWH Region IV-A currently leads the TWG on the Removal of Road Obstructions in the Region.
Deterioration of road condition (see Table 19.2). The causes of road deterioration are water seepage in road pavements and overloading of trucks. Load limits are not regularly monitored due to limited number and non-operation of the weighing stations, particularly the station located Turbina, Calamba City. The regular maintenance of roads to address road cracks, water seepage, among others is often not conducted due to budget issues.
Safety concerns on the roads. Flooded roads and insufficient lightings and signages in some areas pose danger to the
travelling public. Limited budget on road improvement and maintenance cause these inconveniences to the public.
Access to tourist destinations, industrial areas, and agricultural and far-flung areas. While CALABARZON has a relatively high road density, access to tourist destinations, industrial areas and geographically isolated areas is still a concern. The DOT-DPWH Convergence Program, which will improve access to tourist destinations now has 28 projects completed while 11 are still ongoing as of December 2018. These projects improved the accessibility of various tourist spots in the Region. For the improvement in access to industries, the DTI in partnership with the DPWH is currently implementing the Roads Leveraging Linkages of Industry and Trade (ROLL-IT). On the other hand, more farm-to-market roads are being requested especially by GIDAs in CALABARZON.

Chapter 19 Accelerating Infrastructure Development | 249
Figure 19.3 Map of PNR Railway Network
Source:DOTr
Water and air transportation
Continuous rehabilitation and repair projects in existing ports are being undertaken. Rehabilitation and repair projects in Batangas Port were completed in 2018 enhancing port operations and services. These projects include construction of multi-level parking and crane rail extension in Batangas Port Phase I. Completed repair works in Lucena City, Quezon in 2018 included the RoRo Terminal Fee Facility in Gate 2 and reblocking of damaged concrete pavement.
A new passenger terminal building with modern facilities will also be constructed in Batangas Port to cater the increasing number of passengers of the Port. The improved facility will accommodate an estimated capacity of 3,200 to 3,600 seats in its passenger lounge.
Connectivity improved through utilization of existing ports. The existing ports in Batangas and Quezon Provinces are important transport facilities that connect CALABARZON to island Regions of MIMAROPA and Western Visayas. These port facilities are vital mode of transport for tourism, manufacturing and agriculture-based industries.
In terms of cargo, the combined performance of the two major ports improved from 2016 to 2018, and targets were exceeded. The non-containerized cargo grew by 17 percent while the containerized cargo throughput grew by 105.4 percent from 2016. The significant increase in containerized cargoes is recorded in 2018, with 63.6 percent increase from the previous year brought by the shift in direct shipment from Metro Manila to South Luzon Gateway. The 2018 targets for the non-containerized and containerized cargoes were both exceeded. The increase

250 | Regional Development Plan 2017-2022
can also be attributed to the docking of bigger ships and higher frequency of vessel trips to Batangas Container Terminal.
The number of passengers using Batangas Port and theports in Quezon grew by 11 percent from 2016 to 2018, however, it declined by 0.71 percent in 2018 from 2017. The decline in the passenger traffic is brought by the decrease in the passengers in the Batangas Port due to the six-month closure of Boracay Island for rehabilitation. Strict implementation of the carrying capacity of the island resulted in a slowdown in the number of passengers using the Batangas Port. Boracay Island is among the top tourists’ destinations of travellers from Batangas Port. Despite the reduction in the number of passengers from the previous year, the target passengers for 2018 was exceeded.
Furthermore, MARINA, has recently opened and is proposing new routes for passenger vessels and RoRo from the Region. Among the new routes in CALABARZON are the Batangas City – San Jose, Occidental Mindoro, San Juan, Batangas – Abra de Ilog, Occidental Mindoro, Real, Quezon
– Polillo Island, Quezon, Lucena, Quezon – Odiongan, Romblon, Lucena, Quezon – Buyabod, Marinduque, Lucena, Quezon – Romblon, Romblon, Lucena, Quezon – Masbate City and San Narciso, Quezon – San Pascual, Masbate.
The number of vessels which passed through these ports grew by 17.5 percent from 2016. The increase can be attributed to the continuous improvement in the port facilities. Target for 2018 was also exceeded.Early in 2019, the Asian Terminal Inc. inaugurated the expanded berthing facilities in the Batangas Container Terminal. The expansion will increase the terminal’s capacity to 500,000 TEUs, which is double of its previous capacity.
On-going rehabilitation of Sangley Airport to decongest NAIA. The Sangley Airport in Cavite under the Sangley Airport Development Project is being rehabilitated since 2018. The rehabilitation works were substantially completed in October 2019 and inaugurated in February 2020. The completed airport will be utilized for general aviation.
Table 19.4 Throughput of Batangas and Lucena Ports in 2016-2018
INDICATORACCOMPLISHMENT GROWTH
RATE (%)2018
TARGET
% OF TARGET
ATTAINED2016 2017 2018
Non-containerized cargo throughput (MT)
25,896,467 28,272,003 30,300,309.41 17.0 28,597,374 106
Containerized cargoes (TEU)
157,319 197,534 323,135 105.4 189,313 171
Number of passengers 7,831,396 8,693,410 8,631,540 10.2 8,437,382 102
Number of vessels 47,189 54,574 55,453 17.5 48,989 113Source: Philippine Ports Authority – Port Management Office of Batangas and Marquez
Power generation and electrificationRural electrification remains a challenge. The proportion of sitios served with electric connections to potential sitios increased by only 0.82 percent in 2018 from 2016, thus,
the target of energizing 95.58 percent of sitios in 2018 was not met. The inclement weather and difficulty in reaching remote areas delayed the installation of electric connections. In 2017, the reported household electrification level in Region IV-A is at 96.1 percent. The decrease by 0.6 percentage points from the 2016 level can be

Chapter 19 Accelerating Infrastructure Development | 251
Table 19.5 Household and Sitio Electrification in 2016-2018
INDICATORACCOMPLISHMENT GROWTH
RATE (%)2018
TARGET
% OF TARGET
ATTAINED2016 2017 2018
Proportion of sitios with electric connections against potential sitios increased (%)
91.86 92.53 92.68 0.82 95.58 -2.9
Proportion of households with electric connections against potential households increased (%)
96.7 96.1 100 3.3 97.95 2.05
Source: Department of Energy
Table 19.6 Number of Powered-Up Sites with Free Wi-Fi Internet Access and Pop Established in CALABARZON, 2016-2018
INDICATOR 2016 2017 2018 GROWTH RATE (%)
Number of powered-up sites with free Wi-Fi internet access 28 75 59 110.7
Number of Point of Presence established 1 1 1 0Source: Department of Information and Communications Technology – Luzon Cluster_2
attributed to the adoption of a new baseline of potential household count as required in the 2015 PSA Census.
On the other hand, the proportion of households with electric connections to potential households increased by 4.86 percent and the target for 2018 was exceeded. The overachievement of the target was attributed to the intensified electrification and cooperation of the provincial and local officials.
Power sources will increase. CALABARZON contributed 7,524.36 megawatts capacity in 2019 or approximately 49 percent of the 15,261.4 megawatts dependable capacity of the Luzon Grid. The expansion of the coal-fired power plant in Pagbilao Unit 3 in Quezon with a dependable capacity of 420 megawatts and the Modular Gas Turbine Units 3 and 4 in Calaca, Batangas will contribute 46 megawatts to the Luzon Grid.
Slowdown in provision of public internet facilities. Establishment of additional
powered-up sites with free Wi-Fi internet access in the Region grew at 110.7 percent from 2016. However, there was a decrease on established powered-up sites in 2018. On the other hand, there was one Point of Presence established in Batangas in 2018. The Points of Presence are essential network elements where equipment that route, store or transmit internet data are housed.
ICTSlowdown in provision of public internet facilities. Establishment of additional powered-up sites with free Wi-Fi internet access in the Region grew by 110.7 percent from 2016 to 2018. However, there was a decrease on the established powered-up sites in 2018. On the other hand, there was only one Point of Presence (POP) established in the Region (located in Batangas) over the three-year period. POPs are essential network elements where equipment that route, store or transmit internet data are housed.
Water resourcesAccess to water and availability of water is a primary or necessary condition for
economic development. Hence, efficient management of water resources is fundamental to achieve the Sustainable Development Goal of ensuring availability of clean water and sanitation. Access to

252 | Regional Development Plan 2017-2022
On the other hand, a total of 48.03 and 56.82 kilometers of canal lining were constructed in 2017 and 2018, exceeding their targets by 8 and 37 percent, respectively. For 2019, only 31.37 kilometers (32.40%) of canal lining out of the 96.82-kilometer target was constructed.
In addition, 479 units or 85 percent of the 561 units targeted for 2017-2022 were already achieved. These units pertain to irrigation structures such as protection
works, pumphouse, water tank, turnout, check structures and diversion works, among others. Most of the units were established in 2017 and 2018. In 2019, 101 units or only 32 percent of the target units. The non-achievement of the target can be attributed to the untimely release of fund and unfavorable weather condition.
information, investment in infrastructure and strengthening of policies are necessary to improve management of water resources.
Irrigation service improved
The irrigation performance is based on the following: a) irrigated areas (new, restored and rehabilitated); b) length of canal lining; c) number of structures; d) ratio of actual irrigated area to the total potential area; and e) cropping intensity.
The target of 825 hectares of newly- irrigated areas was achieved in 2017 while only 817 hectares or 83 percentof the 988 hectares target in 2018 was met. In addition, the Matataja Small Impounding Project (SIP) was converted into four SIPs with a service area of 120 hectares. The SIPs contributed to the 654 hectares of newly-irrigated areas in 2019. Likewise, the targeted restored irrigation area of 279 and 364 hectares in 2017 and 2018 were achieved while a total of187 hectaresor 78 percent of the targeted 240 hectares were met in 2019.
Table 19.7 Performance of Irrigated Areas (in hectares), 2016 to 20182016 2017 2018 2019
New Irrigated Areas (ha)
Target N/A 825 988 1,835
Actual 617 825 817 336
Variance N/A 0 -171 -1,499
Restored Irrigated Areas (ha)
Target N/A 279 364 240
Actual 749 279 364 107
Variance N/A 0 0 -133
Length of canal lining (km)
Target N/A 44.27 41.53 96.82
Actual 26.84 48.03 56.82 2.59
Variance N/A 3.76 15.29 -94.23
Number of structures
Target N/A 58 134 313
Actual 109 173 196 15
Variance N/A 115 62 -298Source: NIA

Chapter 19 Accelerating Infrastructure Development | 253
Table 19.9 Access to Sanitation and Safe Water Supply, 2016 to 20182016 2017 2018
Percentage of households with access to safe water supply
Target N/A 95 95
Actual 66 95 91
Variance N/A 0 -4
Proportion of households with access to basic sanitation to total number of households
Target N/A 95 95
Actual 65 77 82
Variance N/A 0 -13Source: DOH
Ratio of actual irrigated area to total potential irrigable area increased
The ratio of actual irrigated area increased every year from 2016 to 2019. From 57.36 percentaccomplishment in 2016, the total potential irrigated area increased to 71.76 percent in 2017, an increase of 14.4 percent. Moreover, the actual irrigated area of 74.15 percent in 2018 and 77.8 percent in 2019 exceeded their targets by 1.96 and 1.87 percentage points, respectively. As a result, the cropping intensity increased at an average of 2.4 percent per year from 2016 to 2019. From 147 percent accomplishment in 2016, the cropping intensity increased to 151 percent in 2017, 154 percent in 2018 and 158 percent in 2019.
Households with access to safe water supply increased
Households with access to safe water supply increased from 66 percent in 2016 to 95 percent in 2017. However, the 95 percent target for 2018 was not achieved. Similarly, though the proportion of households with access to basic sanitation to total number of households increased from 65 percent in 2016 to 77 percent in 2017, the 95 percent target for 2018 was not met. Nonetheless, the overall achievement on access to sanitation and safe water supply improved from 2016 to 2018. This can be attributed to Zero Open Defecation Program and Water Safety Plan Certification activities of the DOH.
Table 19.8 Ratio of Actual Irrigated Area, and Cropping Intensity, 2016 to 20182016 2017 2018 2019
Ratio of actual irrigated area to total potential irrigable area increased (% cumulative)
Target N/A 69.09 72.19 75.31
Actual 57.36 71.76 74.15 77.8
Variance N/A 2.67 1.96 2.49
Cropping intensity increased (% cumulative)
Target N/A 148 151 156
Actual 147 151 154 156
Variance N/A 3 3 0Source: NIA

254 | Regional Development Plan 2017-2022
Groundwater management plans and monitoring wells established
The National Water Resources Board initiated the development of Groundwater Management Plans in groundwater of highly urbanized areas. The Plan provides recommendations to address water constraints and monitor effectiveness of groundwater policies in the area through establishment of groundwater monitoring wells, and serve as basis for protection and conservation efforts. Among the target cities in CALABARZON were Batangas, Cavite, Santa Rosa, Binan, Cabuyao, San Pedro and Calamba.
The development of the Ground Management Plan for Batangas City was completed as scheduled in 2018 while three monitoring wells were already installed in Bacoor, Cavite.
Delayed implementation of water infrastructure projects
Water Supply
In March 2019, numerous areas in Metro Manila, Cavite and Rizal began experiencing inadequate potable water supply. This can be attributed to limited sources of water coupled with growing demand for potable water. The implementation of the New Centennial Water Source Project (NCWSP)- Kaliwa Dam can augment the source for potable water. Kaliwa Dam is expected to provide water security, reliability and additional water supply for Metro Manila, and Cavite and Rizal Provinces, and reduce pressure and dependency on Angat Dam Reservoir.
Table 19.10 Projected Water Supply Demand in Cavite and Rizal Province, 2018-2021
PROVINCEPOPULATION
2018 2019 2020 2021
Cavite 897,656 1,516,033 1,554,915 1,589,932
Rizal 2,385,471 2,728,120 2,826,388 2,934,553Source: MWSS
Growing water demand
The population of CALABARZON is projected to reach 16.7 million by 2025 or 2.6 million higher than 2015. The increase in population means increase in demand for water. Also, the warming effect of the global climate change increases our water needs for drinking and bathing. Therefore, water resources need to be efficiently managed to satisfy household water demand and support productive economies in agriculture, industry and energy.
As shown in Table 19.7, MWSS expects an increase in water demand in Cavite and Rizal Provinces from 2018 to 2021.
Social infrastructure By 2023, all strategic social infrastructures in the Region will be in place. All school buildings will have functional water and electricity connections, while health facilities will be accessible even in far-flung areas of the CALABARZON Region. These can be achieved through increased public spending and various convergence projects between private and government sectors. The continued promotion of the Electrification and the Water, Sanitation and Hygiene in Schools (WINS) Program will complement the classrooms that will be constructed under the School Building and Last Mile Schools Programs.

Chapter 19 Accelerating Infrastructure Development | 255
Table 19.11 School Infrastructure and Facilities, CALABARZON, 2016-2019
INDICATORANNUAL PLAN TARGETS ACCOMPLISHMENT END OF PLAN
TARGET2017 2018 2019 2017 2018
Classroom to pupil ratio improved
Kindergarten 1:30 1:25 1:25 1:25 - 1:25
Primary (Grade 1-3) 1:45 1:35 1:35 1:42 1:41 1:30
Primary (Grade 4-6) 1:45 1:45 1:45 1:42 1:41 1:40
Junior High School 1:45 1:45 1:45 1:41 1:62 1:40
Senior High School 1:40 1:40 1:40 1:41 1:62 1:40
Proportion of public schools with adequate water and sanitation facilities to total number of public schools increased (% cumulative)
a. Primary (K to 6) 78.58 82.85 87.12 74.31 - 100
b. Junior High School 72.19 77.75 83.31 66.62 - 100
c. Senior High School - - - 66.62 - -
Proportion of public schools with connection to electricity to total number of public schools increased (% cumulative)
a. Primary (K to 6) 96.2 96.96 97.72 95.44 98.33 -
b. Junior High School 96.2 96.96 97.72 95.44 98.15 -
c. Senior High School - 99.56 99.65 95.44 99.56 -Source: DepEd Region IV-A
Education
Additional classrooms are needed. Classroom to pupil ratio improved from its baseline data of 1:45 in 2016 to 1:41 in 2018 for primary grades. However, targets for the same year were not met in both junior and senior high schools even for schools that offered shifting classes.
Despite increased funding from various convergence projects, construction of additional classrooms was hindered by the lack of land. Other issues identified during project implementation were the shortage of manpower and equipment, unstable soil condition, poor quality of constructed buildings, and contractual concerns.
The delayed implementation of projects under the School Building Program in 2019 also contributed to the non-achievement of the targets, with only one out of 92 school building projects completed as scheduled.
Health
Number of operational barangay health stations in the Region declined. The decrease in the number of operational barangay health stations (BHS) was due to the renovation and relocation of BHS formerly situated in the barangay halls. The 113 renovated BHS in 2018 are expected to be completed on the first quarter of 2020.
Even with the ongoing implementation of the Health Facilities Enhancement Program (HFEP) which covers the construction, repair, rehabilitation, and renovation of barangay health facilities, targets for established rural health units (RHUs) were not achieved. Delays in procurement affected the timely completion of health facilities under the HFEP while funding for some projects were for reversion due to unavailability of project sites.
In addition, the number of licensed government hospitals decreased with the non-renewal of licenses of the following health facilities in Cavite (Cavite Municipal

256 | Regional Development Plan 2017-2022
Table 19.14 Health Care Facilities, CALABARZON, 2017-2019
INDICATORANNUAL PLAN TARGETS ACCOMPLISHMENT
2017 2018 2019 2017 2018 2019
Access to health services improved
Number of established Barangay Health Stations (BHS), Rural Health Units (RHUs), or Urban health Centers (UHC) to total number of barangays increased (% cumulative)*
NA NA NA 66.92% 64.11% 0%***
Established Rural Health Unit/Urban Health Center increased
29 11 18 21 10 0***
Note: tbd - to be determined; NA - not applicable; * Number of established BHS to 4,018 barangays in CALABARZON; **Construction is based on request of LGU; ***Ongoing construction
Source: DOH Region IV-A
Table 19.15 No. of Licensed Government and Private Hospitals, Authorized Bed Capacity, 2017-2018
PROVINCES
2017 2018
GOVERNMENT PRIVATE GOVERNMENT PRIVATE
NO. BED CAP NO. BED
CAP NO. BED CAP NO. BED
CAP
Cavite 5 538 43 2,259 5 538 43 2,559
Laguna 14 762 40 2,481 14 762 40 2,627
Batangas 14 954 42 2,326 14 954 42 2,432
Rizal 9 488 22 1,091 9 488 23 1,201
Quezon 13 570 15 945 13 570 15 945
Total 55 3,312 162 9,102 55 3,312 163 9,764Source: DOH Region IV-A
Table 19.12 Status of Projects under the School Building Program, 2014-2019INDICATOR 2014 2015 2016 2017 2018 2019
No. of Projects 594 363 413 1088 501 92
Completed 593 362 401 1043 386 1
Ongoing 0 0 4 42 115 85
NYS /Procurement 0 0 0 0 0 6
Reverted 1 1 8 3 0 0
Accomplishment (%) 99.82% 99.34% 98.02% 98.69% 92.18% 28.41%Source: DepEd Region IV-A
Table 19.13 Operational Barangay Health Stations, 2016-2018 INDICATOR 2016 2017 2017
Cavite 353 353 341
Laguna 196 214 215
Batangas 495 571 579
Rizal 205 238 227
Quezon 364 511 438
Total 2,340 2,689 2,576Source: DOH Region IV-A

Chapter 19 Accelerating Infrastructure Development | 257
Hospital, Dra. Olivia Salamanca Memorial District Hospital, and General Trias Medicare Hospital) and Quezon (Polilio Medicare Hospital) in 2017. These four hospitals were reclassified or downgraded to infirmaries due to non-compliance to Level 1 hospital requirements particularly on manpower, required services, and operating schedules. In 2019, two government hospitals became operational in Cavite (Ospital ng Imus) and Rizal (Antipolo City Hospital System IV-Mambugan) while for private hospitals, one hospital in Laguna (Citymedic Emergency Hospital Corporation) and Rizal (Soriano-Leyble Medical and Maternity Hospital) became operational, contributing an additional 272 beds.
Unmet target for hospital bed to population ratio. Despite the increase in total bed capacity as shown above, the target for bed to population ratio of 1:1000 was not achieved since most hospitals in the Region are primary-level or Level 1 with a capacity of only 25 to 75 beds.
Social welfare
Social welfare/protection facilities extend residential care to individuals with needs that cannot be provided by their own families. As of 2019, there were five social welfare/protection facilities operated by DSWD in the Region.
Another poverty alleviation program designed to deliver need-responsive social services is the Kapit-Bisig Laban sa Kahirapan-Comprehensive and Integrated Delivery of Social Services (KALAHI-CIDSS). A total of 2,165 sub-projects which include farm-to-market roads and bridges, school building, health centers, post-harvest facilities and water supply systems were identified by the beneficiary communities. Similar to the Bottom-Up Budgeting, the program use participatory planning process in the selection and implementation of projects.
Housing
Demand for living spaces continues to increase with population growth and influx of in-migrants to the Region. Residential displacement caused by natural calamities
Table 19.16 Social Welfare/Protection Facilities, CALABARZON, 2019NAME OF FACILITIES/LOCATION DESCRIPTION
Bahay Tuluyan ng mga Bata (Home for Girls Bagong Bayan, Dasmariñas, Cavite)
A residential institution established to provide care, protection and rehabilitation to girls ages 5 to 17 years old who are victims of sexual abuse (rape, incest, acts of lasciviousness, sexual exploitation, abandonment, negligence and physical abuse and maltreatment)
Regional Haven for Women and Girls Agriculture Compound, Rosario, Batangas
An alternative form of family care providing 24 hour group living on temporary basis to disadvantaged abused women and their qualified dependent whose needs cannot be adequately met by their own families and relative over a period of time. It was established in 1997 with the partnership with the Congressional Spouses Foundation Inc. (CSFI)
National Training School for Boys Barangay Sampaloc, Tanay, Rizal
Provides protection and parental care to CICL. It enables the CICLs who cannot undergo rehabilitation in the community to benefit from an intensive treatment of their deviant behavior and anti-social attitudes in a residential setting and prepare them for a successful adjustment with their family and community after discharge.
Haven for the Elderly Barangay Sampaloc, Tanay, Rizal
A residential facility established on September 30, 1969 that provides care to male and female senior citizens ages 60 years old and above who are abandoned, neglected and in need. It has a bed capacity of 300.
Field Office Resource Operations Center Barangay San Jose, GMA, Cavite
This serves as the resource operation center of DSWD - CALABARZON during disaster and has 30,000 family food packs as stockpile at any given time.
Source: DSWD Region IV-A

258 | Regional Development Plan 2017-2022
such as typhoons and volcano eruptions also contributed to the demand for resettlement areas. The challenge is to provide decent, affordable and disaster-resilient housing units for the affected families.
More than half of the households in the Region own their houses while the remaining households are faced with the threat of insecure tenure. A large majority of the occupied housing units in the Region are constructed with strong materials as depicted in Table 19.17.
The government through the National Housing Authority (NHA) provides resettlement programs to informal settler families living along danger areas and those affected by the implementation of government infrastructure projects such as roads and bridges. NHA undertakes housing development through direct delivery and involvement of beneficiaries, joint venture, and provision of technical assistance to its partners.
Table 19.17 Total Occupied Housing Units by Construction Materials of the Outer Walls and Roof, CALABARZON, 2019
CONSTRUCTION MATERIALS OF THE
OUTER WALL
TOTAL OCCUPIED HOUSING
UNITS
CONSTRUCTION MATERIALS OF THE ROOF
GALVANIZED IRON/
ALUMINUM
TILE/CONCRETE/CLAY TILE
HALF GALVANIZED IRON/HALF CONCRETE
BAMBOO/COGON/
NIPA/ANAHAW
ASBESTOS
MAKESHIFT/SALVAGED/
IMPROVISED MATERIALS
TRAPAL OTHERS NOT REPORTED
Concrete/Brick/ Stone 2,327,606 2,205,915 82,266 29,231 2,914 5,235 343 134 1,089 479
Wood 327,965 256,199 4,712 21,455 39,298 716 2,926 1,974 569 116
Half Concrete/Brick/ Stone and Half Wood
414,963 280,054 6,355 120,235 6,941 120 966 129 147 16
Galvanized Iron/ Aluminum
24,700 20,806 395 1,681 1,686 13 66 38 12 3
Bamboo/Sawali/ Cogon/Nipa
168,084 83,112 - 3,631 78,344 - 1,118 1,456 250 173
Asbestos 1,463 1,144 36 29 - 254 - - - -
Glass 452 218 81 146 - 5 - - 2 -
Maksehift/Salvaged/ Improvised Materials
18,109 8,288 - 498 1,413 - 7,360 523 27 -
Trapal 3,689 1,602 - - 398 - 241 1,434 14 -
Others 1,325 931 9 13 138 3 8 32 191 -
No Walls 881 557 24 98 168 - 16 11 7 -
Not Reported 7,873 5,702 41 317 126 14 - - - 1,673
Total 3,297,110 2,864,528 93,919 177,334 131,426 6,360 13,044 5,731 2,308 2,460
Source: 2019 CALABARZON RSET
Table 19.18 Housing Units, CALABARZON, 2016-2018
PROGRAMACCOMPLISHMENT
2016 2017 2018
Housing Program for ISFs Living Along Danger Areas in Metro Manila 3,341 832 1,917
Resettlement Program 361 125 -
AFP/PNP Housing Program 400 1,123 -
Total 4,102 2,080 1,917Source: NHA 2016-2018 Annual Report

Chapter 19 Accelerating Infrastructure Development | 259
Figure 19.4 Tenure Status of the Housing Unit and Lot, CALABARZON, 2015
Source: NHA 2016-2018 Annual Report
Table 19.19 Type of Evacuation Centers by Province, 2018
PROVINCES BRGY. HALL SCHOOL/ DAY CARE
MULTI-PURPOSE
HALL
CHURCH/ CHAPEL
GYM/ COVERED
COURTOTHERS
Cavite 733 438 226 190 511 13
Laguna 130 195 40 108 83 29
Batangas 142 600 25 40 113 61
Rizal 83 178 11 14 113 37
Quezon 414 363 157 90 49 56
Total 1,602 1,774 459 442 869 169Source: OCD IV-A/CALABARZON PDRRMOs
Evacuation centers
Evacuation centers are usually schools, public gymnasiums and multi-purpose buildings. As these facilities are not designed to serve as temporary accommodations, they do not have the appropriate washrooms or kitchens. Likewise, they do not provide privacy for the evacuees. Apart from the discomfort that the evacuees suffer, the use of classrooms as evacuation areas also hamper the conduct education. , The recent disaster has shown that existing evacuation centers cannot accommodate the volume of affected families and are not ready to provide the basic needs of the evacuees.
Prison and jail facilities
Prisons are overcrowded as the number of inmates continues to rise. The Region is identified as one with most the congested jails in the country as of January 2020. The ideal capacity of 1 Persons Deprived of Liberty (PDL) for every 4.70 square meter prison cell space is not meet. The overcrowding of these facilities continues due to the intensified campaign against illegal drugs and the plea-bargaining system, which expedites court proceedings and put more offenders in prisons. Expansion and improvement of existing facilities and free legal advice will be considered to address the overcrowding problem and prevent the spread of communicable diseases.

260 | Regional Development Plan 2017-2022
Table 19.20 BJMP Jail Facility Congestion Rate DistributionRegion NO. OF JAILS CONGESTION RATE (%)
NCR 44 93.18
I 20 75
II 20 60
III 38 92.11
CALABARZON 58 100
MIMAROPA 19 68.42
V 36 75
VI 37 83.78
VII 40 97.5
VIII 38 50
IX 20 85
X 26 57.69
XI 13 84.62
XII 15 93.33
CARAGA 12 83.33
CAR 20 55
BARMM 11 54.55
Total 467 80.09Source: OCD IV-A/CALABARZON PDRRMOs
Emerging Gaps and New ChallengesDespite government efforts to meet the need for social infrastructure in CALABARZON, new challenges will be encountered in attaining the targets by 2022.
Challenges that may increase the demand for social infrastructures are the natural hazards such as the “Big One”, and the rise of highly communicable diseases. The national and local government units are faced with the challenges of providing sufficient housing and health care for individuals affected by the Taal Volcano
Eruption and those affected and at risk to COVID-19 Pandemic.
The demand for social infrastructures is expected to increase with the Region’s growing population, possible calamities and emergence of new diseases in the future. However, the limitations in the availability of buildable space, limited budget and the ability of the government to build and efficiently operate these social facilities are critical factors that need to be addressed.
Action PlanStrategic FrameworkThe Region shall adopt the strategic framework of the PDP 2017-2022 on Infrastructure development with the following subsector outcomes: a) increase spending on public infrastructure; b) implement strategic infrastructure for the
various infrastructure subsectors; c) ensure asset preservation; and d) intensify R&D on technologies that are cost-effective over the whole project life cycle (Figure 19.5).

Chapter 19 Accelerating Infrastructure Development | 261
Figure 19.5 Strategic Framework to Accelerate Infrastructure Development
Table 19.21 Plan Targets to Accelerate Infrastructure Development, 2017-2022
INDICATORSBASELINE
2019 END OF PLAN TARGET RESPONSIBLE AGENCY
VALUE 2020 2021 2022
Public infrastructure spending increased (% share to GDP)
Increasing Increasing Increasing Increasing PSA
Land Transport
Length of national roads increased (km) 2,542.15 2,542.20 2,542.25 2,542.30 DPWH
Length of existing paved national roads increased (km)
2,487.23 2,509.14 2,510.00 2,511.50
Length of permanent bridges along national roads increased (lm)
19,294 19,294.00 19,294.00 19,294.00
Number of permanent bridges along national roads increased (cumulative)
664 666 667 669
Percentage of national roads in good condition increased (%)
65.75 70.50 75.25 80.50
Kilometers of national roads along priority corridors widened with complete features to at least 4 lanes (cumulative)
170.403 211.95 265.753 265.753
Number of bypass/diversion road and grade separation projects completed along priority corridors with complete features to at least 4 lanes (cumulative)
31 38 48 48
Kilometers of new roads constructed to close gaps in the national road network (cumulative)
44.69 53.88 56.38 56.53
Number of bridges retrofitted 145 150 155 160
Number of bridges widened 316 384 528 654
Travel time (decreased)/Speed increased via land per key corridor
- - - -
Road traffic accident rate reduced (based on PNP Accident Data)
2 2 2 2 DOTr, DPWH,
LGUs, DOH, PNP
Targets

262 | Regional Development Plan 2017-2022
INDICATORSBASELINE
2019 END OF PLAN TARGET RESPONSIBLE AGENCY
VALUE 2020 2021 2022
Rail Transport
Length of standard gauge increased (km) 2.2 4.2 137.2 214.2 DOTr, PNR
Number of railway bridges repaired/reconstructed
71 72 72 72 PNR
Total length of standard rail gauge rail tracks increased (km, cumulative)
46.6 93 137.4 214.4 DOTr, PNR
Number of passenger service routes traversing the Region
3 4 5 7 PNR
Number of freight service routes traversing the Region
1 2 2 2
Passenger trips via rail (in Metro Manila ) increased (in % share of total passenger trips via rail, cumulative)/Passenger service routes
- - - -
Air Transport
Number of airport rehabilitated (2018)1 (Sangley)
DOTr-CAAP
Water Transport
Cargo Throughput (MT) 29,671,218 30,787,818 31,913,616 33,048,797 PPA Batangas and MarQuez
Non-containerized 194,992 202,792 212,932 225,708
Containerized cargoes in TEUs 8,779,354 9,124,245 9,472,112 9,823,015
Passengers transported by sea increased (in number of passengers, cumulative)
8,779,354 9,124,245 9,472,112 9,823,015
No. of vessels increased 52,593 54,404 56,220 58,041
Cargo shipped increased (international and domestic), (MT, cumulative)
- - - -
Water Supply
Percentage of HHs with access to safe water supply increased (%)
95 95 95 95 LGUs
Percentage of HHs with access to basic sanitation increased (%)
95 95 95 95
Proportion of households with access to basic sanitation to total number of households increased (% cumulative)
95 95 95 95
Households served with level three water supply system increased/
- - - -
Proportion of cities/municipalities served by water districts with 24/7 water supply increased (%, cumulative)
Irrigation Projects/Systems Construction/Restoration/ Rehabilitation
New Area (ha.) 1,835 71 1,037 776 NIA
Restore Area (ha.) 240 153 425 922
Length of canal lining (km) 96.82 50.77 - -
Number of structures 313 56 - -
Ratio of actual irrigated area to the total potential irrigable area increased (% cumulative)
75.31 78.54 78.97 82.37
Cropping intensity increased (% cumulative) 156 156 157 160
Information & Communication Technology
Proportion of public schools with internet access to total number of public schools increased (% cumulative)

Chapter 19 Accelerating Infrastructure Development | 263
INDICATORSBASELINE
2019 END OF PLAN TARGET RESPONSIBLE AGENCY
VALUE 2020 2021 2022
a. Primary (K to 6) 62.67 74.85 87.43 100 DepEd
b. Junior High School 88.95 92.64 96.33 100
c. Senior High School 38.945 42.63 46.32 50
Proportion of public schools with computer packages to total number of public schools increased (% cumulative)
a. Primary (K to 6) 96.05 97.37 96.69 100 DepEd
b. Junior High School 84.71 89.81 94.91 100
Average broadband download speed increased (Mbps)
- - - -
Power and Energy
Proportion of households with electricity to total number of households increased (% cumulative)
Increasing Increasing Increasing 100% DOE
Proportion of sitios with electric connections against potential sitios increased (%)
96.74 97.85 98.93 100 NEA
Proportion of households with electric connections against potential households increased (%)
98.49 99.01 99.51 100 NEA
Social Infrastructure
Classroom to pupil ratio improved
Kindergarten 1:25 1:25 1:25 1:25 DepEd, DPWH
Primary (Grade 1-3) 1:35 1:35 1:35 1:30
Primary (Grade 4-6) 1:45 1:45 1:45 1:40
Junior High School 1:45 1:45 1:45 1:40
Senior High School 1:40 1:40 1:40 1:40
Water and sanitation to pupil ratio improved
a. Primary (K to 6) DepEd
b. Junior High School
c. Senior High School
Proportion of public schools with adequate water and sanitation facilities to total number of public schools increased (% cumulative)
a. Primary (K to 6) 87.12 91.39 95.66 100 DepEd
b. Junior High School 83.31 88.87 94.44 100
c. Senior High School - - - -
Proportion of public schools with connection to electricity to total number of public schools increased (% cumulative)
a. Primary (K to 6) 97.72 98.48 99.24 100 DepEd
b. Junior High School 97.72 98.48 99.24 100
c. Senior High School 99.65 99.74 99.82 100
Access to health services improved
Number of established Barangay Health Stations (BHS), Rural Health Units (RHUs), or Urban health Centers (UHC) to total number of barangays increased (%, cumulative)
na na na na LGUs, DOH
Established Rural Health Unit/Urban Health Center increased
18 tbd tbd tbd
Hospital bed to population ratio improved 1:1,100 1:1,100 1:1,100 1:1,100
Waste Management
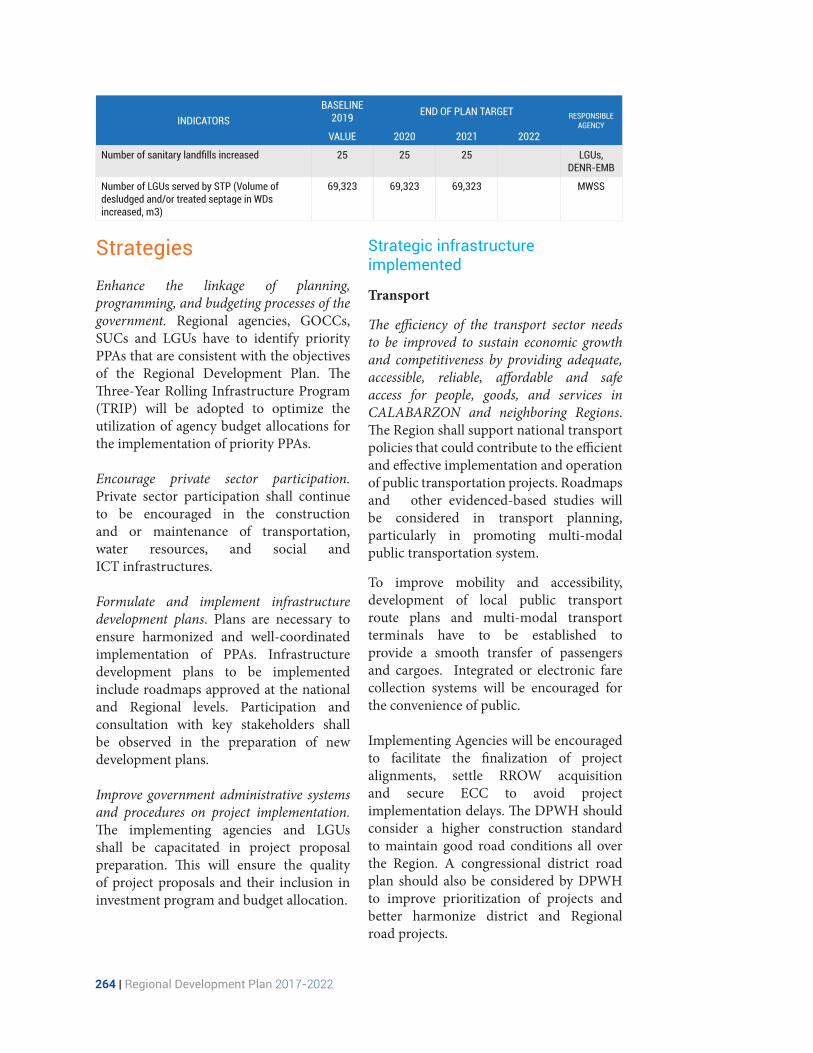
264 | Regional Development Plan 2017-2022
StrategiesEnhance the linkage of planning, programming, and budgeting processes of the government. Regional agencies, GOCCs, SUCs and LGUs have to identify priority PPAs that are consistent with the objectives of the Regional Development Plan. The Three-Year Rolling Infrastructure Program (TRIP) will be adopted to optimize the utilization of agency budget allocations for the implementation of priority PPAs.
Encourage private sector participation. Private sector participation shall continue to be encouraged in the construction and or maintenance of transportation, water resources, and social and ICT infrastructures.
Formulate and implement infrastructure development plans. Plans are necessary to ensure harmonized and well-coordinated implementation of PPAs. Infrastructure development plans to be implemented include roadmaps approved at the national and Regional levels. Participation and consultation with key stakeholders shall be observed in the preparation of new development plans.
Improve government administrative systems and procedures on project implementation. The implementing agencies and LGUs shall be capacitated in project proposal preparation. This will ensure the quality of project proposals and their inclusion in investment program and budget allocation.
Strategic infrastructure implemented
Transport
The efficiency of the transport sector needs to be improved to sustain economic growth and competitiveness by providing adequate, accessible, reliable, affordable and safe access for people, goods, and services in CALABARZON and neighboring Regions. The Region shall support national transport policies that could contribute to the efficient and effective implementation and operation of public transportation projects. Roadmaps and other evidenced-based studies will be considered in transport planning, particularly in promoting multi-modal public transportation system.
To improve mobility and accessibility, development of local public transport route plans and multi-modal transport terminals have to be established to provide a smooth transfer of passengers and cargoes. Integrated or electronic fare collection systems will be encouraged for the convenience of public.
Implementing Agencies will be encouraged to facilitate the finalization of project alignments, settle RROW acquisition and secure ECC to avoid project implementation delays. The DPWH should consider a higher construction standard to maintain good road conditions all over the Region. A congressional district road plan should also be considered by DPWH to improve prioritization of projects and better harmonize district and Regional road projects.
INDICATORSBASELINE
2019 END OF PLAN TARGET RESPONSIBLE AGENCY
VALUE 2020 2021 2022
Number of sanitary landfills increased 25 25 25 LGUs, DENR-EMB
Number of LGUs served by STP (Volume of desludged and/or treated septage in WDs increased, m3)
69,323 69,323 69,323 MWSS
Chapter 19 Accelerating Infrastructure Development | 265
Major programs and projects shall be closely monitored to ensure the quality and timely delivery of outputs at the Regional and local levels. The Regional Project Monitoring Committee shall strengthen the Local Project Monitoring Committees in monitoring and facilitating the implementation of programs and projects.
Convergence programs of agencies have to be promoted. The DOT-DPWH Convergence Program shall be continued in the improvement and construction of access roads leading to tourism destinations. The DTI-DPWH ROLL-IT Program have to be rolled out to facilitate the identification, prioritization and implementation of roads leading to various industries and economic zones. Agricultural areas have to be supported with farm-to-market roads. Additionally, communities in far-flung areas shall be provided with access roads and bridges, including access roads leading to the Last Mile Schools.
Policy coordination mechanisms among agencies, LGUs, and private sector have to put in place to resolve transport issues in road widening, right-of-way acquisition, lot acquisition, removal of road obstructions (utility poles/water lines) and traffic management, among others.
Design of transport facilities have to ensure gender responsiveness and meet the different requirements of the elderly, children and persons with disabilities.
Policies and guidelines on mass transportation during times of pandemic or public health emergencies have to be in place to ensure the safe movement of people as well as the continued flow of goods and services. The construction of farm to market roads and other road projects will be able to contribute to food security. With the project delays caused by COVID-19, implementing agencies have to prepare a catch-up-plans to complete projects on time
or minimize delay.
The road programs and projects for the rehabilitation and recovery for the Taal Volcano Eruption will be prioritized. New road networks will be able to accommodate the high volume of evacuees if immediate evacuation is needed. The Comprehensive Land Use Plans have to be updated to mainstream DRR concerns to local plans to identify road networks that need to be developed. Infrastructure audits will be conducted to determine road integrity after disasters and calamities.
Traffic management measures shall be implemented together with the improvement/construction of transport infrastructures to the highest quality standards. The CALABARZON RDC have to continue implementing the CALABARZON Traffic Management Plan to guide the concerned agencies and LGUs in addressing traffic congestion. The Traffic Management Plan will guide all key agencies and LGUs in planning, investment programming, budgeting, and implementing PPAs in traffic management. Intelligent transport systems, such as signalized road intersections, detection systems, and variable messaging system have to be installed in the appropriate road sections. A study may be pursued on the non-approval of franchise for tricycle and jeepney with no proper parking areas. The LTFRB should assist the LGUs in preparation of local public transport route to harmonize transport routes in the Region.
Transport infrastructures have to be improved to meet the highest quality standards and to enhance mobility. Anti-overloading policies shall be implemented through the operation of weighing bridges to avoid deterioration of roads. The Motor Vehicle Inspection System has to be implemented to comply with the international standards on vehicle safety and environmental impact. The

266 | Regional Development Plan 2017-2022
construction of expressways, bypasses, diversion roads, flyovers, and underpasses as well as road widening shall be prioritized. Such as the STAR Tollway Northbound bridges that will help in decongesting the expressway and connecting roads leading to Batangas Port.
The implementation of mass transport system shall be promoted. The modernization of the commuter line and long railway system and the extension of Metro Manila’s light rail transit in the Region shall be prioritized. Support of the LGUs shall be encouraged particularly in the clearing of right-of-way.
Continuous improvement and development of port facilities. Port facilities should be continuously developed and improved in the Region to ensure that RoRo shipping transport remains a viable mode for transporting people and goods particularly in the island municipalities of Quezon and Batangas. Furthermore, possible alternate ports should be further studied. For instance, the Calatagan Port is being considered as an alternate port to decongest the Port of Batangas. In preparation, the site development plan of the port shall be put in place and the port delineation shall be extended to connect to the proposed road going to the Calatagan Port. Improvements of port facilities will encourage locators and assist in optimized port utilization. This will create economic opportunity for the Region and aid in decongesting the container terminals in Metro Manila.
PPA to conduct intensive marketing campaign to maximize the use of Batangas Port. Moreover, modernization of its facilities and services such as establishment of online booking features will contribute to improved services of the ports.
Ensure that safety measures are in place. Infrastructures have to follow the protocols and guidelines on the safe transportation of goods under the “New Normal Situation”
brought by the COVID-19 Pandemic to address the safety of passengers.
Water Resources
Match available water to water usage. There is a need to match available water to water usage (i.e. potable and non-potable) and explore alternative sources of water to reduce pressure on the use of groundwater. Among the possible sources of non-potable water are surface water, rainwater from roofs, storm water and reclaimed wastewater while desalination may be considered to produce potable water.
Manaage Water Resources in a Changing Climate. Climate change poses negative impacts on water resources. The changing temperature, evaporation, and precipitation brought by climate change increase the frequency of floods and droughts, and reduce river flows. There is a need to mitigate these negative impacts of climate change to build a resilient community.
The DOST, through the Philippine Atmospheric, Geophysical and Astronomical Services Administration, observed El Niño in several provinces of Luzon and Mindanao from September 2018 to mid-January 2019. El Niño, triggered by periodic warming in the eastern Pacific Ocean, could last from 5 months to 2 years. This climate phenomenon generally results in reduced rainfall, and erratic tropical cyclones. The country is expected to experience severe El Niño in 2022 and weak El Niño in 2025. Thus, a Regional El Niño Task Force may be created to oversee communities that will be affected by droughts and water shortages.
There is a need to mitigate the negative impacts of flooding in the Region. Existing flood control initiatives should be continued. The CALABARZON RDC created the Flood Control-Technical Working Group to prepare the terms of reference for the

Chapter 19 Accelerating Infrastructure Development | 267
conduct of the CALABARZON Flood Risk Assessment Study. The Study will consider a holistic and high level of economic, social and environmental impacts which could result from flooding. The final output of the Study will be a list of priority river basins in CALABARZON for master planning. The masterplan will serve as a basis in formulating policies and implementing projects to mitigate flooding in the Region.
Full implementation of existing water policies and programs. Republic Act No. 9275 or the Philippine Clean Water Act of 2004 mandated the DPWH to prepare a National Sewerage and Septage Management Program (NSSMP). The DPWH in coordination with local government units shall formulate a framework plan to address various issues on sanitation, and treatment and disposal of wastewater. The NSSMP provides 50 percent subsidy for the total project cost of sewerage and septage projects. The target beneficiaries of Program include all cities and first class municipalities. However, disinterest and lack of technical and financial capability of local government units to implement sanitation projects remain an issue on the implementation of the Program.
Likewise, Republic Act No. 6716 or the Rainwater Collector and Springs Development Act of 1989 may be reinforced to help alleviate water scarcity and drought down to barangay level.
Irrigation
Expedite implementation of Major Irrigation Projects. The implementation of major irrigation projects such as the Quipot Irrigation and Macalelon Small Reservoir Irrigation should be fast tracked to ensure adequate irrigation water supply and sustain agricultural development in the Region. The Quipot Irrigation Project is expected to irrigate over 2,800 hectares of paddy fields during wet and dry season.
The Project is estimated to benefit a total of 1,327 and 828 farmers in Quezon and Batangas, respectively. On the other hand, the Macalelon Small Water Reservoir will provide reliable and timely irrigation water supply to 830 hectares in 10 barangays of Macalelon and Lopez in Quezon. The Reservoir is estimated to benefit 700 farmers. The Quipot Irrigation and Macalelon Small Reservoir Irrigation projects will be respectively completed in 2021 and 2022.
Power and energy
Promotion of clean energy and energy conservation. With the increasing population and demand for electricity, it is necessary for the Region to harness its renewable energy potential. Thus, the development and promotion of renewable energy, thru the Renewable Energy Act of 2008, as source of clean energy in the Region will be pursued.
Furthermore, with the implementation of the Enhanced Community Quarantine in Luzon due to the Pandemic COVID-19, there is a need to identify mechanisms to stabilize electricity prices given the shutdown/slowdown of operations from large companies and industries. Possible electricity subsidies may be given to the industries and individual households to cushion the impact of income losses.
The Energy Efficiency and Conservation Law was enacted to standardize energy efficiency and conservation measures. The law will regulate use of energy efficient technologies in buildings and will require the Energy Conserving Design and mandate the crafting of Local Energy Efficiency and Conservation Plan before issuance of building permits.
Intensify household and sitio electrification. Despite the increasing number of sitios and households electrified since 2016, there are
268 | Regional Development Plan 2017-2022
still households in rural areas which were not reached. The LGU’s utilization of ER 1-94 Fund will be facilitated to complement the other electrification programs of government.
Promote investments in power and energy facilities. The continuous implementation of the SMARTER Philippines Program of DOST aims to leverage smart technologies and innovation, and promote development of the country in the sectors of governance, jobs, industries, micro-small and medium enterprises, farming, healthcare, scientists and engineers, and climate change adaptations. The projects under this Program are Project Nationwide Operational Assessment of Hazards (NOAH) disaster warning system and its biggest component, the Disaster Risk Exposure and Assessment for Mitigation-Light Detection and Ranging (Dream-Lidar) flood forecasting system; the Integrated Government Philippine (iGovPhil) project, which was rolled out in June 2019 or 2020 and seeks to integrate and interconnect the government’s ICT systems, Smarter Farms, and Smarter Healthcare.
ICT infrastructure
Ensure reliable internet sources are in place. With the implementation of the Enhanced Community Quarantine as a strategy to mitigate the spread of the Pandemic COVID-19, Work from Home arrangements are being pursued. Hence, there is a need to ensure reliable and secure internet services are in place. This requires a concerted effort among telecommunication companies and internet providers in the country. With the emerging new-normal situation after the pandemic, the use of ICT will be maximized. This includes the possible increase in demand for online platforms on the delivery of goods and services, and possible shift to open and distance learning systems.
Enhance Regional Connectivity. With the proposal to establish the DICT’s GovNet in the Region, linkages among government offices and faster delivery of services is expected. An integrated portal among government offices in the Region will ease access to information and services available among the Region’s stakeholders, and foster efficient coordination among the government offices.
Strengthen risk communication system. National and Regional risk communication systems must be in place to ensure efficient coordination among the concerned government offices, media partners, NGOs, CSOs, and other interested groups. The risk communication system, as a crucial aspect of disaster management, will foster knowledge sharing (i.e. hazard maps, situational reports, economic implications) and facilitation of policy interventions and decisions.
Provide adequate communications infrastructure. In line with the mitigation strategies towards the presence of disaster and crises such as the Taal Eruption and the COVID-19 Pandemic, there is a need to establish adequate physical and communications infrastructure to channel information to the public. This will ensure that proper and correct warning alerts and situational updates are communicated and transmitted on time. This can also be used for public health messaging. Furthermore, feedback mechanisms can also be integrated in the system to provide the public a platform to relay their needs and concerns and for them to reach the appropriate authorities and/or offices.
Improve local ICT capacities to support knowledge-intensive industries. With the creation of the DICT), the continued rolling-out of ICT infrastructures is expected to continually increase coverage and reach rural areas and communities. A competitive ICT market will also be promoted at the

Chapter 19 Accelerating Infrastructure Development | 269
local level to improve service quality and reduce operating costs.
Moreover, continuous implementation of DOST’s Small Enterprise Technology Upgrading Program or SETUP will encourage and assist MSMEs to adopt technological innovations in improving their operations and boost their productivity and competitiveness. SETUP provides fund for technology acquisition, equipment, technical assistance and consultancy services, packaging and label design, database information systems, and support for establishment of product standards i.e. testing, and calibration of equipment.
Social Infrastructure
Convergence in implementing infrastructure programs shall be strengthened. Primary social agencies such as the DepEd, DOH, DPWH, and DILG together with other stakeholders should seamlessly work together to allow the ease of access to complementary facilities such as water and sanitation, health, electricity and internet connection. The government must be able to strategically construct quality social infrastructure facilities not only through the collaboration of the national government and local government units but also with the participation and partnerships of the private sector. Data analytics should be utilized to ensure that social infrastructure projects are planned, implemented and operated efficiently and effectively.
Social infrastructure in remote and rural areas shall be prioritized. The government to prioritize social infrastructure investments in remote and rural areas, more specifically in geographically isolated and conflict-affected areas in the Region, to lessen the vulnerabilities of the poor households in the rural areas.
Social infrastructure deficit shall continue to be addressed. Capacity of classrooms will be improved with the return of regular classes to comply with the social distancing and other health guidelines in public places. Strengthening ICT infrastructures in communities will be instrumental in the smooth transition from traditional education system to blended or alternative methods such as online and digital learning. With the anticipated increase in the number of school buildings and hospitals in the Region, LGUs are also encouraged to update their existing development plans and land use policies to be attuned with the New Normal Situation in developing settlements and avoid delays in the construction of these social infrastructures due to limited buildable space. LGUs should also be enjoined in the identification and donation of available public spaces for government social projects.
Housing programs are necessary for the “BalikProbinsya” Program to succeed. Available and affordable housing will encourage urban dwellers to consider moving to rural areas. Housing units will be provided with sufficient utilities such as water and electricity, to promote proper sanitation within households. Families will also be encouraged to venture to backyard gardening for another source of livelihood. Updating of land use plans shall also consider the inclusion of logistic facilities and food terminals to ensure food security in times of need.
Funding for the construction and operation of social infrastructures by the national and local government units will continually increase in the medium-term to attain the Plan development outcomes and addressed the current emerging issues.
Expand existing plans and programs on the implementation of health facilities in the Philippine Health Safety Development Plan.Under the Philippine Health Facilities

270 | Regional Development Plan 2017-2022
Development Plan (PHFDP) 2017 to 2022, the delivery of affordable, accessible and quality health care facilities will be continuously provided to the public. Upgrading of government hospitals and health facilities will also be prioritized. The Universal Health Care (UHC) Law or Republic Act No. 1123 shall be strengthened to reduce of out-of-pocket expenditure for health and serve as an additional source of fund in support to the operations and maintenance of completed HFEP projects in the community. At the local level, the Local Government Code shall guide the LGUs in the allocation and management of emergency funds to safeguard the community during public or health emergencies.
In view of the country’s experience with the COVID-19 Pandemic, there is a need for additional government hospitals and operational community health stations in the Region. Policies and investments programs should also be aligned with the expected increase in number of public infrastructures, including the improvement of equipment and manpower deployment in the health facilities.
Construction of Disaster-Resilient Infrastructure. Construction of social infrastructure should always operate within the context of “build-back-better”, assisted with the conduct of an effective infrastructure audit. Designs for proposed multipurpose buildings shall adhere to the standards set by IATF and the DOH, to include adequate basic utilities for and allow for conversion to quarantine facilities during health emergencies. This will minimize use of other community infrastructure as isolation centers such as schools and evacuation areas, which also serves other important functions.
Asset preservation ensured
Greater emphasis shall be given on the sustainability, safety and resilience of infrastructure facilities in the Region. Existing infrastructure assets need to be preserved to ensure efficient delivery of services to the people.
Climate change adaptation and disaster resilience of infrastructure facilities have to be observed. The government shall ensure that public infrastructures can withstand the effects of disaster and climate change. Logistics network of critical infrastructures such as roads, bridges, ports and communication shall be ensured in times of calamity and disasters.
Security of infrastructure facilities shall be ensured. Security of critical infrastructures from threats, such as, terrorist attacks must be ensured. Coordinated efforts among agencies and private sector are encouraged to enhance the safety and security of infrastructure facilities. The use of state-of-the art technologies will be explored and used for security purposes.
Intensify infrastructure-related R&D
The government and the private sector shall pursue programs on R&D to improve the development of infrastructure facilities. The R&D initiatives shall include, among others, renewable energy, waste water treatment, solid waste management, modern transportation systems, disaster-resilient infrastructures, and ICT applications under the New Normal Situation.

Chapter 19 Accelerating Infrastructure Development | 271
Major Programs and ProjectsTransport:• Road and Bridge Widening Projects• Bypass, Diversion and Tunnel
Road Projects• Road improvement projects• STAR Tollway-Pinamucan Bypass
Road Project• STAR Northbound Bridges• Sto. Tomas Flyover• Taal Lake Circumferential Road• East-West Road• Atimonan-Mauban Road• General Nakar-Dingalan Road• Bataan-Cavite Interlink Bridge• Mindoro-Batangas Super Bridge• East-West Bank Bridge• DOT-DPWH Convergence Program• DTI-DPWH ROLL-IT Program• Traffic Management Projects• Motor Vehicle Inspection Centers• Cavite-Laguna Expressway Project• SLEX Toll Road 4 Project• Quezon-Bicol Expressway• Laguna Lakeshore Road Network• Calamba-Los Baños-Bay
Expressway Project• C6 Expressway Project• LRT 1 Cavite Extension Project• LRT Line 2 East Extension• LRT 6 Project• East-West Rail Project• North South Commuter Railway Project• PNR South Long Haul Project• Drainage and Flood Control Projects• Farm-to-Market Road Projects• Local/Barangay Roads Projects• Improvement and Development of
Port Facilities• Strict implementation of Quality
Management System (QMS) and Port Safety, Health and Environmental Management System (PSHEMS)
• Calatagan Port Development• New RoRo Routes
* Cavite to Mariveles, Bataan* Calatagan-Lubang-Coron* San Andres, Quezon to Masbate, Bicol
and Cebu* San Juan, Batangas to Pola, Oriental
Mindoro and Marinduque
Irrigation:• Irrigation Dams• Rehabilitation and Restoration of
Irrigation Systems• Development of Small Scale and
Community-based Reservoir Irrigation Projects
Water Supply:• New Centennial Water Source Project• Bulk Water Supply Projects• Establishment of Regional body for
Water Supply Subsector• Rainwater Harvesting and Water
Impounding Projects• Development of Water Management Plan• SALINTUBIG• Water supply Projects
Power and Energy:• CW Home Depot Solar Power Project,
Sta. Rosa City, Laguna• Asia Gas Biogas Power Plant
Project, Batangas• Sitio Electrification Program• R&D for Pollution Control in Coal-Fired
Power PlantsSocial Infrastructure:• School Building Program• Last Mile Schools• Health Facilities Enhancement Program
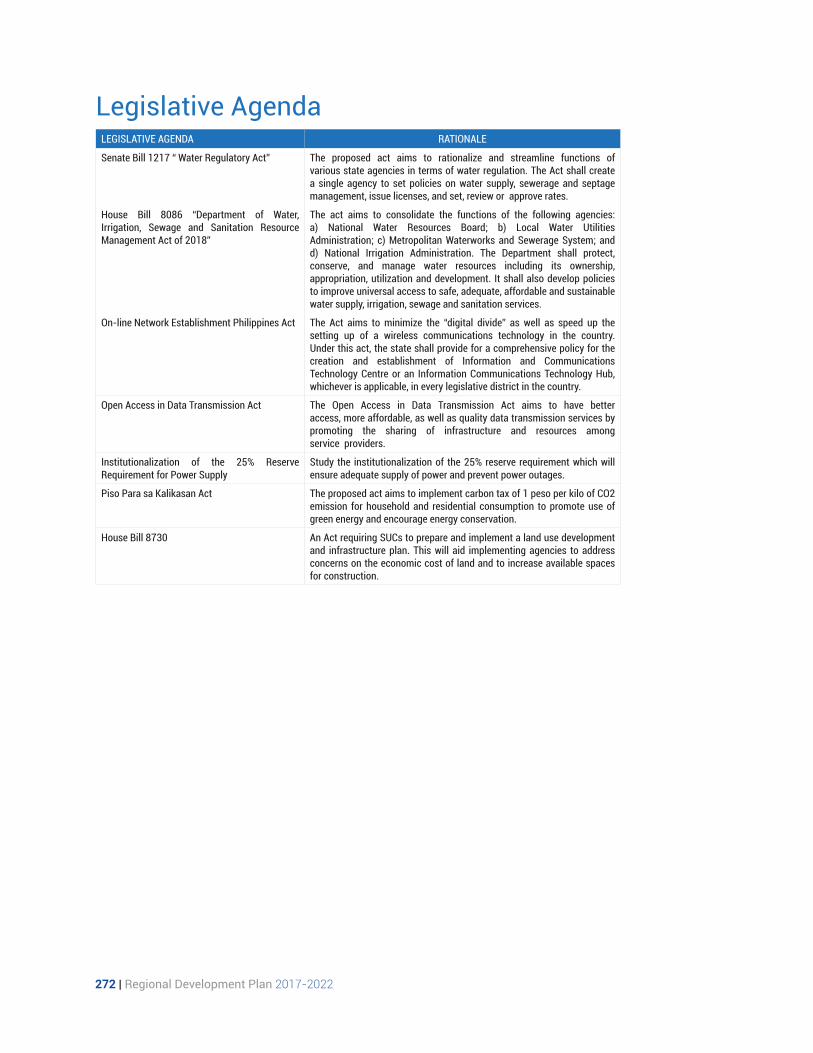
272 | Regional Development Plan 2017-2022
Legislative AgendaLEGISLATIVE AGENDA RATIONALE
Senate Bill 1217 “ Water Regulatory Act” The proposed act aims to rationalize and streamline functions of various state agencies in terms of water regulation. The Act shall create a single agency to set policies on water supply, sewerage and septage management, issue licenses, and set, review or approve rates.
House Bill 8086 “Department of Water, Irrigation, Sewage and Sanitation Resource Management Act of 2018”
The act aims to consolidate the functions of the following agencies: a) National Water Resources Board; b) Local Water Utilities Administration; c) Metropolitan Waterworks and Sewerage System; and d) National Irrigation Administration. The Department shall protect, conserve, and manage water resources including its ownership, appropriation, utilization and development. It shall also develop policies to improve universal access to safe, adequate, affordable and sustainable water supply, irrigation, sewage and sanitation services.
On-line Network Establishment Philippines Act The Act aims to minimize the “digital divide” as well as speed up the setting up of a wireless communications technology in the country. Under this act, the state shall provide for a comprehensive policy for the creation and establishment of Information and Communications Technology Centre or an Information Communications Technology Hub, whichever is applicable, in every legislative district in the country.
Open Access in Data Transmission Act The Open Access in Data Transmission Act aims to have better access, more affordable, as well as quality data transmission services by promoting the sharing of infrastructure and resources among service providers.
Institutionalization of the 25% Reserve Requirement for Power Supply
Study the institutionalization of the 25% reserve requirement which will ensure adequate supply of power and prevent power outages.
Piso Para sa Kalikasan Act The proposed act aims to implement carbon tax of 1 peso per kilo of CO2 emission for household and residential consumption to promote use of green energy and encourage energy conservation.
House Bill 8730 An Act requiring SUCs to prepare and implement a land use development and infrastructure plan. This will aid implementing agencies to address concerns on the economic cost of land and to increase available spaces for construction.
Chapter 20 Ensuring Ecological Integrity, Clean and Healthy Environment | 273

274 | Regional Development Plan 2017-2022

Chapter 20 Ensuring Ecological Integrity, Clean and Healthy Environment | 275
Chapter 20
Ensuring Ecological Integrity, Clean and Healthy EnvironmentFundamental to achieving sustainable development is the capacity of the environment to support the productive sector, livelihood, cultural activities, and human settlements and sustain its functions to provide the necessary ecosystem services (e.g., flood protection and sediment regulation). Hence, it is critical that conservation and protection measures are in place to ensure that human activities do not go beyond ecological limits. However, with the increasing population and intensified risks under a changing climate, the longstanding challenges on resource depletion and degradation are becoming more difficult to address especially in highly resource-dependent communities in the Region.
Maintaining ecological integrity and improving the current state of the environment are among the critical drivers to achieve higher economic growth in the Region. Hence, prioritizing investments to related activities will enable a paradigm shift towards a balanced and inclusive growth for future generations.
The management and overall performance of the environment and natural resources sector from 2017 to the first half of 2019 has improved. However, environmental quality has declined and disaster vulnerability and damage remain to be a challenge for the Region.
Assessment and Challenges
Sustained biodiversity and functioning of ecosystem servicesForest cover and watershed improved but the area of forestland under effective management decreased The Region’s 570,913 hectare forest cover in 2010 was expected to increase 5,601 hectares in 2017, 5,560 hectares in 2018, and 25 hectares in 2019 planted with forest trees through the implementation of Enhanced National Greening Program (ENGP).
The eruption of Taal Volcano on January 2020, however, severely and partially damaged around 1,739 hectares of established NGP plantations due to
ashfall in various municipalities and cities within the Taal Volcano Protected Landscape (TVPL).
In terms of area of mangroves planted, there was an increase in mangrove forest extent from 5,751 hectares in 2010 to 6,584.25 hectares in 2018 which exceeded the target of 5,872 hectares for the same period. The same trend was observed in the area of rehabilitated denuded and degraded forestland from 20,970 hectares in 2016 to 33,926 hectares in 2018. The increasing trend is attributed to the ENGP’s maintenance activities, seedling replacement, regular weeding, and watering. However, the area of forestland under effective management decreased from 36, 531 hectares in 2016 to 34,172 hectares in 2018 due to the expiration

276 | Regional Development Plan 2017-2022
of the 25-year Stewardship Contract of one tenurial instrument under Community Based Forest Management Agreement and eight other tenurial instruments. Table 20.1
shows the summary of forest cover changes and forestland management in the Region as of 2018.
Terrestrial and marine areas effectively and equitably managed. The terrestrial protected areas in the Region increased from 17 in 2017 to 19 in 2018 (Figure 20.1) due to identification of additional protected areas under National Integrated Protected Areas System (NIPAS) Act initial components. This further increased to 20 protected areas, 9 legislated protected areas and 11 protected areas under the initial components per NIPAS Act, by virtue of Republic Act No. 11038 or the Expanded NIPAS (ENIPAS). ENIPAS established 94 protected areas as national parks nationwide and effectively placed them under government management and protection. ENIPAS Law also expanded the composition of Protected Area Management Management Boards. It created a Protected Area Management Office aimed at strengthening the management of protected areas. The Natural Resource Conservation and Development Program of the DENR, which includes the conduct of patrolling, IEC, biodiversity monitoring system, management plan development, caves and wetlands management, and ecotourism development, also contributed to the increase of protected areas in the Region. Specific to biodiversity, the formulation of the Philippine Biodiversity Strategic Action Plan 2015-2028 will further improve management and
protection of critically endangered flora and fauna in key biodiverse areas of the Region.
The TVPL, in particular, needs an in-depth biodiversity assessment to identify the impacts of the January 2020 Taal Volcano eruption and for effective management interventions, which includes assessment of vegetation status and fish stocks, and presence of wildlife.
Classified caves managed by LGUs remained at 36 percent in 2018. The number was maintained through the collaboration with the concerned local government units on the development of a management plan. This, however, decreased from 43 percent in 2017 (Table 20.2) due to priotization of caves per DENR Memorandum Circular.
Quality of coastal and marine ecosystems maintained. Sustained quality of coastal and marine ecosystems in the Region was observed from 2016 to 2018 due to the conduct of coastal cleanup and patrolling. This resulted to better water quality that enabled the successful restocking of giant clams.
Quality of wetlands and caves maintained. Like the coastal and marine ecosystems, the quality of the wetland ecosystems in the
Table 20.1 Forest Cover Changes and Forestland Management in CALABARZON, 2018
INDICATORSBASELINE TARGET ACCOMPLISHMENT
YEAR 2017 2018 2017 2018
Forest Cover increased (ha) 570,913 (2010)
Increasing Increasing 5,601 (area planted)
5,560 (area planted)
Area of Mangroves Planted (ha) 5,751 (2010)
71 50 71 762.25
Area of denuded and degraded forestland rehabilitated (ha)
20,970 (2016)
3,583 4,843 5,601 7,355
Area of forestland under effective management (ha)
36,531 (2016)
36,531 36,531 37,901 34,172
Source: DENR IV-A

Chapter 20 Ensuring Ecological Integrity, Clean and Healthy Environment | 277
Table 20.2 Status of Terrestrial and Marine Area Management in CALABARZON, 2018
INDICATORSBASELINE TARGET ACCOMPLISHMENT
2016 2017 2018 2017 2018
Percentage of Terrestrial protected areas (PAs)
100%(19)
100% 100% 89%(17)
100%
Percentage of classified caves effectively and equitably managed by LGUs
36% 36% 36% 43% 36%
Quality of coastal and marine habitats improved (ha)
Coral reef: Giant clams
reseeded in 133.757
hectares
Maintained quality
Maintained quality
Maintained quality
Maintained quality
Source: DENR IV-A
Figure 20.1 Geographic Distribution of Protected Areas in CALABARZON
Region was maintained. Table 20.3 shows that the priority inland/wetland effectively managed in remained at eight hectares (two hectares in Batangas, five hectares in Laguna and one hectare in Quezon) from 2016 to 2018 through the collaborative efforts of the DENR IV-A and concerned LGUs in developing the management plan and the latter’s issuance of Sanggunian Resolution. The number, however, declined from 12 wetlands in 2017 due to DENR IV-A’s limited resources.
Caves with high conservation value improved from five in 2016 to eight in 2018.
The improvement may be attributed to the prioritization of caves within protected areas and the issuance of Memorandum Circular 2012-03, 2014-03, and 2015-08. Meanwhile, there were eight caves effectively managed in 2018 found in the Provinces of Laguna and Quezon as seen in Table 20.4.
Beneficiaries with secured land tenure increased. There were 5,466 residential free patents in residential lands zoned as residential areas issued to beneficiaries from 2017 to October 2019. This is less than the 5,850 target for the same time period due to low applications received by DENR Region

278 | Regional Development Plan 2017-2022
Table 20.4 Caves with Approved Management Plan in CALABARZON, 2018CAVE LOCATION
Butas Kabag 2 Cave Brgy. San Diego, Luisiana, Laguna
Cave No. 2 (Mona Cave) Brgy. Danlagan Batis, Guinyanagan, Quezon
Cave No.3 (Balete Cave)
Cave No.4 (Twin Cave I)
Cave No. 7 (Pavillion Cave)
Cave No. 9 (Unnamed Cave)
Cave No. 10 (Unnamed Cave)
Malusak Cave Brgy. Malusak, Atimonan, QuezonSource: DENR IV-A
IV-A. On the other hand, there were 3,741 beneficiaries with secured land tenure in public agricultural alienable and disposable lands from 2017 to October 2019, as seen in Table 5. This is higher than the 2,200 beneficiaries targeted for the same period. The accomplishments may be attributed to the strengthening of the database through
the implementation of land administration and management system (LAMS). However, maintaining the effective and efficient delivery of these services is a challenge especially during a public health crisis such as the coronavirus disease 2019 (COVID-19) pandemic experienced in 2020.
Land Administration and Management improved through LAMS. The target of 14,000 surveys was likewise surpassed as 17,690 were inspected, verified, and approved through LAMS from 2017 to October 2019. The shift from manual to computerized processing through the implementation of LAMS is a major factor in the increasing number of accomplishment for survey approval.
Meanwhile, jobs generated from reforestation and non-timber/agroforestry enterprises increased from 8,194 in 2016 to 16,829 as of the first half of 2019. This was accomplished through DENR
IV-A’s successful collaboration with people’s organizations. However, the number of biodiversity-friendly enterprises recognized remained at four from 2017 to the first half of 2019, which means that the increasing target was not achieved.
Despite surpassing the target in 2017, the 22 mid-term target for protected areas developed as ecotourism destinations was not met as only 13 were developed per DENR IV-A due to limited resources. This is further aggravated by the Taal Volcano eruption which damaged ecotourism facilities and infrastructure in TVPL with an estimated cost of PhP 9 million. Likewise, the number of sites in Key Biodiversity
Table 20.3 Caves with Approved Management in CALABARZON, 2018
INDICATORSBASELINE TARGET ACCOMPLISHMENT
2016 2017 2018 2017 2018
Area of priority inland/wetland effectively managed (ha)
8 6 4 12 8
Management of caves with high conservation value improved
5 8 8 8 8
Number of caves effectively managed
(No data) 8 8 8 8
Source: DENR IV-A

Chapter 20 Ensuring Ecological Integrity, Clean and Healthy Environment | 279
Table 20.5 Free Patents Issued to Beneficiaries in CALABARZON, 2019
INDICATORSBASE-LINE TARGET ACCOMPLISHMENT
2016 2017 2018 2019 2017 2018 2019
Number of residential free patents issued 2,969 2,550 1,700 1,600 2,238 1,944 1,284 (as of Oct)
Number of beneficiaries with secured land tenure in public agricultural A&D lands
1,532 1,000 620 580 1,366 1,114 991 (as of Oct)
Number of beneficiaries with secured land tenure in residential lands zoned as residential areas
2,969 2,550 1,700 1,600 2,238 1,944 1,284 (as of Oct)
Source: DENR IV-A
Table 20.6 Status of Land Administration and Management in CALABARZON , 2019
INDICATORSBASE-LINE TARGET ACCOMPLISHMENT
2016 2017 2018 2019 2017 2018 2019
Inspection, verification, and approval of surveys through LAMS
78,722 6,000 4,000 4,000 6,336 6,271 5,083 (as of October)
Employment from ecotourism and resource-based industries increased
245 Increasing Increasing Increasing Increasing Increasing
Number of biodivesity-friendly entrerprise recognized increased
n.d. Increasing Increasing 7 4 4
Jobs generated from reforestation and non-timber/agro forestry enterprises incresed
8,194 1058 Increasing Increasing 3540 2996 2,099 (as of June)
Number of sites/ Protected areas developed as ecotourism destinations
7 10 22 22 13 13
Number of sites in Key Biodiversity Areas that serve as ecotourism destinations
10 10 10 10 10 10
Area of agroforestry system adopted 6,545 4,958 4,957 2,865 4,948
Increased income generated from foreshore areas (PhP)
6,745,776 5% increase
from 2016
5% increase
from 2017
5% increase
from 2018
18,702,789 70,840,143
Integrated Protected Area Fund (IPAF) increased (PhP)
8,502,042 5% increase
from 2016
5% increase
from 2017
5% increase
from 2018
2,564,473.75 2,600,129.75 1,184,273.98
Source: DENR IV-A
Areas that serve as ecotourism destinations was not achieved. Quezon Protected Landscape, Mts. Banahaw and San Cristobal Protected Landscape, Taal Volcano Protected Landscape, Mts. Palay-Palay and Mataas na Gulod Protected Landscape, Laguna Marsh, Mt. Makiling Forest Reserve, and Tayabas Bay are the 7 Key Biodiversity Areas that serve as ecotourism destinations from 2016 to 2018. On the other hand, there are 4,958 hectares of agroforestry system adopted in 2017. This is in addition to the 6,545 hectares recorded in 2016.
Meanwhile, income generated from foreshore areas increased to PhP 70,840,143
in 2018 from PhP 6,745,776 in 2016 due to the intensified collection and appraisal of foreshore areas. The Integrated Protected Area Fund, however, decreased from PhP 9,260,011 in 2016 to PhP 8,394,872 in 2018 due to the closure of Mts. Palay-Palay and Mataas na Gulod Protected Landscape and non-collection in Hinulugang Taktak Protected Landscape and Upper Marikina River Basin Protected Landscape.
Table 20.6 shows the summary of the status of land administration and management in the Region as of June 2019.

280 | Regional Development Plan 2017-2022
Environmental qualityAmbient air quality in three monitoring stations generally improved but data capture from the stations must be continuously improved. The Region has four air quality monitoring stations which are located in the cities of Biñan and Santa Rosa in Laguna, Antipolo in Rizal, and Indang in Cavite.
In 2017, the City of Santa Rosa did not meet the 25 μg/NCM standard for atmospheric particulate matters , recording an annual average of 34.12 micrograms per normal cubic meter of air (μg/NCM). The city still failed to pass the standard in 2018 despite improving to 27.59 μg/NCM. Air quality in the Cities of Antipolo and Biñan passed the standard at 17.24 and 9.83 μg/NCM, respectively in 2018.
Meanwhile, air quality monitoring for the first semester of 2019 shows the cities of Biñan and Santa Rosa are within the standard at 18.74 and 10.35 μg/NCM, respectively.
The Enhanced Community Quarantine in Luzon imposed on March 2020 due to the COVID-19 pandemic, may have significantly reduced air pollution and improved air quality in several areas in the Region. The drop in criteria pollutants such as particulate matters and sulfur and nitrogen oxides, among others, has helped clear the air and eventually may have positive health impacts to the people.
Water quality of major water bodies failed to meet Class C and SB standards. Most of the critical water bodies including the 11 priority river systems, Manila Bay, and Matabungkay, Lemery, and Nasugbu Beaches did not meet the targeted water quality standards (Tables 20.8-20.11).
The Region’s priority river systems failed to meet water quality guidelines for Class C
Standard or for food production use from 2016 to the first semester of 2019. Failure to meet the target is due to high BOD, chloride, ammonia, and phosphate and very high fecal coliform content, as seen in Table 20.8.
Among the critical water bodies in the Region is the Manila Bay. The overall ambient water quality in the area did not meet the Class SB water quality parameter. The major concerns include low dissolved oxygen that threatens the health of water bodies, huge amount of fecal coliform content which necessitates water treatment facilities, and exceedance in the total suspended solids (TSS), as seen in Table 20.9.
The water quality of major recreational water bodies in the Region also failed the SB Class Standard due to high fecal coliform content save for the sampling stations in Laiya, San Juan, Batangas as seen in Table 20.10.
Another critical water body in the Region is Laguna Lake, the largest lake in the country. From 4.67 mg/L in 2015, average BOD levels of the lake from 2017 up to the first semester of 2019 are within the standard of less than 7 mg/L as seen in Table 20.11. The lake has a total of 7,647.39 hectares of aquaculture area as of the first semester of 2019, which is well within the 9,200 hectare carrying capacity of the Laguna Lake. Meanwhile, the 1,000 hectares of Laguna Lake basin planted with seedlings until 2018 was not met since most of the critical areas are privately owned properties; hence, there is a need to identify additional planting sites in coordination with the LGUs.
In terms of water quality management areas (WQMAs), the targets from 2017 to the first semester of 2019 was met. From 1 WQMA (Imus- Ylang ylang- Rio Grande Rivers WQMA) in 2016, the Region now has three operational WQMAs with the addition of Cañas-Maalimango Rivers WQMA and Iyam-Dumacaa River System WQMA.

Chapter 20 Ensuring Ecological Integrity, Clean and Healthy Environment | 281
Table 20.7 Ambient Air Quality in Three Urban Areas of CALABARZON, 2017-2018
URBAN AREAS/STATIONSAMBIENT AIR QUALITY (PM2.5, ANNUAL)
Standardμg/NCM
2017μg/NCM
2018μg/NCM
2019 (1st Sem)μg/NCM
Antipolo 25 No reading 17.24 No reading
Biñan City Incomplete reading 9.83 18.74
Santa Rosa City 34.12 27.59 10.35Source:DENR-EMB IV-A
Table 20.8 Water Quality of Priority River Systems in CALABARZON
RIVER SYSTEM
(PROVINCE)YEAR
BOD MG/L
CHLORIDE MG/L
COLOR TCU
DO MG/L
FC MPN/100
ML
NH3-N MG/L pH PO43-
MG/L
ToC TSS
MG/L
7 350 75 5 200 0.05 6.5-9.0 0.5 25-32 110
Imus(Cavite)
2017 15.53 181.425 32.25 5.41 1,456,530 1.499 7.92 1.208 43.84
2018 10.25 123 8.13 5.41 480,101 3.965 7.80 1.434 19.81
2019* 14.58 372.67 25.98 4.402 1,356,914 7.419 7.50 1.67 199.6
Ylang-Ylang(Cavite)
2017 62.25 93.65 78.25 4.62 56,265 0.62 7.8 0.95 96.1
2018 122.1 468 257.00 5.00 280,001 1.915 7.69 1.669 976.7
2019* 161 656.667 14.167 4.187 315,423 1.185 7.63 1.488 28 141.4
Rio Grande(Cavite)
2017 8.71 12.75 21.07 5.96 1,689,669 0.043 7.56 0.83 68.75
2018 6.00 26.32 9.82 6.07 1,029,080 1.122 8.04 1.499 20.86
2019* 8.048 56.786 11.786 5.450 284,130. 2.338 7.80 1.292 28.8 18.74
Cañas(Cavite)
2017 7.67 1,031 29.46 5.43 449,149 0.27 8.01 1.36 24.63
2018 6.08 956 9.17 5.63 211,769 0.169 7.99 0.790 10.50
2019* 7.61 1,024.333 8.75 5.486 583,528 0.379 7.65 1.4618 26.6 49.86
Iyam(Quezon)
2017 48.5 464 14.2 4.6 421,575 0.088 7.6 0.237 15
2018 10 216 8 5.2 185,396 0.207 8.0 0.274 28 15
2019* 12.889 883 11.667 3.533 409,905.3 7.191 0.325 29.33 13.556
Dumacaa(Quezon)
2017 2.9 625 16.3 6.5 45,392 0.086 7.7 0.334 15.2
2018 4 692 8 6.7 74,640 1.101 8.1 0.468 28 16
2019* 2.53 287.67 12 5.30 29,152.19 7.25 0.42 29.20 10.67
Calumpang (Batangas)
2017 17.1 17 4.9 73,683 2.244 8.0 2.995 16
2018 22.3 7,304 8 5.0 35,543 1.908 8.0 1.834 12
2019* 11.50 220.17 8.33 5.95 170 7.37 2.08 29.3 18.17
Pansipit(Batangas)
2017 4.3 10 6.6 4,963 0.014 8.1 0.645 16
2018 4.0 332 5 6.2 3,926 0.015 7.7 0.658 27.1 13
2019* 3.0 87 5 6.5 37,125 6.8 0.788 28 15
Maragondon(Cavite)
2018 2.58 1,157 5.83 7.91 27,701 0.086 7.80 0.490 95.17
2019* 5 1,227 10 6.6 8,132 7.5 0.37 28 23
Labac(Cavite)
2018 6 2,254 5 6.0 100,929 0.681 7.6 1.018 28.3 71
2019* 9 456 15 5.9 25,344 7.3 0.88 28 35
Timalan(Cavite)
2018 5.8 4,836 6 6.6 66,272 0.246 7.5 0.750 28.5 137
2019* 4 50 10 6 1,284 7.4 0.27 28 12
Obispo(Cavite)
2018 3.8 1,499 6 5.9 25,540 0.447 8.0 0.871 28.5 179
2019* 8 62 10 4.3 95,066 7.3 0.74 28 12
Source: DENR-EMB IV-A

282 | Regional Development Plan 2017-2022
Table 20.9 Water Quality in 10 Sampling Stations Along Manila Bay
SAMPLING STATION YEARCOLOR
TCU DO MG/LFC
MPN/100 ML
NH3-N MG/L pH PO43-
MG/L
ToC TSS MG/L
50 6 100 0.05 7.0-8.5 0.5 26-30 50
Bacoor Beach 2017 47.25 5.71 173,875.60 1.79 7.75 1.10 22.25
2018 22.50 5.48 4,709.66 0.99 8.40 0.42 28.49 24.50
2019 7.50 4.42 9,228.08 0.44 7.40 0.22 29.33
Lido Beach 2017 49.83 5.88 2,419.95 0.07 7.93 0.21 70.92
2018 7.92 5.15 7,294.87 0.09 8.07 0.16 28.04 49.08
2019 6.67 5.63 2,423.95 0.03 7.48 0.08 64.67
Villamar I 2017 28.75 5.93 3,271.07 0.08 7.82 0.15 64.67
2018 8.75 6.01 1,972.54 0.09 7.95 0.12 27.67 47.92
2019 6.67 5.52 5,711.53 0.04 7.57 0.09 77.33
Celebrity 32.08 5.57 20,615.21 0.21 7.80 0.31 84.75 84.75
8.75 5.78 18,545.34 0.21 7.95 0.16 28.19 67.00 67.00
9.17 5.68 17,029.41 0.09 7.16 0.10 124.33 124.33
Garden Coast 65.42 6.14 1,308.96 0.08 8.09 0.21 116.50 116.50
7.50 5.95 2,148.76 0.07 7.97 0.21 28.31 75.83 75.83
6.67 5.77 2,658.99 0.03 7.14 0.06 111.50 111.50
Costa Eugenia 75.83 6.15 1,011.00 0.09 7.94 0.17 100.17 100.17
10.42 6.53 3,167.07 0.07 7.79 0.16 28.23 68.75 68.75
6.67 6.03 1,577.90 0.06 7.38 0.06 80.83 80.83
Villa Criselda 37.50 6.13 2,328.61 0.09 7.95 0.21 106.42 106.42
7.50 6.37 3,315.64 0.12 8.03 0.17 27.59 122.33 122.33
7.50 5.85 1,627.12 0.04 7.51 0.09 90.00 90.00
Antonio’s Hide-away
2017 42.67 6.19 950.98 0.05 7.97 0.15 90.42
2018 5.45 6.48 432.12 0.11 7.74 0.20 28.26 75.73
2019 5.83 6.25 197.47 0.08 7.36 0.09 107.67
Daloroy’s Beach Resort
2017 32.08 6.25 736.89 0.05 7.91 0.14 82.17
2018 5.00 6.58 905.00 0.05 7.39 0.12 27.89 83.92
2019 5.83 6.10 87.80 0.02 7.30 0.06 73.83
Bucana Malaki 2017 108.00 6.16 1,730.25 0.08 7.66 0.16 108.70
2018 7.08 6.20 973.21 0.11 7.79 0.18 28.50 125.33
2019 6.67 6.17 1,529.20 0.15 7.38 0.10 135.00
Villa Excellance 2017 23.50 6.06 4091.25 0.07 7.73 0.14 65.40
2018 9.17 6.45 969.01 0.08 8.15 0.17 28.06 64.75
2019 7.50 6.22 1,137.91 0.04 7.03 0.08 113.17
Dalahican 2017 32.00 4.71 31,100.04 0.29 7.89 0.20 41.10
2018 7.92 8.14 66,279.65 0.31 8.14 0.19 27.87 47.92
2019 6.67 4.33 23,392.53 0.44 7.32 0.17 135.83
Mount Sea Resort 2017 62.50 5.56 18,425.07 0.15 7.65 0.31 73.00
2018 7.92 8.35 17,418.37 0.36 8.35 0.37 28.67 131.58
2019 7.50 5.10 58,929.36 0.32 7.36 0.31 98.33Source: DENR-EMB IV-A

Chapter 20 Ensuring Ecological Integrity, Clean and Healthy Environment | 283
Table 20.11 Average BOD Level of Laguna Lake from 2017-2019
YEAR Average BOD Level (mg/L)Standard: <7 mg/L
2015 (Baseline) 4.67
2017 3.15
2018 2
2019* 3Source: Laguna Lake Development Authority
Table 20.10 Water Quality Sampling Stations in Selected Recreational Water Bodies in CALABARZON
SAMPLING STATION YEARFC
MPN/100 ML pH PO43- MG/L
100 7.0-8.5 0.5
Laiya 2017
2018 15.67 8.0 0.033
2019 47.12 7.3 0.021
Nasugbu 2017
2018 443.44 7.8 0.063
2019 488.80 7.5 0.033
Matabungkay 2017
2018 1701.49 7.9 0.024
2019 256.09 7.7 0.021
Lemery 2017
2018 259.25 7.8 0.108
2019 412.27 6.9 0.049Source: DENR-EMB IV-A
Poor quality of air and water are linked to diseases (e.g., respiratory illnesses) which increases the people’s risk/vulnerability to contracting viral and bacterial infections. Pathogens/viruses may contaminate air and water bodies which can facilitate advanced transmission to a wider number of people in a short span of time if no proper intervention is undertaken by the private and government sectors.
Any raw or undertreated process wastewater from commercial, industrial, institutional establishments, hospitals or healthcare establishments and sewage discharged into the water bodies may exacerbate contraction and spread of the virus. Worst case is when the virus thrived in waterbodies (e.g. rivers and lakes) will contaminate the water supply for various
purposes essential to everyday living (i.e., drinking water, industrial, agriculture). Process wastewater from hospitals/medical facilities, in particular, has higher potential to be contaminated with pathogens, nonetheless, wastewater from commercial and industrial establishments should be included considering that this can also be contaminated.
Solid waste management improved but diversion rate targets remained unmet. In terms of solid waste management, the Region achieved most of its targets (Table 20.14). The number of closed and rehabilitated open dumpsites and controlled dump facilities increased from 8 in 2016 to 28 as of the first semester of 2019. Likewise, the number of sanitary landfills in the Region increased from 23 in 2016

284 | Regional Development Plan 2017-2022
Table 20.12 Total Sanitary Landfills in CALABARZON, 2019PROVINCE 2017 2018 2019 TOTAL SANITARY LANDFILLS
Batangas 7 1 - 8
Cavite 3 - - 3
Laguna 8 - - 8
Quezon 12 - 3 15
Rizal 3 - - 3
TOTAL 33 1 3 37Source: DENR-EMB IV-A
to 37 in the first half of 2019. Among the provinces, Quezon has the most number of sanitary landfill at 15 as seen in Table 20.12. Accomplishment of targets in closed and rehabilitated open and controlled dump facilities and establishment of sanitary landfills is due to DENR-EMB’s provision of financial and technical assistance to LGUs.
Meanwchile, LGUs with approved 10-year Solid Waste Management Plan also increased from 51 in 2016 to 93 by the middle of 2019 due to strict compliance of LGUs. Table 20.13 shows that the Province of Laguna is the top performing province in the Region with 88 percent of its cities and municipalities with approved Solid Waste Management Development Plans. Likewise, LGU compliance with RA 9003 greatly increased from 16 percent in 2016 to 68 percent in the first semester of 2019 due to frequesnt monitoring of DENR-EMB.
Meanwhile, despite the increasing trend in the solid waste diversion rate from 2017 to 2019, the Region’s performance declined from 46 percent in 2016 to 38 percent in 2019.
Relative to the COVID-19 pandemic, the challenge is the increase in the generation of medical and hazardous wastes (i.e., infectious wastes such as used face masks, gloves, and other protective equipment, testing kits, syringes, tissues etc.) in health care facilities, and even at the household level.
To address the improper disposal of medical or pathological wastes from hospitals or healthcare establishments, it is necessary that proper coordination be done by these establishments with registered transporters and Treatment, Storage, and Disposal (TSD) Facilities.
Also, hazardous wastes from the households must be disposed, segregated and properly labelled for the protection of garbage haulers from infectious diseases. The Local Government Units must ensure that hazardous or special wastes undergo proper treatment and are disposed in appropriate sanitary landfills that accept/handle treated special/pathological wastes. Information, education and communication on proper handling of hazardous wastes in the households should also be conducted by the LGUs.
On the other hand, solid waste generation has exhibited a significant decrease in volume which may be attributed to the closure of establishments or non-essential services and limited operation of markets during the enhanced community quarantine.
Nevertheless, when both solid and pathological wastes are improperly disposed, there is a greater risk of exposure to diseases and could cause widespread transmission of virus at a short period of time.
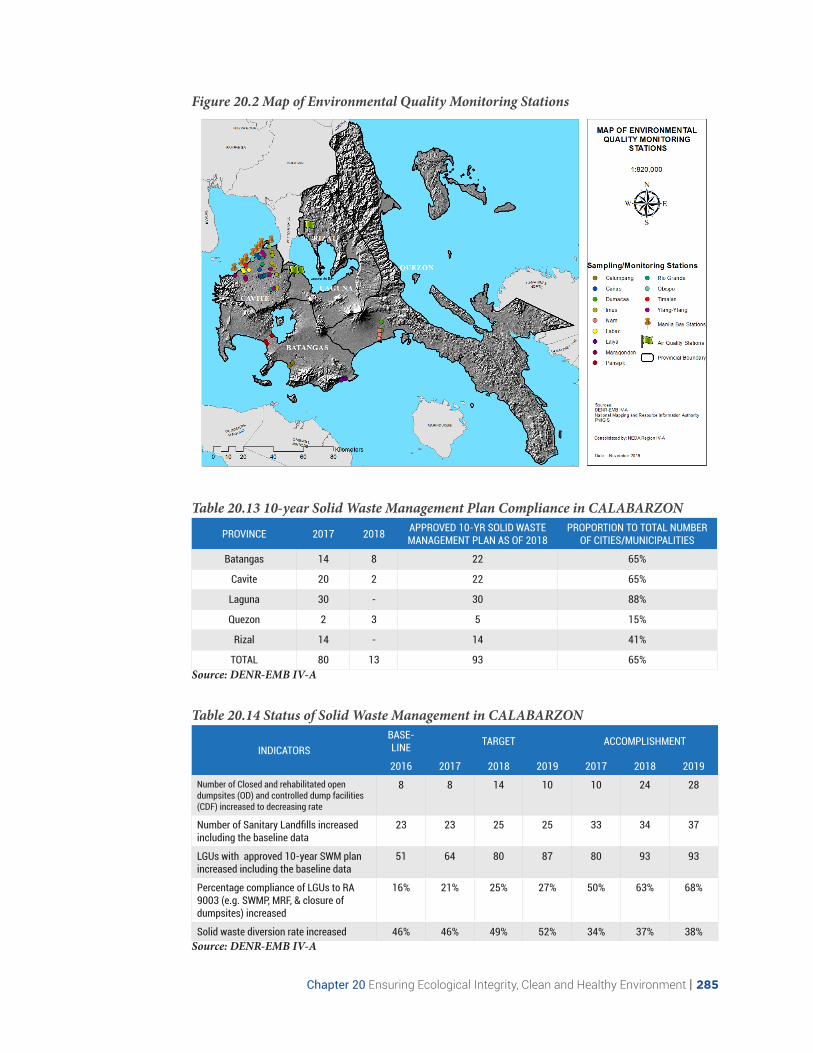
Chapter 20 Ensuring Ecological Integrity, Clean and Healthy Environment | 285
Figure 20.2 Map of Environmental Quality Monitoring Stations
Table 20.13 10-year Solid Waste Management Plan Compliance in CALABARZON
PROVINCE 2017 2018 APPROVED 10-YR SOLID WASTE MANAGEMENT PLAN AS OF 2018
PROPORTION TO TOTAL NUMBER OF CITIES/MUNICIPALITIES
Batangas 14 8 22 65%
Cavite 20 2 22 65%
Laguna 30 - 30 88%
Quezon 2 3 5 15%
Rizal 14 - 14 41%
TOTAL 80 13 93 65%Source: DENR-EMB IV-A
Table 20.14 Status of Solid Waste Management in CALABARZON
INDICATORSBASE-LINE TARGET ACCOMPLISHMENT
2016 2017 2018 2019 2017 2018 2019
Number of Closed and rehabilitated open dumpsites (OD) and controlled dump facilities (CDF) increased to decreasing rate
8 8 14 10 10 24 28
Number of Sanitary Landfills increased including the baseline data
23 23 25 25 33 34 37
LGUs with approved 10-year SWM plan increased including the baseline data
51 64 80 87 80 93 93
Percentage compliance of LGUs to RA 9003 (e.g. SWMP, MRF, & closure of dumpsites) increased
16% 21% 25% 27% 50% 63% 68%
Solid waste diversion rate increased 46% 46% 49% 52% 34% 37% 38%Source: DENR-EMB IV-A

286 | Regional Development Plan 2017-2022
Increased adaptive capacities and resilience of ecosystemsThe adaptive capacities and resilience of ecosystems in the Region improved. Out of 147 LGUs in the Region, 67 have fully functional DRRM operation centers as of 2018. In addition, there are 3,831 identified possible evacuation centers in the Region. Moreover, the number of LGUs with Local Climate Change Action Plans increased form 92 in 2018 to 97 in 2018.
Casualties due to natural disasters decreased from 45 in 2017 to 28 in 2018 due to disaster preparedness and the capacity building programs. These programs include training of 714 individuals on DRRM. The number
of casualties due to human-induced events, however, increased from 525 in 2017 to 1,135 in 2018. The casualties were caused by self-inflicted incidents.
Meanwhile, an emerging challenge in the Region is responding to multiple hazard-events (i.e. Taal Volcano eruption, African Swine Fever outbreak, and the COVID-19 pandemic) occurring simultaneously. A case in point is the reported cases of ASF in Batangas which was suspected from foodwastes in evacuation centers of Taal Volcano eruption. In addition, social distancing is not factored in disaster management (e.g. evacuation centers), which makes the COVID-19 pandemic more difficult to manage due to impact to critical lifelines (e.g. water, relief goods, etc.).
Table 20.15 Indicators, Targets, and Accomplishments for Adaptive Capacity and Resilience in CALABARZON
INDICATORSBASELINE TARGET ACCOMPLISHMENT
2016 2017 2018 2019 2017 2018 2019
Number of reviewed CC/DRRM enhanced plans increased (CLUP, CDP, LDRRMP, LCCAP)
CLUP: 37; CDP: 68;
LDRRMP: 134; LCCAP: 92
Increasing Increasing Increasing
97
Percentage of LGUs with institutionalized and fully operational DRRM Office increased
(No data) Increasing Increasing Increasing 67
Number of established climate/ disaster resilient evacuation centers
(No data) Increasing Increasing Increasing 3,831
Loss of lives and causalities due to natural disasters and meteorological events, environmental hazards, and human-induced events reduced
(No data)Natural DisasterHuman-induced
Decreasing Decreasing Decreasing45
52528
1,135
Source: DENR-EMB IV-A

Chapter 20 Ensuring Ecological Integrity, Clean and Healthy Environment | 287
Action PlanStrategic FrameworkThe main outcome for the sector is to ensure ecological integrity and to improve the socio-economic conditions of resource-based communities through sustainable integrated area development. In support of
the overall sectoral outcome, three major strategies or outcomes will be pursued, namely: a) Biodiversity and functioning of ecosystem services sustained; b) Environmental quality improved; and c) Adaptive capacities and resilience of ecosystems increased.
Figure 20.3 Strategic Framework to Ensure Ecological Integrity, Clean and Healthy Environment
TargetsPlan targets for the remaining period, 2020 to 2022, still focus on maintaining the integrity of biodiversity and functioning of ecosystem services, improving the environmental quality, and increasing the adaptive capacity and resilience of ecosystems.
Realization of these targets would mean preservation of watersheds and protected areas, effectively and equitably managed resources, air and water quality within the prescribed standards, strict compliance to RA 9003 and solid waste management plans, and religious implementation of climate change and disaster risk and reduction management enhanced plans.
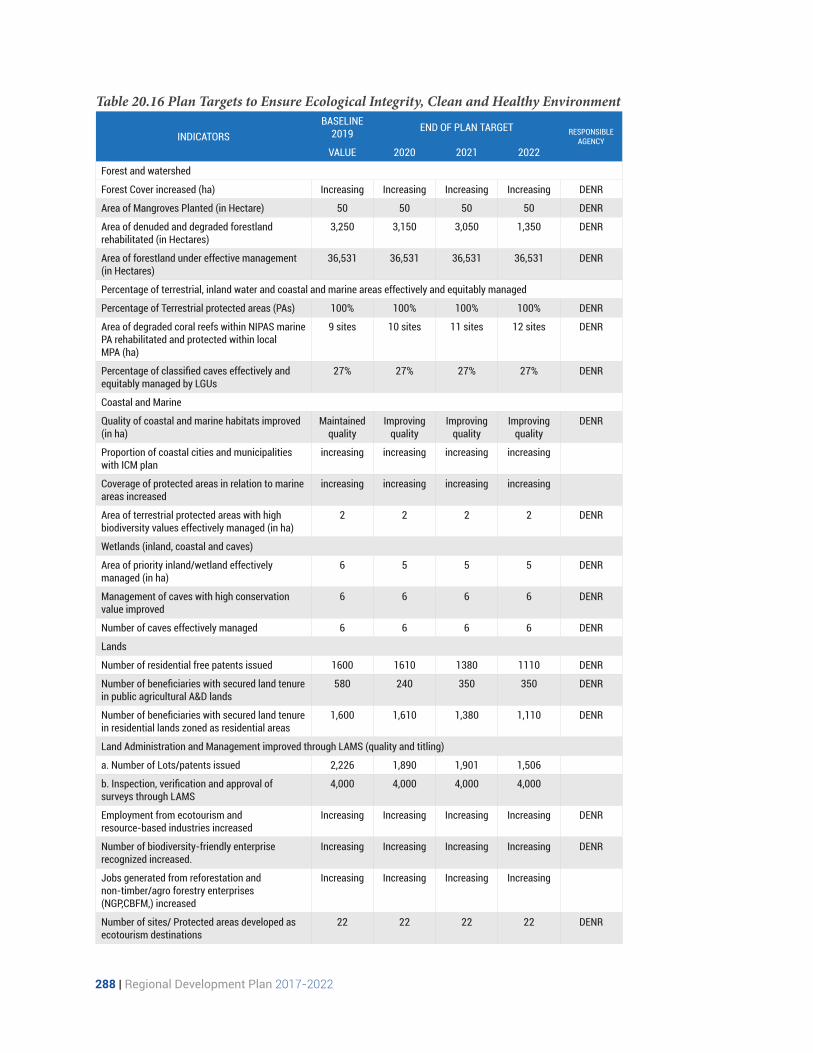
288 | Regional Development Plan 2017-2022
Table 20.16 Plan Targets to Ensure Ecological Integrity, Clean and Healthy Environment
INDICATORSBASELINE
2019 END OF PLAN TARGET RESPONSIBLE AGENCY
VALUE 2020 2021 2022
Forest and watershed
Forest Cover increased (ha) Increasing Increasing Increasing Increasing DENR
Area of Mangroves Planted (in Hectare) 50 50 50 50 DENR
Area of denuded and degraded forestland rehabilitated (in Hectares)
3,250 3,150 3,050 1,350 DENR
Area of forestland under effective management (in Hectares)
36,531 36,531 36,531 36,531 DENR
Percentage of terrestrial, inland water and coastal and marine areas effectively and equitably managed
Percentage of Terrestrial protected areas (PAs) 100% 100% 100% 100% DENR
Area of degraded coral reefs within NIPAS marine PA rehabilitated and protected within local MPA (ha)
9 sites 10 sites 11 sites 12 sites DENR
Percentage of classified caves effectively and equitably managed by LGUs
27% 27% 27% 27% DENR
Coastal and Marine
Quality of coastal and marine habitats improved (in ha)
Maintained quality
Improving quality
Improving quality
Improving quality
DENR
Proportion of coastal cities and municipalities with ICM plan
increasing increasing increasing increasing
Coverage of protected areas in relation to marine areas increased
increasing increasing increasing increasing
Area of terrestrial protected areas with high biodiversity values effectively managed (in ha)
2 2 2 2 DENR
Wetlands (inland, coastal and caves)
Area of priority inland/wetland effectively managed (in ha)
6 5 5 5 DENR
Management of caves with high conservation value improved
6 6 6 6 DENR
Number of caves effectively managed 6 6 6 6 DENR
Lands
Number of residential free patents issued 1600 1610 1380 1110 DENR
Number of beneficiaries with secured land tenure in public agricultural A&D lands
580 240 350 350 DENR
Number of beneficiaries with secured land tenure in residential lands zoned as residential areas
1,600 1,610 1,380 1,110 DENR
Land Administration and Management improved through LAMS (quality and titling)
a. Number of Lots/patents issued 2,226 1,890 1,901 1,506
b. Inspection, verification and approval of surveys through LAMS
4,000 4,000 4,000 4,000
Employment from ecotourism and resource-based industries increased
Increasing Increasing Increasing Increasing DENR
Number of biodiversity-friendly enterprise recognized increased.
Increasing Increasing Increasing Increasing DENR
Jobs generated from reforestation and non-timber/agro forestry enterprises (NGP,CBFM,) increased
Increasing Increasing Increasing Increasing
Number of sites/ Protected areas developed as ecotourism destinations
22 22 22 22 DENR

Chapter 20 Ensuring Ecological Integrity, Clean and Healthy Environment | 289
INDICATORSBASELINE
2019 END OF PLAN TARGET RESPONSIBLE AGENCY
VALUE 2020 2021 2022
Number of sites in Key Biodiversity Areas that serve as ecotourism destinations
10 10 10 10 DENR
Area of agroforestry system adopted 2,865 2,865 2,865 7,165 DENR
Increased income generated from foreshore areas (PhP)
5% increase from 2018
5% increase from 2019
5% increase from 2020
5% increase from 2021
DENR
Integrated Protected Area Fund (IPAF) increased (PhP)
5% increase from 2018
5% increase from 2019
5% increase from 2020
5% increase from 2021
DENR
Air Quality
Percentage of urban areas with air quality within ambient air quality guideline value/ standard increased
100% 100% 100% 100% EMB
Number of urban areas with air quality stations (PM 10/2.5, DOAS) increased
4 4 5 5 EMB
Water Quality
Water quality of priority river systems within water quality guideline value/standard (10 parameters: BOD5, NH3-N, CL, Color, DO, pH, PO4, TSS, Fecal Coliform and Temperature)
a) Imus River Class C Class C Class C Class C EMB
b) Ylang-Ylang River Class C Class C Class C Class C EMB
c) Rio Grande River Class C Class C Class C Class C EMB
d) Cañas River Class C Class C Class C Class C EMB
e) Iyam-Dumacaa River Class C Class C Class C Class C EMB
f) Calumpang River Class C Class C Class C Class C EMB
g) Pansipit River Class C Class C Class C Class C EMB
h) Maragondon River Class C Class C Class C Class C EMB
i) Labac River Class C Class C Class C Class C EMB
j) Timalan River Class C Class C Class C Class C EMB
k) Obispo River Class C Class C Class C Class C EMB
Water quality of sampling stations in Manila Bay within water quality guideline value/standard (8 parameters: fecal coliform, color, DO, pH, TSS, Temperature, Phosphate, NH3-N)
a) Bacoor beach Class SB Class SB Class SB Class SB EMB
b) Lido Beach Class SB Class SB Class SB Class SB EMB
c) Villamar I Class SB Class SB Class SB Class SB EMB
d) San Isidro Class SB Class SB Class SB Class SB EMB
e) Celebrity Class SB Class SB Class SB Class SB EMB
f) Garden Coast Class SB Class SB Class SB Class SB EMB
g) CoastaEuegenia Class SB Class SB Class SB Class SB EMB
h) Villa Criselda Class SB Class SB Class SB Class SB EMB
i) Antonio’s Hideaway Class SB Class SB Class SB Class SB EMB
j) Daloroy’s beach resort Class SB Class SB Class SB Class SB EMB
k) Bucana Malaki Class SB Class SB Class SB Class SB EMB
l) Villa Excellance Class SB Class SB Class SB Class SB EMB
m) Dalahican (Brgy. 8) Class SB Class SB Class SB Class SB EMB
n) Mount Sea Resort Class SB Class SB Class SB Class SB EMB
Water quality of recreational water body within water quality guideline value/standard (8 parameters: fecal coliform, color, DO, pH, TSS, Temperature, Phosphate, NH3-N)
a) Laiya Class SB Class SB Class SB Class SB EMB
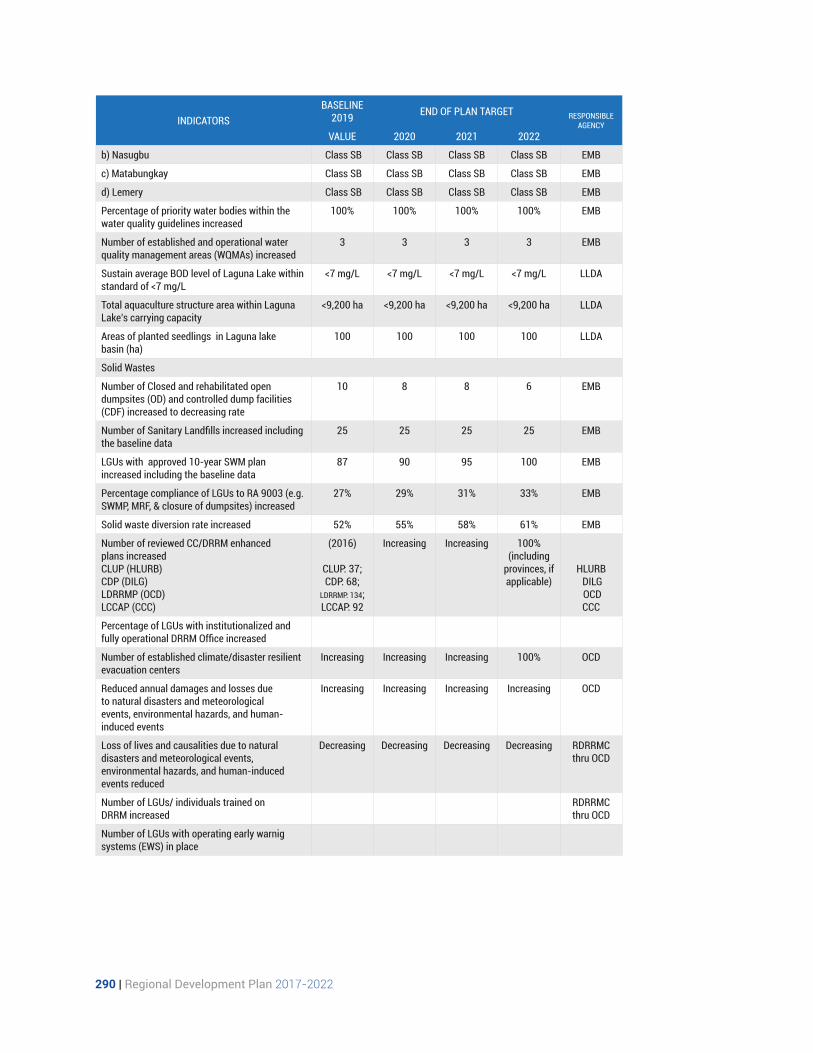
290 | Regional Development Plan 2017-2022
INDICATORSBASELINE
2019 END OF PLAN TARGET RESPONSIBLE AGENCY
VALUE 2020 2021 2022
b) Nasugbu Class SB Class SB Class SB Class SB EMB
c) Matabungkay Class SB Class SB Class SB Class SB EMB
d) Lemery Class SB Class SB Class SB Class SB EMB
Percentage of priority water bodies within the water quality guidelines increased
100% 100% 100% 100% EMB
Number of established and operational water quality management areas (WQMAs) increased
3 3 3 3 EMB
Sustain average BOD level of Laguna Lake within standard of <7 mg/L
<7 mg/L <7 mg/L <7 mg/L <7 mg/L LLDA
Total aquaculture structure area within Laguna Lake’s carrying capacity
<9,200 ha <9,200 ha <9,200 ha <9,200 ha LLDA
Areas of planted seedlings in Laguna lake basin (ha)
100 100 100 100 LLDA
Solid Wastes
Number of Closed and rehabilitated open dumpsites (OD) and controlled dump facilities (CDF) increased to decreasing rate
10 8 8 6 EMB
Number of Sanitary Landfills increased including the baseline data
25 25 25 25 EMB
LGUs with approved 10-year SWM plan increased including the baseline data
87 90 95 100 EMB
Percentage compliance of LGUs to RA 9003 (e.g. SWMP, MRF, & closure of dumpsites) increased
27% 29% 31% 33% EMB
Solid waste diversion rate increased 52% 55% 58% 61% EMB
Number of reviewed CC/DRRM enhanced plans increased CLUP (HLURB) CDP (DILG)LDRRMP (OCD)LCCAP (CCC)
(2016)
CLUP: 37;CDP: 68;
LDRRMP: 134; LCCAP: 92
Increasing Increasing 100% (including
provinces, if applicable)
HLURB DILG OCDCCC
Percentage of LGUs with institutionalized and fully operational DRRM Office increased
Number of established climate/disaster resilient evacuation centers
Increasing Increasing Increasing 100% OCD
Reduced annual damages and losses due to natural disasters and meteorological events, environmental hazards, and human- induced events
Increasing Increasing Increasing Increasing OCD
Loss of lives and causalities due to natural disasters and meteorological events, environmental hazards, and human-induced events reduced
Decreasing Decreasing Decreasing Decreasing RDRRMC thru OCD
Number of LGUs/ individuals trained on DRRM increased
RDRRMC thru OCD
Number of LGUs with operating early warnig systems (EWS) in place

Chapter 20 Ensuring Ecological Integrity, Clean and Healthy Environment | 291
Strategies
Biodiversity and functioning of ecosystem services sustained
Intensify protection and sustainable management of forest, watershed, coastal and marine and land through adoption of ridge-to-reef approach
Forests and Watershed
• Continue the rehabilitation of degraded forestlands, critical watersheds and major river basins through the reforestation efforts under DENR’s Enhanced National Greening Program
• Enhance NGP/private tree plantations using endemic or indigenous species with nitrogen-fixing and carbon sequestration potentials for production and rehabilitation purposes, and extend technical assistance to other parties engaged in tree plantation
• Strengthen the protection of natural and rehabilitated forest, effective and
• management areas and key biodiversity areas through shared governance and closer coordination with local governments, indigenous and local communities, CSOs and private sector. For example, CSOs can be engaged in site development, management and monitoring, and partnerships with businesses for area management
• Adopt the ridge-to-reef approach in the development, review, and implementation of development activities, and environment protection and conservation efforts to take into account the interconnectivity of upland and downstream ecosystems
• Fast-track the completion and/or updating of all CLUPs, CDPs, LDRRMPs, and LCCAPs in the Region especially for highly urbanized areas and cities and ensure that these are DRR/CCA enhanced and have adequate environmental protection measures, and
that zoning ordinance is approved and strictly enforced
• Complete delineation of final forest limits to identify areas for protection and production
Coastal and Marine areas
• Improve management and protection through regular policing and patrolling activities within marine protected areas, activation of marine protected areas network, preparation of marine protected areas management plans, capacity building for local governments on the establishment and expansion of MPAs, and identification of fish sanctuaries
• Implement integrated coastal and marine resources management (for mangroves, coral reefs, sea grass, etc.) including the conduct of coastal resource mapping and assessment
• Complete delineation/delimitation and zoning of municipal waters especially among LGUs with overlapping jurisdiction. Mapping and zoning of foreshore areas into production and protection areas will be also be pursued to ensure fisheries sustainability
• Complete coastal resource mapping and vulnerability assessment based on satellite images and appropriate ground validation activities
Land
• Issue appropriate tenure and management instruments in the protection, conservation, rehabilitation and development of forestlands and protected areas. Secured land titles will also be continuously provided to beneficiaries in public agricultural alienable and disposable lands and areas zoned as residential
• Issue Certificates of Ancestral Domain Title (CADT) to indigenous peoples to support their economic and cultural activities

292 | Regional Development Plan 2017-2022
• Improve land administration and management through the computerization of land titling and related services, updating and sharing of land resources information and capacity building of practitioners down to the LGU level
Wetlands
Improve the management of priority caves and wetlands through the strict implementation of regulations, management plans and advocacy of sustainable practices
Urban biodiversity
Promote the establishment of more green spaces in urban areas to improve the air quality, and micro-climate in the area that will also serve as an affordable and accessible socialization area in neighborhoods contributing to better environmental, health and social quality of life for urban residents.
Water resource
Improve management of water resources (i.e. inventory of available groundwater) and promote responsible and sustainable water consuption
Expand the development of ecotourism sites and resource-based enterprises or industries to provide employment, alternative source of livelihood and increased income for local communities • Promote and develop ecotourism sites in
the Region particularly upland, coastal, wetlands and caves destinations that will provide alternative sources of income and allow private and public investments to come to rural and coastal communities. Both the government and the private sector can provide assistance in eco-tourism site development, which includes the establishment and maintenance of ecotourism facilities
• Conduct the following supporting
activities: a) identification of tourism destinations and products and promoting them to domestic and international markets; b) diversification of existing destinations and creation of new tourism areas, products, and services using community-based ecotourism approaches; and c) formulation and implementation of cluster tourism master plans in identified tourism development areas to maximize tourism assets and economic benefits
• Promote sustainable forest-based industries. The development of commercial forest plantations within applicable areas will be guided by the Region’s comparative advantage in terms of timber production
• Adopt agroforestry system by providing assistance to upland farmers, particularly tenure holders, in developing agroforestry farms, which include installation of soil and water conservation measures and the establishment of partnerships with private investors to increase the competitiveness of goods and services in the market
• Promote sustainable marine-based industries to achieve a blue economy. These industries include: a) sustainable fisheries and aquaculture; b) ocean energy, offshore and gas exploration; c) shipping/marine transportation and shipbuilding; and d) eco-tourism, among others
• Adopt biodiversity-friendly enterprises and practices in agriculture through capacity building and better access to available technologies
• Improve the system of collection of appropriate fees and fines in areas covered by tenure (e.g. foreshore lease areas, SAPA, etc.) to increase revenue collected from the use of these resources which can be utilized by the government to sustain management activities of natural resources
Conserve and promote biodiversity through: a) protection of threatened and endemic species; b) prevention,

Chapter 20 Ensuring Ecological Integrity, Clean and Healthy Environment | 293
control, and eradication of invasive alien species; c) conduct of scientific studies and regular monitoring of biodiversity population and habitats; and d) conduct of environmental protection/conservation awareness orientations in schools, local communities and among tourists
Continue the monitoring of Permanent Biodiversity Monitoring Areas. Data gathering and statistical analysis are necessary activity to establish historical data that will be used for effective biodiversity conservation planning and programming.
Encourage the participation of civil society, private sector, indigenous and local communities in the management of natural resources
Cascade implementation of the PBSAP into RBSAP and fast track mainstreaming at the PA level
Environmental quality improved
Strengthen the enforcement of environmental laws and ensure conformity with environmental standards
Air quality management
• Establish and maintain the required number of air quality monitoring stations especially in major urban centers in the Region
• Regularly monitor industries particularly those with high potential for air pollution, ensure that they conform to air quality standards, and enforce necessary sanctions for violators
• Strengthen the enforcement of anti-smoke belching campaign and vehicle emission testing through increasing the number of personnel and the quality and quantity of necessary equipment/ facilities. The establishment of more government-owned motor vehicle inspection centers and the regular monitoring of private
emission testing centers will also be pursued
• Promote EST (Environmentally Sustainable Transport) including efficient mass transport system and clean fuels
• Provide support for research and development of clean technologies and strengthen the adoption of green technologies and increased investments of the private sector
• Strengthen coordination with LGUs and sharing of data acquired from the ambient air quality stations which may serve as basis in the formulation of LGUs plans and programs
• Deploy mobile air samplers in strategic areas in the Region to capture sufficient air quality data
Water quality management
• Establish and maintain the required number of water quality monitoring stations in major water bodies in the Region
• Regularly monitor industries and water and sewage treatment plants, ensure that they conform to water quality standards and enforce necessary sanctions for violators
• Strengthen pollution control from domestic and agriculture sources that are mostly unregulated and have become the major sources of water pollution
• Establish and operationalize more WQMAs in the Region to implement high-impact projects such as waste treatment, disposal, resettlement and infrastructure projects to improve water quality. Capacity building of WQMA members and resource mobilization will also be pursued to ensure sustainability of planned activities
• Revitalize and form river armies in local governments and conduct regular locally-initiated river and coastal clean-ups
• Regularly monitor water quality of major rivers per province and establish local government- run laboratories on water

294 | Regional Development Plan 2017-2022
quality testing. To ensure the safety of the personnel conducting water quality monitoring, coordination with the Mines and Geosciences Bureau and PHILVOLCS is needed to provide their technical assessment on the current condition of the areas.
• Strictly enforce easement of structures in lakes, rivers and coastal areas
• Survey informal settlers especially those along water bodies, identify relocation sites, and relocate them in low cost housing with proper septage facilities
• Study and enforce the maximum carrying capacity of fish cages and fish stocks in major lakes (e.g. Laguna lake, Taal lake) in the Region
• Regularly monitor the ground water extraction and quality to ensure adequate water supply and water quality/potability
• Implement stringent wastewater management procedures in establishments, industries, wastewater treatment plants and facilities, including hospitals, medical sectors, and health care waste management sectors generating wastewater within the Region through installing and ensuring efficient operation of a disinfectant system at the last stage of the wastewater treatment process prior to discharge to any water body
Solid, toxic and hazardous wastes management
• Close and rehabilitate remaining dumpsites and promote alternative waste disposal and waste to energy facilities/ systems/technologies that can be operated in partnership with the private enterprises
• Operationalize MRFs, treatment facilities, and submission of approved local solid waste management plans
• Strengthen the implementation of IEC activities that focus on proper waste management, waste reduction and recycling for communities and households. For LGUs, re-orientation of local chief executives and relevant
departments on environmental laws and incentives for hosting sanitary landfills will also be regularly conducted
• Provide technical assistance and capacitate LGUs on: a) the formulating solid waste management plans; b) identifying, establishing, operating and maintaining solid waste technologies and facilities; and c) identifying possible revenue generating schemes to sustain solid waste management facilities. Financial assistance can also be provided by the government through existing programs and projects
• Increase LGU compliance to R.A. 9003 and LGU investment in waste management system and facilities in combination with public and private funding
• Promote clustering of sanitary landfill and solid waste management technologies to address its large capital requirement and allow low income LGUs to pool resources to establish such facilities
• Designate permanent municipal and city environment and natural resource officers in all local governments and provide necessary manpower and funding
• Ensure compliance of health care facilities with the standards for hazardous waste management (i.e. strict enforcement and monitoring of existing treatment technologies employed in the TSD facilities to handle new pathogens or viruses, in compliance with the applicable environmental standards)
• Modernize and increase TSD facilities for hazardous healthcare wastes
• Improve disposal of healthcare wastes at the household or barangay level to guarantee proper segregation at source, partnerships between and among LGUs and TSD accredited facilities to ensure that untreated healthcare wastes do not reach materials recovery facilities (MRFs) and sanitary landfills (SLFs), and expanded coverage of hazardous waste tracking system to cover household wastes

Chapter 20 Ensuring Ecological Integrity, Clean and Healthy Environment | 295
Implement the Philippine Action Plan for Sustainable Consumption and Production
• Institutionalize and integrate natural capital accounting in the planning and programming processes
• Determine ecological limits and account and value negative externalities of consumption and production
• Scale up innovation and investment in green technologies and systems
• Develop, promote, and transfer cleaner production technologies, including water and energy- efficient practices (e.g. rainwater catchment facility, cleaner fuels and engine, energy-efficient facilities/green buildings)
• Promote green procurement in both private and public sectors
• Promote EST, including mass transport system and clean fuels
• Promote and provide incentives for the use of renewable energy sources
Adaptive capacities and resilience of ecosystems increased
Strengthen the local implementation of all aspects (i.e. prevention and mitigation preparation, response, rehabilitation and recovery) of disaster risk reduction and management
• Ensure the availability and access to location-specific hazards and risks, in particular access to large scale (1:10,000) probabilistic hazard maps, through the promotion and use of hazard mapping services of agencies and universities. DOST’s plan to establish a Center for Hazard and Resource Mapping in the Region will ensure a centralized and better access to hazard and other resource/thematic maps
• Develop a Regional disaster database to include damages and losses and disaggregated information on gender, and the vulnerable and affected sectors. Supporting activities include: a) collection
of baseline data on disaster events in the past five years; b) formulation of a report template and reporting protocol; c) training for agencies and local DRRM officers; and d) linkage to other related databases
• Continue to mainstream DRR and CCA in Regional, sub-national, and local development plans and policies through the use of relevant planning guidelines such as HLURB’s Supplemental Guidelines to generate updated climate change projection, and risk and vulnerability assessment in order to identify appropriate and adequate mitigation and adaptation measures
• Adopt standards to ensure climate and disaster-resilient natural and human systems, including, but not limited to, communities and critical infrastructure. Retrofitting and construction of climate smart and disaster-resilient infrastructures and facilities will be pursued, especially in hazard- prone areas and environmentally- critical areas
• Conduct and adopt area or firm level BCP not only for large companies but also for small and medium enterprises in order to reduce economic impacts and facilitate the fast recovery of industrial functions and economic activities in the Region in times of natural disasters and emergency situations
• Promote disaster resilient and climate smart businesses and livelihoods to minimize loss of lives and assets
• Promote available DRRM and CC financing mechanisms such as the People’s Survival Fund to improve access and increase utilization. Technical assistance will be provided by Regional and, if needed, national agencies so that LGUs can comply with the requirements and successfully apply to such facilities
• Formulate a Regional preparedness and response framework for disease outbreaks and pandemics to: (a) address the gaps in coordination mechanisms across government agencies and between the

296 | Regional Development Plan 2017-2022
Major Programs and Projects• ENGP• Social Forestry Project • Forest landscape rehabilitation
and restoration • Delineation of final forest limits
including production and protection forests
• Complete delineation of municipal waters
• Development and promotion of ecotourism sites
• Deployment of new technologies on water quality monitoring, e.g. SENRTY by DOST
• Establishment of wastewater treatment facilities in cities and municipalities
• by water concessionaires and water districts
• Establishment of shared solid waste disposal facilities among LGUs
• Establishment of TSD facilities per province for hazardous and infectious wastes
• IEC on waste segregation at source, collection, treatment, and disposal especially infectious and hazardous wastes
• Development and adoption of green
national government and LGUs, along with the private sector and civil society to enable a whole-of-society response, and (b) harmonize existing Disaster Risk Reduction and Management (DRRM) and Crisis Management Frameworks for better interoperability, especially for subnational level planning
• Strengthen emergency evacuation systems by: (a) geo-mapping evacuation centers and hospitals; (b) developing guidelines for determining the appropriate number, capacity and location for evacuation centers prior to establishment/construction; and (c) setting in place appropriate health and safety standards and protocols to prevent the spread of infectious diseases inside the evacuation centers
Priority will be given to activities that will further strengthen the institutional, community and individual capacity to improve the timely and adequate response to disasters, as well as to increase resilience:
• Increase the competency of decision-makers and relevant stakeholders or the public to understand the risk and vulnerability analysis/assessment through capability building on: a) reading/analyzing and integrating thematic or hazard maps for local plans; b) GIS
trainings; and c) risk and vulnerability analysis/assessments
• Continue to strengthen the capacity of concerned agencies to conduct post or rapid disaster needs assessment by building a pool of technical experts and conduct of orientation or trainings on basic concepts and methodologies on damage and loss assessment for LGUs to facilitate timely submission and completion of reports and when necessary, rehabilitation and recovery plans
• Include the conduct of regular infrastructure audit in the budget of agencies and local governments, and monitor the submission of reports to RDRRMC
• Review and update land use and post-disaster resettlement plans to ensure that resettlement areas, future residential and built- up areas are not in hazard prone, environmentally-critical and conservation areas
• Continue to conduct training on DRRM and ICS (Incident Command System) for local governments down to barangay level
• Continue to conduct IEC for households on the existing hazards in their areas and on the preparation and response in times of disasters and emergencies, and to mainstream DRRM and CC in school curricula at all levels

Chapter 20 Ensuring Ecological Integrity, Clean and Healthy Environment | 297
Legislative Agenda
infrastructure and technologies such as rainwater harvesting or catching technologies
• Retrofitting of buildings, establishments and infrastructure according to climate and disaster resilient building standards
• Regional database on disaster damages and losses
• Improvement and installation of additional community EWS
• Conduct of geohazard mapping
Priority Researches • Study on garbage hauling fees and on
alternative, and affordable solid waste
disposal systems according to the income capacities of local governments
• Study on the environmental impacts of dumpsites
• Mapping on ecological assessment for local governments
• Identifying pollutants in priority river systems
• Baseline studies on biodiversity population
• Study on the legal measures to address long term TROs and writ of preliminary injunctions especially for demolishment of illegal and non- compliant industries
LEGISLATIVE AGENDA RATIONALE
Enactment of Sustainable Forest Management Bill
This will ensure that forests are properly managed to meet the needs of the present and future generations.
The bill seeks to develop an effective and sustainable forest management strategy based on the allocation of forestland uses and promotion of land use practices that will not only be productive but will also conserve forest resources such as soil, lumber, and water. This strategy will also work to protect existing forest resources, conserve our fragile biodiversity, and rehabilitate deforested or denuded areas. It is also envisioned to promote and stimulate food production activities without compromising forested areas. This bill likewise provides for a Community-Based Forest Management Program to be undertaken by concerned national agencies and the local government units. With this, indigenous people and other forest-based communities will be empowered to manage, develop, utilize, and protect forest resources in a sustainable way.
Enactment of National Land Use Act There is a need to plan the Region’s physical space well. Land use policies must be clear on where and how much space to allocate for agricultural production to ensure we have enough food; where and how much space for settlements development to meet housing demand; where to encourage growth of industries to boost the economy and create jobs; and which areas should be protected for environmental sustainability.
This is to ensure the rational and sustainable use of our land and our physical resources.
The bill aims to harmonize sector-specific land use policies and institutionalize land use planning.
Enactment of local comprehensive environmental codes to cover land, water and air pollution control
LGUs play a vital role in the implementation of environmental laws. Since they are closer to their constituents, they are in a better position in ensuring the sustainability of resources. Enacting local comprehensive environmental codes will ensure ensure ecological integrity, clean, and healthy environment.
Establishment of clear coordination mechanism between National Water Resource Board, water concessionaires, and local governments on ground water monitoring and extraction permit
Establishment of clear coordination mechanisms between NWRB, water concessionaires, and LGUs on groundwater monitoring and extraction permit will ensure that groundwater sources are managed well and over-extraction will be prevented.

298 | Regional Development Plan 2017-2022

Chapter 21 Ensuring Safe, Orderly and Regular Migration | 299

300 | Regional Development Plan 2017-2022
Chapter 21 Ensuring Safe, Orderly and Regular Migration | 301
Chapter 21
Ensuring Safe, Orderly and Regular MigrationRecognizing the effects of international migration in the socio-economic growth of the CALABARZON Region, concerns in M&D were mainstreamed in the different Chapters of the RDP 2017-2022 which also reflected the cross cutting nature of migration. With the emerging and evolving concerns in international migration, a separate Chapter was prepared in the midtern updating of the Regional plan to address migration concerns comprehensively.
This Chapter disccusses the Region’s situation on international migration, initiatives developed and implmented, gaps and challenges that need to be addressed, and opportunities that can be harnessed towards ensuring a safe, orderly and regular migration. This Chapter also integrates concerns on internal or domestic migration.
Assessment and ChallengesIn 2010, the country’s deployment of OFWs including landbased and seabased reached two million. Total deployment of OFWs continued to increased reaching about 2.4 million in 2015 and 2017. Migrating to another country became a strategy to find better employment opportunities in order to have better quality of life. For the last ten years, CALABARZON was the top sending Region of OFWs. This significance spurred numerous M&D initiatives in the Region to take advantage of the opporutnities international migration brings while reducing and mitigating the social costs assosicated with it.
CALABARZON remained the top sending Region. While the proportion of OFW deployment from the Region was declining from 2016 to 2018, CALABARZON remained the top sending Region in the Philippines with an average of 19.08 percent or an average of 444,000 OFW deployment annually. Majority of the OFWs were male which was in contrast to the national data
of more female OFWs deployed annually. However, the proportion of female OFWs to total deployment in the Region increased from 2016 to 2018. Among the provinces, Cavite had the highest number of OFW deployment in 2015 followed by Batangas.
Access to government services made easier. Aside from the assistance and services provided by the national government agencies, provincial governments were tapped and capacitated to enhance government services provided to OFs. Through the Joint Migration and Development Initiative (JMDI) Phase II project, the RDC implemented the Strengthening, Upscaling, Mainstreaming, International Migration and Development Iniatiative (SUMMID) in CALABARZON that facilitated the creation of One Stop Resource Migration Center (OSMRC) in each province. These Centers provide services ranging from economic, financial and psychosocial in nature. Moreover, some LGUs in the Region had also established

302 | Regional Development Plan 2017-2022
their local OFW help desks to cater to their needs. The presence of the OSMRCs at the provincial level made government services more accessible to Ofs and their families left behind.
Further, frontline agencies established the One Stop Service Centers for OFWs (OSSCO) for migrants where all migration-related documents can be processed. Currently, there were three functional OSSCOs in the Region located in the provinces of Laguna, Batangas and Rizal.
The number of local governments hosting the BalinkBayan portal were also increasing. The localized portal serves as a platform for diaspora engagement for sharing knowledge, expertise, skills, networks, material and financial resources among OFs worldwide. Currently, the localized portal was hosted in Bacoor City, Carmona, Los Baños, Cuenca, and the provinces of Batangas and Laguna. Provincial service maps were also developed to provide easier access to information regarding available services per province. The maps include information on the the service’s focal person and their contact information for ease of coordination.
Orientation seminars strengthened. To ensure that OFs are well-informed and prepared about their work outside the country, and avoid overseas distress, orientation seminars are conducted for pre-employment and pre-departure. The pre-employment orientation seminar (PEOS) is a pre-qualification requirement for people who are considering overseas employment. On the other hand, the pre-departure orientation seminar (PDOS) prepares the OFs for settlement abroad. Country specific PDOS are provided to inform OFs about travel regulations, immigration procedures, cultural differences, settelement concerns, employment and social security concerns, and the rights and obligations of the OFs.
These orientation seminars were intensified through the conduct of pre-migration orientation seminars (PMOS). Aside from the basic information on pre-migration, it involves presentation of migration realities to brief would be OFs on what to be expected upon working overseas. Through partnership with Atikha Overseas Workers and Communities Initiative, Inc., an NGO providing economic and social services to OFs and their families, each province in CALABARZON offers PMOS for interested would be migrants.
Mainstreaming M&D in local governance intensified. Recognizing the effects of international migration at the national, Regional and local economy, convergence efforts at the local level are important to maximize the gains while reducing the social costs of migration. With the SUMMID Project, a knowledge product on mainstreaming M&D in local governance was developed. The publication was disseminated to numerous local governments in the Region. With the creation of the Provincial Committee on Migration and Development (PCMD), mainstreaming of M&D in local plans, programs and projects was highly promoted. Similar with the Regional Committee on Migration and Development (CMD), PCMDs provide a venue to discuss issues and concerns relating to internal and internal migration and address them through convergence efforts.
At the Regional level, convergence efforts and M&D initiatives were tackled through the CMD. The Committee is comprised of the frontline and relavant agencies in international and internal migration, the PCMDs, SUCs and a NGO. Collaborative efforts with NGOs and private sector were strengthened through conduct of projects and activities spearheaded by CMD. CALABARZON is the first among Regions to establish a functional CMD and cascade the creation of CMD at the provincial level.

Chapter 21 Ensuring Safe, Orderly and Regular Migration | 303
Database development remained a challenge. Availability of data is important for evidenced-based decisions and planning. Hence, initiatives have been made to develop a Regional database on international and internal migration. The Community-Based Monitoring System (CBMS) used and maintained by local governments provided an opportunity to collect data on migration. Thirteen rider questions on international migration were developed to be used during data collection for CBMS. As of April 2019, 78 LGUs adopted the CBMS and out of these 10 LGUs used the rider questionnaire on international migration.
For internal migration, a database system known as the local migration information system (LMIS) was developed to capture internal migration data up to the barangay level. As of October 2019, six LGUs in Rizal, Laguna and Cavite adopted the system.
The enactment of the CBMS Act will provide more opportunity to collect data
on international and internal migration. The Act mandates LGUs to adopt the CBMS which is beneficial in development planning and policy formulation. On the other hand, one of the challenges realized is the availability of the data for foreign nationals working in the Region to identify issues and concerns concerning them and ensure that their rights were also protected.
Investments and savings continuously promoted. The Region was active in conducting financial literacy trainings and seminars for OFs and their families including the children left behind. Importance of savings and having investments is greatly emphasized to ensure economic stability upon reintegration. Regional activity like the M&D Forum provides venue in promoting savings and investments for OFs. The implementation of the JMDI project also contributed to savings and investment generation of OFs in 2015 to 2016. Total investments and savings amounted to PhP 55 million with about 55 micro-enterprises
Table 21.1 Proportion of OFW Deployment by Region
RegionYEAR
2014 2015 2016 2017 2018
NCR 10.5 11.0 12.9 9.5 9.7
CAR 2.2 2.3 1.8 2.3 1.8
Ilocos Region 8.2 9.5 8.4 9.0 9.7
Cagayan Valley 6.7 6.0 5.3 6.8 6.5
Central Luzon 15.5 15.1 12.7 12.9 14.3
CALABARZON 17.9 17.9 21.0 20.7 17.9
MIMAROPA 2.1 1.8 1.9 1.8 1.9
Bicol Region 3.4 3.1 4.0 3.8 3.7
Western Visayas 8.6 8.7 4.9 9.5 8.9
Central Visayas 6.5 6.3 4.9 6.1 5.6
Eastern Visayas 1.1 2..6 2.1 2.1 2.2
Zamboang Peninsula 2.6 2.3 2.3 2.1 2.5
Northern Mindanao 3.4 2.8 2.6 2.5 3.5
Davao Region 2.7 3.1 3.0 3.0 3.3
SOCCKSARGEN 4.6 4.4 4.3 4.2 4.6
CARAGA 2.0 1.7 1.9 1.7 1.8
ARMM 1.8 1.5 1.9 1.9 2.1
Negros Island Region - - 4.2 - -
Source: RSET 2019
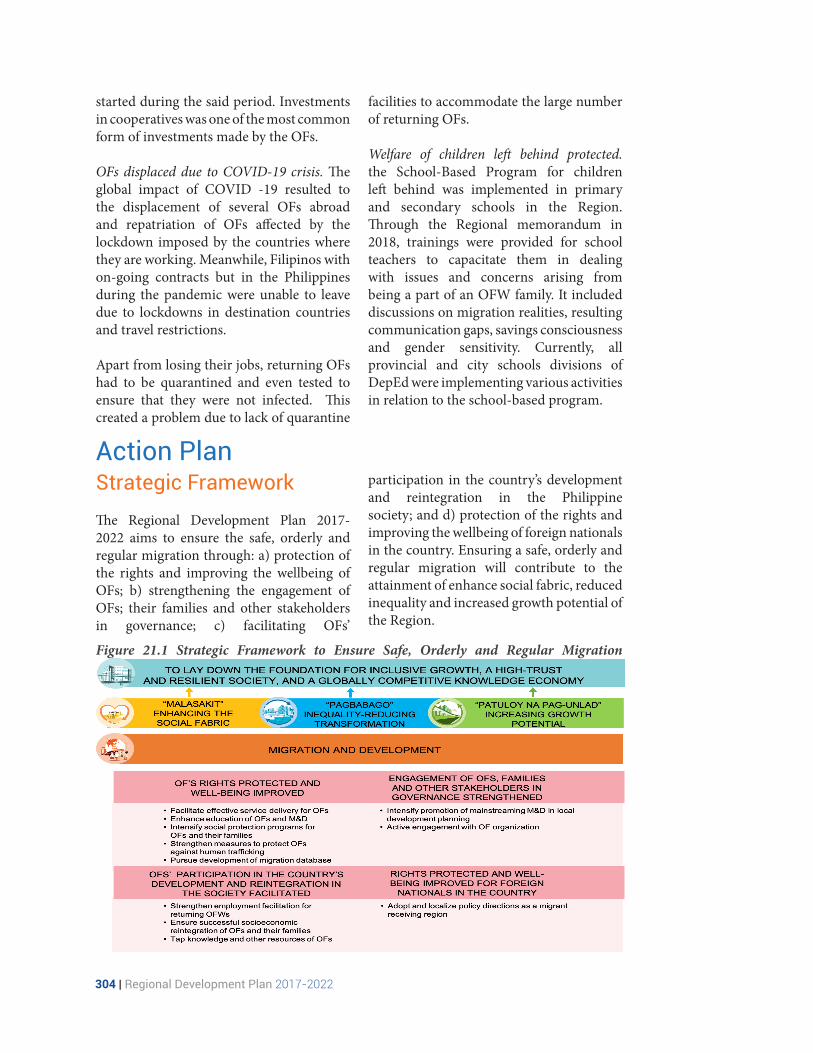
304 | Regional Development Plan 2017-2022
Action Plan
started during the said period. Investments in cooperatives was one of the most common form of investments made by the OFs.
OFs displaced due to COVID-19 crisis. The global impact of COVID -19 resulted to the displacement of several OFs abroad and repatriation of OFs affected by the lockdown imposed by the countries where they are working. Meanwhile, Filipinos with on-going contracts but in the Philippines during the pandemic were unable to leave due to lockdowns in destination countries and travel restrictions.
Apart from losing their jobs, returning OFs had to be quarantined and even tested to ensure that they were not infected. This created a problem due to lack of quarantine
facilities to accommodate the large number of returning OFs.
Welfare of children left behind protected.the School-Based Program for children left behind was implemented in primary and secondary schools in the Region. Through the Regional memorandum in 2018, trainings were provided for school teachers to capacitate them in dealing with issues and concerns arising from being a part of an OFW family. It included discussions on migration realities, resulting communication gaps, savings consciousness and gender sensitivity. Currently, all provincial and city schools divisions of DepEd were implementing various activities in relation to the school-based program.
Strategic FrameworkThe Regional Development Plan 2017-2022 aims to ensure the safe, orderly and regular migration through: a) protection of the rights and improving the wellbeing of OFs; b) strengthening the engagement of OFs; their families and other stakeholders in governance; c) facilitating OFs’
participation in the country’s development and reintegration in the Philippine society; and d) protection of the rights and improving the wellbeing of foreign nationals in the country. Ensuring a safe, orderly and regular migration will contribute to the attainment of enhance social fabric, reduced inequality and increased growth potential of the Region.
Figure 21.1 Strategic Framework to Ensure Safe, Orderly and Regular Migration
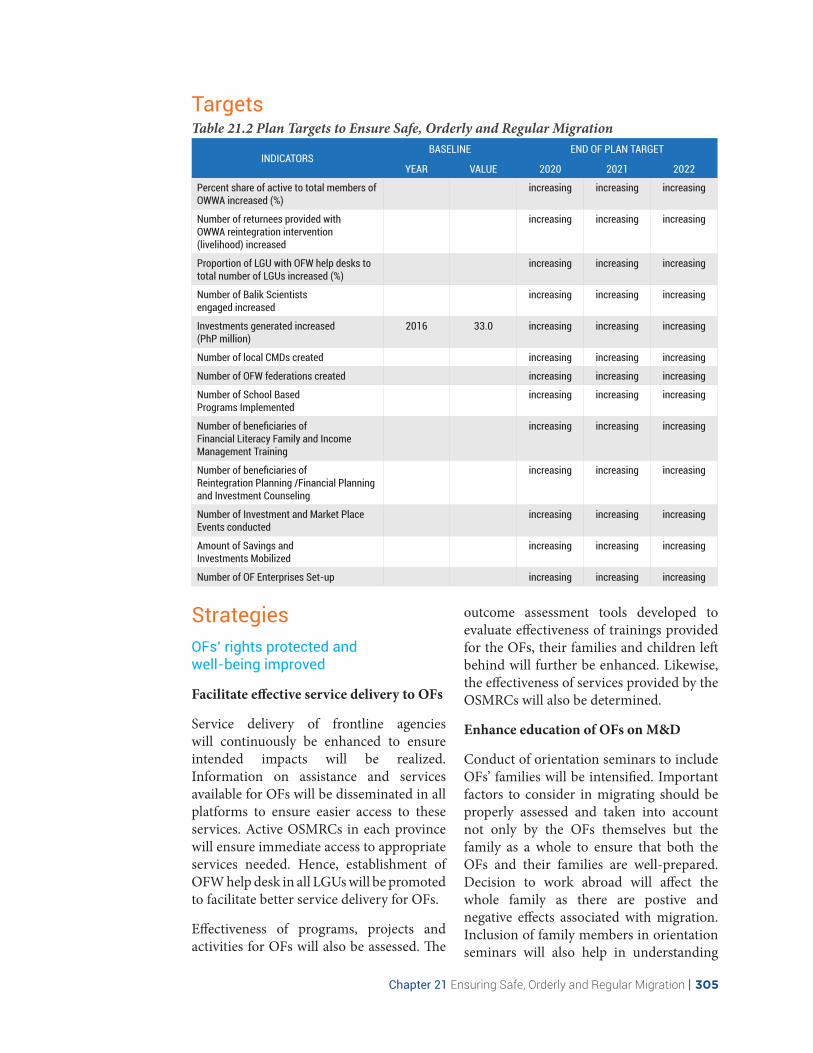
Chapter 21 Ensuring Safe, Orderly and Regular Migration | 305
Table 21.2 Plan Targets to Ensure Safe, Orderly and Regular Migration
INDICATORSBASELINE END OF PLAN TARGET
YEAR VALUE 2020 2021 2022
Percent share of active to total members of OWWA increased (%)
increasing increasing increasing
Number of returnees provided with OWWA reintegration intervention (livelihood) increased
increasing increasing increasing
Proportion of LGU with OFW help desks to total number of LGUs increased (%)
increasing increasing increasing
Number of Balik Scientists engaged increased
increasing increasing increasing
Investments generated increased (PhP million)
2016 33.0 increasing increasing increasing
Number of local CMDs created increasing increasing increasing
Number of OFW federations created increasing increasing increasing
Number of School Based Programs Implemented
increasing increasing increasing
Number of beneficiaries of Financial Literacy Family and Income Management Training
increasing increasing increasing
Number of beneficiaries of Reintegration Planning /Financial Planning and Investment Counseling
increasing increasing increasing
Number of Investment and Market Place Events conducted
increasing increasing increasing
Amount of Savings and Investments Mobilized
increasing increasing increasing
Number of OF Enterprises Set-up increasing increasing increasing
StrategiesOFs’ rights protected and well-being improved
Facilitate effective service delivery to OFs
Service delivery of frontline agencies will continuously be enhanced to ensure intended impacts will be realized. Information on assistance and services available for OFs will be disseminated in all platforms to ensure easier access to these services. Active OSMRCs in each province will ensure immediate access to appropriate services needed. Hence, establishment of OFW help desk in all LGUs will be promoted to facilitate better service delivery for OFs.
Effectiveness of programs, projects and activities for OFs will also be assessed. The
outcome assessment tools developed to evaluate effectiveness of trainings provided for the OFs, their families and children left behind will further be enhanced. Likewise, the effectiveness of services provided by the OSMRCs will also be determined.
Enhance education of OFs on M&D
Conduct of orientation seminars to include OFs’ families will be intensified. Important factors to consider in migrating should be properly assessed and taken into account not only by the OFs themselves but the family as a whole to ensure that both the OFs and their families are well-prepared. Decision to work abroad will affect the whole family as there are postive and negative effects associated with migration. Inclusion of family members in orientation seminars will also help in understanding
Targets

306 | Regional Development Plan 2017-2022
where to seek assistance in times of critical situations. The complete distribution of handbook for OFWs will be essential as an easy access reference for migrants.
Created in 2017, the CALABARZON M&D Academy will also strengthen conduct of education activities for OFs. The Academy aims to cater to the training needs of local, national and international M&D stakeholders through conduct of trainings, accommodation of visitors for study missions, benchmarking, and development of online learning modules.
Intensify social protection programs for OFs and their families
The full implementation of laws such as the Social Security Act and the Universal Healthcare Act will be ensured. The former expands coverage of mandatory SSS contributions to include all OFWs while the latter ensures the automatic coverage of OFWs in PhilHealth. However, it was recognized that collection of premium contributions remains a challenge. Hence, information campaigns on the importance of health and social security will be pursused through inclusion of these in the conduct of orientation seminars for OFs. Financial assistance to OFs affected by a global crisis should also be prioritized.
Implementation of the School-Based Program in elementary and secondary schools will also be continued to address the needs of the children left behind by OFW parents. The program aims to reduce the social costs of migration. While availability of funds was one of the challenges identified, related projects and activities will be continued through funding from other sources to ensure continued attainment of objectives
Strengthen measures to protect OFs against human trafficking
Information on human-trafficking and illegal recruitment will be updated
regularly and will be made available to all stakeholders using numerous platforms. Capacity building of LGUs is also essential to ensure proper interventions for anti-trafficking. Understanding the how, when and where to report violations even at the local level is important to reduce the incidence of human trafficking and thereby protecting the welfare of other OFs.
Database development to be pursued
The enactment of the CBMS Act provides an opportunity to collect data on international and internal migration. The current rider questions on international migration can be incorporated in the development of the standard CBMS questionnaire that the LGUs will be using. Likewise, the LMIS can also be considered to incorporate data collection on internal migrants in the CBMS. Institutionalized data collection tools at the national level can also be explored to include data generation on foreign nationals.
The availability of a comprehensive and up-to-date information is critical in development planning, policy formulation and identification of appopriate program, proejects and activities even at the local level. These data also be important to ensure protetion of the rights of foreing nationals thereby adhering to the all the commitments the country signed to such as the Global Compact for Migration (GCM).
Engagement of OFs, families, and other stakeholders in governance strengthened
Intensify promotion of mainstreaming M&D into local development planning
Mainstreaming of M&D into local development planning started at the provincial level. Starting with the creation of PCMDs; programs, projects and activitees were identified to address the needs of OFs in their localities. Activities engaging component cities and municipalities

Chapter 21 Ensuring Safe, Orderly and Regular Migration | 307
serve as one of the venues to promote the mainstreaming of M&D. Aside from mainstreaming, creation of local CMD and establishment of OFW help desks were also promoted. The development of a knowledge product on mainstreaming M&D will ensure that local governments are properly guided.
Active engagement with OF organization will be pursued
Participation of OF organizations in the Regional and local activities will be encouraged. These activities can serve as a platform to gather information on needs and concerns of OFs in the Region. Their personal experience and knowledge on migration will be beneficial to development planning and ensuring their socioeconomic welfare.
OFs’ participation in the country’s development and reintegration in the Philippine society facilitated
Strengthen employment facilitation for returning OFWs
The current enhancement of the National Skills Registration Program (NSRP) to better highlight OFs in the PhilJobNet and PESO Employment Information System will allow inclusion of work experience of OFs abroad in their profiles. The enhanced database system will also provide easier identification of OFs that can be beneficial to employers.
Ensure successful socioeconomic reintegration of OFs and their families
Successful reintegration requires not only an economic reintegration but a community reintegration as the OF need to adjust to community life. To ensure successful reintegration, interventions should start as early as the pre-departure phase through provision of financial literacy to include family members. Financial planning and goal setting should be developed with
the inclusion of the whole family. Better appreciation of the whole family of the importance of savings, investment and skills upgrading will be beneficial to the return and reintegration of OFs. Creation of invesment options and convergence programs to assist OFs and their families in business development and employment facilitation will be beneficial to attain successful reintegration.
Enhancing collaboration among Regional line agencies, local government units and civil society organizations will be pursued to effectively implement programs for returning and displaced OFs.
Retool the displaced OFs
Skills retooling, through TESDA’s Massive Open Online Courses, Mobile Training Laboratories, and other flexible or blended training arrangements needs to be promoted to improve the employability of displaced OFs. This will enable them, whether temporarily or permanently, to take courses to improve their skills for employability.
Free trainings in agriculture enterprise should be made available to encourage OFs to invest in this economic activity. Aside from trainings, technical and marketing assistance should be provided to help OFs who are interested to venture in agriculture.
Tap knowledge and other resources of OFs
Institutional linkage with Filipino professional and experts abroad can be fostered to collaborate in research and development and capacity building activities. Furthermore, the Balik Scientist Program provides an opportunity to tapped the knowledge and skills gained abroad to further enhance capabilities domestically.
The localized BalinkBayan portal also provides a platform to tap resources from OFs through engagement between OFs and local government. Donations and remittances can be used to fund social

308 | Regional Development Plan 2017-2022
Major Programs and ProjectsThe Region’s priority programs, projects, and activities to achieve the sub-sector sector outcomes in ensuring safe, orderly and regular migration will be implemented through convergence and multi-stakeholder partnership approach. The priority interventions of the Region are the following:
• e-TESDA• School-Based Program for children left
behind by OF parents
• Reintegration programs• Balik Scientists Program • Financial literacy trainings • Distribution of the Handbook for OFWs• Implementation of outcome a
ssessment tools • Full implementation of the Universal
Health Care Act and Social Security Act • Strict implementation of anti-
trafficking laws
Legislative AgendaLEGISLATIVE AGENDA RATIONALE
Amendments to the Migrant Workers and Overseas Filipinos Act (RA 10022)
This will strengthen the compliance requirements for deployment employability of host countries which will contribute to better protection of OFs.
Amendments to the Philippine Immigration Act of 1940
This will strengthen the legal and institutional framework, border control at ports of entry, and registration of foreign nationals within the country which will contribute to better monitoring of foreign nationals in the country and protection of both the foreign nationals and the locals.
Inclusion of migration indicators in the Seal of Good Local Governance (SGLG)
To ensure that mechanisms are in place and functional, inclusion of M&D indicators in the SGLG is being proposed.
CBMS Law Ensure holistic health care for all and promote health-seeking behavior of the population.
The CBMS law will encourage creation of local database and ensure collection of local data for evidenced-based decision-making and interventions. Along with this, the inclusion of international migration questions in the CBMS roll out will ensure availability of local data on migration to ensure that migration benefits are maximized and social costs are minimized.
projects at the local level. Investments generated from OFs can also contribute to local economic development by increasing economic activities.
Rights protected and wellbeing improved for foreign nationals in the country
Adopt and localize policy directions as a migrant receiving Region
Given the number of economic zones and the presence of international organizations like International Rice Research Institute
and educational facilities which cater to international students, the Region is among the top receiving Regions of foreign nationals. Hence, the Region will strive to adopt policies that will address the needs and protect the rights of foreign nationals working and studying in CALABARZON.
Chapter 13 Reaching for the Demographic Dividend | 309

310 | Regional Development Plan 2017-2022

Chapter 22 Plan Implementation and Monitoring | 311

312 | Regional Development Plan 2017-2022
Chapter 22 Plan Implementation and Monitoring | 313
Chapter 22
Plan Implementation and Monitoring Plan implementationThe CALABARZON Regional Development Council, as the highest policy and planning body in the Region, will coordinate the implementation of the remaining plan period of the RDP 2017-2022.
The plan will be implemented through PPAs in the Regional Development Investment Program (RDIP) 2017-2022. The RDIP shall be the basis for preparing the annual budget proposals of Regional line agencies (RLAs), SUCs, and government-owned and controlled corporations. Programs and projects at the provincial level will be considered in the RDIP for possible funding of RLAs.
Monitoring of inputs, outputs and outcomes will be undertaken to track the attainment of goals, objectives and targets in the updated RDP, and implementation of the RDIP. Input monitoring will be on the funding of PPAs. Once funded, output monitoring will track the actual implementation of programs and projects in the RDIP. At the highest level of monitoring, outcome monitoring will assess the achievement of sector and sub-sector outcomes set out in the plan.
Input monitoringTo ensure that programs and projects identified in the RDIP are funded for implementation, the RDC conducts an annual technical budget review and endorses the budget of RLAs, SUCs and GOCCs to the national agencies and the Department of Budget and Management since funds will be mainly sourced from the
General Appropriations Act.
Other financing sources are Official Development Assistance (ODA), funds of LGUs and public-private partnerships.
On the other hand, to monitor proposed legislations identified in the plan, NEDA through the Legislative Executive Development Advisory Council (LEDAC) will monitor the passage of laws
Output monitoring Through the Regional Project Monitoring and Evaluation System (RPMES), project monitoring will be conducted with the active involvement of various agencies, local governments and non-government organizations. The RPMES covers all development projects, inclusive of programs and projects in the RDIP as well as ODA projects, and is undertaken by LGUs, SUCs and GOCCs at the Regional, provincial, city and municipal levels.
At the Regional level, the Regional Project Monitoring Committee (RPMC) will monitor the status of project implementation through submission of project status reports containing information on the physical and financial accomplishements vis-a-vis targets. The local project monitoring committees at the provincial, city and municipal governments as well as RLAs, GOCCs and SUCs will be enjoined to carry out their monitoring functions and responsibilities. To ensure on-track implementation of programs and projects; implementation updates, issues and concerns will be tackled in the quarterly meetings of the RPMC and field
314 | Regional Development Plan 2017-2022
visits. Issues and concerns that affect several stakeholders will be subjected to problem solving session.
The RPMC will aslo conduct ex-post evaluation of completed projects to determine if the outputs are contributing to the attainment of desired outcomes. For several projects that can have greater impact to the communities and have implications for future policy and budget directions, an impact evaluation will be conducted. Best practices in project implementation will be documented to enhance design and implementation of similar projects.
In early 2019, projects covered by the CALABARZON Project Monitoring System (cPMS) were updated and expanded. The cPMS is an online system developed and conceptualized by NEDA Region IV-A, facilitates enrolment of projects, submission of up-to-date RPMES reports and identification of problems that impede project implementation.
Outcome monitoring To operationalize the Managing for Development Results strategy, plan monitoring and evaluation will focus on assessment of the achievement of outcomes in the RDP as measured by indicators and targets in the Results Matrices.
The RDC Secretariat in coordination with the RDC sectoral and special Committees that served as Planning Committees during the plan midterm updating shall conduct an annual assessment on the achievement of targets in the RDP. Table 22.1 presents the coordination mechanism under the RDC.
The RDC sectoral and special committees will ensure coordination and convergence of PPAs and will serve as a platform to discuss and resolve Regional and sector-specific issues, as well as national agenda that have Regional consequences.
The annual plan assessment will be in the form of the Regional Development Report (RDR) which will highlight the significant accomplishment and performance of PPAs implemented by RLAs, SUCs and GOCCs. It also provides development prospects that can be harnessed to optimize positive effects and opportunities to improve the performance of lagging sectors. The annual RDR also serve as guide in the technical review of budget proposals.
Implementation of support activitiesAdvocacy is necessary to increase awareness and understanding of the plan, encourage participation of the different sectors to contribute to plan implementation, facilitate unified policy direction for development priorities, and gain support from key players in Regional development.
The NEDA Region IV-A as the RDC Secretariat will lead the updated RDP advocacy. Activities include preparation and dissemination of promotinal materials, conduct of public campaigns and orientations for key development actors (e.g. Congress, local governments and RLAs), and use of social media platforms.

Chapter 22 Plan Implementation and Monitoring | 315
Table 22.1 Regional Coordination Mechanism for Plan Implementation and Monitoring RDP CHAPTER COORDINATION MECHANISM
Chapter 3: Overlay of Economic Growth, Demographic Dividend and Physical Characteristics
Regional Land Use Committe (RLUC)
Chapter 5: Ensuring People-Centered, Clean and Efficient Governance
Sectoral Committee on Macroeconomy and Development Administration (SCMDA)
Chapter 6: Pursuing Swift and Fair Administration of Justice SCMDA
Chapter 7: Promoting Philippine Culture and Values Sectoral Committee on Social Development/Social Protection (SCSD/SP)
Chapter 8: Expanding Economic Opportunities in Agriculture, Forestry and Fisheries
Sectoral Committee on Economic Development (SCED)
Chapter 9: Expanding Economic Opportunities in Industry and Services
SCED, Investment Promotion Group (IPG)
Chapter 10: Accelerating Human Capital Development SCSD
Chapter 11: Reducing Vulnerability of Individuals and Families
SCSD, Special Committees and Sub-Committees
Chapter 12: Building Safe and Secure Communities SCSD, Special Committees and Sub-Committees
Chapter 13: Reaching for Demograpghic Dividend SCSD, Special Committees and Sub-Committees
Chapter 14: Vigorously Advancing Science, Technology and Innovation
SCED
Chapter 15: Ensuring Sound Macroeconomic Policy SCMDA
Chapter 16: Regional Competitiveness Regional Competitiveness Committee (RCC)
Chapter 17: Attaining Just and Lasting Peace SCMDA
Chapter 18: Ensuring Security, Public Order and Safety SCMDA
Chapter 19: Accelerating Infrastructure Development Sectoral Committee on Infrastructure Development (SCID)
Chapter 20: Ensuring Ecological Integrity, Clean and Healthy Environment
SCED, RLUC
Chapter 21: Ensuring Safe, Orderly and Regular Migration SCSD, Special Committees and Sub-Committees

316 | Regional Development Plan 2017-2022

Regional Development Plan 2017-2022 | 317
List of Acronyms
4Ps Pantawid Pamilyang Pilipino Program ADR Alternative Dispute Resolution AFF Agriculture, Fisheries and Forestry AFP Armed Forces of the Philippines AIEZ Agro-Industrial Economic Zones ALS Alternative Learning System ARBs Agrarian Reform Beneficiaries ARCs Agrarian Reform Communities ARG Automatic Rain Gauge ASPIRE-CBFM Agroforestry Support Program for Enhancing Resiliency
of Community-Based Forest Management ATN Assistance-to-Nationals AY Academic Year BADACs Barangay Anti-Drug Abuse Councils BALAI Building Adequate, Livable, Affordable and Inclusive BatStateU Batangas State University BCP Business Continuity Plans BHS Barangay Health Stations BJMP Bureau of Jail Management and Penology BOSS Business One-Stop Shop BPLS Business Permit and Licensing System BPLS Business Permit Licensing System CAA CAFGU Active Auxiliary CADT Certificates of Ancestral Domain Title CALAEX Cavite-Laguna Expressway CAMP COVID-19 Adjustment Measures Program CARP Comprehensive Agrarian Reform Program CAVITEX Cavite Expressway CBMS Community-Based Monitoring System CBPs Community-Based Projects CCA Climate Change Adaptation CCW Center, Corridors, and Wedges CDA Cooperative Development Authority CDPs Comprehensive Development Plans CEST Community Empowerment through Science
and Technology CHERM Center for Hazard and Environmental Resource Mapping CLEM Century Learning Environment Model CMCI Cities and Municipalities Competitiveness Index CMD Committee on Migration and Development

318 Regional Development Plan 2017-2022
CNTs Communist Party of the Philippines - New People’s Army Terrorists
CORe Communication, Ongoing projects, Research cPMS CALABARZON Project Monitoring System CPP Communist Party of the Philippines CSOs Civil Society Organizations CSPP Conflict-Sensitive and Peace Promoting CvSU Cavite State University DA Department of Agriculture DAR Department of Agrarian Reform DARIUS Data Analytics-Ready Info Unified System DENR Department of Environment and Natural Resources DEWS Deployment of Early Warning Systems DFA Department of Foreign Affairs DHSUD Department of Human Settlements and Urban Development DICT Department of Information, Communication,
and Technology DILG Department of Interior and Local Government DOH Department of Health DOJ-PPA DOJ-Parole and Probation Administration DOST Department of Science and Technology DOST-SEI DOST-Science Education Institute DOT Department of Tourism DRRM Disaster Risk Reduction Management DTI Department of Trade and Industry E-CLIP Enhanced Comprehensive Local Integration Program ECOP Employers Confederation of the Philippines ECQ Enhanced Community Quarantine ELA Executive-Legislative Agenda ENGP Enhanced National Greening Program ENIPAS Expanded NIPAS EODB Ease of Doing Business EST Environmentally Sustainable Transport EXPLORE Exchange of Probes, Learnings and Outputs of Researches FASSSTER Feasibility Analysis of Syndromic Surveillance Using a
Spatio-Temporal Epidemiological Modeler for Early Detection of Diseases
FICs Food Innovation Centers FIRe Fourth Industrial Revolution GCI Global Competitiveness Index GCM Global Compact for Migration GDH Gifts, Decors, and Handicrafts GIA-CBP Grants-In-Aid-Community Based Projects GIDAs Geographically Isolated and Disadvantaged Areas GIP Government Internship Program

Regional Development Plan 2017-2022 | 319
GOCCs Government-Owned and Controlled Corporations GRDP Gross Regional Domestic Product GTCA Good Conduct Time Allowance GVA Gross Value Added HEMIS Higher Education Management Information System HFEP Health Facilities Enhancement Program HRH Human Resources for Health I&S Industry and Services i3S Inclusive Innovation Industrial Strategy ICS Incident Command System ICT4ALS ICT for Alternative Learning System IDD Innovation, Design and Development IDPs Internally Displaced Population IEC Information, Education and Communication IKSP Indigenous Knowledge System and Practices IPR Intellectual Property Rights IPs Indigenous Peoples IPSOs Intellectual Property Satellite Offices IRA Internal Revenue Allotment ISIP Innovation for Social Impact Partnership IT-BPM Information Technology and Business
Processing Management ITSOs Innovation and the Technology Support Offices JMDI Joint Migration and Development Initiative KALAHI-CIDSS Kapit-Bisig Laban sa Kahirapan-Comprehensive and
Integrated Delivery of Social Services KALAHI-NCDDP Kapit-Bisig Laban sa Kahirapan - National Community-
Driven Development Program KASAMA Kabuhayan para sa Magulang ng Batang Mangagawa LAMS Land Administration And Management System LCAC Local Culture and Arts Councils LEAs Law Enforcement Agencies LEDAC Legislative Executive Development Advisory Council LGUs Local Government Units LMIS Local Migration Information System LSDF Luzon Spatial Development Framework LSPU Laguna State Polytechnic University M&D Migration and Development MCX Muntinlupa-Cavite Expressway MDR maternal death review MMR maternal mortality ratio MRFs materials recovery facilities MSEZ Manufacturing Special Economic Zones MSFF Marginalized, Small Farmers and Fishers MSMEs Micro, Small, and Medium Enterprises

320 Regional Development Plan 2017-2022
MTP Medical Tourism Park NaLUA National Land Use Act NBB No Balance Billing NCCA National Commission on Culture and Arts NCIP National Commission on Indigenous Peoples NCP National Competition Policy NCWSP New Centennial Water Source Project NGA National Government Agency NHA National Housing Authority NICER Niche Centers in the Regions for R&D NINA Nutritional Initial Needs Assessment NIPAS National Integrated Protected Areas System NIPS National Intellectual Property Strategy NIRC National Internal Revenue Cod NOAH Nationwide Operational Assessment of Hazards NPA New People’s Army NSP National Shelter Program NSRP National Skills Registration Program NSS National Spatial Strategy NSSMP National Sewerage and Septage Management Program NTESDP National Technical Education and Skills Development Plan NTF-ELCAC National Task Force to End Local Communist
Armed Conflict NUDHF National Urban Development and Housing Framework ODA Official Development Assistance OFWs Overseas Filipino Workers OSMRC One-Stop Migration Resource Center OSSCO One Stop Service Centers for OFWs OTOP One Town One Product P/Ps programs and projects PAO Public Attorney’s Office PBG Pangkabuhayan sa PagBangon at Ginhawa PCA Philippine Competition Act PCIC Philippine Crop Insurance Corporation PCMD Provincial Committee on Migration and Development PCs Planning Committees PDEA Philippine Drug Enforcement Agency PDL Persons Deprived of Liberty PDOS Pre-Departure Orientation Seminar PDPFP Provincial Development and Physical Framework Plan PEOS Pre-Employment Orientation Seminar PESO Public Employment Service Office PEZA Philippine Economic Zone Authority PFM Public Financial Management PHFDP Philippine Health Facilities Development Plan
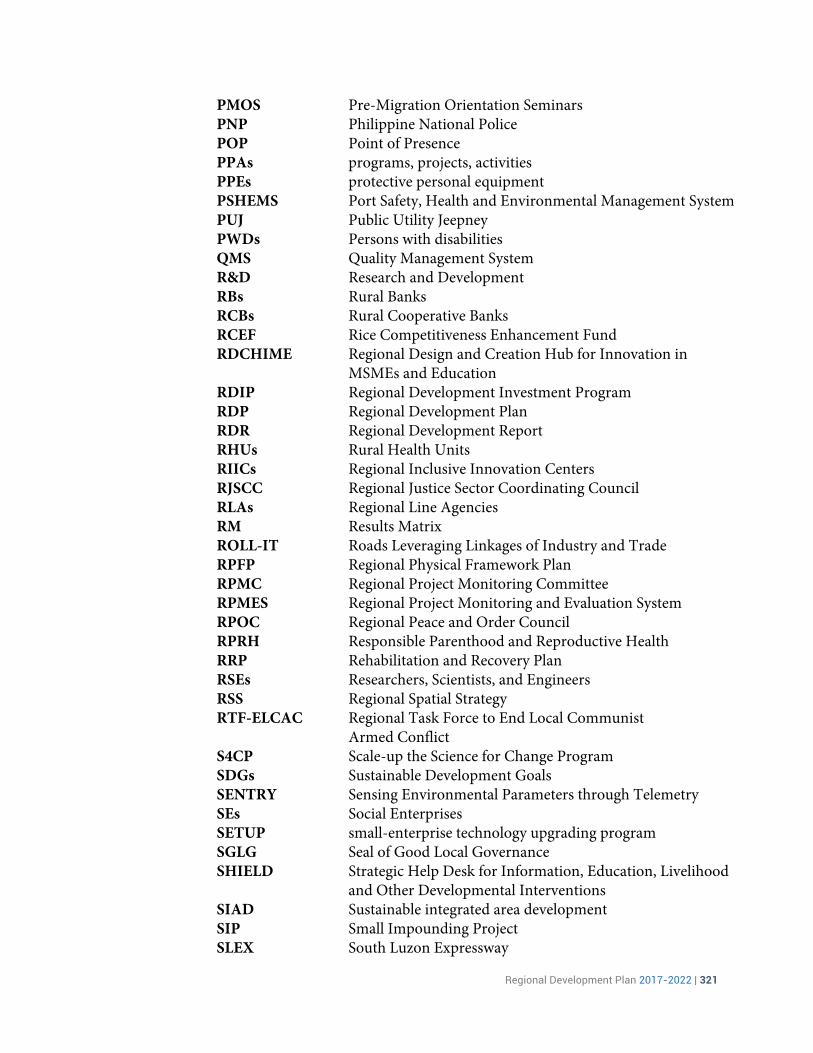
Regional Development Plan 2017-2022 | 321
PMOS Pre-Migration Orientation Seminars PNP Philippine National Police POP Point of Presence PPAs programs, projects, activities PPEs protective personal equipment PSHEMS Port Safety, Health and Environmental Management System PUJ Public Utility Jeepney PWDs Persons with disabilities QMS Quality Management System R&D Research and Development RBs Rural Banks RCBs Rural Cooperative Banks RCEF Rice Competitiveness Enhancement Fund RDCHIME Regional Design and Creation Hub for Innovation in
MSMEs and Education RDIP Regional Development Investment Program RDP Regional Development Plan RDR Regional Development Report RHUs Rural Health Units RIICs Regional Inclusive Innovation Centers RJSCC Regional Justice Sector Coordinating Council RLAs Regional Line Agencies RM Results Matrix ROLL-IT Roads Leveraging Linkages of Industry and Trade RPFP Regional Physical Framework Plan RPMC Regional Project Monitoring Committee RPMES Regional Project Monitoring and Evaluation System RPOC Regional Peace and Order Council RPRH Responsible Parenthood and Reproductive Health RRP Rehabilitation and Recovery Plan RSEs Researchers, Scientists, and Engineers RSS Regional Spatial Strategy RTF-ELCAC Regional Task Force to End Local Communist
Armed Conflict S4CP Scale-up the Science for Change Program SDGs Sustainable Development Goals SENTRY Sensing Environmental Parameters through Telemetry SEs Social Enterprises SETUP small-enterprise technology upgrading program SGLG Seal of Good Local Governance SHIELD Strategic Help Desk for Information, Education, Livelihood
and Other Developmental Interventions SIAD Sustainable integrated area development SIP Small Impounding Project SLEX South Luzon Expressway

322 Regional Development Plan 2017-2022
SLFs Sanitary Landfills SLT Schools of Living Tradition SMERA SME Roving Academy SPES Special Program for Employment of Students SSF Shared Service Facilities STAR Science Teacher Academy for the Regions STARBOOKS Science & Technology Academic and Research-Based
Openly Operated Kiosk Stations STEM Science, Technology, Engineering, and Mathematics STI Science, Technology, and Innovation STRPC Southern Tagalog Regional Party Committee SUCs State Universities and Colleges SUMMID Strengthening, Upscaling, Mainstreaming, International
Migration and Development SURE Survival and Recovery TECHNICOM Technology Innovation for Commercialization TES Tertiary Education Subsidy TESDA Technical Education and Skills Development Authority TEZ Tourism Economic Zones TFR Total Fertility Rate TIKME Teknolohiya at Inobasyon, Kaagapay ng Micro Enterprises TR4 Toll Road 4 TRAIN Tax Reform for Acceleration and Inclusion Act TRIP Three-Year Rolling Infrastructure Program TSBs Thrift and Savings Banks TSD Treatment, Storage, and Disposal TSS Total Suspended Solids TVPL Taal Volcano Protected Landscape TWG-AFP Inter-agency Task Force Technical Working Group For
Anticipatory and Forward Planning U5MR Under-Five Mortality Rate UCBs Universal/Commercial Banks UHC Universal Health Care UNDP United Nations Development Programme UPLB University of the Philippines Los Baños WINS Water, Sanitation and Hygiene in Schools WQMA water quality management areas YB:CMSP Yakap Bayan: Community Mobilization and
Support Program
Regional Development Plan 2017-2022 | 323
RDP 2017-2022 Planning Committees PLANNING COMMITTEE ON MACROECONOMY AND DEVELOPMENT ADMINISTRATION AFP-Southern Luzon Command (AFP SOLCOM) Bureau of Jail Management Penology (BJMP) IV-A Bureau of Local Government and Finance (BLGF) IV-A Bangko Sentral ng Pilipinas (BSP) IV-A Commission on Human Rights (CHR) IV-A Commission on Audit (COA) IV-A Civil Service Commission (CSC) IV-A Department of Budget and Management (DBM) IV-A Department of Health (DOH) IV-A Department of Interior and Local Government (DILG) IV-A Department of Labor and Employment (DOLE) IV-A Department of Trade and Industry (DTI) IV-A National Economic and Development Authority (NEDA) IV-A National Intelligence Coordinating Agency (NICA) IV-A Office of the Civil Defense (OCD) IV-A Office of the President-Presidential Management Staff (PMS) Public Attorneys Office (PAO) Philippine Drug Enforcement Agency (PDEA) IV-A Philippine Information Agency (PIA) IV-A Philippine National Police (PNP) IV-A Philippine Statistics Authority (PSA) IV-A Batangas Provincial Planning and Development Office (Batangas-PPDO) Cavite Provincial Planning and Development Office (Cavite-PPDO) Laguna Provincial Planning and Development Office (Laguna-PPDO) Rizal Provincial Planning and Development Office (Rizal-PPDO) Quezon Provincial Planning and Development Office (Quezon-PPDO) ATIKHA Overseas Workers and Communities Initiative, Inc. Philippine Chamber of Commerce and Industry Philippine Metal Association National Council of Women in the Philippines

324 Regional Development Plan 2017-2022
PLANNING COMMITTEE ON ECONOMIC DEVELOPMENT Bureau of Fisheries and Aquatic Resources (BFAR) Cooperative Development Authority (CDA) IV-A Department of Agriculture (DA) IV-A Department of Agrarian Reform (DAR) IV-A Department of Bank of the Philippines (DBP) Southern Tagalog Department of Education (DepEd) IV-A Department of Environment and Natural Resources (DENR) IV-A DENR-Environmental Management Bureau (EMB) IV-A DENR-Mines and Geosciences Bureau (MGB) IV-A Department of Interior and Local Government (DILG) IV-A Department of Labor and Employment (DOLE) IV-A Department of Science and Technology (DOST) IV-A Department of Tourism (DOT) IV-A Department of Public Works and Highways (DPWH) IV-A Department of Trade and Industry (DTI) IV-A Landbank of the Philippines (LBP) South Luzon Lending Group Laguna Lake Development Authority (LLDA) National Economic and Development Authority (NEDA) IV-A National Food Authority (NFA) IV-A National Irrigation Administration (NIA) IV-A Philippine Coconut Authority (PCA) IV-A Philippine Economic Zone Authority (PEZA) Philippine Fiber Industry Development Authority (PhilFIDA) Technical Education and Skills Development Authority (TESDA) IV-A Philippine Industrial Estate Association Inc. (PHILEA) Philippine Statistics Authority (PSA) IV-A Sorosoro Ibaba Development Cooperative (SIDC) Seven Squares Advocacy Cooperative Cavite Metro Multipurpose Cooperative
PLANNING COMMITTEE ON SOCIAL DEVELOPMENT Batangas State University (BatStateU) Cavite State University (CvSU) Commission on Higher Education (CHED) IV-A Commission on Population (POPCOM) IV-A Department of Agriculture (DA) IV-A

Regional Development Plan 2017-2022 | 325
Department of Agrarian Reform (DAR) IV-A Department of Education (DepEd) IV-A Department of Health (DOH) IV-A Department of Interior and Local Government (DILG) IV-A Department of Labor and Employment (DOLE) IV-A Department of Social Work and Development (DSWD) IV-A Department of Human Settlements and Urban Development (DHSUD) IV-A Home Development Mutual Fund (PAG-IBIG) Government Service Insurance System (GSIS) Laguna State Polytechnic University (LSPU) National Commission on Indigenous Peoples (NCIP) IV-A National Economic and Development Authority (NEDA) IV-A National Nutrition Council (NNC) IV-A National Youth Commission (NYC) Luzon Cluster 1 Philippine Commission for the Urban Poor (PCUP) Parole and Probation Administration-Department of Justice (PPA-DOJ) IV-A Philippine Health Insurance Corporation (PhilHealth) Social Security Services (SSS) Southern Luzon State University (SLSU) Technical Education and Skills Authority (TESDA) IV-A University of the Philippines Los Baños (UPLB) University of Rizal System (URS) Batangas Provincial Planning and Development Office (Batangas-PPDO) Cavite Provincial Planning and Development Office (Cavite-PPDO) Laguna Provincial Planning and Development Office (Laguna-PPDO) Rizal Provincial Planning and Development Office (Rizal-PPDO) Quezon Provincial Planning and Development Office (Quezon-PPDO) Association of Local Colleges and Universities National Council of Women of the Philippines PATAMABA-Workers in the Informal Sector Enterprise (WISE) Sinag Kalinga Foundation Teach for the Philippines, Inc.
PLANNING COMMITTEE ON INFRASTRUCTURE DEVELOPMENT DENR-Environment and Management Bureau (EMB) IV-A Department of Information and Communications Technology (DICT) Cluster 2 DOE-Energy Policy and Planning Bureau (EPPB) Department of Tourism (DOT) IV-A Department of Public Works and Highways (DPWH) IV-A Department of Human Settlements and Urban Development (DHSUD) IV-A Land Transportation Office (LTO) Region IV-A

326 Regional Development Plan 2017-2022
Land Transportation Regulatory Franchising Board (LTFRB) IV-A Maritime Industry Authority (MARINA) National Economic and Development Authority (NEDA) IV-A National Irrigation Agency (NIA) IV-A Philippine National Railway (PNR) Philippine Ports Authority -Port Management Office Batangas (PPA-PMO Batangas) Philippine Ports Authority-Port Management Office Marinduque and Quezon (PPA-PMO) MarQuez Philippine Institute of Civil Engineers (PICE)-Batangas Chapter Cavite Technical and Vocational Educators, Inc.
PLANNING COMMITTEE ON REGIONAL LAND USE Department of Agriculture (DA) IV-A Department of Agrarian Reform (DAR) IV-A Department of Energy (DOE) Department of Environment and Natural Resources (DENR) IV-A DENR-Environment and Management Bureau (EMB) IV-A DENR-Mines and Geosciences Bureau (MGB) IV-A Department of Interior and Local Government (DILG) IV-A Department of Public Works and Highways (DPWH) IV-A Department of Human Settlements and Urban Development (DHSUD) IV-A Department of Justice (DOJ) IV-A Department of Tourism (DOT) IV-A Department of Science and Technology (DOST) IV-A Department of Trade and Industry (DTI) IV-A Laguna Lake Development Authority (LLDA) National Commission on Indigenous Peoples (NCIP) IV-A National Economic and Development Authority (NEDA) IV-A Office of the Civil Defense (OCD) IV-A UPLB-College of Human Ecology (UPLB-CHE) Regional League of Local Development Planning Coordinators, Inc. Batangas Provincial Planning and Development Office (Batangas-PPDO) Cavite Provincial Planning and Development Office (Cavite-PPDO) Laguna Provincial Planning and Development Office (Laguna-PPDO) Rizal Provincial Planning and Development Office (Rizal-PPDO) Quezon Provincial Planning and Development Office (Quezon-PPDO) Ayala Land Philippine Industrial Estate Association Inc. (PHILEA) Philippine Institute of Civil Engineers (PICE)-Batangas Chapter