nanosistemas para el tratamiento de la diabetes mellitus por ...
Upload
independentCategory
view
5download
0
ORIGINAL INVESTIGATION
Systematic identification of interaction effects betweengenome- and environment-wide associations in type 2 diabetesmellitus
Chirag J. Patel • Rong Chen • Keiichi Kodama •
John P. A. Ioannidis • Atul J. Butte
Received: 6 September 2012 / Accepted: 10 December 2012 / Published online: 20 January 2013
� The Author(s) 2013. This article is published with open access at Springerlink.com
Abstract Diseases such as type 2 diabetes (T2D) result
from environmental and genetic factors, and risk varies
considerably in the population. T2D-related genetic loci
discovered to date explain only a small portion of the T2D
heritability. Some heritability may be due to gene–environ-
ment interactions. However, documenting these interactions
has been difficult due to low availability of concurrent genetic
and environmental measures, selection bias, and challenges
in controlling for multiple hypothesis testing. Through gen-
ome-wide association studies (GWAS), investigators have
identified over 90 single nucleotide polymorphisms (SNPs)
associated to T2D. Using a method analogous to GWAS
[environment-wide association study (EWAS)], we found five
environmental factors associated with the disease. By focus-
ing on risk factors that emerge from GWAS and EWAS, it is
possible to overcome difficulties in uncovering gene–envi-
ronment interactions. Using data from the National Health and
Nutrition Examination Survey (NHANES), we screened
18 SNPs and 5 serum-based environmental factors for
interaction in association to T2D. We controlled for
multiple hypotheses using false discovery rate (FDR)
and Bonferroni correction and found four interactions
with FDR \20 %. The interaction between rs13266634
(SLC30A8) and trans-b-carotene withstood Bonferroni
correction (corrected p = 0.006, FDR \1.5 %). The
per-risk-allele effect sizes in subjects with low levels of
trans-b-carotene were 40 % greater than the marginal
effect size [odds ratio (OR) 1.8, 95 % CI 1.3–2.6]. We
hypothesize that impaired function driven by rs13266634
increases T2D risk when combined with serum levels of
nutrients. Unbiased consideration of environmental and
genetic factors may help identify larger and more relevant
effect sizes for disease associations.
Abbreviations
T2D Type 2 diabetes mellitus
GWAS Genome-wide association study
EWAS Environment-wide association study
GWS Genome-wide significance
NHANES National Health and Nutrition Examination
Survey
FDR False discovery rate
OR Odds ratio
SNP Single nucleotide polymorphism
BMI Body mass index
FBG Fasting blood glucose
T1D Type 1 diabetes
CEU HapMap population of European ancestry
living in Utah
MEX HapMap population of Mexican ancestry from
Los Angeles
ASW HapMap population of African ancestry from
Southwestern United States
NCHS National Centers for Health Statistics
Electronic supplementary material The online version of thisarticle (doi:10.1007/s00439-012-1258-z) contains supplementarymaterial, which is available to authorized users.
C. J. Patel � R. Chen � K. Kodama � A. J. Butte (&)
Division of Systems Medicine, Department of Pediatrics,
Stanford University School of Medicine, 1265 Welch Road,
Room X-163 MS-5415, Stanford, CA 94305, USA
e-mail: [email protected]
C. J. Patel � R. Chen � K. Kodama � A. J. Butte
Lucile Packard Children’s Hospital, Palo Alto, CA 94304, USA
J. P. A. Ioannidis
Stanford Prevention Research Center, Department of Medicine,
and Department of Health Research and Policy, Stanford
University School of Medicine, Stanford, CA 94305, USA
123
Hum Genet (2013) 132:495–508
DOI 10.1007/s00439-012-1258-z

RDC Research Data Center
HWE Hardy–Weinberg equilibrium
Introduction
Complex diseases like type 2 diabetes (T2D) have multi-
factorial etiologies, with genetic and environmental factors
playing roles (Schwartz and Collins 2007). Genome-wide
association studies (GWAS) have identified many common
single nucleotide polymorphisms (SNPs) associated with
disease (Hindorff et al. 2009b; Visscher et al. 2012). How-
ever, individual SNPs confer modest risks, and cumula-
tively, they account for only a limited portion of missing
heritability (Manolio et al. 2009), and they have little
prognostic utility (Meigs et al. 2008). Furthermore, it has
been reported that the availability of entire genomes may
not be clinically informative (Roberts et al. 2012). As a
result, many models have been proposed or re-introduced
to describe the genetic basis of complex disease (Gibson
2011; McClellan and King 2010).
Gene–environment interactions have been an important
concept in evolutionary biology. For example, gene–envi-
ronment interactions result in phenotypic plasticity, where
a given genotype produces different phenotypes in
response to different environmental conditions. The spec-
trum of possible phenotypes, such as variation in disease
risk, is known as the ‘‘reaction norm’’ (Pigliucci 2001).
Thus, interactions may account for some of unexplained
disease risk and/or improve our understanding of genetic
basis of risk. In human disease epidemiology, gene–envi-
ronment interactions describe the effect size of the com-
bination of genetic and environmental factors as different
than the effects of each factor alone (Hunter 2005; Thomas
2010). In the following, we consider this type of statistical
gene–environment interaction.
Statistical interaction may offer hints about biological
interaction, where genetic and environmental factors
jointly determine physiological effects on a molecular or
cellular level (Wang et al. 2010). Biological interactions
may be informative of disease etiology. For example,
genetic risk for bladder cancer associated with variants of
the NAT2 gene, a gene that plays a possible role in
metabolism of tobacco smoke constituents, is known to be
larger when considering smoking status of individuals
(Rothman et al. 2010). Thus, identification of robust sta-
tistical/epidemiological interactions can be seen as a first
step toward creation of hypotheses relevant to disease
pathophysiology.
We have created a method called environment-wide
association study (EWAS). EWAS finds environmental
factors associated with disease (Patel et al. 2010, 2012b;
Tzoulaki et al. 2012). EWAS is analogous to GWAS in
which it evaluates multiple environmental factors and has
proper adjustment for the multiplicity of comparisons. The
associations that emerge are validated across different
datasets. In sum, EWAS is a way to unify differences
between genetic and environmental association studies and
to accelerate our knowledge regarding potential environ-
mental influences on health and disease (Ioannidis et al.
2009).
Most studies in this area examine genetic or environ-
mental factors. However, it is still rare for both types of
factors to be measured in human tissue concurrently. A key
challenge involves choosing which factors to examine.
Analyzing all of them is not possible with current tech-
nology (Thomas 2010), and factors are often selected for
convenience, without sufficient documentation of the
strength of their marginal associations. Given the com-
plexity of gene–environment interaction analyses, there
may be problems with selective analyses and selective
reporting of results in a fragmented and possibly biased
fashion (Ioannidis 2005). For example, many studies do not
account for all the interaction effects that they explore.
Thus, there is a need to select common SNPs and exposures
and systematically screen their interactions to avoid spu-
rious results (Khoury and Wacholder 2009; Patel et al.
2012a).
Here, we used a data-driven and systematic approach for
selecting gene–environment interactions associated with a
common disease such as T2D. Our specific goal was to test
NHANES data (Centers for Disease Control and Preven-
tion (CDC) 2009) for interactions between robust factors
found in GWAS and EWAS. NHANES includes 261
genotyped loci, 266 environmental factors measured in
blood and urine, and clinical measures for the same indi-
viduals. We focused on the top GWAS and EWAS hits,
and systematically investigated SNP–environment interac-
tions associated with T2D. Top GWAS hits were defined as
SNPs that had been associated with T2D in at least one
study. Top EWAS hits had robust associations and low
false discovery rates (FDRs) in multiple cohorts. In our
statistical specification of interactions, we modeled disease
risk due to the combination of genotypic and environ-
mental factors as different than the sum of the risks of each
factor alone (Khoury et al. 1988; Thomas 2010).
A source of major debate for the etiology of T2D is the
thrifty genotype hypothesis, in which thrifty genes pro-
vided advantages to human populations during the hunter–
gatherer era (Diamond 2003; Neel 1962; Zimmet et al.
2001). People with the thrifty genotype stored food energy
efficiently during times of feast, making more available to
them during times of famine (Neel 1962; Zimmet et al.
2001). Thus, in modern societies, thrifty genotypes may
496 Hum Genet (2013) 132:495–508
123

have become risk genotypes. However, evidence to support
this hypothesis is lacking, and competing hypotheses have
emerged. A data-driven study of interactions between
SNPs and common environmental exposures may shed
light on this debate and to bring to fore its clinical
implications.
Materials and methods
Data and selected genetic and environmental factors
Data came from National Health and Nutrition Examina-
tion Survey (NHANES) (Centers for Disease Control and
Prevention (CDC) 2009). All SNPs available had been
chosen a priori by independent researchers investigating
other topics (Matise et al. 2011). These SNPs were assayed
in two NHANES: 1999–2000 and 2001–2002. Genotypes
were not collected in 2003–2004 and 2005–2006 and have
yet to be released for 2007–2008. Of these, we used 18
SNPs with documented near-GWS associations in T2D (for
examples and references, see Table S1). We computed
allele frequencies of each SNP stratified on race to confirm
their presence. For quality control, we estimated deviation
from Hardy–Weinberg equilibrium (HWE) for each SNP
by race. In NHANES, ethnicity was coded in five groups
(Mexican-American, non-Hispanic black, non-Hispanic
white, other Hispanic, other).
We previously used NHANES data from 1999–2000,
2001–2002, 2003–2004, and 2005–2006 to screen 266
environmental factors measured in blood or urine (Patel
et al. 2010). We identified and tentatively validated five
environmental factors associated with T2D: trans-b-caro-
tene, cis-b-carotene, c-tocopherol, heptachlor epoxide, and
PCB170. The FDR for each association was \10 % in at
least 2 independent surveys. Trans- and cis-b-carotenes
were measured in the 2001–2002, 2003–2004, and
2005–2006 surveys and had a significance threshold under
FDR 10 % for all 3 surveys. c-Tocopherol was measured in
all four surveys. Its FDR was\10 % in 1999–2000, 2003–
2004, and 2005–2006 and\20 % in the 2001–2002 survey.
Heptachlor epoxide was measured in the 1999–2000,
2001–2002, and 2003–2004 surveys. Its FDR was\10 % in
the 1999–2000 and 2003–2004 surveys. PCB170 was
measured in the 1999–2000, 2001–2002, and 2003–2004
surveys and its FDR was \10 % in the 1999–2000 and
2003–2004 surveys. In the current investigation, we ana-
lyzed the 1999–2000 and 2001–2002 surveys.
T2D was defined in survey participants having 8.5-h
fasting blood glucose (FBG) values C126 mg/dL, as
advised by the American Diabetes Association. We
acknowledge neither FBG nor the self-reported diabetes
status distinguishes between Type 1 diabetes (T1D) and
T2D, but given that T2D accounts for over 95 % of all
diabetes cases, we assume most of our cases are T2D. To
increase study power, we combined data from the
1999–2000 and 2001–2002 surveys. Depending on the
genetic and environmental variables tested, there were
841–2,655 controls and 81–274 case subjects.
Each SNP was coded for the number of risk alleles as
designated in the publications citing it (Chen et al. 2010).
Environmental factors were continuous and followed a
long-tailed distribution; thus, they were log-transformed
and standardized (expressed in standard deviation units)
(Patel et al. 2010).
We compared age, BMI, sex distribution, and race in
T2D subjects and controls. Risk alleles of SNPs from the
literature were found and their frequencies in NHANES
subjects were computed by race. We computed baseline
levels of environmental factors in both groups. We asses-
sed the marginal effect between SNPs or environmental
factors on T2D with survey-weighted logistic regression,
adjusting for race, age, sex, and BMI. We also assessed
marginal effects stratified by race.
Baseline characteristics for each subsample
We defined a subsample as a group of survey participants
available for each interaction test. SNPs and environmental
factors were not assayed equally among subjects, so each
subsample contained a different number of participants.
We computed baseline characteristics for each sub-
sample to assess overall differences between them. First,
we computed risk allele frequency stratified by race in the
HapMap as follows: CEU (Americans of European decent
living in Utah), ASW (Americans of African ancestry liv-
ing in the Southwest), and MEX (Americans of Mexican
ancestry living in Southern California) (Frazer et al. 2007).
We ascertained whether SNPs might be correlated with
serum levels of environmental factors. We evaluated the
correlation between genetic and environmental factors
through survey-weighted linear regression, regressing log
base 10 of the environmental exposure variable on each
genetic variable, adjusted for race, sex, age, and BMI.
Systematic interaction screen between SNPs
and environmental factors
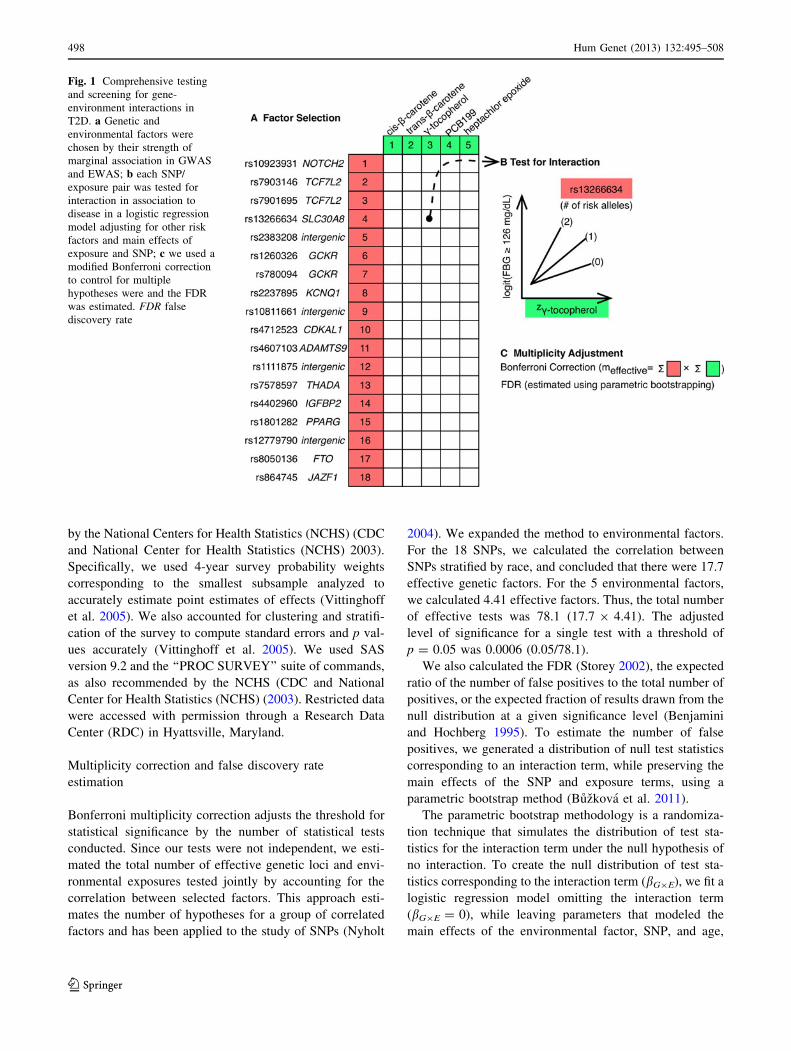
Next, we screened the 90 possible pairs for interaction (18
genetic loci times 5 environmental factors; Fig. 1a, b). We
utilized survey logistic regression to associate each pair of
factors to T2D, incorporating a multiplicative interaction
term and main effects of both factors. Each model was
adjusted by age, sex, race, and BMI.
NHANES is a complex multi-staged survey and we
accounted for its sampling methodologies as recommended
Hum Genet (2013) 132:495–508 497
123
by the National Centers for Health Statistics (NCHS) (CDC
and National Center for Health Statistics (NCHS) 2003).
Specifically, we used 4-year survey probability weights
corresponding to the smallest subsample analyzed to
accurately estimate point estimates of effects (Vittinghoff
et al. 2005). We also accounted for clustering and stratifi-
cation of the survey to compute standard errors and p val-
ues accurately (Vittinghoff et al. 2005). We used SAS
version 9.2 and the ‘‘PROC SURVEY’’ suite of commands,
as also recommended by the NCHS (CDC and National
Center for Health Statistics (NCHS) (2003). Restricted data
were accessed with permission through a Research Data
Center (RDC) in Hyattsville, Maryland.
Multiplicity correction and false discovery rate
estimation
Bonferroni multiplicity correction adjusts the threshold for
statistical significance by the number of statistical tests
conducted. Since our tests were not independent, we esti-
mated the total number of effective genetic loci and envi-
ronmental exposures tested jointly by accounting for the
correlation between selected factors. This approach esti-
mates the number of hypotheses for a group of correlated
factors and has been applied to the study of SNPs (Nyholt
2004). We expanded the method to environmental factors.
For the 18 SNPs, we calculated the correlation between
SNPs stratified by race, and concluded that there were 17.7
effective genetic factors. For the 5 environmental factors,
we calculated 4.41 effective factors. Thus, the total number
of effective tests was 78.1 (17.7 9 4.41). The adjusted
level of significance for a single test with a threshold of
p = 0.05 was 0.0006 (0.05/78.1).
We also calculated the FDR (Storey 2002), the expected
ratio of the number of false positives to the total number of
positives, or the expected fraction of results drawn from the
null distribution at a given significance level (Benjamini
and Hochberg 1995). To estimate the number of false
positives, we generated a distribution of null test statistics
corresponding to an interaction term, while preserving the
main effects of the SNP and exposure terms, using a
parametric bootstrap method (Buzkova et al. 2011).
The parametric bootstrap methodology is a randomiza-
tion technique that simulates the distribution of test sta-
tistics for the interaction term under the null hypothesis of
no interaction. To create the null distribution of test sta-
tistics corresponding to the interaction term (bG9E), we fit a
logistic regression model omitting the interaction term
(bG9E = 0), while leaving parameters that modeled the
main effects of the environmental factor, SNP, and age,
Fig. 1 Comprehensive testing
and screening for gene-
environment interactions in
T2D. a Genetic and
environmental factors were
chosen by their strength of
marginal association in GWAS
and EWAS; b each SNP/
exposure pair was tested for
interaction in association to
disease in a logistic regression
model adjusting for other risk
factors and main effects of
exposure and SNP; c we used a
modified Bonferroni correction
to control for multiple
hypotheses were and the FDR
was estimated. FDR false
discovery rate
498 Hum Genet (2013) 132:495–508
123

sex, race, and BMI. We ‘‘bootstrapped’’ (randomized with
replacement) fitted dependent values (predicted odds for
diabetes) from the null model and refit the interaction
model described above, adding the covariate corresponding
to the interaction between SNP and environmental factor
(bG9E). To simulate a null distribution of test statistics, this
procedure was repeated 100 times. The FDR was estimated
as the ratio of interaction terms deemed significant in the
simulated distribution to all results deemed significant in
the real data.
The specific bootstrapping procedure was as follows:
1. We screened all 90 interaction pairs and collected all
p values corresponding to the coefficient of the
interaction, bg9e. We called these p values Preal. These
models were specified as:
Logit T2Dð Þ ¼ aþ bg � gþ be � eþ bgxe � g � e
þ other covariatesð Þ Model 1ð Þ
Here, ‘‘g’’ denotes the SNP coded by the number of
risk alleles and ‘‘e’’ is the environmental factor, mean-
centered and standardized by the standard deviation.
2. For each of the 90 interaction pairs, we computed the
model corresponding to ‘‘no interaction,’’ or bg9e = 0:
Logit T2Dð Þ ¼ aþ bg � gþ bg � e
þ other covariatesð Þ Model 2ð Þ
The predicted values for Logit(T2D) are called Y.
3. From Model 2 corresponding to bg9e = 0, we boot-
strapped sample (sample with replacement) Y. They
were used as dependent values for Model 1, which
corresponded to the interaction model. We collected
p values corresponding to the interaction term bg9e.
4. Steps 2 and 3 were repeated 100 times, leading to
100 9 90 (9,000) models. The set of 9,000 p values
collected in this way was called Pnull.
5. We estimated the FDR for a given significance level.
For example, for a significance level of 0.05:
FDR(0.05) = ((#Pnull \ 0.05)/100)/(#Preal \ 0.05).
Power calculations for interactions
Sample sizes, genetic risk allele frequency and marginal
OR, and environmental exposure marginal OR were used
to compute power to detect moderate-to-high interaction
effects (interaction OR = 1.5 and 2.0) at p value of 0.01
(FDR \18 %). We assumed marginal effects of genetic
factors observed among NHANES cohorts (genetic mar-
ginal OR = 1.0) and environmental factors OR as
observed in EWAS (exposure marginal OR = 1.5). We
used Quanto software for these calculations (Gauderman
and Morrison 2009).
Analyses stratified by race and consideration of other
T2D risk factors
Our main analysis scan included all participants from
diverse ancestral groups, as reflected in NHANES. Given
that the strongest evidence for T2D associations has come
from studies of Caucasians, we also performed interaction
analyses stratified by race.
We investigated whether eight other candidate T2D
risk factors interact with 18 SNPs. These other factors
included BMI and pulse rate (a proxy for physical fitness).
They also included self-reported intake variables derived
from a 24-h dietary questionnaire. In this questionnaire,
NHANES participants were queried regarding foods they
consumed in 24 h prior to the survey. Variables derived
from this questionnaire include total energy (as calories),
carbohydrate, monounsaturated fat, polyunsaturated fat,
total saturated fat, and total fat consumed in 24 h. As
above, all variables were standardized by the population
mean and standard deviation. Interaction models were
specified as above (main effects and multiplicative
interaction term), adjusting for BMI, self-reported race,
sex, and age. Sample sizes for these tests were greater
than in our main analyses (N = 278–291 cases, 3,066–3,139
controls).
Results
Methodological overview
Figure 1 shows a schematic overview of our approach to
search for interacting SNPs and environmental factors
associated with T2D (defined as fasting blood glucose
C126 mg/dL as recommended by the American Diabetes
Association). We used a dataset containing measurements
for SNPs and environmental factors and chose data with
strong evidence of association of marginal effects in
GWAS and EWAS.
GWAS provide a framework for assembling robustly
replicated sets of common SNPs with genome-wide sig-
nificance [GWS, p \ 5 9 10-8 (Pearson and Manolio
2008)]. As noted above, EWAS provides a way to search
for and validate environmental factors associated with
disease (Patel et al. 2010). We selected environmental
factors with significant associations in 2–4 independent
surveys after accounting for the multiplicity of analyses
and adjusting for demographic factors.
First, we examined the separate marginal effects of each
SNP/genetic variant (‘‘G’’) or each environmental factor
(‘‘E’’) on T2D. Next, we computed correlations between
each environmental factor and SNP (total of E 9 G corre-
lations) to ascertain the degree of their dependence.
Hum Genet (2013) 132:495–508 499
123
Each environmental factor and SNP (total of E 9 G
statistical tests) was tested for interaction while adjusting
for age, sex, BMI, and race (self-reported) (Fig. 1b) in
association to T2D. Finally, we accounted for multiplicity
of analyses with both Bonferroni-adjusted p values and
FDR estimation (Fig. 1c).
Baseline characteristics of cohorts
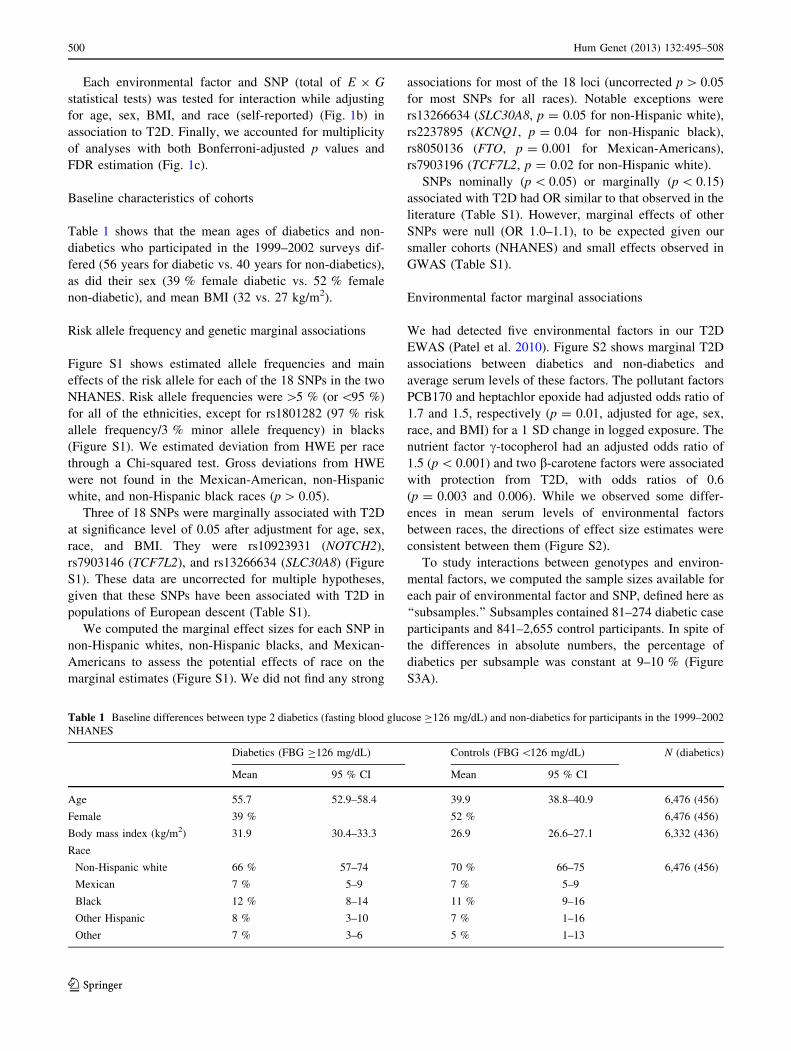
Table 1 shows that the mean ages of diabetics and non-
diabetics who participated in the 1999–2002 surveys dif-
fered (56 years for diabetic vs. 40 years for non-diabetics),
as did their sex (39 % female diabetic vs. 52 % female
non-diabetic), and mean BMI (32 vs. 27 kg/m2).
Risk allele frequency and genetic marginal associations
Figure S1 shows estimated allele frequencies and main
effects of the risk allele for each of the 18 SNPs in the two
NHANES. Risk allele frequencies were [5 % (or \95 %)
for all of the ethnicities, except for rs1801282 (97 % risk
allele frequency/3 % minor allele frequency) in blacks
(Figure S1). We estimated deviation from HWE per race
through a Chi-squared test. Gross deviations from HWE
were not found in the Mexican-American, non-Hispanic
white, and non-Hispanic black races (p [ 0.05).
Three of 18 SNPs were marginally associated with T2D
at significance level of 0.05 after adjustment for age, sex,
race, and BMI. They were rs10923931 (NOTCH2),
rs7903146 (TCF7L2), and rs13266634 (SLC30A8) (Figure
S1). These data are uncorrected for multiple hypotheses,
given that these SNPs have been associated with T2D in
populations of European descent (Table S1).
We computed the marginal effect sizes for each SNP in
non-Hispanic whites, non-Hispanic blacks, and Mexican-
Americans to assess the potential effects of race on the
marginal estimates (Figure S1). We did not find any strong
associations for most of the 18 loci (uncorrected p [ 0.05
for most SNPs for all races). Notable exceptions were
rs13266634 (SLC30A8, p = 0.05 for non-Hispanic white),
rs2237895 (KCNQ1, p = 0.04 for non-Hispanic black),
rs8050136 (FTO, p = 0.001 for Mexican-Americans),
rs7903196 (TCF7L2, p = 0.02 for non-Hispanic white).
SNPs nominally (p \ 0.05) or marginally (p \ 0.15)
associated with T2D had OR similar to that observed in the
literature (Table S1). However, marginal effects of other
SNPs were null (OR 1.0–1.1), to be expected given our
smaller cohorts (NHANES) and small effects observed in
GWAS (Table S1).
Environmental factor marginal associations
We had detected five environmental factors in our T2D
EWAS (Patel et al. 2010). Figure S2 shows marginal T2D
associations between diabetics and non-diabetics and
average serum levels of these factors. The pollutant factors
PCB170 and heptachlor epoxide had adjusted odds ratio of
1.7 and 1.5, respectively (p = 0.01, adjusted for age, sex,
race, and BMI) for a 1 SD change in logged exposure. The
nutrient factor c-tocopherol had an adjusted odds ratio of
1.5 (p \ 0.001) and two b-carotene factors were associated
with protection from T2D, with odds ratios of 0.6
(p = 0.003 and 0.006). While we observed some differ-
ences in mean serum levels of environmental factors
between races, the directions of effect size estimates were
consistent between them (Figure S2).
To study interactions between genotypes and environ-
mental factors, we computed the sample sizes available for
each pair of environmental factor and SNP, defined here as
‘‘subsamples.’’ Subsamples contained 81–274 diabetic case
participants and 841–2,655 control participants. In spite of
the differences in absolute numbers, the percentage of
diabetics per subsample was constant at 9–10 % (Figure
S3A).
Table 1 Baseline differences between type 2 diabetics (fasting blood glucose C126 mg/dL) and non-diabetics for participants in the 1999–2002
NHANES
Diabetics (FBG C126 mg/dL) Controls (FBG \126 mg/dL) N (diabetics)
Mean 95 % CI Mean 95 % CI
Age 55.7 52.9–58.4 39.9 38.8–40.9 6,476 (456)
Female 39 % 52 % 6,476 (456)
Body mass index (kg/m2) 31.9 30.4–33.3 26.9 26.6–27.1 6,332 (436)
Race
Non-Hispanic white 66 % 57–74 70 % 66–75 6,476 (456)
Mexican 7 % 5–9 7 % 5–9
Black 12 % 8–14 11 % 9–16
Other Hispanic 8 % 3–10 7 % 1–16
Other 7 % 3–6 5 % 1–13
500 Hum Genet (2013) 132:495–508
123
Power calculations for genotype–environment interac-
tions depend on minor allele frequency, environmental
factor variability, the ratio of cases to controls, and mar-
ginal associations to disease (Gauderman and Morrison
2009). We estimated the minor allele frequencies in our
NHANES participants (5–44 %), the ratio of cases and
controls for each genotype–environment factor pair (8–
10 %), and assumed standardized environmental variables
(SD = 1). Further, we assumed a genetic marginal OR of
1.0 and environmental factor OR of 1.5 as observed in
these NHANES participants (Figure S1, S2). Under these
assumptions, we determined power of 50–100 % (median
93 %) to detect an interaction OR of 2.0 for a significance
threshold a = 0.01 (corresponding to FDR \20 %) (Gau-
derman and Morrison 2009) (Figure S3B).
Subsample characteristics
Figure S4A, B shows our estimates of the per-subsample
risk allele frequency and estimates of the genetic marginal
effect size. Overall, we found few differences in risk allele
frequency between subsamples by race (Figure S4A). Fur-
ther, we found little difference between risk allele frequency
between non-Hispanic whites, Mexican-Americans, and
non-Hispanic blacks compared to the CEU, MEX, and ASW
HapMap populations (Frazer et al. 2007) (Figure S4A).
Correlations between SNPs and environmental factors
We found little correlation between the 18 SNPs and the 5
environmental factors (Figure S5A–E). There was a nom-
inal negative association between rs10923931 and hepta-
chlor epoxide (p = 0.02), where levels of heptachlor
epoxide decreased 10 % per risk allele. We also observed a
negative association between rs10923931 and cis-b-caro-
tene (p = 0.04), where levels of heptachlor epoxide
decreased 5 % per risk allele.
Correlations among environmental factors
We computed the pair-wise correlations between each
of the environmental factors (Table S2) to assess their
interdependency. There was moderate-to-low correlation
between most factors (q ranging from -0.2 to 0.34). For
example, there was a low inverse correlation between
both versions of b-carotene and c-tocopherol (q = -0.2);
however, we observed high correlation between cis-b-car-
otene and trans-b-carotene (q = 0.96).
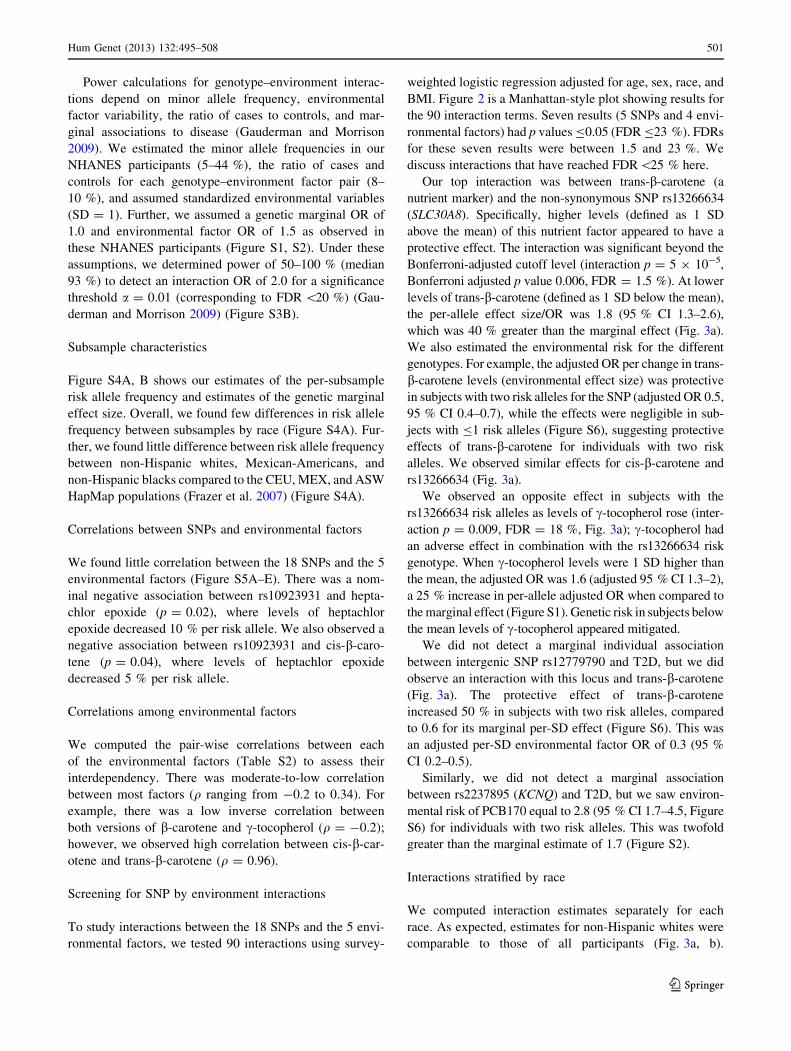
Screening for SNP by environment interactions
To study interactions between the 18 SNPs and the 5 envi-
ronmental factors, we tested 90 interactions using survey-
weighted logistic regression adjusted for age, sex, race, and
BMI. Figure 2 is a Manhattan-style plot showing results for
the 90 interaction terms. Seven results (5 SNPs and 4 envi-
ronmental factors) had p values B0.05 (FDR B23 %). FDRs
for these seven results were between 1.5 and 23 %. We
discuss interactions that have reached FDR\25 % here.
Our top interaction was between trans-b-carotene (a
nutrient marker) and the non-synonymous SNP rs13266634
(SLC30A8). Specifically, higher levels (defined as 1 SD
above the mean) of this nutrient factor appeared to have a
protective effect. The interaction was significant beyond the
Bonferroni-adjusted cutoff level (interaction p = 5 9 10-5,
Bonferroni adjusted p value 0.006, FDR = 1.5 %). At lower
levels of trans-b-carotene (defined as 1 SD below the mean),
the per-allele effect size/OR was 1.8 (95 % CI 1.3–2.6),
which was 40 % greater than the marginal effect (Fig. 3a).
We also estimated the environmental risk for the different
genotypes. For example, the adjusted OR per change in trans-
b-carotene levels (environmental effect size) was protective
in subjects with two risk alleles for the SNP (adjusted OR 0.5,
95 % CI 0.4–0.7), while the effects were negligible in sub-
jects with B1 risk alleles (Figure S6), suggesting protective
effects of trans-b-carotene for individuals with two risk
alleles. We observed similar effects for cis-b-carotene and
rs13266634 (Fig. 3a).
We observed an opposite effect in subjects with the
rs13266634 risk alleles as levels of c-tocopherol rose (inter-
action p = 0.009, FDR = 18 %, Fig. 3a); c-tocopherol had
an adverse effect in combination with the rs13266634 risk
genotype. When c-tocopherol levels were 1 SD higher than
the mean, the adjusted OR was 1.6 (adjusted 95 % CI 1.3–2),
a 25 % increase in per-allele adjusted OR when compared to
the marginal effect (Figure S1). Genetic risk in subjects below
the mean levels of c-tocopherol appeared mitigated.
We did not detect a marginal individual association
between intergenic SNP rs12779790 and T2D, but we did
observe an interaction with this locus and trans-b-carotene
(Fig. 3a). The protective effect of trans-b-carotene
increased 50 % in subjects with two risk alleles, compared
to 0.6 for its marginal per-SD effect (Figure S6). This was
an adjusted per-SD environmental factor OR of 0.3 (95 %
CI 0.2–0.5).
Similarly, we did not detect a marginal association
between rs2237895 (KCNQ) and T2D, but we saw environ-
mental risk of PCB170 equal to 2.8 (95 % CI 1.7–4.5, Figure
S6) for individuals with two risk alleles. This was twofold
greater than the marginal estimate of 1.7 (Figure S2).
Interactions stratified by race
We computed interaction estimates separately for each
race. As expected, estimates for non-Hispanic whites were
comparable to those of all participants (Fig. 3a, b).
Hum Genet (2013) 132:495–508 501
123
However, the study was underpowered for observing
interaction effect sizes in Mexican-Americans or non-
Hispanic blacks (Figure S7A, B). We observed amplified
effects for some per-race stratified interactions. For example,
non-Hispanic blacks with low levels of cis-b-carotene and
risk alleles for rs12779790 had a threefold increased risk for
T2D compared to the overall sample (Figure S7A). Simi-
larly, Mexican-Americans with low levels of trans-b-caro-
tene and risk alleles for rs4712523 (CDKAL1) also had
twofold increased risk for T2D compared to all participants
(Figure S7B).
Interactions adjusted by cis-b-carotene
The interaction OR conferred by the combination of cis/
trans-b-carotene and rs13266634 was similar and in the
same direction (Fig. 3). Furthermore, the interaction OR
between c-tocopherol and rs13266634 ran in the opposite
direction. To assess independence of interactions, we re-
estimated the interaction OR for the top findings while
adjusting for cis-b-carotene in addition to age, sex, BMI,
and race (Figure S8). After adjusting for cis-b-carotene, our
inferences were unchanged. For example, for low trans-
b-carotene, the per-allele adjusted OR for rs13266634 was
2.0 (95 % CI 1.4–2.8; interaction p = 2 9 10-4) after
adjustment for cis-b-carotene. At high levels of c-tocoph-
erol, the per-allele OR for rs13266634 was 1.5 (95 % CI
1.1, 1.8; interaction p = 0.06). The interaction OR for our
top findings was independent of serum cis-b-carotene
levels.
Untransformed environmental factor levels
Environmental factors were log-transformed to achieve
linearity. To assess sensitivity of this transformation on our
interaction OR, we recomputed models for our top findings
without log transforming the environmental factors. We
centered and standardized each environmental factor by
their raw mean and SD, and recomputed the interaction OR
while adjusting for the same covariates above. In conclu-
sion, log transforming the environmental factors did not
lead to sizable changes in interaction OR as compared to
using the non-logged factors for our top findings (Figure
S9). For example, the adjusted OR for participants with
1 SD lower than the mean for trans-b-carotene was 1.8
(95 % CI 1.4–2.5) per one allele change in rs13266634,
comparable to the estimate computed using log-transfor-
mation of trans-b-carotene.
Limited evidence to support interactions with other risk
factors
BMI, physical fitness, energy intake, carbohydrate intake,
and fat intake are well-known risk factors for T2D. We
assessed eight variables representing these factors in
interaction with the 18 SNPs tested in this study. We were
unable to uncover substantial interaction effects that would
survive multiple comparison control (Figure S10). The
lowest p value was 0.02, corresponding to FDR of 100 %.
We did observe a modest interaction between BMI and
rs8050136 (FTO) (uncorrected interaction p value = 0.03).
Fig. 2 Significance values
of interaction term
[-log10(p value) for interaction
term of pair of factors]. SNPs
are on the x axis and
environmental factors are color-
coded above each SNP. Markers
alternate between filled and
open for each locus. The y axis
shows -log10(p value).
Interactions with p value B0.05
are annotated with their FDR.
The dotted line denotes the
Bonferroni threshold. One
finding (the interaction between
rs1326634 and trans-b-carotene;
FDR = 1.5 %) was above theline
502 Hum Genet (2013) 132:495–508
123

rs8050136 is an obesity-related locus whose association
with T2D is explained primarily through its effect on BMI
(Zeggini et al. 2007).
Discussion
We have shown that it is possible to screen for gene–
environment interactions by integrating results from GWAS
and EWAS. Our most promising results are candidates for
prospective studies in additional independent cohorts.
We chose environmental factors and SNPs with strong
evidence for marginal associations in EWAS and GWAS.
However, it would also be possible to evaluate interactions
that lack strong evidence. Given the small marginal effects
for most common SNPs, many genuine associations do not
reach GWS and remain false negatives (Ioannidis et al.
2011). Some may have strong interactions with environ-
mental factors (Khoury and Wacholder 2009), and may
only be discovered if appropriate joint environmental
variables are considered. However, choosing them from
millions of non-GWS SNPs would be a significant chal-
lenge. In addition, testing for interactions is power-inten-
sive (Hunter 2005), and testing a large number would
impose a significant power and multiplicity burden (Tho-
mas 2010). It has been argued that strict Bonferroni mul-
tiplicity corrections need not be used when considering
factors derived from previous observations (Rothman
1990). However, we counter that interaction effects need
not exist between factors that have robust evidence from
EWAS and GWAS. Further, by estimating the FDR, we
present a more powerful way to prioritize findings versus
the Bonferroni correction.
Selecting environmental factors to test for interaction is
even more difficult. In contrast to SNPs, there is no high-
throughput platform that captures environmental factors
with low measurement error. This lack of measuring
capacity limits data.
Fig. 3 Per-risk allele effect
sizes for top putative
interactions with p \ 0.05.
a Estimates for all races,
b non-Hispanic whites. Markersdenote interaction OR computed
at 1SD below mean exposure
levels, at the mean, or at 1 SD
greater than the mean. Marker
sizes are proportional to inverse
variance
Hum Genet (2013) 132:495–508 503
123

We were able to use a prior EWAS to systematically
screen 266 T2D-environmental factors measured in serum
and urine. We selected five factors with the strongest
support for further testing. An advantage of our approach is
that it allows for hypothesis generation while keeping the
total number of tests lower than testing all possible factor
pairs. However, it is still very important to account for
multiple hypothesis testing. We used multiplicity correc-
tion and FDR, but other approaches may also be employed
(Ioannidis 2006). Other alternatives exist to filter the
hypothesis space of interactions, such as prioritizing
interacting factors based on evidence of physical or toxi-
cological interaction (Patel et al. 2012a).
There were other challenges in this study. First, we had
low-to-moderate power to detect moderate interaction
effects for some of the interactions we tested. Not sur-
prisingly, the p values and effect sizes of results were
modest and only one survived Bonferroni correction. We
also obtained modest FDR estimates for the other highest-
ranking interactions. However, we observed that the top
interactions between these SNPs and EWAS factors were
stronger than the interactions between the any of the same
SNPs and other conventional risk factors for T2D, such as
caloric intake, BMI, and physical fitness. We conclude that
our top findings are ideal candidates for extensive valida-
tion through replication in higher-powered investigations.
Replication studies can investigate trends in SNP inter-
actions with various environmental entities in populations
of different ancestry. Population stratification (Smith et al.
2007) is one type of bias for the phenotypic effect of SNPs.
Although our analysis adjusted and stratified for race, to
date, the SNPs identified by GWAS are best characterized
in Caucasian populations. Genetic effects for GWAS-dis-
covered markers may be different in other groups (Hayes
et al. 2007; Ioannidis 2009; Shu et al. 2010; Tsai et al. 2010;
Unoki et al. 2008; Yamauchi et al. 2010). For example, one
study of African–American heart disease patients replicated
17 SNPs found in subjects of European descent. The study
identified only one SNP (rs7903146 TCF7L2) associated
with T2D in African–Americans from a list of 15 SNPs
common to this study, including rs13266634 (SLC30A8)
(Lettre et al. 2011). Little is known about gene–environ-
ment interactions in populations of different ancestry and
this idea should be investigated.
The potential imbalance of each interaction test was a
limitation of this study. Ideally, each interaction pair
should have the same participants. However, NHANES
subjects did not all undergo the same tests. Our smallest
subsamples were those with Heptachlor Epoxide and
PCB170. These factors gave high marginal effects, but
their analyses were lower powered relative to other subs-
amples. Our results may be biased and not as generalizable
as tests with larger sample sizes.
There are few documented examples of interaction
effects between T2D, GWS SNPs and diverse environ-
mental or dietary factors (Cornelis et al. 2009). We have
been able to hypothesize about possible new ones. For
example, the strongest evidence for interaction in our data
was between rs13266634, a non-synonymous coding SNP
in the SLC30A8 gene and three nutrient factors, trans- and
cis-b-carotene, and c-tocopherol. SLC30A8 is expressed in
pancreatic islets and localized in insulin secretory granules
of islet b cells. It appears to modulate insulin secretion and
storage (Chimienti et al. 2004, 2005). Several reports have
found diet-dependent glucose intolerance and insulin
secretion abnormalities in SLC30A8 knockout mice
(Lemaire et al. 2009; Nicolson et al. 2009; Pound et al.
2009). rs13266634 has been associated T2D in numerous
GWAS [e.g., Sladek et al. (2007), Table S1], and can
influence insulin secretion following glucose challenge
(Staiger et al. 2007). Thus, this SNP may be important in
T2D pathogenesis. Our study enabled us to hypothesize
that impaired insulin secretion driven by rs13266634 may
increase T2D risk if combined with high or low levels of
specific nutrients.
Alternatively, c-tocopherol and b-carotene may be
markers of other dietary components. b-Carotene is a lipid-
soluble dietary factor correlated with fruit and vegetable
consumption (Block et al. 2001), components that are
associated with T2D prevention (Carter et al. 2010). In
contrast, the richest sources for c-tocopherol include soy-
bean oils and margarine (Wagner et al. 2004), components
with higher fatty acid content. Fatty acids influence b-cell
function and have been shown to even potentiate insulin
secretion among individuals genetically predisposed to
T2D (Ashcroft and Rorsman 2012). Of interest, vitamin E
appears to modify GWAS-identified SNPs associated with
serum lipid levels, metabolic traits that are risk factors for
T2D (Dumitrescu et al. 2012).
One hypothesis under debate regarding the etiology of
T2D is the thrifty genotype hypothesis, in which T2D risk
genotypes provided advantages for indigenous human
populations. Now, in times of more readily available
nutrients and calories, a result of a different environment,
these thrifty genotypes are now risk genotypes. However,
evidence to support existence of such thrifty genes or
interactions with these environmental factors and behaviors
is lacking. To this end, competing hypotheses have
emerged, including the ‘‘thrifty phenotype’’ (Hales and
Barker 2001) and ‘‘drifty genotype’’ (Speakman 2008),
whereby predisposition to metabolic diseases are a result of
mismatch in nutrition environments between early (pre-
childhood) and adult life or due to random genetic drift,
respectively. Further, more recent events in human history,
such as famine, may have played a role to enrich thrifty
genes in certain populations (Diamond 2003). Perhaps one
504 Hum Genet (2013) 132:495–508
123

reason behind lack of formal evidence to support these
hypotheses may be that other constituents of the modern
lifestyle, such as those indicated by EWAS (in addition to
higher overall energy intake), may be interacting with
genotypes that conferred advantages to early human pop-
ulations. Future studies should examine the role of other
indicators of modern lifestyle and environment on T2D as
we have attempted here.
There was some unavoidable asymmetry in our selec-
tion of SNPs and environmental factors. We chose
SNPs with documented robust associations with T2D and
environmental factors with strong associations to T2D in
NHANES. Only three variants were significantly associ-
ated with T2D overall, and only two were significantly
associated with T2D in race-stratified analyses. This pat-
tern was anticipated, given the small marginal effects of
these genetic factors.
While interactions may be informative of causality
(Davey Smith 2010), these findings are subject to bias. For
environmental factors, confounding and reverse causality are
major issues (Ioannidis et al. 2009). Little is known about the
causal nature, if any, of these factors and T2D (Song et al.
2009). Our findings must be confirmed in independent, larger
populations. Prospective studies will be critical.
The SNPs we examined may have robust marginal
associations to T2D, but could only tag the actual causal
SNP. Our power is decreased for tagging SNPs that are not
in complete linkage disequilibrium with the causal SNP.
More importantly, etiological inference might be hindered
if the causal SNP is unknown.
Nevertheless, these findings may have important impli-
cations for personalized medicine (Chan and Ginsburg
2011) or the ‘‘missing heritability’’ debate (Manolio et al.
2009). For example, Roberts et al. (2012) have recently
quantified the difficulty in predicting disease risk using
entire genomes of individuals. However, Roberts et al.
(2012) only considered genetic or environmental main
effects and interactions were not considered. On the other
hand, Aschard et al. (2012) recently provided theoretical
arguments that gene–environment interactions are unlikely
to improve risk prediction. However, only a limited num-
ber of interactions (maximum of 10) were considered in
these simulations. It is possible that inclusion of many
interaction effects may increase prediction. We hypothe-
size that perhaps the lack of predictive capacity in the
Roberts et al. investigations and predicted by the Aschard
et al. simulations arises from not considering multiple
interactions between environmental exposures and the
genome. To test the hypothesis empirically that multiple
interactions may influence heritability estimates, we would
require relatedness information between participants cur-
rently unavailable in NHANES. Further, to test if multiple
interactions influence risk prediction, we would require
samples with same environmental and genetic measures for
all participants. Nevertheless, we demonstrate one way of
identifying multiple interactions to test in these contexts in
future investigations.
Infrastructure-related challenges remain in this area
(Hunter 2005). First, unlike common SNPs (Hindorff et al.
2009a), we lack a complete list of candidate environmental
factors. Screening and validating gene–environment inter-
actions is power-intensive, and will require both environ-
mental and genetic measures to be measured in multiple
studies (Ioannidis et al. 2009), augmentation of GWAS
with environmental data (Khoury and Wacholder 2009),
and adoption of measurement standards (e.g., Hamilton
et al. 2011). A systematic approach to investigating the
interactions of environment and the individual genome
may help explain a substantial component of disease risk,
lead to hypotheses regarding disease pathology, or help
shed light on the debate on the genetic basis of disease
(Gibson 2011).
Acknowledgments We thank CDC staff for access to the restricted
data and remote computer support, including Peter Meyer, Ajay
Yesupriya, and Vijay Gambhir. We thank the Hewlett Packard
Foundation for computer infrastructure and Alex Skrenchuk of
Stanford Biomedical Informatics Research (Stanford University
School of Medicine) for local computer support. C.J.P. was funded by
the National Library of Medicine (T15 LM007033). A.J.B. was fun-
ded in part by the Lucile Packard Foundation for Children’s Health,
the National Library of Medicine (R01 LM009719), the National
Institute of General Medical Sciences (R01 GM079719). The project
described was supported by the National Center for Research
Resources and the National Center for Advancing Translational Sci-
ences, National Institutes of Health (UL1 RR025744).
Conflict of interest The authors declare no conflicts of interest.
Open Access This article is distributed under the terms of the
Creative Commons Attribution License which permits any use, dis-
tribution, and reproduction in any medium, provided the original
author(s) and the source are credited.
References
Aschard H, Chen J, Cornelis MC, Chibnik LB, Karlson EW, Kraft P
(2012) Inclusion of gene–gene and gene–environment interac-
tions unlikely to dramatically improve risk prediction for
complex diseases. Am J Hum Genet 90:962–972. doi:10.1016/
j.ajhg.2012.04.017
Ashcroft FM, Rorsman P (2012) Diabetes mellitus and the beta-cell:
the last ten years. Cell 148:1160–1171. doi:10.1016/j.cell.2012.
02.010
Benjamini Y, Hochberg Y (1995) Controlling the false discovery rate:
a practical and powerful approach to multiple testing. J R Statist
Soc B 57:289–300
Block G, Norkus E, Hudes M, Mandel S, Helzlsouer K (2001) Which
plasma antioxidants are most related to fruit and vegetable
consumption? Am J Epidemiol 154:1113–1118
Hum Genet (2013) 132:495–508 505
123

Buzkova P, Lumley T, Rice K (2011) Permutation and parametric
bootstrap tests for gene–gene and gene–environment interac-
tions. Ann Hum Genet 75:36–45
Carter P, Gray LJ, Troughton J, Khunti K, Davies MJ (2010) Fruit and
vegetable intake and incidence of type 2 diabetes mellitus:
systematic review and meta-analysis. BMJ 341:c4229. doi:
10.1136/bmj.c4229
CDC and National Center for Health Statistics (NCHS) (2003)
National health and nutrition examination survey analytic
guidelines. http://www.cdc.gov/nchs/data/nhanes/nhanes_03_04/
nhanes_analytic_guidelines_dec_2005.pdf. Accessed 19 Feb
2010
Centers for Disease Control and Prevention (CDC) (2009) National
Health and Nutrition Examination Survey. CDC. http://www.
cdc.gov/nchs/nhanes/. Accessed 1 Sep 2009
Chan IS, Ginsburg GS (2011) Personalized medicine: progress and
promise. Annu Rev Genomics Hum Genet 12:217–244. doi:
10.1146/annurev-genom-082410-101446
Chen R, Davydov EV, Sirota M, Butte AJ (2010) Non-synonymous
and synonymous coding SNPs show similar likelihood and effect
size of human disease association. PLoS One 5:e13574. doi:
10.1371/journal.pone.0013574
Chimienti F, Devergnas S, Favier A, Seve M (2004) Identification and
cloning of a beta-cell-specific zinc transporter, ZnT-8, localized
into insulin secretory granules. Diabetes 53:2330–2337
Chimienti F, Favier A, Seve M (2005) ZnT-8, a pancreatic beta-cell-
specific zinc transporter. Biometals 18:313–317. doi:10.1007/
s10534-005-3687-9
Cornelis MC, Qi L, Kraft P, Hu FB (2009) TCF7L2, dietary
carbohydrate, and risk of type 2 diabetes in US women. Am J
Clin Nutr 89:1256–1262. doi:10.3945/ajcn.2008.27058
Davey Smith G (2010) Use of genetic markers and gene-diet
interactions for interrogating population-level causal influences
of diet on health. Genes Nutr 6:27–43. doi:10.1007/s12263-010-
0181-y
Diamond J (2003) The double puzzle of diabetes. Nature 423:599–
602. doi:10.1038/423599a
Dumitrescu L, Goodloe R, Brown-Gentry K, Mayo P, Allen M,
Jin H, Gillani NB, Schnetz-Boutaud N, Dilks HH, Crawford
DC (2012) Serum vitamins A and E as modifiers of lipid trait
genetics in the National Health and Nutrition Examination
Surveys as part of the Population Architecture using Genomics
and Epidemiology (PAGE) study. Hum Genet. doi:10.1007/
s00439-012-1186-y
Frazer KA, Ballinger DG, Cox DR, Hinds DA, Stuve LL, Gibbs RA,
Belmont JW, Boudreau A, Hardenbol P, Leal SM, Pasternak S,
Wheeler DA, Willis TD, Yu F, Yang H, Zeng C, Gao Y, Hu H,
Hu W, Li C, Lin W, Liu S, Pan H, Tang X, Wang J, Wang W, Yu
J, Zhang B, Zhang Q, Zhao H, Zhou J, Gabriel SB, Barry R,
Blumenstiel B, Camargo A, Defelice M, Faggart M, Goyette M,
Gupta S, Moore J, Nguyen H, Onofrio RC, Parkin M, Roy J,
Stahl E, Winchester E, Ziaugra L, Altshuler D, Shen Y, Yao Z,
Huang W, Chu X, He Y, Jin L, Liu Y, Sun W, Wang H, Wang Y,
Xiong X, Xu L, Waye MM, Tsui SK, Xue H, Wong JT, Galver
LM, Fan JB, Gunderson K, Murray SS, Oliphant AR, Chee MS,
Montpetit A, Chagnon F, Ferretti V, Leboeuf M, Olivier JF,
Phillips MS, Roumy S, Sallee C, Verner A, Hudson TJ, Kwok
PY, Cai D, Koboldt DC, Miller RD, Pawlikowska L, Taillon-
Miller P, Xiao M, Tsui LC, Mak W, Song YQ, Tam PK,
Nakamura Y, Kawaguchi T, Kitamoto T, Morizono T, Nagashi-
ma A, Ohnishi Y, Sekine A, Tanaka T, Tsunoda T et al (2007) A
second generation human haplotype map of over 3.1 million
SNPs. Nature 449:851–861. doi:10.1038/nature06258
Gauderman J, Morrison J (2009) QUANTO—a program to compute
power for G 9 E and G 9 G studies. 1.2.4 edn. University of
Southern California
Gibson G (2011) Rare and common variants: twenty arguments. Nat
Rev Genet 13:135–145. doi:10.1038/nrg3118
Hales CN, Barker DJ (2001) The thrifty phenotype hypothesis. Br
Med Bull 60:5–20
Hamilton CM, Strader LC, Pratt JG, Maiese D, Hendershot T, Kwok
RK, Hammond JA, Huggins W, Jackman D, Pan H, Nettles DS,
Beaty TH, Farrer LA, Kraft P, Marazita ML, Ordovas JM, Pato
CN, Spitz MR, Wagener D, Williams M, Junkins HA, Harlan
WR, Ramos EM, Haines J (2011) The PhenX Toolkit: get the
most from your measures. Am J Epidemiol 174:253–260. doi:
10.1093/aje/kwr193
Hayes MG, Pluzhnikov A, Miyake K, Sun Y, Ng MC, Roe CA,
Below JE, Nicolae RI, Konkashbaev A, Bell GI, Cox NJ, Hanis
CL (2007) Identification of type 2 diabetes genes in Mexican
Americans through genome-wide association studies. Diabetes
56:3033–3044. doi:10.2337/db07-0482
Hindorff L, MacArthur J, Wise A, Junkins H, Hall P, Klemm A,
Manolio T (2009a) A catalog of published genome-wide associa-
tion studies. http://www.genome.gov/gwastudies. Accessed 28
Mar 2012
Hindorff LA, Sethupathy P, Junkins HA, Ramos EM, Mehta JP,
Collins FS, Manolio TA (2009b) Potential etiologic and
functional implications of genome-wide association loci for
human diseases and traits. Proc Natl Acad Sci USA 106:9362–
9367. doi:10.1073/pnas.0903103106
Hunter DJ (2005) Gene–environment interactions in human diseases.
Nat Rev Genet 6: 287–298. doi:10.1038/nrg1578
Ioannidis JPA (2005) Why most published research findings are false.
PLoS Med 2:e124
Ioannidis JP (2006) Commentary: grading the credibility of molecular
evidence for complex diseases. Int J Epidemiol 35:572–578
(discussion 593–596). doi:10.1093/ije/dyl003
Ioannidis JP (2009) Population-wide generalizability of genome-wide
discovered associations. J Natl Cancer Inst 101:1297–1299. doi:
10.1093/jnci/djp298
Ioannidis J, Loy EY, Poulton R, Chia KS (2009) Researching genetic
versus nongenetic determinants of disease: a comparison and
proposed unification. Sci Transl Med 1:8
Ioannidis JP, Tarone R, McLaughlin JK (2011) The false-positive to
false-negative ratio in epidemiologic studies. Epidemiology
22:450–456. doi:10.1097/EDE.0b013e31821b506e
Khoury MJ, Wacholder S (2009) Invited commentary: from genome-
wide association studies to gene-environment-wide interaction
studies–challenges and opportunities. Am J Epidemiol 169:227–
230 (discussion 234–235). doi:10.1093/aje/kwn351
Khoury MJ, Adams MJ Jr, Flanders WD (1988) An epidemiologic
approach to ecogenetics. Am J Hum Genet 42:89–95
Lemaire K, Ravier MA, Schraenen A, Creemers JW, Van de Plas R,
Granvik M, Van Lommel L, Waelkens E, Chimienti F, Rutter
GA, Gilon P, in’t Veld PA, Schuit FC (2009) Insulin crystal-
lization depends on zinc transporter ZnT8 expression, but is not
required for normal glucose homeostasis in mice. Proc Natl Acad
Sci USA 106:14872–14877. doi:10.1073/pnas.0906587106
Lettre G, Palmer CD, Young T, Ejebe KG, Allayee H, Benjamin EJ,
Bennett F, Bowden DW, Chakravarti A, Dreisbach A, Farlow
DN, Folsom AR, Fornage M, Forrester T, Fox E, Haiman CA,
Hartiala J, Harris TB, Hazen SL, Heckbert SR, Henderson BE,
Hirschhorn JN, Keating BJ, Kritchevsky SB, Larkin E, Li M,
Rudock ME, McKenzie CA, Meigs JB, Meng YA, Mosley TH,
Newman AB, Newton-Cheh CH, Paltoo DN, Papanicolaou GJ,
Patterson N, Post WS, Psaty BM, Qasim AN, Qu L, Rader DJ,
Redline S, Reilly MP, Reiner AP, Rich SS, Rotter JI, Liu Y,
Shrader P, Siscovick DS, Tang WH, Taylor HA, Tracy RP,
Vasan RS, Waters KM, Wilks R, Wilson JG, Fabsitz RR, Gabriel
SB, Kathiresan S, Boerwinkle E (2011) Genome-wide associa-
tion study of coronary heart disease and its risk factors in 8,090
506 Hum Genet (2013) 132:495–508
123

African Americans: the NHLBI CARe Project. PLoS Genet
7:e1001300. doi:10.1371/journal.pgen.1001300
Manolio TA, Collins FS, Cox NJ, Goldstein DB, Hindorff LA, Hunter
DJ, McCarthy MI, Ramos EM, Cardon LR, Chakravarti A, Cho
JH, Guttmacher AE, Kong A, Kruglyak L, Mardis E, Rotimi CN,
Slatkin M, Valle D, Whittemore AS, Boehnke M, Clark AG,
Eichler EE, Gibson G, Haines JL, Mackay TFC, McCarroll SA,
Visscher PM (2009) Finding the missing heritability of complex
diseases. Nature 461:747–753
Matise TC, Ambite JL, Buyske S, Carlson CS, Cole SA, Crawford
DC, Haiman CA, Heiss G, Kooperberg C, Marchand LL,
Manolio TA, North KE, Peters U, Ritchie MD, Hindorff LA,
Haines JL (2011) The next PAGE in understanding complex
traits: design for the analysis of population architecture using
genetics and epidemiology (PAGE) study. Am J Epidemiol
174:849–859. doi:10.1093/aje/kwr160
McClellan J, King MC (2010) Genetic heterogeneity in human
disease. Cell 141:210–217. doi:10.1016/j.cell.2010.03.032
Meigs JB, Shrader P, Sullivan LM, McAteer JB, Fox CS, Dupuis J,
Manning AK, Florez JC, Wilson PW, D’Agostino RB, Sr.,
Cupples LA (2008) Genotype score in addition to common risk
factors for prediction of type 2 diabetes. N Engl J Med
359:2208–2219. doi:10.1056/NEJMoa0804742
Neel JV (1962) Diabetes mellitus: a ‘‘thrifty’’ genotype rendered
detrimental by ‘‘progress’’? Am J Hum Genet 14:353–362
Nicolson TJ, Bellomo EA, Wijesekara N, Loder MK, Baldwin JM,
Gyulkhandanyan AV, Koshkin V, Tarasov AI, Carzaniga R,
Kronenberger K, Taneja TK, da Silva Xavier G, Libert S,
Froguel P, Scharfmann R, Stetsyuk V, Ravassard P, Parker H,
Gribble FM, Reimann F, Sladek R, Hughes SJ, Johnson PRV,
Masseboeuf M, Burcelin R, Baldwin SA, Liu M, Lara-Lemus R,
Arvan P, Schuit FC, Wheeler MB, Chimienti F, Rutter GA
(2009) Insulin storage and glucose homeostasis in mice null for
the granule zinc transporter ZnT8 and studies of the type 2
diabetes-associated variants. Diabetes 58:2070–2083. doi:
10.2337/db09-0551
Nyholt DR (2004) A simple correction for multiple testing for single-
nucleotide polymorphisms in linkage disequilibrium with each
other. Am J Hum Genet 74:765–769. doi:10.1086/383251
Patel CJ, Bhattacharya J, Butte AJ (2010) An environment-wide
association study (EWAS) on type 2 diabetes mellitus. PLoS
One 5:e10746. doi:10.1371/journal.pone.0010746
Patel CJ, Chen R, Butte AJ (2012a) Data-driven integration of
epidemiological and toxicological data to select candidate
interacting genes and environmental factors in association with
disease. Bioinformatics 28(12):i121–i126
Patel CJ, Cullen MR, Ioannidis JP, Butte AJ (2012b) Systematic
evaluation of environmental factors: persistent pollutants and
nutrients correlated with serum lipid levels. Int J Epidemiol. doi:
10.1093/ije/dys003
Pearson TA, Manolio TA (2008) How to interpret a genome-wide
association study. J Am Med Assoc 299:1335–1344. doi:10.1001/
jama.299.11.1335
Pigliucci M (2001) Phenotypic plasticity: beyond nature and nurture.
Johns Hopkins University Press, Baltimore
Pound LD, Sarkar SA, Benninger RK, Wang Y, Suwanichkul A,
Shadoan MK, Printz RL, Oeser JK, Lee CE, Piston DW,
McGuinness OP, Hutton JC, Powell DR, O’Brien RM (2009)
Deletion of the mouse SLC30A8 gene encoding zinc transporter-
8 results in impaired insulin secretion. Biochem J 421:371–376.
doi:10.1042/BJ20090530
Roberts NJ, Vogelstein JT, Parmigiani G, Kinzler KW, Vogelstein B,
Velculescu VE (2012) The predictive capacity of personal
genome sequencing. Sci Transl Med 4:133ra58. doi:10.1126/
scitranslmed.3003380
Rothman KJ (1990) No adjustments are needed for multiple
comparisons. Epidemiology 1:43–46
Rothman N, Garcia-Closas M, Chatterjee N, Malats N, Wu X,
Figueroa JD, Real FX, Van Den Berg D, Matullo G, Baris D,
Thun M, Kiemeney LA, Vineis P, De Vivo I, Albanes D, Purdue
MP, Rafnar T, Hildebrandt MA, Kiltie AE, Cussenot O, Golka
K, Kumar R, Taylor JA, Mayordomo JI, Jacobs KB, Kogevinas
M, Hutchinson A, Wang Z, Fu YP, Prokunina-Olsson L, Burdett
L, Yeager M, Wheeler W, Tardon A, Serra C, Carrato A, Garcia-
Closas R, Lloreta J, Johnson A, Schwenn M, Karagas MR,
Schned A, Andriole G, Jr., Grubb R, 3rd, Black A, Jacobs EJ,
Diver WR, Gapstur SM, Weinstein SJ, Virtamo J, Cortessis VK,
Gago-Dominguez M, Pike MC, Stern MC, Yuan JM, Hunter DJ,
McGrath M, Dinney CP, Czerniak B, Chen M, Yang H,
Vermeulen SH, Aben KK, Witjes JA, Makkinje RR, Sulem P,
Besenbacher S, Stefansson K, Riboli E, Brennan P, Panico S,
Navarro C, Allen NE, Bueno-de-Mesquita HB, Trichopoulos D,
Caporaso N, Landi MT, Canzian F, Ljungberg B, Tjonneland A,
Clavel-Chapelon F, Bishop DT, Teo MT, Knowles MA,
Guarrera S, Polidoro S, Ricceri F, Sacerdote C, Allione A,
Cancel-Tassin G, Selinski S, Hengstler JG, Dietrich H, Fletcher
T, Rudnai P, Gurzau E, Koppova K, Bolick SC, Godfrey A, Xu Z
et al. (2010) A multi-stage genome-wide association study of
bladder cancer identifies multiple susceptibility loci. Nat Genet
42:978–984. doi:10.1038/ng.687
Schwartz D, Collins F (2007) Medicine. Environmental biology
and human disease. Science 316:695–696. doi:10.1126/science.
1141331
Shu XO, Long J, Cai Q, Qi L, Xiang YB, Cho YS, Tai ES, Li X, Lin
X, Chow WH, Go MJ, Seielstad M, Bao W, Li H, Cornelis MC,
Yu K, Wen W, Shi J, Han BG, Sim XL, Liu L, Qi Q, Kim HL,
Ng DP, Lee JY, Kim YJ, Li C, Gao YT, Zheng W, Hu FB (2010)
Identification of new genetic risk variants for type 2 diabetes.
PLoS Genet 6:e1001127. doi:10.1371/journal.pgen.1001127
Sladek R, Rocheleau G, Rung J, Dina C, Shen L, Serre D, Boutin P,
Vincent D, Belisle A, Hadjadj S, Balkau B, Heude B,
Charpentier G, Hudson TJ, Montpetit A, Pshezhetsky AV,
Prentki M, Posner BI, Balding DJ, Meyre D, Polychronakos C,
Froguel P (2007) A genome-wide association study identifies
novel risk loci for type 2 diabetes. Nature 445:881–885. doi:
10.1038/nature05616
Smith GD, Lawlor DA, Harbord R, Timpson N, Day I, Ebrahim S
(2007) Clustered environments and randomized genes: a funda-
mental distinction between conventional and genetic epidemiol-
ogy. PLoS Med 4:e352. doi:10.1371/journal.pmed.0040352
Song Y, Cook NR, Albert CM, Van Denburgh M, Manson JE (2009)
Effects of vitamins C and E and beta-carotene on the risk of type
2 diabetes in women at high risk of cardiovascular disease: a
randomized controlled trial. Am J Clin Nutr 90:429–437. doi:
10.3945/ajcn.2009.27491
Speakman JR (2008) Thrifty genes for obesity, an attractive but flawed
idea, and an alternative perspective: the ‘drifty gene’ hypothesis.
Int J Obesity 32:1611–1617. doi:10.1038/ijo.2008.161
Staiger H, Machicao F, Stefan N, Tschritter O, Thamer C, Kantartzis
K, Schafer SA, Kirchhoff K, Fritsche A, Haring HU (2007)
Polymorphisms within novel risk loci for type 2 diabetes
determine beta-cell function. PLoS One 2:e832. doi:10.1371/
journal.pone.0000832
Storey JD (2002) A direct approach to false discovery rates. J R
Statist Soc B 64:479–498
Thomas D (2010) Gene–environment-wide association studies:
emerging approaches. Nat Rev Genet 11:259–272. doi:10.1038/
nrg2764
Tsai FJ, Yang CF, Chen CC, Chuang LM, Lu CH, Chang CT, Wang
TY, Chen RH, Shiu CF, Liu YM, Chang CC, Chen P, Chen CH,
Hum Genet (2013) 132:495–508 507
123

Fann CS, Chen YT, Wu JY (2010) A genome-wide association
study identifies susceptibility variants for type 2 diabetes in Han
Chinese. PLoS Genet 6:e1000847. doi:10.1371/journal.pgen.
1000847
Tzoulaki I, Patel CJ, Okamura T, Chan Q, Brown IJ, Miura K,
Ueshima H, Zhao L, Van Horn L, Daviglus ML, Stamler J, Butte
AJ, Ioannidis JP, Elliott P (2012) A nutrient-wide association
study on blood pressure. Circulation 126:2456–2464. doi:
10.1161/CIRCULATIONAHA.112.114058
Unoki H, Takahashi A, Kawaguchi T, Hara K, Horikoshi M,
Andersen G, Ng DP, Holmkvist J, Borch-Johnsen K, Jorgensen
T, Sandbaek A, Lauritzen T, Hansen T, Nurbaya S, Tsunoda T,
Kubo M, Babazono T, Hirose H, Hayashi M, Iwamoto Y,
Kashiwagi A, Kaku K, Kawamori R, Tai ES, Pedersen O,
Kamatani N, Kadowaki T, Kikkawa R, Nakamura Y, Maeda S
(2008) SNPs in KCNQ1 are associated with susceptibility to type
2 diabetes in East Asian and European populations. Nat Genet
40:1098–1102. doi:10.1038/ng.208
Visscher PM, Brown MA, McCarthy MI, Yang J (2012) Five years of
GWAS discovery. Am J Hum Genet 90:7–24. doi:10.1016/
j.ajhg.2011.11.029
Vittinghoff E, Glidden D, Shiboski S, McCulloch C (2005) Regres-
sion methods in biostatistics: linear, logistic, survival, and
repeated measures models. Springer, New York
Wagner KH, Kamal-Eldin A, Elmadfa I (2004) Gamma-tocopherol—
an underestimated vitamin? Ann Nutr Metab 48:169–188. doi:
10.1159/000079555
Wang X, Elston RC, Zhu X (2010) The meaning of interaction. Hum
Hered 70:269–277. doi:10.1159/000321967
Yamauchi T, Hara K, Maeda S, Yasuda K, Takahashi A, Horikoshi
M, Nakamura M, Fujita H, Grarup N, Cauchi S, Ng DP, Ma RC,
Tsunoda T, Kubo M, Watada H, Maegawa H, Okada-Iwabu M,
Iwabu M, Shojima N, Shin HD, Andersen G, Witte DR,
Jorgensen T, Lauritzen T, Sandbaek A, Hansen T, Ohshige T,
Omori S, Saito I, Kaku K, Hirose H, So WY, Beury D, Chan JC,
Park KS, Tai ES, Ito C, Tanaka Y, Kashiwagi A, Kawamori R,
Kasuga M, Froguel P, Pedersen O, Kamatani N, Nakamura Y,
Kadowaki T (2010) A genome-wide association study in the
Japanese population identifies susceptibility loci for type 2
diabetes at UBE2E2 and C2CD4A-C2CD4B. Nat Genet
42:864–868. doi:10.1038/ng.660
Zeggini E, Weedon MN, Lindgren CM, Frayling TM, Elliott KS,
Lango H, Timpson NJ, Perry JR, Rayner NW, Freathy RM,
Barrett JC, Shields B, Morris AP, Ellard S, Groves CJ, Harries
LW, Marchini JL, Owen KR, Knight B, Cardon LR, Walker M,
Hitman GA, Morris AD, Doney AS, McCarthy MI, Hattersley
AT (2007) Replication of genome-wide association signals in
UK samples reveals risk loci for type 2 diabetes. Science
316:1336–1341. doi:10.1126/science.1142364
Zimmet P, Alberti KG, Shaw J (2001) Global and societal implica-
tions of the diabetes epidemic. Nature 414:782–787. doi:10.1038/
414782a
508 Hum Genet (2013) 132:495–508
123
Copyright © 2022 FDOKUMEN