
Synthesis, characterization and optical properties of Mg(OH) 2 micro-/nanostructure and its...
10
Synthesis, characterization and optical properties of Mg(OH) 2 micro-/nanostructure and its conversion to MgO Latha Kumari a , W.Z. Li a, * , Charles H. Vannoy b , Roger M. Leblanc b , D.Z. Wang c a Department of Physics, Florida International University, Miami, FL 33199, USA b Department of Chemistry, University of Miami, Coral Gables, FL 33124, USA c Department of Physics, Boston College, Chestnut Hill, MA 02467, USA Received 16 April 2009; received in revised form 4 May 2009; accepted 27 May 2009 Available online 7 July 2009 Abstract Magnesium hydroxide (Mg(OH) 2 ) micro- and nanostructures have been synthesized by a single step hydrothermal route. Surface morphology analysis reveals the formation of micro- and nanostructures with varying shape and size at different synthesis conditions. Structural investigations by X-ray diffraction (XRD) and transmission electron microscopy (TEM) confirm that the synthesized material is Mg(OH) 2 with hexagonal crystal structure. An optical band gap of 5.7 eV is determined for Mg(OH) 2 nanodisks from the UV–vis absorption spectrum. A broad emission band with maximum intensity at around 400 nm is observed in the photoluminescence (PL) spectra of Mg(OH) 2 nanodisks at room temperature depicting the violet emission, which can be attributed to the ionized oxygen vacancies in the material. Furthermore, Mg(OH) 2 has been converted to MgO by calcination at 450 8C. Optical studies of the MgO nanodisks have shown an optical band gap of 3.43 eV and a broadband PL emission in the UV region. Mg(OH) 2 and MgO nanostructures with wide-band gap and short-wavelength luminescence emission can serve as a better luminescent material for photonic applications. # 2009 Elsevier Ltd and Techna Group S.r.l. All rights reserved. Keywords: A. Powder: Chemical preparation; B. Electron Microscopy; C. Optical properties; D. MgO 1. Introduction Recently, nanostructures of magnesium oxide (MgO) and hydroxide (Mg(OH) 2 ) have been extensively studied. Magne- sium and its alloys possess unique properties such as low weight and non-toxicity. These properties are found advanta- geous for various devices in the fields of electronics, aerospace, automotive applications and biomedicine [1–3]. Magnesium oxide, a very important wide-band gap insulator, has been attracting much attention due to its application in catalysis [4], toxic waste remediation [5], as additives in refractory, paint, and superconductor products [6–8], and in steel manufacturing because of its high corrosion-resistant behavior [9]. Magnesium hydroxide (Brucite) is commonly used as the flame-retardant filler in composite materials due to its ability to undergo endothermic dehydration in fire conditions [10]. It has also been used as acidic waste neutralizer in environmental protection, papermaking industry, as a fertilizer additive [11–13], and as the most important precursor for the synthesis of magnesium oxide [14]. Recently, much attention has been paid to the synthesis of MgO and Mg(OH) 2 nanostructures. Mg(OH) 2 nanostructures with versatile morphological structures can be prepared by several methods, such as electrodeposition [15], sol–gel technique [16], precipitation [17], hydrothermal [18], sol- vothermal [19] and microwave assisted synthesis [20]. Several reports demonstrated that these structures can be converted into each other (i.e. MgO $ Mg(OH) 2 ) by either hydration [21] or dehydration [22] procedures. Generally, the final properties of the nanocrystals strongly depend on their shape, agglomeration state and preparation process. Hydrothermal route is one of the most extensively employed techniques in the synthesis of metal oxide nanostructures. The hydrothermal method has many advantages. For example, a highly homogeneous crystalline product can be obtained directly at a relatively lower reaction temperature; it favors a decrease in agglomeration between particles, narrow particles size distribution, phase homogeneity, uniform composition, high product purity and controlled www.elsevier.com/locate/ceramint Available online at www.sciencedirect.com Ceramics International 35 (2009) 3355–3364 * Corresponding author. Tel.: +1 305 348 7257; fax: +1 305 348 6700. E-mail address: Wenzhi.Li@fiu.edu (W.Z. Li). 0272-8842/$36.00 # 2009 Elsevier Ltd and Techna Group S.r.l. All rights reserved. doi:10.1016/j.ceramint.2009.05.035
-
Upload
independent -
Category
Documents
-
view
0 -
download
0
Transcript of Synthesis, characterization and optical properties of Mg(OH) 2 micro-/nanostructure and its...
Synthesis, characterization and optical properties of Mg(OH)2
micro-/nanostructure and its conversion to MgO
Latha Kumari a, W.Z. Li a,*, Charles H. Vannoy b, Roger M. Leblanc b, D.Z. Wang c
a Department of Physics, Florida International University, Miami, FL 33199, USAb Department of Chemistry, University of Miami, Coral Gables, FL 33124, USA
c Department of Physics, Boston College, Chestnut Hill, MA 02467, USA
Received 16 April 2009; received in revised form 4 May 2009; accepted 27 May 2009
Available online 7 July 2009
Abstract
Magnesium hydroxide (Mg(OH)2) micro- and nanostructures have been synthesized by a single step hydrothermal route. Surface morphology
analysis reveals the formation of micro- and nanostructures with varying shape and size at different synthesis conditions. Structural investigations
by X-ray diffraction (XRD) and transmission electron microscopy (TEM) confirm that the synthesized material is Mg(OH)2 with hexagonal crystal
structure. An optical band gap of 5.7 eV is determined for Mg(OH)2 nanodisks from the UV–vis absorption spectrum. A broad emission band with
maximum intensity at around 400 nm is observed in the photoluminescence (PL) spectra of Mg(OH)2 nanodisks at room temperature depicting the
violet emission, which can be attributed to the ionized oxygen vacancies in the material. Furthermore, Mg(OH)2 has been converted to MgO by
calcination at 450 8C. Optical studies of the MgO nanodisks have shown an optical band gap of 3.43 eV and a broadband PL emission in the UV
region. Mg(OH)2 and MgO nanostructures with wide-band gap and short-wavelength luminescence emission can serve as a better luminescent
material for photonic applications.
# 2009 Elsevier Ltd and Techna Group S.r.l. All rights reserved.
Keywords: A. Powder: Chemical preparation; B. Electron Microscopy; C. Optical properties; D. MgO
www.elsevier.com/locate/ceramint
Available online at www.sciencedirect.com
Ceramics International 35 (2009) 3355–3364
1. Introduction
Recently, nanostructures of magnesium oxide (MgO) and
hydroxide (Mg(OH)2) have been extensively studied. Magne-
sium and its alloys possess unique properties such as low
weight and non-toxicity. These properties are found advanta-
geous for various devices in the fields of electronics, aerospace,
automotive applications and biomedicine [1–3]. Magnesium
oxide, a very important wide-band gap insulator, has been
attracting much attention due to its application in catalysis [4],
toxic waste remediation [5], as additives in refractory, paint,
and superconductor products [6–8], and in steel manufacturing
because of its high corrosion-resistant behavior [9]. Magnesium
hydroxide (Brucite) is commonly used as the flame-retardant
filler in composite materials due to its ability to undergo
endothermic dehydration in fire conditions [10]. It has also been
used as acidic waste neutralizer in environmental protection,
* Corresponding author. Tel.: +1 305 348 7257; fax: +1 305 348 6700.
E-mail address: [email protected] (W.Z. Li).
0272-8842/$36.00 # 2009 Elsevier Ltd and Techna Group S.r.l. All rights reserve
doi:10.1016/j.ceramint.2009.05.035
papermaking industry, as a fertilizer additive [11–13], and as
the most important precursor for the synthesis of magnesium
oxide [14].
Recently, much attention has been paid to the synthesis of
MgO and Mg(OH)2 nanostructures. Mg(OH)2 nanostructures
with versatile morphological structures can be prepared by
several methods, such as electrodeposition [15], sol–gel
technique [16], precipitation [17], hydrothermal [18], sol-
vothermal [19] and microwave assisted synthesis [20]. Several
reports demonstrated that these structures can be converted into
each other (i.e. MgO$Mg(OH)2) by either hydration [21] or
dehydration [22] procedures. Generally, the final properties of
the nanocrystals strongly depend on their shape, agglomeration
state and preparation process. Hydrothermal route is one of the
most extensively employed techniques in the synthesis of metal
oxide nanostructures. The hydrothermal method has many
advantages. For example, a highly homogeneous crystalline
product can be obtained directly at a relatively lower reaction
temperature; it favors a decrease in agglomeration between
particles, narrow particles size distribution, phase homogeneity,
uniform composition, high product purity and controlled
d.

L. Kumari et al. / Ceramics International 35 (2009) 3355–33643356
particle morphology [23]. In this work, we discuss the synthesis
of various nano-/microstructures of Mg(OH)2 by hydrothermal
technique and its conversion to MgO. Structural analysis is
performed on the micro-/nanostructures of Mg(OH)2. Optical
properties of Mg(OH)2 and MgO nanostructures are also
discussed.
2. Experimental
2.1. Synthesis of magnesium hydroxide nanostructures
Mg(OH)2 nanostructures were synthesized by a single step
hydrothermal route. The starting materials used for the synthesis
are magnesium nitrate hexahydrate (Mg(NO3)2�6H2O) and
sodium hydroxide (NaOH). All the chemicals were analytic
grade reagents (Fisher Scientific) and used without further
purification. Experimental details are as follows: 0.5 M of
Mg(NO3)2�6H2O and 5 M of NaOH solutions were prepared in
distilled water. The NaOH solution was slowly added to the
Mg(NO3)2�6H2O solution under manual stirring. Then, the
mixture was placed in an ultrasonicator bath for about 30 min to
obtain homogeneous solution. Further, 10 mL of the above
solution was loaded into a 20 mL Teflon-lined autoclave, which
was then filled with 2 mL of absolute ethanol as buffering agent.
Finally, the autoclave was sealed and maintained at different
temperatures in the range between 180 and 250 8C for 3–72 h
(hydrothermal treatment time, tH). The autoclave was then
allowed to cool down to room temperature naturally. The
precipitates were filtered, washed with distilled water first to
remove the soluble nitrates and then with ethanol to reduce the
agglomeration, and later dried at 80 8C for 1 h. The white colored
material that resulted was later used for various characteriza-
tions. Mg(OH)2 micro-/nanoparticles were also synthesized at
200 8C for 24 h with the addition of 0.1 g of urea and 0.1 g of
PEG 2000 along with 0.4 M of Mg(NO3)2�6H2O and varying
molar concentrations of NaOH (0.4–2.0 M).
2.2. Mg(OH)2 to MgO conversion by calcination
Some of the as-synthesized Mg(OH)2 samples (at 200 8C for
3, 12 and 48 h) were subjected to calcination in a muffle furnace
in air. The samples were first heated to 250 8C and held at that
temperature for 1 h, then at 350 8C for 2 h, and finally at 450 8Cfor 2 h. The temperature was increased very slowly to avoid the
sudden collapse of the Brucite structure, as well as preserve the
morphological features of the micro-/nanocrystalline Mg(OH)2
in the final MgO materials. In the present work, we have
approached two different methods for the conversion of
Mg(OH)2 to MgO: (1) systematic calcination of the as-prepared
Mg(OH)2 material at 250–450 8C and (2) TGA measurement in
the temperature range of 50–1000 8C.
2.3. Characterization
Surface morphology analysis of the Mg(OH)2 and MgO
materials was performed by a field emission scanning electron
microscope (SEM, JEOL JSM-6330F) operated at an accel-
erating voltage of 15 kV. Transmission electron microscopy
(TEM) and high resolution TEM (HRTEM) images, and
selected-area electron diffraction (SAED) patterns were
obtained from a JEOL-2010F apparatus employing an
accelerating voltage of 200 kV. Crystal structure analysis
was carried out by employing an X-ray diffractometer (D-8
Bruker-AXS) equipped with a Cu Ka radiation source
(l = 1.5406 A) and a two-dimensional area detector. A UV–
vis spectrum was obtained from Perkin-Elmer Lambda 900
UV/Vis/NIR spectrometer, and the photoluminescence spectra
were recorded from SPEX FluoroLog spectrofluorometer
(Horiba, Jobin Yvon). For the spectroscopic analysis,
nanomaterials were dispersed in NaOH solution at room
temperature and taken into a quartz cell (1 cm optical path
length). Thermal behavior of the Mg(OH)2 micro-/nanostruc-
tures was studied through thermogravimetric analysis (TGA)
data, which were collected with a TA instruments TGA 2950
apparatus under Ar flow (100 sccm), in the temperature range
of 50–1000 8C. The heating rate was 25 8C/min from 50 to
250 8C with equilibrium at 250 8C, 10 8C/min from 250 to
400 8C with equilibrium at 400 8C and 25 8C/min from 400 to
1000 8C.
3. Results and discussion
3.1. Surface morphology of Mg(OH)2
The surface morphology of Mg(OH)2 micro-/nanostructures
is analyzed from SEM images. The Mg(OH)2 materials with
various shapes and sizes, synthesized at different hydrothermal
reaction conditions are listed in Table 1. Fig. 1 shows the SEM
images of Mg(OH)2 microparticles synthesized at temperatures
of 180, 200, and 250 8C for 24 and 48 h, respectively. The
Mg(OH)2 product synthesized at 180 8C for 24 h shows wide
range of size distribution from hexagonal nanodisks to
microdisks, which vary from about 120 nm to 4 mm in width
and 75–150 nm in thickness (Fig. 1(a)). As the synthesis time
increased to 48 h (Fig. 1(b)), the surface morphology changes
from micro-/nanodisks to polyhedrons, which have 14 faces.
These polyhedrons also show a wide range of size distribution
with varying widths of around 200 nm to 2.5 mm and
thicknesses of 170 nm to �2 mm. At the hydrothermal
treatment temperature of 200 8C, the Mg(OH)2 particles still
maintain polyhedron shape similar to the materials synthesized
at 180 8C, but with a slight decrease in size. The polyhedrons
produced at 200 8C for a hydrothermal reaction with duration of
24 h have widths of 250 nm to 2.3 mm and thicknesses of
around 150 nm to 1.7 mm (Fig. 1(c)). On the other hand, the
polyhedrons formed for the duration of 48 h are about 340 nm
to 2.55 mm wide and 130 nm to 1.4 mm thick (Fig. 1(d)). At the
highest synthesis temperature of 250 8C, the particles
produced for 24 h have widths of 170 nm to 2.2 mm and
thicknesses of around 125–760 nm (Fig. 1(e)). The particles at
this synthesis condition have a large quantity of nanostructures
rather than microstructures and also show a wide range of
particle size distribution. Mg(OH)2 material formed at 250 8Cfor 48 h are around 380 nm to 1.7 mm wide and 210 nm to

Table 1
Synthesis conditions of Mg(OH)2 materials and the experimental data obtained from SEM, TEM and XRD analysis.
Sample Temp
(8C)
Time
(h)
Morphology
(from SEM)
Particle size
(from TEM)
Crystallite size (nm, from XRD) I001/I101 I001/I110
(1 0 1) (0 0 1)
1 180 24 Microdisks – – – – –
2 180 48 Polyhedrons – – – – –
3 200 03 Microdisks* �3 mm 28.9 44.1 2.03 9.48
4 200 12 Nanodisks* 35–150 nm 23.3 32.8 0.77 2.73
5 200 24 Polyhedrons – – – – –
6 200 48 Polyhedrons* �1 mm 27.7 41.4 0.99 4.4
7 250 24 Polyhedrons – – – – –
8 250 48 Polyhedrons – – – – –
* Presented in detail in Section 3.
L. Kumari et al. / Ceramics International 35 (2009) 3355–3364 3357
1.1 mm thick (Fig. 1(f)). From the SEM analysis, it is observed
that as the hydrothermal treatment temperature and reaction
duration increases, the particle size distribution decreases. At
the synthesis temperature of 200 8C, with an increase in the
Fig. 1. SEM images of Mg(OH)2 microstructures synthesized at different hydrother
200 8C, 48 h; (e) 250 8C, 24 h; and (f) 250 8C, 48 h. The scale bar is 1 mm.
treatment time, the polyhedron thickness range and particle
size distribution range decreases. The polyhedron width to
thickness ratio is also very well maintained at 200 8C. Hence,
the hydrothermal reaction temperature of 200 8C is best suited
mal reaction conditions: (a) 180 8C, 24 h; (b) 180 8C, 48 h; (c) 200 8C, 24 h; (d)

Fig. 2. SEM images of Mg(OH)2 micro-/nanostructures produced at different hydrothermal synthesis conditions: (a) low-magnification, sample 3; (b) high-
magnification, sample 3; Inset shows the plane view of the single microdisk; (c) low-magnification, sample 4 and (d) high-magnification, sample 4. Inset is the
enlarged view of the nanodisks in sample 4.
L. Kumari et al. / Ceramics International 35 (2009) 3355–33643358
for the synthesis of Mg(OH)2 particles with better size
distribution.
From various synthesis trials of Mg(OH)2 material, it has
been confirmed that 200 8C is the optimum temperature at
Fig. 3. SEM images of Mg(OH)2 micro-/nanostructures synthesized at 200 8C for 24
NaOH: (a) low-magnification, 0.4 M (b) high-magnification, 0.4 M, (c) 0.8 M and
which the effect of hydrothermal reaction duration can be very
well observed. Hence, the Mg(OH)2 material was also produced
for low synthesis duration of 3 and 12 h to understand the effect
of reaction time on the microstructure. Fig. 2 shows SEM
h with addition of 0.1 g of urea, 0.1 g PEG and varying molar concentration of
(d) 2.0 M.

Fig. 4. XRD patterns of Mg(OH)2 micro-/nanostructures synthesized at 200 8Cfor different hydrothermal treatment durations of 3, 12 and 48 h (sample 3, 4 and
6, respectively).
L. Kumari et al. / Ceramics International 35 (2009) 3355–3364 3359
images of Mg(OH)2 particles synthesized at 200 8C for 3 and
12 h, respectively. Fig. 2(a) represents the low-magnification
SEM image of the material synthesized for 3 h (sample 3),
which shows the large scale view of the obtained product and
Fig. 2(b) represents the high-magnification SEM image of the
aforementioned sample. Sample 3 consists of hexagonal
microdisks of varying width, from 1.0 to 3.5 mm and a
thickness of about 500 nm. The inset of Fig. 2(b) shows a single
hexagonal microdisk with a width of about 2.5 mm. The
Mg(OH)2 particle synthesized at 200 8C for 12 h (Fig. 2(c) and
(d), sample 4) shows a contrast in surface morphology as
compared to that of the samples formed at other synthesis
conditions. Sample 4 depicts the formation of hexagonal
nanodisks [24] of about 60–140 nm wide and around 45 nm
thick. The overall hexagonal morphology of these disk-like
particles is consistent with the hexagonal crystallographic
characteristics of Brucite. The inset of Fig. 2(d) is a magnified
view of the SEM image of sample 4 in Fig. 2(d). From the SEM
images, it is evident that with an increase in the reaction time
from 3 to 12 h, the Mg(OH)2 particle sizes scale down from
microdisks to nanodisks. Also, the samples synthesized for 12 h
show a reduced particle size distribution as compared to the
sample produced for 3 h. The thickness of the Mg(OH)2
particles synthesized for 3 and 12 h are well controlled as
compared to that of the samples synthesized for 24 and 48 h
(Fig. 1(c) and (d)), which shows a wide range of thickness
variation.
Previous works on the synthesis of various kinds of metal
oxide nanostructures have utilized surfactants or structure
directing agents to control the size and shape of the
synthesized material. In the present work, the effect of the
addition of urea and PEG on the size and shape of the
Mg(OH)2 particles has also been studied. Fig. 3 represents the
SEM images of Mg(OH)2 material synthesized at 200 8C for
24 h with a varying molar concentration of NaOH (0.4–
2.0 M) and with the addition of urea and PEG. The low-
magnification (Fig. 3(a)) and high-magnification (Fig. 3(b))
SEM images of the Mg(OH)2 sample synthesized with 0.4 M
NaOH shows nanoparticles of varying size, with widths of
70–780 nm and thicknesses of 30–450 nm. The increase in
NaOH concentration to 0.8 M and then to 2.0 M produces
Mg(OH)2 microdisks. The material obtained with 0.8 M
NaOH (Fig. 3(c)) consists of microdisks with very large
widths, varying from 1.0 to 14 mm and having a thickness of
about 1 mm. The Mg(OH)2 sample synthesized with 2 M
NaOH (Fig. 3(d)) also has microdisks that are about 1.0–
15 mm wide and 1.7 mm thick. Hence, low molar concentra-
tion of NaOH is preferable for the synthesis of nanoparticles
using surfactants. It is evident from the SEM analysis that the
addition of urea and PEG are advantageous in controlling the
nanoparticles’ growth. The Mg(OH)2 material synthesized at
200 8C for 24 h without PEG and urea reveal polyhedrons
(microparticles) with large particle size variation (Fig. 1(c)),
whereas the sample formed at similar synthesis conditions
using PEG and urea reveal nanoparticles. Hence, optimized
synthesis conditions can account for a controlled growth of
nanoparticles.
3.2. X-ray diffraction analysis of Mg(OH)2
The formation of particles from the hydrothermal route has
some very interesting characteristics. Even a slight variation in
the synthesis conditions will strongly affect the structural and
morphological features of the resulting Mg(OH)2 materials.
The as-prepared Mg(OH)2 samples which are in the form of
small flakes are gently crushed for the XRD measurement.
XRD patterns for Mg(OH)2 micro-/nanoparticles synthesized at
200 8C for 3, 12 and 48 h (sample 3, 4 and 6, respectively) are
shown in Fig. 4 (normalized intensity). All diffraction peaks in
Fig. 4 can be indexed to the hexagonal Brucite structure of
Mg(OH)2 (JCPDS 7-239) with lattice constants of a = 3.148 A
and c = 4.787 A. No peaks from other phases are observed,
indicating a high purity of the synthesized material. The sharp
peaks observed from the XRD pattern indicate that the
Mg(OH)2 particle has a sufficiently large grain size.
The mean crystallite size and the intensity ratio of reflections
(0 0 1) to (1 0 1) and (1 1 0) for different samples (I001/I101,
I001/I110) are listed in Table 1. From the XRD patterns, it is
notable that the (0 0 1) peak became unusually strong and the
relative intensity between (0 0 1) and (1 0 1) changed during
the material synthesis duration. According to the standard file,
the (1 0 1) peak should be the strongest one instead of (0 0 1) as
noticed in our results, which reflects that the growth of crystals
would be confined along the (0 0 1) direction. For sample 3, the
intensity of the peak (0 0 1) is much larger than the (1 0 1) peak,
whereas for sample 4, the intensity of the (0 0 1) peak is smaller
than the (1 0 1) peak. On the other hand, sample 6 shows almost
comparable intensities for the (0 0 1) and (1 0 1) peaks
(Table 1). The value of the I001/I101 ratio for sample 3, 4 and
6 are 2.03, 0.77 and 0.99, respectively, indicating the
dominance of the (0 0 1) plane for sample 3 (Table 1). The
diffraction peaks for sample 4 have a low intensity as compared
to that of sample 3 and sample 6, indicating the reduced
crystallinity in sample 4, which can be attributed to the porous
nature of the synthesized material (Section 3.3). The slight peak
broadening for sample 4 can be assigned to the small grain size

L. Kumari et al. / Ceramics International 35 (2009) 3355–33643360
of Mg(OH)2 particles. The crystallite size is determined by
means of the Debye-Scherrer formula [25] based on the full
width at half-maximum (FWHM). The estimated crystallite
sizes for samples 3, 4 and 6 corresponding to the (0 0 1) plane
are 44.1, 32.8 and 41.4 nm, respectively.
Moreover, from the intensities of the (0 0 1) and (1 1 0)
reflection we can get a possible indication of the orientation of
the particles. Usually in a hexagonal symmetry system, the
normal direction of lamellar particles is (0 0 1). The (0 0 1)
diffraction of sample 3 (microdisks) is stronger than that of
sample 4 (nanodisks), and the (1 1 0) diffraction of sample 4 is
stronger than that of sample 3. In addition, the I001/I110 ratio for
sample 4 and sample 6 are 2.7 and 4.4, respectively, while
sample 3 exhibits a higher value of 9.5, indicating a more
pronounced orientation of the microdisks towards the incident
X-ray radiation. The crystallite sizes determined for samples 3,
4 and 6 corresponding to the (1 0 1) plane, are 28.9, 23.3 and
27.7 nm, respectively.
3.3. Structural analysis of Mg(OH)2 by TEM
Fig. 5 illustrates the TEM images of sample 3 and sample 6.
Fig. 5(a) represents the TEM image of sample 6 indicating that
Fig. 5. TEM, HRTEM and SAED images of Mg(OH)2 microstructures synthesized
polyhedron of sample 6 (48 h), (b) HRTEM image of sample 6 showing lattice
magnification TEM image of single microdisk of sample 3 (3 h) and (d) SAED patt
the clear hexagonal facets of the single polyhedron are about
900 nm wide. The HRTEM image of sample 6 acquired in the
area indicated by the open box in Fig. 5(a) is shown in Fig. 5(b).
The lattice fringes (Fig. 5(b)) are separated by a distance of
0.237 nm which can be attributed to the (1 0 1) plane of
hexagonal phase of Mg(OH)2. Fig. 5(c) is the TEM image of
sample 3 depicting a single microdisk with a width around
3.25 mm and blunt hexagonal facets. The hexagonal spot
patterns in the SAED (Fig. 5(d)) represent the [0 0 1] zone axis
diffraction of the microdisks.
Fig. 6(a) illustrates the low-magnification TEM image of
sample 4. The widths of these nanodisks are in the range of 35–
150 nm. Fig. 6(b) shows an individual Mg(OH)2 nanodisk with
a hexagonal outline having a width of around 86 nm. The
bumpy surface of the nanodisk indicates that it is composed of
many primary building blocks (nanoparticles). The sixfold
symmetry of the corresponding SAED pattern (Fig. 6(c)),
which could be indexed to the [1 0 1] zone axis diffraction of
the nanodisk, implies a better oriented arrangement of these
primary blocks. From the HRTEM image in Fig. 6(d), slight
disorientations in the fringe pattern are noticed; variations in
the contrast reveal the presence of porosity and the internal
interfaces between nanoparticles (mesopores as indicated by
at 200 8C for different durations. (a) High-magnification TEM image of single
fringes separated by 0.237 nm corresponding to the (1 0 1) plane, (c) High-
ern of sample 3 representing the [0 0 1] zone axis diffraction of the microdisks.

Fig. 6. (a) Low-magnification TEM image of nanodisks synthesized at 200 8C for 12 h (sample 4), (b) High-magnification TEM image of single nanodisk showing
porous structure, (c) SAED pattern indicating the [0 0 1] zone axis diffraction of the nanodisks, and (d) HRTEM image of nanodisk with lattice fringes separated by
0.236 nm corresponding to the (1 0 1) plane of Mg(OH)2.
L. Kumari et al. / Ceramics International 35 (2009) 3355–3364 3361
the arrows) [24,26]. The porous nature of sample 4 is also
confirmed by the reduced crystallinity as observed in the XRD
pattern (Fig. 4). The lattice fringes in the HRTEM image
(Fig. 6(d)) are separated by an interplanar distance of 0.236 nm
representing the (1 0 1) plane of Mg(OH)2.
3.4. UV–vis absorption and photoluminescence of
Mg(OH)2 nanodisks
Due to the nanostructure and appreciable particle size
distribution of the Mg(OH)2 nanodisks formed at 200 8C for
12 h, the optical properties of these nanodisks are studied in
great detail. UV–vis absorption and photoluminescence spectra
were obtained at room temperature for sample 4 consisting of
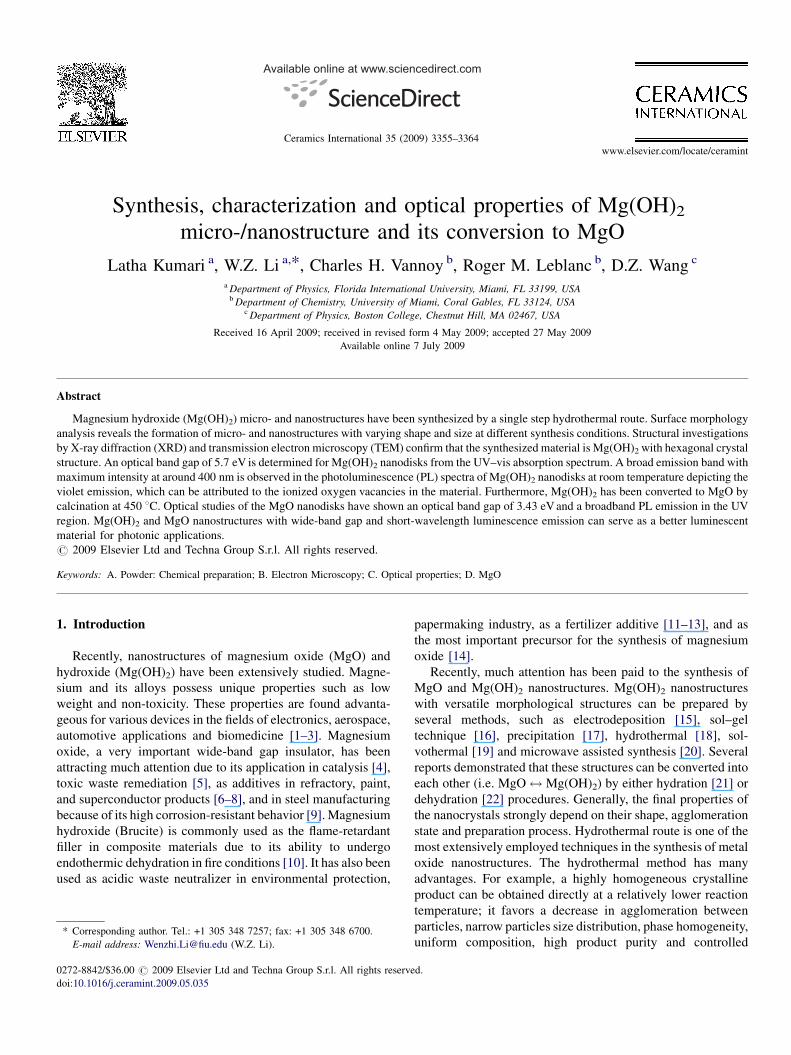
Mg(OH)2 nanodisks. Fig. 7(a) shows the UV–vis absorption
spectrum for sample 4 in the wavelength range of 200–700 nm
depicting the enhanced absorbance in the low (UV) wavelength
region. The dependence of the absorption coefficient (a) on the
photon energy (hg) in the band-edge spectral region for a direct
transition is given by the relation:
ahg ¼ Const ðhg � EgÞ1=2
where a is the absorption coefficient, h is the Planck’s constant,
g is the frequency of light and Eg is the band gap of the solid
[27]. The inset of Fig. 7(a) shows (ahg)2 vs. photon energy plot
for the nanodisks and a direct energy band gap of 5.7 eV was
determined from the plot. A Photoluminescence spectrum
(Fig. 7(b)) was obtained for Mg(OH)2 nanodisks (sample 4)
in the wavelength range of 330–500 nm with an excitation
wavelength of 290 nm. The PL emission spectrum of the
nanodisks is fitted to four Gaussian peaks centered at 362,
387, 410 and 434 nm, which can be attributed to the transitions
involving various Mg2+ states and oxygen states. It can be seen
that the Gaussian curves fit the experimental data perfectly. The
emission band with a peak maximum at around 434 nm is
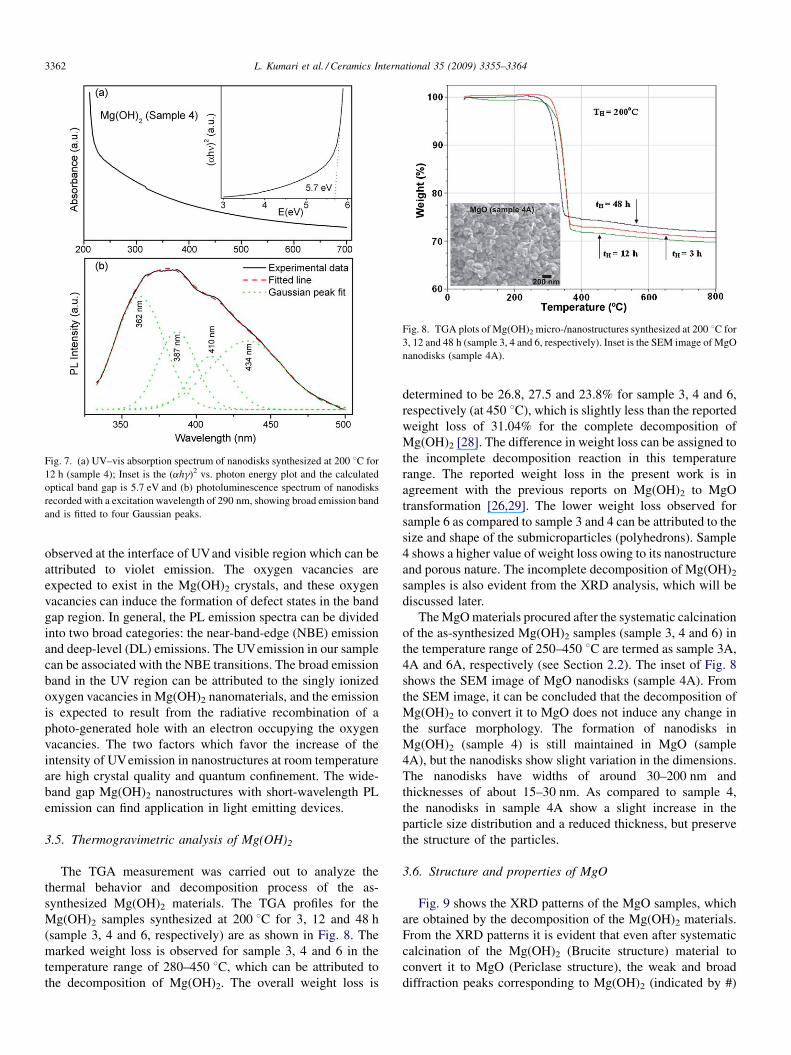
Fig. 7. (a) UV–vis absorption spectrum of nanodisks synthesized at 200 8C for
12 h (sample 4); Inset is the (ahg)2 vs. photon energy plot and the calculated
optical band gap is 5.7 eV and (b) photoluminescence spectrum of nanodisks
recorded with a excitation wavelength of 290 nm, showing broad emission band
and is fitted to four Gaussian peaks.
Fig. 8. TGA plots of Mg(OH)2 micro-/nanostructures synthesized at 200 8C for
3, 12 and 48 h (sample 3, 4 and 6, respectively). Inset is the SEM image of MgO
nanodisks (sample 4A).
L. Kumari et al. / Ceramics International 35 (2009) 3355–33643362
observed at the interface of UVand visible region which can be
attributed to violet emission. The oxygen vacancies are
expected to exist in the Mg(OH)2 crystals, and these oxygen
vacancies can induce the formation of defect states in the band
gap region. In general, the PL emission spectra can be divided
into two broad categories: the near-band-edge (NBE) emission
and deep-level (DL) emissions. The UVemission in our sample
can be associated with the NBE transitions. The broad emission
band in the UV region can be attributed to the singly ionized
oxygen vacancies in Mg(OH)2 nanomaterials, and the emission
is expected to result from the radiative recombination of a
photo-generated hole with an electron occupying the oxygen
vacancies. The two factors which favor the increase of the
intensity of UVemission in nanostructures at room temperature
are high crystal quality and quantum confinement. The wide-
band gap Mg(OH)2 nanostructures with short-wavelength PL
emission can find application in light emitting devices.
3.5. Thermogravimetric analysis of Mg(OH)2
The TGA measurement was carried out to analyze the
thermal behavior and decomposition process of the as-
synthesized Mg(OH)2 materials. The TGA profiles for the
Mg(OH)2 samples synthesized at 200 8C for 3, 12 and 48 h
(sample 3, 4 and 6, respectively) are as shown in Fig. 8. The
marked weight loss is observed for sample 3, 4 and 6 in the
temperature range of 280–450 8C, which can be attributed to
the decomposition of Mg(OH)2. The overall weight loss is
determined to be 26.8, 27.5 and 23.8% for sample 3, 4 and 6,
respectively (at 450 8C), which is slightly less than the reported
weight loss of 31.04% for the complete decomposition of
Mg(OH)2 [28]. The difference in weight loss can be assigned to
the incomplete decomposition reaction in this temperature
range. The reported weight loss in the present work is in
agreement with the previous reports on Mg(OH)2 to MgO
transformation [26,29]. The lower weight loss observed for
sample 6 as compared to sample 3 and 4 can be attributed to the
size and shape of the submicroparticles (polyhedrons). Sample
4 shows a higher value of weight loss owing to its nanostructure
and porous nature. The incomplete decomposition of Mg(OH)2
samples is also evident from the XRD analysis, which will be
discussed later.
The MgO materials procured after the systematic calcination
of the as-synthesized Mg(OH)2 samples (sample 3, 4 and 6) in
the temperature range of 250–450 8C are termed as sample 3A,
4A and 6A, respectively (see Section 2.2). The inset of Fig. 8
shows the SEM image of MgO nanodisks (sample 4A). From
the SEM image, it can be concluded that the decomposition of
Mg(OH)2 to convert it to MgO does not induce any change in
the surface morphology. The formation of nanodisks in
Mg(OH)2 (sample 4) is still maintained in MgO (sample
4A), but the nanodisks show slight variation in the dimensions.
The nanodisks have widths of around 30–200 nm and
thicknesses of about 15–30 nm. As compared to sample 4,
the nanodisks in sample 4A show a slight increase in the
particle size distribution and a reduced thickness, but preserve
the structure of the particles.
3.6. Structure and properties of MgO
Fig. 9 shows the XRD patterns of the MgO samples, which
are obtained by the decomposition of the Mg(OH)2 materials.
From the XRD patterns it is evident that even after systematic
calcination of the Mg(OH)2 (Brucite structure) material to
convert it to MgO (Periclase structure), the weak and broad
diffraction peaks corresponding to Mg(OH)2 (indicated by #)

Fig. 9. XRD profiles of MgO samples (sample 3A, 4A and 6A). The diffraction
peaks corresponding to Mg(OH)2 and MgO are indicated by # and *, respectively.
Fig. 10. (a) UV–vis absorption spectrum of MgO nanodisks (sample 4A); Inset
is the (ahg)2 vs. photon energy plot and the estimated optical band gap is
3.43 eVand (b) photoluminescence spectrum of MgO nanodisks showing broad
emission band and is fitted to four Gaussian peaks.
L. Kumari et al. / Ceramics International 35 (2009) 3355–3364 3363
still exist, which can be attributed to (1 0 1), (1 1 0) and (1 0 2)
planes. The diffraction peaks (marked by *) other than the ones
representing the Mg(OH)2 can be indexed to a face-centered
cubic phase of transformed MgO (JCPDS 87-0653) with a
preferred orientation along the (2 0 0) direction. Sample 4A
shows better crystallinity with sharp diffraction peaks,
confirming the improved transformation of Mg(OH)2 to
MgO as compared to that of sample 3A and sample 6A. The
XRD profile of sample 6A shows prominent peaks correspond-
ing to (1 0 1), (1 1 0) and (1 0 2) reflections of Mg(OH)2. A
weak shoulder peak corresponding to (1 1 1) plane of MgO is
observed for sample 3A and 4A, whereas there appears to be no
shoulder for sample 6A. Hence, calcination even at 450 8C does
not account for the complete decomposition of Mg(OH)2 to
form MgO.
Fig. 10 represents the UV–vis absorption and photolumines-
cence spectra for MgO nanodisks (sample 4A). The UV–vis
absorption spectrum (Fig. 10(a)) was recorded in the wavelength
range of 200–800 nm at room temperature. An absorption peak
in the UV region with a wavelength of 225 nm (5.52 eV) can be
associated to the band-to-band transition in the band gap region.
A direct optical band gap of 3.43 eV was estimated for MgO
nanodisks from the (ahg)2 vs. Energy plot, in the inset of
Fig. 10(a). In bulk form, MgO has a wide-band gap of around
7.3 eV. A large difference in the optical band gap of nanodisks as
compared to their bulk counterpart can be attributed to the
incomplete conversion of Mg(OH)2 to MgO, as discussed in the
TGA and XRD analysis. Fig. 10(b) shows a PL emission
spectrum of the MgO nanodisks obtained in the 330–600 nm
wavelength regions at room temperature. The observed broad
emission band of MgO could be a superimposition of several
peaks. Hence, the broad luminescence band of MgO nanodisks is
fitted to four Gaussian peaks centered at around 354, 382, 415
and 465 nm. Most of these peaks exist in the UV region, and also
at the interface of UV and visible region as compared to the
previous works on MgO nanostructures [30,31] where the
luminescence was observed mainly in the visible region. In the
present work, during the evaporation and oxidation of the as-
synthesized Mg(OH)2 material to form MgO, oxygen vacancies
are generated because of incomplete oxidation. Also, due to the
porous nature of the MgO nanodisks and incomplete oxidation,
the defects associated with oxygen vacancies, Mg vacancies and
interstitials were generated, which would induce the formation of
new defect levels in the band gap region of the MgO nanodisks
and these defect states readily contribute to the luminescence
[32,33]. The peaks corresponding to violet emission at 382 and
415 nm, and the blue emission peak at 465 nm are expected to
originate from the defects in MgO, such as oxygen vacancies
[30–33]. It has been reported [31] that MgO nanostructures
possess more unique optical characteristics than those of the
commercial MgO. Indeed, the PL bands observed for MgO
nanodisks does not correspond to the band gap emission, but can
be attributed to various structural defects. Previous work on high
purity MgO crystals, suggested the luminescence bands at 390
and 530 nm, which were attributed to F (electron oxygen
vacancies) and F+ centers (ionized state of F center), respectively
for an excitation wavelength of 248 nm [32,33]. The PL broad
band of as-prepared porous MgO nanoplates [30] fitted to two
Gaussian peaks centered at around 402 and 455 nm was expected
to originate due to oxygenvacancies. The porous MgO nanodisks
discussed in the present work also show similar features.
4. Conclusions
In summary, the Mg(OH)2 micro-/nanostructures are
synthesized by a hydrothermal route using magnesium salt
as the starting material. Surface morphology analysis confirms
the synthesis of various micro-/nanostructures of Mg(OH)2 at
different hydrothermal reaction conditions. XRD, HRTEM and
SAED studies show that the synthesized Mg(OH)2 material is
of pure hexagonal phase. The present technique provides an

L. Kumari et al. / Ceramics International 35 (2009) 3355–33643364
efficient route for the synthesis of Mg(OH)2 microdisks,
nanodisks and polyhedrons at 200 8C for 3, 12 and 48 h,
respectively, that exhibit controlled morphology, high purity,
uniform composition, and high crystallinity. The UV–vis
spectrum for Mg(OH)2 nanodisks shows an enhanced absorp-
tion intensity in the low wavelength region and an optical band
gap of 5.7 eV is determined from the absorption spectra. The PL
spectra show a broad emission band at the interface of UV and
visible region (violet emission), which can be assigned to the
ionized oxygen vacancies in the synthesized material. Mg(OH)2
was decomposed at 450 8C to obtain MgO. MgO shows an
enhanced optical absorption in the UV region and a broad
luminescence band which originates from the defect states such
as oxygen vacancies in MgO. The Mg(OH)2 and MgO
nanostructures with a wide-band gap and a short-wavelength
luminescence emission can find potential application in
optoelectronic sub-micron devices.
Acknowledgements
W.Z. Li acknowledges the support by the National Science
Foundation under grant DMR-0548061. We would like to thank
Mr. George P. Gomes and Mr. Kevin Hernandez, College of
Engineering and Computing, Florida International University
for their help with TGA measurement.
References
[1] K.U. Kainer, Magnesium Alloys and their Applications, Wiley-VCH,
Weinheim, 2006.
[2] J.E. Gray, B. Luan, Protective coatings on magnesium and its alloys—a
critical review, J. Alloys Compd. 336 (2002) 88–113.
[3] G. Song, D.St. John, Corrosion behaviour of magnesium in ethylene
glycol, Corros. Sci. 46 (2004) 1381–1399.
[4] H. Tsuji, F. Yagi, H. Hattori, H. Kita, Self-condensation of n-butyralde-
hyde over solid base catalysts, J. Catal. 148 (1994) 759–770.
[5] A.N. Copp, Magnesia/magnesite, Bull. Am. Ceram. Soc. 74 (1995) 135–
137.
[6] A. Bhargava, J.A. Alarco, I.D.R. Mackinnon, D. Page, A. Ilyushechkin,
Synthesis and characterization of nanoscale magnesium oxide powders
and their application in thick films of Bi2Sr2CaCu2O8, Mater. Lett. 34
(1998) 133–142.
[7] Y.S. Yuan, M.S. Wong, S.S. Wang, Solid-state processing and phase
development of bulk (MgO)w/BPSCCO high-temperature superconduct-
ing composite, J. Mater. Res. 11 (1996) 8–17.
[8] P.D. Yang, C.M. Lieber, Nanorod-superconductor composites: a pathway
to materials with high critical current densities, Science 273 (1996) 1836–
1840.
[9] B.M. Choudary, R.S. Mulukutla, K.J. Klabunde, Benzylation of aromatic
compounds with different crystallites of MgO, J. Am. Chem. Soc. 125
(2003) 2020–2021.
[10] R.N. Rothon, Magnesium Hydroxide: New Products, Processes and
Applications, Intertech, Portland, MA, 2000.
[11] J.L. Booster, A. Van Sandwijk, M.A. Reuter, Conversion of magnesium
fluoride to magnesium hydroxide, Miner. Eng. 16 (2003) 273–281.
[12] J. Kang, P. Schwendeman, Comparison of the effects of Mg(OH)2
and sucrose on the stability of bovine serum albumin encapsulated in
injectable poly(D,L-lactide-co-glycolide) implants, Biomaterials 23
(2002) 239–245.
[13] R. Richards, W.F. Li, S. Decker, C. Davidson, O. Koper, V. Zaikovski, A.
Volodin, T. Rieker, K.J. Klabunde, Consolidation of metal oxide nano-
crystals. Reactive pellets with controllable pore structure that represent a
new family of porous, inorganic materials, J. Am. Chem. Soc. 122 (2000)
4921–4925.
[14] Y. He, J. Wang, H. Deng, Q. Yin, J. Gong, Comparison of different
methods to prepare MgO whiskers, Ceram. Int. 34 (2008) 1399–1403.
[15] G. Zou, W. Chen, R. Liu, Z. Xu, Morphology-tunable synthesis and
characterizations of Mg(OH)2 films via a cathodic electrochemical pro-
cess, Mater. Chem. Phys. 107 (2008) 85–90.
[16] S. Utamapanya, K.J. Klabunde, J.R. Schlup, Nanoscale metal oxide
particles/clusters as chemical reagents. Synthesis and properties of ultra-
high surface area magnesium hydroxide and magnesium oxide, Chem.
Mater. 3 (1991) 175–181.
[17] J.P. Hsu, A. Nacu, Preparation of submicron-sized Mg(OH)2 particles
through precipitation, Colloids Surf. A 262 (2005) 220–231.
[18] Y.D. Li, M. Sui, Y. Ding, G. Zhang, J. Zhuang, C. Wang, Preparation of
Mg(OH)2 nanorods, Adv. Mater. 12 (2000) 818–821.
[19] W. Fan, S. Sun, L. You, G. Cao, X. Song, W. Zhang, H. Yu, Solvothermal
synthesis of Mg(OH)2 nanotubes using Mg10(OH)18Cl2�5H2O nanowires
as precursors, Mater. Chem. 13 (2003) 3062–3065.
[20] H. Wu, M. Shao, J. Gu, X. Wei, Microwave-assisted synthesis of fibre-like
Mg(OH)2 nanoparticles in aqueous solution at room temperature, Mater.
Lett. 58 (2004) 2166–2169.
[21] W. Feitknecht, H. Braun, Der mechanismus der hydratation von
magnesiumoxid mit wasserdampf, Helv. Chim. Acta 50 (1967) 2040–
2053.
[22] J. Green, Calcination of precipitated Mg(OH)2 to active MgO in the
production of refractory and chemical grade MgO, J. Mater. Sci. 18 (1983)
637–651.
[23] K. Byrappa, T. Adschiri, Hydrothermal technology for nanotechnology,
Prog. Cryst. Growth Charact. Mater. 53 (2007) 117–166.
[24] B. Jia, L. Gao, Morphology transformation of nanoscale magnesium
hydroxide: from nanosheets to nanodisks, J. Am. Ceram. Soc. 89
(2006) 3881–3884.
[25] H.P. Klug, L.E. Alexander, X-ray Diffraction Procedures, Wiley, New
York, 1962.
[26] J.C. Yu, A. Xu, L. Zhang, R. Song, L. Wu, Synthesis and characterization
of porous magnesium hydroxide and oxide nanoplates, J. Phys. Chem. B
108 (2004) 64–70.
[27] J.I. Pankove, Optical Processes in Semiconductors, Dover Publications,
New York, 1971.
[28] J.C. Niepce, G. Watelle, Shear transformation in solid 1! solid 2 + gas
endothermic decompositions, J. Phys. Colloq. 38 (1977) 365–368.
[29] Y. Ding, G. Zhang, H. Wu, B. Hai, L. Wang, Y. Qian, Nanoscale
magnesium hydroxide and magnesium oxide powders: control over size,
shape, and structure via hydrothermal synthesis, Chem. Mater. 13 (2001)
435–440.
[30] H. Niu, Q. Yang, K. Tang, Y. Xie, A simple solution calcination route to
porous MgO nanoplates, Microporous Mesoporous Mater. 96 (2006) 428–
433.
[31] Y. Hao, G. Meng, C. Ye, X. Zhang, L. Zhang, Kinetics-driven growth of
orthogonally branched single-crystalline magnesium oxide nanostruc-
tures, J. Phys. Chem. B 109 (2005) 11204–11208.
[32] G.H. Rosenblatt, M.W. Rowe, G.P. Williams Jr., R.T. Williams, Y. Chen,
Luminescence of F and F+ centers in magnesium oxide, Phys. Rev. B 39
(1989) 10309–10318.
[33] G.P. Summers, T.M. Wilson, B.T. Jeffries, H.T. Tohver, Y. Chen, M.M.
Abraham, Luminescence from oxygen vacancies in MgO crystals thermo-
chemically reduced at high temperatures, Phys. Rev. B 27 (1983) 1283–
1291.