Characterizations of the reflexive spaces in the spirit of James’ Theorem
Upload
khangminh22Category
view
0download
0
Synthesis and Characterizations of SrBi2Ta2O9 Modified
NBT-BT and NBT-KNN Ferroelectric Ceramics near
Morphotropic Phase Boundary
Sridevi Swain
Department of Physics and Astronomy National Institute of Technology Rourkela

Synthesis and Characterizations of SrBi2Ta2O9 Modified
NBT-BT and NBT-KNN Ferroelectric Ceramics near
Morphotropic Phase Boundary
Dissertation submitted to the
National Institute of Technology Rourkela
in partial fulfilment of the requirements
of the degree of
Doctor of Philosophy
in
Physics
by
Sridevi Swain
(Roll Number: 510PH301)
under the supervision of
Prof. Pawan Kumar
December 2015
Department of Physics and Astronomy
National Institute of Technology Rourkela

Physics and Astronomy National Institute of Technology Rourkela
Certificate of Examination
Roll Number: 510PH301
Name: Sridevi Swain
Title of Dissertation: Synthesis and Characterizations of SrBi2Ta2O9 Modified NBT-BT
and NBT-KNN Ferroelectric Ceramics near Morphotropic Phase Boundary.
We the below signed, after checking the dissertation mentioned above and the official
record book (s) of the student, hereby state our approval of the dissertation submitted in
partial fulfillment of the requirements of the degree of Doctor of Philosophy in Physics
and Astronomy at National Institute of Technology Rourkela. We are satisfied with the
volume, quality, correctness, and originality of the work.
Dr. Pawan Kumar Supervisor
Prof. J. Bera Member (DSC)
Dr. D. K. Pradhan Member (DSC)
Dr. S. Jena Member (DSC)
Dr. Muhammad Shahid Anwar Examiner
Dr. D. K. Bisoyi Chairman (DSC)

i
Physics and Astronomy National Institute of Technology Rourkela
Dr. Pawan Kumar December 28, 2015
Associate Professor
Supervisor’s Certificate
This is to certify that the work presented in this dissertation entitled “Synthesis and
Characterizations of SrBi2Ta2O9 Modified NBT-BT and NBT-KNN Ferroelectric Ceramics
near Morphotropic Phase Boundary”, Roll Number 510PH301, is a record of original
research carried out by her under my supervision and guidance in partial fulfilment of the
requirements for the degree of Doctor of Philosophy in Physics. Neither this dissertation
nor any part of it has been submitted for any degree or diploma to any institute or
university in India or abroad.
Pawan Kumar Supervisor

ii
Dedicated to
My Loving Parents

iii
Declaration of Originality
I, Sridevi Swain, Roll Number 510PH301 hereby declare that this dissertation entitled
“Synthesis and Characterizations of SrBi2Ta2O9 Modified NBT-BT and NBT-KNN
Ferroelectric Ceramics near Morphotropic Phase Boundary” represents my original work
carried out as a doctoral student of NIT Rourkela and, to the best of my knowledge, it
contains no material previously published or written by another person, nor any material
presented for the award of any other degree or diploma of NIT Rourkela or any other
institution. Any contribution made to this research by others, with whom I have worked at
NIT Rourkela or elsewhere, is explicitly acknowledged in the dissertation. Works of other
authors cited in this dissertation have been duly acknowledged under the reference section.
I have also submitted my original research records to the scrutiny committee for evaluation
of my dissertation.
I am fully aware that in the case of any non-compliance detected in future, the Senate of
NIT Rourkela may withdraw the degree awarded to me on the basis of the present
dissertation.
December 28, 2015 Sridevi Swain
NIT Rourkela

iv
Acknowledgments
It is with immense gratitude that I acknowledge the support and help of my advisor
Dr. Pawan Kumar, who is the most influential person in my academic life. He was always
available for assisting me and provided with all kinds of facilities for carrying out this
research work. According to me, he seems to have the magnetic power to convert
complicated things simple. I am grateful to him for his guidance, motivation and for so
much I have learned from him.
It gives me great pleasure to acknowledge my DSC committee members, Dr. D. K.
Bisoyi, Dr. S. Jena, Prof. J. Bera and Dr. D. K. Pradhan for their valuable suggestions and
encouragements during the course of this work.
I share the credit for my work with Prof. S. K. Sarangi, Director, NIT Rourkela for
allowing me to utilize all the relevant facilities available in the Institute in general and
Department of Physics & Astronomy in particular.
I express my gratitude to all the faculty members of the Department of Physics &
Astronomy for their great support and motivation.
I am extremely thankful to all the supporting and technical staff of the Department
of Physics & Astronomy, Department of Materials and Metallurgical Engineering and
Department of Ceramic Engineering for their valuable help without which I could not have
completed my work.
I am grateful to the Department of Science and Technology, New Delhi, India for
the financial support provided under the INSPIRE scheme that encouraged me to pursue
my research work successfully.
I am extremely thankful to my laboratory members: Dr. Naresh Kumar, Dr. Prakash
K. Palei, Dr. Subrat K. Kar, Dr. Punyatoya Mishra, Mausumi didi, Chandrasekhar, Rashmi,
Dipika and Buddhadeb for their timely cooperation and encouragements to finish my work.
My thanks also go to all the research scholars of the Department of Physics &
Astronomy, NIT Rourkela.
A special thank goes to my MHRD funded school, Jawahar Navodaya Vidyalaya,
without which I would not have been here today. And also for providing free education and

v
teaching me all the values of life during those precious seven years. Moreover, the
encouragement of my school teachers: Mr. Nepal Roy, Mr. H.K. Giri and Dr. Banamali
Jena, is highly valuable to me till date.
I would be happy to share the support of all my school and college friends
especially Shagufta, Sushant Roul, Neha, Sushant Baral, Rinki, Gita, Soni, Ranjita,
Sugyani, Santosh, Swapnadip and Sashi as a constant source of encouragement and their
confidence in me to complete this work. It also gives me a great pleasure to thank my
friends particularly, Krishna, Sweta, Smruti, Arunima, Dr. Bhabani, Asish who supported,
encouraged and helped me directly or indirectly during this dissertation.
Finally, I would like to express my deepest appreciation to my beloved parents, Mr.
Rabi Narayan Swain and Mrs. Pratima Swain who have never stopped giving me
unconditional love, affection and hope that held me through all the difficulties throughout
my Ph.D. tenure. Then, I owe a deep sense of indebtedness to my sisters Rupa dei and
Lucky, my brother Alok and brother-in-laws Prakash bhaina and Ajay for their much
needed love and continuous support all the time. I am happy to share the love for my
nephews, Ayush & Piyush, also for my cute little niece Ayesha, whose voice always
refreshed my mind whenever I was stressed during my dissertation writing.
I express my whole hearted gratitude to the Almighty God, for giving me all
protection and ability to complete this work.

vi
Abstract
In the scientific community, ferroelectric ceramics have attracted great attention because of their unique dielectric, piezoelectric, pyroelectric and ferroelectric properties. These properties of ferroelectric ceramics make them suitable for various multifunctional device applications. Till date, owing to excellent dielectric, piezoelectric, pyroelectric and ferroelectric properties, the Pb(Ti,Zr)O3(PZT) based ferroelectric ceramics, near morphotropic phase boundary (MPB), are widely used in applications such as actuators, sensors, etc. However, the toxicity, problems in recycling and disposal are the major environmental concerns against the use of lead-based ferroelectric materials. Therefore, there is an urgent need for searching effective lead-free ferroelectrics, whose properties are comparable to those of the well-known PZT based materials. Among the effective lead-free ferroelectrics, the (Na0.5Bi0.5)TiO3(NBT) system has drawn great attention in recent years. Although, the NBT system shows a strong ferroelectric behavior, yet it has some critical limitations such as (i) high coercive field, (ii) high conductivity, (iii) high dielectric loss and (iv) high leakage current, which goes against the use of this system in various device applications. Efforts have been made to overcome these limitations by doping or synthesizing solid solutions with other systems. The solid solution of the (1-x)NBT-xBT system exhibits an MPB at x≈0.07. Similarly, in the solid solution of the (1-x)NBT-xKNN system there exist an MPB at x≈0.07 between the rhombohedral FE phase and a tetragonal AFE phase. Therefore, it is imperative to study structural, dielectric, piezoelectric, ferroelectric, polarization fatigue and leakage current density properties of the (1-x)NBT-xBT and (1-x)NBT-xKNN systems near their respective MPBs. Selected Perovskite Materials
(1-x)Na0.5Bi0.5TiO3-xBaTiO3/NBT-xBT (1-x)Na0.5Bi0.5TiO3-x K0.5Na0.5NbO3/NBT-xKNN
(Where x=0.05, 0.06, 0.07, 0.08)
Solid solutions of the NBT-xBT and NBT-xKNN (where x=0.05, 0.06, 0.07, 0.08) systems were prepared by solid state reaction route. The XRD study confirmed the single perovskite phase in both the NBT-xBT and NBT-xKNN systems at 1000oC and 800 oC calcination temperatures, respectively. No remarkable change in the grain size (average grain size ~2.5μm) was observed with the variation of BT content in the NBT–xBT system. Whereas, in the NBT–xKNN system, the average grain size first increases with the increase of KNN content up to x=0.07 and then starts decreasing for x=0.08. Highest experimental density was found to be ~5.89g/cc (98.30% of the theoretical density (ρth)) and 5.77g/cc (97.81% of the ρth) for x=0.07 compositions of the NBT-xBT and NBT-xKNN systems, respectively. Dielectric study showed existence of both Td (depolarization temperature) and Tm (temperature corresponding to maximum dielectric constant) in all the systems with diffusive phase transition behavior. Dielectric constant (εr) (at 1 kHz frequency) at room temperature (RT) and at Tm were found to be ~2275 and ~5067, respectively for the x=0.07 ceramic samples of the NBT-xBT system. Whereas, for the x=0.07 ceramic samples of the NBT-xKNN system, εr (at 1 kHz frequency) at RT and at Tm were found to be ~2787 and ~4438, respectively. Leakage current density was found to be between 10-7-10-6A/cm2 and

vii
~10-6A/cm2 for all the NBT-xBT and NBT-xKNN ceramics, respectively. In the NBT-xBT system, optimum values of remnant polarization (Pr) ~ 31.71μC/cm2, piezoelectric coefficient (d33) ~105pC/N, electromechanical coupling coefficient (kp) ~0.21 and maximum induced strain% ~0.45 at RT were obtained in the x=0.07 composition. Whereas, optimum values of Pr ~20.61µC/cm2, d33 ~78pC/N, kp ~0.12 and maximum induced strain% ~0.36 were obtained at RT in the x=0.07 composition of the NBT-xKNN system. Bipolar polarization fatigue study confirmed the degradation of all the NBT-xBT and NBT-xKNN ceramics after 107 cycles. Excellent dielectric, piezoelectric and ferroelectric properties confirmed the MPB nature of x=0.07 composition of both the systems. Still, both these systems lack the reliability issues such as polarization fatigue, high coercive field, high leakage current, etc.
On the other hand, bismuth layered structure ferroelectrics (BLSF) such as SrBi2Ta2O9, SrBi2Nb2O9, Bi4Ti3O12, SrBi4Ti4O15, etc., are the natural anti-fatigue materials which can withstand 1012 erase/rewrite operations. A detail structural, dielectric, piezoelectric, ferroelectric, leakage current density and polarization fatigue properties of the effective BLSFs systems were carried out.
Selected BLSF Materials SrBi2Ta2O9/SBT, Sr0.8Bi2.15Ta2O9/SBexT and SrBi2(Ta0.925W0.075)2O9/SBTW
2-layered SBT, SBexT, and SBTW ceramics were synthesized in single phase by solid-state reaction technique. SEM micrographs showed the development of plate-like grains with maximum experimental density ~8.87 g/cc (98 % of the ρth) of the SBexT ceramic samples, sintered at 1200oC/4hr. Enhanced transition temperature (Tc), and better εr and ferroelectric properties were observed in both the SBexT and SBTW ceramic samples compared to the SBT ceramic samples. The dielectric study also showed the sharp transition in both the SBexT and SBTW ceramic samples, whereas a diffused phase transition was observed in the SBT system. From dielectric measurements, highest Tc was obtained in the SBexT system. P-E hysteresis loop study confirmed the ferroelectric nature of all the SBT based ceramic samples. The maximum Pr ~ 8.07μC/cm2 with minimum coercive field (Ec) ~ 15.18kV/cm were obtained in the SBexT ceramic samples. Optimum RT value of d33 ~24pC/N and kp ~ 0.098 were obtained in the SBexT ceramic samples. Reduced leakage current density ~3.14x10⁻⁹A/cm2 was obtained in the SBexT ceramic samples. Bipolar polarization fatigue study confirmed the negligible degradation of all the BLSF materials even after 109 cycles.
Though, the MPB compositions of the NBT-xBT and NBT-xKNN systems exhibit high dielectric, piezoelectric and ferroelectric properties but they show high leakage current density and large degradation of polarization value after repeated cycles. On the contrary, SBexT ceramic samples showed lower leakage current density and better polarization fatigue resistance after repeated cycles. But, the Pr value of the SBexT samples is lower compared to the MPB compositions of the NBT-xBT and NBT-xKNN systems. Therefore, for retaining comparably higher value of Pr and improving the polarization fatigue resistance, these MPB compositions were further modified by SBexT system.

viii
Selected Perovskite-BLSF Materials (1-ϕ)(0.93 Na0.5Bi0.5TiO3-0.07 BaTiO3/NBT-BT)-ϕSr0.8Bi2.15Ta2O9 (1-ϕ)(0.93 Na0.5Bi0.5TiO3-0.07 K0.5Na0.5NbO3/NBT-KNN)-ϕ Sr0.8Bi2.15Ta2O9
(Where ϕ= 2, 4, 8, 12, 16 wt. %)
(1-ϕ)(NBT-BT)-ϕSBexT and (1-ϕ)(NBT-KNN)- ϕSBexT (where ϕ= 2, 4, 8, 12, 16 wt. %) ceramic composites were prepared by solid state reaction route. XRD studies showed the co-existence of individual phases in both the ceramic composite series. SEM study showed the development of plate-like grains for higher content of SBexT phase in both the composite systems. RT εr and tanδ values decreased and diffuse phase transition nature increased with the increase of SBexT content in both the ceramic composite systems. In both the ceramic composite systems, the leakage current density was found to be ~10-7 to 10-8 A/cm2, which is one to two order less than the NBT-BT and NBT-KNN systems. Maximum induced strain% decreased with the increase of SBexT content in both the ceramic composite systems. P-E hysteresis loops of the SBexT modified NBT-KNN ceramics showed the retention of good Pr values. Polarization fatigue studies showed the improvement of polarization fatigue resistance with the increase of SBexT content in both the ceramic composite systems. Improvement in leakage currents density, fatigue resistance, retention of high εr, Pr, d33 and kp for ϕ ≤ 4wt. % of (1-ϕ) (NBT-KNN)-ϕSBexT ceramic composites suggested its usefulness in capacitor, piezoelectric and NVRAM applications.
Keywords: XRD; SEM; MPB; Perovskite; BLSF; Dielectric; Piezoelectric; Ferroelectric; Polarization Fatigue.
The present work is reported in the following chapters Chapter I presents a short introduction to the phenomenon of general ferroelectricity, piezoelectricity, the significance of lead-free perovskite materials with MPB, ceramic-ceramic composite materials, and their applications. The motivation and objective of this thesis work is also included in this chapter. Chapter II describes the experimental details and the investigated parameters. Chapter III presents the detail description of the synthesis of ceramics and ceramic-ceramic composites. The experimental techniques used to characterize the synthesized materials are also presented in this chapter. Chapter IV describes the dielectric, piezoelectric and ferroelectric studies of NBT-xBT and NBT-xKNN ceramics near their respective MPB. Chapter V describes the dielectric, piezoelectric and ferroelectric properties of SBT based ceramics. Chapter VI describes the dielectric, piezoelectric and ferroelectric properties of SBexT modified NBT-xBT (x=0.07) and NBT-xKNN (x=0.07) ceramic composites. Chapter VII presents the major conclusions of the present work with future work recommendations.

ix
Contents
Supervisor's Certificate i
Dedication ii
Declaration of Originality iii
Acknowledgment iv
Abstract vi
List of Figures xv
List of Tables xx
Symbols and Abbreviations xxiii
1. Introduction and Literature Survey 1.1 Introduction ………………………………………..............................................1
1.2 Background of Ferroelectric Phenomena and Related Definitions……………..2
1.2.1 Dielectric Materials……………………………………………………….2
1.2.2 Classification of Materials based on Symmetry Principle…………...........3
1.2.3 Piezoelectric Materials ………………………………………………........5
1.2.4 Pyroelectric Materials………………………………………………..........6
1.2.5 Ferroelectric Materials……………………………………………….........6
1.2.5.1 Ferroelectric Domains and Domain Walls…………………............7
1.2.5.2 Ferroelectrics for Electronic Applications…………….....................8
1.2.5.3 Non-Volatile Ferroelectric Random Access Memories
(NVFRAM)…………………………………………………............8
1.2.5.4 Fatigue in Ferroelectric Ceramics ………………………….............9
1.3 Classification of Ferroelectrics…………………………………………...........10
1.3.1 Ferroelectrics with Perovskite Structure…………………………………10
1.3.2 Ferroelectrics with Bismuth Layer Structure………………….................11
1.3.3 Ferroelectrics with Tungsten Bronze Structure…………….....................12

x
1.3.4 Ferroelectrics with Pyrochlore Structure………………………………...13
1.4 Literature Review………………………………………………………...........14
1.4.1 Lead-Free Ferroelectric Ceramics……………………………….............14
1.4.2 Na0.5Bi0.5TiO3 (NBT) System……………………………………............15
1.4.2.1 NBT based Solid-Solutions with MPB……………………............16
1.4.3 BLSF Systems……………………………………………………...........18
1.4.3.1 SrBi2Ta2O9 (SBT) based Systems......……………………………18
1.4.4 Ferroelectric Ceramic-Ceramic Composites……………………..............19
1.5 Motivation………………………………………………………………...........20
1.6 Objectives and Scope of the Present Work………………………….................20
1.7 Materials under Present Investigation………………………………….............21
References………………………………………………………………….............22
2. Synthesis Route and Investigated Parameters 2.1 Introduction…………………………………………………………….............28
2.2 Synthesis Procedure……………………………………………………............28
2.2.1 Solid State Reaction Route (SSRR)………………………………...........29
2.2.1.1 Precursors in Stoichiometric Proportion……………………..........30
2.2.1.2 Ball Milling and Grinding…………………………………............30
2.2.1.3 Calcination……………………………………………...................30
2.2.1.4 Binder Addition……………………………………………...........30
2.2.1.5 Sintering…………………………………………………...............31
2.2.1.6 Electroding…………………………………………………...........31
2.3 Characterization Techniques...............................................................................32
2.3.1 Thermo Gravimetric Analysis and Differential Scanning Calorimetry…..32
2.3.2 X-Ray Diffraction Study…………………………………………………33
2.3.3 Density Measurements……………………………………………….......34
2.3.4 Scanning Electron Microscope...................................................................35
2.3.5 Dielectric Characterizations........................................................................36
2.3.5.1 Dielectric Constant…………………………………………...........36
2.3.5.2 Dielectric Loss.................................................................................38
2.3.6 Leakage Current Study................................................................................39

xi
2.3.7 Piezoelectric Study…………………………………………………..........40
2.3.7.1 Strain vs. Electric Field Behavior ………………………................40
2.3.7.2 Poling………………………………………………………............42
2.3.7.3 Piezoelectric Coefficients.................................................................43
2.3.7.3.1 Piezoelectric Charge Coefficient.......................................43
2.3.7.3.2 Electromechanical Coupling Coefficient………...............44
2.3.8 Ferroelectric P-E Loop Study.........................................................................45
2.3.9 Polarization Fatigue Study..............................................................................47
References…………………………………………………………………….........49
3. Experimental Details 3.1 Introduction…………………………………………………………….............52
3.2 Synthesis of the Selected Ceramics ………… …………………………..........52
3.3 Characterization Techniques Used……………………………………….........54
3.3.1 Thermal Analysis………………………………………………………...54
3.3.2 Structural Study……………………………………………………….....55
3.3.3 Density and Morphology Study…………………………………….........55
3.3.4 Electroding of the Samples………………………………………............56
3.3.5 Poling……………………………………………………………….........56
3.3.6 Dielectric Measurements………………………………………………...57
3.3.7 Polarization vs. Electric Field (P-E) Measurements………………..........57
3.3.8 Piezoelectric Constant (d33) Measurements………………………...........59
3.3.9 Resonance and Anti-resonance Frequency Measurement……….............60
3.3.10 Strain vs. Electric Field Measurements…………………………...........60
3.3.11 Leakage Current Measurement……………………………………........61
3.3.12 Polarization Fatigue Measurement………………………………..........62
References…………………………………………………………………….........64
4. Dielectric, Piezoelectric, and Ferroelectric Properties of
NBT-xBT and NBT- xKNN Ceramics near MPB 4.1 Introduction……………………………………………………………….........65
4.2 Thermal Analysis…………………………………………………………........65
4.3 XRD Study……………………………………………………………………..66

xii
4.3.1 XRD Study of the NBT-xBT Ceramics…………………………………..66
4.3.2 XRD Study of the NBT-xKNN Ceramics…………………………..........69
4.4 Density and Morphological Study………………………………………..........71
4.4.1 Density and Morphological Study of the NBT-xBT Ceramics………......71
4.4.2 Density and Morphological Study of the NBT-xKNN Ceramics…...........73
4.5 Dielectric Study………………………………………………………………..75
4.5.1 Temperature Dependent Dielectric Properties of NBT-xBT
Ceramics....................................................................................................75
4.5.2 Temperature Dependent Dielectric Properties of NBT-xKNN
Ceramic......................................................................................................77
4.6 Leakage Current Study…………………………………………………...........79
4.6.1 Leakage Current Properties of the NBT-xBT Ceramics………...............79
4.6.2 Leakage Current Properties of the NBT-xKNN Ceramics……………...80
4.7 Piezoelectric Study……………………………………………………….........81
4.7.1 Piezoelectric Study of NBT-xBT Ceramics……………………...............81
4.7.1.1 Strain vs. Electric Field Study ………………………………........81
4.7.1.2 Piezoelectric coefficients (d33 and kp) Study………………...........82
4.7.2 Piezoelectric Study of the NBT-xKNN Ceramics……………….............85
4.7.2.1 Strain vs. Electric Field Study………………………………..........85
4.7.2.2 Piezoelectric coefficients (d33 and kp) Study………………............86
4.8 Ferroelectric Study..……………………………………………………...........87
4.8.1 Ferroelectric Study of NBT-xBT Ceramics.………………………..........87
4.8.2 Ferroelectric Study of NBT-xKNN Ceramics.……………………..........89
4.9 Polarization Fatigue Study.……………………………………………….........90
4.9.1 Polarization Fatigue Study of NBT-xBT Ceramics.………………..........90
4.9.2 Polarization Fatigue Study of NBT-xKNN Ceramics.……………..........92
References…………………………………………………………………….........95
5. Dielectric, Piezoelectric, and Ferroelectric Properties of the
2-Layered SrBi2Ta2O9 based Ceramics 5.1 Introduction……………………………………………………………….........98

xiii
5.2 Thermal Analysis…………………………………………………………........98
5.3 XRD Analysis………………………………………………………….............99
5.4 Microstructure and Density Study………………………………………........101
5.5 Dielectric Study…………………………………………………………........103
5.6 Leakage Current Analysis …………………………………………………....106
5.7 Piezoelectric Study……………………………………………………...........107
5.8 Ferroelectric Study………………………………………………………........109
5.9 Polarization Fatigue Study……………………………………………………110
References…………………………………………………………………….......112
6. Dielectric, Piezoelectric and Ferroelectric Properties of
SBexT modified NBT-xBT and NBT-xKNN (x=0.07) Ceramics 6.1 Introduction…………………………………………………………………...114
6.2 XRD Study……………………………………………………………............114
6.2.1 XRD Study of the (1-ϕ)(NBT-BT)-ϕSBexT Ceramics...………………..114
6.2.2 XRD Study of the (1-ϕ)(NBT-KNN)-ϕSBexT Ceramics...……..............116
6.3 Density and Morphological Study.…………………………………………...116
6.3.1 Density and Morphological Study of the (1-ϕ) (NBT-BT)-ϕSBexT
Ceramics……………………………………………………………......116
6.3.2 Density and Morphological Study of (1-ϕ) (NBT-KNN)-ϕSBexT
Ceramics ………………………………………………………….........118
6.4 Dielectric Study....……………………………………………………............120
6.4.1 Temperature Dependent Dielectric Properties of (1-ϕ) (NBT-BT)-
ϕSBexT Ceramics………………………………………………….........120
6.4.2 Temperature Dependent Dielectric Properties of (1-ϕ) (NBT-KNN)-
ϕSBexT Ceramics …………………………………………………........122
6.5 Leakage Current Study……………………………………………………….124
6.5.1 Leakage Current Properties of (1-ϕ) (NBT-BT)-ϕSBexT Ceramics.........124
6.5.2 Leakage Current Properties of (1-ϕ) (NBT-KNN)-ϕSBexT Ceramics….126
6.6 Piezoelectric Study...……………………………………………………........127
6.6.1 Piezoelectric Study of (1-ϕ) (NBT-BT)-ϕSBexT Ceramics……………..127
6.6.2 Piezoelectric Study of (1-ϕ) (NBT-KNN)-ϕSBexT Ceramics..……........129

xiv
6.7 Ferroelectric Study……………………………………………………............130
6.7.1 Ferroelectric Study of (1-ϕ) (NBT-BT)-ϕSBexT Ceramics………..........130
6.7.2 Ferroelectric Study of (1-ϕ) (NBT-KNN)-ϕSBexT Ceramics.………….132
6.8 Polarization Fatigue Study……………………………………………............134
6.8.1 Polarization Fatigue Study of (1-ϕ) (NBT-BT)-ϕSBexT Ceramics..........134
6.8.2 Polarization Fatigue Study of (1-ϕ) (NBT-KNN)-ϕSBexT
Ceramics..................................................................................................135
6.8.3 Mechanism of Improvement of Electric Fatigue Endurance of the
(1-ϕ)(NBT-KNN)-ϕSBexT and (1-ϕ)(NBT-BT)-ϕSBexT Ceramics.........136
References…………………………………………………………………...........138
7. Conclusions and Future Work 7.1 Conclusions……………………………………………………………...........140
7.1.1 NBT-xBT and NBT-xKNN Systems……………………………...........140
7.1.2 SBT based Systems……………………………………………..............141
7.1.3 (1-ϕ) (NBT-BT)-ϕSBexT and (1-ϕ) (NBT-KNN)-ϕSBexT Systems……141
7.2 Recommendations for Future Work…………………………………….........142
Bio-Data of the Author…………………………………………………….........143

xv
LIST OF FIGURES
Chapter 1 1.1 Frequency dependence of different polarizations in a dielectric material……..........3
1.2 Crystal classification based on symmetry principle…………………………...........4
1.3 Diagrammatic representation of the relationship between
ferroelectrics, pyroelectrics and piezoelectrics……………………………………...4
1.4 Schematic diagram of direct and converse piezoelectric effects……………............5
1.5 Polarization hysteresis in a ferroelectric material……...............................................7
1.6 Creation of ferroelectric domains……………………………………………...........8
1.7 A schematic illustration of polarization decay as a function of the number
of switching cycles…………………………………………………………….........9
1.8 (a) Three-dimensional networks of the corner-sharing octahedra of O2- ions,
(b) A cubic ABO3 perovskite-type unit cell……………………….........................11
1.9 Typical structure of two layered and three layered BLSFs………..........................12
1.10 Schematic diagram showing a projection of the tetragonal tungsten-bronze
structure on the (001) plane………......................................................................13
1.11 One octant part of the pyrochlore structure (A2B2O7). Blue spheres are A3+ ions,
yellow spheres are B4+ ions, and red spheres are O2− ions......................................13
1.12 Cubic perovskite phase of the NBT system..............................................................16
1.13 Phase diagram of the NBT–BT–KNN ternary system...………………..................17
Chapter 2 2.1 Synthesis steps involved in a conventional solid state reaction route………..........29
2.2 Schematics of sintering process: (a) three grains before solid-state sintering,
and (b) after sintering………………………………………………………...........31
2.3 Schematic representation of interaction of X-rays with crystal planes………........34
2.4 Interaction of electron beam with matter……………………………………..........36
2.5 Schematic diagram of auto-balancing bridge………………………………….......37
2.6 The vector resolution of ac current in a capacitor…………………………………38
2.7 (a) Strain induced by electric field in an electrostrictive material, and
(b) Butterfly loop in a piezoelectric material…………………………………........41

xvi
2.8 Strain versus electric field behavior of a general ferroelectric material……...........42
2.9 Schematic illustration of the poling process………………………………….........42
2.10 A typical impedance vs. frequency curve of a ferroelectric material showing
resonance and anti-resonance frequencies………………………….......................44
2.11 Ferroelectric hysteresis ( EP − ) loop (Circles with arrows represent the
polarization state of the material at the indicated fields)…………………..............46
2.12 Probable sequence of polarization switching in ferroelectrics: (a) nucleation
of oppositely oriented domains, (b) growth of oppositely oriented domains,
(c) sidewise motion of domain walls and (d) coalescence of domains……….........47
2.13 Schematic diagram of fatigue mechanism through domain wall pinning
(dashed lines are domain walls, and black circles are trapped defects)……............48
Chapter 3 3.1 Schematic of the corona poling technique…………………………………............56
3.2 HIOKI-LCR meter (3532-50 Hi-TESTER)………………………………..............57
3.3 Schematic of the virtual ground measuring system..................................................58
3.4 Precision premier II unit……………………………………………………...........58
3.5 Schematic diagram of the 33d measurement process………………………...........59
3.6 A setup for the measurements of ES − loop (a) fiber – optical probe
tip configurations (b) displacement sensing mechanism of adjacent
fiber optical elements………………………………………………….....................61
3.7 Leakage test stimulus and measurement profile…………………………...............62
3.8 Fatigue measurement signal profile………………………………………..............63
Chapter 4 4.1 DSC and TGA curves of ball milled powders of x=0.06 compositions of
(a) NBT-xBT, and (b) NBT-xKNN systems………………………………............66
4.2 XRD patterns of the calcined NBT-xBT ceramic samples with x = (a) 0.05,
(b) 0.06, (c) 0.07, and (d) 0.08………………………………………………..........67
4.3 XRD peak splitting at 2θ ~ 46° for NBT-xBT with x=0.07.......................................68
4.4 XRD patterns of the calcined NBT-xKNN ceramic samples with x = (a) 0.05,
(b) 0.06, (c) 0.07, and (d) 0.08……………………………………………….........69
4.5 The standard patterns of the rhombohedral and the tetragonal symmetries

xvii
of the NBT-xKNN samples…………………………………………………..........70 4.6 XRD peak splitting at 2θ ~ 46° for NBT-xKNN with x=0.07...................................71
4.7 SEM micrographs of the NBT-xBT ceramics with x = (a) 0.05, (b) 0.06,
(c) 0.07, and (d) 0.08………………………………………………………............72
4.8 SEM micrographs of the NBT-xKNN ceramics with x = (a) 0.05, (b) 0.06,
(c) 0.07, and (d) 0.08…………………………………………………………........74
4.9 Variation of εr and tanδ with temperature at different frequencies of the
NBT-xBT ceramics with x = (a) 0.05, (b) 0.06, (c) 0.07, and (d) 0.08……............76
4.10 Variation of εr and tanδ with temperature at different frequencies of
NBT-xKNN ceramics with x = (a) 0.05, (b) 0.06, (c) 0.07, and (d) 0.08….............78
4.11 Room temperature leakage current density vs. electric field plots of the
NBT-xBT (0.05≤x≤0.08) ceramic samples.……………………………….............79
4.12 Room temperature leakage current density vs. electric field plots of the
NBT-xKNN (0.05≤x≤0.08) ceramic samples..……………………………….........80
4.13 Variation of induced strain% vs. bipolar electric field of the NBT-xBT
ceramics with x = (a) 0.05, (b) 0.06, (c) 0.07, and (d) 0.08.…………………........82
4.14 Variation of piezoelectric (d33) and electromechanical coupling (kp) coefficients
with the variation of BT content in the NBT-xBT system……………….…..........83
4.15 Impedance (Z) and phase angle (θ) variations with frequency of the x=0.07
poled samples of the NBT-xBT system……………………………………............84
4.16 Variation of induced strain% vs. bipolar electric field of the NBT-xKNN
ceramics with x = (a) 0.05, (b) 0.06, (c) 0.07, and (d) 0.08…………………..........85
4.17 Variation of piezoelectric (d33) and electromechanical coupling (kp) coefficients
with the variation of KNN content in the NBT-xKNN system………………........86
4.18 Impedance (Z) and phase angle (θ) variations with frequency of the
poled x=0.07 samples of the NBT-xKNN system…………………………….......87
4.19 P-E hysteresis loops of the NBT-xBT (x=0.05, 0.06, 0.07, 0.08) ceramics….........88
4.20 P-E hysteresis loops of the NBT-xKNN (x=0.05, 0.06, 0.07, 0.08) ceramics.........89
4.21 Normalized polarization vs. number of cycles plots of the NBT-xBT
(x=0.05, 0.06, 0.07, 0.08) ceramics………………………………………………..91
4.22 P-E hysteresis loops before (1), and after (2) 107 cycles of the NBT-xBT
(x=0.05, 0.06, 0.07, 0.08) ceramics………………………. …………………........92

xviii
4.23 Normalized polarization vs. number of cycles plots of the NBT-xKNN
(x=0.05, 0.06, 0.07, 0.08) ceramics…………………………………………..........93
4.24 P-E hysteresis loops before (1) and after (2) 107 cycles of the NBT-xKNN
(x=0.05, 0.06, 0.07, 0.08) ceramics ……………………...…………………..........94
Chapter 5 5.1 DSC and TGA curves of the ball milled uncalcined SBT powder…………...........99
5.2 XRD patterns of (a) SBT, (b) SBexT and (c) SBTW samples calcined at
1000oC for 4hrs……………………………………………………………...........100
5.3 Variation of experimental density with sintering temperature of the SBT,
SBexT, and SBTW ceramics………………………………………………….......101
5.4 SEM micrographs (a-c) of the SBT ceramic samples sintered at 1100, 1150
and 1200oC, (d-g) of the SBexT ceramic samples sintered at 1100, 1150, 1200
and 1250oC, and (h-j) of the SBTW ceramic samples sintered at 1100, 1150
and 1200oC temperatures………………………………………….........................102
5.5 Temperature dependence of εr at different frequencies of (a) SBT, (b) SBexT
and (c) SBTW ceramics……………………………………………………..........104
5.6 Temperature dependence of tanδ at different frequencies of (a) SBT,
(b) SBexT and (c) SBTW ceramics………………………………………………..105
5.7 Room temperature leakage current density vs. electric field plots of SBT,
SBexT and SBTW ferroelectric ceramics………………………………................107
5.8 S-E loops of (a) SBT, (b) SBexT and (c) SBTW ferroelectric ceramics…............108
5.9 P-E hysteresis loops of SBT, SBexT and SBTW ferroelectric ceramics….............109
5.10 Normalized polarization vs. number of cycles plots of (a) SBT (b) SBexT
and (c) SBTW ferroelectric ceramics………………………………………..........111
Chapter 6 6.1 X-ray diffraction patterns of (a) MPB composition of NBT-BT, (b) SBexT
and (c) (1-ϕ)(NBT-BT)-ϕSBexT (ϕ= 2, 4, 8, 12, 16 wt. %) ceramics…….............115
6.2 X-ray diffraction patterns of the sintered (1-ϕ)(NBT-KNN)-ϕSBexT
(ϕ= 2, 4, 8, 12, 16 wt. %) ceramics Inset Fig: XRD pattern of the
NBT-xKNN (with x=0.07) ceramics…………………………..............................116
6.3 SEM micrographs of (1-ϕ)(NBT-BT)-ϕSBexT ceramics with ϕ (in wt.%) =

xix
(a) 0, (b) 2, (c) 4, (d) 8, (e) 12 and (f) 16………………………………………...117
6.4 SEM micrographs of (1-ϕ) (NBT-KNN)-ϕ SBexT ceramics with ϕ (in wt.%)
= (a) 0, (b) 2, (c) 4, (d) 8, (e) 12 and (f) 16…………………………………........119
6.5 Variation of εr and tanδ with temperature at different frequencies of
(1-ϕ) (NBT-BT)-ϕSBexT ceramics with ϕ (in wt.%) = (a) 0, (b) 2, (c) 4,
(d) 8, (e) 12 and (f) 16……………………………………………………............121
6.6 Variation of εr and tanδ with temperature at different frequencies of
(1-ϕ) (NBT-KNN)-ϕSBexT ceramics with ϕ (in wt.%) = (a) 0, (b) 2,
(c) 4, (d) 8, (e) 12 and (f) 16……………………………………………..............123
6.7 Room temperature leakage current density vs. electric field plots of
(1-ϕ) (NBT-BT)-ϕSBexT (ϕ=0, 2, 4, 8, 12, 16 wt. %) ceramics…………..............125
6.8 Room temperature leakage current density vs. electric field plots of
(1-ϕ) (NBT-KNN)-ϕSBexT (ϕ= 0, 2, 4, 8, 12, 16 wt. %) ceramics……….............127
6.9 Bipolar field-induced strains of (1-ϕ) (NBT-BT)-ϕ SBexT ceramics with ϕ
(in wt.%) = (a) 0, (b) 2, (c) 4, (d) 8, (e) 12 and (f) 16……………………...........128
6.10 Bipolar field-induced strains of (1-ϕ) (NBT-KNN)-ϕ SBexT ceramics
with ϕ (in wt.%) = (a) 0, (b) 2, (c) 4, (d) 8, (e) 12 and (f) 16……………………130
6.11 P-E hysteresis loops of (1-ϕ) (NBT-BT)-ϕSBexT ceramics with ϕ
(in wt.%) = (a) 0, (b) 2, (c) 4, (d) 8, (e) 12 and (f) 16……………………….......131
6.12 P-E hysteresis loops of (1-ϕ) (NBT-KNN)-ϕSBexT (ϕ= 0, 2, 4, 8, 12,
16 wt. %) ceramics……………………………………………………….............133
6.13 Normalized polarization vs. number of cycles plots of
(1-ϕ) (NBT-BT)-ϕSBexT (ϕ= 0, 2, 4, 8, 12, 16 wt. %) ceramics…………............134
6.14 Normalized polarization vs. number of cycles plots of
(1-ϕ) (NBT-KNN)-ϕ SBexT (ϕ= 0, 2, 4, 8, 12, 16 wt. %) ceramics………............136

xx
LIST OF TABLES
2.1 Sample geometries for measurement of material properties………………............45
3.1 Synthesized materials……………………………………………………...............52
3.2 Precursors used in the synthesis of the selected materials…………………............53
3.3 Details of the selected material processing steps…………………………..............53
4.1 Lattice parameters a, c (Å) and α (o) of NBT-xBT (x=0.05, 0.06, 0.07,
0.08) ceramics….................................................................................……..............67
4.2 Lattice parameters of NBT-xKNN (x=0.05, 0.06, 0.07, 0.08) ceramics……..........70
4.3 Average grain size, and experimental density of NBT-xBT (x=0.05, 0.06,
0.07, 0.08) ceramics………………………………………………………..............73
4.4 Average grain size, and experimental density of NBT-xKNN (x=0.05,
0.06, 0.07, 0.08) ceramics……………………………………………….................74
4.5 Dielectric properties (at 1 kHz frequency) of NBT-xBT (x=0.05, 0.06,
0.07, 0.08) ceramics…………………………………………………………..........76
4.6 Dielectric properties (at 1 kHz frequency) of NBT-xKNN (x=0.05, 0.06,
0.07, 0.08) ceramics…………………………………………………………..........78
4.7 Leakage properties of NBT-xBT (x=0.05, 0.06, 0.07, 0.08) ceramics at
the electric field of 40kV/cm…………………………………………………........79
4.8 Leakage properties of NBT-xKNN (x=0.05, 0.06, 0.07, 0.08) ceramics
at the electric field of 40kV/cm……………………………………………………81
4.9 Piezoelectric parameters of NBT-xBT (x=0.05, 0.06, 0.07, 0.08) ceramics............84
4.10 Piezoelectric parameters of NBT-xKNN (x=0.05, 0.06, 0.07, 0.08) ceramics…….87
4.11 Ferroelectric parameters of NBT-xBT (x=0.05, 0.06, 0.07, 0.08) ceramics............88
4.12 Ferroelectric parameters of NBT-xKNN (x=0.05, 0.06, 0.07, 0.08) ceramics.........90
4.13 Relative polarization fatigue% (after 109 cycle) of NBT-xBT (x=0.05,
0.06, 0.07, 0.08) ceramics………………………………………………….............91
4.14 Relative polarization fatigue % (after 109 cycle) of NBT-xKNN
(x=0.05, 0.06, 0.07, 0.08) ceramics…………………………………………..........93
5.1 Lattice parameters of SBT, SBexT and SBTW ceramic samples …………...........100
5.2 Average grain size and experimental density of SBT, SBexT and
xxi
SBTW ceramic samples…………………………………………………..............103
5.3 Dielectric properties (at 1 kHz frequency) of SBT, SBexT and SBTW
ceramics............................................................................................................. ...106
5.4 RT leakage current properties of SBT, SBexT and SBTW ceramics at
60kV/cm.................................................................................................................107
5.5 Piezoelectric properties of SBT, SBexT and SBTW ceramics……………............108
5.6 Ferroelectric properties of SBT, SBexT and SBTW ceramics……………….........110
5.7 Polarization fatigue properties of SBT, SBexT and SBTW ceramics……………..111
6.1 Average grain size, and experimental density of (1-ϕ) (NBT-BT)-ϕ SBexT
(ϕ= 0, 2, 4, 8, 12, 16 wt. %) ceramics…………………………………………….118
6.2 Average grain size, and experimental density of (1-ϕ) (NBT-KNN)-ϕ SBexT
(ϕ= 0, 2, 4, 8, 12, 16 wt. %) ceramics……………………………………….........119
6.3 Dielectric values (at 1 kHz frequency) of (1-ϕ) (NBT-BT)-ϕ SBexT
ceramic samples……………………………………………………………..........122
6.4 Dielectric values (at 1 kHz frequency) of (1-ϕ) (NBT-KNN)-ϕ SBexT ceramic
samples……………………………………………………………………...........124
6.5 Leakage current density of (1-ϕ) (NBT-BT)-ϕ SBexT (ϕ= 0, 2, 4, 8,
12, 16 wt. %) ceramics at 40kV/cm…………………………………………......126
6.6 Leakage current density of (1-ϕ) (NBT-KNN)-ϕ SBexT (ϕ= 0, 2, 4,
8, 12, 16 wt. %) ceramics at 40kV/cm……………………………………….......127
6.7 Piezoelectric parameters of (1-ϕ) (NBT-BT)-ϕ SBexT (ϕ= 0, 2, 4,
8, 12, 16 wt. %) ceramics…………………………………………………...........128
6.8 Piezoelectric parameters of (1-ϕ) (NBT-KNN)-ϕ SBexT (ϕ= 0, 2, 4,
8, 12, 16 wt. %) ceramics………………………………………...........................130
6.9 Ferroelectric parameters of (1-ϕ) (NBT-BT)-ϕ SBexT (ϕ= 0, 2, 4, 8, 12,
16 wt. %) ceramics…………………………………………………………..........132
6.10 Ferroelectric parameters of (1-ϕ) (NBT-KNN)-ϕ SBexT (ϕ= 0, 2, 4, 8,
12, 16 wt. %) ceramics…………………………………………………................133
6.11 Polarization fatigue of (1-ϕ) (NBT-BT)-ϕ SBexT (ϕ= 0, 2, 4, 8, 12, 16 wt. %)
ceramics…………………………………………………………………..............135
6.12 Polarization fatigue of (1-ϕ) (NBT-KNN)-ϕ SBexT (ϕ= 0, 2, 4, 8,
12, 16 wt. %) ceramics…………………………………………………..............136

xxii
List of symbols and abbreviations
εr Dielectric constant
Tanδ Dielectric loss
ɛ0 Permittivity of free space
ɛ' Real part of permittivity
ɛ'' Imaginary part of permittivity
Χ Dielectric susceptibility
Pr Remnant polarization
Ec Coercive field
J-E Current density-Electric field
S-E Induced strain- Electric field
P-E Polarization-Electric field
ρth Theoretical density
ρex Experimental density
d33 Piezoelectric coefficient
kp Electromechanical coupling factor
fa Antiresonance frequency
fr Resonance frequency
a, b, c Lattice parameters
Tc Curie temperature
Td Depolarization temperature
Tm Temperature at maximum dielectric constant
RT Room temperature
PNR Polar nano region
DPT Diffused phase transition
NVFRAM Non-Volatile Ferroelectric Random Access
Memories
PZT (Pb0.52Zr0.48)TiO3
BT BaTiO3
PMN-PT Pb(Mg1/3Nb2/3)O3-PbTiO3

xxiii
NBT Na0.5Bi0.5TiO3
KNN K0.5Na0.5NbO3
SBT SrBi2Ta2O9
SBexT Sr0.8Bi2.15Ta2O9
SBTW SrBi2(Ta0.925W0.075)2O9
(1-ϕ)(NBT-BT)-ϕSBexT (1-ϕ)(0.93 Na0.5Bi0.5TiO3-0.07 BaTiO3)-ϕSr0.8Bi2.15Ta2O9
(1-ϕ)(NBT-KNN)-ϕSBexT (1-ϕ)(0.93 Na0.5Bi0.5TiO3-0.07 K0.5Na0.5NbO3)-ϕSr0.8Bi2.15Ta2O9
MPB Morphotropic phase boundary
BLSF Bismuth layered structure ferroelectrics
SSRR Solid state reaction route
PVA Polyvinyl alcohol
DSC Differential scanning calorimetry
TGA Thermo gravimetric analysis
XRD X-ray diffraction
SEM Scanning electron microscope
SCLC Space charge limited currents
FE Ferroelectric
AFE Antiferroelectric
PE Paraelectric

1
Chapter 1
Introduction and Literature Survey
1.1 Introduction
In the present era of device miniaturization, smart ceramic materials are technologically significant particularly in sensor, actuator, transducer, memory and capacitor devices. Smart ceramic materials change their chemical or physical properties under the influence of external stimuli. These materials are also known as electroceramics because of their extraordinary electrical properties. A parallel development of various subclasses of electroceramics with piezoelectric properties has also taken place along with the development of new technologies. Consequently, since more than half a century, the piezoelectric ceramics have been getting considerable recognition. In addition, polycrystalline ceramics (ferroelectric in nature) with high dielectric constant were initially used in the capacitors. In the early 1950's, only BaTiO3 (BT) based ceramics were used in capacitor and piezoelectric transducer device applications. Subsequently, many other ferroelectric ceramics including lead titanate (PbTiO3), lead zirconate titanate (PZT), lead lanthanum zirconate titanate (PLZT) and relaxor ferroelectrics like lead magnesium niobate (PMN) have been developed and utilized in various device applications [1]. Among the limited choice of lead-free ferroelectric ceramics, Na0.5Bi0.5TiO3 (NBT) system with perovskite structure has remained as the prototype material due to its better ferroelectric properties. However, some critical issues associated with NBT system propel the researchers to modify the system either by doping/substitution or by preparing solid solution with other ceramic materials. By the choice of a suitable ferroelectric system, NBT based solid solutions, possessing a morphotropic phase boundary (MPB) can easily be realized. Although, through these modifications major critical issues associated with the NBT system are resolved, still the reliability problems such as polarization fatigue and high leakage current are not yet addressed. On the other hand, though the ferroelectric properties of bismuth layered structure ferroelectrics (BLSFs) are weak compared to their perovskite counterparts, yet they possess the superior polarization fatigue endurance property. In this connection, emphasis was given to NBT based systems near their MPBs, which were further modified by suitable BLSF systems for improving the reliability issues.

2
1.2 Background of Ferroelectric Phenomena and Related Definitions
1.2.1 Dielectric Materials
Dielectrics are a class of insulating materials, which have virtually no free charge carriers and find their use in capacitor applications. Induction of polarization under an applied external electric field is the special characteristic of dielectrics, which separates them out from other class of insulating materials. This polarization in a dielectric material can occur by several mechanisms through limited charge rearrangements. Dielectrics are generally described by the dielectric constant or relative permittivity ( rε ) and dielectric
loss ( δtan ) parameters. And, the total capacitance, C of a capacitor is given by
)1.1(d
AC roεε=
Where, ‘ oε ’ is the permittivity of the free space, ‘ rε ’ is the dielectric constant (‘ roεε ’ is
the permittivity of dielectric material), ‘ d ’ is the distance between the parallel plates, and ‘ A ’ is the area of the plates. Moreover, the material parameter ‘ χ ’, which is known as
dielectric susceptibility relates the applied external electric field ( E ) and electrical polarization ( P ) by the relation
)2.1(EP oχε=
Also, rε of an isotropic medium is defined by the relation
)3.1(1)(0
0 χεεε +=+= E
PEr
where, DPE =+0ε is the electric displacement field [2].
The mechanisms related to polarization, occurring in a dielectric material, depend on the frequency of the applied external electric field. Following are the different contributions to the total polarization in a dielectric material [3]:
Electronic polarization (displacement of the negatively charged electron shell against the positively charged nucleus).
Ionic polarization (mutual displacement of the positive and negative sub lattices under the influence of an applied electric field).
Orientation polarization (alignment of permanent dipoles). Space charge polarization (polarization effect in a dielectric material showing
spatial inhomogeneity of charge carrier densities).
Each polarization contribution originates from the short-range movement of the charges, which responds to the applied electric field with different time scales. Schematic

3
dispersion of the real and imaginary parts of the dielectric function is shown in Fig.1.1. Each of the polarization contributions has its own characteristic frequency, which is the reciprocal of the characteristic time/relaxation time and where a maximum of the dielectric loss appears (shown in lower part of Fig.1.1). Depending on whether the oscillating masses experience a restoring force or not, one can distinguish between resonance and relaxation effects, respectively. Resonances are observed for the ionic (molecular vibrations and ionic lattices in the infrared (IR) region, 1011-1013 Hz) as well as electronic polarization (above 1013 Hz), while relaxation effects are found for the orientational polarization (electric dipoles from 108-1010 Hz) as well as interface or space charge polarization (below 10Hz) [4].
Fig. 1.1: Frequency dependence of different polarizations in a dielectric material [5].
1.2.2 Classification of Materials based on Symmetry Principle
The physical properties of crystals, thin films, polycrystalline or an amorphous material are affected by their symmetry. According to Neumann’s principle, the symmetry of a crystal’s internal structure is reflected in the symmetry of its external properties [6]. To explain symmetry about a point in space, crystallographers employ four symmetry operations; (1) a center of symmetry, (2) axes of rotation, (3) mirror planes and (4) combinations of these [7], which leads to a total of 32 point groups. Dielectric materials may belong to any one of the 32 point groups (or crystal classes) among which twenty groups are piezoelectric, where the polarization can be induced by an applied electric field. Half of the piezoelectric class of materials, (i.e. 10 point groups) are called

4
polar materials, which exhibit spontaneous polarization in the absence of any applied electric field or stress. Such dielectrics are called pyroelectrics, since the detection of spontaneous polarization is carried out by heating the specimens. The spontaneous polarization of a polar material results from an inherent asymmetry within the basic crystal cell. Polar materials whose direction of spontaneous polarization can be changed by an applied electric field are known as ferroelectrics or Siegnette electrics occasionally. The term ferroelectricity is derived from the analogy with ferromagnetic materials, since ferroelectric materials also possess domains, exhibit hysteresis loops and show Curie-Weiss type behavior near their phase transition temperatures [8]. Fig.1.2 shows the classification of materials on the basis of crystal symmetry and Fig.1.3 shows the relationship between dielectric, ferroelectric, pyroelectric and piezoelectric materials.
Fig. 1.2: Crystal classification based on symmetry principle [9].
Fig. 1.3: Diagrammatic representations of the relationship between ferroelectrics, pyroelectrics and piezoelectrics.

5
1.2.3 Piezoelectric Materials
Piezoelectric materials possess the coupling between electrical and mechanical energies, i.e. an applied mechanical stress results in the generation of polarization. Over hundred years ago, Jacques and Pierre Curie discovered that the unit cells of piezoelectric materials lack center of crystallographic symmetry. This asymmetrical configuration of atoms in the unit cell creates an asymmetric charge distribution, which results in the formation of an electric dipole in the crystal as a whole. This macroscopic charge displacement or polarization is proportional to the applied mechanical stress. It was observed that the converse is also true where the voltage applied to the surface of a piezoelectric crystal creates a small change in its dimensions, which is proportional to the applied voltage. Although the attainable strain is relatively small, it can impart sufficient force to displace objects; many times more massive than the crystal itself, which makes these materials suitable for actuator applications [10].
The direct and converse piezoelectric effects, as shown in Fig.1.4, can be expressed in tensor notation as,
)4.1(jkijki dD σ= (Direct Effect)
)5.1(kkijij EdS = (Converse Effect)
where, iD is the polarization generated along the i - axis in response to the applied stress
jkσ . For the converse effect, ijS is the strain generated in a particular orientation of the
crystal by the application of electric field kE along the k -axis [6]. ijkd and kijd are the
piezoelectric coefficients for direct and converse effects, respectively.
Fig. 1.4: Schematic diagram of direct and converse piezoelectric effects [11].

6
1.2.4 Pyroelectric Materials
Pyroelectrics are subclasses of piezoelectrics, which possess spontaneous polarization. Generally, this spontaneous polarization in pyroelectric materials is not necessarily switchable by an external electric field. This inherent dipole moment within each unit cell induces a net polarization, which can be manipulated by temperature. The pyroelectric coefficient ( ip ) is described as the change in the spontaneous polarization
with temperature [7] as,
)6.1(TPp s
i ∂∂
=
where, ip (Cm-2K-1) is the pyroelectric coefficient. Alternatively, ‘ ip ’ is calculated
using the relation,
)7.1(
dtdTA
Ipi =
Where, ‘ I ’ is the pyroelectric current, measured during the heating cycle, ‘ A ’ is the area of the electrode and ‘ dtdT / ’ is the rate of heating. The spontaneous polarization disappears above the Curie temperature ( cT ), the temperature above which a pyroelectric
unit cell transforms into the centrosymmetric paraelectric phase. In the centrosymmetric paraelectric phase, there exist no dipole moment within the unit cell, and thus exhibits a reduced piezoelectric effect [1].
1.2.5 Ferroelectric Materials
Ferroelectrics are subclasses of pyroelectrics, in which the spontaneous electric polarization can be reversed by the application of an external electric field. The effect of the application of an electric field and cycling through negative and positive directions to a ferroelectric material, results in a hysteretic behavior, shown in Fig.1.5. With the increase of electric field, the polarization initially increases from zero to a saturation polarization, satP , and then upon decreasing the electric field, it reduces to a remnant
polarization, rP . The electric field required to reduce the polarization back to zero value,
is called coercive field cE . A ferroelectric material has the following characteristics [7] :
Ferroelectric hysteresis loop Spontaneous polarization Reversible polarization Ferroelectric transition temperature.

7
Fig.1.5: Polarization hysteresis in a ferroelectric material [12].
1.2.5.1 Ferroelectric Domains and Domain Walls
Ferroelectric materials consist of regions, called domains, within which spontaneous polarization is uniformly oriented. This polarization orientation differs from an adjacent domain and the region which separates the two adjacent domains is called the domain wall. The walls between domains with opposite orientation and mutually perpendicular polarizations are called 180o and 90o walls, respectively [13]. More often, spontaneous polarization is generated by cooling the ferroelectric material below the Curie point. As the temperature is reduced down to the Curie point, the generation of spontaneous polarization leads to the formation of surface charges, which produce a depolarizing field, dE , directed opposite to the spontaneous polarization. In principle,
ferroelectric domains are formed to minimize the electrostatic energy of the depolarizing fields, dE , and elastic energy associated with mechanical strain generated in the
ferroelectric material when it is cooled through paraelectric to ferroelectric state [14]. A combination of electric and elastic boundary conditions to which a ferroelectric material is subjected when it is cooled down through the ferroelectric phase transition temperature, usually leads to a complex domain structure with many 90o, 180o and many other walls. This is schematically shown in Fig.1.6.

8
Fig.1.6: Creation of ferroelectric domains [15].
1.2.5.2 Ferroelectrics for Electronic Applications
After the discovery of BaTiO3 ceramics, ferroelectric crystals and ceramics have been studied for a variety of electronic device applications, including actuators, filters, sensors and capacitors. Most extensive research in various ferroelectric materials which have been carried out till date is related to the field of utilization of switchable polarization under the application of an external electric field. Therefore, the concept of utilizing the reversible spontaneous polarization of ferroelectric materials as a non-volatile ferroelectric random access memory (NVFRAM) state is one of the key research interests of the present time. A concise description of the ferroelectric non-volatile memories, followed by a discussion on polarization fatigue, one of the major reliability issues, which limits the applicability of ferroelectrics in memory devices, has been summarized in the successive two sections.
1.2.5.3 Non-Volatile Ferroelectric Random Access Memories (NVFRAM)
The hysteresis behavior of ferroelectric polarization vs. applied external electric field (P-E) of ferroelectric material makes it useful for the non-volatile memory applications. In these materials, there exists a nominal threshold electric field (called coercive field), above which the polarization changes its sign and we get two zero field values i.e. the rP± , which are equally stable. Either of these two states of the polarization
can be encoded as “1” or “ 0 ” in the memory devices and since no external electric field is required to maintain these states, the memory is termed as non-volatile [16]. Due to their following advantages such as (i) fast access speed, (ii) low power consumption, (iii) extended read/write endurance and (iv) ability to store data without the need for battery backup power, the bistable states of the ferroelectric makes them ideal replacements for

9
the standard random access memory (RAM), erasable programmable read-only memory (EPROM) and flash memories. Following the first NVFRAM demonstrations in 1989, NVRAMs have been extensively developed [17]. Moreover, current applications of these ferroelectric materials include in smart cards, data collection and storage (e.g., power meters), configuration storage and buffer devices.
1.2.5.4 Fatigue in Ferroelectric Ceramics
As per definition, ferroelectric (polarization) fatigue is the loss of the switchable remnant polarization in a ferroelectric material, undergoing unipolar/bipolar pulses. Fig. 1.7 shows a schematic representation of the polarization decay vs. the number of cycles in a ferroelectric material. Fatigue is generally accepted as the result of charge injection and the accumulation of space charges, which pin the domain switching. The microscopic models for explaining the origins of the fatigues are the formation of charged defect pairs, such as lead vacancies, bismuth vacancies, oxygen vacancies [18] and space-charge accumulation at or near the electrode-ferroelectric interfaces [19]. Defect charges play important role in all these models [20].Though both bulk and thin film ferroelectric materials are susceptible to polarization fatigue, the mechanism of polarization fatigue is presently not well understood. Yet, in the early studies, mostly in single crystals, considerable research on ferroelectric fatigue has produced a large quantity of experimental data. The influence of various conditions i.e., temperature, ambient atmosphere, choice of electrode, composition of the ferroelectric material, and the characteristics of the external electric field on fatigue has been studied previously [21-23].
Fig.1.7: A schematic illustration of polarization decay as a function of the number of switching cycles [18].

10
1.3 Classification of Ferroelectrics
According to the nature of chemical bonds, crystalline ferroelectrics may be classified into four types [24]: (i) Perovskite e.g.: BaTiO3, K0.5Na0.5NbO3, Na0.5Bi0.5TiO3 (ii) Layer structure e.g.: SrBi2Ta2O9, Bi4Ti3O12 (iii) Tungsten bronze e.g.: PbNb2O6, and (iv) Pyrochlore e.g.: Cd2Nb2O7.
1.3.1 Ferroelectrics with Perovskite Structure
Perovskite is a family name of a group of materials having a prototype ABO3 type
of structure. Here, the A-site cations (e.g. Ba2+, Sr2+, Ca2+, Pb2+) are normally larger than the B-site cations (e.g. Ti4+, Zr4+, Sn4+) and O represents the oxygen atoms. Fig. 1.8 (a) shows the three-dimensional corner sharing O2- ions octahedral network. The A-site cations are surrounded by twelve anions in cube-octahedral coordination and the B site cations are surrounded by six anions in octahedral coordination.
Fig.1.8 (b) shows the ideal perovskite with cubic unit cell [25]. Most of the materials belonging to the perovskite structure are ionic compounds. In perovskites, the chemical composition related to its stability can be measured by their tolerance factor ‘ t ’, also known as Goldschmidt tolerance factor, which is given below:
)8.1()(2 OB
OA
RRRRt+
+=
where, AR , BR and OR are the ionic radii of A, B and O ions, respectively [26]. For ideal
cubic structure t =1.0, however, perovskite structures with 0.95< t < 1.0 are cubic in nature. The perovskite structures with t > 1.0 tend to be ferroelectric and with t < 0.95, leads to non-ferroelectric nature and results in distorted perovskite structure. In addition to ‘ t ’, the polarizability of the ions also plays a significant role in determining the nature of the material [27].

11
(a) (b)
Fig.1.8: (a) Three-dimensional network of the corner-sharing octahedra of O2- ions, (b) A cubic ABO3 perovskite-type unit cell [28].
In few materials, the A site becomes complex by comprising more than one cation in the ABO3 structure, which is denoted as (A1A2)BO3 and known as complex perovskite structure. Generally, in this complex perovskite structure, A1 and A2 are relatively large size mono-, di- or tri-valent cations such as Na+, K+ , Ba2+, Ca2+, Sr2+, Pb2+, Bi3+ etc. and B site is a small size, highly charged tera-, penta- or hexa-valent cations, such as Ti4+, Nb5+, W6+, etc. Compositional heterogeneities due to the A-site cations in these complex perovskite structures make the nature of the phase transition in these ferroelectrics as diffused type.
1.3.2 Ferroelectrics with Bismuth Layer Structure
Bismuth layer-structured ferroelectrics (BLSFs) were first synthesized by Aurivillius in 1949 and hence they are also known as Aurivillius compounds [29]. Fig.1.9 shows the structure of BLSF, which comprises the intergrowth of fluorite-like (Bi2O2)2+ units and pseudo-perovskite slabs (An-1BnO3n+1)2- . ‘n’ indicates the number of perovskite layers stacked along the c-axis between the (Bi2O2)2+ layers and generally its value lies between 1 ≤ n ≤ 8. In (An-1BnO3n+1)2-, B is a small size, highly charged tetra-, penta- or hexa-valent cation, such as Ti4+, Ta5+, Nb5+, V5+, W6+ etc. (An-1BnO3n+1)2- perovskite slabs are sandwiched between the Bi2O2 layers and gives a characteristic layer structure. Ferroelectricity in these compounds is generally attributed to the cationic displacement along the polar a-axis and the tilting of octahedra around the ‘a’ and ‘c’ axes [29-32].
B
O

12
Some typical examples of BLSFs are: Bi2WO6 (n = 1), SrBi2Ta2O9 (n = 2), Bi4Ti3O12 (n = 3), MBi4Ti4O15 (M = Ca, Sr, Pb, Ba) (n=4), Ba2Bi4Ti5O18 (n=5) etc. These BLSFs possess some exclusively attractive electrical properties such as excellent fatigue endurance, fast switching speed, good polarization retention, relatively high Curie temperature, low aging rate and low operating voltage [33-36]. The mentioned electrical properties of BLSFs make them suitable for ferroelectric non-volatile random access memory (NVRAM) storage devices, high-temperature piezoelectric device, sensor and photo-catalysts applications [37, 38].
Fig.1.9: Typical structure of two layered [39], and three layered [40] BLSFs. 1.3.3 Ferroelectrics with Tungsten Bronze Structure
The “Tetragonal Tungsten Bronze” (TTB) structural type is related to the potassium tungstate (K0.475WO3) like structure [41]. Interconnected corner-sharing oxygen octahedral with three types of pseudo-symmetric open channels i.e. three-, four-, and five-fold is the characteristic feature of the TTB crystal structure, as shown in Fig.1.10 [42]. The site occupancy formula for TTB structure is given by (A1)2(A2)4(C)4(B1)2(B2)8O30. The three open channels (A1, A2 and C sites) and the space encapsulated by oxygen octahedron (B1 and B2) can accommodate a wide range of cations and anions, leading to modified materials with different tailored properties. Lead niobate (PbNb2O6) was the first crystal of the tungsten bronze type structure to show useful ferroelectric properties [1]. Various substitutions in the TTB structure have led to the discovery of many new normal, and relaxor type ferroelectrics [43]. At present, there are more than hundred ferroelectric materials which belong to tungsten bronze family.

13
Fig.1.10: Schematic diagram showing a projection of the tetragonal tungsten bronze structure on the (001) plane [42]. 1.3.4 Ferroelectrics with Pyrochlore Structure
The pyrochlore structure is shown by materials having a stoichiometric formula of A2B2O7 [44], where A is a trivalent or divalent cation and B is a tetra- or pentavalent cation. Fig.1.11 shows the one octant part of pyrochlore structure [45]. Due to a wide compositional range of A and B site cations, pyrochlore compounds show interesting properties useful for solid electrolytes, anodes and cathodes for fuel cells and sensors, catalysts, dielectrics and materials for the encapsulation of actinides and other nuclear wastes [46].
Fig.1.11: One octant part of the pyrochlore structure (A2B2O7). Blue spheres are A3+ ions, yellow spheres are B4+ ions, and red spheres are O2− ions [44].

14
Ferroelectric materials, such as Ce2Ti2O7, Sr2Nb2O7, La2Ti2O7 (LTO), and Nd2Ti2O7 (NTO), with a pseudo-pyrochlore structure, exhibit a high coercive field, good thermal stability and a low dielectric constant [47].
1.4 Literature Review
In the following sections, literature review about the potential lead-free perovskite and BLSF ceramics is presented.
1.4.1 Lead-Free Ferroelectric Ceramics
Lead(Pb)-containing ferroelectric ceramics such as (Pb0.52Zr0.48)TiO3 (PZT), Pb(Mg1/3Nb2/3)O3–PbTiO3 (PMN-PT) etc. find their use in the modern sensors, actuators and transducers applications due to their superior dielectric, ferroelectric and piezoelectric properties. These excellent properties appear due to the special electronic configuration as well as the peculiar crystal chemistry of Pb2+ ions in the Pb-based systems. Specifically, the stereochemically active 6s2 lone pair of Pb2+ ions causes a strong structural distortion, which leads to highly polarizable and electrically active materials in the Pb-based systems [48, 49]. Furthermore, the exceptionally superior properties in these PZT, PMN-PT etc. systems are obtained near the respective morphotropic phase boundary (MPB) regions [27]. The MPB describes the boundary that separate regions of different symmetries and can be crossed through a change in composition [50]. At MPBs, the crystal structure of these system changes abruptly and the electromechanical properties are optimum. Despite the excellent properties of PZT based systems, regulatory agencies worldwide began putting restrictions on the use of lead over the past few years, due to its toxicity, and currently research is focused mostly on Pb-free materials [51]. Many research groups around the globe are actively involved to find out the effective alternative to lead-free ferroelectric systems. In this search, a special attention has been given to the materials with perovskite phase. This is because materials with perovskite phase are easy to synthesize and suitable modifications in these systems can be incorporated easily. BaTiO3 (BT), Na0.5Bi0.5TiO3 (NBT), K0.5Bi0.5TiO3 (KBT), KNbO3 (KN), K0.5Na0.5NbO3 (KNN), BaZrTiO3 (BZT), BaSrTiO3 (BST) etc. are the various effective lead-free perovskite ferroelectrics [52]. Among them, NBT based systems are more searched from past few years as the effective lead-free ferroelectric systems [53].
In contrast, bismuth layered structure ferroelectrics (BLSF) such as Bi4Ti3O12 (BIT), SrBi2Nb2O6 (SBN), SrBi2Ta2O9 (SBT), SrBi4Ti4O15 etc. have also attracted the attention of the research community because of promising ferroelectric properties [29]. Despite weak piezoelectric properties, these BLSFs find their use in piezoelectric resonators [54].

15
Although the use of perovskite ferroelectrics in various applications is widespread but they do not find their due promising use because of polarization fatigue and imprint related problems in dielectric, ferroelectric and piezoelectric properties [55]. On the other hand, BLSFs materials show polarization fatigue-resistance up to ~1012 cycles, which is comparatively ~ 5-6 order higher than their perovskite counterparts. A key feature is that the devices are typically read destructively, which leads to the requirement that the ferroelectric materials should endure large numbers of switching cycles. However, polarization fatigue is one of the major issues limiting the applicability of ferroelectrics in memory device applications. NBT is a promising ferroelectric material and possesses strong ferroelectricity,
1.4.2 Na0.5Bi0.5TiO3 (NBT) System
Sodium bismuth titanate (NBT) was first discovered in 1960 by Smolenskii et al. [53]. This system is an A-site distorted perovskite material, in which both the Bi3+ and Na+ ions occupy the same A-site positions, shown in Fig. 1.12. Furthermore, this system belongs to ABO3 perovskite category with a rhombohedral (R3c) crystal structure at room temperature (RT). However, preliminary structural studies of the NBT system did not provide a conclusive structural understanding [56, 57]. Jones and Thomas reported that this system exhibits rhombohedral R3c space group at RT and upon heating changes to tetragonal and subsequently to cubic structure [58]. NBT is a promising ferroelectric material with excellent ferroelectric properties with a relatively large Pr (~ 38μC/cm2) and a high Ec (~ 73 kV/cm), high Curie temperature ~320°C with diffuse phase transition (DPT) and a moderate piezoelectric coefficient (d33) ~73pC/N [59]. The peculiar phase transition behavior with different dielectric anomalies of the NBT system has attracted considerable attention [60]. The Rietveld analysis of neutron diffraction data has revealed the coexistence of rhombohedral-tetragonal and tetragonal-cubic phases over the 250-400°C, and 500-540°C temperature ranges, respectively [58]. Yet, two other characteristic transition temperatures were obtained from the dielectric studies, indicated by Td and Tm, known to be depolarization temperature and temperature of the maximum dielectric constant, respectively [61]. At the same time, the high-temperature phase transition viz. tetragonal-cubic has been verified through differential scanning calorimetry (DSC) [62]. Furthermore, the phase transition, at low temperature especially between Td and Tm has been reported as TR-T, which is partially questionable [63, 64]. Vakhrushev et al. [65] reported that there is co-existence of rhombohedral-tetragonal phases with the rhombohedral clusters dispersed within a tetragonal matrix in between Td and Tm. The investigation of phase transition behavior between Td and Tm using transmission electron microscopy (TEM) by Dorcet et al. [66] reported rhombohedral-orthorhombic phase transition through the formation of an intermediate modulated phase. The antiferroelectric

16
and relaxor behaviour are reported in the NBT based systems [66]. The interpretation of the behavior of phase transition between Td and Tm is still quite open to discussion and needs further study in the NBT based systems.
Fig. 1.12: Cubic perovskite phase of the NBT system [67] Besides all the properties and phase transition behaviour of NBT material, it has
been noticed from the preliminary literature survey that although the pure NBT material shows a strong ferroelectric behaviour, but it has some critical limitations such as: (i) high coercive field, (ii) high conductivity, (iii) high dielectric loss, (iv) high leakage current, and (v) prone to polarization fatigue. The issue of high conductivity was attributed to volatilization of Bi3+ ions during sintering process. Hiruma et al. reported the increase in resistivity with the addition of excess bismuth in this system [59]. Bi3+ doped NBT system was studied by Wang et al.[68] and they reported that it reduces the leakage current, enhances the piezoelectric properties, and increases the dielectric constant and the dielectric loss.
Despite numerous studies on NBT based systems with various substitutions, solid solutions of NBT with some other perovskite-based systems exhibit desired improved properties, and only few of them shows the MPBs in certain compositional ranges. These systems near their MPBs exhibits piezoelectric, ferroelectric and electromechanical properties comparable with the Pb-based ferroelectric materials.
1.4.2.1 NBT based Solid-Solutions with MPB
Kounga et al. reported an MPB ~6-7 mol% addition of KNN in the NBT system [69]. Although, the addition of KNN system in the NBT system made the solid solution more antiferroelectric in its behavior, it also led to a much higher unipolar strain [69]. However, in the solid solution of (1-x)(Bi0.5Na0.5)TiO3-(x)(K0.5Na0.5)NbO3 ceramics,

17
Laoratanakul et al. [70] reported an MPB near the composition between x = 0.03 and x = 0.05. Takenaka et al. [71] have reported the MPB for x = 0.06-0.07 in the (1-x)(Bi0.5Na0.5)TiO3-xBaTiO3 system. The structure of (Na0.5Bi0.5)1−xBaxTiO3 system showed an MPB between rhombohedral–tetragonal phase in the composition range of 0.04<x<0.08 at RT [72]. The composition of (Bi0.5N0.5)TiO3-Ba(Zr0.05Ti0.95)O3 system shows an MPB and improved piezoelectric properties in the 3-12 mol% doping of the Ba (Zr0.05Ti0.95)O3 ceramics. Chen et al. studied the electrical properties of (1-x)(Bi0.5N0.5)TiO3-xBa(Zr0.04Ti0.96)O3 solid solutions and reported an MPB with the addition of 6 mole % of Ba(Zr0.04Ti0.96)O3 ceramics in the NBT system [73]. Zhou et al. reported an MPB in the (Bi1/2Na1/2)Ti1−x(Zn1/3Nb2/3)xO3 system within the 0.5% ≤ x ≤ 2.0% compositional range [74].
Since NBT, BT, and KNN are typical end members for developing lead-free piezoelectric materials [75] their binary as well as ternary solid solutions have been widely studied for ferroelectric and piezoelectric properties [76]. This concept is visualized in Fig. 1.13, where a quasi-ternary phase diagram between the NBT, BT and KNN is constructed [76-78]. From these combinations, seven binary MPBs are constructed (shown in Fig. 1.13) where, MPB-1 and MPB-2 are the NBT rich MPBs owing to binary solid solutions.
Fig. 1.13: Phase diagram of the NBT–BT–KNN ternary system [79].
Nevertheless, in the binary solid solutions of NBT-BT and NBT-KNN, still there is ambiguity regarding the presence of MPB at an exact composition [69-71, 80]. Therefore, the solid solutions of the (1-x) NBT- xBT and (1-x) NBT-xKNN systems near

18
MPBs have captured our attention for achieving better dielectric, ferroelectric and piezoelectric properties.
1.4.3 BLSF Systems
Ferroelectric bismuth-layer perovskite materials are recognized as promising materials for FeRAM applications due to their high polarization fatigue resistance, satisfactory electrical and retention characteristics compared to Pb-based and Pb-free perovskite ferroelectrics [81]. Two families of materials, lead zirconate titanate (PZT) and strontium bismuth tantalate (SBT), have been widely investigated for memory applications. Since the current research is an effort to choose material with excellent ferroelectric behaviour with fatigue-resistant behaviour for NVRAM applications, SrBi2Ta2O9 (SBT) has been chosen among numerous BLSFs. This is because of its distinguished properties, which are briefly discussed in the following section.
1.4.3.1 SrBi2Ta2O9 (SBT) based Systems
SBT system, shown in Fig. 1.9, is an n=2 member of the Aurivillius family of layered compounds, considered to be a versatile material for multifarious applications. The crystal structure of this system has orthorhombic distortion with space group A21am and a=0.5306 nm, b=0.55344 nm, and c=2.49839 nm as the lattice parameters [82]. The Pr value of pristine SBT system is ~10μC/cm2 which is much higher than other BLSFs and hence focussed for this research. Araujo et al. [83] have first reported the fatigue-free behavior of SBT system. They recognized the inherent advantage of BLSFs over other ferroelectric materials on account of the fact that the former have intermediate bismuth oxide layers between the ferroelectric units. This Pb-free system has a great importance in ferroelectric memory application devices. But, the εr and Pr values of the SBT based systems are lower compared to the perovskite-based counterparts. Therefore, many attempts have been made to improve the dielectric and ferroelectric properties of the SBT based systems with different modifications [84-86]. Moreover, most of the studies on SBT based system are related to their thin film forms. Shimakawa et al. [87] have reported that the calculated polarization of Sr-deficient-and-Bi-excess Sr0.8Bi2.2Ta2O9 ( cT~ 400 °C) system is larger than their counterpart stoichiometric system. Substitution of Bi and the cation vacancies at the Sr sites helps in enhancing the structural distortion of the TaO6 octahedra, which lead to larger spontaneous polarization and higher Curie temperature. Takemura et al. [88] observed that excess Bi and/or Sr deficient SBT thin films showed stronger dielectric anomaly near cT . In particular, the cT values of the Sr
deficient SBT thin films were higher than that of the corresponding bulk ceramics. Simultaneously, creating Sr deficiency and doping excessive Bi can improve the crystallinity and promote the grain growth in the SBT based systems. On the contrary,

19
Wu et al. [89] studied V5+ doped SrBi2Ta2O9 and reported an increased Tc ~360 °C as compared to 305 °C for pure SBT. Coondoo et al. [90] studied donor (W6+, Eu3+) substituted SBT system and reported the decreased electrical conductivity with both the donor substituent. The substitution of the smaller W6+ ions for Ta5+ ions in the SBT system is reported to be effective in improving its dielectric properties [90]. Moreover, W6+ has been investigated as a substituent for bismuth titanates (Bi4Ti3O12/BIT) in which the Pr is reported to enhance when a small amount of Ti4+ was replaced by W6+. This has been explained by considering the fact that the substitution introduces cation vacancies that suppress oxygen vacancies in the structure. This is especially relevant for SBT, where the degradation in ferroelectric properties and fatigue is widely believed to originate from the existence of oxygen vacancies[91]. In the present work, the hexa valent ion W6+ has been chosen as a donor cation for substituting the pentavalent Ta5+ sites in SBT and its influence on the microstructure, dielectric and ferroelectric properties that have been expected. From the literature, we further observed that Coondoo et al. studied the series of SrBi2(Ta1-xWx)2O9 (SBTW) samples and the ferroelectric properties was maximum for x = 0.075 [91]. Therefore, simultaneously doped Bi-excess and Sr-deficient non-stoichiometric Sr0.8Bi2.15Ta2O9 as studied by Aoyagi et al. [92], and the donor (W6+) doped SrBi2(Ta0.925W0.075)2O9/SBTW system, as studied by Coondoo et al. [91] have caught the attention of the author as promising candidates among the BLSFs.
1.4.4 Ferroelectric Ceramic-Ceramic Composites
As discussed in the previous sections, the ferroelectrics can be classified based on their structures. Several researchers have put efforts to prepare composites using different structured ferroelectrics to improve the required properties. In this section, a few examples of such efforts are briefly outlined. N. Zhang et al. [93] have investigated the electric fatigue properties of traditional perovskite structured Pb0.94La0.04(Zr0.70Ti0.30)O3/PLZT ceramics incorporated with layered structured ferroelectric material, SrBi2Nb2O9. Enhancement of grain strength of the PLZT ceramics and increase in the value of dielectric constant due to incorporation of SrBi2Nb2O9/SBN was reported. Ceramic composites of Pb0.94La0.04 (Zr0.70Ti0.30)O3 and SrBi2Nb2O9 with almost no deterioration in the value of switchable polarization and hysteresis as compared to 60% deterioration observed in pure PLZT ceramic after 106 cycles was reported. The mechanism of improvement in the fatigue properties was attributed to the specific structure of the bismuth oxide layer in SBN, which could alleviate piled-up oxygen vacancies, nearby ferroelectric domain walls, and facilitate the movement of the ferroelectric domain walls in the process of the ferroelectric domain reorientation. N. Zhang et al. [94] again investigated the influences of SrBi2Ta2O9 (SBT) on the dielectric and ferroelectric properties of Pb0.94La0.04(Zr0.70Ti0.30)O3 ceramics. A substantial increase

20
of dielectric constant was observed with the increase of SBT content in the PLZT–SBT composites. While only 40% value of original switchable polarization could be kept in pure PLZT ceramics after 106 polarization switching, almost no deterioration of switchable polarization and hysteresis loop of the PLZT–SBT composites was observed. Thongmee et al. [95] investigated the Pb(Zr0.52Ti0.48)O3–Bi3.25La0.75Ti3O12/PLZT-BLT ceramics and observed higher remnant polarization values of the PZT–BLT ceramics than that of the pure PZT (~11.12 μC /cm2) and pure BLT (~10 μC /cm2) ceramics. The coercive field ~4.04 kV/mm, lower than that of pure BLT ceramics, was also obtained in the PZT–BLT ceramics. BLT addition reduced the tendency to depolarize, induced higher endurance to switching field as well as better fatigue resistance to the PZT-BLT samples. This literature study suggests that we can combine an effective Pb-free perovskite with suitable Bi-layered material for improving its fatigue properties.
1.5 Motivation NBT-based solid solutions near MPBs possess high remnant polarization,
excellent ferroelectric, piezoelectric and dielectric properties. However, polarization fatigue and leakage current behaviors of these NBT based compounds restrict their use in various device applications. Combination of perovskite-based material with SBT based materials can lead to the improvement in polarization fatigue endurance nature and lower the leakage current density effectively. Hence, we are motivated to choose the NBT based solid solutions near MPB and further modify them with suitable SBT based materials for improving polarization fatigue endurance nature and lower the leakage current density.
1.6 Objectives and Scope of the Present Work
Ferroelectric materials find a notable position in the field of material research because of their unique and superior properties, which make them suitable for various electronic, optoelectronic, computer memory etc. device applications. The objectives of the present work have been defined on the basis of the existing problems, challenges and current status in the field of NBT based ferroelectric materials. The main objectives of the present thesis are listed below:
[1] To select the potential lead-free ferroelectric materials with perovskite type structure near their MPBs.
[2] To select the potential lead-free ferroelectrics with bismuth layer structure, possessing excellent polarization fatigue resistant and low leakage current properties.
[3] To optimize the synthesis process for single phase formation of these selected systems by solid state reaction route.

21
[4] To carry out the detailed structural, microstructural, dielectric, ferroelectric, piezoelectric, leakage current and polarization fatigue studies of the selected lead free perovskite and bismuth layer structure based systems.
[5] To synthesize ferroelectric ceramic-ceramic composites using effective perovskite and effective bismuth layer structure ceramics for improving the polarization fatigue and lower the leakage current behaviors.
[6] To carry out the detailed structural, microstructural, dielectric, ferroelectric, piezoelectric, leakage current and polarization fatigue studies of these ceramic composite systems.
1.7 Materials under Present Investigation In the present work, a systematic investigation of the dielectric, leakage current,
piezoelectric, ferroelectric and polarization fatigue properties of the solid solutions of NBT with BT and KNN ceramics was carried out. SBT based ceramics were also synthesized and their various properties were also characterized and analyzed. Finally, the ceramic-ceramic composites using effective perovskite and effective bismuth layer structure ceramics were synthesized, characterized and analysed. Following are the selected materials for the above mentioned objectives:
Perovskite Material Series
(1-x)Na0.5Bi0.5TiO3-xBaTiO3/NBT-xBT (1-x)Na0.5Bi0.5TiO3-x K0.5Na0.5NbO3/NBT-xKNN
(Where x=0.05, 0.06, 0.07, 0.08)
BLSF Materials
SrBi2Ta2O9/SBT Sr0.8Bi2.15Ta2O9/SBexT SrBi2(Ta0.925W0.075)2O9/SBTW
Perovskite-BLSF Series
(1-ϕ)(0.93 Na0.5Bi0.5TiO3-0.07 BaTiO3/ NBT-BT)-ϕ Sr0.8Bi2.15Ta2O9 (1-ϕ)(0.93 Na0.5Bi0.5TiO3-0.07 K0.5Na0.5NbO3/ NBT-KNN)-ϕ Sr0.8Bi2.15Ta2O9
(Where ϕ= 2, 4, 8, 12, 16 wt. %)

22
References [1] A. Safari, R.K. Panda, V.F. Janas, Ferroelectricity: Materials, Characteristics & Applications, Key Engineering Materials, 122-124 (1996) 35-70. [2] C. Kittel, Introduction to Solid State Physics, John Wiley & Sons, New York, 2005. [3] A.J. Moulson , J.M. Herbert, Electroceramics: Materials, Properties, Applications, John Wiley & Sons 2003. [4] B.S. Prakash, Investigations into the microstructure-property correlation in doped and undoped giant dielectric constant material CaCu3Ti4O12, Materials Research Centre, Indian Institute of Science, Bangalore, 2007. [5] A.M. Badr, H.A. Elshaikh, I.M. Ashraf, Impacts of Temperature and Frequency on the Dielectric Properties for Insight into the Nature of the Charge Transports in the Tl2S Layered Single Crystals, Journal of Modern Physics, 2 (2011) 12-25. [6] J.F. Nye, Physical Properties of Crystals: Their Representation by Tensors and Matrices, Clarendon Press1985. [7] D. Damjanovic, Ferroelectric, dielectric and piezoelectric properties of ferroelectric thin films and ceramics, Reports on Progress in Physics, 61 (1998) 1267. [8] J.C. Burfoot, G.W. Taylor, Polar Dielectrics and Their Applications, University of California Press 1979. [9] S.N. Kumar, Synthesis and Characterization of Sr0.53Ba0.47Nb2O6
based Ferroelectric Composites for Pyroelectric Applications, Department of Physics and Astronomy, National Institute of Technology, Rourkela, 2012. [10] T.L. Jordan, Z. Ounaies, Piezoelectric Ceramics Characterization, ICASE NASA Langley Research Center Hampton, Virginia, 2001. [11] P. Dineva, D. Gross, R. Müller, T. Rangelov, Dynamic Fracture of Piezoelectric Materials: Solution of Time-Harmonic Problems via BIEM, Springer International Publishing 2014. [12] D. Askeland, P. Fulay, W. Wright, The Science and Engineering of Materials, Cengage Learning 2010. [13] S. Stemmer, S. Streiffer, F. Ernst, M. Ruuhle, Atomistic structure of 90 domain walls in ferroelectric PbTiO3 thin films, Philosophical Magazine A, 71 (1995) 713-724. [14] R.E. Newnham, Structure-Property Relations, Springer Science & Business Media 2012. [15] M.A. Torghabeh, Development of lead-free piezoelectric thin films by pulsed laser deposition, Materials Science and Engineering, Rutgers, The State University of New Jersey, 2010. [16] S.B. Desu, Minimization of fatigue in ferroelectric films, physica status solidi (a), 151 (1995) 467-480. [17] G.R. Fox, F. Chu, T. Davenport, Current and future ferroelectric nonvolatile memory technology, Journal of Vacuum Science & Technology B, 19 (2001) 1967-1971. [18] M. Ozgul, Polarization Switching and Fatigue Anisotropy in Relaxor-Lead Titanate Ferroelectric Single Crystals, Department of Materials Science and Engineering, The Pennsylvania State University 2003.

23
[19] R. Landauer, Electrostatic Considerations in BaTiO3 Domain Formation during Polarization Reversal, Journal of Applied Physics, 28 (1957) 227-234. [20] H. Blattner, W. Kanzig, W. Merz, H. Sutter, Domain structure of barium titanate crystals Helv Phys Acta 21(1948) 207–209. [21] G.W. Taylor, Electrical Properties of Niobium-Doped Ferroelectric Pb(Zr, Sn, Ti)O3 Ceramics, Journal of Applied Physics, 38 (1967) 4697-4706. [22] Q.Y. Jiang, E.C. Subbarao, L.E. Cross, Effect of composition and temperature on electric fatigue of La-doped lead zirconate titanate ceramics, Journal of Applied Physics, 75 (1994) 7433-7443. [23] C.P. de Araujo, J.F. Scott, G.W. Taylor, Ferroelectric Thin Films: Synthesis and Basic Properties, Gordon and Breach 1996. [24] G.H. Haertling, Ferroelectric Ceramics : History and Technology, Journal of American Ceramic Society, 82 (1999) 797–818. [25] B.G. Hyde, S. Andersson, Inorganic crystal structures, John Wiley and Sons, New York, 1989. [26] H.D. Megaw, Crystal structures: a working approach, Saunders Co., Philadelphia, 1973. [27] B. Jaffe, W.R. Cook Jr., H. Jaffe, Piezoelectric Ceramics, Academic Press, London and New York 1971. [28] R.S. Roth, Classification of perovskite and other ABO3-type compounds, Journal of Research of the National Bureau of Standards, 58 (1957) 75-88. [29] B. Aurivillius, Mixed Bismuth Oxides with Layer Lattices: I. The Structure Type of CaNb2Bi2O9, Arkiv for Kemi, 1 (1949) 463-480. [30] B. Aurivillius, Mixed Bismuth Oxides with Layer Lattices: II. Structure of Bi4Ti3O12 Arkiv For Kemi, 1 (1949) 499-512 [31] E.C. Subbarao, Crystal Chemistry of Mixed Bismuth Oxides with Layer-Type Structure, Journal of the American Ceramic Society, 45 (1962) 166-169. [32] R.E. Newnham, R.W. Wolfe, J.F. Dorrian, Structural basis of ferroelectricity in the bismuth titanate family, Materials Research Bulletin, 6 (1971) 1029-1039. [33] F. Chu, D. Damjanovic, O. Steiner, N. Setter, Piezoelectricity and Phase Transitions of the Mixed-Layer Bismuth Titanate Niobate Bi7Ti4NbO21, Journal of the American Ceramic Society, 78 (1995) 3142-3144. [34] H.S. Shulman, M. Testorf, D. Damjanovic, N. Setter, Microstructure, Electrical Conductivity, and Piezoelectric Properties of Bismuth Titanate, Journal of the American Ceramic Society, 79 (1996) 3124-3128. [35] J.A. Horn, S.C. Zhang, U. Selvaraj, G.L. Messing, S. Trolier-McKinstry, Templated Grain Growth of Textured Bismuth Titanate, Journal of the American Ceramic Society, 82 (1999) 921-926. [36] S.K. Rout, E. Sinha, A. Hussian, J.S. Lee, C.W. Ahn, I.W. Kim, S.I. Woo, Phase transition in ABi4Ti4O15(A=Ca,Sr,Ba) Aurivillius oxides prepared through a soft chemical route, Journal of Applied Physics, 105 (2009) 024105.

24
[37] S.O. Alfaro, A. Martinez-de la Cruz, Synthesis, characterization and visible-light photocatalytic properties of Bi2WO6 and Bi2W2O9 obtained by co-precipitation method, Applied Catalysis A: General, 383 (2010) 128-133. [38] H. Yan, H. Zhang, M.J. Reece, X. Dong, Thermal depoling of high Curie point Aurivillius phase ferroelectric ceramics, Applied Physics Letters, 87 (2005) 082911. [39] H.C. Gupta, Archana, V. Luthra, A lattice dynamical investigation of the Raman and the infrared wavenumbers of SBT (SrBi2Ta2O9), Journal of Molecular Structure, 984 (2010) 204-208. [40] M. Tripathy, R. Mani, J. Gopalakrishnan, New substitutions and novel derivatives of the Aurivillius phases, Bi5TiNbWO15 and Bi4Ti3O12, Materials Research Bulletin, 42 (2007) 950-960. [41] A. Magneli, Arkiv for Kemi, 1 (1949) 213. [42] C. Elias, J. Michael, M. Dominique, M. Mario, Flexible relaxor materials: Ba2PrxNd1-
xFeNb4O15 tetragonal tungsten bronze solid solution, Journal of Physics: Condensed Matter, 21 (2009) 452201. [43] J. Ravez, A. Simon, Lead-free relaxor ferroelectrics with 'TTB' structure, Comptes Rendus Chimie, 5 (2002) 143-148. [44] M.A. Subramanian, G. Aravamudan, G.V. Subba Rao, Oxide pyrochlores - A review, Progress in Solid State Chemistry, 15 (1983) 55-143. [45] E.E. Erickson, D. Gray, K. Taylor, R.T. Macaluso, L.A. LeTard, G.S. Lee, J.Y. Chan, Synthesis, structure and dielectric characterization of Ln2Ti2-2xM2xO7(Ln=Gd, Er; M=Zr, Sn, Si), Materials Research Bulletin, 37 (2002) 2077-2083. [46] A.R. Cleave, Atomic Scale Simulations for Waste Form Applications, Department of Materials Imperial College of Science, Technology and Medicine, London, 2006. [47] W.S. Kim, J.-K. Yang, C.-K. Lee, H.-S. Lee, H.-H. Park, Synthesis and characterization of ferroelectric properties of Ce2Ti2O7 thin films with Ce3+ by chemical solution deposition, Thin Solid Films, 517 (2008) 506-509. [48] A.R. West, Basic solid state chemistry, John Wiley & Sons, New York, 1999. [49] R.E. Cohen, Origin of ferroelectricity in perovskite oxides, Nature, 358 (1992) 136-138. [50] M. Ahart, M. Somayazulu, R.E. Cohen, P. Ganesh, P. Dera, H.-k. Mao, R.J. Hemley, Y. Ren, P. Liermann, Z. Wu, Origin of morphotropic phase boundaries in ferroelectrics, Nature, 451 (2008) 545-548. [51] M. Pecht, Y. Fukuda, S. Rajagopal, The impact of lead-free legislation exemptions on the electronics industry, Electronics Packaging Manufacturing, IEEE Transactions, 27 (2004) 221-232. [52] T. Takenaka, Piezoelectric properties of some lead-free ferroelectric ceramics, Ferroelectrics, 230 (1999) 87-98. [53] G.A. Smolenskii, V.A. Isupv, A.I. Afranovskaya, N.N. Krainik, New ferroelectrics of complex composition, Soviet Physics Solid State, 2 (1961) 2651. [54] S. Zhang, H.J. Lee, C. Ma, X. Tan, Sintering Effect on Microstructure and Properties of (K,Na)NbO3 Ceramics, Journal of the American Ceramic Society, 94 (2011) 3659-3665. [55] S. Poykko, D.J. Chadi, Dipolar Defect Model for Fatigue in Ferroelectric Perovskites, Physical Review Letters, 83 (1999) 1231-1234.

25
[56] J. Suchanicz, J. Kwapulinski, X-ray diffraction study of the phase transitions in Na0.5Bi0.5TiO3, Ferroelectrics, 165 (1995) 249-253. [57] V.A. Isupov, T.V. Kruzina, Some physical-properties of Na0.5Bi0.5TiO3 ferroelectric Izv. Akad. Nauk Sssr Fiz, 47 (1983) 616-618. [58] G.O. Jones, P.A. Thomas, Investigation of the structure and phase transitions in the novel A-site substituted distorted perovskite compound Na0.5Bi0.5TiO3, Acta Crystallographica Section B, 58 (2002) 168-178. [59] Y. Hiruma, H. Nagata, T. Takenaka, Thermal depoling process and piezoelectric properties of bismuth sodium titanate ceramics, Journal of Applied Physics, 105 (2009) 084112. [60] J. Suchanicz, Behaviour of Na0.5Bi0.5TiO3 ceramics in the a.c. electric field, Ferroelectrics, 209 (1998) 561-568. [61] Z. Yang, Y. Hou, B. Liu, L. Wei, Structure and electrical properties of Nd2O3-doped 0.82Bi0.5Na0.5TiO3-0.18Bi0.5K0.5TiO3 ceramics, Ceramics International, 35 (2009) 1423-1427. [62] I.P. Pronin, P.P. Syrnikov, V.A. Isupov, V.M. Egorov, N.V. Zaitseva, Peculiarities of phase transitions in sodium-bismuth titanate, Ferroelectrics, 25 (1980) 395-397. [63] X.X. Wang, X.G. Tang, H.L.W. Chan, Electromechanical and ferroelectric properties of (Bi1/2Na1/2)TiO3-(Bi1/2K1/2)TiO3-BaTiO3 lead-free piezoelectric ceramics, Applied Physics Letters, 85 (2004) 91-93. [64] Y. Hiruma, K. Yoshii, H. Nagata, T. Takenaka, Phase transition temperature and electrical properties of (Bi1/2Na1/2)TiO3-(Bi1/2A1/2)TiO3 (A=Li and K) lead-free ferroelectric ceramics, Journal of Applied Physics, 103 (2008) 084121. [65] S.B. Vakhrushev, V.A. Isupov, B.E. Kvyatkovsky, N.M. Okuneva, I.P. Pronin, G.A. Smolensky, P.P. Syrnikov, Phase transitions and soft modes in sodium bismuth titanate, Ferroelectrics, 63 (1985) 153-160. [66] V. Dorcet, G. Trolliard, P. Boullay, Reinvestigation of Phase Transitions in Na0.5Bi0.5TiO3 by TEM. Part I: First Order Rhombohedral to Orthorhombic Phase Transition, Chemistry of Materials, 20 (2008) 5061-5073. [67] C.J. Walsh, Bond Valence Structure Analysis of Doped Bismuth Sodium Titanate Faculty of Ceramic Engineering. Kazuo Inamori School of Engineering, Alfred University, 2004. [68] X.X. Wang, K.W. Kwok, X.G. Tang, H.L.W. Chan, C.L. Choy, Electromechanical properties and dielectric behavior of (Bi1/2Na1/2)(1-x)BixTiO3 lead-free piezoelectric ceramics, Solid State Communications, 129 (2004) 319-323. [69] A.B. Kounga, S.-T. Zhang, W. Jo, T. Granzow, J. Rodel, Morphotropic phase boundary in (1-x) Na0.5Bi0.5TiO3-xK0.5Na0.5NbO3 lead-free piezoceramics, Applied Physics Letters, 92 (2008) 222902. [70] P. Laoratanakul, R. Yimnirun, S. Wongsaenmai, Phase formation and dielectric properties of bismuth sodium titanate-potassium sodium niobate ceramics, Current Applied Physics, 11 S161-S166. [71] T. Tadashi, M. Kei-ichi, S. Koichiro, (Bi1/2Na1/2)TiO3-BaTiO3 System for Lead-Free Piezoelectric Ceramics, Japanese Journal of Applied Physics, 30 (1991) 2236.

26
[72] Q. Xu, S. Chen, W. Chen, S. Wu, J. Lee, J. Zhou, H. Sun, Y. Li, Structure, piezoelectric properties and ferroelectric properties of (Na0.5Bi0.5)1-xBaxTiO3 system, Journal of Alloys and Compounds, 381 (2004) 221-225. [73] Z. Chen, A. Shui, Z. Lu, P. Liu, Piezoelectric and Dielectric Properties of (Bi0.5Na0.5)TiO3-Ba(Zr0.04Ti0.96)O3 Lead-Free Piezoelectric Ceramics, Journal of the Ceramic Society of Japan, 114 (2006) 857-860. [74] C. Zhou, X. Liu, Effect of B-site substitution of complex ions on dielectric and piezoelectric properties in (Bi1/2Na1/2)TiO3 piezoelectric ceramics, Materials Chemistry and Physics, 108 (2008) 413-416. [75] S. Zhang, R. Xia, T.R. Shrout, Lead-free piezoelectric ceramics vs. PZT?, J Electroceram, 19 (2007) 251-257. [76] S.-T. Zhang, A.B. Kounga, E. Aulbach, H. Ehrenberg, J. Rödel, Giant strain in lead-free piezoceramics Bi0.5Na0.5TiO3–BaTiO3–K0.5Na0.5NbO3 system, Applied Physics Letters, 91 (2007) 112906. [77] S.-T. Zhang, A.B. Kounga, E. Aulbach, T. Granzow, W. Jo, H.-J. Kleebe, J. Rödel, Lead-free piezoceramics with giant strain in the system Bi0.5Na0.5TiO3–BaTiO3–K0.5Na0.5NbO3. I. Structure and room temperature properties, Journal of Applied Physics, 103 (2008) 034107. [78] S.-T. Zhang, A.B. Kounga, E. Aulbach, W. Jo, T. Granzow, H. Ehrenberg, J. Rödel, Lead-free piezoceramics with giant strain in the system Bi0.5Na0.5TiO3–BaTiO3–K0.5Na0.5NbO3. II. Temperature dependent properties, Journal of Applied Physics, 103 (2008) 034108. [79] S.-T. Zhang, F. Yan, B. Yang, W. Cao, Phase diagram and electrostrictive properties of Bi0.5Na0.5TiO3–BaTiO3–K0.5Na0.5NbO3 ceramics, Applied Physics Letters, 97 (2010) 122901. [80] G. Picht, J. Topfer, E. Hennig, Structural properties of (Bi0.5Na0.5)1-xBaxTiO3 lead-free piezoelectric ceramics, Journal of the European Ceramic Society, 30 (2010) 3445-3453. [81] J.F. Scott, C.A. Paz de Araujo, Ferroelectric Memories, Science, 246 (1989) 1400-1405. [82] C.-H. Lu, Y.-C. Chen, Sintering and decomposition of ferroelectric layered perovskites: Strontium bismuth tantalate ceramics, Journal of the European Ceramic Society, 19 (1999) 2909-2915. [83] C.A.P. de Araujo, J.D. Cuchiaro, L.D. McMillan, M.C. Scott, J.F. Scott, Fatigue-free ferroelectric capacitors with platinum electrodes, Nature, 374 (1995) 627-629. [84] I. Seiji, U. Ichiro, Piezoelectricity in Ceramics of Ferroelectric Bismuth Compound with Layer Structure, Japanese Journal of Applied Physics, 13 (1974) 1572. [85] I. Coondoo, A.K. Jha, Investigations of structural, dielectric and ferroelectric behavior of europium substituted SrBi2Ta2O9 ferroelectric ceramics, Solid State Communications, 142 (2007) 561-565. [86] A. Li, H. Ling, D. Wu, T. Yu, M. Wang, X. Yin, Z. Liu, N. Ming, Investigation of the structural and electrical properties of Sr1-xBi2.2Ta2O9 thin films with deficient Sr contents, Applied Surface Science, 173 (2001) 307-312. [87] Y. Shimakawa, Y. Kubo, Y. Nakagawa, T. Kamiyama, H. Asano, F. Izumi, Crystal structures and ferroelectric properties of SrBi2Ta2O9 and Sr0.8Bi2.2Ta2O9, Applied Physics Letters, 74 (1999) 1904-1906.

27
[88] K. Takemura, T. Noguchi, T. Hase, Y. Miyasaka, Dielectric anomaly in strontium bismuth tantalate thin films, Applied Physics Letters, 73 (1998) 1649-1651. [89] Y. Wu, M.J. Forbess, S. Seraji, S.J. Limmer, T.P. Chou, G. Cao, Oxygen-vacancy-related dielectric relaxation in SrBi2Ta1.8V0.2O9 ferroelectrics, Journal of Applied Physics, 89 (2001) 5647-5652. [90] I. Coondoo, N. Panwar, Enhanced Dielectric and Ferroelectric Properties of Donor (W6+, Eu3+) Substituted SBT Ferroelectric Ceramics, INTECH Open Access Publisher, 2010. [91] I. Coondoo, N. Panwar, A.K. Jha, Effect of sintering temperature on the structural, dielectric and ferroelectric properties of tungsten substituted SBT ceramics, Physica B: Condensed Matter, 406 (2011) 374-381. [92] R. Aoyagi, H. Takeda, S. Okamura, T. Shiosaki, Ferroelectric and piezoelectric properties of bismuth layered-structure ferroelectric (Sr,Na,Bi)Bi2Ta2O9 ceramics, Materials Science and Engineering: B, 116 (2005) 156-160. [93] N. Zhang, L. Li, Z. Gui, Improvement of electric fatigue properties in Pb0.94La0.04(Zr0.70Ti0.30)O3 ferroelectric capacitors due to SrBi2Nb2O9 incorporation, Materials Research Bulletin, 36 (2001) 2553-2562. [94] N. Zhang, L. Li, B. Li, D. Guo, Z. Gui, Improvement of electric fatigue properties in PLZT ferroelectric ceramics due to SrBi2Ta2O9 incorporation, Materials Science and Engineering: B, 90 (2002) 185-190. [95] N. Thongmee, A. Watcharapasorn, M. Hoffman, S. Jiansirisomboon, Ferroelectric properties of Pb(Zr0.52Ti0.48)O3-Bi3.25La0.75Ti3O12 ceramics, Ceramics International, 38, Supplement 1 (2012) S205-S209.

28
Chapter 2 Synthesis Route and Investigated Parameters
2.1 Introduction
The basic steps of the solid state reaction route, used in the present work, are presented in the following sections. Structural, microstructural, dielectric, piezoelectric, leakage current, ferroelectric and polarization fatigue characterization techniques are used in the present study. The basic principles of these experimental methods and techniques are also briefly explained in this chapter.
2.2 Synthesis Procedure
Processing technique plays a vital role in determining the purity, microstructure and density, which ultimately decides the electrical properties of the synthesized product [1-3]. The ever increasing demand of advanced ceramics with specific properties has led to the improvement and optimization of existing synthesis techniques as well as development of new ones. Some of the most interesting methods/techniques, used to prepare the ferroelectric ceramic materials, are solid-state reaction route, sol-gel, polymer-sol-gel, hydrothermal, micro emulsion, combustion, thermal pyrolysis spray, molten salt synthesis route etc. Each of these synthesis routes has their own advantages and disadvantages. In order to achieve a quality product with respect to purity, homogeneity, reactivity, particle sizes etc., one has to select the most desirable synthesis route. In the present study, solid state reaction route has been selected for the processing of the selected materials. Though, the solid state reaction route has some inherent shortcomings like: chances of contamination and non-homogeneity, yet it has its own specific advantages over other synthesis routes. Solid state reaction route, mostly used for a large-scale production of the ceramics, is also most convenient for laboratory scale preparation of the ceramics. It is a convenient, easier and a low-cost technique among other available synthesis methods in terms of performance, reliability and reproducibility [4].

29
2.2.1 Solid State Reaction Route (SSRR)
Solid state reaction route is the most extensively used processing method for the synthesis of polycrystalline bulk ceramics. This method involves large range of selection of starting materials viz. carbonates, oxides, etc. Since solids do not react with each other at room temperature (RT), it is necessary to heat them at elevated temperatures as high as up to ~1500oC for the proper reaction to take place at significant rate. Thus, both kinetic and thermodynamic factors are important in this method. Here, the solid reactants react chemically without the presence of any solvent at high temperatures yielding a product which is stable. The major advantage of this method is that the final compound is in the solid form, which is structurally pure and with the desired properties. The various steps of solid-state reaction synthesis route are given in the flow chart, shown in Fig.2.1.
Fig.2.1: Synthesis steps involved in a conventional solid state reaction route.
Precursors in Stoichiometric Proportion
Ball Milling
Calcination
Phase Confirmation
Binder Addition
Green Compacts
Sintering
Density and Microstructure Determination
Electroding
Electrical Characterizations

30
2.2.1.1 Precursors in Stoichiometric Proportion
Precursors are the starting raw materials also called as reagents. The nature of the raw materials has a major effect on the properties of the final ceramic material. The quality of the starting raw materials depends upon the purity% and the particle size. The starting reagents are dried thoroughly before weighing to remove the moisture and are selected on the basis of reaction conditions. The surface area of the reagents influences the reaction rate for which fine-grained materials should be used. If the raw materials contain some impurities, it affects the physical properties of the final product material [5].
2.2.1.2 Ball Milling and Grinding
Ball milling is a process of grinding the raw materials into fine powder for uniform mixing when different materials are grinded together. The rate of grinding depends on particle size of raw materials, grinding media, container and the medium used [6]. Rate of grinding is inversely proportional to particle size of the materials. As the particles become fairly fine, further reduction in size becomes more and more difficult. The size and density of grinding media plays an important role for deciding the rate of milling. In the milling process, the particles experience mechanical stress at their contact points due to compression, impact, or shear with the milling medium or with other particles. Size and density of the particles play an important role in the formation of desired product; therefore proper care should be taken in the milling and grinding steps.
2.2.1.3 Calcination
The calcination temperature can be estimated by thermal analysis techniques (DSC/TGA characterization techniques, discussed in later sections) of the dried precursor mixture, obtained after milling process. During calcination, the phase formation of the compound takes place by solid-phase reaction, which involves the chemical reaction through atomic diffusion at temperature below the melting points of the precursors [7]. Four physical processes are involved in the calcination process, viz. (i) linear expansion of the particles (ii) contraction of the product (iii) solid phase reaction and (iv) grain growth. Generally, calcination process is an endothermic decomposition reaction, which results in the final single phase with the liberation of gases [8].
2.2.1.4 Binder Addition
Binder holds the granules of the powder together during the preparation of the green compacts, required for sintering. Addition of binder also reduces the brittleness of the green compacts. The binder should decompose at much lower temperature, compared to the calcination temperature of the compound. Generally, polyvinyl alcohol (PVA) is used as the binder which is a water soluble synthetic polymer with a monomer of (-CH2-CHOH-) with excellent adhesive property.

31
2.2.1.5 Sintering
Green compacts are densified through the sintering process. The various mechanisms of sintering of polycrystalline materials take place through bonding and growth of necks between the particles. Various sintering mechanisms are: lattice diffusion from the surface, surface diffusion, vapor transport, lattice diffusion from the grain boundary, grain boundary diffusion, and plastic flow [9]. Grain boundary diffusion and lattice diffusion are the most important densifying mechanisms in the polycrystalline ceramics. The diffusion from grain boundary to the pore permits neck growth as well as contribute to the densification process. Besides these mechanisms, different ionic species forming the compound are coupled to preserve the stoichiometry and electroneutrality. In sintering process, the green compacts are heated to a temperature, which is approximately ~50-80% of the melting temperature [10], as a result the pellet does not melt and the particles join to reduce the porosity of the compact by ionic diffusion, shown in Fig.2.2. The sintered pellets are ready for any type of characterizations succeeded by proper optimization or/else sintering temperature is varied for better densification and is optimized again.
Fig. 2.2:Schematics of sintering process: (a) three grains before solid-state sintering, and (b) after sintering[11].
2.2.1.6 Electroding
Electroding on insulating ceramics is required for testing the electrical properties of the ceramic materials. The selection of suitable conducting electrodes for electrical measurements of a non-conducting sample is very important. There are two types of parallel plate measurement methods: contacting and non-contacting electrodes. The contacting thin film electrode method is adopted widely. This is because it causes minimum error, caused by the air gap between the electrodes and the surface of the test

32
material. Secondly, the procedure to measure dielectric constant under this method is simple as compared to non-contacting electrode method.
2.3 Characterization Techniques Advanced ceramics demonstrate specific properties, and they are characterized by
various experimental techniques with a specific aim. Some of the characterizations are related with the synthesis process and others are related with the characterizations of the final product for the purpose of analyzing their utility for a specific device application. In the present study, following experimental techniques are used:
Thermogravimetric analysis and differential scanning calorimetry X-Ray diffraction study Density measurements Scanning electron microscope Dielectric characterizations Leakage current study Piezoelectric study Ferroelectric P-E loop study Polarization fatigue study
2.3.1 Thermo Gravimetric Analysis and Differential Scanning Calorimetry
Thermo Gravimetric Analysis (TGA) is one of the thermal analysis techniques in which the substance undergoes a mass change when subjected to a controlled temperature rise. The specimen powder and the reference material are placed on refractory pans (Alpha alumina or platinum) and suspended from high precision balances. A thermocouple is in close proximity to the specimen though not in contact, so as not to interfere with the free float of the balances. The balances are electronically compensated to ensure the specimen pan does not move whenever the specimen gains or losses weight. The measurement is normally carried out in air or in an inert atmosphere, such as He/Ar, and the changes in weight are recorded as a function of temperature of the testing samples. Sometimes the measurement is performed in neon oxygen atmosphere to slow down the oxidation process [12, 13].
Differential scanning calorimetry (DSC) is also one of the thermal analysis techniques in which the difference in the amount of heat required to increase the temperature of a sample and that of the reference is measured as a function of temperature. The sample and reference are enclosed in the same furnace and are maintained at nearly the same temperature throughout the experiment. The temperature

33
program is designed in such a way that the temperature of sample holder increases linearly as a function of time. The reference sample has a well-defined heat capacity over the range of temperatures to be scanned and does not undergo a physical or chemical change during the measurement. The basic principle underlying this technique is that the sample undergoes a physical transformation namely phase transitions, melting, decomposition, crystallization etc. and heat will flow into or out of the specimen (endothermic or exothermic process) in order to maintain both the specimen and the reference at the same temperature. When the specimen undergoes a phase transition from solid to liquid phase it requires more heat to be supplied than the reference to maintain the same temperature. This absorption of heat corresponds to an endothermic peak in the DSC curve. Similarly when the sample becomes crystallized, heat energy is liberated from the specimen and hence corresponds to an exothermic peak in the DSC curve. By observing the difference in heat flow between the specimen and reference, it is possible to measure the amount of heat absorbed or released during such transitions [12-14].
2.3.2 X-Ray Diffraction Study
X-ray diffraction (XRD) is a powerful nondestructive tool for determining the structure, phase, crystal orientations (texture), and other structural parameters, such as average crystallite size, strain, crystallinity, and crystal defects. Physical properties of the solids (e. g., electrical, optical, magnetic, ferroelectric, etc.) depend on atomic arrangements of materials; therefore the determination of the crystal structure is an important part in the characterizations of the materials. XRD peaks are formed by constructive interference of a monochromatic beam of X-rays scattered at specific angles from each set of lattice planes in a sample [15]. The peak intensities are determined by the atomic arrangements within the lattice plane. Consequently, the XRD pattern is a fingerprint of periodic atomic arrangements in the given material [16]. The XRD pattern is governed by the Bragg’s law. The Bragg condition of diffraction is defined as
)1.2(sin2 θλ dn =
where, n is the order of diffraction, λ is the wavelength of the X-rays, d is the interplanar spacing, and θ is the scattering angle. The wavelength of the X-rays should be of the order of lattice spacing of the sample in order to produce diffraction peaks at specific angles. Fig 2.3 shows the schematic interaction of X-rays with the crystal planes.

34
Fig.2.3: Schematic representation of interaction of X-rays with crystal planes [17].
Various properties of the materials can be analyzed by determining the lattice parameters accurately. The calculation of the lattice parameters from the 2θ positions or d -spacing values can be done using the following formula:
]sinsinsin[ 222222222222212 γβα balackcbhV
hkld++=
)2.2()coscoscoscoscoscos1( 2/1222 γβαγβα +−−−= abc
where, V is the volume of the unit cell, a , b , c , α , β , and γ are the lattice parameters
and h , k , l are the Miller indices of the lattice planes. The following information can be obtained from the XRD analysis: (i) quality and phase confirmation of the synthesized samples, (ii) the interplanar spacing (d), (iii) the intensities of the reflections, (iv) the unit cell parameters and the type of lattice [18].
2.3.3 Density Measurements
Density of the synthesized materials is an important experimental parameter for specifying their use in various device applications. The synthesized materials having experimental density near to that of the theoretical density exhibits better properties. The theoretical density can be determined by knowing the lattice parameters. The theoretical density ‘ thρ ’ can be determined by using the following equation,
)3.2(NVnM
th =ρ
where, n is the number of atoms per unit cell and M is the atomic weight. ‘ N ’ is Avogadro’s number and ‘V ’ is the volume of the unit cell. The experimental density ( exρ )
of the synthesized materials is measured by using the Archimedes principle:

35
)4.2(liquidtheofDensityweightSuspendedweightSoaked
weightDryex ×
−
=ρ
Relative density (RD) of the synthesized materials is defined as the ratio of experimental density to the theoretical density and calculated by using the following relation,
)5.2(%100)( ×=th
exRDρρ
2.3.4 Scanning Electron Microscope
Scanning electron microscope (SEM) is a type of electron microscope that images a sample surface by scanning it with a high-energy beam of electrons. This technique is widely used to characterize the surface topography and morphology of the sintered samples. The fundamental principle of scanning electron microscopy (SEM) is mainly based on the kinetic energy of the accelerated electrons. This energy is dissipated in the form of a variety of signals due to the electron-sample interactions. These signals include secondary electrons, backscattered electrons (BSE) (used for SEM images), diffracted backscattered electrons (used to determine crystal structures and orientations), photons (characteristic X-rays, used for elemental analysis), visible light (cathode luminescence), and heat. Secondary electrons and backscattered electrons are commonly used in studying the morphology of the sintered samples and illustrating the contrasts in the composition of the multiphase samples (i.e. for rapid phase discrimination). The characteristic X-rays are generated by inelastic collisions of the incident electrons with electrons in discrete orbitals (shells) of the atoms of the investigated samples, thus the characteristic X-rays are produced for each element of the samples. SEM analysis is considered to be "non-destructive"; because the X-rays generated by electron interactions do not lead to volume loss of the sample [19, 20]. Fig 2.4 shows the schematic diagram of different signals coming out from the interaction of electron beam with the matter.

36
Fig. 2.4: Interaction of electron beam with matter [21]
The specimen under scanning electron microscope must be electrically conductive at least at the surface and electrically grounded to prevent the accumulation of electrostatic charge at the surface. The nonconductive specimen tends to get charged when scanned by the electron beam and especially in the secondary electron imaging mode; which causes scanning faults and other imaging artifacts. Therefore, it is usually coated with an ultrathin layer of electrically conducting material like platinum or gold; using low vacuum sputter coating or by high vacuum evaporation [20, 22].
2.3.5 Dielectric Characterizations
Ferroelectric materials very often show interesting dielectric properties like high dielectric constant (εr) and low dielectric loss (tanδ), which are important for practical capacitor device applications. Study of εr and tanδ provides a great deal of information about the utility of the ferroelectric materials in various dielectric applications.
2.3.5.1 Dielectric Constant
The dielectric constant (εr) of a material is the ratio of the charge stored on a pair of electrodes, separated by a slab of material, at a given voltage and the charge stored on a set of identical electrodes, separated by vacuum. It is defined as;
)6.2(10 EP
r εε +=
where, rε : Dielectric constant or relative permittivity of the material E : Net electric field in the presence of dielectric material P : Induced dipole moment / volume under an applied electric field E
0ε : Permittivity of the free space

37
And, for an alternating electric field, the dielectric constant can be written as
)7.2(''' εεε ir −=
where, 'ε and ''ε are the real and imaginary components of the dielectric constant, respectively. The real component is in phase and imaginary component is in 90o out of phase with the applied external electric field. The ''ε is caused either by resistive leakage or dielectric absorption.
For ordinary substances, the value of εr is low, usually under 5 for organic materials and under 20 for most inorganic solids. Ferroelectric ceramics, however
generally have much higher rε , typically several hundred to several thousand [23, 24].
LCR meter measures the various electrical parameters at low frequencies employing auto-balancing bridge. Fig.2.5 shows the schematic diagram of auto-balancing bridge. Z is the impedance of the material (in the form of electrode pellet), Z1 and Z2 are known impedance and Zx is variable impedance. Zx is varied until no current flows through G. Underbalanced condition, Z can be calculated as,
)8.2()(1
2×= Z
ZZZ
Fig. 2.5: Schematic diagram of auto-balancing bridge [25].
Knowing the value of Z , the resistance component ( R ) and reactance component ( X ) can be calculated. Capacitance ( C ) and dielectric loss ( δtan ) can be calculated using the
Z1 Z2
Zx Z
G

38
following formula fXC π2/1= where f is frequency and XR /tan =δ . Knowing the
capacitance C , dielectric constant can be calculated as,
)9.2(AdC
or ×
×=
εε
where, oε : Permittivity of free space in farad per meter (8.854 x 10⁻¹²F/m)
rε : Dielectric constant or relative permittivity of the sample. A : Area of each plane electrode in square meters (m2) d : Thickness of the electrode ceramic sample in meters (m)
2.3.5.2 Dielectric Loss
The charging current in an ideal dielectric leads the applied voltage by 2/πradians (90o). However, in real dielectrics, in addition to the charging current, associated with the storage of electric charge by the dipoles, a loss current must be considered, which arises from the long-range migration of charges, e.g., DC ohmic conduction and the dissipation of energy associated with the rotation or oscillation of dipoles [24]. As the dielectric always possesses a loss, it is generally represented by a complex dielectric constant, defined in equation 2.10. The total current in the real dielectric is a complex quantity which leads the voltage by an angle (90-δ), where δ is called the loss angle. The tangent loss is given by
)10.2(tan '''
εεδ ==
cl
II
The total current I through the capacitor can be resolved into two components, a charging current (Ic) in quadrature with voltage and conduction current Il in phase with the voltage. The vector resolution of the total current is shown in Fig. 2.6.
Fig. 2.6:The vector resolution of ac current in a capacitor [4].

39
Dielectric loss ( δtan ) is also commonly known as the dissipation factor, D . The inverse of the loss tangent, δtan/1=Q , is used as a figure of merit in high-frequency applications [24].
2.3.6 Leakage Current Study
Leakage current is primarily associated with the dielectric capacitors, used in the electronic devices, and refers to the conduction of a small amount of current even when they are electrically turned off. Even though this off current is of the order of magnitude less than that of the current through the device when it is on, this leakage current still slowly discharges through the capacitor. The leakage current through a capacitor relate to the imperfection within the used dielectric materials and hence also known as dielectric leakage. In most of the applications, the ferroelectrics are used as capacitors, either as bulk ceramics or single crystals or as thin films of polycrystalline or of epitaxial nature [26]. Also, most of the device applications are related with the external voltage, applied on the ferroelectric capacitors, which leads to the unavoidable occurrence of a leakage current. Traditionally, the possible conduction mechanisms in ferroelectric materials are divided in two major classes [27]:
1. Bulk limited: ohmic-type conduction; space charge limited currents (SCLC); Pool-Frenkel emission (PFE) from the deep traps; hopping.
2. Interface limited: thermionic emission over the potential barrier at the electrode interface, also known as Schottky emission (SE); electric field assisted tunneling or Fowler-Nordheim tunneling (FNT).
If the leakage is controlled by the PFE, which originates from the field assisted thermal ionization of trapped carriers into the conduction band of the materials; then the leakage current density can be expressed as [28].
)11.2(exp0
−−
=kT
eEe
AEJopt
t επεφ
where, A is a constant, E is applied electric field, tφ is the trap ionization energy, e is the
elementary charge, T is the temperature, k is the Boltzmann’s constant, optε is the optical
dielectric constant, and oε is the permittivity of free space. On the other hand, if the
leakage is dominated by SCLC, which originates from the density of free electrons when

40
carrier injection overcomes density of thermally stimulated free electrons, then the leakage current density can be expressed as [29]
)12.2(89 2
0 LEJ r µεε=
Where, μ is the mobility of charge carriers, εr is the dielectric constant, and L is the material thickness. Furthermore, if the leakage is controlled by the FN tunneling, then the leakage current density can be expressed as [30]
)13.2(exp2/3
2
−=
EC
BEJ iφ
Where, B and C are constants and ϕi is the potential barrier height.
The J-E characteristics of FN tunneling, PF emission, and SCLC can be characterized by the linear relationships J vs. E in the form ( ) ( )EEJ /1ln/ln 2 − ,
( ) 2/1/ln EEJ − and ( ) ( )EJ loglog − , respectively, based on their slope which is around two.
2.3.7 Piezoelectric Study
2.3.7.1 Strain vs. Electric Field Behavior
In ferroelectric materials, polarization switching by an applied external electric field leads to strain–electric field ( ES − ) hysteresis loop. Generally, the ES − hysteresis loops in the ferroelectrics resemble the shape of a butterfly and arises due to the three types of effects. One is the converse piezoelectric effect and the other two are due to switching and movement of domain walls. Here, the converse piezoelectric effect is known to be a primary electromechanical coupling effect in solid-state theory i.e. the strain is linearly proportional to the electric field, whereas electrostriction is a secondary coupling effect in which the strain is proportional to the square of the electric field and is independent of the direction of the applied electric field. Some ferroelectric materials (relaxor) show the electrostrictive effect, shown in Fig. 2.7(a) [31], and expressed as:
)14.2(2MEx =
Where, x is the strain induced with the application of applied electric field E , and M is electrostrictive constant.

41
Fig. 2.7: (a) Strain induced by electric field in an electrostrictive material [32], and (b) butterfly loop in a piezoelectric material [33].
Fig. 2.7(b) shows the strain vs. electric field ( ES − ) hysteresis loop of a ferroelectric material. At zero fields (point A), the strain of the crystal is taken to be zero. The electric field is then applied in the direction of the spontaneous polarization. As the field is increased, the crystal expands due to piezoelectric effect and the induced strain traces the path A–B–C. The expansion continues until the maximum field reaches to point C. At point C, the field starts to decrease, but it is still parallel to sP . The strain of the
sample traces the same line but in the opposite direction (from C to A). At point A the strain is again zero. The field then changes its direction, becoming antiparallel to sP . As
the field strength increases in the negative direction, the crystal contracts with respect to point A. At point D, the field is large enough to switch the direction of polarization. After switching, the polarization becomes parallel to the field and the strain becomes positive again (point E). During further increase of the field in the negative direction, strain increases to point F and then decreases back to point A as the field is decreased [33]. The reversal of the polarization and sudden change of the strain happens again at point G. The strain–field curve is linear, indicating that the strain is purely piezoelectric except at the switching points D and G.
Practically, the ES − curve for a piezoelectric material has a hysteresis loop, which resembles the shape of a butterfly, shown in Fig. 2.8. This results because of the combined effect of electrostrictive and piezoelectric phenomenon, switching and movement of domain walls in a ferroelectric material. Moreover, ceramic samples usually contain a number of non-180odomain walls. The movement and switching of non-180o domain walls may involve a significant change in the dimensions [34]. During the field

42
cycling process, a residual (or remnant) strain may be observed at zero fields if the domains do not switch to their original positions [34, 35]. As the contribution to the strain from movement of domain walls is strongly nonlinear and possess a hysteresis, this results in a non-linear ES − curve, shown in Fig. 2.8. However, hysteresis free S-E behavior is desired for actuator applications [36].
Fig. 2.8: Strain versus electric field behavior of a general ferroelectric material [37].
2.3.7.2 Poling
Inside a ferroelectric crystal, the regions with uniform polarization are called ferroelectric domains within which all the electric dipoles are aligned in the same direction. The domains in a crystal are separated by boundaries called domain walls. Adjacent domains can have their polarization vectors in antiparallel directions, at right angles to one another, etc. Neighbouring domains having polarization vectors at right angles and antiparallel directions are known as having 90o or 180o domain walls, respectively [24].
Fig. 2.9:Schematic illustration of the poling process [38].

43
A ferroelectric single crystal has multiple ferroelectric domains when it is grown. Poling is a process in which a single domain can be obtained by the motion of domain walls which is made possible by the application of a sufficiently high electric field. This is a very important process required for realizing the practical application of polycrystalline ferroelectric ceramics in various devices. Ferroelectric ceramics do not possess piezoelectric properties owing to the random orientations of the ferroelectric domains before poling. During poling, a DC electric field is applied on the ferroelectric sample, which forces the domains to be oriented in a particular direction. After poling i.e., even after the removal of the electric field, a remnant polarization and a remnant strain is maintained in the sample and because of which the sample exhibits piezoelectricity. A simple illustration of the poling process is shown in Fig. 2.9.
2.3.7.3 Piezoelectric Coefficients
2.3.7.3.1 Piezoelectric Charge Coefficient
As explained in the previous chapter, either direct or converse piezoelectric effects can be employed for evaluation of piezoelectric coefficients. Measurement of the piezoelectric coefficients using the direct piezoelectric effect is done by applying a normal load to a ferroelectric capacitor and then measuring the charge on the electrodes. To measure the piezoelectric coefficients using the converse piezoelectric effect, an electric field is applied and the strain in the ferroelectric material is measured. The equations for the direct and converse piezoelectric effects are given as:
Direct effect: )15.2(TdD =
Converse effect: )16.2(EdS =
where, ‘ d ’ is the piezoelectric charge coefficient, ‘ D ’ is the dielectric displacement, ‘T ’ is the mechanical stress, ‘ E ’ is the electric field and ‘ S ’ is the mechanical strain. Higher value of ‘ d ’ is desirable for materials intended to be developed for applications which use motion or vibration, such as sonar or ultrasonic cleaner or transducers [24]. Since, piezoelectric coefficient is direction dependent i.e., it is a tensor quantity; the longitudinal piezoelectric coefficient (d33) is the value of the piezoelectric coefficient that applies to the distortion measured in the same direction as that of the applied external electric field [39]. The strain induced in a piezoelectric material by an applied electric field depends on the value of E and d , which decides the material's suitability for strain-dependent (actuator) applications [40].

44
2.3.7.3.2 Electromechanical Coupling Coefficient
The electromechanical coupling factors, k33, k31, kp, and k15 describes the effectiveness with which a piezoelectric material converts electrical energy into mechanical energy, or converts mechanical energy into electrical energy. ‘k’ can be determined from the dimension of the sample. In the k33, k31, and k15 electromechanical coupling coefficient notations, the first subscript denotes the direction along which the electrodes are connected; the second denotes the direction along which the mechanical energy is applied, or developed. In general, the electromechanical coupling factor can be expressed as [41]:
)17.2(2
energymechanicalInputenergyelectrialtoconvertedenergyMechanicalk =
)18.2(2
energyelectricalInputenergymechanialtoconvertedenergyElectricalk =
In contrast to static DC conditions, the behavior of the piezoelectric materials is
much more complex under dynamic DC conditions. Generally, it is characterized in terms of an equivalent electrical circuit, which exhibits both parallel and series resonance
frequencies. The frequency of the minimum impedance ( rf ) and the frequency of the
maximum impedance ( af ) of a typical ferroelectric material are shown in Fig.2.10.
Fig. 2.10: A typical impedance vs. frequency curve of a ferroelectric material showing the resonance and anti-resonance frequencies [42].
These rf and af frequencies are called as resonance and anti-resonance
frequencies, respectively. The resonance frequency is the frequency at which the sample

45
vibrates most readily and converts the input electrical energy into the mechanical energy most efficiently [43]. Fig.2.10 shows that initially with the increase of frequency, the
impedance decreases and reaches a minimum value at rf and with the further increase in
frequency the impedance increases and reaches a maximum value at af . The resonance
frequency measurement of a material is strongly dependent upon its geometry. For a thin disc of piezoelectric ceramic, the planar mode coupling coefficient ( pk ) expresses radial
coupling which is the coupling between the electric field parallel to the direction in which the ceramic element is polarized and mechanical effects that produce radial vibrations.
pk value measured from rf and af values can be calculated by using the following
relation, [44]
)19.2()(51.22
r
rap f
ffk −=
To assure the resonance behavior, sample geometry must be chosen carefully
[43]. Geometries, suitable for measuring the different piezoelectric and elastic coefficients, are given in Table 2.1.
Table 2.1: Sample geometries for measurement of material properties.
Dimensional Requirement
Long, slender, length poled rod;
l > 3d
Thin flat plate, thickness poled;
l > 3.5t, w
Thin flat disc, thickness poled d>10t
Properties Measured
ME
DT
Qgds
skK
,33,3333
33,333
,
,,tan, δ
ME
DT
Qgds
skK
,31,3111
11,313
,
,,tan, δ Mp
T QkK ,tan, ,3 δ
2.3.8 Ferroelectric P-E Loop Study
The most important characteristic of a ferroelectric material is the polarization reversal (or switching) by an applied external electric field. Mainly, the domain wall switching in the ferroelectric materials leads to the development of polarization vs.

46
electric field ( EP − ) hysteresis loop. The hysteresis loop is the polarization responding to an applied voltage, P(V). Its derivative with respect to voltage is expressed by,
)20.2(/Area
VQVP δδ
δδ
=
The domain switching in a ferroelectric material, results a ferroelectric hysteresis loop[30], shown in Fig. 2.11.At small values of the electric field, the polarization increases linearly with the increase of field amplitude. As the field is increased, the unfavourable direction of the polarization will start to switch in the direction of the field, rapidly increasing the measured charge density. An ideal hysteresis loop is symmetrical and in this case, +EC= −EC and +PR= −PR, known as the coercive field and remnant polarization, respectively. The shapes of the P-E loop are affected by many factors such as the thickness of the sample, the presence of charged defects, mechanical stresses, preparation conditions, thermal treatment etc. The mechanism of polarization switching has been studied in detail for many bulk and thin-film ferroelectrics [39]. The polarization reversal takes place by the growth of existing antiparallel domains, by domain-wall motion, and by nucleation and growth of new antiparallel domains, shown in Fig. 2.12 [45].
Fig. 2.11: Ferroelectric hysteresis ( EP − ) loop (Circles with arrows represent the polarization state of the material at the indicated fields) [46].

47
Fig.2.12:Probable sequence of polarization switching in ferroelectrics: (a) nucleation of oppositely oriented domains, (b) growth of oppositely oriented domains, (c) sidewise motion of domain walls and (d) coalescence of domains [45]. 2.3.9 Polarization Fatigue Study
Polarization fatigue of ferroelectrics is the systematic suppression of switchable polarization after a repeated number of electrical pulses [47].The fatigue property in ferroelectric materials degrades their behavior and it is of particular concern for realizing their applications in memory devices. Although both bulk and thin-film materials are prone to ferroelectric fatigue, the mechanisms of this anomaly are still not well understood. However, extensive study on polarization fatigue has generated a large body of experimental data that led to many theoretical models of the fatigue phenomenon [47, 48]. Among several mechanisms proposed for the origin of polarization fatigue, the simplest and earliest one is the reduction of the effective area of the electrodes of the capacitors [49]. A decrease in the effective size of the capacitor can contribute to a decrease in the total switchable polarization due to failure of the electrode after a number of switching cycles. If this mechanism is the origin of the fatigue then the remnant polarization, switchable polarization and capacitor area are all reduced by the same factor. The second mechanism is the reduction of the effective electric field by the formation of a passive layer [50].
However, the domain wall pinning is regarded as the main conventional mechanism responsible for the fatigue in ferroelectric materials [51, 52]. In this pinning mechanism, mobile defects such as oxygen vacancies and electronic charge carriers get trapped at the domain walls. The domain walls get pinned and the domains surrounded by the pinned domain walls do not continue to switch. Fig. 2.13 is an illustration of the domain wall pinning mechanism. Warren et al. [53] proposed this mechanism by

48
observing polarization fatigue in PZT thin films. According to their study, electronic charge carriers generated by optical and thermal treatments were trapped at domain boundaries, which led to a polarization discontinuity. Accumulation of electronic charge carriers makes the polarization reorientation difficult under an electric field.
Fig.2.13: Schematic diagrams of fatigue mechanism domain wall pinning (dashed lines are domain walls and black circles are trapped defects) [54].

49
References [1] K. Keizer, E.H.J. Janssen, K.J. de Vries, A.J. Burggraaf, Influence of particle size and structure of ZrO2 on microstructure development and dielectric constant of PbZr0.5Ti0.5O3, Materials Research Bulletin, 8 (1973) 533-544. [2] T. Yamamoto, Optimum Preparation Methods for Piezoelectric Ceramics and Their Evaluation, The American Ceramic Society Bulletin, 71 (1992) 978-985. [3] G. Arlt, The influence of microstructure on the properties of ferroelectric ceramics, Ferroelectrics, 104 (1990) 217-227. [4] A.J. Moulson , J.M. Herbert, Electroceramics: Materials, Properties, Applications, John Wiley & Sons, 2003. [5] A.R. West, Solid State Chemistry and Its Applications, John Wiley & Sons 1987. [6] J.K. A Beddow, Particle Characterization in Technology: Applications and microanalysis, CRC Press 1984. [7] Y. Xu, Ferroelectric Materials and Their Applications, Elsevier Science 2013. [8] J.D. Gilchrist, Extraction metallurgy, Pergamon, Oxford, Pergamon, 1989. [9] M.L. Eggersdorfer, D. Kadau, H.J. Herrmann, S.E. Pratsinis, Multiparticle Sintering Dynamics: From Fractal-Like Aggregates to Compact Structures, Langmuir, 27 (2011) 6358-6367. [10] M.N. Rahaman, Sintering of ceramics, CRC Press, Boca Raton (FL); London; New York, 2008. [11] A. Gronotte, Development of new chemical processes to lead-free piezoelectric and ferroelectric materials, Dept. of Chemistry Simon Fraser University, 2009. [12] J.A. Dean, Analytical Chemistry Handbook, McGraw-Hill Companies 1995. [13] D.A. Skoog, F.J. Holler, T.A. Nieman, Principles of Instrumental Analysis, Saunders College Pub.1998. [14] M.J. O'Neill, The Analysis of a Temperature-Controlled Scanning Calorimeter, Analytical Chemistry, 36 (1964) 1238-1245. [15] M.F.C. Ladd, Structure Determination by X-Ray Crystallography, Springer US2012. [16] A.R. West, Basic solid state chemistry, John Wiley & Sons, 1999. [17]x-ray diffraction,http://www.veqter.co.uk/residual-stress-measurement/x-ray-diffraction1 [18] B.D. Cullity, Elements of X-Ray Diffraction, Addison-Wesley Publishing Company, Inc.1956. [19] E. Suzuki, High-resolution scanning electron microscopy of immunogold-labelled cells by the use of thin plasma coating of osmium, Journal of Microscopy, 208 (2002)153-157. [20] J. Goldstein, D.E. Newbury, P. Echlin, D.C. Joy, A.D. Romig, C.E. Lyman, C. Fiori, E. Lifshin, Scanning Electron Microscopy and X-Ray Microanalysis: A Text for Biologists, Materials Scientists, and Geologists, Springer, US, 2012. [21] http://serc.carleton.edu/research_education/geochemsheets/electroninteractions.html [22] C.E. Jeffree, N.D. Read, Ambient and Low-temperature Scanning Electron Microscopy, Electron microscopy of plant cells, Academic Press, London, 1991. [23] G. Rangarajan, M.S. Vijaya, Materials Science, Tata McGraw-Hill 2014.

50
[24] B. Jaffe, W.R. Cook Jr., H. Jaffe, Piezoelectric Ceramics, Academic Press London and New York, 1971. [25] S.N. Kumar, Synthesis and Characterization of Sr0.53Ba0.47Nb2O6
based Ferroelectric Composites for Pyroelectric Applications Department of Physics and Astronomy, National Institute of Technology, Rourkela, 2012. [26] N. Izyumskaya, Y.I. Alivov, S.J. Cho, H. Morkoc, H. Lee, Y.S. Kang, Processing, Structure, Properties, and Applications of PZT Thin Films, Critical Reviews in Solid State and Materials Sciences, 32 (2007) 111-202. [27] L. Pintilie, M. Alexe, Metal-ferroelectric-metal heterostructures with Schottky contacts. I. Influence of the ferroelectric properties, Journal of Applied Physics, 98 (2005) 124103. [28] P. Zubko, D.J. Jung, J.F. Scott, Electrical characterization of PbZr0.4Ti0.6O3 capacitors, Journal of Applied Physics, 100 (2006) 114113. [29] R.H. Tredgold, Space charge conduction in solids, Elsevier Pub. Co.1966. [30] S.M. Sze, Physics of Semiconductor Devices, John Wiley & Sons 1981. [31] G.H. Haertling, Properties of Hot-Pressed Ferroelectric Alkali Niobate Ceramics, Journal of the American Ceramic Society, 50 (1967) 329-330. [32] S.-T. Zhang, A.B. Kounga, W. Jo, C. Jamin, K. Seifert, T. Granzow, J. Rödel, D. Damjanovic, High-Strain Lead-free Antiferroelectric Electrostrictors, Advanced Materials, 21 (2009) 4716-4720. [33] D. Damjanovic, Ferroelectric, dielectric and piezoelectric properties of ferroelectric thin films and ceramics, Reports on Progress in Physics, 61 (1998) 1267. [34] K. Uchino, Electrostrictive actuators: materials and applications, Anglais, 65 (1986) 647-652. [35] M.J. Zipparo, K.K. Shung, T.R. Shrout, Piezoceramics for high-frequency (20 to 100 MHz) single-element imaging transducers, Ultrasonics, Ferroelectrics, and Frequency Control, IEEE Transactions on, 44 (1997) 1038-1048. [36] K. Furuta, K. Uchino, Advanced Ceramic Materials, 1(1986) 61. [37] Piezo Engineering Tutorial, http://www.aerotech.com/product-catalog/piezo-nanopositioners/piezo-engineering-tutorial.aspx [38] P. Palei, Structural and Electrical Properties of Conventional and Microwave Processed Lead-Free KNN Based Ceramics, Department of Physics and Astronomy, National Institute of Technology, Rourkela, 2012. [39] M.E. Lines, A.M. Glass, Principles and Applications of Ferroelectrics and Related Materials, Clarendon Press, 1979. [40] S.-E. Park, T.R. Shrout, Ultrahigh strain and piezoelectric behavior in relaxor based ferroelectric single crystals, Journal of Applied Physics, 82 (1997) 1804-1811. [41] T. Ikeda, Fundamentals of Piezoelectricity, Oxford University Press1996. [42] The Technical Ceramics business of Morgan Advanced Materials, http://www.morgantechnicalceramics.com/. [43] Piezo theory, https://www.americanpiezo.com/knowledge-center/piezo-theory.html

51
[44] T.F. Hueter, D.P. Neuhaus, J. Kolb, An Experimental Study of Polarization Effects in Barium Titanate Ceramics, Journal of the Acoustical Society of America, 26 (1954) 696-703. [45] Shur V, E. Rumyantsev, Arising and evolution of the domain structure in ferroics, Journal of Korean Physical Society, 32 (1998) S727-S732. [46] Ferroelectrics, http://electrons.wikidot.com/ferroelectrics. [47] A.K. Tagantsev, I. Stolichnov, E.L. Colla, N. Setter, Polarization fatigue in ferroelectric films: Basic experimental findings, phenomenological scenarios, and microscopic features, Journal of Applied Physics, 90 (2001) 1387-1402. [48] P.J. Schorn, D. Brouhaus, U. Bottger, R. Waser, G. Beitel, N. Nagel, R. Bruchhaus, Fatigue effect in ferroelectric PbZr1-xTixO3 thin films, Journal of Applied Physics, 99 (2006) 114104. [49] D.J. Johnson, D.T. Amm, E. Griswold, K. Sreenivas, G. Yi, M. Sayer, Measuring Fatigue in PZT Thin Films, MRS Online Proceedings Library, 200 (1990) 289. [50] A.K. Tagantsev, M. Landivar, E. Colla, N. Setter, Identification of passive layer in ferroelectric thin films from their switching parameters, Journal of Applied Physics, 78 (1995) 2623-2630. [51] W. Li, A. Chen, X. Lu, J. Zhu, Y. Wang, Priority of domain wall pinning during the fatigue period in bismuth titanate ferroelectric thin films, Applied Physics Letters, 86 (2005) 192908. [52] W.L. Warren, D. Dimos, B.A. Tuttle, G.E. Pike, R.W. Schwartz, P.J. Clews, D.C. McIntyre, Polarization suppression in Pb(Zr,Ti)O3 thin films, Journal of Applied Physics, 77 (1995) 6695-6702. [53] W.L. Warren, D. Dimos, B.A. Tuttle, R.D. Nasby, G.E. Pike, Electronic domain pinning in Pb(Zr,Ti)O3 thin films and its role in fatigue, Applied Physics Letters, 65 (1994) 1018-1020. [54] D.H. Do, Investigation of Ferroelectricity and Piezoelectricity in Ferroelectric Thin Film Capacitors using Synchrotron X-ray Micro Diffraction, Metallurgical Engineering, University of Wisconsin-Madison, 2006.

52
Chapter 3
Experimental Details
3.1 Introduction
This chapter presents the various steps involved in the synthesis of the selected Na0.5Bi0.5TiO3 and SrBi2Ta2O9 based systems as well as their ceramic-ceramic composite systems. Further, a brief detail of the different experiments performed on the studied samples, using various characterization techniques, is also discussed.
3.2 Synthesis of the Selected Ceramics
Solid state reaction route (SSRR) was employed for the synthesis of the selected ceramic samples. Detail of different ceramic samples, synthesized in this thesis work, is listed in Table 3.1.
Table 3.1: Synthesized materials.
Perovskite materials BLSF materials
(1-x)Na0.5Bi0.5TiO3-xBaTiO3/NBT-xBT
(1-x)Na0.5Bi0.5TiO3-xK0.5Na0.5NbO3/NBT-xKNN
(where x=0.05, 0.06, 0.07, 0.08)
SrBi2Ta2O9/SBT,
Sr0.8Bi2.15Ta2O9/SBexT and
SrBi2(Ta0.925W0.075)2O9/SBTW
Perovskite-BLSF ceramic-ceramic composites
(1-ϕ)(0.93 Na0.5Bi0.5TiO3-0.07 BaTiO3/ NBT-BT)-ϕ Sr0.8Bi2.15Ta2O9T
(1-ϕ)(0.93 Na0.5Bi0.5TiO3-0.07 K0.5Na0.5NbO3/ NBT-KNN)-ϕ Sr0.8Bi2.15Ta2O9
(Where ϕ= 2, 4, 8, 12, 16 wt. %)
In the present work, commercially available high purity (≥ 99%) powder
precursors, as listed in Table. 3.2; were used as the starting raw materials for the synthesis of the selected materials.

53
Table 3.2: Precursors used in the synthesis of the selected materials.
Chemical Name Chemical Formula Purity Manufacturer
Bismuth oxide Bi2O3 99.9% Alfa Aesar Sodium carbonate Na2CO3 99.99% Merck
Titanium oxide TiO2 99.9% Merck Barium carbonate BaCO3 99.9% Merck
Potassium carbonate K2CO3 99.9% Loba Chemie Niobium pentoxide Nb2O5 99.9% Merck Strontium carbonate SrCO3 99.9% Merck
Tantalum oxide Ta2O5 99.9% Alfa Aesar Tungsten oxide WO3 99.9% Merck
Table 3.3: Details of the selected material processing steps.
Ceramic Composition Precursors Optimized Calcination
Temp.(oC)/ 4 h
Optimized Sintering
Temp.(oC)/ 4h
Sample Notation
Pero
vski
te
(1-x)Na0.5Bi0.5TiO3-xBaTiO3
(x=0.05, 0.06, 0.07, 0.08) Bi2O3, Na2CO3,
TiO2, BaCO3
1000
1150
NBT-xBT
(1-x)Na0.5Bi0.5TiO3-x K0.5Na0.5NbO3
(x=0.05, 0.06, 0.07, 0.08)
Bi2O3,Na2CO, TiO2, K2CO3,
Nb2O5
800
1100
NBT-xKNN
BL
SF
SrBi2Ta2O9 SrCO3, Bi2O3, Ta2O5,
1000
1150
SBT
Sr0.8Bi2.15Ta2O9 1200
SBexT
SrBi2(Ta0.925W0.075)2O9 SrCO3,Bi2O3, Ta2O5,WO3
1150
SBTW
Pero
vski
te-B
LSF
(1-ϕ)(0.93 Na0.5Bi0.5TiO3-0.07 BaTiO3)-ϕ Sr0.8Bi2.15Ta2O9
(ϕ= 2, 4, 8, 12, 16 wt. %)
Calcined NBT-BT and SBexT
____
1150
(1- ϕ)(NBT-BT)-
ϕ(SBexT)
(1-ϕ)(0.93 Na0.5Bi0.5TiO3-0.07 K0.5Na0.5NbO3)-ϕ Sr0.8Bi2.15Ta2O9
(ϕ= 2, 4, 8, 12, 16 wt. %)
Calcined NBT-KNN and SBexT
____
1150
(1- ϕ)(NBT-KNN)- ϕ(SBexT)

54
The various steps involved in the processing of the selected ceramic samples by SSRR are already mentioned in the flow chart, given in the previous chapter (Fig.2.1). The raw materials with defined purity, given in Table 3.2, were used for the synthesis of the corresponding ceramic compositions, listed in Table 3.3. Stoichiometric weights of the starting precursor powders were taken into a jar and ball milled with acetone using zirconia balls as grinding media for 12 hours. DSC and TGA were carried out of the ball milled uncalcined powders in the temperature range of 30–1000°C with a constant heating rate of 10oC per minute. The dried mixed powders were calcined at different temperatures (ascertained from TGA/DSC analysis) in normal atmosphere and the formation of single phase of the calcined powders of the NBT-xBT, NBT-xKNN, SBT, SBexT, SBTW ceramic samples were examined by X-ray diffractometer. The optimized calcined temperatures are listed in Table 3.3. Perovskite-BLSF ceramic-ceramic composites were prepared by taking calcined powders of the selected perovskites and BLSF ceramic powders. Polyvinyl alcohol (PVA) binder solution (3wt.%) was added into the calcined powders, which were compressed into pellets called green pellets of ~10 mm in diameter and ~1 mm in thickness, using a hydraulic press with a pressure ~ 70MPa. The green pellets were sintered in normal atmosphere at different temperatures (below their melting point) with a heating rate of 5°C/min. Optimized sintering temperatures are also listed in Table 3.3.
3.3 Characterization Techniques Used This section presents the details about the different characterization instrument,
used for the present study.
3.3.1 Thermal Analysis
For DSC analysis of the studied samples, temperature program is designed in such a way that the sample holder temperature varies linearly as a function of time. The reference sample should have a well-defined heat capacity over the range of temperatures to be scanned. DSC measures the difference in the amount of heat required to increase the temperature of the sample and reference, which is measured as a function of temperature. Both the sample and the reference are maintained at nearly same temperature throughout the experiment. Generally, the temperature program for a DSC analysis is designed such that the sample holder temperature increases linearly as a function of time. However, TGA is the measure of weight change of the specimen as a function of temperature. The specimen powder is placed on a refractory pan (mostly alpha alumina or platinum). The pan is suspended from a high precision balance. A thermocouple is in close proximity to the specimen but not in contact, so as not to interfere with the free float of the balance. The balances are electronically compensated

55
so that the specimen pan does not move when the specimen gains or losses weight. In the present study, DSC/TGA experiments has been performed by taking ~10 mg of ball milled powder samples and heated at a constant heating rate of 10oC per minute by using Netzsch, STA 449C.
3.3.2 Structural Study
X-ray diffraction patterns of all the ceramic samples were studied for confirming about the single perovskite phase formation. XRD analysis was performed on Rigaku Ultima-IV using Cu Kα (λ=0.15405 nm) radiation. The diffraction data was taken in the 2θ range from 20o to 60o-80o. Firstly, the Cu Kα radiation was stripped from the collected XRD data by using standard software “X’pert high score”. Then the crystal structure and the crystallographic parameters of the samples were determined from their respective diffraction peaks.
3.3.3 Density and Morphology Study
The experimental density of the sintered samples was measured using Archimedes method. In the present work, kerosene oil was used as the immersion medium. First, the dry weights of the sintered samples were measured. The sintered samples were then immersed in a glass beaker containing kerosene oil and kept in a desiccator connected with a suction pump for creating vacuum in it till the kerosene oil filled up the open pores of the ceramic samples completely, which is confirmed by observing the glass beaker to become bubbles free. Then the ceramic samples were suspended in kerosene oil with the help of a specially designed hanging pan to hold the ceramic samples inside kerosene oil and the suspended weights were measured. The soaked weights of the ceramic samples (whose pores are filled with kerosene oil) were also measured and the experimental density was calculated by the following formula;
)1.3()ker(81.0 oseneofDensityweightSuspendedweightSoaked
weightDryex ×
−
=ρ
The SEM micrographs were taken using JEOL SEM- 6480LV and JEOL T-330. In order to avoid the potential build up during the measurement, the samples (non-conducting) were coated with platinum/gold using a sputter coater. Average grain size of the samples was measured using linear intercept method by using “ImageJ software”. Firstly, the scale was set by comparing the length scale from the SEM images. Secondly the diagonal lines were drawn on a maximum number of grains (to minimize the error) and the lengths were calculated. The average value of grains was calculated by dividing the total intercepted grain length by the number of grains.

56
3.3.4 Electroding of the Samples
The sintered pellets were polished and cleaned with acetone. Sufficient care was taken for keeping the faces of the pellets parallel. A thin layer of silver paste was applied on both sides of the samples and fired in a muffle furnace at 300°C for 15 min to ensure good adhesion. The sintered ceramic pellets now act as dielectric medium between the two parallel silver metallic plates and can be subjected to various electrical measurements.
3.3.5 Poling
The schematic diagram of the corona discharge poling method is shown in Fig.3.1. The unit consists of a bottom electrode (metallic plate) and sharp pointed corona needle (top electrode), made of brass of diameter ~ 2mm. A ring-shaped grid of ~12 mm diameter, made of thin copper wire, was kept between the tip of the corona needle and the base plate in such a way that the tip of the needle is ~1mm above the center of the grid.
Fig.3.1: Schematic of the corona poling technique [1].
The samples were placed on the metallic base plate and a high voltage (5-6 kV) was applied between the corona point and the base plate. The chosen voltage was slightly higher than the voltage at which corona discharge starts. A bias voltage (1.5 kV) was applied between the grid and the metallic plate to accelerate the ions caused by

57
breakdown of air. The samples were subjected to corona discharge for 30 minutes at RT and then the field was removed. This poling technique is better than the DC poling technique in terms of the safety of the samples. In corona poling of the samples, there is no need of putting the samples in silicon oil (which is usually done in DC poling of samples to avoid the breakdown through sideways), since there is no direct contact of the electrodes with the samples.
3.3.6 Dielectric Measurements
The dielectric measurements of the samples were carried out by using a computer interfaced HIOKI 3532-50 LCR Hi-Tester, shown in Fig. 3.2. The interfacing of the instrument was done by using “Lab VIEW software”. Dielectric parameters, rε and δtan , were measured as a function of temperature at different frequencies (1kHz-1MHz). For temperature dependent dielectric measurements, the samples were heated with a heating rate of 2oC/min and the corresponding dielectric data were recorded at an interval of 1oC.
rε was calculated by using the following relation [2]:
)2.3(AtC
or ×
×=
εε
where, C is the measured capacitance, t is the thickness of the sample, A is the surface area of the sample and oε is the permittivity of the free space (~ 8.854 × 10 -12 F/m) [1].
Fig. 3.2: HIOKI-LCR meter (3532-50 HI-TESTER).
3.3.7 Polarization vs. Electric Field ( EP − ) Measurements
The RT ferroelectric hysteresis ( EP − ) loops of the studied ceramic samples were measured using Precision Premier II, a standard ferroelectric testing machine (Radiant Technology). The ferroelectric measurements were done based on the virtual ground measuring system, shown in Fig.3.3. The trans-impedance amplifier maintains the precision return terminal at a virtual ground potential in this configuration. All the charges, which flow through the sample as a result of the applied drive voltage, are

58
collected by the integrator circuit and the voltage generated on the output of the integrator is then measured and translated into the test results that are displayed by the “Vision software”. The precision drive and return circuitry are matched with respect to speed and current sinking ability; therefore the precision testers can reject errors that might occur when the drive makes a transition faster than the trans-impedance amplifier. This enables the precision testers to accurately measure a large range of capacitance values over a wide range of speeds [3]. The unit image of the precision premier II is given in Fig. 3.4.
Fig. 3.3: Schematic of the virtual ground measuring system [3].
Fig. 3.4: Precision premier II unit.

59
3.3.8 Piezoelectric Constant ( 33d ) Measurements The piezoelectric coefficient ( 33d ) of the studied samples was measured by a
quasi-static method using a Piezometer (YE2730A 33d Meter, APC International Ltd.).
The piezoelectric coefficient, 33d , is defined by the following relation:
)3.3(33Es
s
TDd
=
Where, sD is the charge density (C/m2) and sT is the mechanical stress (N/m2) at constant
electric field ( E ). Figure 3.5 shows a schematic diagram for the 33d measurement using
the Piezo-Meter. Equation 3.3 can be simplified as follows:
)4.3()/()/(
33 FCV
FQ
AFAQ
TDd
Es
s ===
=
Where,C is the shunt capacitance and V is the potential difference across the shunt capacitor.
Fig. 3.5: Schematic diagram of the 33d measurement process [4].
When a force (F) is applied on an area (A) of a poled sample by the upper and lower probes then due to the piezoelectric effect, a charge (Q) is produced. Hence, piezoelectric charge coefficient ( 33d ) measurement relates with the development of charge on the
surface of the sample. The Piezo-Meter measures this potential difference, calculates the
33d (in pC/N) of the sample and displays the value digitally.

60
3.3.9 Resonance and Anti-resonance Frequency Measurement
Resonance ( rf ) and anti-resonance ( af ) frequencies, used to calculate the
electromechanical coupling coefficients ( pk ), were measured by using HIOKI 3532-50
LCR HiTESTER. In the frequency vs. impedance graph, the point where impedance is minimum is called as resonance frequency and the point where impedance is maximum is called anti-resonance frequency. Relation between pk , rf and af values is given in
chapter 2.
3.3.10 Strain vs. Electric Field Measurements
The strain vs. electric field (S-E) loops of the studied ceramic samples were measured by using the MTI-2100 Fotonic Sensor, associated with the Precision Premier II (Radiant Technology) unit. The schematic of the MTI-2100 Fotonic Sensor is shown in Fig. 3.6. The Fotonic Sensor unit consists of a dual-channel, fiber-optic measurement system that performs non-contact displacement and vibration measurements. The Fotonic Sensor utilizes the adjacent pairs of light-transmitting and receiving fibers which are bundled together. The displacement is based on the interaction between the field of illumination of the transmitting fibers and the field of view of the receiving fibers. The sample with electrode on both sides is connected into an external voltage source. The distance between the sample and the Fotonic probe is adjusted by a screw device. At contact or zero gaps, most of the light exiting the transmitting fibers is reflected directly back into the same fiber, providing a very little amount of light to the receiving fiber and produces a zero output signal. With an increase in the probe to the target distance [Fig. 3.6(b)], the amount of light being captured by the receiving fiber increases. This process continues until the entire face of the receiving fibers is illuminated with the reflected light. This point is called the “optical peak” and corresponds to maximum voltage output of the electrical signal. Further increase in distance would cause the diverging field of reflected light to exceed the field of view of the receiving fiber, thus causing a reversal in the output-versus-distance signal relationship. Therefore, “optical peak” point corresponds to maximum received signal at the receiving fiber. During the S-E measurements, firstly the distance between the sample and the Fotonic probe is reduced by screwing backwards to get away from the optical peak to the point that gives rise to minimum intensity of received light, secondly; distance between the sample and the Fotonic probe is adjusted to get the Fotonic meter value ~3.5 V, thirdly; the Fotonic sensor is calibrated and finally; the electrical signal is applied. Any displacement of the sample in response to the electric field would be compared with the optical peak and gives the relationship of displacement versus electric field(S-E) curve.

61
Fig. 3.6: A setup for the measurements of ES − loop (a) fiber–optical probe tip configurations (b) displacement sensing mechanism of adjacent fiber optical elements.
3.3.11 Leakage Current Measurement
The leakage current measurement of the studied samples was carried out by using the Precision Premier II (Radiant Technology) ferroelectric tester with the help of “Vision” software. Ferroelectric materials are mainly used as capacitors under the application of an external voltage, which leads to unavoidable occurrence of leakage current through the samples. Measurement of this leakage current can be carried out by the Precision tester. The sample is subjected to a constant DC bias voltage. Before the measurement begins, a programmable delay or "Soak" period passes through the sample, which is intended to allow the passage of any polarization switching current or other currents, induced by the application of the voltage. After the delay period, a measurement period begins in which the current through the sample is regularly sampled and recorded. The leakage test stimulus and the measurement profile are shown in the Fig. 3.7.

62
Fig. 3.7: Leakage test stimulus and measurement profile [3].
The current is sampled as frequently as possible during the time of leakage measurement. Sampling is restricted by the duration of the measurement and is adjusted to be the maximum number of possible points, given minimum and maximum per-point sample times. The current through the device under test is measured directly by the precision circuitry system. The other parameter, resistance (in Ohms), can be derived simply from the current measurement given by:
)5.3()(/)(tanRe AmpsCurrentVoltsDCcesis =Ω
The main parameters specified by the user to configure the leakage measurement are the DC bias voltage, the soak time (ms) and the measurement time (ms).
3.3.12 Polarization Fatigue Measurement
The fatigue experiments were performed using the Radiant Precision Premier II (Radiant Technology) ferroelectric tester under long duration task using the “Vision” software. The measurement performs a complete fatigue characterization by first performing a pre-fatigue baseline PUND measurement; consisting of five pulses applied to the sample. Among the five pulses, the first pulse is a preset, switching the sample into a specific polarization state and is an unmeasured pulse. The second pulse is in the opposite direction of the Preset, switching the sample state. At the top of the pulse, the switched polarization value P* (µC/cm2) is measured. After the pulse, the zero-Volt P*r (µC/cm2) value is measured. The third pulse is in the same direction as the second. It measures unswitched polarization P^ (µC/cm2). And, again at zero volts, P^r (µC/cm2) is measured. The fourth and fifth pulses repeat the second and third pulses in the opposite

63
voltage direction, giving -P* (µC/cm2), -P*r (µC/cm2), -P^ (µC/cm2) and –P^r (µC/cm2) parameters. Then a series of stress/measure cycles are performed in which an unmeasured waveform is applied for a period of time, followed by a PUND measurement. Each subsequent stress period adjusts its duration. Normally, the task is configured with longer stress periods at each stress/measure cycle, but this is entirely under user’s control. Fig. 3.8 shows the fatigue measurement signal profile of the sample under test.
Elements of the experiment that are under user control include: • Triangular waveform (most common choice). • Maximum stress voltage. • Stress waveform frequency. • PUND measurement voltage. • PUND measurement pulse width. • Number of stress/measure cycles. • Method of adjusting the stress period between cycles.
Fig. 3.8: Fatigue measurement signal profile [5].

64
References
[1] K.C. Kao, Dielectric Phenomena in Solids, Elsevier Academic Press, London, 1990. [2] E. Barsoukov, J. R. Macdonald, Impedance Spectroscopy: Theory, Experiment, and Applications (Wiley-Inter science, Hoboken, 2005). [3] Radiant Technologies, Inc. 2835D Pan American Freeway NE Albuquerque, NM 87107. [4] P. Palei, Structural and Electrical Properties of Conventional And Microwave Processed Lead-Free KNN Based Ceramics, Department of Physics and Astronomy, National Institute of Technology, Rourkela, 2012 [5] Precision Premier II standardized ferroelectric test system operation manual, Radiant Technologies Inc.

65
Chapter 4
Dielectric, Piezoelectric, and Ferroelectric Properties of NBT-xBT and NBT-xKNN Ceramics near MPB
4.1 Introduction (1-x)Na0.5Bi0.5TiO3-xBaTiO3/NBT-xBT and (1-x)(Na0.5Bi0.5TiO3)-xK0.5Na0.5NbO3
/NBT-xKNN (where x=0.05, 0.06, 0.07, 0.08) are the solid solutions of perovskite-structured NBT system with BT and KNN systems, respectively. In literature, it is reported that there exist an MPB in these systems within the above mentioned compositional ranges. For the NBT-xBT system, the MPB lies within the 0.06 ≤ x ≤ 0.08 ranges [1] and for the NBT-xKNN system, the MPB lies for x ≈ 0.07 [2]. Though, there are many reports on the NBT-xBT system and few reports on the NBT-xKNN system, yet the leakage current and polarization fatigue properties of these systems have not been studied in detail, which are detrimental for their use in many practical device applications. Therefore, in the present chapter along with structural, dielectric, piezoelectric and ferroelectric properties, the leakage current and the bipolar polarization fatigue behaviors of these systems are investigated and discussed in detail.
4.2 Thermal Analysis Figs. 4.1(a) and (b) shows the DSC and TGA curves of the ball milled dried
uncalcined powders of the NBT-xBT and NBT-xKNN systems with x=0.06 compositions, respectively. From the DSC and TGA curves, the solid-state reactions of both the NBT-BT and NBT-KNN powders show distinct mass losses, respectively. The initial mass loss ~ 100oC, is due to the evaporation of moisture and water content, present in both the powders. Decomposition of the carbonate groups of both the systems takes place in the 400-800°C temperature range. Among the carbonate groups, Na2CO3 is less stable, therefore it starts losing CO2 at lower temperature (~400 °C) [3]. Therefore, weight loss, observed just above 400°C, can be associated with the decomposition of Na2CO3. The overall weight loss from the room temperature (RT) to ~980°C is ~13.42% and from RT to ~ 770°C, it is ~12.75% for the NBT-BT and NBT-KNN powders,

66
respectively. For temperatures above 980°C and 770°C, there is no substantial weight loss, which suggest about the probable calcination temperatures of the NBT-BT and NBT-KNN powders, respectively.
0 200 400 600 800 1000-4
-3
-2
-1
0
1
2
3
4
Temp.(οC)
DS
C(m
W/m
g)
(a)
86
88
90
92
94
96
98
100
102
Wei
ght l
oss
%
0 200 400 600 800
-2.0
-1.5
-1.0
-0.5
0.0
0.5
1.0 (b)
DS
C(m
W/m
g)
Temp.(οC)
88
90
92
94
96
98
100
Wei
ght l
oss
%
Fig.4.1: DSC and TGA curves of ball milled powders of x=0.06 compositions of (a) NBT-xBT, and (b) NBT-xKNN systems.
4.3 XRD Study
The X-ray diffraction (XRD) studies of the calcined NBT-xBT and NBT-xKNN (x=0.05, 0.06, 0.07, 0.08) ceramic powders are given in the following subsections.
4.3.1 XRD Study of the NBT-xBT Ceramics
The XRD patterns of the calcined NBT-xBT ceramic samples near MPB
(0.05≤x≤0.08) are shown in Fig. 4.2. The XRD patterns reveal the single perovskite phase
formation without any trace of secondary phase peaks, which confirm the complete solid
solution formation of the BT system with the NBT system [4]. A close inspection of each
diffraction peak shows that there is no splitting or broadening in the 2θ between 40o and
46o range for all the compositions, which indicates that all these compositions have
pseudo-cubic distortions [5]. Similar type of behavior is also reported by Rajeev et al. in
the NBT-BT system [5]. The lattice parameters of rhombohedral NBT-xBT
(0.05≤x≤0.08) ceramic samples are refined in hexagonal setting by using the standard
computer program “POWD” [6]. The transformation expressions, used for rhombohedral

67
(rh) (pseudo-cubic) to hexagonal (hex) symmetry, are taken from the earlier report on the
NBT-BT system by Picht et al. [1]. The rhombohedral (pseudo-cubic) unit cell
parameters of the NBT-xBT (0.05≤x≤0.08) ceramic samples are given in Table 4.1.
20 30 40 50 60 70 80
3 1 02 2
01 2 2
1 0 2
0 0 2
1 1 1
1 1 0
0 0 1
(d)
(c)
(b)
(a)
2θ(o)
Inte
nsity
(A.U
.)
Fig. 4.2: XRD patterns of the calcined NBT-xBT ceramic samples with x = (a) 0.05, (b) 0.06, (c) 0.07, and (d) 0.08.
Table 4.1: Lattice parameters a, c (Å) and α (o) of NBT-xBT (x=0.05, 0.06, 0.07, 0.08)
ceramics.
BT content ahex chex arh αrh
x = 0.05 5.5062(4) 13.4615(2) 3.8909(2) 90.07(3)
x = 0.06 5.5105(8) 13.4724(6) 3.8940(1) 90.07(5)
x = 0.07 5.5019(3) 13.4173(5) 3.8847(4) 90.17(2)
x = 0.08 5.5143(6) 13.4724(9) 3.8823(4) 90.09(6)

68
As the XRD peaks showed pseudo-cubic distortions, it was difficult to observe the
peak splitting remarkably. However, as shown in Fig. 4.3, the peak positions and
intensities were analyzed with the software package “Peakfit” using a symmetric Gauss–
Lorentz profile function. Deconvolution of XRD patterns of NBT-xBT (x=0.07) at 2θ ~
46° is observed, which is indexed as (200)R, (200)T and (002)T after deconvolution of the
peak at the same position, corresponding to rhombohedral and tetragonal structures,
respectively. Therefore, presence of double structures confirms the MPB nature of NBT-
BT system. The tetragonal volume fraction was calculated using the formula:
)1.4(%100(%))200()200()002(
)200()002( ×++
+=
rhtrtr
trtrtr III
IIV
Where, Irh(2 0 0) is the integral intensity of rhombohedral (2 0 0) reflection; Itr(0 0 2) and Itr(2 0
0) are the integral intensities of tetragonal (0 0 2) and (2 0 0) reflections, respectively. The rhombohedral volume fraction can be calculated as Vrh =1−Vtr [1]. Using the above relations, volume fraction ratio of the rhombohedral and tetragonal phases of the MPB composition of NBT-xBT (x=0.07) was calculated to be 40:60.
46.00 46.25 46.50 46.75 47.002θ(°)
Inte
nsity
(a.u
.)
Observed Calculated Fit (002)tr
Fit (200)rh
Fit (200)tr
Fig. 4.3: XRD peak splitting at 2θ ~ 46° for NBT-xBT with x=0.07.

69
4.3.2 XRD Study of the NBT-xKNN Ceramics
Fig. 4.4 shows the XRD patterns of the calcined NBT-xKNN powder
samples. Formation of single perovskite phase without any trace of secondary phase was
confirmed in all the compositions of the NBT-xKNN systems. For knowing the crystal
structure, the standard deviations (S.D. = dobs- dcal) was taken into account, which must be
minimum (where, d is interplanar spacing). The best agreement between the observed
(obs) and the calculated (cal) ‘d’ values, and the Bragg angles are found for the
rhombohedral and the tetragonal structures in the x = 0.07 composition of the NBT-
xKNN system. The presence of double structures confirms the MPB nature of this
composition. Whereas, the rhombohedral structure is observed for both x=0.05 and 0.06
compositions and a single tetragonal structure is observed for the x=0.08 composition.
The rhombohedral crystal structure of the NBT-xKNN ceramics are indexed in hexagonal
setting by using the standard computer program “POWD” and the lattice parameters and
the crystal structures are given in Table 4.2 [6]. The simulated XRD patterns of the NBT-
xKNN ceramics exhibiting rhombohedral and tetragonal symmetry are also given as
standard pattern in Fig. 4.5 [7].
20 30 40 50 60 70 80
3 1 0
2 2 01 2
2
1 0 20 0
2
1 1 1
1 1 0
0 0 1
2θ(o)
(d)
(c)
(b)Inten
sity(A
.U.)
(a)
Fig. 4.4: XRD patterns of calcined NBT-xKNN ceramic samples with x = (a) 0.05, (b) 0.06, (c) 0.07, and (d) 0.08.

70
20 25 30 35 40 45 50 55 60 65 70 75 80
(220)
(208)(21
4)(01
8)
(122)
(118)(02
4)
(202)
(008)
(110)
(104)
(012)
2θ(°)
Rhombohedral
20 25 30 35 40 45 50 55 60 65 70 75 80
(220)
(202)
(211)
(112)
(210)
(201)(20
0)(00
2)
(111)
(110)
(001)
Inten
sity (
a.u.)
Tetragonal
Fig. 4.5: The standard patterns of the rhombohedral and the tetragonal symmetries of NBT-xKNN samples [7].
Table 4.2: Lattice parameters of NBT-xKNN (x=0.05, 0.06, 0.07, 0.08) ceramics.
KNN content Lattice parameters Crystal Structure
a(Å) c(Å)
x=0.05 5.5042(4) 13.5511(2) Rhombohedral
x=0.06 5.5058(2) 13.5303(1) Rhombohedral
x=0.07
5.5072(2) 13.5271(9) Rhombohedral
3.8952(1) 3.9125(7) Tetragonal
x=0.08 3.8987(2) 3.9037(5) Tetragonal

71
To evaluate the tetragonal or rhombohedral phase contents for MPB composition
of NBT-xKNN (x=0.05, 0.06, 0.07, 0.08) systems, the tetragonal (0 0 2) and (2 0 0)
reflections (44.5–47.5o 2θ) were measured with a slow scan rate as shown in the Fig. 4.6
[1]. Using the relations (4.1), volume fraction ratio of the rhombohedral and tetragonal
phases of the MPB composition NBT-xKNN (x=0.07) was calculated to be 32:68.
45.4 45.6 45.8 46.0 46.2 46.4 46.6 46.8 47.0 47.2 47.4 47.6
Observed Calculated Fit (002)tr
Fit (200)rh
Fit (200)tr
In
tens
ity (a
.u.)
2θ°
Fig. 4.6: XRD peak splitting at 2θ ~ 46° for NBT-xKNN with x=0.07.
4.4 Density and Morphological Study
4.4.1 Density and Morphological Study of the NBT-xBT Ceramics
Fig. 4.7 shows the SEM micrographs of all the sintered NBT–xBT (x =0.05, 0.06,
0.07, 0.08) ceramics. From the micrographs, densely packed and non-uniform distribution
of the rectangular shaped grains of all the NBT–xBT ceramics can be observed. The
slight inhibition of grain growth with the increase of BT addition into the NBT system is
noticed with the initial increase of BT content. This may be related to the segregation of
Ba2+ ions near the crystal boundaries, which might have affected the migration of other

72
ions and contributed against the growth of grains [8]. But, no remarkable change in grain
size is observed with the variation of the BT content in the NBT–xBT system. Linear
intercept method was used to find out the average grain size of all the NBT–xBT
ceramics using “ImageJ” software. The average grain size of the MPB compositions of
NBT–xBT system are given in Table 4.3.
Fig. 4.7: SEM micrographs of NBT-xBT ceramics with x = (a) 0.05, (b) 0.06, (c) 0.07, and (d) 0.08.
Experimental density (ρex) of all the NBT-xBT ceramic samples was calculated by
using the Archimedes’ principle and its values are listed in Table 4.2. Highest ρex, which
is ~ 98.30% of the theoretical density (ρth), was obtained for the x=0.07 ceramic samples.

73
Table 4.3: Average grain size, and experimental density of NBT-xBT (x=0.05,
0.06, 0.07, 0.08) ceramics.
BT content Average grain size (μm) Experimental density(g/cc)
x = 0.05 2.53 5.88
x = 0.06 2.48 5.86
x = 0.07 2.50 5.89
x = 0.08 2.45 5.80
4.4.2 Density and Morphological Study of NBT-xKNN Ceramics
The SEM micrographs of the sintered NBT-xKNN (x=0.05, 0.06, 0.07, 0.08)
ceramic samples are shown in Fig. 4.8. Closely packed, rectangular shaped and non-
uniform arrangement of grains can be seen from the SEM micrographs. Since, non-
uniform microstructure is a characteristic of KNN system [9], the non-uniformity of the
NBT-xKNN grains can be attributed to the substitution of KNN in the NBT system. The
average grain size was also calculated by linear intercept method using ‘ImageJ’ software
and given in Table 4.4. The average grain size increases with the initial increase of KNN
substitution in the NBT system and starts decreasing for the x=0.08 composition. This
suggests that the excess substitution of KNN in the NBT-xKNN system acts as grain
growth inhibitor [10]. The experimental density (ρex) of the sintered NBT-xKNN ceramic
samples is given in Table 4.4. The initial increase of grain size and ρex with the increase
of KNN content in NBT-xKNN system may be due to the formation of liquid phase
across the grain boundaries[11], which led to rearrangement of particles and providing
more effective packing. Maximum grain size and ρex were observed for the x= 0.07
composition. The maximum grain size and ρex for the x=0.07 composition could be able
to influence the enhancement of the electrical properties of this particular composition.

74
Fig. 4.8: SEM micrographs of NBT-xKNN ceramics with x = (a) 0.05, (b) 0.06, (c) 0.07,
and (d) 0.08.
Table 4.4: Average grain size, and experimental density of NBT-xKNN (x=0.05, 0.06,
0.07, 0.08) ceramics.
KNN content Average grain size (μm) Experimental density(g/cc)
x = 0.05 2.54 5.67
x = 0.06 3.27 5.69
x = 0.07 4.34 5.77
x = 0.08 2.10 5.66

75
4.5 Dielectric Analysis
4.5.1 Temperature Dependent Dielectric Properties of NBT-xBT Ceramics
Fig. 4.9 (a-d) shows the temperature dependence of dielectric constant (εr) and
dielectric loss (tanδ) at different frequencies of the NBT-xBT (x=0.05, 0.06, 0.07, 0.08)
ceramic samples. Two major peaks are observed in all the NBT-xBT ceramic samples.
The first peak in the 95-105°C temperature range corresponds to the depolarization
temperature (Td), where the ferroelectric (FE) phase undergoes to antiferroelectric (AFE)
phase transition. The second peak ~ Tm (where εr reaches the maximum) corresponds to
the transition from antiferroelectric to paraelectric state. εr exhibits strong frequency
dispersion below Td whereas above Td this dispersive nature is diminished. This indicates
that there must be some dielectric relaxing mechanism present near the vicinity of RT
[12]. Earlier, it is reported that in the pure Na0.5Bi0.5TiO3 system, the phase region
exhibiting P4bm symmetry with nano-domains embedded in the R3c matrix contributes
towards the relaxor type nature [13]. Near Tm, at different frequencies no such
appreciable dielectric peak shift is observed. But, these dielectric peaks near Tm are
relatively broad, suggesting the diffuse phase transition nature. This diffuse phase
transition can be attributed to the random distribution of the Na+, Bi3+, and Ba2+ ions at
the A-site in the NBT-xBT system [14]. These behaviors also suggest that all the NBT-
xBT ceramic systems exhibit relaxor nature. The dielectric properties of the NBT-xBT
(x=0.05, 0.06, 0.07, 0.08) ceramics at 1 kHz frequency are given in Table 4.5. It can be
observed that, among all the MPB compositions of the NBT-xBT system, x=0.07 shows
the highest value of εr at RT as well as at Tm, which hint towards its MPB nature.
Moreover, x=0.07 composition exhibited lower Td, which implies a reduction of the
stability of ferroelectric domains at RT, since in the x=0.07 composition, there co-exists
double structures (rhombohedral and tetragonal). This results in the decrease of the
thermal stability of the long-range ferroelectric domains at RT in the double structure
MPB composition [15, 16].

76
50 100 150 200 250 300
500
1000
1500
2000
2500
3000
3500
4000
4500
5000
1kHz 10kHz 100kHz 1MHz
tanδ
Temperature(°C)
ε r
0.0
0.1
0.2
0.3
0.4
0.5
0.6
0.7
0.8(a)
50 100 150 200 250 300500
1000
1500
2000
2500
3000
3500
4000
4500
ε r
0.0
0.5
1.0
1.5
1kHz 10kHz 100kHz 1MHz
tanδ
Temperature(°C)
(b)
50 100 150 200 250 300
500
1000
1500
2000
2500
3000
3500
4000
4500
Temperature(°C)
ε r
0.0
0.5
1.0
1.5
1kHz 10kHz 100kHz 1MHz
tanδ
(d)
Fig. 4.9: Variation of εr and tanδ with temperature at different frequencies of the NBT-xBT ceramics with x = (a) 0.05, (b) 0.06, (c) 0.07, and (d) 0.08.
Table 4.5: Dielectric properties (at 1 kHz frequency) of NBT-xBT (x=0.05, 0.06, 0.07,
0.08) ceramics.
BT content εr at RT tanδ at RT Td ( °C) Tm ( °C) εr at Tm
x = 0.05 2023 0.09 102 226 4712
x = 0.06 1946 0.05 101 219 4588
x = 0.07 2275 0.04 99 219 5067
x = 0.08 1898 0.08 100 215 4263

77
4.5.2 Temperature Dependent Dielectric Properties of NBT-xKNN Ceramics
Fig. 4.10 (a-d) shows the temperature dependence of εr and tanδ at different
frequencies of the NBT-xKNN (x=0.05, 0.06, 0.07, 0.08) ceramic samples. Two major
dielectric anomalies are observed in all the samples, one below 150 °C and the other one
~ 250 °C. Similar type of dielectric patterns are also observed in the NBT-BT system, as
studied by Jo et al. [17], where the commonly observed two dielectric anomalies are
attributed to the thermal evolution of ferroelectric polar nanoregions (PNRs) of R3c
(Rhombohedral) and P4bm (tetragonal) symmetries, which coexist throughout the
temperature range, and reversibly transform into each other with the variation of
temperature [17]. It is reported that around the MPB of the NBT-xKNN system, both the
rhombohedral and tetragonal phases coexist simultaneously [2]. Broad dielectric peaks
with slight frequency dependence of εr and tanδ at Td and Tm indicates the relaxor nature
of all the NBT-xKNN ceramic samples [18]. The relaxor-like nature in this type of
system is attributed to the coexistence of PNRs of different symmetries. Further, it is
reported that an unpoled NBT sample exhibit relaxor nature at RT [19]. As the samples
are unpoled, the first dielectric dispersion, observed below Td in the NBT-xKNN systems,
suggest towards the relaxor contribution [18]. Whereas, the second dielectric anomaly
can be attributed to the thermal evolution of the PNRs with the transformation of R3c to
P4bm phase [17]. In addition, the increase of dielectric peak broadening with the increase
of KNN content suggest the increase of disordered cation distribution at both the A- and
B-sites in the NBT-xKNN system. The εr, Td, Tc, and tanδ values at RT and at 1 kHz
frequency of the MPB compositions of the NBT-xKNN system are given in Table 4.6. It
is observed that Tc decreases while the maximum εr does not change significantly, with
the increase of KNN content in the NBT-xKNN system up to x=0.07 composition. The
highest εr value at RT and at Tc in the x=0.07 composition can be related to the presence
of double structure and suggest its actual MPB nature. Since, the presence of double
structure is the characteristic of an MPB composition, and it also increases the
polarization, which ultimately improve the dielectric properties.

78
50 100 150 200 250 300 350
1000
1250
1500
1750
2000
2250
2500
2750
3000
3250
3500
3750
4000
4250
4500
Temperature(°C)
(a) 1kHz 10kHz 100kHz 1MHz
ε r
0.04
0.08
0.12
0.16
0.20
tanδ
50 100 150 200 250 300 350
1000
1250
1500
1750
2000
2250
2500
2750
3000
3250
3500
3750
4000
4250
4500
Temperature(°C)
1kHz 10kHz 100kHz 1MHz
ε r
0.1
0.2
0.3
0.4
(b)tan
δ
50 100 150 200 250 300 3501600
1800
2000
2200
2400
2600
2800
3000
3200
3400
Temperature(°C)
ε r
(d)
0.00
0.04
0.08
0.12
0.16
0.20
0.24
0.28
0.32
0.36
0.40
0.44
0.48
1kHz 10kHz 100kHz 1MHz
tanδ
Fig.4.10: Variation of εr and tanδ with temperature at different frequencies of NBT-xKNN ceramics with x = (a) 0.05, (b) 0.06, (c) 0.07, and (d) 0.08.
Table 4.6: Dielectric properties of NBT-xKNN (x=0.05, 0.06, 0.07, 0.08) ceramics at 1 kHz frequency.
KNN content εr at RT tanδ at RT Td ( °C) Tm ( °C) εr at Tm
x = 0.05 1750 0.06 136 268 4324
x = 0.06 2380 0.05 122 261 4389
x = 0.07 2787 0.05 121 259 4438
x = 0.08 2088 0.04 130 243 3328

79
4.6 Leakage Current Study
4.6.1 Leakage Current Properties of the NBT-xBT Ceramics Fig. 4.11 shows the RT leakage current density vs. electric field (J-E) plots of the
NBT-xBT ceramic samples up to ~ 40kV/cm. A slight asymmetry in the J-E plots suggest towards the electrode dependent nature of the NBT-xBT ceramic samples [20]. The leakage current characteristics at lower electric fields suggest that the conduction mechanism in all the NBT-xBT ceramic samples can be attributed to be of Ohmic type, whereas at higher fields, the conduction mechanism can be associated with the space charge limited conduction [21-23]. The RT leakage current density values of all the NBT-xBT ceramic samples at ~ 40kV/cm are given in Table 4.7. Among all the NBT-xBT ceramic samples, x=0.07 composition shows the lowest leakage current density (~5.72x10⁻⁷ A/cm2), which hints towards its better suitability in ferroelectric device applications compared to the other studied compositions. The current density are observed to be between 10-7 - 10-6 A/cm2 for all the NBT-xBT ceramic samples. A remarkable hump at electric field >30kV/cm in the J-E plot can be related with the ferroelectric switching behavior, i.e. coercive field of the studied ceramic samples [24].
-40 -20 0 20 40
10-10
10-9
10-8
10-7
10-6
10-5
10-4
Curre
nt D
ensi
ty(A
/cm
2 )
Electric Field(kV/cm)
0.05 BT 0.06 BT 0.07 BT 0.08 BT
Fig. 4.11: Room temperature leakage current density vs. electric field plots of the NBT-xBT (0.05≤x≤0.08) ceramic samples.
Table 4.7: Leakage properties of NBT-xBT (x=0.05, 0.06, 0.07, 0.08) ceramics at the electric field of 40kV/cm.
BT content x =0.05 x =0.06 x =0.07 x =0.08
Current density(A/cm2) 3.14x10⁻⁶ 1.03x10⁻⁶ 5.72x10⁻⁷ 3.23x10⁻⁶

80
4.6.2 Leakage Current Properties of the NBT-xKNN Ceramics
Fig. 4.12 shows the leakage current vs. applied electric field behavior of the NBT-
xKNN ceramic samples. The insulating characteristics of a dielectric ceramic can be
determined by the value of its leakage current. The leakage current density of all the
NBT-xKNN ceramic samples gradually increases with the increase of applied electric
field up to ~10kV/cm. The conduction mechanism at lower fields may be attributed to the
Ohmic type conduction. With the further increase of the electric field, the conduction
mechanism can be related to the space charge limited conduction [21-23]. Here also,
among all the NBT-xKNN ceramic samples, x=0.07 composition shows the lowest
leakage current density of ~1.04x10⁻⁶ A/cm2 at ~ 40kV/cm. In this case, the observed
least leakage current density can be attributed to the maximum grain size of the x=0.07
composition samples. Since, larger grains contribute towards interfacial areas between the
grains is small and these interfaces provide a leakage path for charge carriers, therefore
larger the grain size, least is the leakage current [25]. However, unlike NBT-BT samples,
absence of any hump in J-E characteristics suggests some kind of role of non-attainment
of polarization saturation within the applied electric field range in NBT-xKNN samples.
The values of leakage current density of all the NBT-xKNN ceramic samples at 40kV/cm
electric field are given in Table 4.8.
-40 -20 0 20 4010-10
10-9
10-8
10-7
10-6
10-5
0.05KNN 0.06KNN 0.07KNN 0.08KNN
Electric Field(kV/cm)
Curre
nt D
ensi
ty(A
/cm
2 )
Fig. 4.12: Room temperature leakage current density vs. electric field plots of NBT-
xKNN (0.05≤x≤0.08) ceramics.

81
Table 4.8: Leakage properties of NBT-xKNN (x=0.05, 0.06, 0.07, 0.08) ceramics at the electric field of 40kV/cm.
KNN content x =0.05 x =0.06 x =0.07 x =0.08
Current density(A/cm2) 3.37x10⁻⁶ 1.46x10⁻⁶ 1.04x10⁻⁶ 1.89x10⁻⁶
4.7 Piezoelectric Study
4.7.1 Piezoelectric Studies of NBT-xBT Ceramics
4.7.1.1 Strain vs. Electric Field Study
Fig. 4.13 (a-d) shows the RT-induced strain% vs. external electric field (S-E)
curves of all the NBT-xBT(x=0.05, 0.06, 0.07, 0.08) compositions. From the S-E plots, it
is observed that in all the NBT-xBT ceramic samples, initially the strain% increases with
the increase in applied external electric field, which is due to the alignment of the
domains along the field direction. At higher electric fields, the alignments of domains get
saturated, which results in the maximum induced strain%. A slight asymmetry is
observed in the (S-E) plots of the NBT-xBT system near MPB, which may be due to the
internal field induced by the presence of certain defects [26]. In the present case, a
maximum strain of ~0.45% is obtained in the x=0.07 composition samples, which
suggests the dominance of the movement and switching of the non-180° domain walls
[27]. This also indicates that small displacements of all types of domain walls can affect
the polarization of the material. It is a known fact, that in addition to the pure
piezoelectric response of the material within each domain, the movement and switching
of non-180° walls will involve a significant change in the dimensions of the sample.
Furthermore, the development of typical butterfly-shaped loops and the existence of
remnant strain in the NBT-xBT ceramics indicate their piezoelectric nature [28]. The
maximum induced strain% of the studied MPB compositions of the NBT-xBT system are
given in Table 4.9.

82
-80 -60 -40 -20 0 20 40 60 80
0.00
0.05
0.10
0.15
0.20
0.25
0.30 (a)St
rain
%
-80 -60 -40 -20 0 20 40 60 80
0.0
0.1
0.2
0.3
0.4 (b)
Electric Field(kV/cm)-80 -60 -40 -20 0 20 40 60 80
0.0
0.1
0.2
0.3
0.4
0.5
(c)
-80 -60 -40 -20 0 20 40 60 80
0.00
0.05
0.10
0.15
0.20
(d)
Fig. 4.13: Variation of induced strain% vs. bipolar electric field of the NBT-xBT
ceramics with x = (a) 0.05, (b) 0.06, (c) 0.07, and (d) 0.08.
4.7.1.2 Piezoelectric Coefficients (d33 and kp) Study
Fig. 4.14 shows the RT variation of the piezoelectric coefficient (d33) and the
electromechanical coupling coefficient (kp) with the variation of BT content in the NBT-
xBT system. Electromechanical coupling coefficient, kp, is calculated by using relation
4.2 [29]. The resonance (fr) and anti-resonance (fa) frequencies, used in the eq. 4.2 are
obtained from frequency vs. impedance (Z) plots. The frequency vs. impedance (Z), and
phase angle plots of the x=0.07 composition is shown in Fig. 4.15.
)2.4()(51.221
−×=
r
rap f
ffk

83
The values of d33 and kp coefficients are given in Table 4.9. The highest value of
d33 and kp coefficients are obtained in the x=0.07 composition samples. The highest value
of the d33 coefficient in the x=0.07 composition again suggest its actual MPB nature.
Since, there exists a large number of poling directions in a MPB composition, which
result in the better piezoelectric and electromechanical properties.
The values of kp and d33 is not in linear variation (as shown in fig 4.14), i.e. the
values are higher for x=0.05 rather than for x=0.06 composition. Linear trend is not
followed as the observed results suggest that 0.05 composition is also within the MPB
region. Since within the MPB region, electrical properties varies as per the % of different
constituent phases present in the selected compositional range. This also suggests the
need of further study of effect of different constituent phases on electrical properties of
these MPBs compositions.
0.05 0.06 0.07 0.0840
50
60
70
80
90
100
110
120
130
140
150
BT content
kp
d 33 (p
C/N
)
0.14
0.15
0.16
0.17
0.18
0.19
0.20
0.21
0.22 d33 kp
Fig. 4.14: Variation of piezoelectric (d33) and electromechanical coupling (kp) coefficients
with BT content in the NBT-xBT system.

84
3.0x10⁵ 3.5x10⁵ 4.0x10⁵ 4.5x10⁵ 5.0x10⁵
0
2000
4000
6000
8000
10000 Z Phase
Freq. (Hz)
Impe
danc
e Z
(Ω)
-100
-80
-60
-40
-20
0
20
40
60
fa
fr
Phase θ (degree)
Fig. 4.15: Impedance (Z) and phase angle (θ) variations with frequency of the x=0.07 poled samples of the NBT-xBT system. Table 4.9: Piezoelectric parameters of NBT-xBT (x=0.05, 0.06, 0.07, 0.08) ceramics.
BT content kp d33 (pC/N) Strain%
x = 0.05 0.19 95 0.27
x = 0.06 0.16 76 0.38
x = 0.07 0.21 105 0.45
x = 0.08 0.14 59 0.18

85
4.7.2 Piezoelectric Study of the NBT-xKNN Ceramics
4.7.2.1 Strain vs. Electric Field Study
Fig. 4.16 shows RT the S-E plots of the NBT-xKNN (x=0.05, 0.06, 0.07, 0.08) ceramic samples. Though, the remnant strain value of all the NBT-xKNN ceramic samples is observed to be smaller, compared to the NBT-xBT systems, but the development of typical butterfly-shaped S-E loops confirm their piezoelectric nature. This S-E plots also shows the characteristic of a ferroelectric ceramic sample [30]. The maximum induced strain% of all the NBT-xKNN ceramic samples is given in Table 4.10. Development of maximum strain% ~ 0.36 is observed in the x=0.07 composition samples. This suggests that, at x=0.07 composition, the movement and switching of the non-180° domain walls is dominant [27]. The maximum strain% in the x=0.07 composition further suggest the actual MPB nature of this composition [31].
-80 -60 -40 -20 0 20 40 60 80
0.00
0.05
0.10
0.15
0.20
0.25
0.30
0.35 (a)
Stra
in%
Electric Field(kV/cm)
-80 -60 -40 -20 0 20 40 60 80
0.00
0.05
0.10
0.15
0.20
0.25
0.30 (b)
-80 -60 -40 -20 0 20 40 60 80-0.05
0.00
0.05
0.10
0.15
0.20
0.25
0.30
0.35
0.40
(c)
-80 -60 -40 -20 0 20 40 60 80
0.00
0.05
0.10
0.15
0.20
0.25 (d)
Fig. 4.16: Variation of induced strain% vs. bipolar electric field of the NBT-xKNN
ceramics with x = (a) 0.05, (b) 0.06, (c) 0.07, and (d) 0.08.

86
4.7.2.2 Piezoelectric Coefficients (d33 and kp) Study
Fig. 4.17 shows the RT variation of the piezoelectric coefficient (d33), and the electromechanical coupling coefficient (kp) with the variation of KNN content in the NBT-xKNN system. The electromechanical coupling coefficient (kp) was calculated by using eq. 4.1 [29]. Similar to NBT-xBT systems, the fr and fa frequencies, used in the eq. 4.2, are obtained from frequency vs. impedance (Z) plots. The frequency vs. impedance (Z), and phase angle plots of the x=0.07 composition is shown in Fig. 4.18. d33 and kp values are summarized in Table 4.10. Highest value of d33 and kp are observed in x=0.07 composition samples, which suggest its actual MPB nature. This is because the MPB composition of a ferroelectric system has relatively high piezoelectric and electromechanical activities, which is attributed to an increase in the number of possible spontaneous polarization directions due to the coexistence of mixed structures [31]. Since, the presence of double structure in the x=0.07 composition samples can increase the number of polarization directions, which can ultimately increase the piezoelectric properties.
0.05 0.06 0.07 0.0850
55
60
65
70
75
80
85
d33 kp
KNN content
d 33 (p
C/N)
0.05
0.06
0.07
0.08
0.09
0.10
0.11
0.12
kp
Fig. 4.17: Variation of piezoelectric (d33) and electromechanical (kp) coupling
coefficients with the variation of KNN content in the NBT-xKNN system.

87
3.0x10⁵ 3.5x10⁵ 4.0x10⁵ 4.5x10⁵ 5.0x10⁵
800
900
1000
1100
1200
1300
1400 Z Phase
Impe
danc
e Z
(Ω) Phase θ (degree)
Freq. (Hz)
fa
fr
-88
-86
-84
-82
-80
-78
-76
Fig. 4.18: Impedance (Z) and phase angle (θ) variations with frequency of the poled x=0.07 samples of NBT-xKNN system. Table 4.10: Piezoelectric parameters of NBT-xKNN (x=0.05, 0.06, 0.07, 0.08) ceramics.
KNN content kp d33 (pC/N) Strain%
x = 0.05 0.07 58 0.30
x = 0.06 0.10 65 0.28
x = 0.07 0.12 78 0.36
x = 0.08 0.09 62 0.23
4.8 Ferroelectric Study
4.8.1 Ferroelectric Study of NBT-xBT Ceramics
Fig. 4.19 shows the RT polarization vs. electric field (P-E) hysteresis loops of the NBT-xBT (x=0.05, 0.06, 0.07, 0.08) ceramic samples. Remnant polarization (Pr) and

88
coercive field (Ec) values of all the NBT-xBT ceramic samples are given in Table 4.11. The development of well saturated P-E hysteresis loops confirms the ferroelectric nature of all the NBT-xBT ceramic samples. However, maximum value of Pr ~ 31.71 µC/cm2 with Ec ~ 40 kV/cm were obtained in the x=0.07 ceramic samples, which suggest the actual MPB nature of this composition. The low value of Ec in the x=0.07 ceramic samples compared to x= 0.05 and 0.06 compositions supports the observed enhanced piezoelectric properties of this composition. Since, with lower Ec value, the domain movement can take place easily, which results in better piezoelectric properties. With the further increase of BT content i.e. for x= 0.08 in the NBT-xBT system, a considerably low Pr value is observed, which can be attributed to the introduction of greater lattice distortion into the NBT system [32].
-80 -60 -40 -20 0 20 40 60 80
-40
-30
-20
-10
0
10
20
30
40
Pol
ariz
atio
n(µC
/cm
2 )
0.08 BT 0.07 BT 0.06 BT 0.05 BT
Electric Field(kV/cm)
Fig. 4.19: P-E hysteresis loops of NBT-xBT (x=0.05, 0.06, 0.07, 0.08) ceramics.
Table 4.11: Ferroelectric parameters of NBT-xBT (x=0.05, 0.06, 0.07, 0.08) ceramics.
BT content x = 0.05 x = 0.06 x = 0.07 x = 0.08
Pr (µC/cm2) 28.73 23.50 31.71 15.66
Ec(kV/cm) 45.33 42.62 40.00 34.65

89
4.8.2 Ferroelectric Study of NBT-xKNN Ceramics
Fig. 4.20 shows the polarization vs. electric field (P-E) hysteresis loops of the NBT- xKNN ceramic samples. Well saturated (P-E) hysteresis loops of all the NBT- xKNN ceramic samples are developed. The fine saturation, which relate with the insulating property of a sample, might have been prevented by the increase of leakage current at higher applied external electric field [33]. Maximum remnant polarization (Pr) ~ 20.61 µC/cm2 and small coercive field (Ec) ~ 19.90 kV/cm were obtained for the x = 0.07 composition. The maximum Pr value of the x=0.07 composition can be associated with the increase in domain wall motion. The highest grain size in this composition can be related with the easy switching of the domains and hence maximum Pr among the studied NBT-xKNN ceramic samples [34, 35]. Further, the highest value of Pr in this composition suggests the its actual MPB nature [36]. As, the existence of mixed structures in the x=0.07 composition increases the number of polarizations directions (14, 6 for tetragonal structure and 8 for rhombohedral structure) and hence highest value of Pr among the studied NBT-xKNN ceramic samples [37]. The Pr and Ec values of all the NBT-xKNN ceramic samples are given in Table 4.12.
-80 -60 -40 -20 0 20 40 60 80-60
-50
-40
-30
-20
-10
0
10
20
30
40
50
60
Electric Field(kV/cm)
Pol
ariz
atio
n(µC
/cm
2 )
0.05KNN 0.06KNN 0.07KNN 0.08KNN
Fig. 4.20: P-E hysteresis loops of NBT-xKNN(x=0.05, 0.06, 0.07, 0.08) ceramics.

90
Table 4.12: Ferroelectric parameters of NBT-xKNN (x=0.05, 0.06, 0.07, 0.08) ceramics.
KNN content x = 0.05 x = 0.06 x = 0.07 x = 0.08
Pr (µC/cm2) 12.93 16.26 20.61 7.95
Ec(kV/cm) 24.19 25.64 19.90 19.00
4.9 Polarization Fatigue Study
4.9.1 Polarization Fatigue Study of NBT-xBT Ceramics
Fig. 4.21 shows the normalized polarization vs. number of cycles (up to 109) of the applied external electric field, measured at 105Hz frequency of the NBT-xBT ceramic samples. Polarization fatigue in ferroelectric materials is the systematic suppression of the spontaneous polarization under bipolar or unipolar electrical cycling [38, 39]. In the present study, the bipolar fatigue study is undertaken because in many ferroelectric random access memory (FeRAM) and non-volatile memory devices, each cell is controlled by bipolar pulses [40]. Here, P* and -P* (µC/cm2) denotes the switched polarization value in positive and negative applied electric field cycles. In this case, the switched polarizations were observed at the cycle numbers of 1, 300000, 1.5x10⁶, 1.17x10⁷, 1.11 x10⁸, and 1.23x10⁹, respectively. All the NBT-xBT ceramics follow the same trends of normalized polarization vs. no. of cycles of the applied external electric field and there is a substantial decrease in the polarization value after 107 cycles of all the ceramics, which indicates the degradation of their ferroelectric properties. The relative polarization fatigue% (after 109 cycles) of all the NBT-xBT ceramic samples is given in Table 4.13. Generally, in a ferroelectric material, different factors are responsible for such type of polarization degradation. Pinning of the domain walls by the defects with charges (such as oxygen vacancies, electronic or ionic charges etc.), segregated in the wall region [41-43], may be considered as the mechanism responsible for the fatigue behavior in the NBT-xBT ceramics. In the present study, the pinning of the domain walls can be associated mainly with the oxygen vacancies, because the oxygen vacancy formation is most common in the perovskite ceramics during sintering at high temperatures [44].

91
10-1 100 101 102 103 104 105 106 107 108 109 1010
-1.0
-0.8
-0.6
-0.40.4
0.6
0.8
1.0
0.05 BT 0.06 BT 0.07 BT 0.08 BT
Norm
alize
d Po
lariz
atio
n
Switching Cycles(N)
P*
-P*
Fig. 4.21: Normalized polarization vs. number of cycles plots of NBT-xBT (x=0.05, 0.06, 0.07, 0.08) ceramics. Table 4.13: Relative polarization fatigue % (after 109 cycle) of NBT-xBT (x=0.05, 0.06, 0.07, 0.08) ceramics.
BT content x = 0.05 x = 0.06 x = 0.07 x = 0.08
Relative polarization fatigue% (109 cycle)
25.66
22.37
22.54
47.48
Fig. 4.22 (a-d) shows the P-E hysteresis loops before and after 107 cycles of the
applied external electric field to confirm the fatigue behavior of all the NBT-xBT ceramics. Decrease of remnant polarization confirmed the fatigue behavior in these ceramics. The NBT-xBT ceramics corresponding to x=0.08, show the greatest degree of polarization degradation. Generally, the fatigue mechanism and polarization in ferroelectric materials are related to the defect agglomeration and deformation of grains [45, 46]. Therefore, relatively non-uniform and agglomerated grains in the x=0.08 NBT-xBT ceramics can account the greatest degree of polarization degradation among the

92
studied MPB compositions of NBT-xBT system. Except the NBT-xBT ceramics, corresponding to x=0.05, all the ceramics show an increase in the coercive field after loading cycles. The geometrically less constrained grains in the NBT-xBT ceramics corresponding to x=0.05 can explain the retention of same coercive field after loading cycles [46].
-60 -40 -20 0 20 40 60-40
-30
-20
-10
0
10
20
30
40
A
(a) 1
2
-60 -40 -20 0 20 40 60-30
-20
-10
0
10
20
30
Pola
rizat
ion(
µC/c
m2 )
Electric Field(kV/cm)
(b)2
1
-60 -40 -20 0 20 40 60
-40
-30
-20
-10
0
10
20
30
40 (c) 1
2
-60 -40 -20 0 20 40 60
-20
-10
0
10
20 (d) 1
2
Fig 4.22: P-E hysteresis loops before (1) and after (2) 107 cycles of the NBT-xBT (x=0.05, 0.06, 0.07, 0.08) ceramics. 4.9.2 Polarization Fatigue Study of NBT-xKNN Ceramics
Room temperature normalized polarization vs. number of cycle’s plots at 105Hz bipolar triangular pulses of the NBT-xKNN ceramic samples are shown in Fig. 4.23. There are various factors such as the formation of space charges, and point defects, which are responsible for such type of polarization loss. Space charge polarization is a common factor observed over most of the perovskite ceramics [47]. It is reported that formation of the domain is a fast process resulting in a domain pattern with extended space charge region near domain walls and is related with semiconductor properties. Within these space charge regions, a significant depolarization field is still present which could drive the much slower ionic charge carriers like oxygen vacancies thus providing fatigue

93
according to the space charge mechanism [21]. Correlating with the fatigue mechanisms, it is observed that all the NBT-xKNN ceramic samples start showing the degradation of the polarization after 1.5x 10⁶ switching cycles. The relative polarization fatigue % (after 109 cycles) of all the NBT-xKNN ceramic samples is given in Table 4.14.
10-1 100 101 102 103 104 105 106 107 108 109 1010
-1.0
-0.8
-0.6
-0.40.4
0.6
0.8
1.0
0.05KNN 0.06KNN 0.07KNN 0.08KNN
-P*
P*
Switching Cycles(N)
Norm
alize
d Po
lariz
atio
n
Fig. 4.23: Normalized polarization vs. number of cycles plots of NBT-xKNN (x=0.05, 0.06, 0.07, 0.08) ceramics. Table 4.14: Relative polarization fatigue % (after 109 cycle) of NBT-xKNN (x=0.05, 0.06, 0.07, 0.08) ceramics.
KNN content x = 0.05 x = 0.06 x = 0.07 x = 0.08
Relative polarization fatigue
%(109 cycle)
38.01
36.20
30.57
67.69
Similar to NBT-xBT systems, P-E hysteresis loops of the NBT-xKNN ceramics,
before electric fatigue, and after 107 polarization switching cycles are compared and shown in Fig. 4.24(a-d). As can be seen from the P-E plots, there is a significant degradation of the saturation polarization. Furthermore, degradation in Pr value is

94
observed for all the samples and interestingly, the value of Ec behaves exactly opposite i.e. increases negligibly for x=0.05, whereas for all other samples they are almost same compared to the loops before fatiguing. It has been suggested that the degradation of Pr value after 107 cycles can be due to the domain wall pinning at charged defects, which is the dominant degradation mechanism in perovskite ceramics [48]. The interaction of charged defects such as oxygen vacancies and charged domain walls can lead to local agglomeration of defects and the eventual stabilization of domains. Whereas, the formation and growth of microcracks in the near-electrode region can be associated with the increase in the Ec value of the x=0.05 ceramics [49]. These cracks result from the high internal stress under bipolar cycling in a ferroelectric ceramic [50].
-80 -60 -40 -20 0 20 40 60 80
-30
-20
-10
0
10
20
30
-80 -60 -40 -20 0 20 40 60 80-40
-30
-20
-10
0
10
20
30
40
-80 -60 -40 -20 0 20 40 60 80-30
-20
-10
0
10
20
30
-80 -60 -40 -20 0 20 40 60 80-80
-60
-40
-20
0
20
40
60
80
2
1(a)
A
2
1(b)
2
1(d)
2
1(c)
Pola
rizat
ion(
µ C/c
m2 )
Electric Field(kV/cm)
Fig. 4.24: P-E hysteresis loops before (1) and after (2) 107 cycles of the NBT-xKNN ceramics with x = (a) 0.05, (b) 0.06 (c) 0.07 (d), and 0.08.

95
References [1] G. Picht, J. Töpfer, E. Hennig, Structural properties of (Bi0.5Na0.5)1−xBaxTiO3 lead-free piezoelectric ceramics, Journal of the European Ceramic Society, 30 (2010) 3445-3453. [2] A.B. Kounga, S.-T. Zhang, W. Jo, T. Granzow, J. Roedel, Morphotropic phase boundary in (1-x)Bi0.5Na0.5TiO3-xK0.5Na0.5NbO3 lead-free piezoceramics. [3] P. Patnaik, Handbook of inorganic chemicals (McGraw-Hill, New York, 2002) [4] C. Xu, D. Lin, K.W. Kwok, Structure, electrical properties and depolarization temperature of (Bi0.5Na0.5)TiO3–BaTiO3 lead-free piezoelectric ceramics, Solid State Sciences, 10 (2008) 934-940. [5] R. Ranjan, A. Dwivedi, Structure and dielectric properties of (Na0.50Bi0.50)1−xBaxTiO3: 0≤x≤0.10, Solid State Communications, 135 (2005) 394-399. [6] E. Wu, POWD, an interactive program for powder diffraction data interpretation and indexing, Journal of Applied Crystallography, 22 (1989) 506-510. [7] W.-C. Lee, C.-Y. Huang, L.-K. Tsao, Y.-C. Wu, Crystal Structure, dielectric and ferroelectric properties of (Bi0.5Na0.5)TiO3–(Ba,Sr)TiO3 lead-free piezoelectric ceramics, Journal of Alloys and Compounds, 492 (2010) 307-312. [8] M.N. Rahaman, Sintering of ceramics, CRC Press, Boca Raton, London; New York, (2008). [9] B. Malic, J. Bernard, J. Holc, D. Jenko, M. Kosec, Alkaline-earth doping in (K,Na)NbO3 based piezoceramics, Journal of the European Ceramic Society, 25 (2005) 2707-2711. [10] P. Laoratanakul, R. Yimnirun, S. Wongsaenmai, Phase formation and dielectric properties of bismuth sodium titanate–potassium sodium niobate ceramics, Current Applied Physics, 11 (2011) S161-S166. [11] M. Masato, Y. Toshiaki, K. Koichi, H. Shin-ichi, Sinterability and Piezoelectric Properties of (K,Na)NbO3 Ceramics with Novel Sintering Aid, Japanese Journal of Applied Physics, 43 (2004) 7159. [12] L.A. Schmitt, J. Kling, M. Hinterstein, M. Hoelzel, W. Jo, H.J. Kleebe, H. Fuess, Structural investigations on lead-free Bi1/2Na1/2TiO3-based piezoceramics, J Mater Sci, 46 (2011) 4368-4376. [13] C. Ma, X. Tan, Dul, apos, E. kin, M. Roth, Domain structure-dielectric property relationship in lead-free (1−x)(Bi1/2Na1/2)TiO3-xBaTiO3 ceramics, Journal of Applied Physics, 108 (2010) 104105. [14] A.A. Bokov, Z.G. Ye, Recent progress in relaxor ferroelectrics with perovskite structure, J Mater Sci, 41 (2006) 31-52. [15] X. Dai, A. DiGiovanni, D. Viehland, Dielectric properties of tetragonal lanthanum modified lead zirconate titanate ceramics, Journal of Applied Physics, 74 (1993) 3399-3405. [16] Y. Man-Soon, M.J. Hyun, K. Sunuk, Spontaneous Micro-Macro Ferroelectric Domain Switching in PbZrO3-doped Pb(Ni1/3Nb2/3)O3-PbTiO3 System, Japanese Journal of Applied Physics, 34 (1995) 1916. [17] W. Jo, S. Schaab, E. Sapper, L.A. Schmitt, H.-J. Kleebe, A.J. Bell, J. Rödel, On the phase identity and its thermal evolution of lead-free (Bi1/2Na1/2)TiO3-6 mol% BaTiO3, Journal of Applied Physics, 110 (2011) 074106. [18] K. Wang, A. Hussain, W. Jo, J. Rödel, Temperature-Dependent Properties of (Bi1/2Na1/2)TiO3–(Bi1/2K1/2)TiO3–SrTiO3 Lead-Free Piezoceramics, Journal of the American Ceramic Society, 95 (2012) 2241-2247. [19] K. Sakata, Y. Masuda, Ferroelectric and antiferroelectric properties of (Na0.5Bi 0.5)TiO3-SrTiO3 solid solution ceramics, Ferroelectrics, 7 (1974) 347-349. [20] A.R. Chaudhuri, A. Laha, S. Krupanidhi, Enhanced ferroelectric properties of vanadium doped bismuth titanate (BTV) thin films grown by pulsed laser ablation technique, Solid state communications, 133 (2005) 611-614. [21] Y.A. Genenko, J. Glaum, M.J. Hoffmann, K. Albe, Mechanisms of aging and fatigue in ferroelectrics, Materials Science and Engineering: B, 192 (2015) 52-82.

96
[22] A.Z. Simões, M.A. Ramírez, E. Longo, J.A. Varela, Leakage current behavior of Bi3.25La0.75Ti3O12 ferroelectric thin films deposited on different bottom electrodes, Materials Chemistry and Physics, 107 (2008) 72-76. [23] S.-T. Chang, J.Y.-m. Lee, Electrical conduction mechanism in high-dielectric-constant (Ba0.5Sr0.5)TiO3 thin films, Applied Physics Letters, 80 (2002) 655-657. [24] A. Mukherjee, P. Victor, J. Parui, S. Krupanidhi, Leakage current behavior in pulsed laser deposited Ba (Zr0.05Ti0.95)O3 thin films, Journal of applied physics, 101 (2007) 034106. [25] K.D. Matthews, X. Chen, D. Hao, W.J. Schaff, L.F. Eastman, GaN photovoltaic leakage current and correlation to grain size, Journal of Applied Physics, 108 (2010) 073105. [26] X.J. Zheng, J.Y. Liu, J.F. Peng, X. Liu, Y.Q. Gong, K.S. Zhou, D.H. Huang, Effect of potassium content on electrostrictive properties of Na0.5Bi0.5TiO3-based relaxor ferroelectric thin films with morphotropic phase boundary, Thin Solid Films, 548 (2013) 118-124. [27] D. Fu, M. Endo, H. Taniguchi, T. Taniyama, S.-y. Koshihara, M. Itoh, Piezoelectric properties of lithium modified silver niobate perovskite single crystals, Applied Physics Letters, 92 (2008) 172905. [28] B. Jaffe, W. R. Cook Jr.,H. Jaffe, Piezoelectric Ceramics, Academic Press London and New York, 1971. [29] J.-N.L. J.-H. Oh, S.-s. Lee, K.-J. Lim, Relativity of Electric Field to Resonance Characteristics and Piezoelectric Constants of Modified PZT Ceramics, TEEM, 10 (2009). [30] S.-T. Zhang, F. Yan, B. Yang, W. Cao, Phase diagram and electrostrictive properties of Bi0.5Na0.5TiO3–BaTiO3–K0.5Na0.5NbO3 ceramics, Applied Physics Letters, 97 (2010) 122901. [31] W. Liu, X. Ren, Large Piezoelectric Effect in Pb-Free Ceramics, Physical Review Letters, 103 (2009) 257602. [32] Q. Zhang, X. Zhao, R. Sun, H. Luo, Crystal growth and electric properties of lead-free NBT-BT at compositions near the morphotropic phase boundary, Physica status solidi (a), 208 (2011) 1012-1020. [33] N. Scarisoreanu, F. Craciun, V. Ion, S.Birjega, M. Dinescu, Structural and electrical characterization of lead-free ferroelectric Na1/2Bi1/2TiO3–BaTiO3 thin films obtained by PLD and RF-PLD, Applied Surface Science, 254 (2007) 1292-1297. [34] F. Xu, S. Trolier-McKinstry, W. Ren, B. Xu, Z.-L. Xie, K.J. Hemker, Domain wall motion and its contribution to the dielectric and piezoelectric properties of lead zirconate titanate films, Journal of Applied Physics, 89 (2001) 1336-1348. [35] S. Swain, P. Kumar, Dielectric, ferroelectric and bipolar electric field induced strain properties of MPB composition of NBT-xKNN system, Journal of Electroceramics, 32 (2014) 102-107. [36] H. Fan, H.-E. Kim, Perovskite stabilization and electromechanical properties of polycrystalline lead zinc niobate–lead zirconate titanate, Journal of Applied Physics, 91 (2002) 317-322. [37] A. Safari, R. K. Panda, V. F. Janas, Department of Ceramic science and Engineering, Rutgers University, Piscataway NJ 08855, USA. [38] X.J. Lou, Polarization fatigue in ferroelectric thin films and related materials, Journal of Applied Physics, 105 (2009) 024101. [39] J. F. Scott, Ferroelectric Memories, Springer-Verlag Berlin Heidelberg New York, 2000. [40] X.J. Lou, J. Wang, Bipolar and unipolar electrical fatigue in ferroelectric lead zirconate titanate thin films: An experimental comparison study, Journal of Applied Physics, 108 (2010) 034104. [41] C.-C. Chou, C.-S. Hou, T.-H. Yeh, Domain pinning behavior of ferroelectric Pb1− xSrxTiO3 ceramics, Journal of the European Ceramic Society, 25 (2005) 2505-2508. [42] C. Verdier, D.C. Lupascu, J. Rödel, Stability of defects in lead–zirconate–titanate after unipolar fatigue, Applied Physics Letters, 81 (2002) 2596-2598. [43] D. Lupascu, Fatigue of Ferroelectric Ceramics and Related Issues, Springer Berlin Heidelberg, 2004.

97
[44] W.L. Warren, K. Vanheusden, D. Dimos, G.E. Pike, B.A. Tuttle, Oxygen Vacancy Motion in Perovskite Oxides, Journal of the American Ceramic Society, 79 (1996) 536-538. [45] E.A. Patterson, D.P. Cann, Bipolar piezoelectric fatigue of Bi(Zn0.5Ti0.5)O3-(Bi0.5K0.5)TiO3-(Bi0.5Na0.5)TiO3 Pb-free ceramics, Applied Physics Letters, 101 (2012) 042905. [46] D. Dragan, Ferroelectric, dielectric and piezoelectric properties of ferroelectric thin films and ceramics, Reports on Progress in Physics, 61 (1998) 1267. [47] O. Bidault, P. Goux, M. Kchikech, M. Belkaoumi, M. Maglione, Space-charge relaxation in perovskites, Physical Review B, 49 (1994) 7868-7873. [48] Z. Luo, J. Glaum, T. Granzow, W. Jo, R. Dittmer, M. Hoffman, J. Rödel, Bipolar and Unipolar Fatigue of Ferroelectric BNT‐Based Lead‐Free Piezoceramics, Journal of the American Ceramic Society, 94 (2011) 529-535. [49] J. Nuffer, D.C. Lupascu, A. Glazounov, H.-J. Kleebe, J. Rödel, Microstructural modifications of ferroelectric lead zirconate titanate ceramics due to bipolar electric fatigue, Journal of the European Ceramic Society, 22 (2002) 2133-2142. [50] Z. Luo, T. Granzow, J. Glaum, W. Jo, J. Rödel, M. Hoffman, Effect of Ferroelectric Long-Range Order on the Unipolar and Bipolar Electric Fatigue in Bi1/2Na1/2TiO3-Based Lead-Free Piezoceramics, Journal of the American Ceramic Society, 94 (2011) 3927-3933.

98
Chapter 5
Dielectric, Piezoelectric and Ferroelectric Properties of the 2-Layered SrBi2Ta2O9 based Ceramics
5.1 Introduction
Bismuth layered perovskite materials are useful for memory-based applications because of their low leakage current, fatigue endurance, and good electrical characteristics [1-3]. Among the 2-layer layered perovskites, commonly called Aurivillius phases, SrBi2Nb2O9, SrBi2Ta2O9/SBT, Bi4Ti3O12 and SrBi4Ti4O15 are the well-known materials. Among these different materials, the electrical properties of the SBT system are known to be sensitive to composition variation, especially to the content of Bi3+ or any other substitutions [4, 5]. In literature, the non-stoichiometric SBT and donor doped SBT systems were reported to show better dielectric and ferroelectric properties [6,7]. Therefore, among 2-layer layered perovskites, in the present work, SrBi2Ta2O9/SBT, Sr0.8Bi2.15Ta2O9/SBexT and SrBi2(Ta0.925W0.075)2O9/SBTW systems were selected and synthesized by solid state reaction route. The detail experimental procedure of their synthesis is explained in chapter 3. The dielectric, ferroelectric, leakage current, polarization fatigue, and the piezoelectric properties of these ceramic samples are investigated, compared and discussed in detail in this chapter.
5.2 Thermal Analysis
Fig 5.1 shows the DSC and TGA curves of ball milled and dried uncalcined precursor powder of SBT system. From RT to 1000oC, the overall weight loss is ~ 10%. The observed weight loss around ~ 400oC can be associated with the evaporation of CO2
and O2 gases, resulting from the decomposition of strontium carbonate, bismuth oxide, and tantalum dioxide. The exothermic peak ~1000ºC in DSC plot with no substantial weight loss in TGA plot can be attributed to the phase formation of SBT system. As per this study, all the SBT based ceramics were calcined within the temperature range of 900-1100ºC.

99
Fig 5.1: DSC and TGA curves of the ball milled uncalcined SBT powder.
5.3 XRD Analysis
The XRD patterns of the calcined powders of the SBT, SBexT and SBTW
ceramics are shown in Fig 5.2. Single layered perovskite phase is formed in all the SBT based samples, calcined at 1000ºC. In XRD pattern of SBTW sample, very low intensity peaks at ~ 33o, 36o, 45o, 51o, and 52o were observed. Those peaks are belongs to the segregated phase of W, which suggest about the solubility limit of W6+ in the SBT system. Using diffraction angles (2θ) and intensity of the diffracted peaks, indexing of the XRD patterns was carried out using a computer program package ‘POWD’[8]. For a probable crystal structure, the standard deviations, S.D. = (dobs-dcal) was considered to be minimum, The best agreement between the observed (obs) and the calculated (cal) interplanar spacing (d) was found, and the diffraction patterns of all the SBT based samples are assigned to the BLSFs (m=2) single phase with orthorhombic symmetry (space group A21am). There is a slight shift of XRD diffraction peak position towards the higher diffraction angle side of the SBTW ceramic samples. This can be associated with the decrease in lattice parameters of the SBTW ceramic samples, resulting from the substitution of smaller ionic radii W6+ (0.60 Å) ions in place of Ta5+ (0.64 Å) ions in the SBT system [9]. The lattice parameters of the SBT, SBexT and SBTW ceramics are given in Table 5.1. There is also a slight reduction in the lattice parameters of the SBexT
200 400 600 800 100090
92
94
96
98
100
Temp.(οC)
-1.0
-0.5
0.0
0.5
1.0
1.5
2.0
Wei
ght l
oss
%
DSC(
mW
/mg)

100
20 25 30 35 40 45 50 55
* Peaks denotes segregated phase of W
**
2θ(degree)
Inte
nsity
(A.U
.)
(c)
(b)
1 1
15
1 3
5 / 3
1 5
1 1
130 2
10 /
2 0
10
2 2
0
0 2
8 / 2
0 8
1 1
90 0
10
0 2
0 / 2
0 0
1 1
50
0 8
1 1
3
1 1
1
0 0
6
(a)
**
*
ceramic samples, which can again be associated with the substitution of smaller ionic radii Bi3+ (0.96 Å) ions in place of larger Sr2+ (1.44 Å) ions site.
Fig. 5.2: XRD patterns of (a) SBT, (b) SBexT and (c) SBTW samples calcined at 1000oC for 4hrs.
Table 5.1: Lattice parameters of SBT, SBexT and SBTW ceramic samples.
Sample lattice parameters
a (Å) b (Å) c (Å)
SBT 5.8429(3) 5.2126(1) 25.2296(1)
SBexT 5.8027(2) 5.2025(1) 25.2114(1)
SBWT 5.8279(3) 5.2121(3) 25.2179(1)

101
5.4 Microstructure and Density Study
Fig. 5.3 shows the variation of experimental density with sintering temperature of the (a) SBT, (b) SBexT and (c) SBTW ceramic samples. The theoretical density of the pure SBT ceramic samples is ~8.93 g/cc [6]. For all the SBT based ceramic samples, the experimental density increases up to a particular sintering temperature and then starts decreasing. The decrease of experimental density at higher sintering temperature can be attributed to the volatilization of bismuth oxide in all the SBT based ceramic samples [10]. 1150oC, 1200oC and 1150oC are the optimized sintering temperatures of the SBT, SBexT and SBTW ceramic samples, respectively. The relative density of the SBT, SBexT and SBTW ceramic samples at optimized sintering temperatures was found to be ~95, 98 and 95%, respectively. Optimization of highest sintering temperature and detection of highest relative density of SBexT ceramic samples suggest that excess bismuth content enhances the sintering temperature, which ultimately enhances the densification process.
1100 1150 1200 1250
7.4
7.6
7.8
8.0
8.2
8.4
8.6
8.8
9.0
SBT SBexT SBTW
Sintering Temperature(oC)
Expe
rimen
tal D
ensi
ty(g
/cm
3 )
Fig. 5.3: Variation of experimental density with sintering temperature of the SBT, SBexT, and SBTW ceramics.
Fig. 5.4 shows the micrographs of the SBT based ceramic samples, sintered at different temperatures. A systematic study of the micrographs reveals that the pure SBT ceramic samples, sintered at 1100oC (Fig. 5.4(a)), show the round shaped grains, which changes to square shapes grains with increased average grain size at 1150oC (Fig. 5.4(b))

102
sintering temperature. However, densely packed microstructures of the SBexT ceramic samples are observed at different sintering temperatures. At different sintering temperatures, randomly oriented plate-like grains are observed in the SBexT ceramic samples. The average grain size of the SBexT ceramic samples increases with the increase of sintering temperature, visible in Fig 5.4 (d)-(g). Among SBT, SBexT, and SBTW sintered ceramics, the maximum average grain size is observed in the SBexT ceramic samples, sintered at 1200oC. Fig 5.4(h)-(j) shows the highly non-uniform distribution of grains of SBTW ceramic samples, sintered at 1100oC. This non-uniformity of grains of SBTW ceramic samples decreases at 1150oC, optimized sintering temperature. The experimental density and microstructure of all the SBT based ceramics can be co-related to the volatility of the bismuth at higher sintering temperatures [10]. The average grain size and the experimental density of all the SBT based ferroelectric ceramics, sintered at different optimized temperatures are listed in Table 5.2.
Fig. 5.4: SEM micrographs (a-c) of the SBT ceramic samples sintered at 1100, 1150 and 1200oC, (d-g) of the SBexT ceramic samples sintered at 1100, 1150, 1200 and 1250oC, and (h-j) of the SBTW ceramic samples sintered at 1100, 1150 and 1200oC temperatures.

103
Table 5.2: Average grain size and experimental density of SBT, SBexT, and SBTW
ceramic samples. Sample Sintering temperature( oC) Average grain size
(μm) Experimental density(g/cc)
SBT
1100 1.09 8.32
1150 2.52 8.53
1200 2.11 8.51
SBexT
1100 1.46 8.49
1150 2.04 8.62
1200 3.65 8.87
1250 4.62 7.84
SBTW
1100 1.63 8.43
1150 2.84 8.52
1200 2.43 8.46
5.5 Dielectric Study Fig 5.5(a-c) shows the variation of εr (at different frequencies) vs. temperature of
the SBT, SBexT and SBTW ceramics, sintered at 1150oC, 1200oC and 1150oC, respectively. These dielectric plots show the composition and doping effects on the dielectric properties of the SBT based ceramics. The dielectric constant of a ferroelectric material depends upon the composition, grain size, secondary phases, etc. [11]. From these dielectric plots, three important dielectric observations have been inferred. For the SBexT and SBTW ceramics, there is (i) sharp ferroelectric-paraelectric transition at the Curie temperature (Tc), (ii) enhancement of the value of dielectric constant, and (iii) peak shifting towards higher temperature side compared to the pure SBT ceramic samples. Both the Bi-excess and W6+-substituted samples exhibited sharp transition at their respective Tc. Whereas, in the pure SBT ceramic samples, a diffused phase transition behaviour is observed, which agrees with the earlier reports [12]. This suggests that there exist various regions in the pure SBT ceramic samples with various Tc values [13], which can be attributed to the defects and poor microstructure. The low-frequency dispersion at high temperatures is also observed in the pure SBT ceramic samples, which may be associated with the defects in the samples such as oxygen vacancies, ••
oV , created from the
volatilization of Bi2O3 at high sintering temperatures [14-16]. Moreover, the diffuse phase transition nature near Tc in the pure SBT system can be discussed on the basis of the cation disorder in the Sr-based bismuth layer-structured compounds. There is cation redistribution at A-sites in the perovskite lattice and at the bismuth sites in the (Bi2O2)2+

104
layers in the SrBi2Ta2O9 system [17]. The sharp transition of the SBexT and SBTW ceramic samples suggests that the respective lattices maintain electrical neutrality [18, 19]. Unlike in the pure SBT system, the addition of excess bismuth in the SBexT system and by the donor doping in the SBTW system, the oxygen vacancies, created at high sintering temperature, get compensated. Enhancement of Tc value of the SBexT ceramic samples can be associated with the creation of cation vacancies at the Sr site [18, 19]. The substitution of Bi at the Sr sites in the SBexT ceramic samples can enhance the structural distortion of the TaO6 octahedra, which ultimately lead to the higher Tc value [19]. In the SBTW ceramic samples, the introduction of cation vacancies at the A-site possibly lead to an enhancement of ferroelectric structural distortion, which eventually increases the Tc value [18, 20]. The introduction of cation vacancies can make the domain motion easier and lead to the increase of εr value of both the SBexT and SBTW systems compared to the pure SBT system [18, 20].
50 100 150 200 250 300 350 4000
500
1000
1500
2000
2500
3000
3500
4000
1kHz 10kHz 100kHz 1MHz
Temperature(°C)
ε r
(a)
100 200 300 400
0
200
400
600
800
1000
1200
1400
1600
1800
Temperature(°C)
1kHz 10kHz 100kHz 1MHz
ε r
(b)
50 100 150 200 250 300 350
200
400
600
800
1000
1200
1400
(c) 1kHz 10kHz 100kHz 1MHz
Temperature(°C)
ε r
Fig. 5.5: Temperature dependence of εr at different frequencies of (a) SBT, (b) SBexT and (c) SBTW ceramics.

105
Temperature dependence of tanδ of all the SBT-based ceramic samples at
different frequencies is shown in Fig 5.6(a-c). The temperature dependence of tanδ
follows the similar variation as that of εr vs. temperature plots of respective SBT based
systems. There is a marginal decrease in the tanδ value compared to that of the pure SBT
ceramic samples, which may be due to the reduction of oxygen vacancies during the
processing of the SBexT and SBTW ceramic samples [19]. The RT dielectric properties at
1 kHz frequency of all the SBT based ceramic samples are summarized in Table 5.3.
Fig. 5.6: Temperature dependence of tanδ at different frequencies of (a) SBT, (b) SBexT, and (c) SBTW ceramics.

106
Table 5.3: Dielectric properties (at 1 kHz frequency) Dielectric properties of SBT, SBexT, and SBTW ceramics.
Sample εr at RT tanδ at RT Tc ( °C) εr at Tc
SBT 147 0.05 290 1260
SBexT 182 0.04 398 1590
SBTW 187 0.04 356 1270
5.6 Leakage Current Analysis
Fig 5.7 shows the RT variation of leakage current density as a function of applied electric field of the SBT based ceramic samples. The observed RT leakage current density values of the SBT based ceramic samples are given in Table 5.4. The leakage current density of the SBexT and SBTW ceramic samples decreased compared to the pure SBT ceramic samples, which suggest that there might be a relation between the electrical properties and the orientation of the grains. As reported earlier [21], because the Bi2O2 layers act as insulating layer, the resistivity along the c-axis is two to three orders of magnitude higher than that along the a–b plane in the Bi-layer systems. With excess Bi3+ or with the W6+-substitution in the SBT system, the c-axis orientation may start dominating, which increases the insulating nature of these samples and lead to the decrease in the leakage current density [22]. Both excess Bi3+ and W6+-substitution in the SBT system can act as donor impurities, which might have compensated the oxygen vacancy-related charge carriers and hence there is a decrease in the values of the leakage current of the SBexT and SBTW ceramic samples compared to the pure SBT system [23]. As evident from the plots, the observed leakage current characteristics are almost symmetric in nature, which confirms the electrode independent nature of the samples [22]. In all the SBT based ceramics, at lower voltages, the leakage current can be attributed to the Ohmic-type conduction process and at high voltages the leakage current can be attributed to the space charge limited conduction process [24, 25]. However, a noticeable crest around +/- 20kV/cm can be related to the coercive fields (Ec) of the studied SBT based ceramic samples [26].

107
-60 -40 -20 0 20 40 60
10-12
10-11
10-10
10-9
10-8
10-7 SBT SBexT SBTW
Electric Field(kV/cm)
Curr
ent D
ensi
ty(A
/cm
2 )
Fig. 5.7: Room temperature leakage current density vs. electric field plots of SBT, SBexT, and SBTW ferroelectric ceramics.
Table 5.4: RT leakage current properties of SBT, SBexT and SBTW ceramics at 60kV/cm.
Sample SBT SBexT SBTW
Current density(A/cm2) 1.09x10⁻⁸ 3.14x10⁻⁹ 3.81x10⁻⁹
5.7 Piezoelectric Study
The S-E loops of the SBT based ceramic samples are shown in Fig. 5.8. It can be seen that the S-E loop is not well formed for the pure SBT ceramics whereas the typical butterfly shaped loops are observed for the SBexT and SBTW ceramic samples. The enhancement of the piezoelectric and ferroelectric properties can be attributed to the incorporation of higher valent ions accompanied by cation vacancies at the A-site of the SBexT and SBTW ceramic samples [27, 28]. The maximum strain % ~ 0.011 is observed in the SBexT ceramic samples. In order to find the piezoelectric coefficient (d33) and electromechanical coupling factor (kp), the SBT based ceramics were poled by Corona discharge technique. Among the SBT based ceramics, the maximum value of kp ~ 0.09 and d33 ~ 24pC/N are observed in the SBexT ceramic samples, which can be attributed to

108
its maximum grain size. Since, higher grain size enhances the domain wall mobility, which can result in better piezoelectric properties [27]. The values of strain%, kp and d33 of all the studied SBT based ceramic samples are given in Table 5.5.
-80 -60 -40 -20 0 20 40 60 80
0.000
0.002
0.004
0.006
0.008
0.010 (a)
-80 -60 -40 -20 0 20 40 60 80
0.000
0.002
0.004
0.006
0.008
0.010
0.012
0.014
(b)
-80 -60 -40 -20 0 20 40 60 80
0.000
0.002
0.004
0.006
0.008
0.010
(c)Stra
in%
Electric Field(kV/cm)
Fig. 5.8: S-E loops of (a) SBT, (b) SBexT and (c) SBTW ferroelectric ceramics.
Table 5.5: Piezoelectric properties of SBT, SBexT and SBTW ceramics.
Sample kp d33 (pC/N) Maximum strain%
SBT 0.06 16 0.008
SBexT 0.09 24 0.011
SBTW 0.08 20 0.007

109
5.8 Ferroelectric Study
Fig. 5.9 shows the well-saturated P-E hysteresis loops of all the SBT based ceramic samples. Highest remnant polarization (Pr) ~ 8.07μC/cm2 was observed in the SBexT
ceramic samples. The enhanced polarization in the SBexT ceramic samples can be explained on the basis of larger distortion of its TaO6 octahedra. As reported earlier, bismuth layer based Sr2+-deficient and-Bi3+-excess thin films show larger Pr than that of the corresponding stoichiometric thin films [29, 30]. From the crystal structure study of the SBT system, the TaO2 plane in the TaO6 octahedra is reported as the densest plane, which can cause tensile stress in the Bi2O2 layers and compressive stress in the perovskite-like unit cells [31]. In the present case, the substitution of smaller Bi3+ ions at the Sr2+ ions site can cause compressive stress in the perovskite-like unit cell in the SBexT ceramic samples. This can result in the increased mismatch between the perovskite-like unit cells and the Bi2O2 layers in the SBexT samples, which will lead to larger distortion of the TaO6 octahedra and hence enhanced ferroelectric properties [31]. The higher value of Pr of the SBTW ceramic samples compared to the pure SBT samples can related to the formation of cation vacancies [32]. The substitution of W6+ ions at the Ta5+ ions site can suppress the concentration of the oxygen vacancies in the SBTW system. Further, the lowering of the number of oxygen vacancies in the SBTW system can reduce the domain walls pinning effect and enhanced Pr and reduced Ec values [32]. Pr and Ec values of the SBT, SBexT, and SBTW ceramics are given in Table 5.5.
-80 -60 -40 -20 0 20 40 60 80
-10
-5
0
5
10
SBT SBexT SBTW
Pola
rizat
ion(
µC/c
m2 )
Electric Field(kV/cm)
Fig. 5.9: P-E hysteresis loops of SBT, SBexT, and SBTW ferroelectric ceramics.

110
Table 5.6: Ferroelectric properties of SBT, SBexT and SBTW ceramics.
Sample Pr (µC/cm2) Ec (kV/cm)
SBT 5.89 20.70
SBexT 8.07 15.18
SBTW 6.90 17.24
5.9 Polarization Fatigue Studies
Fig. 5.10 shows the normalized polarization vs. number of cycles (up to 109) of the (a)
SBT, (b) SBexT and (c) SBTW ferroelectric ceramics with the applied external electric
field measured at 105Hz frequency. Under the present bipolar fatigue study, P* and -P*
(µC/cm2) are the switched polarization value in the positive and negative applied electric
field cycles [33]. The switched polarizations are observed after 1, 300000, 1.5x10⁶,
1.17x10⁷, 1.11 x10⁸, and 1.23x10⁹ electric field cycle numbers. All the SBT based
ceramics follow the same trend of polarization variation without any substantial
polarization decrease, which indicate that there is no/marginal degradation of the
ferroelectric properties. Polarization fatigue% values after 109 electric field cycles of the
SBT, SBexT, and SBTW ceramics are given in Table 5.7. This measurement confirms that
the SBT based materials are more or less inherently fatigue-free in nature. The fatigue-
free behavior of the SBT based materials can be attributed to the charge compensation of
the oxygen vacancies, created at high processing temperatures, by the self-regulated
(Bi2O2)2+ layers in the SBT based systems [2]. However, the self-regulating (Bi2O2)2+
layers effect is not enough to explain the fatigue-free nature, since many BLSF’s does
not show fatigue-free behavior even if there is a presence of (Bi2O2)2+ layers [34].
Fatigue-free nature of the studied ceramics is possible due to the oxygen stability by the
combination of double perovskite layers and (Bi2O2)2+ layers [34].

111
10-1 100 101 102 103 104 105 106 107 108 109 1010
-1.0
-0.8
-0.6
-0.4
-0.2
0.0
0.2
0.4
0.6
0.8
1.0
-P*
P*
Switching Cycles(N)
Nor
mal
ized
Pol
ariz
atio
n(a)
10-1 100 101 102 103 104 105 106 107 108 109 1010
-1.0
-0.8
-0.6
-0.4
-0.2
0.0
0.2
0.4
0.6
0.8
1.0
Switching Cycles(N)
(b)
-P*
P*
Nor
mal
ized
Pol
ariz
atio
n
10-1 100 101 102 103 104 105 106 107 108 109 1010
-1.0
-0.8
-0.6
-0.4
-0.2
0.0
0.2
0.4
0.6
0.8
1.0
Switching Cycles(N)
(c)
-P*
P*
No
rmal
ized
Pol
ariz
atio
n
Fig. 5.10: Normalized polarization vs. number of cycles plots of (a) SBT, (b) SBexT and (c) SBTW ferroelectric ceramics.
Table 5.7: Polarization fatigue properties of SBT, SBexT and SBTW ceramics.
Sample SBT SBexT SBTW
Relative polarization fatigue % (109 cycle) 1.56 0.86 1.46

112
References
[1] J.F. Scott, C.A. Paz De Araujo, Ferroelectric memories, Science (New York, N.Y.), 246 (1989) 1400-1405. [2] C.A.P. de Araujo, J.D. Cuchiaro, L.D. McMillan, M.C. Scott, J.F. Scott, Fatigue-free ferroelectric capacitors with platinum electrodes, Nature, 374 (1995) 627-629. [3] S.B. Desu, D.P. Vijay, Novel fatigue-free layered structure ferroelectric thin films, Materials Science and Engineering: B, 32 (1995) 75-81. [4] H. Bachhofer, F. Hintermaier, M. Hauf, O. Spindler, T. Haneder, C. Dehm, H. von Philipsborn, R. Waser, Effect of Film Composition on Low-Temperature Processing of SBT Deposited by MOCVD, MRS Online Proceedings Library, 596 (1999) null-null. [5] J. Ricote, M.L. Calzada, A. González, C. Ocal, Microstructural Studies on the Low-Temperature Crystallization Process of Strontium Bismuth Tantalate Thin Films, Journal of the American Ceramic Society, 87 (2004) 138-143. [6] R. Aoyagi, H. Takeda, S. Okamura, T. Shiosaki, Ferroelectric and piezoelectric properties of bismuth layered-structure ferroelectric (Sr,Na,Bi)Bi2Ta2O9 ceramics, Materials Science and Engineering: B, 116 (2005) 156-160. [7] I. Coondoo, N. Panwar, A.K. Jha, Effect of sintering temperature on the structural, dielectric and ferroelectric properties of tungsten substituted SBT ceramics, Physica B: Condensed Matter, 406 (2011) 374-381. [8] E. Wu, POWD, an interactive program for powder diffraction data interpretation and indexing, Journal of Applied Crystallography, 22 (1989) 506-510. [9] R.D. Shannon, C.T. Prewitt, Effective ionic radii in oxides and fluorides, Acta Crystallographica Section B, 25 (1969) 925-946. [10] A. Simões, G. da Costa, M. Ramirez, J.A. Varela, E. Longo, Effect of the excess of bismuth on the morphology and properties of the BaBi2Ta2O9 ceramics, Materials Letters, 59 (2005) 656-661. [11] R.R. Das, P. Bhattacharya, W. Pérez, R.S. Katiyar, Effect of Ca on structural and ferroelectric properties of SrBi2Ta2O9 and SrBi2Nb2O9 thin films, Ceramics International, 30 (2004) 1175-1179. [12] I. Coondoo, A.K. Jha, S.K. Agarwal, Enhancement of dielectric characteristics in donor doped Aurivillius SrBi2Ta2O9 ferroelectric ceramics, Journal of the European Ceramic Society, 27 (2007) 253-260. [13] K. Takemura, T. Noguchi, T. Hase, Y. Miyasaka, Dielectric anomaly in strontium bismuth tantalate thin films, Applied Physics Letters, 73 (1998) 1649-1651. [14] B.H. Park, S.J. Hyun, S.D. Bu, T.W. Noh, J. Lee, H.-D. Kim, T.H. Kim, W. Jo, Differences in nature of defects between SrBi2Ta2O9 and Bi4Ti3O12, Applied Physics Letters, 74 (1999) 1907-1909. [15] T. Friessnegg, S. Aggarwal, R. Ramesh, B. Nielsen, E.H. Poindexter, D.J. Keeble, Vacancy formation in (Pb,La)(Zr,Ti)O3 capacitors with oxygen deficiency and the effect on voltage offset, Applied Physics Letters, 77 (2000) 127-129. [16] C. Ang, Z. Yu, L.E. Cross, Oxygen-vacancy-related low-frequency dielectric relaxation and electrical conduction in Bi:SrTiO3, Physical Review B, 62 (2000) 228-236. [17] S. M. Blake, M.J. Falconer, M. McCreedy, P. Lightfoot, Cation disorder in ferroelectric Aurivillius phases of the type Bi2ANb2O9(A=Ba, Sr, Ca), Journal of Materials Chemistry, 7 (1997) 1609-1613. [18] Y. Wu, S.J. Limmer, T.P. Chou, C. Nguyen, G. Cao, Influence of tungsten doping on dielectric properties of strontium bismuth niobate ferroelectric ceramics, Journal of Materials Science Letters, 21 (2002) 947-949. [19] Y. Wu, C. Nguyen, S. Seraji, M.J. Forbess, S.J. Limmer, T. Chou, G. Cao, Processing and Properties of Strontium Bismuth Vanadate Niobate Ferroelectric Ceramics, Journal of the American Ceramic Society, 84 (2001) 2882-2888.

113
[20] T. Sadayuki, T. Masao, Effects of Impurities on the Mechanical Quality Factor of Lead Zirconate Titanate Ceramics, Japanese Journal of Applied Physics, 11 (1972) 31. [21] S.K. Kim, M. Miyayama, H. Yanagida, Electrical anisotropy and a plausible explanation for dielectric anomaly of Bi4Ti3O12 single crystal, Materials Research Bulletin, 31 (1996) 121-131. [22] A.R. Chaudhuri, A. Laha, S.B. Krupanidhi, Enhanced ferroelectric properties of vanadium doped bismuth titanate (BTV) thin films grown by pulsed laser ablation technique, Solid State Communications, 133 (2005) 611-614. [23] Y.-M. Kan, G.-J. Zhang, P.-L. Wang, Y.-B. Cheng, Preparation and properties of neodymium-modified bismuth titanate ceramics, Journal of the European Ceramic Society, 28 (2008) 1641-1647. [24] S.-T. Chang, J.Y.-m. Lee, Electrical conduction mechanism in high-dielectric-constant (Ba0.5Sr0.5)TiO3 thin films, Applied Physics Letters, 80 (2002) 655-657. [25] A. Mukherjee, P. Victor, J. Parui, S. Krupanidhi, Leakage current behavior in pulsed laser deposited Ba (Zr0.05Ti0.95)O3 thin films, Journal of applied physics, 101 (2007) 034106. [26] N. Tsutsumi, T. Kitano, K. Kinashi, W. Sakai, Ferroelectric Switching of Vinylidene and Trifluoroethylene Copolymer Thin Films on Au Electrodes Modified with Self-Assembled Monolayers, Materials, 7 (2014) 6367. [27] H.T. Martirena, J.C. Burfoot, Grain-size effects on properties of some ferroelectric ceramics, Journal of Physics C: Solid State Physics, 7 (1974) 3182. [28] C. Fujioka, R. Aoyagi, H. Takeda, S. Okamura, T. Shiosaki, Effect of non-stoichiometry on ferroelectricity and piezoelectricity in strontium bismuth tantalate ceramics, Journal of the European Ceramic Society, 25 (2005) 2723-2726. [29] A. Tsutomu, S. Nobuyuki, Y. Tadashi, O. Katsumi, Preparation of Bi-Based Ferroelectric Thin Films by Sol-Gel Method, Japanese Journal of Applied Physics, 34 (1995) 5096. [30] N. Takehiro, H. Takashi, M. Yoichi, Analysis of the Dependence of Ferroelectric Properties of Strontium Bismuth Tantalate (SBT) Thin Films on the Composition and Process Temperature, Japanese Journal of Applied Physics, 35 (1996) 4900. [31] Y. Shimakawa, Y. Kubo, Y. Nakagawa, T. Kamiyama, H. Asano, F. Izumi, Crystal structures and ferroelectric properties of SrBi2Ta2O9 and Sr0.8Bi2.2Ta2O9, Applied Physics Letters, 74 (1999) 1904-1906. [32] I. Coondoo, N. Panwar, Enhanced Dielectric and Ferroelectric Properties of Donor (W6+, Eu3+) Substituted SBT Ferroelectric Ceramics, the book "Ferroelectrics" ISBN 978-953-307-439-9, InTech, (2010) pp-241-242. [33] X.J. Lou, J. Wang, Bipolar and unipolar electrical fatigue in ferroelectric lead zirconate titanate thin films: An experimental comparison study, Journal of Applied Physics, 108 (2010) 034104. [34] B. Park, B. Kang, S. Bu, T. Noh, J. Lee, H. Kim, T. Kim, Origins for fatigue-free properties of Bi-layered perovskite materials, Journal-Korean physical society, 35 (1999) s1306-s1309.

114
Chapter 6
Dielectric, Piezoelectric and Ferroelectric Properties of SBexT modified NBT-xBT and NBT-xKNN (x=0.07) Ceramics
6.1 Introduction
In the NBT-xBT and NBT-xKNN systems, the respective MPB existed at x=0.07 composition (reported in chapter 4). On the other hand, SBexT system showed overall improved electrical, ferroelectric, and polarization fatigue along with lower leakage current properties (reported in chapter 5). Compared to the SBexT system, the leakage current density is higher and polarization fatigue behavior is poor of the MPB compositions of the NBT-xBT and NBT-xKNN systems, respectively. Modification of the MPB compositions of the NBT-xBT and NBT-xKNN systems with SBexT system can combine the excellent ferroelectric properties of the perovskite phase with the anti-polarization fatigue and low leakage properties. In this chapter, a systematic study of the dielectric, leakage current density, ferroelectric, piezoelectric and polarization fatigue properties of the synthesized (1-ϕ)(0.93Na0.5Bi0.5TiO3-0.07BaTiO3/NBT-BT)-ϕSr0.8Bi2.15Ta2O9 and (1-ϕ)(0.93Na0.5Bi0.5TiO3-0.07K0.5Na0.5NbO3/NBT-KNN)-ϕSr0.8Bi2.15Ta2O9 (ϕ= 2, 4, 8, 12, 16 wt. %) ceramics is presented.
6.2 XRD Study In the following subsections, the XRD study of the sintered (1-ϕ)(NBT-BT)-ϕ
SBexT and (1-ϕ)(NBT-KNN)-ϕSBexT (ϕ= 0, 2, 4, 8, 12, 16 wt. %) ceramics are given.
6.2.1 XRD Study of the (1-ϕ)(NBT-BT)-ϕSBexT Ceramics
XRD pattern of the MPB composition (for ϕ= 0) of the NBT-xBT system shows the single perovskite phase with pseudo-cubic distortion (explained in chapter 4 and shown in Fig. 6.1(a)), whereas, Fig. 6.1(b) shows the development of single phase layered perovskite with orthorhombic crystal structure of the SBexT system. Fig. 6.1 (c) shows the XRD patterns of the sintered (1-ϕ) (NBT-BT)-ϕSBexT for ϕ= 2, 4, 8, 12, 16 wt. % ceramic samples. Fig. 6.1 (c) confirms the presence of both the SBexT and the NBT-BT

115
ceramic phases and the XRD peaks intensity of the SBexT phase increases with the increase of its wt.% in the (1-ϕ)(NBT-BT)-ϕSBexT system. The XRD peaks of the NBT-BT and SBexT phases are marked with ‘Δ’ and ‘#’ symbols. Later, the existence of both SBexT and NBT-BT phases in the (1-ϕ)(NBT-BT)-ϕSBexT ceramics is also confirmed from the SEM micrograph study. With the increase of SBexT content in the (1-ϕ)(NBT-BT)-ϕSBexT system, some unwanted secondary phase XRD peaks (marked as *) starts appearing. This suggests the possible reaction between the NBT-BT and SBexT phases at high sintering temperature [1].
20 30 40 50 60 70 80
16wt.%
12wt.%
8wt.%4wt.%
∆ ∆
∆
∆
∆
∆
∆
∆ ####
##
#
#Inten
sity(a
.u.)
2θ(°)
(c)
****
2wt.%
Fig. 6.1: X-ray diffraction patterns of (a) MPB composition of NBT-BT, (b) SBexT and (c) (1-ϕ) (NBT-BT)-ϕ SBexT (ϕ= 2, 4, 8, 12, 16 wt. %) ceramics.
20 30 40 50 60 70 80
3 1
02 2
0
1 2
2
1 0
2
0 0
2
1 1
1
1 1
0
0 0
1
2θ(°)
Inte
nsity
(a.u
.)
(a)
20 25 30 35 40 45 50 55 602θ(°)
Inte
nsity
(A.U
.)
1 1
15
1 3
5 / 3
1 5
1 1
130 2
10 /
2 0
10
2 2
0
0 2
8 / 2
0 8
1 1
90 0
10
0 2
0 / 2
0 0
1 1
50
0 8
1 1
3
1 1
1
0 0
6
(b)

116
6.2.2 XRD Study of the (1-ϕ)(NBT-KNN)-ϕSBexT Ceramics
Fig. 6.2 shows the RT X-ray diffraction (XRD) patterns of the sintered (1-ϕ)(NBT-KNN)-ϕSBexT (ϕ= 0, 2, 4, 8, 12, 16 wt. %) ceramics, whereas the inset figure is for ϕ= 0 wt. %. These XRD patterns show the presence of both the NBT-KNN and the SBexT phases. The existence of the NBT-KNN (marked as Δ) and SBexT (marked as #) phases in the XRD pattern separately suggest the possibilities of affecting each other properties. Moreover, some impurity peaks (marked as *) are also detected in the XRD patterns of the (1-ϕ)(NBT-KNN)-ϕSBexT ceramics, which corresponds to the pyrochlore/intermediate phases [1]. Later, the existence of both SBexT and NBT-KNN phases in the (1-ϕ)(NBT-KNN)-ϕSBexT ceramics is also confirmed from the SEM micrograph study. Development of unwanted XRD peaks (other than the SBexT and the NBT-KNN phases) suggest the possible reaction between the NBT-KNN and SBexT systems during sintering stage [2,3].
20 30 40 50 60 70 80
(e)
(d)(c)
(b)
2θ(°)
Inten
sity(a
.u.) 20 30 40 50 60 70 80
2θ(°)
Inten
sity(a
.u.)
NBT-KNN
∆ *∆ *
∆
#
∆
#∆
#∆
*
#
∆
#
*∆
(a)
Fig. 6.2: X-ray diffraction patterns of (1-ϕ)(NBT-KNN)-ϕSBexT ceramics with ϕ (in wt. %) = (a) 2, (b) 4, (c) 8, (d) 12, and (e) 16. Inset: XRD pattern of NBT-xKNN (with x=0.07).
6.3 Density and Morphological Study
6.3.1 Density and Morphological Study of the (1-ϕ)(NBT-BT)-ϕSBexT Ceramics
Fig. 6.3 (a-f) shows the SEM images of the (1-ϕ)(NBT-BT)-ϕ SBexT (ϕ= 0, 2, 4, 8, 12, 16 wt. %) ceramic samples. The incorporation of SBexT phase beyond ϕ ≥ 8 wt. %

117
influences the microstructure of the NBT-BT ceramic samples. Up to ϕ =4 wt. %, the grain shapes are of typical NBT-BT ceramics type. However, long, randomly oriented and platelike grains starts developing with the increase of SBexT content beyond ϕ = 4 wt.% in the (1-ϕ) (NBT-BT)-ϕ SBexT ceramic samples. In addition, with the increase of SBexT content, the non-uniformity of ractangular grains increases and the average grain size decreases. This decrease of average grain size with the increase of SBexT content suggest that SBexT acts as grain growth inhibitor in the (1-ϕ)(NBT-BT)-ϕ SBexT ceramic samples. The decrease of average grain size with the increase of SBexT content can also be associated with the appearance of secondary phases in the (1-ϕ)(NBT-BT)-ϕ SBexT ceramic samples [2]. The avaerage grain size of the NBT-BT-type rectangular grains and the SBexT-type platelike grains of the (1-ϕ)(NBT-BT)-ϕSBexT ceramics are given in Table 6.1. The experimental density (ρex) of all the sintered (1-ϕ)(NBT-BT)-ϕ SBexT ceramic samples is also given in Table 6.3. ρex increases with the increase of SBexT content and becomes maximum for ϕ=12 wt.%. This enhancement of density can be linked to the introduction of a denser layered perovskite SBexT phase in the (1-ϕ)(NBT-BT)-ϕSBexT ceramic samples [4].
Fig. 6.3: SEM micrographs of (1-ϕ) (NBT-BT)-ϕ SBexT with ϕ (in wt.%) = (a) 0, (b) 2, (c) 4, (d) 8, (e) 12 and (f) 16.

118
Table 6.1: Average grain size, and experimental density of (1-ϕ) (NBT-BT)-ϕ SBexT (ϕ= 0, 2, 4, 8, 12, 16 wt. %) ceramics.
(1-ϕ) (NBT-
BT)-ϕ SBexT
ϕ = 0 wt.
%
ϕ = 2
wt. %
ϕ = 4 wt.
%
ϕ = 8 wt.
%
ϕ = 12
wt. %
ϕ = 16 wt.
%
Average grain
size (μm)
2.50 1.94 1.68 1.22
l*=4.24
1.65
l* =15.3
1.16
l*=11.21
Experimental
density(g/cc)
5.89 5.92 5.95 5.96 6.09 5.62
Where, l*=length of plate like grains
6.3.2 Density and Morphological Study of (1-ϕ)(NBT-KNN)-ϕSBexT Ceramics
Fig. 6.4 (a-f) shows the SEM images of the (1-ϕ) (NBT-KNN)-ϕ SBexT (ϕ= 0, 2,
4, 8, 12, 16 wt. %) ceramic samples. Non-uniform arrangement of rectangular grains can
be seen from the SEM micrographs of the NBT-KNN samples. However, long, randomly
oriented and platelike grains starts emerging for ϕ ≥ 8 wt.% samples in the(1-ϕ) (NBT-
KNN)-ϕSBexT system, which is similar to the SBexT modified NBT-BT systems. The
average grain size of the (1-ϕ)(NBT-KNN)-ϕSBexT ceramics is calculated by the linear
intercept method and given in Table 6.2. There is a small decrease of the average grain
size of the rectangular shaped grains with the increase of SBexT content in the (1-ϕ)(NBT-
KNN)-ϕSBexT ceramics. The experimental density (ρex) of the sintered (1-ϕ)(NBT-
KNN)-ϕSBexT ceramics was measured by Archimedes principle. The values of ρex of the
(1-ϕ)(NBT-KNN)-ϕSBexT ceramics are given in Table 6.2. ρex increases with the increase
of SBexT content in the (1-ϕ)(NBT-KNN)-ϕ SBexT system, which is again obvious
because the SBexT system is a denser layered perovskite than the NBT-KNN system [4].

119
Fig. 6.4: SEM micrographs of (1-ϕ) (NBT-KNN)-ϕ SBexT ceramics with ϕ (in wt.%) = (a) 0, (b) 2, (c) 4, (d) 8, (e) 12 and (f) 16.
Table 6.2: Average grain size, and experimental density of (1-ϕ) (NBT-KNN)-ϕ SBexT (ϕ= 0, 2, 4, 8, 12, 16 wt. %) ceramics.
(1-ϕ)(NBT-
KNN)-ϕSBexT
ϕ = 0
wt. %
ϕ = 2
wt. %
ϕ = 4
wt. %
ϕ = 8 wt.
%
ϕ = 12
wt. %
ϕ = 16 wt.
%
Average grain
size (μm)
4.34 1.53 1.31 1.27
l*=3.54
1.25
l*=6.28
1.26
l*=9.62
Experimental
density(g/cm3)
5.77 5.80 5.84 5.85 5.94 6.01
Where, l*=length of plate-like grains
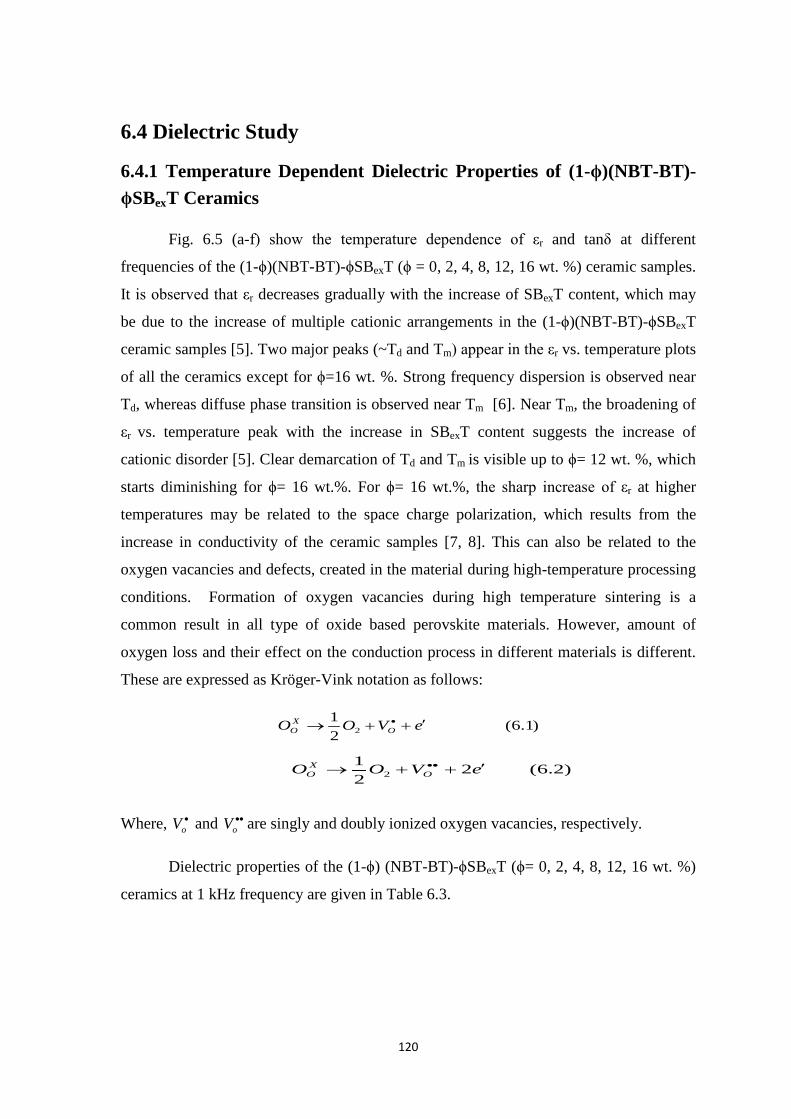
120
6.4 Dielectric Study
6.4.1 Temperature Dependent Dielectric Properties of (1-ϕ)(NBT-BT)-ϕSBexT Ceramics
Fig. 6.5 (a-f) show the temperature dependence of εr and tanδ at different
frequencies of the (1-ϕ)(NBT-BT)-ϕSBexT (ϕ = 0, 2, 4, 8, 12, 16 wt. %) ceramic samples.
It is observed that εr decreases gradually with the increase of SBexT content, which may
be due to the increase of multiple cationic arrangements in the (1-ϕ)(NBT-BT)-ϕSBexT
ceramic samples [5]. Two major peaks (~Td and Tm) appear in the εr vs. temperature plots
of all the ceramics except for ϕ=16 wt. %. Strong frequency dispersion is observed near
Td, whereas diffuse phase transition is observed near Tm [6]. Near Tm, the broadening of
εr vs. temperature peak with the increase in SBexT content suggests the increase of
cationic disorder [5]. Clear demarcation of Td and Tm is visible up to ϕ= 12 wt. %, which
starts diminishing for ϕ= 16 wt.%. For ϕ= 16 wt.%, the sharp increase of εr at higher
temperatures may be related to the space charge polarization, which results from the
increase in conductivity of the ceramic samples [7, 8]. This can also be related to the
oxygen vacancies and defects, created in the material during high-temperature processing
conditions. Formation of oxygen vacancies during high temperature sintering is a
common result in all type of oxide based perovskite materials. However, amount of
oxygen loss and their effect on the conduction process in different materials is different.
These are expressed as Kröger-Vink notation as follows:
)1.6(21
2 eVOO OX
O ′++→ •
)2.6(221
2 eVOO OX
O ′++→ ••
Where, •oV and ••
oV are singly and doubly ionized oxygen vacancies, respectively.
Dielectric properties of the (1-ϕ) (NBT-BT)-ϕSBexT (ϕ= 0, 2, 4, 8, 12, 16 wt. %)
ceramics at 1 kHz frequency are given in Table 6.3.

121
Fig. 6.5: Variation of εr and tanδ with temperature at different frequencies of (1-ϕ) (NBT-BT)-ϕSBexT ceramics with ϕ (in wt.%) = (a) 0, (b) 2, (c) 4, (d) 8, (e) 12 and (f) 16.

122
Table 6.3: Dielectric values (at 1 kHz frequency) of (1-ϕ) (NBT-BT)-ϕ SBexT ceramic samples.
(1-ϕ) (NBT-BT)-ϕ SBexT
εr
at RT
tanδ
at RT
Td
( °C)
Tm
( °C)
εr
at Tm
ϕ = 0 wt.% 2275 0.04 99 219 5067
ϕ = 2 wt.% 1725 0.05 81 216 3687
ϕ = 4 wt.% 1534 0.05 88 214 3272
ϕ = 8 wt.% 1326 0.04 96 214 2624
ϕ = 12 wt.% 1253 0.04 99 201 2209
ϕ =16 wt.% 532 0.03 - - -
6.4.2 Temperature Dependent Dielectric Properties of (1-ϕ)(NBT-KNN)-ϕSBexT Ceramics
Fig. 6.6 (a-f) shows the temperature dependence of εr and tanδ at different frequencies of the (1-ϕ) (NBT-KNN)-ϕSBexT (ϕ=0, 2, 4, 8, 12, 16 wt. %) ceramics. Two significant peaks (near Td and Tm) appear in the temperature dependence of εr plots of the (1-ϕ) (NBT-KNN)-ϕSBexT ceramics. At RT, the variation of εr vs. T plots exhibit frequency dispersion, whereas above Td this dispersion nature is reduced, which suggest the existence of relaxing phenomena close to RT, which is absent at higher temperatures [6]. However, near Tm, εr vs. T peaks are comparatively broad, indicating the diffuse phase transition (DPT) nature of the samples. It is observed that εr increases with the increase in temperature up to Tm and starts decreasing slowly with the increase of temperature above Tm. Also, Tm decreases with the increase of SBexT content in the (1-ϕ) (NBT-KNN)-ϕSBexT ceramics. The decrease of Tm with the increase of SBexT content can be related to the internal stress in the (1-ϕ) (NBT-KNN)-ϕSBexT ceramics [9]. This behavior suggests that there might have decrease in internal stress, which gives rise to decrease in Tm. However, Td shows a marginal shift without any systematic trend with the variation of SBexT content in the (1-ϕ) (NBT-KNN)-ϕSBexT ceramics. Furthermore, there is no clear distinction between Td and Tm for ϕ=16 wt.% ceramic samples.The value of εr at RT as well as at Tm decreases with the increase of SBexT content, which suggest the

123
increase of multiple cationic arrangements in the (1-ϕ)(NBT-KNN)-ϕSBexT ceramics [5]. RT value of tanδ at 1 kHz frequency drastically decreases for ϕ = 16 wt. % ceramic samples, which suggest the usefulness of this system for capacitor applications. Dielectric properties at 1 kHz frequency of the (1-ϕ) (NBT-KNN)-ϕSBexT (ϕ= 0, 2, 4, 8, 12, 16 wt. %) ceramics are given in Table 6.4.
Fig. 6.6: Variation of εr and tanδ with temperature at different frequencies of (1-ϕ) (NBT-KNN)-ϕ SBexT ceramics with ϕ (in wt.%) = (a) 0, (b) 2, (c) 4, (d) 8, (e) 12 and (f) 16.

124
Table 6.4: Dielectric values (at 1 kHz frequency) of (1-ϕ) (NBT-KNN)-ϕ SBexT ceramic samples.
(1-ϕ) (NBT-KNN)-ϕ SBexT
εr
at RT
tanδ
at RT
Td
( °C)
Tm
( °C)
εr
at Tm
ϕ = 0 wt.% 2787 0.05 121 259 4438
ϕ = 2 wt.% 2396 0.07 128 231 2663
ϕ = 4 wt.% 1329 0.03 128 228 2606
ϕ = 8 wt.% 1313 0.03 115 197 2398
ϕ = 12 wt.% 1220 0.03 115 186 1946
ϕ =16 wt.% 1278 0.02 124 - -
6.5 Leakage Current Study
6.5.1 Leakage Current Properties of (1-ϕ)(NBT-BT)-ϕSBexT Ceramics
The room temperature (RT) leakage current density vs. electric field (J–E)
characteristics of the (1-ϕ)(NBT-BT)-ϕSBexT (ϕ= 0, 2, 4, 8, 12, 16 wt. %) ceramic
samples are shown in Fig. 6.7. The values of leakage current density of all the (1-ϕ)
(NBT-BT)-ϕ SBexT ceramic samples are observed to be between ~10-7 to 10-8A/cm2 at the
maximum applied electric field of 40kV/cm. Leakage current density values of the SBexT
modified systems are lower than the pure NBT-BT ceramic sample. In contrast, as shown
in Fig. 6.7, even at low electric fields, the NBT-BT ceramic samples exhibits high
leakage current density. Bi vacancies ( '''BiV ) accompanied by oxygen vacancies ( ••
oV ) in the
NBT-BT system can be related to its high leakage current behavior [10, 11]. The decrease
of leakage current density with the incorporation of SBexT ceramics can be related to the
decrease in space charge density [12]. The leakage current conduction mechanism of the
(1-ϕ)(NBT-BT)-ϕSBexT ceramic samples can be explained in terms of ohmic behavior at
low electric fields and space charge limited conduction (SCLC) behavior at high electric
fields [13]. In addition, a distinct hump at ~30kV/cm electric field in the J-E plot of the

125
NBT-BT ceramic samples relates with the coercive field for the particular composition
[14]. Moreover, asymmetric nature of the J-E plot of the NBT-BT ceramic samples
suggests the electrode dependent behavior [15]. The values of leakage current density at
an electric field of 40kV/cm are given in Table 6.5. The leakage current density value
decreases up to ϕ= 12wt. %. This decrease of leakage current density with the
modification of SBexT ceramics can be associated with the introduction of lattice defects,
which block the electron movement and results in less electrical conductivity [16].
However for ϕ =16 wt.%, the leakage current density value starts increasing which may
be related to the dominance of space charge effect and presence of secondary phases in
the systems.
-40 -30 -20 -10 0 10 20 30 4010-11
10-10
10-9
10-8
10-7
10-6
10-5 0 wt.% 2 wt.% 4 wt.% 8 wt.% 12 wt.% 16 wt.%
Cur
rent
Den
sity
(A/c
m2 )
Electric Field(kV/cm)
Fig. 6.7 Room temperature leakage current density vs. electric field plots of (1-ϕ) (NBT-BT)-ϕSBexT (ϕ=0, 2, 4, 8, 12, 16 wt. %) ceramics.

126
Table 6.5: Leakage current density of (1-ϕ) (NBT-BT)-ϕ SBexT (ϕ= 0, 2, 4, 8, 12, 16 wt.
%) ceramics at 40kV/cm.
(1-ϕ) (NBT-BT)-
ϕ SBexT
ϕ = 0 wt. %
ϕ = 2 wt. %
ϕ = 4 wt. %
ϕ = 8 wt. %
ϕ = 12 wt. %
ϕ = 16 wt. %
Current
Density(A/cm2)
5.72x10⁻⁷ 1.24x10⁻⁷ 9.60x10⁻⁸ 7.14x10⁻⁸ 5.72x10⁻⁸ 2.35x10-
7
6.5.2 Leakage Current Properties of (1-ϕ)(NBT-KNN)-ϕSBexT Ceramics
Fig. 6.8 shows nearly symmetrical J–E characteristics of (1-ϕ) (NBT-KNN)-
ϕSBexT (ϕ=0, 2, 4, 8, 12, 16 wt %) ferroelectric ceramics at both positive and negative
biased voltages. The bulk-limited current plays a critical role in the conduction
mechanism of the (1-ϕ)(NBT-KNN)-ϕSBexT ceramics [17]. Again, the symmetric nature
of the J–E plots suggests the electrode independent nature of all the (1-ϕ) (NBT-KNN)-
ϕSBexT ceramic samples [15]. The value of the leakage current density of all the (1-ϕ)
(NBT-KNN)-ϕSBexT ceramics at an electric field of 40kV/cm are given in Table 6.6. The
value of the leakage current is two order less compared to the parent NBT-KNN ceramic
samples. The decrease of leakage current value with the increase of SBexT content in the
(1-ϕ)(NBT-KNN)-ϕSBexT system can be accounted in terms of the moderate leakage
behavior of SBexT [18]. Whereas, the small leakage current of SBexT system can be
explained with its layer structure nature [19]. The conduction mechanism in any ceramic
is of bulk and/or interface limited type [20]. In this case, the RT leakage current behavior
at low voltage is of Ohmic conduction type and at high voltage is of SCLC type [21].

127
-40 -20 0 20 4010-13
10-12
10-11
10-10
10-9
10-8
10-7
10-6
Cur
rent
Den
sity
(A/c
m2 )
Electric Field(kV/cm)
0 wt.% 2 wt.% 4 wt.% 8 wt.% 12 wt.% 16 wt.%
Fig. 6.8: Room temperature leakage current density vs. electric field plots of (1-ϕ) (NBT-KNN)-ϕ SBexT (ϕ= 0, 2, 4, 8, 12, 16 wt. %) ceramics.
Table 6.6: Leakage current density of (1-ϕ) (NBT-KNN)-ϕ SBexT (ϕ= 0, 2, 4, 8, 12, 16 wt. %) ceramics at 40kV/cm.
(1-ϕ) (NBT-
KNN)-ϕ
SBexT
ϕ = 0 wt.
%
ϕ = 2 wt.
%
ϕ = 4 wt.
%
ϕ = 8 wt.
%
ϕ = 12 wt.
%
ϕ = 16
wt. %
Current
Density
(A/cm2)
1.04x10-
6
3.36x10⁻⁸ 3.85x10⁻⁸ 2.92x10⁻⁸ 1.72x10⁻⁸ 1.23x10-
8
6.6 Piezoelectric Study
6.6.1 Piezoelectric Study of (1-ϕ) (NBT-BT)-ϕSBexT Ceramics
Fig. 6.9 shows the RT-induced strain% vs. external electric field (S-E) plots of the (1-ϕ) (NBT-BT)-ϕ SBexT (with ϕ= 0, 2, 4, 8, 12, 16 wt. %) ceramic samples. The typical butterfly shape S-E loop with a maximum strain of ~0.45% of the NBT-BT ceramic samples confirmed its piezoelectric nature. While for the SBexT modified systems, the

128
-60 -40 -20 0 20 40 60
0.0
0.1
0.2
0.3
0.4
0.5
(a)
-60 -40 -20 0 20 40 60-0.02
0.00
0.02
0.04
0.06
0.08
0.10
0.12
0.14
0.16
(b)
-60 -40 -20 0 20 40 60-0.02
0.00
0.02
0.04
0.06
0.08
(c)
-60 -40 -20 0 20 40 60
0.00
0.01
0.02
0.03
0.04
0.05
0.06
(d)
-60 -40 -20 0 20 40 60-0.01
0.00
0.01
0.02
0.03
0.04
0.05 (e)
-60 -40 -20 0 20 40 60-0.01
0.00
0.01
0.02
0.03
0.04
(f)
Electric Field(kV/cm)
Stra
in%
shape of the S-E loops changes to a typical relaxor ferroelectric type, which may be due to the dependence of Td on frequency, confirmed in the dielectric spectrum [22]. The significant reduction of the induced strain%, accompanied by the deviation from the butterfly shaped S–E loops reveals that the ferroelectric and non-polar phases coexist in the (1-ϕ) (NBT-BT)-ϕSBexT (with ϕ= 2, 4, 8, 12, 16 wt. %) ceramic samples. Moreover, this suggests that an easy transition between the ferroelectric and non-polar phases can occur under an applied external electric field [23]. The S-E loop of the ceramics for ϕ=16 wt. % composition is highly disrupted and the value of induced strain% gets drastically lowered. This can be attributed to the low piezoelectric property SBexT and presence of secondary phase in the (1-ϕ)(NBT-BT)-ϕSBexT ceramic composites for ϕ=16 wt. %. The d33 and kp values of all the poled (1-ϕ) (NBT-BT)-ϕSBexT ceramics are also measured. The d33 and kp values are found to decrease with increase in SBexT incorporation and get completely disappear after ϕ = 12 wt. % and 8 wt. %, respectively. Maximum induced strain %, d33 and kp of all the (1-ϕ) (NBT-BT)-ϕSBexT ceramic samples are given in Table 6.7.
Fig. 6.9 Bipolar field-induced strains of (1-ϕ) (NBT-BT)-ϕ SBexT ceramics with ϕ (in wt. %) = (a) 0, (b) 2, (c) 4, (d) 8, (e) 12 and (f) 16.

129
Table 6.7: Piezoelectric parameters of (1-ϕ) (NBT-BT)-ϕ SBexT (ϕ= 0, 2, 4, 8, 12, 16 wt. %) ceramics.
(1-ϕ) (NBT-BT)-ϕ SBexT
ϕ = 0 wt. %
ϕ = 2 wt. %
ϕ = 4 wt. % ϕ = 8 wt. %
ϕ = 12 wt. %
ϕ =16 wt. %
kp 0.21 18.24 13.31 8.11 - -
d33 (pC/N) 105 85 43 25 14 -
Strain% 0.45 0.14 0.07 0.05 0.04 0.03
6.6.2 Piezoelectric Study of (1-ϕ) (NBT-KNN)-ϕSBexT Ceramics
Fig. 6.10 shows the development of S-E loops of the (1-ϕ)(NBT-KNN)-ϕSBexT
(with ϕ= 0, 2, 4, 8, 12, 16 wt. %) ceramics, which suggests the movement and switching
of the non-180° domain walls [24]. Butterfly shaped S-E loops are observed in all the
(1-ϕ)(NBT-KNN)-ϕSBexT ceramic samples. Unlike SBexT modified NBT-BT systems,
the butterfly shape of the S-E loops of the (1-ϕ)(NBT-KNN)-ϕSBexT ceramics is retained.
However, with the increase of SBexT content, the asymmetry of the S-E loops increases,
which can be attributed to the increase of defects/secondary phase in the (1-ϕ)(NBT-
KNN)-ϕSBexT ceramics [25]. Maximum induced strain% values of all the studied
ceramic samples are given in Table 6.8. The maximum strain% value gradually decreases
with the increase of SBexT content in the (1-ϕ)(NBT-KNN)-ϕSBexT ceramics. The d33 and
kp values of all the (1-ϕ)(NBT-KNN)-ϕSBexT ceramics are given in the Table 6.8. Like
the decrease of maximum strain% values, the d33 and kp values are also decreasing with
the increase of SBexT content in the (1-ϕ)(NBT-KNN)-ϕSBexT ceramics. Moreover, no
significant value of kp and d33 of the (1-ϕ)(NBT-KNN)-ϕSBexT ceramics are observed for
ϕ = 4 wt.% and 8 wt.% ceramics, respectively.

130
-80 -60 -40 -20 0 20 40 60 80-0.05
0.00
0.05
0.10
0.15
0.20
0.25
0.30
0.35
0.40 (a)St
rain
%
Electric Field(kV/cm)
-60 -40 -20 0 20 40 60-0.02
0.00
0.02
0.04
0.06
0.08
0.10
0.12
0.14
0.16
0.18 (b)
-60 -40 -20 0 20 40 60
0.00
0.02
0.04
0.06
0.08
0.10
0.12
0.14
0.16
(c)
-60 -40 -20 0 20 40 60
0.00
0.02
0.04
0.06
0.08 (d)
-80 -60 -40 -20 0 20 40 60 80-0.01
0.00
0.01
0.02
0.03
0.04
0.05
0.06
0.07 (e)
-60 -40 -20 0 20 40 60-0.005
0.000
0.005
0.010
0.015
0.020
0.025
0.030
0.035
0.040
(f)
Fig. 6.10: Bipolar field-induced strains of (1-ϕ) (NBT-KNN)-ϕ SBexT ceramics with ϕ (in wt. %) = (a) 0, (b) 2, (c) 4, (d) 8, (e) 12 and (f) 16.
Table 6.8: Piezoelectric parameters of (1-ϕ) (NBT-KNN)-ϕ SBexT (ϕ= 0, 2, 4, 8, 12, 16 wt. %) ceramics.
(1-ϕ) (NBT-KNN)-ϕ SBexT
ϕ = 0 wt. % ϕ = 2 wt. % ϕ = 4 wt. %
ϕ = 8 wt. %
ϕ = 12 wt. %
ϕ =16 wt. %
kp 0.12 0.10 0.08 - - -
d33 (pC/N) 78 52 31 15 - -
Strain% 0.29 0.15 0.11 0.08 0.05 0.03
6.7 Ferroelectric Study
6.7.1 Ferroelectric Study of (1-ϕ) (NBT-BT)-ϕ SBexT Ceramics
Fig. 6.11 show the P-E hysteresis loops of the (1-ϕ) (NBT-BT)-ϕSBexT (where ϕ= 0, 2, 4, 8, 12, 16 wt.%) ceramic samples. The MPB composition of the NBT-BT system

131
exhibits a strong ferroelectric nature with remnant polarization (Pr) ~31.71μC/cm2 and coercive field (Ec) ~ 40kV/cm. However, as compared to the NBT-BT ceramics, the SBexT incorporated (1-ϕ)(NBT-BT)-ϕSBexT ceramic samples show lowering of the Ec and Pr values. The lowering of Pr value with the incorporation of SBexT in the (1-ϕ) (NBT-BT)-ϕSBexT ceramic samples may be associated with the increase in number of cations [5]. In addition, the drastic decrease in Ec and Pr values accompanied by slightly pinched P–E hysteresis loops with the incorporation of higher content of SBexT in the (1-ϕ) (NBT-BT)-ϕSBexT ceramic samples may also be attributed to the introduction of non-polar and development of secondary phases [26]. For lower content of SBexT (ϕ= 2 and 4 wt. %), Td shifts towards RT. This shift in Td can cause the appearance of non-polar phase in these ceramics and the interactions between these polar and non-polar phases may give rise to the deformation of the P–E hysteresis loops [27-30]. Further, the ferroelectric P-E hysteresis loop analysis of the (1-ϕ)(NBT-BT)-ϕSBexT ceramic samples is in good agreement with its piezoelectric behavior. Pr and Ec values of all the (1-ϕ) (NBT-BT)-ϕSBexT ceramic samples are given in Table 6.9.
-60 -40 -20 0 20 40 60
-40
-30
-20
-10
0
10
20
30
40 (a)
-80 -60 -40 -20 0 20 40 60 80
-40
-30
-20
-10
0
10
20
30
40 (b)
-60 -40 -20 0 20 40 60-40
-30
-20
-10
0
10
20
30
40
(c)
-80 -60 -40 -20 0 20 40 60 80
-30
-20
-10
0
10
20
30 (d)
-80 -60 -40 -20 0 20 40 60 80-30
-20
-10
0
10
20
30
(e)
-80 -60 -40 -20 0 20 40 60 80
-12
-8
-4
0
4
8
12 (f)
Electric Field(kV/cm)
Pola
rizat
ion(
µC/c
m2 )
Fig. 6.11: P-E hysteresis loops of (1-ϕ) (NBT-BT)-ϕ SBexT ceramics with ϕ (in wt.%) = (a) 0, (b) 2, (c) 4, (d) 8, (e) 12 and (f) 16.

132
Table 6.9: Ferroelectric parameters of (1-ϕ) (NBT-BT)-ϕ SBexT (ϕ= 0, 2, 4, 8, 12, 16 wt.
%) ceramics.
(1-ϕ)(NBT-
BT)-ϕSBexT
ϕ = 0 wt. % ϕ = 2 wt.
%
ϕ = 4 wt.
%
ϕ = 8 wt.
%
ϕ = 12
wt. %
ϕ = 16
wt. %
Pr (µC/cm2) 31.71 1.88 3.02 3.47 3.84 2.20
Ec(kV/cm) 40.00 1.70 5.20 5.59 9.11 11.02
6.7.2 Ferroelectric Study of (1-ϕ) (NBT-KNN)-ϕ SBexT Ceramics
Fig. 6.12 shows the RT well-developed P–E hysteresis loops of all the (1-ϕ)
(NBT-KNN)-ϕ SBexT (ϕ= 0, 2, 4, 8, 12, 16 wt. %) ceramic composites. Leakage current
of a ferroelectric material plays a great impact on its ferroelectric behavior. Development
of slimmer P-E loops with the increase of ϕ content can be correlated with the decrease of
its leakage current. The ceramic composites with ϕ =16 wt. % have the lowest leakage
current in the (1-ϕ)(NBT-KNN)-ϕ SBexT sample. This can be attributed to the addition of
excess SBexT, that might have caused lattice defects which blocked electron transporting,
resulting in less electrical conductivity and in turn lower leakage [16]. This is in good
agreement with the lower coercive field as shown in Fig 6.12. Moreover, the observed
ferroelectric behavior can be attributed to the domain wall motion and structural
distortion of the oxygen octahedra in all the studied ceramics. The leakage current, Pr,
and Ec values of all the (1-ϕ)(NBT-KNN)-ϕSBexT ceramic composite samples are given
in Table 6.10.

133
-80 -60 -40 -20 0 20 40 60 80
-40
-20
0
20
40
Pola
rizat
ion(
µm/c
m2 )
Electric Field(kV/cm)
0 wt.% 2 wt.% 4 wt.% 8 wt.% 12 wt.% 16 wt.%
Fig. 6.12: P-E hysteresis loops of (1-ϕ) (NBT-KNN)-ϕSBexT (ϕ= 0, 2, 4, 8, 12, 16 wt. %) ceramics.
Table 6.10: Ferroelectric parameters of (1-ϕ) (NBT-KNN)-ϕ SBexT (ϕ= 0, 2, 4, 8, 12, 16
wt. %) ceramics.
(1-ϕ) (NBT-
KNN)-ϕSBexT
ϕ = 0 wt.
%
ϕ = 2 wt.
%
ϕ = 4 wt.
%
ϕ = 8 wt.
%
ϕ = 12
wt. %
ϕ = 16
wt. %
Pr (µC/cm2) 20.61 9.64 9.54 5.64 2.60 1.44
Ec(kV/cm) 19.90 27.63 25.68 24.49 18.26 10.80

134
6.8 Polarization Fatigue Study
6.8.1 Polarization Fatigue Study of (1-ϕ) (NBT-BT)-ϕSBexT Ceramics
The fatigue endurance study of the (1-ϕ)(NBT-BT)-ϕSBexT (ϕ= 0, 2, 4, 8, 12, 16 wt. %) ceramic composites was carried out at room temperature by using 105Hz bipolar triangular switching pulses. Fig. 6.13 shows the variation of normalized polarization vs. number of switching cycles (up to 109) of all the (1-ϕ) (NBT-BT)-ϕ SBexT ceramic composite samples. The switched polarization value in the positive and negative applied electric field cycles is denoted by P* and -P* (µC/cm2). The NBT-BT composition near MPB shows degradation of ~ 22.54% in their polarization behavior. From Fig. 6.13 plots, it is observed that the polarization degradation gradually decreases with the increase in SBexT content, which can be related to anti-fatigue behaviour of SBexT system. Since, polarization fatigue, which is related to the leakage current, obstructs the use of ferroelectric materials in memory applications. The studied polarization fatigue characteristics has also supported the leakage current behavior of (1-ϕ)(NBT-BT)-ϕSBexT ceramics. The relative polarization fatigue% values of all the (1-ϕ) (NBT-BT)-ϕSBexT ceramics after 109 switching cycles are listed in Table 6.11. The mechanisms of reduction of polarization fatigue with SBexT incorporation has already been discussed in the following 6.8.3 section.
Fig. 6.13: Normalized polarization vs. number of cycles plots of (1-ϕ) (NBT-BT)-ϕ SBexT (ϕ= 0, 2, 4, 8, 12, 16 wt. %) ceramics.

135
Table 6.11: Polarization fatigue of (1-ϕ) (NBT-BT)-ϕ SBexT (ϕ= 0, 2, 4, 8, 12, 16 wt %) ceramics.
(1-ϕ) (NBT-BT)-
ϕ SBexT
ϕ = 0
wt. %
ϕ = 2
wt. %
ϕ = 4
wt. %
ϕ = 8
wt. %
ϕ = 12
wt. %
ϕ = 16
wt. %
Relative polarization
fatigue %(109 cycle)
22.54 13.48 11.02 9.94 8.26 5.84
6.8.2 Polarization Fatigue Study of (1-ϕ)(NBT-KNN)-ϕSBexT Ceramics
Fig. 6.14 shows the RT polarization fatigue characteristics of the (1-ϕ)(NBT-
KNN)-ϕSBexT (ϕ= 0, 2, 4, 8, 12, 16 wt. %) ceramics at 10kHz bipolar triangular
switching pulses. Variation of normalized polarization vs. number of cycles (up to 109) of
all the (1-ϕ)(NBT-KNN)-ϕSBexT ceramic composites is shown in Fig. 6.14. The
switching polarizations are observed after 1, 300000, 1.5x10⁶, 1.17x10⁷, 1.11 x10⁸ and
1.23x10⁹ numbers of the applied electric field cycles. It is observed that the polarization
degradation gradually decreases with the increase of SBexT content in the (1-ϕ)(NBT-
KNN)-ϕSBexT ceramics. It is well known that the polarization fatigue of a ferroelectric
material is strongly related to its leakage current behavior i.e., lower the leakage current,
higher is the fatigue-free behavior in the material [31] This also explains the decrease of
polarization degradation with the increase of SBexT content in (1-ϕ)(NBT-KNN)-ϕSBexT
ceramics. In the ABO3 type of perovskite ferroelectric ceramics, formation of oxygen
vacancy types of defects is more pronounced [32]. Therefore, with the increase of SBexT
content in the (1-ϕ) (NBT-KNN)-ϕSBexT ceramics, the number of oxygen vacancies
decreases [19] and the polarization fatigue resistant increases. The detailed mechanism
has been explained in the following section.The relative polarization fatigue% values
after 109 cycles of all the (1-ϕ) (NBT-KNN)-ϕ SBexT ceramics are listed in Table 6.12.

136
10-1 100 101 102 103 104 105 106 107 108 109 1010
-1.0
-0.8
-0.6
0.6
0.8
1.0
-P*
P*No
rmali
zed P
olariz
ation
Switching Cycles(N)
0 wt.% 2 wt.% 4 wt.% 8 wt.% 12 wt.% 16 wt.%
Fig. 6.14: Normalized polarization vs. number of cycles plots of (1-ϕ) (NBT-KNN)-ϕ SBexT (ϕ= 0, 2, 4, 8, 12, 16 wt. %) ceramics.
Table 6.12: Polarization fatigue of (1-ϕ) (NBT-KNN)-ϕ SBexT (ϕ= 0, 2, 4, 8, 12, 16 wt %) ceramics.
(1-ϕ) (NBT-KNN)-ϕ
SBexT
ϕ = 0 wt.
%
ϕ = 2 wt.
%
ϕ = 4
wt. %
ϕ = 8
wt. %
ϕ = 12
wt. %
ϕ = 16
wt. %
Relative polarization
fatigue %(109 cycle)
30.57 11.57 6.0 4.98 1.66 1.05
6.8.3 Mechanism of Improvement of Electric Fatigue Endurance of the
(1-ϕ)(NBT-KNN)-ϕSBexT and (1-ϕ) (NBT-BT)-ϕSBexT Ceramics
The major contribution to polarization fatigue in normal perovskite ferroelectric
materials is related to the oxygen vacancies, created at high processing temperatures [33].
During reorientation of the domains, these oxygen vacancies are generally driven towards
domain walls or grain boundaries and captured by space charges [33]. This accumulation

137
of oxygen vacancies at the domain walls and/or at grain boundaries would lead to the
pinning of domain walls and development of depolarization field. The depolarization
field weakens the applied external electric field and results in effectively less
reorientation of domains, which is reflected in the decrease of remnant/saturation
polarization after repeated no. of electric field cycles and accounts the polarization
fatigue of the ferroelectric material. This type of phenomena is common in perovskite
phase ferroelectric systems. Whereas, in layered perovskite ferroelectrics such as in SBT,
a specific bismuth oxide layer (Bi2O2)2+ exists between the oxygen octahedron chains
(SrTa2O7)2- [34]. With this, the ferroelastic stress, caused by the reorientation of the
polarization under applied external electric field can be relieved. Moreover, due to the
large lattice space and weak ionic bonds in the (Bi2O2)2+ layers, the oxygen vacancies can
be accommodated in these layers, which restrict the piling of oxygen vacancies near the
domain walls [35]. Thus, a weaker depolarization field or less pinning of the domain
walls would be present, which accounts the better polarization fatigue endurance of the
layered perovskite ferroelectrics. This explains the improvement of polarization fatigue
endurance in the SBexT modified NBT-BT and NBT-KNN ceramics, respectively.

138
References
[1] K. Kotani, I. Kawayama, M. Tonouchi, Y. Hotta, H. Tabata, Dielectric and ferroelectric properties of c-axis oriented strontium bismuth tantalate thin films applied transverse electric fields, Journal of Applied Physics, 99 (2006) 124106. [2] N. Zhang, L. Li, B. Li, D. Guo, Z. Gui, Improvement of electric fatigue properties in PLZT ferroelectric ceramics due to SrBi2Ta2O9 incorporation, Materials Science and Engineering: B, 90 (2002) 185-190. [3] M.S. Anwar, A.A. Khan, K.Y. Park, S.R. Lee, F. Ahmed, B.H. Koo, Influence of Zn on magnetocaloric effect in (0.95)La0.7Sr0.3MnO3/Ni1−xZnxFe2O4 ceramic composites, Materials Research Bulletin, 69 (2015) 41-45. [4] I. Coondoo, N. Panwar, A.K. Jha, Effect of sintering temperature on the structural, dielectric and ferroelectric properties of tungsten substituted SBT ceramics, Physica B: Condensed Matter, 406 (2011) 374-381. [5] K. Ramam, M. Lopez, K. Chandramouli, Dielectric and piezoelectric studies of perovskite–tungsten bronze structured (1− x)PLZT–xPBBiN nanoceramic composites by high-energy mechanical activation technique, Journal of Alloys and Compounds, 488 (2009) 211-216. [6] L.A. Schmitt, J. Kling, M. Hinterstein, M. Hoelzel, W. Jo, H.J. Kleebe, H. Fuess, Structural investigations on lead-free Bi1/2Na1/2TiO3-based piezoceramics, J Mater Sci, 46 (2011) 4368-4376. [7] C.C. Wang, C.M. Lei, G.J. Wang, X.H. Sun, T. Li, S.G. Huang, H. Wang, Y.D. Li, Oxygen-vacancy-related dielectric relaxations in SrTiO3 at high temperatures, Journal of Applied Physics, 113 (2013) 094103. [8] J. S. Kim, B.C. Choi, J. H. Jeong, S. T. Chung, S. Cho, I. W. Kim, Low-Frequency Dielectric Dispersion and Impedance Spectroscopy of lead-free Na0.5Bi0.5TiO3(NBT) Ferroelectric Ceramics, Journal Korean Physical Society 55 (2009) 21. [9] S.N. Kumar, P. Kumar, D.K. Agrawal, Structural, dielectric and ferroelectric properties of SBN ceramics synthesized by microwave reactive sintering technique, Ceramics International, 38 (2012) 5243-5250. [10] S.K. Acharya, B.-G. Ahn, C.U. Jung, J.-H. Koh, I.-H. Choi, S.-K. Lee, Effect of Rb doping on ferroelectric and piezoelectric properties of Bi0.5Na0.5TiO3–BaTiO3 thin films, Journal of Alloys and Compounds, 603 (2014) 248-254. [11] J. Li, P. Li, J. Yu, Study on substitution effect of Bi4Ti3O12 ferroelectric thin films, in: I. Coondoo (Ed.) Ferroelectrics, In Tech, Croatia, 2010, pp. 119-138. [12] Q.-Y. Tang, Y.-M. Kan, Y.-G. Li, G.-J. Zhang, P.-L. Wang, Effect of vanadium doping on fabrication and property of Bi4Ti3O12 ceramics, Scripta materialia, 54 (2006) 2075-2080. [13] L. Zhang, J. Zhai, W. Mo, X. Yao, The dielectric and leakage current behavior of CoFe2O4-BaTiO3 composite films prepared by combining method of sol-gel and electrophoretic deposition, Solid State Sciences, 12 (2010) 509-514. [14] A. Mukherjee, P. Victor, J. Parui, S. Krupanidhi, Leakage current behavior in pulsed laser deposited Ba (Zr0.05Ti0.95)O3 thin films, Journal of applied physics, 101 (2007) 034106-034106-034106. [15] A.R. Chaudhuri, A. Laha, S.B. Krupanidhi, Enhanced ferroelectric properties of vanadium doped bismuth titanate (BTV) thin films grown by pulsed laser ablation technique, Solid State Communications, 133 (2005) 611-614. [16] J.X. Tang, M.H. Tang, J. Zhang, F. Yang, W.F. Zhao, H.Y. Xu, Z.H. Sun, Y.C. Zhou, V5+-doped Bi3.4Yb0.6Ti3O12 fatigue resistant ferroelectric thin films, Materials Letters, 62 (2008) 3189-3191. [17] T.P.-c. Juan, S.-m. Chen, J.Y.-m. Lee, Temperature dependence of the current conduction mechanisms in ferroelectric Pb(Zr0.53Ti0.47)O3 thin films, Journal of Applied Physics, 95 (2004) 3120-3125.

139
[18] S. Swain, P. Kumar, R.B. Choudhary, Electrical and ferroelectric studies of the 2-layered SrBi2Ta2O9 based ceramics, Physica B: Condensed Matter, 477 (2015) 56-63. [19] X. Tang, L. Hu, J. Yang, L. Chen, J. Dai, W. Song, Z. Yang, X. Zhu, Y. Sun, BiFeO3 thin films prepared on metallic Ni tapes by chemical solution deposition: effects of annealing temperature and a La0.5Sr0.5TiO3 buffer layer on the dielectric, ferroelectric and leakage properties, RSC Advances, 4 (2014) 32738-32743. [20] L. Pintilie, Charge Transport in Ferroelectric Thin Films, 2011. [21] S.-T. Chang, J.Y.-m. Lee, Electrical conduction mechanism in high-dielectric-constant (Ba0.5Sr0.5)TiO3 thin films, Applied Physics Letters, 80 (2002) 655-657. [22] W. Krauss, D. Schütz, M. Naderer, D. Orosel, K. Reichmann, BNT-based multilayer device with large and temperature-independent strain made by a water-based preparation process, Journal of the European Ceramic Society, 31 (2011) 1857-1860. [23] A. Ullah, C.W. Ahn, A. Hussain, S.Y. Lee, J.S. Kim, I.W. Kim, Effect of potassium concentration on the structure and electrical properties of lead-free Bi0.5(Na,K)0.5TiO3–BiAlO3 piezoelectric ceramics, Journal of Alloys and Compounds, 509 (2011) 3148-3154. [24] D. Fu, M. Endo, H. Taniguchi, T. Taniyama, S.-y. Koshihara, M. Itoh, Piezoelectric properties of lithium modified silver niobate perovskite single crystals, Applied Physics Letters, 92 (2008) 172905. [25] X. Zheng, J. Liu, J. Peng, X. Liu, Y. Gong, K. Zhou, D. Huang, Effect of potassium content on electrostrictive properties of Na0.5Bi0.5TiO3-based relaxor ferroelectric thin films with morphotropic phase boundary, Thin Solid Films, 548 (2013) 118-124. [26] J. Shi, H. Fan, X. Liu, A.J. Bell, Large Electrostrictive Strain in (Bi0.5Na0.5)TiO3–BaTiO3–(Sr0.7Bi0.2)TiO3 Solid Solutions, Journal of the American Ceramic Society, 97 (2014) 848-853. [27] Y.-Q. Yao, T.-Y. Tseng, C.-C. Chou, H.H.D. Chen, Phase transition and piezoelectric property of (Bi0.5Na0.5)0.94Ba0.06ZryTi1−yO3(y=0–0.04) ceramics, Journal of Applied Physics, 102 (2007) 094102. [28] D. Lin, K.W. Kwok, Effect of Li-substitution on piezoelectric and ferroelectric properties of (Bi0.92Na0.92−xLix)0.5Ba0.06Sr0.02TiO3 lead-free ceramics, Current Applied Physics, 10 (2010) 1196-1202. [29] F. Guifen, L. Wenzhong, W. Xiaohong, L. Fei, x. Jianzhong, Phase transition behavior and electromechanical properties of (Na1/2Bi1/2)TiO3–KNbO3 lead-free piezoelectric ceramics, Journal of Physics D: Applied Physics, 41 (2008) 035403. [30] Y. Hiruma, Y. Imai, Y. Watanabe, H. Nagata, T. Takenaka, Large electro strain near the phase transition temperature of (Bi0.5Na0.5)TiO3–SrTiO3 ferroelectric ceramics, Applied Physics Letters, 92 (2008) 262904. [31] H. Du, S. Wohlrab, S. Kaskel, Synthesis, Structure, and Properties of Bi3.25Pr0.75Ti2.97V0.03O12 Ferroelectric Ceramics, The Journal of Physical Chemistry C, 111 (2007) 11095-11103. [32] W.L. Warren, K. Vanheusden, D. Dimos, G.E. Pike, B.A. Tuttle, Oxygen Vacancy Motion in Perovskite Oxides, Journal of the American Ceramic Society, 79 (1996) 536-538. [33] W.L. Warren, D. Dimos, B.A. Tuttle, G.E. Pike, H.N. AlShareef, Relationships among ferroelectric fatigue, electronic charge trapping, defect-dipoles, and oxygen vacancies in perovskite oxides, Integr. Ferroelectr., 16 (1997) 77-86. [34] A.D. Rae, J.G. Thompson, R.L. Withers, Structure refinement of commensurately modulated bismuth strontium tantalate, Bi2SrTa2O9, Acta Crystallographica Section B, 48 (1992) 418-428. [35] N. Zhang, L. Li, Z. Gui, Improvement of electric fatigue properties in Pb0.94La0.04(Zr0.70Ti0.30)O3 ferroelectric capacitors due to SrBi2Nb2O9 incorporation, Materials Research Bulletin, 36 (2001) 2553-2562.

140
Chapter 7
Conclusions and Future Work In the present work, ferroelectric ceramics with NBT-xBT and NBT- xKNN
compositions showed an MPB at x=0.07. The ceramics with these compositions were observed to have excellent dielectric, piezoelectric, ferroelectric properties which could be helpful for various device applications. Leakage and polarization fatigue behaviour study is very important for realizing the utility of these materials in various device applications. For this purpose, in the present thesis work, leakage and polarization fatigue study of these systems are carried out and discussed in detail. Next objective of this work was to improve leakage and polarization fatigue behaviour of perovskite based systems. Based on literature, SBT, SBexT, and SBTW (bismuth layered structure ferroelectrics (BLSF) materials), naturally anti-fatigue with low leakage current behaviour, were selected and studied in detail. SBexT system was selected to further modify the leakage and polarization fatigue behaviour of MPB compositions of NBT-BT and NBT-KNN systems. For this purpose NBT-BT- SBexT and NBT-KNN- SBexT composite systems were synthesized and studied in detail. SBexT phase incorporated NBT-BT and NBT-KNN systems showed improved leakage current density and polarization fatigue behaviour. The major conclusions drawn from the present work and the scope of the related future work are given in this chapter.
7.1 Conclusions
7.1.1 NBT-xBT and NBT-xKNN Systems:
Solid solutions of (1-x)Na0.5Bi0.5TiO3-xBaTiO3 (x=0.05, 0.06, 0.07, 0.08) and (1-x)(Na0.5Bi0.5TiO3)-xK0.5Na0.5NbO3 (x=0.05, 0.06, 0.07, 0.08) ceramics near their respective MPBs were synthesized in single perovskite phase by solid-state reaction route.
In the NBT-xBT system, RT maximum values of Pr ~ 31.71μC/cm2, εr ~2275 (at 1 kHz frequency), d33 ~105pC/N, kp ~ 0.21 and field induced strain% ~ 0.45 were obtained in the x=0.07 composition.
In the NBT-xKNN system, RT maximum values of Pr ~ 20.61µC/cm2, εr ~ 2787 (at 1 kHz frequency), d33 ~78pC/N, kp ~ 0.12, and maximum induced strain% ~0.36 were obtained in the x=0.07 composition.

141
The minimum leakage current density ~5.72x10⁻⁷A/cm2 and ~1.04x10⁻⁶ A/cm2 were observed in the x=0.07 compositions of the NBT-xBT and NBT-xKNN systems, respectively.
Polarization fatigue study confirmed the polarization degradation after 107 cycles of all compositions of the NBT-xBT and NBT-xKNN systems.
7.1.2 SBT based Systems:
The 2-layered SrBi2Ta2O9/SBT, Sr0.8Bi2.15Ta2O9/SBexT, and SrBi2(Ta0.925W0.075)2O9/SBTW BLSF ceramics were successfully synthesized in single phase by the solid-state reaction route.
Plate-like grains morphology with maximum experimental density ~8.87 g/cc was observed in the SBexT ceramics, sintered at 1200oC/4hr.
Optimum εr ~1590 at 1 kHz frequency and highest Tc (398oC) were obtained in the SBexT ceramic samples.
RT lowest leakage current density ~3.14x10⁻⁹ A/cm2, maximum Pr ~ 8.07 µC/cm2
with minimum Ec ~ 15.18kV/cm were obtained in the SBexT ceramic samples. Polarization fatigue study confirmed negligible polarization degradation even
after 109 electric field cycles of all the SBT, SBexT and SBTW ceramics.
7.1.3 (1-ϕ)(NBT-BT)-ϕSBexT and (1-ϕ)(NBT-KNN)-ϕSBexT Ceramics:
(1-ϕ)(NBT-BT)-ϕ SBexT and (1-ϕ)(NBT-KNN)-ϕSBexT (ϕ= 0, 2, 4, 8, 12, 16 wt. %) ceramic composites were prepared by solid state reaction route.
XRD studies confirmed the co-existence of respective phases in both the systems. SEM study showed the growth of plate-like grains and the dielectric study showed
the decrease of εr and tanδ values with the increase of SBexT content in both the systems.
Room temperature leakage current density between 10-7 to 10-8 A/cm2 (which is one and two order less than that of the MPB compositions of the NBT-xBT and NBT-xKNN systems, respectively) was obtained in both the systems.
Reduction of maximum induced strain% with the increase of SBexT content was obtained in both the ceramic composite systems.
Improvement in leakage currents density, fatigue resistance, retention of high εr, Pr, d33 and kp values in ϕ ≤ 4wt. % ceramic composites of the (1-ϕ) (NBT-KNN)-ϕSBexT system suggested their usefulness in capacitor, piezoelectric and NVRAM applications.

142
7.2 Recommendations for Future Work
In the present work, (1-ϕ)(NBT-BT)-ϕSBexT and (1-ϕ)(NBT-KNN)-ϕSBexT ceramic composites were synthesized by solid state reaction route and studied for various structural and electrical properties. Following recommendations are made for the extension of the present work:
Thin films and nanoceramics of the best compositions of the (1-ϕ)(NBT-BT)-ϕSBexT and (1-ϕ)(NBT-KNN)-ϕSBexT systems can be synthesized and studied for various structural and electrical properties.
For proper understanding of the grain and grain boundary effects in the (1-ϕ)(NBT-BT)-ϕSBexT and (1-ϕ)(NBT-KNN)-ϕSBexT ceramic composites, impedance spectroscopic studies can be done.
Temperature variation of J-E and P-E loop studies can be carried out to understand the different conduction and FE-AFE transition mechanisms.
Fatigue characteristics of the (1-ϕ)(NBT-BT)-ϕSBexT and (1-ϕ)(NBT-KNN)-ϕSBexT ceramics at different frequency of the applied electric field can be carried out.
For proper understanding of the polarization degradation mechanism, the dielectric, piezoelectric and P-E hysteresis loop studies of the best compositions can be carried out after repeated number of electric field cycles.
*************

143
Bio-Data of the Author
Name: Sridevi Swain D.O.B.: 01-07-1985 Educational Qualification:
Secondary Education: Jawahar Navodaya Vidyalaya Sarang, Dhenkanal Intermediate: Jawahar Navodaya Vidyalaya Sarang, Dhenkanal Int. B.Sc. & B. Ed: Regional Institute of Education Bhubaneswar M.Sc. in Physics: National Institute of Technology Rourkela Ph.D. in Physics: National Institute of Technology Rourkela
Publications: 1. S. Swain, P. Kumar, D. K. Agrawal, Sonia, Dielectric and ferroelectric study of KNN modified NBT ceramics synthesized by microwave processing technique, Ceramics International 39 (2013) 3205–3210. 2. S. Swain, P. Kumar, Dielectric, ferroelectric and bipolar electric field induced strain properties of MPB composition of NBT-xKNN system, Journal of Electroceramics 32 1 (2014) 102-107. 3. S. K. Kar, S. Swain, Sonia, P. Kumar, High dielectric constant and low optical band gap studies of La-modified Ba(Fe
0.5Nb
0.5)O
3 ceramics, Materials Chemistry and Physics 155 (2015)
171-177. 4. S. Swain, S. K. Kar, P. Kumar, Dielectric, Optical, Piezoelectric and Ferroelectric Studies of NBT-BT Ceramics near MPB, Ceramics International 41 (2015) 10710–10717. 5. S. Swain, P. Kumar, R. B. Choudhary, Electrical and Ferroelectric Studies of the 2-Layered SrBi
2Ta
2O
9 based Ceramics, Physica B: Condensed Matter 477 (2015) 56–63.
6. S. Swain, P. Kumar, Structural, Dielectric and Ferroelectric Study of (1-ϕ)(NBT-KNN)-ϕSB
exT Ceramics, Journal of Physics and Chemistry of Solids 98 (2016) 59-64.
7. S. Swain, P. Kumar, Synthesis and Characterizations of (1-ϕ)(NBT-BT)-ϕSBex
T Ceramics for
NVRAM Applications, Current Applied Physics 16 (2016) 1105-1112. 8. S. Swain, P. Kumar, Optical, Piezoelectric, Polarization Fatigue and Leakage Current Studies
of the NBT-KNN Ceramics near MPB (Communicated).
Permanent Address: D/O Rabi Narayan Swain Surapratap pur (Vill./PO) Dhenkanal (Dist.) 759024, Odisha, India
Copyright © 2022 FDOKUMEN