
Synthesis and characterization of fluorophore-absorber pairs for sensing of ammonia based on...
10
Synthesis and characterization of fluorophore-absorber pairs for sensing of ammonia based on fluorescence Gerhard J. Mohr a,* , Sonja Draxler b , Karolina Trznadel b , Frank Lehmann c , Max E. Lippitsch b a Center for Chemical Sensors, ETH Technopark, Technopark St. 1, CH-8005 Zurich, Switzerland b Institute for Experimental Physics, Karl-Franzens University, Universita ¨tsplatz 5, A-8010 Graz, Austria c Institute for Physical Chemistry, Friedrich-Schiller University, Lessing St. 10, D-07743 Jena, Germany Received 30 June 1997; received in revised form 14 November 1997; accepted 23 November 1997 Abstract A new and simple preparation procedure for fluorophore absorber pairs which enable optical sensing of ammonia is reported. In ion pairs formed between organoruthenium complexes (fluorophore) and triphenylmethane dyes (absorber), a deprotonation of the absorber leads to an absorbance band which overlaps the emission of the fluorophore whereby both the fluorescence intensity and the fluorescence lifetime of the fluorophore are altered. Dissolving these ion pairs in polymer materials such as poly (vinyl chloride) or porous glass obtained by the sol–gel process results in membranes which respond to ammonia. Plasticized PVC membranes containing the fluorophore-absorber pair and coated with a PTFE layer allow a continuous assay of dissolved ammonia in the range of 0.01 to 25 mg l 1 . Membranes composed of the ion pair dissolved in a sol–gel-based glass and coated with PTFE respond to ammonia with a similar sensitive range and a limit of detection of 0.01 mg l 1 . # 1998 Elsevier Science B.V. Keywords: Ammonia; Optical sensors; Ion pairs; Liquid polymeric membranes 1. Introduction In the last decade, a wide range of optical sensors for gaseous species has been presented [1]. They are generally based on the incorporation of pH-sensitive dyes in a polymer matrix. On exposure to acidic or basic gases, protonation or deprotonation of the dyes occurs and, consequently, they change their optical properties. [2–7] This approach has also been applied to the measure- ment of gaseous analytes via fluorescence lifetime. Sensors for carbon dioxide have been presented where energy is transferred from a pH-insensitive donor to a pH-sensitive acceptor molecule [8,9]. In a similar approach, a sensor composed of tetramethylrhoda- mine ethylester and bromophenol blue shows signifi- cant changes of fluorescence intensity on exposure to ammonia [10]. Recently, Lakowicz et al. [11] have presented a lifetime-based sensor for ammonia, which is composed of sulforhodamine 101 and bromocresol green incorporated in plasticized ethylcellulose. Analytica Chimica Acta 360 (1998) 119–128 *Corresponding author. Fax: +41 1 445 1233; E-mail: gerhard@chemsens. pharma. ethz. ch/Homepage: http:// www.chemsens.ethz.ch 0003-2670/98/$19.00 # 1998 Elsevier Science B.V. All rights reserved. PII S0003-2670(97)00697-1
Transcript of Synthesis and characterization of fluorophore-absorber pairs for sensing of ammonia based on...

Synthesis and characterization of ¯uorophore-absorber pairs forsensing of ammonia based on ¯uorescence
Gerhard J. Mohra,*, Sonja Draxlerb, Karolina Trznadelb, Frank Lehmannc, Max E. Lippitschb
a Center for Chemical Sensors, ETH Technopark, Technopark St. 1, CH-8005 Zurich, Switzerlandb Institute for Experimental Physics, Karl-Franzens University, UniversitaÈtsplatz 5, A-8010 Graz, Austriac Institute for Physical Chemistry, Friedrich-Schiller University, Lessing St. 10, D-07743 Jena, Germany
Received 30 June 1997; received in revised form 14 November 1997; accepted 23 November 1997
Abstract
A new and simple preparation procedure for ¯uorophore absorber pairs which enable optical sensing of ammonia is reported.
In ion pairs formed between organoruthenium complexes (¯uorophore) and triphenylmethane dyes (absorber), a deprotonation
of the absorber leads to an absorbance band which overlaps the emission of the ¯uorophore whereby both the ¯uorescence
intensity and the ¯uorescence lifetime of the ¯uorophore are altered. Dissolving these ion pairs in polymer materials such as
poly (vinyl chloride) or porous glass obtained by the sol±gel process results in membranes which respond to ammonia.
Plasticized PVC membranes containing the ¯uorophore-absorber pair and coated with a PTFE layer allow a continuous assay
of dissolved ammonia in the range of 0.01 to 25 mg lÿ1. Membranes composed of the ion pair dissolved in a sol±gel-based
glass and coated with PTFE respond to ammonia with a similar sensitive range and a limit of detection of 0.01 mg lÿ1. #1998 Elsevier Science B.V.
Keywords: Ammonia; Optical sensors; Ion pairs; Liquid polymeric membranes
1. Introduction
In the last decade, a wide range of optical sensors
for gaseous species has been presented [1]. They are
generally based on the incorporation of pH-sensitive
dyes in a polymer matrix. On exposure to acidic or
basic gases, protonation or deprotonation of the dyes
occurs and, consequently, they change their optical
properties. [2±7]
This approach has also been applied to the measure-
ment of gaseous analytes via ¯uorescence lifetime.
Sensors for carbon dioxide have been presented where
energy is transferred from a pH-insensitive donor to a
pH-sensitive acceptor molecule [8,9]. In a similar
approach, a sensor composed of tetramethylrhoda-
mine ethylester and bromophenol blue shows signi®-
cant changes of ¯uorescence intensity on exposure to
ammonia [10]. Recently, Lakowicz et al. [11] have
presented a lifetime-based sensor for ammonia, which
is composed of sulforhodamine 101 and bromocresol
green incorporated in plasticized ethylcellulose.
Analytica Chimica Acta 360 (1998) 119±128
*Corresponding author. Fax: +41 1 445 1233; E-mail:
gerhard@chemsens. pharma. ethz. ch/Homepage: http://
www.chemsens.ethz.ch
0003-2670/98/$19.00 # 1998 Elsevier Science B.V. All rights reserved.
P I I S 0 0 0 3 - 2 6 7 0 ( 9 7 ) 0 0 6 9 7 - 1

In order to provide ammonia sensors with longer
¯uorescence lifetimes (in the range of ms rather than
ns), larger Stokes shift and ¯uorescence emission at
longer wavelengths, we have prepared ion pairs from
bromophenol blue and organoruthenium complexes.
The resulting ion pairs were incorporated in plasti-
cized PVC and sol±gel membranes and characterized
in terms of sensitivity, limits of detection and
response.
2. Experimental
2.1. Reagents
Ruthenium (III) chloride trihydrate and 4,7-diphe-
nyl-1,10-phenanthroline (dpp) were obtained from
Alpha Products (Karlsruhe, Germany) and ruthenium
(II)-tris-(2,20-bipyridyl) dichloride from Aldrich
(Steinheim, Germany). Bromophenol blue (BPB),
tetramethoxysilane (TMOS), phenyltrimethoxysilane
(PhTMOS), poly (vinyl chloride) (PVC, high mole-
cular weight), bis-(2-ethylhexyl) sebacate (DOS),
ethanol and tetrahydrofuran (THF) were obtained
from Fluka AG (Buchs, Switzerland). The synthesis
of o-cyanophenyloctylether (CPOE) has already been
described in detail [12]. The gas permeable micro-
porous PTFE membrane of 12 mm thickness was
obtained from Baumax (Graz, Austria). The gas
impermeable transparent polyester support (MylarTM,
type GA-10, 175 mm) was obtained from Du Pont de
Nemours, Brussels. Buffer components were of ana-
lytical grade (Fluka AG). Double distilled water was
used throughout. Ammonia solutions were prepared
by dissolving ammonium chloride in air-saturated
phosphate buffer of pH 6.8. The concentration of free
ammonia was calculated with the Henderson±Hassel-
balch equation which, at pH 6.8 and 258C, is
log�NH3� � log�NH�4 � ÿ 2:44 (1)
2.2. Synthesis of ion pairs
2.2.1. Ruthenium (II)-tris-(2,20-bipyridyl)-bis-
bromophenolblue ion pair [Ru (biby)3 (BPB)2]
A solution of ruthenium (II)-tris-(2,20-bipyridyl)
dichloride (0.1 g) in 50 ml of water was added to
0.21 g of the sodium salt of bromophenol blue in
100 ml of water. The resulting precipitate was stirred
for 2 h, centrifuged at 4000 rpm, washed twice with
0.01 M hydrochloric acid and dried over calcium
chloride.
Calculated/found for C68H42Br8N6O10S2Ru�2H2O (1943.5): C, 42.02/41.92; H, 2.39/2.04; N,
4.32/4.06.
2.2.2. Ruthenium (II)-tris-(4,7-diphenyl-1,10-
phenanthroline)-bis-bromophenolblue ion
pair [Ru (dpp)3 (BPB)2]
A solution of ruthenium (II)-tris-(4,7-diphenyl-
1,10-phenanthroline) dichloride (0.16 g) [13] in
150 ml of 30% aqueous acetone was added to 0.2 g
of the sodium salt of bromophenol blue in 150 ml of
30% aqueous acetone. The resulting precipitate was
stirred for 2 h, centrifuged at 4000 rpm, washed twice
with 0.01 M hydrochloric acid and dried over calcium
chloride.
Calculated/found for C110H66Br8N6O10S2Ru
(2436.2): C, 54.23/54.31; H, 2.73/2.55; N, 3.45/3.32.
2.3. Membrane preparation
M1 and M2: 1.5 mg of Ru (dpp)3 (BPB)2 are
dissolved in a mixture of 120 mg PVC and 240 mg
plasticizer (CPOE or DOS, respectively) in 1.5 ml of
THF. 0.1 ml of the solution is spread onto a Mylar foil
by a home made coating device resulting in mem-
branes of a thickness of �1 to 3 mm. Then, a PTFE
layer is mechanically ®xed on the plasticized PVC
membrane in order to protect from cross-sensitivity to
pH. The resulting sensor membranes were conditioned
in plain buffer for 3 h in order to minimize effects of
swelling on the response which are caused by water
uptake.
M3: 10 mg of Ru (biby)3 (BPB)2 are dissolved in a
mixture of 2.5 ml of 96% ethanol, 1 ml of TMOS and
1 ml of PhTMOS. After addition of 0.5 ml of 0.1 M
hydrochloric acid, sol±gel formation is started. The
reaction mixture is kept in dark for 1 week. Then, 5 ml
of the solution is spread on 12�15 mm glass platelets
and the resulting membranes stored in dark for 2
weeks. Before measurements, the sol±gel membranes
are additionally coated with a thin PTFE layer and
conditioned for 2 h in plain buffer.
120 G.J. Mohr et al. / Analytica Chimica Acta 360 (1998) 119±128

2.4. Apparatus
Fluorescence excitation and emission spectra as
well as response curves of the sensing membranes
were measured on a RF-5001PC spectro¯uorimeter
(Shimadzu, Kyoto, Japan). Response curves were
recorded by placing the membranes in a ¯ow-through
cell to form one wall of the cell. Excitation light hit the
sensor membrane from outside (after passing the
polyester support) and ¯uorescence is detected at an
angle of 558 relative to the incident light beam. In
order to measure the response to the analytes, buffers
containing the analyte and adjusted to a de®ned pH
value were pumped through a ¯ow-through cell using
a peristaltic pump (Minipuls 3, Gilson, Villiers-le-Bel,
France). Absorbance spectra were run on a UV-2101-
PC photometer (Shimadzu, Kyoto, Japan). pH mea-
surements were performed with a pH meter (Metrohm,
Buchs, Switzerland) calibrated with Aldrich pH stan-
dards of pH 7.00, 4.00 and 10.00. All experiments
were performed at 23�28C. In order to determine the
decay times of the ion pairs in solution, 10 mM
ethanolic solutions were prepared. For the determina-
tion of the quantum yields of the ion pairs in solution,
ethanolic solutions with an absorbance of approxi-
mately 0.05 at the excitation wavelength were pre-
pared. The luminescence quantum yields were
determined relatively to rhodamine 6G. In order to
obtain the protonated and deprotonated forms, 5 ml of
tri¯uoroacetic acid or of triethanolamine were added
to 2 ml of the ion pair solution.
Fluorescence lifetimes were measured using a nitro-
gen laser (wavelength 337 nm, pulse duration 300 ps,
pulse energy�100 mJ) as the excitation source. The
emission was ®ltered with a Schott OG 610 (3 mm)
long pass ®lter to prevent excitation light from reach-
ing the detector. A Hamamatsu H 5783-01 miniature
photomultiplier (rise/fall time 600 ps) was used as the
detector. The decay was monitored by a Tektronix
DSA 601A digital signal analyzer (bandwidth 1 GHz).
The (in fact non-exponential) decay function was
modeled by a sum of exponentials and a pre-expo-
nential weighted mean lifetime [14] was calculated.
2.5. Sensing mechanism
Ammonia is determined by making use of a pH
indicator dye embedded either in sol±gel based glass
or in plasticized PVC. When exposed to an aqueous
sample containing ammonia, the latter diffuses
through a proton impermeable microporous PTFE
layer into the sensor membrane to deprotonate the
indicator according to:
dyeÿOH� NH3 , dyeÿOÿ � NH4�
�yellow� �blue�Due to the overlap of the emission of Ru �biby�2�3 and
Ru �dpp�2�3 with the absorbance of the deprotonated
form of BPP, excitation energy transfer occurs. A
deprotonation of BPB, therefore, results in a decrease
in ¯uorescence intensity and lifetime of the organo-
ruthenium complexes. As shown already for the ion
pairs in solution, this is not, however, the only con-
tribution to the observed change in ¯uorescence (see
Section 3.1).
3. Results
3.1. Choice of indicator dyes
Cationic organoruthenium complexes are well-
known for their large Stokes shift, compatibility to
the blue light emitting diode (LED) and long ¯uor-
escence lifetime. These properties not only make them
valuable components for sensors but also for biochem-
ical and biological applications. Complexes of ruthe-
nium (II) with bipyridyl, phenanthroline or 4,7-
diphenyl-(1,10-phenanthroline) have been used to
measure oxygen via ¯uorescence quenching [15]
and they are used to label biomolecules [16]. In order
to be applied in sensor membranes, the complexes
have to be soluble in organic polymer matrices. Kli-
mant et al. [15] have obtained lipophilic polymer-
soluble organoruthenium complexes by ion pairing
with lipophilic alkylsulfonates. We pursued a similar
approach, however, instead of using optically inert
compounds, we used triphenylmethane dyes for ion
pairing (Fig. 1). The selection of triphenylmethane
dyes (here: bromophenol blue, BPB) is based on the
criteria of longwave absorbance, appropriate dissocia-
tion behavior, photochemical stability and they have
sulfo groups which allow ion pairing with cationic
dyes. In order to make triphenylmethane dyes poly-
mer-soluble, the alkali ion was exchanged by the
reaction with organoruthenium dichlorides to form
G.J. Mohr et al. / Analytica Chimica Acta 360 (1998) 119±128 121

ion pairs according to:
2Dye-SOÿ3 Na� � Ru �org�2�2Clÿ
! Ru �org�2��Dye-SOÿ3 �2 � 2NaCl
The ruthenium bipyridyl complex with BPB is
soluble in polar solvents such as alcohols. The use
of lipophilic ruthenium (II)-tris-(4,7-diphenyl-1,10-
phenanthroline) dichloride results in ion pairs with
solubility in non-polar solvents such as tetrahydro-
furan and chloroform.
In ethanolic solution the absorbance spectra of the
ion pairs represent the combination of the absorbance
spectra of the ruthenium complexes with bromophenol
blue. In contrast, the ¯uorescence spectra very closely
resemble the spectra of the respective ruthenium
complexes with inorganic counterions (chloride or
perchlorate). The quantum yields and the ¯uorescence
decays, however, are remarkably different. In Table 1
the pre-exponential weighted decay times and quan-
tum yields of the two ion pairs in ethanolic solution are
compared to the ruthenium complexes with inorganic
Fig. 1. Chemical structures of Ru (biby)3 (BPB)2 and Ru (dpp)3 (BPB)2.
122 G.J. Mohr et al. / Analytica Chimica Acta 360 (1998) 119±128

counterions (see also [17]). The BPB ion pairs have a
much lower quantum yield and their decay is not a
single exponential, when both BPB was in its proto-
nated or in its deprotonated form.
Exposure of the ion pairs to alkalines leads to a
deprotonation of BPB. This was tested by adding
triethanolamine to the ethanolic solutions. The absor-
bance band of the deprotonated BPB overlapped with
the emission band of the ¯uorophore. On deprotona-
tion of BPB, the ¯uorescence spectrum of the organo-
ruthenium complexes did not change, but both the
¯uorescence quantum yield and the decay time were
reduced (see Table 1). This may be indicative of
radiationless excited-state energy transfer between
the ¯uorophore and the deprotonated indicator.
3.2. Choice of polymers
Due to the lipophilicity of the ion pairs, they may
be dissolved in polymers such as plasticized
poly (vinyl chloride) or poly (vinyl acetate), ethylcel-
lulose and sol±gels. Probably the best known
material for ion selective electrodes and optodes is
plasticized PVC. It forms fairly stable sensor layers
and acts as a good solvent for both lipophilic indicator
dyes and ion exchangers or selective ion carriers. The
mechanical stability is low and a large fraction of
plasticizer (usually 33% PVC, 66% plasticizer and 1%
additives) is required to obtain fast and stable
response. Two plasticizers have been investigated
in detail, namely non-polar DOS and polar CPOE.
CPOE is an analogue compound to o-nitrophenyl-
octylether (NPOE) both in lipophilicity and polarity.
However, a tremendous advantage of CPOE is the
fact that, opposite to NPOE, it does not quench
¯uorescence [12].
Porous glasses obtained by the sol±gel process are
the preferred matrix materials for ®ber optical sensors
because of their high permeability for gases and ions,
good optical transparency and because they are not
subject to signi®cant swelling. Sol±gel-based glasses
are chemically rather inert and exhibit good adhesion
to glass (the support used in M3) but recent investiga-
tions of organomodi®ed sol±gel materials have also
shown good adhesion of these materials to polymer
supports such as polyester.
Both materials, namely membranes based on sol±
gel glasses and plasticized PVC are ion-permeable and
respond to changes of pH by a deprotonation of the
absorber and an alteration in the ¯uorescence. At the
pH of the sample solutions (pH 6.8), the absorber is
already fully deprotonated and does not respond to
ammonia. Therefore, gas sensors based on plasticized
PVC and sol±gels have to be coated with an ion-
impermeable layer (PTFE) in order to prevent cross-
sensitivity to ionic species. Due to the PTFE layer,
exposure to pH 6.8 does not result in deprotonation of
the absorber in the sensor membrane. Consequently,
the dye responds to different concentrations of ammo-
nia present in the buffer solution but does not respond
to pH. PTFE coatings additionally provide an optical
isolation against interfering ambient light.
Table 1
Excitation and emission maxima (in nm), quantum yields and fluorescence lifetimes (in ms) of the ion pairs dissolved in ethanol with and
without added triethanolamine (TEA) and comparison with the organoruthenium complexes with inorganic counterions (chloride or
perchlorate) in ethanol
Ru (bipy)3 (BPB)2 Ru (dpp)3(BPB)2 Ru (bipy)3Cl2 Ru (dpp)3 (ClO4)2
Exc./em. max. 456/605 466/608 452/628 460/610
Quantum yield (N2 saturated) 0.017 0.167 0.042 0.32
Quantum yield (air saturated) 0.005 0.012 0.014 0.016
Decay time (N2 saturated) 0.328 2.83 0.714 5.20
Decay time (air saturated) 0.157 0.215 0.245 0.257
Quantum yield (with TEA, N2) ca. 0.002 0.068 ± ±
Quantum yield (with TEA, air) ca. 0.001 ca. 0.002 ± ±
Decay time (with TEA, N2) 0.246 1.59 ± ±
Decay time (with TEA, air) 0.147 0.174 ± ±
G.J. Mohr et al. / Analytica Chimica Acta 360 (1998) 119±128 123

3.3. Sensor characteristics
3.3.1. Sensor membrane M1
The spectra of M1 on exposure to different con-
centrations of ammonia are shown in Fig. 2. There is a
signi®cant decrease in ¯uorescence of the ruthenium-
based ¯uorophore in the spectral range of the depro-
tonated band of BPB (at 610 nm). The partial spectral
overlap of the absorber with the ¯uorophore results in
the formation of a shoulder at around 600 nm. The
decrease in the relative signal of M1 in going from 0 to
25 mg lÿ1 ammonia is as high as 60%. The limit of
detection is 0.01 mg lÿ1. The forward response time
(for 95% of the total signal change to occur) of M1 is
5±10 min, while the reverse response time is 15±
20 min (Fig. 3). The relative standard deviation for
0.1 mg lÿ1 and 1.0 mg lÿ1 ammonia (n�6) was deter-
mined to be 1.24 and 1.56%, respectively.
The absorbance spectra of M1 (without protective
PTFE layer) show that there is a full deprotonation of
the absorber on exposure to plain buffer of pH 6.8 after
15 min. There is no further increase in absorbance on
exposure to buffer containing 10 mg lÿ1 ammonia or
on exposure to 0.1 M sodium hydroxide solution. This
proves that the sensor membrane is pH-sensitive and
can only be operated with the ion impermeable PTFE
layer.
During absorbance measurements with
plasticized PVC, a signi®cant swelling of the sensor
layers was observed which appeared as a hyperchro-
mism of the whole spectrum. This behavior also
affected ¯uorescence measurements in that a drift
of the ¯uorescence signal to higher values by 1±2%
per hour was observed during the initial stage of the
measurements. It is caused by the water uptake of the
sensor membranes due to diffusion of water vapor
through the PTFE coating and should be minimized by
conditioning in plain buffer for 3±5 h. Swelling might
be also minimized by using a lower content of plas-
ticizer.
3.3.2. Sensor membrane M2
The ¯uorescence spectra of M2 are signi®cantly
different from M1. The plain membrane exhibits a
maximum at 590 nm. On exposure to ammonia, the
¯uorescence at 590 nm is decreased and a new max-
imum at 635 nm is formed, with an isosbestic point at
615 nm (Fig. 4). In addition, the sensitivity toward
ammonia is smaller than in the case of M1. The
decrease in the relative signal of M2 in going from
0 to 25 mg lÿ1 ammonia is as high as 50%. The limit of
detection is 0.1 mg lÿ1. The response times of M2 are
somewhat higher than those of M1 in that the forward
response time is 10±15 min, while the reverse
response time is 25±30 min.
The absorbance behavior of M2 is comparable to
M1 in that it is pH-sensitive and upon exposure to
plain buffer of pH 6.8 deprotonation of BPB occurs.
However, the response time is much slower and it
Fig. 2. Fluorescence emission spectra of M1 on exposure to (a)
plain 66 mM phosphate buffer; (b) 0.1 mg lÿ1 ammonia; (c)
1.0 mg lÿ1 ammonia; and (d) 10 mg lÿ1 ammonia, all at pH 6.8;
and corresponding absorbance spectra of M1 (without PTFE layer)
on exposure to (e) pH 6.8 and (f) pH 1.0.
Fig. 3. Response time, reversibility and relative signal change of
sensor membrane M1 on exposure to (a) plain 66 mM phosphate
buffer; (b) 0.1 mg lÿ1 ammonia; (c) 1.0 mg lÿ1 ammonia; and (d)
10.0 mg lÿ1 ammonia, all at pH 6.8. Excitation and emission
wavelengths were set to 475 and 600 nm, respectively.
124 G.J. Mohr et al. / Analytica Chimica Acta 360 (1998) 119±128

takes 6 h until equilibrium is reached. Again, addition
of buffer containing 10 mg lÿ1 ammonia or 0.1 M
sodium hydroxide solution does not further change
the absorbance. These ®ndings are in agreement with a
recent investigation of pH indicator dyes in plasticized
PVC [12]. It was shown that the polarity of the
plasticizer affects the dissociation of the indicator.
Highly polar plasticizers such as CPOE enable the
formation of a deprotonated and, therefore, negatively
charged species in the polymer matrix. Non-polar
plasticizers such as DOS, in contrast, are less able
to solvate the deprotonated form of the ion pair
because there is a serious dielectric constraint to
deprotonation in the non-polar polymer matrix. This
effect is very important for the reversibility of the
membrane because without this dielectric constraint,
deprotonation of the ion pair in the membrane would
be irreversible.
The absorbance measurements also showed the
good stability of the ion pairs in plasticized PVC.
M2 without PTFE did not show signi®cant leaching
during 20 h of continuous exposure to buffer of pH 6.8
at a ¯ow rate of 1.5 ml minÿ1. A similar behavior was
observed for M1. These ®ndings suggest the use of Ru
(dpp)3 (BPB)2 and related ion pairs in combination
with carriers such as valinomycin, nonactin, organotin
compounds and metalloporphyrins for both cation
and anion sensing based on ion-exchange or co-extrac-
tion.
3.3.3. Sensor membrane M3
The spectra of M3 on exposure to different con-
centrations of ammonia are shown in Fig. 5. Similar to
M1, the partial spectral overlap of the absorber with
the ¯uorophore results in the formation of a shoulder
at around 580 nm. The decrease in the relative signal
of M1 in going from 0 to 25 mg lÿ1 ammonia is as
high as 65%. The limit of detection is 0.01 mg lÿ1.
The forward response time (for 95% of the total signal
change to occur) of M1 is 10±15 min, while even after
2 h no full reversion of the ¯uorescence signal was
obtained. This is in agreement with the above ®ndings,
because the sol±gel material is signi®cantly more
Fig. 5. Fluorescence emission spectra of M3 on exposure to (a)
plain 66 mM phosphate buffer; (b), 0.1 mg lÿ1 ammonia; (c)
1.0 mg lÿ1 ammonia; and (d) 10.0 mg lÿ1 ammonia, all at pH 6.8;
and corresponding absorbance spectra of M3 (without PTFE layer)
on exposure to (e) pH 1.0 and (f) pH 6.8.
Fig. 6. Work functions of sensor membranes M1, M2 and M3 on
exposure to aqueous ammonia at pH 6.8.
Fig. 4. Fluorescence emission spectra of M2 on exposure to (a)
plain 66 mM phosphate buffer; (b) 0.1 mg lÿ1 ammonia; (c)
1.0 mg lÿ1 ammonia; and (d) 10.0 mg lÿ1 ammonia, all at pH
6.8; and corresponding absorbance spectra of M2 (without PTFE
layer) on exposure to (e) pH 1.0 and (f) pH 6.8.
G.J. Mohr et al. / Analytica Chimica Acta 360 (1998) 119±128 125
hydrophilic than plasticized PVC. Consequently, there
is no dielectric constraint for the deprotonated form of
the ion pair and the charged ion pair is stabilized in the
sol±gel matrix. However, recent ®ndings have shown
that by increasing the content of the organomodi®ed
educts for the sol±gel process, the reverse response
can be improved [10].
Sol±gel-based materials behave differently to plas-
ticized PVC in that, due to the rigid structure, almost
no swelling is observed. Therefore a drift similar to
M1 and M2 was not found. However, the sensor
membrane without protective PTFE layer is respon-
sive to pH. Again, the response to pH is very slow and
full deprotonation of the dye in the sol±gel layer takes
more than 30 h. Consequently, M3 may also be oper-
ated without a PTFE coating as a probe for ammonia
because the response to ammonia is much faster than
the response to changes of pH. The time for a steady-
state signal on exposure to ammonia is 20 min. Expo-
sure to plain buffer for 20 min equals a signal of
0.025 mg lÿ1 ammonia, therefore, higher concentra-
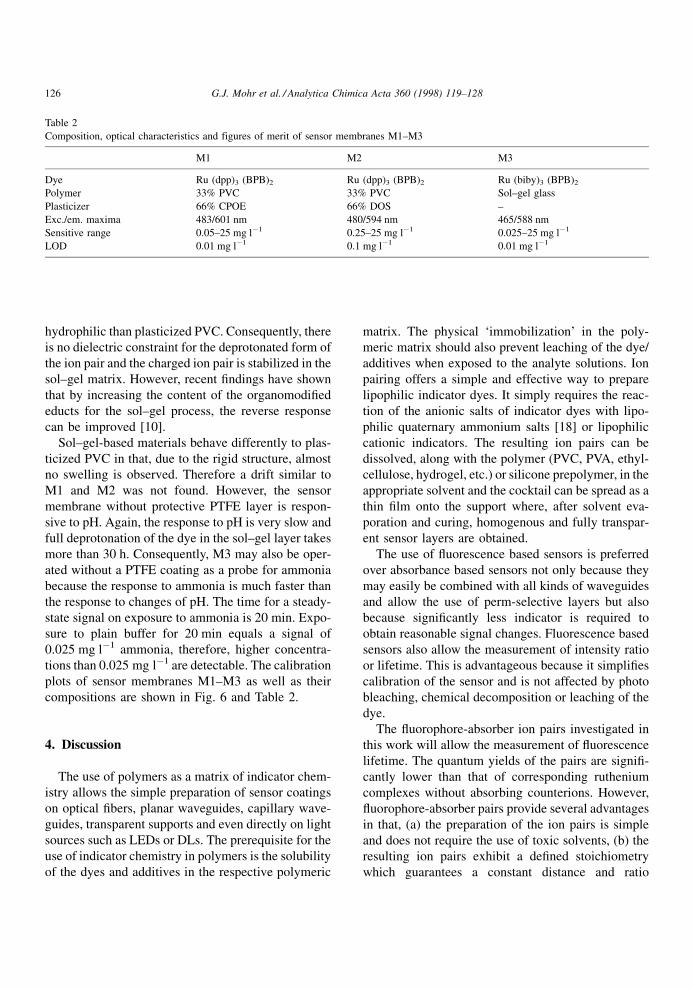
tions than 0.025 mg lÿ1 are detectable. The calibration
plots of sensor membranes M1±M3 as well as their
compositions are shown in Fig. 6 and Table 2.
4. Discussion
The use of polymers as a matrix of indicator chem-
istry allows the simple preparation of sensor coatings
on optical ®bers, planar waveguides, capillary wave-
guides, transparent supports and even directly on light
sources such as LEDs or DLs. The prerequisite for the
use of indicator chemistry in polymers is the solubility
of the dyes and additives in the respective polymeric
matrix. The physical `immobilization' in the poly-
meric matrix should also prevent leaching of the dye/
additives when exposed to the analyte solutions. Ion
pairing offers a simple and effective way to prepare
lipophilic indicator dyes. It simply requires the reac-
tion of the anionic salts of indicator dyes with lipo-
philic quaternary ammonium salts [18] or lipophilic
cationic indicators. The resulting ion pairs can be
dissolved, along with the polymer (PVC, PVA, ethyl-
cellulose, hydrogel, etc.) or silicone prepolymer, in the
appropriate solvent and the cocktail can be spread as a
thin ®lm onto the support where, after solvent eva-
poration and curing, homogenous and fully transpar-
ent sensor layers are obtained.
The use of ¯uorescence based sensors is preferred
over absorbance based sensors not only because they
may easily be combined with all kinds of waveguides
and allow the use of perm-selective layers but also
because signi®cantly less indicator is required to
obtain reasonable signal changes. Fluorescence based
sensors also allow the measurement of intensity ratio
or lifetime. This is advantageous because it simpli®es
calibration of the sensor and is not affected by photo
bleaching, chemical decomposition or leaching of the
dye.
The ¯uorophore-absorber ion pairs investigated in
this work will allow the measurement of ¯uorescence
lifetime. The quantum yields of the pairs are signi®-
cantly lower than that of corresponding ruthenium
complexes without absorbing counterions. However,
¯uorophore-absorber pairs provide several advantages
in that, (a) the preparation of the ion pairs is simple
and does not require the use of toxic solvents, (b) the
resulting ion pairs exhibit a de®ned stoichiometry
which guarantees a constant distance and ratio
Table 2
Composition, optical characteristics and figures of merit of sensor membranes M1±M3
M1 M2 M3
Dye Ru (dpp)3 (BPB)2 Ru (dpp)3 (BPB)2 Ru (biby)3 (BPB)2
Polymer 33% PVC 33% PVC Sol±gel glass
Plasticizer 66% CPOE 66% DOS ±
Exc./em. maxima 483/601 nm 480/594 nm 465/588 nm
Sensitive range 0.05±25 mg lÿ1 0.25±25 mg lÿ1 0.025±25 mg lÿ1
LOD 0.01 mg lÿ1 0.1 mg lÿ1 0.01 mg lÿ1
126 G.J. Mohr et al. / Analytica Chimica Acta 360 (1998) 119±128

between the absorber and the ¯uorophore, (c) the
high lipophilicity of the ion pairs renders them soluble
in non-polar solvents and allows incorporation in
polymer materials and (d) the ion pairs allow to
measure all types of analytes which cause changes
of pH. The last fact not only holds for acidic and basic
analytes or pH but also for analytes available via ion-
exchange or co-extraction [19]. On the other hand, the
quenchability of the pH-sensitive ion pairs by oxygen
complicates any intensity measurement. However, due
to the difference between the mechanisms of oxygen
quenching and lifetime change by pH reactions, life-
time measurements allow to differentiate between
signal changes obtained from oxygen and pH varia-
tions. Consequently, it will be possible to simulta-
neously evaluate both the concentrations of oxygen
and ammonia with the presented indicator chemistry
[20].
The emission spectra of the sensor membranes M1±
M3 (Figs. 3±5) show that, in contrast to the situation
in solution in the polymer environment the ion pairs
exhibit major changes in the ¯uorescence bands. In the
sensor membrane M2 exposure to ammonia leads to a
¯uorescence decrease at around 590 nm (similar to
M1 and M3). At the same time, the ¯uorescence of M2
increases at around 640 nm and an isosbestic point is
observed. We assume the formation of exciplexes
(excited state complexes) between the excited Ru
(dpp)3 cation and the deprotonated BPB to cause this
increase of longwave ¯uorescence [21]. This is further
corroborated by the fact that the new band is only
observed in highly unpolar matrix (DOS) whereas in
the polar sol±gel based glass and the rather polar
CPOE the increase of ¯uorescence at 640 nm is not
observed to such an extent. This, however, does not
affect the calibration plot of M2 when measuring at
wavelengths lower than 610 nm.
The luminescence lifetimes of the ruthenium ion-
pairs in sensor membranes as well as further investi-
gations on the energy transfer within the ion pairs will
be described in more detail in a forthcoming paper
[22].
5. Conclusions
The presented work describes a simple and repro-
ducible method for the preparation of ¯uorophore
absorber pairs which are useful for ammonia sensing.
The approach, however, is generic in that any ¯uor-
escent cationic dye available can be ion-paired with
dyes containing a sulpho group or related anionic
functions. The anionic dyes used for ion-pairing
may be pH-sensitive triphenylmethane dyes but also
ion-selective chromoionophores. By choosing the
appropriate polymer matrix, ¯uorescence sensors
for pH as well as gas or ion sensors may be obtained
which exhibit the intrinsic advantages of ¯uorescence
intensity and lifetime measurements.
Acknowledgements
This work was ®nancially supported by the Austrian
Science Foundation within project S5701-PHY and
J1260-CHE which is gratefully acknowledged. We
would also like to thank Drs. Ines Oehme and Claudia
Preininger for stimulating discussions. K.T. acknowl-
edges a stipend from TEMPUS.
References
[1] O.S. Wolfbeis (ed.), Fiber Optic Chemical Sensors and
Biosensors, CRC Press, Boca Raton, FL, 1991.
[2] M.A. Arnold, T.J. Ostler, Anal. Chem. 58 (1986) 1137.
[3] O.S. Wolfbeis, H.E. Posch, Anal. Chim. Acta 185 (1986)
321.
[4] T.D. Rhines, M.A. Arnold, Anal. Chim. Acta, 231 (1990) 231;
and refs. cited therein.
[5] P. Caglar, R. Narayanaswamy, Analyst 112 (1987) 1285.
[6] W. Sellien, R. Czolk, J. Reichert, H.J. Ache, Anal. Chim.
Acta 269 (1992) 83.
[7] B.H. Weigl, A. Holobar, N.V. Rodriguez, O.S. Wolfbeis,
Anal. Chim. Acta 282 (1993) 335.
[8] J.R. Lakovicz, H. Smacinski, M. Karakelle, Anal. Chim. Acta
272 (1993) 179.
[9] J. Sipior, L. Randers-Eichhorn, J.R. Lakovicz, G.M. Carter,
G. Rao, Biotechnol. Prog. 12 (1996) 266.
[10] C. Preininger, G.J. Mohr, Anal. Chim. Acta 342 (1997)
207.
[11] Q. Chang, J. Sipior, J.R. Lakowicz, R. Rao, Anal. Biochem.
232 (1995) 92.
[12] D.B. Papkovsky, G.J. Mohr, O.S. Wolfbeis, Anal. Chim. Acta
337 (1997) 201±205.
[13] R.J. Watts, G.A. Crosby, J. Am. Chem. Soc. 93 (1971)
3184.
[14] E.R. Carraway, J.N. Demas, B.A. DeGraff, Anal. Chem. 63
(1991) 332.
G.J. Mohr et al. / Analytica Chimica Acta 360 (1998) 119±128 127

[15] I. Klimant, O.S. Wolfbeis, Anal. Chem. 67 (1995) 3160.
[16] E. Terpetschnig, H. Szmacinski, J.R. Lakowicz, Anal.
Biochem. 227 (1995) 140.
[17] A. Juris, V. Balzani, F. Barigelletti, S. Campagna, P. Belser,
A. Von Zelewsky, Coord. Chem. Rev. 84 (1988) 85.
[18] A. Mills, Q. Chang, N. McMurray, Anal. Chem. 64 (1992)
1383.
[19] U.E. Spichiger, W. Simon, E. Bakker, M. Lerchi, P.
BuÈhlmann, J.P. Haug, M. Kuratli, S. Ozawa, S. West, Sens.
Actuators B 11 (1993) 1.
[20] S. Draxler, M.E. Lippitsch, Sens. Actuators B 29 (1995) 199.
[21] H.G.O. Becker, EinfuÈhrung in die Photochemie, Deutscher
Verlag der Wissenschaften GmbH, Berlin 1991.
[22] K. Trznadel, S. Draxler, M.E. Lippitsch, unpublished results.
128 G.J. Mohr et al. / Analytica Chimica Acta 360 (1998) 119±128