Benzene hydroxylation over FeZSM-5 catalysts: which Fe sites are active?
Upload
independentCategory
view
6download
0
t
he-acteristic
inagnesium;al stabil-However,
dylation ofd thatcompletetivity pernning elec-oxidation
PO
Journal of Catalysis 231 (2005) 381–392
www.elsevier.com/locate/jca
Synthesis and characterization of CuMgAl ternary hydrotalcitesas catalysts for the hydroxylation of phenol
S. Kannana,∗, A. Dubeya,1, H. Knozingerb
a Silicates and Catalysis Discipline, Central Salt and Marine Chemicals Research Institute, Bhavnagar-364 002, Indiab Department Chemie, Physikalische Chemie, LMU München, Butenandtstrasse 5-13 (Haus E), 81377 München, Germany
Received 23 November 2004; revised 24 January 2005; accepted 31 January 2005
Available online 23 March 2005
Abstract
CuMgAl ternary hydrotalcites with a (Cu+Mg)/Al atomic ratio of 3.0 and a Cu/Mg atomic ratio of 5.0, 3.0, 1.0, 0.33, and 0.2 were syntsized by coprecipitation under low supersaturation. Powder X-ray diffraction (PXRD) of all of the samples showed the pattern charof hydrotalcite without any detectable impurity phases, with the crystalline order, especially in theab plane, improving with an increasemagnesium concentration. In situ PXRD studies revealed varying phase evolution processes depending on the concentration of mthis observation was well complemented by in situ diffuse reflectance infrared Fourier transform (DRIFT) measurements. The thermity of these materials also improved with an increase in magnesium concentration, as indicated by TG-DTA-EGA measurements.a characteristic endotherm was noted at temperatures around 870 K accompanied by the evolution of CO2, the intensity of which increasewith an increase in copper concentration. Catechol (CAT) and hydroquinone (HQ) were the main products noted in the hydroxphenol over these materials, with H2O2 as oxidant and H2O as solvent. Variation of the substrate:catalyst mass ratio (10–500) showethe activity passes through a maximum for a ratio of 100. The influence of reaction time indicated that the reaction was nearlyin less than 60 min. Activity was enhanced by an increase in the concentration of copper, whereas the normalized activity (acunit copper concentration) showed an opposite trend. The structure–activity relationship of these samples, obtained through scatron microscopy, N2 adsorption measurements, X-ray photoelectron spectroscopy, and cyclic temperature-programmed reduction–measurements, corroborated such activity variations. 2005 Elsevier Inc. All rights reserved.
Keywords:CuMgAl ternary hydrotalcite; Hydroxylation of phenol; In situ PXRD; DRIFT spectroscopy; Structure–activity relationships; Cyclic TPR-T
measurements; Dispersionnicin-
erse
cite
gusu-s ofiallytheir
seh di-
1. Introduction
Hydrotalcite-like compounds comprise a class of anioclays or layered double hydroxides that have receivedcreasing attention in recent years because of their divapplications as ion exchangers[1,2], catalysts[3–5], cat-alyst supports[6], and polymer additives[7]. Structurally,they can be understood from an examination of the bru
* Corresponding author.
E-mail address:[email protected](S. Kannan).1 Present address: Department of Chemistry, Korea Advanced Instituteof Science and Technology, Taejon, 305-701, Korea.
0021-9517/$ – see front matter 2005 Elsevier Inc. All rights reserved.doi:10.1016/j.jcat.2005.01.032
[(Mg(OH)2)] lattice, wherein a partial replacement of Mg2+with a trivalent cation, say Al3+, occurs, and the resultinexcess positive charge is compensated for by anions,ally carbonate, occupying interlayer positions. Synthesithese materials containing transition metal ions, especcopper, in the sheets is of particular interest because ofselective oxidation properties.
Hydroxylation of phenol to dihydroxybenzenes (Sche-me 1) is an important selective oxidation reaction whoproducts, catechol and hydroquinone, are used in suc
verse applications as photographic chemicals, antioxidants,flavoring agents, polymerization inhibitors and pharmaceu-ticals. In a recent study, we reported on the hydroxylation
l of C
tal-nde o
tion igeir
hi-
ivend
user-da
ppered-R-ilarox-dl
xi-
nt.s-
esthe
s iser-ithn
t--derokplesedm),
ereghtlentthehe
ar-trytedof
ps
forert
rentayon-bly
cell,in
ade
ro-tingd to; P/NKBrd then of
isG-ce.
382 S. Kannan et al. / Journa
Scheme 1. Hydroxylation of phenol.
of phenol over various copper-containing ternary hydrocites containing different di- and trivalent metal ions athat these materials have activities comparable to thossome of the zeolite-based materials[8–10]. In the presenstudy, magnesium was chosen as a second divalent catCuMgAl ternary hydrotalcites with the goal of elucidatinthe influence of divalent non-transition-metal cation on thcatalytic performance.
Corma and co-workers[11] reported that a catalyst wita Cu/Mg atomic ratio of 1, which was obtained by calcnation and reduction of a CuMgAl hydrotalcite, was actin the selective catalytic reduction of NO by propane ain the SOx removal from exhaust streams. Auer et al.[12]have studied the synthesis of methyl amines with theof mixed-metal oxides derived from CuMgAl hydroxy cabonates with different Mg/Al atomic ratios and observemaximum activity for a precursor composition for whichpure HT-like phase was detected. The presence of coalso strongly enhanced the activity of mixed oxides prepafrom CuMgAl oxides (33 at% Cu) for the oxidation of ammonia with high selectivity toward nitrogen and the SCactivity (NO by NH3), whereas the binary MgAl oxide catalyst did not show any measurable SCR activity under simconditions and produced significant amounts of nitrogenides during ammonia oxidation[13]. Recently, Kaneda anco-workers[14] reported that an alkali-promoted CuMgAhydrotalcite (a Cu/Mg atomic ratio of 1:10 and a (Cu+Mg)/Al ratio of nearly 3.0) was active for the selective odation of 2,6-di-tert-butylphenol to 3,3′,5,5′-tetra-tert-butyl-4,4′-diphenoquinone, with molecular oxygen as the oxidaThe authors claimed that both Cu2+ and the base were esential to this reaction.
Although scattered information on CuMgAl hydrotalcitis available, a systematic investigation of the effect ofvariation of the Cu/Mg atomic ratio in CuMgAl hydrotal-cites on their properties for selective catalytic oxidationstill lacking. Therefore, we report here on the catalytic pformance of a series of CuMgAl ternary hydrotalcites wvarying Cu/Mg atomic ratios for the selective hydroxylatioof phenol with H2O2 as the oxidant in aqueous solution.
2. Experimental
2.1. Sample preparation
All chemicals were from S.D. Fine Chemicals (India).The samples were prepared by the low supersaturation technique. Two solutions, one (A) containing the desired amount
atalysis 231 (2005) 381–392
f
n
r
of metal (Cu, Mg, Al) nitrates and one (B) with precipitaing agents (i.e., NaOH and Na2CO3), were added simultaneously, while the pH was maintained around 9–10 unvigorous stirring at room temperature. The addition toca. 90 min and the final pH was adjusted to 10. The samwere aged in the mother liquor at 338 K for 24 h, filteroff, washed (until the total absence of nitrates and sodiuand dried in air at 353 K for 12 h. The resulting solids wground in a mortar. They exhibited a grayish blue to liblue color. In all cases, the atomic ratio between the divaand trivalent cations was maintained around 3.0, whileCu/Mg atomic ratio was varied between 5:1 and 1:5. Tsamples are denoted CuMgAl-XY , whereXY stands for thenominal Cu/Mg atomic ratio.
2.2. Experimental techniques
2.2.1. Chemical analysisElemental chemical analysis for Cu, Mg, and Al was c
ried out with inductively coupled plasma (ICP) spectrome(Varian Vista RL CCD) in which the samples were digesin a microwave oven with small quantities of a mixtureHNO3 and HF.
2.2.2. Powder X-ray diffractionPowder X-ray diffraction was carried out in a Phili
X’Pert MPD system with Cu-Kα radiation (λ = 1.54056 Å).A step size of 0.14◦ and a step time of 5.6 s were useddata collection. The data were processed with Philips X’P(version 1.2) software. The operating voltage and the curwere 40 kV and 40 mA, respectively. In situ powder X-rdiffraction (PXRD) was carried out on the same system cnected to an Anton–Paar high-temperature XRK assemin which the sample was mounted in a high-temperatureheated at 5 K min−1 in steps of 50 K, and stabilized for 5 mbefore measurements. The step size was 0.05◦ with a steptime of 1 s. Identification of the crystalline phases was mby comparison with the JCPDS files[15].
2.2.3. Diffuse reflectance infrared spectroscopyDRIFT measurements (with variable temperature p
gramming) were carried out with the use of a self-suppordisc in a Perkin–Elmer FT1730 spectrometer connectea diffuse reflectance accessory (Graseby Specac, USA19930 series). Background corrections were made withas a reference prior to measurements, and we recordespectra by accumulating 64 scans at a spectral resolutio2 cm−1.
2.2.4. Thermogravimetry and differential thermal analysThermogravimetry-differential thermal analysis (T
DTA) was carried out on a Netzsch STA 409 thermobalan
-Analysis was done from 323 to 973 K at a heating rate of10 K min−1 under nitrogen (30 cc min−1). The gases evolvedduring the thermal treatment, H2O (m/e = 18) and CO2
S. Kannan et al. / Journal of Catalysis 231 (2005) 381–392 383
Table 1Elemental analysis, chemical formulae and lattice parameters of the samples synthesized
Sample M(II)/Ala Cu/Mga Formulab a
(Å)
c
(Å)Solution Solid Solution Solid
CuMgAl-51 3.0 3.06 5.0 5.18 [Cu0.63Mg0.12Al0.25(OH)2](CO3)0.13 · 0.58H2O Ndc 22.70CuMgAl-31 3.0 3.02 3.0 2.95 [Cu0.56Mg0.19Al0.25(OH)2](CO3)0.13 · 0.61H2O 3.080 22.76CuMgAl-11 3.0 3.08 1.0 0.99 [Cu0.37Mg0.38Al0.25(OH)2](CO3)0.13 · 0.67H2O 3.070 22.87CuMgAl-13 3.0 3.04 0.33 0.32 [Cu0.18Mg0.57Al0.25(OH)2](CO3)0.13 · 0.68H2O 3.063 22.95CuMgAl-15 3.0 3.07 0.20 0.19 [Cu0.12Mg0.63Al0.25(OH)2](CO3)0.13 · 0.70H2O 3.067 23.18
a Atomic ratio.
ine
iontion-de-con-%edksthethture
anas
swa
ithwas) at
Leoolt-ni-
n of77 Km-nts.
ar-h a
eac-
zu-a
weucts,nticon-
thenate
ravi-een
tingis
ren-de.lesn
b Values rounded to two significant figures.c Not determined.
(m/e = 44), were simultaneously analyzed with an on-lquadruple mass spectrometer (Balzers QMG 4211).
2.2.5. Temperature-programmed reduction and reoxidatCyclic temperature-programmed reduction–reoxida
(TPRO) measurements were carried out in a customsigned system with He as carrier gas and a thermalductivity detector (TCD). High-purity oxygen (99.99%; 5in He) and hydrogen (99.99%; 5% in He) were premixwith helium with the use of mass flow controllers (BrooModel 5600). Sample weights were taken so as to fulfilMonti and Baiker criterion[16] and were heated under boreducing and oxidizing atmospheres from room temperato 1073 K at a heating rate of 10 K min−1. Calibration of theinstrument was carried out with CuO (Merck).
2.2.6. X-ray photoelectron spectroscopyX-ray photoelectron spectroscopy was carried out on
ESCALAB (VG Scientific, UK). The sample was presseda disk and measured, with Mg-Kα radiation (1253.6 eV) athe excitation source. The vacuum during measurementsbetter than 5× 10⁻⁸ mbar, and the data were analyzed wthe use of standard software. The binding energy scalecalibrated with respect to the adventitious carbon (C 1s284.6 eV.
2.2.7. Scanning electron microscopyScanning electron micrographs were obtained with a
(Model 1430) microscope operating at an acceleration vage of 15 kV and a working distance of 17 mm, with magfication values up to 100,000×.
2.2.8. Surface area measurementsThe specific surface areas and pore size distributio
the samples were measured by nitrogen adsorption atwith a sorptometer (ASAP-2010, Micromeritics). The saples were degassed at 393 K for 4 h prior to measureme
2.2.9. Catalytic activity measurementsThe hydroxylation of phenol in aqueous solution was c
ried out in a two-necked glass reactor (50 ml) fitted wit
condenser and a septum. Hydrogen peroxide (30% v/v) wasadded through the septum to the magnetically stirred solu-tion of phenol containing the catalyst and kept at the desireds
reaction temperature. We monitored the course of the rtion by periodically taking small samples (0.05 cm3), whichwere analyzed by gas chromatography (GC) (Shimad14B) with a OV-17 packed column (2 m, 4 mm i.d.) andflame ionization detector. Quantification was done afterconsidered the response factors of reactants and prodthe retention times of which were determined from authesamples, which were derived from standard mixtures ctaining both of them.
3. Results and discussion
3.1. Catalyst characterization
Table 1summarizes the elemental compositions andformulas calculated for the samples studied. The carbocontent was calculated based on the M(II)/Al atomic ratio,and the water content was computed based on thermogmetric results. A reasonable coincidence was noted betwthe solution concentrations with those of solids, suggescompletion of precipitation; the small deviation observedrather common and has usually been attributed to a prefetial precipitation of one or another metal ion as a hydroxi
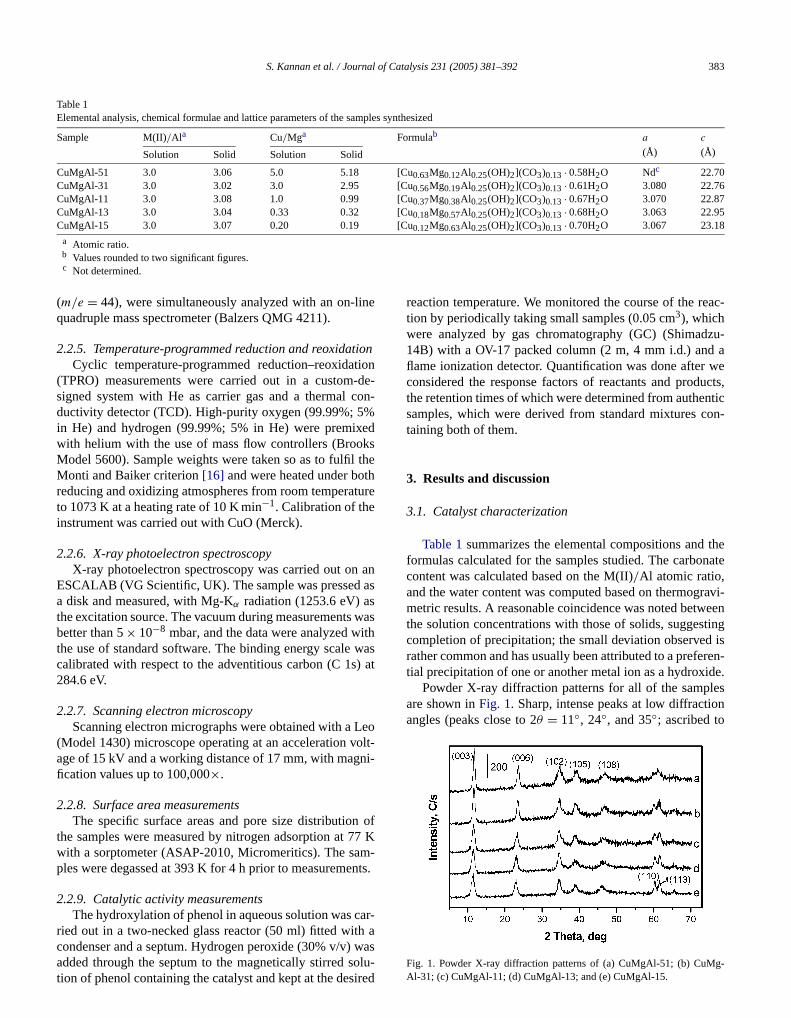
Powder X-ray diffraction patterns for all of the sampare shown inFig. 1. Sharp, intense peaks at low diffractioangles (peaks close to 2θ = 11◦, 24◦, and 35◦; ascribed to
Fig. 1. Powder X-ray diffraction patterns of (a) CuMgAl-51; (b) CuMg-Al-31; (c) CuMgAl-11; (d) CuMgAl-13; and (e) CuMgAl-15.

l of C
;
ec-eak
hy-
withthe
ri-enic
otedthe
flecen isara-0)
tionl to
dif-ound
le-ighentra-dingm-is intterupow-nom
ofith
gheren-
t
tionr be
of,m
eec-
o
thesbywaser-cursermysis
384 S. Kannan et al. / Journa
Fig. 2. FT-IR spectra of (a) CuMgAl-51; (b) CuMgAl-31; (c) CuMgAl-11(d) CuMgAl-13; and (e) CuMgAl-15.
diffraction by basal planes (003), (006), and (009), resptively) and broad, less intense peaks at higher angles (pclose to 2θ = 38◦, 46◦, and 60◦; ascribed to diffraction by(105), (108), and (110) planes) confirm the presence ofdrotalcite (JCPDS: 41-1428) with 3R packing of layers[17].The positions of the remaining peaks are in agreementsuch an assignment. No significant positional changes inbasal or theab plane reflections were noted with the vaation in the Cu/Mg atomic ratio. This could possibly bexplained by only subtle differences in the octahedral ioradii of Cu2+ (0.73 Å) and Mg2+ (0.72 Å) [18]. However,a clear improvement in the orderliness of the layer was nwith decreasing copper content, as indicated by bothincrease in intensity and sharpness of (110) and (113) retions observed around 60◦ and 62◦. This is expected, sincat higher concentrations of copper a Jahn–Teller distortioexpected, leading to poor long-range ordering. Lattice pmetersa andc, calculated from the (003), (006), and (11reflections, are summarized inTable 1. Assuming a valueof 4.8 Å for the width of brucite-like layers[19], the inter-layer distance is close to 2.7–2.9 Å, suggesting the locaof carbonate anions with their molecular planes parallethe brucite-like layers.
FT-IR spectra for the samples are shown inFig. 2. Al-though all samples show rather similar spectra, subtleferences can be noted. The main band is recorded ar3450–3500 cm−1 and is due to theνOH mode of H-bondedhydroxyl groups in the layers and of interlayer water mocules. The band becomes sharper and shifts toward hwave numbers with an increase in magnesium concetion. This suggests that the strength of hydrogen bon(through different kinds of interaction of OH species) is siilar upon an increase in magnesium concentration. Thisaccordance with PXRD results, which also implied a belong-range ordering (i.e., similar kind of M–OH point groarrangements in the lattice of the layered network). Hever, a shift toward higher wave numbers suggests an a
aly, as will be discussed later. This band shows a prominentshoulder around 2950 cm−1 ascribed to hydrogen bondingof hydroxyl groups of layered lattice and/or water mole-atalysis 231 (2005) 381–392
s
-
r
-
Fig. 3. TG-DTA traces and EGA traces (of water and CO2) of (a) CuMg-Al-51; (b) CuMgAl-11; and (c) CuMgAl-15.
cules with interlayer carbonate anions[20]. A rather weakband at 1640 cm−1 is attributed to the deformation modeinterlayer water molecules whose intensity increased wincreasing magnesium concentration, suggesting a hicontent of water molecules, in accordance with the elemtal composition results given inTable 1. A sharp band a1370 cm−1 can be assigned to the antisymmetricν3 modeof interlayer carbonate anions. No shift of this band posiis noted, regardless of the composition. It should furthenoted that although the band is shifted from the positionfree carbonate (∼ 1450 cm−1), it does not split. This facttogether with the absence of any band around 1050 c−1
(position expected for the IR forbiddenν1 mode of carbon-ate), suggests the retention of D3h symmetry of the carbonatanion in the interlayers. Significant differences in the sptra were noted in the spectral region below 1000 cm−1 ofM–OH stretching and M–OH–M′ bending vibrations due tcompositional variations.
Representative thermal analysis profiles of some ofsamples are given inFig. 3. Two well-defined weight lossewere noted up to 773 K, which were duly complementedtwo endotherms. However, the nature of the endothermsdifferent with the variation in the composition. For a copprich sample, the second endotherm or weight loss ocin a broader temperature window, and a narrow endothwas observed for a Mg-rich sample. The parallel anal
of the evolved gas (EGA) also supported the conclusionthat the dehydration component of the second weight lossoccurred in a wider temperature window for Cu-rich sam-
l of C
tionsingtheyla-on-ardi-
herr-
de-
ationsiumT-in
tion.sultsnd-and
sium
ldthataly-
the
rmcon-tion.mal
natehy-
esesitu. In
the
siveandles.a-
ace.als
(asd to
d73;K
en-ither-ceduOal-
nitytheblymas
rest-ella-pre-redthe
S. Kannan et al. / Journa
ples. Although EGA studies showed that the decarbonatemperature window becomes narrower with an increacopper content, such a contribution of decarbonation topeak shape is less significant compared with dehydroxtion. A sharper peak with single-stage evolution of carbate (Fig. 3: CO2: spectra a; considering up to 800 K) forCu-rich sample could suggest a similar nature and coonation of carbonate ion, preferably associated with Cu2+.The two stages (whose temperatures are designatedby T1 and T2) are ascribed first to the removal of intelayer water molecules (transformation temperatureT1) andsecond to the dehydroxylation of brucite-like sheets andcarbonation (transformation temperatureT2) with concomi-tant destruction of the layer structure[21]. Furthermore, aprogressive shift in the temperatures (bothT1 and T2) tohigher values was noticed as the magnesium concentrwas increased. This is indeed expected, since magneis better stabilized in an octahedral coordination of a Hlike lattice than copper, which is inherently less stableoctahedral coordination because of Jahn–Teller distorHowever, these observations are in contrast with the reobserved by FT-IR, wherein the strength of hydrogen boing (considered a measure of interaction between layersthe interlayers) decreased with an increase in magnecontent (CuMgAl-15νOH = 3496 cm−1 and CuMgAl-51νOH = 3450 cm−1). In other words, dehydroxylation shoube easier for the sample with weaker hydrogen bonding,is, for a magnesium-rich sample, whereas the thermal ansis showed an opposite trend whereinT2 increased with anincrease in magnesium concentration. At this moment,reason for such an observation is not clear.
In addition to these profiles, a well-defined endothewas also noted around 823–873 K, whose weight losstribution increased with an increase in copper concentraA parallel attempt to study the evolved gases during therdecomposition revealed the evolution of only CO2, whichsuggests the presence of amorphous mixed oxycarboA detailed thermal analysis pathway of Cu-containingdrotalcites was recently reported[22].
Interesting information on the phase evolution of thmaterials emerged from an investigation made under inheating conditions by PXRD and DRIFT measurementssitu PXRD of some selected samples is shown inFig. 4.The diffraction patterns clearly indicate that the nature ofphase evolution is strongly influenced by the Cu/Mg atomicratio. With an initial increase in temperature, a progresdecrease in the intensity of the basal reflections ((003)(006)) occurs with a concomitant shift toward higher angThis is attributed in general to the removal of interlayer wter molecules, resulting in the shrinkage of interlayer spA more detailed analysis of the diffraction patterns revethat the complete decomposition of the HT-like latticeinferred by the disappearance of (003) reflection) shifte
higher temperatures with increasing magnesium concentra-tion, that is, CuMgAl-51 at 523 K, CuMgAl-11 at 573 K,and CuMgAl-15 at 623 K. In other words, the stability ofatalysis 231 (2005) 381–392 385
e
.
Fig. 4. In situ PXRD of CuMgAl-15, CuMgAl-11, and CuMgAl-51 calcineat (a) 323; (b) 373; (c) 423; (d) 473; (e) 523; (f) 573; (g) 623; (h) 6(i) 723; (j) 773; (k) 823; (l) 873; (m) 923; (n) 973; (o) 1023; and (p) 1073(HT, hydrotalcite;P, CuO;∗, spinel).
the HT-like lattice increased with the magnesium conctration, which is in accordance with TG-DTA results. Wa further increase in temperature, crystallization of diffent phases occurs, the composition of which is influenby chemical composition. In the case of CuMgAl-51, Cforms, and its crystallinity is improved with increasing ccination temperature. However, above 823 K (Fig. 4C, k),crystallization of a spinel phase also occurs, the crystalliof which improved with increasing temperature. Fromchemical composition of this sample, this could possibe CuAl2O4 with some partial substitution of magnesiu(solid solution spinel). No discrete Mg-containing phase wobserved in the entire temperature range studied. Inteingly, crystallization of CuO occurs at around 423 K, wbelow theT1 temperature in the TG profile. Hence, formtion of CuO occurs even when the layered structurevails, suggesting that this formation might have occurthrough dehydroxylation primarily along the edges of
layers. In contrast, the calcination of CuMgAl-15 showedthe crystallization of a MgO phase, which was, however,very amorphous in nature, with a defect or nonstoichiom-
l of C
3;3;
osi-
c
Odi-200)
rd-ningotedtrixis-
aveea-tativenly tplesxandn-net-
le anif-ate
l.car-centina-e,
e in
h.
iedT)cts.um
ed).
ta-ondAl
di-thisgle-use
ger-thiswersug-siumex-
d asThe
ithtion.cese-
ystAswithprox-ub-e torkertra-ary
386 S. Kannan et al. / Journa
Fig. 5. In situ DRIFT spectra of CuMgAl-11 activated in air at (a) 30(b) 323; (c) 373; (d) 423; (e) 473; (f) 523; (g) 573; (h) 623; (i) 673; (j) 72(k) 773; (l) 873; (m) 973 K. (Ex situ calcined for 773, 873, and 973 K).
etry, as indicated by a significant displacement in the ptions of the primary diffraction lines (Fig. 4A, h; d(200) =2.092 Å andd(220) = 1.482 Å) with respect to synthetipericlase (d(200) = 2.110 Å andd(220) = 1.490 Å; JCPDS45-0946). However, above 623 K, crystallization of Mgoccurred, and the crystallinity of MgO increased (as incated by the increase in sharpness and intensity of (and (220) reflections observed around 42◦ and 62◦, re-spectively) with increasing temperature. However, regaless of the temperature, no crystalline discrete Cu-contaiphase evolved, and no well-defined spinel phase was neven after heating at 1073 K. Hence, copper in this mamight have been present in its oxidic form and well dpersed.
To complement this phase evolution process, we halso studied these samples by in situ DRIFT FT-IR msurements in air at increasing temperatures; represenspectra are given inFig. 5. Because of limitations of thaccessory attachment, the samples could be heated o773 K under in situ conditions, whereas spectra of samcalcined at higher temperature (> 773 K) were recorded esitu. The spectrum at room temperature showed broad baround 3500 cm−1 with shoulders at lower wavenumbers, idicating an extensive hydrogen-bonded hydroxy-waterwork. Bands were also noted around 1650 and 1380 cm−1,which were assigned as above. Calcination of the sampslightly elevated temperatures (e.g., 373 K) showed sigicant variations in the carbonate region, with the carbonband splitting into two bands around 1530 and 1380 cm−1.Such a split was noted earlier by us[23] and by Cabrera et a[24] and ascribed to a change in the coordination of thebonate ion upon loss of interlayer water molecules. In rework [22], we reported the presence of unidentate coordtion of carbonate with metal ions in the brucite-like latticbased on the extent of such splitting. A further increastemperature decreased the intensity of bothνOH and δH2O
vibrations. However, samples showed weak vibrations ofcarbonate, even after calcination at 973 K, suggesting thepresence of amorphous oxycarbonate.atalysis 231 (2005) 381–392
,
e
o
s
t
Table 2Phenol hydroxylation activity of CuMgAl ternary hydrotalcitesa
Catalyst Conversion(%)
Product distribution (wt%) TONb
(h−1)CAT HQ CAT/HQ
CuMgAl-51 23.5 13.7 9.8 1.4 37CuMgAl-31 24.7 16.5 8.2 2.0 46CuMgAl-11 22.0 13.5 8.5 1.6 51CuMgAl-13 19.1 13.0 6.1 2.1 95CuMgAl-15 17.7 12.2 5.5 2.2 128
a Reaction conditions: phenol, 1.0 g; phenol/H2O2 molar ratio, 2.0; cat-alyst mass, 10 mg; solvent, water (10 ml); temperature, 338 K; time, 2
b Moles of phenol converted per mole of copper per hour.
3.2. Catalytic hydroxylation of phenol
Table 2summarizes the activity of these catalysts studfor phenol hydroxylation. On all catalysts, catechol (CAand hydroquinone (HQ) were observed as major produAmong the catalysts studied, CuMgAl-31 showed maximactivity with nearly 50% selectivity of H2O2 (selectivity isdefined here on the basis of dihydroxybenzenes formFurthermore, the product distribution indicated a CAT/HQratio of around 2.0, unlike that obtained for CuCoAl calysts[9], suggesting an influence of the nature of the seccation in controlling the course of the reaction. Binary Mghydrotalcite with a Mg/Al atomic ratio of 3.0 did not showany hydroxylation of phenol under similar reaction contions. Hence, the presence of copper is essential forreaction to occur. Although an attempt to synthesize a sinphase CuAl binary hydrotalcite failed as expected (becaof the Jahn–Teller effect, a mixed phase containinghardite (or malachite) and hydrotalcite was obtained),binary hydrotalcite also showed a conversion much lothan that of any of the ternary catalysts studied here,gesting that the presence of both copper and magneaugmented the activity. The activity was normalized andpressed as a turnover number (TON), which is definemoles of phenol produced per mole of copper per hour.TON values are also summarized inTable 2and show anopposite trend (to that of actual conversion of phenol), wTONs increasing with increasing magnesium concentraThe dilution of copper by magnesium obviously enhanthe specific activity of copper for the hydroxylation of phnol.
Fig. 6 illustrates the variation of the substrate/catalmass ratio with the phenol conversion for CuMgAl-51.shown in the figure, the conversion of phenol increaseddecreasing substrate/catalyst ratios at values above apimately 100 and then started decreasing at still lower sstrate/catalyst ratios. This decrease is presumably duspontaneous formation of coke (as indicated by the dacolor of the reaction mixture) at higher catalyst concentions, obtained through consecutive oxidation of prim
products (catechol and hydroquinone). To verify the for-mation of coke, in one of our experiments we filtered thereaction mixture, and the solid was washed, dried, and sub-
l of C
ass
gAl
es
andlossrat-ngoth
ex-ancub-tud-
cetud-p toced
pet-.
sub-ml;
andnd
mthersec-h as-31ity
l
he-us
trile,e
l ob-ngential;
in-erat-iesen
r-ssi-ciesox-
olter-tiorsionofbutsig-ed
S. Kannan et al. / Journa
Fig. 6. Variation in conversion of phenol with the substrate:catalyst mratio for CuMgAl-51 (phenol, 1 g; solvent (water), 10 ml; phenol/H2O2molar ratio, 2.0; temperature, 338 K; time, 2 h).
Table 3Influence of reaction temperature on phenol hydroxylation over CuMternary hydrotalcitesa
Catalyst Temp.(K)
Conv.(%)
Product distribution (wt%) H2O2 selec.b
(%)CAT HQ CAT/HQ
CuMgAl-51 303 18.5 11.0 7.5 1.5 37.0323 20.2 12.1 8.1 1.5 47.0338 23.5 13.7 9.8 1.4 47.0353 15.3 9.2 6.1 1.5 30.6
CuMgAl-31 303 20.1 12.0 8.1 1.5 40.2323 22.3 13.5 8.8 1.5 44.6338 24.7 16.5 8.2 2.0 49.4353 17.0 11.0 6.0 1.8 34.0
CuMgAl-11 303 17.2 11.7 5.5 2.1 34.4323 20.0 13.8 7.2 1.9 40.0338 22.0 13.5 8.5 1.6 44.0353 14.0 8.2 5.8 1.4 28.0
a Reaction conditions as inTable 2.b Selectivity of H2O2 calculated on the basis of dihydroxybenzen
formed.
jected to heating in air at 550◦C. A significant differencein the weight was noted between the as-filtered solidthe heated sample (10–13 mg of coke after the weightdue to hydrotalcite is taken into consideration), corroboing the formation of coke, which is oxidized after heatiin air. Similar observations were also made earlier for bCuNiAl and CuCoAl ternary hydrotalcites[9]. In addition,a preferential formation of catechol was noted at bothtremes of substrate:catalyst ratios, suggesting the hindrof interconversion and/or isomerization reactions. A sstrate/catalyst ratio of 100 was selected for all further sies.
Table 3shows the variation in the catalytic performanwith reaction temperature over some of the catalysts sied. A subtle increase in the conversion was noted u338 K, whereas a further increase in temperature reduthe conversion of phenol; this could be ascribed to comitive thermal decomposition of H2O2 at higher temperature
However, the CAT/HQ ratio was not influenced by the reac-tion temperature, and the decrease in the conversion betwee338 and 353 K occurred with all catalysts. An analysis com-atalysis 231 (2005) 381–392 387
e
Fig. 7. Influence of reaction time on the phenol conversion (phenol, 1 g;strate:oxidant molar ratio, 5:1; temperature, 338 K; solvent (water), 10substrate:catalyst mass ratio, 100).
paring these results with those obtained for CuCoAlCuNiAl ternary hydrotalcites showed a characteristic trein that the activity of CuMgAl ternary hydrotalcites at rootemperature was significantly higher than that of any ocatalyst studied so far, suggesting the influence of theond divalent metal ion. For example, a conversion as hig20% was noted at room temperature (303 K) for CuMgAlfor a substrate/oxidant mole ratio of 2:1. Such high activcould be due to better stabilization of Cu2+ in the octahedrasites of the CuMgAl HT-like lattice.
To study the influence of the reaction medium on pnol hydroxylation, the reaction was performed in variosolvents (other than water), namely, acetone, acetonit-butanol, THF, and dimethylformamide (DMF). In nonof these solvents was measurable conversion of phenoserved. We believe that the proximity of the hydroxylatispecies and the substrate molecule on the surface is essthe corresponding configuration would be well stabilizedH2O. In water, both phenol and H2O2 dissolve simultaneously and can approach the active center, thereby gening the hydroxyl radicals, thought to be the active specinvolved in the hydroxylation reaction. Furthermore, whthe reaction was carried out with oxidants other than H2O2,namely, oxygen, air, andt-butylhydroperoxide, no convesion was detected under similar conditions. This could pobly be due to the lack of generation of active oxygen speand solubility problems associated with the reactant andidant.
Fig. 7 shows the variation in the conversion of phenover some of the catalysts studied at different time invals with a substrate/oxidant mole ratio of 5:1. This rawas selected to evaluate these catalysts at low convelevels. It is clear from the figure that more than 90%the total conversion was achieved in less than 30 min,a further increase in time did not change the conversionnificantly. A small induction period of 5–10 min was not
nfor these catalysts. This is in contrast to the behavior ofmany zeolite-based catalysts, which either show a progres-sive growth in the conversion of phenol or exhibit an induc-
l of C
f in-rds,s inul-o-
fil-antveion.the
oustiallyndi-
the
2:1,elecied
ate,od-edticy-wascleionnith
ub-eredata-tioniv-le
h any-
ione-rent
then
so atheer-turethe
This
ater
es
gAl
es
re-ys-ed
sug-e ofhe
388 S. Kannan et al. / Journa
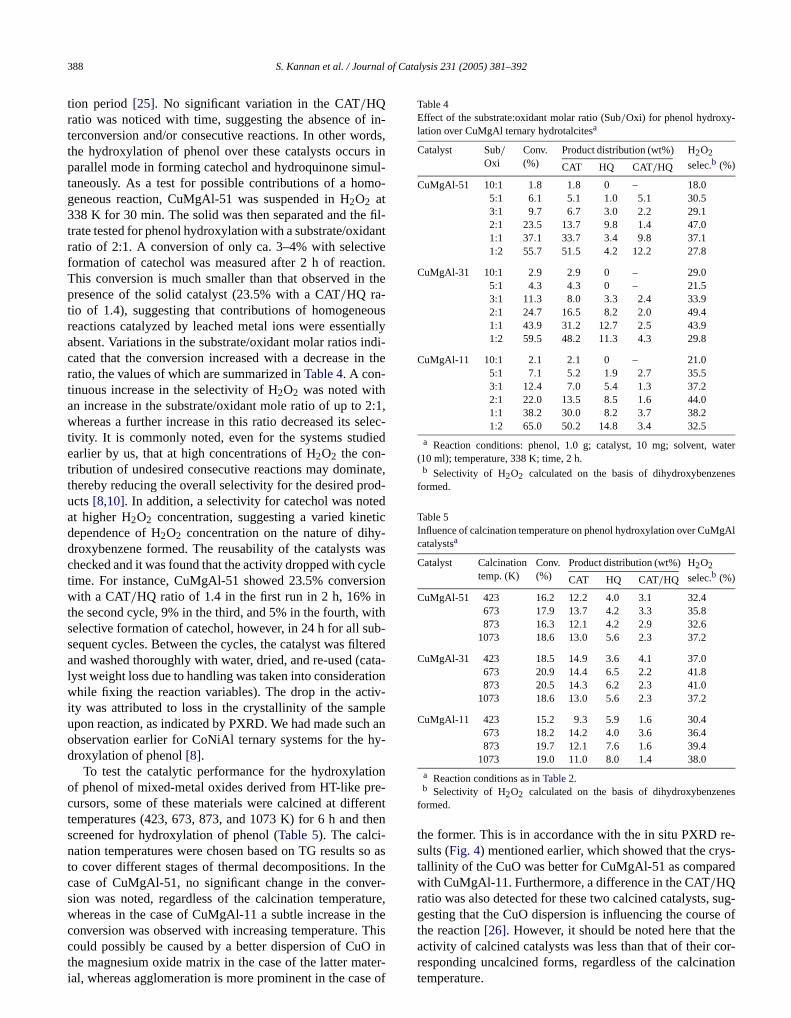
tion period [25]. No significant variation in the CAT/HQratio was noticed with time, suggesting the absence oterconversion and/or consecutive reactions. In other wothe hydroxylation of phenol over these catalysts occurparallel mode in forming catechol and hydroquinone simtaneously. As a test for possible contributions of a homgeneous reaction, CuMgAl-51 was suspended in H2O2 at338 K for 30 min. The solid was then separated and thetrate tested for phenol hydroxylation with a substrate/oxidratio of 2:1. A conversion of only ca. 3–4% with selectiformation of catechol was measured after 2 h of reactThis conversion is much smaller than that observed inpresence of the solid catalyst (23.5% with a CAT/HQ ra-tio of 1.4), suggesting that contributions of homogenereactions catalyzed by leached metal ions were essenabsent. Variations in the substrate/oxidant molar ratios icated that the conversion increased with a decrease inratio, the values of which are summarized inTable 4. A con-tinuous increase in the selectivity of H2O2 was noted withan increase in the substrate/oxidant mole ratio of up towhereas a further increase in this ratio decreased its stivity. It is commonly noted, even for the systems studearlier by us, that at high concentrations of H2O2 the con-tribution of undesired consecutive reactions may dominthereby reducing the overall selectivity for the desired pructs[8,10]. In addition, a selectivity for catechol was notat higher H2O2 concentration, suggesting a varied kinedependence of H2O2 concentration on the nature of dihdroxybenzene formed. The reusability of the catalystschecked and it was found that the activity dropped with cytime. For instance, CuMgAl-51 showed 23.5% converswith a CAT/HQ ratio of 1.4 in the first run in 2 h, 16% ithe second cycle, 9% in the third, and 5% in the fourth, wselective formation of catechol, however, in 24 h for all ssequent cycles. Between the cycles, the catalyst was filtand washed thoroughly with water, dried, and re-used (clyst weight loss due to handling was taken into considerawhile fixing the reaction variables). The drop in the actity was attributed to loss in the crystallinity of the sampupon reaction, as indicated by PXRD. We had made sucobservation earlier for CoNiAl ternary systems for the hdroxylation of phenol[8].
To test the catalytic performance for the hydroxylatof phenol of mixed-metal oxides derived from HT-like prcursors, some of these materials were calcined at diffetemperatures (423, 673, 873, and 1073 K) for 6 h andscreened for hydroxylation of phenol (Table 5). The calci-nation temperatures were chosen based on TG resultsto cover different stages of thermal decompositions. Incase of CuMgAl-51, no significant change in the convsion was noted, regardless of the calcination temperawhereas in the case of CuMgAl-11 a subtle increase inconversion was observed with increasing temperature.
could possibly be caused by a better dispersion of CuO inthe magnesium oxide matrix in the case of the latter mater-ial, whereas agglomeration is more prominent in the case ofatalysis 231 (2005) 381–392
-
s
,
Table 4Effect of the substrate:oxidant molar ratio (Sub/Oxi) for phenol hydroxy-lation over CuMgAl ternary hydrotalcitesa
Catalyst Sub/Oxi
Conv.(%)
Product distribution (wt%) H2O2
selec.b (%)CAT HQ CAT/HQ
CuMgAl-51 10:1 1.8 1.8 0 – 18.05:1 6.1 5.1 1.0 5.1 30.53:1 9.7 6.7 3.0 2.2 29.12:1 23.5 13.7 9.8 1.4 47.01:1 37.1 33.7 3.4 9.8 37.11:2 55.7 51.5 4.2 12.2 27.8
CuMgAl-31 10:1 2.9 2.9 0 – 29.05:1 4.3 4.3 0 – 21.53:1 11.3 8.0 3.3 2.4 33.92:1 24.7 16.5 8.2 2.0 49.41:1 43.9 31.2 12.7 2.5 43.91:2 59.5 48.2 11.3 4.3 29.8
CuMgAl-11 10:1 2.1 2.1 0 – 21.05:1 7.1 5.2 1.9 2.7 35.53:1 12.4 7.0 5.4 1.3 37.22:1 22.0 13.5 8.5 1.6 44.01:1 38.2 30.0 8.2 3.7 38.21:2 65.0 50.2 14.8 3.4 32.5
a Reaction conditions: phenol, 1.0 g; catalyst, 10 mg; solvent, w(10 ml); temperature, 338 K; time, 2 h.
b Selectivity of H2O2 calculated on the basis of dihydroxybenzenformed.
Table 5Influence of calcination temperature on phenol hydroxylation over CuMcatalystsa
Catalyst Calcinationtemp. (K)
Conv.(%)
Product distribution (wt%) H2O2
selec.b (%)CAT HQ CAT/HQ
CuMgAl-51 423 16.2 12.2 4.0 3.1 32.4673 17.9 13.7 4.2 3.3 35.8873 16.3 12.1 4.2 2.9 32.6
1073 18.6 13.0 5.6 2.3 37.2
CuMgAl-31 423 18.5 14.9 3.6 4.1 37.0673 20.9 14.4 6.5 2.2 41.8873 20.5 14.3 6.2 2.3 41.0
1073 18.6 13.0 5.6 2.3 37.2
CuMgAl-11 423 15.2 9.3 5.9 1.6 30.4673 18.2 14.2 4.0 3.6 36.4873 19.7 12.1 7.6 1.6 39.4
1073 19.0 11.0 8.0 1.4 38.0
a Reaction conditions as inTable 2.b Selectivity of H2O2 calculated on the basis of dihydroxybenzen
formed.
the former. This is in accordance with the in situ PXRDsults (Fig. 4) mentioned earlier, which showed that the crtallinity of the CuO was better for CuMgAl-51 as comparwith CuMgAl-11. Furthermore, a difference in the CAT/HQratio was also detected for these two calcined catalysts,gesting that the CuO dispersion is influencing the coursthe reaction[26]. However, it should be noted here that t
activity of calcined catalysts was less than that of their cor-responding uncalcined forms, regardless of the calcinationtemperature.
l of C
lcites
1;lar-
in-hich
todroxarytha
h asp-highlopnt in
5,Il
ithrela-g ans.ni-
d byn in-
sofinthe
av-h ofnd
thatrli-5.a of
siumlog-inchout
lesletsgy.thatag-
Al-chAl-in
on-ers
hecon-gerenceb-nge
ea-r
750ran-sfer
iescon-eak
asionper-al.
the–aird
de-
S. Kannan et al. / Journa
Table 6Specific surface areas and pore parameters of CuMgAl ternary hydrota
Catalyst Surface area(m2 g−1)
Pore volumea
(cm3 g−1)Average poresizea (Å)
CuMgAl-51 62 0.50 260CuMgAl-31 74 0.51 220CuMgAl-11 114 0.72 180CuMgAl-13 125 0.91 200CuMgAl-15 130 0.90 200
a Calculated based on desorption branch of isotherm.
Fig. 8. N2 adsorption isotherms at 77 K of (a) CuMgAl-51; (b) CuMgAl-1and (c) CuMgAl-15 (isotherms (b) and (c) are displaced vertically for city). Inset: Pore size distribution (BJH, desorption branch of isotherm).
3.3. Structure–activity correlations
From these discussions it is quite clear that copper isdeed an essential component in the catalyst, without wthe phenol hydroxylation is not catalyzed. It is interestingdiscuss the reasons for the dependence of the phenol hyylation on the copper concentration in the CuMgAl ternHT-like lattice. The results discussed above demonstratecatalysts containing low concentrations of copper, sucCuMgAl-15, exhibit the highest specific activities of coper, suggesting that isolated copper centers possess theest intrinsic activity. Moreover, the ternary catalysts deveincreasing BET surface areas as the magnesium contecreases. Surface areas are summarized inTable 6. Dinitrogenadsorption isotherms at 77 K for CuMgAl-51, CuMgAl-1and CuMgAl-11 are shown inFig. 8. They show the type Ipattern of the IUPAC classification[27] with a rather smalhysteresis loop (type B), the area of which increases wincreasing magnesium content. The loops close at ative pressure of 0.7–0.8 for all three samples, indicatinsimilar pore architecture of largely mesoporous dimensioIn other words, the interlayer space is inaccessible fortrogen molecules. These results are further corroboratethe pore size distribution of these samples, shown as a
set inFig. 8. In general, pore formation in hydrotalcites isthrough interparticle packing, and the distribution of pores isinfluenced by the crystallite size and packing arrangement ofatalysis 231 (2005) 381–392 389
-
t
-
-
crystallites[2]. A relatively narrow distribution of pores waobserved for CuMgAl-15, whereas a broader distributionpores prevails for CuMgAl-51. This is indeed reflectedthe BJH pore diameter of these samples (computed fromdesorption branch of the isotherm). The former had anerage pore diameter (derived from the desorption brancthe isotherm) of 200 Å, and the latter showed 260 Å, awith the specific surface area of the former was twiceof the latter. This could possibly be due to the better ordeness of crystallites, as indicated by PXRD for CuMgAl-1The total pore volume, specific surface area, and the arethe hysteresis loop increases with an increase in magnecontent. These changes probably originate from morphoical differences in the crystallites arising with a changemagnesium concentration. In anticipation of finding sudifferences, scanning electron microscopy was carriedfor some of these samples; the results are shown inFig. 9. Atfirst glance the micrographs would indicate that all sampconsist of platelets; however, overlapping of such plateoccurs, thereby exhibiting a kind of spongy morpholoHowever, a closer look at the micrographs clearly showsthe extent of agglomeration decreased with increasing mnesium concentration. In other words, for sample CuMg51, platelet agglomeration occurs strongly in forming suspongy particles 3–15 µm in diameter, whereas CuMg15 consists of particles of 1–3 µm. This is presumablyaccordance with pore size distribution results wherein ctributions of larger pores were formed in greater numbthrough interparticles for CuMgAl-51. In other words, tprevalence of an ordered lattice at higher magnesiumcentration (smaller particle size), coupled with the larsurface area, offers higher dispersion of copper and hexhibits higher intrinsic activity. It has generally been oserved that the electronic properties of the metal ions chasubtly with changes in their dispersion[28]. In anticipationof such behavior, UV–vis spectra of these samples were msured; these are shown inFig. 10. All samples showed rathesimilar spectra exhibiting two bands in the region nearand 250 nm. The first band is generally ascribed to d–d tsitions, and the second band is attributed to charge trantransitions (CT). A continuous drop in the integral intensitof both bands is in accordance with the decrease in thecentration of copper. Subtle differences are noted in the ppositions for both transitions with changing Cu/Mg atomiccomposition. A progressive shift to lower wavelengths wnoted for the d–d transition with increasing concentratof copper, which is inferred to suggest a decrease in dission. This is in accordance with the results of Marion et[29], who studied the variation in spectral features withvariation of the copper content and aging in a methanereaction mixture over Cu/Al2O3 catalysts. The peak aroun250 nm could be specifically attributed to an O2− → Cu2+charge transfer transition. The energy of the transition
pends on the symmetry, oxidation state of the metal ion, andthe nature of the ligand or of the other metal atom[30]. Ingeneral, the energy of the CT band increases with the optical
orvely.ner-Al-
qua-taltion.na-
itssen-ws
per-ure-
d fortruc-onedoxder-ture-clictore-theetalwascies
e thee
-f-ver,
ease-ion
ithsedy betricineler-r is
390 S. Kannan et al. / Journal of Catalysis 231 (2005) 381–392
Fig. 9. Scanning electron micrographs of (a) CuMgAl-51; (b) CuMgAl-11;and (c) CuMgAl-15.
Fig. 10. UV–vis diffuse reflectance (SKM function) spectra of (a) CuMg-
electronegativity difference between metal and ligand[31]:
νCT = 30,000(χopt(L) − χopt(M)
)cm−1
for ligand-to-metal charge transfer (LMCT), whereχopt (L)andχopt (M) are the optical electronegativities of the donand acceptor orbitals on the ligand and metal, respectiIn our series of catalysts, a continuous increase in the egies of the charge transfer transition was noted (CuMg51 = 39,370 cm−1; CuMgAl-15 = 41,720 cm−1) with anincrease in magnesium concentration. Based on the etion given above, the optical electronegativity of the meion decreases with an increase in magnesium concentraHere it is assumed that there is a negligible change in theture of the ligand (namely oxygen in the form of OH) andcoordination in the HT-like lattice. In other words, the eaof oxidation of Cu2+ increases with a decrease in its cocentration in the CuMgAl HT-like lattice and hence shohigher intrinsic activity.
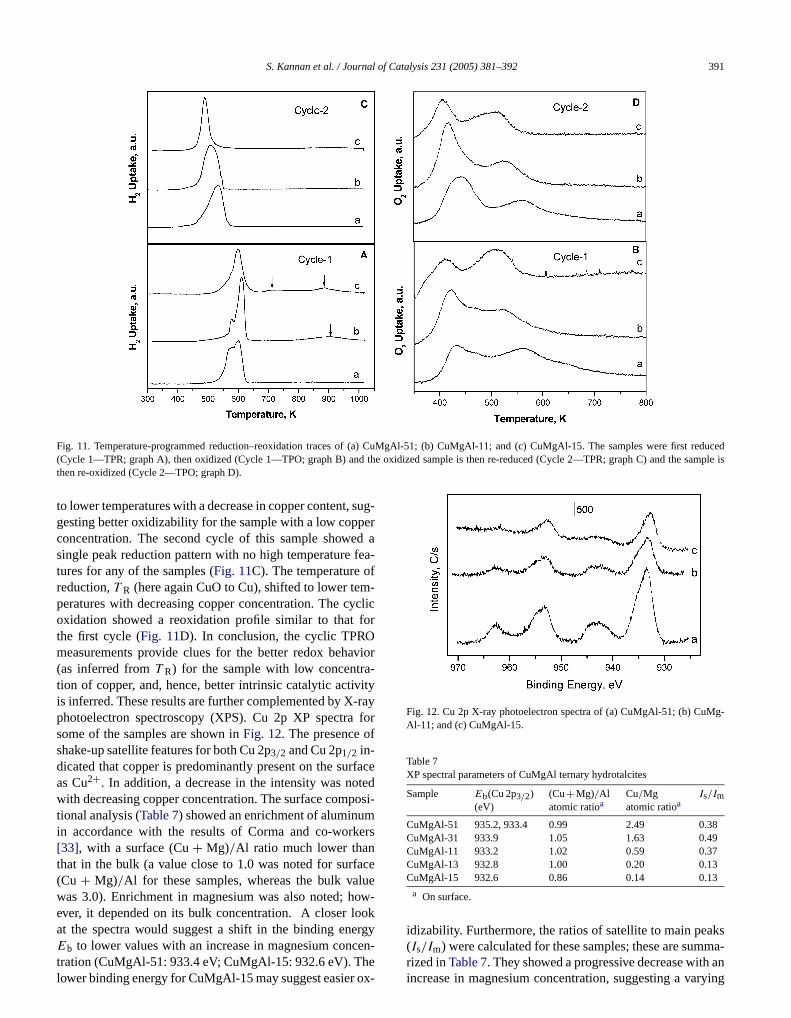
These results are further corroborated by cyclic temature-programmed reduction–reoxidation (TPRO) measments. Data for selected samples are shown inFig. 11. Itmust be admitted that these experiments were performecatalyst samples after/during heating (i.e., after the destion of the layered structure), whereas catalysis was dwith uncalcined layered materials. The analysis of the rebehavior of these materials, however, may add to the unstanding of the properties of these materials. Temperaprogrammed reduction and reoxidation were done in a cyform, in which the uncalcined hydrotalcite was subjectedreduction during heating in the first step, and the resultingduced matrix was then subjected to reoxidation. Duringsecond cycle, the oxidized form, present as a mixed-moxide, was subjected to reduction (at this stage thereno prevalence of a HT-like phase), and the reduced spewas subjected to reoxidation. Due care was taken to havcharacteristicK number around 100, well within the rangsuggested by Monti and Baiker, whereK is given by theformula K = n0/FCo, wheren0 is the initial amount ofreducible species in µmoles,F is the flow rate of the reducing gas mixture in cc s−1, andCo is the concentration oreductant in µmol cc−1. In the first reduction profile, a twostage reduction occurs at around 560 and 600 K; howethe intensity of the former peak decreases with a decrin copper concentration (Fig. 11A). This peak may be assigned to reduction of CuO formed through dehydroxylatof a HT-like network to Cu0 [32]. In addition, there werehigh temperature peaks of low intensity for the sample wlow copper concentration, the intensity of which increawith a decrease in copper content. This could tentativelexplained by in situ generation of some nonstoichiomeCuO (which may also be present as nonstoichiometric spsolid solution), which reduced at a relatively higher tempature. Such a formation may be favorable when coppe
Al-51; (b) CuMgAl-31; (c) CuMgAl-11; (d) CuMgAl-13; and (e) CuMg-Al-15 (top a and bottom e); inset: ordinate expanded region of d–d transi-tion.
present in a well-dispersed form. Reoxidation of this samplein oxygen revealed a similar two-stage reoxidation profile(Fig. 11B); however, the temperature of reoxidation shifted
S. Kannan et al. / Journal of Catalysis 231 (2005) 381–392 391
Fig. 11. Temperature-programmed reduction–reoxidation traces of (a) CuMgAl-51; (b) CuMgAl-11; and (c) CuMgAl-15. The samples were first reducedd the sample is
sugerd a
fea-f
-yclicfor
vior-ity
-rayfor
f
facetedosi-
mers
acelueow-okrgy
g-
ks
(Cycle 1—TPR; graph A), then oxidized (Cycle 1—TPO; graph B) anthen re-oxidized (Cycle 2—TPO; graph D).
to lower temperatures with a decrease in copper content,gesting better oxidizability for the sample with a low coppconcentration. The second cycle of this sample showesingle peak reduction pattern with no high temperaturetures for any of the samples (Fig. 11C). The temperature oreduction,T R (here again CuO to Cu), shifted to lower temperatures with decreasing copper concentration. The coxidation showed a reoxidation profile similar to thatthe first cycle (Fig. 11D). In conclusion, the cyclic TPROmeasurements provide clues for the better redox beha(as inferred fromT R) for the sample with low concentration of copper, and, hence, better intrinsic catalytic activis inferred. These results are further complemented by Xphotoelectron spectroscopy (XPS). Cu 2p XP spectrasome of the samples are shown inFig. 12. The presence oshake-up satellite features for both Cu 2p3/2 and Cu 2p1/2 in-dicated that copper is predominantly present on the suras Cu2+. In addition, a decrease in the intensity was nowith decreasing copper concentration. The surface comptional analysis (Table 7) showed an enrichment of aluminuin accordance with the results of Corma and co-work[33], with a surface (Cu+ Mg)/Al ratio much lower thanthat in the bulk (a value close to 1.0 was noted for surf(Cu + Mg)/Al for these samples, whereas the bulk vawas 3.0). Enrichment in magnesium was also noted; hever, it depended on its bulk concentration. A closer loat the spectra would suggest a shift in the binding ene
Eb to lower values with an increase in magnesium concen-tration (CuMgAl-51: 933.4 eV; CuMgAl-15: 932.6 eV). Thelower binding energy for CuMgAl-15 may suggest easier ox-oxidized sample is then re-reduced (Cycle 2—TPR; graph C) and the
-
Fig. 12. Cu 2p X-ray photoelectron spectra of (a) CuMgAl-51; (b) CuMAl-11; and (c) CuMgAl-15.
Table 7XP spectral parameters of CuMgAl ternary hydrotalcites
Sample Eb(Cu 2p3/2)(eV)
(Cu+Mg)/Alatomic ratioa
Cu/Mgatomic ratioa
Is/Im
CuMgAl-51 935.2, 933.4 0.99 2.49 0.38CuMgAl-31 933.9 1.05 1.63 0.49CuMgAl-11 933.2 1.02 0.59 0.37CuMgAl-13 932.8 1.00 0.20 0.13CuMgAl-15 932.6 0.86 0.14 0.13
a On surface.
idizability. Furthermore, the ratios of satellite to main pea
(Is/Im) were calculated for these samples; these are summa-rized inTable 7. They showed a progressive decrease with anincrease in magnesium concentration, suggesting a varying
l of C
sen
ili-sic
theoutessa-
tion.
nged aith
n ofre-oreashichtheeer
l ion,Nctro-
on,nksewci-theihe
i-
on,
Sci.
. 173
y,
bil-
.001)
A.M.em.
41
ng-
-
en-
lli,lids,ew
6.75.
04)
20
em.
hi,
an,
ay
pCH,
ier,
em.
392 S. Kannan et al. / Journa
charge density of copper atoms, although they are prein a similar HT-like lattice. The lower value ofIs/Im forCuMgAl-15 may suggest a facile reducibility of Cu2+. It isinferred that the facile redox behavior of this sample factates the oxidation reaction and in turn exhibits high intrinactivity.
4. Conclusions
CuMgAl ternary hydrotalcites with different Cu/Mgatomic compositions were successfully synthesized inentire composition range studied (from 5.0 to 0.2) withco-crystallization of any impurity phases. The orderlinof the HT-like lattice and the thermal stability of these mterials increased with increasing magnesium concentraActivity for selective hydroxylation of phenol with H2O2as oxidant and H2O as solvent increased with increasicopper concentration, whereas normalized activity showreverse trend. A mixed trend in the activity was noted wthe variation in the substrate/catalyst ratio. Comparisothe activity of as-synthesized hydrotalcites with their corsponding calcined forms indicated that the former are mactive than the latter. A variation in the activity trend wnoted when compared among the calcined samples, wwas due to varied phase compositions (influenced byCu/Mg atomic ratio, as indicated by in situ PXRD). Thbetter intrinsic activity for the sample with a lower coppcontent is caused by better dispersion of the active metahere Cu2+, and its facile redox behavior, as indicated by2adsorption measurements, cyclic TPRO, SEM, and spescopic measurements.
Acknowledgments
S.K. thanks the Alexander von Humboldt FoundatiBonn, Germany, for a research fellowship. S.K also thathe Council of Scientific and Industrial Research, NDelhi, India, for a research fellowship under the Young Sentist Scheme. The authors also thank the referees forconstructive criticism, which has definitively improved tquality of this paper.
References
[1] F. Trifirò, A. Vaccari, in: J.L. Atwood, J.E.D. Dasvies, D.D. MacN
col, F. Vogtle, J.-M. Lehn, G. Alberti, T. Bein (Eds.), ComprehensiveSupramolecular Chemistry, Solid State Supramolecular Chemistry:atalysis 231 (2005) 381–392
t
r
Two and Three-Dimensional Inorganic Networks, vol. 7, PergamOxford, 1996, p. 251.
[2] V. Rives, Layered Double Hydroxides: Present and Future, NovaPub. Inc., New York, 2001.
[3] K. Koteswara Rao, M. Gravelle, J.-S. Valente, F. Figueras, J. Catal(1998) 115.
[4] B.M. Choudary, M. Lakshmi Kantam, A. Rahman, V.Ch. ReddK. Koteswara Rao, Angew Chem. Int. Ed. 40 (2001) 763.
[5] D. Tichit, B. Coq, CATTECH 7 (2003) 206.[6] S. Narayanan, K. Krishna, Appl. Catal. A 198 (2000) 13.[7] R. Kalouskova, M. Novotna, Z. Vymazal, Polymer Degrad. Sta
ity 85 (2004) 903.[8] V. Rives, O. Prieto, A. Dubey, S. Kannan, J. Catal. 220 (2003) 161[9] A. Dubey, V. Rives, S. Kannan, Phys. Chem. Chem. Phys. 3 (2
4826.[10] A. Dubey, V. Rives, S. Kannan, J. Mol. Catal. A 181 (2002) 151.[11] I.J. Shannon, F. Rey, G. Sankar, J.M. Thomas, T. Maschmeyer,
Waller, A.E. Palomares, A. Corma, A.J. Dent, G.N. Greaves, J. ChSoc. Faraday Trans. 92 (1996) 4331.
[12] S.M. Auer, S.V. Gredig, R.A. Koppel, A. Baiker, J. Mol. Catal. 1(1999) 193.
[13] M. Trombetta, G. Ramis, G. Busca, B. Monanari, A. Vaccari, Lamuir 13 (1997) 4628.
[14] K. Iwai, T. Yamauchi, K. Hashimoto, T. Mizugaki, K. Ebitani, K. Kaneda, Chem. Lett. 58 (2003).
[15] Joint Committee on Powder Diffraction Standards, International Ctre for Diffraction Data, Pennsylvania, 1996 (Set No. 46).
[16] D.A.M. Monti, A. Baiker, J. Catal. 83 (1983) 323.[17] A. De Roy, C. Forano, K. El Malki, J.P. Besse, in: M.L. Occe
H. Robson (Eds.), Expanded Clays and Other Microporous SoSynthesis of Microporous Materials, Van Nostrand Reinhold, NYork, 1992, chap. 7, p. 108.
[18] R.D. Shannon, C.T. Prewitt, Acta Crystallogr. B 25 (1969) 925.[19] F.M. Labajos, V. Rives, M.A. Ulibarri, J. Mater. Sci. 27 (1992) 154[20] J. Perez-Ramirez, G. Mul, J.A. Moulijn, Vibr. Spectrosc. 27 (2001)[21] W.T. Reichle, CHEMTECH 16 (1986) 58.[22] S. Kannan, V. Rives, H. Knozinger, J. Solid State Chem. 177 (20
319.[23] S. Kannan, Tz. Venkov, K. Hadjiivanov, H. Knozinger, Langmuir
(2004) 730.[24] I. Melian-Cabrera, M.L. Granados, J.L.G. Fierro, Phys. Chem. Ch
Phys. 4 (2002) 3122.[25] A. Germain, M. Allian, F. Figueras, Catal. Today 32 (1996) 145.[26] S. Velu, K. Suzuki, M. Okazaki, M.P. Kapoor, T. Osaki, F. Ohas
J. Catal. 194 (2000) 373.[27] B.C. Lippens, J.H. de Boer, J. Catal. 4 (1965) 319.[28] J.G. Nunan, P.B. Himelfarb, R.G. Herman, K. Klier, C.E. Bogd
G.W. Simmons, Inorg. Chem. 28 (1989) 3868.[29] M.C. Marion, E. Garbowski, M. Primet, J. Chem. Soc. Farad
Trans. 86 (1990) 3027.[30] M. Che, F. Bozon-Verduraz, in: G. Ertl, H. Knozinger, J. Weitkam
(Eds.), Handbook of Heterogeneous Catalysis, vol. 2, Wiley–VWeinheim, 1997, p. 642.
[31] A.B.P. Lever, Inorganic Electronic Spectroscopy, third ed., ElsevAmsterdam, 1997.
[32] A. Alejandre, F. Medina, P. Salagre, X. Correig, J.E. Sueiras, ChMater. 11 (1999) 939.
[33] F. Marquez, A.E. Palomares, F. Rey, A. Corma, J. Mater. Chem. 11(2001) 1675.
Copyright © 2022 FDOKUMEN