Lower Limb Interjoint Postural Coordination One Year After First-Time Ankle Sprain
Upload
independentCategory
view
0download
0
Synovial cytokine expression in ankle osteoarthritis depends on age and stage
Hagen Schmal, Ralf Henkelmann, Alexander T. Mehlhorn, Kilian Reising, Gerrit Bode, Norbert P.
Südkamp, Philipp Niemeyer
Department of Orthopaedic Surgery, University of Freiburg Medical Center, Hugstetter Str. 55, D‐
79106 Freiburg, Germany
Corresponding address:
Hagen Schmal, M.D.
University of Freiburg Medical Center
Department of Orthopaedic Surgery
Hugstetter Str. 55
D‐79106 Freiburg i.Br.
e‐mail: [email protected]
Phone: +49 761 270 90160
Fax: +49 761 270 28000
Key words: ankle – osteoarthritis – Ankle Osteoarthritis Scoring System –CD105 – BMP‐7 –
aggrecan – biomarker – bFGF – clinical trial
Running title: Age‐related biochemistry of ankle osteoarthritis

Age‐related biochemistry of ankle osteoarthritis
Abstract 1
Purpose 2
Aim of the study was the analysis of cytokine expression in ankle osteoarthritis (OA) 3
hypothesizing age‐dependent regulation patterns. 4
Methods 5
Forty‐nine patients undergoing an arthroscopy of the ankle with different stages of chronic OA 6
were prospectively included in a clinical trial comparing the group <18 years (n=9, Ø15.1±2.0 years) 7
with the older patients (≥18 years, n=40, Ø36.5±11.9). Lavage fluids were analyzed by ELISA for levels 8
of aggrecan, BMP‐2/7, IGF‐1/R, bFGF, CD105, MMP‐13, IL‐1β. Additionally, clinical parameters and 9
scores (FFI, CFSS, AOFAS) were evaluated and supplemented by radiographic scores (Kellgren 10
Lawrence Score (KLS) for conventional X‐rays, Ankle Osteoarthritis Scoring System (AOSS) for MRI). 11
Results 12
In contrast to distribution of gender and BMI (p<0.005), parameters characterizing the cartilage 13
defect as ICRS grading, size and duration of symptoms were not dependent on age. The incidence of 14
osteochondritis disscecans (OCD) was higher in the group <18 years (p<0.006), but the average 15
degree of OCD grading was not different. KLS and AOSS were significantly higher in the group 16
≥18years (p<0.02). Correlating with the higher degree of OA in the elderly, clinical function measured 17
by FFI and AOFAS was statistically significant worse (p<0.05). Intraarticular concentrations of 18
aggrecan (3.1fold), bFGF (8.7fold), BMP‐7 (2.7fold) and CD105 (1.5fold) were statistically significant 19
higher in the group ≥18 years (p<0.03). 20
Conclusions 21
Confirming the hypothesis, increased synovial levels of aggrecan, bFGF, BMP‐7 and CD105 were 22
found in patients over 18 years. This correlated with a higher stage of OA determined by radiographic 23
Age‐related biochemistry of ankle osteoarthritis
changes or deteriorated function and may offer starting points for new diagnostics and 24
interventional strategies. 25
Level of Evidence: 2 26
Introduction 27
Development of osteoarthritis (OA) is not only accompanied by loss of cartilage, transformation 28
of the subchondral bone layer and loss of function, but also by a significant change of the 29
biochemical joint milieu [12]. Typical markers as collagen‐ [33] or proteoglycan fragments [25] have 30
been described following OA or cartilage damages in different joints in serum and urine. 31
Furthermore, specific expression and regulation of different proteins associated with cartilage 32
homeostasis in the joint cavity have been demonstrated in different anatomical regions [13]. E.g. IGF‐33
1 and bFGF were proteins with elevated concentrations associated to focal cartilage lesions in the 34
knee [35]. Moreover, it could be shown that synovial BMP‐2 levels indicated a favorable outcome 35
following cartilage regeneration [37]. Two important aspects seem to decisively influence the 36
composition of synovial cytokines. Firstly, several publications suggested a significant effect of the 37
type of joint on cartilage biology, because different biomechanics and symmetry [7] seem to 38
determine special cartilage properties and a specific biochemistry [1, 10]. This is supported by the 39
observation of joint specific pathologies as impingement syndroms or certain locations of 40
osteochondritis dissecans (OCD). Secondly, age is another important factor with significant impact on 41
the expression pattern of cytokines found in a joint. Not only the biochemical environment, but also 42
the surface expression of typical markers as collagen type II and aggrecan on chondrocytes used for 43
implantation has been demonstrated to be age dependent. This data indicated that open physes, 44
recognized as the typical skeletal aspect usually used for discrimination of children and adults, is not 45
sufficient describing maturation of cartilage. For this, expression of chondrogenic markers suggested 46
an age boarder between 18 and 20 years [38]. Specific marker expression and a particular 47
biochemical milieu have been shown to have implications on cartilage regenerating surgery that is 48
more successful in younger patients [34, 38]. 49

Age‐related biochemistry of ankle osteoarthritis
Taken these thoughts together, this study aimed to determine the effect of age on the 50
expression of synovial cytokines in ankles with different stages of chronic OA. In order to cover a 51
significant spectrum of different cytokines intraarticular concentrations of BMP‐2, BMP‐7, endoglin 52
(part of the BMPR‐1A complex, CD105), bFGF and IGF‐1 and its receptor as marker of intrinsic 53
cartilage repair, IL‐1β and MMP‐13 as a marker of inflammation, aggrecan as an integral part of the 54
extracellular matrix (ECM), and the total protein content were determined [35]. Since these proteins 55
are expected to be involved in OA progress, the comparison of synovial levels allows evaluation of 56
biochemical joint degeneration. For categorization of the different phases or stages of OA, scoring of 57
conventional X‐rays and MRIs was used in combination with functional evaluation [29]. The influence 58
of cartilage defect characteristics was also evaluated, because it has been shown that circumscribed 59
cartilage lesions influence the amount of certain mediators and proteins in the knee, and data for the 60
ankle are not available until now. Considering the described biomechanical and chondrogenic 61
distinctiveness results found in the knee are not simply transferable. Intention of the paper was to 62
verify the hypothesis that cytokine regulation during OA development in the ankle is dependent on 63
age. This may offer starting points for new diagnostics and interventional strategies in early OA. 64
Material and Methods 65
Forty‐nine patients were enrolled in a prospective clinical trial between November 2009 and May 66
2011. Patients were included following a performance of an arthroscopy of the ankle, when 67
agreement to participate in the study was assigned. Exclusion criteria were alcohol or drug abuse, 68
mental retardation with incapability to complete the necessary self‐reports and joint infection. 69
SPECIMEN COLLECTION 70
Synovial lavage fluids from ankles of patients undergoing an arthroscopy were intraoperatively 71
collected. Before starting the arthroscopy, 20 ml of sterile ringer solution was instilled into the joint 72
cavity. The fluid was mixed within the joint by repeated passive flexion‐extension and repeated 73
manipulation of the posterior and anterior ankle regions, and then was aspirated as described before 74

Age‐related biochemistry of ankle osteoarthritis
[35]. Specimens were centrifuged in order to separate the cells and then stored frozen at ‐80°C until 75
analyzed. 76
CHARACTERIZATION OF PATIENTS 77
The average age was 32.6±13.6 years, the ratio male/female was 31/18 (63%/37%). 15 patients 78
were treated operatively before (31%). 15 patients (31%) were smoker, 34 non‐smoker (69%).The 79
average body mass index (BMI) was 25.4±4.5. 33 patients had an arthroscopy because of an 80
osteochondritis dissecans (OCD) or long term consequences of OCD, further relevant diagnosis were 81
tibio‐talar impingement and osteophytes (11), ligament instability (2), removement of loose joint 82
bodies (3), chondromalacia (5), and cysts (1). Multiple diagnoses were possible for one patient. 83
Diagnoses were confirmed by a radiologist and a second orthopedic surgeon. Nine individuals were 84
younger than 18 years (average age 15.1±2.0 years), 40 patients were older than 17 years (average 85
age 36.5±11.9 years). The group separation at 18 years was chosen because cartilage maturation has 86
been suggested to be finished after 18 years based on surface marker expression [38]. Smoking 87
behavior was included, because this has been shown to have influence on intraarticular cytokine 88
expression [36]. 89
ELISAS FOR BMP2, BMP7, ENDOGLIN, bFGF, IGF1, IGF1R, IL1β, MMP13, 90
AGGRECAN, BCA (BICINCHONINIC ACID) PROTEIN ASSAY 91
In order to measure concentrations of the indicated proteins, commercially available ELISA kits 92
provided by R&D Systems (Wiesbaden‐Nordenstadt, Germany) for BMP‐2, BMP‐7, Endoglin (CD 105), 93
bFGF, IGF‐1, IGF‐1R, IL‐1β and BioSource (BioSource Deutschland GmbH, Solingen, Germany) for 94
aggrecan were used according to the manufacturers’ instructions. Briefly, the assay employs the 95
quantitative sandwich enzyme immunoassay technique. A specific MAb was pre‐coated onto a 96
microplate. Supernatants were applied to the wells and, after washing, an HRP‐conjugated specific 97
Ab was added to the wells. Following the next wash, color development was proportional to protein 98
concentration and was calculated by comparison with a standard. Measurements were done in 99
duplicates, and high stability and reproducibility assured by measuring the same samples at different 100

Age‐related biochemistry of ankle osteoarthritis
time points with concordant results. This confirmed the reliability of the storing procedure as well as 101
the ELISA method as also reported by the manufacturers. Furthermore, standard controls always had 102
standard deviations less than 5%. A colorimetric method was used in order to quantify total protein 103
amount in the lavage fluids. The bicinchoninic acid (BCA) assay was available in kit form from Pierce 104
(Rockford, Ill., USA) and was used according to the manufacturers’ instructions. Measurements were 105
done in quadruplicates. 106
ASSESSMENT OF SCORES 107
ANKLE OSTEOARTHRITIS SCORING SYSTEM (AOSS) 108
In order to quantify the OA related changes in the ankles by MRI the AOSS was developed. The 109
following criteria were assessed: 110
1. Depth of cartilage damage as described by Yulish [44] : grade 0 (0 points): no, grade 1 (1 111
point): <50% of total cartilage depth, grade 2 (2 points): >50%, grade 3 (3 points): full thickness 112
cartilage defects 113
The depth of cartilage loss was qualitatively rated in relation to the height of the adjacent intact 114
cartilage or the expected, normal cartilage contour. In doubt, the sagittal T2‐weighted sequence was 115
used for the final decision. 116
2. Defect of the subchondral bone [8]: grade 0 (0 points): no, grade 1 (1 point): minimal 117
(<2mm), grade 2 (2 points): moderate (2‐5mm), grade 3 (3 points): severe (>5mm) 118
The depth of the osseous component of the osteochondral defect was scored by estimating the 119
distance between the actual osteochondral defect and the extrapolated subchondral cortex mainly 120
based on evaluation of the coronary or sagittal T1‐weighted sequences. 121
3. Osteophytes [28]: grade 0 (0 points): no, grade 1 (1 point): minimal (<3mm), grade 2 (2 122
points): moderate (3‐5mm), grade 3 (3 points): severe (>5mm) 123
Size was measured from the base to the tip of the osteophyte, baseline was defined as the 124
natural course of the bone. 125

Age‐related biochemistry of ankle osteoarthritis
4. Subchondral cysts (largest diameter): grade 0 (0 points): no, grade 1 (1 point): minimal 126
(<3mm), grade 2 (2 points): moderate (3‐5mm), grade 3 (3 points): severe (>5mm) 127
Subchondral cysts were defined as structures of high signal intensity on T2‐weighted images in 128
the cancellous bone underlying the joint cartilage. 129
5. Bone marrow edema (largest diameter) [23]: grade 0 (0 points): no, grade 1 (1 point): 130
minimal (<5mm), grade 2 (2 points): moderate (5‐20mm), grade 3 (3 points): severe (>20mm) 131
Bone marrow edema was assessed as an area of increased signal intensity on T2‐weighted 132
images in the subchondral cancellous bone. 133
6. Anterolateral or anteromedial meniscoid [32]: 0 points: no, 1 point: yes 134
MR images were assessed for appearance of pathological anterolateral or anteromedial soft 135
tissue structures. 136
7. Effusion [43]: 0 points: no, 1 point: yes 137
If more than a small, physiological sliver of synovial fluid was observed in the T2 images, joint 138
effusion was assumed to be present. 139
8. Loose joint bodies [11]: 0 points: no, 1 point: yes 140
9. Synovitis [14]: 0 points: no, 1 point: yes 141
Synovitis was evaluated on sagittal images and was reflected by thickening and irregularity of the 142
normally pencil‐thin rim of high signal intensity synovium. 143
10. Soft tissue cysts (Baker cyst analog) [41]: 0 points: no, 1 point: yes 144
These structures may be considered as excrescences originating from the joint capsule. They are 145
depicted as a circumscribed mass with intermediate signal intensity on proton density‐weighted and 146
high signal intensity on T2‐weighted sequences and are usually observed in the triangle of calcaneus 147
and Achilles tendon. 148
There are 5 major (1‐5) and 5 minor (6‐10) criteria. The major criteria are evaluated with up to 3 149
points, the minor criteria with up to 1 point, respectively. The range of the total score is from 0 to 20 150
points. The development of the score was done in collaboration with a radiologist. The evaluation for 151
score validation was done by three different orthopaedic surgeons dedicated to knee‐ and ankle 152

Age‐related biochemistry of ankle osteoarthritis
surgery. All observers were masked to the patients’ biometrical data, and were trained using the 153
scoring form. Training was limited to 40 patients with discussion of results in order to create practical 154
and reproducible conditions. Evaluation of criteria was instructed by a radiologist. Intra‐observer 155
reproducibility was assessed using 2 months interval between the randomized readings. Evaluation 156
of each point was done based on the view of all image stacks using all functions including 157
magnification or ‘live sync’ (Impax®, Agfa HealthCare, Bonn, Germany). All patients underwent MR 158
imaging with a 1.5‐T system (Avanto; Siemens Medical Systems, Erlangen, Germany) with a dedicated 159
ankle surface four‐element phased‐array coil. We applied a standard protocol consisting of the 160
following MR sequences: coronal turbo inversion‐recovery magnitude, coronal spin‐echo T1‐161
weighted, axial fat‐saturated fast spin‐echo T2‐weighted, and sagittal fat‐saturated intermediate 162
weighted. For validation of the score the intra‐observer variability was determined, resulting in a 163
weighted κ of 0.74±0.14 (good agreement). Inter‐observer variability was determined, resulting in a 164
weighted κ of 0.62±0.10 (good agreement). 165
KELLGREN LAWRENCE SCORE (KLS) 166
This score has been assessed as described before [20] using an anterio‐posterior and a lateral 167
view of plane radiographs of the ankle. Mode of evaluation was the same as described for the AOSS. 168
Intra‐observer evaluation resulted in a κ of 0.64±0.05 (good agreement). Inter‐observer evaluation 169
resulted in a κ of 0.58±0.10 (moderate agreement). 170
CLINICAL SCORES 171
The following clinical scores describing the function of foot and ankle were evaluated within 14 172
days before the operation in order to quantify a possible loss of performance. The foot function 173
index (FFI) was introduced by Budiman‐Mak et al. [4] and used in the validated german version 174
published by Naal et al.[30]. The calcaneal fractures scoring system according to Kerr (CFSS) was 175
originally published in order to evaluate the function following calcaneal fractures [21]. Since then, it 176
was used in multiple settings describing function of foot and ankle. Furthermore, the ankle‐hindfoot 177

Age‐related biochemistry of ankle osteoarthritis
scale (AOFAS), one of the most used scores evaluating the function of foot and ankle with special 178
regard to the lower and upper ankle joint, was used [26]. Both last scores were applied using the 179
translated german and validated version [40]. In order to provide comparability with other studies, 180
three different and region‐specific scores were evaluated. ICRS Score for grading of cartilage damage 181
was determined as previously described [35] during arthroscopy by the surgeon. 182
The study was approved by the Ethical board of the University of Freiburg (AN‐EK‐FRBRG‐335/08) 183
and registered at the German Clinical Trials Register (CORRCYT, DRKS00000365). 184
Statistical analysis 185
All values were expressed as mean ± standard deviation if not otherwise indicated. For reasons of 186
validation, score evaluation was done by at least two different orthopaedic surgeons dedicated to 187
knee‐ and ankle surgery. In case of dissents, a consensus decision was made after discussion. 188
Individual group means of scores were compared with the rank sum U‐test. Power for comparing two 189
means was additionally calculated. Correlations were determined by calculating the Spearman 190
coefficient (ρ) for the predominantly not normally distributed values. Kappa (κ) statistics were used 191
to assess inter‐ and intra‐observer agreement in grading Kellgren Lawrence Score (KLS). A weighted 192
kappa was used when evaluating the Ankle Osteoarthritis Scoring System (AOSS). If the grade scores 193
agreed, the weighting was 1.00 (maximal agreement). If the scores differed by one grade, the 194
weighting was 0.66; if they differed by two, the weighting was 0.33; if they differed by three, the 195
weighting was 0.00 (no better than chance agreement). Values between 0 and 1 were interpreted 196
according to modified published guidelines (40): a κ value of 1.00–0.81 is considered very good 197
agreement, 0.80–0.61 good, 0.60–0.41 moderate, 0.40–0.21 fair, and 0.20–0.00 poor agreement. 198
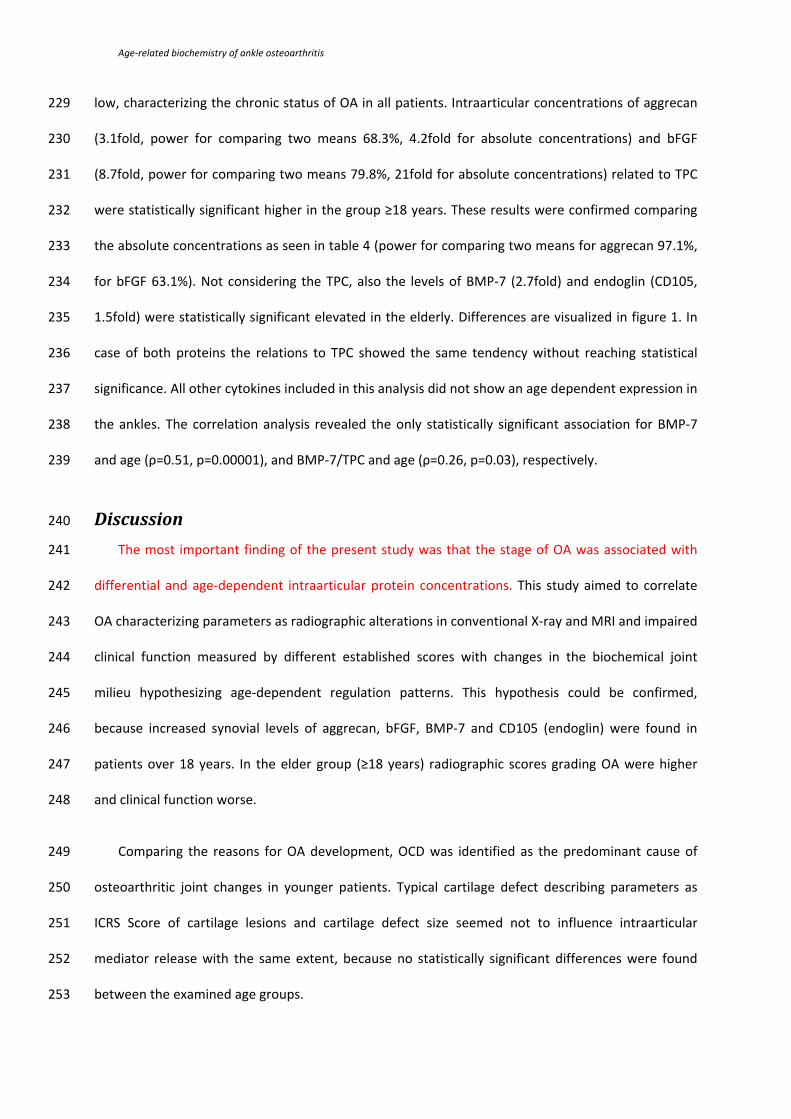
Incidences were compared using the chi square test. Statistical significance was defined when 199
P<0.05. 200
Results 201
Epidemiological parameters and defect characteristics 202

Age‐related biochemistry of ankle osteoarthritis
Distribution of gender, body mass index (BMI) and smoking behavior were clearly age dependent 203
(table 1). The association of BMI and age could be confirmed by a correlation analysis (ρ=0.48, 204
p=0.0002). The statistically significant difference between the age groups could not be shown for the 205
parameters characterizing the defect as duration of symptoms, ICRS Score of cartilage lesions and 206
cartilage defect size. This could be confirmed by the correlation analysis for ICRS Score and defect 207
size, in contrast duration of symptoms statistically significant correlated with age (ρ=0.39, p=0.005). 208
The incidence of osteochondritis disscecans (OCD) was higher in the group <18 years, but the average 209
degree of OCD grading according to Berndt and Harty [2] was not different. Data are summarized in 210
table 2. 211
Functional and radiological parameters characterizing OA of ankles 212
Both, the Kellgren Lawrence Score (KLS) and the Ankle Osteoarthritis Scoring System (AOSS), 213
quantifying OA related radiomorphometric changes in the analyzed ankles, were significantly lower 214
in the group of patients younger than 18 years. Correlation analysis demonstrated a statistically 215
significant association of KLS and age (ρ=0.36, p=0.01), this significance was missed in case of the 216
AOSS. Correlating with the higher degree of radiographic OA in the elderly, clinical function 217
measured by FFI and AOFAS was statistically significant worse (p<0.05). CFSS showed the same trend, 218
but missed statistical significance. Data are summarized in table 3. Correlation analysis confirmed 219
decreasing function with increasing age (ρ=0.41, and p=0.003 for FFI, ρ=‐0.36 and p=0.01 for CFSS, 220
ρ=‐0.47 and p=0.0006 for AOFAS). 221
Intraarticular protein expression comparing children/adolescents and adults 222
In order to minimize the bias made by a possible dilution during the process of specimen 223
collection and joint lavage, the synovial level of a specific protein was analyzed based on the absolute 224
concentration and in relation to the total protein content (TPC). Since with determination of TPC a 225
further variable was added, which always offers the possibility for another mistake, both the 226
absolute values and the relation were compared between the groups. TPC was higher in the group of 227
adults, but the difference did not reach statistical significance. Overall, the levels of IL‐1β were very 228
Age‐related biochemistry of ankle osteoarthritis
low, characterizing the chronic status of OA in all patients. Intraarticular concentrations of aggrecan 229
(3.1fold, power for comparing two means 68.3%, 4.2fold for absolute concentrations) and bFGF 230
(8.7fold, power for comparing two means 79.8%, 21fold for absolute concentrations) related to TPC 231
were statistically significant higher in the group ≥18 years. These results were confirmed comparing 232
the absolute concentrations as seen in table 4 (power for comparing two means for aggrecan 97.1%, 233
for bFGF 63.1%). Not considering the TPC, also the levels of BMP‐7 (2.7fold) and endoglin (CD105, 234
1.5fold) were statistically significant elevated in the elderly. Differences are visualized in figure 1. In 235
case of both proteins the relations to TPC showed the same tendency without reaching statistical 236
significance. All other cytokines included in this analysis did not show an age dependent expression in 237
the ankles. The correlation analysis revealed the only statistically significant association for BMP‐7 238
and age (ρ=0.51, p=0.00001), and BMP‐7/TPC and age (ρ=0.26, p=0.03), respectively. 239
Discussion 240
The most important finding of the present study was that the stage of OA was associated with 241
differential and age‐dependent intraarticular protein concentrations. This study aimed to correlate 242
OA characterizing parameters as radiographic alterations in conventional X‐ray and MRI and impaired 243
clinical function measured by different established scores with changes in the biochemical joint 244
milieu hypothesizing age‐dependent regulation patterns. This hypothesis could be confirmed, 245
because increased synovial levels of aggrecan, bFGF, BMP‐7 and CD105 (endoglin) were found in 246
patients over 18 years. In the elder group (≥18 years) radiographic scores grading OA were higher 247
and clinical function worse. 248
Comparing the reasons for OA development, OCD was identified as the predominant cause of 249
osteoarthritic joint changes in younger patients. Typical cartilage defect describing parameters as 250
ICRS Score of cartilage lesions and cartilage defect size seemed not to influence intraarticular 251
mediator release with the same extent, because no statistically significant differences were found 252
between the examined age groups. 253

Age‐related biochemistry of ankle osteoarthritis
Although different pathologies impair either biomechanics or biochemistry of the ankle a 254
common final path seems to develop during OA independent of the initiating event. These changes 255
include loss of cartilage, narrowing of the joint space, sclerosis of the subchondral bone layer, 256
formation of cysts and osteophytes. This is associated with a deterioration of motion range, function 257
and pain development [5]. At the same time the biochemical milieu of the affected joint changes 258
[15]. This paper analyzed the concordant transformation of all these parameters in OA of the ankle 259
with special regard to cytokines and proteins that play significant roles in cartilage metabolism and 260
age. The increase of proteoglycan fragments in synovial fluid during OA has been described earlier 261
[25] in the knee. This is in line with our findings of increased intraarticular aggrecan levels associated 262
with progress of OA reflected by radiographic and functional changes. The simple presence of 263
cartilage lesions without advanced clinical and radiographic signs of OA did not influence 264
intraarticular aggrecan levels [35]. This again correlates with our findings that the characteristics of 265
the cartilage defect had no or at least a less penetrating effect within the general development of 266
OA. bFGF has been described as a typical catabolic cytokine in cartilage metabolism, which is often 267
involved in repair processes inducing a shift towards proliferation by decreasing chondrogenic 268
differentiation at the same time [39]. Similar effects have been described after gene transfer with 269
bFGF [27]. Furthermore, increased bFGF concentrations were found in human knee joints with focal 270
cartilage defects [35]. This is confirmed by the data of this analysis; here bFGF levels correlated with 271
impaired function and disturbed radiomorphometry during OA development in ankles. Different 272
effects of BMP‐7 on chondrocytes and cartilage metabolism have been shown, describing this 273
cytokine as anabolic by enhancing production of extracellular matrix and promoting chondrogenic 274
differentiation [6]. Furthermore, it was demonstrated that BMP‐7 may possibly serve as an indicating 275
parameter for determining OA severity, because levels were increased with OA stage in primary knee 276
OA [17]. On the other hand, synovial BMP‐7 concentrations were not increased in case of isolated 277
cartilage lesions in the knee [35]. Although data about BMP‐7 regulation in the ankle are missing, the 278
results found in knees pretty much mirror the data presented in this study for the ankle. Endoglin, 279
part of the BMP‐receptor complex, has been used as one marker for synovia cells with progenitor 280

Age‐related biochemistry of ankle osteoarthritis
quality [24] and was elevated in serum and synovial fluid during knee OA [18]. This is in line with our 281
findings for the ankle. For the majority of different proteins no statistically significant differences 282
could be found between the different examined age groups. This also adds important aspects to the 283
interpretation of the data gathered. Pro‐inflammatory cytokines are supposed to be up‐regulated 284
during initial events of OA as trauma or acute inflammation. Overall, levels of analyzed IL‐1β were 285
relatively low in the whole population indicating a chronic state of OA. This correlates with relevant 286
periods of time between onset of symptoms and operation, during which the lavage was collected. 287
This is further confirmed by the missing differential regulation of cytokines downstream of the IL‐1β 288
triggered signaling as MMP‐13. Similarly, in a study looking for TNFα levels in knees with chronic OA a 289
correlation to KLS was missing [31]. 290
Although characteristics of chondrocytes of different origins show significant discrepancies [10], 291
similar regulation patterns could be found comparing knee and ankle. Age‐dependent expression of 292
synovial cytokines [36] and specific age‐related expression of surface markers on chondrocytes [38] 293
have been described before. But the presented data suggest that the influence of age on synovial 294
cytokine expression is less than the joint alterations caused by OA. The differences between the 295
investigated age groups are very likely caused by the increasing stage of OA with age. The authors are 296
aware of the fact that OA development is influenced by numerous factors including a genetically 297
predisposition [16]; and vice versa age itself has significant associations to parameters interacting 298
with OA progress as obesity. BMI and gender have been reported to be OA determining 299
characteristics [42], and both parameters were different in our groups, which indicates the 300
difficulties for definition of independent risk factors for OA development, even considering 301
application of statistical logistic regression models. For this approach the limited case number as 302
collected for the presented study becomes a problem. This is further complicated by the 303
heterogeneous clinical indications for ankle arthroscopy in the investigated collective. Despite of the 304
mentioned limitations, the question may be raised, what the clinical implications of these findings 305
are. There are two major aspects associated with the knowledge of different cytokine expression 306

Age‐related biochemistry of ankle osteoarthritis
comparing adolescents and adults. Firstly, determination of proteins in the lavage fluid offers a 307
possibility for new diagnostic procedures. Secondly, differential regulation of intraarticular 308
biochemistry potentially indicates a starting point for biological interventions as it has been done 309
before by application of anabolic BMP‐7 [19]. Considering that circumscribed cartilage lesions or 310
early OA usually appear as indications for microfracturing or autologous chondrocyte implantation, 311
the importance of knowledge about cytokine regulation during this pathology becomes evident, 312
because it has influence on the outcome. Although advanced OA has a common final path 313
characterized by matrix degrading enzymes and pro‐inflammatory mediators [13], early OA may be 314
associated with differential biochemical regulation patterns determined by the triggering pathology. 315
Although some scores exist to measure changes in ankles with MRI following injury [45], OCD [3] 316
or hemophilia [9], there is no validated score evaluating OA related changes. This lead us to develop 317
and validate an own scoring system based on the majority of published, clinically relevant diagnostic 318
findings [23, 28, 43]. The results for intra‐ and interobserver reliability were comparable to the 319
established Kellgren Lawrence Score and reproduce values achieved in semiquantitative MRI scoring 320
of the knee [22]. The composition of the AOSS takes clinical relevance with specific ankle pathologies 321
into account and enables scientific analysis of subgroups. The reliability of the AOSS was 322
demonstrated by results resembling the analysis with the Kellgren Lawrence Score. Differences seen 323
may explained by the fact that changes related to early OCD resulted in high AOSS scores with 324
partially low KLS. 325
The limitations of the study as the number of patients, the heterogeneous indicating pathologies 326
and the differences in epidemiological parameters characterizing the populations compared may 327
lead to new scientific studies in the future with adapted design. However, the finding of different 328
regulation patterns of intraarticular cytokines in children and adolescents compared to adults in early 329
OA offers new clinical aspects for differential diagnostics using the analysis of synovial effusions. 330
Furthermore, the conceptual design for possible intervention studies may be worked out on the basis 331
of the identified differential regulated proteins. 332

Age‐related biochemistry of ankle osteoarthritis
Conclusion 333
Summarizing, data of this study indicate that OA of the ankle leads besides loss of function and 334
radiographic alterations to a distinct intraarticular composition of proteins related to cartilage 335
metabolism. Statistically significant differences could be described for synovial expression of 336
aggrecan, bFGF, BMP‐7 and CD105. Both, levels of these proteins and OA characterizing parameters, 337
correlated with age but not with properties of cartilage lesions. 338
Legend 339
Figure 1 340
The proteins bFGF (A), BMP‐7 (B), CD105 (endoglin) (C) and aggrecan (D) were found to be 341
differentially expressed in the age groups ≥18 years and <18 years. 342
Table 1: 343
Comparison of epidemiological parameters and defect characteristics between 344
children/adolescents and adults, m – male, f – female, y – yes, n ‐ no, *t‐test, #chi square test, + U‐test 345
Mann‐Whitney 346
Table 2: 347
Comparison of defect characteristics between children/adolescents and adults, m – male, f – 348
female, y – yes, n ‐ no, *t‐test, #chi square test, + U‐test Mann‐Whitney 349
Table 3: 350
Comparison of functional and radiological parameters between children/adolescents and adults, 351
FFI ‐ foot function index (reverse scale), CFSS ‐ calcaneal fractures scoring system according to Kerr, 352
AOFAS ‐ ankle‐hindfoot scale, KLS ‐ Kellgren Lawrence Score, AOSS ‐ ankle osteoarthritis scoring 353
system, n.s. – not significant, + U‐test Mann‐Whitney 354
Table 4: 355
Age‐related biochemistry of ankle osteoarthritis
Comparison of intraarticular protein expression between children/adolescents and adults, TP – 356
total protein content, MMP‐13 ‐ matrix metalloproteinase‐13, Il‐1β – interleukin‐1 β, bFGF – basic 357
fibroblast growth factor, BMP‐2 and BMP‐7 ‐ bone morphogenetic protein‐2 and 7, IGF‐1 ‐ insulin‐like 358
growth factor 1, IGF‐1R ‐ insulin‐like growth factor 1 receptor, CD105 ‐ endoglin, n.s. – not significant, 359
*t‐test for unequal variances (Aspin‐Welch) 360
Acknowledgements 361
The study was funded by the AO Foundation Germany and the Department of Education and 362
Research Germany (01EC1001D). We thank Prof. Christian Lohrmann, Department of Radiology, 363
University of Freiburg Medical Center, for instructions and recommendations regarding the Ankle 364
Osteoarthritis Scoring System. 365
References 366
1. Aurich M, Eger W, Rolauffs B, Margulis A, Kuettner KE, Mollenhauer JA, Cole AA (2006) [Ankle 367 chondrocytes are more resistant to Interleukin‐1 than chondrocytes derived from the knee]. 368 Orthopade 35:784–790 369
2. Berndt AL, Harty M (1959) Transchondral fractures (osteochondritis dissecans) of the talus. J 370 Bone Joint Surg Am 41‐A:988–1020 371
3. Bohndorf K (1998) Osteochondritis (osteochondrosis) dissecans: a review and new MRI 372 classification. Eur Radiol 8:103–112 373
4. Budiman‐Mak E, Conrad KJ, Mazza J, Stuck RM (2013) A review of the Foot Function Index and 374 the Foot Function Index ‐‐ revised. J Foot Ankle Res 6:5 375
5. Choi WJ, Choi GW, Kwon H‐M, Lee JW (2013) Arthroscopic treatment in mild to moderate 376 osteoarthritis of the ankle. Knee Surg Sports Traumatol Arthrosc 21:1338‐44 377
6. Chubinskaya S, Hurtig M, Rueger DC (2007) OP‐1/BMP‐7 in cartilage repair. Int Orthop 31:773–378 81 379
7. Van Dijk CN, Reilingh ML, Zengerink M, van Bergen CJA (2010) Osteochondral defects in the 380 ankle: why painful? Knee Surg Sports Traumatol Arthrosc 18:570–580 381
8. Doria AS, Babyn PS, Lundin B, Kilcoyne RF, Miller S, Rivard GE, Moineddin R, Pettersson H 382 (2006) Reliability and construct validity of the compatible MRI scoring system for evaluation of 383 haemophilic knees and ankles of haemophilic children. Expert MRI working group of the 384 international prophylaxis study group. Haemophilia 12:503–513 385
9. Doria AS, Lundin B, Miller S, Kilcoyne R, Dunn A, Thomas S, Rivard G, Moineddin R, Babyn PS 386 (2008) Reliability and construct validity of the compatible MRI scoring system for evaluation of 387 elbows in haemophilic children. Haemophilia 14:303–314 388
10. Eger W, Aurich M, Schumacher BL, Mollenhauer J, Kuettner KE, Cole AA (2003) [Differences in 389 metabolism of chondrocytes of the knee and ankle joint]. Z Orthop Ihre Grenzgeb 141:18–20 390
11. Galat DD, Ackerman DB, Spoon D, Turner NS, Shives TC (2008) Synovial chondromatosis of the 391 foot and ankle. Foot Ankle Int 29:312–317 392
12. Goldring MB, Otero M (2011) Inflammation in osteoarthritis. Curr Opin Rheumatol 23:471–478 393 13. Goldring MB, Otero M, Tsuchimochi K, Ijiri K, Li Y (2008) Defining the roles of inflammatory and 394
anabolic cytokines in cartilage metabolism. Ann Rheum Dis 67 Suppl 3:75–82 395

Age‐related biochemistry of ankle osteoarthritis
14. Hao D‐P, Zhang J‐Z, Xu W‐J, Wang Z‐C, Wang X‐N (2011) Pigmented villonodular synovitis of the 396 ankle: radiologic characteristics. J Am Podiatr Med Assoc 101:252–258 397
15. Haseeb A, Haqqi TM (2013) Immunopathogenesis of osteoarthritis. Clin. Immunol. 146:185–196 398 16. Hashimoto S, Rai MF, Janiszak KL, Cheverud JM, Sandell LJ (2012) Cartilage and bone changes 399
during development of post‐traumatic osteoarthritis in selected LGXSM recombinant inbred 400 mice. Osteoarthr Cartil 20:562–571 401
17. Honsawek S, Chayanupatkul M, Tanavalee A, Sakdinakiattikoon M, Deepaisarnsakul B, 402 Yuktanandana P, Ngarmukos S (2009) Relationship of plasma and synovial fluid BMP‐7 with 403 disease severity in knee osteoarthritis patients: a pilot study. Int Orthop 33:1171–5 404
18. Honsawek S, Tanavalee A, Yuktanandana P (2009) Elevated circulating and synovial fluid 405 endoglin are associated with primary knee osteoarthritis severity. Arch Med Res 40:590–594 406
19. Hunter DJ, Pike MC, Jonas BL, Kissin E, Krop J, McAlindon T (2010) Phase 1 safety and 407 tolerability study of BMP‐7 in symptomatic knee osteoarthritis. BMC Musculoskelet Disord 408 11:232 409
20. Kellgren JH, Lawrence JS (1957) Radiological assessment of osteo‐arthrosis. Ann Rheum Dis 410 16:494–502 411
21. Kerr PS, Prothero DL, Atkins RM (1996) Assessing outcome following calcaneal fracture: a 412 rational scoring system. Injury 27:35–38 413
22. Kornaat PR, Ceulemans RYT, Kroon HM, Riyazi N, Kloppenburg M, Carter WO, Woodworth TG, 414 Bloem JL (2005) MRI assessment of knee osteoarthritis: Knee Osteoarthritis Scoring System 415 (KOSS)‐‐inter‐observer and intra‐observer reproducibility of a compartment‐based scoring 416 system. Skeletal Radiol 34:95–102 417
23. Korompilias AV, Karantanas AH, Lykissas MG, Beris AE (2009) Bone marrow edema syndrome. 418 Skeletal Radiol 38:425–436 419
24. Kurose R, Ichinohe S, Tajima G, Horiuchi S, Kurose A, Sawai T, Shimamura T (2010) 420 Characterization of human synovial fluid cells of 26 patients with osteoarthritis knee for 421 cartilage repair therapy. Int J Rheum Dis 13:68–74 422
25. Lohmander LS, Dahlberg L, Ryd L, Heinegård D (1989) Increased levels of proteoglycan 423 fragments in knee joint fluid after injury. Arthritis Rheum 32:1434–42 424
26. Madeley NJ, Wing KJ, Topliss C, Penner MJ, Glazebrook MA, Younger AS (2012) Responsiveness 425 and validity of the SF‐36, Ankle Osteoarthritis Scale, AOFAS Ankle Hindfoot Score, and Foot 426 Function Index in end stage ankle arthritis. Foot Ankle Int 33:57–63 427
27. Madry H, Orth P, Kaul G, Zurakowski D, Menger MD, Kohn D, Cucchiarini M (2010) Acceleration 428 of articular cartilage repair by combined gene transfer of human insulin‐like growth factor I and 429 fibroblast growth factor‐2 in vivo. Arch Orthop Trauma Surg 130:1311–1322 430
28. McCauley TR, Kornaat PR, Jee WH (2001) Central osteophytes in the knee: prevalence and 431 association with cartilage defects on MR imaging. AJR Am J Roentgenol 176:359–364 432
29. Moon J‐S, Shim J‐C, Suh J‐S, Lee W‐C (2010) Radiographic predictability of cartilage damage in 433 medial ankle osteoarthritis. Clin Orthop Relat Res 468:2188–2197 434
30. Naal FD, Impellizzeri FM, Huber M, Rippstein PF (2008) Cross‐cultural adaptation and validation 435 of the Foot Function Index for use in German‐speaking patients with foot complaints. Foot 436 Ankle Int 29:1222–1228 437
31. Orita S, Koshi T, Mitsuka T, Miyagi M, Inoue G, Arai G, Ishikawa T, Hanaoka E, Yamashita K, 438 Yamashita M, Eguchi Y, Toyone T, Takahashi K, Ohtori S (2011) Associations between 439 proinflammatory cytokines in the synovial fluid and radiographic grading and pain‐related 440 scores in 47 consecutive patients with osteoarthritis of the knee. BMC Musculoskelet Disord 441 12:144 442
32. Robinson P, White LM, Salonen DC, Daniels TR, Ogilvie‐Harris D (2001) Anterolateral ankle 443 impingement: mr arthrographic assessment of the anterolateral recess. Radiology 221:186–190 444
33. Rousseau JC, Garnero P (2012) Biological markers in osteoarthritis. Bone 51:265–277 445 34. Salzmann GM, Sah B‐R, Schmal H, Niemeyer P, Sudkamp NP (2012) Microfracture for treatment 446
of knee cartilage defects in children and adolescents. Pediatr Rep 4:e21 447

Age‐related biochemistry of ankle osteoarthritis
35. Schmal H, Mehlhorn A, Stoffel F, Köstler W, Südkamp NP, Niemeyer P (2009) In vivo 448 quantification of intraarticular cytokines in knees during natural and surgically induced cartilage 449 repair. Cytotherapy 11:1065–1075 450
36. Schmal H, Niemeyer P, Südkamp NP, Gerlach U, Dovi‐Akue D, Mehlhorn AT (2011) Pain 451 perception in knees with circumscribed cartilage lesions is associated with intra‐articular IGF‐1 452 expression. Am J Sports Med 39:1989–1996 453
37. Schmal H, Niemeyer P, Zwingmann J, Stoffel F, Südkamp NP, Mehlhorn AT (2010) Association 454 between expression of the bone morphogenetic proteins 2 and 7 in the repair of circumscribed 455 cartilage lesions with clinical outcome. BMC Musculoskelet Disord 11:170 456
38. Schmal H, Pestka JM, Salzmann G, Strohm PC, Südkamp NP, Niemeyer P (2013) Autologous 457 chondrocyte implantation in children and adolescents. Knee Surg Sports Traumatol Arthrosc 458 21:671–677 459
39. Schmal H, Zwingmann J, Fehrenbach M, Finkenzeller G, Stark GB, Südkamp NP, Hartl D, 460 Mehlhorn AT (2007) bFGF influences human articular chondrocyte differentiation. Cytotherapy 461 9:184–93 462
40. Schuh A, Hausel M (2000) [Difficulties in evaluating follow‐up outcome in calcaneus fracture 463 managed with plate osteosynthesis. Is there a reliable score?]. Unfallchirurg 103:295–300 464
41. Sit M, Higgs JB (2009) Non‐popliteal synovial rupture. J Clin Rheumatol 15:185–189 465 42. Spector TD, Hart DJ, Doyle DV (1994) Incidence and progression of osteoarthritis in women with 466
unilateral knee disease in the general population: the effect of obesity. Ann Rheum Dis 53:565–467 568 468
43. Ba‐Ssalamah A, Schibany N, Puig S, Herneth AM, Noebauer‐Huhmann IM, Trattnig S (2002) 469 Imaging articular cartilage defects in the ankle joint with 3D fat‐suppressed echo planar 470 imaging: comparison with conventional 3D fat‐suppressed gradient echo imaging. J Magn 471 Reson Imaging 16:209–216 472
44. Yulish BS, Montanez J, Goodfellow DB, Bryan PJ, Mulopulos GP, Modic MT (1987) 473 Chondromalacia patellae: assessment with MR imaging. Radiology 164:763–766 474
45. Zanetti M, De Simoni C, Wetz HH, Zollinger H, Hodler J (1997) Magnetic resonance imaging of 475 injuries to the ankle joint: can it predict clinical outcome? Skeletal Radiol. 26:82–88 476
477

Age<18years Age≥18years P Age 15.1±2.0 years 36.5±11.9 years <0.0001*
Gender m/f 2/7 29/11 <0.005# BMI 21.7±1.9 26.3±4.5 <0.0001*
Smoker y/n 0/9 (0%) 15/25 (38%) <0.03#
Tab. 1: Comparison of epidemiological parameters and defect characteristics between children/adolescents and adults, m – male, f – female, y – yes, n ‐ no, *t‐test, #chi square test, + U‐test Mann‐Whitney

Age<18years Age≥18years P Duration of symptoms 15.0±26.1 months 43.4±44.6 months n.s.* ICRS score 1.3±1.1 2.1±1.5 n.s.+ Defect size 0.4±0.4 1.3±2.6 n.s.* OCD grading 1.7±1.0 1.4±1.4 n.s.+ Prevalence OCD 7/9 (78%) 21/40 (52%) <0.006#
Tab. 2: Comparison of defect characteristics between children/adolescents and adults, m – male, f – female, y – yes, n ‐ no, *t‐test, #chi square test, + U‐test Mann‐Whitney
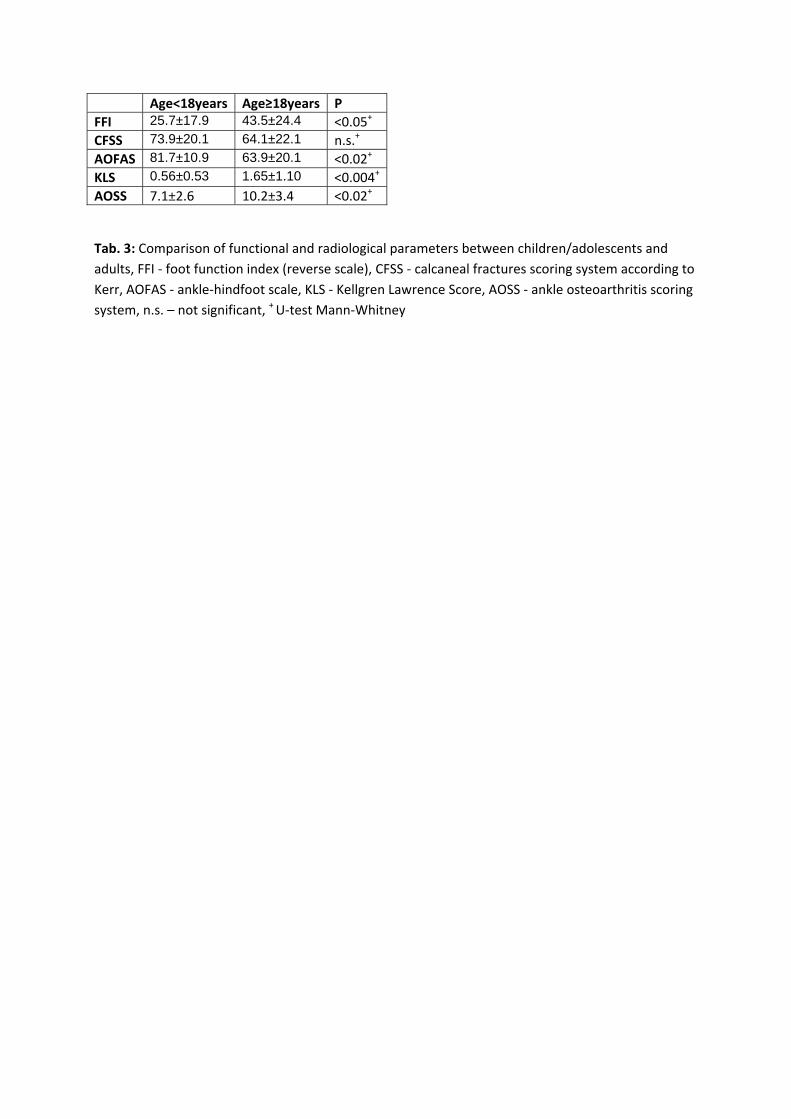
Age<18years Age≥18years P FFI 25.7±17.9 43.5±24.4 <0.05+ CFSS 73.9±20.1 64.1±22.1 n.s.+ AOFAS 81.7±10.9 63.9±20.1 <0.02+ KLS 0.56±0.53 1.65±1.10 <0.004+
AOSS 7.1±2.6 10.2±3.4 <0.02+
Tab. 3: Comparison of functional and radiological parameters between children/adolescents and adults, FFI ‐ foot function index (reverse scale), CFSS ‐ calcaneal fractures scoring system according to Kerr, AOFAS ‐ ankle‐hindfoot scale, KLS ‐ Kellgren Lawrence Score, AOSS ‐ ankle osteoarthritis scoring system, n.s. – not significant, + U‐test Mann‐Whitney

Age<18years Age≥18years P MMP‐13 (pg/ml) 10.5±31.6 8.9±21.2 n.s.* MMP‐13/TP 0.09±0.26 0.06±0.15 n.s.* Il‐1β (pg/ml) 7.8±3.7 10.1±9.5 n.s.* Il‐1β/TP 0.03±0.03 0.04±0.07 n.s.* bFGF (pg/ml) 5.4±6.9 112.4±294.8 <0.03* bFGF/TP 0.03±0.05 0.26±0.51 <0.008*
BMP‐2 (pg/ml) 110.5±83.1 90.8±88.5 n.s.* BMP‐2/TP 0.53±1.09 0.60±1.19 n.s.* BMP‐7 (pg/ml) 17.3±11.3 46.7±44.2 <0.001*
BMP‐7/TP 0.09±0.09 0.20±0.33 n.s.* IGF‐1 (pg/ml) 849.4±1329.2 334.6±202.6 n.s.* IGF‐1/TP 4.02±8.08 1.55±2.20 n.s.* IGF‐1R (pg/ml) 270.9±268.1 395.9±509.0 n.s.* IGF‐1R/TP 1.14±1.46 1.34±1.62 n.s.* CD105 (pg/ml) 773.6±347.7 1177.9±692.4 <0.02* CD105/TP 3.17±2.38 6.12±10.70 n.s.* Aggrecan (pg/ml) 14225.7±10370.6 59762.2±71574.3 <0.001*
Aggrecan/TP 44.7±37.8 139.8±233.7 <0.02* TP (mg/ml) 400.0±317.6 602.7±643.1 n.s.*
Tab. 4: Comparison of intraarticular protein expression between children/adolescents and adults, TP – total protein content, MMP‐13 ‐ matrix metalloproteinase‐13, Il‐1β – interleukin‐1 β, bFGF – basic fibroblast growth factor, BMP‐2 and BMP‐7 ‐ bone morphogenetic protein‐2 and 7, IGF‐1 ‐ insulin‐like growth factor 1, IGF‐1R ‐ insulin‐like growth factor 1 receptor, CD105 ‐ endoglin, n.s. – not significant, *t‐test for unequal variances (Aspin‐Welch)

Figure 1:
120
140
)21foldA
50
60
l)
2.7foldB
60
80
100
FGF (pg/ml)
20
30
40
MP‐7 (pg/ml
0
20
40
≥18y <18y
b
0
10
≥18y <18y
BM
≥18y <18yAge
≥18y <18yAge
1600
1.5foldC80000
4.2foldD
1000
1200
1400
(pg/ml)
50000
60000
70000
an (p
g/ml)
200
400
600
800
Endo
glin
10000
20000
30000
40000
Aggreca
0
≥18y <18yAge
0
≥18y <18yAge
Copyright © 2022 FDOKUMEN