Symptom prevalence in the community - NCBI
8
THE PATIENT'S POINT OF VIEW Symptom prevalence in the community D. R. HANNAY, ma, ph.d,mfcm,mrccp, dch Senior Lecturer in General Practice, University of Glasgow, Scotland SUMMARY. The prevalence of physical symp¬ toms among a sample of patients registered at a health centre is described as recorded from home interviews. The number of physical symp¬ toms per person is then correlated with personal characteristics and environmental factors, using computer programmes. Introduction A CONSIDERABLE amount has been written about presenting complaints in general practice (Journal ofthe Royal College of General Practitioners, 1973), but there is less information available about morbidity in the community especially when carefully defined by symptomatology. Aim The aim was to determine the prevalence of symptoms among people living in the community. Method A random sample was drawn from the practice lists of a health centre in Glasgow and these patients were interviewed in their homes over the course of a year. There were 44 grouped questions on physical symptoms which were designed to be mutually exclusive and to cover every possibility. The questions were phrased in simple non-technical language and referred to feelings people might have noticed about themselves rather than to diseases. Where medical conditions were defined in terms of symptoms the appropriate method- ology was used, for instance for chronic bronchitis (Cochrane and Fletcher, 1968), angina, and intermittent claudication (Rose, 1962). The answers were purely subjective responses and no objective clinical signs or tests were included. The questions were asked of the present, or previous two weeks only, and therefore the results represent a two-week period prevalence. © Journal ofthe Royal College of General Practitioners, 1978,28, 492-499. In addition to symptoms there was information on personal characteristics and environmental factors, such as housing, mobility, and employment. Computer programmes for bivariate and multivariate analysis were used to explore associations between such vari- ables and the prevalence of physical symptoms (Nie et al, 1970). Mental symptoms were asked separately and are not included here. Random monthly samples without replacement were drawn from the computer file of the health centre over the course of a year. It was found that 46 per cent of the patients drawn were not at the address given for them, (Hannay, 1972; Hannay and Maddox, 1977) partly because of redevelopment in central Glasgow, and partly because there is no routine way of recording changes of address. In view of this a detailed analysis of the age-sex distribution and location of the non- respondents was carried out (Hannay and Maddox, 1977). Those who were not at the address given for them had mainly lived in slum clearance areas, and although the age-sex distribution of those interviewed was broadly comparable to the population in general, those between the ages of 16 and 44 tended to be under represented. One might expect this age group to be the most mobile, and also the least likely perhaps to attend the health centre, which was the only way a change of address within Glasgow could be recorded. Only three per cent of the sample refused to be interviewed. Most of these were elderly people and the main reason given was ill health. A steady rate of monthly interviews was maintained throughout a calendar year to allow for seasonal variations, and a total of 1,344 interviews was completed, representing 3 1 per cent of the mean list size for the health centre for that year. The total number of patients was therefore just over half the average list size in the UK. Results The results for each symptom question are analysed in Table 1 (parts a to k), which shows the two-week period prevalence for each individual symptom, as well as for the 44 symptom groups, expressed as a percentage of the total sample interviewed. Looking first at the groups 492 Journal ofthe Royal College of General Practitioners, August 1978
-
Upload
khangminh22 -
Category
Documents
-
view
1 -
download
0
Transcript of Symptom prevalence in the community - NCBI

THE PATIENT'S POINT OF VIEW
Symptom prevalence in the communityD. R. HANNAY, ma, ph.d,mfcm,mrccp, dch
Senior Lecturer in General Practice, University of Glasgow, Scotland
SUMMARY. The prevalence of physical symp¬toms among a sample of patients registered at a
health centre is described as recorded fromhome interviews. The number of physical symp¬toms per person is then correlated with personalcharacteristics and environmental factors, usingcomputer programmes.
Introduction
A CONSIDERABLE amount has been writtenabout presenting complaints in general practice
(Journal ofthe Royal College of General Practitioners,1973), but there is less information available aboutmorbidity in the community especially when carefullydefined by symptomatology.
Aim
The aim was to determine the prevalence of symptomsamong people living in the community.
Method
A random sample was drawn from the practice lists of a
health centre in Glasgow and these patients were
interviewed in their homes over the course of a year.There were 44 grouped questions on physical
symptoms which were designed to be mutually exclusiveand to cover every possibility. The questions were
phrased in simple non-technical language and referredto feelings people might have noticed about themselvesrather than to diseases. Where medical conditions were
defined in terms of symptoms the appropriate method-ology was used, for instance for chronic bronchitis(Cochrane and Fletcher, 1968), angina, and intermittentclaudication (Rose, 1962). The answers were purelysubjective responses and no objective clinical signs or
tests were included. The questions were asked of thepresent, or previous two weeks only, and therefore theresults represent a two-week period prevalence.© Journal ofthe Royal College ofGeneral Practitioners, 1978,28,492-499.
In addition to symptoms there was information on
personal characteristics and environmental factors,such as housing, mobility, and employment. Computerprogrammes for bivariate and multivariate analysiswere used to explore associations between such vari-ables and the prevalence of physical symptoms (Nie etal, 1970). Mental symptoms were asked separately andare not included here.Random monthly samples without replacement were
drawn from the computer file of the health centre over
the course of a year. It was found that 46 per cent of thepatients drawn were not at the address given for them,(Hannay, 1972; Hannay and Maddox, 1977) partlybecause of redevelopment in central Glasgow, andpartly because there is no routine way of recordingchanges of address. In view of this a detailed analysis ofthe age-sex distribution and location of the non-
respondents was carried out (Hannay and Maddox,1977). Those who were not at the address given for themhad mainly lived in slum clearance areas, and althoughthe age-sex distribution of those interviewed was
broadly comparable to the population in general, thosebetween the ages of 16 and 44 tended to be underrepresented. One might expect this age group to be themost mobile, and also the least likely perhaps to attendthe health centre, which was the only way a change ofaddress within Glasgow could be recorded.Only three per cent of the sample refused to be
interviewed. Most of these were elderly people and themain reason given was ill health. A steady rate ofmonthly interviews was maintained throughout a
calendar year to allow for seasonal variations, and a
total of 1,344 interviews was completed, representing3 1 per cent of the mean list size for the health centrefor that year. The total number of patients was
therefore just over half the average list size in the UK.
Results
The results for each symptom question are analysed inTable 1 (parts a to k), which shows the two-week periodprevalence for each individual symptom, as well as forthe 44 symptom groups, expressed as a percentage ofthe total sample interviewed. Looking first at the groups
492 Journal ofthe Royal College ofGeneral Practitioners, August 1978
The Patient's Point of View
Table 1. Part a. Numbers of physical symptoms(percentages out of 1,344 patients shown inbrackets).
Table 1. Part c.
Table 1. Part b
Trouble with hair 68(5.7Ja) Lossof hair 14( 1.0)b) Superfluous hair 0c) Dandruff 54 ( 4.0)Lumps under skin 65 ( 4.8)a) Lumps or swollen glands (other
than in breast) 57 ( 4.2)b) Swellingssuch as a rupture 6(0.4)c) Lumps in breast 2(0.1)Change of colour in skin or in whites
ofeyes 22 ( 1.6)a) Palerthanusual 12 ( 0.9)b) Yellowerthan usual 3( 0.2)c) Other discolouration such as
bruising 7 ( 0.5)Feeling more thirsty than usual orcold apart from the weather 76 ( 5.7)a) More thirsty than usual 48 ( 3.6)b) More cold apart from the weather 19 ( 1.4)a)andb) 9( 0.7)
Change of appetite 106( 7.9)a) Loss of appetite 70 ( 5.2)b) Gain of appetite or feeling hungry 36( 2.7)
of symptoms, respiratory symptoms were by far thecommonest (Tables lf and g), followed by headaches(Table j), and feeling tired and generally run down(Table la). Trouble with the feet (Table li), ears andeyes (Table lk), skin (Table la), varicose veins (Tablelh), and cardiorespiratory symptoms (Table lg) come
next.These groups were then classified into individual
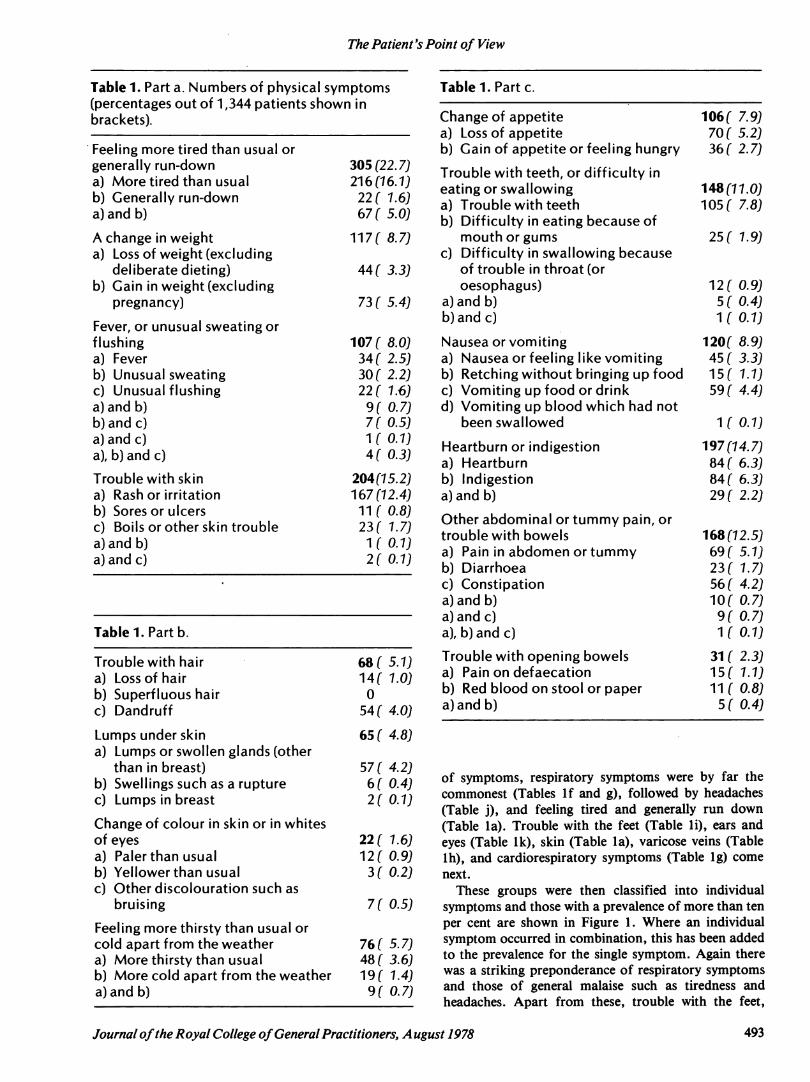
symptoms and those with a prevalence of more than ten
per cent are shown in Figure 1. Where an individualsymptom occurred in combination, this has been addedto the prevalence for the single symptom. Again therewas a striking preponderance of respiratory symptomsand those of general malaise such as tiredness andheadaches. Apart from these, trouble with the feet,
Journal ofthe Royal College ofGeneral Practitioners, A ugust 1978 493
The Patient's Point of View
Stuffy or runny nose or catarrh at back of nose
Cough now or during the past two weeks
More tired than usual
Headaches
Bunions, corns or callosities
Sputum now or during the past two weeks
Rash or irritations
Shortness of breath when hurrying on level groundor walking up slight hill
Usually cough first thing on getting up
Varicose veins
Usually sputum first thing on getting up
Difficulty in hearing
Percentage out of 1,344 people
Figure 1. Commonest physical symptoms.
skin, dyspnoea, varicose veins, and hearing were thecommonest individual symptoms.
It is possible to gain some idea of the broader medicalcategories by combining groups of symptoms (Figure2). This involves assumptions about the cause whichmay be arbitrary, such as placing shortness of breathwith the respiratory rather than the cardiovascularsystem. Inevitably there is a large miscellaneouscategory, but again respiratory symptoms predominate.The number of symptoms in each category is expressedas a percentage of the total number of physicalsymptoms found. The physical symptoms were thencombined into a single score for each subject, to obtainthe number of physical symptoms per person. The meannumber of physical symptoms per person was 4-3, witha range of 0 to 25. Only 14 per cent of those interviewedreported no physical symptoms during the previous twoweeks.Almost two thirds of the independent variables used
in the survey gave significant results when correlatedwith the number of physical symptoms per person.However, many of these associations were due either tovariables measuring the same thing, such as self-estimates of present health, or to factors which were
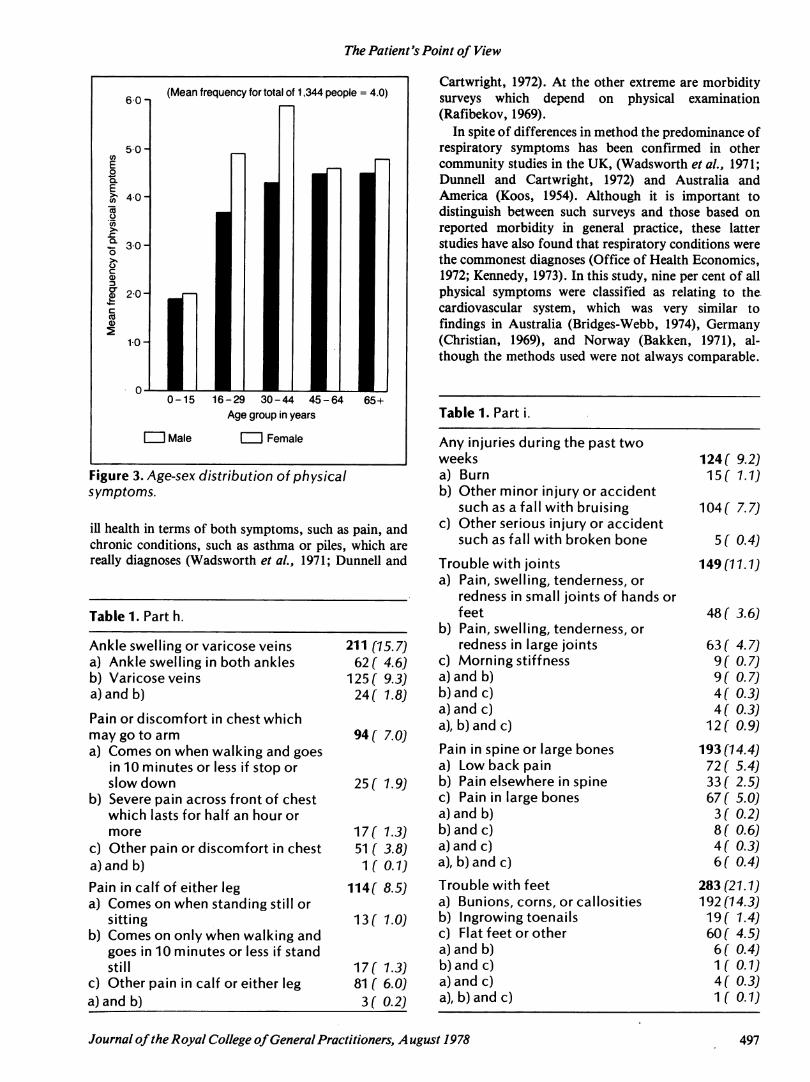
likely to be the result rather than the cause of physicalsymptoms, such as the use of medical services andmedicine taking. The frequency of physical symptomsbroadly increased with age and was higher for females
than males (Figure 3). There was a significantcorrelation with age, but not with sex. Other significantsociographic variables on bivariate analysis indicatedthat people who were separated or divorced, un-
494 Journal ofthe Royal College ofGeneral Practitioners, A ugust 1978

The Patient's Point of View
Figure 2. Physical symptom categories.
All of these variables had significant simple correlationswith physical symptom prevalence except for the femalesex and low intelligence scores which were more
prominent on regression analysis. Those who hadpreviously lived outside Glasgow, or who had been intheir present home a long time, had significantly morephysical symptoms on simple correlation, but theserelationships were reversed on regression analysis,probably because of the age factor. Some variables,such as social class, achieved no significance on eitherbivariate or multivariate analysis.
Discussion
Although the questions were phrased in simple laylanguage, several of the symptoms asked can betranslated into medical terminology with varyingdegrees of diagnostic implication. For instance, fromthe questions on chronic cough and sputum (Table lf) itseemed that about 12 per cent of all those studied hadchronic bronchitis, and at least 49 people had symptomssuggestive of asthma. There were also two cases ofhaemoptysis (Table lg). The questions on shortness of
employed due to illness, living in crowded conditions or
alone, were more likely to have an increased number ofphysical symptoms, whereas owner occupiers andthose living in more recent housing had fewer physicalsymptoms. Cigarette smokers and those with highneuroticism scores had significantly more symptoms. Inaddition, increased mobility and a lack of activereligious allegiance were also associated with higherfrequencies of physical symptoms.Some of these significant correlations may have been
due to interaction effects. For instance, the associationbetween physical symptoms and being separated or
divorced may have been a reflection of the age-sexgroup of those involved, rather than their maritalstatus. In order to allow for this, those variables whichmight be causal for the frequency of physical symptomswere used in multivariate analysis. Twenty-two suchvariables were entered into a regression equation as
possible predictors of frequency of physical symptoms,and of these the following ten had significant regressioncoefficients in order of importance:1. Neuroticism score.
2. Number of short hospital stays.3. Age.4. Number ofmoves.5. Number of cigarettes smoked.6. Religion (no active allegiance).7. Sex (female).8. Birth and upbringing (away from Glasgow).9. Intelligence score (low).10. House ownership(tenant).
Journal ofthe Royal College ofGeneral Practitioners, A ugust 1978 495
The Patient's Point of View
breath were worded according to grades of dyspnoea;260 people had varying degrees and 30 had paroxysmalnocturnal dyspnoea (Table lg).Answers to the questions on the cardiovascular
system (Table lh) indicated 26 people with angina, 18with the symptoms of coronary thrombosis, and a
further 51 with ill-defined pain or discomfort in thechest which is a commoner symptom than is oftenrecognized medically (Jones, 1972). There were 17people with intermittent claudication, 81 with legcramps (mainly nocturnal), and 125 with varicose veins.The responses to questions on the locomotor andnervous systems (Table j and k) suggested that theremay have been 29 cases of rheumatoid arthritis, and fivecases of epilepsy. Less specifically, there were 72 peoplewith low back pain, 16 with ataxia, and six withaphasia. There were 130 people with some degree ofmotor or sensory loss in their limbs, and 20 who were
blind in one or both eyes (Table lk).Although some conditions such as angina and chronic
bronchitis are defined in terms of symptoms, it is notpossible in a subjective study to be certain about thosediagnoses which are not so defined, but for which singlesymptoms are highly suggestive. For instance, 75 peoplehad urinary frequency and 16 dysuria, and there were
three cases of possible jaundice (Table lb). It is likelythat the woman with bleeding in pregnancy had a
threatened miscarriage (Table le), but less likely thatthose who felt "more thirsty than usual" had diabetes(Table lb).
Symptoms do not necessarily imply ill health ordisease and one can be tired or breathless without beingill. It has been found, for instance, that symptoms oftenassociated with anaemia bear little relation to haemo¬globin levels (Wood and Elwood, 1966; Robinson andWood, 1968). In the present study 23 per cent of thoseinterviewed felt more tired or run down than usual(Table la), 17 per cent said they had had headachesduring the previous two weeks (Table lj), and one percent thought they were paler than usual (Table lb). It isdifficult to draw any conclusions about ill health or
make diagnostic inferences from such findings.It is not easy to compare the results of this study with
others because of the conceptual confusions whichunderlie surveys of health and illness, such as failure to
distinguish between symptoms and diagnoses (Kirscht,1971). Some studies of ill health in the community haveused subjective scales and scores without being explicitabout symptoms (Grogono, 1973). Others have defined
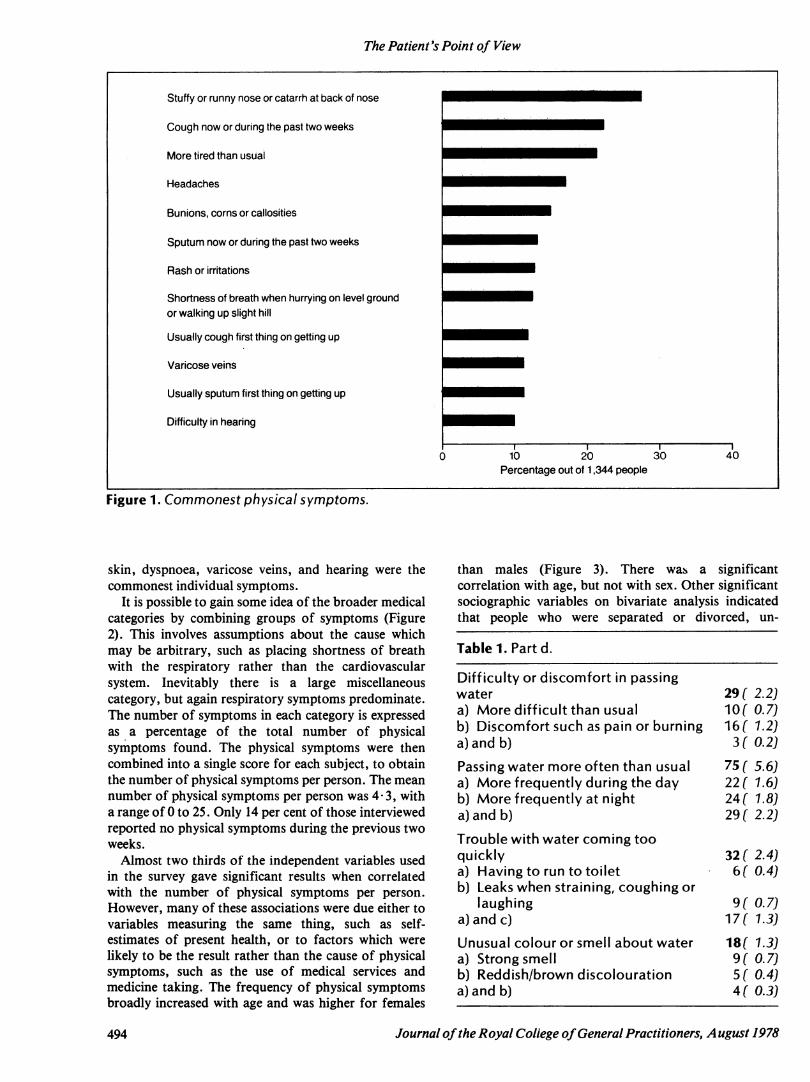
Table 1. Part g.
Wheezingor coughing up blood 106 ( 7.9)a) Chest soundingwheezy or
whistling 53f 3.9)b) Attacks of shortness of breath
withwheezing 14f 1.0)c) Coughing up blood which had not
been swallowed 2( 0.1)a)andb) 34 ( 2.5)a)andc) 2( 0.1)a), b)andc) 1 ( 0.1)Shortness of breath 260 (79.3Ja) When hurrying on level ground or
walking up slight hill 166(72.4)b) When walking with people of own
age on level ground 17f 1.3)c) Having tostop for breath when
walking at own pace on levelground 34 ( 2.5)
d) When washingor dressing 20f 1.5)e) Whensittingquietly 23 ( 1.7)Attacks of palpitations orbreathlessness 101 ( 7.5)a) Attacks of palpitations when
heart beats fast for no apparentreason 61 ( 4.5)
b) Attacks of breathlessness whenlyingdown 7( 0.5)
c) Sudden attacks of breathlessnesswhen lyingdown at night 12( 0.9)
a)andb) 3( 0.2)b)andc) 2( 0.1)a)andc) 5( 0.4)a), b)andc) 11 ( 0.8)
496 Journal ofthe Royal College ofGeneral Practitioners, A ugust 1978
The Patient's Point of View
6-0-1
50 HEoQ.E
75oco
40 H
r 30Ho
CCD3
? 2°Hcco
210 H
(Mean frequency for total of 1,344 people = 4.0)
CUMale
16-29 30-44 45-Age group in years
I I Female
64 65+
Cartwright, 1972). At the other extreme are morbiditysurveys which depend on physical examination(Rafibekov, 1969).
In spite of differences in method the predominance ofrespiratory symptoms has been confirmed in othercommunity studies in the UK, (Wadsworth et al., 1971;Dunnell and Cartwright, 1972) and Australia andAmerica (Koos, 1954). Although it is important todistinguish between such surveys and those based on
reported morbidity in general practice, these latterstudies have also found that respiratory conditions werethe commonest diagnoses (Office of Health Economics,1972; Kennedy, 1973). In this study, nine per cent of allphysical symptoms were classified as relating to thecardiovascular system, which was very similar tofindings in Australia (Bridges-Webb, 1974), Germany(Christian, 1969), and Norway (Bakken, 1971), al¬though the methods used were not always comparable.
Figure 3. /Age-sex distribution of physicalsymptoms.
ill health in terms of both symptoms, such as pain, andchronic conditions, such as asthma or piles, which are
really diagnoses (Wadsworth et al., 1971; Dunnell and
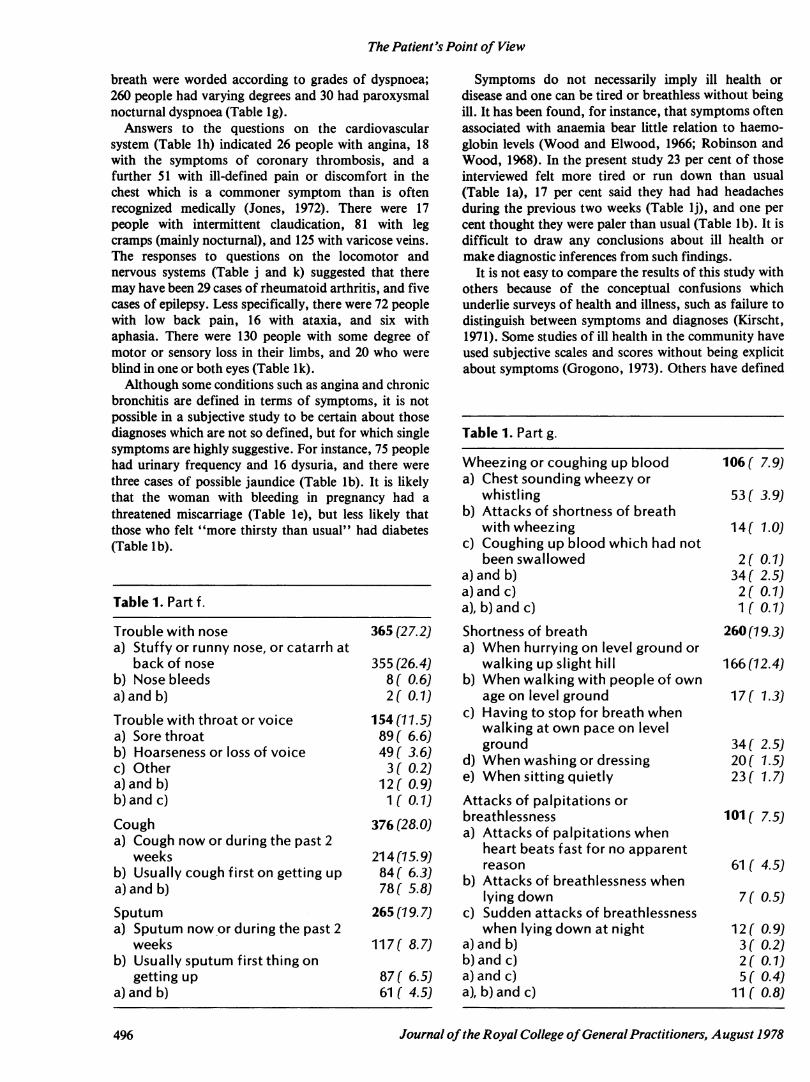
Table 1. Part h.
a) Pain, swelling, tenderness, orredness in small joints of hands orfeet
b) Pain, swelling, tenderness, or48 ( 3.6)
Journal ofthe Royal College ofGeneral Practitioners, August 1978 497

The Patient's Point of View
Table 1. Part j.
Loss of consciousness or convulsions 21 ( 1.6)a) Loss of consciousness or
blackouts 16( 1.2)b) Convulsions or fits 5( 0.4)Headaches or dizziness, or feelingmore irritable and jumpy than usual 318 (23.7)a) Headaches 174 (12.9)b) Spells of dizziness or vertigo 66 ( 4.9)c) Feeling more irritable and jumpy
than usual 18( 1.3)a) and b) 27( 2.0)b) and c) 4( 0.3)a)andc) 13( 1.0)a), b)and c) 16( 1.2)Facial pain, loss of speech or balance 34( 2.6)a) Pain in face for no apparent
reason 9( 0.7)b) Loss of power of speech 6 ( 0.4)c) Loss of ability to balance on feet 16( 1.2)b) and c) 2( 0.1)a), b) and c) 1 (0.1)
Table 1. Part k.
Trouble with ears 214(15.9)a) Pain, irritation or wax in ears 51 ( 3.8)b) Difficulty in hearing 110 ( 8.2)c) Ringing or buzzing in ears 18( 1.3)a) and b) 14( 1.0)b) and c) 8( 0.6)a)and c) 6( 0.4)a), b) and c) 7 (0.5)Trouble with eyes 205 (15.3)a) Pain, irritation or watering of eyes 85 ( 6.3)b) Difficulty in seeing 86 ( 6.4)c) Loss of sight in one or both eyes 16 ( 1.2)a)and b) 14 (1.0)b)andc) 1( 0.1)a) and c) 3( 0.2)Loss of power in limbs 27( 2.0)a) Loss of power in upper limbs 11 ( 0.8)b) Loss of power in lower limbs 9( 0.7)a) and b) 7 ( 0.5)Loss of feeling or alteration ofsensation in limbs 103( 7.7)a) Loss of feeling, tingling, or
numbness in upper limbs 51 ( 3.8)b) Loss of feeling, tingling, or
numbness in lowver limbs 32 ( 2.4)a)and b) 20( 1.5)
Two surveys in the UK do not seem to have employedany accepted method for recording cardiovascular,symptoms (Wadsworth et al., 1971; Dunnell andCartwright, 1972).
Nine per cent of all physical symptoms found in thisstudy were classified as alimentary and the sameproportion were classified as neurological. Thesefigures are similar to those obtained from generalpractice in Scotland (Kennedy, 1973) and Norway(Bakken, 1971), and from community surveys inEngland (Wadsworth et al., 1971). Six per cent ofphysical symptoms in the present study related to bonesand joints, and five per cent involved the genitourinarysystem. The former proportion is similar to general-practice findings in Scotland (Kennedy, 1973), but notas high as the figure derived from community surveys inEngland (Wadsworth et al., 1971) or Australia (Bridges-Webb, 1974), which probably reflects problems ofdefinition rather than real differences in morbidity. Thenumber of genitourinary symptoms found in Glasgowappeared to be more than double those found inLondon (Wadsworth et al., 1971), but again differencesin classification make comparisons difficult. The sameis true for skin conditions (Office of Health Economics,1973), although if allowances are made for the way inwhich symptoms were grouped, such as those relating tofeet, the prevalence of skin conditions in the presentstudy appears to be comparable to other UK surveys(Wadsworth et al., 1971; Dunnell and Cartwright,1972).The mean number of four physical symptoms per
person was similar to that found by Dunnell andCartwright (1972). The proportion of people who hadno physical symptoms (14 per cent) was the same asreported from a comparable morbidity survey inAustralia (Bridges-Webb, 1974), and similar toPeckham Health Centre's 12 per cent (Pearce andCrocker, 1943). Again the value of such comparisons islimited by the different methods used.The results of regression analysis suggest that personal
characteristics such as personality, age, sex, andintelligence are important factors in the prevalence ofphysical symptoms. Whereas cigarette smoking mightbe causal, other variables such as hospital stays weremere associations. Mobility was also important andmay reflect a lack of personal stability, like the absenceof an active religious allegiance. Tenants may also beless stable than owner occupiers especially in areas ofextensive urban redevelopment such as Glasgow.
ReferencesBakken, A. F. (1971). Tidsskrift den Norske Laegeforening, 91,
215-218.Bridges-Webb, C. (1974). International Journal ofEpidemiology, 3,
3746.Christian, W. (1969). Offentliche Gesundheitswesen, 31, 23-38.Cochrane, A. L. & Fletcher, C. M. (1968). The Early Diagnosis of
SomeDiseases of the Lung. London: Office of HealthEconomics.
Dunnell, K. & Cartwright, A. (1972). Medicine Takers, Prescribersand Hoarders. London: Routledge and Kegan Paul.
498 Journal ofthe Royal College ofGeneral Practitioners, August 1978

The Patient's Point of View
Grogono, A. A. (1973). International Journal ofEpidemiology, 2,5-6.
Hannay, D. R. (1972). Lancet, ii, 371-373.Hannay, D. R. & Maddox, E. J. (1977). Community Health, 8,
210-216.Jones, F. A. (ed.) (1972). RichardAsher Talking Sense. London:
Pitman Medical.Kennedy, T. M. (1973). Update, 6, 1285-1300.Kirscht, J. P. (1971). Social Science and Medicine, 5, 519-526.Koos, E. L. (1954). The Health ofRegionville. New York: Columbia
University Press.Nie, N. H., Bent, D. H. & Hull, C. H. (1970). Statistical Package
for the Social Sciences. USA: McGraw-Hill.Office of Health Economics (1972). Medicine and Society. London:
OHE.Office of Health Economics (1973). Skin Disorders. London: OHE.Pearse, I. H. & Crocker, L. H. (1943). The Peckham Experiment.
London: George Allen and Unwin.Rafibekov, S. D. (1969). Sovetskoe Zdravookhranenie, 28, 20-21.Robinson, J. 0. & Wood, M. M. (1968). British Journal ofPreventive
and Social Medicine, 22, 23-36.Rose, G. A. (1962). Bulletin ofthe World Health Organization, 27,
645-658.Royal College of General Practitioners (1973). Present State and
Future Needs ofGeneral Practice. Reportfrom General PracticeNo. 16. London: RCGP.
Wadsworth, M. E.J., Butterfield, W. J. H. & Blaney, R. (1971).Health and Sickness: the Choice of Treatment. London:Tavistock.
Wood, M. M. & Elwood, P. C. (1966). British Journal ofPreventiveand Social Medicine, 20, 117-121.
Acknowledgements
This study was made possible by a grant from the Social ScienceResearch Council and was undertaken while I was attached to theDepartments of Community Medicine and Social and EconomicResearch at the University of Glasgow. I would like to thank thesedepartments for their encouragement, the general practitioners at theWoodside Health Centre for permission to interview their patients,Mr E. J. Maddox, Mrs McLaren, Mrs Scobbie, and Mrs Wyllie fortheir help as interviewers, and Mrs Robertson for secretarialassistance.
FAMILY MEDICINEPrinciples and Applications
Edited by Jack H. Medalie, MD, MPH with 27 ContributorsThe most complete and current work of its kind, FamilyMedicine is an exceptional contribution to the professionaldisciplines involved in this primary medical specialty. Thisbook provides a superb integration of the relevant aspectsof the behavioural and clinical sciences as well as theprinciples of preventive and curative medicine as applied tofamily care. An expansive range of topics is thoroughly andeffectively illustrated through the use of clinical examples.The twenty-seven practicing family specialists whocontributed to Family Medicine provide a detailedconsideration of every aspect of this relevant field, which issuch a vital part of modern medical practice.Selected Contents: Dimensions of Family Medicine andPractice. Changing.Social Patterns and TheirInterrelationship with the Familyand Health.Communication and the Interview. General Principles andCongenital Conditions. Transmission of InfectiousDiseases. Psychosocial Processes. The First Child. TheMiddle-Age PeriodorApplications to Family TherapyPrinciples in Family Practice. Family History, Data Base,Family Tree, and Family Diagnosis. Principles of aProblem-Oriented Record System. Knowledge and SkillsNeeded in Family Practice. Index.
1978/372 pages/40 lllustrations/$15.95
@ WILLIAMS & WILKINSEuropean Office:
145A Croydon Road, Beckenham, Kent BR3 3RB.
UPDATEPOSTGRADUATECENTRE SERIES
This series of well-illustrated booklets, eachcovering a single topic of importance to familymedicine, is intended to serve as a back-up tothe work of the postgraduate centres and toencourage discussion and individual study ofdiseases commonly encountered in generalpractice.
The following titles are available:Chronic BronchitisPeptic UlcerAsthmaHypertensionStrokesAnxiety and DepressionDiseases of Old AgeDiseases ofWomenPainEczema and PsoriasisEach booklet costs £1.35, which includespostage.
To order your booklet(s), complete the formbelow, or simply send us your name andaddress, and post with your remittance to:Update Publications Ltd, 33/34 Alfred Place,London WC1 E 7DP. Cheques or postal ordersshould be made payable to Update PublicationsLtd.
ORDER FORMTitle(s) requested..................................................................................................................................................................................
Remittance enclosed.............................................................Nam e...............................................................................................Address.......................................................................................................................................................................................................
C0878
UPDATE PUBLICATIONS LIMITED33/34 Alfred Place, London WC1E 7DP
Journal ofthe Royal College ofGeneral Practitioners, August 1978 499