SWM - Agra
195
DETAILED PROJECT REPORT (REVISED) FOR SOLID WASTE MANAGEMENT IN AGRA, UTTAR PRADESH rcues Regional Centre for Urban & Environmental Studies (Estd. by Ministry of Urban Development) Government of India, Adjacent Registrar’s Office, University of Lucknow, Lucknow PREPARED BY:
-
Upload
independent -
Category
Documents
-
view
1 -
download
0
Transcript of SWM - Agra

DETAILED PROJECT REPORT
(REVISED)
FOR
SOLID WASTE MANAGEMENT IN
AGRA, UTTAR PRADESH
rcues Regional Centre for Urban & Environmental Studies
(Estd. by Ministry of Urban Development) Government of India,
Adjacent Registrar’s Office, University of Lucknow,
Lucknow
PREPARED BY:

Detailed Project Report for Solid Waste Management in Agra,,Uttar Pradesh
Regional Centre for Urban and Environmental Studies, Lucknow rcues
LLiisstt ooff CCoonntteennttss

Detailed Project Report for Solid Waste Management in Agra, Uttar Pradesh
Regional Centre for Urban and Environmental Studies, Lucknow TOC-1
RCUES
TABLE OF CONTENTS
Page No. Table of Contents TOC - 1 List of Annexures TOC - 7 List of Drawings TOC - 8 List of Tables TOC- 9 List of Figures TOC-12 List of Abbreviations TOC-13 Executive Summary ES 1-4 Chapter 1 INTRODUCTION TO THE PROJECT 1.1 Definition of Solid Waste Management 1-1 1.2 Problems Due to Solid Waste 1-1 1.3 Current Status of SWM in India 1-1 1.4 Initiatives to Improve SWM 1-2 1.4.1
Honorable Supreme Court of India Recommendations
1-2
1.4.2
Municipal Solid Waste Management Rules 1-2
1.4.3 Jawaharlal Nehru National Urban Renewal Mission
1-3
1.4.4 Twelfth Finance Commission Recommendations
1-3
1.5 Project Background 1-3 1.6 Project Objectives 1-3 1.7 Scope of Study 1-4 1.8 Approach and Methodology 1-4 1.8.1 Problem Identification 1-6 1.8.2 Primary and secondary data collection 1-7 1.8.3 Data Collation and Analysis 1-10 1.8.4 Gap analysis 1-11 1.8.5 Evaluation & Proposal, Detailed engineering,
BOQ and Cost estimates of the MSW Management Plan
1-12
2 THE PLAN AREA-SITUATION ANALYSIS 2.1 Location and Extents 2-1 2.2 Population 2-1 2.3 Landuse 2-3 2.4 Physical Infrastructure 2-4
Detailed Project Report for Solid Waste Management in Agra, Uttar Pradesh
Regional Centre for Urban and Environmental Studies, Lucknow TOC-2
RCUES
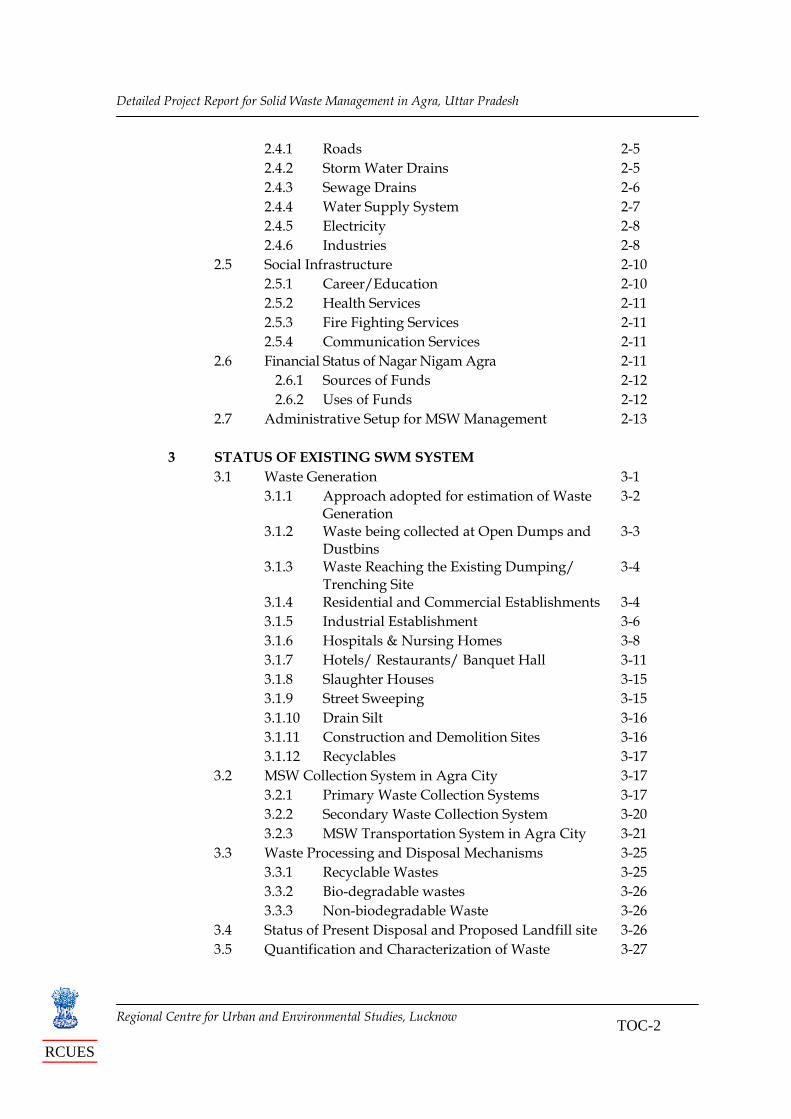
2.4.1 Roads 2-5 2.4.2 Storm Water Drains 2-5 2.4.3 Sewage Drains 2-6 2.4.4 Water Supply System 2-7 2.4.5 Electricity 2-8 2.4.6 Industries 2-8 2.5 Social Infrastructure 2-10 2.5.1 Career/Education 2-10 2.5.2 Health Services 2-11 2.5.3 Fire Fighting Services 2-11 2.5.4 Communication Services 2-11 2.6 Financial Status of Nagar Nigam Agra 2-11 2.6.1 Sources of Funds 2-12 2.6.2 Uses of Funds 2-12 2.7 Administrative Setup for MSW Management 2-13 3 STATUS OF EXISTING SWM SYSTEM 3.1 Waste Generation 3-1 3.1.1 Approach adopted for estimation of Waste
Generation 3-2
3.1.2 Waste being collected at Open Dumps and Dustbins
3-3
3.1.3 Waste Reaching the Existing Dumping/ Trenching Site
3-4
3.1.4 Residential and Commercial Establishments 3-4 3.1.5 Industrial Establishment 3-6 3.1.6 Hospitals & Nursing Homes 3-8 3.1.7 Hotels/ Restaurants/ Banquet Hall 3-11 3.1.8 Slaughter Houses 3-15 3.1.9 Street Sweeping 3-15 3.1.10 Drain Silt 3-16 3.1.11 Construction and Demolition Sites 3-16 3.1.12 Recyclables 3-17 3.2 MSW Collection System in Agra City 3-17 3.2.1 Primary Waste Collection Systems 3-17 3.2.2 Secondary Waste Collection System 3-20 3.2.3 MSW Transportation System in Agra City 3-21 3.3 Waste Processing and Disposal Mechanisms 3-25 3.3.1 Recyclable Wastes 3-25 3.3.2 Bio-degradable wastes 3-26 3.3.3 Non-biodegradable Waste 3-26 3.4 Status of Present Disposal and Proposed Landfill site 3-26 3.5 Quantification and Characterization of Waste 3-27

Detailed Project Report for Solid Waste Management in Agra, Uttar Pradesh
Regional Centre for Urban and Environmental Studies, Lucknow TOC-3
RCUES
3.6 MSW Management System in Agra City 3-29 3.7 Expenditure on MSW Management 3-30
3.8 Gaps in Existing MSWM with respect to MSW Rules 2000
3-31
3.7.1 No Segregation practice at source 3-31 3.7.2 Primary collection of solid waste is not
Appropriate 3-31
3.7.3 Secondary storage of solid waste is unorganized
3-32
3.7.4 Solid waste is Transported in Open Vehicles 3-32 3.7.5 Slaughter House Waste is mixed with MSW 3-32 3.7.6 Biomedical waste is not managed properly
in all health care facilities 3-33
3.7.7 Collection and disposal of construction waste is not appropriate
3-33
3.7.8 Disposal of solid waste is not appropriate 3-33 3.7.9 Manual handling of solid waste
3-33
3.7.10 Lack of awareness among city residents and civic authorities
3-33
4 PROPOSED MSW MANAGEMENT SYSTEM 4.1 Basis of Design for Proposed SWM Plan 4-1 4.2 Proposed MSW Management Plan 4-3 4.2.1 Primary Waste Collection System 4-3 4.2.2 Secondary Waste Storage System 4-14 4.2.3 Transfer Station 4-20 4.2.3.1 Waste Transportation System 4-21 4.3 Summary of Collection & Transportation
Infrastructure 4-24
4.4 Operation and Maintenance Costs (O&M costs) for Collection and Transportation System
4-25
5 WASTE TO COMPOST PLANT 5.1 Introduction 5-1 5.2 Basis of Compost Plant Design 5-2 5.3 Process Design for Proposed MSW Composting Unit 5-3 5.3.1 Waste Receipt and Storage 5-4 5.3.2 Waste Pre-Processing 5-5 5.3.3 Windrow (Mechanical) Composting 5-6 5.3.4 Curing and Drying 5-6 5.3.5 Compost Refinement, Bagging and storage 5-6 5.4 Design of Compost Plant Infrastructure and
Equipments 5-6

Detailed Project Report for Solid Waste Management in Agra, Uttar Pradesh
Regional Centre for Urban and Environmental Studies, Lucknow TOC-4
RCUES
5.4.1 Receipt, Handling, and Pre-processing of MSW (Tipping Area)
5-6
5.4.2 Composting 5-7 5.4.3 Curing Shed 5-8 5.4.4 Compost Drying Area 5-8 5.4.5 Sizing and Refinement Tower 5-8 5.4.6 Packing and Baggage Area 5-9 5.4.7 Finished Product Godown 5-9 5.4.8 Control Room 5-9 5.4.9 Administrative Building 5-9 5.4.10 Roads and Other Facilities 5-9 5.4.11 Water Supply and Sprinkling system 5-10 5.4.12 Electric Power 5-10 5.4.13 Green Belt and Garden Area 5-10 5.4.14 Compost Rejects 5-10 5.4.15 Total Area Requirement 5-10 5.5 Cost Estimates for Proposed Compost Plant 5-10 6 LANDFILL DESIGN 6.1 Conceptual Design 6-1 6.1.1 Waste to be Handled 6-2 6.1.2 Access Road 6-2 6.1.3 Land Area 6-2 6.1.4 Evaluation of Geology and Hydrology of the
site 6-2
6.1.5 Surface Drainage Facilities 6-4 6.1.6 Operational Plan 6-4 6.1.7 Layout of the MSW Landfill 6-5 6.1.8 Completed Waste Fill Features 6-6 6.1.9 Estimation of Landfill Capacity 6-7 6.1.10 Selection of Liner Systems 6-10 6.1.11 Selection Of Leachate Control Facilities 6-11 6.1.12 Effluent Treatment Plant Design 6-12 6.1.13 Selection Of Landfill Gas Control Facilities 6-13 6.1.14 Aesthetic Considerations 6-13 6.1.15 Monitoring Facilities 6-13 6.1.16 Determination of Equipment Requirements 6-16 6.1.17 Design Life 6-16 6.1.18 Post Closure Care 6-16 6.2 Technical Specifications 6-16 6.3 Cost Estimates 6-17 7 OTHER OPERATION AND MAINTENANCE ASPECTS

Detailed Project Report for Solid Waste Management in Agra, Uttar Pradesh
Regional Centre for Urban and Environmental Studies, Lucknow TOC-5
RCUES
7.1 Management Information System 7-1 7.1.1 Objective 7-1 7.1.2 Waste Generation 7-1 7.1.3 Waste Collection 7-2 7.1.4 Waste Transportation 7-3 7.1.5 Waste Processing and Disposal 7-3 7.1.6 Performance Monitoring Indicators 7-4 7.2 Complaint Handling System 7-5 7.2.1 Essential features of a complaint handling
system 7-6
7.2.2 General Rules for Handling Complaints 7-6 7.2.3 Complaint handling system for Agra 7-7 7.3 Environment, Health and Safety Aspects 7-7 7.4 Project Benefits Assessment 7-8 7.5 Outcomes of the Projects 7-11 8 COST OF THE PROPOSED SYSTEM 8-1 9 FINANCIAL FRAMEWORK 9.1 Project Financial Structuring 9-1 9.2 Project Financial Sustainability/O&M Framework and
Planning 9-3
9.2.1 Framework of the proposed PPP model 9-4 9.2.2 PPP in operation of collection, segregation
and storage of waste 9-6
9.2.3 PPP in transportation of waste to compost plant and landfill
9-7
9.2.4 PPP in operation of compost plant 9-8 9.2.5 PPP in operation of landfill site 9-10 9.2.6 PPP in setting up of a Waste to Energy Plant
and its O&M thereafter 9-11
9.2.7 Users Charges/Revenue Generation / tipping fee
9-14
9.2.8 Improvement in Revenue/Tipping Fee over a period of time through PPP
9-15
9.2.9 Inspiration…. 9-16 10 PROPOSED INSTITUTIONAL FRAMEWORK 10.1 Recommendations for Institutional Strengthening 10.1 10.1.1 Public Private Partnership 10.2 10.2 Proposed Institutional Framework For Operation
And Maintainance 10.3
11 IEC & Capacity Building of NNA For Sustainable MSWM 11.1 Introduction 11-1
Detailed Project Report for Solid Waste Management in Agra, Uttar Pradesh
Regional Centre for Urban and Environmental Studies, Lucknow TOC-6
RCUES
11.2 Objectives 11-1 11.3 Public Participation And Awareness Through IEC
Programmes 11-2
11.3.1 Approach of IEC plan 11-2 11.3.2 Strategy for creating Awareness 11-3 11.4 Training and Capacity Building of Nagar Nigam Agra
for MSW management 11-6
11.4.1 Objective 11.6 11.4.2 Specific Activities in Regard to
Training/Capacity Building Programmes 11.7
11.4.3 Some Proposed Tools/Methods 11.7 11.5 Awareness and Capacity Building of Schedule and
Activities Costing 11-8
12 PROJECT IMPLEMENTATION PLAN

Detailed Project Report for Solid Waste Management in Agra, Uttar Pradesh
Regional Centre for Urban and Environmental Studies, Lucknow TOC-7
RCUES
LIST OF ANNEXURES
Annexure-I Recommendation of Honourable Supreme Court of India for
Solid Waste Management Practices for Class I Cities Municipal Solid Waste Management Rules published by the
Ministry of Environment and Forests (MEOF) Objectives of Jawahar Lal Nehru national Urban Renewal
Mission Twelfth Finance Commission recommendation on Local
Bodies grants & Inter state distribution
Annexure-II • Chronological Record of Meetings & Visits • Minutes of the Stakeholders Meeting
Annexure-III Projected Population
Annexure-IV Ward wise Details and Break up of Waste Generation in Agra (2006) Annexure-V Questionnaire Formats for Primary Survey Annexure-VI Sheet 1 : Compilation and Analysis of Open Dumps Survey Data
Sheet 2 : Compilation and Analysis of Dustbins Survey Data Sheet 3: Waste characterization by SGS India Pvt. Ltd Sheet 4: Calculation of Total Waste Generation in Agra City Sheet 5: Photographs of Open Dumps and Dustbins
Annexure-VII Weigh slips of Waste Transportation vehicle Annexure-VIII Household Survey photographs and Summary Sheet
Annexure-IX • Year wise Waste Generation In Agra
• Compostable Waste • Lanfillable Waste
Annexure-X Technical Specifications for Waste Collection and Transportation Infrastructure
Annexure-XI Detail Cost Estimates of Construction Of New Dhalao Annexure-XII Detail Cost Estimates of Transfer Stations Annexure-XIII Summary of Financial Statement Annexure-XIV Cost estimates of Landfill & Quotations Annexure-XV Technical Specifications for Landfill Site Annexure-XVI Details of Twelfth Finance Commission Grant for solid waste
management Annexure -XVII Confirmation Letters for Land for Sanitary Landfill Facility and
Transfer station

Detailed Project Report for Solid Waste Management in Agra, Uttar Pradesh
Regional Centre for Urban and Environmental Studies, Lucknow TOC-8
RCUES
LIST OF DRAWINGS
Serial Number
Drawings Description
1 3146/Agra/01 City Plan of Agra Showing Nagar Nigam And Ward Boundaries
2 3146/Agra/02 Waste Collection Centre (DP Bins)& Route Plan
3 3146/Agra/03 Waste Collection Centers (Open Dumps & Route Plan)
4 3146/Agra/04 Map Showing Various Waste Generating Areas in Agra City
5 3146/Agra/05 Proposed Waste Collection System 6 3146/ Agra/Chap 4/01 Drawing for construction of WSD
(Dhalao)
7 3146/ Agra/Chap 4/02 Layout of MSW Transfer Station At Agra
8 3146/ Agra /Chap5 Layout Plan of Aerobic Compost Unit (350 TPD) for Agra
9 3146/ Agra /Chap6./01 Layout Plan of MSW Landfill for Agra 10 3146/ Agra /Chap6./02 Leachate Collection System for MSW
Landfills 11 3146/ Agra /Chap6./03 G.A. Drawing of Security Room
12 3146/ Agra /Chap6./04 G.A. Drawing of Weigh Bridge, Scale
Room
13 3146/ Agra /Chap6./05 G.A. Drawing for Office Building and MCC Room
14 3146/ Agra /Chap6. /06 G.A. Drawing for Temporary Storage Shed/ Segregation Area
15 3146/ Agra /Chap6./07 G.A. Details of Tyre Washing Facility
16 3146/ Agra /Chap6./08 Typical Drawing for Construction of WSD (Dhalao)
17 3146/ Agra /Chap6./09 Sectional Details of MSW Landfill 18 3146/ Agra /Chap6./10 Top Cover Plan 19 3146/ Agra /Chap6./11 Leachate Treatment scheme for
Sanitary landfill
Detailed Project Report for Solid Waste Management in Agra, Uttar Pradesh
Regional Centre for Urban and Environmental Studies, Lucknow TOC-9
RCUES
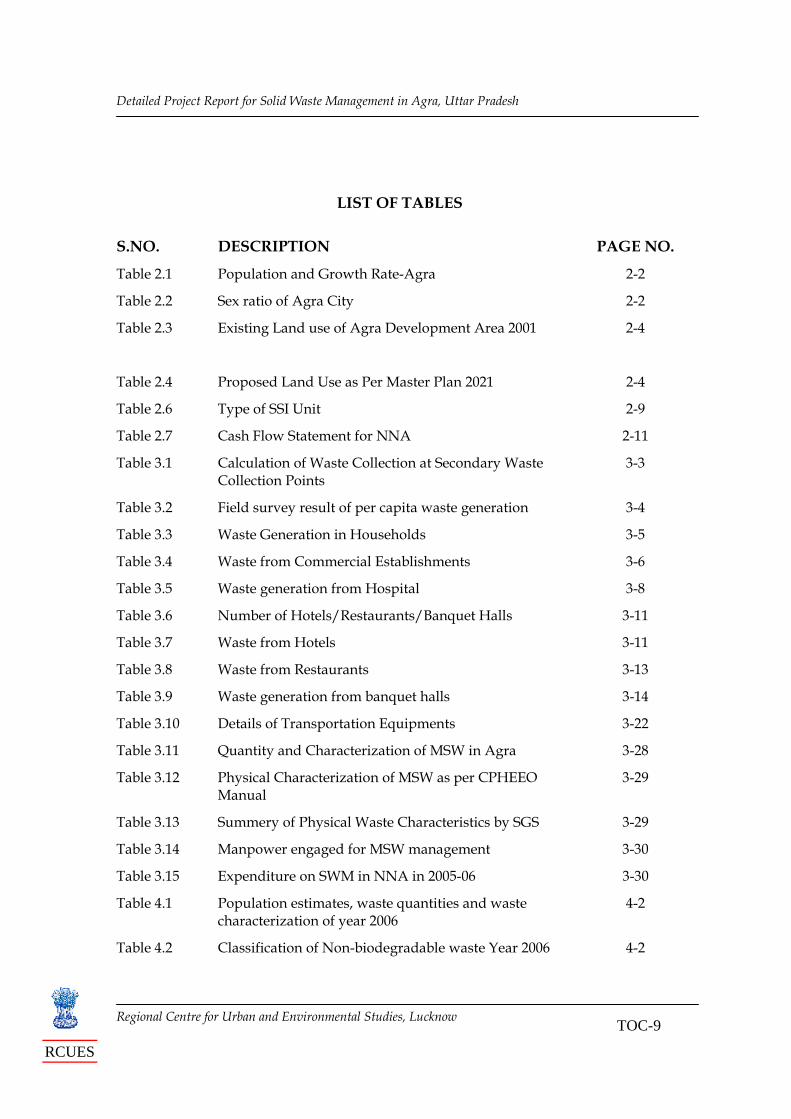
LIST OF TABLES
S.NO. DESCRIPTION PAGE NO.
Table 2.1 Population and Growth Rate-Agra 2-2
Table 2.2 Sex ratio of Agra City 2-2
Table 2.3 Existing Land use of Agra Development Area 2001 2-4
Table 2.4 Proposed Land Use as Per Master Plan 2021 2-4
Table 2.6 Type of SSI Unit 2-9
Table 2.7 Cash Flow Statement for NNA 2-11
Table 3.1 Calculation of Waste Collection at Secondary Waste Collection Points
3-3
Table 3.2 Field survey result of per capita waste generation 3-4
Table 3.3 Waste Generation in Households 3-5
Table 3.4 Waste from Commercial Establishments 3-6
Table 3.5 Waste generation from Hospital 3-8
Table 3.6 Number of Hotels/Restaurants/Banquet Halls 3-11
Table 3.7 Waste from Hotels 3-11
Table 3.8 Waste from Restaurants 3-13
Table 3.9 Waste generation from banquet halls 3-14
Table 3.10 Details of Transportation Equipments 3-22
Table 3.11 Quantity and Characterization of MSW in Agra 3-28
Table 3.12 Physical Characterization of MSW as per CPHEEO Manual
3-29
Table 3.13 Summery of Physical Waste Characteristics by SGS 3-29
Table 3.14 Manpower engaged for MSW management 3-30
Table 3.15 Expenditure on SWM in NNA in 2005-06 3-30
Table 4.1 Population estimates, waste quantities and waste characterization of year 2006
4-2
Table 4.2 Classification of Non-biodegradable waste Year 2006 4-2

Detailed Project Report for Solid Waste Management in Agra, Uttar Pradesh
Regional Centre for Urban and Environmental Studies, Lucknow TOC-10
RCUES
Table 4.3 Primary waste collection system 4-4
Table 4.4 Required Infrastructure for collection of House Hold Waste
4-6
Table 4.5 Infrastructure Required for Primary waste Collection and Transportation
4-13
Table 4.6 Proposed ward wise secondary collection locations 4-15
Table 4.7 Quantity and cost estimates for secondary storage infrastructure
4-20
Table 4.8 Quantity and cost estimates for transportation infrastructure
4-23
Table 4.9 Summary of collection and transportation infrastructure 4-24
Table 4.10 O&M cost for waste transportation collection infrastructure and personnel
4-26
Table 5.1 Cost estimate for composting unit 5-10
Table 6.1 List of facilities Provided at Agra Landfill 6-4
Table 6.2 Capacity Calculation for MSW Landfill 6-7
Table 6.3 Leachate Pipe sizing 6-11
Table 6.4 Monitoring Plan 6-14
Table 6.5 Summary of Cost Estimates 6-18
Table 6.6 Operation and Maintenance Cost 6-19
Table 7.1 Measures to guage performance of MSWM system 7-4
Table 8.1 Breakup of Cost of the Proposed Scheme 8-1
Table 8.2 Phased Implementation of Landfill Site 8-2
Table 9.1 Financial Plan 9-3
Table 9.2 PPP in MSW Management 9-5
Table 9.3 O&M cost/ annum of waste transportation infrastructure 9-7
Table 9.4 Profitability of Compost plant in 2009-10 9-8
Table 9.5 Summary of annual O & M Cost per annum at landfill 9-10
Table 9.6 User Charges / Revenue Generation /Tipping Fee 9-14
Table 9.7 Assumption and Profitability for Compost Plant 9-18
Table 9.8 Profitability Projections for Compost Plant 9-19
Detailed Project Report for Solid Waste Management in Agra, Uttar Pradesh
Regional Centre for Urban and Environmental Studies, Lucknow TOC-11
RCUES
Table 9.9 Cash Flow Statement for Compost Plant 9-20
Table 9.10 Projected balance Sheet for Compost Plant 9-21
Table 10.1 Specific roles and responsibilities of institution involved in implementation and O&M
10-1
Table 11.1(A) Awareness schedule & costing 11-8
Table11.1 (B) Training and capacity building 11-9

Detailed Project Report for Solid Waste Management in Agra, Uttar Pradesh
Regional Centre for Urban and Environmental Studies, Lucknow TOC-12
RCUES
LIST OF FIGURES
S.NO. DESCRIPTION PAGE NO. Figure 1.1 Approach and methodology 1-5 Figure 2.1 Proposed Land use as Per Master plan 2021 2-4 Figure 2.2 Distribution of SSI Units 2-9 Figure 2.3 Organization Structure of Agra Nagar Nigam 2-14 Figure 5.1 Classification of Biological Treatment Methods 5-1 Figure 5.2 Process Design for MSW Composting 5-4 Figure 5.3 Windrow Turner 5-5 Figure10.1 Proposed Institutional Framework 10-3

Detailed Project Report for Solid Waste Management in Agra, Uttar Pradesh
Regional Centre for Urban and Environmental Studies, Lucknow TOC-13
RCUES
LIST OF ABBREVIATIONS
CPCB Central Pollution Control Board
Cu.ft. Cubic feet
cum Cubic meter
GIS Geographical Information System
GPS Geographical Positioning System
km kilometer
NNA Nagar Nigam Agra
MIS Management Information System
MoEF Ministry of Environment and Forest
MSW Municipal Solid Waste
MT Metric Ton
PPE Personal Protective Equipment
RCUES Regional Centre for Urban and Environmental Studies
RM Running meter
Rs Rupees
sqm Square meter
sq. km. Square kilometer
SWM Solid Waste Management
TPD Tonnes per day
% Percentage
TFC Twelfth Finance Commission
JnNURM Jawaharlal Nehru National Urban Renewal Mission
IDSMT Integrated Development of Small and Medium Towns.
AUWSP Accelerated Urban Water Supply Program
O&M Operation and maintenance
PPP Public Private Participation
CSS Collection, Segregation and Storage.

Detailed Project Report for Solid Waste Management in Agra,,Uttar Pradesh
Regional Centre for Urban and Environmental Studies, Lucknow rcues
EExxeeccuuttiivvee SSuummmmaarryy

Detailed Project Report for Solid Waste Management in Agra, Uttar Pradesh
Regional Centre for Urban and Environmental Studies, Lucknow Executive Summary rcues
EXECUTIVE SUMMARY The Regional Centre for Urban and Environmental Studies (RCUES), Lucknow has been appointed Nodal agency by Government of Uttar Pradesh and entrusted with responsibilities of managing all activities concerning to Municipal Solid Waste Management in towns/cities of Uttar Pradesh. As per the scope of work specified, RCUES has prepared a detailed project report (DPR) and allied Engineering Drawings on Solid Waste Management Plan for Nagar Nigam Agra (NNA) on an integrated approach inline with the guidelines of MoEF/CPCB and MSW Rules 2000. The detailed project report covers an introduction to project, background of the planning area, status of the existing solid waste management system, proposed MSW management system with cost estimates, equipment specifications and route plans, design of waste (350 TPD) to compost plant with cost estimates, conceptual design of sanitary landfill with cost estimates and engineering drawings, operational and maintenance aspects, cost of proposed system, financial framework including public private participation in the various components of MSW, proposed institutional framework and details of community participation through IEC. The option of waste to energy as an alternative to compost and the contribution of rag pickers in keeping Agra clean have been discussed in detail in the detailed project report. Agra has a population of 14.26 lacs with a slum population of about 9.5%. It is spread in an area of 141 sq. kms. The length of roads is about 1724 kms. There are 200 open dumps, 9 dhalaos, 116 dustbins spread all over the city. NNA has about 2865 safai karamcharis which includes 650 safai karamcharis on contract basis and a fleet of 96 vehicles of different type/age to carry out the MSWM activity. The waste in the city is being dumped at one authorized site a few kilometers away from the city. The rag picking community of close to 6000 people spread all over the city is involved in removing recyclable waste. NNA incurs an expenditure of about Rs 28.1 crores annually on MSWM. The entire expenditure on this activity is financed mainly from the funds it received from the State Finance Commission. An analysis of the extensive survey data indicates that a total quantity of 709.03 TPD waste is generated in Agra out of which 43.9% (311.26 TPD) is organic, 21.2% (150.31 TPD) is recyclable, 8.5% (60.27 TPD) is drain silt, 5.0% (35.45 TPD) is street sweeping waste, 16.1% (114.15 TPD) is construction waste and remaining 5.3% (37.58 TPD) is mixed waste. The calculations also suggest that per capita per day waste generation is around 497 gms/ capita/ day.

Detailed Project Report for Solid Waste Management in Agra, Uttar Pradesh
Regional Centre for Urban and Environmental Studies, Lucknow Executive Summary rcues
The following gaps were found in the existing MSW management with respect to MSW Rules 2000 in Agra:
• The existing state of the open dumps in the city, road side dumps, clogged nallahs reflect the inefficiency of the present system. The safai karamcharis also dump the drain silt and waste at open dumps.
• There is a lack of awareness among city residents and civic authorities. Awareness for segregation of waste at source was very low and no segregation of waste was practiced at source
• Primary collection of solid waste was not appropriate. There was only limited door to door collection of waste.
• Secondary storage of solid waste is unorganized and efficient. The dustbins were broken or rusted. There were no closed dhallaos and main collection points were all open dumps. Animals strayed on open dumps, collection bins overflowed and waste collection appeared to be poor. There was no marking for segregation of waste into separate bins.
• Solid waste is transported in open vehicles like tipper trucks. Safai karamcharis involved in this activity do not use any personal protection equipment (PPE) for their protection
• Slaughter house waste is mixed with the MSW. Biomedical waste is not managed properly in all health care facilities.
• Collection and disposal of construction waste is not appropriate. In EWS and LIG houses it is mixed with household waste
• Disposal of solid waste is not appropriate as waste was being thrown at unauthorized dump yards.
In the DPR, the MSW management, operation, primary & secondary collection and transportation system are proposed in accordance with the guidelines issued by CPCB/ MoEFF, actual site conditions as depicted from the extensive surveys conducted and in line with MSW Rules 2000. New rickshaws, wheelbarrows, containers and bins have been proposed for primary collection and secondary storage of waste. Along with the utilization of some of the existing vehicles, modern transport vehicles have been proposed for waste transportation.Apart from this Waste Infrastructure Depot (WID) in each sanitary ward is proposed for storage of MSW infrastructure in use and also for available additional / backup infrastructure. For the design of sanitary landfill, important issues like waste to be handled, access road , land area, evaluation of geology and hydrology of the site, surface drainage, operational plan, layout of MSW landfill, completed waste fill features, estimation of landfill capacity, embankment, foundation, selection of liner systems , selection of leachate control facilities, selection of landfill gas control facilities, aesthetic considerations, post closure care, ground water protection, monitoring facilities, determination of equipment requirements, estimated cost of the project design life have been carefully analyzed and a rational concept has been developed.

Detailed Project Report for Solid Waste Management in Agra, Uttar Pradesh
Regional Centre for Urban and Environmental Studies, Lucknow Executive Summary rcues
Design has also been developed for waste (350 TPD) to compost plant. For design due consideration has been given to basis of compost plant design, curing shed, compost drying area, sizing and refinement tower, packing and baggage area, finished product godown, control room, administrative building, roads and other facilities, water supply and sprinkling system, electric power, weigh bridge, green belt and garden area, compost rejects etc The cost estimates are prepared and area requirement worked out. The DPR envisages for IEC & capacity building of stakeholders, program implementation, approach to IEC implementation covering program communication, social mobilization, identification of areas where community participation, methodology for conducting training programs with schedule are provided in details. The total project outlay is estimated at Rs 3393.3 lacs as detailed below: Cost of the Proposed Scheme
Particulars
Total Outlay
Rs in lacs - Collection 500.45 - Storage 340.65 - Transportation to site/plant 571.88
A. Sub total of above (Collection/Storage/Transportation)
1412.98
B. Compost plant 772.46 C. Landfill site (for use during the first 5 years): 808.73 D. Contingencies @ 3% on A to C 89.82 E. Capital Cost (A+B+C+D) 3083.99 F. Preparing of Detailed Project Report @1.5% of E 46.26 G. Capacity Building , IEC @ 1.5% of E above 46.26 H. Efficiency @ 1% of E above 30.84 I. Innovative Approach @ 1 % of E above 30.84 J. Incentives (F+G+H+I+J) 154.20 K. Third Party Project Monitoring and Evaluation @ 5% of
E above 154.20
L. Total Cost of the Proposed Scheme (E+J+K) 3393.3 The tools, equipment, machinery and fleet of vehicles for collection, segregation, storage and transportation for waste are proposed to be upgraded and/or replaced. The investment on account aggregates to Rs 1412.98 lacs. The capital outlay for the 350 TPD waste to compost plant is proposed at Rs 772.46 lacs.

Detailed Project Report for Solid Waste Management in Agra, Uttar Pradesh
Regional Centre for Urban and Environmental Studies, Lucknow Executive Summary rcues
The total proposed investment in landfill for a life of 25 years is estimated at Rs 3299 lacs. Out of this the cost of landfill site development for use during the first 5 years estimated at Rs 808.73 lacs has been considered in the capital cost outlay. The total cost of the scheme is proposed to be financed by grants under the Jawahar Lal Nehru Urban Renewal Mission (JnNURM), Twelfth Finance Commission, funds from the State Government , NNA as would be approved by the competent authority. As per the recommendations of the GoI, PPP has been proposed in the O&M of the 4 areas of MSW. It has been found from the earlier experiences of PPP that it leads to more efficient and reliable operations as the governance remains in the hands of government and operation is the hands of Private organizations. For this contracts should be finalized after calling for tenders and private partners with good financial background and related experience should be inducted. Incentives by way of reward and punishment should be a part of the PPP agreement. The activity of street sweeping and silt removal would be done by the existing staff of the NNA. The door to door collection of waste will be brought under PPP in a phased manner, ward wise. The operation of the compost plant and the landfill site should be brought under PPP from the startup of these facilities. NNA should also address the social concerns of the rag picker community who play a major role in segregating waste and cleaning the city.

Detailed Project Report for Solid Waste Management in Agra,,Uttar Pradesh
Regional Centre for Urban and Environmental Studies, Lucknow rcues
CCHHAAPPTTEERR 11 IInnttrroodduuccttiioonn ttoo tthhee PPrroojjeecctt

Detailed Project Report for Solid Waste Management in Agra,, Uttar Pradesh
Regional Center for Urban and Environmental Studies, Lucknow 1-1rcues
CHAPTER 1 INTRODUCTION TO THE PROJECT 1.1 Definition of Solid Waste Management
Solid Waste Management (SWM) is an organized process of storage, collection, transportation, processing and disposal of solid refuse residuals in an engineered sanitary landfill. It is an integrated process comprising several collection methods, varied transportation equipments, storage, recovery mechanisms for recyclable material, reduction of waste volume and quantity by methods such as composting, waste-to-power and disposal in a designated engineered sanitary landfill. The selection of a suitable SWM process is driven by the source and quality of waste produced. Solid waste is generated from a number of sources which include households (kitchen and yards), commercial areas (shops, hotels, and restaurants), industries (raw material and packaging), institutions (schools, hospitals, and offices), construction and demolition sites, wild and domesticated animals (carcasses of dead animals, manure), parks (fallen branches, leaves from trees) and streets (sand, silt, clay, concrete, bricks, asphalt, residues from air deposition and dust). 1.2 Problems Due to Solid Waste Accumulation of solid waste in open areas is an eyesore, diminishing real estate and property value, a breeding ground for insects and other vectors (rats and mice, wild and domesticated animals, as well as humans who may come in contact with contaminated wastes). It also causes odour nuisance, reflects the unorganized nature of the community and creates a poor environment for growing children. Improper and unorganized disposal of Municipal Solid Waste (MSW) in open areas and landfills have a negative impact on the living conditions of human beings as well as the overall environment. It results in spread of communicable and non-communicable diseases among human beings and animals, thus affecting the welfare, livelihood and economic productivity. In addition, it causes contamination of soil, surface water, ground water and generation of toxic and green-house gases. However, using adequate information, resources and efficient management practices, one can turn solid waste into a useful resource. 1.3 Current Status of SWM in India Management of Solid Wastes is of growing concern to the general public at large, local authorities and business communities in cities and citys across India. The problem is exacerbating in urban areas due to rapid strides in population growth coupled by an economic boom that encourages the
Average Rate of MSW
MSW generated in small, medium, and large cities and citys in India is about 0.1 kilograms (kg), 0.3-0.4 kg, and 0.5 kg per capita per day, respectively (Central Pollution Control Board [CPCB]).

Detailed Project Report for Solid Waste Management in Agra,, Uttar Pradesh
Regional Center for Urban and Environmental Studies, Lucknow 1-2rcues
consumption of goods and hence waste generation. As per Census 2001, the urban population accounts for 28-percent of the total Indian population. The Local Governing Bodies (LGBs) viz. Nagar Nigam and Nagar Palika Parisad are responsible for providing SWM services in the urban areas. In most of the urban areas, insufficient funds, use of obsolete and/or inefficient technologies, lack of public awareness/ training, and improper infrastructure have resulted in a poor state of SWM. 1.4 Initiatives to Improve SWM In the recent years, Government of India has taken several initiatives so as to improve the existing SWM practices in the country. Some of the key initiatives and recommendations are discussed as under: 1.4.1 Honorable Supreme Court of India Recommendations In recent years, the current SWM system in India has got considerable attention from the Central and State Governments and local municipalities. The first initiative was taken by the Honorable Supreme Court of India in 1998, which resulted in formation of a Committee to study the current status of SWM in Indian cities. This Committee identified the deficiencies/ gaps in the existing SWM system in the country and prepared the Interim Report on SWM Practices in Class I cities. Class I cities are cities with a population ranging between one lakh to ten lakhs (1, 00,000 to 10, 00,000). The recommendations of the Committee that pertain to MSW design criteria are provided in Annexure I of this report. 1.4.2 Municipal Solid Waste Management Rules As a second initiative, the Ministry of Environment and Forests (MoEF), Government of India, published “Municipal Solid Waste (Management and Handling) Rules 2000” (MSW Rules 2000). These rules were developed in conformance with Sections 3, 6 and 25 of the Environment Protection Act, 1986 and aim at standardization and enforcement of SWM practices in the urban sectors. These rules dictate that “Every municipal authority shall, within the territorial area of the municipality, be responsible for the implementation of the provisions of these rules and infrastructure development for collection, storage segregation, transportation, processing and disposal of municipal solid wastes”. In addition, “the CPCB shall coordinate with State Pollution Control Boards (SPCBs) and Pollution Control Committees (PCCs) in the matters of MSW disposal and its management and handling”. A summary of the SWM rules of 2000 document is provided in Annexure I
Average Composition of MSW
MSW primarily comprises of 30-35% of organic fraction, 3-6% of recyclables (paper and plastic), 40-45% of inert material, and less than one-percent glass and metal (National Environmental Engineering Research Institute [NEERI]).

Detailed Project Report for Solid Waste Management in Agra,, Uttar Pradesh
Regional Center for Urban and Environmental Studies, Lucknow 1-3rcues
1.4.3 Jawaharlal Nehru National Urban Renewal Mission The Jawaharlal Nehru National Urban Renewal Mission (JNNURM) is the third notable initiative undertaken by Government of India. JNNURM provides funding for urban infrastructure development in 63 cities and citys of the country. This mission has been initiated in 2006 and is slated to continue until 2011. The objectives of this mission are included in Annexure I 1.4.4 Twelfth Finance Commission Recommendations The Twelfth Finance Commission (TFC) under Department of Expenditure, Government of India, has recommended measures to augment the Consolidated Funds of the States to supplement resources of the Rural Local Bodies (RLBs) (Panchayats) and Urban Local Bodies (ULBs) (Municipalities). These funds are allocated to the the RLBs and ULBs based on the recommendation made by the State Finance Commissions (SFCs). In addition, in accordance with the recommendations made by the TFC, sum of Rs.20, 000 crores and Rs.5, 000 crores has been allocated for RLBs and ULBs, respectively, for the period 2005-10. The funds allocated to the RLBs are being utilized for providing water supply and sanitation in rural areas while the funds allocated to the ULBs are being utilized for enhancing the solid waste management services in urban areas under public-private partnership. In addition, municipalities with population of over 100,000 (as per 2001 census) are required to prepare a comprehensive scheme including composting and waste to energy systems to be undertaken in the private sector for appropriate allocation of funds. The main recommendations by the TFC are summarized in Annexure I 1.5 Project Background As a part of the TFC, Agra intends to enhance the existing SWM system for Agra and thus improve the health and living standards of its residents. For this purpose, NNA has assigned Regional Centre for Urban and Environmental Studies (RCUES), Lucknow, with the task of preparing a Detailed Project Report (DPR) for Solid Waste Management for Agra. 1.6 Project Objectives The purpose of this DPR is to identify the existing SWM practices within Agra, recognize deficiencies/ gaps in the present system and propose a comprehensive integrated plan for SWM in Agra in compliance with the MSW Rules 2000.
Detailed Project Report for Solid Waste Management in Agra,, Uttar Pradesh
Regional Center for Urban and Environmental Studies, Lucknow 1-4rcues
1.7 Scope of Study The scope of work includes the following: • Detailed survey of the prevailing conditions
o Quantification and characterization of the MSW o Gap analysis based on the MSW Rules 2000
• Design an MSW management system in accordance with MSW Rules, 2000 o Collection and Transportation System (CTS) o Waste processing system o Integrated Sanitary Landfill Facility (ISLF)
• O & M Plan addressing o Stakeholders’ complaints o Management of Information Systems (MIS) o Environment, Health and Safety (EHS)
• Preparation of Bill of Quantities (BOQ) • Capital and Operation & • • Maintenance (O&M) cost estimates • MSW management model including privatization aspects 1.8 Approach and Methodology This DPR proposes a comprehensive SWM management and implementation plan for Agra city. In order to address each of the problems associated with the current SWM system in Agra city, a series of steps were adopted, which are summarized in Figure 1.1.

Detailed Project Report for Solid Waste Management in Agra,, Uttar Pradesh
Regional Center for Urban and Environmental Studies, Lucknow 1-5rcues
Figure 1.1: Approach and Methodology
Problem Identification
Primary & Secondary Data Collection
Data Collation & Analysis
Gap Analysis
Evaluation of MSW Management Alternatives
Propose MSW Management Plan
BOQs & Cost Estimates
Financial Framework for Project Implementation
Institutional Framework including Privatization Options
Project Implementation Plan

Detailed Project Report for Solid Waste Management in Agra,, Uttar Pradesh
Regional Center for Urban and Environmental Studies, Lucknow 1-6rcues
1.8.1 Problem Identification With the start of the project, RCUES team interacted with various departments of the City, viz. Municipal Commissioner, Executive officer, Nagar Nigam Agra(NNA) and Agra Development Authority (ADA) (the records of meetings are enclosed as Annexure II this report). The objective of these meetings was to get ourselves acquainted with the people whom we will be interacting with, in the due course of the project and to get first hand information about the present waste management system being practiced in Agra, so as to identify major problem areas. The RCUES team then explained their understanding and roadmap to execute the project and understood the point of view of officials in this regard. Following are the major points of discussion during the problem identification stage:
The total area of the Agra, is 141 square kms
The awareness level of Agra residents, regarding waste management is observed to be very low.
Transportation of waste using heavy vehicles is very difficult; this is primarily
due to congested roads. It was also found that a ring road may be constructed around the city. This would be helpful in better transportation planning.
The city of Agra has underground sewerage system. About 17% of area is covered by sewerage system, of which 50% is not in working condition.
There is one slaughterhouse and a number of unauthorized meat shops in the
City. It was found that these slaughter houses/ shops do not follow clean methods for possessing meat. The waste from slaughter houses (skin, horns, and bones) is sold to processing or recycling units, from where it is exported. The remaining waste such as flesh cuttings are thrown away in open dumps which is lifted by NNA along with MSW.
For disposal and management of Bio-Medical waste (BMW), an organization,
Dutta Enterprises lifts the waste dumped outside the medical establishments in dual bins and transports the same to incineration facility operated by them on the outskirts of the city. However, all the clinics or smaller nursing homes etc are not registered with the Dutta enterprises and often dump the BMW at open dumpsites/ dhalaos along with the MSW.
According to NNA estimates, there are around 153 hotels, 700 restaurants and 88
Banquet Halls within the NNA boundary. It is to be noted that many of these establishments including are unregistered. Hence, NNA is not able to formulate a detailed plan for waste collection from these places.

Detailed Project Report for Solid Waste Management in Agra,, Uttar Pradesh
Regional Center for Urban and Environmental Studies, Lucknow 1-7rcues
1.8.2 Primary and secondary data collection
From the earlier experience of similar projects, RCUES team anticipated that to understand the problems of both the NNA and the public, it was essential to undertake both secondary and primary data collection. The major source of secondary data for this project was Nagar Nigam Agra and other government and non-government organizations. Secondary data was collected after discussions with NNA officials to understand the present practice of waste management and disposal system in Agra. Detailed questionnaires were prepared (refer Annexure V of this report for sample questionnaires) to collect information from these organizations in a streamlined and organized fashion at macro level. In this regard, following preliminary information was also collected to help in framing the methodology for primary data collection.
• Map of Agra with Municipal Limits • Census Details – Year 2001, 1991, 1981, 1971, 1961, 1951 • Organization structure of Nagar Nigam Agra • Total Number of House holds in Nagar Nigam Agra • List of Markets in Nagar Nigam Agra(Commercial Markets, Mandies) • List of Hospitals, Nursing homes in Nagar Nigam Agra, list of Hotels in
Agra Nagar Nigam • List of Industries in Nagar Nigam Agra Ward wise Map • List of Abattoirs, Slaughter Houses in Nagar Nigam Agra , list of Contact
Persons (Sanitary Inspectors, In charge Transportation, Ward Councilors, Landfill) of Nagar Nigam Agra
• Number of persons involved in MSWM • Existing Trenching Location, • Workshop Location • List of Vehicles, Waste transportation equipment • Ward-wise population distribution
Based on the evaluation of available secondary data and the outcome of discussions with the NNA our strategy and approach to complete each and every stage of the project was framed.
The major waste quantification was conducted from the Dhalaos/ Dustbins/Open dumpsites of the city from where waste is dumped by different sections of the society, later the results were compared with the records available with the NNA and the evaluations of the transportation system conducted by RCUES team for total waste generation per day.

Detailed Project Report for Solid Waste Management in Agra,, Uttar Pradesh
Regional Center for Urban and Environmental Studies, Lucknow 1-8rcues
The major reasons for considering the Dhalaos/Dustbins/open dumpsite as the best suited location for primary data collection for quality and quantity of waste are:
It was highlighted during the meetings & ‘ transacts of different wards’ made by RCUES project team that most of the waste, including the MSW, BMW, and Waste from eating joints/ Hotels/ Restaurants/ Dhabas/ Guest Houses/ Banquet Halls, waste from slaughter houses, is being dumped in the Dhalaos/ Dustbins/Open dumpsites.
If only, door to door survey would have been conducted, the results would have been based only on the information provided by the respondents and may have had errors.
Door to door survey would also not have included drain silt, street sweeping, construction waste etc, which are responsible as an important and a large part of waste to be transported in the City.
Hence, primary data were collected from these dhalaos. In addition to this, primary survey has also been conducted at Hospitals, Hotels, and commercial centers and at house hold level also. (Refer Annexure V for sample survey formats). Results are provided in chapter 3 of this report.
During the primary survey, the RCUES team interacted with nearby residents, took photographs of the site and conducted waste quantification and characterization. Dhalao/dustbins/Open dumps have been selected and detailed survey of these sites has been carried out. (The Dhalao survey photographs are enclosed as Annexure VI for ready reference).
This was followed by waste quantification at site and waste characterization (physical) by quarter tine method. Details of the method are provided in chapter 3 of this report.
Following are the activities undertaken under this task:
Survey of waste storage centers (Dhalaos/Open dumps/Bins) to access the quantity of waste generated in each ward and total waste generated in NNA boundary
Comparison of default per capita waste generation factors with total waste
generated
Physical Characterization of waste percentage wise as Sr. No Waste Category Constituents
1 Inert Waste
Bulky wastes like mats & beddings, Stones Mud (from street sweepings)

Detailed Project Report for Solid Waste Management in Agra,, Uttar Pradesh
Regional Center for Urban and Environmental Studies, Lucknow 1-9rcues
Porcelain & Sanitary ware Ash
2 Organic Waste
leaves, Fruits and vegetable peals, Rotten veg and fruits, Left over food, Organic wastes from kitchens and markets and Horticulture wastes.
3 Drain Silt
Silt from drain including blackish matter that includes waste which is not visible as it is either decomposed or can’t be differentiated.
4 Recyclable
Plastics Metals Papers Glass Plastic bags Clothes Cardboards Cartoons Boxes Rubber Packaging Disposal materials from restraints
4 Construction Debris
Broken Concrete Brick Sand Stone & Aggregates
Chemical Characterization of Waste for following parameters
1 Moisture Content 2 Calorific value 3 Bulk Density 4 Ph 5 Conductivity

Detailed Project Report for Solid Waste Management in Agra,, Uttar Pradesh
Regional Center for Urban and Environmental Studies, Lucknow 1-10rcues
6 c/n ratio 7 Organic Carbon 8 Total Solids (% by mass) 9 Lignin Content (% by mass) 10 Total Volatile Solids (1:5) Rat 11 Loss on Ignition 12 Total Potassium (as k.mg/kg) 13 Nitrogen (% by mass) 14 Phosphorous ( % by mass) 15 Sulphur (as S, % by mass on dry basis) 16 Iron 17 Copper 18 Zinc 19 Nickel 20 Manganese 21 Chromium 22 Cadmium 23 Mercury 24 Lead 25 Selenium 26 Arsenic 27 Pesticide
Apart from the Dhalao/Dustbin/Open dump site survey, the City was surveyed thoroughly and areas were traced as per density of population and standards of living of the people. Similarly, survey of major waste generation sources, waste storage centers in the city and landfill sites were carried out to assess the present waste storage infrastructure, frequency of waste collection, segregation of waste, recycle and disposal practices in Agra city. Waste collection and transportation fleet management system was studied; fleet maintenance measures and route plans of waste transportation system were traced.
1.8.3 Data Collation and Analysis
The waste quantity and characterization details gathered during primary survey were compiled and analyzed. The quantities were also compared with the waste transported from each sanitary ward. The data was duly compiled and details are provided in chapter 3 of this report Waste quantities are also analyzed and calculated to provide a break up for each ward and arrive at per capita per day waste generation figures. The results are also compared with the per-capita waste generation figures as provided by the NNA.

Detailed Project Report for Solid Waste Management in Agra,, Uttar Pradesh
Regional Center for Urban and Environmental Studies, Lucknow 1-11rcues
The Census 2001 figures of population for Nagar Nigam Agra are used to calculate the population projections for each ward. The Projections are done using the methods recommended in CPHEEO Manual. Waste generation figures are also calculated on the basis of these projected figures and the per capita waste generation figures. The same are enclosed as Annexure IX of this report.
1.8.4 Gap analysis
Gaps in the existing waste management system were identified with reference to the MSW Rules 2000, the information provided by the NNA officials and the existing scenario as per the results of the primary survey. During the survey awareness level of general public in regard to segregation of waste and other environmental friendly waste management practices was accessed Backup fleet and equipments with the Nagar Nigam Agra were also analyzed by conducting meetings with NNA officials and the present conditions of these equipments were also assessed. Following are the highlights of this exercise
Comparison of default per capita waste generation factors with per capita waste generation figure as derived from the survey.
Adjudging the availability and requirement of waste management
equipments, the analysis was used for conceptualization of the proposed plan.
The existing waste management is not organized & scheduled and hence,
requires up gradation.
The awareness level regarding the SWM rules and the acceptability is very low.
The residents & the shop keepers of the LIG and MIG areas dump waste at
the nearest open dump site and/ or on the streets or in vacant plots.
Many of the Eating joints/ Hotels/ Restaurants/ Dhabas/Guest Houses/ Banquet Halls of the City are unauthorized. Hence the NNA is not able to formulate a detailed plan for waste collection from these places.
Detailed Project Report for Solid Waste Management in Agra,, Uttar Pradesh
Regional Center for Urban and Environmental Studies, Lucknow 1-12rcues
1.8.5 Evaluation & Proposal, Detailed engineering, BOQ and Cost estimates of the MSW Management Plan
Based on the outcomes of the Primary and Secondary data collection, collation and analysis results, discussions with the stakeholders, NNA, and the best judgments made by the RCUES experts, alternatives were considered and evaluated and a most suitable MSW management model developed for implementation.
Further, detailed engineering, cost and estimates for this plan were developed and considered for producing a finance model.
Refer chapters 5, 6, 7 and 8 for details regarding detailed engineering, BOQ, Cost estimates, landfill design, operational and maintenance aspects.
Detailed Project Report for Solid Waste Management in Agra,,Uttar Pradesh
Regional Centre for Urban and Environmental Studies, Lucknow rcues
CCHHAAPPTTEERR 22 TThhee PPllaann AArreeaa-- SSiittuuaattiioonn AAnnaallyyssiiss

Detailed Project Report for Solid Waste Management in Agra, Uttar Pradesh
Regional Centre for Urban and Environmental Studies, Lucknow 2.1rcues
• CHAPTER 2 THE PLAN AREA – SITUATION ANALYSIS This chapter provides an overview of the location, current extents of Agra city, its existing and projected populations, land use pattern and existing physical & social infrastructure. It also details the current financial status of NNA and its administrative setup for MSW management. The information provided in this chapter was procured through various sources such as NNA, Agra Development Authority (ADA), discussions with the local residents and site investigations performed by the RCUES project team. While some of this information directly forms the basis of the design for the components of MSW management, the rest gives the feel of the city and its parameters for which the MSW management system is being proposed. 2.1 Location and Extents The city of Agra is situated on the Western Bank of river Yamuna on National Highway (NH-2) at about 200 kms from Delhi in the state of Uttar Pradesh. Agra is geographically located between 27°05’ and 27°15’ latitude in north direction and longitude 78°07’ and 77°53’ in east direction The Agra city is situated on the banks of the river Yamuna. The city is known for Taj Mahal, one of the Seven Wonders of the World which draws tourist from all over the world. The city has rich historical background, which is amply evident from the numerous historical monuments in and around the city. Large number of domestic and foreign tourist visit Agra. It is a part of the golden triangle of tourism-Delhi, Jaipur, Agra. The city has an area of 141sq.km which falls under the jurisdiction of Agra Nagar Nigam. The city is divided into 90 election wards. These election wards are further grouped into 19 sanitary wards for solid waste management. This area has been used to design the MSW collection and transportation system in the proposed integrated plan in this DPR. 2.2 Population As per as census 2001, the population of Agra is estimated 12.75 lakhs (excluding population of cantonment of Agra) with a decadal growth rate of 30.37%. During the post-independence period commerce showed a phenomenal increase with the associated industrial development and establishment of industrial estate, which resulted in the increase of city population. In the last four decades growth rate was maximum of 32.15%. The increase in the Nagar Nigam limits in the year 1981 attributed to the increase in population and high growth rate. Table: 2.1 shows decadal population and growth rate from 1961-2001.

Detailed Project Report for Solid Waste Management in Agra, Uttar Pradesh
Regional Centre for Urban and Environmental Studies, Lucknow 2.2rcues
The historical growth rate has been derived based on the past decadal population of the city and cantonment, the future population has been projected only for Agra city that falls within the limits and under the purview of NNA. The ward wise population for the 90 election wards is included in Annexure IV. In addition, the census estimates from 1961 to2001 have been used to project the population for years 2006, 2011, 2021, and 2031 (Table 2.1) for Agra city. The calculations for population projections are done by various methods as recommended by CPHEOO Manual for solid waste Management and these are summarized in Annexure III. The projected population for 2011 has been used in planning the collection and transportation equipment and the compost plant and the projected population for 2031 for designing the land fill site. The plan, however, purposes phased land fill and composting site designs to accommodate the increase in MSW considering the changes in population with time. Table2.1: Population and Growth Rate- Agra
E The sex ratio measures the extent of prevailing equity between males and females in the project area. As per the Census 2001, the sex ratio in the city is 846 females per thousand males, which is les than the district figure of 898 females per thousand males. Table 2.2: Sex Ratio
Year Sex Ratio 1971 829 1981 821 1991 832 2001 846
Source: Census of India, 2001 As per as census 2001, the literacy rate in the city is 60.14%, which is less than the literacy rate of the district (64.97 %). There is large poor population in the city. At overall city level nearly 17760
Population and Growth Rate Agra (Census of India, 2001)
Year Population Growth Rate (%) 1961 462000 - 1971 591000 27.92 1981 781000 32.15 1991 978000 25.22 2001 1275134 30.37
Population Projection 2006 1426617 2011 1590570 11.5 2016 1768592 11.2 2021 1957393 10.7

Detailed Project Report for Solid Waste Management in Agra, Uttar Pradesh
Regional Centre for Urban and Environmental Studies, Lucknow 2.3rcues
households has been identified as household below poverty line. As per the census 2001, the total slum population in the city is 121761. The percentage of slum population in the city is 9.5% of the total population, which is less than the percentage of slum population to the total urban population of the state (12.7 percent). As per DUDA there are 252 slum pockets with a population of the order 5.5 lakhs i.e. about 44 percent of the total population. Out of the total number of 80 wards (after delimitation 90 wards) in the city, 44 number of wards have slums. The slum population in the ward varies from 2.66 % to maximum of 91.85%. 2.3 Land Use
Table 2.3 Existing Land Use of Agra Development Area 2001 Master Plan of 2021 takes into account the requirements of urban population of 22.5 lakh as estimated by 2021(Master plan 2021) and focusing on city’s historical and archeological significance. The total future land requirement for the city is 200.36 sq km. The percentage breakups for the proposed Land use is given in Table 2.4 and Fig 2.1 Table 2.4 Proposed Land Use as per Master Plan 2021
Land use Percentage Residential 61.84 Commercial 1.88 Whole Commercial 0.75 Industrial 6.87 Community Facility 10.66 Office 2.25 Traffic & Transportation 10.87 Crenulations/ Burial ground 0.40 Park Place Ground 1.33 Historical Monument 1.47 Nursery 0.30 Gardens 0.87 Sewage Farms 0.49 Total 100

Detailed Project Report for Solid Waste Management in Agra, Uttar Pradesh
Regional Centre for Urban and Environmental Studies, Lucknow 2.4rcues
Fig 2.1 Proposed Land Use as per Master Plan 2021 2.4 Physical Infrastructure The RCUES field team carried out an in-depth study of various infrastructure facilities within the city such as roads, storm water drains, sewage, water supply, electricity, and social infrastructure. The following subsections discuss the survey results of these infrastructures as they would influence the proposed MSW Management system plan and design. 2.4.1 Roads
Land use Percentage Residential 49.53 Commercial 2.72 Industrial 8.01 Office 2.54 Tourism 0.89 Public& 8.80 Traffic & Transportation 10.79 Recreation & Open Spaces
4.37
Other open spaces 2.10 Other 10.25 Total 100
Residential49.53%
Other10.25%
Commercial 2.72%
Industrial 8.01%
Tourism 0.89%
Office 2.54%
Public & Semi Public 8.80%
Traffic & Transportation
10.79%
Recreation & Open spaces
4.37%
Other Open Spaces2.10%
Poor Condition of Road
Detailed Project Report for Solid Waste Management in Agra, Uttar Pradesh
Regional Centre for Urban and Environmental Studies, Lucknow 2.5rcues
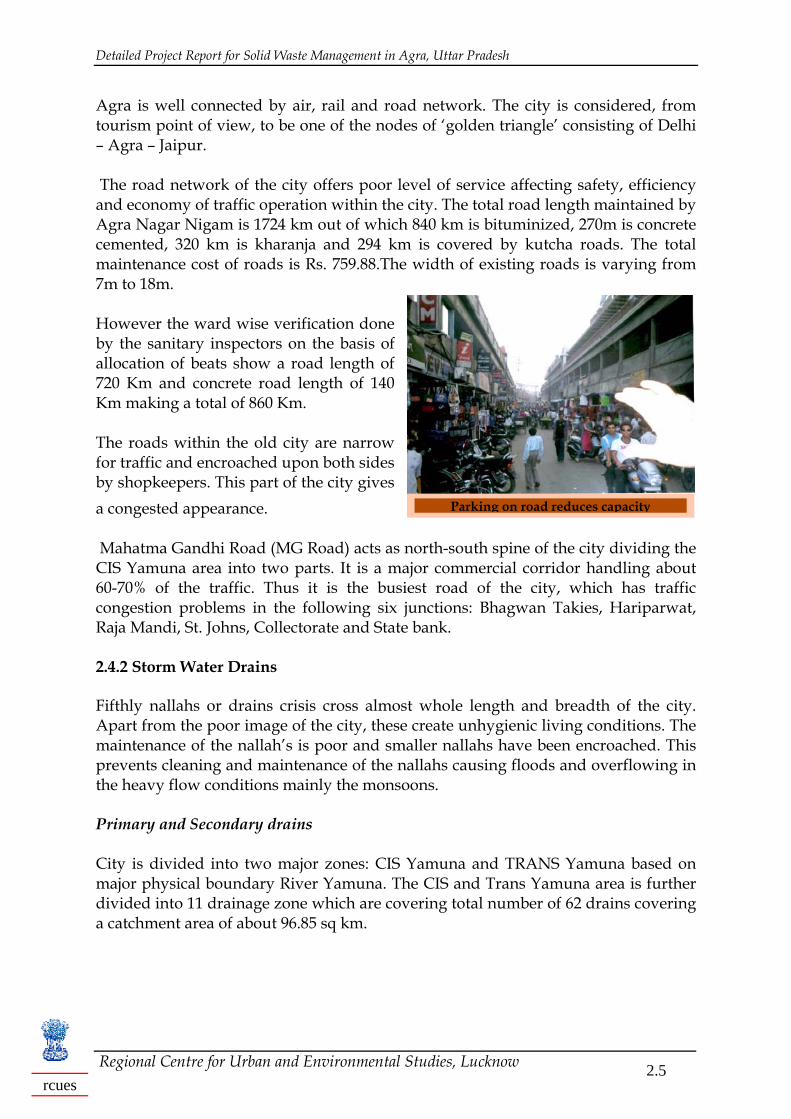
Agra is well connected by air, rail and road network. The city is considered, from tourism point of view, to be one of the nodes of ‘golden triangle’ consisting of Delhi – Agra – Jaipur. The road network of the city offers poor level of service affecting safety, efficiency and economy of traffic operation within the city. The total road length maintained by Agra Nagar Nigam is 1724 km out of which 840 km is bituminized, 270m is concrete cemented, 320 km is kharanja and 294 km is covered by kutcha roads. The total maintenance cost of roads is Rs. 759.88.The width of existing roads is varying from 7m to 18m. However the ward wise verification done by the sanitary inspectors on the basis of allocation of beats show a road length of 720 Km and concrete road length of 140 Km making a total of 860 Km. The roads within the old city are narrow for traffic and encroached upon both sides by shopkeepers. This part of the city gives a congested appearance. Mahatma Gandhi Road (MG Road) acts as north-south spine of the city dividing the CIS Yamuna area into two parts. It is a major commercial corridor handling about 60-70% of the traffic. Thus it is the busiest road of the city, which has traffic congestion problems in the following six junctions: Bhagwan Takies, Hariparwat, Raja Mandi, St. Johns, Collectorate and State bank. 2.4.2 Storm Water Drains Fifthly nallahs or drains crisis cross almost whole length and breadth of the city. Apart from the poor image of the city, these create unhygienic living conditions. The maintenance of the nallah’s is poor and smaller nallahs have been encroached. This prevents cleaning and maintenance of the nallahs causing floods and overflowing in the heavy flow conditions mainly the monsoons. Primary and Secondary drains City is divided into two major zones: CIS Yamuna and TRANS Yamuna based on major physical boundary River Yamuna. The CIS and Trans Yamuna area is further divided into 11 drainage zone which are covering total number of 62 drains covering a catchment area of about 96.85 sq km.
Parking on road reduces capacity
Detailed Project Report for Solid Waste Management in Agra, Uttar Pradesh
Regional Centre for Urban and Environmental Studies, Lucknow 2.6rcues
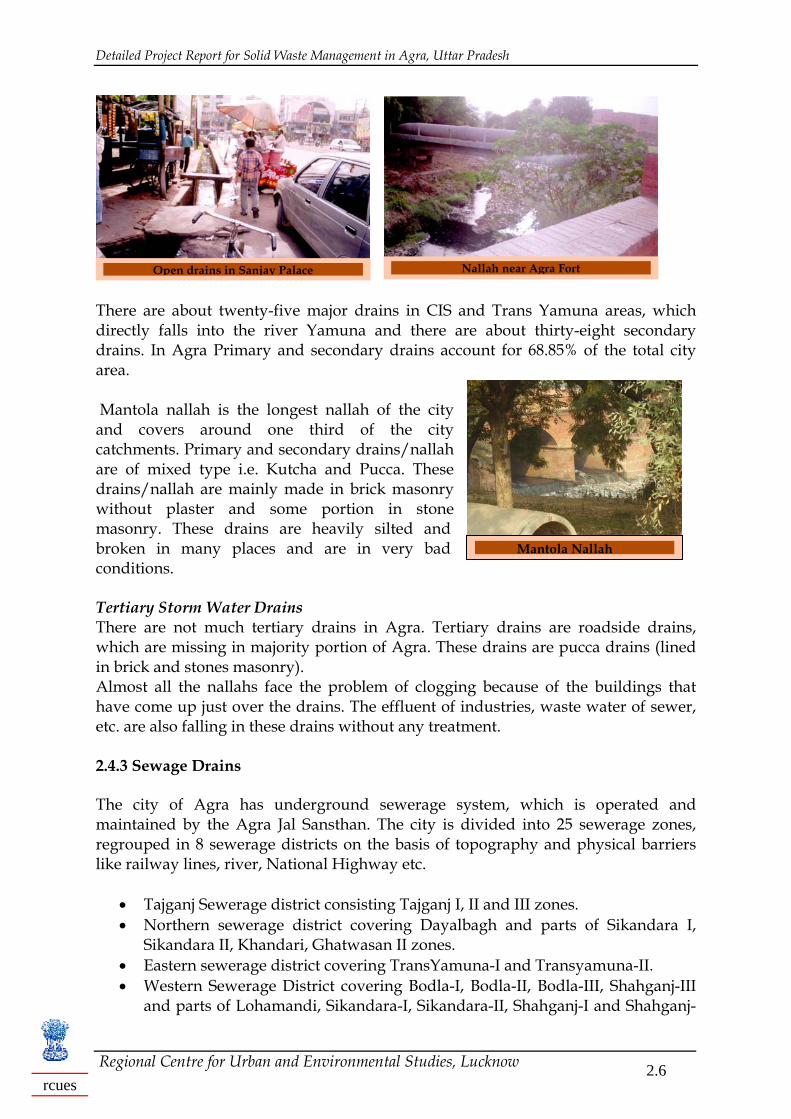
There are about twenty-five major drains in CIS and Trans Yamuna areas, which directly falls into the river Yamuna and there are about thirty-eight secondary drains. In Agra Primary and secondary drains account for 68.85% of the total city area. Mantola nallah is the longest nallah of the city and covers around one third of the city catchments. Primary and secondary drains/nallah are of mixed type i.e. Kutcha and Pucca. These drains/nallah are mainly made in brick masonry without plaster and some portion in stone masonry. These drains are heavily silted and broken in many places and are in very bad conditions. Tertiary Storm Water Drains There are not much tertiary drains in Agra. Tertiary drains are roadside drains, which are missing in majority portion of Agra. These drains are pucca drains (lined in brick and stones masonry). Almost all the nallahs face the problem of clogging because of the buildings that have come up just over the drains. The effluent of industries, waste water of sewer, etc. are also falling in these drains without any treatment. 2.4.3 Sewage Drains The city of Agra has underground sewerage system, which is operated and maintained by the Agra Jal Sansthan. The city is divided into 25 sewerage zones, regrouped in 8 sewerage districts on the basis of topography and physical barriers like railway lines, river, National Highway etc.
• Tajganj Sewerage district consisting Tajganj I, II and III zones. • Northern sewerage district covering Dayalbagh and parts of Sikandara I,
Sikandara II, Khandari, Ghatwasan II zones. • Eastern sewerage district covering TransYamuna-I and Transyamuna-II. • Western Sewerage District covering Bodla-I, Bodla-II, Bodla-III, Shahganj-III
and parts of Lohamandi, Sikandara-I, Sikandara-II, Shahganj-I and Shahganj-
Open drains in Sanjay Palace Nallah near Agra Fort
Mantola Nallah

Detailed Project Report for Solid Waste Management in Agra, Uttar Pradesh
Regional Centre for Urban and Environmental Studies, Lucknow 2.7rcues
II • Southern-I sewerage district covering Bundukatra and part of Shahganj-I • Southern-II sewerage district covering part of Shahganj-II. • Central sewerage district covering Ghatwasan-I, Kotwali, Maithan,
Hariparbat, Chhata, Rakabganj and parts old Khandari, Ghatwasan-II and Lohamandi.
The area covered by sewerage system is only 17%. About 50% of the sewerage system is not in working condition. Three Sewage Treatment Plants were built under Yamuna Action Plan Phase I. The STPs at Burhi ka Nagla (2.25 MLD) and Peela Khar (10 MLD) are made to perform beyond capacity, but still treat only 10% of the sewage they receive. Mostly the sewage goes into the open drains. The system is badly silted, choked and damaged at number of places and overloaded due to the growth of population the city. Improper means of disposals of wastewater has also resulted in environmental pollution and creates unhygienic conditions. In view of the above situation of the sewage and storm water drains, it would take sometime before the system is set augmented and set in place. It is therefore been assumed in the design that the entire drain silt and street sweepings would be sent to the landfill. 2.4.4 Water Supply System Uttar Pradesh Jal Nigam (UPJN) is the nodal agency for developing water infrastructure in Agra. UPJN then transfers the facilities to the (Agra Jal Sansthan) AJS for operation and maintenance. The mission of AJS is to supply potable water in adequate quantity to the consumers and maintain the sewerage system of the city efficiently. Agra water supply originates from river Yamuna. Apart from Yamuna Agra also receives about 115 MLD of raw water from Gokul Barrage during the lean period to June. The total Storage capacity available within Agra is about 48200 KL comprising of 12 number of reservoirs. Further this water is distributed to Agra city through distribution network 1100 KM length of pipes with diameter ranging from 80 mm -800 mm. The city’s total water requirement is about 300-350 MLD at current demand level (including cantonment). As per estimate U.P. Jal Sansthan 70% of the area is covered by piped water supply however in some of the areas the water supply is uneven Present 25 zones have been set up, based on topography and operational
Sewage Treatment Plant in Agra

Detailed Project Report for Solid Waste Management in Agra, Uttar Pradesh
Regional Centre for Urban and Environmental Studies, Lucknow 2.8rcues
convenience, to cover the entire master plan area. In most of the areas of Nagar Nigam water distribution system is available but still in some wards like Sikandra-II, Bodla-II, Shahganj-III, Tanjganj-II, III, Trans Yamuna-II and Ghatwasan-II no water supply network is available. Water requirement in these is met by tube wells and hand pumps. There are about 4017 stand posts and about 4598 hand pumps in the city. These areas are facing acute water shortage. There are two water treatment plants at Jeevani Mandi (Installed capacity of 200 MLD) and Sikandra (Installed capacity of 144 MLD).Both the treatment plants are giving a final output of about 270 MLD. 2.4.5 Electricity It is one of the most critical infrastructure facilities for a city. It has impact not only on livability issues but also critical factors governing competitiveness (especially for industries).In case of Agra nonavailablity of power means people using DG sets as a back-up option. At the city level, power supply is based on following parameters:
⎯ Demand Supply Gap ⎯ Asset management ⎯ Billing & collection ⎯ Automation of distribution network
Agra district has witnessed a rapid growth in the last few years. The connected load has increased from 539 MW in 1991 to 627 MW in 2001. Currently with 57 substations of 33 KV, the available capacity is 493 MVA, which is just equal to the peak load demand of 500 MVA. However, keeping in view the growth of Agra, this needs to be increased. The projected peak load demand by 2010 is about 800 MVA. 2.4.6 Industries As per the report of district Industries Centre, Industrial Development in Agra at a glance, the total number of SSI units in the city is 5263 and the investment in these SSI units is Rs263-15 crores. The total number of exporting SSI units is 131 and shoe export units are Rs 87 The annual export from exporting SSI units and shoe export units is approximately Rs. 1500-00 crores and Rs. 1000-00 crores respectively. The annual export from SSI units also includes the indirect export. The sectoral distribution of investment shows that Rs. 89 crores and Rs.42, 50.00 crore is being invested in agro-based industry and service sector respectively. Table2.6: Type of SSI unit

Detailed Project Report for Solid Waste Management in Agra, Uttar Pradesh
Regional Centre for Urban and Environmental Studies, Lucknow 2.9rcues
Repairing & Service Industry
32.7%
Miscellaneous Mfg.
16.1%
Electrical Machinery & Apparatus
1.2%
Beverages, Toba & Toba products
0.1%
Food products4.4%
Hosiery & garments
12.6%
Machinery & Part Except Electrical
4.8%
Non-metallic mineral products
6.5%Metal products3.2%
Paper products & Printing1.2%
Wood Products6.5%
Leather Produc5.0%
Chemical & Chemical Products
2.1%
Rubber & Plastic3.7%
Fig 2.2: Distribution of SSI units
From the above table, it can be seen that the maximum percentage of SSI units are in repairing & service industry. There are also about 30,000 households artisan units in the city. Agra city has been the traditional seat of Iron Casting Products from the Mughal period. Before 1993 there were approximately 250 Foundry units in the city but with the declaration of Taj Trapezium Zone in 1997-98 and implementation of strict pollution norms many industries were
closed down. Now
S. No. Kind of SSI Unit Number Percentage to total 1 Food products 232 4.4
2 Beverages, Toba & Toba products 4 0.1
3 Hosiery & garments 663 12.6 4 Wood Products 342 6.5 5 Paper products & Printing 63 1.2 6 Leather Products 263 5.0 7 Rubber & Plastic 194 3.7
8 Chemical & Chemical Products 113 2.1
9 Non-metallic mineral products 341 6.5
10 Metal products 166 3.2
11 Machinery & Part Except Electrical 253 4.8
12 Electrical Machinery & Apparatus 63 1.2
13 Miscellaneous Mfg. 847 16.1
14 Repairing & Service Industry 1719 32.7
Total 5263 100

Detailed Project Report for Solid Waste Management in Agra, Uttar Pradesh
Regional Centre for Urban and Environmental Studies, Lucknow 2.10rcues
there are only 166 foundry units working in the city by adopting the environment friendly fuel. The shoe manufacturing industry in Agra exists mainly in the form of cottage industries. There are about 5,000 to 7,000 such units in Agra. Besides, there are about 200 export-oriented units. These employ more workers. In addition, there are mid-size manufacturing units, which can be classified as small-scale industries. Such units employ about 10 to 50 workers. According to State government records, about 1.5 lakh pairs of shoes are manufactured a day in Agra by the cottage, small-scale and medium-scale footwear units together. About two lakh people work in the shoe industry in Agra. About 1.5 lakh pairs of shoes are manufactured in Agra per day by the cottage, small scale and medium scale footwear units. There are also a large number of ancillary industries, supporting footwear industries in Agra. About 65% of total domestic requirement of shoes in India is supplied from Agra. Agra is also famous for its Petha. Petha is manufactured by over 750 cottage units of the city and it has been the source of livelihood for several thousand residents. The origin of petha dates back to the Mughal era. Presently, the well-known Agra petha is manufactured in the narrow lanes of the centuries-old Noori Darwaza Market and other places of the city. 2.5 Social Infrastructure 2.5.1 Career/Education Despite the fact that only 48.6% of the population in Agra city are literate (according to census 2001), the city provides many career options. Out of this figure majority of those who are illiterate comprise females - only 30.6% of females are literate. However, educational institutes are spread throughout the city except in certain rural areas. The educational institutes provide primary and high school education, higher education, vocational training, and professional training. As Agra is a tourist hotspot one would expect a good number of institutes providing the training in this industry. Contrary to the fact there are very few institutes offering professional courses in tourism and allied fields. The educational institutes in Agra comprises of 118 high schools, for higher education there are 2 Universities, one is Dayalal Deemed
University and another one is Dr Bheem Rao Ambedkar University (Agra
Dr BheemRao Ambedkar Agra University

Detailed Project Report for Solid Waste Management in Agra, Uttar Pradesh
Regional Centre for Urban and Environmental Studies, Lucknow 2.11rcues
University), 1 Medical Colleges, Engineering Colleges, 9 Degree Colleges having affiliation from Agra University, Management Institutes, Computer institutes, Polytechnics, Inter colleges (CBSE), Inter Colleges (UP Board), Central School and Industrial Training Institutes. Besides there are many private institutes that provide training in professional courses. 2.5.2 Health Services These include medical College which is providing medical facilities, 1 district hospital, and 127 private hospitals, about 101 government hospitals, 13 dispensaries, 1 maternity hospital medical offices in the city, 5 child health care centers, 123 nursing homes and several private clinics. Besides these, there are hospitals for armed forces in the cantonment area, for police personnel in police lines and for railway staff in railway lines. Majority of the medical services are provided by private establishments. About 75-80% of the hospitals are registered with Dutta Enterprises for collection and disposal of the waste. 2.5.3 Fire Fighting Services For Agra city there is 1 firefighting station. By 2021 one more firefighting station will be required. 2.5.4 Communication Services Agra City has an extensive communication/telecommunication networks involving both private and public sector as key service providers. The communication facilities are readily available in the private and public sector in Agra city. In the private sector along with courier services there are 75 Sub Post Offices. Besides the Telecommunication Department, the private sector is involved in providing telecommunication services connecting Agra city areas surrounding the city and far off rural areas through STD, ISD and mobile networks. 2.6 Financial Status of Agra Nagar Nigam The cash flow statement for the 2 year period ended March 31, 2006 for NNA has been summarized in Table 2.7:
Table2.7 Cash Flow Statement for NNA Year Ended March 31, 2005 2006 SOURCES OF FUNDS Rs in crores 1. Rates & taxes 13.7 7.6 2. Municipal revenue other than taxes 10.8 17.8 3. Grants& Loans a) State Finance Commission 27.3 45.8 b) Eleventh Finance Commission 1.9 2.1 4. Others 0.4 0.8

Detailed Project Report for Solid Waste Management in Agra, Uttar Pradesh
Regional Centre for Urban and Environmental Studies, Lucknow 2.12rcues
Total Sources 54.1 74.1 USES OF FUNDS 1. General admin. & collection charges 10.1 10.5 2. Lighting establishment 0.6 1.2 3. Cleaning -Salaries 22.3 24.8 -Equipment 3.2 3.3 4. Others 13.3 15.2 5. Public works 0.5 1.4 Total Uses 50.0 56.4
2.6.1 Sources of funds During the year ended March 31, 2006, the income of Rs 7.6 crores from rates and taxes comprised mainly of house tax (Rs 4.6 crores), advertisement tax (Rs 0.7 crores), share of stamp tax (Rs 0.9 crores), electricity department (Rs 1.1 crores) and others (Rs 0.3 crores). During the year ended March 31, 2006, the income from municipal revenue (other than taxes) of Rs 17.8 crores comprised mainly of rental of shops (Rs 0.8 crores), market fees (Rs 0.5 crores), slaughter house (Rs 1.2 crores), Agra Development Authority (Rs 1.3 crores), Jal Nigam (Rs 4.5 crores), Housing Development Authority (Rs 7.2 crores) and others (Rs 2.3 crores). Thus the resources NNA raises from rate and taxes and other user charges are low. The prime source of fund is from the grants it receives from the State Finance Commission (Rs 45.8 crores), Eleventh Finance Commission (Rs 2.1 crores) and others sources (Rs 0.8 crores). 2.6.2 Uses of funds From Table 2.7, it can be summarized that the main expenditure for NNA is on the establishment to collect rates and taxes (Rs 10.5 crores), cleanliness/sanitation including SWM (Rs 28.1 crores), others (Rs 15.2 crores) and public works (Rs 1.4 crores) The single most expenditure for NNA is on cleanliness and SWM. This expenditure at Rs 28.1 crores accounts for 51% of the total non capital expenditure of Rs 55.0 crores (total expenses of Rs 56.4 crores less expenses on public work of Rs 1.4 crores). In view of above the following can be concluded:
The accounts are maintained in single entry basis NNA needs to undertake reform to migrate to a modern double entry system.
NNA needs to improve its reliance on earning significantly by taxes/rents and imposition of user charges and correspondingly reduce its dependence on grants, if it wants to improve its financial position, so as to able to access financial institutions/capital market for any fund raising.

Detailed Project Report for Solid Waste Management in Agra, Uttar Pradesh
Regional Centre for Urban and Environmental Studies, Lucknow 2.13rcues
2.7 Administrative Setup for MSW Management The main organization which is responsible for urban governance and civic management is the Agra Nagar Nigam. The corporation has a democratically elected leadership from the constituencies within the geographic jurisdiction of the corporation boundaries. The present Corporation has been elected in the month of November, 2006 and has a jurisdiction of the corporation boundaries. Uttar Pradesh Municipal Corporation Adhiniyam, 1959 and its amendments govern the functioning of Agra Nagar Nigam (NNA). Under this cleanliness and sanitation is one of the main responsibilities of NNA. The Municipal Commissioner is the highest executive head of the Agra Nagar Nigam. The Health (Swasthya Vibhag) and Engineering (Nirman Vibhag) departments are the two executive departments responsible for implementation of the SWM plan and civil infrastructure in the town, respectively. The Health department is involved in planning and management of the SWM activities and in providing sanitary facilities to the residents of Agra. The Engineering department works in coordination with the Health department and undertakes civil and infrastructure development activities for the city. The Nagar Swasth Adhikari and the Executive Engineer are the senior officers of the Health and Engineering departments respectively, who report to the Municipal Comissioner. The administrative charts for each of these governing bodies are shown in Figure 2.3. The Nagar Nigam is divided into 90 election wards which are further divided into 19 Sanitary wards being headed by sanitary inspectors. The sanitary inspector is responsible for managing the fleet routes, collection procedure, allocating diesel to vehicles, street sweeping and de-lineation of responsibility of the supervisors and safaikaramcharis.

Detailed Project Report for Solid Waste Management in Agra, Uttar Pradesh
Regional Centre for Urban and Environmental Studies, Lucknow 2.14rcues
Fig: 2.3 Organizational Structure of the Agra Nagar Nigam
Municipal Commissioner
Chief Health Officer (1)
Senior Health Officer (1)
Additional Health Officer (1)
Chief Sanitary Inspector (2)
Sanitary Inspector (16)
Sanitary Supervisors (16)
Workers (2215)
Drivers (90)

Detailed Project Report for Solid Waste Management in Agra,,Uttar Pradesh
Regional Centre for Urban and Environmental Studies, Lucknow rcues
CCHHAAPPTTEERR 33 SSttaattuuss ooff eexxiissttiinngg SSWWMM SSyysstteemm
Detailed Project Report for Solid Waste Management in Agra, Uttar Pradesh
Regional Centre for Urban and Environmental Studies, Lucknow 3.1rcues
CHAPTER 3 STATUS OF EXISTING SWM SYSTEM This chapter discusses the existing SWM practices in Agra city. The various sources of waste generation, the current primary and secondary waste collection practices, waste transportation and disposal mechanisms, and gaps in the existing SWM system are identified in this chapter. Further, the solid waste generated from various sources is quantified and characterized in terms of the constituents of solid waste. The information provided in this chapter was furnished from discussions held with the NNA, local residents and site investigations and detailed survey performed by the project team. 3.1 Waste Generation Various estimates for waste generation are used in Agra because no detailed survey has been carried out in the past to measure the waste generation. The generation characteristics are strongly influenced by climatic and seasonal variation due to tourist arrivals and festivals, the economy of the region, the physical characteristics of the city and social and religious customs of the city This section describes the various sources of waste generation in Agra city, and existing waste handling and management methods at the source. The primary source of waste generation in Agra city are the local households, markets and commercial establishments such as hotels, restaurants, shops etc. Due to mismanagement and unavailability of separate handling facilities, Waste from industrial establishment, Hospitals and nursing homes, slaughter houses, street sweeping and sanitary drains etc. also contributes to MSW. As lot of demolition of old structures and reconstruction works are taking place, construction and demolition waste is significant. Agra is famous for Petha sweets and petha making produces substantial quantity of organic waste. Dairy waste also contributes to city waste generation. Apart from this there is a huge generation of leather and rubber trimming from small Footwear units spread in the city which adds up major portion to Municipal solid waste. The Project team held in depth discussions with various stakeholders viz. ADA, NNA, health officer, supervisors and sanitary inspectors, safai karamcharis, private operators, NGO’s, residents and doctors so as to get first hand information about the prevailing waste management systems at generation point. Discussions were undertaken on all the key issues related to waste management at generation level. Based on outcome of these discussions and incorporation of various viewpoints of the officials, The team identified major problem areas related to waste generation.

Detailed Project Report for Solid Waste Management in Agra, Uttar Pradesh
Regional Centre for Urban and Environmental Studies, Lucknow 3.2rcues
3.1.1 Approach Adopted for Estimation of Waste Generation After elaborate discussions and understanding the ground realities, The Project team prepared series of information sheets (Questionnaires) (Annexure V) so as to assess the key issues/ problem areas at macro level. RCUES deputed a team for nearly four weeks for assessment of the prevailing conditions of MSW Management ranging from waste generation from households, commercial establishments viz. Petha and Footwear units, hospitals & nursing homes, industrial establishments etc. to quantification, collection, transportation and ultimate disposal. The waste generated in the various parts of the city reaches the open dumps and dustbins that are located in each part of the city. The focus of waste estimation has been to study the amount and characteristic of waste being collected at these collection points. The Project team has undergone comprehensive survey of these locations that includes a detailed inventory to arrive at the per-capita waste generation of the city. To collaborate the findings at waste collection points, quantity and composition estimation has been done at the point of waste generation i.e. residential, commercial viz. Petha & Footwear units & industrial establishments, hospitals and nursing homes, hotels and restaurants, slaughter houses, street sweeping, sanitary drains, and construction and demolition sites. These estimates were used as a base to arrive at the total waste or per capita waste generation trends for major sources. The survey was followed by waste characterization (physical & chemical) by quartering method. The characterization has been done by M/s SGS India Pvt. Ltd. , Gurgaon. This result is supported by survey done at the household level, hospitals, hotels etc. A seven days consecutive survey of existing landfill site which includes weighing at a Weigh Bridge of transportation fleet reaching the site, was also carried out so as to assess the present waste disposal practices with an objective to ascertain overall waste collection efficiency in Agra city. Waste collection and transportation fleet management system was studied; fleet maintenance measures and route plans of waste transportation system were traced and are shown in Drawing No.-O:3146/Agra/ 02 &03 for ready reference. The waste quantity and characterization details as gathered during primary survey were compiled and analyzed. The data was compiled and details of the results are discussed in the following section of this chapter. Waste quantities were also calculated and analyzed for each election ward in order to propose collection and transportation system at ward level. As the available population figures are from census data, hence adequate projections have been made, as per the methodology provided in the CPHEEO SWM Manual.

Detailed Project Report for Solid Waste Management in Agra, Uttar Pradesh
Regional Centre for Urban and Environmental Studies, Lucknow 3.3rcues
3.1.2 Waste being collected at Open Dumps and Dustbins Primary survey at secondary collection point i.e., Dhallao or open dumps sites and dustbins have been selected and detailed surveys have been carried out by the The survey team, the site photographs are enclosed as Annexure VI for ready reference. These points are also marked on the map of the city DRG No. O:3146/Agra/02& 03. As per NNA official reported there were 561 secondary collection points which includes 200 Open dumps/ Dhallao and 361 Dumper placer locations. However The Project Team had observed only 325 secondary collection points across the existing 90 election wards. In total detailed survey was carried out at 9 Dhallao, 200 open dump sites and 116 dumper container (out of 361 dumper container reported). The project team also observed that around 90 dumper container out of 116 surveyed are in good condition. According to NNA, 60 new dumper containers are also purchased under Twelfth Finance Commission Grant. Direct assessment of waste collection is done at each such location in a prescribed format by survey team. For ready reference Table 3.1 given below summarizes the results of some of the locations.
Table 3.1: Calculation of Waste Collection at Secondary Collection Points.
Highest waste quantity is recorded in OD 50, 130, 119, 167, 24and DB 41,55,54,109,33 Similarly; results were collated for other wards also. (Results for all secondary collection centers are enclosed as Annexure VI to this report).
(In MT/ Day)
ID of Open dump/ Dhalao/ Dustbin
Location Waste Collected
Type of Waste
Bio
degr
adab
le
Rec
ycla
ble
Iner
t was
te
Con
stru
ctio
n de
bris
& w
aste
DB 103 Naval Ganj
Digamber Jain Mandir
0.50 0.24 0.08 0.15 0.03
DB 41 Saket Colony 6.60 0.83 0.35 5.15 0.30 OD 95 Mati Katra 3.90 1.62 0.31 0.45 1.50 OD 96 Bhivab Nagar 4.30 1.90 1.58 0.05 0.80
OD 33 Panchkuiya Road, Char
Baag 4.00 1.60 0.96 1.05 0.40

Detailed Project Report for Solid Waste Management in Agra, Uttar Pradesh
Regional Centre for Urban and Environmental Studies, Lucknow 3.4rcues
3.1.3 Waste Reaching the Existing Dumping/Trenching Site The existing trenching site is located at Shadahra on Delhi- Tundla Bye pass Road. Waste transportation vehicles dispose waste at this authorized site from all over the city collected at the points designated by Nagar Nigam. With the purpose of estimating the current efficiency of total waste transportation from the city, the site was physically observed by the The Survey team from 6:00AM in the morning to &:00 PM in the evening for seven consecutive days .Each and every vehicle reaching the site were noted in a log book and weighed for tare and load weight and estimation of quantity is arrived thereafter. Sample weigh slips are attached as Annexure-VII. The survey estimated that approximately 536 MT/Day waste is collected by the transportation fleet. Thus the present efficiency of waste lifting to disposal site works out to be 75.5% of total waste collection at secondary collection points. 3.1.4 Residential and Commercial Establishments The major portion of residents belonging to the residential establishments dump their household waste outside their homes and in some cases in dustbin (if available), or on the streets (open dumps) or in the drains running in front of the house. The karamcharis/operators collect waste from the various lanes and drains dump it in the vacant plots or in the open dumps. As of now, no charges are levied on households for collection of MSW by NNA. Private Operators is active in small way in MIG and HIG areas. They lift waste daily from door to door at monthly charge of Rs. 20 to Rs. 50. This waste is transported to the secondary waste collection centers (Refer Section 3.2.1) by Rickshaw trolley. An exhaustive survey of the 500 residential establishments was carried out for a week in order to assess the collection and transportation system at source and per capita waste quantity generated. The photographs and details of the survey is summarized in Annexure VIII .The survey includes residents from Economically Weaker Section (EWS), Low Income Groups (LIG), Middle Income Groups (MIG) and High Income Groups (HIG) . These groups have been characterized as per living standards, family size, main occupation, housing typology, solid waste disposal practice prevalent in Agra city. The per capita waste generation for each of the resident types is calculated and is summarized in Table 3.2. Table 3.2: Field survey results of per capita waste generation
Household Categories
Number of samples Average per capita waste generation
(gms/ day) Household Population
EWS 147 978 210 LIG 154 1070 216 MIG 135 994 303 HIG 98 540 366

Detailed Project Report for Solid Waste Management in Agra, Uttar Pradesh
Regional Centre for Urban and Environmental Studies, Lucknow 3.5rcues
However, these establishments are scattered in all wards and also the waste generated differs on a daily basis. Further, the per capita value obtained for different groups does not include street sweeping, drain silt and construction debris. Single bin system, with/without segregation is prevalent and the use of polythene for waste disposal was also found to be in vogue. Household survey indicates a higher percentage of bio degradable waste, as most of the waste here is fresh kitchen waste. The awareness of the people to recover recyclables is high which is sold to the kabadiwallas. As per Master plan -2021, the various segment of household stock and their share of the total housing demand are EWS-40%, LIG- 30%, MIG- 20%, HIG- 10% respectively. As per census 2001, the total no of household (HH) in the was 209997. If this ratio of HIG/MIG/LIG/EWS is used, which is in line with the slum population in Agra and RCUES’s estimate, the weighted average house hold waste generation comes to 246 gms/person/day.
Average per capita Generation, gms/ day =
(%EWS* EWS percapita generation+%LIG* LIG percapita generation +%MIG *MIG
percapita generation + %HIG* HIG percapita generation)
Table 3.3: Waste generation in Household
Category Percentage
Total population
2006 Total Generation MT/ Day HIG 10% 142662 52 MIG 20% 285323 87 LIG 30% 427985 93 EWS 40% 570647 120
TOTAL 100% 1426617 352 Based on the above analysis the residential/household accounts for about 352 MT/Day of total waste generation in the city. The commercial areas identified in Agra city are situated throughout the city and include Sanjay Palace, Bhagwan Talkies chaurah, Bijlighar chaurah, Nai ki Mandi, Rakabganj, Dayal Bagh Road, Bhagirath Marg etc. These areas are mixed zones comprising of commercial (shops and markets) and residential areas as well as hotels and restaurants. MSW generated from Commercial establishment is more recyclable and inert waste compared to organic waste. However a bulk waste like cartoon etc. is recycled at source and does not add on to total MSW generation. The waste from shops starts accumulating in the nearby open dumps in the morning hours (7:00 – 11:00 AM),

Detailed Project Report for Solid Waste Management in Agra, Uttar Pradesh
Regional Centre for Urban and Environmental Studies, Lucknow 3.6rcues
when they are cleaned. Safai karamcharies clean market places and throw the waste in the nearby open dumps. The commercial establishments are not charged for market sweeping, collection, and disposal at the nearby secondary collection points. The Project team conducted detailed survey of major commercial complexes .summarized below in Table 3.4: Table 3.4: Waste from Commercial establishment Commercial Complex No. of
shops Quantity of waste Generation in kgs/ day Biodegradable Recyclable Inert Total
Laxmi Market, Besides shahganj chaurah 25 20 25 50 95 Gaurav Complex, Bhagwan Talkies Chaurah 21 30 15 10 55 Sky Tower, Sanjay Palace 500 100 100 300 500 Baptist Church Complex, Pratap pur, Civil lines 20 15 20 35 70 Shivaji Market Complex, Bijlighar Chauraha 80 25 40 50 115 Emporium, Block No-13 7 10 10 20 40 Nath Complex 40 20 30 40 90 Garg Complex, Nai ki mandi 25 25 30 50 105 Drid-ve-Complex, Dayal Bagh Road 25 12 15 25 52 Anna Complex, Bhagirathi Marg 20 10 15 25 50 Total 763 267 300 605 1172 Percentage 23% 26% 52% 100% From the survey the per unit generation works out to be 1.54 kgs/unit/day.As reported in City Development Plan and NNA, there are more than 50000 shops & commercial establishment registered at Nagar Nigam. At this rate the total waste contributed by commercial establishment to MSW is 77 MT/ Day approximately. 3.1.5 Industrial Establishments As indicated in Section 2.3.6 of this DPR, there are various small scale and cottage industries in Agra city. Based on observations made by the survey team about these industries, the MSW is primarily generated from Petha and Footwear unit. (Specified in Drawing No. O: 3146/Agra/04 Petha units are mostly located at Noori Darwaza and Raja Mandi .The petha waste is biodegradable and about 50% is eaten up by grazing animals. However significant amount of waste is thrown in nallah and nearby secondary collection points. The leather and rubber trimming from footwear industry is accounted largely at Mantola, Dholikhar, Khattipara,Azamganj, Gobarchowki,pankisarai,Nai ki mandi, shakuntla Nagar, Raj Nagar,khaitana road,

Detailed Project Report for Solid Waste Management in Agra, Uttar Pradesh
Regional Centre for Urban and Environmental Studies, Lucknow 3.7rcues
gopal pura,Nand pura ,Devi road, Mohan pura, Budhvihar,Tila Nand Ram,Kajipara and many other places. Waste from Large leather and Rubber industry is not prominent but job works done by individuals for larger establishment which are mainly done at cottage level does not practice recycling rather throw waste in open areas or nallahs. It was also observed that accumulated waste at open dump or dustbins was burnt in order to reduce the volume when it remains unattended for several days. The total leather and rubber waste estimated at secondary collection point is approximately 60 MT/ Day. The pictures below depict the present situation due to waste generation from such units.
Weekly Leather Market run on Biglighar
to Baluganj Road side. Leather Waste is burnt after Dumping it
into Nallah
Sewer water flowing on the Leather
market Road due to choking. Drain silt containing huge quantity of
Leather and Rubber waste.
Petha waste thrown in Drain near Chitra
Talkies Petha units at Noori Darwaza

Detailed Project Report for Solid Waste Management in Agra, Uttar Pradesh
Regional Centre for Urban and Environmental Studies, Lucknow 3.8rcues
3.1.6 Hospitals & Nursing Homes Apart from Biomedical Waste generation, Hospital and nursing home generates non-infectious waste which contributes to total MSW generation. According to the CPHEEO guidelines the waste generation by medical institution will be around 1.5 kg/bed/ day of which 75% will be non- infectious i.e., Municipal solid waste and 25% will be biomedical waste. As reported in City Development Plan and by NNA, Agra has 127private hospitals and about 101 government hospitals and medical offices in the city. The total bed strength reported is about 8000. The team surveyed in detail about 49 Hospitals and Nursing home comprising both private and government to analyze quantity and present Hospital waste management scenario in Agra city. As per the survey, The quantity of waste generated from these medical establishments is estimated at 1.49 kg/bed/day out of which Biomedical waste (BMW) and Non –infectious is 0.549 and 0.944 kg /bed/ day respectively. The value arrived is in line with the CPHEEO guidelines. These results, derived from the survey, are summarized in Table 3.5. Table 3.5: Waste generation from Hospitals
Name of Hospital/
Nursing Home Location
No. of
Beds
Average Occupancy
per day
Waste Quantity (kgs/bed/day
Solid Waste
Bio- medical Waste
Total
Shree Ram Hospital I I C, Building Sanjay Police 35 25 2 3 5
Sarthak Nursing Home
G25, kamla Nagar by Pass Road, Agra 12 7 3 3 6
Vidhya Nursing Home
G-2, Phase 2, Trans Yamuna Colony Firojabad Agra 22 15 15 10 25
Dr Agarwal Nursing &
Maternity home
C-59, Trans Yamuna Colony, Agra 8 5 4 3 7
Priya Nursing home
B-91 Trans Yamuna Colony near Sayad road, Agra 12 8 7 5 12
Shree Krishna Hospital
D-14, Phase 2, Trans Yamuna Colony Tundal
Road Agra 20 15 10 10 20
Goyal Hospital D-2, Trans Yamuna colony, Agra 15 10 12 8 20
Akash Hospital Phase2, Trans Yamuna colony, Agra 25 15 10 5 15
Care Well Hospital
A-8, Trans Yamuna Phase1Faijabad, Agra 22 15 8 6 14
Vandana Nursing home
D-16, Phase 2 Trans Yamuna Colony, Daijabad road,
Agra 17 10 7 5 12

Detailed Project Report for Solid Waste Management in Agra, Uttar Pradesh
Regional Centre for Urban and Environmental Studies, Lucknow 3.9rcues
Name of Hospital/
Nursing Home Location
No. of
Beds
Average Occupancy
per day
Waste Quantity (kgs/bed/day
Solid Waste
Bio- medical Waste
Total
Jai Deep Hospital & Maternity
Center
Near Sayad Phase2 Trans Yumuna 10 6 5 4 9
Ram Tej Hospital
184/6 C,Vidhya Nagar road, Agra 20 10 25 20 45
Amit Jaggi Memorial Hospital
Vidhya nagar, Agra 15 7 15 10 25
Dr. Arti Manoj Hospital Vidhya nagar, Agra 20 10 20 12 32
Vishwani Hospital
E-41, near Kamla Nagar Petrol pump, Agra 12 7 5 4 9
Janak Raden Hospital E-35, Kamla Nagar, Agra 10 7 3 3 6
Sanjeevani Hospital E-8, kamla Nagar 7 10 7 5 12
Shakya Nursing & Maternity
home
14/9, Saket Colony road, Agra 9 5 5 4 9
Agarwal health Care center
G-35, Kamla Nagar, by pass, Agra 16 6 12 10 22
Shyam Lal Nursing Home
E-19, Kamla Nagar by pass road, Agra 12 10 7 5 12
Shiwam Nursing Home
H-64, Kamla Nagar by pass road, Agra 8 6 4 3 7
City Hospital City Hospital 112 60 50 30 80
Iswar Devi Memorial Hospital
Rajpur, Agra 22 10 5 3 8
Sukal Nursing Home 31/1E, Partappur, Agra 5 3 1 1 2
Public Care Hospital Rajpur Sahid Nagar 5 4 3 2 5
Mangala Hospital
Lauris Complex, Mannnar road, Agra 15 1 2 3 5
Pushpam Hospital Delhi Gate, Agra 55 20 70 34 104
Puspanjli Hospital Delhi Gate, Agra 55 20 70 34 104
Jai Hospital LIC Building, Agra 70 30 12 3 15 Shanti Hospital 102, Rajeev Nagar 15 5 3 2 5
Ravi Hospital 1/55, Delhi Gate Mathura road, Agra 4 1 3 1 4
Ganga Ram B93, TransYamuna Colony Firojabad, Agra 12 10 6 3 9
Heritage 7/52, Javanhan Nagar 50 20 7 3 10

Detailed Project Report for Solid Waste Management in Agra, Uttar Pradesh
Regional Centre for Urban and Environmental Studies, Lucknow 3.10rcues
Name of Hospital/
Nursing Home Location
No. of
Beds
Average Occupancy
per day
Waste Quantity (kgs/bed/day
Solid Waste
Bio- medical Waste
Total
Hospital Kapur
Orthopadetic Center
1, Shahid Nagar Shamshabad, Agra 20 10 7 4 11
ECG Alert Card Agra Medical & Research Center 23 15 2 3 5
Kailash Kant Hospital & Maternity
Home
5, Shahid Nagar, Agra 10 10 5 3 8
Metro Shahid Nagar, Crossing 50 20 4 1 5
Hareniya Moniyala
4, Shahid Nagar, Police station, Agra 5 2 5 3 8
Shubham Hospital
Ashah TV Tower, Firozabad, Agra 10 10 6 4 10
R K Hospital 54, New Jagdish Colony, Agra 5 1 15 5 20
Dr.Vikash Bansal
1/178 A, Bagh Farjana Naval Kishor Nursing 6 4 2 1 3
Dr. Kamlesh Tandan
Nursing Home 4/48 Lajpat Nagar, Agra 9 2 2 1 3
Verma Nursing Home 4/6, Ram Babu Civil Lines 5 3 5 3 8
Dr. Harsh Hospital 1/198, Civil lines 10 3 2 1 3
Santi Hospital 102, Rajeev Nagar 10 4 3 4 7
Shidharth 1/115/1,Gulabray Market & Research Center 10 5 5 2 7
Jai Devi Hospital Delhi Gate, Agra 50 20 15 5 20
Ayushman Hospital
Near Chandera khadri, Agra 7 4 4 1 5
Ram Raghu Hospital
Opposite Sanjay Complex Raghunath Nagar Church
raod, Agra 110 50 25 7 32
Total 1087 556 525 305 830 Average 0.944 0.549 1.49
The medical establishments in Agra city generates approximately 12 MT/ Day waste of which about 7.5 MT/ Day goes to Municipal stream and rest is BMW. The collection, transportation and disposal of the BMW are taken care by Dutta Enterprises. The vehicle of Dutta Enterprises collects the waste from hospitals and sent it to incineration facility operated by them in Agra. . About 75-80 % of the establishments are registered with Dutta Enterprises. The monthly charges procured by Dutta Enterprises per establishment are fixed depending on the strength of beds

Detailed Project Report for Solid Waste Management in Agra, Uttar Pradesh
Regional Centre for Urban and Environmental Studies, Lucknow 3.11rcues
as well as quantity of waste generation. As per the survey, charges vary from Rs. 500-2500/- per month in Agra city. The Project team noted the BMW is stored in the twin bins; however, colour schemes are not uniform and vary from hospital to hospital. 3.1.7 Hotels/Restaurants/Banquet Hall A summary of number of eating joints/ hotels identified in Agra city is provided in Table 3.5 The waste from these establishments mostly includes left-over food, and disposable crockery. Workers of these establishments dump the wastes at nearby container/ open dump from where the same is transported to designated dumpsite by Nagar Nigam workers. An estimate of the total waste generated in metric tons per day (MT/day) from hotels, restaurants, guest houses, marriage halls, and dhabas is presented in Table 3.6 Table 3.6: Number of Hotels/ Restaurants/ Banquet Halls in Agra City
Hotels/ Restaurants Nos. Waste Generated(Approx.) (Kg/unit/day)
Waste Generated (MT/day)
Hotels 153 58 9
Restaurants 700 30 21
Banquet Halls 88 50 4.4
Source: Agra Nagar Nigam and field survey The waste generated from each type of establishment in Table 3.6 has been estimated as per the surveys done for hotels, restaurants and banquet halls. The survey results are given below: Table 3.7 : Waste from Hotels
Sl. No. Name of Hotel Location
Capacity of Hotel (no. of room)
Quantity of waste per day
(kg) 1 Rajender Prasad Mahatma sidh road, Agra 145 140 2 Shri Partap Chand Jain Harihar Parvat 28 80 3 New Hotel Prince 919, Shiv Ji Market, Agra 12 112 4 Hotel Prince Sanjay Shallini Market Near Power House 21 60 5 Devash Guest House Delhi Gate, Agra 10 20 6 Rahi Tourist Building Delhi Gate, Near Raja Mandir 35 240 7 Hotel East Light Delhi Gate, Near Raja Mandir 14 40 8 Ashoka Guest House Kacheri road, Balugang , Agra 15 80
9 Prakash Tourist Complex 18/159, B Purant Mandi, Taj Ganj 12 40
10 Hotel Anand 27 Mandal Town, Agra 11 60 11 Hotel Ashish Palace Tourisht Complex Area 24 80 12 Hotel Oasis 44, Bansai Nagar, Agra 15 32

Detailed Project Report for Solid Waste Management in Agra, Uttar Pradesh
Regional Centre for Urban and Environmental Studies, Lucknow 3.12rcues
Sl. No. Name of Hotel Location
Capacity of Hotel (no. of room)
Quantity of waste per day
(kg)
13 Hotel Bengal Lodge Restaurant
30/28 Kachri Raod, Rakabganj Chipitala 17 48
14 Jhangir Hotel Taj Ganj, Agra 10 32
15 Hotel Roof-Top Restaurant Fatehabad Road Tajganj, Agra 12 40
16 Hotel Gopal Near Kailash Cinema 15 40 17 Hotel Deepak Fatehpur, Agra 10 40 18 Hotel Semi Softel Delux Delhi Gate, Agra 15 32 19 Capri Restaurant Delhi Gate, Agra 20 100 20 Shilaza Delhi Gate, Near Raja Mandir 32 40 21 Ashoka Guest House Delhi Gate, Agra 9 40 22 Amba INN 1/15, Delhi Raja Mandli Raod, Agra 25 40 23 Goverdhan Hotel Delhi Gate, Agra 35 100 24 Taj Delux 61, Baluganj, Agra 12 8 25 Hotel Zee Near Taj View Fahtehpur, Agra 30 120
26 Sanjay Lodge Block E 21, Near Petrol Pump Kamla Nagar, Agra 12 20
27 Ashoka Guest House 4/17A, Baluganj, Agra 14 120
28 Pall Hotel 1/42/-A/12, Delhi Gate ka Mandir, Agra 25 24
29 Hotel Rangal Trivent Market Chakki road, Agra 20 40 30 Hotel Sadari Shaheed Nagar, Shamsabad, Agra 25 80 21 Amar Yatri Niwash Fatehpur road, Agra 41 80
32 Hotel Sagar Near Kamlesh Cinema Fatehpur, Agra 12 40
33 Hotel Paradish Fatehpur, Agra 15 40 34 Shri Dauji D501, Kamla Nagar, Agra 15 48 35 The Calcutta Hotel Chhipitala 15 28 36 Hotel Shree Ram 24/5, Biili Ghar Bus Stand, Chipla 12 20 37 Hotel Solitaire Haririt crossing MG road, Agra 20 12 38 Hotel Taj Complex Crossing Saket Colony, Shahganj 8 12
39 Hotel Maya Purana Mandir Fatehpur road, Agra 12 60
Total 2288 Waste generation per unit =2288/39= 58 kgs/unit/day
The total of 39 hotels were surveyed summarized in Table 3.7 for quantification of waste generated from Hotels-large and small. The waste characteristics shows higher biodegradable waste compared to recyclable and inert. The waste generation rate of large hotels in NNA ranges from 40kg/ unit/ day to as high as 120kg /unit / day. After detailed analysis on the basis of average occupancy rate and capacity of the hotel , it is estimated that the average generation rate in hotel is 58 kgs/unit/ day and total waste generated works out to be 9 MT/ Day

Detailed Project Report for Solid Waste Management in Agra, Uttar Pradesh
Regional Centre for Urban and Environmental Studies, Lucknow 3.13rcues
Table 3.8 : Waste from Restaurants
Sl. No. Name of Restaurent Location Capacity of
Restaurant
Average Occupancy per
day
Quantity of
Wastage (per day)
(KG)
1 Morya Restaurants Hari Parwant Chauraha, Agra 40 100 50
2 Raj Sweet & Restaurant Dewari road near, Agra 44 150 60
3 Sahil Restaurant near Heera Cinema Hall, Agra 50 100 40
4 Nilam Restaurant Near RamLila ground, Agra 30 100 30
5 Sweet Corner Balkeshwer 40 100 40 6 Kamal Restaurant Kedar Nagar, Agra 70 200 75 7 Rasmi Restaurant Trans Yamuna, Agra 60 100 40 8 Taj Restaurant Trans Yamuna, Agra 50 100 25
9 Hotal New Taj Restaurant Lomomander 40 50 20
10 Chand redturent Khatic Restaurant 40 50 25
11 Mushkan Restaurant Shahab near Petrol pump 45 50 30
12 Parryason Restaurant
1/44 Shop no.2, Delhi gate, Agra 20 35 8
13 AnjanRestaurant Crossing veiw, Fatehabad, Agra 40 20 8
14 Pizza Corner Pizza corner, Sadar bazar 30 45 12
15 New Quality Restaurant
kailash cinema, Fatehpur, Agra 40 50 10
16 Shivakash Restaurant
Lalsag, Fuisag Jasaria Enclave Hospital 25 35 12
17 Indra Restaurant Behind Halal, Agra 50 80 20 18 Divya villas 18/159, Prakash Tourist 32 100 70 19 Ajanta Restaurant F339, Kamla Nagar Agra 25 40 20
20 Devi Ram Restaurant 3/19 Pratappura, Agra 15 25 8
21 Lakhshmi Restaurant
50/ A, Taj road Sadar bazar 25 35 30
22 Radhiyaka Restaurant
E 25/2, Taj road Sadar bazaar 50 200 75
23 Braj Restaurant 50/ A, Taj road sadar bazar 50 40 20
24 Tamption Restaurant
Tourist Complex Fatehpur, Agra 35 100 40
25 Shree Balaji Shri Balaji cinema, Agra 32 100 50
26 Ashish Restaurant Tourist Complex Fatehpur, Agra 40 100 60
27 Dolly Restaurant Fatehabad road 40 100 50
28 PizzaHut 8, Handicraft Nagar Fatehpur, Agra 68 200 15
29 Hotal Rayal Near Hotel Zee Tourist Complex, Agra 60 200 80
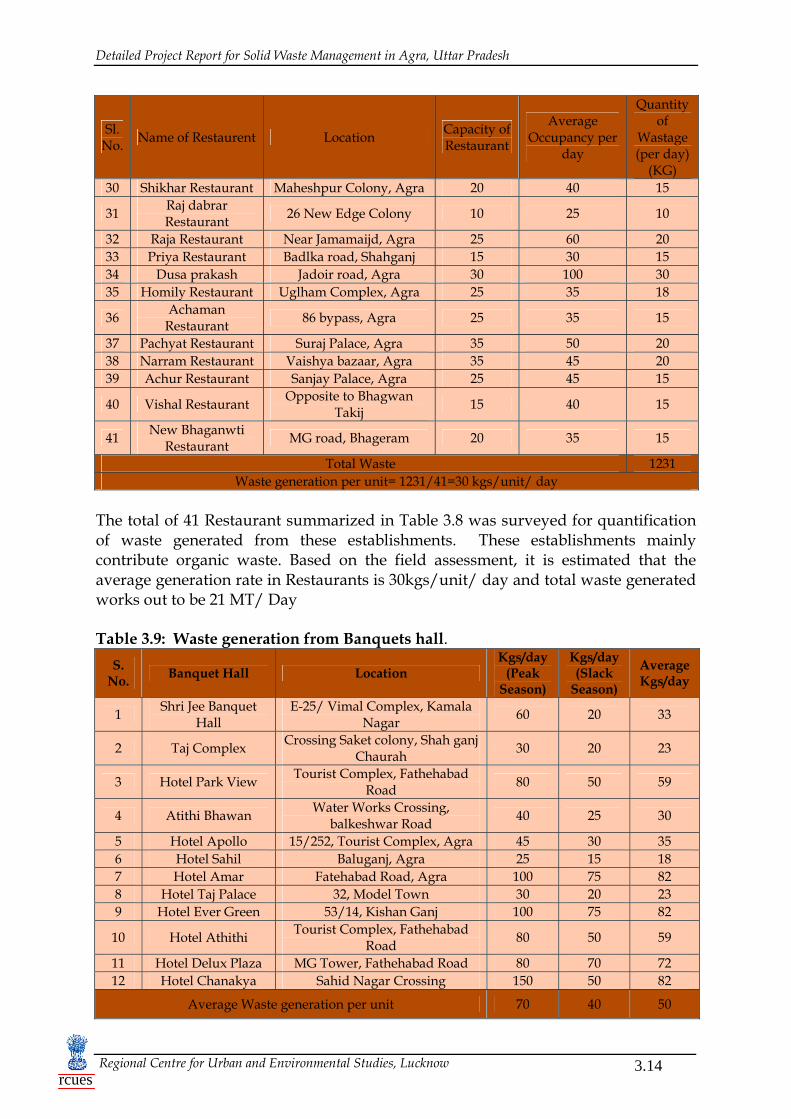
Detailed Project Report for Solid Waste Management in Agra, Uttar Pradesh
Regional Centre for Urban and Environmental Studies, Lucknow 3.14rcues
Sl. No. Name of Restaurent Location Capacity of
Restaurant
Average Occupancy per
day
Quantity of
Wastage (per day)
(KG) 30 Shikhar Restaurant Maheshpur Colony, Agra 20 40 15
31 Raj dabrar Restaurant 26 New Edge Colony 10 25 10
32 Raja Restaurant Near Jamamaijd, Agra 25 60 20 33 Priya Restaurant Badlka road, Shahganj 15 30 15 34 Dusa prakash Jadoir road, Agra 30 100 30 35 Homily Restaurant Uglham Complex, Agra 25 35 18
36 Achaman Restaurant 86 bypass, Agra 25 35 15
37 Pachyat Restaurant Suraj Palace, Agra 35 50 20 38 Narram Restaurant Vaishya bazaar, Agra 35 45 20 39 Achur Restaurant Sanjay Palace, Agra 25 45 15
40 Vishal Restaurant Opposite to Bhagwan Takij 15 40 15
41 New Bhaganwti Restaurant MG road, Bhageram 20 35 15
Total Waste 1231 Waste generation per unit= 1231/41=30 kgs/unit/ day
The total of 41 Restaurant summarized in Table 3.8 was surveyed for quantification of waste generated from these establishments. These establishments mainly contribute organic waste. Based on the field assessment, it is estimated that the average generation rate in Restaurants is 30kgs/unit/ day and total waste generated works out to be 21 MT/ Day Table 3.9: Waste generation from Banquets hall.
S. No. Banquet Hall Location
Kgs/day (Peak
Season)
Kgs/day (Slack
Season)
Average Kgs/day
1 Shri Jee Banquet Hall
E-25/ Vimal Complex, Kamala Nagar 60 20 33
2 Taj Complex Crossing Saket colony, Shah ganj Chaurah 30 20 23
3 Hotel Park View Tourist Complex, Fathehabad Road 80 50 59
4 Atithi Bhawan Water Works Crossing, balkeshwar Road 40 25 30
5 Hotel Apollo 15/252, Tourist Complex, Agra 45 30 35 6 Hotel Sahil Baluganj, Agra 25 15 18 7 Hotel Amar Fatehabad Road, Agra 100 75 82 8 Hotel Taj Palace 32, Model Town 30 20 23 9 Hotel Ever Green 53/14, Kishan Ganj 100 75 82
10 Hotel Athithi Tourist Complex, Fathehabad Road 80 50 59
11 Hotel Delux Plaza MG Tower, Fathehabad Road 80 70 72 12 Hotel Chanakya Sahid Nagar Crossing 150 50 82
Average Waste generation per unit 70 40 50

Detailed Project Report for Solid Waste Management in Agra, Uttar Pradesh
Regional Centre for Urban and Environmental Studies, Lucknow 3.15rcues
The total of 12 Restaurant summarized in Table 3.9 was surveyed for quantification of waste generation Banquet hall/ Marriage hall. Assuming that function hall gets peak occupation during November to February and on other months occupancy rate comes down as only few marriages are conducted in these months, Waste generation in peak season and Slack season is estimated from field survey is 70kgs/unit/day and 40 kgs/unit/day respectively. The weighted average works out to be 50 kgs/unit/day. The waste mainly contributes organic waste. At this generation rate, the total waste generation is estimated at 4.4 MT/ Day 3.1.8 Slaughter Houses There is one authorized slaughter house located at Chalesar, Kuber pur in Jamunapar Sanitary ward. The field team brought out during survey that approximately 1200 animals (calves and buffaloes) are butchered every day in the peak season and 300 animals are butchered per day during the rainy season in the authorized slaughter house. The team also noted many other unauthorized location exist in Kajipara, Mantola, Sayedpara, Rawatpara, Mundapara, Khatipara etc (specified in Drawing No.-O: 3146/ Agra/04). About 100 animals (calves and buffaloes) on an average in each of this unauthorized location. It was found that the slaughtering of small animals mainly lamb/goat/chicken is done at individual homes/ meat shops and the generated waste is disposed off in dustbins or open dump sites. The waste from slaughter houses (skin, horns, and bones) is sold to processing or recycling units, from where it is exported. The remaining waste such as flesh cuttings, gobar etc are thrown away to the points of Nagar Nigam at respective areas. Waste are also thrown away to various drains like Mantola nalah, Dhakran nallah etc. It is observed that the process of attaining the bones of foot and horn by burning the flesh and hair attached by these parts are done on the road side of the main road. Quantification of total waste generation could not be done from field surveys due to the reluctance shown by there owners. No official records are being maintained on the quantity of waste generated from the slaughter houses. According to NNA waste from slaughter houses in Agra city is estimated to the tune of 7 MT/ Day per day. No official records are being maintained on the quantity of waste generated from the slaughter houses. 3.1.9 Street Sweeping Street sweeping starts between 6:00 to 7.00 AM and continues up to 12:00 PM. The sweepers are provided with jharoo (brooms), pans, favda, hand-carts, panji (bamboo stick used to clean nalas [drains]), gayti (pointed favda to clean roads), and buckets to clean nalas. They collect the waste on road sides, which are then transported to the nearby open dumps/ dustbins by rickshaw trolley or to out skirt of the city directly by tractor trolley. Estimate of street sweeping waste were done at open dumps and dustbins, the

Detailed Project Report for Solid Waste Management in Agra, Uttar Pradesh
Regional Centre for Urban and Environmental Studies, Lucknow 3.16rcues
results of which are given in Annexure IX. Based on the field survey conducted by RCUES, the street sweeping constitutes about 5% percent of the MSW generated in Agra. The total waste estimated from street sweeping is 35.5 MT/ Day. The average waste generation per km Road length is 42 kgs/ km considering road length of 850kms. 3.1.10 Drain Silt There are 25 major drains and 38 secondary drains with in the city (Ref.Section 2.4.2 of chapter 2).The major portions of the drain silt are generated by throwing of the household sweepings/ part of the street sweeping in the small drain flowing across the various streets and gallies. Some silt formation also happens through the blowing of the construction and other debris lying along side the drains. The drain silt typically comprises dust, household waste, sweepings, construction waste etc. In some of the cases part of the waste generated from various sources is disposed off in drains and retained until it is degraded and becomes a part of the drain silt. The drains are cleared of the accumulated solid waste twice or thrice a week/even fortnightly in a few parts of the city. At other parts, the waste is left unattended for months and cleared before the rainy season, up on complaints from the local residents. The cleared waste is left for drying for one to two days adjacent to the drains (which again lead to a part of the waste getting back into the drain) and transported to the secondary collection points, from where they are disposed off at the dump sites. Based on the field survey conducted by RCUES, the drain silt constitutes about 8.7% percent of the MSW generated in Agra. Estimate of Drain silt were done at open dumps and dustbins, the results of which are given in Annexure IX The total waste estimated from drain silt is 61 MT/ Day. The average waste generation per km Road length is 72 kgs/ km considering road length of 850kms. 3.1.11 Construction and Demolition Sites This waste varies from time to time depending up on the construction or demolition activities in Agra city. A major portion of this waste is generally used in reconstruction activities or for filling up of the low lying areas or kacha road. The individual generating construction waste generally engages private vehicle to collect the construction waste and dump it any elsewhere in the city for a nominal cost. However, during field survey major portion of such waste is dumped at open dump sites and dustbins designated for MSW collection by Nagar Nigam. RCUES observed that about 16.1% percent of this waste is collected at these sites and become a part of MSW, disposed off by NNA. Out of this about 20 MT is being disposed off directly by private operators without it going through the secondary collection points. As such there are no standard practices for disposal of construction waste in Agra city.

Detailed Project Report for Solid Waste Management in Agra, Uttar Pradesh
Regional Centre for Urban and Environmental Studies, Lucknow 3.17rcues
3.1.12 Recyclables Rag pickers play a very significant role in keeping Agra City clean. Section 3.3.1 discusses Public Private Partnership, details their role and concerns that NNA needs to address in order to make their participation more effective. The average composition of recyclable waste estimated at secondary collection points is 21.1%.It comprises paper, textiles, plastics, Leather and rubber, glass and metal. Most of the value added recyclable is being sold directly to Kabadiwallas. The rag picker community removes most of these recyclables. However the waste from Leather and rubber trimming is not reused and finally dumped in the secondary collection point or find its place in nallahs resulting in chocking of drains. 3.2 MSW Collection System in Agra City The MSW collection in Agra city is not well organized due to lack of awareness among the citizens as well as civic bodies responsible for collection of waste. However, Collection conducted in a two stages. In first stage, the waste collected from door to door is transported to dustbins and open dumps. In this stage, collection is not very efficient even though large numbers of private sweepers are engaged in waste collection from door to door at a nominal charge. Most residents drop the waste outside their residence, which in-turn is swept away by street sweeping and lifted by means of handcart, rickshaw trolley by Nagar Nigam workers to the nearby opens dumps. In second stage waste filled DP Container is replaced with empty DP container by Dumper placer vehicle. The waste is transported to the designated dumpsite. Waste from open dumps is collected in trucks/tipper trucks/tractor manually or by JCB’s and Loaders and finally transported to the designated dumpsite. The mode of transportation of waste from secondary dumpsites is decided on the basis of waste quantity as well as access road. 3.2.1 Primary Collection Systems The Project team did an exhaustive survey at macro level to assess the prevalent primary collection systems in Agra city. The primary collection of waste refers to house to house collection of waste in the community bins either by the resident themselves or by the sanitary workers. There is no organized arrangement for house to house collection of waste in almost whole city except for some part of the city. Community bins are also not available at convenient locations for depositing the waste. As already mentioned, that there is mixed pattern of primary waste collection from households. Private Sweepers collect waste from HIG and MIG household in handcarts and transport it to nearby open dump/ Dustbins. Nagar Nigam workers (safai karamcharis) collect waste that is thrown outside the residences while sweeping the streets. The waste collection timings generally range from 6:00 AM and 2:00 PM.
Detailed Project Report for Solid Waste Management in Agra, Uttar Pradesh
Regional Centre for Urban and Environmental Studies, Lucknow 3.18rcues
Nagar Nigam has 2215 permanent sweepers, 650 contract sweepers, 250 handcarts, 25 rickshaw trolleys engaged in primary collection. About 70% of the primary collection equipment are in usable condition. Besides this, The Project team observed that pilot project for door to door collection is implemented by NGO, New Public School Samiti, Lucknow at Sanitary ward Hariparwat-III. At present 2000 household are registered and charges are fixed at Rs. 30- 50/-depending on the type. NGO reported that only 130 household has paid the monthly charges. The main problem behind this is the interference of private operators who never wants them to work there nor wants to join it. After discussion it is brought out that private sweeper can earn much more if they work individually rather than joining the NGO Team. A summary of collection methods from each of the waste generation source listed in Section 3.1 are given below:
Most of the HIG and MIG Household have deployed private sweepers at a monthly nominal charge of Rs. 20-30 (MIG) and Rs 25-50 (HIG) .These sweepers collect the waste in handcarts and transport it to nearby collection point fixed by Nagar Nigam for secondary collection. In some cases disposal charges of even Rs 200 per month are being paid for disposal at landfill site.
The BMW from large number of private hospitals and nursing homes is
collected by the nursing home staff. These are further lifted by private operators (Mr. Dutta Enterprises) at monthly charge of Rs.500-2500/-
The left over food from eating places is carried to the secondary collection points and nearby open areas in private vehicles. The waste is collected between 8:00 AM and 2:00 PM.
The meat waste generated from meat shops and private residences is thrown
into open dump sites. The waste is collected between 8:00 AM and 2:00 PM.
The waste generated from street sweeping is carried to the dustbins and open dump sites by the NNA workers. First, rickshaw trolley and then tractors are used for transporting the solid waste. This activity is performed on a daily basis between 6:00 AM and 2:00 PM.
The drain silt is carried to the secondary collection points by NNA workers.
Sometimes, depending on the location, the drain itself can be considered as a secondary collection point.
The construction and demolition debris is carried to the low lying areas in JCB
tippers/tractors owned by NNA or by the private individuals..
The field investigations performed by the The project team indicate that:
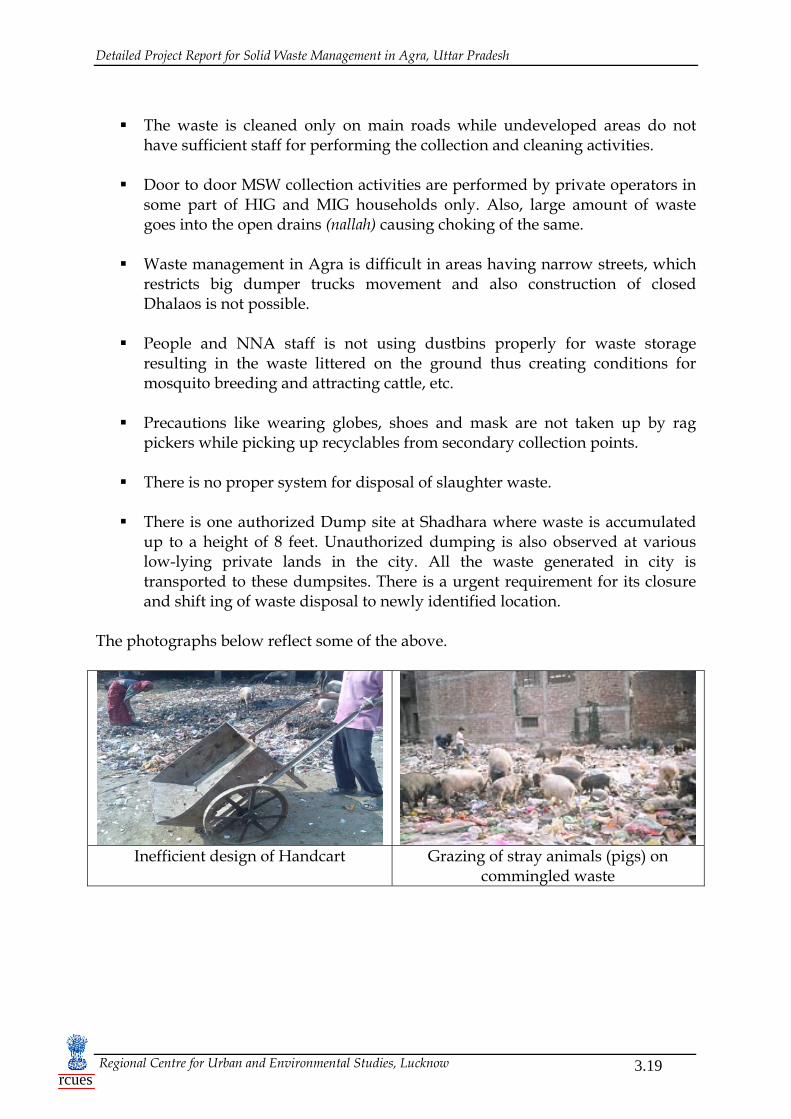
Detailed Project Report for Solid Waste Management in Agra, Uttar Pradesh
Regional Centre for Urban and Environmental Studies, Lucknow 3.19rcues
The waste is cleaned only on main roads while undeveloped areas do not
have sufficient staff for performing the collection and cleaning activities.
Door to door MSW collection activities are performed by private operators in some part of HIG and MIG households only. Also, large amount of waste goes into the open drains (nallah) causing choking of the same.
Waste management in Agra is difficult in areas having narrow streets, which
restricts big dumper trucks movement and also construction of closed Dhalaos is not possible.
People and NNA staff is not using dustbins properly for waste storage
resulting in the waste littered on the ground thus creating conditions for mosquito breeding and attracting cattle, etc.
Precautions like wearing globes, shoes and mask are not taken up by rag
pickers while picking up recyclables from secondary collection points.
There is no proper system for disposal of slaughter waste.
There is one authorized Dump site at Shadhara where waste is accumulated up to a height of 8 feet. Unauthorized dumping is also observed at various low-lying private lands in the city. All the waste generated in city is transported to these dumpsites. There is a urgent requirement for its closure and shift ing of waste disposal to newly identified location.
The photographs below reflect some of the above.
Inefficient design of Handcart Grazing of stray animals (pigs) on
commingled waste

Detailed Project Report for Solid Waste Management in Agra, Uttar Pradesh
Regional Centre for Urban and Environmental Studies, Lucknow 3.20rcues
Littering of waste on the Road side Storm Water drains clogged with Waste
3.2.2 Secondary Waste Collection System The MSW collected from each of the primary collection points mentioned above is transported to designated open dump areas and DP containers (mostly on the main roads) , which are the secondary collection points identified in Agra. Most of the waste is transported in rickshaw trolley and handcarts to the secondary collection points. The waste from the secondary collection points situated at congested places is lifted manually using pans and favdas tipper trolleys. In other cases JCB/ loaders are used to load the tipper truck/trolley, which in turn are used to transport this waste. In addition, the JCB loaders are used to lift the construction and demolition waste. The survey team noted that the major secondary collection points are Open dumps, and DP Container in the city. These have been marked in the Map and details are given in Annexure VI. Based on the field observations made by the The survey team, Truck /tractors/ tippers are used for picking up MSW from open dumpsites. Dumper placer is used to lift waste from DP containers. All waste is finally dumped to Sahadra dumpsites. Waste is lifted in two to three trips per day by each vehicle. Also, vehicles used for transportation are not fully loaded with waste to the recommended vehicle capacity which means that the collection system has only 75-80% efficiency as worked out in section (3.1.2). The team noted unauthorized dumping to near by low lying area by vehicle operators so as to save time and fuel.
Waste shifted from Handcart to Dustbin Dustbins for waste collection

Detailed Project Report for Solid Waste Management in Agra, Uttar Pradesh
Regional Centre for Urban and Environmental Studies, Lucknow 3.21rcues
JCB shifting waste into tipper truck JCB collecting Waste from Ground
3.2.3 MSW Transportation System in Agra City This section describes the workshop for maintenance of transportation vehicles, the transportation equipment available with the NNA, the routing details of these vehicles, and the current MSW transportation practices followed in Agra city. Workshop NNA has workshop located at Transport Nagar. The waste transportation vehicles are operated, supervised and maintained at this workshop. The workshop is supervised by workshop in charge. At present this responsibility is given to Junior Engineer. Based on the investigation made by The survey team workshop includes one puncture department, one welding department, mechanical department and vehicle service station. Most maintenance and repair work is done here. Major Maintenance and repairs are outsourced on contract basis. Transportation Equipment Based on the survey conducted by the RCUES, the NNA has total 96 waste transportation vehicles, used for the day-to-day collection of waste in the workshop. These vehicles make three to four trips per day for collecting and transporting the MSW from secondary collection points to the waste dump sites. Table 3.10 provides details of each of these collection and transportation vehicles, furnished by the NNA. These vehicles transport about 525-550MT/day of MSW.

Detailed Project Report for Solid Waste Management in Agra, Uttar Pradesh
Regional Centre for Urban and Environmental Studies, Lucknow 3.22rcues
Table 3.10: Details of Transportation Equipment
S.No
Make & Type
Nos. Model Capacit
y(cu.m) Condition
Frequency of
breakdown
Reason of breakdown
Trucks
1 Tata Tipper 5
1980(1), 1982(2), 1987(1), 1990(1)
8 O.K Monthly Old models
2 Ashok Leylan
d 10 1999-
2000 10 O.K(9),
Damaged(1)
Quaterly
Due to over loading of land fill site vehicles slips, results in
mechanical breakdown of
vehicles
3 Swaraj Mazad
a 14
1997(4), 1998(10
) 6 Repairable(
1)
Dumper Placer Truck
4 Ashok Leylan
d 16 1999-
2000 8 O.K
Quaterly Routine Servicing
5 Swaraj Mazad
a 17 1995-
2000 4.5 O.K(12),
Repairable(5)
Tractor Trolley
6 Escorts 3 1995-200 6 O.K Quaterly
Mechanical breakdown of
vehicles Three Wheeler
7 Piaggio 6 2000 1 O.K(5)
Damaged(1) Quaterly RoutineServicin
g Bazaj 5 2005 1 O.K
JCV's
8 JCB 3 1999(2), 2000(1) 1 O.K
Quaterly Routine Servicing 9 L&T 1 1997 1 O.K
10 Tata 1 2003 1 O.K Loader
14 L-710 9 1995(3), 1996(1), 1997(5)
0.75 O.K Quaterly Routine Servicing

Detailed Project Report for Solid Waste Management in Agra, Uttar Pradesh
Regional Centre for Urban and Environmental Studies, Lucknow 3.23rcues
Others
Sewer Jetting Machin
e
2 1996(1), 2004(1) 6000*
O.K(1) Damaged(
1)
Quaterly Routine Servicing
12
Chain Mounte
d Excavat
or
2
2004(J.C.B-JS-
75), 2005(Ta
ta-TMX-
20)
- O.K
13 Skid Stear
loader 1 2000 1 O.K
15 430 Jet Dodger 1 2000 Damaged(
1) The vehicles used for transportation of MSW start at the workshop in the morning hours and reach the sanitary ward offices located in each of the 19 sanitary wards. The sanitary inspector issues labor and fuel to each of these vehicles, when the waste collection process begins (8:00 AM). The vehicle drivers are supposed to make an entry in the log register, when they return in the evening to their respective sanitary ward offices. These entries include details about the amount of fuel issued, fuel used, number of hours worked and timings, and the route taken. This information is supposed to be verified by the sanitary supervisor and the sanitary inspector. However, the survey team noted that the entries are made in the log registers the following morning and that the sanitary ward offices are mostly closed by 12:00 PM.
Routing of Vehicles The existing unauthorized dump site is located at Shadhara on Delhi- Tundla bypass Road. The transportation system from workshop, lift and transport waste to Dumping site. The details of the site are provided in Section 3.5 of this DPR. The transportation vehicles make three to four trips per day to transport the MSW to this dump site. It takes about one to two hours to make three trips depending on the distance travelled and the traffic conditions.

Detailed Project Report for Solid Waste Management in Agra, Uttar Pradesh
Regional Centre for Urban and Environmental Studies, Lucknow 3.24rcues
Existing Infrastructure for Waste Transportation with NNA
Parking and open Shed Waste transportation vehicle parked at
workshop
JCB’s and Loader Tool Room and Repairing Shed
Tata Tipper Truck Dumper Placer (4.5m3)
Ashok Leyland Tipper Truck Dumper Placer (7 m3)

Detailed Project Report for Solid Waste Management in Agra, Uttar Pradesh
Regional Centre for Urban and Environmental Studies, Lucknow 3.25rcues
Drawing O: 3146/Agra/02 & 03 illustrates the current routes adopted by the MSW collection and transportation vehicles in Agra city. The survey team accompanied these transportation vehicles to trace their routes and also confirmed from the residents that the routing is generally followed. The photographs qualify the type of vehicles and infrastructure with NNA. Transfer Stations There are no transfer stations identified as part of the MSW transportation process. The waste collected from secondary collection points is directly transported to the existing dump sites within the city. However the newly identified site at gram Raibha, Tehsil Kerawali on Bichpuri- Achenara Road is approximately 20 kms from the office of Agra Development Authority. If the waste has to be disposed at this site a intermediate station is required to transfer waste from small vehicles to large vehicle from where waste can be transported to this site. This process is essential in order to reduce frequency of vehicles reaching the site thus reducing maintenance cost as well as increase waste collection efficiency per vehicle. However NNA has yet to identify and acquire the site for transfer station. 3.3 Waste Processing and Disposal Mechanisms This section describes the waste processing and disposal methods for each type of wastes adopted in Agra city. At present ANN does not possess any Waste processing Facility .The unsegregated waste is disposed at Shadhara dumpsite located at Agra –Tundla byepass road. Waste is also dumped at various low lying and private vacant plots. Certain recycling waste is segregated and sold by Rag picking community. Various types of wastes were identified in Agra city – recyclables, bio-degradable wastes, and non-bio-degradable wastes. Details of waste characteristics are given in Section 3.5 of this chapter. 3.3.1 Recyclable Wastes The recyclable wastes are segregated manually by kabadiwalas and rag-pickers estimated at about 6000. The kabadiwalas purchase recyclable waste from residential and commercial establishments while rag-pickers collect recyclables from market places, dustbins, and dumping sites, and sort them before selling off. The Project team observed that majority of such groups are located at Ravidas Nagar,Budh Vihar, North Idgah, Police line, Idgah (also on the back of Idgah Nallah), Kathghar, Mohanpura, Chipitola behind puranimandi, Rakabganj near police station etc However, these recyclables are not segregated to the maximum extent, thereby allowing them to be a part of the landfill waste. The cost of paper is Rs.4-5/kg, cartoons is Rs. 4.5/kg, glass is Rs.2/kg, plastic is Rs.3-10/kg depending up on the quality, and that of iron is Rs.12-13/kg.

Detailed Project Report for Solid Waste Management in Agra, Uttar Pradesh
Regional Centre for Urban and Environmental Studies, Lucknow 3.26rcues
3.3.2 Bio-degradable Wastes The bio-degradable waste is not segregated either at the primary collection points, secondary collection points, or dumping sites. Most of the bio-degradable waste was found to be eaten by animals at the grazing on the open dumping sites. Biodegradable waste tends to loose moisture and if not separated early gets merged with sand and soil making physical distinction difficult. 3.3.3 Non-biodegradable Wastes Street sweepings and drain silt is a major constituent of the non-biodegradable wastes. This type of waste is disposed off at the dumping sites along with other wastes without any prior processing. 3.4 Status of Present Disposal & Proposed Landfill Site. The existing SWM system for Agra does not have an engineering landfill site for disposal of waste. The waste collected from secondary collection points is dumped in an unorganized manner at the dumpsite. The authorized dumpsite is located at Shadhara on Agra- Tundla Bypass Road. Behind this site Kalindi Vihar area is situated and on the other side Jharna Nallah.It is at a distance of 4-5 kms from Workshop at Transport Nagar. The present situation of the landfill site is over dumped to a height of approx 8 ft from Road level. The total area of the Dumping site is 4.475 acres. The way to the dumping site is badly damaged, due to which the vehicle of Nagar Nigam for waste disposal transport waste less than there capacity. During the discussion with NNA, it was also brought out that situation become worst in rainy season as the way becomes to much slippery due to which there exists risk of frequent accident. The Agra Nagar Nigam has 22 acres of land at kuberpur, teshil, Etmadpur, which has been proposed for the development of Integrated Sanitary Landfill Facility. However, additional adjoining land is under process of acquisition by Agra Development Authority to take care of the requirement of an integrated solid waste complex for the next 25 years. The Project team physically visited the site which is approximately 16 Km from Nagar Nigam Agra office. It is well connected to National Highway -2 by butiminized approach road connecting to Kuberpur village. The land adjoins slaughter house in the north. The topography of land is Ravine. Based on discussions with NNA and other agencies, it was decided that the landfill site and other facilities including compost plant should be proposed at this identified site. As agreed, a standard conceptual design of the landfill site is being

Detailed Project Report for Solid Waste Management in Agra, Uttar Pradesh
Regional Centre for Urban and Environmental Studies, Lucknow 3.27rcues
proposed. The exact details of the landfill would need to be reevaluated after the land is acquired and the position of the landfill marked by the competent authority in the proposed site area. It is only then that the soil test and EIA study would be carried out.
Existing Dumpsite used as Landfill at
Shadhara Elevated road leading to Existing
Dumpsite at Shadhara
Proposed Site Location for Landfill at
Gram kuberpur,Teshil Etmadpur Access Road( towards Kuberpur)
for proposed site connecting NH-2. 3.5 Quantification and Characterization of Waste In order to quantify the MSW, The Project team surveyed all the secondary collection points and waste transportation vehicles operated by NNA. On conducting detailed analysis of results obtained from surveys conducted for open dump sites, it was estimated that per capita waste generation in Agra city is estimated at 0.497 kgs/ capita/ day. The future waste projection upto 2031 is calculated for designing landfill site for 25 years and compost plant as per MSW rules 2000 (Refer Annexure-IX). The projections are obtained on the basis of projected population and 1 % per capita increase per year as per NEERI Report.

Detailed Project Report for Solid Waste Management in Agra, Uttar Pradesh
Regional Centre for Urban and Environmental Studies, Lucknow 3.28rcues
Waste generation projections were also calculated for each ward for 2006 (Refer Annexure-IV) and the infrastructure required for SWM is proposed accordingly. Refer chapter 4 of this report for details. For collecting the samples for physical characterization quartering method as per the IS standard IS: 9234 – 1979, was adopted. In this method, a 100 kg representative sample of MSW is collected from the dump site, mixed thoroughly and is divided into four equal parts. The two diagonally opposite parts are retained for analysis and the other two are discarded. The retained parts are again mixed thoroughly and are divided into four equal parts. The exercise is continued and samples of 10 kg are taken for physical analysis. In summary, the total waste generation in Agra city is 709.4 MT/day approximately. Breakup of the quantity and type of waste from each of the secondary collection centre is enclosed as Annexure VI to this report. Table 3.11 below provides the averaged values of waste type. Table 3.11: Quantity and Characterization of MSW in Agra
Waste Characteristic Quantity
Generation (MT/day)
Percentage of Total Waste in
Percentage
Treatment/ Management Option
Recyclables (paper, rubber, synthetics, glass, and metals etc)
150.5 21.2 Reuse/ Recycle 20% Landfilling
Organic Matter including Petha waste
311.1 43.9 90% for Compost /10% for landfilling
Construction Debris 114.5 16.1 Filling of low-lying
area/20% Landfilling
Mixed Waste & Drain Silt & Street Sweeping
133.3 18.8 Landfilling
Total 709.4 100 As detailed in Annexure VI, the total waste quantity at dumpsites and at the dustbins aggregated to 631 MT/ day. After adding for 28.3 tonnes (10% of biodegradable) to take care of the green waste eaten by animals, 20 tonnes per day of construction waste not being routed through the dumps, and 30.1 tonnes (25% of recyclables) of recyclables being removed in secondary collection points, the total waste per day is estimated at 709.4 MT/ Day. This addition has been done as in Agra there is a large number of stray cattle and an active ragpicker community. The above waste characterization is arrived on the survey of the collection points and is by and large in line with the physical characterization of MSW (Table 3.12) as

Detailed Project Report for Solid Waste Management in Agra, Uttar Pradesh
Regional Centre for Urban and Environmental Studies, Lucknow 3.29rcues
per the CPHEEO manual for the population range of over 10 lakhs. The biodegradable in Agra is higher on account of Petha waste and recyclable is higher on account of Leather and Rubber trimming. Table 3.12: Physical characterization of MSW as per CPHEEO manual
Component Percentage Recyclables (paper, rubber, synthetics, glass, and metals) 16 Organic Matter 39 Inert (sand, soil, construction waste) 45
The results are also supported by the test results of M/s SGS India Private Limited. The physical and chemical characterization report are enclosed as Annexure VI . The SGS Results (physical) are summarized in Table: 3.13 below: Three different sites were chosen for physical and chemical characterization of waste .Biodegradable is reported higher at residential Dhalao, Recyclable is reported higher at commercial Dhalao and higher inert is reported at dumping site. Table3 13: Summary of Physical Waste Characteristics by SGS
Sampling sites Type Waste Characterization in
Percentage Biodegradable Recyclable Inert
Dhalao at Idakhargarh,Rustam
Khan ki Sarai Residential 48.3 21.7 30.0
Dhalao at Panchkuia Commercial Complex 22.8 36.9 40.3
At Shadhara Dumping site 32.4 24.8 42.8 Table 3.13 has been used for design purposes for calculating the capacity of the collection, storage and transportation equipment, the compost plant and the landfill site. These are detailed in Chapter 4 (Collection, storage and transportation), Chapter 5 (Compost plant) and Chapter 6 (Land fill site) respectively. 3.6 MSW Management System in Agra City Sections 3.1, 3.2, 3.3, and 3.4 of this DPR describe the sources of waste generation, waste collection, transportation, and disposal mechanisms employed by the NNA in handling MSW in Agra city. In addition to these processes, the survey team obtained information on the total manpower engaged in MSW management system, public awareness programs, and expenditure incurred by the NNA. Each of these issues is discussed in brief in this section. Section 2.7 summarizes the administrative set up in NNA for MSW management.

Detailed Project Report for Solid Waste Management in Agra, Uttar Pradesh
Regional Centre for Urban and Environmental Studies, Lucknow 3.30rcues
Table 3.14 summarizes the manpower available for management of MSW in Agra city. Table 3.14: Manpower Engaged for MSW Management
Designation No. Main Workforce Chief Health Officer 1 Senior Health Officer 1 Chief Sanitary Inspector 02 Sanitary Supervisor 16 Permanent Safai Kararmchairs 2215 Safai Karamcharis on Contract Basis 650 Driver 90 Other Workers Rag-pickers >6000 Private operators >1000
Public Awareness Programs Based on discussions with the Agra residents, it was understood that they do not have any knowledge of waste segregation at the source. They dump the waste indiscriminately at in any open or low lying areas in the city and hold the NNA officials responsible for not picking up the waste. 3.7 Expenditure on MSW Management During 2005-2006, the expenditure incurred on SWM is summarised in Table: 3.15 Table: 3.15: Expenditure on SWM by NNA in 2005-06
Rs. in crores 1. Cleanliness Department – Salaries etc 24.8 2.Equipment 3.3 Total 28.1
The single most expenditure for NNA is on Cleanliness and SWM. This expenditure at Rs. 28.1 crores accounts for 51% of the total non capital expenditure of Rs. 55.0 crores(Total expenses less expenses on public works) Expenditure for investment in SWM was low and most of the expenditure was operations and maintenance of the SWM establishment. On a per ton basis, the expenditure of Rs 28.1 crores to an expenditure of Rs.1080/tonne of SWM.This can be considered on relatively a higher side.

Detailed Project Report for Solid Waste Management in Agra, Uttar Pradesh
Regional Centre for Urban and Environmental Studies, Lucknow 3.31rcues
3.8 Gaps in Existing MSW Management with respect to MSW Rules 2000 The MSW Rules 2000 has laid out very detailed and specific criteria for management of solid waste. It has also laid down the guidelines, guidance notes and specific work standards to be adopted by municipal personnel or personnel involved with solid waste management for organized SWM practices (starting from waste collection, segregation, transportation, to environmentally safe waste disposal practices). The field and design team finds that the SWM system in Agra requires significant improvements/ total transformation to meet the performance standards laid down in MSW Rules 2000. Some of the significant gaps observed by Field team are as under: 3.7.1 No Segregation Practiced at Source The waste generators in Agra city do not segregate the waste prior to disposal. The The Project team identified that these generators (households, restaurants, shops, etc.) dump mixed waste into Dustbin, drains, and open dumps
Waste disposal in Open dump in Road
side Littering of waste outside DP bin
As a standard practice, MSW has to be segregated into biodegradable and non-biodegradable wastes and disposed off in separate containers to aid in efficient waste processing and disposal mechanisms. 3.7.2 Primary collection of solid waste is not appropriate NNA does not provide door-to-door MSW collection service to its residents. As discussed in section 3.1, the major portion of HIG and LIG residents of Agra city pay private operators to collect their daily waste in handcarts and disposed off to near by secondary collection point. However, others throw the household waste outside their residences from where sweepers of NNA collect waste by means of rickshaw

Detailed Project Report for Solid Waste Management in Agra, Uttar Pradesh
Regional Centre for Urban and Environmental Studies, Lucknow 3.32rcues
trolley and dump the same into the dustbins or onto streets (open dump). In most of the cases, generators themselves dispose off waste in nearby waste collection points/ containers, onto the streets, or in the nearby drains. The safai karamcharis employed by the NNA do street sweeping, collect drain silt and waste heaps from roadsides and dispose them off at a nearby open dumps. These unorganized disposal methods have resulted in accumulation of solid waste on roadsides and vacant plots and in low lying areas and storm water drains. Door-to-door waste collection service has to be provided to households. The roadside waste collected by street sweepers must be directly dumped into a separate bin at the secondary waste collection point. 3.7.3 Secondary storage of solid waste is unorganized The team observed that at places wherever dustbins are available, either they are rusted or damaged. At other places, waste is dumped on open dumps which have evolved over time. In the absence of secondary storage facility for MSW, it is dumped at any location in the vicinity – drains, vacant plots, street corners, low lying areas, and other open areas. Heaps and stretches of un-segregated waste in open areas is an eyesore, thereby causing environmentally hazardous & unhygienic conditions across the city, thus, creating conditions for breeding of mosquitoes, grazing by cattle Separate coloured bins must be provided at the secondary storage location for biodegradable and non-biodegradable, and recyclable wastes. The bins must be covered and cleared at the scheduled time to prevent storage of waste for a long time and littering of waste outside the bins. 3.7.4 Solid waste is transported in open vehicles Most of the times, solid waste is transported in open trucks and trolleys. The Project team observed that these vehicles are overloaded with waste, resulting in road littering during transportation. The loading and unloading of waste is done manually and safai karamcharis involved in this activity do not use any Personal Protection Equipment (PPE) for their protection. The waste transportation vehicles must be covered at all times expect while loading and unloading activities and the loaded waste should not exceed the capacity of these vehicles. 3.7.5 Slaughter house waste is mixed with the MSW Waste from slaughter houses is dumped along with the MSW in open and near by agricultural land. As such, there is no provision for segregation and safe disposal in Agra city.

Detailed Project Report for Solid Waste Management in Agra, Uttar Pradesh
Regional Centre for Urban and Environmental Studies, Lucknow 3.33rcues
Slaughter house waste should be collected separately and disposed off by controlled incineration, burial, anaerobic digestion, or other approved processing methods. 3.7.6 Biomedical waste is not managed properly in all health care facilities The survey team found out that most of the private hospitals/nursing homes in Agra are segregating their waste and the bio-medical waste. They have contracted with a UPPCB approved contractor M/s Dutta Enterprises of Agra for collection and disposal of BMW. However few organizations does not strictly follow segregation of BMW and needs to be penalized by the competent authority. Biomedical waste segregation, handling and disposal mechanisms adopted by all medical institutions must be strictly in compliance with the Bio-medical Waste Rules. 3.7.7 Collection and disposal of construction waste is not appropriate The construction/ demolition waste generated by local residents is transported in tractor trolleys and disposed off in open/ low-lying areas in the vicinity, privately. The construction and demolition waste (from private or NNA sites) must not be dumped in any open areas in an unorganized manner. It must be handled under the guidance of NNA staff. 3.7.8 Disposal of solid waste is not appropriate The solid waste collected from various sources is disposed off in open dumpsites indiscriminately without segregation or preprocessing. There is no engineered sanitary landfill site for safe disposal of solid waste. According to MSW Rules 2000, biodegradable waste shall be processed and converted into compost or used for power generation; recyclables shall be segregated and sold to recyclers; no hazardous waste be dumped along with MSW; construction waste to be segregated and used for filling low lying areas and only remaining waste shall be dumped into engineered landfill facility. 3.7.9 Manual handling of solid waste Safai Karamcharis involved in primary collection of MSW do not use any Personal Protection Equipment (PPEs) such as face masks, disposable gloves, boots, hats, and proper safety clothing (sturdy colored uniform) to avoid direct contact with waste and reduce the likelihood of on-the-job injury. Manual handling of solid waste during primary collection is an acceptable practice in Agra city. 3.7.10 Lack of awareness among city residents and civic authorities The NNA staff is responsible for managing MSW in Agra city in accordance with the MSW Rules 2000. However, they are completely ignorant of these rules and the

Detailed Project Report for Solid Waste Management in Agra, Uttar Pradesh
Regional Centre for Urban and Environmental Studies, Lucknow 3.34rcues
implementation practices recommended in the document. The current state of affairs indicates that a change is needed in the mindset of the NNA staff involved in managing MSW in Agra city. Furthermore, they need to understand the environmental, social, and economic implications of an unorganized MSW management system. Likewise, public participation is very essential in successful implementation of the MSW management plan in the city. Therefore, a planned and concerted effort is required to bring about awareness among the public and make them realize their responsibilities as individuals and as a community. In summary, public awareness, community participation, transparent administration, accountability at all levels is the need of hour so as to ensure success of any MSW management plan.

Detailed Project Report for Solid Waste Management in Agra,,Uttar Pradesh
Regional Centre for Urban and Environmental Studies, Lucknow rcues
CCHHAAPPTTEERR 44 PPrrooppoosseedd MMSSWW MMaannaaggeemmeenntt
SSyysstteemm

Detailed Project Report for Solid Waste Management in Agra, Uttar Pradesh
Regional Centre for Urban and Environmental Studies, Lucknow 4.1
rcues
CHAPTER 4 PROPOSED MSW MANAGEMENT SYSTEM This chapter provides an integrated SWM plan for primary and secondary waste collection systems and transportation system for Agra city. The proposed plan also includes the infrastructure requirements, quantities, and corresponding cost estimates for the collection and transportation systems. The proposed SWM system is broadly based on the 4R Environmental Protection Rules (Reduce, Recycle, Reuse, and Recover) and is in accordance with the MSW 2000 Rules. The primary aspects of the proposed plan include the following:
• Compliance with Municipal Solid Waste Management & Handling Rules of 2000
• Compulsory segregation at the source • Provision of segregated infrastructure at all stages of collection and
transportation • Waste to be covered at all stages of handling • Elimination of manual handling of waste, and the provision of the proper
PPEs to the workers • 100% collection and transportation of the generated waste • Maximum recovery of resources by segregating recyclables and
biodegradable • Advocate 4R’s i.e. reduce, recycle, reuse, and recover materials in MSW
management • Adopt proven technologies for waste processing • Promote information, education and communication across the stakeholders
to ensure system efficiency and sustainability • Ensure economic sustainability of the proposed system by introducing public
private partnership in MSW management • Adequate health and safety provisions for workers at all stages of waste
handling • Regular environmental monitoring at waste processing and disposal facilities • Have robust complaint-handling system in place • Conduct regular internal and external independent audits on the efficiency of
entire SWM system 4.1 Basis of Design for Proposed SWM Plan In order to propose a waste management plan and infrastructure/equipment for primary and secondary waste collection and transportation systems for Agra city, the following were considered:
• Past population estimates based on Census surveys • Projected populations for the design period • Spread of Agra city • Current MSW quantities as per RCUES’ field survey data • Projected MSW quantities based on the current values

Detailed Project Report for Solid Waste Management in Agra, Uttar Pradesh
Regional Centre for Urban and Environmental Studies, Lucknow 4.2
rcues
• Current and projected per-capita waste • Characterization of the current and projected waste quantities • Wardwise quantity of waste generation • Existing waste dumping sites/secondary waste collection locations
Table 4.1 summarizes the past and current projected populations, waste quantities, and per-capita waste for Agra city, used for proposed SWM plan and infrastructure design. Table 4.1: Population Estimates, Waste Quantities, and Waste Characterization (Year 2006) 2001 Population (Census Data) 1275134 2006 Population 1426617
Waste Composition Percentage Waste Quantity (MT/day) Bio-degradable 43.9% 311.3 Recyclable 21.2% 150.3 Non-biodegradable (Inert) 34.9% 247.4
Total Waste 100 709 Per-capita Waste (kg/capita/day) 497 gms/day/person
The non-biodegradable waste mainly comprises of construction waste, drain silt, street sweepings and mixed waste. Based on survey, for SWM infrastructure design purpose the inert waste is further categorized as follows: Table 4.2: Classification of Non-biodegradable Waste (Year 2006) Type of Inert Waste Quantity Waste (MT/day) Street sweepings and drain silt 95.7 Construction and demolition waste 114.1 Mixed waste 37.6 Total Waste 247.4
Apart from the general solid waste, as discussed in Chapter 3 there is bio-medical waste generation in Agra. The quantity of biomedical waste (BMW) generated from medical facilities in Agra is approx 4.5 MT/day. This bio-medical waste needs to be dealt separately as per the Biomedical Waste Management Rules. There is a private operator, Dutta Enterprises, managing biomedical waste treatment and disposal in Agra. All medical facilities shall compulsorily segregate their waste at source and send their waste to the authorized waste treatment and disposal facility. The State Pollution Control Board shall monitor all medical facilities in Agra and ensure that all of them dispose off their waste as per the rules.

Detailed Project Report for Solid Waste Management in Agra, Uttar Pradesh
Regional Centre for Urban and Environmental Studies, Lucknow 4.3
rcues
4.2 Proposed MSW Management Plan This section describes a step-wise approach for safe and efficient collection, storage, and transportation of MSW for Agra city. They include primary waste collection, secondary waste collection and storage, and waste transportation for subsequent processing and disposal. The collection and transportation system is designed for 5 years timeframe. With increase in spread of Agra city, additional infrastructure will be required to undertake SWM services as per the proposed plan. 4.2.1Primary Waste Collection System The efficiency of the proposed waste management plan described below is driven by the separation of waste at the primary collection level. For this purpose, following approach needs to be adopted by the residents as well as the NNA personnel: The waste will be stored by the generators in two separate bins, one each for bio-degradable and recyclables. Door-to-door waste collection will be privatized in the entire Agra city. Areawise responsibility will be assigned to private operators. Waste collectors will collect waste on a day-to-day basis in two types of bins - green bins for bio-degradable and white bins for recyclable waste. Door-to-door collection of waste will be through rickshaw trolleys. Initially NNA safaikaramcharis shall do street sweeping on a day-to-day basis. Overtime number of safai karamcharies will reuse (due to retirement and introduction of VRS scheme) and this service will also be given to private operator. The street sweeping waste will be collected in wheelbarrows. The waste collectors will transfer bio-degradable and non-biodegradable waste to the secondary collection location and will sell the recyclable waste. The existing infrastructure for secondary collection of waste will be upgraded to comply with MSW Rules 2000 and additional secondary collection locations will be developed to ensure that no primary collection staff has to travel more than 250m for dumping of waste. The NNA safaikaramcharis shall re-use the construction and demolition wastes for filling-up the man-made low-lying areas or shall recycle the construction waste to make bricks. The local residents shall hand-over the construction waste generated from private construction activities to NNA workers for proper use. Most of the waste generated from slaughter houses such as bones, skin and horns is recyclable and shall be sold to the recyclers. The only solid waste generated from the slaughter houses is flesh cuttings, which shall be buried in a designated area. The private workers and NNA safaikaramcharis shall be well equipped to avoid direct contact with waste. Table 4.3 summarizes the overall management of MSW at the primary collection level.

Detailed Project Report for Solid Waste Management in Agra, Uttar Pradesh
Regional Centre for Urban and Environmental Studies, Lucknow 4-4
Table 4.3 Primary Waste Collection System
Category Source/Waste Generator Type of Waste Requirement Generator Responsibility Implementation
I
Residential Commercial Institutional Hotels/Restaurants/ Eating Joints
Bio-degradable Non-Biodegradable Recyclable
Segregation at source Day-to-day collection
1. Storage in 2-bins
1. Private/ waste collectors 2. Private rag-pickers
II Street sweeping and drain silt
Bio-degradable Non-Biodegradable Recyclable
Segregation at secondary collection Day-to-day collection
--
Initially NNA safaikaramcharis, overtime withreduction to number of safai karamcharies to be under taken in PPP format.
III Construction Non-biodegradable Time of construction Handover to NNA NNA waste collectors
IV
Slaughter Houses
Carcass Other biodegradable Non-biodegradable Recyclable
Segregation at source Day-to-day collection
1. Storage in 4-bins 2. Primary collectors 3. Separate Slaughter house waste for burial
1. Facility owner 2. Recyclers

Detailed Project Report for Solid Waste Management in Agra, Uttar Pradesh
Regional Centre for Urban and Environmental Studies, Lucknow 4-5

Detailed Project Report for Solid Waste Management in Agra, Uttar Pradesh
Regional Centre for Urban and Environmental Studies, Lucknow 4.5 rcues
It is proposed that primary waste collection shall be done by NGOs or private operators. Presently, in Agra there is limited system of primary collection of waste. It is proposed that NNA shall identify NGOs/private operators for this purpose and authorize them for undertaking this activity. The NGOs/private operators shall be assigned responsibility area wise. The private operator authorized for a particular area shall ensure that there is proper waste collection of biodegradable and recyclable waste as per the plan from all sources in his area. The waste collectors shall have adequate infrastructure as per the proposed plan given in Table 4.4 in the next page.
Collection of Waste from Households: The door-to-door collection of waste shall be done on a day-to-day basis between 7:00 AM and 2:00 PM. The NNA shall ensure that infrastructure is made available for undertaking this activity in compliance with the MSW Rules 2000. The proposed infrastructure for primary waste collection is given below. The waste collection infrastructure for construction and demolition shall be provided by the NNA on need basis. Required Infrastructure for Households The infrastructure is calculated at ward level. Based on field survey, it is proposed to use Rickshaws for door-to-door collection of waste. It is proposed to have a Rickshaw with four 50 litre bins for door-to-door collection of waste. Among 4 bins, 3 bins will be used for collection of biodegradable waste, 1 bin for recyclables. The distribution of bins for waste collection has been done on the basis of the waste characteristics received from the households. The waste received from the households mainly comprises of biodegradable waste. The household waste also contains recyclable waste but the quantity of this waste as compared to biodegradable waste is very less. Based on field survey, wardwise estimation has been done for requirement of rickhaws. The quantity of waste generation from each ward is estimated based on its
Rickshaw Trolley with 4 bins

Detailed Project Report for Solid Waste Management in Agra, Uttar Pradesh
Regional Centre for Urban and Environmental Studies, Lucknow 4.6 rcues
population and per capita waste generation in Agra. As discussed above, from households maximum waste is bio-degradable waste, therefore, number of rickshaws required is calculated based on quantity of biodegradable waste. Sample procedure for infrastructure calculation in Ward 1 Quantity of biodegradable waste from households of ward 1= 3904 Kg/day 1. Number of rickshaws required 3904 Kg biodegradable waste is to be collected in three 50 litre bins placed on the rickshaw. Average density of bio-degradable waste is considered at 0.6 kg/litre. Assuming that only 80% capacity of the bins will be used for waste storage, number of rickshaws required in ward 1 = (3904/0.6)/150*.8 = 54.22 ≈ 54 rickshaws Considering that each rickshaw can make 3 trips in a day, Number of rickshaws required = 54/3 = 18 rickshaws This activity shall be undertaken by private operator. The private operator shall have sufficient number of workers to do waste collection all 365 days a year. On the basis of the above the requirement of number of rickshaw has been calculated wardwise and the details are given in Table 4.4: Table 4.4: Required Infrastructure for Collection of Household Waste
Ward No. Ward Name
Wardwise Area in sq.km
Projected Population 2006
Population Density 2006 ( Density/ sq. km)
Bio-degradable waste (43.9%) in Kg per day
Required number of rikshaws
1 Jagdishpura 0.42 17894 42213 3904 18
2 Gummat Takth Pahalwan
0.63 14006 22287 3056 14
3 Nagla Harmukh 0.58 14230 24588 3105 14
4 Sewala Jat 1.02 14284 13980 3116 14 5 Bhogipura 1.09 18004 16478 3928 18 6 Raj Nagar 1.02 16667 16337 3636 17
7 Nagla Maewadi 3.93 13901 3534 3033 14
8 Idgah 1.14 13633 11956 2974 14
9 Barah Khamba 0.79 18045 22933 3937 18

Detailed Project Report for Solid Waste Management in Agra, Uttar Pradesh
Regional Centre for Urban and Environmental Studies, Lucknow 4.7 rcues
10 Sarai Malukchand 2.09 15275 7310 3333 15
11 Kajipara 0.37 13555 37103 2958 14
12 Ghas Ki Mandi 0.59 16867 28482 3680 17
13 Nagla Mohan 0.75 13866 18586 3025 14 14 Nagla Ajeeta 2.19 17783 8127 3880 18 15 Khataina 0.34 17839 51800 3892 18 16 Bundu Katra 0.56 13914 24830 3036 14
17 Bagh Muzaffar Khan
3.66 14390 3935 3140 15
18 Kachpura 0.47 17441 37404 3805 18 19 Bhim Nagar 0.78 15822 20178 3452 16
20 Laywers Colony 1.89 18198 9644 3971 18
21 Ram Nagar 0.73 18056 24576 3940 18
22 Gadi Bhadhoria 0.82 16597 20157 3621 17
23 Ratanpura 0.58 17589 30124 3838 18 24 Nai ki Sarai 8.56 13961 1630 3046 14 25 Nagla Padi 0.58 17902 30781 3906 18 26 Freeganj 0.40 13694 34322 2988 14 27 Nawalganj 2.07 16727 8072 3650 17 28 Mohanpura 0.55 13619 24713 2971 14 29 Chawli 0.50 16138 32163 3521 16
30 Charsu Darwaza 0.26 13653 52938 2979 14
31 Sohalla 1.59 16236 10184 3542 16
32 Ghatia Azam Khan 0.98 16888 17297 3685 17
33 Dhakran 0.62 14271 23035 3114 14
34 Sector 5 to 12, Awas Vikas 2.69 18069 6727 3942 18
35 Bailanganj 0.68 16662 24331 3635 17 36 Kedar Nagar 0.51 18188 35786 3968 18 37 Tehdi Bagia 5.52 15474 2801 3376 16
38 Himachal Colony 0.89 13841 15550 3020 14
39 Tal Feroz Khan 0.53 17859 33791 3897 18
40 Madhu Nagar 0.58 17794 30733 3882 18
41 Naamnair 0.53 13627 25539 2973 14 42 Ajeet Nagar 1.01 17715 17464 3865 18
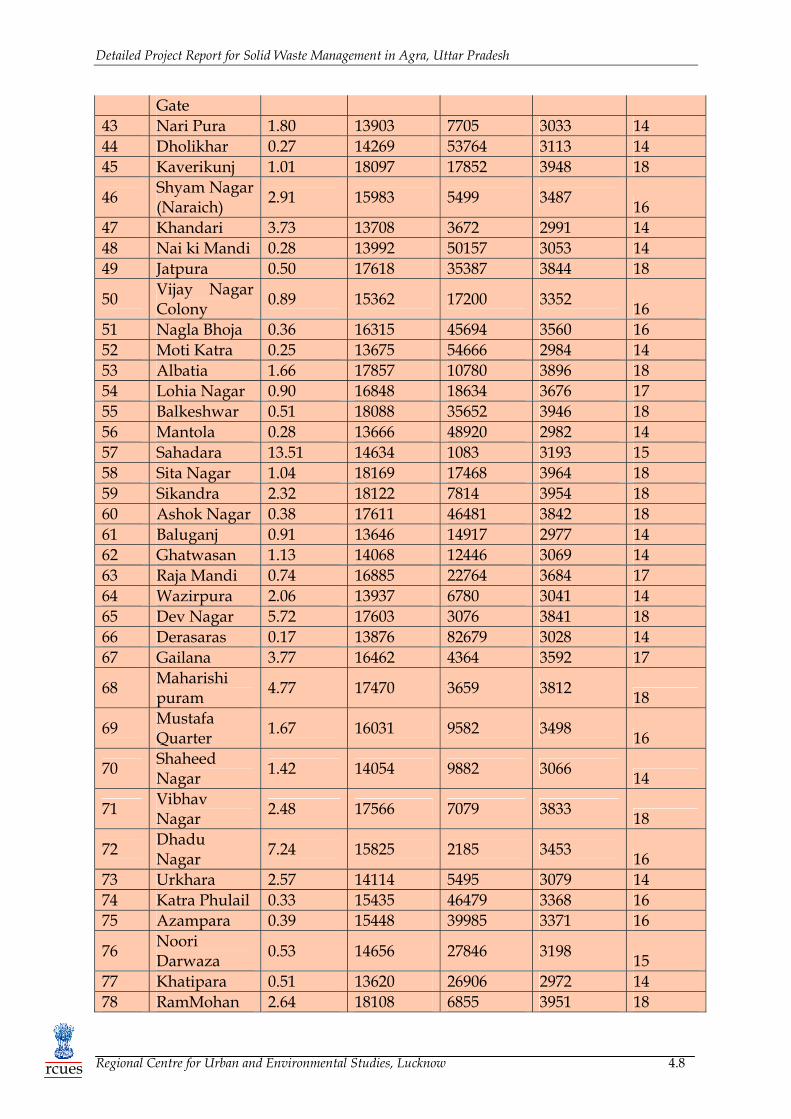
Detailed Project Report for Solid Waste Management in Agra, Uttar Pradesh
Regional Centre for Urban and Environmental Studies, Lucknow 4.8 rcues
Gate 43 Nari Pura 1.80 13903 7705 3033 14 44 Dholikhar 0.27 14269 53764 3113 14 45 Kaverikunj 1.01 18097 17852 3948 18
46 Shyam Nagar (Naraich) 2.91 15983 5499 3487 16
47 Khandari 3.73 13708 3672 2991 14 48 Nai ki Mandi 0.28 13992 50157 3053 14 49 Jatpura 0.50 17618 35387 3844 18
50 Vijay Nagar Colony 0.89 15362 17200 3352 16
51 Nagla Bhoja 0.36 16315 45694 3560 16 52 Moti Katra 0.25 13675 54666 2984 14 53 Albatia 1.66 17857 10780 3896 18 54 Lohia Nagar 0.90 16848 18634 3676 17 55 Balkeshwar 0.51 18088 35652 3946 18 56 Mantola 0.28 13666 48920 2982 14 57 Sahadara 13.51 14634 1083 3193 15 58 Sita Nagar 1.04 18169 17468 3964 18 59 Sikandra 2.32 18122 7814 3954 18 60 Ashok Nagar 0.38 17611 46481 3842 18 61 Baluganj 0.91 13646 14917 2977 14 62 Ghatwasan 1.13 14068 12446 3069 14 63 Raja Mandi 0.74 16885 22764 3684 17 64 Wazirpura 2.06 13937 6780 3041 14 65 Dev Nagar 5.72 17603 3076 3841 18 66 Derasaras 0.17 13876 82679 3028 14 67 Gailana 3.77 16462 4364 3592 17
68 Maharishi puram 4.77 17470 3659 3812 18
69 Mustafa Quarter 1.67 16031 9582 3498 16
70 Shaheed Nagar 1.42 14054 9882 3066 14
71 Vibhav Nagar 2.48 17566 7079 3833 18
72 Dhadu Nagar 7.24 15825 2185 3453 16
73 Urkhara 2.57 14114 5495 3079 14 74 Katra Phulail 0.33 15435 46479 3368 16 75 Azampara 0.39 15448 39985 3371 16
76 Noori Darwaza 0.53 14656 27846 3198 15
77 Khatipara 0.51 13620 26906 2972 14 78 RamMohan 2.64 18108 6855 3951 18

Detailed Project Report for Solid Waste Management in Agra, Uttar Pradesh
Regional Centre for Urban and Environmental Studies, Lucknow 4.9 rcues
Nagar 79 Dhankot 0.18 15728 85039 3432 16 80 Telipara 0.80 17042 21186 3718 17 81 Rawatpara 0.34 13744 40776 2999 14
82 Bhund Kaa Bagh 1.13 17263 15303 3767 17
83 Kamala Nagar 0.74 15577 21074 3399 16
84 Trans Yammuna Colony
0.80 18029 22531 3934 18
85 MotiGanj 0.20 14149 70518 3087 14 86 Pepal Mandi 0.26 14914 58223 3254 15
87 Kamala Nagar Block E & G
0.64 15893 24694 3467 16
88 Jaipur House 1.40 17017 12192 3713 17 89 Gobar Choki 1.13 14323 12677 3125 14 90 Maithan 0.28 16039 57982 3499 16 TOTAL 1439
Total no. of Rickshaws required with 5% back-up = 1439x1.05 = 1510.9 ≈ 1511 Rikshaws Number of workers required per day = 1439 This activity will be undertaken by the private operator. The total number of workers required by a private operator is based on the assumption that the private workers will not get more than 60 days leave in a year. Therefore, the number of workers required for collection of waste on all 365 days = 1439x1.2 ≈ 1727 Presently handcarts are used for primary collection of waste. Out of the total existing handcarts, 50 handcarts are in good condition but these handcarts do not facilitate collection of segregated waste. Recently, some infrastructure for primary collection of waste has also been purchased from the TFC grant money. This infrastructure includes – Traditional handcarts = 100 (already purchased) + 400 (ordered) = 500 Container Carrying Paddle Tricycle = 100 In the above infrastructure, only tricycles will facilitate collection of segregated waste, therefore, it is proposed that handcarts shall be used for collection of street sweeping waste. Now, requirement to purchase new rickshaws = 1511 – 100 = 1411
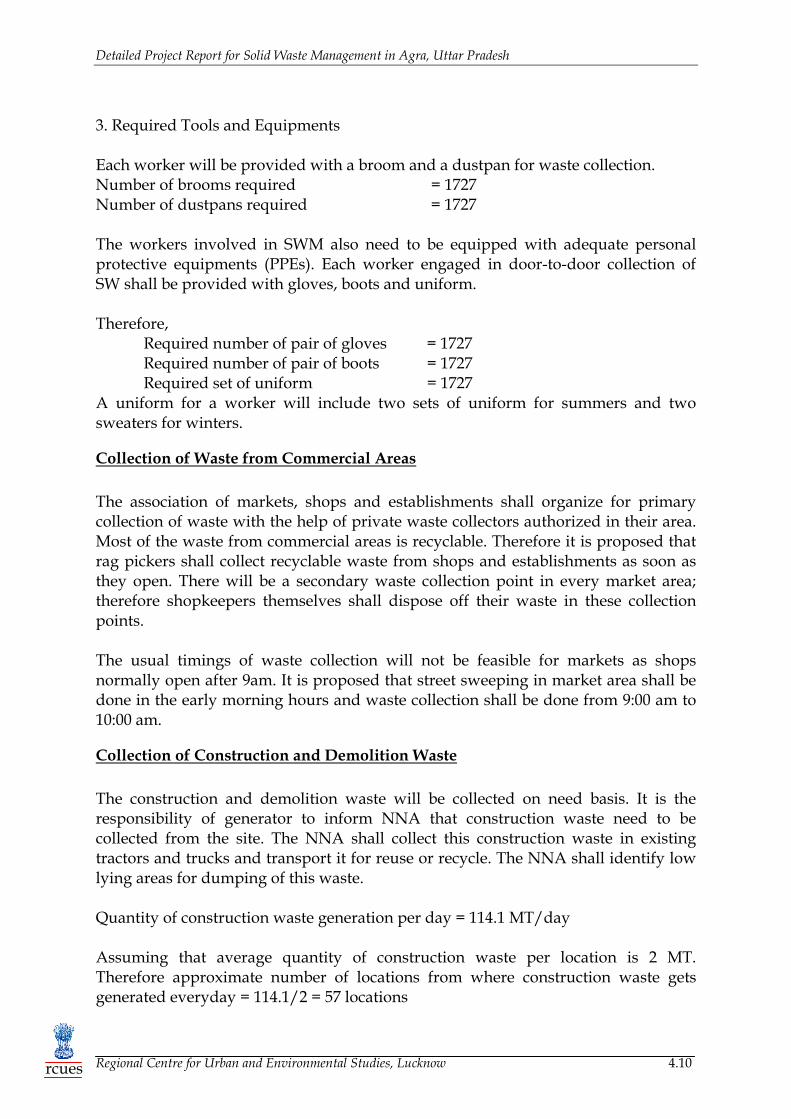
Detailed Project Report for Solid Waste Management in Agra, Uttar Pradesh
Regional Centre for Urban and Environmental Studies, Lucknow 4.10 rcues
3. Required Tools and Equipments Each worker will be provided with a broom and a dustpan for waste collection. Number of brooms required = 1727 Number of dustpans required = 1727 The workers involved in SWM also need to be equipped with adequate personal protective equipments (PPEs). Each worker engaged in door-to-door collection of SW shall be provided with gloves, boots and uniform. Therefore, Required number of pair of gloves = 1727 Required number of pair of boots = 1727 Required set of uniform = 1727 A uniform for a worker will include two sets of uniform for summers and two sweaters for winters.
Collection of Waste from Commercial Areas The association of markets, shops and establishments shall organize for primary collection of waste with the help of private waste collectors authorized in their area. Most of the waste from commercial areas is recyclable. Therefore it is proposed that rag pickers shall collect recyclable waste from shops and establishments as soon as they open. There will be a secondary waste collection point in every market area; therefore shopkeepers themselves shall dispose off their waste in these collection points. The usual timings of waste collection will not be feasible for markets as shops normally open after 9am. It is proposed that street sweeping in market area shall be done in the early morning hours and waste collection shall be done from 9:00 am to 10:00 am.
Collection of Construction and Demolition Waste The construction and demolition waste will be collected on need basis. It is the responsibility of generator to inform NNA that construction waste need to be collected from the site. The NNA shall collect this construction waste in existing tractors and trucks and transport it for reuse or recycle. The NNA shall identify low lying areas for dumping of this waste. Quantity of construction waste generation per day = 114.1 MT/day Assuming that average quantity of construction waste per location is 2 MT. Therefore approximate number of locations from where construction waste gets generated everyday = 114.1/2 = 57 locations

Detailed Project Report for Solid Waste Management in Agra, Uttar Pradesh
Regional Centre for Urban and Environmental Studies, Lucknow 4.11 rcues
One truck will cover 3-4 locations in one trip and one truck will make approximately 3 trips in a day. Therefore, number of trucks required = 57/(3x3) = 6.3 ≈ 6 With adequate back-up, number of trucks required = 8 Existing trucks can be upgraded and can be used for this activity.
Collection of dairy waste All dairy waste shall be sent to the compost plant. Existing tractors with NNA can be used for this purpose. The compost plant operator shall have understanding with dairy owners and NNA for collection and transportation of dairy waste from source to the compost plant site and transportation cost would be reimbursed by the Compost Plant operator as proposed in Chapter 9.
Collection of waste from banquet halls, marriage halls and community centres It is proposed to deploy a few auto rickshaws for collection of bulk waste from these facilities. The facility owners’ have to request NNA to get this waste collected from their premises. NNA shall charge them for providing this facility. Apart from this, NNA will have tie-up with private vehicle operators ansd NNAwill use this vehicles to lift the waste from any such site.
Street Sweeping The street sweeping shall be done on a day-to-day basis. It is desirable to split the 8 hours of duty of sweepers into two shifts, 4 hrs in the morning and 4 hrs in the afternoon. The street sweeping is to be done by NNA safaikaramcharis as per the proposed plan. Required Infrastructure for Street Sweeping Street Sweeping Machines Estimated quantity of street sweeping waste (including drain silt) = 95.7 TPD Assuming density of street sweeping waste as 1MT/m3, quantity = 95.7 m3 = 95700 litre Length of roads in Agra = 850 km It is proposed that approximately 25% of the roads which are prime roads remain in good condition all round the year will be cleaned by road vacuum sweeping machine. Therefore, road length which will be cleaned by

Detailed Project Report for Solid Waste Management in Agra, Uttar Pradesh
Regional Centre for Urban and Environmental Studies, Lucknow 4.12 rcues
mechanical sweeping = 850 x 0.25 = 212.5 km It is assumed that 80% of this road has a divider, therefore total length of road to be cleaned by road vacuum sweeping machine = 212.5 x 1.8 = 382.5 km The average speed of a truck mounted road sweeping machine is 10 km/hr. Machine will be used from 10 pm to 8 am for road sweeping. Therefore, number of road sweeping machines required = 5 (4 for daily operation and 1 as back-up). Number of drivers and helpers required for operating street sweeping machine from 8pm to 10 am (considering all 365 days operation) = 9 drivers and 9 helpers Approximate waste collected by the street sweeping machines = (212/850)x95.7 = 23.9 TPD ≈ 24 TPD Remaining 71.7 TPD (71700 litres) of street sweeping waste has to be collected from 638 km of roads through manual cleaning by the street sweepers. Initially it will be done by safai karamcharies. Over time it will be shifted to private operater in phased manner as discussed earlier. Wheelbarrows The street sweeping waste will be collected in 100 litre wheelbarrows. Based on quantity of street silt and assuming that wheelbarrow will be used for 80% of its capacity, number of wheelbarrows required = 71700 /(100x.8)= 896.25 ≈ 900
Street Sweeping staff
Wheelbarrow

Detailed Project Report for Solid Waste Management in Agra, Uttar Pradesh
Regional Centre for Urban and Environmental Studies, Lucknow 4.13 rcues
The street sweepingshall be done daily. The infrastructure required for street sweeping is also estimated based on length of roads in Agra and safaikaramcharis required for street sweeping. Length of roads to be manually cleaned in Agra = 638 km
As per the work norms for a town of this size, on an average every street sweeper can clean 600m length of road in a day, therefore Total number of workers required = 638/.60 = 1063.33 ≈ 1063 Assuming that 20% of this road has a divider, additional number of workers required for street sweeping = (638x0.2)/0.6 = 212.66 ≈ 213 Total street sweeping staff required per day = 1063 + 213 = 1276 Street sweeping shall be done 365 days a year by the Nagar Nigam staff. Approximate number of holidays in a year as per the State Government Rules and Regulations = 125 Therefore total staff required = 1276 x 1.5 = 1914 Assuming that one wheelbarrow will be shared by two street sweepers, number of wheelbarrows required per day = 1914/2 = 957 Therefore total number of wheelbarrows required = Max (900, 957) = 957 Total number of wheelbarrows with 5% back-up infrastructure = 957 x 1.05 = 1004.85 ≈ 1005 In the existing system, handcarts are used for the collection of street sweeping waste. It is proposed to use 550 available handcarts in place of wheelbarrows. Therefore number of wheelbarrows required = 1005 – 550 = 455 Other Tools and Equipments Other working tools required for street sweeping staff include shovel and broom. Number of brooms required = 1914 Number of shovels required = 1914 PPEs required for the street sweeping staff include gloves, boots, safety mask and uniform. Therefore, Required number of pair of gloves = 1914 Required number of pair of boots = 1914 Required number of safety mask = 1914 Required set of uniform = 1914 Table 4.5: Infrastructure Required for Primary Waste Collection and Transportation
Equipment Description No. Rate (Rs.)
Total Cost
Exp. Life
Remarks

Detailed Project Report for Solid Waste Management in Agra, Uttar Pradesh
Regional Centre for Urban and Environmental Studies, Lucknow 4.14 rcues
(Rs.) (yrs) Two covered bins for households
10 litre capacity Plastic bins
500000 25 12500000 2
Rickshaw with bins for door-to-door collection of waste
A Rickshaw having 4 bins of 50 litre capacity each
1411 8813 12435143 2.5 Rate includes 2 year equipment warranty from the vendor
Renovation (painting) of existing rickshaws
Bought recently from the TFC grant
100 200 20000
Wheelbarrow for street sweepings
100 litre capacity 455 5250 2388750 5 Rate includes 2 year equipment warranty from the vendor
Renovation of existing handcarts for collection of street sweeping waste
Including existing handcarts in good condition and handcarts purchased with the TFC money
550 200 110000
Road vacuum sweeping machine
For wide metalled roads (Existing chassis shall be used for fitting sweeping machine)
5 3450000 17250000
Gloves for all safaikaramcharis
3641 25 91025 1 For all workers engaged in the activity irrespective of their employment status
Boots for all safaikaramcharis
3641 250 910250 1
Shovels for street sweepers 1914 200 382800 -- Broom for all
safaikaramcharis 3641 50 182050 2
Dustpan for door-to-door collection
1727 50 86350
Uniform (two sets of uniform + two sweaters)
for all safaikaramcharis
3641 1000 3641000 1
Safety mask for street sweepers 1914 25 47850 1 TOTAL 50045218
*The equipment specifications are given in Annexure IV-I. 4.2.2 Secondary Waste Storage System

Detailed Project Report for Solid Waste Management in Agra, Uttar Pradesh
Regional Centre for Urban and Environmental Studies, Lucknow 4.15 rcues
As mentioned in Chapter 3, there are open dumps, dhalaos and dumper containers for secondary waste storage in Agra. The existing collection system is taken as a basis to develop secondary waste collection system for Agra city. Proposed Management Plan for Secondary Waste Collection System There are two types of waste streams from the primary collection of waste – ‘bio-degradable’, and ‘recyclables’. The recyclables will be sold directly in the market by the waste collectors. It is proposed to provide secondary collection facility for biodegradable and non-biodegradable waste. MSW at every secondary collection point shall be stored in two separate covered containers – green for biodegradable and black for non-biodegradable. Non-biodegradables will include drain silt and street sweepings. The sweeper shall not travel more than 250m to dispose off primary collection waste. Therefore distance between two secondary waste collection locations shall not be more than 500m. In wards with leather industry, provision shall be there for separate collection of leather waste. The bin design and strength shall be able to facilitate its hydraulic lifting by transportation vehicles. The secondary waste collectors shall be well equipped to avoid direct contact with waste.
Proposed Infrastructure for Secondary Waste Collection System: According to the field investigations conducted, presently there are 325 locations for secondary waste collection. Amongst 325 locations, 200 are open dumps, 9 are RCC dhalaos, 116 locations have dumper placer containers. The area under NNA is approximately 141 sq. km. It is proposed to have one secondary collection point for every 400mx400m area in high density wards and one secondary collection location for every 500mx500m area in remaining wards of NNA. Table 4.6 presents wardwise number of secondary collection locations and drawing O:3146/AGRA/05 includes indicative locations of their placement in specific wards. However, the exact location for placement of bins, dumper placer containers and dhalaos shall be finalized at the time of implementation in discussion with NNA. Table 4.6 Proposed Wardwise Secondary Collection Locations

Detailed Project Report for Solid Waste Management in Agra, Uttar Pradesh
Regional Centre for Urban and Environmental Studies, Lucknow 4.16 rcues
War
d N
o.
War
d N
ame
Are
a (in
sq.
km.)
Popu
latio
n D
ensi
ty
was
te
(43.
9%)
in
Kg
per d
ay
seco
ndar
y co
llect
ion
loca
tions
w
aste
per
loc
atio
n (in
m3)
Type
of
Seco
ndar
y co
llect
ion
Infr
astr
uctu
re
Infr
astr
uctu
re
(incl
udin
g 1
for
bio
and
1 fo
r no
nbio
m
ultip
lied
by
num
ber
of
loca
tions
)
57 Sahadara 13.51 1083 3193 54 0.1 0.6 m3 RC Bin 108 RC Bin 24 Nai ki Sarai 8.56 1630 3046 34 0.15 0.6 m3 RC Bin 68 RC Bin 72 Dhadu Nagar 7.24 2185 3453 29 0.2 0.6 m3 RC Bin 58 RC Bin 37 Tehdi Bagia 5.52 2801 3376 22 0.26 0.6 m3 RC Bin 44 RC Bin 65 Dev Nagar 5.72 3076 3841 23 0.28 0.6 m3 RC Bin 46 RC Bin 7 Nagla Maewadi 3.93 3534 3033 16 0.32 0.6 m3 RC Bin 32 RC Bin 47 Khandari 3.73 3672 2991 15 0.33 0.6 m3 RC Bin 30 RC Bin 68 Maharishi puram 4.77 3659 3812 19 0.33 0.6 m3 RC Bin 38 RC Bin
17 Bagh Muzaffar Khan 3.66 3935 3140 15 0.35 0.6 m3 RC Bin 30 RC Bin
67 Gailana 3.77 4364 3592 15 0.4 0.6 m3 RC Bin 30 RC Bin
46 Shyam Nagar (Naraich) 2.91 5499 3487 12 0.48 0.6 m3 RC Bin 24 RC Bin
73 Urkhara 2.57 5495 3079 10 0.51 0.6 m3 RC Bin 20 RC Bin
34 Sector 5 to 12, Awas Vikas 2.69 6727 3942 11 0.6 1.1 m3 RC Bin 22 RC Bin
78 RamMohan Nagar 2.64 6855 3951 11 0.6 1.1 m3 RC Bin 22 RC Bin 64 Wazirpura 2.06 6780 3041 8 0.63 1.1 m3 RC Bin 16 RC Bin 71 Vibhav Nagar 2.48 7079 3833 10 0.64 1.1 m3 RC Bin 20 RC Bin 10 Sarai Malukchand 2.09 7310 3333 8 0.69 1.1 m3 RC Bin 16 RC Bin 14 Nagla Ajeeta 2.19 8127 3880 9 0.72 1.1 m3 RC Bin 18 RC Bin 43 Nari Pura 1.8 7705 3033 7 0.72 1.1 m3 RC Bin 14 RC Bin 59 Sikandra 2.32 7814 3954 9 0.73 1.1 m3 RC Bin 18 RC Bin 27 Nawalganj 2.07 8072 3650 8 0.76 1.1 m3 RC Bin 16 RC Bin 20 Laywers Colony 1.89 9644 3971 8 0.83 1.1 m3 RC Bin 16 RC Bin 69 Mustafa Quarter 1.67 9582 3498 7 0.83 1.1 m3 RC Bin 14 RC Bin 70 Shaheed Nagar 1.42 9882 3066 6 0.85 1.1 m3 RC Bin 12 RC Bin 53 Albatia 1.66 10780 3896 7 0.93 1.1 m3 RC Bin 14 RC Bin 31 Sohalla 1.59 10184 3542 6 0.98 1.1 m3 RC Bin 12 RC Bin 8 Idgah 1.14 11956 2974 5 0.99 1.1 m3 RC Bin 10 RC Bin 62 Ghatwasan 1.13 12446 3069 5 1.02 1.1 m3 RC Bin 10 RC Bin
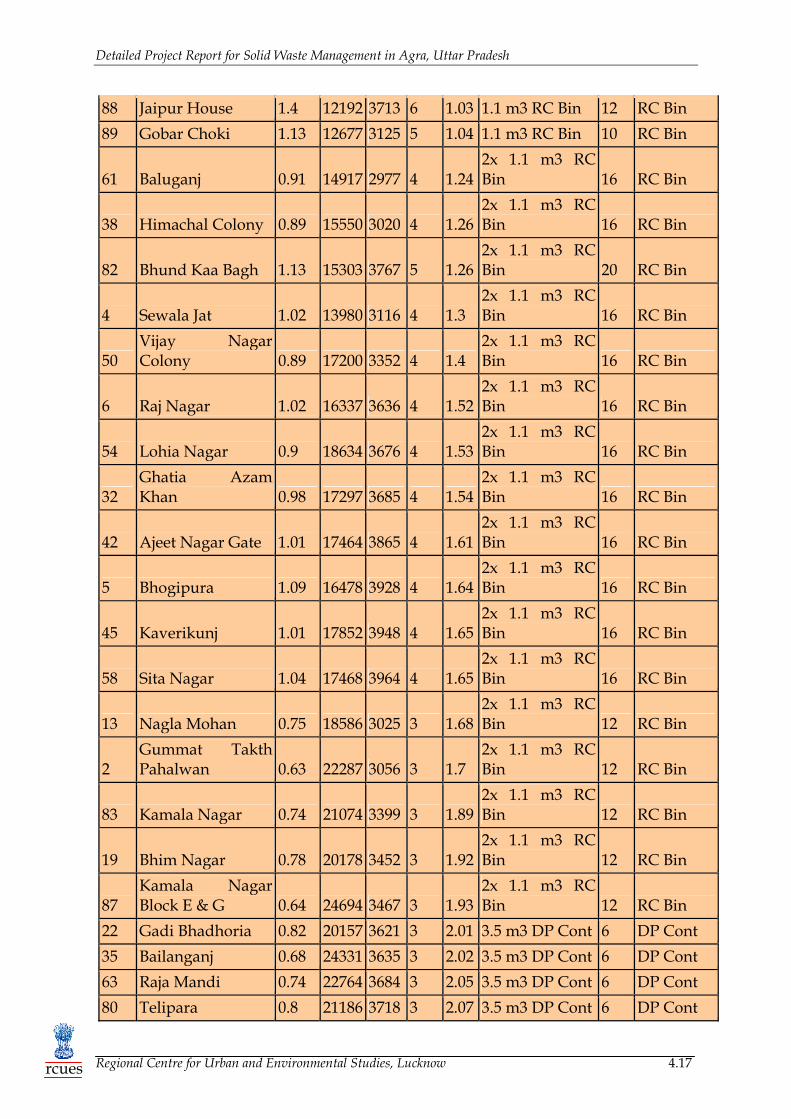
Detailed Project Report for Solid Waste Management in Agra, Uttar Pradesh
Regional Centre for Urban and Environmental Studies, Lucknow 4.17 rcues
88 Jaipur House 1.4 12192 3713 6 1.03 1.1 m3 RC Bin 12 RC Bin 89 Gobar Choki 1.13 12677 3125 5 1.04 1.1 m3 RC Bin 10 RC Bin
61 Baluganj 0.91 14917 2977 4 1.24 2x 1.1 m3 RC Bin 16 RC Bin
38 Himachal Colony 0.89 15550 3020 4 1.26 2x 1.1 m3 RC Bin 16 RC Bin
82 Bhund Kaa Bagh 1.13 15303 3767 5 1.26 2x 1.1 m3 RC Bin 20 RC Bin
4 Sewala Jat 1.02 13980 3116 4 1.3 2x 1.1 m3 RC Bin 16 RC Bin
50 Vijay Nagar Colony 0.89 17200 3352 4 1.4
2x 1.1 m3 RC Bin 16 RC Bin
6 Raj Nagar 1.02 16337 3636 4 1.52 2x 1.1 m3 RC Bin 16 RC Bin
54 Lohia Nagar 0.9 18634 3676 4 1.53 2x 1.1 m3 RC Bin 16 RC Bin
32 Ghatia Azam Khan 0.98 17297 3685 4 1.54
2x 1.1 m3 RC Bin 16 RC Bin
42 Ajeet Nagar Gate 1.01 17464 3865 4 1.61 2x 1.1 m3 RC Bin 16 RC Bin
5 Bhogipura 1.09 16478 3928 4 1.64 2x 1.1 m3 RC Bin 16 RC Bin
45 Kaverikunj 1.01 17852 3948 4 1.65 2x 1.1 m3 RC Bin 16 RC Bin
58 Sita Nagar 1.04 17468 3964 4 1.65 2x 1.1 m3 RC Bin 16 RC Bin
13 Nagla Mohan 0.75 18586 3025 3 1.68 2x 1.1 m3 RC Bin 12 RC Bin
2 Gummat Takth Pahalwan 0.63 22287 3056 3 1.7
2x 1.1 m3 RC Bin 12 RC Bin
83 Kamala Nagar 0.74 21074 3399 3 1.89 2x 1.1 m3 RC Bin 12 RC Bin
19 Bhim Nagar 0.78 20178 3452 3 1.92 2x 1.1 m3 RC Bin 12 RC Bin
87 Kamala Nagar Block E & G 0.64 24694 3467 3 1.93
2x 1.1 m3 RC Bin 12 RC Bin
22 Gadi Bhadhoria 0.82 20157 3621 3 2.01 3.5 m3 DP Cont 6 DP Cont 35 Bailanganj 0.68 24331 3635 3 2.02 3.5 m3 DP Cont 6 DP Cont 63 Raja Mandi 0.74 22764 3684 3 2.05 3.5 m3 DP Cont 6 DP Cont 80 Telipara 0.8 21186 3718 3 2.07 3.5 m3 DP Cont 6 DP Cont

Detailed Project Report for Solid Waste Management in Agra, Uttar Pradesh
Regional Centre for Urban and Environmental Studies, Lucknow 4.18 rcues
18 Kachpura 0.47 37404 3805 3 2.11 3.5 m3 DP Cont 6 DP Cont 1 Jagdishpura 0.42 42213 3904 3 2.17 3.5 m3 DP Cont 6 DP Cont 9 Barah Khamba 0.79 22933 3937 3 2.19 3.5 m3 DP Cont 6 DP Cont 21 Ram Nagar 0.73 24576 3940 3 2.19 3.5 m3 DP Cont 6 DP Cont
84 Trans Yammuna Colony 0.8 22531 3934 3 2.19 3.5 m3 DP Cont 6 DP Cont
11 Kajipara 0.37 37103 2958 2 2.46 3.5 m3 DP Cont 4 DP Cont 28 Mohanpura 0.55 24713 2971 2 2.48 3.5 m3 DP Cont 4 DP Cont 30 Charsu Darwaza 0.26 52938 2979 2 2.48 3.5 m3 DP Cont 4 DP Cont 41 Naamnair 0.53 25539 2973 2 2.48 3.5 m3 DP Cont 4 DP Cont 56 Mantola 0.28 48920 2982 2 2.48 3.5 m3 DP Cont 4 DP Cont 77 Khatipara 0.51 26906 2972 2 2.48 3.5 m3 DP Cont 4 DP Cont 26 Freeganj 0.4 34322 2988 2 2.49 3.5 m3 DP Cont 4 DP Cont 52 Moti Katra 0.25 54666 2984 2 2.49 3.5 m3 DP Cont 4 DP Cont 81 Rawatpara 0.34 40776 2999 2 2.5 3.5 m3 DP Cont 4 DP Cont 66 Derasaras 0.17 82679 3028 2 2.52 3.5 m3 DP Cont 4 DP Cont 16 Bundu Katra 0.56 24830 3036 2 2.53 3.5 m3 DP Cont 4 DP Cont 48 Nai ki Mandi 0.28 50157 3053 2 2.54 3.5 m3 DP Cont 4 DP Cont 3 Nagla Harmukh 0.58 24588 3105 2 2.59 3.5 m3 DP Cont 4 DP Cont 33 Dhakran 0.62 23035 3114 2 2.59 3.5 m3 DP Cont 4 DP Cont 44 Dholikhar 0.27 53764 3113 2 2.59 3.5 m3 DP Cont 4 DP Cont 76 Noori Darwaza 0.53 27846 3198 2 2.66 3.5 m3 DP Cont 4 DP Cont 86 Pepal Mandi 0.26 58223 3254 2 2.71 3.5 m3 DP Cont 4 DP Cont 74 Katra Phulail 0.33 46479 3368 2 2.81 3.5 m3 DP Cont 4 DP Cont 75 Azampara 0.39 39985 3371 2 2.81 3.5 m3 DP Cont 4 DP Cont 79 Dhankot 0.18 85039 3432 2 2.86 3.5 m3 DP Cont 4 DP Cont 90 Maithan 0.28 57982 3499 2 2.92 3.5 m3 DP Cont 4 DP Cont 29 Chawli 0.5 32163 3521 2 2.93 3.5 m3 DP Cont 4 DP Cont 51 Nagla Bhoja 0.36 45694 3560 2 2.97 3.5 m3 DP Cont 4 DP Cont 12 Ghas Ki Mandi 0.59 28482 3680 2 3.07 4.5 m3 DP Cont 4 DP Cont 23 Ratanpura 0.58 30124 3838 2 3.2 4.5 m3 DP Cont 4 DP Cont 49 Jatpura 0.5 35387 3844 2 3.2 4.5 m3 DP Cont 4 DP Cont 60 Ashok Nagar 0.38 46481 3842 2 3.2 4.5 m3 DP Cont 4 DP Cont 15 Khataina 0.34 51800 3892 2 3.24 4.5 m3 DP Cont 4 DP Cont 40 Madhu Nagar 0.58 30733 3882 2 3.24 4.5 m3 DP Cont 4 DP Cont 25 Nagla Padi 0.58 30781 3906 2 3.25 4.5 m3 DP Cont 4 DP Cont

Detailed Project Report for Solid Waste Management in Agra, Uttar Pradesh
Regional Centre for Urban and Environmental Studies, Lucknow 4.19 rcues
39 Tal Feroz Khan 0.53 33791 3897 2 3.25 4.5 m3 DP Cont 4 DP Cont 55 Balkeshwar 0.51 35652 3946 2 3.29 4.5 m3 DP Cont 4 DP Cont 36 Kedar Nagar 0.51 35786 3968 2 3.31 4.5 m3 DP Cont 4 DP Cont 85 MotiGanj 0.2 70518 3087 1 5.15 8.0 m3 DP Cont 2 DP Cont
Total Proposed Secondary Collection Infrastructure Refuse Collector Bins : 0.6 m3 capacity – 528 Bins 1.1 m3 capacity - 528 Bins + 20 bins for leather waste intensive wards DP Containers: 3.5 m3 capacity - 146 Containers 4.5 m3 capacity - 40 Containers 8.0 m3 capacity - 02 Containers Apart from the above it is proposed to construct 19 Waste Infrastructure Depots (WIDs) in each sanitary ward at prime locations. The WIDs will be used for storage of MSW infrastructure in use and also for available additional/back-up infrastructure. The external façade of these WIDs will also be used for advertisements to generate revenue. Two types of infrastructure are proposed for secondary collection of waste – dumper placer containers and refuse collector bins. At locations where expected biodegradable waste is more than 2 m3, it is proposed to have 3.5 m3 capacity dumper placer container, locations where expected waste is more than 3.0 m3 it is proposed to have 4.5 m3 capacity DP container and locations where waste is more
than 4.5 m3 it is proposed to have 8.0 m3 capacity DP container. The points where expected waste is less than 2.0m3, it is proposed to have adequate number of 1.1m3 and 0.6m3 Refuse Collector bins depending upon the expected quantity. It is proposed that DP containers shall be kept at 94 locations and on remaining 464 locations Refuse Collector (RC) bins shall be placed. Two types of RC bins are proposed – 1.1m3 capacity and 0.6 m3 capacity. 1.1 m3 capacity bins are proposed at 200 locations and 0.6 m3 capacity RC bins are proposed at 264 locations.
The above secondary collection plan is developed keeping in view the available infrastructure with NNA. It is proposed that existing Dumper Containers available with NNA shall be used in the new proposed plan. There are two types of DP containers available with NNA – 8 m3 and 4.5 m3 capacity. The total number of containers in usable condition is 150 out of which 60 containers have been purchased
600 litre and 1100 litre capacity mobile bins

Detailed Project Report for Solid Waste Management in Agra, Uttar Pradesh
Regional Centre for Urban and Environmental Studies, Lucknow 4.20 rcues
recently from the TFC grant money. It is proposed to use these containers at suitable locations as per the design and surplus containers in place of 3.5 m3 containers. It is proposed that with time when existing DP containers worn out, they shall be replaced with 3.5 m3 DP containers as per the design. Placement of DP Containers It is proposed that DP containers will be placed at 94 locations. At each location pair of DP container will be provided- one for biodegradable waste and one for non-biodegradable waste. It is proposed to use existing dumper containers at 75 locations. It is proposed to buy new 3.5 m3 twin container dumper containers for the remaining 19 locations. Total no. of 3.5 m3 twin container DP containers required = 19 x2 = 38 Total no. of containers with 5% back-up= 38 + (188x1.05) = 47 Placement of RC Bins Total number of 1100 litre bins required = 548 Total number of 600 litre bins required = 528 Additional 5% back-up is provided for all equipments for replacement in case of any such requirement Therefore total number of 1100 litre bins = 548x1.05=575.4 ≈ 576 Total number of 600 litre bins = 528x1.05 = 554.4 ≈ 555 Apart from the above, additional 150 litre twin bin set shall be placed near all public places including schools, colleges, offices, post office, and market areas. It is proposed to provide 250 pairs of 150 litre bins for placement across the city. Table 4.7 summarises secondary collection infrastructure proposed in Agra. Table 4.7: Quantity and Cost Estimates for Secondary Storage Infrastructure Equipment Description Total
number Rate (Rs.)* Total Cost
(Rs.)
DP Containers 3.5 m3 capacity twin container dumper placer
47 44375 2085625
DP Containers Existing of 4.5 m3 and 8m3 capacity (renovation)
90 5000 450000
DP Containers Recently purchased from the TFC grant (painting)
60 500 30000
Cemented Platform for placement of dumper containers
Platform of size 2.5m x 4m at 94 locations
94 10500
987000 1100 litre capacity bins
1.1 m3 576 23125 13320000

Detailed Project Report for Solid Waste Management in Agra, Uttar Pradesh
Regional Centre for Urban and Environmental Studies, Lucknow 4.21 rcues
600 litre capacity bins
0.6 m3 555 18125 10059375
Cemented Platform for placement of RC bins
Platform of size 1.5m x 3m at 464 locations
464 5000
2320000 Waste Infrastructure Depots (WIDs)
6m x 4m x 3.7m 19 1,25,000
2375000 150 litre twin bin set
150 litres 250 pairs 9750 per pair 2437500
Total 34064500 *rates include 2 year maintenance warranty of the equipment from the vendor The equipment specifications are given in Annexure X. The infrastructure at secondary waste location points will function as per the following schedule: The bio-degradable wastes shall be cleared every day to avoid foul smell and degradation of waste. The non-biodegradable waste shall be cleared once in two days. 4.2.3 Transfer Station It is proposed that from the wards far from the landfill facility, the waste in dumper placers and smaller size trucks shall be first brought to the transfer station and then transported in bigger vehicles to the waste treatment and disposal site. Transfer station is a facility where municipal solid waste will be unloaded from collection vehicles and briefly held while it is reloaded onto larger vehicles for transportation to integrated waste treatment and disposal facility. By combining the loads of several small individual waste collection trucks into a single shipment, apart from reduction in number of vehicular trips travelling to and from the disposal site there will be significant resource saving in terms of money on the labor, operating costs of transporting the waste to a distant disposal site and environmental protection. Although waste transfer stations help reduce the impacts of trucks travelling to and from the disposal site, they can cause an increase in traffic in the immediate area where they are located. Therefore site for the transfer station shall be identified ensuring that traffic congestion will not take place near the area. It is proposed that two transfer stations shall be strategically located for collection of waste from small vehicles to bigger compactors.

Detailed Project Report for Solid Waste Management in Agra, Uttar Pradesh
Regional Centre for Urban and Environmental Studies, Lucknow 4.22 rcues
It is proposed that in transfer station waste will be directly transferred from a smaller vehicle to the bigger compactor. For this a two-level arrangement has been proposed. The smaller vehicles through a ramp will reach at a higher level and unload there waste through their hydraulic tipping arrangement. A front end loader will push this waste into the bigger vehicle standing at the lower level. A typical design of transfer station is enclosed in Drawing no. O:3146/CHAP 4/01 and cost estimates are enclosed as Annexure XI. 4.2.3.1 Waste Transportation System The MSW transportation system for Agra city is proposed in conjunction with the waste collection system described in the preceding section. The requirement of transportation vehicles has been estimated based on the following plan- The NNA workers shall transport the bio-degradable waste (green containers) from secondary collection points to a designated composting site on a day-to-day basis. The NNA workers shall transport the non-biodegradable waste (black containers) from secondary collection points to a designated integrated waste processing facility at least once in two days. The waste from DP Containers shall be transported using Dumper Placers. The waste from RC bins shall be transported using refuse collectors. It is proposed to have three transfer stations for transferring waste from smaller vehicles to bigger size compactors. Waste from dumper placers and small size Refuse Collectors shall be transferred in bigger size compactors to economise on transportation cost and reduce vehicular traffic. The transportation shall be done in two shifts – 7:00 AM and 3:00 PM and between 4:00 PM and 11:00 PM. Hydraulically operated equipment shall be used for transportation of waste. The waste, under any circumstances, shall not be handled manually. Cattle lifting vehicles shall be used for lifting of stray animals and dead animals from the city It is estimated that one transfer station will require approximately 3000 sqm area. The estimated cost of construction of transfer station is Rupees 27 lacs.
Cattle Lifting Vehicle

Detailed Project Report for Solid Waste Management in Agra, Uttar Pradesh
Regional Centre for Urban and Environmental Studies, Lucknow 4.23 rcues
Proposed Infrastructure for Waste Transportation System: The transportation vehicle requirement is based on following assumptions: It is proposed to use 14m3 and 8m3 capacity Refuse Collectors for lifting waste from RC bins. A refuse collector will make one trip of loading waste from 8-24 bins (depending upon capacity of refuse collector and waste quantities in bins) and unloading waste at the designated site in 1 hr 30 min – 2 hr. The transportation of waste is done in two shifts with effective transportation time of 7.30 hrs in each shift, therefore total number of trips is 7 trips in a day. Required no. of 14m3 Refuse Collectors = 8 (4 for lifting biodegradable waste, 3 for lifting non-biodegradable waste and 1 as back up) Required no. of 8m3 Refuse Collectors = 8 (4 for lifting biodegradable waste, 3 for lifting non-biodegradable waste and 1 as back up). For this the existing trucks will be upgraded. The existing Dumper Placers shall be used for collecting waste from DP containers. A DP will take approximately 1-1.30 hr for one trip. Therefore total number of trips in a day will be 10. Existing number of dumper placers shall be sufficient for lifting 4.5m3 and 8m3 DP containers but new twin container dumper placers are required for lifting 3.5m3 containers. Dumper Placers for new containers = 3 DP (1 as back-up) It is proposed that vehicle maintenance shall be done either in the existing workshop facilities or this activity shall be outsourced. Table 4.8: Quantity and Cost Estimates for Transportation Infrastructure Equipment Description Nos. Rate
(Rs.) Total Cost (Rs.)
Transfer Station
2 27,00,000 5400000
Dumper Placers
3.5 m3 capacity twin container dumper placers
3 (1 as back-up)
11,50,000
3450000 Dumper Placers
Existing to be renovated (painted)
14 (2 as back-up)
50,000 700000
Refuse Collector
14 cum capacity 8 (1 back-up)
18,15,000 14520000
Refuse Collector
8 cum capacity 8 (1 back-up)
11,35,000 9080000
Existing truck Upgradation (8 will be upgraded to lift the construction waste)
8 (2 back-up)
2,00,000
1600000

Detailed Project Report for Solid Waste Management in Agra, Uttar Pradesh
Regional Centre for Urban and Environmental Studies, Lucknow 4.24 rcues
Compactors For transfer of waste from transfer station
8 (two as back-up)
25,00,000 20000000
Cattle Lifting Vehicles
2 12,18,750 2437500
Total Cost 57187500 The number of drivers required per shift to transport the waste will be 40. Therefore total number of drivers required after accounting for holidays = 60 drivers/shift One helper is required with every driver, therefore number of helpers = 60 helpers/shift Total staff required for two shift operation = 120 drivers and 120 helpers 4.3 Summary of collection and transportation infrastructure Table 4.9: Summary of Collection and Transportation Infrastructure Type of Equipment
Proposed Infrastructure
Presently available with NNA in good condition
Purchased from the TFC grant
New Infrastructure Required
Total Cost
Primary Collection
Two covered bins for households
500000 - - 500000 12500000
Rickshaw with bins for door-to-door collection of waste
1511 - 100 1411 12435143
100 (painting)
20000
Wheelbarrow for street sweepings
1005 50 500 (100 already procured + order placed for 400)
455 2388750
550 (Painting)
110000
Road Vacuum Sweeping
5 - - 5 17250000

Detailed Project Report for Solid Waste Management in Agra, Uttar Pradesh
Regional Centre for Urban and Environmental Studies, Lucknow 4.25 rcues
Machine Secondary Storage
DP Containers of 3.5m3, 4.5m3 and 8.0m3 capacity
197 90 (of 8.0 m3 and 4.5 m3 capacity)
60 (of 8.0 m3 and 4.5 m3 capacity)
47 2085625
90 (Renovation)
450000
60 (painting) 30000 Cemented platform for placement of DP containers
94 - - 94 987000
1100 litre capacity bins
576 - - 576 13320000
600 litre capacity bins
555 - - 555 10059375
Cemented platform for placement of RC bins
464 - - 464 2320000
Waste Infrastructure Depot (WID)
19 - - 19 2375000
150 litre twin bin set
250 pairs - - 250 pairs 2437500
Transfer Station Transfer Station
2 - - 2 5400000
Transportation Twin Container Dumper Placers (3.5m3 capacity containers)
3 - - 3 3450000
8m3 and 4.5 m3 container capacity Dumper Placer
14 14 (renovation)
- - 700000
14 m3 Refuse Collector
8
- - 8 14520000
8 m3 Refuse Collector
8 - - 8 9080000
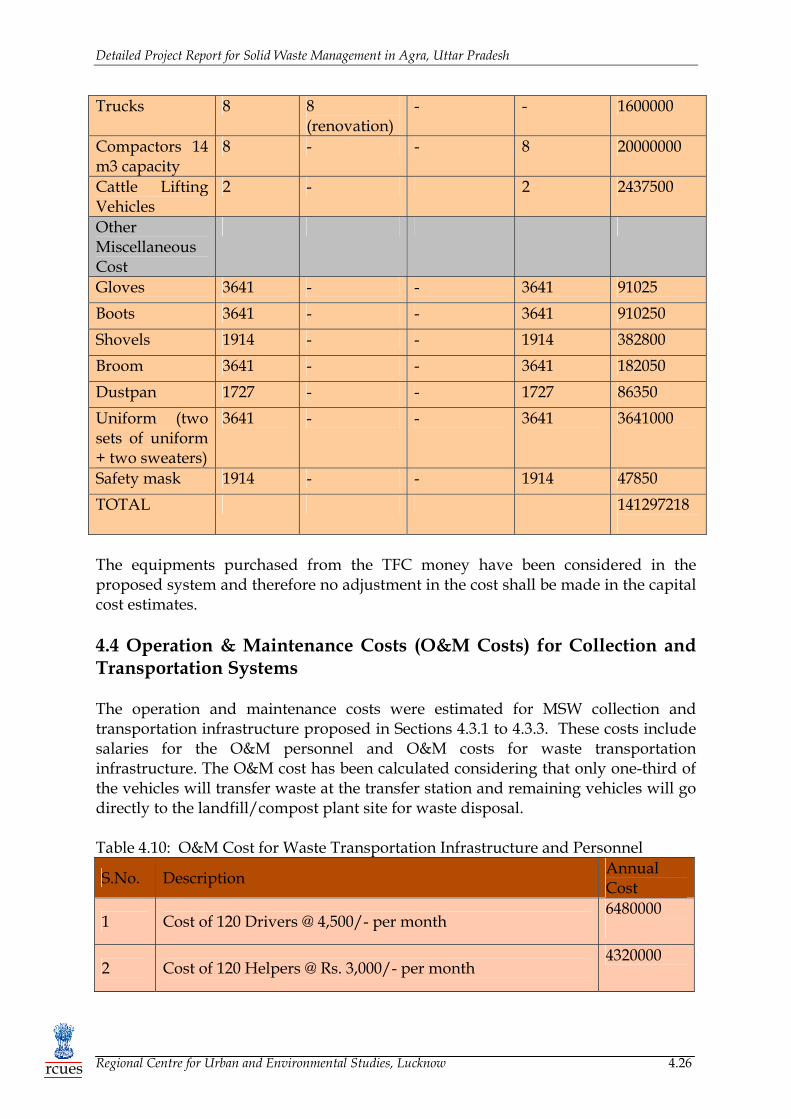
Detailed Project Report for Solid Waste Management in Agra, Uttar Pradesh
Regional Centre for Urban and Environmental Studies, Lucknow 4.26 rcues
Trucks 8 8 (renovation)
- - 1600000
Compactors 14 m3 capacity
8 - - 8 20000000
Cattle Lifting Vehicles
2 - 2 2437500
Other Miscellaneous Cost
Gloves 3641 - - 3641 91025 Boots 3641 - - 3641 910250 Shovels 1914 - - 1914 382800 Broom 3641 - - 3641 182050 Dustpan 1727 - - 1727 86350 Uniform (two sets of uniform + two sweaters)
3641 - - 3641 3641000
Safety mask 1914 - - 1914 47850 TOTAL 141297218
The equipments purchased from the TFC money have been considered in the proposed system and therefore no adjustment in the cost shall be made in the capital cost estimates. 4.4 Operation & Maintenance Costs (O&M Costs) for Collection and Transportation Systems The operation and maintenance costs were estimated for MSW collection and transportation infrastructure proposed in Sections 4.3.1 to 4.3.3. These costs include salaries for the O&M personnel and O&M costs for waste transportation infrastructure. The O&M cost has been calculated considering that only one-third of the vehicles will transfer waste at the transfer station and remaining vehicles will go directly to the landfill/compost plant site for waste disposal. Table 4.10: O&M Cost for Waste Transportation Infrastructure and Personnel
S.No. Description Annual Cost
1 Cost of 120 Drivers @ 4,500/- per month 6480000
2 Cost of 120 Helpers @ Rs. 3,000/- per month 4320000

Detailed Project Report for Solid Waste Management in Agra, Uttar Pradesh
Regional Centre for Urban and Environmental Studies, Lucknow 4.27 rcues
3
Diesel cost for 3 lt. per trip for Dumper Placers transporting waste to transfer station for 14 vehicles. The cost per litre of diesel is considered as Rs. 32/-. The average number of trips per vehicle is considered as 10 trips per day.
4905600
4
Diesel cost for 8 lt. per trip for 7 Refuse Collectors (14m3 capacity). The cost per litre of diesel is considered as Rs. 32/-. The average number of trips per vehicle is considered as 6 trips per day.
3924480
5
Diesel cost for 3 lt. per trip for 7 Refuse Collectors (8m3 capacity). The cost per litre of diesel is considered as Rs. 32/-. The average number of trips per vehicle is considered as 8 trips per day.
1962240
7
Diesel cost for 8 lt. per trip for 6 Compactors (14m3 capacity). The cost per litre of diesel is considered as Rs. 32/-. The average number of trips per vehicle is considered as 8 trips per day.
4485120
8
Diesel cost for 6 lt. per trip for 6 construction waste carrying vehicles. The cost per litre of diesel is considered as Rs. 32/-. The average number of trips per vehicle is considered as 3 trips per day.
1261440
9 Diesel cost for JCBs for lifting construction waste 280320
10 Diesel cost for street sweeping machine 3737600
11 Diesel cost for Cattle Lifting Machine 934400
12 Provision for vehicle Servicing / Repair & Routine Maintenance for 50 vehicles 4500000
TOTAL 36791200

Detailed Project Report for Solid Waste Management in Agra,,Uttar Pradesh
Regional Centre for Urban and Environmental Studies, Lucknow rcues
CCHHAAPPTTEERR 55 WWaassttee ttoo CCoommppoosstt PPllaanntt

Detailed Project Report for Solid Waste management for Agra, Uttar Pradesh
Regional Center for Urban and Environmental Studies, Lucknow 5-1 rcues
CHAPTER 5 WASTE TO COMPOST PLANT 5.1 Introduction This Chapter discusses the biological treatment of the compostable component of MSW generated in Agra City. The compostable waste primarily comprises of Organic material such as kitchen and yard waste, refuse from vegetable markets, food waste from hotels and restaurants; petha waste from sweet making units; green & horticultural waste; cow dung and dairy waste etc. It can either be stabilized before sending it to a landfill or can be converted into a valuable material such as compost, bio-gas, filler material in landfills etc. However, the land fill requirements for disposal of MSW and consequent further contamination of the environment can be avoided by processing of the bio-degradable waste into usable material viz., Compost. Biological treatment of organic material involves using naturally occurring micro-organisms to decompose the bio-degradable components of waste under controlled conditions. Biological treatment can be categorized into aerobic (composting) and anaerobic (bio-gasification) methods Figure 5.1.
Bio-gasification Composting
Biological Treatment
Windrows Enclosed Vessel Wet Process Dry Process
Figure 5.1: Classification of Biological Treatment Methods
In India, the Indore method and Bangalore method are used for aerobic and anaerobic treatment of organic material, respectively. In the Indore method, alternate layers of compostable material and night soil are piled up into heaps or ‘windrows’ and exposed to the atmosphere for decomposition. The heaps are turned regularly for 2 to 3 months and then left unturned for the next 1 to 1-1/2 months and in the process the resulting mass becomes the compost. In the Bangalore method, the compostable waste and night soil are piled up in alternate layers in an underground earthen trench. The trench is covered with 15 cm thick layer of soil and left for decomposition. The increase in temperature and biological activity inside the trench convert the refuse into dark brown colored powdery mass, called humus. The entire process takes about 4-5 months. The third method is vermin-composting, where earthworms are used to decomposition of bio-degradable waste.
Detailed Project Report for Solid Waste management for Agra, Uttar Pradesh
Regional Center for Urban and Environmental Studies, Lucknow 5-2 rcues
Aerobic composting is considered to be a more efficient method of biological treatment in comparison to the anaerobic method. The advantages of aerobic composting are listed below:
• It enriches the soil nutrient content.
• It sanitizes the MSW very effectively compared to others.
• It destroys the contaminants including weeds and other biological hazardous materials such as residues of harmful organic and organo-metallic compounds.
• Process is fast compared to other options.
• Process control parameters are optimized easily to accelerate the bio-
degradation by microorganisms.
• Process results in considerable reduction in volume and mass of the feed stock (garbage).
• Process output product quality is manageable keeping in view demands in
various sectors like horticulture, agriculture, high value crops, land remediation, landscaping, etc.
5.2 Basis of Compost Plant Design The field survey and analysis of waste in Agra as detailed in Chapter 3, indicates that out of the total 755 TPD of waste generated in Agra in 2008-09, (the year the compost plant shall commence commercial production) approximately 298 TPD is biodegradable and compostable. The projected waste for year 2011 is 830 TPD, out of which about 350 TPD is compostable (the design year for which compost plant has to be designed). The Aerobic Windrow Composting Methodology has been adopted for converting the organic waste into compost. Composting can be achieved using three types of micro-organisms – bacteria, actinomycetes and fungi. In the initial stages, the bacteria, fungi, and protozoa activities cause the temperature in the compost plant to increase to 65-70oC, which is called the thermophilic stage. In this stage, the bacterial and actinomycetes activity causes decomposition, resulting in a fall in temperature, when the fungi activity resumes. This stabilized condition is known as mesophilic stage, when the composting material becomes dark brown due to humus synthesis. In addition to temperature, air supply, moisture content, particle size of MSW, acidity/alkalinity, and chemical characteristics are the other factors which influence the microbial activity in a windrow. Several factors affect the rate of decomposition of the bio-degradable material as described below:
Detailed Project Report for Solid Waste management for Agra, Uttar Pradesh
Regional Center for Urban and Environmental Studies, Lucknow 5-3 rcues
• Micro-organisms: In order to expedite the process, additives such as cellulolitic, lignolytic, or cow dung solution shall be added to the organic waste. Micro-organisms such as azotobactor and phosphorus solubilizing microbes (PSM) will need to be added during the pre-processing stage for initiating the microbial activity.
• Moisture content: The moisture content of the bio-degradable waste needs to
be maintained within the range of 55-60%. Additional water will need to be mixed with the bio-degradable waste, if required, to keep the moisture content within the range of 55-60%.
• Air supply: Sufficient air supply is required to maintain a high rate of
decomposition, removal of carbon dioxide and volatile organic compounds, and buffering of the pH. This can be done manually by regular turning of the windrows or through self propelled windrow turners which move over the compost rows.
• Temperature: A temperature range of 65-70oC is conducive for sanitization of
MSW. In addition, the disease-causing micro-organisms are killed and weeds are destroyed at this temperature. Further, a high rate of decomposition is achieved in the temperature range of 35-45oC.
• Particle size of MSW: Smaller particle size of compostable material provides
greater surface area for the micro-organisms to act up on. However, the particle size should not be too small so as to compact the organic matter and reduce void space.
• Acidity/alkalinity: A pH range of 6.5-7.8 is most suitable for the composting
process.
• Chemical characteristics: A C: N ratio, 20:1 to 25:1 is ideal for maximum decomposition of organic matter.
• Waste Densities Adopted: For the purpose of design, a density of 0.45 T/m3
is assumed for the incoming waste and 0.60 T/m3 is assumed for the compost (within the range 0.6-0.9 T/m3).
5.3 Process Design for Proposed MSW Composting Unit The bio-degradable waste segregated at the source is collected and transported to the Compost Plant. The Process Design for MSW Compost Plant involves various steps as described below (Figure 5.2).

Detailed Project Report for Solid Waste management for Agra, Uttar Pradesh
Regional Center for Urban and Environmental Studies, Lucknow 5-4 rcues
Figure 5.2: Process Design for MSW Composting
5.3.1 Waste Receipt and Storage The bio-degradable waste from the city is received by Tippers and unloaded on an elevated ground near the Receipt area. At this point, waste segregation is carried out manually. The segregated organic material is dozed off into the receiving pit through a Dozer or Front-end Loader. It is then drawn by a Reciprocating Feeder (R-feeder)
Tipping Area
-Bio degradable waste
- Pre-processing of MSW (Segregation &
Shredding)
Magnetic Separator/ Conveyor belt
COMPOSTING
Temperature (65-70oC)
Moisture (55-60%)
Air
Mixing & Turning
(Min. 4 weeks)
Air Compost Curing(Min. 2 weeks)
Moisture
Mixing & Turning
Recyclable Material
Rejects
Additives & Inoculants
Drying
Manual Segregation
Segregation of Non - biodegradable
Materials
Screening & Refining
Value addition (suitable to
use)
Packing &Storing
Finished product for sale
Odour Treatment
Recovery
Landfill
Stage I
Stage II
Stage III
Stage VI

Detailed Project Report for Solid Waste management for Agra, Uttar Pradesh
Regional Center for Urban and Environmental Studies, Lucknow 5-5 rcues
and put on to a Conveyor Belt to facilitate removal of non-biodegradable material such as metal, paper, glass, bricks, stones, etc. 5.3.2 Waste Pre-processing The segregated organic waste is transferred to a Surge Hopper in the Screening Area. The material in the surge hopper is drawn by reciprocating feeders and put on to flat Picking Conveyors that run at a speed of 0.8m/s. Workers are deployed on either side of the slow moving picking conveyors to sort the non-biodegradable wastes. The rejected material is transferred to a Reject Hopper for appropriate disposal. The sorted organic refuse is sent to a Shredder in the Shredding Yard for sizing through Loading Conveyors. The size reduction facilitates faster biological decomposition. The shredded material is transferred to Windrows through front-end loaders or through Shuttle Conveyor arrangement and telescopic chute. Additives, inoculants and micro-organisms are added at this stage for controlled decomposition of organic material. 5.3.3 Windrow (Mechanical) Composting
Figure 5.3 Windrow Turner The pre-processed waste is laid in trapezoidal or triangular heaps in multiple rows for initiating the microbial activity. These waste heaps are periodically aerated through Self-Propelled Windrow Turners (Figure 5. 3) which move over the rows and facilitate turning and cropping. Water is sprayed on the heaps to maintain the desired moisture content. The heaps are covered with a layer of polyvinyl chloride (PVC) sheets to prevent oudor nuisance and flies and to maintain the required temperature.

Detailed Project Report for Solid Waste management for Agra, Uttar Pradesh
Regional Center for Urban and Environmental Studies, Lucknow 5-6 rcues
The design details of the windrow platform are given in Section 5.3. As the decomposition progresses, the bio-mass changes color from light green to dark brown humus like substance. Once, this condition is reached, the compost ready for further refinement (separation and grading). At this stage the conversion of organic waste into compost takes approximately 4 weeks. 5.3.4 Curing and Drying The fully decomposed organic matter will be placed on the curing bed for two weeks and covered with PVC sheets. Water will be sprinkled on a regular basis. This process is done to remove any odor and the microbes present in the compost. The fully matured compost will then be dried in the drying bed under the sunlight. 5.3.5 Compost Refinement, Bagging, and Storage The compost is passed through a coarse trommel (rotary sieve) to get the compost of desired size. After the mechanical separation, grading and sieving, fully matured and stabilized humus like organic fertilizer/soil enriched is recovered for use in crop production. Quality control is done for the physical, chemical, and biological parameters and the finished product is packed in high density polyethylene (HDPE) bags for sale. 5. 4 Design of Compost Plant Infrastructure and Equipments The proposed Compost Plant will have a design capacity of 350 TPD. The Compost will be prepared in a multi-stage process as shown in Figure 5.2. The infrastructure and land requirement for each of these processes is described below. Each of these processing units is shown in the Drawing No. O: 3146 / COMPOST PLANT 5.4.1 Receipt, Handling, and Pre-processing of MSW (Tipping Area) The segregated compostable waste collected from the city is received through an earthen embankment ramp with a water-bound macadam (WBM) surface by tippers in this area. The waste will be unloaded on an elevated ground (Hopper) in the receipt area. The receiving pit will be constructed of provided in a Reinforced Cement Concrete (RCC) enclosure with a steel bin of 50 MT capacity. The waste will be segregated manually for foreign materials such as paper, glass, plastic, polythene, etc. Depending on the quality of the material, it will be sent to recyclable units for recovery of to the landfill site for final disposal.

Detailed Project Report for Solid Waste management for Agra, Uttar Pradesh
Regional Center for Urban and Environmental Studies, Lucknow 5-7 rcues
The segregated organic waste will be dozed into a receiving pit through a dozer or front end loader. The waste will then be drawn by a reciprocating feeder (R-feeder) and put on to a conveyor to facilitate removal of inert material/iron and other metallic material. This segregated material will then be transferred to a surge hopper in the screening plant. The material from surge hopper is drawn by an R-feeder and put on to a flat picking conveyor that runs at a speed of 0.8 m/sec. The sorting of non-organic material will be done manually by deploying workers on either side of the slow moving picking conveyors. The sorted out organic material will be sent to a shredder for sizing through. The rejects from the picking conveyors will be transferred to reject hopper for appropriate disposal. The shredded material from the shredder yard will be transferred to windrows through front end loaders or through conveyor arrangement and telescopic chute. The additives inoculums etc. will then be added for controlled aerobic treatment. Area Requirements for Tipping Area: a) Area required for receiving of MSW = 2500 sq. m b) Area required for temporary storage = 600 sq. m c) Area required for screening and segregation = 1500 sq. m
d)Total area required for receipt, handling, and pre-processing = 4600 sq. m
5.4.2 Composting The composting of bio-degradable portion of the shredded waste is done through Aerobic Mechanical Composting using Windrow arrangement. The waste heaps are aerated through self propelled windrow turner twice a week or will be turned and mixed using a frond end loader. The moisture content will be maintained by manual sprinkling on daily basis. In addition, a temporary PVC cover will be provided on the windrows to prevent odor and nuisance of flies. Sufficient space is provided between two rows for facilitating movement of front end loaders / Windrow Turners. RCC flooring is provided for the entire composting pad with a slope of 1:200. Saucer drains are provided on the floor of the windrow area for draining of leachate. The leachate is collected in a 42800-litre capacity Sump with a facility to put back on the windrows as per requirement.

Detailed Project Report for Solid Waste management for Agra, Uttar Pradesh
Regional Center for Urban and Environmental Studies, Lucknow 5-8 rcues
A monsoon shed is provided in the composting area. This shed will enable operation of the plant during rainy season. This shed will consist of a steel portal structure with 24G corrugated galvanized iron (CGI) sheets. Windrow Arrangement and Area Requirements: No. of rows of windrows = 13 Shape of windrow = trapezoid Bottom width of windrow cross-section = 8 m Top width of the windrow cross-section = 2 m Height of windrow cross-section = 2 m Space between each windrow for movement of vehicles = 3 m Length of each windrow = 130 m Total floor area for composting (Including area on four sides for vehicular movement) = 23000 sq. m Compost area covered with monsoon shed = 10000 sq. m 5.4.3 Curing Shed A closed 9-m steel portal framed shed will be provided with CGI roofing for immediate storage and curing of semi-finished compost. The shed is also provided with hanging platform for storage conveyors. Area Requirements: Area of curing shed = 1200 sq. m 5.4.4. Compost Drying Area Area required for drying = 1200 sq. m 5.4.5 Sizing and Refinement Tower The sizing of compost will be done using trammels (5 mm, 10 mm, 20 mm, and 50 mm) before it is sent for packaging. This process will be performed in a steel portal framed shed with CGI roofing. A floor height of 5.25 m will be provided for installation of finishing section machinery. Area Requirements: Area required for sizing and refinement = 300 sq. m
Detailed Project Report for Solid Waste management for Agra, Uttar Pradesh
Regional Center for Urban and Environmental Studies, Lucknow 5-9 rcues
5.4.6 Packing and Baggage Area Area required for packing and baggage = 225 sq. m 5.4.7 Finished Product Godown The finished and packed compost will be stored in this area. The shed will be constructed of a steel portal structure with CGI roofing. Area Requirements : Area required for storing finished product = 500 sq. m 5.4.8 Control Room The control panel room will consist of an RCC framed structure and will be at a strategic location in the compost plant for supervision and efficient operation on the machinery. A transformer will be located adjacent to this control room. Area Requirements : Control room and transformer yard = 150 sq. m 5.4.9 Administrative Building The administrative building will be a two-storeyed RCC framed structure with facilities for laboratory and conference room. The laboratory will be well equipped with all necessary provisions for monitoring of processes such as oven, muffle furnace, balance, spectrophotometer, different chemical glassware, etc. Area Requirements : Administrative building area = 100 sq. m 5.4.10 Roads and Other Facilities Roads of proper sizes are to be provided. Other facilities such as canteen, toilet, washing place, store-room, dump-yard, supervisor room are to be provided adjacent to the coarse segregation section. Adequate lighting will be provided through out the compost plant. In addition, fire-fighting equipment will be provided for safety purposes. Area Requirements: Total area required for these facilities = 5000 sq. m

Detailed Project Report for Solid Waste management for Agra, Uttar Pradesh
Regional Center for Urban and Environmental Studies, Lucknow 5-10 rcues
5.4.11 Water Supply and Sprinkling system One water sump of 90,000 lts capacity will be constructed near the platform with provision of pump house for spraying of culture, slurry, and water during the compost treatment process. 5.4.12 Electric Power A HT/LT electric power connection will be obtained from state electricity boards. Total power requirement for pre-processing, composting, curing, and storing = 200 KVA 5.4.13 Green Belt and Garden Area A green belt of densely planted, tall growing trees will be developed around the plant. Suitable provision for demonstration plots to ascertain the quality of finished products may be made available at the plant site. 5.4.14 Compost Rejects The compost rejects will be sent to the land fill site for disposal. 5.4.15 Total Area Requirement The total area required for the compost plant = 50000 sq. m = 5.0 Ha 5.5 Cost Estimates for Proposed Compost Plant Table: 5.1 Cost Estimates for Composting Unit
Abstract of Cost of 350 TPD Compost Plant
S.No. Imtem Description Unit Rate (Rs.) Quantity
Amount (Rs.)
1 Site dressing and development Ha 50,000 5 250,000
2 Receipt area development and ramp sq. m 250 2500 625,000
3 Receiving pit, hopper and retaining wall arrangement nos. 250,000 1 250,000
4 Temporary waste store (covered) sq. m 2,500 600 1,500,000
5 Belt feeder nos. 200,000 1 200,000 6 Conveyor nos. 450,000 1 450,000

Detailed Project Report for Solid Waste management for Agra, Uttar Pradesh
Regional Center for Urban and Environmental Studies, Lucknow 5-11 rcues
7
Screening and segregation shed (including all civil works, trenches & equipment foundations) sq. m 3,200 1500 4,800,000
8 Elevating surge hopper nos. 450,000 1 450,000 9 R-feeder nos. 100,000 5 500,000 10 Chutes nos. 75,000 5 375,000 11 Loading conveyor nos. 450,000 1 450,000 12 Reject conveyor & hopper nos. 450,000 1 450,000
13
Shredding section (shredder, fines chute, bypass chute, shredding yard) lot 1,000,000 1 1,000,000
14 Transfer conveyor lot 450,000 1 450,000
15 Platform for compost yard area including civil works sq. m 1,000 23000 23,000,000
16 Self propelled windrow turners/digestion equipment lot 150,000 3 450,000
15 Front-end loaders nos. 1,250,000 4 5,000,000 17 Covered compost yard sq. m 1,500 10000 15,000,000 18 Curing shed sq. m 3,200 1200 3,840,000 19 Drying bed sq. m 700 1200 840,000 20 Sizing and refinement tower sq. m 3,200 300 960,000
21
Screening equipment, trommel, belt chain, chutes, elevating conveyors, rotary screen, transfer stations, drives, take-ups, packing & baggage equipment, etc. lot 2,000,000 1 2,000,000
22 Packing & baggage area sq. m 2,500 225 562,500 23 Finished product store area sq. m 2,500 500 1,250,000 24 Water sprinkle system lot 450,000 1 450,000 25 Fire-fighting system (electrical) lot 450,000 1 450,000
26 Electrical control room & transformer yard sq. m 12,000 150 1,800,000
27 Cable ducts, cables, panels, electrical & other equipment lot 1,000,000 1 1,000,000
28 Administrative office sq. m 7,500 100 750,000 29 Roads sq. m 450 5000 2,250,000
30
0.2 m wide peripheral drain around site including concrete, brick work, plaster, etc. complete RM 250 900 225,000

Detailed Project Report for Solid Waste management for Agra, Uttar Pradesh
Regional Center for Urban and Environmental Studies, Lucknow 5-12 rcues
31 Cross drainage works nos. 100,000 8 800,000
32 1.8 m high chain link fencing with RCC pillars RM 215 900 193,500
33 Security Gates nos. 30,000 2 60,000 34 Security Room sq. m 4,500 20 90,000 35 Toilet sq. m 5,000 25 125,000
36
Water supply system (drinking water, industrial water & fire-fighting) lot 1,250,000 1 1,250,000
37 Additives & Inoculants lot 1,250,000 1 1,250,000 38 Lab infrastructure & glassware lot 1,900,000 1 1,900,000 39 Total 77,246,000
Total cost of composting plant is Rupees Seven Crores Seventy Two Lacs Forty Six Thousand Only
Detailed Project Report for Solid Waste Management in Agra,,Uttar Pradesh
Regional Centre for Urban and Environmental Studies, Lucknow rcues
CCHHAAPPTTEERR 66 LLaannddffiillll DDeessiiggnn

Detailed Project Report for Solid Waste Management in Agra,, Uttar Pradesh
Regional Center for Urban and Environmental Studies, Lucknow 6-1rcues
CHAPTER 6 LANDFILL DESIGN
Preliminary design engineering has been done for the construction of municipal solid waste (MSW) landfill facility for Agra city. This facility comprises Secured landfill (SLF), Effluent Treatment Plant (ETP), Office building, Laboratory, Parking area, MCC Room and other associated facilities. The construction of landfill shall be taken up into five phases. Each phase will serve for approximately 5 years. After filling of each phase it will be covered with top cover and filling of MSW in the next phase area will be started. The landfill facility shall require around 75 acres of area to accommodate the landfillable waste for 25 years in Agra city. Agra Nagar Nigam presently has 22 acres of land at Kuberpur tehsil Etmadpur. The acquisition of additional adjoining land required to develop the landfill site for 25 years as per MSW Rules 2000 is under process by Agra Development Authority. The topographic survey and geo technical investigation will be carried out once the land is in complete possession of Agra Nagar Nigam. However, a typical design is being presented for 25 years design life capacity.In this chapter a summary of the conceptual design considerations are discussed. 6.1 Conceptual Design The conceptual design is presented in drawings Nos: O:3146/Agra/Chap.6/01, O:3146/Agra/Chap.6/02, O:3146/Agra/Chap.6/03, O:3146/Agra/Chap.6/04, O:3146/Agra/Chap.6/05, O:3146/Agra/Chap.6/06, O:3146/Agra/Chap.6/07, O:3146/Agra/Chap.6/08, O:3146/Agra/Chap.6/09, O:3146/Agra/Chap.6/10 and O:3146/Agra/Chap.6/11. Some of the issues that have direct influence on the design are discussed. They are:
1. Waste to be Handled 2. Access Road 3. Land Area 4. Evaluation of Geology and Hydrology of the Site 5. Surface Drainage 6. Operational Plan 7. Layout of MSW landfill 8. Completed Waste Fill Features 9. Estimation of landfill Capacity 10. Selection of Liner Systems 11. Selection of Leachate Control Facilities 12. Selection of landfill Gas Control Facilities 13. Aesthetic Considerations 14. Monitoring Facilities 15. Determination of Equipment Requirements 16. Design life 17. Post Closure Care

Detailed Project Report for Solid Waste Management in Agra,, Uttar Pradesh
Regional Center for Urban and Environmental Studies, Lucknow 6-2rcues
These are discussed in detail as below: 6.1.1 Waste to be Handled A detailed inventory survey indicated that presently approximately 710 MT/Day of municipal solid waste is generated daily in various wards located in Agra municipal area. About 311 MT/Day is organic waste, 150.5 MT/Day is recyclable waste and 95 MT/Day is street sweeping and drain silt, 36 MT/ Day is mixed waste and 114 MT/ Day is construction and demolition waste. Considering the present waste type and proposed collection and processing system the following configuration of waste is considered as lanfillable waste
• 10% of total biodegradable waste generated • 100% of total mixed waste generated • 100% Street Sweeping and Drain Silt • Construction & Demolition waste, 20% • 20% of total Recyclable Waste generated
The total waste quantity for a period of 25 years including future projection has been taken as 2791117 CuM in the designing of MSW landfill. The year wise breakup is given in Annexure IX. Presently the quantity to be disposed of in MSW landfill is around 220MT per day. 6.1.2 Access Road The proposed landfill shall receive MSW by road from various wards/localities located within Agra municipal area, as such the site shall be suitably connected with a good road network. A direct 5.0 m wide road including 1 m shoulders on each side connecting the landfill area is planned to reach the landfill site and within the facility for proper circulation and movement of vehicles. 6.1.3 Land Area The design of MSW landfill facility has been planned by considering 75 acres of land. The land has been utilized for MSW landfill so that the landfill holds large amount of waste covering for a disposal period of about 25 years. Around 25 % of the area has been earmarked for green belts, associated facilities and buffer zones in as much as the surrounding environment is not disturbed/effected by noise, odors and defacement (from aesthetic considerations). All services are accommodated within this area.
6.1.4 Evaluation of Geology And Hydrology of The Site
The district consists of Gangetic plain with a few outcrops of the vindhyas in its peripheral region. The climate is generally dry except during monsoon season. It is cold in winter and hot in summer with average temperature ranging from 7°C to

Detailed Project Report for Solid Waste Management in Agra,, Uttar Pradesh
Regional Center for Urban and Environmental Studies, Lucknow 6-3rcues
42°C although sometimes during winters it drops below the freezing point of water. The general annual rainfall is 600 to 700mm.

Detailed Project Report for Solid Waste Management in Agra,, Uttar Pradesh
Regional Center for Urban and Environmental Studies, Lucknow 6-4rcues
6.1.5 Surface Drainage Facilities The storm water routing within the MSW landfill site has been planned to effectively discharge storm water through storm water drains/ control structures effectively discharge to the offsite channels. For this purpose storm water drains, intercepting drains, peripheral drains and toe drains are provided. All these drains shall have masonry construction with lined bottom and sides. 6.1.6 Operational Plan The facility shall be developed as a MSW disposal facility conforming to the statutory guidelines of MoEF/CPCB/SPCB and CPHEEO Manual with elaborate operation and management (O&M) plans matching to the size and environmental protection requirements. The O&M plan shall ensure operational efficiency and also timely feedback well before onset of any eventuality/emergency. For this the following areas have been given emphasis: a) Inventorization and Characterization of MSW A mechanism shall be established whereby continuous update on MSW inventory in Agra is available. Special attention shall be placed in case of entry of any development of new colonies, institutions, mandis, markets etc. A separate cell has been planned to track quantity and characteristics of such MSW. The cell shall comprise of one environmental engineer assisted by a laboratory support. The team shall develop liaison with ULBs, RWAs etc.
b) Change in laws, governing rules/regulations, updates etc. Conforming to changing scenarios and rulings of the governmental agencies due modifications/improvements shall be implemented. A liaison engineer shall be appointed for monitoring and updating these activities. c) Operation Manual An operation manual conforming to the procedures for effective running shall be developed wherein the landfill facility operator, local residents and the government agencies are appraised of their roles and responsibilities. d) Emergency Management Program In case of any emergencies like vandalism, fire, floods, earthquake, groundwater and soil contamination, etc. the emergency cell on site shall keep liaison with the concerned agencies such as fire fighting squad, hospitals, police, district administration, local PCB office, etc. for a coordinated timely action.

Detailed Project Report for Solid Waste Management in Agra,, Uttar Pradesh
Regional Center for Urban and Environmental Studies, Lucknow 6-5rcues
e) Monitoring Program Adequate instrumental monitoring systems for knowing the condition of the landfill and the surrounding areas (soil, groundwater, air) covering range of 2 km has been planned. These instruments shall be maintained and operated as per the operation manual. A well-equipped laboratory for exercising quality controls is also planned. A monitoring cell shall be responsible for upkeep of the monitoring program. Logbooks and records relating to waste quantities received, disposed in the landfill, etc. shall be maintained in soft and hard copies by this cell. f) Human Resource Plan A team shall be created for addressing issues related to environmental concerns, public unrest, grievances, on-site and off-site health hazards, compensations, etc. This team shall make timely and coordinated efforts to sorting out differences, if any. 6.1.7 Layout of the MSW landfill Considering the broad parameters outlined above various possible layouts have been developed. The most optimum layout is only given in drawings: O:3146/Agra/Chap.6/01, O:3146/Agra/Chap.6/02, O:3146/Agra/Chap.6/03, O:3146/Agra/Chap.6/04, O:3146/Agra/Chap.6/05, O:3146/Agra/Chap.6/06, O:3146/Agra/Chap.6/07 O:3146/Agra/Chap.6/08, O:3146/Agra/Chap.6/09, O:3146/Agra/Chap.6/10 and O:3146/Agra/Chap.6/11. These drawings provide detailed description of various supporting and infrastructure facilities. The landfill facility shall have 1.8 m high permanent fencing all along the boundary with one lockable secured gate 3m wide. A complete list of the utilities, services and buildings that are planned in this MSW landfill are given in Table 6.1. The locations of the facilities are marked in these drawings. Table 6.1 List of facilities provided at Agra landfill S. No Description Size / Nos
1 Main Entrance Gate 3m wide 2 Security office 3MX3M 3 Weigh Bridge and Scale Room 2.7MX4.17M 4 Office Building 5MX4M 5 Laboratory 5MX3M 6 Parking (Paved Area) 20MX15M 7 MCC Room 5MX4M
8 Temporary Storage/ Segregation Area (Covered) 22MX32M

Detailed Project Report for Solid Waste Management in Agra,, Uttar Pradesh
Regional Center for Urban and Environmental Studies, Lucknow 6-6rcues
9 Workshop Area 5MX20M 10 Wheel Wash Pit 10MX4M 11 Leachate Collection sump 3.5MX3.5Mx2M (WD)
12 Area for Daily Cover Material AS/SITE
13 Monitoring Well 4 Nos
14 Earthen Embankment 1V:2H Slope
15 Green Belt 3 M wide
16 Ground Water Monitoring Well 4 Nos.
17 High Mast (HM) lighting 4 Nos. 18 Storm Water Drain 2822M 19 ETP for Leachate 5 Acre (Approx.)
6.1.8 Completed Waste Fill Features The design of MSW landfill has been done by considering 75 acres of land. The base of landfill i.e. top of liner has been kept at ground level and 12 m high (above GL) earthen embankment has been provided to achieve the required storage capacity within the area available. Top width of the embankment has been kept at 3.0 m. Inner & outer slopes of the embankment have been kept at 1V: 2H for stability of slopes. All around the landfill site 1.8 m high fencing shall be provided to prevent any unauthorized entry & stray animals. A 3.0 m wide green belt has been provided all along the facility boundary. The geocomposite liner has been provided on the inner side of the landfill as per the requirement of Central and State Pollution Control board norms. Leachate collection system has been provided at the base of the landfill with 355 mm dia HDPE header and 110 mm dia perforated HDPE lateral pipes. Leachate shall be collected in the Leachate collection sump from where it will be pumped to Effluent Treatment Plant. Leachate transfer pumps shall be provided of adequate capacity. MSW shall be dumped in the landfill by trucks, which shall be further levelled and compacted. Periodic waste audits will ensure that non-conforming waste shall not be dumped at the landfill site. The waste shall be compacted in thin layers using compacters and covered with a daily cover of soil layer or inert waste. After the landfill is filled it will be covered with top cover system with single liner arrangement and on the top 450 mm thick surface layer (Top Soil) shall be provided with vegetation. The slope of top cover shall be kept as 5% to provide quick drainage of rainfall For ground water monitoring 4 Nos. of wells shall be provided. A suitable ramp to reach the embankment top shall be provided so that truck/ dumper can reach the top of embankment and can directly dump the municipal solid waste in the landfill.
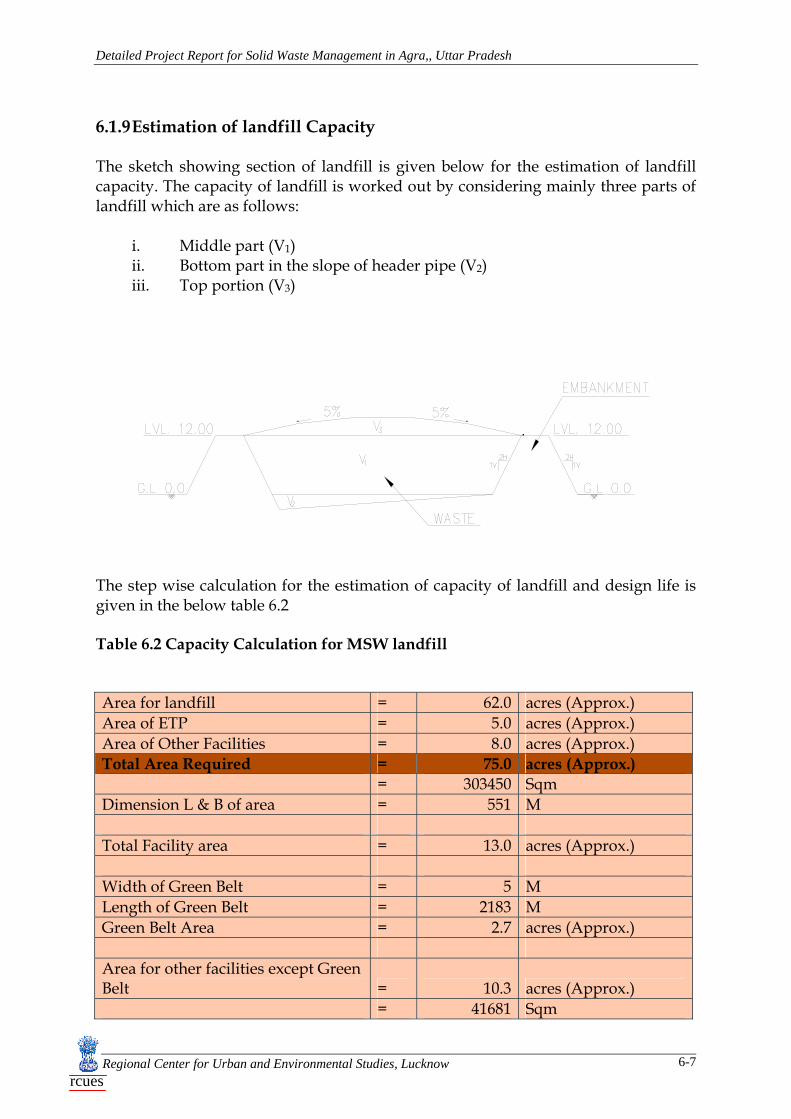
Detailed Project Report for Solid Waste Management in Agra,, Uttar Pradesh
Regional Center for Urban and Environmental Studies, Lucknow 6-7rcues
6.1.9 Estimation of landfill Capacity The sketch showing section of landfill is given below for the estimation of landfill capacity. The capacity of landfill is worked out by considering mainly three parts of landfill which are as follows:
i. Middle part (V1) ii. Bottom part in the slope of header pipe (V2) iii. Top portion (V3)
The step wise calculation for the estimation of capacity of landfill and design life is given in the below table 6.2 Table 6.2 Capacity Calculation for MSW landfill Area for landfill = 62.0 acres (Approx.) Area of ETP = 5.0 acres (Approx.) Area of Other Facilities = 8.0 acres (Approx.) Total Area Required = 75.0 acres (Approx.) = 303450 Sqm Dimension L & B of area = 551 M Total Facility area = 13.0 acres (Approx.) Width of Green Belt = 5 M Length of Green Belt = 2183 M Green Belt Area = 2.7 acres (Approx.) Area for other facilities except Green Belt = 10.3 acres (Approx.) = 41681 Sqm

Detailed Project Report for Solid Waste Management in Agra,, Uttar Pradesh
Regional Center for Urban and Environmental Studies, Lucknow 6-8rcues
Dimension for facilities area except Green Belt X = 541 M Y = 77 M Embankment Outer dimensions at GL L1 = 541 M B1 = 464 M Depth below GL = 0.0 M Height of embankment above GL = 12.0 M Top width of embankment = 3.0 M Slope of embankment 1H: 2.0 Slant Length inside Base to Top of Embankment = 26.8 M Slant Length outside GL to Top of Embankment = 26.8 M Embankment Outer dimensions at Top L2 = 493 M B2 = 416 M Embankment Inner dimensions at Top L3 = 487 M B3 = 410 M Embankment Inner dimensions at GL L4 = 439 M B4 = 362 M Embankment Inner dimensions at Base L5 = 439 M B5 = 362 M Inner Area at Embankment Top L3xB3 = 199516 Sqm Inner Area at GL L4xB4 = 158780 Sqm Inner Area at Base L5xB5 = 158780 Sqm Depth due to 1% slope at base = 4.39 M

Detailed Project Report for Solid Waste Management in Agra,, Uttar Pradesh
Regional Center for Urban and Environmental Studies, Lucknow 6-9rcues
Depth due to 1% slope in lateral at base = 1.81 M Total depth due to slope at base = 6.20 M Total Depth below GL = 6.20 M Height above embankment due to 5% slope = 12 M Thickness of Composite Liner at Base = 1.1 M Max. depth of base of liner below GL = 7.3 M VOL I = 492031 Cum VOL II = 2149780 Cum VOL III = 809475 Cum Total Volume = 3451286 Cum Daily Cover = 20 % Net Volume including side liner = 2876072 Cum Volume of liner at Base = 174658 Cum Volume of liner at Sides = 20495 Cum Net Volume For MSW in Landfill = 2855577 Cum Landfill-able MSW (Required) = 2791117 Cum Thk. of clay liner at base = 0.60 M Thk. of clay Liner at sides = 0.45 M Thk. of protective layer at base = 0.20 M Thk. of protective layer at sides = 0.10 M Thk. of Drainage layer at base = 0.30 M Road length = 2358 M Drain length = 2822 M Life of Landfill = 25 Years
The leachate treatment units, leachate collection sumps, equalization tanks, treatment control room etc. shall be provided outside the embankment. These shall be located 0.5 m above the lowest ground level. Waste conveying facilities are provided for mechanically depositing the residue into the MSW landfill after segregation.

Detailed Project Report for Solid Waste Management in Agra,, Uttar Pradesh
Regional Center for Urban and Environmental Studies, Lucknow 6-10rcues
No specific intermediate cover is provided other than the daily cover. However if the problem of odor persists intermediate cover may also be considered. In that case one intermediate cover of soil of thickness 450 mm may be provided at the mid-level The top cover shall have the highest point at the center and slopes towards the edges radially with around 5 % slope (after pre-grade settlement) towards the embankment. A network of intercepting drains and peripheral drains are provided for quick draining of the rainwater. The facility shall have green belts, trees and turfing on the embankment/ formation slopes as slope protection and to present pleasing appearance. 6.1.10 Selection of Liner Systems The objective in the design of liners is to minimize the infiltration of leachate and gases into subsurface soils below the landfill eliminating the potential for ground water contamination. Composite liner designs employing a geomembrane and clay layer provide more protection and are hydraulically more effective than other types of linings. Liners provide an effective hydraulic barrier beneath the waste to contain the waste and to allow for effective removal of leachate generated during containment. In the present MSW landfill, single composite liner system shall be provided meet stringent performance criteria that provide a high margin of safety. Each of the liner systems is discussed in more detail in the following sections. a) Bottom Liners The bottom portion of the landfill directly rests on stable compacted specially prepared soil bed. The various layers of liners from bottom to top are:
• 600 mm thick compacted clay/ amended soil (k≤ 10-7 cm/sec.) • 1.5 mm thick High Density Polyethylene (HDPE) Geomembrane • 200 thick silty sand protective layer • 300 mm thick granular soil drainage layer (Leachate Collection Layer)
b) Side Liners The side slopes in the soil formation are similarly made on firm compacted specially prepared stable slopes of 2H: 1V. The various layers of side liners from bottom to top are:
• 450 mm thick compacted clay/ amended soil (k≤ 10-7 cm/sec.) • 1.5 mm thick High Density Polyethylene (HDPE) Geomembrane • 100 mm thick protective layer (selected soil)
c) Top Cover Liners

Detailed Project Report for Solid Waste Management in Agra,, Uttar Pradesh
Regional Center for Urban and Environmental Studies, Lucknow 6-11rcues
The top cover the landfill directly rests on compacted specially shaped waste surface. The bed shall be laid to 3 to 5 % slope (after allowing for pre-grade settlements of the waste) for providing good natural drainage. The various layers of liners from bottom to top are:
• 450 mm thick granular soil (Gas Collection layer) • 600 mm thick compacted clay/ amended soil (k≤ 10-7 cm/sec.) • 300 mm thick topsoil /Sweet earth laid to 5 % slope
6.1.11 Selection of Leachate Control Facilities The leachate collection layer is provided in the granular soil (drainage) layer of the bottom liner system. The collection layer shall comprise of a network of perforated HDPE lateral pipes laid at aslope of 2% and 20 m c/c spacing. These laterals collect leachate and transfer it to the HDPE header pipe, which is laid at a slope of 1%. The header pipe ultimately transfers the leachate into the Leachate collection sump. The general arrangement of header and laterals is provided in the layout plan of MSW landfill. The sizing of laterals and headers is given in the table 6.3 below. Table 6.3 Leachate Pipe Sizing Area of landfill 199516 m2 Intensity of rainfall 40 mm/day Velocity in pipes 2 m/sec Leachate generation per hour 332.53 m3/hr Evaporation 10 % Leachate to be managed 299.27 m3/hr Leachate Collection System Header Sizing Header is running 0.5 full(value in decimal) Diameter of header 0.325 M 325 Mm Provide Header Pipe (PN6, HDPE, 15mm thk.) 355 mm (min) Quantity of Header Pipe 490 M Lateral Sizing Lateral is running 0.25 full(value in decimal) Number of laterals 44 Nos Diameter of lateral 0.069 M 69 Mm
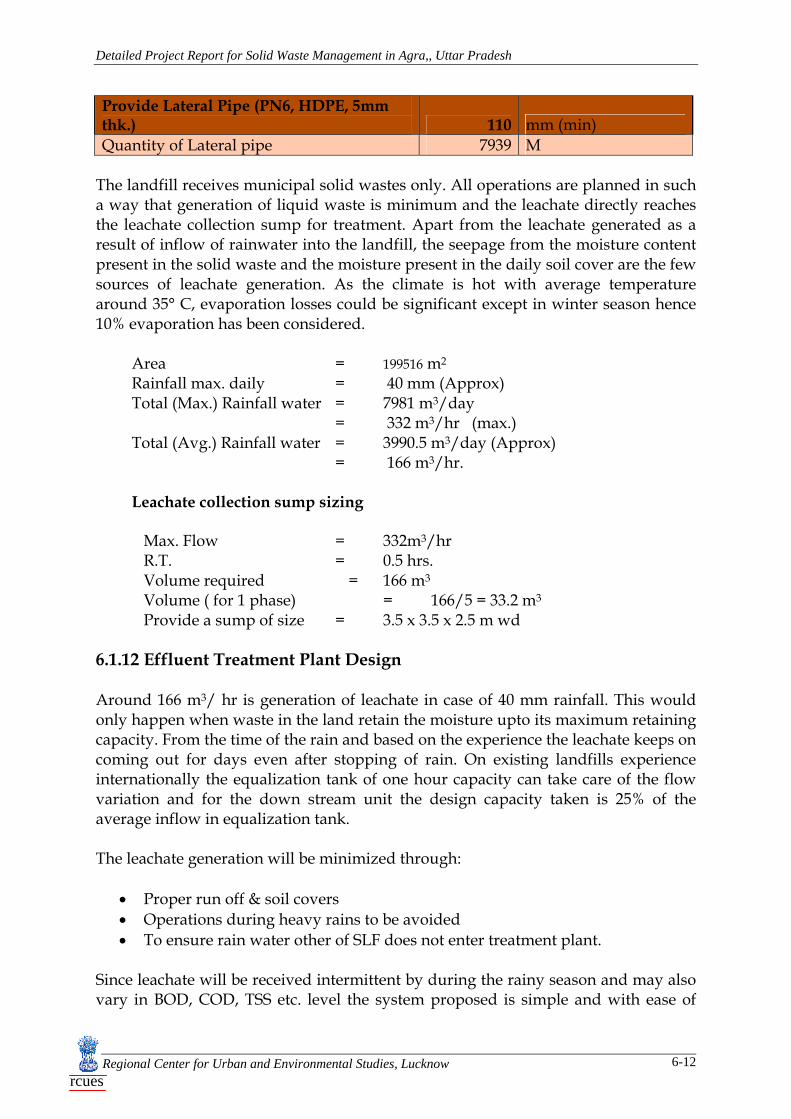
Detailed Project Report for Solid Waste Management in Agra,, Uttar Pradesh
Regional Center for Urban and Environmental Studies, Lucknow 6-12rcues
Provide Lateral Pipe (PN6, HDPE, 5mm thk.) 110 mm (min) Quantity of Lateral pipe 7939 M
The landfill receives municipal solid wastes only. All operations are planned in such a way that generation of liquid waste is minimum and the leachate directly reaches the leachate collection sump for treatment. Apart from the leachate generated as a result of inflow of rainwater into the landfill, the seepage from the moisture content present in the solid waste and the moisture present in the daily soil cover are the few sources of leachate generation. As the climate is hot with average temperature around 35° C, evaporation losses could be significant except in winter season hence 10% evaporation has been considered. Area = 199516 m2
Rainfall max. daily = 40 mm (Approx) Total (Max.) Rainfall water = 7981 m3/day = 332 m3/hr (max.) Total (Avg.) Rainfall water = 3990.5 m3/day (Approx) = 166 m3/hr.
Leachate collection sump sizing
Max. Flow = 332m3/hr R.T. = 0.5 hrs. Volume required = 166 m3 Volume ( for 1 phase) = 166/5 = 33.2 m3 Provide a sump of size = 3.5 x 3.5 x 2.5 m wd
6.1.12 Effluent Treatment Plant Design Around 166 m3/ hr is generation of leachate in case of 40 mm rainfall. This would only happen when waste in the land retain the moisture upto its maximum retaining capacity. From the time of the rain and based on the experience the leachate keeps on coming out for days even after stopping of rain. On existing landfills experience internationally the equalization tank of one hour capacity can take care of the flow variation and for the down stream unit the design capacity taken is 25% of the average inflow in equalization tank. The leachate generation will be minimized through:
• Proper run off & soil covers • Operations during heavy rains to be avoided • To ensure rain water other of SLF does not enter treatment plant.
Since leachate will be received intermittent by during the rainy season and may also vary in BOD, COD, TSS etc. level the system proposed is simple and with ease of

Detailed Project Report for Solid Waste Management in Agra,, Uttar Pradesh
Regional Center for Urban and Environmental Studies, Lucknow 6-13rcues
operations and O&M, leachate from the SLF will be collection in equalization tank through collection sump. Aeration will be done through aeration to avoid anaerobic conditions and also to reduce BOD & COD through aerobic bacteria. The waste water the equalization tank will then be transferred to clarifier for settling suspended impurities. Settled sludge will be drained to drying bed and then to SLF. Clarified waste water will be chlorinated and will be passed through pressure sand filter and activated carbon filter. The outlet from the activated carbon filter will be meeting UPPCB discharge standards for irrigation purposes. The process flow diagram for treatment of leachate is given in drawing no. O:3146/ Agra/Chap. 6/ 11. The detailed cost estimates are appended in Annexure- XIV. 6.1.13 Selection of landfill Gas Control Facilities The landfill is a secured landfill with single composite liners well in place at bottom, sides and top. The liner system consists of one-layers of geomembrane and one-layers of 2ft. (600mm) thick amended clay as liners whereby the chances of gases escaping from the ground and contaminating the groundwater and soil are remote. The gases developed due to continued confinement of degradable wastes, if any, are released through the gas extraction facilities provided in the landfill. For this purpose GI Vents are planned at 20m x 20m grids. 6.1.14 Aesthetic Considerations Adequate measures are planed to give a facelift by utilizing the abundantly available on site natural soil for raising buffer zones /embankments. Two rows of vegetative plantation shall be developed along the circumference of the outer embankment along with turfing on the slopes. In addition the top cover shall also be developed as a green belt. 6.1.15 Monitoring Facilities The soil, air and water in the area shall be continuously monitored for no contamination. Both sampling methods and non-sampling methods are adopted and monitored as per the monitoring plan for timely action to be taken before water contamination and leakage of gases into the soil. The facility is provided with a minimum four monitoring wells for soil water and gas measurements. The details of the monitoring plan are given in Table 6.4, wherein instruments /monitoring areas proposed are listed.

Detailed Project Report for Solid Waste Management in Agra,, Uttar Pradesh
Regional Center for Urban and Environmental Studies, Lucknow 6-14rcues
Table 6.4 Monitoring Plan Monitoring Method
Type of Monitoring
Equipment Used
Information/data to be recorded
Sampling Monitoring Method (Methods involving collection of samples for laboratory analysis)
Air Monitoring (Collection of Air samples)
Gas Syringes Air Bags
Air quality/analysis of gas
Ground Water Monitoring (Collection of ground Water)
Monitoring wells (Background wells) – both single depth and multiple depth
Water quality
(Collection of Ground Water)
Piezometers Water quality
(Collection of Leachate samples)
In landfill piezometers
Leachate quality
Vadose Zone Monitoring
Collection Lysimeters, Soil gas probes & Suction Cup Lysimeters
Analysis of Leachate between, VOC in soil, Gas monitoring, liquid monitoring in Vadose zone
Non-sampling Monitoring Method (Methods involving Physical and Electrical measurements)
Ground water Conductivity
Conductivity cells
Monitor changes in Groundwater Conductivity
Leachate Monitoring
Inland fill Piezometers
Measure depth of Leachate in landfill
Temperature Temperature probes
Measure temperature In land fill
Vadose zone Electric probes Salinity of vadose zone Electric Changes in the water

Detailed Project Report for Solid Waste Management in Agra,, Uttar Pradesh
Regional Center for Urban and Environmental Studies, Lucknow 6-15rcues
Resistance Block
content
Gamma ray attenuation probes
For monitoring of moisture content
Neutron Moisture meter
Moisture content in the soil
Tensiometer Used to measure negative pressure that exists in soil/landfill
TDR meter & Thermocouple psychometers
For recording Thermo Dielectric Properties of water and soil – any change in temperature and moisture will be recorded
Waves Sensing Devices (seismic type)
To identify leak detection
Apart from the above, regular inspection and monitoring of important components of the landfill shall be done as per the schedule given below: Final Top Cover: Once in a year and after each substantial rainfall it should be
checked for any erosion, landslides, movement of soil, slope, etc. Vegetation: Four times in a year a check should be made for existence of
dead plants/trees. Any plant/tree found dead shall be removed immediately.
Final Grade: Twice a year should be checked for ponding/logging of water. If any abnormalities found, slope should be corrected by putting soil.
Surface drains: Four times a year and after each substantial rain should be checked for any blockages. Leaves, debris or any other accumulation found in the drain shall be removed immediately.
Gas Monitoring: As required in the Management Plan it should be checked for strong presence of odor. The gas monitoring equipments (compressor, pipes, flaring stand, etc) should be checked to ensure their workability as they might become inoperable due to high gas generation.
Groundwater Monitoring: As per the Action Plan. A regular inspection shall be done to
check for any failures in the monitoring system. Leachate Management: As required by the plan.
Detailed Project Report for Solid Waste Management in Agra,, Uttar Pradesh
Regional Center for Urban and Environmental Studies, Lucknow 6-16rcues
6.1.16 Determination of Equipment Requirements The landfill facility shall have minimum operating equipment for the construction stages and no earth moving machinery is planned as the work shall be done by engaging suitable contracting agency. For the operations of daily cover the following nominal equipment shall be provided:
1. Front-end loader/JCB - 1No 2. Tipping trucks - 1 Nos 3. Safety Equipment - 1 Lot 4. Fire Fighting Equipment - 1 Lot 5. Diesel Generator - 1No.
For ETP unit suitable supporting plant and equipment are planned. For power supply to equipment, lighting, services etc a substation with transformer yard has been planned. All electrical systems shall have proper earthling and control systems. One number diesel-run electrical generator of 50 KVA is proposed for running the essential services and the ETP. 6.1.17 Design Life The landfill design life relates to active period, closure period and post closure period. The active period is the period in which actual filling takes place. In this case, this will be 25 years. The closure and post-closure period for which a landfill will be monitored and maintained shall be 30 years after the active period. 6.1.18 Post Closure Care Post closure care involves the routine inspection of the completed landfill site, maintenance of infrastructure and environmental monitoring. A well defined closure plan shall be formulated for effective implementation. 6.1 Technical Specifications The detail technical specifications of the following items have been given in Annexure XV.
1. Preparation of work area/ clearing site/ jungle 2. Striping 3. Excavation & filling work 4. Excavation of trenches 5. Borrow areas 6. Cast-in-situ cement concrete 7. Formwork and staging 8. Reinforcement

Detailed Project Report for Solid Waste Management in Agra,, Uttar Pradesh
Regional Center for Urban and Environmental Studies, Lucknow 6-17rcues
9. Structural steel work 10. Filling for clay liner and foundation 11. Foundation for embankment 12. Earthen embankment 13. Turfing 14. HDPE liner 15. Clay liner 16. Geo-textile 17. Geonet 18. Leachate collection system 19. HDPE Pipes 20. Sand layer 21. Gravel layer 22. Vertical centrifugal pump 23. Valves 24. Leachate treatment plant 25. Weighbridge 26. Piezometers 27. Electrical works 28. Schedule of Makes 29. Quantity assurance check list 30. List of mandatory spares
6.2 Cost Estimates The detailed cost estimates and Operation & Maintenance Plan for landfill, top cover and facilities are given in Annexure XIV. The summary of cost estimates and yearly O&M cost is given below in table 6.5 and table 6.6 respectively. 6.3 Closure Plan of existing dump site on PPP basis The existing dump site in Agra city at Shadhara chungi that is receiving waste from all around the city for a long period of time. The dump site has its commercial value as it could be used for other development alternatives. The waste dumped in the past has its biodegradable fraction which will degrade over time. The closure plan of this dump site is to be planned by Nagar Nigam Agra after having detailed study of the site pertaining to ground water contamination, surface runoff, degradation of waste, production of gas etc. The site could be developed on public private partnership (PPP) basis with some private operator. The yield and sale value from the development of the commercial and residential property by this land shall be sufficient for the closure cost of the dump site.. Therefore the closure cost of the dump site is not being included in the cost estimates and should be considered on PPP model for its development.

Detailed Project Report for Solid Waste Management in Agra,, Uttar Pradesh
Regional Center for Urban and Environmental Studies, Lucknow 6-18rcues
Table 6.5 Summary of Cost Estimates
Summary of Cost Estimates of Landfill for Agra
S.No Item Description Total Amount (Rs.)
Phase I (1 - 5 Years)
Phase II (6 - 10 Years)
Phase III (11 - 15 Years)
Phase IV (16 -20 Years)
Phase V (21 - 25 Years)
1 Landfill 226067663 45213533 45213533 45213533 45213533 45213533 2 Top Cover 70365013 14073003 14073003 14073003 14073003 14073003 3 Facilities for Landfill 6534627 6534627 4 Effluent Treatment Plant 5200000 5200000
5
Accessories e.g weighing bridge, JCB, Tipper Truck, Borewell for water supply, safety equipments, fire fighting equipments etc 6000000 6000000
Total (Rs.) 314167303 77021162 59286535 59286535 59286535 59286535
6 Add 5% for Electrical, Mechanical and Instrumentation works 15708365 3851058 2964327 2964327 2964327 2964327
GRAND TOTAL (Rs.)
329875668 80872220 62250862 62250862 62250862 62250862
Say (Rs.)
329900000
Operation and Maintenance Cost for 1 Year (Rs.) 3173000

Detailed Project Report for Solid Waste Management in Agra,, Uttar Pradesh
Regional Center for Urban and Environmental Studies, Lucknow 6-19rcues
Table 6.6 Operation and Maintenance Cost S.No
. Description Qualification Quantity Rates Per
month (Rs.)
Total Amount (Rs.)
A. Manpower Requirement (For one month) 1 Facility
Manager Diploma in Mechanical Engineering
1 Nos 15000 15000
2 Chemist M.SC.Chemistry 1 Nos 10000 10000 3 Computer
Operator Diploma in Computer engineering
1 Nos 8000 8000
4 Security Men Senior Secondary School
3 Nos 6000 18000
5 Electrician/Fitter
ITI 1 Nos 6000 6000
6 Accountant Master of Commerce
1 Nos 6000 6000
7 Helper Literate 3 Nos 4000 12000 8 Gardener Literate 1 Nos 4000 4000 9 Sweeper Literate 1 Nos 4000 4000 10 Peon Senior
Secondary School
1 Nos 4000 4000
11 Drivers Literate 2 Nos 4000 8000 TOTAL (Rs) 95000
TOTAL MAN POWER (A) (Rs) 95000 B Chemicals
(per month)
Lumpsum 20000 C Electric Power
(per month)
Lumpsum 10000 D DailyCover
(per month) 1303.904 CUM @ Rs 90/CuM 90 117352
E POL (per month)
Lumpsum 22000
Total (A+B+C+D+E) Rs. 264352 Total O&M (per month) Rs. 264352
Total O&M (per year) Rs.
3172224
Total O&M (per year) Rs. (Say)
3173000

Detailed Project Report for Solid Waste Management in Agra,,Uttar Pradesh
Regional Centre for Urban and Environmental Studies, Lucknow rcues
CCHHAAPPTTEERR 77 OOtthheerr OOppeerraattiioonn aanndd MMaaiinntteennaannccee
AAssppeeccttss

Detailed Project Report for Solid Waste Management in Agra, Uttar Pradesh
Regional Centre for Urban and Environmental Studies, Lucknow 7-1rcues
CHAPTER 7 OTHER OPERATION AND MAINTENANCE ASPECTS
7.1 Management Information System 7.1.1 Objective To ensure success of municipal solid waste management system, it is required to collect specific and discreet information not only to keep records up-to-date but also, for taking corrective measures as well as proper planning for future. Some of the information is thus required to:
Have overall idea of existing condition Deficiencies in the existing system Develop corrective measures for the existing system Upgrading the existing system Decision making Planning a better system Making budgetary provisions
Computerization of data helps people working at all levels for waste management. It helps to build a strong and a reliable information database necessary to facilitate the decision-making and monitoring process for management. The waste management system will essentially comprise of following components:
Waste Generation Waste Collection
Primary Secondary
Waste Transportation Waste Processing and disposal
The general information to be collected, collated and updated from time to time include of an existing system is as detailed below: 7.1.2 Waste Generation The waste generation data to be collected and maintained in the database comprise of:
Average quantity of waste generated per capita/kg/day Average quantity of waste produced each day in metric tones (MT) Seasonal variation in daily waste generation Total quantity of waste produced annually during last 3 years (MT) Breakup of the quantity of waste generated per day in kgs or MT
Household, shops and establishment waste

Detailed Project Report for Solid Waste Management in Agra, Uttar Pradesh
Regional Centre for Urban and Environmental Studies, Lucknow 7-2rcues
Vegetable and food market waste Meat, fish and slaughter house waste Construction and demolition waste Non-infectious hospital waste Non-hazardous industrial waste
7.1.3 Waste Collection The collection of data has two components primary collection and secondary collection. The data to be collected and maintained in the database for each of the two components is as detailed below: Primary Collection: Primary collection is the first and prime activity of solid waste management. For planning and designing effective, sustainable, cost effective and efficient primary collection system, the following information is required for each ward/town:
Area Present and future growth of population Population density Source of waste generation Sanitation workers in local body Contract workers Voluntary agency workers Tools and implements used in primary collection system Welfare measures for the workers Personnel protective equipments provided to the workforce Mode and frequency of collection from various sources: No. of safai karamcharis (SK’s) required to report for duty No. of SK’s actually reported No. of SK’s absent No. of houses actually attended by each SK’s Amount of waste collected Houses left unattended No. of street bins emptied and amount of waste transferred to the waste
storage depots No. of persons required to supervise No. of cases where performance found satisfactory No. of cases where performance was not upto mark Action taken and proposed to be taken Complaints received and attended
Secondary Collection: The second and vital activity in solid waste management services is the transfer of waste to intermediate storage point’s i.e. waste storage depots. To design an intermediate waste storage point and to ensure a synchronized

Detailed Project Report for Solid Waste Management in Agra, Uttar Pradesh
Regional Centre for Urban and Environmental Studies, Lucknow 7-3rcues
transportation system the following information is to be established for each ward/town:
Location Area Capacity Type of transfer system Mode of unloading Mode of loading No. of secondary collection locations per ward Type of secondary collection locations in each ward:
Dumper Placer Container Dustbin
Amount of waste received from various sources in each ward
7.1.4 Waste Transportation To enable designing a cost effective and efficient transportation system synchronized with primary and secondary collection system the following information is to be established for each ward/city:
No. of collection points Distance between collection points Quantity at collection points No. of vehicles available with the local body for waste transportation Type of vehicles, carrying capacity, age No. of trips made by vehicles/shift/day Fuel consumption of vehicles Distance traversed by vehicles Details of manpower working in each shift Quantity of waste transported in each shift Total quantity of waste transported/day Percentage of waste transported/day Breakdown reported during the day and action taken No. of bins cleared during the day No. and location of bins left unclear Arrangement made for clearing backlog
7.1.5 Waste Processing and Disposal To have an effective and planned operation of disposal and to design for developing an engineered and scientific disposal system, following information is to be established and maintained in the database:
Percentage of waste treated Amount of rejects from plant

Detailed Project Report for Solid Waste Management in Agra, Uttar Pradesh
Regional Centre for Urban and Environmental Studies, Lucknow 7-4rcues
Details of processed waste End use of processed waste Quantity of waste disposed to landfill after processing Amount of waste received for processing Characteristics of waste (physical & chemical) Amount of waste received for disposal in landfill Amount of waste received from processing unit Amount of waste disposed off in landfill Volume of leachate generated Leachate management system Response from private sector
7.1.6 Performance Monitoring Indicators There are a number of specific performance measures that can be used to assess the individual functional elements or operating sub-systems of any MSWM systems, there are also measures that help gauge the overall performance of any MSWM system. Some of such measures are as presented below: Table 7.1: Measures to guage performance of MSWM system Issue Indicator Health Morbidity and mortality rates due to illness related, directly or
indirectly with solid waste such as Cholera Tetanus Dengue fever Hepatitis etc
Economy Manpower employed in waste management activities
Various stakeholders involved in waste management system (equipment manufacturer, recycling industry, consultants, maintenance department etc)
Environmental Conditions
Percentage of MSW collected over the total MSW generated Percentage of MSW properly disposed over SW collected
Social Conditions
Percentage of population provided with waste collections services Annual increase/decrease in number of waste pickers in final disposal No. of community health education programs
Solid Waste Per capita waste generation (kg/person/day)

Detailed Project Report for Solid Waste Management in Agra, Uttar Pradesh
Regional Centre for Urban and Environmental Studies, Lucknow 7-5rcues
Generation Recovery (Tonnage of solid waste recovered per day/tonnage of solid
waste generated per day)*100 Coverage & Access to Urban Sanitation Services
Percentage of urban population served Percentage of semi-urban population served Ratio of urban/semi-urban population served
Management Operation and Finance
No. of waste management employees/thousand persons served Average monthly service charge Budget of waste management system Income generation through tariffs Efficiency of collection i.e value collected divided by value billed multiplied by 100 Unit cost of waste management service (Rs./ton) i.e sum of all direct costs, annual costs, indirect costs, social benefits, financial costs, depreciation divided by tonnage received at final disposal site per year
Other Recommended Indicators
Coverage of street sweeping Efficiency of collection equipment i.e total equipment divided by the no. of equipment in operation + backup equipment + maintenance equipment No. of bills paid per month No. of bills raised per month
It is important to note that general performance measures have to be compiled at regular intervals and then compared over time to enable SWM managers to monitor and establish positive and negative trends in waste management system. For example if at any time it is found that there is variation in revenue collection i.e it is going down over past few months, it is important for the concerned person of NNA to look into the matter and find way of overcoming this. 7.2 Complaint Handling System An effective and transparent complaint handling system is a prerequisite to any successful transformation. It is thus propose to set-up an efficient, effective, transparent and user-friendly complaint handling system for registering complaints from people regarding removal of solid waste. Complaint handling is another important component of waste management system. It helps in analyzing and improving the level of services provided to the stakeholders’.

Detailed Project Report for Solid Waste Management in Agra, Uttar Pradesh
Regional Centre for Urban and Environmental Studies, Lucknow 7-6rcues
7.2.1 Essential features of a complaint handling system A complaint handling system that is efficient and fair includes:
acknowledging that your customers have a right to complain openly seeking feedback from your customers, and having a written policy about handling complaints, which is readily available
to the customers. The essential features of complaint handling system are as described below: Fairness: Complaint handling should be fair to all parties, and must allow everyone's views to be heard and taken into account in a balanced way. Effectiveness: Availability of adequate resources is vital to handle complaints efficiently and effectively. Complaints received should be dealt with quickly and courteously. The people involved in responding to complaints will communicate the complaints to the filed staff and will have the authority and ability to decide remedies and to put them into effect. Accessibility: The complaint handling system should be accessible to all customers, and help them lodge their complaints. Information about how to make a complaint will be readily available and simple to understand or in other words it will be a user-friendly system. Toll free numbers, e-mail address etc will be provided for registering complaints. These numbers will also be available on all the vehicles, bins placed at public places, at all waste storage locations and will be displayed at all prominent public places. Accountability: The system will record the complaints received and the outcomes achieved. All the recurring and systemic problems that become known through the complaint handling system will be identified and rectified. The operation of complaint handling system will be reviewed regularly to make sure that effective outcomes are achieved for customers. 7.2.2 General Rules for Handling Complaints The general rules/ etiquettes for handling complaints include:
Listen to the complaint and get all details Repeat the message to confirm your understanding Tell the customer what will be done and when Handle complaints quickly Follow-up to be sure the complaint is redressed Confirm the complaint has received a satisfactory response and thank the
customer Inform public of services, your responsibilities and theirs

Detailed Project Report for Solid Waste Management in Agra, Uttar Pradesh
Regional Centre for Urban and Environmental Studies, Lucknow 7-7rcues
7.2.3 Complaint handling system for Agra Three dedicated telephone lines will be put in place for receiving customer calls and complaints. The system will be operational all times of day round the year. The system will have provision wherein the operator punches in all details of the complainer whenever a complaint is received. The complaint will be forwarded to the required field staff, which will ensure that it is addressed. Once the necessary action has been taken on the complaint, it can be disposed off and a note will be sent to the complainant stating details off action taken. A record of all the complaints lodged will be maintained to prepare a database, which will help in establishing
Complainant’s name Zone/ward Nature of complaint Time of complaint Response time Feedback from complainant
The most important feature, which will help in upgrading the complaint handling system will be the feedback received from people. 7.3 Environment, Health and Safety Aspects
Improper Solid Waste Management gives rise to problems of health, sanitation and environmental degradation. Several diseases are spread due to waste mismanagement as rodents and vectors breed on MSW. Rodents and vector insects transmit various diseases like dysentery, cholera, plague, typhoid, infective hepatitis and others. The workers engaged in SWM services are exposed to high health risks and frequently suffer from respiratory track infections and also gastro-intestinal problems. The rag pickers who move from street to street, bin to bin and go to dump yards to retrieve recyclable waste are most vulnerable to diseases on account of their direct contact with contaminated waste. They too are found to suffer from intestinal and respiratory infections, skin disorders and eye infection. They also suffer from injuries at open dumps, which can cause tetanus and serum hepatitis. Unscientific disposal of waste also contaminates soil and ground water resources with heavy metal and other contaminants through leachate and pose a serious problem of environmental deterioration and health risk. It is therefore essential that at all stages solid waste is handled carefully and health risks are minimized. Certain practices which shall be followed include:

Detailed Project Report for Solid Waste Management in Agra, Uttar Pradesh
Regional Centre for Urban and Environmental Studies, Lucknow 7-8rcues
⎯ Waste is covered at all stages of management cycle ⎯ Waste stored at the source of generation is collected daily before it starts
decaying and emanates foul smell ⎯ Workers are adequately trained in waste handling and protecting themselves
from the health risks involved in their occupation ⎯ Workers are given protective clothing and shoes and persuaded or requested
to use them ⎯ Waste is not burnt on the street / open space or at any place as it causes
pollution ⎯ Landfill sites are properly managed and monitored to prevent ground water
pollution It is proposed that all NNA waste handlers should be given annual medical examination and free medical treatment if it is felt that the illness is occupation- related. 7.4 Project Benefits Assessment: Social Cost-Benefit Assessment The proposed plan for Municipal Solid Waste Management in Agra City is based on 4R principal (Reduce, Reuse, Recycle and Recover). The plan is developed in lines with the requirements of MSW Rules 2000 and ensures well-being of the society at large. The MSW management plan proposes upgradation of the existing infrastructure and development of new infrastructure as per the current status of MSW management facilities in Agra city. In the proposed plan, infrastructure provision has been done to ensure that collection, transportation, treatment and disposal of MSW in Agra is done properly. The proposed approach will have positive and negative environmental, social and economic benefits to MSW workers and the overall society. The benefits and adverse impacts from the proposed MSW management plan are summarized below:
S. No.
Benefit Description
Comments Quantitative Impacts (wherever possible) & Underlying Assumptions
Benefits to NNA/other MSW workers
1 Improved working
- Provision of properly designed rikshaws,
- Workers will be given infrastructure

Detailed Project Report for Solid Waste Management in Agra, Uttar Pradesh
Regional Centre for Urban and Environmental Studies, Lucknow 7-9rcues
conditions wheelbarrows with covered containers
- Provision of PPEs - No manual handling of
waste proposed
for waste collection and handling as per the design
- Workers will be given appropriate competence training
2 Improved workers morale
- Ability to perform activities as desired
- Improved efficiency
- Infrastructure standard is maintained
3 Improved heath and safety
- Reduction to waste exposure as waste to be covered at all stages of handling
- Segregation of waste at source – biomedical and industrial hazardous waste not mixed with the MSW
- Provision of appropriate PPEs
- No manual handling of waste
- Workers given appropriate training on waste handling
- Infrastructure facilities maintained as per the proposed design
4 Employment opportunities
- PPP proposed for MSW management
- New infrastructure facilities (Compost Plant and Sanitary landfill) proposed
- PPP model is successful
- Infrastructure facilities are run efficiently
5 Reforms driven economic sustainability
- Grants are being provided on the condition that NNA would undertake suitable reforms in Management, Accounting and other areas so as to maintain sustainability of the project in the long run.
- Reforms implemented
Benefits to the Society
6 Easy access to MSW infrastructure facilities
- Every locality will have one secondary collection points @ 0.25 km2 area
- Door-to-door collection facility in all the localities
- Door-to-door waste collection from all households
- Secondary collection points available as per the design

Detailed Project Report for Solid Waste Management in Agra, Uttar Pradesh
Regional Centre for Urban and Environmental Studies, Lucknow 7-10rcues
7 Clean and Hygienic conditions resulting reduction in number of infectious and other diseases such as bronchitis, hepatitis, diarrhea, parasitic infection and pulmonary diseases.
- 100% door-to-door collection of waste proposed
- MSW handling in covered containers
- Daily cleaning of roads and secondary waste storage depots
- Waste transportation in covered vehicles
- Provided MSW management is done as per the design
8 Environmental Improvement
- No dumping of waste on ground
- Covered waste handling, so no foul odour at collection points
- No open burning of waste
- Recycling of waste - Composting of
biodegradable waste - Development of
Engineered landfill
- Provided MSW management is done as per the design
9 Improved quality of life
- Improved surroundings - Clean environment - Access to infrastructure
-
10 Improved awareness and civic sense in people
- Training and awareness of people for MSW management
- Dissemination of information, education and communication as per the design
Adverse
Impacts - -
1 Environmental impacts during construction of new infrastructural facilities
- Dust pollution during construction
- Air pollution from vehicles
- Water pollution due to construction activities
- Noise from material
- Adverse impacts from construction activities will be minimised by due care
-
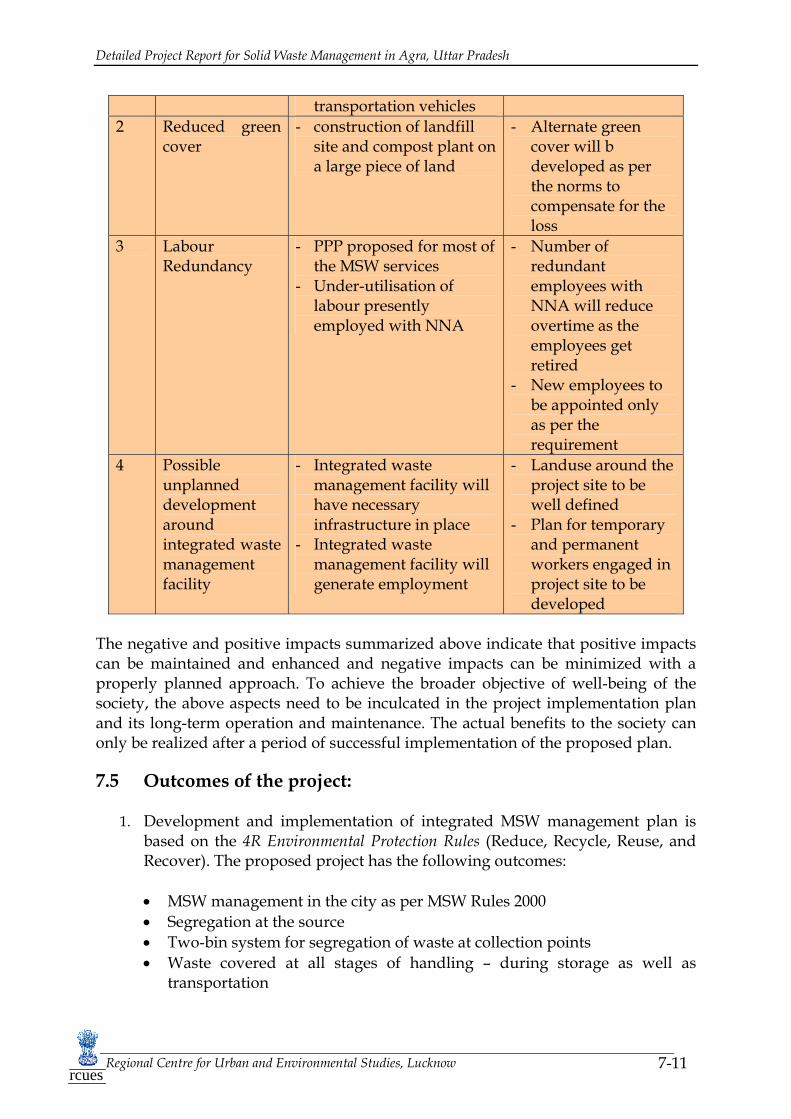
Detailed Project Report for Solid Waste Management in Agra, Uttar Pradesh
Regional Centre for Urban and Environmental Studies, Lucknow 7-11rcues
transportation vehicles 2 Reduced green
cover - construction of landfill
site and compost plant on a large piece of land
- Alternate green cover will b developed as per the norms to compensate for the loss
3 Labour Redundancy
- PPP proposed for most of the MSW services
- Under-utilisation of labour presently employed with NNA
- Number of redundant employees with NNA will reduce overtime as the employees get retired
- New employees to be appointed only as per the requirement
4 Possible unplanned development around integrated waste management facility
- Integrated waste management facility will have necessary infrastructure in place
- Integrated waste management facility will generate employment
- Landuse around the project site to be well defined
- Plan for temporary and permanent workers engaged in project site to be developed
The negative and positive impacts summarized above indicate that positive impacts can be maintained and enhanced and negative impacts can be minimized with a properly planned approach. To achieve the broader objective of well-being of the society, the above aspects need to be inculcated in the project implementation plan and its long-term operation and maintenance. The actual benefits to the society can only be realized after a period of successful implementation of the proposed plan. 7.5 Outcomes of the project:
1. Development and implementation of integrated MSW management plan is based on the 4R Environmental Protection Rules (Reduce, Recycle, Reuse, and Recover). The proposed project has the following outcomes:
• MSW management in the city as per MSW Rules 2000 • Segregation at the source • Two-bin system for segregation of waste at collection points • Waste covered at all stages of handling – during storage as well as
transportation

Detailed Project Report for Solid Waste Management in Agra, Uttar Pradesh
Regional Centre for Urban and Environmental Studies, Lucknow 7-12rcues
• No manual handling of waste in transferring of waste from containers to transportation vehicles
• Provision of the proper Personal Protective Equipments to the workers • Recycling of biodegradable waste through composting and profits from
this venture • Landfilling only of waste which is inert and non-biodegradable, thus
reduced landfill cost and land requirement • Healthy and safe environment for the people • Information, education and communication across the stakeholders to
create awareness within community and MSW workers • Promotion of PPP to bring efficiency in the system and reduce burden on
ULB
2. These steps will lead to greater cleanliness of the city and overall improvement of environmental hygiene. It would reduce disease and improve health of citizens.
3. It will also make the system in compliance with the legal requirement of MSW
Rules 2000

Detailed Project Report for Solid Waste Management in Agra,,Uttar Pradesh
Regional Centre for Urban and Environmental Studies, Lucknow rcues
CCHHAAPPTTEERR 88 CCoosstt ooff tthhee PPrrooppoosseedd SScchheemmee

Detailed Project Report for Solid Waste Management in Agra, Uttar Pradesh
Regional Centre for Urban and Environmental Studies, Lucknow 8-1rcues
CHAPTER 8 COST OF THE PROPOSED SCHEME The total project outlay is estimated at Rs 3392.39 lacs. The implementation of the scheme is scheduled to be completed finally on March 31, 2008 after which the commercial production of compost plant and use of landfill facilities will commence. The scheme for collection, storage and transportation of waste are likely to be implemented earlier. Details of the cost of the proposed scheme are given in Table 8.1: Table 8.1: Breakup of the Cost of the Proposed Scheme
Particulars
Total Outlay
Rs in lacs
Reference/ Comments
- Collection 500.45 Chapter 4 - Storage 340.65 Chapter 4 - Transportation to site/plant 571.88 Chapter 4
A. Sub total of above (Collection/Storage/Transportation)
1412.98
B. Compost plant 772.46 Chapter 5 C. Landfill site (for use during the first 5 years): 808.73 Chapter 6 D. Contingencies @ 3% on A to C 89.82 E. Capital Cost (A+B+C+D) 3083.99 F. Preparing of Detailed Project Report @1.5% of E 46.26 G. Capacity Building , IEC @ 1.5% of E above 46.26 H. Efficiency @ 1% of E above 30.84 I. Innovative Approach @ 1 % of E above 30.84 J. Incentives (F+G+H+I+J) 154.20 K. Third Party Project Monitoring and Evaluation
@ 5% of E above 154.20
L. Total Cost of the Proposed Scheme (E+J+K) 3392.39 The tools, equipment, machinery and fleet of vehicles for collection, segregation, storage and transportation for waste are proposed to be upgraded and/or replaced. These are the detailed in sections 4.2.1, 4.2.2 and 4.2.3. The investment on account aggregates to Rs 1412.98 lacs. The capital outlay for the 350 TPD waste to compost plant is proposed at Rs 772.46 lacs (refer chapter 5). Details of the landfill site , proposed to be set up in phases are given in Table 8.2.

Detailed Project Report for Solid Waste Management in Agra, Uttar Pradesh
Regional Centre for Urban and Environmental Studies, Lucknow 8-2rcues
Table 8.2: Phased implementation of landfill site Life of Landfill (Years) 5 20 Major expenditure during the period 2007-08 In phases from 2012 Usage Period 2008-13 2013 and thereafter Capital Cost (Rs in Lacs) – Total 3299 808.7 2490.3
The total proposed investment in landfill for a life of 25 years is estimated at Rs 3299 lacs. Out of this the cost of landfill site development for use during the first 5 years estimated at Rs 808.7 lacs has been considered in the capital cost outlay. Breakup of the other costs are given in point E to K in Table 8.1

Detailed Project Report for Solid Waste Management in Agra,,Uttar Pradesh
Regional Centre for Urban and Environmental Studies, Lucknow rcues
CCHHAAPPTTEERR 99 FFiinnaanncciiaall FFrraammeewwoorrkk

Detailed Project Report for Solid Waste Management in Agra, Uttar Pradesh
Regional Centre for Urban and Environmental Studies, Lucknow 9-1 rcues
CHAPTER 9 FINANCIAL FRAMEWORK The total long term funds required to finance the cost of the scheme aggregates to Rs 3392.39 lacs. The requirement of funds is detailed in chapter 8. The above requirement of funds is proposed to be met mainly by grants from grants available from Government of India (GOI) under the Jawharlal Nehru National Urban Renewable Mission (JnNURM). The scheme of JnNURM is detailed in the subsequent paragraphs. Balance part of the total cost of the scheme would be met by grants the State Government /NNA /Financial Institutions. This is as per the requirement, when grants are availed under the JnNURM scheme. Investment in the landfill site development for use after its first 5 years is estimated at an average of Rs 124.5 lacs/annum (required for 20 years after 2012) and is proposed to be financed though funds raised/generated/borrowed by NNA.
Grants under JnNURM
JnNURM, announced in December 2005, is a reforms-driven, fast-track, planned development of identified towns with focus on efficiency in urban infrastructure and services delivery, community participation and accountability of local governments towards citizens. The salient features of this scheme are:
• Preparation of sector-wise project reports by identified cities listing projects and their priority. The thrust areas are re-development of inner (old) city areas, water supply and sanitation, sewerage and solid waste management, construction and improvement of drains/storm water drains, construction/ up gradation of roads, highways/expressways, parking lots/spaces on public private partnership basis etc.
• The grant assistance (both Central and State) to act as seed money to leverage additional resources from financial institutions/capital market.
Under JnNURM, 63 cities, comprising 35 cities with a population of over 10 lakhs and 28 cities of historical/cultural importance will be covered. The funding pattern is to be 35:15:50 (between Centre, States/ULB and financial institutions) for mega cities (> 40 lakh population) and 50:20:30 for cities with populations between 10 lakhs and 40 lakhs.
Agra is already proposed as one of the 63 cities to be financed under JnNURM. As per the above the total cost of the scheme estimated would be financed in the ratio of 50:20:30 between the Centre, States, ULB and financial institutions.

Detailed Project Report for Solid Waste Management in Agra, Uttar Pradesh
Regional Centre for Urban and Environmental Studies, Lucknow 9-2 rcues
List of mandatory reforms to be undertaken by the Urban Local Body / Para-statal
• Adoption of accrual–based modern accounting system. • Introduction of e-governance like GIS and MIS. • Reform of property tax rates and collection efficiency with GIS. • Levy of reasonable user charges to bridge revenue-expenditure gap in
seven years. • Internal earmarking of budgets for basic services to urban poor. • Provision for improved housing, water supply, sanitation and ensuing
delivery of other already existing universal services of the Government for education, health and social security.
List of mandatory reforms at State Level
• Decentralization to enable meaningful interaction of citizen with ULB. • Repeal of Urban Land Ceiling and Regulation Act. • Reform of Rent Control Laws. • Reduction in stamp duty - Not to exceed more than 5% within next 7
years. • Enactment of Public Disclosure Law and release of quarterly reports. • Enactment of Community Participation Law to institutionalize citizen
participation. • Assigning or associating elected ULB with “city planning”.
List of optional reforms (State and ULB/Para-statal level to implement any 2 reforms in each year)
• Revision of construction bye laws • Procedural simplification for conversion of agricultural land to non-
agricultural purposes. • Introduction of Property Title Certification System in ULB. • Earmarking at least 20-25% of developed land in all housing projects
for EWS/LIG • Introduction of computerized process of registration of land and
property. • Revision of bye-laws to make rain water harvesting mandatory • Enactment of bye-laws for reuse of recycled water. • Administrative reforms i.e. reduction in establishment expenses
through voluntary retirement schemes (VRS), non-filling up of posts falling vacant due to VRS/retirement etc., and achieving specified milestones in this regard.
• Structural reforms • Encouraging Public Private Partnership (PPP)
Means of Finance

Detailed Project Report for Solid Waste Management in Agra, Uttar Pradesh
Regional Centre for Urban and Environmental Studies, Lucknow 9-3 rcues
The capital cost estimated at Rs 3083.99 lacs would be financed in the ratio of 50%, 20%, 30% (GOI, State Government and NNA) as per the financial plan applicable under JnNURM to cities with a population of over 10 lakhs but below 40 lakhs. NNA can also raise funds from financial institutions to part finance its share. It is indicated that the incentives/PME are proposed to be financed entirely by funds from the Government of India The exact financing would however be decided by the Competent Authority approving the financial plan for financing. Investment in the landfill site development for use after its first 5 years is estimated at an average of Rs 124.5 lacs/annum (for 20 years after 2012) and is proposed to be financed though funds raised/generated/borrowed by NNA. 9.2 Project Financial Sustainability/O&M Framework and Planning
The fund requirement for setting up facilities has been detailed in section 8 and Project Financial Structuring has been detailed in section 9.1. Once the facilities are erected, it is important that the operations are efficient, reliable and sustainable. The proposed financial model considers sustainability of operations of the four (4) areas of MSW management namely:
• Collection, segregation and storage of MSW waste • Transportation of collected waste to site • Operations of the compost plant. It also details the option for choosing
composting in relation to a waste to energy plant. • Operations of the land fill site
The basis of the proposed model is on PPP of the O&M components. The paragraphs below detail the need for a PPP model and list the way forward in implementing the PPP arrangements by NNA. The sustainability of the PPP schemes and determination of tipping fees, necessitate projected calculations of revenue and operating cost (together referred to as profitability) involved in each of the four (4) areas of the MSW operations.
The figures of profitability will be used to estimate the tipping fees/royalties etc. that may be recoverable/ payable by NNA in each of the four (4) areas of operations.
In section 9.2.9, examples of two towns namely Namkkal and Suryapet are given as an inspiration for NNA to make the city of Agra as a zero garbage city. The solid waste management in these two towns has been admired by the Honourable Supreme Court of India. It focuses that more than finances and other tools, its just good management and sense of commitment that is required to keep a city clean !

Detailed Project Report for Solid Waste Management in Agra, Uttar Pradesh
Regional Centre for Urban and Environmental Studies, Lucknow 9-4 rcues
9.2.1. Framework of the proposed PPP model
SWM as per the MSW (M&H) Rules 2000 is essentially a public responsibility. Therefore, the services rendered by NNA have to be efficient, economic and reliable to comply with Honourable Supreme Court directives in this regard.
RCUES’s primary survey points the need for improvement in waste management by NNA in terms of efficiency and its effectiveness. The deficiency in the existing system is due to lack of infrastructure, appropriate technology, restrictive bureaucracy, lack of accountability, higher administrative and salary expenses. These are not commensurate with desired level of productivity. Public awareness and community participation needs to be encouraged. The present unsatisfactory state of sanitation and cleanliness in Agra reflects the above mentioned anomalies.
RCUES’s past experience gained in other ULBs under similar conditions makes it recommend mandatory involvement and private sector participation in SWM projects/components. Private sector involvement through private public participation more often than not results in the win-win situations for all stakeholders both in the short and long term. Private sector investors being accountable for the services rendered will help make the operations more reliable and efficient – Short term advantage Sustained efficient operations will bring investment/ finances for such projects which will further improve operational efficiency - Long term advantage Since our main objective is to determine the tipping fee, PPP scheme in the discussions are restrictive to operation and maintenance as given below in Table 9.2 Table 9.2: PPP in MSW Management
Areas for PPP Capital Deployment *
Yearly O&M
Collection, segregation and storage
NNA PPP in a phased manner, starting initially with a few colonies and wards and then moving forward when positive results are achieved on a sustained basis
Transportation NNA PPP from beginning along with responsibility of IEC
Compost plant NNA PPP of compost on start of commercial production
Landfill NNA PPP of landfill on start of commercial production
* Financed by grants

Detailed Project Report for Solid Waste Management in Agra, Uttar Pradesh
Regional Centre for Urban and Environmental Studies, Lucknow 9-5 rcues
PPP for setting up a waste to energy plant has not been recommended in this DPR in this phase of the project. It can be undertaken in the second phase after a few years when certain bench marks are achieved. This is detailed later. The contractual agreement among private sector investors & NNA, for any of the above PPP arrangement, will include clearly defined services considering
• health and safety • environmental protection • legal aspect of compliance towards legislation • cost recovery/operational economics
Clarity in definition of the services made in mutual agreement will ensure good and reliable services which will be helpful at larger stage for monitoring and evaluation of services. The performance monitoring in terms of service efficiency, reliability, service quality and cost can be emphasized by defining operational standards, regulatory checks and periodicity of performance checks through public awareness and participation. Of late, both reward and punishment systems have are being incorporated for motivation and efficient performance of the private operator. The private sector may, however, be encouraged to participate in a manner not affecting the interest of the existing labour force, not violating the provisions of the labour laws, and above all restricting exploitative labour practices at the same time reducing the establishment cost of NNA. Sound though the above may seem there are practical constraints and improvements can be achieved over a period of time through proper training, education and work force redeployment and implementation of a planned retirement and hiring policy. Investment in capital infrastructure without concurrent addressal of labour productivity issues and public awareness will be futile. Procedurally, NNA should invite tenders to finalize the private operator in each of the specified areas. The tenders should be evaluated on the basis of private operators past experience in the field, his financial strength, willingness to deploy funds upfront, technical evaluation of the proposal and the tipping fee payable to/by the NNA. 9.2.2. PPP in operation of collection, segregation and storage of waste This activity should be done by the present staff of NNA and PPP should only be introduced in a gradual manner. PPP should be tried out in a few wards. Once it becomes operates successfully for a period of time, only then should it be introduced into more wards after analyzing the sensitivity and other requirements.

Detailed Project Report for Solid Waste Management in Agra, Uttar Pradesh
Regional Centre for Urban and Environmental Studies, Lucknow 9-6 rcues
Bigger municipalities have implemented the scheme of managing collection, segregation and storage under public private partnership (PPP) in some of their wards. Ahmedabad, Vijaywada, New Delhi, Surat, Rajkot are few of the examples. Locality/ward wise, tenders could be invited by NNA for private sector participation in collection of waste from doorsteps of households for a period of 2 to 3 years. The private entrepreneur would select his own team of workers and supervisors and define the work content to them. Based on the experience in places where PPP is operational, tipping fee by way of monthly collection charges can vary between Rs 15 to Rs 40 per month per household depending on the proximity of the houses as well as the ability and willingness for the housel hold to pay in terms of its disposable income. In Agra this is being done mainly in HIG colonies where the tipping fee being collected for door to door garbage collection varies from Rs 15 to Rs 50 per month. The most important thing for success of PPP is that people would continue to pay if the system delivers in its performance. The prime reason for failure of PPP has been loud promises and assurances but unsatisfactory performance. NNA should see this as a very important strategy for fund raising and improving its user charges and ensure that peoples expectations are met by making the PPP arrangement strong and effective. In the interim, before PPP becomes self sustainable and embedded in the society, the annual expenditure on collection, segregation and storage would be continued to be funded by the funds/grants NNA received from State Finance Commission as detailed in Section 2.4 and 3.7.3 of the report. Also NNA, along with the State Government, may consider increasing the house tax and levy a conservancy tax so as collect funds for cleanliness and sanitation and reduce its dependence on grants marginally for this requirement. Some cities, for example Rajkot , have such a provision. More details are given later. 9.2.3. PPP in transportation of waste to compost plant and landfill The estimated O&M expenses for the new fleet and proposed modern transportation system is Rs 367.9 lacs as detailed in section 4.4 and summarized in Table 9.3: Table 9.3: O&M Cost for Waste Transportation Infrastructure and Personnel S.No. Description Rs in lacs
1 Annual Cost 367.9

Detailed Project Report for Solid Waste Management in Agra, Uttar Pradesh
Regional Centre for Urban and Environmental Studies, Lucknow 9-7 rcues
The annual O&M at Rs 367.9 lacs would translate into a transportation cost of Rs 130/ton. With some provision as profit for the private operator, the tipping fee payable could be marginally higher. Bangalore, Jaipur, Rajkot, etc., cities have award contracts for transportation of waste from the temporary waste storage depots through contractor’s labour and vehicles. In this case, it is proposed that the vehicles would be provided by NNA and this has made the proposal for PPP significantly attractive and more sustainable. Generally tenders are invited and the lowest bidders are given the annual contracts for transportation of waste. Payments are made on per metric ton basis, restricting the total tonnage per truck and having a penalty provision for failure to perform or delay in clearance of bins. In New Delhi, the transporters with whom the PPP has been finalized, have been given the additional responsibility of IEC, along with the responsibility of transportation. 9.2.4. PPP in operation of compost plant The assumptions for profitability, profitability projections, cash flow statement and projected balance sheet for the 350 tpd waste to compost plant are given separately as Table 9.7, 9.8, 9.9 and 9.10 respectively at the end of this Chapter. The operations of the compost plant are profitable as summarized in Table 9.4: Table 9.4: Profitability of compost plant in 2009-10
Item Production of compost (tpa) 31185 Capacity utilization (%) 90 (Rs in lacs) Revenue 467.8 Cost of production 226.5 Gross profit (GP) 241.2 % of GP/Revenue 51.6 Interest 12.1 Depreciation 45.0 Operating profit 184.1 Tax 0.0 Net profit 184.1 Reserves 184.1 Net cash accruals 229.1 Cash breakeven point (%) 39.6

Detailed Project Report for Solid Waste Management in Agra, Uttar Pradesh
Regional Centre for Urban and Environmental Studies, Lucknow 9-8 rcues
On the basis of the assumptions in Table 9.5, in the second year of operations, at a capacity utilization of 90%, the compost plant will generate revenue of Rs 468 lacs. The operations will result in net cash earnings of Rs 229 lacs. The cash breakeven point is at 39.6%. The payback period for investment is about 4 years. With profitable returns, the O&M for the compost plant may attract participation under PPP from the private sector. Private parties may even be interested to deploy a part of their funds as upfront investment. Instead of tipping fee per ton, NNA could negotiate for fixed amount of payment per annum for providing facilities like land, waste and its initial investment. Thus out of the total cash earnings of Rs 229 lacs per annum, the PPP operator would be left with a surplus cash of Rs 214 lacs after incurring Rs 15 lacs as normal capital expenditure. Rs 15 lacs has been provided to save funds for expansion of the compost plant. NNA could ask the PPP to pay to it half of this amount i.e. Rs 107 lacs per annum for the land, waste and the facility set up by NNA. Alternatively other strategies could be formulated by NNA while negotiating the PPP agreement with the O&M operator. If the private operator is asked to pay upfront in terms of security or part finance the initial investment, the amount proposed above would stand reduced. While these figures are indicative, the actual perception, willingness to invest by private operator, the fixed amount per annum/ royalty/ tipping fee payable can only be determined at the time of inviting bids for the PPP proposal. It may be mentioned that the business of composting can be run with a much higher degree of value addition with proper management and marketing. The revenue from compost plant can increase significantly (over two to three times) if compost is marketed and sold in bags rather than selling it in bulk. With proper technical inputs and using the right mix of culture, the conversion yields can be improved. Thus a correct choice of the experienced private operator can bring in more profitability into the business, translating into more earnings for NNA. On the flipside, average realizations from compost can drop significantly if it is not of a good quality and marketing efforts are insufficient. In subsequent years, once the plant operates satisfactorily, the compost plant will be in a position to leverage the profitable operations and subsidized funds initially received through grants to expand its facilities as well as raise resources from lenders in form of debt.

Detailed Project Report for Solid Waste Management in Agra, Uttar Pradesh
Regional Centre for Urban and Environmental Studies, Lucknow 9-9 rcues
9.2.5. PPP in operation of landfill site As details of the O&M cost per annum at landfill is given in Table 6.6. The O&M expenses is summarized in Table 9.5. The O&M expenses at Rs 31.7 lacs per annum translate to Rs 37 per ton of waste disposed at landfill site. Table 9.5: Summary of annual O&M cost/annum at landfill
Rs in Lacs Per month Salaries and wages 0.95 Chemicals 0.20 Power 0.10 Oil, lubes etc. 0.22 Daily cover 1.17 Total 2.64 Total per annum 31.7
The cost per ton for larger sized landfills, like in Agra, is relatively on the lower side due to low fixed expenditure required on manpower establishment. The tipping fee payable to the private party carrying out O&M at the landfill would be marginally higher than this. NNA can also consider it in the perspective that that the revenue it earns from the compost plant get reduced by the above
amount incurred on O&M annually. On the assumption that segregation is going to be the focus area, small income that may be realized by sale of recyclables or marginal fees that could be charged from rag-pickers has not been considered as revenue for the financial analysis. Thus the landfill site at Agra is not expected to generate revenues in the initial few years. Future development of landfill site and possibility for revenue generation in detailed in section 9.2.8. 9.2.6 PPP in setting up of a Waste to Energy Plant and its O&M thereafter In the ensuing few paragraphs we shall detail out the concept and various alternatives of converting waste to energy. This shall also include the position of the existing plants in India as well as those being envisaged. The discussion would end with a recommendation/ suggested action plan.
A. Waste to energy technologies:

Detailed Project Report for Solid Waste Management in Agra, Uttar Pradesh
Regional Centre for Urban and Environmental Studies, Lucknow 9-10 rcues
Anaerobic Digestion and Biomethanation In this process organic waste in absence of air is broken down by bacteria into methane gas which is used for generating power. A 5 MW MSW based power plant based on bio-methanation technology was constructed at a cost of Rs 84 crores at Lucknow. It commenced commercial operations but it had to be closed down for various reasons Honourable supreme Court is ceased with matter and has stayed subsidy to all types of Waste to Energy Plants. Production of Refuse Derived Fuel (RDF) or Pelletization The advantage of this is that waste is converted into pellets which can be conveniently stored and transported long distances. It can be used as a coal substitute at a lower price. As pelletization involves significant MSW sorting operations and is energy intensive as it requires the removal of water from the waste to form pallets. Pellets get contaminated by toxic/hazardous material, and the pellets are not safe for burning in the open or for domestic use. Such plants are in the initial stage of development in India. The viability and sustainability of the technology process and projects are still being examined. The Department of Science and Technology (DST) of the Technology Information, Forecasting and Assessment Council (TIFAC), New Delhi tested the technology on a pilot scale basis to make fuel pellets from MSW. The above technology of processing MSW into fuel pellets was transferred to M/s. Selco International Limited, Hyderabad for scaling up and commercial operation. The Technology Development Board of DST and TIFAC had assisted Selco to set up a 6.6 MW power plant using MSW derived fuel and generate electricity. Selco uses 400 tonnes of MSW to convert into pallets and mixes it with 30 per cent rice husk for generation of power. DST has also transferred the technology to M/s Sriram Energy Systems Ltd to set up a similar plant at Vijayawada. Both these plants are reportedly operational since November 2003. The issues of sustainability and proportion of use of agro waste along with municipal solid waste claimed by the operators of these facilities is being contested and challenged by NGO’s. The Government subsidies on such plants have been put on hold by Honourable Supreme Court. Other Technologies like Inceneration Inceneration, commonly used in developed countries is more suitable for high calorific value waste with a large component of paper, plastic, packaging material, pathological wastes, etc. It can reduce waste volumes by over 80 per cent and convert waste to innocuous material, with energy recovery. The method is relatively hygienic, noiseless, and odourless, and land requirements are low. However the disadvantage is that this plant requires
Detailed Project Report for Solid Waste Management in Agra, Uttar Pradesh
Regional Centre for Urban and Environmental Studies, Lucknow 9-11 rcues
large capital and has substantial operation and maintenance costs. Skilled personnel are required for plant operation and maintenance. An incinerator capable of generating 3.75 MW power from 300 TPD MSW was installed at Timarpur, Delhi in the year 1987. It could not operate successfully reportedly due to low net calorific value of MSW. The plant is lying idle and the investment is wasted. Other technologies including incineration are not relevant in the Indian context because of their costs.
B. Issues presently associated with WTE plants
Provenness of technology in the Indian context is still to be established: Experience shows that the WTE have been successful in developing countries to handle large quantities of MSW. Two RDF based waste to energy projects viz. Hyderabad and Vijaywada have been commissioned in India and few more are under various stages of development. Both the project have failed to give tangible results and Bio methane Plant at Lucknow has also failed to deliver goods Honourable Supreme Court in is ceased with the situation in the subsidy Waste to Energy has been put on hold. The matter of WTE being technologically effective on MSW waste alone is presently sub judiced and availability of subsidy for such plants has been put on hold. Though the need is strong and the advantages of converting waste to energy are well appreciated, the technology still needs to be proven in the Indian context.
WTE involves much higher investment than Compost and so has a much higher risk: WTE projects generally involve higher capital investment and are more complex when compared to other options like composting for waste disposal, but gains are not higher. The reported cost of setting up an integrated facility works out to be about Rs 8 to Rs 10 crore/MW. The exact power generation capacity is a function of biodegradeable waste, the calorific value of waste and the plant configuration that is conceptualized. A norm is to assume 1 MW for every 125-150 TPD of MSW waste. Thus, on the basis of the waste in Agra (say at 350 TPD), a 2.8 MW power plant can be set up which would cost about Rs 25 crores to Rs 28 crores. At such high capital costs, the project would be viable only if subsidized funds are deployed in setting up the project. As indicated before, subsidies in such plants are on hold as long as the matter is sub judiced. Power projects from other sources of energy are in the range of Rs 3 crore/MW to Rs 5 crores/MW).
Segregation at source is very essential: Segregation of waste at source in order to avoid mixing of undesirable waste streams plays a major role in making a WTE facility financially viable. The failure of the plants in the past has been due to non availability of segregated

Detailed Project Report for Solid Waste Management in Agra, Uttar Pradesh
Regional Centre for Urban and Environmental Studies, Lucknow 9-12 rcues
bio disposable waste. Present MSW management system proposed in the DPR including IEC for segregation, PPP for house to house hold collection of waste etc. would start yielding results on a sustained basis only after a few years. No doubt segregation is required for composting also but its degree and criticality for WTE is significantly higher.
Complexity and large time frame is required in tying up other issues while setting up WTE plants: The terms for MSW supply, allotment of land and a power purchase agreement are factors in determining the financial viability of projects and private sector participation. Such aspects taken considerable time before projects can be implemented. Financial Institution lending for such facilities on a non recourse basis, insist that all project risks be suitably addressed and tied up to their satisfaction, with back-to-back agreements. Such projects have taken more than a year and in many cases several years to be conceptualised
Present Financial Position of NNA and Financing of the WTE plants: Financing from Financial Institutions even under PPP and a private operator would be coming through only when NNA’s financial position improves after undertaking reforms, WTE technology is proven and cheaper, NNA can demonstrate that desired segregation is being achieved at the source level to give a sustained throughput to the plant and project risks be covered on a back to back basis including power purchase agreements.
C. Recommendation on PPP in a WTE plant In view of the above discussions, it is suggested that the Waste to Energy Plant be envisaged in the second phase, after a minimum period of 5-7 years till the proven technology with Indian waste is available. After 5-7 year period it is expected that the technology would be proven, technology cost would reduce, segregation at source will be demonstrated, NNAs financial position would be much healthier subsequent to reforms under JNNURM and financing would be available. In the second phase, after 5 to 7 years, the WTE plant to be therefore set up under PPP with an experienced private partner, who has experience in this field.
9.2.7. User Charges/Revenue generation/ tipping fee Based on the discussions in the above paragraph, the following are derived/summarized in Table 9.56:

Detailed Project Report for Solid Waste Management in Agra, Uttar Pradesh
Regional Centre for Urban and Environmental Studies, Lucknow 9-13 rcues
Table 9.6 : User Charges/Revenue Generation/Tipping Fee/Sustainability Activity/ Type of
Charges Cost / Quantification of Charges
1 Primary Collection Door to Door Collection of waste
Rs 15 to Rs 50 per household/month The recovery of easily recoverable/ segregated recyclables and the above tipping fee will provide sustainability to the operations.
2 Expenditure on Safai Karamcharis
The expenditure on Safai Karamcharis (presently Rs 24.8 crores) will come down over a period of time based on a proper personnel policy on recruitment and retirement. Till this is achieved the expenditure would be sustained by the SFC funds.
3 Transportation of waste
Cost- Rs 367.9 lacs per annum or Rs 130/ ton. Thus tipping fee payable by NNA to O&M operator could be Rs 150/ton . This expenditure can also be covered from the recycleables recovered by the operator
4 Operations of Compost Plant
Selling Price of Compost-Rs 1.5/kg Cost of Production of Compost-Rs 0.80/kg Net Cash Accruals- Rs 154.5 lacs Compost Operations are self sustainable
5 Operations at Landfill Site
Cost-Rs 31.7 lacs per annum or Rs 37/ton of landfillable waste. This expenditure is low and can be sustained by surplus generated in the operations of the compost plant

Detailed Project Report for Solid Waste Management in Agra, Uttar Pradesh
Regional Centre for Urban and Environmental Studies, Lucknow 9-14 rcues
6 User charges (Conservancy tax)
Assuming that the projected expenditure on MSWM including present expenditure is Rs 3000 lacs (presently 2810 lacs), NNA and State Government of UP can recover some part of it in form of conservancy tax as in vogue abroad. This can be levied to start with at the rate of Rs 15 to Rs 20 per household/month (Rs 20 month* 200000 household* 12 months= Rs 4.8 crores/annum) The base rates of these taxes should be stratified as per the income groups and such taxation should be introduced in a phase manner so that its impact is not resisted. In this way, the financial funding from State Finance Commission for MSWM can stand reduced.
The pricing of the user charges/tipping fee for various components of MSWM (except for the compost plant that is detailed in section 9.2.4 is based on cost recovery of O&M expenditure. Hence financial parameters of IRR, return on assets etc., on these investments are not applicable. With the whole scheme being funded by grants with nil cost of capital, such a financial framework can be considered to be sustainable if O&M charges of the whole system are recovered. In case the scheme is part funded by debt; the user charge should then be increased suitability to take care of annual interest and repayment obligation.
9.2.8. Improvement in revenue/ tipping fee over a period of time through PPP It is proposed to convert the land fill sites into public parks (as shown in photo) on its closure. The transformation can help generate revenue from parking fees, kiosk rentals, and advertisement and entrance fees. A example of such a park is the Indraprastha Park in Delhi, which is located at the end point of Nizammudin Bridge, when one approaches Delhi from Uttar Pradesh.
Once the PPP system gets streamlined and optimal efficiency is achieved in SWM area of collection, segregation and storage, NNA should target additional revenues by converting recyclables into useful products which may

Detailed Project Report for Solid Waste Management in Agra, Uttar Pradesh
Regional Centre for Urban and Environmental Studies, Lucknow 9-15 rcues
require new technology, risk mitigation methodology etc. These are presently being tried now; on a smaller basis (e.g. conversion of construction waste into bricks has started in Rajkot). NNA should evaluate the cost benefits associated and results achieved in other cities before undertaking such innovations. 9.2.9 Inspiration…. Namakkal Namakkal is a poultry town in Tamil Nadu with poplulation of 1 lakh. It is a 'zero-garbage town, becoming the first local body in the world to receive ISO 14001 certificate for adopting effective solid-waste management system. The municipality, houses around 600 poultry farms and over 250 automobile workshops. It received the honour from Asian Environmental Management Council based in Germany, on being recommended by the Government of India. About 20 tons of solid waste is generated daily in the town. Of this 8 tons of organic waste is subjected to vermin composting, 3 tons is recycled and remaining 10 tons of inorganic waste is used for landfilling. Door to Door collection and Privatisation of the collection and transportation of waste has been done. Use of plastics, smoking and spitting in public places etc are banned in the town. Further the use of vehicle horns and loud speakers are also restricted. Suryapet Suryapet, a town in Nalgonda district of Andhra Pradesh, with a population of 1 lakh. It is spread over an area of 34 square kilometers and is divided into 28 municipal wards. It has a high slum and a floating population of about 20,000. It has 218 kms of drain and 241 kms of raod. Waste was a severe problem in the town. Suryapet’s annual income of Rs 8.45 crore was small to manage its daily garbage garbage output of 33 tpd. Municipality of Suryapet laid forward the innovative system of waste management by introducing the door-to-door-collection system. Two bins were supplied to all the residents where the red bins were meant for dry wastes and the green bins for wet garbage. Hanging bins were fixed to the electric poles for easy accessibility of the pedestrians. The town was divided into seven zones with the allotment of one tractor and few sanitary personnel for daily collection of waste. Municipal vehicles would collect garbage from respective zones in the morning. Separate vehicle was deployed for the collection of biomedical wastes, wastes from hotels. The aim was to involve the entire community in the transformation. Street meetings, street plays and door-to-door visits marked the social mobilisation process. In
Detailed Project Report for Solid Waste Management in Agra, Uttar Pradesh
Regional Centre for Urban and Environmental Studies, Lucknow 9-16 rcues
addition to their routine duties, municipal workers distributed leaflets and encouraged households to segregate their waste at the source. Municipal staff greeted members of every household with traditional kumkum and made them feel proud of being part of the effort.
The municipality spent just Rs 1.24 crore in a year on cleaning up the town. No additional workers were hired, nor were extra resources mobilised. Transparency and efficiency were nevertheless revived. Motivational incentives, regular monitoring and efficient management provided back-up support to the much-needed cleanup effort.

Detailed Project Report for Solid Waste Management in Agra, Uttar Pradesh
Regional Centre for Urban and Environmental Studies, Lucknow 9-17 rcues
Table 9.7. ASSUMPTION OF PROFITABILITY
COMPOST PLANT
1. The plant will have a capacity to process 350 tons per day of waste. The capacity utilization has been taken at 80%, 90%, (2009-2010 and thereafter)
2. It will give an average yield of 30% in terms of compost generation.
3. The selling price of compost has been taken @ Rs 1.5 per kg.
4. The cost of mulch material and other inputs has been taken at Rs 46.8
lacs/annum in normal year of operations
5. Power and utility cost has been taken at Rs 3.6 lacs per month.
6. Repair and Maintenance has been calculated @ 5% of the plant and machinery cost and 3% on the cost of buildings. Normal capital expenditure has been taken @ Rs 15 lacs from 2009-2010 onwards
7. Salaries and wages have been provided for 10 technical/supervisors and 35
non technical/workmen at average salaries of Rs 12,000 and Rs 4,500 per month.
8. Administrative expenses have been provided @ 60% of the salary & wages.
9. Selling expenses have been provided @ 12% of sales
10. Interest on working capital has been provided for @14% p.a.
11. Depreciation has been provided for SLM basis for book profit and WDV basis
for income tax.
12. Tax exemption under section 80IA has been provided.
13. Quasi equity funds will be deployed by the PPP operator for use as margin money at startup of the compost plant.

Detailed Project Report for Solid Waste Management in Agra, Uttar Pradesh
Regional Centre for Urban and Environmental Studies, Lucknow 9-18 rcues
Table 9.8. PROFITABILITY PROJECTIONS
COMPOST PLANT Rs in Lacs
Year ended March 31, 2009 2010 2011 2012 2013 2014 2015 2016months 12 Capacity Utilisation (%) 80 90 90 90 90 90 90 90Production tpa 27720 31185 31185 31185 31185 31185 31185 31185 Total Income 415.8 467.8 467.8 467.8 467.8 467.8 467.8 467.8 Raw Materials 41.6 46.8 46.8 46.8 46.8 46.8 46.8 46.8Power and fuel 38.4 43.2 43.2 43.2 43.2 43.2 43.2 43.2Repairs and Maintenance 27.2 27.2 27.2 27.2 27.2 27.2 27.2 27.2Salary and Wages 33.3 33.3 33.3 33.3 33.3 33.3 33.3 33.3Administrative Expenses 20.0 20.0 20.0 20.0 20.0 20.0 20.0 20.0Selling Expenses 49.9 56.1 56.1 56.1 56.1 56.1 56.1 56.1Cost of Production 210.3 226.5 226.5 226.5 226.5 226.5 226.5 226.5 Gross Profit 205.5 241.2 241.2 241.2 241.2 241.2 241.2 241.2% of GP/Total Income 49.4 51.6 51.6 51.6 51.6 51.6 51.6 51.6 Total Interest 11.6 12.1 12.1 12.1 12.1 12.1 12.1 12.1Depreciation 45.0 45.0 45.0 45.0 45.0 45.0 45.0 45.0Operating Profit 148.9 184.1 184.1 184.1 184.1 184.1 184.1 184.1Tax 0.0 0.0 0.0 0.0 0.0 0.0 0.0 0.0Net Profit 148.9 184.1 184.1 184.1 184.1 184.1 184.1 184.1Reserves 148.9 184.1 184.1 184.1 184.1 184.1 184.1 184.1Net Cash Accruals 193.9 229.1 229.1 229.1 229.1 229.1 229.1 229.1Breakeven Point (%) Cash 37.2 39.6 39.6 39.6 39.6 39.6 39.6 39.6Operating 47.1 49.5 49.5 49.5 49.5 49.5 49.5 49.5

Detailed Project Report for Solid Waste Management in Agra, Uttar Pradesh
Regional Centre for Urban and Environmental Studies, Lucknow 9-19 rcues
Table 9.9. CASH FLOW STATEMENT
COMPOST PLANT
Year ended 31.03. Zero 2009 2010 2011 2012 2013 2014 2015 2016months Year 12 Source of Funds Grants/Equity 772.5 Quasi Equity 41.6 Inc. in Bank Fin. 82.7 3.9 0.0 Net Cash Accrual 193.9 229.1 229.1 229.1 229.1 229.1 229.1 229.1Inc. in Creditors 3.9 0.0
Total Sources 814.1 276.6 236.9 229.1 229.1 229.1 229.1 229.1 229.1 Uses of Funds Capital Cost 772.5 Normal cap. exp. 0.0 15.0 15.0 15.0 15.0 15.0 15.0 15.0 Inc. in Curr. asset 41.6 82.7 11.4 0.0
Total Uses 814.1 82.7 26.4 15.0 15.0 15.0 15.0 15.0 15.0 Opening Cash 0.0 0.0 193.9 404.5 618.6 832.7 1046.8 1260.9 1475.0+/-surplus/(deficit) 0.0 193.9 210.6 214.1 214.1 214.1 214.1 214.1 214.1Closing Cash 0.0 193.9 404.5 618.6 832.7 1046.8 1260.9 1475.0 1689.1
* Zero Year is the period of implementation ending on March 31,2008

Detailed Project Report for Solid Waste Management in Agra, Uttar Pradesh
Regional Centre for Urban and Environmental Studies, Lucknow 9-20 rcues
Table 9.10. PROJECTED BALANCE SHEET
COMPOST PLANT
Rs in Lacs Year ended 31.03. Zero 2009 2010 2011 2012 2013 2014 2015 2016 Year months 12 Assets Gross Fixed Assets 772.5 772.5 787.5 802.5 817.5 832.5 847.5 862.5 877.5less: depreciation 0.0 45.0 90.0 135.0 180.0 224.9 269.9 314.9 359.9Net Fixed Assets 772.5 727.5 697.5 667.5 637.5 607.5 577.5 547.5 517.5Current Assets 41.6 124.4 135.7 135.7 135.7 135.7 135.7 135.7 135.7Cash/Bank Balance 0.0 193.9 404.5 618.6 832.7 1046.8 1260.9 1475.0 1689.1 Total 814.1 1045.7 1237.7 1421.8 1605.9 1790.0 1974.1 2158.2 2342.4 Liabilities Quasi Equity 41.6 41.6 41.6 41.6 41.6 41.6 41.6 41.6 41.6Grants 772.5 772.5 772.5 772.5 772.5 772.5 772.5 772.5 772.5Reserves & Surplus 0.0 148.9 333.0 517.1 701.3 885.4 1069.5 1253.6 1437.7Bank Finance 0.0 82.7 86.7 86.7 86.7 86.7 86.7 86.7 86.7Creditors 0.0 0.0 3.9 3.9 3.9 3.9 3.9 3.9 3.9 Total 814.1 1045.7 1237.7 1421.8 1605.9 1790.0 1974.1 2158.2 2342.4

Detailed Project Report for Solid Waste Management in Agra,,Uttar Pradesh
Regional Centre for Urban and Environmental Studies, Lucknow rcues
CHAPTER 10 PPrrooppoosseedd IInnssttiittuuttiioonnaall FFrraammeewwoorrkk

Detailed Project Report for Solid Waste Management in Agra, Uttar Pradesh
Regional Center for Urban and Environmental Studies, Lucknow
10.1rcues
CHAPTER 10 PROPOSED INSTITUTIONAL FRAMEWORK
The success and sustenance of the proposed SWM services depends on robustness and capacity of institutional framework. It is proposed to take steps for institutional strengthening and internal capacity building to ensure that endeavor to improve the existing scenario is successful. Institutional strengthening can be done by adequately decentralizing the administration, delegating adequate powers at the decentralized level, by inducting qualified and competent professionals into the administration and providing adequate training to the existing staff. Chapter 11 discusses plan for capacity building of all stakeholders including management staff, supervisors, workers, contractors and public.
10.1 Recommendations for Institutional Strengthening The recommendations for the institutional framework are based on the specific tasks to be carried out under the proposed MSW Project. The activities which need to be focused as per the proposed plan include:
• Segregation of Waste • Mechanism of Waste Collection
o Primary collection o Secondary collection
• Transportation of waste from secondary collection locations. • Operation and Maintenance
o Landfill. o Composting. o Transportation.
The above issues are to be implemented and managed partly by NNA exclusively on its own and partly by private sector participation. Based on our analysis of the merits and demerits of the existing system, it is proposed that the institutional framework for above proposed MSW activities should be as follows: Table 10.1: Specific Roles and Responsibilities of Institution Involved in Implementation and O&M Activities Organisation /
Institutions Scope of work
Collection/segregation Nagar Nigam Agra
o Deploy of sanitary workers o Sensitization of residents/public
about segregation. o Provide facilities/bins for
segregation o Collection from house holds o Transportation of waste to bins.
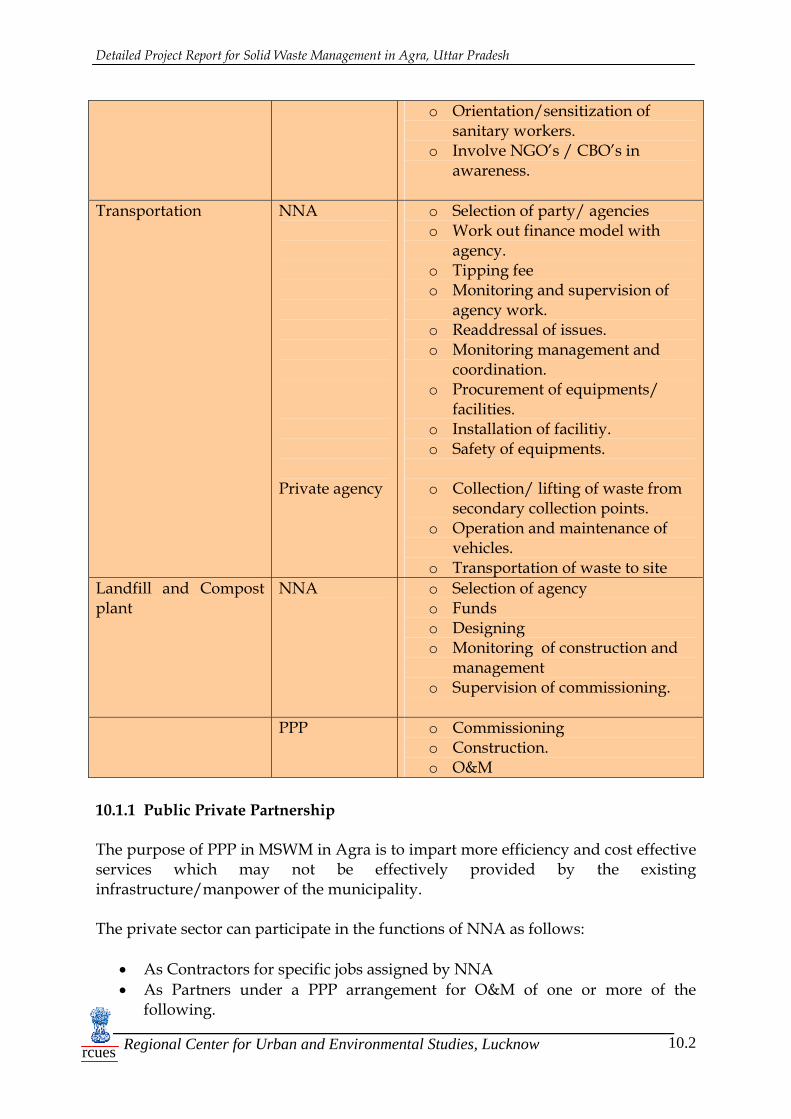
Detailed Project Report for Solid Waste Management in Agra, Uttar Pradesh
Regional Center for Urban and Environmental Studies, Lucknow
10.2rcues
o Orientation/sensitization of sanitary workers.
o Involve NGO’s / CBO’s in awareness.
Transportation NNA
Private agency
o Selection of party/ agencies o Work out finance model with
agency. o Tipping fee o Monitoring and supervision of
agency work. o Readdressal of issues. o Monitoring management and
coordination. o Procurement of equipments/
facilities. o Installation of facilitiy. o Safety of equipments.
o Collection/ lifting of waste from
secondary collection points. o Operation and maintenance of
vehicles. o Transportation of waste to site
Landfill and Compost plant
NNA o Selection of agency o Funds o Designing o Monitoring of construction and
management o Supervision of commissioning.
PPP o Commissioning o Construction. o O&M
10.1.1 Public Private Partnership The purpose of PPP in MSWM in Agra is to impart more efficiency and cost effective services which may not be effectively provided by the existing infrastructure/manpower of the municipality. The private sector can participate in the functions of NNA as follows:
• As Contractors for specific jobs assigned by NNA • As Partners under a PPP arrangement for O&M of one or more of the
following.

Detailed Project Report for Solid Waste Management in Agra, Uttar Pradesh
Regional Center for Urban and Environmental Studies, Lucknow
10.3rcues
Collection / Segregation and Transportation of waste O&M of Proposed facilities like Compost Plant and Landfill
• As Investors for part financing and setting up of new facilities.
Figure 0.1: Proposed Institutional Framework for SWM
10.2 Proposed Institutional Framework for Operation and
Maintenance The proposed Institutional Framework for O&M is as follows:
Waste Segregation
Primary Collection
Secondary Collection
Transportatio
Integrated SWM facility
Generators NGOs/CBOs
NNK staff
Private Operator
NNA to monitor
NNK
Private Operator
NNA to monitor
Private Operator
NNA to monitor
IMPLEMENTING INSTITUTION
ACTIVITY MONITORING INSTITUTION
NNA to monitor
NGOs/CBOs
Landfilling Composting
CAPACITY BUILDING INSTITUTION
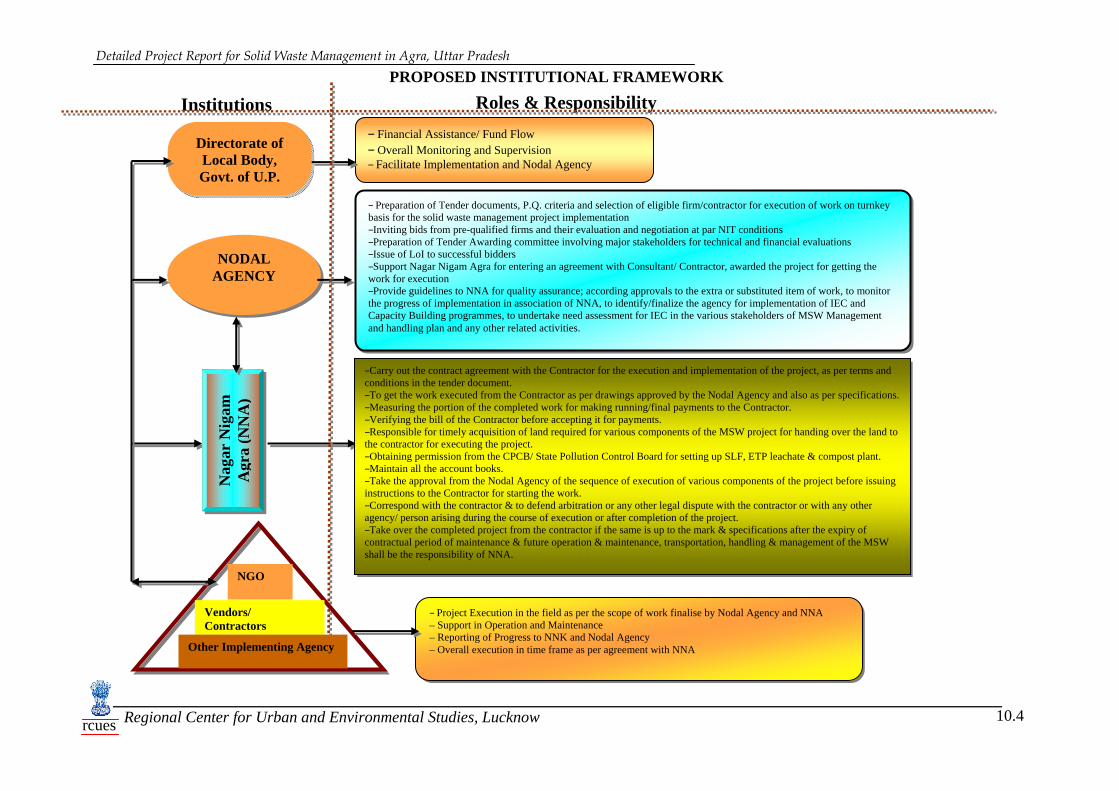
Detailed Project Report for Solid Waste Management in Agra, Uttar Pradesh
Regional Center for Urban and Environmental Studies, Lucknow
10.4rcues
Directorate of Local Body, Govt. of U.P.
Nag
ar N
igam
A
gra
(NN
A)
– Financial Assistance/ Fund Flow – Overall Monitoring and Supervision – Facilitate Implementation and Nodal Agency
NODAL AGENCY
– Preparation of Tender documents, P.Q. criteria and selection of eligible firm/contractor for execution of work on turnkey basis for the solid waste management project implementation –Inviting bids from pre-qualified firms and their evaluation and negotiation at par NIT conditions –Preparation of Tender Awarding committee involving major stakeholders for technical and financial evaluations –Issue of LoI to successful bidders –Support Nagar Nigam Agra for entering an agreement with Consultant/ Contractor, awarded the project for getting the work for execution –Provide guidelines to NNA for quality assurance; according approvals to the extra or substituted item of work, to monitor the progress of implementation in association of NNA, to identify/finalize the agency for implementation of IEC and Capacity Building programmes, to undertake need assessment for IEC in the various stakeholders of MSW Management and handling plan and any other related activities.
–Carry out the contract agreement with the Contractor for the execution and implementation of the project, as per terms and conditions in the tender document. –To get the work executed from the Contractor as per drawings approved by the Nodal Agency and also as per specifications.–Measuring the portion of the completed work for making running/final payments to the Contractor. –Verifying the bill of the Contractor before accepting it for payments. –Responsible for timely acquisition of land required for various components of the MSW project for handing over the land to the contractor for executing the project. –Obtaining permission from the CPCB/ State Pollution Control Board for setting up SLF, ETP leachate & compost plant. –Maintain all the account books. –Take the approval from the Nodal Agency of the sequence of execution of various components of the project before issuing instructions to the Contractor for starting the work. –Correspond with the contractor & to defend arbitration or any other legal dispute with the contractor or with any other agency/ person arising during the course of execution or after completion of the project. –Take over the completed project from the contractor if the same is up to the mark & specifications after the expiry of contractual period of maintenance & future operation & maintenance, transportation, handling & management of the MSW shall be the responsibility of NNA.
Institutions Roles & Responsibility
PROPOSED INSTITUTIONAL FRAMEWORK
– Project Execution in the field as per the scope of work finalise by Nodal Agency and NNA – Support in Operation and Maintenance – Reporting of Progress to NNK and Nodal Agency – Overall execution in time frame as per agreement with NNA
Vendors/ Contractors
NGO
Other Implementing Agency

Detailed Project Report for Solid Waste Management in Agra,,Uttar Pradesh
Regional Centre for Urban and Environmental Studies, Lucknow rcues
CCHHAAPPTTEERR 1111 IIEECC && CCaappaacciittyy BBuuiillddiinngg ooff NNNNAA
ffoorr SSuussttaaiinnaabbllee MMSSWWMM

Detailed Project Report for Solid Waste management forAgra, Uttar Pradesh
Regional Center for Urban and Environmental Studies, Lucknow
11-1rcues
CHAPTER 11 INFORMATION, EDUCATION & COMUNICATION (IEC) AND
CAPACITY BUILDING FOR SUSTAINABLE MSW MANAGEMENT
11.1 Introduction In the present scenario waste management and handling process is unplanned due to lack of proper infrastructure, awareness among the public and its involvement. No target oriented awareness programmes conducted in the past for solid waste management improvement or for waste segregation. Thus for making proper, reduced, segregated waste collection, there is a great need of public awareness and their involvement. Along with this, the Municipal Solid waste collection, handling and processing staff should be trained and sensitised. For this purpose need of Information, Education & Communication (IEC) Plan and Training & Capacity Building of staffs responsible for Solid Waste Management have been noticed. 11.2 Objective The major objectives of the IEC and Capacity Building are as follows:
– Bringing of attitudinal and behavioural changes among the residence about the segregation of waste and sanitation improvement.
– Public awareness through informing and educating the masses on various aspects of solid waste management and achieve the target of receiving segregated waste from each household.
– Creating Public Participation in Planning and Management of MSW Activities
– Capacity Building of the personnel's involved in implementing MSW i.e. Institutional Capacity of Health Department of FNPP for Improved MSW Management.
– Integration and involvement of private sweepers and Rag Pickers in improving MSW management
11.3 Public Participation and Awareness through IEC programmes The basic approach of IEC plan is to create effectiveness of the Solid Waste Management System. The success of any solid waste management scheme can be measured through the extent of cooperation and participation of people, effectiveness of the proposed system and operational efficiency. 11.3.1 Approach of IEC Plan

Detailed Project Report for Solid Waste management forAgra, Uttar Pradesh
Regional Center for Urban and Environmental Studies, Lucknow
11-2rcues
Attitudinal and behavioral changes of the residents are important for the success of the segregated waste collection and its sustainability. For this purpose, communication with the residents is required through various techniques and modes. There needs to be a two-way approach for IEC Implementation: a. Program communication : (to bring about behavioral changes)
Behavioral changes are must to achieve the objective of receiving segregated waste from each household. For this purpose, the strategy should be to build and improve existing community awareness and education through adopting awareness initiatives among the citizens.
b. Social Mobilization : (for alliance building ) It is universal that presence of local stakeholder or group in an issue can provide a very effective mechanism for community outreach and associated information and education activity. Hence support of NGOs, Local Leaders, RWAs, and Educational Institutions etc are indispensable for social mobilization.
Public Address Meetings (Workshops/ Community Meeting)
Health Workers & Volunteers (Door to door campaign)
Media Advocacy (Print & Electronic Media)
Folk Media (Street Plays, Road Shows)
Communication
Social Mobilisation/ Networking
Educational Institutions (Schools, College etc)
RWAs/ NGOs/ CBOs/ Societies Support
Sr. Officials/ Administration Officers / Sr. Citizens
Local Leaders / Ministerial Support

Detailed Project Report for Solid Waste management forAgra, Uttar Pradesh
Regional Center for Urban and Environmental Studies, Lucknow
11-3rcues
11.3.2 Strategy for Creating Awareness: Selection of key target audience plays a key role in generating effective awareness and cities like Agra need more careful planning for this purpose. Some of the target audience can be from sectors of particular interest including the female head of the family, children and youth, who require some form of role model to influence their behaviour. Broadly, the target audience can be categorized as waste generators, waste collectors and waste managers. Once the target groups have been identified, the responsibility lies in developing the approach for educating these groups. For successful implementation of any program involving public at large, it is essential to spell out clearly and make them know the manner in which the problem is proposed to be tackled to keep area clean and improve the quality of life. The communication material should be developed and must be utilized in public awareness program through the tools of publicity. The use of various publicity tools will be made as under:
1. Focus Group Discussions 2. Inter personal communications 3. Creating watchdog committees comprising of local influential people, RWA
members and important stakeholders, societies 4. Printed materials and Audio-visual aids 5. Other locally popular media.
Other tools like Newspapers, Media/Radio, Skit/Street plays, Billboards/ print Medium may be used for creating awareness. 11.4 Training and Capacity Building The basic approach of training & Capacity Building of managing staff is to create effectiveness of the Solid Waste Management System and its operational efficiency of sanitary staff. 11.4.1 Objective The Capacity Building/training programs must aim at:
1. To sensitize the key stakeholders with working knowledge of the benefits of waste reduction, segregation and management.
2. To Impart skills about the respective roles from generator to waste managers

Detailed Project Report for Solid Waste management forAgra, Uttar Pradesh
Regional Center for Urban and Environmental Studies, Lucknow
11-4rcues
For achieving these objectives, a core group of trainers needs to be organized for continuous in-house training of the manpower to be deployed and other sanitation staff. For the success of this program it is essential that training and orientation be planned for all the people involved in various activities of solid waste management at different levels viz Administrative and Officials, Technical and non-technical staff etc. Along with these, private sanitary staff and rag-pickers should also be motivated for their active role in waste collection process. The skill up-gradation programmes may be conceptualized and implemented will result to the followings.
• Determine roles and responsibilities of each official in specific terms. • Establish better coordination amongst the staff and departments to carry out
different functions related to MSW management • Enhance the knowledge base on problems and issues concerning to solid waste
management for each area and pockets. • Develop effective O&M of facilities such as Tri-cycles, Dustbins and Waste
containers with the help of public. • Develop an effective monitoring mechanism with the proper involvement of
officials responsible. 11.4.2 Specific activities in regard to training/Capacity Building Programmes
i. Training Need Assessment ii. Training made for specific Target Groups
iii. Conducting orientation program and need based site visits iv. Training made for specific Target Groups v. Evaluation of Training and orientation programmes
vi. Gap Analysis vii. Reinforcement programmes to fulfill the GAP
viii. Setting of appropriate Institutional framework for sustainability 11.4.3 Some Proposed tools/methods
i. In-house / interactive sessions ii. Exposure visits
iii. On Task Orientation iv. Other innovative programmes

Detailed Project Report for Solid Waste Management in Agra,,Uttar Pradesh
Regional Centre for Urban and Environmental Studies, Lucknow rcues
CCHHAAPPTTEERR 1122 PPrroojjeecctt IImmpplleemmeennttaattiioonn PPllaann

Detailed Project Report for Solid Waste Management in Agra, Uttar Pradesh
0 Month7 Month8 Month9 Month10 Month11Project Mile stones
1 Approval of DPR*
2 Preparation of Detailed Implementation plan in line with the DPR
3 Approval of Implementation plan
4 Issuance of notice for EOI
5 Screening of EOI & Shortlisting of firms
6 Preparation of Tender documents
7 Approval of Tender Documents by RCUES and GNN
8 Finalisation of Tender Documents and Issue of Tender
MSW Project Implementation Plan
Month3 Month4 Month12Month5 Month6Month1 Month2
Notice
8 Reciept of tenders from bidders
9 Bid evaluation and Recommendation for operator
10 Award of works contract to sucessful bidder(s)
11 Preperation of Construction scheduleDiscussions with sucessful bidder(s)Finalization of time linesFinalization of scope of workFinalization of methodologyDevelopment of construction schedule
12 Evaluation and Approval of engineering drawings and designReciept of design and drawing by bidderEvaluation w.r.t. tender document
13 Inspection of Equipments
14 Supervision and Monitoring of construction works
15 Start of Commercial Operations ⇒
Regional Centre for Urban and Environmental Studies, Lucknow

Detailed Project Report for Solid Waste Management in Agra, Uttar Pradesh
0 Month7 Month8 Month9 Month10 Month11Month3 Month4 Month12Month5 Month6Month1 Month2
Regional Centre for Urban and Environmental Studies, Lucknow