
Concentrations of surface O 3, NO 2 and CO during winter seasons at a semi-arid region - Agra, India
10
Indian Journal of Radio & Space Physics Vol. 37, April 2008, pp. 121-130 Concentrations of surface O 3 , NO 2 and CO during winter seasons at a semi-arid region – Agra, India Renuka Saini, G S Satsangi & Ajay Taneja School of Chemical Sciences, Department of Chemistry, St. John’s College, Agra 282 002, India (E-mail: [email protected]) Received 6 March 2006; revised 20 February 2008; accepted 22 February 2008 Surface measurements of O 3 (ozone) and its precursor gases such as NO 2 and CO have been made over an urban site of Agra (semi-arid region). Ozone and NO 2 show diurnal variations to an urban site during winter season. The overall increase of ozone is attributed to the increase in NO 2 , CO and other precursor’s emissions by different sources in the proximity of both the sites, i.e. St. John’s College (SJC) and Dayalbagh. The average concentration of ozone was found to be 27.3 ppbv and it ranges from 1.2 to 69.0 ppbv, whereas the average concentration of NO 2 and CO were 66.3 ± 7.0 ppbv and 710.3 ± 159.4 ppbv, respectively. The coefficient of determination of regression curve between O 3 and NO 2 were r = 0.50 at SJC and r = 0.68 at Dayalbagh, whereas correlation between O 3 and CO were r = 0.75 at SJC and r = 0.50 at Dayalbagh, indicating positive correlation. Air samples from the two different locations of Agra city have indicated that the concentrations of ozone and CO were within the permissible limits but NO 2 concentration was above the limit. Keywords: Ozone, Precursor gases, NO 2 , CO, Photochemical production, Semi-arid region PACS No.: 92.60.Sz, 82.33.Tb 1 Introduction It is well recognized that ozone plays an important role in absorbing the sun’s ultraviolet radiation. Now the importance of ozone in the troposphere is also known. It is one of the greenhouse gases absorbing the outgoing long wave radiation at 9.6 μm. Air pollution of high surface ozone arising from photochemical formation and accumulation has plagued many regions worldwide 1,2 . In some of the developed countries like UK and USA, the problem of air pollution in urban areas has been successfully dealt with, while in most developing countries like China and India, the situation is rather serious due to their poor economy and insufficient financial investment for control of urban air pollution 3 . In the presence of volatile organic compounds (VOC’s), CO and nitrogen oxides (NO + NO 2 = NO x ), ozone is photo chemically produced and can accumulate to hazardous levels in favourable weather conditions 4,5 . The anthropogenic volatile organic carbon (VOCs) emissions, which consist of non-methane hydrocarbons (NMHC) has been the subject for extensive control programme in many countries in order to reduce ambient ozone concentration. Major contributors to the concentration of upper tropospheric NO x are lightning, aviation and NO x emissions at the surface, which largely consist of energy consumptions, soil emissions, vegetation and biomass burning. Ozone production depends nonlinearly on NO x concentration 6 . However, NO is readily oxidized to NO 2 , which has considerable biological significance. It irritates the alveoli of the lungs, and the response of the human respiratory system to short term exposure to NO 2 also leads to increased airway resistance and decreased pulmonary diffusing capacity 7 . Accurate characterization of ozone precursors, mainly CO (from vehicular exhaust) is extremely important for understanding tropospheric ozone formation and accumulation, and crafting effective control strategies to better address ozone air quality management issues. Biomass burning in the tropics is considered to significantly affect the regional and global distribution of tropospheric ozone, because it emits a large amount of trace gases such as CO 2 and CH 4 as well as ozone precursor gases, NO x , CO and hydrocarbons 7,8 and these can affect distant areas through long-range transport 9-12 . Out of these, CO has a relatively long lifetime in the atmosphere (between about two weeks and two months) 13 and thus may be used as an important pollution tracer. The main goal of measuring CO concentration is to evaluate the dependency of ozone production upon CO, as it is directly produced in the biomass burning process, and can be measured with good precision and accuracy. None of the other trace gases produced in biomass
-
Upload
independent -
Category
Documents
-
view
0 -
download
0
Transcript of Concentrations of surface O 3, NO 2 and CO during winter seasons at a semi-arid region - Agra, India

Indian Journal of Radio & Space Physics
Vol. 37, April 2008, pp. 121-130
Concentrations of surface O3, NO2 and CO during winter seasons at
a semi-arid region – Agra, India
Renuka Saini, G S Satsangi & Ajay Taneja
School of Chemical Sciences, Department of Chemistry, St. John’s College, Agra 282 002, India
(E-mail: [email protected])
Received 6 March 2006; revised 20 February 2008; accepted 22 February 2008
Surface measurements of O3 (ozone) and its precursor gases such as NO2 and CO have been made over an urban site of
Agra (semi-arid region). Ozone and NO2 show diurnal variations to an urban site during winter season. The overall increase
of ozone is attributed to the increase in NO2, CO and other precursor’s emissions by different sources in the proximity of
both the sites, i.e. St. John’s College (SJC) and Dayalbagh. The average concentration of ozone was found to be 27.3 ppbv
and it ranges from 1.2 to 69.0 ppbv, whereas the average concentration of NO2 and CO were 66.3 ± 7.0 ppbv and 710.3 ±
159.4 ppbv, respectively. The coefficient of determination of regression curve between O3 and NO2 were r = 0.50 at SJC and
r = 0.68 at Dayalbagh, whereas correlation between O3 and CO were r = 0.75 at SJC and r = 0.50 at Dayalbagh, indicating
positive correlation. Air samples from the two different locations of Agra city have indicated that the concentrations of
ozone and CO were within the permissible limits but NO2 concentration was above the limit.
Keywords: Ozone, Precursor gases, NO2, CO, Photochemical production, Semi-arid region
PACS No.: 92.60.Sz, 82.33.Tb
1 Introduction It is well recognized that ozone plays an important
role in absorbing the sun’s ultraviolet radiation. Now
the importance of ozone in the troposphere is also
known. It is one of the greenhouse gases absorbing
the outgoing long wave radiation at 9.6 µm. Air
pollution of high surface ozone arising from
photochemical formation and accumulation has
plagued many regions worldwide1,2
. In some of the
developed countries like UK and USA, the problem of
air pollution in urban areas has been successfully
dealt with, while in most developing countries like
China and India, the situation is rather serious due to
their poor economy and insufficient financial
investment for control of urban air pollution3. In the
presence of volatile organic compounds (VOC’s), CO
and nitrogen oxides (NO + NO2 = NOx), ozone is
photo chemically produced and can accumulate to
hazardous levels in favourable weather conditions4,5
.
The anthropogenic volatile organic carbon (VOCs)
emissions, which consist of non-methane
hydrocarbons (NMHC) has been the subject for
extensive control programme in many countries in
order to reduce ambient ozone concentration. Major
contributors to the concentration of upper
tropospheric NOx are lightning, aviation and NOx
emissions at the surface, which largely consist of
energy consumptions, soil emissions, vegetation and
biomass burning. Ozone production depends
nonlinearly on NOx concentration6. However, NO is
readily oxidized to NO2, which has considerable
biological significance. It irritates the alveoli of the
lungs, and the response of the human respiratory
system to short term exposure to NO2 also leads to
increased airway resistance and decreased pulmonary
diffusing capacity7.
Accurate characterization of ozone precursors,
mainly CO (from vehicular exhaust) is extremely
important for understanding tropospheric ozone
formation and accumulation, and crafting effective
control strategies to better address ozone air quality
management issues. Biomass burning in the tropics is
considered to significantly affect the regional and
global distribution of tropospheric ozone, because it
emits a large amount of trace gases such as CO2 and
CH4 as well as ozone precursor gases, NOx, CO and
hydrocarbons7,8
and these can affect distant areas
through long-range transport9-12
. Out of these, CO has
a relatively long lifetime in the atmosphere (between
about two weeks and two months)13
and thus may be
used as an important pollution tracer. The main goal
of measuring CO concentration is to evaluate the
dependency of ozone production upon CO, as it is
directly produced in the biomass burning process, and
can be measured with good precision and accuracy.
None of the other trace gases produced in biomass

INDIAN J RADIO & SPACE PHYS, APRIL 2008
122
burning, such as methane14
and CO2 have variations
as large as CO, thus making changes more difficult to
detect. In the present site, large portion of population
is depending on biomass burning for cooking and
warming houses during winter season. This activity
increases heat, which can also be used for bringing
respite from extreme cold conditions. Thus, increase
in intensity of regional emissions of these precursor
gases could potentially enhance surface ozone
concentrations. Economic projections indicate that
larger increase in emissions may occur over the next
50 years if current development persists. If these
occur, the impact of ozone on public health and
vegetation15-17
would be experienced in the near
future.
In India, few studies have reported ozone
concentrations in tropical rural coastal18
, urban areas19
and high altitude sites20
. This paper deals with the
study of concentration of O3, NO2 and CO at different
locations in Agra city during winter season, because
during winters there is frequent occurrence of fog and
clear sky. Foggy conditions help the pollutants to
settle down and the lifetime of ozone precursors
would be considerably greater in winters than in any
other season. Thus the study of ozone and its
precursor gases is an important subject not only for
understanding atmospheric chemistry but also for
environment and climate related studies. Pollutants
emitted from traffic and industrial activities play an
important role in the formation of ozone. Air
sampling of O3 measurements were designed to obtain
monthly ground level concentration of O3 and to see
the effects of vehicular pollution on O3 concentration.
However, the measurements of ozone and related
gases are very limited over the semi-arid Indian
regions. The growing industrial activities in this
region add to the importance of these studies.
2 Experimental method
2.1 Sampling site
Agra, the city of the Taj Mahal (27°10′N 78°02′E)
is located in the north central part of India, about 200
km south of Delhi in the Indian state of Uttar Pradesh.
A part of the great northern Indian plains, Agra city is
considered as a semi-arid zone as two-thirds of its
boundary is surrounded by the Thar desert of
Rajasthan. Three highways cross this city. Sampling
was carried out at two sites, St. John’s College (SJC)
and Dayalbagh. The first site was SJC, which is
situated in the heart of Agra city, is considered as the
high traffic density sampling site. It lies by the side of
a road that carries a maximum traffic density of about
10,000 (105) vehicles per day (Satsangi et al., 2004).
The second site Dayalbagh is situated in the northern
part of the city. It is devoted to agriculture, where
tube-well pumps are used for irrigation purposes, run
by diesel and has low density of residence. This is a
relatively cleaner site. Major urban activity centers,
i.e. the industrial area (Sikandra Phase 3) as well as
Mathura Refinery are situated in the north-west part
of the first sampling site (SJC) as shown in
Fig. 1, which include foundries, rubber processing
units, chemical industries, tanneries, ferrous and non-
ferrous metal casting and lime processing units. These
units emit major gaseous pollutants21
like CO, NOx
and SO2.
2.2 Sample collection and analysis
The present study was conducted during winter
seasons of years 2003-2005 (November, 2003 to
February, 2005). Agra has a tropical climate.
Summers (April-June) are extremely hot and
maximum temperature can be as high as 45°C while
winters (November to February) are foggy. Heavy
rains and humidity mark the monsoon season
(July-September). In October while the day
temperature remains as in September, the nights
become cooler. From November both day and night
temperature steadily drops and in January, the coldest
month, the mean daily temperature is 10°C and the
mean daily minimum temperature is 6°C. The relative
humidity during the winter months ranges between 60
and 70%. The downward wind is SSE 29% and NE
6% in summers and it is W-NW 9.4% and NNW
11.8% in winters.
Neutral KI buffer method (a chemical method) was
used to measure the air concentration of O3. Surface
O3 and NO2 were collected with the help of a handy
sampler (KDM Instruments, New Delhi). For O3 air
was drawn in impingers containing absorbing solution
of O3 (KH2PO4, Na2HPO4 and KI). Air was drawn for
2 h at a rate of 2 LPM in the KI buffer solution
(pH 7.0 absorbing solution). The liberated iodine,
which forms the triiodide ion, was measured
calorimetrically at 352 nm using UV-VIS
spectrophotometer22
(Heλios-α, Thermospectronic,
UK). During all the winter months, samples were
collected throughout the week with an average of 4-5
samples per day. Total number of 220 samples was
collected during the study. Some samples (14-17)
were collected to see diurnal variation for a particular
time interval. Impingers were shielded from direct
sunlight by covering them with black sheet to avoid

SAINI et al.: SURFACE O3, NO2 & CO DURING WINTER AT AGRA, INDIA
123
photodecomposition. Low temperature was
maintained by putting ice in the box, in which
impingers were kept. Ozone was immediately
analyzed after sampling. Incomplete samples were
discarded whenever there was power failure during
sample collection. Quality assurance parameters like
collection efficiency and reproducibility were
measured. To determine collection efficiency,
samples of air in three different impingers in a series
were taken and the concentration of O3 in each
determined separately. Maximum concentration was
found in the first impinger. Two parallel sets of
measurements were carried out to determine the
reproducibility with identical absorbing solution. The
differences of the parallel measurements under
ambient condition were less than 6%.
The constituent NO2 was also measured by the
impinger technique. Air was drawn in to 20-ml. of
sodium arsenite solution at a flow rate of 2 LPM for
2 h. Concentration of NO2 was estimated by the
Saltzman’s method as modified by Jacob and
Hoccheiscer22
. The NO2 (as NO2-) concentration was
detected colorimetrically on reaction with phosphoric
acid, sulphanilamide and n-Naphthylamine diamine
dihydrochloride (NEDA), producing an azo dye. The
absorbance of the colour was read at 540 nm using
UV-VIS spectrophotometer (Heλios-α, Thermo-
spectronic, UK). To determine collection efficiency
same technique as for O3 was used. Maximum
concentration was found in the first impinger. Two
parallel sets of measurements were carried out to
determine the reproducibility with identical absorbing
solution. The differences of the parallel measurements
under ambient condition were less than 4%.
Concentration of CO was measured by a portable
YES-205 multi-gas monitor (Young Environment
System Inc 140-8771 Douglas St. Richmond, B.C.
V6X1V2, Canada). The monitor measures CO in the
interval of 0-50 ppm with a resolution of 0.3 ppm.
Zero and span were checked at regular intervals using
zero air and standard of CO. For CO measurements,
the instrument was positioned 2 m above the ground
level. While measuring CO, temperature and relative
humidity were also measured.
Fig. 1 — Map of Agra city

INDIAN J RADIO & SPACE PHYS, APRIL 2008
124
3 Results and discussion The average concentrations of O3, NO2 and CO for
both the sites, for all the months of winter season are
presented in Table 1. The average concentrations of
O3, NO2 and CO were 34.6 ± 5.4 ppb, 56.2 ± 21.7 ppb
and 1088 ± 202.75 ppb at SJC and 20.1 ± 5.9 ppb,
27.4 ± 19.6 ppb and 332.5 ± 116 ppb at Dayalbagh,
respectively. Maximum O3, NO2 and CO
concentrations were found to be 69.0 ppb, 150.7 ppb
and 1130 ppb respectively, at SJC, whereas minimum
O3, NO2 and CO concentrations were found to be
1.2 ppb, 2.1 ppb and 269 ppb at Dayalbagh. It is clear
that the concentrations of these gases are higher at
SJC as compared to Dayalbagh. Higher pollution at
SJC is attributed to diesel/petrol vehicular emissions,
as the major source of pollution.
Figure 2(a) shows the difference in diurnal
variation of O3 averaged over the period from
November 2003 to February 2005. At Agra highest
mixing ratio of O3 in the winter season is observed to
be 59.6 ppb during peak noontime and the lowest of
13.7 ppb appears during early morning. In January,
high variation could be attributed to daily variation in
weather conditions (frequent occurrence of fog and
clear sky). Foggy condition would result in low
photochemical formation. The O3 levels are observed
to be low during nighttime; as there is no photo-
oxidation of precursors (causing O3 production). Low
levels of O3 during early morning and nighttime are
due to combined effects of chemical loss by NO and
NO2 species and suppressed boundary layer mixing
processes (due to low temperature). Moreover, during
nighttime the titration of O3 by surface emission of
NO in shallow boundary layer and loss due to surface
deposition continues. Boundary layer processes and
meteorological parameters also play important role in
the O3 variabilities25
(Y N Ahammed, 2006). Increase
in O3 during the day is basically due to photo-
oxidation of precursor gases like CO, CH4 and
hydrocarbons in the presence of sufficient amount of
NOx.
Diurnal variation of ozone gives a clear picture of
ozone status in Agra region. During the day, ozone
concentration starts increasing gradually after sunrise,
attains maximum value during noontime and then
decreases. As evident from the figure the rate of
increase in O3 concentration during morning is fast,
whereas in the evening it decreases rather slowly.
During the day-time, peak O3 concentrations also
coincide with flux of solar radiation, indicating its
photochemical production. Low concentration of O3
during night/early morning time could also be a result
of its deposition and surface chemical reactions. Thus,
NO emitted from vehicular emissions serves as a
Table 1 — Threshold limit for air borne contaminates
Pollutants Time Weighted Average, ppb
O3a 50.3 (8 h)
NO2b 30 (Annual)*
40 (24 h)**
COb 1,750 (8 h)
3,492.8 (1 h)
*Annual Arithmetic mean of minimum 104 measurements in a
year taken twice a week 24 hourly at uniform interval.
**24 hourly/8 hourly values should be met 98% of the time in
a year. However, 2% of the time it may exceed but not on two
consecutive days.
Source: aWHO air quality guidelines 2005
(http://www.euro.who.int/document/E87950.pdf) bWBA,CPCB, 2003
[
Fig. 2 — Difference in diurnal variation of: (a) O3, (b) NO2 and
(c) CO at St. John’s College and Dayalbagh

SAINI et al.: SURFACE O3, NO2 & CO DURING WINTER AT AGRA, INDIA
125
nighttime/morning sink. Besides automotive
emission, NO has also been suggested to be emitted
from soil; emissions depend upon soil temperature
and soil humidity11,22
(Kirchhoff, 1988; Satsangi et al,
2004). Further changes in the boundary layer height,
as well as in the incoming solar radiation, are quite
rapid during morning time, and therefore the
maximum changes in O3 are observed during this
time27
(Naja and Lal, 2002).
Table 2 compares the concentrations of O3 at
present site with similar work done in other sites of
India, i.e. Ahmedabad19
, Mt. Abu20
and Gadanki23
. It
is evident from these results that concentration of O3
in the present site was within the range of urban
(Ahmedabad) and high altitude areas (Mt.Abu,
Gadanki). The daytime increase in ozone
concentration, which is a pronounced feature of a
polluted site, it is basically due to the photo-oxidation
of the precursor gases such as CO, CH4 and NMHC in
the presence of sufficient amount of NOx. The
well-known photo-oxidation cycle of CO can be
represented as28
(Pitts and Pitts, 1998)
CO + OH → CO2,
H + O2 + M → HO2 + M,
HO2 + NO → NO2 + OH,
NO2 + hv → O (3P) + NO,
λ < 420 nm
O (3P) + O2 + M → O3 + M,
Net: CO + 2O2 + hv → CO2 + O3
In this process NOx acts as a catalyst and continues
to do so until physical processes permanently remove
it or it gets transformed to other oxides of nitrogen.
Similar ozone productive cycles take place for CH4
and NMHC’s, but their O3 yield is much higher than
that of CO. Production of O3 from its precursor, NOx
is one of the important features of the polluted
atmosphere. In the troposphere, peroxy radicals that react rapidly with NO mainly play this role.
The main sources of O3 precursors are vehicular
traffic, which significantly emit the oxide of nitrogen
and CO. The increase in number of vehicles is
associated with higher concentrations of NO2 and CO,
which have also increased. Concentration of NO2 and
CO attains higher levels during winter season as they
get transported through northwesterly wind flow from
the polluted regions. Also in winter months, the
pollutants emitted from various anthropogenic and
natural sources, are trapped in the boundary layer due to frequent temperature inversions.
Tropospheric O3 is also produced from the NOx
catalyzed oxidation of various hydrocarbons24,25
.
Figure 2(b) shows the diurnal variation of NO2
averaged at both sites during winter months. The
average concentration of NO2 at SJC and Dayalbagh
were 41.7 ± 8.7 ppb and 26.4 ± 3.2 ppb, respectively
and the range was 5.0-187.4 ppb at SJC while
2.1-111.1 ppb at Dayalbagh. Figure 2(c) shows the
diurnal variation of CO at both the sampling sites
during the study period (November 2003-February
2005). At SJC average concentration of CO was
1088 ± 202.7 ppb and for Dayalbagh it was 332.5 ±
116 ppb while it varied in the range 269-1130 ppb.
To see the effects of NO2 and CO on O3 production
the concentrations of these gases at both sites were
compared (Fig. 3). The concentrations of O3, NO2 and
CO at Dayalbagh were in the ranges 11.8-37.5 ppb,
5.2-187.4 ppb and 147-324 ppb, respectively; while at
SJC these are 13.7-59.6 ppb, 13.7-49.1 ppb and
188-1358 ppb, respectively. The concentrations of
NO2 and CO are greater at SJC than at Dayalbagh,
probably because SJC is located near the main road,
which is a source of these precursor gases. Linear
regression lines are drawn to estimate the associations between O3 and NO2 concentrations at both sites.
The O3-NO2 correlation graph [Fig. 4(a)] depicts
that the regression (r = 0.50) at SJC, i.e. the efficiency
of O3 production per mol of NO2 was 50%, as this
area is polluted by commercial and heavily vehicles,
where CO is (the other dominant precursors of O3)
present in sufficient amount, which contributes in O3
Table 2 — O3 concentration (ppb) in different cities of India
compiled from literature data
Study area Month Average
concentration
± s.d.
Reference
November 51.4±10.9
December 46.9±13.8
January 40.2±12.6
Ahemdabad
February 34.2±15.9
Lal et al, 2000
[Ref. 19]
November 26.1±14.1
December 30.0±15.0
January 26.2±13.5
Gadanki
February 30.1±16.5
Naja et al, 2002
[Ref. 23]
November 48.8±7.7
December 44.4±9.0
January 46.2±9.5
Mt. Abu
February 46.7 ±10.9
Naja et al, 2003
[Ref. 20]
November 28.5± 4.2
December 31.1± 7.3
January 20.4± 7.4
Agra
February 24.5± 3.9
Present Study
[

INDIAN J RADIO & SPACE PHYS, APRIL 2008
126
production. Whereas, Fig. 4(b) suggests that at
Dayalbagh, the regression (r = 0.68) showing that the
efficiency of O3 production per mol of NO2 was 68%,
as this is a residential area dominated by agricultural
activities. Similarly, the O3-CO correlation graph
[Fig. 5(a)] shows regression (r = 0.75) at SJC,
indicating that the efficiency of O3 production per mol
of NO2 was 75%, as the concentration of CO usually
remain constant because of daily routine of traffic
(same routine is nearly followed by all the vehicles
due to specific timings for school, college and offices
in the morning and evening). At Dayalbagh,
regression (r = 0.50), illustrating that the efficiency of
O3 production per mol of NO2 was 50% at this site.
This correlation values are in an air mass where O3
production has just occurred.
Table 3 provides a comparison of correlation
coefficient and slope with the other observations
made in different sites of Asia. Slope between ozone
and CO provides the information on ozone production
per molecules of CO. Correlation between
concentrations of O3 and CO give ozone production
efficiency (slope 0.076), which is similar to those of
other studies over the Asian region. Lower ozone
production efficiency and lower correlations are
indications of incomplete photochemical processes
over the Asian region. It has been studied that
biomass burning and fossil fuel burning emissions
occur simultaneously over Asian region unlike North
America and Europe31
(Reiner et al, 2001) and carbon
to NOx emission ratio is much higher over Asia than
over North America32
(Lelieveld et al., 2001).
Calculated intercept and slope in O3 and CO at the
present site is 1.97 and 0.076, respectively, with
correlation coefficient of 0.40. Lower slope and
relatively lower correlation between ozone and CO
may be the indicators of incomplete photochemical
processes26
. The present results are consistent with the
studies made over the Asian region20,27,28
, which also
show lower values of slopes and intercept. This result
further supported the lower ozone production
efficiency, which earlier the present authors compared
with that of Ahmedabad, Mt. Abu and Gadanki.
Fig. 4 — Correlation of O3 and NO2 at (a) St.John’s College
(r = 0.50, p = 0.004, n = 40) and (b) Dayalbagh (r = 0.68,
p = 0.07, n = 40)
Fig. 3 — Diurnal Variation of O3, NO2 and CO at
(a) St. John’s College and (b) Dayalbagh

SAINI et al.: SURFACE O3, NO2 & CO DURING WINTER AT AGRA, INDIA
127
Table 4 shows the permissible limits of
concentration of O3, NO2 and CO. Present data of O3
and CO were compared with permissible limits of
respective species and found to be within the range.
So it is believed that there is no harmful effect of
Fig. 5 — Correlation of O3 and CO at (a) St. John’s College
(r = 0.75, p = 0.004, n = 40) and (b) Dayalbagh (r = 0.50,
p = 0.07, n = 40)
these gases in the climate of this region, but
concentration of NO2 is alarming and crossed the
permissible limits. This was further confirmed by the
earlier study, which calculates the exposure index of
O3, i.e. AOT 40. Calculated results suggested that the
present O3 exposures are lower than the critical level
of O3 and the present level of O3 does not pose
harmful impact on vegetation29
. Although the present
level of O3 exposures are lower than the critical level
of O3, immediate implementation of effective control
technologies for reducing emissions of O3 precursors
is suggested.
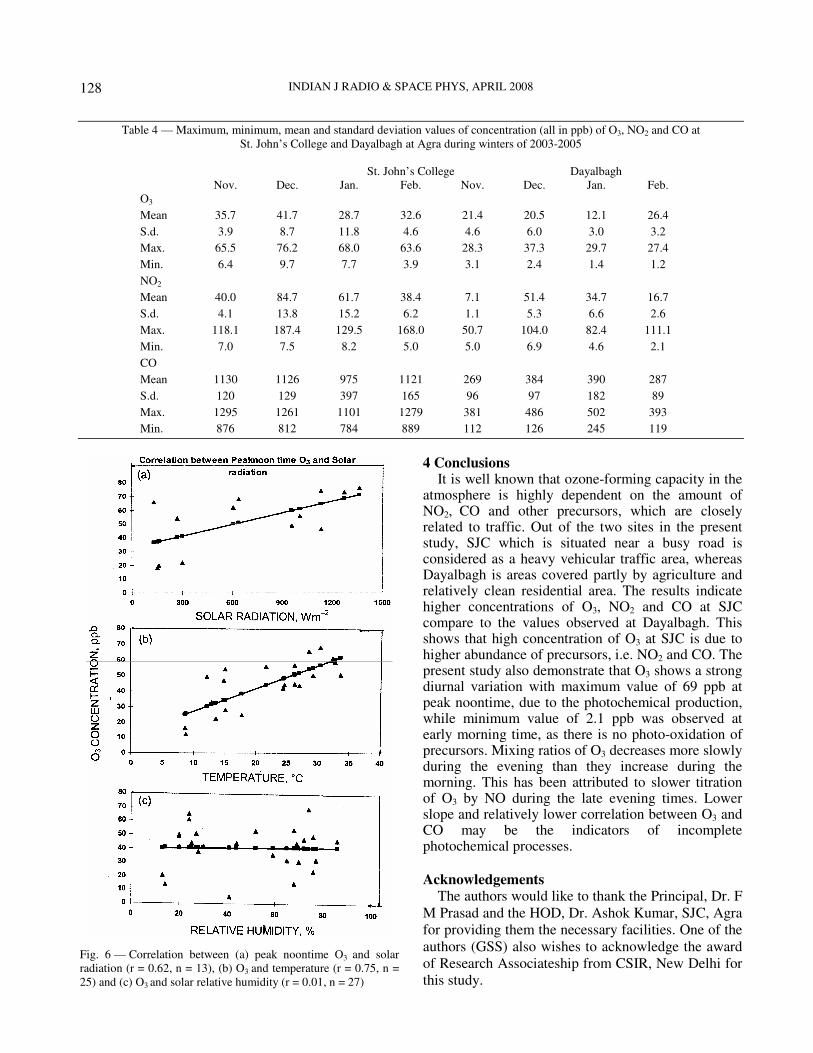
One of the primary factors influencing
photochemical formation is the intensity of solar
radiation. Other parameters that influence the
concentration of O3 are the temperature, humidity,
wind direction and wind speed and levels of
pollutants. Figure 6 shows the correlation between O3
with meteorological parameters. There is good
correlation of O3 with solar radiation and temperature
(r = 0.63; p = 0.01 and r = 0.75; p = 0.001), which is
followed by very poor correlation with relative
humidity (r = 0.01, p = 0.001). High concentrations of
O3 are therefore likely to occur with high temperature
and solar radiation and low relative humidity. The
effect of air transport has been examined by the wind
study of the winter season. The prevailing winds were
WNW and NNW. The levels of O3 were found to be
higher during winds from WNW and NNW. This is
supported by the fact that the major urban activity
centers are situated at NW direction of the sampling
sites. These units emit significant amount of NO2 and
other gases. Winds from WNN and WNW directions
probably transport air at the sampling sites. The
precursors produce O3 photo-chemically during the
transportation time.
Table 3 — Ozone and CO correlations details from different sites of world compiled from literature data
Site Ozone, ppb CO, ppb Slope Corr. Coeff. References
Sable Island 33.3 114 0.3 0.68 Chin et al. 30
Parrish et al. 26
Seal Island 38.9 129 0.31 0.74 Chin et al. .30
Parrish et al. 26
Cape Race 30.3 124 0.33 0.47 Chin et al.30
Parrish et al. 26
Bermuda 11-65 65-255 0.27 0.65 Dickerson et al. 31
Oki 29.2-55.0 105-248 0.006-0.23 0.18-0.66 Pochanart et al. 27
Mt Fuji 24.8-59.8 92.4-158.6 0.09-0.19 0.41-0.50 Tsutsumi & Matsueda28
Mt Abu 30.1 ± 12.8 154.6 ± 73.3 0.13 ± 0.01 0.52 Naja et al. 20
Agra 26.1 ± 5.7 710.2 ± 159.3 0.076 0.40 Present Study
INDIAN J RADIO & SPACE PHYS, APRIL 2008
128
Fig. 6 — Correlation between (a) peak noontime O3 and solar
radiation (r = 0.62, n = 13), (b) O3 and temperature (r = 0.75, n =
25) and (c) O3 and solar relative humidity (r = 0.01, n = 27)
4 Conclusions It is well known that ozone-forming capacity in the atmosphere is highly dependent on the amount of NO2, CO and other precursors, which are closely related to traffic. Out of the two sites in the present study, SJC which is situated near a busy road is considered as a heavy vehicular traffic area, whereas Dayalbagh is areas covered partly by agriculture and relatively clean residential area. The results indicate higher concentrations of O3, NO2 and CO at SJC compare to the values observed at Dayalbagh. This shows that high concentration of O3 at SJC is due to higher abundance of precursors, i.e. NO2 and CO. The present study also demonstrate that O3 shows a strong diurnal variation with maximum value of 69 ppb at peak noontime, due to the photochemical production, while minimum value of 2.1 ppb was observed at early morning time, as there is no photo-oxidation of precursors. Mixing ratios of O3 decreases more slowly during the evening than they increase during the morning. This has been attributed to slower titration of O3 by NO during the late evening times. Lower slope and relatively lower correlation between O3 and CO may be the indicators of incomplete photochemical processes.
Acknowledgements The authors would like to thank the Principal, Dr. F
M Prasad and the HOD, Dr. Ashok Kumar, SJC, Agra
for providing them the necessary facilities. One of the
authors (GSS) also wishes to acknowledge the award
of Research Associateship from CSIR, New Delhi for
this study.
Table 4 — Maximum, minimum, mean and standard deviation values of concentration (all in ppb) of O3, NO2 and CO at
St. John’s College and Dayalbagh at Agra during winters of 2003-2005
St. John’s College Dayalbagh
Nov. Dec. Jan. Feb. Nov. Dec. Jan. Feb.
O3
Mean 35.7 41.7 28.7 32.6 21.4 20.5 12.1 26.4
S.d. 3.9 8.7 11.8 4.6 4.6 6.0 3.0 3.2
Max. 65.5 76.2 68.0 63.6 28.3 37.3 29.7 27.4
Min. 6.4 9.7 7.7 3.9 3.1 2.4 1.4 1.2
NO2
Mean 40.0 84.7 61.7 38.4 7.1 51.4 34.7 16.7
S.d. 4.1 13.8 15.2 6.2 1.1 5.3 6.6 2.6
Max. 118.1 187.4 129.5 168.0 50.7 104.0 82.4 111.1
Min. 7.0 7.5 8.2 5.0 5.0 6.9 4.6 2.1
CO
Mean 1130 1126 975 1121 269 384 390 287
S.d. 120 129 397 165 96 97 182 89
Max. 1295 1261 1101 1279 381 486 502 393
Min. 876 812 784 889 112 126 245 119

SAINI et al.: SURFACE O3, NO2 & CO DURING WINTER AT AGRA, INDIA
129
References 1 Greenfelt P & Schjoldanger J, Photochemical oxidant in the
troposphere: a mountain menace, Ambio (Sweden), 13 (1984)
61.
2 Volz A & Kley D, Evalution of the Montsouris series of
ozone measurements made in nineteenth century, Nature
(UK), 332 (1988) 240.
3 Zhang L, Chen C & Murlis J, Study on winter air pollution
control in Lanzhou, China (MIT Press, UK), (2000) 351.
4 Davidson A, Update on ozone trend in California’s south
coast air basin, J Air Waste Manage Assoc (USA), 43 (1993)
226.
5 Wakamatsu S, Ohara T & Uno I, Recent trends in precursor
concentrations and oxidant distribution in the Tokyo and
Osaka areas, J Atmos Chem (Netherlands), 30 (1996) 715.
6 Lin X, Trainer M & Liu S C, On the non-linearity of the
tropospheric ozone production, J Geophys Res (USA), 93
(1988) 15879.
7 Mudgal R, Sharma B, Upadhyay R & Taneja A, Seasonal
variation of ambient air quality at selected sites in Agra city,
Indian J Radio Space Phys, 29 (2000) 127.
8 Curtzen P J, Detany A C, Greenberg J, Haagenson P, Heidt
L, Lueb R, Pollock W, Seiler W, Wartburg A, Zimmerman P,
Tropospheric chemical composition measurements in Brazil
during the dry season, J Atmos Chem (Netherlands), 2 (1985)
233.
9 Curtzen P J & Andreae M O, Biomass burning in the tropics:
impact on atmospheric chemistry and biogeochemical cycles,
Science (USA), 250 (1990) 1669.
10 Andreae M O, Soot carbon and excess fine potassium: long-
range transport of combustion-derived aerosols, Science
(USA), 220 (1983) 1148.
11 Kirchhoff V W J H & Nobre C A, Atmospheric chemistry
research in Brazil: Ozone measurements at Natal, Manaus
and Cuiaba, Rev Bras Geofis (Brazil), 24 (1986) 95.
12 Reichle H G, Connors V S, Holland J A, Hypes W D, Wallio
H A, Casas J C, Gomsen B B, Saylor M S & Hesketh W D,
Middle and upper Tropospheric carbon monoxide mixing
ratios as measured by a satellite borne remote sensor during
November 1981, J Geophys Res (USA), 91 (1986) 10865.
13 Fishman J, Watson C E, Larsen J C & Logan J A,
Distribution of tropospheric ozone determined from satellite
data, J Geophys Res (USA), 95 (1990) 3399.
14 Novelli P C, Masarie K A & Lang P M, Distributions and
recent changes of carbon monoxide in the lower troposphere,
J Geophys Res (USA), 103 (1998) 19015.
15 Alvala P C & Kirchhoff V W J H, Observations of
atmospheric methane and monoxide in Brazil: SCAR B
mission, J Geophys Res (USA), 103 (1998) 32101.
16 Pochanart P, Akimoto H, Kinjo Y & Tanimoto H, Surface
ozone at four remote sites and the preliminary assessment of
the exceedences of its critical level in Japan, J Atmos Chem
(Netherlands), 36 (2002) 4235.
17 Lefohn A S, Jackson W, Shadwick D S & Knudesen H P,
Effect of surface ozone exposure on vegetation grown in the
southern Appalachian mountains; identification of possible
areas of concern, Atmos Environ (UK), 11 (1997) 1695.
18 Mauzerall D L & Wang X, Protecting agricultural crops from
the effects of tropospheric ozone exposure: reconciling
science and standard setting in the United States, Europe and
Asia, Ann Rev Energy Environ (Japan), 26 (2001) 237.
19 Debaje S B, Jeyakumar S J, Ganeshan K, Jadhav D B &
Seetaramayya, Surface ozone measurements at tropical rural
coastal station Tranquebar, India, Atmos Environ (UK), 37
(2003) 4911.
20 Lal S, Naja M & Subbaraya B H, Seasonal variations in
surface ozone and its precursors over an urban site in India,
Atmos Environ (UK), 34 (2000) 713.
21 Naja M, Lal S & Chand D, Diurnal and seasonal variabilities
in surface ozone at a high altitude site Mt. Abu (24.6°N,
72.7°E, 1680 m asl) in India, Atmos Environ (UK), 37 (2003)
4205.
22 Satsangi G S, Lakhani A, Kulshrestha P R & Taneja A,
Seasonal and diurnal variation of surface ozone and a
preliminary analysis of exceedence of its critical levels at a
semi-arid site in India, J Atmos Chem (Netherlands), 47
(2004) 271.
23 National Environmental Engineering Research Institute
(NEERI) Nagpur, Ministry of Environment & Forest, New
Delhi, 1993.
24 Harrison R M, Secondary Pollutants in Handbook of Air
Pollution Analysis, edited by R M Harrison and R Perry
(Chapman and Hall, New York, USA), 1986.
25 Ahammed Y N, Reddy R R, Gopal K R, Narasimhulu K,
Basha D B, Reddy L S S & Rao T V R, Seasonal variation of
surface O3 and its precursor gases during 2001-2003,
measured at Anantapur (14.62°N), a semi-arid site in India,
Atmos Res (Netherlands), 80 (2006) 151.
26 Kirchhoff V W J H & Rasmussen R A, Time variations of
CO and O3 concentrations in a region subject to biomass
burning, J Geophys Res (USA), 95 (1990) 7521.
27 Naja M & Lal S, Surface ozone and precursor gases at
Gadanki (13.5°N, 79.2°E), a tropical rural site in India, J
Geophys Res (USA), 107 (2002) 8.
28 Pitts Finlayson B J & Pitts J N, Atmospheric Chemistry:
Fundamentals and Experimental Techniques, (John Wiley,
New York), 1998.
29 Rowland F S, Stratospheric ozone depletion by
chlorofluorocarbons, Ambio (Sweden), 19 (1990) 281.
30 Cahoon Jr., D R, Stockes B J, Levines J S, Cofer III W R &
O’Neill K P, Seasonal distribution of African savannah fires,
Nature (UK), 359 (1992) 812.
31 Reiner T, Sprung D, Jost C, Andreae M O & Shetter R E,
Chemical characterization of pollution layers over the
tropical Indian ocean: signature of emission from biomass
and fossil fuel burning, J Geophys Res (USA), 106 (2001)
28497.
32 Lelieveld J, The Indian ocean experiment: widespread air
pollution from South and Southeast Asia, Science (USA), 291
(2001) 1031.
33 Parrish D D, Trainer M, Williams, E. J., Fahey, D.W.,
Hubler, G., Liu, S.C. and Fehsenfeld F C, Measurements of
the NOx-O3 photostationary state at Niiwot Ridge, Colorado,
J Geophys Res (USA), 91 (1986) 5361.
34 Pochanart P, Hirokawa J, Kajii Y, Akimoto H & Nakao M,
The influence of regional scale anthropogenic activity in
Northeast Asia on seasonal variations of surface ozone and
carbon monoxide observed at Oki, Japan, J Geophys Res
(USA), 104 (1999) 3621.
35 Tsutsumi Y & Matsueda H, Relationship of ozone and CO at
the summit of Mt. Fuji (35.35°N, 138.73°E, 3776m above
sea level) in summer 1997, Atmos Environ (UK), 34 (2000)
553.

INDIAN J RADIO & SPACE PHYS, APRIL 2008
130
36 Chin M, Jacob D J, Munger L W, Parrish D D & Doddridge
B G, Relationship of ozone and carbon monoxide over North
America, J Geophys Res (USA), 99 (1994) 14565.
37 Dickerson R R, Doddridge B G, Kelley P & Rhoads K O,
Large-scale pollution of the atmosphere over the remote
Atlantic ocean: evidence from Bermuda, J Geophys Res
(USA), 100 (1995) 8945.
38 WHO air quality guidelines 2005 (http://www.euro.who.int/
document/E87950.pdf).
39 WBACPCB (World Bank Aided Central Pollution Control
Board), Sponsored Training Course on Air Pollution
Meteorology and Air Quality Modeling June 9-13, IIT
Kanpur, India, 2003.
40 Lawrence A J, Masih A & Taneja A, Indoor/outdoor
relationships of CO and oxides of nitrogen in domestic
homes with roadside, urban and rural location in central
Indian region, Indoor Air (Denmark), 15 (2004) 76.