Sweden's Integrated National Energy and Climate Plan
199
1 (199) 16.1.2020 Two annexes The Ministry of Infrastructure Sweden’s Integrated National Energy and Climate Plan Reporting under Regulation (EU) 2018/1999 of the European Parliament and of the Council of 11 December 2018 on the Governance of the Energy Union and Climate Action, amending Regulations (EC) No 663/2009 and (EC) No 715/2009 of the European Parliament and of the Council, Directives 94/22/EC, 98/70/EC, 2009/31/EC, 2009/73/EC, 2010/31/EU, 2012/27/EU and 2013/30/EU of the European Parliament and of the Council, Council Directives 2009/119/EC and (EU) 2015/652 and repealing Regulation (EU) No 525/2013 of the European Parliament and of the Council.
-
Upload
khangminh22 -
Category
Documents
-
view
1 -
download
0
Transcript of Sweden's Integrated National Energy and Climate Plan

1 (199)
16.1.2020
Two annexes
The Ministry of Infrastructure
Sweden’s Integrated National Energy and Climate Plan
Reporting under Regulation (EU) 2018/1999 of the European Parliament
and of the Council of 11 December 2018 on the Governance of the Energy
Union and Climate Action, amending Regulations (EC) No 663/2009 and
(EC) No 715/2009 of the European Parliament and of the Council,
Directives 94/22/EC, 98/70/EC, 2009/31/EC, 2009/73/EC,
2010/31/EU, 2012/27/EU and 2013/30/EU of the European Parliament
and of the Council, Council Directives 2009/119/EC and (EU) 2015/652
and repealing Regulation (EU) No 525/2013 of the European Parliament
and of the Council.

2 (199)
Table of contents
1. OVERVIEW AND PROCESS FOR ESTABLISHING THE PLAN .................................................................................................. 4
1.1 Executive summary .......................................................................................... 4 1.2 Overview of the current policy situation ....................................................... 6 1.3 Consultations and involvement of national and Union entities and their outcome ................................................................................................. 10
1.4 Regional cooperation in preparing the plan ................................................ 15
2. NATIONAL OBJECTIVES AND TARGETS .................................. 16
2.1 Dimension decarbonisation........................................................................... 16
2.2 Dimension energy efficiency ......................................................................... 26 2.3 Dimension energy security ............................................................................ 31 2.4 Dimension internal energy market ............................................................... 35 2.5 Dimension research, innovation and competitiveness .............................. 43
3. POLICIES AND MEASURES ........................................................ 45
3.1 Dimension decarbonisation........................................................................... 45
3.2 Dimension energy efficiency ......................................................................... 84 3.3 Dimension energy security .......................................................................... 113 3.4 Dimension internal energy market ............................................................. 118 3.5 Dimension research, innovation and competitiveness ............................ 125
4. Current situation and projections with existing policies and measures ........................................................................................ 134
4.1 Projected evolution of main exogenous factors influencing energy system and GHG emission developments .......................................... 134
4.2 Dimension decarbonisation......................................................................... 141 4.3 Dimension energy efficiency ....................................................................... 157 4.4 Dimension energy security .......................................................................... 161 4.5 Dimension internal energy market ............................................................. 166 4.6 Dimension research, innovation and competitiveness ............................ 176
5. IMPACT ASSESSMENT OF PLANNED POLICIES AND MEASURES .................................................................................... 187
5.1 Impacts of planned policies and measures described in Section 3 on energy system and GHG emissions and removals, including comparison to projections with existing policies and measures (as described in Section 4) ........................................................................................ 187
5.2 Macroeconomic and, to the extent feasible, the health, environmental, education, skills and social impacts, including just transition aspects (in terms of costs and benefits as well as cost-effectiveness) of the planned policies andmeasures described in Section 3 at least until the last year of the period covered by the plan, including comparison to projections with existing policies and measures. .............................................................................................................. 191
5.3 Overview of investment needs ................................................................... 194 5.4 Impacts of planned policies and measures described in Section 3 on other Member States and regional cooperation at least until the last year of the period covered by the plan, including comparison to

3 (199)
projections with existing policies and measures ............................................. 199
Annex 1 - Summary of the national consultation
document for Sweden’s Integrated National Energy and
Climate Plan
Annex 2 - Calculation of annual and cumulative energy
savings in accordance with Article 7, 7(a) and 7(b) of the
Energy Efficiency Directive

4 (199)
1. OVERVIEW AND PROCESS FOR ESTABLISHING
THE PLAN
1.1 Executive summary
1.1.1 Political, economic, environmental, and social
context of the plan
In December 2015, the European Commission presented its communication
on an Energy Union1 for Europe. In practice the Energy Union involves the
revision of all European energy and climate legislation. In November, the
Commission presented Clean Energy for all Europeans2, a package of measures
to keep the EU competitive as the clean energy transition changes global
energy markets. The package included legislative proposals for energy
efficiency, renewable energy, electricity market design, security of electricity
supply and rules for the governance of the Energy Union. The Governance
Regulation3 came into force on 24 December 2018. The Regulation states
that, by 31 December 2019, and subsequently by 1 January 2029 and every
ten years thereafter, each Member State must notify to the Commission an
integrated national energy and climate plan, containing the elements set out
in the Regulation. This document contains Sweden’s Integrated National
Energy and Climate Plan in accordance with the Governance Regulation and
is structured according to the general framework set out in Annex I to the
Regulation.
The Integrated Energy and Climate Plan elaborates on Sweden’s existing
energy and climate goals, policies and measures and on the associated
scenarios. It is based primarily on the Climate Policy Framework, energy
policy and the targets drawn from the Energy Policy Framework Agreement
(see Section 1.3).
The long-term energy and climate targets and objectives described in the
plan establish long-term conditions for the business community and society
as a whole.
1.1.2 Strategy for the five dimensions of the Energy Union
Overall, Swedish energy and climate policy is compatible with the ambitions
of the Energy Union’s five dimensions. It is based on the same three pillars
as energy cooperation in the EU and aims to combine ecological
sustainability, competitiveness and security of supply. The energy policy
must therefore create the conditions for effective and sustainable energy use 1 COM/2015/080 final. 2 IP/16/4009. 3 Regulation 2018/1999 (EU) of the European Parliament and of the Council of 11 December 2018 on the Governance of the Energy Union and
Climate Action, amending Regulations (EC) No 663/2009 and (EC) No 715/2009 of the European Parliament and of the Council, Directives 94/22/EC, 98/70/EC, 2009/31/EC, 2009/73/EC, 2010/31/EU, 2012/27/EU and 2013/30/EU of the European Parliament and of the Council, Council Directives 2009/119/EC and (EU) 2015/652 and repealing Regulation (EU) No 525/2013 of the European Parliament and of the Council.
5 (199)
and a cost-effective energy supply in Sweden, while minimising the damage
to health, the environment and climate and facilitating the transition to a
sustainable society. Sweden must lead the way on environmental and climate
issues and become the world’s first fossil fuel-free welfare state. Sweden
aims to cut its net greenhouse gas emissions to zero by 2045, and reduce the
emissions from activities on Swedish territory to 15% of their 1990 levels.
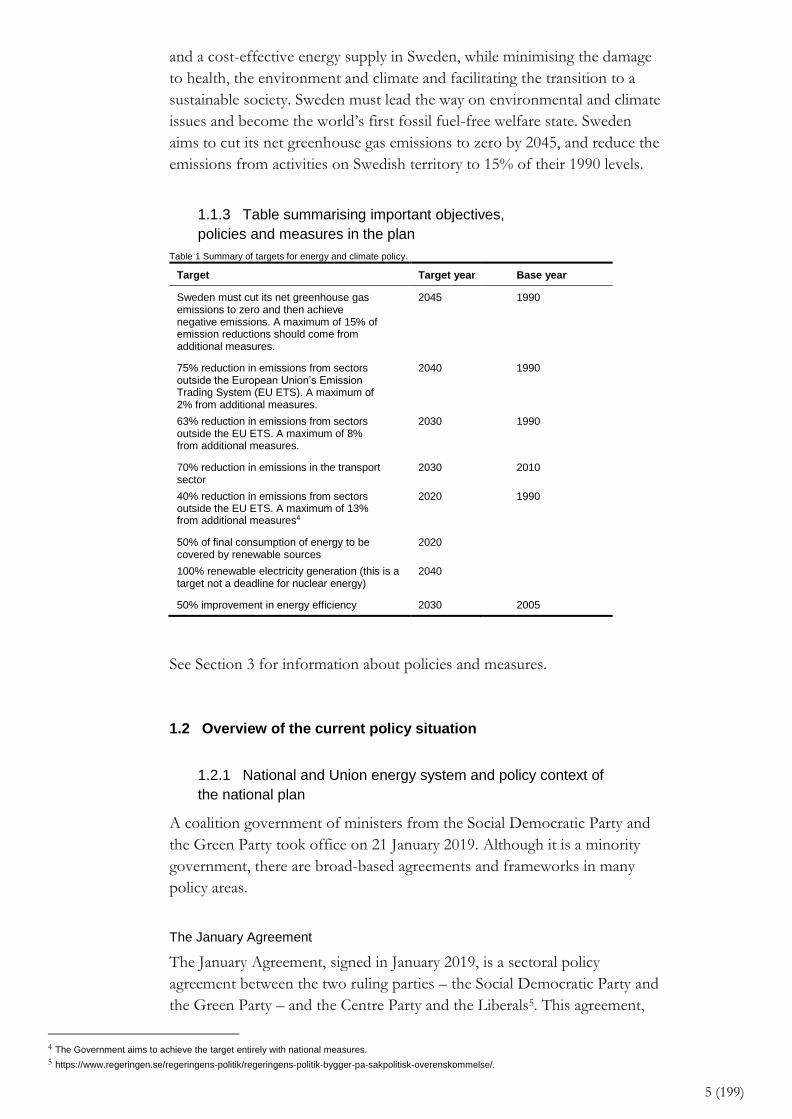
1.1.3 Table summarising important objectives,
policies and measures in the plan
Table 1 Summary of targets for energy and climate policy.
Target Target year Base year
Sweden must cut its net greenhouse gas emissions to zero and then achieve negative emissions. A maximum of 15% of emission reductions should come from additional measures.
2045 1990
75% reduction in emissions from sectors outside the European Union’s Emission Trading System (EU ETS). A maximum of 2% from additional measures.
2040 1990
63% reduction in emissions from sectors outside the EU ETS. A maximum of 8% from additional measures.
2030 1990
70% reduction in emissions in the transport sector
2030 2010
40% reduction in emissions from sectors outside the EU ETS. A maximum of 13% from additional measures4
2020 1990
50% of final consumption of energy to be covered by renewable sources
2020
100% renewable electricity generation (this is a target not a deadline for nuclear energy)
2040
50% improvement in energy efficiency 2030 2005
See Section 3 for information about policies and measures.
1.2 Overview of the current policy situation
1.2.1 National and Union energy system and policy context of
the national plan
A coalition government of ministers from the Social Democratic Party and
the Green Party took office on 21 January 2019. Although it is a minority
government, there are broad-based agreements and frameworks in many
policy areas.
The January Agreement
The January Agreement, signed in January 2019, is a sectoral policy
agreement between the two ruling parties – the Social Democratic Party and
the Green Party – and the Centre Party and the Liberals5. This agreement,
4 The Government aims to achieve the target entirely with national measures. 5 https://www.regeringen.se/regeringens-politik/regeringens-politik-bygger-pa-sakpolitisk-overenskommelse/.

6 (199)
which consists of 73 points in a number of areas, forms the basis for some
of the Government's policies. Point 30 of the agreement states that the
Government must pursue an active climate policy which upholds the
Climate Policy Framework.
Sweden's Climate Policy Framework
The Riksdag adopted a climate policy framework for Sweden in June 201766.
The Framework was adopted with a broad majority and comprises national
climate targets, a climate act and a climate policy council. The Climate Policy
Framework provides order and stability for climate policy and establishes
long-term conditions for the business community and society as a whole. It
is a key component of Sweden’s efforts to comply with the Paris Agreement.
See Section 2.1.1 for details of Sweden’s national climate targets.
The Climate Act
The Climate Act (2017:720) regulates the Government's climate policy; it
sets out the aims of the policy and specifies how it should be conducted.
The Act states that the Government’s climate policy must be based on the
long-term emission targets set by the Riksdag and must create conditions
which allow the climate policy and budget policy targets to work together.
The Act also determines when and how the Government should monitor
climate policy and report planned measures to the Riksdag.
It must present a climate statement to the Riksdag every year in the draft
budget and present a climate policy action plan the year after an ordinary
general election.
The Climate Policy Council
As part of the Climate Policy Framework, the Government has set up the
Climate Policy Council; the members of the council are experts on climate,
climate policy, economics, social sciences and behavioural science. The
Council is tasked with assessing whether the Government’s overall policy is
compatible with its, and the Riksdag’s, climate targets.
The Energy Agreement
In March 2015, the Government decided to set up a parliamentary
commission to oversee energy policy7. Under the directive, the Energy
Commission was tasked with preparing the ground for a broad agreement8
on energy policy, with a particular focus on electricity supply after 2025–
2030. Five political parties (representing a majority in the Riksdag) came to
an agreement on 10 June 2016. These were the Social Democrats, the
6 Government bill 2016/17:146 Report 2016/17:MJU24, Riksdag communication 2016/17:320. 7 Directive 2015:25. 8 https://www.regeringen.se/artiklar/2016/06/overenskommelse-om-den-svenska-energipolitiken/.

7 (199)
Moderates, the Green Party, the Centre Party and the Christian Democrats.
The Riksdag adopted energy policy targets based on the Energy Agreement.
Sweden’s energy policy is based on the same three pillars as energy
cooperation in the EU; it therefore aims to combine sustainability, security
of supply and competitiveness. The policy aims to combine security of
supply, competitiveness and sustainability. The energy policy must therefore
create the conditions for effective and sustainable energy use and a cost-
effective energy supply in Sweden, while minimising the damage to health,
the environment and climate and facilitating the transition to a sustainable
society. The Riksdag has set the following targets as a result of the Energy
Agreement.9:
• The 2040 target is 100% of electricity generated from
renewable sources. This is a target, not a deadline for banning
nuclear energy; nor is it a policy decision to stop generating
nuclear energy.
• Consumption of energy in Sweden must be 50% more
efficient in 2030 than it was in 2005. This target is expressed as
energy supplied in relation to gross domestic product (GDP).
Progress on the Energy Agreement is monitored by regular reviews. The
reviews must contain conclusions and suggestions for the evolution of the
electricity market and the monitoring of energy policy targets. The first
review report was submitted to the Riksdag in June 201910.
On 10 December 2019, the Moderates and the Christian Democrats
announced that they are abandoning the agreement.
1.2.2 Current energy and climate policies and measures
relating to the five dimensions of the Energy Union
See Section 3 for information about policies and measures.
1.2.3 Key issues of cross-border relevance
Sweden is part of the well-integrated and interconnected Nordic electricity
market and is involved in matters related to further market integration A
properly functioning, integrated cross-border energy market is extremely
important.
1.2.4 Administrative structure of implementing national
energy and climate policies
The role of the agencies
Each department is responsible for a number of Government agencies
9 Government bill 2017/18:228, Report 2017/18:NU22, Riksdag communication 2017/18:411. 10 Government communication 2018/19:153 Första kontrollstationen för energiöverenskommelsen.

8 (199)
which have to apply the laws and carry out the activities decided on by the
Government and the Riksdag. The following agencies are mainly responsible
for energy and climate matters11:
The Swedish Energy Agency works in various sectors of society to promote
effective and sustainable energy consumption and to make the supply of
energy in Sweden cost-effective.
The Swedish Environmental Protection Agency plays a key role in
environmental work, driving, supporting and coordinating environmental
policy.
It works towards meeting the Riksdag’s environmental generation and
quality targets and proposes measures for environmental work as required.
The Swedish Energy Markets Inspectorate supervises the electricity, natural
gas and district heating markets.
The Swedish National Grid manages Sweden's national electricity network.
It is also the system operator for electricity supply in Sweden, which involves
balancing the system in the short term and ensuring that system installations
work together reliably.
The Swedish Meteorological and Hydrological Institute (SMHI) provides
supporting information for weather and water-related plans and decisions. It
is the expert body for meteorology, hydrology, oceanography and
climatology and a resource for environmental work.
The National Board of Housing, Building and Planning is the central agency
for the built environment, land and water management, town and country
planning, building and building management and finance for housing.
Formas (the Swedish research council for the environment, agricultural
science and spatial planning) provides assistance and information about
research in its field. It promotes sustainable growth and development.
County councils – Sweden is divided into 21 counties all of which have a
county council led by a governor. The county council is a public
coordinating authority, a service authority and an appeal body and has
11 The descriptions of the agencies’ activities have been taken from the Government’s website unless otherwise specified: www.regeringen.se.

9 (199)
supervisory responsibility. The county councils are guarantors for the
implementation of the Government's national goals and play an important
part in drafting national energy and climate plans and allocating state aid for
energy and climate purposes.
Many other agencies also play a large part in implementing energy and
climate policy.
The role of municipalities and regions
Municipalities and regions are important for Sweden's climate work. Their
closeness to the population, their role in town and country planning and the
fact that they are major employers make them important operators in the
work to meet climate targets. The municipalities work with companies,
organisations, residents and other operators to drive local developments,
thus helping to meet national and local targets. Many local initiatives are
contributing towards the effort to meet Sweden’s national climate targets.
The primary aim of the regional energy management agencies is to promote
energy efficiency and renewable energy sources locally and regionally. They
work with public and private operators on assignments and projects based
on international and national energy and environment goals. Since they are
not allowed to compete with private companies, they operate as
independent, not-for-profit energy organisations. There are around 360
energy management agencies in Europe. The 15 agencies in Sweden have
played an important part in the EU’s energy policy since the 1990s.
1.3 Consultations and involvement of national and Union
entities and their outcome
1.3.1 Involvement of the national parliament
Sweden’s integrated energy and climate plan is based on goals and policies
adopted by the Riksdag. On 14 November 2019, the Riksdag’s Trade
Committee held a consultation on guiding principles before Sweden's
national energy and climate plan was finalised. It also held a consultation on
the Commission’s specific recommendations for Sweden's draft energy and
climate plan on 17 December 2019.
1.3.2 Involvement of local and regional authorities
The Swedish Energy Agency and other relevant agencies started the
preparatory work for the National Integrated Energy and Climate Plan in
Spring 2019. An information meeting was held on 29 August 2019 for a
wide range of operators, including the municipalities and regions. The
meeting explained the process and the type of information the plan would
contain. A written consultation on the Swedish Energy Agency’s proposals

10 (199)
for the energy and climate plan was held on 1 September 2019,
in which the municipalities and regional operators expressed their opinions
and provided input for the plan.
See Section 1.3.3 for more information about these consultations.
1.3.3 Consultations of stakeholders, including the social
partners, and engagement of civil society and the general
public
The political goals and policies described in this plan have been through the
usual consultation process, which gives stakeholders and the general public
the opportunity to express their views. The memorandum Responding to the
Consultation – How and Why12 issued by the Coordination Department of the
Swedish Government Offices describes how and why the consultations are
sent out and the mechanism for dealing with them in the subsequent stages
of the procedure.
Much of the Integrated Energy and Climate Plan is based on the targets and
goals developed as a result of the Energy Commission's work and the work
on the Climate Policy Framework described in Section 1.2. The
consultations held during this work are described separately below.
Consultation on the preparatory documents for the Integrated Energy and Climate Plan
The preparatory documents for the draft energy and climate plan were sent
to 30 operators for consultation in spring 2018. Ten responses were
received, mainly from trade associations. The views were taken into account
in the draft, which was reported on 17 January 201913. One of the views
expressed was that Sweden’s Integrated Energy and Climate Plan should be
written in Swedish to make it more accessible to the general public; this was
taken into account in the work on this plan.
Work began on the final energy and climate plan in spring 2019. An
information meeting about the plan for a wide range of operators was held
on 29 August 2019. Around 80 operators (trade associations, agencies,
research institutes, universities, municipalities, regions and environmental
organisations) were invited. The meeting explained the process for the
energy and climate plan and the type of information the plan would contain.
Sweden's contribution to the EU’s renewable energy goals for 2030 and the
proposals currently in the plan were also discussed.
12 SB PM 2003:2. 13 https://www.regeringen.se/rapporter/2019/01/sveriges-utkast-pa-integrerad-nationell-energi--och- klimatplan/.

11 (199)
A written consultation on the Swedish Energy Agency’s proposals for the
energy and climate plan was held on 1 September 2019. The Government
has commissioned The Swedish Energy Agency to produce a proposal for
the plan. However the proposal does not contain all of the parts of the
template set out in the Governance Regulation. The parts related to ongoing
work to implement the revised Energy Efficiency Directive and the Energy
Performance of Buildings Directive are missing. The written consultations
produced 36 responses containing views and comments on the plan.
Detailed views have been incorporated into the plan. A summary of the
views expressed is given in Annex 1.
Consultation on the Climate Policy Framework
The Government assigned the Environmental Objectives Committee, a
cross-party policy committee, the task of developing the proposal for the
Climate Policy Framework, along with a long-term goal for 2045. The
Committee also prepared a proposal for a long-term climate and air
pollution control strategy, including intermediate targets for 2030 and 2040.
The Environmental Objectives Committee was composed of representatives
from seven of the eight parties in the Riksdag and a chair. It was assisted by
30 experts, who represented various categories of operator: agencies,
representatives from industry, researchers, environmental organisations and
trade unions. These experts were involved in some of the monthly meetings
held by the Committee during this project, participating in discussions and
contributing their expertise Key questions discussed were the level of
ambition and the timing of the long-term goals. The research representatives
and environmental organisations stressed that it was important to achieve
net-zero within a short time frame to be in line with the IPCC’s14
conclusions. They also responded to assumptions about the potential of
measures in the scenarios included in the preparatory documents for the
intermediate targets for 2030 and 2040.
To explore the opportunities and challenges involved in reducing emissions
and to discuss policy, ten seminars were held during the project for a
broader range of experts and operators to examine how to implement the
transition in various sectors of society. Separate round table discussions on
possible measures and policies were also held with representatives from
various sectors of industry (base materials, the bioeconomy and agriculture)
and the academic world.
When the Committee had prepared its report, the proposal for a climate
policy framework and a long-term goal for 2045 was sent for consultation to
14 IPCC = Intergovernmental Panel on Climate Change.

12 (199)
around 200 stakeholders who were given three months to consider it15.
Similar consultations were held for the long-term climate and air pollution
control strategy16. The stakeholders selected represented all types of
operator: voluntary organisations (NGOs), trade associations, think tanks,
universities and colleges, authorities etc. The consultations showed that
stakeholders broadly supported the climate policy framework and climate
goals.
The Energy Commission
The Energy Commission arranged six major seminars in its areas of focus:
consumption, supply, transmission and the market. Representatives from
trade associations, trade unions, research institutes, environmental
organisations, industry, departments and agencies were invited to the
seminars along with many experts from Sweden and abroad. The seminars
were open to the public, broadcast over the internet and documented on the
Energy Commission’s website17, which also publishes the latest information
about the Commission’s work. The Commission also held two seminars for
experts, one on the electricity and heating markets and one on energy
storage facilities in cooperation with the Swedish Smartgrid Forum18. It also
organised a round table discussion on the design of the future electricity
market with Swedenergy. During Politician's Week in Almedalen in July
2016, the Energy Commission also arranged a seminar on the framework
agreements concluded in June 2016.
During the course of this work, the Energy Commission held 14 ordinary
meetings to which the Directors General of the Swedish National Grid, the
Swedish Energy Markets Inspectorate and the Swedish Energy Authority
were invited. These meetings were held in conjunction with external parties
– The Confederation of Swedish Enterprise, Swedenergy, the Swedish
Association of Local Authorities and County Councils (now the Swedish
Association of Local Authorities and Regions) and the Swedish Society for
Nature Conservation – to gain a deeper understanding of the views of the
various operators19.
1.3.4 Consultations of other Member States
A draft of Sweden's Integrated National Energy and Climate Plan was sent
to Denmark, Finland and Norway for comment. There were no comments
on the draft.
1.3.5 Iterative process with the Commission
15 https://www.regeringen.se/remisser/2016/03/remiss-av-delbetankande-fran-miljomalsberedningen-med- forslag-om-ett-klimatpolitiskt-ramverk-inklusive-langsiktigt-
klimatmal/. 16 https://www.regeringen.se/remisser/2016/06/remiss-av-delbetankande-fran-miljomalsberedningen-med- forslag-om-en-klimat--och-luftvardsstrategi-for-sverige/. 17 www.energikommissionen.se. 18 Described in Section 2.4.3 and 3.4.3. 19 The Energy Commission’s Report Kraftsamling för framtidens energi (SOU 2017:2).

13 (199)
Sweden took part in the meetings held with the technical working group set
up by the European Commission to assist Member States with the
development of their integrated energy and climate plans. To start the
iterative process with the Commission, Sweden uploaded an early draft of
the Integrated National Energy and Climate Plan to the technical
cooperation platform set up for the technical working group in June 2018.
This early draft was discussed informally with the Commission during
autumn 2018. Sweden formally reported its draft Integrated Energy and
Climate Plan on 17 January 201920.
The Commission assessed the draft plans of all Member States and, on 18
June 2019, issued recommendations for each of the plans along with a
general assessment of whether they are ambitious enough to meet the
common EU goals. The specific recommendations for Sweden21 were taken
into account for the work on this Integrated Energy and Climate Plan and
for the aim to implement it as far as possible within the framework of
established targets and policies.
1.4 Regional cooperation in preparing the plan
1.4.1 Elements subject to joint or coordinated planning with
other Member States
Cooperation, coordination and dialogue between the Nordic countries is
conducted through the Nordic Council of Ministers. An ad-hoc network
group has been set up within this cooperative framework to coordinate the
national energy and climate plans in the Nordic region. The ad-hoc group
has met to discuss matters of common interest and to share knowledge. It
has also held discussions with Nordic Energy Research (NER) about ways
of using its analytical work for the preparation of the integrated energy and
climate plans of the Nordic countries.
The ad-hoc group was formed in 2018 to encourage the Nordic countries to
cooperate on the preparation of their national integrated energy and climate
plans. The first meeting was held in Stockholm in May 2018.
Sweden is a member of the North Seas Energy Cooperation (NSEC), a
forum for regional cooperation founded in 2016. Ten countries and the
European Commission belong to the NSEC. The member countries, besides
Sweden are: Belgium, Denmark, France, Germany, Ireland, Luxembourg,
the Netherlands, Norway and the United Kingdom. Cooperation is
voluntary; one of the aims is to produce joint strategies for cost-effective
20 https://www.regeringen.se/rapporter/2019/01/sveriges-utkast-pa-integrerad-nationell-energi--och-klimatplan/. 21 C (2019) 4427 final.

14 (199)
expansion of renewable energy, in particular offshore wind power in the
North Sea region.
The work on the integrated energy and climate plans has also been discussed
within the regional cooperation on the Baltic Energy Market
Interconnection Plan (BEMIP).
1.4.2 Explanation of how regional cooperation is considered in the plan
The Nordic cooperation on energy and climate matters has benefited the
work on many parts of the plan. The interconnected nature of the Nordic
energy market is reflected in the scenarios used in this plan.
The analytical work of Nordic Energy Research was considered particularly
in Section 5.
2. NATIONAL OBJECTIVES AND TARGETS
2.1 Dimension decarbonisation
2.1.1 GHG emissions and removals
2.1.1.1 The elements set out in point (a)(1) of Article 4
With respect to greenhouse gas emissions and removals and with a
view to contributing to the achievement of the economy wide Union
greenhouse gas emission reduction target:
The Member State's binding national target for greenhouse gas
emissions and the annual binding national limits pursuant to
Regulation (EU) 2018/842.
For the emission sectors22 which do not belong to the EU’s scheme for
emission allowance trading. For the (EU ETS) or LULUCF23 sector, each
member country has a national target under the EU’s Effort Sharing
Decision/non-traded sector (ESD24/ESR25). Sweden's contribution to effort
sharing is to reduce its emissions to 20% of their 2005 levels by 2030.
The Swedish national intermediate target for 2030 is to reduce emissions
from the non-EU ETS or LULUCF sectors by 63% compared to their 1990 22 Examples of sectors that do not belong to the EU ETS or LULUCF are heating of homes and commercial premises, agriculture and national transport (excluding
national flights). 23 LULUCF stands for Land Use, Land-Use Change and Forestry . In this sector, carbon storage changes are reported for each soil type and for harvested wood
products. https://www.naturvardsverket.se/Sa-mar-miljon/Statistik-A-O/Vaxthusgaser-utslapp- och-upptag-fran-markanvandning/. 24 Decision No 406/2009/EC of the European Parliament and of the Council of 23 April 2009 on the effort of Member States to reduce their greenhouse gas emissions to
meet the Community’s greenhouse gas emission reduction commitments up to 2020. 25 Regulation (EU) 2018/842 of the European Parliament and of the Council of 30 May 2018 on binding annual greenhouse gas emission reductions by Member States
from 2021 to 2030 contributing to climate action to meet commitments under the Paris Agreement and amending Regulation (EU) No 525/2013.

15 (199)
levels, equivalent to a 59% reduction of their 2005 levels. Sweden has
Annual Emissions Allocations and intends to continue to cancel any scope
for emissions created by overachievement of its target under the EU’s Effort
Sharing Decision. This is to ensure that the emission reductions achieved in
Sweden cannot be used by other EU Member States and that the EU’s total
emission margin is reduced by the amount by which Sweden has
overachieved its target. The Riksdag makes decisions on cancellation every
year.
Sweden's annual emission path for 2021-2030 will be determined once the
implementing act is clear at EU level.
Member State's commitments pursuant to Regulation (EU) 2018/841
Under the LULUCF Regulation26 (period 2021–2030) each Member State
undertakes to ensure that the removals and emissions from the LULUCF
sector do not exceed those permitted under the Regulation’s accounting
rules. The Regulation aims to provide an incentive for additional actions
within the LULUCF sector; it is up to the Member States to choose
appropriate actions.
Sweden's 2021-2025 reference levels for its LULUCF forestry accounts have
not yet been determined. At the beginning of 2020 the European
Commission will determine the reference level for the accounts of Sweden's
actions and their outcome. For other types of land Sweden follows the same
LULUCF guidelines as other Member States.
2.1.1.2 Where applicable, other national objectives and targets
consistent with the Paris Agreement and the existing long-term
strategies. Where applicable for the contribution to the overall
Union commitment of reducing the GHG emissions, other
objectives and targets, including sector targets and adaptation
goals, if available.
The Riksdag adopted a national climate policy framework for Sweden in
June 2017. The framework consists of a climate act, national climate targets
and a climate policy council. See Section 1.2 for more information about the
Climate Policy Framework.
Sweden has four main climate policy targets.
• An overall environmental quality target, with no specific
deadline, to help limit the rise in global average
temperatures.
• A long-term Swedish emissions target for 2045.
26 Regulation (EU) 2018/841 of the European Parliament and of the Council of 30 May 2018 on the inclusion of greenhouse gas emissions and removals from land use,
land use change and forestry in the 2030 climate and energy framework, and amending Regulation (EU) No 525/2013 and Decision No 529/2013/EU.

16 (199)
• Intermediate targets for Swedish emissions outside the
EU’s emissions trading scheme for 2020, 2030 and 2040.
• A special intermediate target for greenhouse gas emissions
from national transport (except for national aviation,
which belongs to the EU ETS) for 2030.
Sweden’s environmental quality goal: Limited Impact on the Climate
To provide a clear structure for environmental work in Sweden, the Riksdag
has adopted 16 environmental quality goals. One of these, Limited Impact on
the Climate, forms the basis for action on climate change. The target has been
defined27 as:
‘Limiting the global average temperature rise to less than 2 ºC above its pre-industrial
level and making efforts to achieve an increase of less than 1.5 ºC above the pre-industrial
level. Sweden must work internationally to direct global efforts towards achieving this goal.’
A long-term emissions target
Sweden must reduce its net emissions of greenhouse gases to zero by 2045,
and then achieve negative emissions. This means that greenhouse gases from
Swedish territory must be at least 85% lower in 2045 than they were in 1990.
Capture and storage of carbon dioxide of fossil origin must be included in
the measures to achieve this target in the absence of reasonable alternatives.
Additional measures will also have to be taken into account to achieve net
zero emissions. The climate goal is illustrated in Figure 1.
Intermediate targets for greenhouse gas emissions in 2020, 2030 and 2040
• In 2020, the greenhouse gas emissions of the ESR sector in
Sweden28 must be 40% lower than they were in 1990. A
maximum of 13% of emission reductions may be made
by implementing additional measures in the form of
credits29.
• By 2030, the greenhouse gas emissions of the ESR sector in
Sweden must be at least 63% lower than they were in 1990.
A maximum of 8% of emission reductions may be made by
implementing additional measures.
• By 2030 greenhouse gas emissions from national
transport, excluding national flights, must be at least 70% lower than they were in 201030.
• By 2040, the greenhouse gas emissions of the ESR sector in
Sweden must be at least 75% lower than they were in 1990.
A maximum of 2% of emission reductions may be made by
implementing additional measures.
27 Government bill 2016/17:146, Report 2016/17:MJU24, Riksdag communication 2016/17:320. 28 ESR stands for Effort Sharing Regulation. Emissions are regulated nationally on the basis of the EU’s Effort Sharing Regulation. Between 2013 and 2020, this sector
is called the ESD, Effort Sharing Decision. 29 Credits may include emission reductions in other EU Member States and credits from the Clean Development Mechanism under the Kyoto Protocol. 30 National aviation is not included in the target as it belongs to the EU ETS.

17 (199)
Additional measures
Under international rules, additional measures may be taken into account to
achieve the long-term goal for 2045 and the intermediate targets. However,
no decision has yet been made about how to do this. Current additional
measures include net removal by forests and land, verified emission
reductions through investments in other countries and capture and storage
of biogenic carbon dioxide (bio-CCS).
Figure 1. Sweden's climate targets (with and without additional measures) and historic emissions. The levels marked in a lighter colour are target levels making maximum use of additional measures, while the darker colours are target levels without using additional measures. From 2005, the historic emissions are split between the traded and the non-traded sector (ESR), as the EU’s emissions trading system started in that year.
Source Target Sverige Sweden EU:s utsläpps-handel EU emissions trading Mål för icke-handlande sektorn Target for the non-traded sector Mål för Sveriges totala nettoutsläpp Target for Sweden's total net emissions Negativa nettoutsläpp efter 2045 Negative net emissions after 2045 Miljoner ton koldioxidekvivalenter Million metric tonnes of carbon dioxide equivalents
Climate change adaptation
The Government's goal for climate change adaptation is to develop a long-
term, sustainable and robust society which actively combats climate change
by reducing vulnerabilities and grasping opportunities. The Government
adopted the first National Climate Change Adaptation Strategy in March
201831. The strategy establishes mechanisms for coordinating, monitoring,
evaluating and reviewing climate change adaptation work. Seven particular
areas have been highlighted for further work on the basis of the predicted
consequences for society. The work should be informed by a number of
guiding principles.
As climate change adaptation involves many different fields, the work is
largely governed by existing national and international regulations,
frameworks and objectives. These include the goals of the 2030 Agenda and
the Planning and Building Act (2010:900). 31 Government bill 2017/18:163. National Climate Change Adaptation Strategy

18 (199)
Air pollution control policy
The revised National Emission Ceilings Directive32 (2016/2284/EU) on the
reduction of atmospheric pollutants sets ceilings for Sweden's emission
reduction commitments for sulphur dioxide (SO2), nitrogen oxides (NOx),
volatile organic compounds (NMVOC), particulate matter (PM2,5) and
ammonia (NH3). The emission ceiling must be complied with by 2020 and
2030 and there are also indicative targets for 2025, which must demonstrate
a linear emission reduction between 2020 and 2030. Table 2 and Table 3
show Sweden's commitments for 2020 and 2030.
Table 2. Sweden's commitments for 2020 and 2030 under the new Ceilings Directive in per cent with 2005 as the base year.
Air pollution Reduction by 2020 [%] Reduction by 2030 [%]
NOx 36 66
SO2 22 22
NMVOC 25 36
NH3 15 17
PM2,5 19 19
Table 3. Sweden's commitments for 2030 expressed in thousand metric tonnes (kt) and remaining target according to the emission inventory and forecast reported in February and March 2017.
Pollution Emissions 2005 [kt]
Commitment 2030 [lt]
Forecast 2030 [kt] Target 2030 [kt]
NOx 172 58 70 -12
SO2 36 28 17 -
NMVOC 179 115 107 -
NH3 58 48 49 -1
PM2,5 26 22 17 -
A new Air Pollution Control Ordinance (218:740) implementing the
provisions of the revised National Emission Ceilings Directive came into
force on 1 July 2018. The Ordinance covers the work of the Swedish
Environmental Protection Agency and other relevant agencies on the
National Air Pollution Control Programme, emission statistics, scenarios,
environmental monitoring and reporting to the EU under the provisions of
the Directive.
2.1.2 Renewable energy
2.1.2.1 The elements set out in point (a)(2) of Article 4
With respect to renewable energy: With a view to achieving the
Union's binding target of at least 32% renewable energy in 2030 as
32 Directive (EU) 2016/35/EC of the European Parliament and of the Council of 14 December 2016 on the reduction of national emissions of certain atmospheric
pollutants, amending Directive 2003/35/EC and repealing Directive 2001/81/EC.

19 (199)
referred to in Article 3 of Directive (EU) 2018/2001, a contribution to
that target in terms of the Member State's share of energy from
renewable sources in gross final consumption of energy in 2030, with
an indicative trajectory for that contribution from 2021 onwards. By
2022, the indicative trajectory shall reach a reference point of at least
18% of the total increase in the share of energy from renewable
sources between that Member State's binding 2020 national target,
and its contribution to the 2030 target. By 2025, the indicative
trajectory shall reach a reference point of at least 43% of the total
increase in the share of energy from renewable sources between that
Member State's binding 2020 national target, and its contribution to
the 2030 target. By 2027, the indicative trajectory shall reach a
reference point of at least 65% of the total increase in the share of
energy from renewable sources between that Member State's binding
2020 national target, and its contribution to the 2030 target.
By 2030, the indicative trajectory shall reach at least the Member
State's planned contribution. If a Member State expects to surpass
its binding 2020 national target, its indicative trajectory may start at
the level it is projected to achieve. The Member States' indicative
trajectories, taken together, shall add up to the Union reference
points in 2022, 2025 and 2027 and to the Union's binding target of at
least 32% renewable energy in 2030. Separately from its
contribution to the Union target and its indicative trajectory for the
purposes of this Regulation, a Member State shall be free to
indicate higher ambitions for national policy purposes.
Sweden has no national targets for the share of renewable energy in 2030.
Sweden's draft Integrated Energy and Climate Plan33 used the Swedish
Energy Agency's long-term scenarios34 from 2016 and the policies adopted
at that time as the basis for a national contribution to the Union’s common
target for 2030. The Swedish Energy Agency’s 2016 reference scenario with
conditions recommended by the EU indicated that renewable energy would
account for 65% of gross energy consumption in 2030. The Agency's latest
long-term scenarios35 show that this is still a reasonable contribution which
should be achievable with the policies adopted (see Section 4).
Under the Renewable Energy Directive36, Sweden's binding target for the
share of renewable energy in gross energy consumption in 2020 is 49%.
Figure 2 shows the indicative trajectory from the binding target for 2020 to a
national contribution of a 65% share of renewable energy in gross energy
consumption in 2030. The indicative trajectory does not place any limits on
higher national ambitions and objectives or the development of national
policies.
33 https://www.regeringen.se/rapporter/2019/01/sveriges-utkast-pa-integrerad-nationell-energi--och-klimatplan/. 34 The Swedish Energy Agency – Scenarier över Sveriges energisystem 2016 (ER2017:6). 35 The Swedish Energy Agency – Scenarier över Sveriges energisystem 2018 (ER2019:7). 36 Directive (EU) 2018/2001 of the European Parliament and of the Council of 11 December 2018 on the promotion of the use of energy from renewable sources.

20 (199)
Figure 2 Sweden's indicative trajectory for the share of renewable energy in final energy consumption between 2020 and 2030.
2.1.2.2 Estimated trajectories for the sectoral share of
renewable energy in final energy consumption from 2021 to 2030
in the electricity, heating and cooling and transport sector.
The EU Reference Scenario is described in detail in Section 4.2.2 including
trajectories for the share of renewable energy in the electricity, heating and
cooling and transport sectors.
2.1.2.3 Estimated trajectories by renewable energy technology
that the Member State projects to use to achieve the overall and
sectoral trajectories for renewable energy from 2021 to 2030,
including expected total gross final energy consumption per
sector in Mtoe and total planned installed capacity (divided by
new capacity and repowering) per technology and sector in MW.
The future profitability and competitiveness of different renewable energy
sources will depend on developments on the market. The Government
believes it is more cost-effective to leave it to the market to determine which
technologies are used instead of setting specific targets.
Section 4.2.2 describes the estimated distribution of renewable energy by
technology and energy consumption in 2030 according to the EU Reference
Scenario, in total and by sector.
The expected total gross final energy consumption37 of 37 Mtoe given in the EU
Reference Scenario does not change from 2020 to 2030. In the heating and
cooling sector, the equivalent energy consumption increases by 1 Mtoe to 17
Mtoe in 2030. The energy consumption in the transport sector falls slightly
from 2020 to 7 Mtoe in 2030; in the electricity sector it is unchanged at 13
Mtoe in 2030. 37 The denominator in the calculations of renewable energy shares.

21 (199)
In the scenario, the total installed electricity generation capacity increases
from around 39 GW in 2017 to nearly 45 GW in 2030 in spite of the fact
that two nuclear reactors are expected to be decommissioned during this
period (see the estimated distribution between different technologies in
Figure 3). The installed capacity for wind power is expected to increase the
most, by 5 GW between 2017 and 2030. Solar power is expected to increase
by 2 GW in the same period. There is no information on the division
between new capacity and repowering.
Figure 3 Installed capacity per type of power in the Swedish Energy Agency’s EU Reference Scenario, 2020–2030, GW.
Source Target Vattenkraft Hydropower Kärnkraft Nuclear power Kondens+gasturbin Steam + gas turbine Kraftvärme Cogeneration Ind mottryck Ind back-pressure Vindkraft Wind power Sol+övr förnybart Solar + other renewable GW GW
Note: The modelling result is based on normal operation which means that the need for back-up power is probably underestimated.
2.1.2.4 Estimated trajectories on bioenergy demand, disaggregated
between heat, electricity and transport, and on biomass supply by
feedstocks and origin (distinguishing between domestic production
and imports). For forest biomass, an assessment of its source and
impact on the LULUCF sink.
In the Swedish Energy Agency’s EU Reference Scenario the total bioenergy
consumption increases by 14 TWh between 2017 and 2020 to a total of 157
TWh. The estimated bioenergy consumption for 2030 is 161 TWh, as shown
in Figure 4.
In the heating and cooling sector, bioenergy consumption increases by 10

22 (199)
TWh up to 2020 and then by 2 TWh to 121 TWh in 2030. Solid biofuels38
account for 9 TWh of the increase and depend on increased use for heat
generation in district heating plants and for heating in the housing and
services sector.
In the transport sector, the consumption of bioenergy (but only liquid
biofuels) increases by 3 TWh up to 2020 and then remains constant until
203039. The increase is due primarily to increased consumption of biodiesel
in the form of HVO (around 2 TWh) which is currently produced primarily
from waste and residues.
In the electricity sector, bioenergy consumption increases by only 1 TWh up
to 2020 and then by 2 TWh up to 2030. Solid biofuels account for the
largest proportion of this increase.
At present, Sweden imports a relatively large amount of biofuel feedstocks
for all three consumer sectors, although there is significant national potential
for most types of feedstock. However, there is no state policy for controlling
the balance between domestic production and imports; it is controlled by
market forces.
38 Including lyes, a residual product of paper production. 39 The scenario only contains the current levels for the reduction obligation.

23 (199)
Figure 4 Bioenergy consumption in the Heating and Cooling, Electricity and Transport sectors from 2005 to 2017 by type of biomass, and assessment in the EU Reference Scenario up to 2030, TWh.
Source Target Förnybara delen av avfall, VK Renewable share of waste, HC Fasta biobränslen, VK Solid biofuels, HC Flytande biobränslen, E Liquid biofuels, E Gasformiga biobränslen Gaseous biofuels Flytande biobränslen, VK Liquid biofuels, HC Fasta biobränslen E Solid biofuels, E Förnybara delen av avfall, E Renewable share of waste, E Gasformiga biobränslen, VK Gaseous biofuels, HC Gasformiga biobränslen, E Gaseous biofuels, E Flytande biobränslen, T Liquid biofuels, T
Source: The Swedish Energy Agency.
Note: T = transport; E = electricity and HC = heating and cooling.
The model used in the EU Reference Scenario does not indicate which
specific types of solid biofuel are used, in other words whether or not they
are based on forestry feedstocks. However, the consumption of solid
biofuels increases by nearly 8 TWh between 2017 and 2020 and then
remains constant. If felling residues in the form of branches and tops
account for most of this increase, it has little impact on the carbon sink; but
the removal of more stumps can be detrimental. However, stores of carbon
could be increased by growing trees for biomass on derelict land formerly
used for annual crops.
2.1.2.5 Where applicable, other national trajectories and objectives,
including those that are long-term and sectoral (such as share of
renewable energy in district heating, renewable energy use in
buildings, renewable energy produced by cities, renewable energy
communities and renewables self-consumers, energy recovered
from the sludge acquired through the treatment of wastewater)
The 2040 target is 100% of electricity generated from renewable sources.

24 (199)
That is a target, not a deadline for banning nuclear energy; nor is it a policy
decision to stop generating nuclear energy.
Progress towards the target of 100% electricity generated from renewable
sources was assessed during the first review40 of the Energy Agreement in
2019. Electricity generated from renewable sources as a proportion of total
electricity generation increased from 57.6% to 58.4% in 2017. In the
Swedish Energy Agency’s EU Reference Scenario, this share increases to
84% in 2040. Nuclear energy accounts for most of the remaining electricity
generated from non-renewable sources, followed by electricity from burning
residual fossil gases (coke and blast furnace gases) from the steel industry
and the fossil content of waste.
Section 4 describes the trend in the generation of energy from renewable
sources shown in the EU Reference Scenario using the calculation method
from the Renewable Energy Directive.
2.2 Dimension energy efficiency
2.2.1 The elements set out in point (b) of Article 4
2.2.1.1 The indicative national energy efficiency contribution to
achieving the Union's energy efficiency targets of at least 32.5% in
2030 as referred to in Article 1(1) and Article 3(5) of Directive
2012/27/EU, based on either primary or final energy consumption,
primary or final energy savings, or energy intensity. Member States
shall express their contribution in terms of absolute level of primary
energy consumption and final energy consumption in 2020, and in
terms of absolute level of primary energy consumption and final
energy consumption in 2030, with an indicative trajectory for that
contribution from 2021 onwards. They shall explain their underlying
methodology and the conversion factors used.
Sweden has set a target for the reduction of energy intensity in terms of
energy supplied in relation to GDP. This is a cross-sectoral target to reduce
energy intensity by 20% between 2008 and 2020.
Energy consumption must be 50% more efficient by 2030 than it was in
2005. This target is also expressed as energy supplied (primary energy) in
relation to real GDP and is part of the Energy Agreement (see Section 1.2).
Figure 5 shows the energy intensity targets, which are a 20% reduction in
2020 and a 50% reduction in 2030. Besides the difference in base and target
40 Government communication 2018/19:153 Första kontrollstationen för energiöverenskommelsen.

25 (199)
years, the 20% target also includes fuels for non-energy purposes, which the
50% target does not.
Figure 5 Energy intensity targets for 2020 and 2030. Statistics up to 2017 followed by the assumed linear progression to the respective target.
Source: The Swedish Energy Agency.
As Sweden's 2030 target is an energy intensity target there is no fixed level
for consumption of energy supplied (primary) and final energy to meet the
target. Figure 6 shows the different energy consumption levels calculated for
different assumptions about the development of GDP. Assuming the
economy grows at 2% a year, the primary energy consumption on meeting
the target in 2030 will be 461 TWh and the final energy consumption will be
339 TWh. These are not target levels. Energy consumption may be different
if the GDP develops differently.
Figure 6. Calculated levels for consumption of supplied (primary) and final energy to meet Sweden's target for a 50% fall in energy intensity in 2030.
Source Target Tillförd energi vid måluppfyllnad Energy supplied on meeting the target Slutlig energi- användning vid måluppfyllnad
Final energy consumption on meeting the target
Tillförd energi scenario Referens EU Energy supplied, EU Reference Scenario Slutlig energianvändning scenario Referens EU
Final energy consumption, EU Reference Scenario

26 (199)
Årlig BNP-tillväxt 2005–2030 Annual growth in GDP, 2005–2030 TWh TWh
The EU Reference Scenario (see Section 4) estimates Sweden's primary
energy consumption – in practice, the same as energy supplied – in 2020 at
533 TWh and its final energy consumption at 391 TWh. The corresponding
figures for 2030 are 516 TWh and 384 TWh without further policy
measures. Besides the growth in GDP, the development of energy intensity
depends on primary energy consumption which, in turn, is dependent on
measures for renewable energy, energy efficiency, structural changes in the
industry, the future of nuclear energy and general economic growth. See
Section 2.4.4 for information about sectoral energy-efficiency strategies.
Scenarios are mainly prepared in energy terms, rather than in terms of
physical units, with base year statistics from the national energy balances
(official statistics). Since they are prepared both for energy supplied and for
final energy consumption, conversion factors for electricity and district
heating, for example, are not needed for the calculations.
2.2.1.2 The cumulative amount of end-use energy savings to be
achieved over the period 2021-2030 under point (b) of Article 7(1)
on the energy saving obligations pursuant to Directive 2012/27/EU.
For the whole of the period 2021–2030, Member States must achieve a
cumulative end-use energy saving equivalent to an annual saving of at least
0.8% of the annual final energy consumption in 2016–2018. According to
Eurostat data, Sweden's average final energy consumption in 2015–2017 was
371 TWh; this means that the provisional total savings obligation is 163
TWh. The final energy savings obligation will be determined when the 2018
energy statistics are available.
2.2.1.3 The indicative milestones of the long-term strategy for the
renovation of the national stock of residential and non-residential
buildings, both public and private, the roadmap with domestically
established measurable progress indicators, an evidence-based
estimate of expected energy savings and wider benefits, and the
contributions to the Union's energy efficiency targets pursuant to
Directive 2012/27/EU in accordance with Article 2a of Directive
2010/31/EU.
Sweden will report its long-term renovation strategy, including indicative
milestones, to the Commission by 10 March 2020. The Government has
commissioned the National Board of Housing, Building and Planning and
the Swedish Energy Agency to prepare proposals for Sweden's long-term
renovation strategy.
2.2.1.4 The total floor area to be renovated or equivalent
annual energy savings to be achieved from 2021 to 2030
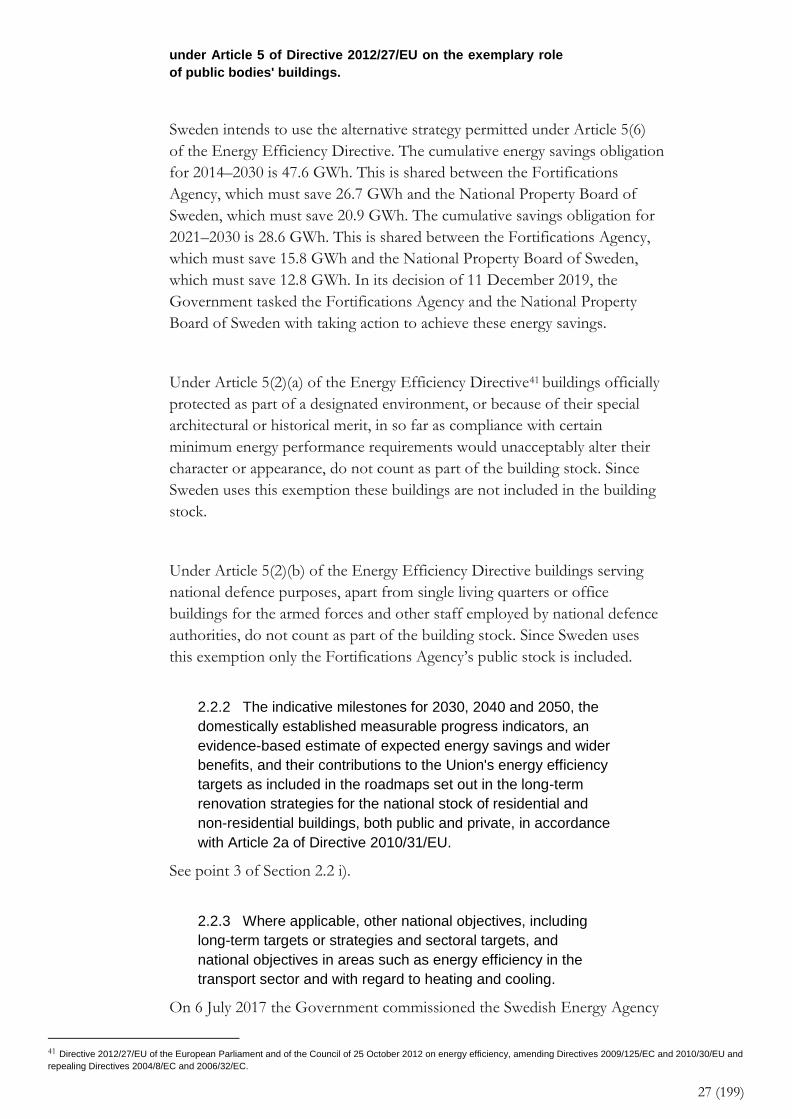
27 (199)
under Article 5 of Directive 2012/27/EU on the exemplary role
of public bodies' buildings.
Sweden intends to use the alternative strategy permitted under Article 5(6)
of the Energy Efficiency Directive. The cumulative energy savings obligation
for 2014–2030 is 47.6 GWh. This is shared between the Fortifications
Agency, which must save 26.7 GWh and the National Property Board of
Sweden, which must save 20.9 GWh. The cumulative savings obligation for
2021–2030 is 28.6 GWh. This is shared between the Fortifications Agency,
which must save 15.8 GWh and the National Property Board of Sweden,
which must save 12.8 GWh. In its decision of 11 December 2019, the
Government tasked the Fortifications Agency and the National Property
Board of Sweden with taking action to achieve these energy savings.
Under Article 5(2)(a) of the Energy Efficiency Directive41 buildings officially
protected as part of a designated environment, or because of their special
architectural or historical merit, in so far as compliance with certain
minimum energy performance requirements would unacceptably alter their
character or appearance, do not count as part of the building stock. Since
Sweden uses this exemption these buildings are not included in the building
stock.
Under Article 5(2)(b) of the Energy Efficiency Directive buildings serving
national defence purposes, apart from single living quarters or office
buildings for the armed forces and other staff employed by national defence
authorities, do not count as part of the building stock. Since Sweden uses
this exemption only the Fortifications Agency’s public stock is included.
2.2.2 The indicative milestones for 2030, 2040 and 2050, the
domestically established measurable progress indicators, an
evidence-based estimate of expected energy savings and wider
benefits, and their contributions to the Union's energy efficiency
targets as included in the roadmaps set out in the long-term
renovation strategies for the national stock of residential and
non-residential buildings, both public and private, in accordance
with Article 2a of Directive 2010/31/EU.
See point 3 of Section 2.2 i).
2.2.3 Where applicable, other national objectives, including
long-term targets or strategies and sectoral targets, and
national objectives in areas such as energy efficiency in the
transport sector and with regard to heating and cooling.
On 6 July 2017 the Government commissioned the Swedish Energy Agency
41 Directive 2012/27/EU of the European Parliament and of the Council of 25 October 2012 on energy efficiency, amending Directives 2009/125/EC and 2010/30/EU and
repealing Directives 2004/8/EC and 2006/32/EC.

28 (199)
to prepare sectoral energy efficiency strategies with various sectors in
consultation with the relevant agencies. This is a task under the Energy
Agreement and will continue until 2030.
It will take the form of a discussion of suitable indicative targets and
measures for the sector’s contribution to at 50% increase in energy
efficiency by 2030, taking account of other energy and climate policy targets.
The Swedish Energy Agency has identified five sectors and has defined the
following strategic areas with the relevant operators:
1. Fossil-free transport.
2. World-class production.
3. A flexible and robust energy system.
4. Future trade and consumption.
5. Resource-efficient building.
The Swedish Energy Agency intends to focus on cooperation and to
proceed iteratively so that strategic areas can be added or removed during
the process.
The sectoral strategies must make use of the drive and ambitions of Swedish
operators. It is important that their actions and activities genuinely improve
the resource-efficiency of energy consumption.
The Government’s national goods transport strategy Effective, high-capacity,
sustainable goods transport — a national goods transport strategy, contains five key
areas for the transition to fossil-free transport. The Government has issued a
number of assignments under the goods transport strategy.
2.3 Dimension energy security
2.3.1 The elements set out in point (c) of Article 4
2.3.1.1 National objectives with regard to
– increasing the diversification of energy sources and supply from
third countries, the purpose of which may be to reduce energy
import dependency
– increasing the flexibility of the national energy system, and
– addressing constrained or interrupted supply of an energy
source, for the purpose of improving the resilience of
regional and national energy systems, including a timeframe
for when the objectives should be met.
Besides the requirements and criteria in European Union legislation, there
are no national targets for reducing dependence on importing energy from
third countries.
Instead, the energy supply is secured by properly functioning energy

29 (199)
markets, where energy is traded freely as far as possible, both within Sweden
and between Sweden and other countries.
See Section 2.3.4 for national objectives for increasing the flexibility of the
national energy system.
Responsibility for a secure energy supply, and hence for objectives to
address constrained or interrupted supply, is shared among many different
operators. A secure energy supply, together with sustainability and
competitiveness, is the overall objective of Swedish energy policy. It is also
an integral part of the general guidelines for crisis management and civil
defence. The energy markets, which are largely international, provide a
means of preventing interruptions and shortages or reducing their severity.
The energy supply can be adapted to new requirements on market
conditions. The public authorities have an important role in designing
frameworks and monitoring the energy markets to ensure that they are
functioning well.
Electricity supply
There is currently no specific target for the security of the electricity supply.
The revised Electricity Market Regulation42 requires all Member States that
have a capacity mechanism to define a supply security target in the form of a
reliability standard. An action plan to identify remaining market failures and
distortions as a result of legislation to improve the operation of the market
was drawn up during the preparation of this standard. In its 2020
appropriation directive, the Government commissioned the Swedish Energy
Markets Inspectorate to submit proposals for a reliability standard. Sweden
has had a capacity mechanism in the form of a power reserve since 2003 to
manage winter peaks in electricity consumption (see Section 3.3 for more
information). In a notice to the Government in May 2019, the Riksdag asked
it to develop an electricity supply security target for Sweden43. The
Government intends to develop an accounting method for electricity supply
security in future draft budgets.
A rapid rise in electricity consumption in some metropolitan areas, mainly as
a result of increased urbanisation and new industry, combined with the
length of time needed to increase the capacity of the grid, can increase the
risk of regional capacity shortages, particularly if the scarcity is not reflected
in the price. The Government has therefore commissioned the Swedish
Energy Markets Inspectorate to investigate the extent of the capacity
shortage in the grid, investigate the history of the problem and analyse
conditions and measures linked to the problems identified. It must submit
42 Regulation (EU) 2019/943 of the European Parliament and of the Council of 5 June 2019 on the internal market for electricity. 43 Report 2018/19:NU12, Riksdag communication 2018/19:210.
30 (199)
its final report to the Swedish Government Offices (Infrastructure
Department) by 1 October 2020 and an interim report by 30 April 2020.
Under Article 10 of the Risk-Preparedness Regulation44 the competent
authority of each Member State must establish a risk-preparedness plan for
electricity. A risk-preparedness plan must be adopted by 5 January 2022 and
must be updated every four years. As Sweden does not have a competent
authority for electricity, there is currently no Swedish risk-preparedness plan
for electricity.
The national grid is planned and operated according to the (n-1) principle,
which means that a fault in a single component should not affect the
electricity supply. In the event of a fault, the effects must be remedied within
15 minutes and the electricity system must then be prepared for any new
fault. This requires rapid access to an active fault reserve45. If the grid is
damaged, the necessary repairs must be started without delay.
The objective for power cuts is expressed as an obligation for network
owners to ensure that they do not last for more than 24 hours, unless the
causes are beyond the grid operator’s control.
Section 3.3 discusses shortages of electricity and capacity in more detail.
Section 4.4 analyses the adequacy of future capacity.
Oil supply
Under the IEP Agreement46 and the Oil Stocks Directive47, Sweden is
obliged to hold emergency supplies equivalent to 90 days’ net imports of oil.
Section 3.3 provides more information about this.
Gas supply
The EU’s Security of Gas Supply Regulation48 requires protected customers
to have access to gas for at least 30 days if the gas supply is disrupted.
Sweden has decided that only households connected to the Western Swedish
gas network should be defined as protected customers; they account for 2%
of Sweden’s gas consumption. Under the Security of Gas Supply Regulation,
solidarity protected customers may include, under specific conditions,
certain essential social services and district heating installations.
44 Regulation (EU) 2019/941 of the European Parliament and of the Council of 5 June 2019 on risk-preparedness in the electricity sector and repealing Directive
2005/89/EC. 45 A generation failure or a fault in the grid disrupts the operation of the electricity system. If the balancing power market does not have the capacity to deal with the
problem, the state-owned enterprise Svenska kraftnät activates the reserve capacity to restore the balance in the system. The reserve capacity is currently provided primarily by gas turbines located in the southern bidding zones (SE3 and SE4). 46 The International Energy Agency’s Agreement on an International Energy Programme. 47 Council Directive 2009/119/EG of 14 September 2009 imposing an obligation on Member States to maintain minimum stocks of crude oil and/or petroleum products. 48 Regulation (EU) 2017/1938 of the European Parliament and of the Council of 25 October 2017 concerning measures to safeguard the security of gas supply and
repealing Regulation (EU) No 994/2010.

31 (199)
2.3.2 National objectives with regard to increasing the
diversification of energy sources and supply from third countries
for the purpose of increasing the resilience of regional and
national energy systems.
See Section 2.3.1.
2.3.3 Where applicable, national objectives with regard to
reducing energy import dependency from third countries, for
the purpose of increasing the resilience of regional and
national energy systems.
See Section 2.3.1.
2.3.4 National objectives with regard to increasing the
flexibility of the national energy system, in particular by
means of deploying domestic energy sources, demand
response and energy storage.
The Government’s draft budget for 2020 (Government bill 2019/20:1
expenditure area 21) confirms that a future electricity system containing a
larger proportion of variable wind and solar energy will require more
flexibility in planned generation, better demand response in consumer
sectors and more energy storage and systems services to support and
stabilise the electricity system. To achieve this, we must continue to promote
demand response, for example by removing regulatory obstacles to new
business models.
In its bill The Focus of Energy Policy 49 the Government states that the role of
the network operator may have to be broadened to take full advantage of the
benefits of smart grids, energy storage and demand response for the
electricity system.
Emergency oil stocks are based on the target for minimum stocks in the Oil
Stocks Directive50 and the Agreement on an International Energy Program,
which requires members of the International Energy Agency to hold oil
stocks equivalent to at least 90 days’ net imports.
For demand response, see Section 2.4.3.
2.4 Dimension internal energy market
49 Government bill 2017/18:228 Energipolitikens inriktning. 50 Council Directive 2009/119/EG of 14 September 2009 imposing an obligation on Member States to maintain minimum stocks of crude oil and/or petroleum products.

32 (199)
2.4.1 Electricity interconnectivity
The level of electricity interconnectivity that the Member State aims
for in 2030 in consideration of the electricity interconnection target
for 2030 of at least 15%, with a strategy with the level from 2021
onwards defined in close cooperation with affected Member States,
taking into account the 2020 interconnection target of 10% and the
following indicators of the urgency of action:
1. Price differential in the wholesale market exceeding an
indicative threshold of EUR 2/MWh between Member
States, regions or bidding zones.
2. Nominal transmission capacity of interconnectors below 30%
of peak load
3. Nominal transmission capacity of interconnectors below 30%
of installed renewable generation.
Sweden has not set a target for interconnection in 2030. However, the
Energy Agreement includes an ambition to increase Sweden’s network
connections with other countries. At the beginning of 2019, Sweden’s
interconnectivity level was51 27%, which already exceeds the EU’s target for
2030. Current and future levels are discussed in Section 4.5.
Table 4 shows the annual average prices in the Swedish and neighbouring
bidding zones in 2018 and the price differences between the zones. The
differences vary from year to year and are highly dependent on the weather,
in other words the flow of water for hydroelectric power, the generation of
wind power and the demand for heating which varies with the temperature.
Table 4 shows that the following zones could benefit from increased Net
Transfer Capacity (NTC): SE3-SE4, SE1-FI, SE3- FI, SE4-LT, SE4-PL and
SE4-DE. Some of these have already been identified and are the subject of
existing or planned projects. The SouthWest Link (SE3-SE4), 3:e AC to
Finland (SE1-F1) and the Hansa Powerbridge (SE4-DE).
However any analysis of potential new or improved connections must
include an assessment of the socio-economic benefits in the expected future
market situation. The current price may give an indication of the potential
demand, but the analysis should be based on the market situation in 10–30
years’ time.
Table 4. Annual average prices in 2018 in EUR/MWh and price differences between neighbouring bidding zones.
51 Interconnectivity level = installed capacity for transmission abroad / installed electricity generation capacity.

33 (199)
Bidding zone Electricity price (EUR/MWh)
Difference
Zone 1 Zone 2 Zone 1 Zone 2
SE1 SE2 44.2 44.2 0.0
SE2 SE3 44.2 44.5 -0.3
SE3 SE4 44.5 46.3 -1.8
SE1 FI 44.2 46.8 -2.6
SE3 FI 44.5 46.8 -2.3
SE3 DK1 44.5 44.0 0.5
SE4 DK2 46.3 46.2 0.2
SE3 NO1 44.5 43.6 0.9
SE2 NO3 44.2 44.1 0.1
SE1 NO4 44.2 43.7 0.5
SE4 LT 46.3 50.0 -3.6
SE4 PL 46.3 52.2 -5.8
SE4 DE 46.3 44.7 1.7 Source: NordPool, Montel.
Table 5 shows the relationship between the NTC and the peak load. In all
cases the level exceeds the target level of 30%.
Table 5. NTC (Net Transfer Capacity) Import & Export, Peak Load, [MW].
NTC Import [MW]
NTC Export [MW]
Peak load [MW]
Import / top load
Export / top load
SE1 5 100 5 400 1 600 319% 338%
SE2 11 450 11 900 3 200 358% 372%
SE3 13 385 16 675 17 100 78% 98%
SE4 9 015 5 215 4 800 188% 109%
SE 10 350 10 590 26 700 39% 40% Source: Svenska kraftnät – Kraftbalansrapporten 2019.
A socio-economic and environmental cost-benefit analysis must be carried
out for every new interconnectivity project; the project should only go ahead
if the potential benefits outweigh the costs.
Table 6 shows the relationship between the Net Transfer Capacity and the
renewable capacity. In all cases the level exceeds the target level of 30%.
Table 6. NTC (Net Transfer Capacity), RES (Renewable Energy Sources), [MW].
NTC Import [MW]
NTC Export [MW]
RES [MW]
Import / RES
Export / RES
SE1 5 100 5 400 6 650 77% 81%
SE2 11 450 11 900 12 220 94% 97%
SE3 13 385 16 675 8 014 167% 208%
SE4 9 015 5 215 3 220 280% 162%
SE 10 350 10 590 30 103 34% 35% Source: Svenska kraftnät. Kraftbalansrapporten 2019.

34 (199)
2.4.2 Energy transmission infrastructure
2.4.2.1 Key electricity and gas transmission infrastructure projects,
and, where relevant, modernisation projects, that are necessary for
the achievement of objectives and targets under the five dimensions
of the Energy Union Strategy.
Electricity transmission
Svenska kraftnät is a state-owned enterprise which owns the Swedish
national grid. It is responsible for maintaining the instantaneous energy
balance and the operational security of Sweden’s grid and is certified as the
system operator by the Swedish Energy Markets Inspectorate. The current
system development plan52 covers the period up to 2027 and includes
Svenska kraftnät’s grid development plan; the full text of the plan can be
found on Svenska kraftnät’s website. The following are some of the largest
grid development projects.
• The SouthWest Link project53, which increases Net Transfer
Capacity between bidding zones 3 and 4 (see Figure 32 on
bidding zones in Section 4.5), is currently in the test phase
and is expected to increase capacity by 1 200 MW.
• The West Coast Programme comprises several projects
to eliminate bottlenecks in this area.
• The expected phase-out of nuclear energy in bidding zone 3
and expansion of wind energy in bidding zones 1 and 2, will
increase the need for transmission between bidding zones 2
and 3. The NordSyd Programme54 comprises around 50
different projects to increase capacity between bidding
zones 2 and 3 by 2040.
Gas transmission
The western Swedish natural gas system extends from Trelleborg in the
south to Stenungssund in the north and slightly eastwards towards
Jönköping. Gas is transported to Sweden through a pipeline from Dragør in
Denmark. The Swedish transmission network is owned by Swedgas AB,
which is also responsible for balancing the system. A few very large
consumers are connected directly to the transmission network.
52 Svenska kraftnät – Systemutvecklingsplan 2018– 2027. 53 https://www.svk.se/natutveckling/stamnatsprojekt/sydvastlanken/. 54 https://www.svk.se/natutveckling/stamnatsprojekt/nordsyd/.

35 (199)
The LNG55 terminal at the Port of Gothenburg opened in autumn 2018 and
will initially supply gas for shipping, industry and road haulage. It will
eventually have a total capacity of around 30 000 m3. The Government has
decided to reject an application for a concession to build a natural gas
pipeline between the LNG terminal and the natural gas transmission
network.56
2.4.2.2 Where applicable, main infrastructure projects
envisaged other than Projects of Common Interest.
There are plans for a third AC line57 between Sweden (SE1) and Finland.
There are also plans for a new 700-MW HVDC link58 between Sweden
(SE4) and Germany.
One of the Öresund cables from SE4 to DK2 will be replaced in 2020.
Some of the other connections to Denmark, and Fennoskan 1 (SE3-FI) are
likely to need replacing before 2030.
A new Nordic grid development plan59 was published in August 2019. The
report from the four Nordic Transmission System Operators (Energinet,
Fingrid, Statnett and Svenska kraftnät) describes the driving forces behind
the major changes which the Nordic power system is undergoing and the
planned and existing projects designed to meet the challenges these changes
present.
2.4.3 Market integration
2.4.3.1 National objectives related to other aspects of the internal
energy market such as: increasing system flexibility, in particular
through policies and measures related to market-based price
formation in compliance with applicable law; market integration and
coupling, aiming to increase the tradeable capacity of existing
interconnectors, smart grids, aggregation, demand response,
storage, distributed generation, mechanisms for dispatching, re-
dispatching and curtailment and real-time price signals, including a
timeframe for when the objectives should be met.
Sweden has no specific national objectives for market integration, but is
continuously developing measures and taking part in Nordic cooperation in
this field.
To ensure the optimum use of resources and a cost-effective transition to a
sustainable energy system, the Nordic Council of Ministers has set up a new
55 LNG = liquefied natural gas. 56 Government decision II:1 at the cabinet meeting of 10 October 2019, ref. I2019/00911/E. 57 AC = alternating current. 58 HVDC = high-voltage direct current. 59 Nordic Grid Development Plan 2019, June 2019, Stanett, Fingrid, Energinet, Svenska kraftnät.

36 (199)
Nordic electricity market forum for closer dialogue between political and
non-political stakeholders, and between different types of stakeholder on the
Nordic electricity market. The forum has produced a new vision for the
Nordic electricity market which was adopted by the Nordic Council of
Ministers at its last meeting in Reykjavik in 201960. The vision is
accompanied by a roadmap for action up to 2030, which was drawn up by
the electricity market operators61.
The Nordic countries have decided to intensify their cooperation on the
Nordic balancing process and have developed a model for the balancing of
the Nordic power system in the future — the Nordic Balancing Model
(NBM)62. A considerable amount of work will be required over the next few
years to finalise the design of the new model, develop the IT systems and
implement it. The intention is to implement it gradually so that the whole
system is operational by 2023.
Important elements and milestones are:
• Single price model
• 15-minute settlement period
• Nordic capacity market for aFRR63
• Nordic capacity market for mFRR64
Until now balancing has been planned and handled on an hourly basis and
the system operator’s balancing reserves have been used to cover any
changes within the operating hours. A 15-minute settlement period will
enable all parties on the power market to plan their own balance more
precisely and allow more efficient use of power resources and the grid.
2.4.3.2 Where applicable, national objectives related to the
non-discriminatory participation of renewable energy, demand
response and storage, including via aggregation, in all energy
markets, including a timeframe for when the objectives are to
be met.
Sweden has no specific targets for this. However, it has introduced a
provision in Chapter 3, Section 16 of the Electricity Act (1997:857)
prohibiting grid operators from establishing technical requirements or other
conditions which make it more difficult to provide services in the form of
changed electricity consumption, unless the condition is justified in the
interests of the secure, reliable and efficient operation of the grid.
Another provision (Chapter 5, Section 11 of the Electricity Act) states that,
when determining how much the grid operators may charge customers,
60 https://nordicelforum.org/wordpress/wp-content/uploads/2019/06/Vision-for-the-nordic-electricity-market-EN_2.pdf. 61 https://nordicelforum.org/wordpress/wp-content/uploads/2019/06/Handlingsplan-for-at-opnå-2030-visionen-FINAL.pdf. 62 http://nordicbalancingmodel.net/. 63 automatic Frequency Restoration Reserves. 64 manual Frequency Restoration Reserves.

37 (199)
account must be taken of the extent to which their operations are
compatible with or contribute to the efficient use of the grid. This provision
is intended to encourage grid operators to make it easier for customers to
provide services which allow better demand response, for example by using
new technical solutions.
The Smartgrid Forum, a joint enterprise to promote smarter energy use set
up in spring 2016 by a Government decision, has developed a strategy for
using smart grids to increase the flexibility of the electricity system65. The
strategy is described in more detail in Section 3.4.3.
2.4.3.3 Where applicable, national objectives with regard to ensuring
that consumers participate in the energy system and benefit from
self-generation and new technologies, including smart meters.
Sweden has no specific targets for this.
On 1 November 2018, new requirements were introduced in the Ordinance
(1999:716) on the Measurement, Calculation and Reporting of Transmitted
Electricity (the Measurement Ordinance) which will apply from 2025. The
new requirements apply to functions of electricity meters, measuring systems
and measuring equipment. Under the new Measurement Ordinance, the grid
operator must meet the functional requirements by the start of the 2025
measurement year; the requirements cover the measuring systems and
equipment for all consumers of low-voltage electricity.
The functional requirements for measuring systems and measuring
equipment
• allow electricity consumers to obtain information, such as
capacity used, which make it easier for them to save energy
and play an active part in the electricity market; and
• promote reliable and effective grid operation and make it
easier and cheaper to integrate electricity from
microgeneration, such as solar electricity.
2.4.3.4 National objectives with regard to ensuring electricity
system adequacy, as well as for the flexibility of the energy system
with regard to renewable energy production, including a timeframe
for when the objectives are to be met.
Sweden has no national objectives for ensuring electricity system adequacy.
The new regulation66 for cross-border exchanges in electricity includes
65 http://swedishsmartgrid.se/projekt-och-resultat/strategier-for-smarta-elnat/okad-flexibilitet-i-elsystemet/. 66 Regulation (EC) No 714/2009 of the European Parliament and of the Council of 13 July 2009 on conditions for access to the network for cross-border exchanges in

38 (199)
articles which require Member States to monitor system adequacy
continuously.
The Swedish Energy Markets Inspectorate was given the task of producing
proposals for a reliability standard in its 2020 spending authorisations.
Member States with adequacy problems must take a number of measures to
improve the operation of the market. If these measures prove insufficient,
they can introduce a mechanism to conserve capacity (the Swedish capacity
reserve counts as such a mechanism) which must be backed up by a
reliability standard based on the value of the lost load. The European
Network of Transmission System Operators for Electricity (ENTSO-E)
must produce European methods for calculating the value of the lost load
and reliability standards for system adequacy.
2.4.3.5 Where applicable, national objectives to protect energy
consumers and improve the competitiveness of the retail energy
sector.
The Government is working to give customers more active choice and to
increase competitiveness by introducing a system in which suppliers are the
key party in the market. This means that customers will mostly have contact
with the electricity supplier and the supplier will bill them both for electricity
and grid costs. To increase active customer engagement and provide new
services, the Government and the authorities have also started work on
launching an electricity market hub for centralised management of
measurement data, where the stakeholders can obtain and provide
information.
The electricity market hub is a central IT system which will manage the
exchange of information between electricity market operators.
2.4.4 Energy poverty
2.4.4.1 Where applicable, national objectives with regard to energy
poverty, including a timeframe for when the objectives are to be met.
Sweden makes no distinction between energy poverty and poverty in
general. As a result, the term energy poverty is not used, and there are no
targeted policies to deal with it. The issue is addressed within social policy.
2.5 Dimension research, innovation and competitiveness
2.5.1 National objectives and funding targets for public and,
where available, private research and innovation relating to
the Energy Union, including, where appropriate, a timeframe
for when the objectives are to be met.
electricity and repealing Regulation (EC) No 1228/2003.
39 (199)
Answers given in Section 2.5.2.
2.5.2 Where available, national 2050 objectives related to
the promotion of clean energy technologies and, where
appropriate, national objectives, including long-term targets
(2050) for deployment of low-carbon technologies, including
for decarbonising energy and carbon-intensive industrial
sectors and, where applicable, for related carbon transport
and storage infrastructure.
The overall objective for energy research and innovation is to contribute to
meeting energy and climate targets, the long-term energy and climate policy
and the energy-related environmental policy objectives described in Section
2.
Energy research and innovation must67:
• develop the scientific and technical knowledge and competence
required to use new technologies and new services to make the
transition to a sustainable energy system in Sweden in the long
term, combining sustainability, competitiveness and security of
supply;
• develop technologies and services which can be commercialised
by Swedish businesses, hence contributing to sustainable growth
and the transition and development of the energy system both
in Sweden and on other markets, and contribute to and make
use of international cooperation on energy.
Energy research and cooperation must also contribute to achieving the
general research policy objective68 to make Sweden a world leader in research
and innovation and a leading centre of knowledge, where high-quality
research, higher education and innovation contribute to social development,
welfare, competitive businesses and respond to the challenges facing society,
both in Sweden and worldwide.
The public funding available for the National Energy Research and
Innovation Programme for the next four years was announced in the 2017
draft budget; the funding increased from 1.3 billion krona in 2017 to 1.6
billion krona in 202069. The areas covered are described in Section 3.5.
Beneficiaries in the private sector are expected to contribute private funding
equivalent to at least half of the public funding they receive.
67 Government bill 2016/17:66 Forskning och innovation på energiområdet för ekologisk hållbarhet, konkurrenskraft och försörjningstrygghet. 68 Government bill 2016/17:50 Kunskap i samverkan – för samhällets utmaningar och stärkt konkurrenskraft. 69 Government bill 2016/17:1 expenditure area 21 and prop. 2016/17:66 Forskning och innovation på energiområdet för ekologisk hållbarhet, konkurrenskraft och
försörjningstrygghet.

40 (199)
Sweden is actively engaged in international negotiations and discussions to
spread the message about its transition to a fossil-free welfare state, in which
climate work creates innovations, increases competitiveness and improves
health. Sweden must become a permanent global showcase for sustainable
innovation in transport.
2.5.3 Where applicable, national objectives with
regard to competitiveness
The commercial policy is designed to create jobs and encourage companies
to grow, by fostering entrepreneurship and innovation and ensuring
effective competition70.
In its climate policy framework71 the Riksdag states that Sweden must show
that climate transition is compatible with welfare and good competition.
3. POLICIES AND MEASURES
3.1 Dimension decarbonisation
3.1.1 GHG emissions and removals
3.1.1.1 Policies and measures to achieve the target set under
Regulation (EU) 2018/842 as referred in point 2.1.1 and policies and
measures to comply with Regulation (EU) 2018/841, covering all key
emitting sectors and sectors for the enhancement of removals, with
an outlook to the long-term vision and goal to become a low emission
economy and achieving a balance between emissions and removals
in accordance with the Paris Agreement.
The above climate goals are affected by many European Union policy areas
and measures, such as the EU ETS, the Fuel Quality Directive, emission
requirements for new vehicles, the Fluorinated Greenhouse Gases
Regulations, the Landfill Directive and the Common Agricultural Policy.
These will not be discussed here.
They are also affected by many policy areas and measures for renewable
energy and energy efficiency (see Section 3.1.2 and 3.2) and the reduction of
greenhouse gas emissions in Sweden. Table 7 summarises the key policies
for achieving climate goals.
Table 7. Summary of key policies and measures for achieving the 2030 climate goals (EU policies are in bold type).
70 https://www.regeringen.se/regeringens-politik/naringspolitik/. 71 Government bill 2016/17:146 Report 2016/17:MJU24, Riksdag communication 2016/17:320.

41 (199)
Cross-sectoral Energy supply Housing and services
Industry Transport Waste Agriculture Forestry
Energy and Carbon Tax EU ETS
Klimatkliv (Climate
Stride) funding
initiative
Environmental Code
Planning and Building Act
Fossil-Free Sweden
Communication
Energy and Climate Advisory Service
Regional energy and climate plans
The European Regional Development Fund Research and demonstration
Procurement rules
Energy and Carbon Tax
Waste Incineration Tax
EU ETS Electricity certificates system
Wind power initiative
Support for solar energy
Energy and Carbon Tax Ecodesign Directive
Energy Labelling Regulation Building regulations Energy and Climate Advisory Service
Energy declarations Education programme for low-energy buildings Client groups and networks
Energy and Carbon Tax EU ETS
Industrikliv (Industrial
Stride) funding
initiative Energisteg
(Energy Step) funding
programme
Requirements and support for energy mapping
Energy and climate coaches Energy-efficiency network Environmental Code
F-Gas Regulation and BREF
Energy and Carbon Tax Emission requirements for new vehicles
Reduction obligation Bonus-malus system CO2-based vehicle tax
Lower taxable value for vehicles with environmental technology
Pump Act Environmental information about fuels Climate incentive payment Urban Environment Agreement
Infrastructure planning
Eco-bonus system for shipping
Procurement rules
Tax on air travel EU ETS (flights)
Ban on dumping flammable and organic waste
Collection of measurement data from dumps Waste tax Producer responsibility
Municipal waste planning EU waste package
CAP Rural Development Programme
The Rural Development Network
Advice Support for biogas from manure
Biogas support
The Forestry Act Land drainage rules under the Environmental Code
Forest and land protection under the Environmental Code and nature conservation agreements National Forest Programme
Advice and education CAP
Cross-sectoral policies and measures
Energy Tax and Carbon Tax
The Swedish energy taxation system combines a carbon tax with a fuel tax
and an electricity tax. The main taxes affecting greenhouse gas emissions in
Sweden are the carbon tax and the fuel tax. These are described in general
terms below; a more detailed description is given for each sector.
A carbon tax, based on the fossil content of fuel, was introduced in Sweden
in 1991 to reduce carbon dioxide emissions. The tax has been increased in
stages since it was first introduced. Overall, it has increased from
SEK 0.25/kg CO2 (1991) to SEK 1.18/kg CO2 (2019). Besides specific tax
increases introduced by the Riksdag in response to proposals in
Government bills, the tax rates are indexed annually on the basis of earlier
legislation. Carbon tax is not deducted on biofuels, which are not covered by
the reduction obligation for petrol and diesel.
Some sectors are taxed at a reduced rate, or are exempt from tax, because of
the risk of carbon leakage, in other words a business or its emissions moving
outside the country’s borders.

42 (199)
Energy has been taxed for many years in Sweden72. Energy taxes on petrol
and diesel were introduced in 1924 and 1937 respectively. An energy tax was
first imposed on heating fuel and electricity in the 1950s. The purpose of
energy taxes was initially purely fiscal, but for a long time they have also
been used to bring energy consumption into line with Sweden's energy
efficiency and renewable energy goals73. The energy tax on motor fuels is
also designed to absorb external traffic-related costs, such as wear to road
surfaces and noise. The energy tax on fuel varies depending on whether it
applies to motor fuel or heating fuel. The level of taxation on heating fuels
also varies between the domestic, industrial and energy supply sectors (see
Section 3.2 for current levels of taxation).
Both energy and carbon tax are charged on petrol and diesel for road
vehicles, machinery, private vehicles and aircraft. To take account of
inflation and economic developments, energy and carbon taxes on fuel are
also adjusted to reflect changes in the Consumer Prices Index (CPI) and
Gross Domestic Product (GDP)74.
In some cases, Sweden applies a tax reduction for sustainable biofuels. All
high-blend sustainable biofuels are exempt from both energy tax and carbon
tax. Sweden has state aid approval for current tax relief on high-blend liquid
biofuels and biogas until the end of 202075. Biofuels blended into gasoline or
diesel are covered by the reduction obligation (see the section on the
transport sector below) and therefore subject to the same tax per litre as the
fossil fuels they are blended with. The carbon tax on the finished fuel has
been determined on the basis of the average fossil carbon content, taking
account of the target for the average content of blended biofuel (see Section
3.2 for the current levels of taxation).
There is no energy or carbon tax on fossil fuel for national and international
commercial shipping and aviation.
Both energy and carbon tax is applied to fuel used for heating. Biofuel is
exempt from both taxes. Other fuels used to generate heat in combined heat
and power (CHP) and other heat generation plants within the EU ETS are
subject to 91% carbon tax and the full rate of energy tax. The rate for CHP
plants has increased significantly since 1 August 2019, when the fuel was
subject to an 11% carbon tax and 30% energy tax. CHP plants outside the
72 Energy tax is a collective term for excise duties on fuel and electricity and is governed by the Energy Tax Act, see (1994:1776). 73 The energy efficiency goal and the renewable energy goal for 2020 are set out in Government bill 2008/09: 162 and 163. 74 The annual adjustment of tax rates for petrol and diesel takes account of changes in GDP by applying a flat-rate of 2% in addition to the CPI adjustment. This
additional adjustment is applied both to energy and carbon tax but is expressed as an increase in energy tax. This additional indexation was neutralised in the petrol and diesel tax adjustment in 2020. 2019/20:1 expenditure area 22). 75 C(2015) 9344 final, C(2015) 9345 final.

43 (199)
EU ETS pay the full rate of energy and carbon tax on the fuel used to
generate heat. This is also an increase, as only 30% energy tax was paid on
this fuel until 1 August 2019 (see Section 3.2 for current levels of taxation).
The fuel used to generate electricity is exempt from both energy and carbon
tax, but electricity consumption is generally subject to the energy tax on
electricity (see Section 3.2 for current levels of taxation).
Some energy and carbon tax exemptions and reduction are applied to
industry, mainly because most of the manufacturing sector is already covered
by the EU ETS. These parts of the manufacturing sector pay 30% of the
general energy tax on heating fuel and are completely exempt from carbon
tax. The parts of the manufacturing sector outside the EU ETS also pay
30% of the energy tax on the heating fuel used in the manufacturing process.
These sectors previously paid significantly less carbon tax, but this has
gradually increased in recent years. The tax reduction was removed entirely
in 2018 and carbon tax is now applied in full.
Until 31 July 2019, energy and carbon tax on diesel for on-track machines
(OTMs) in the mining industry (‘mining diesel’) was charged at 11% and
60% of the general levels of taxation respectively. This energy and carbon
tax reduction was abolished on 1 August 2019 (see Section 3.2 for current
levels of taxation).
The agriculture, forestry and aquaculture sectors pay 30% of the general
energy tax on heating fuel. Carbon tax reductions were also applied to these
sectors, but they have been reduced gradually and the full carbon tax has
applied since 2018.
A special reduction of the carbon tax on diesel for machinery in the
agriculture, forestry and aquaculture sectors has been reduced gradually from
SEK 2.10 a litre (2011) to SEK 1.43 a litre (up to 30 June 2019). From 1 July
2019 to 31 December 2019 the tax reduction was increased again to
SEK 2.24 a litre. Energy tax on this fuel was reduced to SEK 0.19 a litre in
the same period.
The Klimatkliv
Since 2015, all types of organisation, except for those belonging to the EU
ETS, have been able to apply for local climate investment.76 The candidates
compete for this investment on the basis of the estimated reduction in
greenhouse gas emissions per krona. Examples of eligible investments are
76 Investments in sectors within the EU ETS may still be eligible if they increase the utilisation of waste heat.

44 (199)
charging infrastructure for electric vehicles, biogas plants, switching from
fossil oil to biofuel or district heating, the expansion of smaller district
heating networks, destruction of nitrous oxide in the healthcare sector, cycle
paths and cycling infrastructure. In 2019, the Government budgeted
SEK 1.5 billion for the Klimakliv initiative.
The Environmental Code and the Planning and Building Act
The horizontal environmental legislation is collected in the Environmental
Code, which has the overall purpose of promoting sustainable development.
The code is applied with reference to Sweden's environmental quality goals,
including Limited Impact on the Climate (see Section 2.1.1 for this goal).
The Environmental Code includes general rules to be followed by all
operations and measures. It also contains a requirement to use the best
available technology. Large environmentally hazardous operations require a
permit. The process for granting a permit includes an assessment of direct
and indirect environmental impact and energy management and, for
installations that are not part of the EU ETS, an assessment of greenhouse
gas emissions. However, requirements for greenhouse gas emissions may not
be imposed on operations that are part of the EU ETS.
Land-use planning is governed mainly by the Planning and Building Act
(2010:900), which requires environmental and climate aspects to be taken
into account in planning. Some infrastructure projects are assessed under the
Environmental Code instead, either directly or by reference from other
legislation.
Communication about climate matters
The Swedish authorities have many years of experience with using
communication as a policy for the public sector, business and the general
population. Examples include the following:
• the Swedish Environmental Protection Agency’s website
www.naturvardsverket.se is a hub for facts and statistics
about emissions and is widely used by politicians, the media,
companies, organisations and researchers;
• the Swedish Meteorological and Hydrological Institute
(SMIH) develops and distributes information about weather,
water and climate change; the Swedish National Knowledge
Centre for Climate Change Adaptation, part of the SMHI,
has launched a Swedish climate change portal, providing
information and guidance on adaptation to a warmer
climate;
• the Swedish Energy Agency is responsible for giving energy
efficiency information and advice to companies and the
general population and for providing a reliable and

45 (199)
sustainable energy supply; it also runs an informative
website and assists with local energy advice (for more
information, see Energy and climate advisory services
below);
• the Swedish Forest Agency and the Swedish Board of
Agriculture focus on e-services and digital information
for land and forest owners, forestry workers and
farmers about reducing the impact of climate on
forestry and agriculture; and
• The Swedish Transport Administration is tasked by the
Government with providing information and raising
awareness to help meet the domestic transport milestone
and creating the conditions for Sweden to meet its net
zero emissions target by 2045.
Fossil-Free Sweden
The Government’s Fossil-Free Sweden initiative was launched in 2016 to
improve dialogue between the Government and business, municipalities,
other public operators and civil society77.
The Government has appointed a national coordinator for Fossil-Free
Sweden who acts as a link between the operators and the Government to
remove obstacles and accelerate the reduction in greenhouse gas emissions.
The initiative is an important platform for dialogue and cooperation between
major operators for a competitive climate transition.
It currently involves around 400 operators and is open to anyone who
supports the declaration. The operators involved in the initiative share the
belief that the world must be fossil-free and that Sweden must take a lead on
this. The declaration also commits operators to take certain specific actions
to reduce emissions.
The initiative includes sectoral roadmaps which highlight the commercial
possibilities for companies and sectors to become fossil free. Fourteen of
these roadmaps were presented to different sectors in 2018–2019. They are a
good basis for constructive cooperation between the Government and
business on the path to the joint climate goals.
The work includes giving advice and publicising the vision for a fossil-free
society, highlighting the opportunities presented by the transition.
Energy and climate advisory services
77 http://fossilfritt-sverige.se/.

46 (199)
The Swedish Energy Agency provides municipalities with Government
funds so that they can give local climate and energy advice to private
individuals and small businesses. Almost every Swedish municipality has a
local climate and energy advisor, who provides objective information
tailored to the locality and advises on energy efficiency measures, energy
consumption and climate-related issues in buildings and households.
The Swedish Energy Agency also gives financial assistance to the 15 regional
energy offices which coordinate the energy and climate advisors. The energy
offices initiate and participate in many energy efficiency and renewable
energy projects funded by the EU, the county councils, regional associations
and other organisations. The offices work regionally with companies, county
councils, municipalities and others bodies, for example on producing plans
and strategies.
Regional climate and energy strategies
The county councils coordinate regional climate and energy initiatives and
support regional operators, for example by gathering and disseminating
information. The county councils have worked with other regional and local
operators on regional climate and energy strategies based on the long-term
energy and climate policy targets adopted by the Riksdag, with the aim of
producing effective measures and synergies. The county councils also
contribute to environmental assessments and environmental monitoring,
local and regional town and country planning, regional development and
growth policy and infrastructure planning.
Public procurement
There is great potential for using public procurement to reduce emissions
and promote innovative and climate-smart solutions.
In its national procurement strategy, the Government stated that Sweden
must lead the way and continue to set the standard for green public
procurement, and that the life-cycle should be considered in every phase of
procurement. The new procurement legislation, including the Public
Procurement Act (2016:1145), explains how environmental and climate
aspects can be taken into account.
The transport sector
Reduction obligation – switching fuels
An obligation to reduce petrol and diesel consumption was introduced on 1
July 2018 to promote the use of biofuels78. All fuel suppliers must therefore
reduce the greenhouse gas emissions of petrol and diesel over their entire
78 Act (2017:1201) on Reducing Greenhouse Gas Emissions by Adding Biofuels to Petrol and Diesel.

47 (199)
life-cycle by a certain percentage every year by gradually increasing the
amount of added biofuel (see Table 8). The reduction obligation makes an
important contribution to phasing out fossil fuels in transport.
Table 8. 2018–2020 reduction levels under the Reduction Obligation Act79
.
Year 2018 2019 2020 Diesel 19.3% 20% 21% Petrol 2.6% 2.6% 4.2%
The Government has asked the Swedish Energy Agency to suggest
reduction levels for 2021–2030. It has also examined whether the same
reduction should apply to petrol and diesel and whether or not high-blend
biofuels should be included in the reduction obligation. The report on this
task was submitted in June 201980 and it was completed on 25 October 2019.
The process for successively increasing the reductions after 2020 is
continuing.
Bonus-malus system for new light-duty vehicles
A bonus-malus system has been in force in Sweden since 1 July 2018. The
system means that purchases of low carbon vehicles qualify for a bonus,
while high carbon vehicles are subject to a higher rate of vehicle tax for the
first three years. A carbon-based vehicle tax is applied from year four
onwards (see below). The system covers purchases of new cars, light-duty
buses and light-duty trucks. From 1 January 2020, vehicle tax and the bonus
for new vehicles will be based on the Worldwide Harmonised Light Vehicle
Test Procedure (WLTP), a new, more accurate method for measuring a
vehicle’s fuel consumption. Since the new method generally produces higher
emission measurements, the changeover will lead to tougher environmental
governance.
Carbon-based vehicle tax
To give buyers an incentive to choose cars, light-duty trucks, light-duty
buses and mobile homes with low greenhouse gas emissions, Sweden applies
different annual tax rates based on the vehicle's carbon emissions per
kilometre, which means that vehicles with low carbon emissions are taxed at
a lower rate than those with high emissions. This tax applies to vehicles
purchased before the bonus-malus system was implemented in July 2018 and
will continue to apply to vehicles that ‘leave’ the bonus-malus system three
years after purchase.
Lower taxable value for vehicles with environmental technology
Company cars account for 50% of new vehicle registrations in Sweden and
employees can use a large proportion of them privately. The benefit of using
79 Act (2017:1201) on Reducing Greenhouse Gas Emissions by Adding Biofuels to Petrol and Diesel. 80 The Swedish Energy Agency – Kontrollstation 2019 för reduktionsplikten (ER 2019:27).

48 (199)
an employer’s car for private travel is generally taxable and the value is
calculated on the basis of a separate rate. Under a rule introduced to support
the introduction of environmentally friendly cars to the market, the value of
environmentally friendly company cars is reduced to the price of the closest
comparable new car without that technology. The taxable value of electric
cars, plug-in hybrids and cars that run on gas (excluding gasoil) can be
reduced even further.
Requirements for biofuels at filling stations – The Pump Act
To improve the availability of renewable fuels, Sweden has passed a law81
requiring filling stations with sales of over 1 500 m3 of petrol or diesel to
offer at least one type of renewable fuel.
Environmental information about fuels
The Government has amended the Fuels Ordinance (2011:346) to enable
consumers to obtain information about the origin and environmental impact
of fuels at the pump. The Ordinance obliges fuel suppliers to provide
consumers with information based on their annual reports to the Swedish
Energy Agency under the Fuels Act (2011:319).
The environmental information must be available at the pump and must
provide a summary of a fuel’s greenhouse gas emissions over its entire life-
cycle, its raw materials and their country of origin. More details can be found
on the fuel supplier’s websites. Small fuel suppliers are exempt from the
requirement to provide information to avoid the excessive administrative
costs they would incur. The information requirement will therefore be
voluntary for companies supplying less than 1 500 m3 of liquid or
1 000 000 m3 of gaseous fuels a year.
The Swedish Energy Agency is currently developing detailed requirements
for the environmental information. The information requirement will come
into force in May 2020.
Electric bus incentive payment becomes a climate incentive payment
The regional public transport authorities (municipalities and companies
which the regional public transport authorities have authorised to enter into
public transport contracts) and private operators of public transport services
can apply for an electric bus incentive payment. This payment applies to
electric buses, plug-in hybrid buses, trams and fuel cell buses for public
transport.82 The amount of the payment depends on the number of
passengers and whether the buses are electric only or hybrid. It is designed
to support the introduction of electric buses to the market. The budget for
81 Act (2005:1248) on the obligation to provide renewable fuels. 82 Ordinance (2016:836) on Electric Bus Incentive Payments.

49 (199)
the electric bus incentive payment in 2019 is SEK 80 million.
From 2020, the electric bus incentive payment will become a climate
incentive payment. This will make it possible to apply for support for
electric trucks and other environmentally friendly trucks and electric
machinery as well as electric buses; in combination with the continuing
support for electric buses this will promote the introduction of these
vehicles to the market. The budget for this will be increased to SEK 120
million in 2020.
Urban Environment Agreement
In 2015, the Government introduced a special grant for sustainable urban
environments, the Urban Environment Agreement. The grant is intended
for municipalities and county councils and amounts to SEK 1 billion a year
for 2018–2029, or SEK 12 billion in total. The Urban Environment
agreement is financed via the economic framework of the 2018– 2029
National Transport Infrastructure Plan. The measures are intended to
produce energy-efficient solutions with low greenhouse gas emissions and
contribute to achieving the environmental quality goal High Quality Built
Environment. The grant provides municipalities and county councils with up
to 50% Government funding for infrastructure for public transport and,
since 2017, for cycling. In April 2019, the Government decided to amend
the Ordinance (2015:579) on Support for Sustainable Urban Environments
to include goods transport measures in the Urban Environment Agreement.
The amendments came into force on 22 May 2019. Municipalities and
county councils which have been given grants must use them to increase the
proportion of sustainable transport or build more houses.
Sustainable cities with a focus on climate-smart mobility
The Government has appointed the Swedish Energy Agency as main project
manager and administrator of the Nordic Council of Ministers’ Sustainable
Nordic Cities project, focusing on climate-smart mobility. The project will
consist of five sub-projects:
1. the launch and the concluding conference on sustainable
cities, focusing on climate-smart travel and transport;
2. the presentation of good examples and
recommendations for ways of increasing the number
of zero-emission vehicles in cities;
3. discussions, exchanges of experience and
recommendations for promoting attractive and climate-
smart transport in cities;
4. exchanges of experience and attempts to find solutions
for charging electric vehicles in cities; and
5. development of a database of electric vehicle charging

50 (199)
stations.
The Government has commissioned the Swedish Transport Administration
to lead the sub-project on attractive and climate-smart transport in cities. It
must submit a report on its work to the Infrastructure Department by 15
March 2021.
Long-term infrastructure planning
In May 2018 the Government decided to introduce a new national transport
infrastructure plan for all modes of transport for 2018–2029. The Swedish
Transport Administration is responsible for long-term planning for all
modes of transport and for implementing the plan. The plan will be
prepared in consultation with municipal and regional authorities and other
stakeholders.
Eco-bonus system for shipping
Since 2018 the Government has allocated funding to an eco-bonus system
to encourage the transfer of goods transport from roads to shipping. The
aim is to reduce the greenhouse gas emissions from the transport of goods.
In its draft budget for 2020, the Government proposed extending the system
until 2022 with an allocation of SEK 50 million a year.
National goods transport strategy
In June 2018 the Government decided to introduce a national goods
transport strategy83. The strategy highlights three priorities for further work.
There are action areas for each priority, subdivided into six action areas for
Competitive and Sustainable Goods Transport, five for Transition to Fossil-
Free Transport and three for Innovation Competence and Knowledge. The
Government has issued a number of assignments under the goods transport
strategy. It has also set up a national goods transport council.
Electrification commission
The Government will commit SEK 5 million a year until 2022 for an
electrification commission to accelerate work on the electrification of the
transport sector84. The electrification commission will help to accelerate
investments in electric roads, charging infrastructure for electric trucks and
other effective applications. The commission will also shed light on matters
related to funding, how quickly roads can be electrified, and the effects of
converting goods transport on the electricity supply. It will work with the
business community and relevant stakeholders, as a matter of urgency, to
produce an action plan for electrification of Sweden's busiest roads and will
investigate other electrification options.
83 https://www.regeringen.se/regeringens-politik/nationell-godstransportstrategi/. 84 https://www.regeringen.se/artiklar/2019/09/sarskilda-satsningar-i-hostbudgeten-inom- infrastrukturdepartementets-politikomraden/.

51 (199)
Electric roads
Electric roads are infrastructure for dynamic charging, in other words
charging en route. Depending on the technology chosen, they can be used
by trucks, buses and cars. A demonstration project is being carried out on
the E16 outside Sandviken (heavy goods vehicles) and at Arlanda airport
(heavy goods vehicles and cars). In April 2019, the Swedish Transport
Administration decided to launch two more demonstration projects, which
are currently being carried out in Lund (public transport) and on Gotland
(heavy goods vehicles and public transport). The demonstration project on
Gotland uses induction, so there is no need for a fixed connection with the
vehicle, while the other projects use conduction, so the vehicle has to be
physically connected to the electricity supply. The Swedish Transport
Administration is currently preparing to build the first permanent electric
road. The Government believes that electric roads will increase the
efficiency of goods transport and reduce greenhouse gas emissions. It
therefore intends to develop a long-term plan to construct and expand
electric roads. Major goods routes and links to ports should be prioritised.
The need for complementary technologies to allow vehicles to run on
electricity outside the electric road network, for example rapid charging
points for heavy goods traffic, should be addressed in future work.
Public procurement of transport
Since 2009 the cars purchased or leased by public authorities have had to be
environmentally friendly85. Many municipalities and companies voluntarily
apply the same requirements when purchasing or leasing vehicles.
The Vehicle and Public Transport Service Procurement (Environmental
Requirements) Act (2011:846) sets out the criteria to be met for the public
procurement of cars and public transport services. These criteria aim to
reduce environmental impact by setting requirements for aspects such as
energy consumption and emissions.
According to FRIDA, the Swedish Environment and Vehicle Database for
Public Transport86 around 85%87 of public transport ran on renewable fuels
in 2018. Statistics from the Swedish Confederation of Transport
Enterprises88 show that 63% of busses ran on fuels other than conventional
diesel in 2017.
Procurement authorities apply criteria for public procurement of passenger
transport, goods transport, fuel, tyres, public transport and vehicles89 which
help those procuring transport to set requirements.
85 The Ordinance (2009:1) on Environmental and Road Safety Requirements for Cars and Car Journeys by Public Authorities. 86 https://www.svenskkollektivtrafik.se/verktyg-och-system/frida-miljo-och-fordonsdatabas/. 87 Percentage of vehicle kilometres with renewable fuels. 88 Statistics for the bus sector, Swedish Confederation of Transport Enterprises. 89 https://www.upphandlingsmyndigheten.se/hallbarhet/stall-hallbarhetskrav/fordon-och-transport/.

52 (199)
Coordination of charging infrastructure and renewable fuels which
require specific infrastructure
The Swedish Energy Agency is tasked with coordinating support for the
vehicle charging and renewable fuels infrastructure and providing
information about the location of charging stations and filling stations for
biodiesel, E85 and ED95, vehicle gas and hydrogen. This includes support
for the Swedish Environmental Protection Agency under the Klimakliv
initiative along with expertise and advice on setting priorities, information
about the geographical distribution and assessment of support granted. As
part of its coordination work, the Swedish Energy Agency has held
discussions with the county councils about developing regional plans for the
renewable fuels infrastructure.
It has focused its work on the charging infrastructure on increasing the
capacity of society operators, by involving relevant operators in the
development of a suitable charging infrastructure. In its work on the
renewable fuels infrastructure it has focused on collecting knowledge and
experience of renewable fuels which require specific infrastructure by
increasing access to relevant and reliable information about the
infrastructure for various operators.
Rapid charging along major roads
In response to the Government’s proposal in the draft budget for 2020, the
Riksdag has introduced support for rapid charging infrastructure along
major roads to cover the large areas which do not have this infrastructure
yet90. The Government proposes spending SEK 50 million over three years
on this expansion.
The county councils’ task to prepare regional plans for infrastructure for electric
vehicles and renewable fuels
In its 2018 spending authorisation, the Government tasked county councils
with preparing regional plans for infrastructure for electric vehicles and
renewable fuels. This is part of the county councils’ long-term leadership
and coordination of regional work in all areas relevant to the energy
transition and reduced climate impact. A report on the regional plans must
be submitted by 31 January 2020.
Measures to improve information and raise awareness of the
transition to a fossil-free transport system
In April 2019, the Government tasked the Swedish Transport
Administration with taking measures to improve information and raise
awareness of the transition to a fossil-free transport system. These measures 90 Government bill 2019/2020:1 expenditure area 21, Report 2019/20:NU3, Riksdag communication 2019/20:110.

53 (199)
are intended to contribute to meeting the Riksdag’s climate target of
reducing the 2010 levels of greenhouse gas emissions from domestic
transport, excluding aviation, by at least 70% by 2030, and to enable Sweden
to achieve net zero emissions by 2045.
This project will continue until 31 December 2022, but the Swedish
Transport Administration must submit a report by 30 June 2021 outlining
the measures that should be taken to improve information and raise
awareness of the transition to a fossil-free transport system during the rest
of the planning period (2023–2029). The Swedish Transport
Administration’s main tasks for this project are:
• to hold an annual conference to discuss progress towards
meeting the Riksdag's climate target for transport;
• to prepare an annual summary of ongoing work, concentrating
on measures which may produce significant climate benefits,
which are to be used by the relevant authorities and operators
when planning and implementing their work on the climate
target for transport; and
• to create an arena for access to fossil-free fuels and efficient
transport in cities, provide more information about owning and
driving electric vehicles to encourage electrification of the
transport system, and take measures to improve information and
raise awareness to help the municipalities and county councils to
develop their climate requirements for procurement of transport
infrastructure.
Tax on air travel
On 1 April 2018 a tax on air travel was introduced in Sweden to reduce its
impact on the climate91. The tax is levied on commercial air travel and must
be paid for passengers travelling from an airport in Sweden by the air carrier
with which they are travelling.
The amount of the tax depends on the passenger's final destination (in 2020:
SEK 62, 260 or 416).
Night trains abroad
The Government wants to give people a better choice of public transport
with a low climate impact. On 11 July 2019 it tasked the Swedish Transport
Administration with investigating the possibility of providing daily night
train services to several European cities. It must submit proposals for the
transport to be procured, prepare a timetable for implementation and assess
the cost to the state. It must also investigate other options for providing
night train services abroad and for the state to contribute to replacing the
91 Air Travel (Tax) Act (2017:1200).
54 (199)
transport procured with a commercially operated service as soon as possible.
The Swedish Transport Administration must submit an interim report of its
findings by 15 January 2020 and a final report by 20 April 2020.
The waste sector
Ban on dumping combustible and organic material and methane collection
The dumping of combustible and organic waste is banned under the
Ordinance (2001:512) on the Dumping of Waste. The Ordinance also
governs the collection and disposal of methane from landfill sites.
Waste Tax Act
A tax on waste disposed of in landfill sites was introduced in 200092. The tax
has increased gradually and has been indexed at 2% above CPI a year since
2019. In 2019 the tax is SEK 520 per tonne of waste taken to a landfill site.
Producer responsibility
The producer responsibility legislation contains national recycling targets;
eight product groups are covered by a number of ordinances93. Producer
responsibility promotes the sorting, collection and recycling of waste
streams. It also aims to reduce the amount of waste and to give producers an
incentive to develop more resource-efficient products, which are easier to
recycle and do not contain substances that are harmful to the environment.
Municipal waste plans
Under the Environmental Code, municipalities must have a waste plan
which covers all types of waste and sets out the measures required to
manage waste in an appropriate way to protect the environment and
conserve resources. The waste plan must also include measures to reduce the
amount and hazardousness of waste94.
The forestry sector
The 2014–2020 Rural Development Programme
The Rural Development Programme for 2014–2020, which is part of the
EU’s Common Agricultural Policy (CAP), includes investments for young
entrepreneurs, capacity building, cooperation and innovation, and support
for organic farming, environmental and climate measures, and animal
welfare. Measures specifically intended to reduce greenhouse gas emissions
are those designed to increase energy efficiency, the product and use of
92 Waste Tax Act (1999:673). 93 The Ordinance (2018:1462) on Producer Responsibility for Packaging, the Ordinance (2018:1463) on Producer Responsibility for Recovered Paper, the Ordinance
(2007:185) on Producer Responsibility for Cars, the Ordinance (1994:1236) on Producer Responsibility for Tyres, the Ordinance (2014:1075) on Producer Responsibility for Electrical Equipment, the Ordinance (2008:834) on Producer Responsibility for Batteries, the Ordinance (2009:1031) on Producer Responsibility for Medicinal Products and the Ordinance (2007:193) on Producer Responsibility for Certain Radioactive Products and Orphan Sources. 94 The Swedish Environmental Protection Agency's Regulations (2006:6) for Municipal Waste Prevention and Management Plans.
55 (199)
renewable energy (including the production of biogas and the planting of
perennial energy crops), conversion from fossil to renewable energy sources,
improved manure management, more efficient nitrogen use, climate and
energy advice, measures to prevent nitrogen leaks, restoration and
establishment of wetlands, promotion of forage and catch crops on
agricultural land, the conservation of natural pastures and other separate
climate and energy projects. The budget for the whole duration of the
programme is SEK 36 billion, 59% of which is funded by Sweden and the
remaining 41% by the EU.
The Rural Development Network
The Rural Development Network completes Sweden's Rural Development
Programme. The Network brings together local, regional and central
operators to exchange information and experience, with the aim of
improving the implementation of its EU-related programme. The
Government has given the Swedish Board of Agriculture the task of
ensuring that the Rural Development Network operates effectively.
Advice on plant nutrients – ‘Keeping Hold of Nutrients’
The Swedish Board of Agriculture offers an advisory service called ‘Keeping
Hold of Nutrients’ together with the Federation of Swedish Farmers and the
county councils. The service is funded by the Regional Development
Programme and has been giving advice on increasing the efficiency of
nutrients to reduce leaching since the beginning of 2001. It also gives advice
specifically on reducing greenhouse gas emissions, which is one of its main
objectives, and on energy efficiency.
Support for biogas from manure
Since 2015 there has been a support system for production of biogas from
anaerobic digestion of manure95. The support aims to increase the
production of biogas from manure, obtaining twice the environmental and
climate benefits by reducing methane emissions from manure and replacing
fossil energy. Many environmental benefits can be obtained by digesting
more manure. It reduces greenhouse gas emissions and eutrophication of
fresh and marine water and produces biogas which can be used as energy.
The biogas obtained can be used to generate electricity or heat and as a fuel
for vehicles. The maximum support is SEK 0.40 per kWh of biogas
produced. The Rural Development Programme can also provide support for
investment in new biogas plants.
Biogas support
In 2018, temporary support was introduced for production of biogas
upgraded to vehicle gas (biofuel) which was not produced from sewage
95 The Ordinance (2014:1528) on State Support for the Production of Biogas.

56 (199)
sludge or landfill gas96. To improve competition in the sector, and in
response to the Government's proposal in the revised budget in autumn
2019, the Riksdag decided that a total of SEK 100 million in support should
also be paid out for this type of biogas production in 201997.
Land Use, Land-Use Change and Forestry (LULUCF)
The Forestry Act
The Forestry Act (1979:429) has two overall objectives of equal importance:
to support production and to protect the environment The production
objective is to use forests and woodlands efficiently and responsibly so that
they provide a sustainable yield. Forestry production must focus on flexible
use of forestry products. The environmental objective is to preserve the
natural productive capacity of woodlands. The bio- and genetic diversity of
forests must be secured. Forests must be managed in a way that allows
viable populations of naturally occurring plant and animal species to survive
under natural conditions. Endangered species and habitats and heritage
forests and their aesthetic and societal value must be protected.
Rules for land drainage
The Environmental Code contains rules for land drainage which can also be
used to reduce emissions from this land. Land drainage is carried out to
remove water from the land or to protect it from water. For measures to be
classified as land draining as defined in the Environmental Code, they must
be intended to make the land more suitable for a particular long-term
purpose, such as cultivation, development, peat cutting, road construction,
landscaping or golf courses.
Since 1986, a permit has been required for land drainage under the
Environmental Code. Land drainage is forbidden in large areas of Southern
Sweden, where it is particularly important to preserve wetlands. This means
that conservation measures are stricter and there is a two-stage process for
land drainage permits. Applicants must first obtain an exemption from the
land drainage ban and then permission for drainage. Land drainage is
prohibited in the rest of the country and on sites protected under the
Ramsar convention98.
Provisions for nature reserves and protection of natural habitats in the
Environmental Code and conservation agreements
In Sweden forests and land are set aside for the conservation of biodiversity,
the care and conservation of valuable natural habitats, the protection,
96 See the Ordinance (2018:1501) on State Support for the Production of Biogas for Use as Biofuel. 97 Government bill 2019/20:2, Report 2019/20:FiU11, Riksdag communication 2019/20:60. 98 The Ramsar convention is a global convention for the conservation of wetlands and aquatic environments and uses them sustainable:
https://www.naturvardsverket.se/Miljoarbete -i-samhallet/EU-och- internationellt/Internationellt-miljoarbete/miljokonventioner/Vatmarkskonventionen/.

57 (199)
restoration or creation of valuable natural habitats and for open-air
recreation. These measures in the form of nature reserves, conservation
agreements and voluntary setting aside of land also benefit carbon storage in
forest biomass and land carbon, by maintaining or increasing it.
In Sweden and many other countries, nature reserves99 are one of the most
common ways of protecting valuable natural environments in the long term.
At the moment there are nearly 5 000 nature reserves in Sweden. Chapter 7
of the Environmental Code contains provisions for the establishment of
nature reserves. The Swedish Environmental Protection Agency is in charge
of this work.
Conservation agreements
Conservation agreements100 are civil-law agreements under which the state or
a municipality agrees to pay property owners a certain amount of money not
to use land for forestry, for example. The Swedish Forest Agency and the
Swedish Environmental Protection Agency provide joint guidance on setting
up these agreements. It should not make any difference which authority a
landowner makes an agreement with.
Sweden’s National Forest Programme
The Government adopted the strategy for Sweden's National Forest
Programme101 on 17 May 2018. The strategy is governed by the
Programme’s vision: ‘Forests – green gold – must provide jobs and
sustainable growth for the whole country and contribute to the development
of a growing bioeconomy.’ An action plan, containing specific measures
based on the Forest Programme’s vision and objectives, has been
developed102 for the strategy. The availability of sustainable biomass from
Swedish forests has an important part to play in the transition to a fossil-free
society. The action plan contributes to Sweden's climate work by
establishing targets and measures to increase the national supply of bio-
based alternatives.
Advice, education and training on forest management
The Swedish Forest Agency provides forest owners with information about
how climate change will affect their forests. It also issues guidance on how
owners can best use and manage their forests to achieve their specific aims.
The energy supply sector
99 http://www.naturvardsverket.se/Var-natur/Skyddad-natur/Naturreservat/. 100 http://www.naturvardsverket.se/Stod-i-miljoarbetet/Vagledningar/Skyddad-natur/Naturvardsavtal/. 101 https://www.regeringen.se/49bad6/contentassets/34817820f e074cb9aeff084815bd3a9f/20180524_hela.pdf. 102 https://www.regeringen.se/4a095b/contentassets/7cbc4c534fb3457385ff1d7f32e3e512/handlingsplan-for-sveriges-nationella-skogsprogram-2018.pdf.

58 (199)
Policies and measures for this sector are described in Section 3.1.2.
The housing and services sector
Policies and measures for this sector are described under the dimension
Energy Efficiency in Section 3.2.
The industry sector
The ‘Industrikliv’ is a state initiative which assists Swedish industry with the
development of technologies and processes for reducing process-related
greenhouse gas emissions. It is described under Research, innovation and
competitiveness in Section 4.6.
Other policies and measures for the sector are described in the dimension
for energy efficiency in Section 3.2.
3.1.1.2 Where relevant, regional cooperation in this area.
On 1 January 2019, the prime ministers of the Nordic states adopted a
declaration undertaking to make their countries carbon neutral. The
declaration highlights many areas for increased Nordic cooperation and
work has started on identifying potential new areas. In August 2019, the
prime ministers adopted a new vision for Nordic cooperation which aims to
make the Nordic region the world’s most sustainable and integrated region
by 2030. Action on the climate is also at the heart of this vision. Nordic
companies and sustainability solutions have great potential to play a key role
in the green conversion of the global economy.
Nordic experience and know-how can help to promote higher ambitions
under the Paris Agreement and encourage dialogue with other countries in
international negotiations. The objective of the Nordic Environmental and
Climate Cooperation Programme for 2019–2024, which was negotiated
under Sweden’s leadership, is therefore that the Nordic countries should
contribute to the ambitious implementation of the Paris Agreement and
continue to take a leading role in the necessary climate transition.
During its presidency of the Nordic Council of Ministers in 2018, Sweden
took the initiative to promote closer cooperation on sustainable Nordic
cities. The presidency project to promote the transition to climate-smart
mobility in cities and sustainable solutions for the Nordic region with a
focus on building in wood and sustainable architecture and design runs from
2018–2020 and will increase the exchange of information and joint actions.
The Nordic Environment Finance Corporation (NEFCO) plays an
important part in the green transition. NEFCO's focus on climate, green

59 (199)
growth, the Baltic Sea and the Arctic and Barents Sea are entirely in line with
the Government's priorities. It is also the only Nordic institution with Green
Climate Fund (GCF) accreditation, which enables Nordic operators to carry
out climate measures in cooperation with the fund.
Nordic cooperation as a priority for the Government, which is working to
intensify it.
3.1.1.3 Without prejudice to the applicability of State aid rules,
financing measures, including Union support and the use of Union
funds, in this area at national level, where applicable
3.1.2 Renewable energy
3.1.2.1 Policies and measures to achieve the national
contribution to the binding 2030 Union target for renewable
energy and trajectories as referred to in point (a)(2) Article 4, and,
where applicable or available, the elements referred to in point
2.1.2 of this Annex, including sector- and technology-specific
measures.
The electricity certificates system
The aim of the electricity certificates system103 is to stimulate the growth of
renewable electricity. The system was introduced in Sweden in 2003 and has
been operated jointly with the other Nordic countries since 2012. The
countries have a common goal to use the system to increase renewable
electricity generation to 28.4 TWh by the end of 2020. Sweden has
undertaken to fund 15.6 TWh and Norway 13.2 TWh, but it is up to the
market to determine when and where the new electricity will be generated.
In June 2017 the Swedish Government decided to extend the electricity
certificate system until 2045 and to increase it by 18 TWh by 2030. Norway's
target for 2020 is the same and no new target will be introduced in Norway
after 2020.
Sweden is funding the higher target of 18 TWh, which will be achieved by
applying a linear increase of 2 TWh a year from 2022 until 2030.
The electricity generators that fulfil the requirements of the Electricity
Certificates Act (2011:1200) receive an electricity certificate for each
megawatt hour (MWh) of electricity they generate, which they can then sell
on the open market. There is a demand for electricity certificates because all
electricity suppliers and some consumers are obliged to buy them for a
103 http://www.energimyndigheten.se/fornybart/elcertifikatsystemet/.

60 (199)
certain amount (quota) of the electricity they sell or consume. The number
of electricity certificates a supplier can buy increases every year in line with
the quota, which increases the demand.
Tax on waste incineration
The Riksdag has decided to introduce a new excise duty on incinerated waste
in response to the Government's proposal104. Biofuels, hazardous waste,
animal by-products and the production of some materials which contain
waste or waste residues will be exempted from the duty. The tax will be
charged at SEK 125 per tonne of waste, although the rate will be SEK 75
per tonne of waste in 2020 and SEK 100 per tonne in 2021. The rate will be
increased annually in line with general price increases from 2023 onwards. A
deduction for tax purposes can be applied to waste from an incineration
plant. The new tax comes into force on 1 April 2020.
Tax reduction for microgeneration of renewable electricity
To make it easier for private individuals and companies to invest in
generating renewable electricity for their own use, microgenerators have
been compensated for the surplus they feed into the grid since 2015105.
The tax reduction is SEK 0.60 per kWh for the surplus fed in to a
connection point with fuse of up to 100 amps in a calendar year. The ceiling
for reductions is SEK 18 000 a year.
Reduced energy tax for microgenerators of renewable energy
Electrical power generated in a plant with an installed generation capacity of
less than 50 kW by a generator with a combined installed generation capacity
of less than 50 kW, which not been transferred to a network and which is
covered by the grid concession and notified under Chapter 2 of the
Electricity Act (1997:857) is tax-exempt.
50 kW of installed generation capacity is equivalent to 125 kW of installed
generation capacity for electrical power generated by wind or waves, 255 kW
installed peak power for solar power and 50 KW installed capacity for other
energy sources without a generator. The installed capacities of electrical
power generated from different sources must be combined.
If the generator's total generation capacity exceeds 50 kW or the equivalent,
but not the capacity of a single plant, the energy tax can be reduced to
SEK 0.5 per kWh for electricity not transferred to a licensed network.
104 Government bill 2019/20:32, Report 2019/20:SkU12, Riksdag communication 2019/20:91. 105 Chapter 67, Section 27–33, Income Tax Act (1999:1229).

61 (199)
Changes to investment support for photovoltaic cells connected to the grid
Since 2009 state support has been given for the installation of photovoltaic
cells. It is directed at all kinds of operator – companies, public organisations
and private individuals. There is a lot of interest in the support and county
councils received around 52 000 applications up to April 2019, 29 000 of
which were granted.
Since 8 May 2019, the maximum support has been 20%. The amount of
support is calculated on the basis of the eligible installation costs. The
maximum support for each photovoltaic cell system is SEK 1.2 million and
the maximum eligible costs are SEK 37 000 plus VAT per installed kilowatt
of rated electrical capacity. The support covers installation of all types of
photovoltaic cell systems and hybrid solar electricity/heat systems. The
county councils deal with applications in the order received. The support is
limited and can only be given while the money set aside lasts. Systems
eligible for energy certificates can also obtain photovoltaic cell support.
The budget for photovoltaic cell support was SEK 585.6 million in 2017 and
SEK 1 085 million in 2018. The budget for the support in 2019 was
SEK 736 million. The scheme expires on 31 December 2020 and the budget
for 2020 has been set at SEK 835 million106.
Renovation, conversion and extension deduction for photovoltaic cells or solar heat
The tax deduction for renovation, conversion and extension applies to the
labour costs for house repairs, maintenance, conversions and extensions107.
It was introduced in 2008 to increase the supply of labour and reduce
undeclared work108. Private individuals can obtain a deduction of around 9%
of the investment costs for installing photovoltaic cells or solar heating
systems109 .
Support for storage for self-generated electrical energy
Storing energy can increase the efficiency of the energy system. A grant for
storage of self-generated electrical energy was introduced in November 2016
to enable customers to store more of their self-generated energy. It provides
financial support for private individuals installing storage systems110. The
grant has an annual budget of SEK 60 million and will end in 2020. Up to
60% of the cost of a storage system can be covered by the grant, however
the maximum payment is SEK 50 000.
106 Government bill 2019/20:1, Report 2019/20:NU3, Riksdag communication 2019/20:110. 107 The renovation, conversion and extension deduction is also described in Section 3.2. 108 Government bill 2006/07:94, Report 2006/07:SkU15, Riksdag communication 2006/07:181 and Government bill 2008/09:97, Report 2008/09:FiU18, Riksdag
communication 2008/09:183. 109 http://www.energimyndigheten.se/fornybart/solelportalen/vilka-stod-och-intakter-kan-jag-fa/stod-vid-investering/. 110 The Ordinance (2016:899) on Grants for the Storage of Self-Generated Electrical Energy.

62 (199)
By April 2019, the Swedish Energy Agency had paid around SEK 36 million
to the county councils, which administer the support.
Refunding of energy tax on electricity after battery storage
Under Chapter 11, Section 13 of the Energy Tax Act (1994:1776),
consumers have been able to apply for an energy tax refund on electricity
drawn from a licensed grid, stored and then fed back into the same licensed
grid, since 1 January 2019. This is to avoid unintentional double taxation.
Exemptions from network charges
Electricity consumers who have their own small111 generation plants and
who consume self-generated electricity in addition to electricity purchased
from the grid, are exempt from electricity feed-in charges. However the
exemption applies only to consumers who have withdrawn more electricity
from the grid in a calendar year than they have fed into it. Examples of
consumers covered by this support include farms with small wind power
plants and buildings with photovoltaic installations on the roof.
Smart and renewable energy systems on Gotland
The Government has commissioned the Swedish Energy Authority to
conduct a pilot project for the transition to a sustainable energy system on
Gotland; the project will be based on the three basic pillars of energy policy:
security of supply, competitiveness and sustainability. The first stage was to
produce a roadmap for the project, which was submitted to the Government
on 20 March 2019.112 The next stage is to implement the roadmap. The
measures in the roadmap cover the whole of the energy system and, in
principle, all sectors. They affect many major operators (public, private, not-
for-profit organisations and individual members of the public) not least
because they are responsible for implementing them. The project is expected
to take several years to complete.
3.1.2.2 Where relevant, specific measures for regional cooperation,
as well as, as an option, the estimated excess production of energy
from renewable sources which could be transferred to other Member
States in order to achieve the national contribution and trajectories
referred to in point 2.1.2.
Since 2011, Sweden and Norway have had a joint electricity certificates
market governed by a bilateral agreement. The aim of this joint electricity
certificates market is to increase renewable electricity generation by 28.4
TWh between 2012 and 2020. Sweden will finance 15.2 TWh and Norway
13.2 TWh; it is up to the market to determine when and where the new
electricity will be generated. Sweden also aims to increase renewable energy
111 Exemption from network charges applies to electricity consumers with a contract for a power rating of up to 63 amps who generate electricity or are able to supply
electricity at an output of up to 43.5 kilowatts. 112 The Swedish Energy Agency – Gotland Energy Pilot Project. Färdplan för att möjliggöra att Gotland blir pilot för ett hållbart energisystem (ER2019:09).

63 (199)
generation by a further 18 TWh by 2030. This increase will be financed by
Sweden alone.
Reporting under the agreement between Sweden and Norway will be based
on a 50-50 distribution of electricity generation between the two countries
until each has reached 13.2 TWh and then on 100% generation by Sweden
(Article 14(2)).
3.1.2.3 Specific measures on financial support, where applicable,
including Union support and the use of Union funds, for the
promotion of the production and use of energy from renewable
sources in electricity, heating and cooling, and transport.
Information about specific financial support, including Union support, is
given in Section 3.1. The Regional Funds Programme is described in Section
3.2. The Connecting Europe Facility (CEF) aims to bridge gaps in the
European transport, energy and telecommunications networks, focusing
particularly on the cross-border parts of those networks. The facility aims to
improve competitiveness within the EU and to foster economic, social and
territorial cohesion, and has provided funding for Swedish projects over the
years.
3.1.2.4 Where applicable, the assessment of the support for
electricity from renewable sources that Member States are to carry
out pursuant to Article 6(4) of Directive (EU) 2018/2001.
Sweden has not prepared specific assessments of the effectiveness of
support schemes for the generation of renewable electricity and their major
distributive effects on different consumer groups, and on investments.
Under Article 6.4 of the revised Renewable Energy Directive113 Member
States must, at least every five years, assess the effectiveness of their support
schemes for electricity from renewable sources and their major distributive
effects on different consumer groups, and on investments. The Member
States must include the assessment in the relevant updates of their integrated
national energy and climate plans and progress reports in accordance with
the Energy Governance Regulation114.
3.1.2.5 Specific measures to introduce one or more contact
points, streamline administrative procedures, provide
information and training, and facilitate the uptake of power
purchase agreements. Summary of the policies and measures
under the enabling framework Member States have to put in
place pursuant to Article 21(6) and Article 22(5) of Directive (EU)
2018/2001 to promote and facilitate the development of self-
consumption and renewable energy communities.
113 Directive (EU) 2018/2001 of the European Parliament and of the Council of 11 December 2018 on the promotion of the use of energy from renewable sources. 114 Regulation 2018/1999 (EU) of the European Parliament and of the Council of 11 December 2018 on the Governance of the Energy Union and Climate Action,
amending Regulations (EC) No 663/2009 and (EC) No 715/2009 of the European Parliament and of the Council, Directives 94/22/EC, 98/70/EC, 2009/31/EC, 2009/73/EC, 2010/31/EU, 2012/27/EU and 2013/30/EU of the European Parliament and of the Council, Council Directives 2009/119/EC and (EU) 2015/652 and repealing Regulation (EU) No 525/2013 of the European Parliament and of the Council.

64 (199)
The introduction of one or more contact points
In May 2019, the Government commissioned the Swedish Environmental
Protection Agency to analyse the measures required to implement Article 16
of Directive (EU) 2018/2001 of the European Parliament and of the
Council of 11 December 2018 on the promotion of the use of energy from
renewable sources (the revised Renewable Energy Directive). This includes
investigating which agency or agencies should be designated as contact
points. It must submit a report to the Swedish Government Offices
(Infrastructure Department) by 31 January 2020.
Strategy for sustainable expansion of wind power
The Swedish Energy Agency and the Swedish Environmental Protection
Agency are working together to develop a strategy for sustainable expansion
of wind power. The strategy is based on the target of 100% renewable
electricity generation in 2040 under the Energy Agreement. A substantial,
sustainable expansion of wind power will be required to achieve this
transition. The Directors General of the two agencies have therefore begun
to develop a joint strategy for sustainable expansion of wind power which
takes account of factors such as resource-efficiency, human health and the
environmental impact. This is an Environmental Objectives Council
initiative115.
The council coordinates the approach of state operators to wind power and
produces guidelines for balancing various interests; it is also drafting a wind
power plan, which breaks down the national wind power requirement to
regional and municipal level. It began the work in 2018 and is due to report
on it in spring 2020.
Maritime spatial plans
On 17 June 2015, the Government decided to introduce a maritime spatial
planning regulation (2015:400) to govern maritime spatial planning in
Sweden. Under this regulation, the Swedish Agency for Marine and Water
Management must produce proposals for maritime spatial planning for the
Gulf of Bothnia, the Baltic Sea and the North Sea. The maritime spatial
plans must ensure sustainable use of marine resources and development of
industry, while improving the marine environment. The Swedish Agency for
Marine and Water Management must work with the Swedish Energy Agency
to develop ways of harnessing offshore wind power and wave energy. The
Agency prepared the first draft of its maritime spatial plans in autumn 2016.
The plans were sent out for consultation in spring 2017. This was followed
by further consultation in 2018 and a review in 2019. The Agency submitted
draft maritime spatial plans to the Government in December 2019116.
115 The Government set up the Environmental Objectives Council as a platform to promote action and intensify work on achieving Sweden's environmental targets at all
levels of society. The Council presents the measures it intends to take to accelerate this work on 1 March every year. It’s mandate ends on 6 May 2022. 116 Maritime Spatial Plans for the Gulf of Bothnia, the Baltic Sea and the North Sea, reference number 3628-2019.

65 (199)
Simplified administration of support for photovoltaic cells
At the Government's request, the Swedish Energy Agency reviewed the
management of investment support for photovoltaic cells and made some
suggestions for simplifying it. It suggested that this should be done initially
within the current administrative system. The administration has been
streamlined in a number of respects, the application forms have been
simplified, information about support has been made more accessible,
applications can now be submitted electronically, the monitoring
requirement has been removed and dialogue between the authorities
managing the support has been improved.
The solar electricity portal - guidance on photovoltaic cells
In September 2018, the Swedish Energy Authority launched the
Solelportalen.se web portal. The portal provides owners of small domestic
properties and commercial premises with independent, factual information
about photovoltaic systems from pre-installation planning to
decommissioning. It is intended to help people considering investing in
photovoltaic cells to make wise decisions.
The solar electricity portal was developed by the Swedish Energy Agency at
the Government's request, It carried out the work in conjunction with
several authorities with relevant information in the field.
Removal of the requirement for planning consent for solar energy installations
The requirement for planning consent for many types of installation and
solar collector has been removed from the planning and building legislation
to facilitate the installation of photovoltaic systems.
Since 1 August 2018, planning consent has not usually been required to
install a photovoltaic or solar collector installation on a building in an area
covered by the urban management plan, if it follows the contours of the
building. However, the municipalities can set other requirements in the
urban management plan. The exemption from planning consent does not
apply to buildings in built areas which are of special historic, cultural,
environmental or artistic value or are located in, or adjacent to, areas of
interest for national defence.
Since the planning and building legislation did not previously contain any
specific rules for photovoltaic and solar heat installations, or any guiding
case-law, the conditions for solar energy installations varied between
municipalities.
Areas of national interest to optimise land use

66 (199)
The Swedish Energy Agency is responsible for declaring national interest for
energy generation and energy distribution which must be of particular
national relevance.
For energy generation, this includes areas for large-scale installations which
can generate large amounts of energy or power, but also installations which
can provide balancing or regulating capacity or which are needed in the area
when energy consumption is high. There are currently eight areas earmarked
for energy generation.
For energy distribution, national interest provisions should be applied to
areas for installations which are part of larger interconnected energy
distribution systems of national interest.
Areas have been designated of national interest for wind use since 2004 and,
since the last update in 2013, this has been very important for evaluating
wind power in comparison with other interests for town and country
planning117. There are now 313 areas of national interest for wind use, 284 of
which are onshore and 29 offshore. They cover a total area of 7 900 km2
excluding developed land, which is 1.5% of the area of Sweden, including
Swedish waters.
The Swedish Energy Agency is also developing a national interest scheme
for hydro-electric power and has begun a preliminary study on this.
Future hydro-electric power generation must be adapted to modern
environmental conditions and must also facilitate the transition to an
electricity system based on 100% renewable energy. A draft national plan for
reviewing hydroelectric power is currently being prepared. Eight
hydroelectric power companies have also formed the Vattenkraftens
Miljöfond Sverige AB, which is responsible for funding the environmental
measures required for the transition of hydroelectric power operations in
Sweden. The environmental initiatives must be beneficial both to fisheries
and tourism and to local development and must be designed to achieve
international environmental targets in water-related industries.
Renewable electricity purchase agreements
There are no specific policies or other measures to facilitate more
widespread use of renewable energy purchase agreements. According to
market operators, these agreements are widely used in Sweden and have
played an important role in the expansion of wind power.
117 http://www.energimyndigheten.se/fornybart/riksintressen-for-energiandamal/.

67 (199)
Self-consumption of renewable energy and renewable energy communities
In May 2019, the Government commissioned the Swedish Energy Markets
Inspectorate to investigate how to implement the revised Renewable Energy
Directive118. This involved investigating the measures required to implement
Article 21 on renewable energy self-consumers and Article 22 on renewable
energy communities. It must submit a report to the Swedish Government
Offices (Infrastructure Department) by 28 February 2020.
3.1.2.6 Assessment of the necessity to build new infrastructure
for district heating and cooling produced from renewable
sources.
The Swedish district heating system is already well developed and district
heating competes with other forms of heating. The owners assess whether
new infrastructure for district heating and district cooling is necessary and
will be profitable.
3.1.2.7 Where applicable, specific measures on the promotion of
the use of energy from biomass, especially for new biomass
mobilisation taking into account: — biomass availability,
including sustainable biomass: both domestic potential and
imports from third countries — other biomass uses by other
sectors (agriculture and forest-based sectors); as well as
measures for the sustainability of biomass production and use.
The Klimatkliv119 is an investment support initiative for local and regional
measures to reduce emissions of carbon dioxide and other gases which have
an impact on the climate; it is administered by the Swedish Environmental
Protection Agency. The funds must be invested with the primary aim of
reducing greenhouse gas emissions120. A plant for production of biochar
from forestry residues is one example of a measure that has received support
under the Klimatkliv initiative121.
The Swedish Energy Agency is continuously producing statistics on biofuels
(prices, quantities) to increase transparency on its markets122. The Swedish
Forest Agency records the removal of branches and tops left over from
felling in its felling residue reports123.
The 2014–2020 Rural Development Programme includes investment
support for buying and planting the perennial energy crops willow, poplar
and hybrid aspen124. The programme also includes investment support for
118 Directive (EU) 2018/2001 of the European Parliament and of the Council of 11 December 2018 on the promotion of the use of energy from renewable sources. 119 The Klimatkliv is also described in Section 3.1.1. 120 https://www.naturvardsverket.se/Stod-i-miljoarbetet/Bidrag/Klimatklivet/Om-Klimatklivet/. 121 https://www.landskogsbruk.se/skog/satsning-pa-biokol-far-225-miljoner/. 122 http://www.energimyndigheten.se/statistik/. 123 https://www.skogsstyrelsen.se/bruka-skog/skogsbransle/. 124 https://www.jordbruksverket.se/amnesomraden/stod/stodilandsbygdsprogrammet/investeringar/jordbruktradgardochrennaring.4.6ae223614dda2c3dbc44ef5.html.

68 (199)
fencing for bio-energy crops and the construction of bio-energy installations.
The Government has set up a circular economy delegation125. The
delegation is a Government advisory body within the Swedish Agency for
Economic and Regional Growth. Its tasks include developing a strategy for
the transition to a circular and bio-based economy, both nationally and
regionally. It has chosen to focus initially on three areas: plastics, public
procurement and the design of the circular economy. It has conducted a
comprehensive debate on the circular economy and its importance for the
sustainable development of society. Industry, for example, needs a business
case and a demand for products not manufactured from virgin material, and
business opportunities for by-products and manufacturing residues.
In 2016, the Environmental Objectives Council launched a project to
increase knowledge of bioenergy in Sweden and the EU. The Swedish Forest
Agency, the Swedish Energy Agency, the Swedish Board of Agriculture, the
Swedish Environmental Protection Agency and the county councils were
jointly commissioned to produce a report on the position of bioenergy and
its potential.126 This was a response to the need for sustainable measures to
reduce greenhouse gas emissions under the Paris Agreement; it also took
account of the fact that many different agencies are responsible for dealing
with this issue. The project report stated that ‘effective policies are needed to
utilise the full potential of sustainable bioenergy’.
There are many bioenergy research initiatives which are described in Section
4.6.
3.1.3 Other elements of the dimension
3.1.3.1 Where applicable, national policies and measures affecting
the EU ETS sector and assessment of the complementarity and
impacts on the EU ETS.
The following policies affect emissions in the EU ETS:
– carbon tax and energy tax on cogeneration and heat
generation – see the description in Section 3.1.1;
– the electricity certificates system – see the description in Section 3.1.2;
– energy tax on industry – see the description in Section 3.1.1;
– the Industrikliv initiative – see the description in Section 4.6;
– the Energisteg initiative – see the description in Section 3.2;
– requirements and support for energy mapping – see the description in Section 3.2
– energy and climate coaches – see the description in Section 3.2;
– energy efficiency networks – see the description in Section 3.2;
125 https://tillvaxtverket.se/amnesomraden/affarsutveckling/delegation-cirkular-ekonomi.html 126 The Swedish Forest Agency, the Swedish Energy Agency, the Swedish Board of Agriculture and the Swedish Environmental Protection Agency – Bioenergi på rätt
sätt – Om hållbar bioenergi i Sverige och andra länder (Report 2017/10).

69 (199)
– the Environmental Code – see the description in Section 3.1.1; and
– tax on waste incineration – see the description in section 3.1.2.
These policies are designed to promote technical advances and reduce
emissions from Swedish installations within the system. They complement
the EU ETS and may increase the number of allowances in the Market
Stability Reserve. Hence they may potentially also increase the number of
allowances cancelled.
3.1.3.2 Policies and measures to achieve other national targets,
where applicable
Air quality
Sweden’s commitment under the National Emissions Ceiling Directive127
To honour its commitments, Sweden will have to take measures to reduce
national emissions of ammonia and nitrogen oxides. The National Air
Pollution Control Programme128 adopted by the Government on 28 March
2018 sets out the measures that need to be taken. To achieve the reductions
in nitrogen oxide emissions measures will have to be taken both in domestic
transport and industry. An integrated air and climate policy will help to
reduce emissions of both greenhouse gases and air pollutants.
Measures to reduce ammonia emissions include management of manure in
farming, since this is the single largest source of these emissions in Sweden.
Climate change adaptation
Creating the conditions for climate change adaptation – cooperative
structures, stakeholder involvement and action plans
The Ministry of the Environment is responsible for coordinating work on
climate change policy in the Swedish Government Offices. Climate change
adaptation is monitored and evaluated with the assistance of the National
Expert Council for Climate Change Adaptation and the Swedish
Meteorological and Hydrological Institute (SMHI). The National Expert
Council for Climate Change Adaptation was set up in 2018 and is tasked
with preparing a five-yearly report for the Government. The report must put
forward proposals for national work on climate change adaptation, prioritise
adaptation measures on the basis of an assessment of the risks, costs and
benefits, briefly analyse the effects of climate change on society and assess
national work on climate change adaptation.
127 Directive (EU) 2016/35/EC of the European Parliament and of the Council of 14 December 2016 on the reduction of national emissions of certain atmospheric
pollutants, amending Directive 2003/35/EC and repealing Directive 2001/81/EC. 128 M2019/00243/Kl.

70 (199)
In June 2018, as a result of the National Climate Change Adaptation
Strategy, the Government commissioned the National Board of Housing,
Building and Planning to coordinate work on climate change adaptation in
the built environment
In 2012, the Government commissioned the SMHI to set up the National
Knowledge Centre for Climate Change Adaptation to assist municipalities,
regions, authorities and other stakeholders with their climate adaptation
work. In 2019, the centre had a budget of around SEK 20 million for this
work.
Many Swedish authorities play an important part in climate change
adaptation through their respective sector responsibilities. They work
preventively by increasing knowledge and improving resilience. The
implementation of the National Climate Change Adaptation Strategy began
in June 2018 with the Ordinance (2018:1428) on the Climate Change
Adaptation Work of National Authorities in which the Government gives 32
national authorities and the 21 county councils the task of initiating,
supporting and monitoring climate change adaptation in their respective
areas of responsibility, for example by preparing action plans.
Many national authorities had already prepared action plans for their sector.
Some were prepared with national funding, for example action plans for
forestry, human health, cultural heritage, sustainable development and Sami
industry and culture.
The county councils are responsible for coordinating the regional climate
change adaptation work and for supporting local operators. They adopted
regional action plans in 2014. The work on climate change adaptation
measures identified in these plans is reported to the Government every year.
The plans cover the whole of Sweden with nearly 800 proposed measures.
Most of the measures are related to flood protection, protection of drinking
water, protection of coastlines, infrastructure (roads and railways),
adaptation of agriculture and forestry, resilience during heatwaves and health
care.
The Governmental Agency Network for Climate Change Adaptation
comprises the 21 county councils and 19 national agencies. The network
coordinates climate adaptation work and provides a forum for the exchange
of information; the secretariat is managed by the SMHI. There are also
thematic national cooperation networks.
71 (199)
Some local agencies have also developed action plans for their
municipalities. Significant progress has been made and awareness of the
importance of climate change adaptation has increased throughout society in
recent years. The Planning and Building Act (2010:900) was amended in
2018 to stimulate further progress. As a result of these amendments the
municipalities are able to take greater account of climate adaptation aspects
in the communal planning process.
Knowledge transfer and risk assessment
The SMHI’s Rossby Centre for climate research has drafted national and
regional climate scenarios up to 2100. The Swedish Civil Contingencies
Agency operates the Floods Portal, which contains information from flood
maps and geographical data in accordance with the Ordinance (2009:956) on
Flood Risks, and a database of natural disasters. The Swedish Geotechnical
Institute has worked with seven other agencies to produce geotechnical risk
maps and tools to assess climate risks.
The Climate Change Adaptation Portal provides information about the
impact of climate change on society along with tools for climate change
adaptation, examples of climate change adaptation measures already
implemented and information about current activities.
Many of the sectoral and regional adaptation plans include risk and
vulnerability analyses.
Implementation
The Government funds measures to improve knowledge of the impact of
climate change and to address its impact, for example with measures to
prevent subsidence, landslides and floods. The budget for this in 2019 is
SEK 316 million. This includes funding for measures to prevent subsidence
and landslides in the Göta älv valley, which is a particularly vulnerable area
of Sweden.
The Government is also making decisions on the delegation of various
measures to sectoral agencies. However, climate change adaptation is multi-
sectoral, which means that the work is usually carried out by several
operators and sectors working together nationally, regionally and locally.
Sweden has a well-established and effective framework for work on reducing
the risk of disasters, which includes emergency preparedness groups. The
work is coordinated by the Swedish Civil Contingencies Agency.

72 (199)
Cooperation is encouraged at all levels and between sectors and operators
working on land use planning, risk management, natural disasters and
climate change adaptation, to reduce risks and improve preparedness.
There are currently several cooperation forums in Sweden, where sectoral
agencies and other stakeholders can share experience and plan important
measures. These include the Agency Network for Coastal Erosion, the
Committee for Dam Design Flows from a Climate Change Perspective, The
Delegation for Subsidence and Landslides, and the National Drinking Water
Network.
Sweden’s municipalities are obliged to carry out risk and vulnerability
analyses as part of their work to prepare for extraordinary events and
emergencies.
These analyses include events affected by climate change.
In the built environment, where the risk of natural disasters in particularly
high, municipalities can apply for state funding for preventive measures.
Around SEK 75 million a year is available for 2017–2020. The funding,
which is administered by the Swedish Civil Contingencies Agency, can be
given to cover up to 60% of the costs, or a maximum of 60% of the value of
the object at risk. The natural disasters concerned here are mainly
subsidence, landslides and floods.
Evaluation and audits
The National Climate Change Adaptation Strategy has a five-year review
cycle. The cycle includes the implementation of the strategy and the
production of an updated climate and vulnerability analysis, followed by
review and evaluation of the work carried out. The SMHI's National Expert
Council for Climate Change Adaptation is responsible for evaluating the
strategy. An updated strategy will then be developed in 2023.
Gender mainstreaming
Under the Paris Agreement, the transition to a fossil-free economy must
take account of human rights and promote equality. Human rights are
universal and establish that all people are of equal value and have equal
rights irrespective of their culture, nationality or background. Equality in
turn is a human right and establishes that society must give women, men,
girls and boys the same rights, resources, protection and opportunities.
According to the UN’s climate convention, women are under-represented in
positions of authority and sometimes lack the conditions or opportunities to
influence climate-related policy, planning and implementation Women all

73 (199)
over the world are also affected more severely by climate change than men,
as they are more vulnerable to it in many countries. Climate projects and
policy often achieve better results when women are involved in making the
decisions locally and nationally, because they often have local knowledge and
experience of managing resources sustainably.
Sweden is working on gender equality issues both at EU and national level.
Sweden's feminist policies include international work, and Sweden's gender
equality policy objectives are also objectives for the Government's
international cooperation. Sweden's domestic policy and foreign policy on
gender equality are therefore closely linked, as with the EU cooperation.
Sweden promotes gender equality work within the EU, the UN, the Council
of Europe and other international organisations. It also works nationally to
meet its international gender equality commitments and obligations,
including those under the Beijing Platform and the UN’s Convention on the
Elimination of all Forms of Discrimination against Women (CEDAW).
Sweden has a feminist foreign policy which means that it always adopts a
gender equality approach to its international relations with the aim of
promoting rights, representation and resources for all women and girls. The
feminist foreign policy is set out in an action plan, which includes specific
targets for gender equality. Sweden has campaigned for many years for
gender equality to be integrated into all relevant EU processes.
Sweden’s gender equality work aims to ensure that all women and men have
the same power and opportunities to shape society and their own lives. This
aim must also embedded in climate policy and the Government intends to
step up work on gender equality. At the Government’s request, the Swedish
Environmental Protection Agency has submitted a proposal for further
integration of gender equality in the implementation of the Paris Agreement.
3.1.3.3 Policies and measures to achieve low emission mobility
(including electrification of transport).
Policies and measures for the transport sector are described in Section 3.1.1.
3.1.3.4 Where applicable, national policies, timelines and
measures planned to phase out energy subsidies, in particular for
fossil fuels;
Environmentally damaging subsidies must be phased out both in Sweden
and worldwide. However, Sweden has not set deadlines for phasing out
energy subsidies. In response to the proposals in the revised spring budget
for 2019, the reduction of energy and carbon taxes for mining operations
was abolished (see Section 3.1.1). The compatibility of policy with climate
objectives is also evaluated continuously through the Climate Policy

74 (199)
Framework (see Section 1.2.1).
3.2 Dimension energy efficiency
3.2.1 Planned policies, measures and programmes to
achieve the indicative national energy efficiency contributions
for 2030 as well as other objectives referred to in point 2.2,
including planned measures and instruments (also of a
financial nature) to promote the energy performance of
buildings, in particular with regard to the following:
3.2.1.1 Energy efficiency obligation schemes and alternative
policy measures under Articles 7a and 7b and Article 20(6) of
Directive 2012/27/EU and to be prepared in accordance with Annex
III to this Regulation
Choice of policies to achieve the energy saving obligations
Under Article 7(10) of the Energy Efficiency Directive129 Member States
must achieve the amount of energy savings required under Article 7.1,
paragraph 1, point b, either by establishing an energy efficiency obligation
scheme referred to in Article 7a or by adopting alternative policy measures
referred to in Article 7b. The Member States may combine an energy
efficiency obligation scheme with alternative policy measures.
Swedish energy efficiency policy is based on the principle that:
• policies should be general and not linked to specific technologies;
• prices must give the right (or required) information;
• search costs are reduced because information is produced and distributed; and
• barriers can be removed, for example by adjusting
existing regulations.
State initiatives to promote energy efficiency are targeted both at energy
consumption and supply and aim to support the spontaneous efficiency
improvements in society with policies tailored to the mechanisms of the
market. The state's role is to identify and remedy market failures – primarily
external effects and a lack of information.
The current portfolio of energy efficiency policies is consequently very
broad and comprises general economic policies, such as energy and carbon
taxes and emissions trading, as well as more targeted administrative policies,
such as the requirement for authorisation to carry out activities that are
harmful to the environment and the requirement for energy performance
129 Directive 2012/27/EU of the European Parliament and of the Council of 25 October 2012 on energy efficiency, amending Directives 2009/125/EC and 2010/30/EU
and repealing Directives 2004/8/EC and 2006/32/EC.

75 (199)
ratings and energy labelling of energy-related products and buildings. The
policies are implemented by means of various complementary initiatives,
which deal in different ways with the lack of information on the market and
increase awareness and knowledge of different energy-efficiency and energy-
saving measures, both technical and behaviour-related, and also their
legitimacy. Examples include state support for municipal energy and climate
advisory services, state support for energy mapping in small and medium-
sized enterprises, state support for local and regional capacity development
for the energy and climate transition, including support for regional climate
and energy strategies and measures for early introduction to the market.
Sweden also provides various support measures for investments to promote
energy efficiency. Examples include the Energisteg programme, the Klimakliv
and Industrikliv initiatives and state support for renovation and energy
efficiency measures in apartment blocks in certain areas.
The combination of economic policies and complementary and targeted
information initiatives and investment assistance is considered to provide a
sound basis for achieving energy efficiency cost-effectively. Energy and
carbon taxes increase the cost of using energy and hence create an incentive
for consumers to take energy-saving measures to reduce their energy
consumption and/or consume energy more efficiently. Some of the
measures are easy to introduce and to take, but there is often a lack of
detailed knowledge about the measures that can be taken and are suitable in
a particular case. Information about possible and suitable measures is often
asymmetric, which means that those selling energy-efficient technologies or
other energy-efficiency solutions often have an information advantage over
the final consumer, who will be taking the measures and footing the bill. The
guidance function of the energy price is often not enough. Energy
consumers who respond to price signals are also influenced by other
policies. Support for energy mapping can improve final consumers’
knowledge about where measures should be taken. Impartial advice about
suitable measures can be obtained from a municipal energy and climate
advisor.
Under Article 7(11) of the Energy Efficiency Directive, when drafting policy
measures to meet their energy savings obligations under 7(1) of the Energy
Efficiency Directive, Member States must take account of the need to
alleviate energy poverty in accordance with criteria established by them and
with due regard for their existing practice in the area. The Government
makes no distinction between energy poverty and poverty in general. As a
result, the term energy poverty is not used, and there are no targeted policies
to deal with it.
The Swedish Energy Agency has looked into whether an energy savings
obligation scheme (white certificates) is an appropriate policy for Sweden on

76 (199)
a number of occasions. It has concluded that this kind of scheme should not
be introduced in Sweden in principle, but does not categorically rule it out. It
believes that white certificates aim to correct market failures that are already
addressed by another policies; the scheme may also affect, and be affected
by, the operation of other policies, such as the EU ETS and electricity
certificates. It does not rule out the possibility of using white certificates if
another objective in addition to energy efficiency is added to the scheme, by
does not believe the matter needs to be investigated any further.
In the final report of its study of smaller operators in a changing energy
landscape Smaller operators in the energy landscape – effective proposals (SOU
2018:76) it proposed that an obligation scheme should be introduced in
Sweden. The proposal deals with energy efficiency and energy consumption
up to 2040 and energy efficiency in general. The scheme proposed by the
study was not based on the obligation scheme provided for under the
Energy Efficiency Directive. The study has been sent out for consultation,
and the suggestions made will be dealt with by the Swedish Government
Offices.
Sweden is implementing the Directive’s energy savings obligation for the
period 1 January 2014 to 31 December 2020 by means of energy and carbon
taxes and complementary policies which focus on managing information-
related market failures.
In view of this, Sweden currently intends to achieve the savings obligation
with policies other than obligation schemes, as permitted under Article 7(b)
of the Energy Efficiency Directive. It will impose special energy and carbon
taxes to meet the energy savings obligation. A more detailed description of
energy and carbon taxes in Sweden and the EU is given below. Other
complementary energy efficiency policies are described in Section 3.2.1.2
and Section 3.2.1.3.
Energy and carbon tax
Energy and carbon taxes in Sweden
The energy and carbon taxes charged in Sweden under the Energy Tax Act
(1994:1776) fulfil the minimum levels of taxation required by the Energy
Tax Directive130
The Swedish agency that administers and monitors taxation (the
implementing public authority) is the Swedish Tax Agency.
130 Council Directive 2003/96/EC of 27 October 2003 restructuring the Community framework for the taxation of energy products and electricity.

77 (199)
Electricity generators and network operators are the main groups liable for
energy tax131. They incur the tax liability when they transmit electricity to
anyone who is not liable for the tax as a generator, network owner or
voluntary tax payer or when the electricity is used by a party liable for the
tax.
The main categories of taxpayer liable for energy and carbon tax on fuel are
warehousekeepers, consignees and traders authorised by the Swedish Tax
Agency132. Tax liability for fuel is normally incurred when it is supplied
under duty suspension 133 and is therefore released for consumption or, in
the case of authorised traders, when it is supplied to a buyer who is not an
authorised trader or to its own sales outlet.
The Energy Tax Act gives rates of energy and carbon tax on fuel as an
amount per quantity of fuel (krona and öre per litre, cubic metre or kg
depending on the type of fuel). With the exception of the energy taxes on
electrical energy, the information given below on tax based on energy
content describes the typical energy-content equivalent of these levels of
taxation or changes in these levels. The energy and carbon taxes on fuels
have risen by 16–29 öre/kWh between 1995 and 2019, depending on the
type of fuel. The taxes vary depending on the type of fuel and the purpose
for which it is used. A reduced rate is applied to some uses, including
consumption for industrial manufacturing processes. In addition to these
reduced taxes, a full exemption from energy and carbon tax on fuel used in
some specific industrial process, such as metallurgical processes, can be
granted under the Energy Tax Act. However, there is no tax reduction on
the fuel consumption of a household that uses oil for heating. Table 9 shows
the changes in energy and carbon tax on fossil fuels and electricity between
2012 and 2019. The biggest change is the diesel tax reduction of 13
öre/kWh between 2018 and 2019. This was a result of the removal of the
tax exemption for low-level biodiesel blends. When the reduction obligation
was introduced, the energy and carbon taxes on petrol and diesel were
reduced to reflect the content of fossil carbon in the fuel blend, and to avoid
the effects on the petrol and diesel price which had been seen when the tax
on their biofuel content was introduced.
Table 9 shows the current rates of energy and carbon tax. The rates given
for fuels are a result of changing to a different taxation unit from the one
specified in the Energy Tax Act. The tax rates are shown here as an amount
per quantity of energy (öre/kWh). The current rates for energy and carbon
tax on fuel are laid down in Chapter 2, Sections 1, 1a, 1b, 3 and 4 of the
Energy Tax Act. The tax rates are not fixed over time but are reviewed and
131 Chapter 11, Section 5 of the Energy Tax Act (1994:1776). 132 Chapter 4, Sections 1 and 12 of the Energy Tax Act (1994:1776). 133 Duty suspension means the suspensive procedure referred to in Council Directive 2008/118/EC of 16 December 2008 concerning the general arrangements for
excise duty and repealing Directive 92/12/EEC.
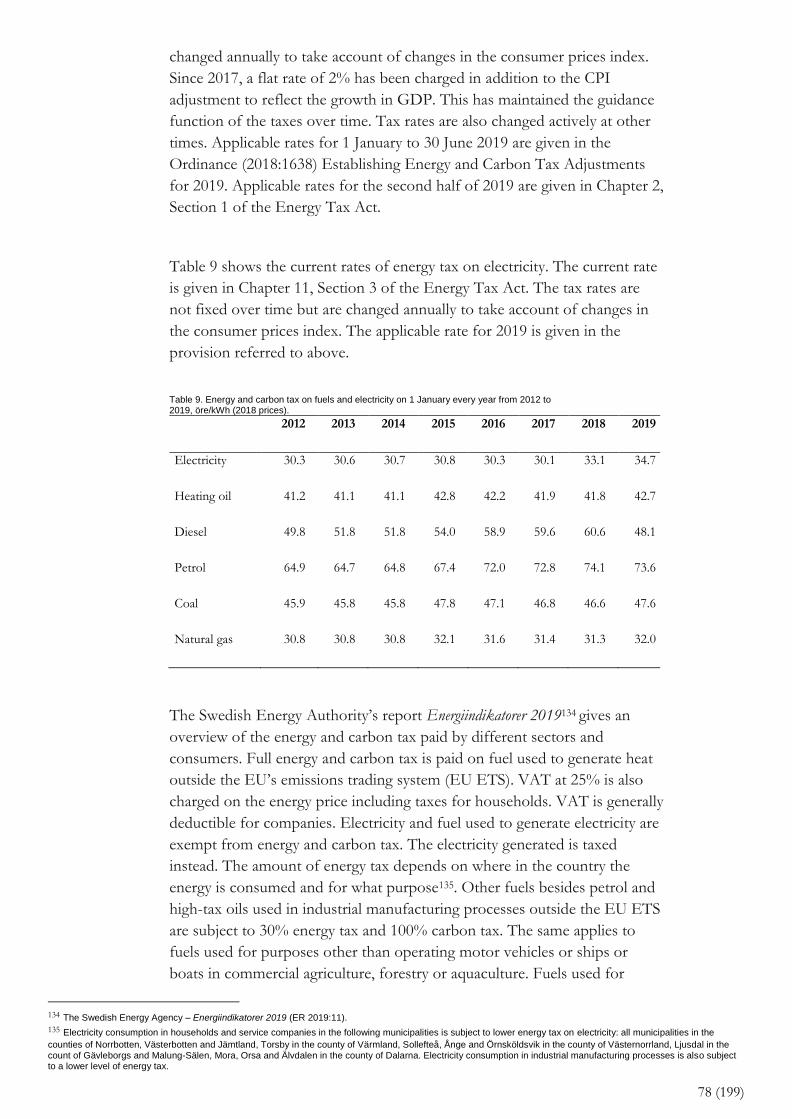
78 (199)
changed annually to take account of changes in the consumer prices index.
Since 2017, a flat rate of 2% has been charged in addition to the CPI
adjustment to reflect the growth in GDP. This has maintained the guidance
function of the taxes over time. Tax rates are also changed actively at other
times. Applicable rates for 1 January to 30 June 2019 are given in the
Ordinance (2018:1638) Establishing Energy and Carbon Tax Adjustments
for 2019. Applicable rates for the second half of 2019 are given in Chapter 2,
Section 1 of the Energy Tax Act.
Table 9 shows the current rates of energy tax on electricity. The current rate
is given in Chapter 11, Section 3 of the Energy Tax Act. The tax rates are
not fixed over time but are changed annually to take account of changes in
the consumer prices index. The applicable rate for 2019 is given in the
provision referred to above.
Table 9. Energy and carbon tax on fuels and electricity on 1 January every year from 2012 to 2019, öre/kWh (2018 prices).
2012 2013 2014 2015 2016 2017 2018 2019
Electricity 30.3 30.6 30.7 30.8 30.3 30.1 33.1 34.7
Heating oil 41.2 41.1 41.1 42.8 42.2 41.9 41.8 42.7
Diesel 49.8 51.8 51.8 54.0 58.9 59.6 60.6 48.1
Petrol 64.9 64.7 64.8 67.4 72.0 72.8 74.1 73.6
Coal 45.9 45.8 45.8 47.8 47.1 46.8 46.6 47.6
Natural gas 30.8 30.8 30.8 32.1 31.6 31.4 31.3 32.0
The Swedish Energy Authority’s report Energiindikatorer 2019134 gives an
overview of the energy and carbon tax paid by different sectors and
consumers. Full energy and carbon tax is paid on fuel used to generate heat
outside the EU’s emissions trading system (EU ETS). VAT at 25% is also
charged on the energy price including taxes for households. VAT is generally
deductible for companies. Electricity and fuel used to generate electricity are
exempt from energy and carbon tax. The electricity generated is taxed
instead. The amount of energy tax depends on where in the country the
energy is consumed and for what purpose135. Other fuels besides petrol and
high-tax oils used in industrial manufacturing processes outside the EU ETS
are subject to 30% energy tax and 100% carbon tax. The same applies to
fuels used for purposes other than operating motor vehicles or ships or
boats in commercial agriculture, forestry or aquaculture. Fuels used for
134 The Swedish Energy Agency – Energiindikatorer 2019 (ER 2019:11). 135 Electricity consumption in households and service companies in the following municipalities is subject to lower energy tax on electricity: all municipalities in the
counties of Norrbotten, Västerbotten and Jämtland, Torsby in the county of Värmland, Sollefteå, Ånge and Örnsköldsvik in the county of Västernorrland, Ljusdal in the count of Gävleborgs and Malung-Sälen, Mora, Orsa and Älvdalen in the county of Dalarna. Electricity consumption in industrial manufacturing processes is also subject to a lower level of energy tax.

79 (199)
industrial manufacturing processes within the EU ETS are subject to 30%
energy tax and no carbon tax. Fuels other than crude tall oil and high-tax oil
used within the EU ETS to generate heat for purposes other than industrial
manufacturing are subject to 100% energy tax and 91% carbon tax.
Different levels of taxation are applied to transport depending on the fuel,
environmental classification and purpose of the vehicle. Low-tax diesel and
fuel oils used in rail transport and in ships used for non-private purposes,
and aviation gasoline and kerosene used for non-private purposes are
exempt from energy and carbon tax. Aviation and marine fuel used for
private purposes is taxed. Natural gas used as a fuel is subject to carbon tax
but exempt from energy tax. Electricity used for rail transport is also exempt
from tax.
On 1 July 2018, the tax reduction on low-level biofuel blends was removed
and replaced with a reduction obligation. The petrol and diesel suppliers
liable to pay tax are obliged to gradually increase the amount of biofuel in
their fuels, which increases the price at the pump. To compensate for this,
the tax on petrol and diesel was reduced. The overall pump price for petrol
and diesel may however be higher. Pure biofuels or high-level blended
biofuels are still completely exempt from tax.
The EU’s minimum levels of taxation
The EU's minimum levels of taxation applicable to motor fuels are shown in
Table A of Annex I to the Energy Tax Directive136. Table B of this annex
shows minimum levels of taxation applicable to motor fuels used for the
purposes set out in Article 8(2) of Directive 2003/96/EC. Table C of the
annex shows minimum levels of taxation applicable to heating fuels and
electricity. Article 15(3) of the Directive states that Member States may apply
a level of taxation down to zero to fuels and electricity used for agricultural,
horticultural or piscicultural works, and in forestry. The EU’s minimum
levels or taxation are shown in Table 10 and Table 11. They have not
changed since 2010.
Table 10. The EU’s minimum rates of taxation for fuels and electricity.
Unit for the tax rate
Tax rate
Motor fuels
Leaded petrol €/1 000 litres 421
Unleaded petrol) €/1 000 litres 359
Diesel €/1 000 litres 330
Kerosene €/1 000 litres 330
LPG €/1 000 kg 125
Natural gas €/GJ gross calorific value
2.6
Motor fuels used for the purposes set out in Article 8(2) (agriculture, stationary motors, construction etc.)
136 Council Directive of 27 October 2003 restructuring the Community framework for the taxation of energy products and electricity.
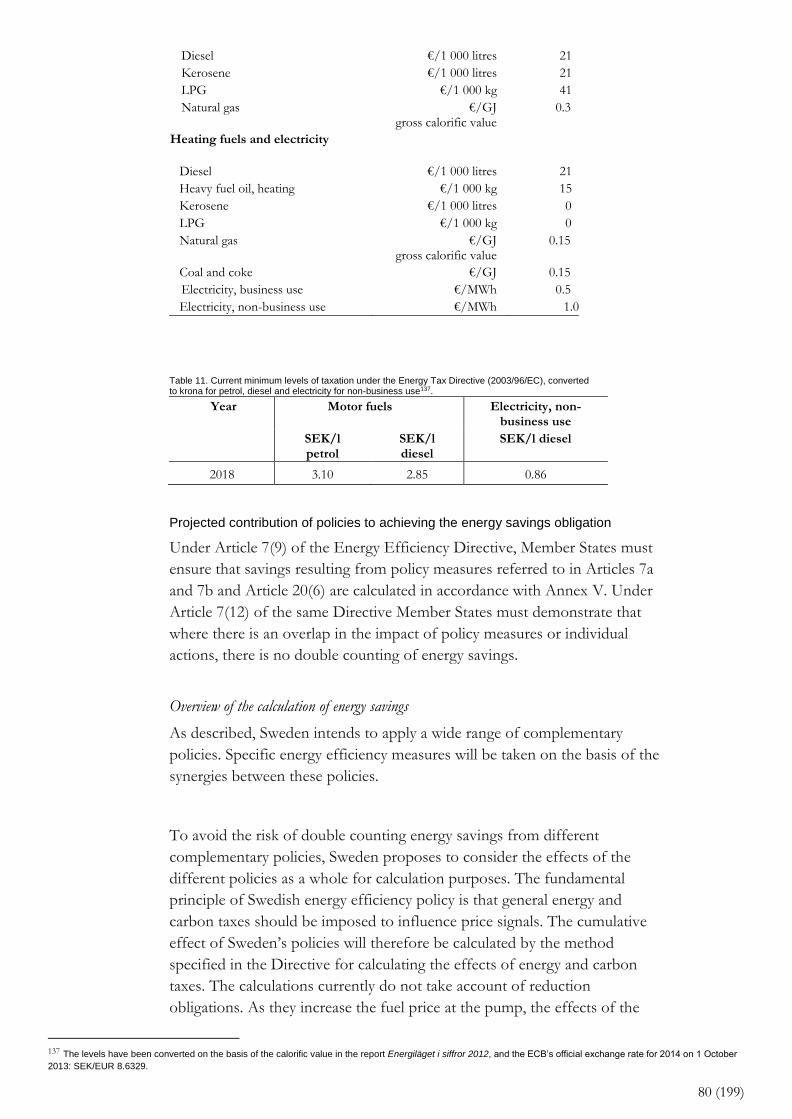
80 (199)
Diesel €/1 000 litres 21
Kerosene €/1 000 litres 21
LPG €/1 000 kg 41
Natural gas €/GJ gross calorific value
0.3
Heating fuels and electricity
Diesel €/1 000 litres 21
Heavy fuel oil, heating €/1 000 kg 15
Kerosene €/1 000 litres 0
LPG €/1 000 kg 0
Natural gas €/GJ gross calorific value
0.15
Coal and coke €/GJ 0.15
Electricity, business use €/MWh 0.5
Electricity, non-business use €/MWh 1.0
Table 11. Current minimum levels of taxation under the Energy Tax Directive (2003/96/EC), converted to krona for petrol, diesel and electricity for non-business use137.
Year Motor fuels Electricity, non-business use
SEK/l petrol
SEK/l diesel
SEK/l diesel
2018 3.10 2.85 0.86
Projected contribution of policies to achieving the energy savings obligation
Under Article 7(9) of the Energy Efficiency Directive, Member States must
ensure that savings resulting from policy measures referred to in Articles 7a
and 7b and Article 20(6) are calculated in accordance with Annex V. Under
Article 7(12) of the same Directive Member States must demonstrate that
where there is an overlap in the impact of policy measures or individual
actions, there is no double counting of energy savings.
Overview of the calculation of energy savings
As described, Sweden intends to apply a wide range of complementary
policies. Specific energy efficiency measures will be taken on the basis of the
synergies between these policies.
To avoid the risk of double counting energy savings from different
complementary policies, Sweden proposes to consider the effects of the
different policies as a whole for calculation purposes. The fundamental
principle of Swedish energy efficiency policy is that general energy and
carbon taxes should be imposed to influence price signals. The cumulative
effect of Sweden’s policies will therefore be calculated by the method
specified in the Directive for calculating the effects of energy and carbon
taxes. The calculations currently do not take account of reduction
obligations. As they increase the fuel price at the pump, the effects of the
137 The levels have been converted on the basis of the calorific value in the report Energiläget i siffror 2012, and the ECB’s official exchange rate for 2014 on 1 October
2013: SEK/EUR 8.6329.

81 (199)
policy should perhaps be treated in the same way as a tax in future. The
effects of the other, complementary policies described in Section 3 will
therefore not be monitored and calculated as specified in Article 7a and 7b
of the Energy Efficiency Directive. Sweden implements the obligation under
the Directive to achieve national energy savings in the period 2014–2020 in a
similar way. This approach to calculating and monitoring energy savings is
applied only to the implementation of the provisions of Article 7, 7a and 7b
of the Directive.
Method for calculating energy savings from taxes
The Directive does not provide a detailed calculation method, but the
provisions state that credit should be given only for energy savings from
taxation measures exceeding the minimum levels of taxation applicable to
fuels as required in the Energy Tax Directive or the VAT Directive138.
Furthermore, price elasticities for the calculation of the impact of the
taxation measures must be estimated on the basis of recent and
representative official data.
Credit can therefore be given for the energy savings obtained from the price
difference when Sweden’s levels of energy and carbon taxes and VAT are
higher than the EU’s minimum taxation levels. A simple way of calculating
the energy saving is to multiply the price difference by the price elasticity and
energy consumption.
Articles 7, 7a and 7b of the Energy Efficiency Directive do not require the
cumulative energy saving to be achieved by new policies; however it must be
achieved by new measures. These can be measures under new and/or
existing policies. The levels of energy and carbon tax and VAT in Sweden
have been higher than the EU’s minimum levels of taxation for a long time.
They contribute to energy savings by encouraging both changes in behaviour
(for example driving less) and investments in energy efficient technologies
(such as buying a more energy-efficient car). The start date used is a key
factor when calculating the effects of policies. The energy efficiency
measures taken in 2021 are an effect of the levels of taxation (and other
policies) in 2021, but also those in 2020 and before. The taxes introduced in
and after 2021 will have an effect beyond 2030.
Since Sweden estimated the effects of the taxes on energy saving in the
period 2014–2020, 2014 should also be the start year for calculations for
2021–2030. To calculate the effect of taxes, energy savings in the period
2014–2030 should be evaluated counterfactually, in other words compared
on the basis of an alternative scenario to reduce the levels of taxation to the
EU’s minimum on 1 January 2014, when the savings requirement under the
138 Council Directive 2006/112/EC of 28 November 2006 on the common system of value added tax.

82 (199)
Directive was originally introduced, for example to introduce an alternative
policy in the form of white certificates. The guiding effect of the higher
levels of taxation keeps energy consumption lower than the alternative
scenario in which taxes are reduced. The cumulative energy savings are
therefore the difference between the scenarios, which is the increased energy
consumption resulting from educed taxes (see Figure 7). If we included
effects in the period 2014–2030 of taxes introduced before 2014, the energy
savings would be far higher, because the full effect of price differences
would already have been achieved in 2014 and would have continued to be
felt since that date. The levels of energy and carbon tax in Sweden are also
regularly adjusted in line with the Consumer Prices Index (and in some cases
also with increases in real earnings (GDP)), which maintains – and
sometimes increases –their guidance function even if prices in general rise.
The guidance function of the taxes is therefore not eroded in real terms.
They have been adjusted regularly to ensure this. As an example, energy
taxes on electricity were increased on 1 July 2017 and 1 January 2019 as a
result of the Energy Agreement.

83 (199)
Figure 7. Energy saving as a result of differences between the level of taxation in Sweden and the minimum level of taxation.
Source Target
Euse Twh Euse Twh EU EU SE SE
As stated above, the taxes increase prices both in the short- and the long-
term. To capture this effect, the energy savings should be calculated
dynamically and cumulatively as far as possible, taking account of both
short- and long-term price elasticity.
As regards the use of long-term price elasticity, the calculation method does
not assume that the full effect is achieved in the first year after the
introduction of a tax increase. This is not a risk in a dynamic model, but if a
dynamic model is not available, an assumption must be made about how
long it will take to achieve the full effect and how the effect will develop
over time. There are various ways of doing this. More detailed information
about the calculation models, price elasticity etc. used to calculate energy
savings achieved by Swedish policies in different sectors is given in the next
section. The calculations are made for different fuels/energy sources in the
housing and services (excluding agriscience businesses) and transport
sectors.
In 2013, Runar Brännlund produced economic estimates of short- and long-
term price elasticities for electricity consumption in the housing and services
sector139 and petrol and diesel consumption in the transport sector140. The
elasticities in these estimates are lower than those in previous estimates made
in 2008141. The Swedish Energy Agency produced new estimates of short-
and long-term price elasticities in 2019; these covered the period 1975–2017
for electricity consumption in housing and services and 1976–2017 for the
139 Brännlund (2013) Bostadssektorns elefterfrågan i Sverige, Rapport till Finansdepartementet. 140 Brännlund (2013) The effects on energy saving from taxes on motor fuels: The Swedish case, CERE Working Paper 2013:6. 141 See Ett energieffektivare Sverige, SOU 2008:25, Annex 5.

84 (199)
transport sector142. It based its estimates on the models used in 2013 for
energy demand. The resulting price elasticities have been used for these
effect calculations, as set out in the Swedish Energy Agency's
memorandum143.
The actual final energy consumption data are used for calculation and future
monitoring for 2014–2017. The final energy consumption for 2017 is then
used for 2018–2030. The actual energy prices, taxes and VAT are used for
2014–2018144. The values for 2018 are then used for 2019–2030. All of these
prices are expressed as fixed prices as at 2015. Actual conversion factors are
used to convert petrol and diesel prices from SEK/litre to SEK/kWh and
vice versa.
The minimum EU tax and VAT levels set out in the respective directives are
used for the contrafactual reference scenario145. The EU’s lowest levels of
taxation for each fuel has been converted to SEK/kWh at the current
official exchange rate (see Table 10). This level is used for the whole of the
period 2014–2030. The EU’s VAT Directive states that the lowest level of
normal taxation is 15%, as compared with the Swedish level of 25%. VAT at
the EU’s minimum level has been calculated on the Swedish energy price146
and the lowest permitted level of normal taxation. The total minimum price
has then been compared with the Swedish energy price including excise duty
and VAT.
The effect of the price differences between excise duties and VAT in
Sweden and the EU is calculated for each year. The price differences
resulting from the above assumptions are the same as those for the years up
to 2019, which produces the same annual, but preliminary, effect from that
year onward.
Annex 2 contains descriptions and results of energy savings calculations in
the housing and service and transport sectors. Full sources and data can be
obtained from the Swedish Government Offices. The Swedish Energy
Agency updates all of the data every year when new official statistics are
published. It will also refine the calculation methods, as they currently
underestimate the effects of the taxes. The calculations can be updated when
the report on the energy savings achieved under the EU’s Governance
Regulation147 is submitted.
142 The Swedish Energy Authority's Memorandum, 2019: Beräkningsmetod för energi- och CO2-skatternas effekter på energianvändningen. (ref. 2018–12739). 143 Ibid. 144 The Swedish Energy Agency – Energiläget i siffror 2019. 145 The Directive states that credit should be given only for energy savings from taxation measures exceeding the minimum levels of taxation applicable in the EU. 146 Excluding Swedish tax and VAT. 147 Regulation (EU) 2018/1999 of the European Parliament and of the Council of 11 December 2018 on the Governance of the Energy Union and Climate Action,
amending Regulations (EC) No 663/2009 and (EC) No 715/2009 of the European Parliament and of the Council, Directives 94/22/EC, 98/70/EC, 2009/31/EC, 2009/73/EC, 2010/31/EU, 2012/27/EU and 2013/30/EU of the European Parliament and of the Council, Council Directives 2009/119/EC and (EU) 2015/652 and repealing Regulation (EU) No 525/2013 of the European Parliament and of the Council.

85 (199)
Overall assessment of energy savings from Swedish policies
Table 12 shows the combined annual and cumulative energy savings from
Swedish policies, calculated as the effect of higher levels of energy and
carbon tax and VAT in Sweden compared with the EU’s minimum levels of
taxation. According to the tables, the overall cumulative energy saving from
Swedish policies during the whole of the period 2014–2030 is estimated
conservatively to be around 290 TWh: 119 TWh in 2014–2020 and 172
TWh in 2021–2030. This exceeds the cumulative energy saving to be
achieved by Sweden for those periods148. The Swedish Energy Agency
updates all of the data every year when new official statistics are published. It
will also refine the calculation methods, as they currently underestimate the
effects of the taxes. The calculations can be updated when the report on the
energy savings achieved under the EU’s Governance Regulation149 is
submitted.
Table 12. Annual and cumulative energy savings from Swedish policies for the period 2014–2030.
2014 2015 2016 2017 2018 2019 2020 2021 2022 2023 2024 2025 2026 2027 2028 2029 2030
Housing
and
services
TWh/year
10.8
11.6
11.4
11.3
11.7
11.7
11.7
11.7
11.7
11.7
11.7
11.7
11.7
11.7
11.7
11.7
11.7
TWh/cum. 10.8 22.4 33.8 45.1 56.7 68.4 80.1 91.7 103.4 115.1 126.7 138.4 150.1 161.7 173.4 185.0 196.7
Transport TWh/year 4.7 5.4 6.2 5.8 5.6 5.6 5.6 5.6 5.6 5.6 5.6 5.6 5.6 5.6 5.6 5.6 5.6
TWh/cum. 4.7 10.2 16.4 22.2 27.8 33.3 38.9 44.4 50.0 55.6 61.1 66.7 72.2 77.8 83.3 88.9 94.5
Total TWh/year 15.5 17.0 17.6 17.1 17.2 17.2 17.2 17.2 17.2 17.2 17.2 17.2 17.2 17.2 17.2 17.2 17.2
TWh/cum. 15.5 32.6 50.2 67.3 84.5 101.7 118.9 136.2 153.4 170.6 187.8 205.1 222.3 239.5 256.7 273.9 291.2
Housing
and
services
TWh/year
11.7
11.7
11.7
11.7
11.7
11.7
11.7
11.7
11.7
11.7
TWh/cum.
11.7 23.3 35.0 46.7 58.3 70.0 81.7 93.3 105.0 116.7
Transport TWh/year
5.6 5.6 5.6 5.6 5.6 5.6 5.6 5.6 5.6 5.6
TWh/cum.
5.6 11.1 16.7 22.2 27.8 33.3 38.9 44.5 50.0 55.6
Total TWh/year 17.2 17.2 17.2 17.2 17.2 17.2 17.2 17.2 17.2 17.2
TWh/cum. 17.2 34.4 51.7 68.9 86.1 103.3 120.6 137.8 155.0 172.2
3.2.1.2 Long-term renovation strategy to support the renovation of
the national stock of residential and non-residential buildings, both
public and private (2), including policies, measures and actions to
148 268 TWh in total, 106 TWh of which was achieved in 2014 –2020; 163 TWh is estimated for 2021–2030. 149 Regulation (EU) 2018/1999 of the European Parliament and of the Council of 11 December 2018 on the Governance of the Energy Union and Climate Action,
amending Regulations (EC) No 663/2009 and (EC) No 715/2009 of the European Parliament and of the Council, Directives 94/22/EC, 98/70/EC, 2009/31/EC, 2009/73/EC, 2010/31/EU, 2012/27/EU and 2013/30/EU of the European Parliament and of the Council, Council Directives 2009/119/EC and (EU) 2015/652 and repealing Regulation (EU) No 525/2013 of the European Parliament and of the Council.
86 (199)
stimulate cost-effective deep renovation and policies and actions to
target the worst performing segments of the national building stock,
in accordance with Article 2a of Directive 2010/31/EU.
Sweden will report its long-term renovation strategy under Article 2a of the
Energy Performance of Buildings Directive150 by 10 March 2020.
National Board of Housing, Building and Planning Building Regulations (BBR)
The Planning and Building Act (2010:900) establishes requirements for
buildings. The regulations apply both to new buildings and to alterations to
buildings. The National Board of Housing, Building and Planning Building
Regulations (BBR)151 contain detailed regulations under the Planning and
Building Act for the design, accessibility and usability of housing, fire
protection, hygiene, health, environment, water and waste management,
noise protection, safe use and energy management.
The building regulations contain energy management requirements which
specify the limits for energy consumption in buildings. One requirement sets
limits for energy consumption in buildings (primary energy) expressed as
kWh per square metre per year. This requirement covers energy for heating,
comfort cooling, domestic hot water and domestic energy and is given for
normal use of the building. The primary energy requirement is currently
90 kWh/m2 for small buildings, in other words one- and two-dwelling
buildings, 85 kWh/m2 for multi-dwelling buildings and 80 kWh/m2 for non-
residential buildings.
Support for renovation and energy efficiency measures in rented properties
On 1 October 2016, support was introduced to encourage renovation and
energy efficiency measures in rented properties in areas facing socio-
economic challenges152.
The support is divided into two parts – one for renovation and one for
energy efficiency. The renovation support, which is 20% of the costs, is
given directly to the tenants as a rent rebate over seven years. The energy
efficiency support is calculated on the basis of the energy saving achieved
after the renovation. This part of the support is given to the property owner.
To be eligible for this part of the support, the renovations must improve
energy performance by at least 20%. Support cannot be sought for
renovation or energy efficiency alone, as that does not fulfil the purpose of
the measure153.
The support is being phased out after the Riksdagen’s decision on the state
150 Directive 2010/31/EU of the European Parliament and of the Council of 19 May 2010 on the energy performance of buildings. 151 The National Board of Housing, Building and Planning regulations (BFS 2011:6, incl. amendments up to BFS 2018:15). 152 The Ordinance (2016:837) on Support for Renovation and Energy Efficiency Measures in Some Residential Areas. 153 The National Board of Housing, Building and Planning – Information om stöd till renovering och energieffektivisering i vissa bostadsområden (November 2016).

87 (199)
budget for 2019154. SEK 165 million has been allocated to fund existing
measures in 2020155.
The renovation, conversion and extension deduction
The tax deduction for renovation, conversion and extension applies to the
labour costs for house repairs, maintenance, conversions and extensions. It
was introduced in 2008 to increase the supply of labour and reduce
undeclared work156. Some of the measures covered also help to increase
energy efficiency157. An obvious effect of the deduction is that it gives
property owners an incentive to carry out more renovations. On 1 July 2016
the tax reduction was cut from 50% to 30% of the labour costs. The
maximum support will now be SEK 50 000 per person per year. The facility
is offered to owners of small buildings, owner-occupied apartments and
holiday homes and to tenants.
The National Renovation Centre (NRC)
The NRC works with businesses and academic institutions to improve
knowledge and distribute information to operators in the building industry,
to enable them to carry out renovations efficiently. The aim is to make
existing buildings more environmentally, economically and socially
sustainable from a life-cycle point of view, while improving or retaining their
function so that they meet the requirements of users and the authorities158.
Renoveringsinfo.se information website
The website renoveringsinfo.se is an initiative of the NRC and Svensk
Byggtjänst AB. It aims to improve knowledge and distribute information to
help operators in the industry to carry out renovations efficiently. The
website collects opinion pieces, news, examples of renovation projects,
research and comprehensive information on specific renovation measures.
The news section is a subscriber service, but the other parts of the website
are free.
The Sustainable Building Information Centre
The Sustainable Building Information Centre was set up on 1 January 2018
and is run by Svensk Byggtjänst AB on behalf of the National Board of
Housing, Building and Planning159. The Government has commissioned the
National Board of Housing, Building and Planning to monitor the Centre’s
operations and results on a regular basis. The contract expires in 2021 and
154 Report 2018/19:CU1, Riksdag communication 2018/19:83. 155 Government bill 2019/20:1, Report 2019/20:CU1, Riksdag communication 2019/20:96. 156 Government bill 2006/07:94, Report 2006/07:Sk U15, Riksdag communication 2006/07:181 and Government bill 2008/09:97, Report 2008/09:FiU18, Riksdag
communication 2008/09:183. 157 Owners of small buildings are entitled to a tax reduction for drilling and installation of geo-thermal heating systems, changing windows, doors and taps, installing
additional insulation and installing and changing ventilation systems. Tenants are entitled to a tax reduction only for the renovation, conversion and extension work carried out on the property. (www.skatteverket.se). 158 http://www.renoveringscentrum.lth.se/. 159 Svensk Byggtjänst AB works with IVL Swedish Environmental Research Institute, Rise Research Institutes of Sweden AB, Energy Agencies of Sweden, The National
Renovation Centre at the Lund University Faculty of Engineering (NRC) and Sustainable Innovation (SUST).

88 (199)
will then be renewed for a year at a time, after evaluation.
The Sustainable Building Information Centre’s mission is to ‘promote
energy efficient renovation and building, using sustainable materials while
minimising the impact on the environment from a life-cycle point of view’.
This includes collecting information about sustainable building, adapting it
to specific target groups and disseminating it. The Centre’s website provides
information about research, results and experience. The Centre’s
information is targeted at all relevant groups, including professional builders,
owners of small buildings, housing association board members, property
owners or those involved in the building process in any other capacity160.
3.2.1.3 Description of policy and measures to promote energy
services in the public sector and measures to remove regulatory
and non-regulatory barriers that impede the uptake of energy
performance contracting and other energy efficiency service
models
Development of local and regional capacity, including sustainable transport solutions
In the 2018 spending authorisation, the Swedish Energy Agency was
assigned two tasks which promote efficiency improvements in transport.
The first is to carry out initiatives in 2018–2020 to promote strategic work
for the energy transition and reduced climate impact at local and regional
level (‘Local and Regional Capacity Development’) and the second is to
work in dialogue with the National Board of Housing, Building and
Planning, the Swedish Transport Administration, the county councils and
operators responsible for regional development on planning and
implementing initiatives in the form of support to increase digital ways of
working, cooperation on coordinated distribution of goods, town and
country planning measures to improve transport efficiency, advice and
education initiatives and financial support for measures or demonstrations
(‘Sustainable Transport Solutions’). The Agency has set up a support
programme for these two tasks, which distributes funds by means of public
calls. The support programme aims to help local and regional public
operators to contribute to the energy transition and reduced climate impact.
It is designed to develop operators’ ability to work systematically and
strategically on integrating energy and climate matters into various areas of
public-sector responsibility, including public procurement, town and country
planning and improving transport efficiency. The 75 or so projects which
have been given support must end by 2020. In 2019 and 2020 the Swedish
Energy Agency will also arrange for the projects to exchange experience and
share knowledge and produce guidelines and other knowledge aids for
operators wishing to carry out similar work.
160 https://ichb.se/.

89 (199)
Since 2018, the county councils have been tasked by the Government with
promoting, coordinating and leading the regional implementation of the
Government's policies for the energy transition and reduced climate impact
in the long-term. This involves:
• leading and coordinating the development of new long-
term regional energy and climate strategies based on the
Riksdag’s long-term energy and climate policy in dialogue
with operators in other county councils; and
• coordinating measures to promote fossil-free transport and
developing regional plans for infrastructure for electric
vehicles and renewable fuels as part of its work on regional
energy and climate strategies, in dialogue with the Swedish
Energy Agency and the Swedish Transport Administration.
The regional strategies and plans were adopted in autumn 2019 and are now
being implemented.
Dissemination of information
To promote energy services, the Swedish Energy Agency is currently
working as a contact point, providing relevant information to customers and
suppliers on the internet. In its Performance-Based Energy Management
project161, the Residential Property Owners’ Network’s has developed a
model contract for housing associations. The report Nulägesanalys av
energitjänster med garanterad energibesparing i Sverige162 was produced in 2017.
The Energy Efficiency Council
The Energy Efficiency Council is responsible for improving state
cooperation and implementing and monitoring measures and instruments to
achieve the Riksdag’s energy efficiency objectives. It plays and important
part in implementing the Energy Efficiency Directive. The Council is an
arena for addressing strategically important issues to improve cooperation
within the Government and increase the transparency of energy efficiency,
including public procurement and energy efficiency measures. It is an
advisory body and meets four times a year.
3.2.1.4 Other planned policies, measures and programmes to
achieve the indicative national energy efficiency contributions for
2030 as well as other objectives referred to in point 2.2 (for example
measures to promote the exemplary role of public buildings and
energy-efficient public procurement, measures to promote energy
audits and energy management systems (2), consumer information
and training measures (3), and other measures to promote energy
efficiency (4)).
161 https://energiradgivningen.se/lagenhet/malstyrd-energiforvaltning. 162 http://www.enveco.se/wp-content/uploads/2018/03/Anthesis-Enveco-rapport-2017-13.- Nul%C3%A4gesanalys-av-energitj%C3%A4nster-med-garanterad-
energibesparing-i-Sverige.pdf.

90 (199)
Besides the energy efficiency provisions adopted at European level and
implemented in Sweden, such as the Ecodesign Directive163, the Energy
Labelling Regulation164, the Energy Performance of Buildings Directive165
and the Energy Efficiency Directive166 the following policies and measures
apply.
Sectoral energy efficiency strategies
In 2017 the Government commissioned the Swedish Energy Agency to
formulate sectoral energy efficiency strategies with various industries, in
consultation with the relevant agencies. The sectoral strategies are designed
to help Sweden to achieve the target of a 50% improvement in energy
efficiency by 2030.
The aim of sectoral strategies is to set up a dialogue between the Swedish
Energy Agency, various industries and relevant agencies at an early stage, to
discuss indicative targets and measures in each sector and thus make a cost-
effective contribution to achieving the national energy and climate
objectives. This task was assigned to it under the Energy Agreement (see
Section 1.2) and will continue until 2030. The sectoral strategies are
described in Section 2.2.
Municipal energy and climate advisory services167
Energy and climate advisory services have existed in various forms for nearly
40 years. They were reviewed in 2015, and the Government decided to
introduce new guidelines in the Ordinance (2016:385) on Contributions to
Communal Energy and Climate Advisory Services. Advisory services
provide impartial, free, technologically neutral and commercially
independent advice to households, companies, housing associations and
organisations. This can be done by telephone or email or face-to-face.
All municipalities can provide basic local energy and climate advice.
Municipalities in remote areas can obtain additional coordination and travel
support to allow them to provide these services. In addition to a basic
advisory service, municipalities can run a more comprehensive energy and
climate advisory service with additional financial support from the Swedish
Energy Agency. The additional support can allow them to provide more
advice and cooperate with other municipalities or work together on projects
which focus on a local priority target group.
163 Directive 2009/125/EC of the European Parliament and of the Council of 21 October 2009 establishing a framework for the setting of ecodesign requirements for
energy-related products. 164 Regulation (EU) 2017/1369 of the European Parliament and of the Council of 4 July 2017 setting a framework for energy labelling and repealing Directive
2010/30/EU. 165 Directive 2010/31/EU of the European Parliament and of the Council of 19 May 2010 on the energy performance of buildings. 166 Directive 2012/27/EU of the European Parliament and of the Council of 25 October 2012 on energy efficiency, amending Directives 2009/125/EC and 2010/30/EU
and repealing Directives 2004/8/EC and 2006/32/EC. 167 http://www.energimyndigheten.se/energieffektivisering/program -och-uppdrag/kommunal-energi-och-klimatradgivning/.

91 (199)
Environmental supervision and guidance for supervision
The Environmental Code came into force in 1998. The Code increased the
importance of energy management and the use of renewable energy sources
by highlighting them in one of the rules for consideration which are its
fundamental pillars. The Environmental Code specifies that all operators
must manage energy and use primarily renewable energy sources. Operators
must therefore:
• find out how much energy they are using;
• identify possible measures; and
• take reasonable measures at all times.
The supervisory authorities must check that the management principles are
being followed. They are also responsible for giving advice. The authorities
have the right to request the information required for supervision, for
example maps, analyses and measures. It is therefore particularly important
to document energy management work. Under the Environmental
Supervision Ordinance (2011:13), the Swedish Energy Agency has been
responsible for providing supervisory guidance for operators’ internal audits
of energy management and the use of renewable energy sources since 2011.
The work involves supporting and advising operational supervisory
authorities, municipalities and county councils and coordinating, monitoring
and evaluating operational supervision.
Energy mapping in large companies
The Energy Mapping (Large Companies) Act (2014:266) aims to promote
energy efficiency. The Act is one of the ways in which Sweden meets the
requirements imposed on Member States under the EU’s Energy Efficiency
Directive168. The Act requires large companies to produce energy maps,
which must contain information about their total energy consumption and
suggestions for cost-effective ways of improving energy efficiency. Energy
mapping must be carried out at least every four years.
The Energisteg programme
Energisteg is a programme to support energy efficiency in industry and thus
help to achieve the Energy Agreement target of a 50% improvement in
energy efficiency by 2030. The programme has a total funding allocation of
SEK 125 million and runs from 2018–2020. Industry accounts for a large
proportion of Sweden's total energy consumption and the programme is
targeted particularly at the mining and manufacturing industries.
Industrial companies that have produced an energy map under the Energy
168 Directive 2012/27/EU of the European Parliament and of the Council of 25 October 2012 on energy efficiency, amending Directives 2009/125/EC and 2010/30/EU
and repealing Directives 2004/8/EC and 2006/32/EC.

92 (199)
Mapping (Large Companies) Act, can seek two types of financial support:
design support or investment support. Design support is a contribution to
an in-depth design or study of energy efficiency measures. Investment
support covers the additional cost of investing in energy efficiency measures
identified by statutory energy mapping.
The European Regional Development Fund
During the 2014–2020 programming period, the Commission allocated
around SEK 2.8 billion (including national co-finance) to Sweden to
implement Thematic Objective 4 of the Regional Funds: ‘supporting the
shift towards a low-carbon economy in all sectors’. These funds have been
divided between eight regional and one national Regional Fund programme
to encourage businesses, specifically small and medium-sized enterprises, to
improve the energy efficiency of their operations and to contribute to
innovative solutions in this area. More than 12 000 companies are expected
to have received support through the projects funded up to now.
Energy efficiency support for small and medium-sized enterprises169
Since 2015, the Swedish Energy Agency has run initiatives to promote
energy efficiency in small and medium-sized enterprises. The support is co-
financed by the European Regional Development Fund via the National
Regional Fund Programme. The Programme includes support to companies
for energy mapping. Companies that have already mapped their energy use,
but need to carry out in-depth analyses before making investment decisions,
can apply for support for environmental studies. Companies can also apply
for investment support for energy efficiency measures. Besides this financial
support. small companies are also offered coaching and the opportunity to
take part in regional business networks.
The National Regional Fund Programme’s Priority Axis 3, which supports
the shift towards a low-carbon economy in all sectors, aims to promote
energy efficiency and the use of renewable energy in companies, along with
research and innovation. The Priority Axis also aims to support the capital
requirements of companies whose operations assist with the transition to a
low-carbon economy.
The eight Swedish Regional Fund Programmes grant funding to projects
specifically aimed at energy efficiency in small and medium-sized enterprises.
The projects include cooperation between universities, companies and the
public sector to improve the energy efficiency of small and medium-sized
enterprises in the region.
Support for introduction to market, technology development and innovation clusters
169 http://www.energimyndigheten.se/nrp/.

93 (199)
Technology procurement is an instrument designed to initiate a transition in
the market and to disseminate new, more efficient technologies and methods
and new products, systems and processes. Network-based procurement for
the development of technology is a method which covers the whole
decision-making process, from the preliminary study and purchasing groups,
to requirements specifications and the dissemination and further
development of more energy-efficient technologies. It is used in areas such
as heating and control, ventilation and lighting. The Swedish Energy Agency
coordinates innovation clusters for cities (BeBo), commercial and public
premises (BeLok), small house builders (BeSmå), public sector bodies
renting premises (HyLok) and food distribution (BeLivs).
The aim of these purchaser groups and networks is to create a forum and a
platform where the state, businesses and academic institutions can develop
energy-efficient methods, produce good examples and give demonstrations
etc. The networks test, introduce and evaluate new technologies, new
models and new products and overcome knowledge barriers on the market.
The networks also act as a platform for cooperation and engagement for
various sector operators, agencies and academic institutions.
Energy declarations
The Energy Declarations for Buildings Act (2006:985) came into force in
2006 and governs the use of energy declarations in Sweden. The National
Board of Housing, Building and Planning has produced rules for
implementing the Act and supervises the declarations and the independence
of energy experts. An Energy Declaration must be prepared for buildings
when they are built, sold or rented out and for large buildings often visited
by the public. It is drawn up by an independent expert commissioned by the
owners and is valid for 10 years.
An Energy Declaration contains information about the building’s energy
consumption and is intended for future house buyers or tenants. Energy
Declarations must provide buyers with information about energy
consumption which they can take into account when buying a property.
They must also contain any energy-saving measures suggested by the energy
expert.
Energy Declarations were introduced 13 years ago and many early
declarations have now expired as they are only valid for 10 years. New
declarations have therefore been issued for many buildings in the past few
years. In June 2019, 689 000 buildings with an Energy Declaration were
registered in the National Board of Housing, Building and Planning’s
database170.
170 The National Board of Housing, Building and Planning. Trend – Energideklarationer 2009-07-01 – 2019-06-30.

94 (199)
Training programmes for low-energy buildings
Since 2016, the Swedish Energy Agency, together with other operators, has
been responsible for a range of capacity-building programmes for low
energy consumption in buildings. The programmes are aimed at various
operators in the building industry, such as architects, engineers, customers,
technicians, installers, site managers and teachers of secondary school
building courses.
Information initiatives
The Swedish authorities, particularly the Swedish Energy Agency171, have
developed web-based tools to disseminate information about energy
consumption and energy efficiency to specific target groups. The
information initiatives are targeted at households, companies and authorities.
• Energikalkylen172 is a web-based calculation programme
which provides households with information about energy
efficiency.
• Energilyftet173 is a free web-based training course on low-
energy building aimed at customers, architects, engineers,
building project managers, administrators and control
technicians.
The Sustainable Building Information Centre174 was set up in December
2017 at the request of the National Board of Housing, Building and
Planning and on the Government's initiative. The Centre is run by Svensk
Byggtjänst AB in conjunction with IVL Swedish Environmental Research
Institute, Rise Research Institutes of Sweden AB, Energy Agencies of
Sweden, The National Renovation Centre at the Lund University Faculty of
Engineering (NRC) and Sustainable Innovation (SUST) and promotes
energy-efficient renovation and building using sustainable materials which
have a low climate impact from a life-cycle point of view. It is tasked with
collecting information about sustainable building, adapting it to specific
target groups and disseminating it and has published scientific reports and
articles, produced guides to sustainable building and taken part in
conferences.
3.2.1.5 Where applicable, a description of policies and measures to
promote the role of local renewable energy communities in
contributing to the implementation of policies and measures in
points i, ii, iii and iv.
The Swedish Energy Markets Inspectorate is currently tasked with
examining how the Internal Market for Electricity Directive should be
171 https://www.energimyndigheten.se/energieffektivisering/. 172 http://energikalkylen.energimyndigheten.se/. 173 http://www.energimyndigheten.se/energieffektivisering/jag-arbetar-med-energieffektivisering/byggbranschen/energilyftet/. 174 https://www.ichb.se/, https://www.boverket.se/sv/byggande/uppdrag/informationscentrum-for-hallbart-byggande/.

95 (199)
incorporated into Swedish legislation. At present there are no measures or
policies for this.
3.2.1.6 Description of measures to develop measures to utilise
energy efficiency potentials of gas and electricity infrastructure
Amendments to the Electricity Act
The Electricity Act (1997:857) was amended in 2014 to comply with the
requirements of the Internal Market for Electricity Directive. A provision
was inserted into Chapter 3, Section 16a of the Act, which states that grid
operators may not establish technical requirements or other conditions
which hamper the provision of services in the form of altered electricity
consumption, unless the conditions are justified in the interests of a secure,
reliable and efficient network. This avoids the possibility of network tariffs
preventing load levelling by balancing services, for example, and the
purchase of additional services.
Provisions were also inserted into Chapter 4, Section 1 of the Electricity Act,
stating that network tariffs must be compatible with efficient use of the grid
and efficient generation and consumption of electricity. The Swedish Energy
Markets Inspectorate may issue regulations for network tariffs to promote
effective use of the grid.
Regulatory model for network operators
In 2014, an incentive to encourage energy efficiency was introduced into the
economic regulation of grid operators175. The incentive gives a bonus to
network operators that help to increase energy efficiency by reducing
network losses and improving the utilisation of capacity a bonus.
3.2.1.7 Regional cooperation in this area, where applicable.
Since 2018, the county councils have been tasked by the Government with
promoting, coordinating and leading the regional implementation of the
Government's policies for the energy transition and reduced climate impact
in the long-term. This involves:
• leading and coordinating the development of new long-
term regional energy and climate strategies based on the
Riksdag’s long-term energy and climate policy in dialogue
with operators in other county councils; and
• coordinating measures to promote fossil-free transport and
developing regional plans for infrastructure for electric
vehicles and renewable fuels as part of its work on regional
energy and climate strategies, in dialogue with the Swedish
175 Energimarknadsinspektionens föreskrifter (EIFS 2019:4) om vad som avses med kvaliteten i nätverksamheten och vad som avser med ett effektivt utnyttjande av
elnätet vid fastställande av intäktsram.

96 (199)
Energy Agency and the Swedish Transport Administration.
The regional strategies and plans were adopted in autumn 2019 and are now
being implemented.
3.2.1.8 Financing measures, including Union support and the
use of Union funds, in the area at national level.
Besides the national financing measures described above, the following EU
finance is relevant:
EU financial support for energy efficiency in buildings
The EU promotes improvements in the energy performance of buildings
with a range of financial support programmes. The Energy Efficiency
Finance Facility (EEFF) was established in 2011 and offers facilities for
loans, equity and guarantees and support for technical assistance for project
development support.
The European Regional Development Fund
The European Regional Development Fund (ERDF) aims to improve
economic and social cohesion within the EU by reducing regional
differences. In 2014–2020, the ERDF rules require Member States to
allocate an obligatory part of the support to the ‘transition to a low-carbon
economy’. The priorities for the next programming period, 2021-2027, have
not yet been established, but are likely to include comprehensive initiatives
for Sweden’s climate transition.
During the 2014–2020 programming period, the Commission allocated
around SEK 7.5 billion (including national co-finance) to Sweden for the
Regional Funds; SEK 1.4 billion of this was intended for thematic objective
4: ‘supporting the shift towards a low-carbon economy in all sectors’.
EU funds for Thematic Objective 4 in 2014–2020 have been divided
between eight regional programmes (SEK 8 million excluding co-finance)
and one national Regional Fund programme (SEK 700 million excluding co-
finance) to encourage businesses, specifically small and medium-sized
enterprises, to improve the energy efficiency of their operations and to
contribute to innovative solutions in this area.
The National Regional Fund Programme
Priority Axis 3 of the National Regional Fund Programme ‘supporting the
shift towards a low-carbon economy in all sectors’ aims to promote energy
efficiency and the use of renewable energy in companies, as well as research
and innovation, and the application of low-carbon technologies. This

97 (199)
priority axis is implemented as a national initiative to encourage small and
medium-sized enterprises to improve their energy efficiency, which will
make them more competitive on the market. The Priority Axis also aims to
support the capital requirements of companies whose operations assist with
the transition to a low-carbon economy.
The initiatives described below are run by the Swedish Energy Agency to
enable companies throughout the country to improve their energy efficiency.
Energy mapping support
Small and medium-sized enterprises have been entitled to apply for financial
support for energy mapping since 2010 to improve their energy efficiency176.
Energy mapping should include energy maps, suggestions for measures and
an energy plan. Each company can apply for 50% of the cost of energy
mapping, up to a maximum of SEK 50 000.
Energy efficiency networks
The Swedish Energy Agency launched a network project for small and
medium-sized enterprises in 2015. The project aims to operate 40 networks
comprising 400 companies in all, and to help them to introduce energy
management principles with the assistance of regional coordinators and
energy experts. Sharing experience and learning from each other through the
networks are also important factors for success. The network activities aim
to reduce the energy consumption of participating companies by 15%. This
will reduce the companies’ costs, improve their competitiveness and provide
new opportunities for growth.
Development of technologies and innovation
Investment support for energy-efficiency measures. Some measures
identified by energy mapping may be expensive but necessary for the
company to achieve the higher level of energy efficiency. Companies can
apply for investment support for up to 50% of the additional cost of these
investments.
Energy-efficiency incentives
Advice for small and medium-sized companies subject to supervision under
the Environmental Code. The supervision officers of the county councils
and municipalities give companies advice on supervision to enable them to
go beyond the legal requirements.
Dissemination of information about energy services
The Swedish Energy Agency has specific initiatives to promote energy
176 The Ordinance (2009:1577) on State Support for the Production of Biogas.

98 (199)
services to small and medium-sized enterprises (SMEs). It carries out these
initiatives in conjunction with industry organisations, energy management
agencies and county councils all around the country to reach both customers
and suppliers of energy services. Activities include a variety of seminars,
workshops and network meetings.
Energy and climate coaches
The Energy and Climate Coaches project is a national initiative aimed
particularly at small and medium-sized enterprises with an annual energy
consumption of less than 300 megawatt hours (MWh).
The programme, which is free to participants, combines individual coaching
with group lectures and exchanges of information between companies. The
coaching activities aim to increase energy efficiency and reduce greenhouse
gas emissions. The benefits to the companies are lower costs and improved
competitiveness.
The municipalities are entitled to apply for funding for a part-time energy
and climate coach.177 Around 130 municipalities currently have coaches,
which means that coaching can be provided locally. The programme started
in January 2017 and continued until 2019.
Other activities under the National Regional Fund Programme.
ClimateSync knowledge support is run jointly by the Swedish Energy
Agency and the Swedish Agency for Economic and Regional Growth to
support all of the initiatives in Thematic Objective 4; it includes mapping,
project manager meetings, results work, learning processes and
dissemination activities.
Green Funds are equity funds for investment in start-ups providing products
and services to reduce climate impact. Green Funds are managed by ALMI
Invest AB.
Regional Structural Funds Programme
Within the eight Swedish regional ERDF programmes, more than 20
projects aimed specifically at energy efficiency in small and medium-sized
enterprises have been granted finance in 2014-2020. The projects include
cooperation between universities, companies and the public sector (regions,
municipalities etc.) aimed at improving the energy efficiency of small and
medium-sized companies in the region.
177 The Ordinance (2016:385) on Contributions to Municipal Energy and Climate Advisory Services.

99 (199)
Besides these energy efficiency projects for small and medium-sized
enterprises, finance has so far been granted to around 150 projects for:
• research and innovation: low-carbon technology;
• sustainable building;
• sustainable transport;
• renewable energy in small and medium-sized enterprises; and
• business support.
3.3 Dimension energy security
3.3.1 Policies and measures related to the elements set out
in point 2.3.
Electricity supply
Measures for power cuts
Svenska kraftnät is Sweden’s emergency preparedness authority for
electricity; it’s job is to reinforce the electricity supply to ensure that it can
withstand severe stresses. It ensures that measures are taken to improve
preparedness, that there are trained personnel and that resources are
available to carry out repairs and provide communication equipment. For
the funding of preparedness measures, see Section 3.3.3.
Network owners are obliged to ensure that power cuts last for no more than
24 hours (see also Section 2.3) unless they are caused by factors beyond their
control178. If a power cut lasts for more than 12 hours, customers are
entitled to compensation179.
Measures are also taken to increase public awareness of suitable
preparedness measures at home to alleviate the effects of power cuts180.
Measures for electricity shortages
Crisis management measures have been prepared both to prevent electricity
shortages and to alleviate the effects of any shortages. The measures include
a national information campaign to encourage consumers to reduce their
consumption voluntarily to avoid shortages. If this is not sufficient, there are
plans for a possible rationing system in the future. The Swedish Energy
Agency is the agency in charge of measures to deal with electricity shortages.
178 Chapter 3, Section 9a of the Electricity Act (1997:857). 179 Chapter 3, Section 9a of the Electricity Act (1997:857). 180 http://www.energimyndigheten.se/trygg-energiforsorjning/nar-det-blir-el--eller-varmeavbrott-i-ditt-hem/.
100 (199)
Measures for capacity shortages
Capacity shortages must be avoided because market operators act in balance.
The Swedish system operator, Svenska kraftnät, has a number of technical
and commercial mechanisms which it can use to maintain the balance in the
electricity system if this is not sufficient.
The capacity reserve can be used if the balance cannot be restored by
ordinary measures. To create the capacity reserve, Svenska kraftnät sets up
agreements with electricity generators and consumers to maintain a specific
generation capacity or reduce their consumption.
If these mechanisms are not sufficient to remedy the problem, load shedding
(manual disconnection) is the last resort; that means disconnecting some
consumers to avoid system collapse. Styrel, a method for planning and
prioritising socially important electricity consumers, has been developed to
alleviate the consequences for society181.
The Government has commissioned the county councils in Skåne,
Stockholm, Västra Götaland and Uppsala to carry out a local and regional
analysis of the conditions for a secure electricity supply in their respective
regions. The aim is to find ways of improving coordination between the
regional and local operators to increase the efficiency of network supply.
The county councils must collect information and views from relevant local
and regional operators, such as municipalities and grid operators, to obtain a
good basis for their analysis of the local and regional capacity requirements.
They must also identify, and coordinate with, national initiatives and projects
and work which is important for their assessments for the particular area.
They must submit a report to the Swedish Government Offices
(Infrastructure Department) by 07 August 2020.
Gas supply
The Security of Gas Supply Regulation182 contains operational requirements
for security of the gas supply. On the basis of the Regulation and the
Swedish
legislation183 a risk assessment had been carried out which forms the basis
for a national preventive action plan184 and national crisis management plan.
In addition to these plans, the Swedish Energy Agency has also produced
regulations and general advice185, which contain certain requirements for
natural gas companies and major natural gas consumers. The requirements
181 The Ordinance (2011:931) on Planning to Prioritise Socially Important Electricity Consumers. 182 Regulation (EU) 2017/1938 of the European Parliament and of the Council of 25 October 2017 concerning measures to safeguard the security of gas supply and
repealing Regulation (EU) No 994/2010 183 Act (2012: 273) on the Security of the Natural Gas Supply and the Ordinance (2012:275) on the Security of the Natural Gas Supply. 184 This corresponds to the requirement in Article 6(1) of Regulation (2017/1938) to introduce a ‘risk preparedness plan’. 185 The Swedish Energy Agency’s regulations and general advice (STEMFS 2016:1) on security of the national gas supply.

101 (199)
aim to increase preparedness for any future gas supply crises and thus secure
the supply of gas to domestic customers, who have special protection under
the Security of Gas Supply Regulation. The Regulation specifies that the
competent authorities must oblige natural gas companies to take measures to
secure the gas supply to protected customers in the following circumstances:
• when temperatures are extreme for seven days which,
statistically, happens once every 20 years;
• when there is an exceptional demand for gas for a period of
30 days which, statistically, happens once every twenty years;
and
• when the largest single gas infrastructure is
interrupted for 30 days under average winter
conditions
Oil supply
The IEA Agreement186 and the Oil Stocks Directive187 oblige Sweden to hold
emergency stocks equivalent to 90 days’ net imports. The Swedish Energy
Agency determines the size of the oil stocks once a year; it also establishes
who is responsible for holding them and how large individual stocks should
be. The extent of the storage obligation is based on the sales or
consumption of the party obliged to hold them during the previous
reference year. A stock year runs from 1 April to 31 March of the following
year. From 2020, the stock year will change to 1 July to 30 June of the
following year. The emergency stocks include biofuels if they are blended
with stored fuel on sale or consumption, or if they are stored in Sweden and
the party obliged to store them can demonstrate that they are intended for
blending with stored fuel and will be used for transport.
Information security
Implementation of the NIS Directive
The NIS Directive188 on information security has been transposed into
Swedish legislation by the (2018:1174) Socially Important and Digital
Services (Information Security) Act and the accompanying Ordinance and
regulations.
The purpose of the Information Security (Socially Important and Digital
Services) Act is to achieve a high level of network and information-system
security for socially important services in the energy, transport, banking,
financial market infrastructure, health, drinking water supply and
distribution, digital infrastructure and digital services sectors. The Swedish
186 The International Energy Agency’s Agreement on an International Energy Programme. 187 Council Directive 2009/119/EG of 14 September 2009 imposing an obligation on Member States to maintain minimum stocks of crude oil and/or petroleum products. 188 Directive (EU) 2016/1148 of the European Parliament and of the Council of 6 July 2016 concerning measures for a high common level of security of network and
information systems across the Union.

102 (199)
Civil Contingencies Agency coordinates the work under the Act and the
individual sectors have dedicated supervisory authorities. In short, the Act
obliges suppliers of socially important services to register with the
supervisory authorities, to report incidents and to carry out systematic
information security work.
The Government has appointed the Swedish Energy Agency as the
supervisory authority for the energy sector in Sweden under the Act. The
Agency is therefore required to supervise suppliers of socially important
services in the energy sector to ensure that they comply with the Act and the
associated regulations. It is also responsible for providing information and
training about information security and risk and continuity management. It
is currently developing regulations for risk analysis and security measures for
the energy sector. The Agency provides training on legislation, threats and
risk analysis.
The Government’s digitisation strategy
The National Digitisation Strategy189 sets out the Government’s digitisation
policy. The vision is sustainable digitisation in Sweden. The overall objective
is to make Sweden the world leader in exploiting the possibilities of
digitisation. Reliable people with good digital skills have the opportunity to
drive innovation, which requires strong leadership and good infrastructure.
The strategy contains five subsidiary objectives for digital competence,
digital security, digital innovation and digital infrastructure to help achieve
the overall objective. The subsidiary objectives show how digitisation will
benefit social development.
National strategy for information and cybersecurity
The Government has also presented a national strategy for developing and
improving information and cybersecurity in Sweden190. The strategy sets out
objectives in six priority areas to create permanent conditions which will
allow social operators to work effectively on information and cybersecurity
and raise awareness and improve knowledge throughout society.
3.3.2 Regional cooperation in this area
The security supply work and crisis management measures are based on the
geographical extent of the market. Since the oil and fuel markets are global,
cooperation on crisis management measures is also global, partly within the
IEA. The risk of a potential oil or fuel shortage is analysed both in Sweden
and in the EU, by the IEA. The IEA assesses the severity of an interruption
to the market supply and analyses how much of the emergency stocks
should be used to cover it. It can suggest measures, including collective
189 https://www.regeringen.se/49adea/contentassets/5429e024be6847fc907b786ab954228f/digitaliseringsstrategin_slutlig_170518-2.pdf. 190 https://www.regeringen.se/49f639/contentassets/04c9e2929f474f14bb05f182e7054c87/faktablad -en- nationell-strategi-for-samhallets-informations--och-
cybersakerhet.pdf.

103 (199)
measures, but Sweden is responsible for deciding on the measures to be
taken.
Since the Swedish electricity system is linked to the other Nordic countries,
the Nordic region works together on crisis management measures.
NordBER is a forum for cooperation between the Nordic energy and
electricity preparedness authorities and system operators on electricity
preparedness. Two Swedish agencies, the Swedish Energy Agency and
Svenska kraftnät, are members.
Sweden and Denmark have cooperated on gas supply for many years. The
EU’s new Security of Gas Supply Regulation191 formalises regional
cooperation by dividing Member States into different regional risk groups so
that they can produce joint regional risk assessments to improve cooperation
on disruption which affects the region. Sweden is in three of these groups192.
The transmission network operators in Sweden and Denmark have set up a
joint balancing zone which will increase regional cooperation.
3.3.3 Where applicable, financing measures in this area at
national level, including Union support and the use of Union
funds
Svenska kraftnät is given a budget allocation for preparedness measures.
Some of this allocation is also used for administrative costs linked to its role
as the authority in charge of preparedness, funding for research and
information related to its duty to promote the security of the country’s flood
defences. The annual allocation is normally equivalent to the electrical
preparedness charge paid by the grid operators (SEK 255 million in 2018193).
The crisis management measures aim to prevent, resist and manage
disruption of the electricity supply which may place the country under severe
strain. Examples include technical reinforcement measures, increased
physical protection of vital installations, strong IT-security and the
acquisition of resources for repair and training.
3.4 Dimension internal energy market
3.4.1 Electricity infrastructure
3.4.1.1 Policies and measures to achieve the targeted level of
interconnectivity as set out in point (d) of Article 4.
191 Regulation (EU) 2017/1938 of the European Parliament and of the Council of 25 October 2017 concerning measures to safeguard the security of gas supply and
repealing Regulation (EU) No 994/2010 192 Group 1 comprises Denmark, Germany, Luxembourg and the Netherlands, Group 2 Belgium, Czechia, Denmark, Germany, France, Luxembourg, the Netherlands,
Austria and Slovakia and Group 3 Belgium, Denmark, Germany, Ireland, Spain, France, Italy, Luxembourg, the Netherlands, Portugal and the United Kingdom. 193 Svenska Kraftnät – Årsredovisning 2018, p. 35.
104 (199)
As regards the dimension ‘Internal Energy Market’:
1. The level of electricity interconnectivity that the Member State aims
for in 2030 in consideration of the electricity interconnection target
for 2030 of at least 15%, with a strategy with the level from 2021
onwards defined in close cooperation with the Member States
affected, taking into account the 2020 interconnection target of 10%
and the indicators of the urgency of action based on price differential
in the wholesale market, nominal transmission capacity of
interconnectors in relation to peak load and to installed renewable
generation capacity as set out in point 2.4.1 of Section A of Part I of
Annex I. Each new interconnector shall be subject to a
socioeconomic and environmental cost-benefit analysis and
implemented only if the potential benefits outweigh the costs.
2. Key electricity and gas transmission infrastructure projects, and,
where relevant, modernisation projects, that are necessary for the
achievement of objectives and targets under the five dimensions of
the Energy Union.
3. National objectives related to other aspects of the internal energy
market such as: increasing system flexibility, in particular through
policies and measures related to market-based price formation in
compliance with applicable law; market integration and coupling,
aiming to increase the tradeable capacity of existing interconnectors,
smart grids, aggregation, demand response, storage, distributed
generation, mechanisms for dispatching, re-dispatching and
curtailment and real-time price signals, including a timeframe for
when the objectives should be met, and other national objectives
related to the internal energy market as set out in point 2.4.3 of
Section A of
Part 1 of Annex I
As described in Section 2.4, the Swedish interconnectivity level in
2018/2019 is 27%, which is higher than the EU’s target of 15% by 2030.
Svenska kraftnät is building connections to other countries on the basis of
socio-economic cost-benefit assessments.
A third AC connection to Finland is currently in the design phase and the
Hansa Powerbridge to Germany is part of the current network development
plan. Planned and new connections are analysed every other year, when
Svenska kraftnät’s network development plan is updated.
3.4.1.2 Regional cooperation in this area
Svenska kraftnät cooperates with other European national grid companies
through the European Network of Transmission System Operators for
Electricity (ENTSO-E). It contributes to various ENTSO-E products such
as the Ten Year Development Plan (TYNDP) and is also a member of
various ENTSO-E working groups.

105 (199)
It also produces joint Nordic network development plans with the other
Nordic national grid companies every other year. The last plan, which was
published in August 2019194194, describes planned and current projects.
3.4.1.3 Where applicable, financing measures in this area at
national level, including Union support and the use of Union funds
The planned AC connection195 (400 kV) between Sweden (SE1) and Finland
has PCI status196 and is therefore eligible for funding from the EU. This is
being handled by Fingrid (the Finnish transmission system operator).
3.4.2 Energy transmission infrastructure
3.4.2.1 Policies and measures related to the elements set out in
point 2.4.2, including, where applicable, specific measures to enable
the delivery of Projects of Common Interest (PCIs) and other key
infrastructure projects.
Removing regular bottlenecks from the national grid is a continuous
process. Regional and local network companies are responsible for their own
parts of the grid. Regular bottlenecks are removed if that is worthwhile from
a socio-economic point of view. However there is no justification for
reinforcing the grid to the point where bottlenecks never occur. Reinforcing
the grid to minimise bottlenecks is a long-term measure.
3.4.2.2 Regional cooperation in this area
See Section 3.4.1.2.
3.4.2.3 Where applicable, financing measures in this area at
national level, including Union support and the use of Union funds
A new scheme197 was introduced on 1 May 2015 which allows regional network
companies to apply for grid reinforcement loans. The aim of the new
regulation is to enable large renewable generation projects to connect to the
grid.
The grid reinforcement loan is a temporary solution to allow regional
network companies to obtain a loan from Svenska kraftnät under certain
circumstances. The loan covers the grid reinforcement costs that facilitate
future connection of electricity generation. This means that an operator
connecting to the grid only needs to pay the costs of the capacity required
for its own project, which was not the case with previous regulations.
194 Statnett, Fingrid, Energinet, Svenska kraftnät – Nordic Grid Development Plan 2019. 195 https://www.svk.se/natutveckling/stamnatsprojekt/messaure-keminmaa/. 196 https://ec.europa.eu/energy/en/topics/infrastructure/projects-common-interest. 197 The Ordinance (2015:213) on Loans to Network Companies for the Connection of Renewable Generation.

106 (199)
3.4.3 Market integration
3.4.3.1 Policies and measures related to the elements set out
in point 2.4.3
Sweden does not have any national targets for market integration, as stated
in Section 2.4.3. While there are no national targets, the measures for market
integration are described in more detail below.
3.4.3.2 Measures to increase the flexibility of the energy
system with regard to renewable energy production such as
smart grids, aggregation, demand response, storage,
distributed generation, mechanisms for dispatching, re-
dispatching and curtailment, real-time price signals, including
the roll-out of intraday market coupling and cross-border
balancing markets.
An electricity market with a higher proportion of renewable generation in
the form of wind and solar power also presents greater challenges for the
electricity system. Domestic customers and industries can help to meet some
of the challenges by being flexible in their use of electricity. A flexible
electricity system is essential for maintaining the balance between production
and consumption. Those responsible for the balance hold the key to this,
since they have an incentive to reduce their costs by increasing the flexibility
of resources under market conditions. In a future electricity market with a
higher share of renewable and variable electricity generation, it will be
important to use all of the electricity system’s flexibility resources, in other
words flexible production and storage, and demand response.
The SmartGrid Forum has produced a strategy198 to increase flexibility in the
electricity system with smart grids. Four areas have been identified which
need to be developed to achieve this. These four areas combined are
essential for the development of services and products to stimulate flexibility
in the electricity system. The Forum has produced 20 recommendations for
activities in the following four areas:
• establishing the conditions for new business models for flexible services;
• developing the markets for system services;
• carrying out IT-security and integrity measures; and
• carrying out information and awareness-raising measures.
Sweden participates in Nordic and international cooperation on demand
response. The Swedish Energy Markets Inspectorate monitors developments
in demand response continuously to ensure there is scope for it in the
regulations. It has proposed a range of measures to facilitate and accelerate
the development of demand response at the Government's request199. Many
of these measures have been implemented. The measures implemented or
198 http://www.swedishsmartgrid.se/globalassets/publikationer/slutrapport_flex_14sept.pdf. 199 The Swedish Energy Markets Inspectorate – Åtgärder för ökad efterfrågeflexibilitet i det svenska elsystemet (Ei 2016:15).

107 (199)
approved are described below.
Work is being carried out in accordance with the network codes on shorter
settlement periods and developed price setting for imbalances. This may give
operators more of an incentive to develop business models for explicit
demand response. Explicit demand response means that customers are
compensated for using more or less electricity during a particular period.
The energy released in this way can be offered in different marketplaces (for
example intraday or balancing power markets) or used for other purposes
(for example for local networks). Flexibility is therefore priced in the
electricity system.
To enable customers to adapt their electricity consumption to hourly
variations in the electricity price, they must be sent a price signal by means
of an hourly price contract, for example; this is known as implicit demand
response. An hourly price contract means that customers are charged for
their actual hourly consumption rather than at a flat rate for their
consumption profile. Hourly price contracts give customers a genuine
opportunity and incentive to control their consumption, so that they use
more electricity when the price is low and less when the price is high. Two
measures have been implemented to promote hourly price contracts.
The Ordinance (1999:716) on the Measurement, Calculation and Reporting
of Transmitted Electricity (the Measurement Ordinance) has been amended
to remove flat-rate settlement for customers with an hourly price contract
from 1 January 2020. In addition to this, hourly rate contracts will be
included in Elpriskollen – the Swedish Energy Market Inspectorate's price
comparison website. This will be done by including variable hourly rate
contracts in the Inspectorate’s regulations and general advice200 about
electricity suppliers’ responsibility for providing information about prices
and conditions applicable to consumers. Showing these contracts on
Elpriskollen will create new opportunities for Swedish consumers to choose
this type of contract.
3.4.3.3 Where applicable, measures to ensure the non-
discriminatory participation of renewable energy, demand response
and storage, including via aggregation, in all energy markets.
There are no specific measures, as discrimination is not permitted in the
Nordic electricity system.
3.4.3.4 Policies and measures to protect consumers, especially
vulnerable and, where applicable, energy poor consumers, and to
improve the competitiveness and contestability of the retail energy
200 Energimarknadsinspektionens föreskrifter och allmänna råd (EIFS 2013:7) om elleverantörers skyldighet att lämna uppgift om priser och leveransvillkor som
tillämpas mot elanvändare.

108 (199)
market.
The Swedish definition of vulnerable customers is set out in the Ordinance
(2016:742) containing Instructions for the Swedish Energy Markets
Inspectorate and states that ‘vulnerable customers are persons who
permanently lack the means to pay for the electricity or natural gas
transmitted or delivered to them for non-business purposes’. This category
of consumer is protected on the Swedish electricity and natural gas markets
by a right to receive financial assistance for payment of bills. The Swedish
Energy Markets Inspectorate has estimated that around 20 000 consumers
can be classified as vulnerable customers.
Both the Electricity Act (1997:857) and the Natural Gas Act (2005:403) also
contain provisions which protect consumers at risk of being disconnected
from the electricity or natural gas network for non-payment or another
serious breach of their contract. These provisions require companies to
follow a particular statutory procedure before disconnecting them. This
includes providing them with accurate information, giving them the
opportunity to comply without disconnecting them and notifying social
services in the municipality where they live before they are disconnected.
The Energy Markets Inspectorate also runs a price comparison website,
www.elpriskollen.se, to improve consumers’ position on the electricity
market and access to objective information. Consumers can use it to
compare prices and conditions under the most common contracts offered
by all electricity suppliers. The opportunity to compare prices and other
factors which may influence the choice of electricity supplier is essential for
encouraging active customer engagement and hence demand response.
In a future electricity market with a higher share of variable electricity
generation in the form of wind and solar power, it will be important to
utilise all of the flexibility resources in the electricity system, in other words
flexible production and storage, and demand response.
3.4.3.5 Description of measures to enable and develop demand
response, including those addressing tariffs to support dynamic
pricing.
Since 2018, grid operators have been able to test new tariffs as part of a pilot
project under Chapter 4, Section 4a–4b of the Electricity Act (1997:857). In
its report Åtgärder för ökad efterfrågeflexibilitet i det svenska elsystemet (Ei R
2016:15) the Swedish Energy Markets Inspectorate concluded that network
tariffs are an effective tool for exploiting the available customer demand
response.
Under the new provisions of the Electricity Act, grid operators are able to

109 (199)
test tariffs that use demand response to encourage more efficient use of the
network on a small number of customers in a customer category. This allows
them to test and develop the tariffs to encourage the type of flexibility
needed in their own network area.
The provisions are an exception to the requirement for uniform network
tariffs. However, the tariffs must still be objective and non-discriminatory
and must be compatible with efficient use of the grid and efficient
generation and consumption of electricity.
On 2 October 2018, the Government decided to amend the Electricity
Ordinance (2013:208). The amendments allow the Swedish Energy Markets
Inspectorate to issue rules for designing network tariffs to promote efficient
use of the grid. It has begun drafting these rules. The work is expected to be
completed in Spring 2020. The Swedish Energy Markets Inspectorate may
also issue rules for the customer information to be provided by grid
operators explaining their charges and telling customers how they can
influence their costs by changing the conditions or patterns of consumption.
It is planning to start work on these rules in 2020.
3.4.4 Energy poverty
3.4.4.1 Where applicable, policies and measures to achieve the
objectives set out in point 2.4.4.
Not applicable as energy poverty is not an element of social policy.
3.5 Dimension research, innovation and competitiveness
3.5.1 Policies and measures related to the elements set out
in point 2.5
Policies for research and innovation
Energy research policies are set out in the Government bill on Research and
Innovation for Sustainability, Competitiveness and Security of Supply in the
Energy Sector (Government bill 2016/17:66) and are implemented by the
energy-related activities under the National Energy Research and Innovation
Programme. They complement the policies presented in the Government
bill A Cooperative Approach to Knowledge – Meeting Society’s Challenges
and Enhancing Competitiveness (Government bill 2016/17:50).
These bills set out the policy and the budget for the next four years and
similar bills have been presented every four years. The next Government bill
on the energy research and innovation policy is currently being prepared and
the Government will make a decision on it in autumn 2020. The

110 (199)
Government has commissioned the Swedish Energy Agency to prepare the
background information for this bill to provide a sound basis for continued
funding for the sector.
The Agency has overall responsibility for research, development, innovation
and demonstration and for the National Energy Research and Innovation
Programme. Some related activities are also carried out by other agencies
working in conjunction with the Swedish Energy Agency. Basic research on
nuclear fission and fusion is funded by the Swedish Research Council.
Overall basic energy research is carried out jointly by the Swedish Research
Council (which evaluates the quality of the research) and the Swedish
Energy Agency (which evaluates its relevance to energy).
The Energy Development Board is the ultimate decision-making body for
the National Energy Research and Innovation Programme. Its members are
appointed by the Government and represent various fields and disciplines.
They are drawn from the academic and commercial world and from the
public sector. The Board usually makes decisions on major programmes and
large individual projects. It can also delegate decisions to the Swedish
Energy Agency.
The National Energy Research and Innovation Programme
Sweden's activities under the National Energy Research and Innovation
Programme, which has an annual budget of around SEK 1.6 billion for
2017–2020, are based on the principle that energy research and innovation
should help to find solutions for five overall challenges201:
• to create a fully renewable energy system which meets the
challenges presented by the energy system’s impact on the
climate, while considering the environmental impact of the
different types of renewable energy;
• to ensure that the energy system is flexible and robust and
provides security of supply for society as a whole as part of
a fully renewable energy system;
• to create a resource-efficient society which improves
competitiveness, facilitates the transition to a renewable
energy system and enables society as a whole to use
available resources efficiently;
• to increase action on innovation, jobs and the climate to
give Sweden a leading position in the transition to a
renewable energy system; to use the transition as an
opportunity to develop businesses;
• to facilitate interaction between various operators, sectors,
201 Government bill Research and Innovation for sustainability, competitiveness and security of supply in the energy sector (Government bill 2016/17:66).

111 (199)
standards and business models in the energy system with the
aim of creating the conditions for cooperation and diversity
to speed up the transition.
Sweden will carry out initiatives to address these challenges under the 2017–
2020 National Energy Research and Innovation Programme. The
programme runs research and innovation initiatives in nine areas:
• the transport system
• bioenergy
• buildings in the energy system
• electricity generation and the electricity system
• industry
• sustainable society
• general energy system studies
• business development and commercialisation
• cooperation on information.
Section 4.6 describes some examples of current or completed projects
funded by the National Energy Research and Innovation Programme.
Ten-year research programme on climate and sustainable society
In addition to the National Energy and Innovation Programme, there is also
a Ten-Year National Climate Research Programme. The Programme was
launched in 2017 to help achieve Sweden's aim to be a fossil-free welfare
society and its ambition to be a global leader in achieving the objectives of
the Paris Agreement. People must radically change and adapt their behaviour
to reduce humanity's impact on the climate – in Sweden, in the EU and
worldwide. Interdisciplinary and cross-sectoral research and innovation in
many different fields is required to meet climate challenges. The programme
was granted around SEK 75 million in 2018, and it is estimated that it will
receive SEK 130 million a year from 2019 to 2026.
There is also a Ten-Year National Research Programme for Sustainable
Society. The programme was launched in 2017 and will develop knowledge
which may lead to the development of new solutions of in all sectors of
society, to create a safe, secure, sustainable and inclusive society. The
programme is based on the Agenda 2030 sustainability goals, the national
environmental targets and other relevant national objectives. Its initiatives
are conducted on the basis of a strategic research agenda. The results of the
programme must benefit society by utilising existing knowledge and
developing new knowledge. In 2019, the programme will pay around
SEK 25 million to research projects and around SEK 25 million to social
housing projects. The programme funding for 2019–2026 is expected to be
SEK 100 million a year.

112 (199)
The Government’s cooperative programmes
Four cooperative programmes have been launched for the Government's
2019-2022 term of office to improve cooperation between businesses,
academic institutions and the Government202. These programmes aim to
concentrate resources on enhancing Sweden's competitiveness and capacity
for innovation and meeting the major challenges facing society. One of the
four cooperative programmes deals with the climate transition for
businesses.
The Government will also monitor and develop the work of the cooperative
programme Next Generation Travel and Transport, which has decided to
focus on automation, digitisation and electrification.
The National Innovation Council
The Government has set up an innovation council to devise innovative
solutions for major social challenges and to promote long-term
competitiveness and sustainability in Sweden203. The Innovation Council has
an advisory role and brings a new perspective to matters of importance for
innovation policy.
Its main purpose is to improve the conditions for innovation in Sweden and
society's ability to find innovative solutions to challenges.
3.5.2 Where applicable, cooperation with other Member
States in this area, including, where appropriate, information on
how the SET Plan objectives and policies are being translated
to a national context
Cooperation with other Member States
International cooperation on energy research and innovation will be an ever
more important complement to national initiatives for achieving the national
objectives and is particularly important for a small country like Sweden.
Sweden's cooperation with other countries on research, innovation and
development is conducted mainly within the EU and its various instruments.
These include the EU Framework Programme for Research and Innovation
(Horizon 2020) and the Strategic Energy Technology Plan (SET plan)204.
However Sweden also participates in the work of other international forums
such as the International Energy Agency (IEA) and Mission Innovation
(MI).
202 https://www.regeringen.se/regeringens-politik/regeringens-strategiska-samverkansprogram/. 203 https://www.regeringen.se/regeringens-politik/nationella-innovationsradet/. 204 https://setis.ec.europa.eu/actions-towards-implementing-integrated-set-plan.

113 (199)
The SET plan contains four key priorities and ten key actions to accelerate
the energy system transition. Objectives and implementation plans have
been developed for each key action at EU level. Participation is voluntary,
but Sweden participates in relevant key actions which are also national
priorities, as this is be best way to link national and EU objectives. Sweden
participates to some extent in the following working groups and
corresponding implementation plans: ocean energy, smart solutions for
energy consumers, smart cities, energy systems, energy efficiency in
buildings, energy efficiency in industry, batteries for e-mobility, bioenergy
and renewable fuels and carbon storage and carbon utilisation. The work
entails linking up parts of the National Research Programme (activities
under each objective), in other words each thematic and strategic research
and innovation initiative within these objectives, to assist with the joint
actions and objectives of a particular key action in the SET plan.
Swedish operators also participate in some of the EU's Technology and
Innovation Platforms: ETIP Renewable Heating and Cooling and ETIP
Smart Networks for Energy Transition (SNET). The platforms are industry-
led and carry out activities within the key actions of the respective SET
plans.
ERA-NET is a Horizon 2020 instrument for cooperation on joint calls and
project funding between research funding agencies in the EU. Sweden takes
part in many of these cooperative programmes to complement national
initiatives in a particular area, increase the dissemination of knowledge and
learn from various research and development initiatives. In summary,
Sweden participates in the key actions: bioenergy, ocean energy, solar energy,
smart cities and communities, building a sustainable society, smart grids,
wind energy, transport and adaptation to climate change. Sweden also takes
part in ERA-NET cooperative programmes and a Joint Programme
Initiative which assists with implementing the SET Plan's implementation
plans (see Table 13).
Around SEK 45 million was paid for the cooperative programmes and
initiatives in which Sweden participates in 2018; this is expected to rise to
around SEK 45 million in 2019. In addition to this, Sweden plans to take
part in a Horizon Europe partnership programme (co-funded by the EU).
Table 13. List of ERA-NET cooperative programmes and Joint Programme Initiatives in which the Swedish Energy Agency participates
EUROPEAN PROGRAMMES
DESCRIPTION OF THE LINK TO NATIONAL INVESTMENTS

114 (199)
ERA-NET BIOENERGY Reinforces national bioenergy programmes and the networks of Swedish operators. Participation in this cooperative programme fits well with the Agency’s research priorities, especially increasing the use of bioenergy. The calls require bioenergy projects in which cooperation between the operators in many of the countries taking part in the call add value to the project. The project must relate to supply or consumption or both (heating, cooling, electricity, fuel) in different biofuel chains.
SOLAR-ERA.NET COFUND 1
SOLAR-ERA.NET COFUND 2
Reinforces national programmes for solar cells and solar thermal electricity and the networks of Swedish operators. The Solar-ERA-NET Cofund aims to increase the exchange of knowledge and stimulate developments in solar electricity by financing joint projects and activities and using existing knowledge at regional, national and European level. Sweden has a lot of solar electricity know-how. To maintain its position as a global leader, it is important to promote international cooperation. It is also expected to strengthen Europe’s industrial technology base, creating growth and employment in Europe and in Sweden.
OCEAN ERA-NET
OCEAN ERA-NET COFUND
Reinforces national ocean energy programmes205 and
the networks of Swedish operators. The research and
development carried out by universities and companies in Sweden is commercialised primarily in markets abroad. By supporting international cooperation, Swedish research and development can assist with the transition of the energy system both nationally and internationally and can be exported to foreign markets by Swedish businesses. There is also a significant need for cooperation in this area as there are many barriers to be overcome and a very limited amount of funding. Member States can work together to commercialise ocean energy in Europe.
BESTF3 Reinforces national bioenergy programmes and the networks of Swedish operators. Funding for cooperative projects on bioenergy, which must demonstrate at least one innovative step in bioenergy processes and will result in pre-commercial demonstration. The programme aims to promote the contribution of bioenergy to European climate and energy policy targets.
ERA-NET PLUS NEW EUROPEAN WIND ATLAS
Reinforces national wind energy programmes and the networks of Swedish operators. Participation in this cooperative programme fits well with the Agency’s research priorities and the development of electricity generated from renewable sources. The aim is to develop and produce a new European wind atlas.
ERA-NET SMART GRIDS PLUS ERA-NET SMART ENERGY SYSTEMS
ERA-NET PLUS REGSYS
Reinforces national grid programmes and the networks of Swedish operators. ERA-Net Smart Grids plus aims to contribute to the technological development of smart grids and facilitate interaction with the market and society in order to achieve the common European vision for the energy system of the future. The objective is to integrate smart grid technologies, stakeholders and market processes to help achieve Europe’s short- (2020), medium- (2035) and long- (2050) term energy policy targets. ERA-Net plus Regsys aims to create new system solutions for the specific needs of local and regional energy systems and networks. The property owners, local and regional companies, municipal and county councils and others who need these solutions will be actively involved in the development of new knowledge and integrated technologies, processes, system services and prototypes.
FORESTVALUE Reinforces national bioenergy initiatives. The aim of this cooperative programme is to promote innovation and improve competitiveness in the forestry sector in Europe and to support its transition from a resource-intensive to a knowledge-intensive, productive, resource-efficient and resilient sector. International cooperation contributes towards establishing a bioeconomy in Sweden by providing leverage for the development and testing of solutions which may achieve it
ERA-NET COFUND SMART CITIES AND COMMUNITIES
ERA-NET COFUND SUSTAINABLE URBANISATION (ENSUGI)
Reinforces national initiatives for sustainable cities and a sustainable society. Participation in this cooperative programme fits well with the Agency’s research priorities. The aim of ENSUGI is to address global challenges in the area covered by the call, focusing on synergies and connections within the Food-Water-Energy system and links to urbanisation and sustainable development through cooperation between European operators in the JPI Urban Europe and countries outside Europe.
ERA-NET COFUND ELECTROMOBILITY EUROPE
Reinforces national initiatives for electrification of the vehicle fleet and transport efficiency. Participation in this cooperative programme fits well with the Agency’s research priorities. Testing and demonstrating knowledge and innovation in the transport system and the urban environment will help produce a breakthrough for electric mobility in Europe.
URBAN EUROPE The strategic research and innovation agenda developed within Urban Europe is supported by participation in ERA-net and hence by the Swedish Energy Agency’s sustainable cities initiatives.
Nordic cooperation
Sweden is a member of Nordic Energy Research (NEF), which is a joint
energy research and analysis institution under the Nordic Council of
Ministers. The overall purpose of its activities is to promote energy
cooperation, use and profiling in the Nordic countries. NEF supports areas
of energy research that are of common interest to Nordic stakeholders and
205 Ocean energy is a collective term for technologies that generate energy from waves, tides, currents, temperature differences and differences in salinity.

115 (199)
provide potential for cross-border cooperation. It finances and coordinates
research, provides administrative expertise and advice and builds networks.
Sweden is paying SEK 12.5 million a year to the NEF for 2019 and 2020.
Examples of calls and projects
NordForsk, The Academy of Finland, Formas, the Swedish Research
Council for Health, Working Life and Welfare (Forte), the Swedish Energy
Agency and the Research Council of Norway finance a joint call for research
on sustainable urban development and smart cities. The call has a total
budget of NOK 50 million. The overall objective of the call is to promote
cooperation between the knowledge societies in the Nordic countries to
increase the possibilities for addressing the challenges facing cities of all
sizes. The projects must contribute to the overall analysis and use of
important knowledge for the successful implementation of possible
solutions.
The Swedish Energy Agency and the Norwegian state-owned company
Gassnova are providing SEK 7.7 million and NOK 9.5 million respectively
in funding for a bilateral three-year demonstration project for carbon
capture and storage (CCS) at the Preem refinery in Lysekil. The project is
investigating the possibility of setting up a full-scale CCS plant at the
refinery’s hydrogen installation which will reduce its CO2 emissions by up to
500 000 tonnes a year. The demonstration plant is a stage in the plan to set
up a full-scale plant in 2025.
3.5.3 Where applicable, financing measures in this area at
national level, including Union support and the use of Union
funds
Financing measures
Sweden is a member of Mission Innovation, an initiative in which the
governments of many countries cooperate to accelerate global clean energy
innovation. The initiative aims to make new, clean energy technology
affordable. Sweden has committed to double its initiatives under the energy
research and innovation programme, which is operator-initiated set up as a
result of public calls. This doubling is based on the average budget allocated
for such initiatives from 2013-2015 until 2020.
Table 14 shows the outcome for 2016-2018 and the planned initiatives up to
2020. The initial value is estimated at SEK 134 million based on the average
annual outcome for 2013-2015 and with the aim of increasing the funding to
SEK 268 million by 2020. The total value of the initiatives planned for 2018
has now increased to SEK 215 million. In view of the current level and the
initiatives planned by the Swedish Energy Agency, the total budget for the
research categories highlighted by the Government is expected to double by

116 (199)
2020, in line with the Mission Innovation Commitment.
Table 14. Outcome for 2016, 2017 and 2018 and Mission Innovation budget already planned for
2019–2020, in SEK
Year 2016
(outcome) 2017
(outcome) 2018
(outcome) 2019 (budget) 2020 (budget) Total
2016–2020
[SEK] 120 910 964 198 752 151 215 114 540 251 158 954 280 000 000 1 065 936 609
Sweden has granted the funds shown in Table 15206,207, in euro, for certain
social challenges under Horizon 2020.
Table 15. Funds granted to Swedish operators under Horizon 2020 [EUR]
Secure, clean and efficient energy €105 842 195
Smart, green and integrated transport €133 942 257
Climate measures, environment, resource efficiency and raw materials
€70 041 727
4. Current situation and projections with existing policies and
measures
The Swedish Environmental Protection Agency produced new climate and
energy scenarios in 2018 and 2019. The scenarios are presented in full in the
report Scenarier över Sveriges energisystem208 and are used as a basis for the
climate scenarios reported to the European Commission in the climate
report209. Unless otherwise specified, the scenario presented here is the
Swedish Energy Agency's Referens EU scenario, which is based on the
assumptions for the development of fossil fuels and the price of emission
allowances. The scenario is based on Sweden's energy and climate polices up
to 1 July 2018.
4.1 Projected evolution of main exogenous factors
influencing energy system and GHG emission developments
4.1.1 Macroeconomic forecasts (GDP and population growth)
The National Institute of Economic Research produces conditions for
economic development with its EMEC equilibrium model. These
macroeconomic forecasts are then used as a basis for the long-term climate
and energy scenarios. The development of Gross Domestic Product (GDP)
and population growth is an important factor for future energy consumption
206 Data published in the European Commission’s eCORDA database as at 13 November 2018. 207 Vinnova, Horisont 2020 – årsbok 2018 (VR 2019:04). 208 The Swedish Energy Agency – Scenarier över Sveriges energisystem 2018 (ER 2019:7). 209 The Swedish Environmental Protection Agency – Report for Sweden on assessment of projected progress, March 2019.
117 (199)
and the impact on greenhouse gas emissions.
The development of GDP is modelled in EMEC; the figures from 2015 to
2050 are presented in Table 16.
Table 16 The development of GDP in the economic scenarios from EMEC
Year 2015-2035 2036-2050
GDP development
2.05 1.94
The assumptions for population development in the period 2016–2040 are
produced by Statistics Sweden (SCB) and presented in Table 17.
Table 17 Population development assumptions
Year 2014 2020 2030 2035 2040
Population 9,995,153 10,421,344 11,172,645 11,400,957 11,595,653
Source: SCB
4.1.2 Sectoral changes expected to impact the
energy system and GHG emissions
The transport sector
To achieve the climate target in the transport sector vehicles, aircraft and
ships must become more energy efficient and the use of renewable biofuels
and electric vehicles must increase. However, increased traffic may increase
greenhouse gas emissions, particularly in the goods transport sector.
The industry sector
Electricity consumption is expected to rise in the industry sector, as many
production processes run on fossil energy will be replaced with electricity.
This will not reduce energy consumption, but it will reduce the consumption
of fossil fuels.
Housing and services sectors
The developments in the housing and service sectors depend on energy
efficient buildings and converting buildings with a direct electricity supply to
heat pumps. The potential for profitable efficiency and conversion measures
may fall in the long term, as more measures are carried out, and the
construction of new buildings may increase energy consumption.
4.1.3 Global energy trends, international fossil fuel prices,
EU ETS carbon price
The price developments for fossil fuels and carbon prices in the EU-ETS
applied by the European Commission are used for the climate and energy

118 (199)
scenarios. These scenarios come from the Commission's modelling for
reference scenarios210; it recommends that Member States use them to
increase the comparability of their results.
The prices for fossil fuels and emission allowances used in Referens EU are
presented below in Tables 18, 19, 20 and 21.
Table 18 Assumptions for world market prices for crude oil, USD/barrel, real prices.
Year 2015 2020 2030 2040
Price [USD/barrel]
56 97 121 135
Source: European Commission
Table 19 Assumptions for world market prices for coal USD/tonne, real prices.
Year 2015 2020 2030 2040
Price [USD/barrel]
66 86 124 137
Source: European Commission
Table 20 Assumptions for world market prices for natural gas, USD/mmBTU, real prices.
Year 2015 2020 2030 2040
Price [USD/barrel]
8 10 12 13
Source: European Commission
Table 21 Assumptions for prices of emission allowances for carbon dioxide, EUR/tonne CO2, real prices.
Year 2015 2020 2030 2040
Price [USD/barrel]
8 16 35 52
Source: European Commission
4.1.4 Development of technology costs
For the production of the energy and climate scenarios, assumptions were
made about how the cost of different current technologies would develop.
These assumptions are important for the result of the scenarios and play a
large part in the future development of different technologies. The energy
supply in the scenarios was modelled with the Times- Nordic211 energy
system model. More information about the assumptions is given in Annex B
‘Förutsättningar och metod’ of the Swedish Energy Agency's publication
Scenarier över Svergies energisystem 2018 (ER 2019:07).
Nuclear power
Table 22 shows the estimated costs of new nuclear power. Based on these
cost and lifetime assumptions, the total cost of generating new nuclear
power would be around SEK 0.60/kWh electricity (excluding any generation
210 https://ec.europa.eu/energy/en/data-analysis/energy-modelling/eu-reference-scenario-2016. 211 http://www.profu.se/times.htm.

119 (199)
taxes). The thermal power tax was phased out in 2018.
A generation-based nuclear power charge of around SEK 40/MWh
electricity is paid to the Nuclear Waste Fund to fund future disposal.
Table 22 Assumptions for the cost of new nuclear power
Cost of investment
(SEK/kW electricity)
Fixed O&M (SEK/kW electricity)
Mobile O&M and fuel costs
(SEK/MWh electricity)
Lifetime
(years)
50 000 550 100 50
Note: O&M stands for operation and maintenance costs.
Hydropower
The scenario calculations assume that around 1 TWh of new hydropower
will be added up to 2025 at a cost of around SEK 0.40–0.50/kWh,
depending on the type of investment. The absolute amount consists of
increases in the capacity of current large-scale hydropower, while the model
assumes the potential for new small-scale hydropower to be very limited.
Wind power
Times-Nordic divides wind power in Sweden into 12 different onshore
classes and 9 different offshore classes. The cost assumptions for new wind
power in Sweden are based on information from the Swedish Energy
Agency212 along with a slightly less comprehensive update by the Agency in
2018. It is assumed that nearly 100 TWh of onshore wind power is available
for development (see Figure 8). The model includes system integration costs
(for example for reserve capacity and some grid expansion) particularly for
large volumes of wind power. The model also takes into account that the
earning capacity will be reduced once the proportion of wind power reaches
a certain level (the more wind power in the system, the lower the price wind
farms receive for their electricity).
Figure 8 Estimated generation costs for new wind power in Sweden, assuming a lifetime of 25 years and 7% real discount rate.
212 The Swedish Energy Agency – Produktionskostnader för vindkraft i Sverige (ER 2016:17).
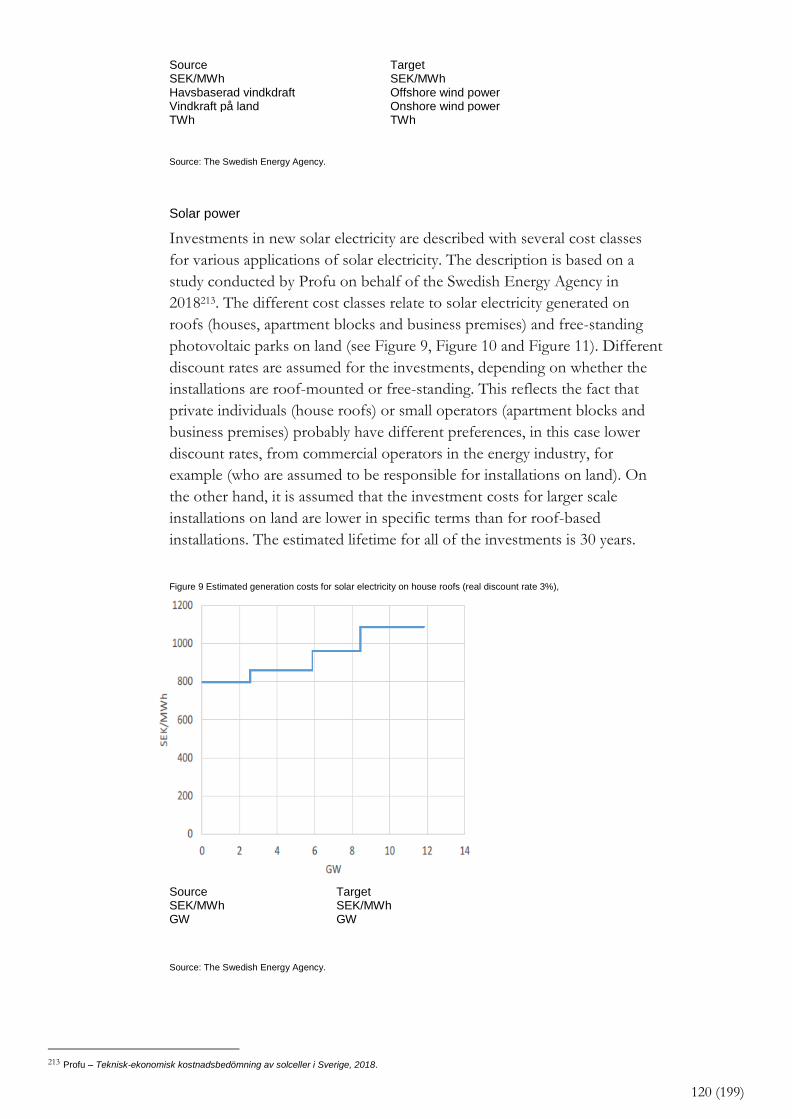
120 (199)
Source Target SEK/MWh SEK/MWh Havsbaserad vindkdraft Offshore wind power Vindkraft på land Onshore wind power TWh TWh
Source: The Swedish Energy Agency.
Solar power
Investments in new solar electricity are described with several cost classes
for various applications of solar electricity. The description is based on a
study conducted by Profu on behalf of the Swedish Energy Agency in
2018213. The different cost classes relate to solar electricity generated on
roofs (houses, apartment blocks and business premises) and free-standing
photovoltaic parks on land (see Figure 9, Figure 10 and Figure 11). Different
discount rates are assumed for the investments, depending on whether the
installations are roof-mounted or free-standing. This reflects the fact that
private individuals (house roofs) or small operators (apartment blocks and
business premises) probably have different preferences, in this case lower
discount rates, from commercial operators in the energy industry, for
example (who are assumed to be responsible for installations on land). On
the other hand, it is assumed that the investment costs for larger scale
installations on land are lower in specific terms than for roof-based
installations. The estimated lifetime for all of the investments is 30 years.
Figure 9 Estimated generation costs for solar electricity on house roofs (real discount rate 3%),
Source Target SEK/MWh SEK/MWh GW GW
Source: The Swedish Energy Agency.
213 Profu – Teknisk-ekonomisk kostnadsbedömning av solceller i Sverige, 2018.

121 (199)
Figure 10 Estimated generation costs for solar electricity in apartment blocks and business premises (real discount rate 4%).
Source Target SEK/MWh SEK/MWh GW GW
Source: The Swedish Energy Agency.

122 (199)
Figure 11 Estimated generation costs for solar electricity on land (real discount rate 6%),
Source Target SEK/MWh SEK/MWh GW GW
Source: The Swedish Energy Agency.
Biofuel-based electricity generation
Estimated data for a conventional biofuel combined heat and power (CHP)
plant are given in Table 23 With flue gas condensation, which is essential for
these plants, the total efficiency is around 105–110%, calculated on the basis
of the lower calorific value.
Table 23 Estimated data for three sizes of conventional biofuel CHP plant with flue gas condensation (some parameters, for example efficiency and index are assumed to change over time).
Cost of
investment
(SEK/kW
electricity)
Fixed O&M
(SEK/kW
electricity)
Mobile O&M
(SEK/MWh
electricity)
Efficiency (%) Index Lifetime
(years)
Large plant (ca 80 MW electricity)
25 500 380 80 30-32 (electricity)
0.38-0.41 30
Medium plant
(ca 30 MW
electricity)
34,500 580 85 28-30 (electricity)
0.35-0.39 30
Small plant (ca 10 MW electricity)
45,000 920 85 25-27 (electricity)
0.32-0.34 30
Source: The Swedish Energy Agency.
Note: O&M stands for operation and maintenance costs.
Power generated with gas
The total capacity of gas-fired CHP in Sweden is currently around 0.8 GW
electricity. It is assumed that the Öresund plant in Malmö will be phased out
by 2020, as the owner intends, leaving only around 0.3 GW power generated
by gas. Funds can be invested in developing new gas-generated power
capacity if the models indicate that it is worthwhile. Data for gas-based
power and combined heat and power generation are presented in Table 24.
The efficiency develops over time.

123 (199)
Table 24 Estimated data for gas-based power and combined heat and power generations
Cost of
investment
(SEK/kW
electricity)
Fixed O&M
(SEK/kW
electricity)
Mobile O&M
(SEK/MWh
electricity)
Efficiency (%) Index Lifetime (years)
Condensing power 7,000 40 15 55-62 - 30
CHP, large 9,500 70 20 45-50 (electricity)
1.1 30
CHP, small 12,500 120 25 45-50 (electricity)
1 30
Note: O&M stands for operation and maintenance costs.
District heating – super-heated water boilers
Table 25 presents key data for two typical super-heated water boilers, one
solid fuel-fired and one gas-fired (fuel costs and policies are fuel-specific and
are included in the model but not shown in the table)
Table 25 Estimated generation costs for district heating in heating plants (super-heated water boilers).
Cost of
investment
(SEK/kW
electricity)
Fixed O&M
(SEK/kW
electricity)
Mobile O&M
(SEK/MWh
electricity)
Efficiency
(%)
Lifetime
(years)
Natural gas 4,000 25 15 90 30
Biofuel, peat or coal 8,000 100 20 90-95 30
Note: O&M stands for operation and maintenance costs.
4.2 Dimension decarbonisation
4.2.1 GHG emissions and removals
4.2.1.1 Trends in current GHG emissions and removals in the EU ETS, effort
sharing and LULUCF sectors and different energy sectors214
Total GHG emissions and removals
Sweden emitted 5.7 million tonnes CO2 equivalents of greenhouse gases
(excluding LULUCF) in 2017. Sweden's emissions have fallen by 26% since
1990. Most of the reductions occurred in 2003-2014. The emissions varied
between a maximum of 76.9 tonnes CO2 equivalents in 1996 and a
minimum of 52.7 tonnes CO2 equivalents in 2017. Annual variations are due
primarily to temperature fluctuations, rainfall patterns and the economic
cycle. Sweden has a net uptake of carbon dioxide. The net sink varied in the
period 1990–2017. The total net uptake in 2017 was 44 million tonnes CO2
equivalents, which corresponds to 83% of the total emissions. See Figure 12
for total emissions and uptake in Sweden.
214 All information in this section comes from the Swedish Environmental Protection Agency – National Inventory Report Sweden 2019, Greenhouse gas emission
Inventory 1990–2017.

124 (199)
Figure 12 Total emissions and uptake in Sweden, 1990–2017.
Source Target Miljoner ton koldioxidekvivalenter Million metric tonnes of carbon dioxide
equivalents Markanvändning, förändrad markanvändning och skogsbruk (LULUCF)
Land Use, Land-Use Change and Forestry (LULUCF)
Jordbruk (CRF 3) Agriculture (CRF 3) Avfall (CRF 5) Waste (CRF 5) Industriprocesser inklusive produktanvändning (CRF 2)
Industrial processes including product use (CRF 2)
Energi (CRF 1) Energy (CRF 1)
42.1 million tonnes of fossil CO2 (excluding LULUCF) were emitted in
2017, equivalent to 80% of the total greenhouse gas emissions, calculated as
CO2 equivalents. 4.5 million tonnes CO2 equivalent (around 9% of total
emissions) of methane (CH4), 4.9 million tonnes CO2 equivalent (around
9% of total emissions) of nitrous oxide (N2O) and 1.1 tonnes CO2
equivalent (around 2% of total emissions) of hydrofluorocarbons were also
emitted. The distribution between the different greenhouse gases was similar
throughout the whole period from 1990 to 2017. See Figure 13 for
emissions of each greenhouse gas.
Figure 13 Emissions (excluding LULUCF) in 2017, by greenhouse gas, expressed as CO2 equivalents.
Source Target
N2O N2O

125 (199)
CH4 CH4
CO2 CO2
HFCs, PFCs & SF6 HFCs, PFCs & SF6
Emissions and uptake by sector
The largest emissions in 2017 were produced by the energy sector (70%),
agriculture (14%) and industrial processes and product use (14%).
See Figure 14 for emissions by sector.
Figure 14 Emissions (excluding LULUCF) in 2017, by sector.
Source Target Avfall Waste Jordbruk Agriculture Industriprocesser och produktanvändning Industrial processes and product use Energy Energy Energiindustrier Energy industries Tilverkningindustri och byggsektor Manufacturing industries and construction Transport Transport Övriga sektorer Other sectors Militär transport Military transport
The emissions fell by 26% between 1990 and 2017. The long-term
reductions in emissions occurred primarily between 2003 and 2014. The
reductions can be explained partly by the measures taken, for example the
transition to renewable energy and energy efficiency, and partly by
stagnation in industry. The measures that influenced emissions were carried
out over a longer period; some of them began before 1990.
Emissions in the non-traded sector
Emissions of greenhouse gases in the non-traded sector were around 32
million tonnes CO2 equivalents in 2017. That means a 0.7% reduction
between 2016 and 2017 and a 32% reduction since 1990. Emissions from
domestic transport accounted for half of the emissions in the non-traded
sector in 2017. These emissions fell by 3% between 2016 and 2017 and were
19% lower in 2017 than in 2010. This reduction can be explained largely by
an increase in the use of diesel and biofuel, both in the form of low biodiesel
blends and, increasingly, pure biodiesel. The replacement of old passenger
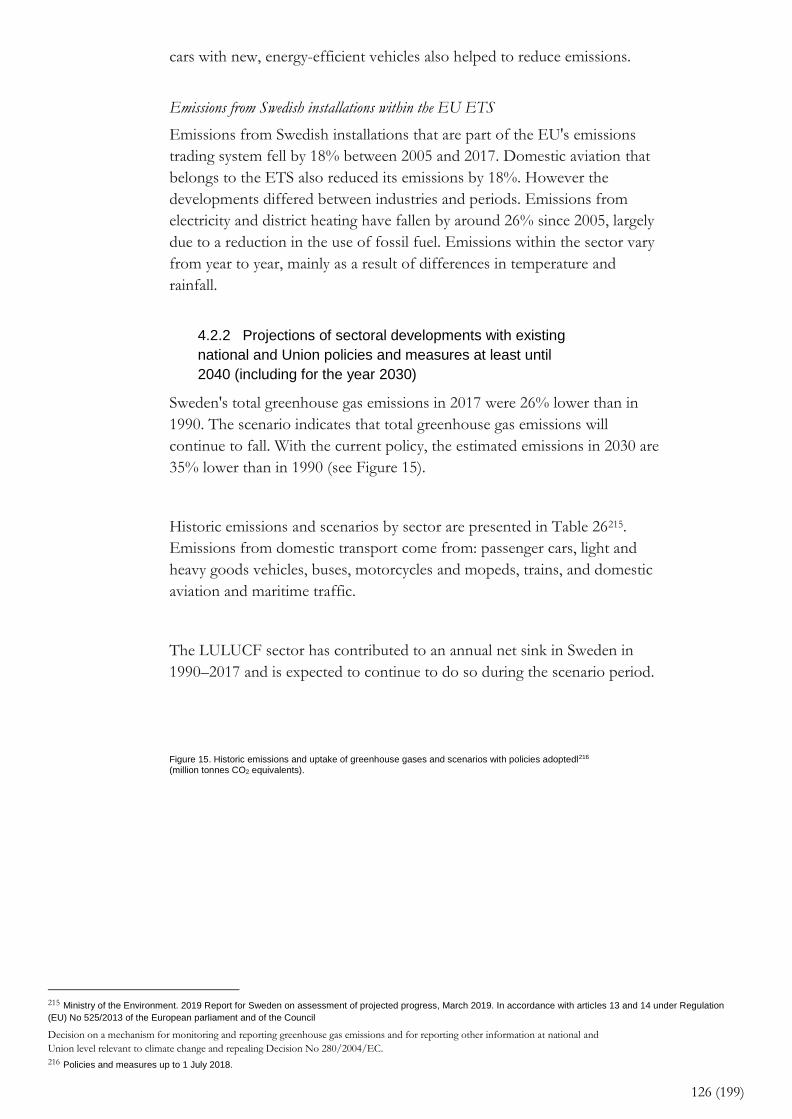
126 (199)
cars with new, energy-efficient vehicles also helped to reduce emissions.
Emissions from Swedish installations within the EU ETS
Emissions from Swedish installations that are part of the EU's emissions
trading system fell by 18% between 2005 and 2017. Domestic aviation that
belongs to the ETS also reduced its emissions by 18%. However the
developments differed between industries and periods. Emissions from
electricity and district heating have fallen by around 26% since 2005, largely
due to a reduction in the use of fossil fuel. Emissions within the sector vary
from year to year, mainly as a result of differences in temperature and
rainfall.
4.2.2 Projections of sectoral developments with existing
national and Union policies and measures at least until
2040 (including for the year 2030)
Sweden's total greenhouse gas emissions in 2017 were 26% lower than in
1990. The scenario indicates that total greenhouse gas emissions will
continue to fall. With the current policy, the estimated emissions in 2030 are
35% lower than in 1990 (see Figure 15).
Historic emissions and scenarios by sector are presented in Table 26215.
Emissions from domestic transport come from: passenger cars, light and
heavy goods vehicles, buses, motorcycles and mopeds, trains, and domestic
aviation and maritime traffic.
The LULUCF sector has contributed to an annual net sink in Sweden in
1990–2017 and is expected to continue to do so during the scenario period.
Figure 15. Historic emissions and uptake of greenhouse gases and scenarios with policies adoptedl216 (million tonnes CO2 equivalents).
215 Ministry of the Environment. 2019 Report for Sweden on assessment of projected progress, March 2019. In accordance with articles 13 and 14 under Regulation
(EU) No 525/2013 of the European parliament and of the Council
Decision on a mechanism for monitoring and reporting greenhouse gas emissions and for reporting other information at national and
Union level relevant to climate change and repealing Decision No 280/2004/EC.
216 Policies and measures up to 1 July 2018.

127 (199)
Note: The series ‘Transport’ refers to domestic transport.
Source Target Energi Energy Industriprocesser och produktanvändning Industrial processes and product use Jordbruk Agriculture Avfall Waste Transport Transport LULUCF LULUCF Mton CO2-ekv. MMTCDE
Table 26. Historic emissions and uptake of greenhouse gases by sector and scenarios with policies adoptedl217
(million tonnes CO2 equivalent).
1990 2017 2020 2025 2030 2035 2040 1990–
2030
Energy excl. transport 33.3 20.1 19.5 18.9 18.5 18.4 18.2 -44%
Domestic transport 19.0 16.6 14.8 13.9 13.4 13.2 13.3 -30%
Industrial processes and product use
7.6 7.6 7.7 7.5 7.3 7.2 7.1 -4%
Agriculture 7.7 7.2 6.7 6.4 6.2 6.1 6.1 -19%
Waste 3.7 1.3 1.1 0.9 0.7 0.6 0.6 -81%
Total emissions 71.3 52.7 49.7 47.7 46.1 45.6 45.3 -35%
LULUCF -34.4 -43.7 -41.4 -42.5 -40.6 -39.0 -40.6 18%
According to the long-term time-based emission targets adopted by the
Riksdag Sweden must reduce its net emissions of greenhouse gases to zero
by 2045, and then achieve negative emissions. The remaining emissions
from activities on Swedish territory must be at least 85% lower than in 1990.
Sweden has also set intermediate targets to help achieve the overall
environmental quality object of Limited Impact on the Climate (see Section
2.1.1). Figure 16 below shows forecast emissions developments compared
with Sweden’s targets for 2045.
Figure 16. Forecast greenhouse gas emissions compared with Sweden’s targets for 2045.
217 Policies and measures up to 1 July 2018.

128 (199)
Source Target Scenarier baserade på beslutade styrmedel
Scenarios based on policies adopted
Långsiktigt mål om netto-noll-utsläpp senast år 2045
Long-term targets for net-zero emissions by 2045
Med fullt utnyttjande av kompletterande åtgärder
Making full use of complementary measures
42-47 miljoner ton 42-47 million tonnes 31-36 miljoner ton 31-36 million tonnes Utan nyttjande av kompletterande åtgärder
Without using complementary measures
According to the scenario, the greenhouse gas emissions (excl. LULUCF)
will continue to fall, but not to the extent required to achieve the 2045
target. Total emissions in 2045 are predicted to be 34–41% lower than in
1990. That is an emissions shortfall of 42–47 million tonnes CO2 equivalent
in comparison with the target, or 31–36 million tonnes if complementary
measures are fully utilised. This can be compared with the total emissions of
52.7 million tonnes in 2017. The scenario shows that further measures are
needed to achieve the target.
4.2.3 Renewable energy
4.2.3.1 Current share of renewable energy in gross final energy
consumption and in different sectors (heating and cooling,
electricity and transport) as well as per technology in each of
these sectors.
Table 27 shows the developments in the total share of renewable energy and
the share of the electricity, transport and heating/cooling sectors218 since
2005. The shares shown in Table 27 are taken from the official reports made
in Shares219, the calculation tool used in the Renewable Energy Directive220.
218 The heating and cooling sectors cover industry, housing and services, and district heating. 219 Shares is a calculation tool which harmonises the calculation method for all Member States. The tool is provided by Eurostat and ensures that Member States use
the same method to calculate the share of renewable energy. 220 Directive (EU) 2018/2001 of the European Parliament and of the Council of 11 December 2018 on the promotion of the use of energy from renewable sources.
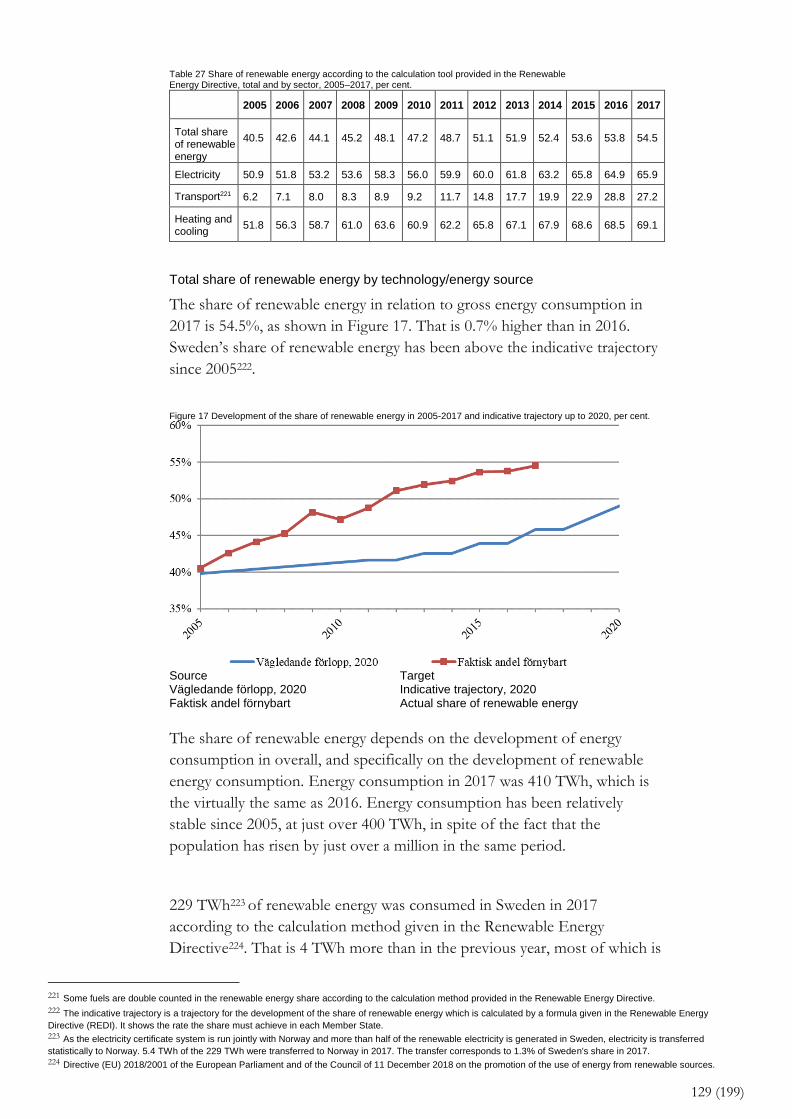
129 (199)
Table 27 Share of renewable energy according to the calculation tool provided in the Renewable Energy Directive, total and by sector, 2005–2017, per cent.
2005 2006 2007 2008 2009 2010 2011 2012 2013 2014 2015 2016 2017
Total share of renewable energy
40.5
42.6
44.1
45.2
48.1
47.2
48.7
51.1
51.9
52.4
53.6
53.8
54.5
Electricity 50.9 51.8 53.2 53.6 58.3 56.0 59.9 60.0 61.8 63.2 65.8 64.9 65.9
Transport221 6.2 7.1 8.0 8.3 8.9 9.2 11.7 14.8 17.7 19.9 22.9 28.8 27.2
Heating and cooling
51.8
56.3
58.7
61.0
63.6
60.9
62.2
65.8
67.1
67.9
68.6
68.5
69.1
Total share of renewable energy by technology/energy source
The share of renewable energy in relation to gross energy consumption in
2017 is 54.5%, as shown in Figure 17. That is 0.7% higher than in 2016.
Sweden’s share of renewable energy has been above the indicative trajectory
since 2005222.
Figure 17 Development of the share of renewable energy in 2005-2017 and indicative trajectory up to 2020, per cent.
Source Target Vägledande förlopp, 2020 Indicative trajectory, 2020 Faktisk andel förnybart Actual share of renewable energy
The share of renewable energy depends on the development of energy
consumption in overall, and specifically on the development of renewable
energy consumption. Energy consumption in 2017 was 410 TWh, which is
the virtually the same as 2016. Energy consumption has been relatively
stable since 2005, at just over 400 TWh, in spite of the fact that the
population has risen by just over a million in the same period.
229 TWh223 of renewable energy was consumed in Sweden in 2017
according to the calculation method given in the Renewable Energy
Directive224. That is 4 TWh more than in the previous year, most of which is
221 Some fuels are double counted in the renewable energy share according to the calculation method provided in the Renewable Energy Directive. 222 The indicative trajectory is a trajectory for the development of the share of renewable energy which is calculated by a formula given in the Renewable Energy
Directive (REDI). It shows the rate the share must achieve in each Member State. 223 As the electricity certificate system is run jointly with Norway and more than half of the renewable electricity is generated in Sweden, electricity is transferred
statistically to Norway. 5.4 TWh of the 229 TWh were transferred to Norway in 2017. The transfer corresponds to 1.3% of Sweden's share in 2017. 224 Directive (EU) 2018/2001 of the European Parliament and of the Council of 11 December 2018 on the promotion of the use of energy from renewable sources.

130 (199)
due to the rise in biofuel consumption in the transport sector and the further
expansion of wind power. The total increase since 2005 is 61 TWh. The
consumption of biofuels and wind power make the biggest contribution to
the high renewable energy consumption, as shown in Figure 18. The
contribution of heat pumps225 rose from 7 TWh in 2005 to 16 TWh in 2016.
Figure 18 Renewable energy and energy consumption according to the Renewable Energy Directive and the share of renewable energy in 2005-2017, TWh and per cent.
Source Target Biobränslen Biofuels Värmepumpar Heat pumps Andel fömybar energi Share of renewable energy Vattenkraft Hydropower Solenergi Solar energy Vindkraft Wind power Total energianvändning Total energy consumption Andel förnybart, procent Share of renewable energy, per cent
Biofuels account for the largest share of the renewable energy consumed in
Sweden. In 2017, biofuels accounted for 57% of renewable energy according
to the Renewable Energy Directive; their share has not fallen below 55%
since 2005. Biofuels are used mainly in industry and for district heating.
However, the largest increase in recent years has been in the transport
sector, where the consumption of biofuels has risen. Figure 19 shows the
consumption of biofuels by sector.
225 Heat pumps are included here as heat absorbed, subject to some limits.

131 (199)
Figure 19 Consumption of biofuels by sector, 2005-2017, TWh
Source Target
Industri Industry
Fjärrvärmeproduktion District heating
Transporter Transport
Bostäder m.m. Housing etc.
Elproduktion Electricity generation
Hydropower makes the next biggest contribution to the large share of
renewable energy, both historically and in 2017, when it accounted for 29%
of renewable energy.
Wind power has grown by the highest percentage since 2005 and accounts
for 8% of renewable energy; that is slightly more than heat pumps, which
accounted for 7% in 2017. Solar power accounted for 0.2% of renewable
energy in 2017.
The share of renewable electricity generation by energy source/technology
The share of renewable electricity generation in relation to total electricity
consumption in 2017 was 65.9%, one per cent higher than in 2016. In 2005,
the share was 50.9%. The higher share in 2017 as compared with 2016 is
mainly due to an increase in wind power.
In 2017 96 TWh electricity was generated from renewable sources226, 66
TWh227 from hydropower, 17.2 TWh228 from wind power and 10.3 TWh
from biomass in combined heat and power plants and in industry. The
remaining 2 TWh were produced with from renewable waste, bio-oils and a
small amount of solar power.
226 A temperature correction is applied to electricity generated from hydro- and wind power using the method given in the Renewable energy Directive. 227 Temperature-corrected value, actual production was 64.6 TWh. 228 Temperature-corrected value, actual production was 17.6 TWh.

132 (199)
Electricity consumption fell from 151 TWh in 2005 to 145 TWh in 2017 in
spite of the fact that the population increased from 9.05 million to 10.12
million in the same period. This is mainly due to a 5 TWh reduction in
electricity consumption in industry between 2005 and 2017. Figure 20 shows
the development of electricity generated from renewable sources and
electricity consumption.
Figure 20 Electricity generated from renewable sources and electricity consumption (2005-2017), TWh and per cent.
Source Target Vattenkraft Hydropower Vindkraft Wind power Biokraft Bioenergy Övrigt Other Solkraft Solar power Elanvändning Electricity consumption Andel Förnybar el Share of renewable electricity Andel Förnybar, procent Share of renewable, per cent
Renewable share in the transport sector by energy source
In 2017, the share of renewable energy in the transport sector was 27.2%
according to the calculation method given in the Renewable Energy
Directive229, as shown in Figure 21. This is a 1.5% reduction from the
previous year. The reduction between 2016 and 2017 is due to the increase
in the volume of biofuels which are not double counted, which have
replaced some of the biofuels which are double counted. The share of
renewable energy in the transport sector in Sweden has increased
significantly since its 2005 level of 6.2%.
229 Directive (EU) 2018/2001 of the European Parliament and of the Council of 11 December 2018 on the promotion of the use of energy from renewable sources.

133 (199)
Figure 21 Actual consumption of renewable energy and electricity (TWh) as a proportion of renewable energy with and without double counting (%), 2005–2017.
Source Target El Electricity Etanol Ethanol Biodiesel, FAME Biodiesel, FAME Biodiesl, HVO Biodiesel, HVO Biogas Biogas Andel Förnybar (utan dubbelräkningar) Share of renewable (without double
counting) Andel Förnybar (med dubbelräkningar) Share of renewable (with double
counting) Andel Förnybar, procent Share of renewable, per cent
The high share of renewable energy in the transport sector is mainly due to
biofuels, primarily biodiesel in the form of HVO, which was used to a far
greater extent in 2017 than in 2010. As HVO has the same chemical
composition as fossil diesel, a high proportion can be added to blends with
fossil diesel, which are the fuels primarily used. The biofuel with the next
largest share is biodiesel in the form of FAME followed by ethanol and
biogas.
Biofuels produced from raw materials covered by Annex IX to the
Renewable Energy Directive230 are double counted in the Directive. This
affects the share of renewable energy in Sweden, as a small proportion of
HVO and a large proportion of biogas is currently produced from raw
materials counted in Annex IX.
The renewable part of the electricity used in transport is also rewarded in the
calculation method in the Renewable Energy Directive. The electricity
consumption reported by Sweden, which is shown in Figure 21, is for rail
transport.
230 Directive (EU) 2018/2001 of the European Parliament and of the Council of 11 December 2018 on the promotion of the use of energy from renewable sources.

134 (199)
The electricity consumption of cars and other vehicle for road transport is
not reported as there are no official statistics for this.
Without using the double counting calculation method given in the
Renewable Energy Directive, the share of renewable in the transport sector
was 22% in 2017.
Renewable share in the heating and cooling sector by technology/energy source
The share of renewable energy in the heating and cooling sector231 in relation
to energy consumption was 69.1% in 2017 and therefore 0.6% higher than
in 2016, as shown in Figure 22. In 2005, the share was 51.8%.
Figure 22 Renewable energy and energy consumption in the heating and cooling sector, 2005–2017, TWh.
Source Target Värmepumpar Heat pumps Biobränsle, Fjärrvärme Biofuels, district heating Biobränsle, Industri Biofuels, industry Biobränsle, Bostäder Biofuels, housing Sol, Bostäder Solar, housing Total användning, täljaren Total consumption, numerator Andel Förnybar Share of renewable Andel Förnybar, procent Share of renewable, per cent
There was 114 TWh of renewable energy in the sector in 2017, which is an
increase in comparison with 2005, when there was 89 TWh. The renewable
energy is mainly biofuels, which account for 86%, followed by heat pumps
at 14%.232
231 The heating and cooling sector includes industry, housing and services, and district heating, but excludes electricity consumption in these sectors. 232 Includes a small quantity of solar heat.

135 (199)
Energy consumption fell form 172 TWh to 165 TWh in the same period
from, which also increases the share of renewable energy.
4.2.3.2 Indicative projections of development with existing
policies for the year 2030 (with an outlook to the year 2040).
The most recent long-term energy scenarios were published in the report
Scenarier över Sveriges energisystem 2018233 for which the base year was 2016.
However, the figures and text below include the share and statistics for
2017. The Referens EU scenario is based on conditions set by Commission
and on the energy and climate policies adopted in Sweden up to 1 July 2018.
Table 28 shows the developments in the total share of renewable energy and
the share of the electricity, transport and heating/cooling sectors in the
Referens EU scenario up to 2040.
Table 28 Share of renewable energy according to the calculation method given in the Renewable Energy Directive, total and by sector in 2017, and in the Referens EU scenario, 2020, 2025, 2030, 2035 and 2040, per cent.
2017 2020 2025 2030 2035 2040
Total share of renewable energy
54.5% 58.2% 63.4% 66.5% 67.9% 73.4%
Electricity 65.9% 68.1% 75.6% 82.6% 85.8% 96.6%
Transport234 27.2% 36.1% 41.7% 47.7% 49.8% 52.1%
Heating and cooling 69.1% 69.2% 71.8% 72.2% 72.4% 73.7%
Total share of renewable energy up to 2040
In the Referens EU scenario, the share of renewable energy in relation to
energy consumption increases from 54.5% in 2017 to 66% in 2030, as
shown in Figure 23. The scenario estimates that the share will rise to 73% in
2040.
233 The Swedish Energy Agency – Scenarier över Sveriges energisystem 2018 (ER 2019:7). 234 Some fuels in the renewable energy share in the transport sector are double counted according to the calculation method provided in the Renewable Energy
Directive.
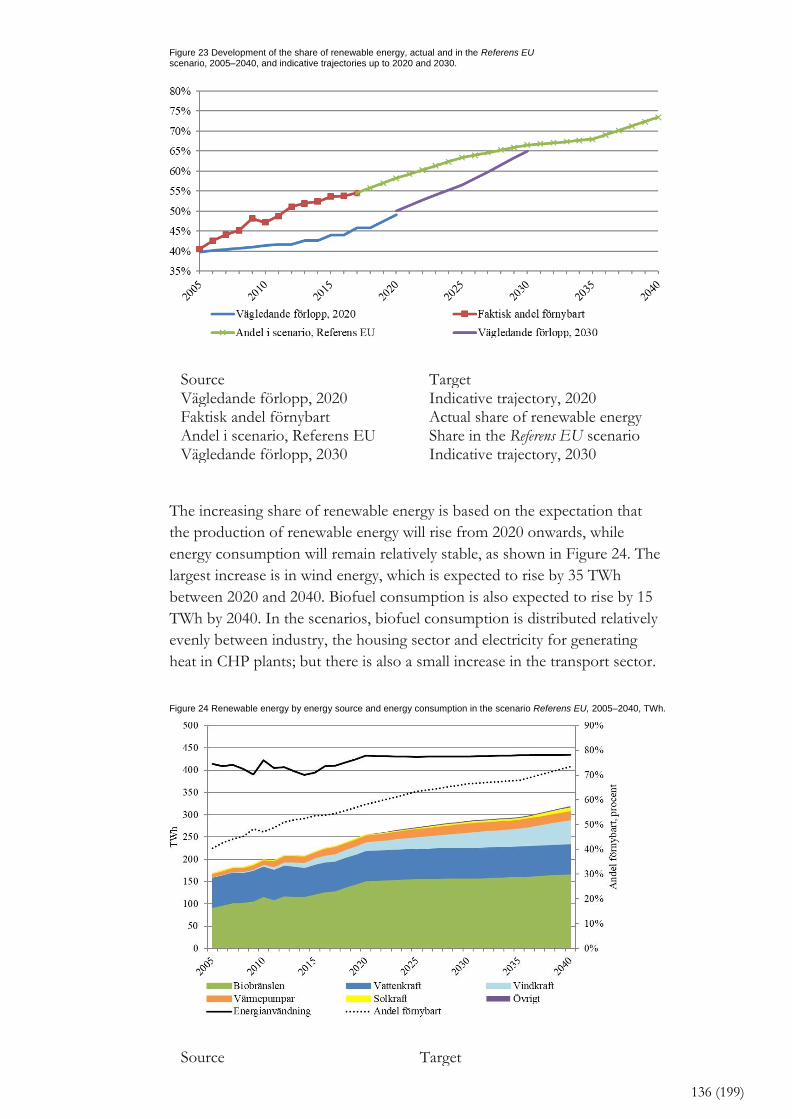
136 (199)
Figure 23 Development of the share of renewable energy, actual and in the Referens EU scenario, 2005–2040, and indicative trajectories up to 2020 and 2030.
Source Target Vägledande förlopp, 2020 Indicative trajectory, 2020 Faktisk andel förnybart Actual share of renewable energy Andel i scenario, Referens EU Share in the Referens EU scenario Vägledande förlopp, 2030 Indicative trajectory, 2030
The increasing share of renewable energy is based on the expectation that
the production of renewable energy will rise from 2020 onwards, while
energy consumption will remain relatively stable, as shown in Figure 24. The
largest increase is in wind energy, which is expected to rise by 35 TWh
between 2020 and 2040. Biofuel consumption is also expected to rise by 15
TWh by 2040. In the scenarios, biofuel consumption is distributed relatively
evenly between industry, the housing sector and electricity for generating
heat in CHP plants; but there is also a small increase in the transport sector.
Figure 24 Renewable energy by energy source and energy consumption in the scenario Referens EU, 2005–2040, TWh.
Source Target
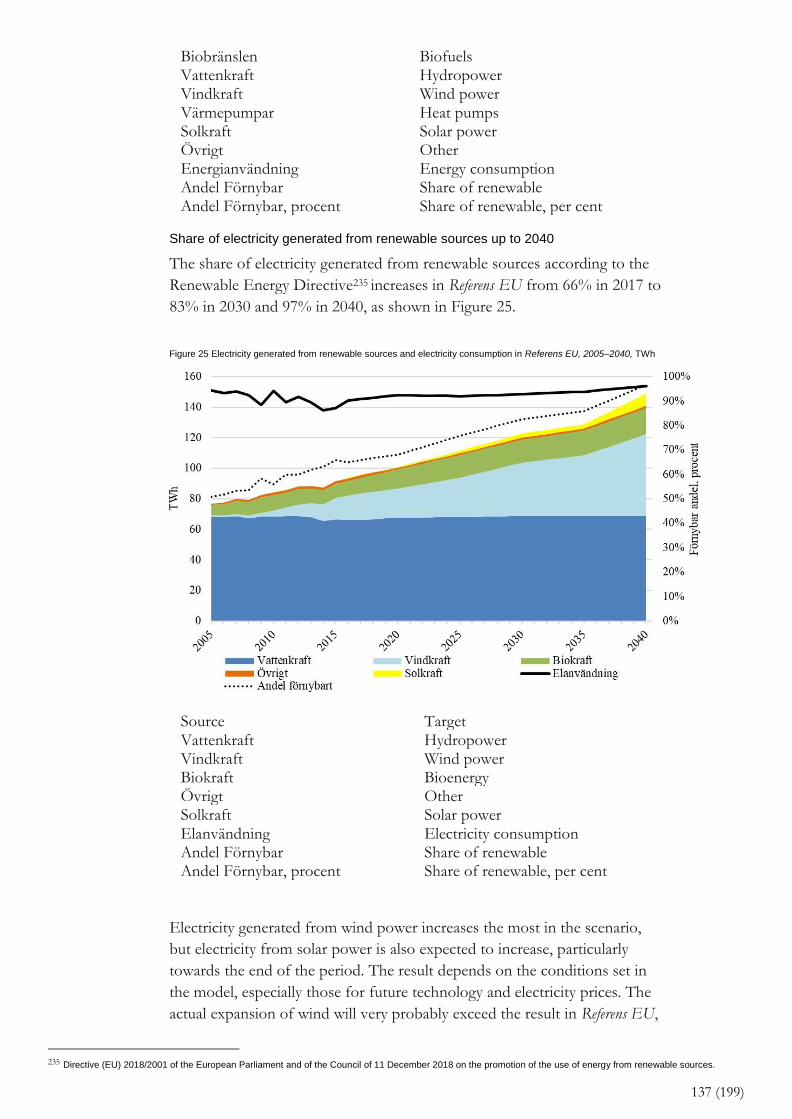
137 (199)
Biobränslen Biofuels Vattenkraft Hydropower Vindkraft Wind power Värmepumpar Heat pumps Solkraft Solar power Övrigt Other Energianvändning Energy consumption Andel Förnybar Share of renewable Andel Förnybar, procent Share of renewable, per cent
Share of electricity generated from renewable sources up to 2040
The share of electricity generated from renewable sources according to the
Renewable Energy Directive235 increases in Referens EU from 66% in 2017 to
83% in 2030 and 97% in 2040, as shown in Figure 25.
Figure 25 Electricity generated from renewable sources and electricity consumption in Referens EU, 2005–2040, TWh
Source Target Vattenkraft Hydropower Vindkraft Wind power Biokraft Bioenergy Övrigt Other Solkraft Solar power Elanvändning Electricity consumption Andel Förnybar Share of renewable Andel Förnybar, procent Share of renewable, per cent
Electricity generated from wind power increases the most in the scenario,
but electricity from solar power is also expected to increase, particularly
towards the end of the period. The result depends on the conditions set in
the model, especially those for future technology and electricity prices. The
actual expansion of wind will very probably exceed the result in Referens EU,
235 Directive (EU) 2018/2001 of the European Parliament and of the Council of 11 December 2018 on the promotion of the use of energy from renewable sources.

138 (199)
at least in the short term, as many projects are currently being planned and
built.
If the share of electricity generated from renewable sources is compared
with the total amount of electricity generated instead, the result for 2040 is
lower, at around 84%. This is mainly due to the fact that the scenario still
contains some nuclear power and some of the electricity is generated with
fossil fuels from waste and steel production residues. Sweden will therefore
not achieve its target of 100% electricity generated from renewable sources
by 2040.
Renewable share in the transport sector up to 2040
The scenario estimates that, when calculated by the method given in the
Renewable Energy Directive236, the share of renewable energy in the
domestic transport sector will rise from 27% in 2017 to 48% in 2030 and
52% in 2040, as shown in Figure 26. The share of renewable energy in 2017
is relatively low, in spite of the increase in the amount of HVO, because only
a certain amount of the HVOs is produced from raw materials covered by
Annex IX to the Renewable Energy Directive and therefore double counted.
The introduction of the reduction obligation system in Sweden is expected
to increase the share of double-counted biofuels during the lifetime of the
system237. Section 3.1.1 provides more information about the reduction
obligation.
However, in Referens EU, the consumption of biofuels, particularly HVOs,
increases most, which contributes to a sustained increase in the share of
renewable energy. Electricity consumption is also expected to rise in line
with the share of electricity generated from renewable sources, and therefore
increases the share of renewable energy.
Total energy consumption in the transport sector falls during the period
covered by the scenario, which also increases the share of renewable energy.
236 Directive (EU) 2018/2001 of the European Parliament and of the Council of 11 December 2018 on the promotion of the use of energy from renewable sources. 237 The fuels that reduce climate emissions the most tend to be those that are double counted. See the list of raw materials in Annex IX to Directive (EU) 2018/2001 of
the European Parliament and of the Council of 11 December 2018 on the promotion of the use of energy from renewable sources.

139 (199)
Figure 26 Consumption of renewable energy and electricity (TWh) calculated according to the method in the Renewable Energy Directive and share of renewable energy with and without double counting (%), 2005-2040.
Source Target Vattenkraft Hydropower Vindkraft Wind power Biokraft Bioenergy Övrigt Other Solkraft Solar power Elanvändning Electricity consumption Andel Förnybar Share of renewable Andel Förnybar, procent Share of renewable, per cent
Renewable share in the heating and cooling sector up to 2040
The share of renewable energy in relation to energy consumption in the
heating and cooling sector is expected to rise from 69% in 2017 to 72% in
2030, as shown in Figure 27. Referens EU estimates that the share will be
74% in 2040.

140 (199)
Figure 27 Renewable energy and energy consumption and share of renewable energy in the heating and cooling sector, 2005–2040, TWh and per cent.
Source Target Värmepumpar Heat pumps Biobränsle, Fjärrvärme Biofuels, district heating Biobränsle, Industri Biofuels, industry Biobränsle, Bostäder Biofuels, housing Sol, Bostäder Solar, housing Total användning, täljaren Total consumption, numerator Fjärrkyla och spillvärme District cooling and waste heat Andel Förnybar Share of renewable Andel Förnybar, procent Share of renewable, per cent
The energy consumed in the sector is largely renewable already, but the
consumption of renewable energy is expected to rise slightly. This is mainly
due to the expected rise in the consumption of biofuels in industry and for
district heating. The use of heat pumps also increases with the introduction
of waste heat238 into the calculations from 2025 onwards. Energy
consumption for heating and cooling increases slightly between 2020 and
2040 in the scenarios, which reduces the share.
4.3 Energy Efficiency dimension
4.3.1 Current primary and final energy consumption in the
economy and by sector (including industry, households,
services and transport).
Table 29 shows total and final energy consumption in the whole economy
and by sector.
238 A cautious estimate of 40% of waste heat has been included in the renewable energy calculations for the sector in the scenarios.

141 (199)
Table 29 Energy consumption 2017 [TWh],
2017
Total energy consumption239 including non-energy uses 573
Total energy consumption excluding non-energy uses, including international aviation
545
Total final energy consumption, excluding international aviation and shipping
378
Total final energy consumption, including international aviation and shipping
389
Industry 143
Housing 87
Services, etc. 59
Transport (domestic) 88
International aviation 11
4.3.2 Current potential for the application of
high-efficiency cogeneration and efficient district heating
and cooling
The information under this heading is taken from the report provided for
under Article 14(1) of the Energy Efficiency Directive240, entitled
‘Comprehensive assessment of the potential for the application of
high-efficiency cogeneration, district heating and cooling – Promotion of
efficiency in heating and cooling’. Please note that the information in that
report differs from the long-term scenarios241 from 2018 used as a basis for
this plan. The next comprehensive assessment report in accordance with
Article 14 is due on 31 December 2020.
According to the report on the potential for high-efficiency cogeneration,
district heating and cooling, new district heating connections in both existing
and new developments are not expected to compensate for the reduction
caused by energy efficiency measures and the conversion to heat pumps in
buildings that have already been connected. In 2011, 54.7 TWh of district
heating was generated, which is expected to fall to 51 TWh by 2030, despite
the fact that new connections to existing and new buildings are expected to
amount to 8 TWh in 2030. The net reduction is thus expected to be 4 TWh,
or 12 TWh without new connections, as shown in Figure 28.
239 Total energy consumption corresponds to total input energy and includes all domestic energy consumption, including transformation and transmission losses and
fuels for non-energy uses. International transport is not included. 240 Swedish Energy Agency – Comprehensive assessment of the potential for the application of high-efficiency cogeneration, district heating and cooling (ER2013:24). 241 Swedish Energy Agency – Scenarios of Sweden’s energy system 2018 (ER2019:7).

142 (199)
Figure 28. Projected development of Sweden’s cumulative deliveries of district heating to 2030242.
Source Target Anslutning av ny bebyggelse Connection of new buildings Anslutning av befintlig bebyggelse Connection of existing buildings Småhus som hade fjärrvärme 2011 Smaller buildings with district heating in
2011 Lokaler som hade fjärrvärme 2011 Premises with district heating in 2011 Flerbostadshus som hade fjärrvärme 2011 Multi-dwelling buildings with district heating
in 2011 Industri Industry
District cooling currently amounts to approx. 1 TWh. The potential for
district cooling has been estimated at a further 2 TWh by 2030.
The total cogeneration potential consists of cogeneration in district heating
systems and industrial cogeneration, also known as industrial back pressure.
The additional potential for electricity production from cogeneration
amounts to approx. 5 TWh by 2030. This is based on the assumption that
deliveries of district heating will decrease slightly in the long term.
Electricity production from industrial cogeneration is currently approx.
6 TWh per year. The potential from industrial cogeneration is estimated to
be approx. 9 TWh by 2030.
4.3.3 Projections on the basis of existing instruments,
measures and programmes on energy efficiency in
accordance with point 1.2, paragraph ii, for primary and final
energy consumption for each sector until at least 2040
(including 2030)
Figure 29 shows the EU baseline scenario for Sweden’s final energy
consumption to 2040, broken down by sector. The scenario is based on
instruments and measures adopted on 1 July 2018.
242 Swedish Energy Agency – Comprehensive assessment of the potential for the application of high-efficiency cogeneration, district heating and cooling (ER2013:24).

143 (199)
Figure 29 Scenario for energy consumption 2016-2040 for industry, transport, and housing and services, etc., TWh.
Source Target
Industri Industry
Bostäder, service mm Housing, services, etc.
Transport inkl utrikes flyg Transport, including international aviation
Energy consumption in the housing and services sector is expected to
decrease slightly towards 2040. This is the result of energy efficiency
measures in buildings and the fact that buildings with a direct supply of
electricity are being converted to heat pumps.
Energy consumption in the transport sector also decreases towards 2040,
which is due to the fact that vehicles, aircraft and ships are becoming more
energy efficient, as well as an increase in the use of electric vehicles and
ships.
Energy consumption in industry is expected to increase slightly, however. A
number of production processes powered by fossil fuels are being replaced
with electricity, which will bring about an increase in energy consumption.
4.3.4 Cost-optimal levels of minimum energy performance
requirements resulting from national projections, in
accordance with Article 5 of Directive 2010/31/EU.
Table 30 shows the cost-optimal levels of minimum energy performance
requirements resulting from national projections, in accordance with
Article 5 of the Energy Performance of Buildings Directive243. The results
are shown as a range, with the applicable minimum requirements in brackets.
243 Directive 2010/31/EU of the European Parliament and of the Council of 19 May 2010 on the energy performance of buildings.

144 (199)
Table 30 Cost-optimal levels and minimum energy performance requirements.
Cost-optimal level primary energy rate (EPpet) kWh/m2Atemp year
Smaller buildings 74-88 (90)
Multi-dwelling buildings
50-88 (85)
Premises 53–70 (80)
The National Board of Housing, Building and Planning has developed a
proposal on new levels for minimum energy performance requirements,
which was put forward for consultation during the summer and autumn of
2019 and had a proposed date of entry into force of 1 July 2020.
4.4 Energy Security dimension
4.4.1 Current energy mix, domestic energy sources, import
dependency, including relevant risks
The energy mix in Sweden is dominated by biofuels, crude oil and petroleum
products, nuclear fuel and hydroelectric power. Significant domestic energy
carriers are hydroelectric power, biofuels, wind power and absorbed heat
from heat pumps244. Biofuels accounted for 24% of input energy in 2017245.
Trends in total energy input between 2005 and 2017 are shown in Figure 30.
However, a large proportion of energy input is dependent on imports, for
example nuclear fuel and fossil fuels, such as natural gas and oil, with the
latter energy carrier being widely used in the transport sector. In total, fossil
fuels accounted for 27% of input energy in 2017. The energy self-sufficiency
ratio, defined as the ratio between domestic energy and total input energy,
has increased slightly in recent years, reaching 44% in 2017.
244 All historical statistical data are based on the Swedish Energy Agency’s ‘Energy indicators in figures 2019’. 245 Excludes net imports.

145 (199)
Figure 30 Total energy input per energy carrier, TWh, 2005-2017.
Source Target Vindkraft Wind power Vattenkraft Hydroelectric power Primär värme Primary heat Kärnbränsle Nuclear fuel Övrigabränslen Other fuels Natur-och stadsgas Natural and town gas Råolja och petroleumprodukter Crude oil and petroleum products Kolochkoks Coal and coke Biobränslen Biofuels
Source: Swedish Energy Agency, Energy indicators in figures 2019.
Electricity production in Sweden is primarily based on hydroelectric power
and nuclear power, which accounted for 40% and 39%, respectively, of total
electricity production in 2017. The wind power expansion continues,
accounting for 11% of total electricity production in 2017. The consumption
of biofuels for electricity and heat production is also increasing.
4.4.2 Development forecasts based on existing instruments
and measures until at least 2040 (including 2030)
Figure 31 shows total input, broken down by energy carrier, for the period
2016 to 2040 in the EU baseline scenario. Input energy decreases from 2035.
This is based on the assumption that the process to phaseout the remaining
nuclear power reactors will begin and nuclear fuel use thus decreases over
time.
Figure 31 Total input, broken down by energy carrier, in the EU baseline scenario, TWh, 2016-2040.

146 (199)
Source Target Stora värmepumpar Large heat pumps Solkraft Solar power Vindkraft Wind power Vattenkraft Hydroelectric power Kärnkraftsbränsle Nuclear fuel Övrigt bränsle Other fuels Naturgas/stadsgas Natural gas/town gas Oljebränslen Oil fuels Kol, koks, mas- och kokungsgas Coal, coke, blast furnace and coking gas Biobränslen Biofuels
Source: Swedish Energy Agency – Scenarios of Sweden’s energy system
2018 (ER2019:7). Note: Net imports of electricity are excluded.
The scenario involves an expansion of renewable electricity production and
a phasing-out of existing nuclear power. The scenario is based on the closure
of reactors 1 and 2 of the Ringhals nuclear power plant in 2020 and 2019,
respectively, as per the owners’ announcement, with it being expected, based
on information provided by the owners, that the remaining six reactors will
be phased-out after 60 years of operation. However, nuclear power plants
will continue to operate for as long as they are profitable and safety
requirements are met, which may be either shorter or longer than the
expected 60 years. It is expected that approx. 60% of nuclear power will
have been phased-out by around 2040, with 25 TWh remaining in the
electricity system. The wind power expansion is driven by higher electricity
prices from 2030 onwards, amounting to 54 TWh in 2040. Electricity
production from solar cells amounts to almost 8 TWh in 2040.
The consumption of biofuels increases over time. The largest increase in
biofuels in absolute terms occurs in relation to electricity and heat
production in district heating networks, although there are also significant
increases in domestic transport and industry. The consumption of oil
decreases over time and is primarily driven by developments within the
transport sector, where increased electrification and efficiency measures

147 (199)
reduce the demand for vehicles and ships powered by fossil fuels.
The electricity balance is strengthened continuously up to 2035, when net
exports account for 35 TWh. This is primarily due to an increase in wind
power generation accompanied by relatively weak growth in electricity
demand. During the period 2035-2040, however, the electricity balance
weakens and net exports fall to 33 TWh in 2040. This is mainly attributable
to the fact that the expansion of wind power and, to a certain extent, solar
power cannot compensate for the loss of electricity production resulting
from a partial phasing-out of nuclear capacity.
The phasing-out of nuclear power, with additional electricity production
being primarily generated by wind and solar power, poses a challenge for the
stability of the electricity system and thus increases the risk of disruption if
no action is taken. This is due to the fact that system inertia246 decreases as a
result of the phasing-out of nuclear power, while additional electricity
production, primarily from wind and solar power, does not naturally
contribute to system inertia.
Reduced reactive power247 as a consequence of the phasing-out of nuclear
power has additional significance when it comes to the possibility of
transferring electricity between different electricity price areas. The
aforementioned change to the power system also poses the risk that the
power balance will weaken over time, resulting in an increased risk of rising
costs and higher prices. This is due to the fact that wind power is
unpredictable and there is an increased need for balancing resources in the
system.
Analyses of future power adequacy
Svenska kraftnät (the government agency responsible for the national grid)
continuously analyses Sweden’s short- and long-term future power adequacy.
There are two different methods for evaluating power adequacy.
The statistical method compares expected available domestic production
against expected electricity consumption during winter periods with the
highest electricity consumption. This is known as a power balance and is
carried out in respect of a normal one-year winter, a 10-year winter (a cold
winter that recurs, on average, once every ten years) and a 20-year winter.
If power adequacy is evaluated using the dynamic method (also known as
246 The nominal frequency in the Nordic synchronous power system is 50 Hz. Imbalances occur momentarily and cause the frequency to deviate from 50 Hz. Active
power balancing, which is able to counteract such imbalances, is subject to a short delay. Therefore, a certain degree of spinning mass in the system is required to be able to counteract rapid changes in frequency. The spinning mass of the rotating parts (generators) creates inertia and gives the system’s active frequency regulation extra time in which to act. The more system inertia, the slower the frequency change of a given disruption. 247 Reactive power is generated when there is a phase shift between current and voltage. Reactive power reduces the possibilities to transmit active power into the grid,
which is considered to be the type of power that carries out useful work when consumed by the load.
148 (199)
the probabilistic method), the entire electricity system is simulated as part of
an electricity market model with connections between electricity price areas
(and countries) and consumption and production units. The model simulates
a large number of years of weather, during which wind, water and
consumption levels, etc., vary. This method thus takes account of the
import/export capacity between electricity price areas, both domestic and
international production resources, and forced outages in terms of both
production and interconnectors.
Using the statistical method, Svenska kraftnät considers that the 2020 power
balance amounts to -2 100 MW during a normal one-year winter and -
3 700 MW during a 20-year winter248. A negative power balance means that
electricity consumption during winter periods with the highest electricity
consumption exceeds expected available domestic production. Therefore,
this illustrates the need for imports during periods with the highest
electricity consumption. A short-term weakening of the power balance is
primarily due to the fact that Ringhals reactor 2 was decommissioned in
2019 and Ringhals reactor 1 is scheduled to be decommissioned during
2020.
Svenska kraftnät also evaluated power adequacy using the dynamic
method249. When production and imports do not adequately cover the load,
a power shortage occurs. This is referred to as Loss of Load Expectation
(LOLE) and Expected Energy Not Served (EENS). LOLE is measured in
number of hours per year, while EENS is measured in number of MWh per
year. Overall, the simulations show a higher risk of power shortages after
2030. However, it should be noted that the risk is assessed as remaining at a
low level. In the reference scenario for 2040 used by Svenska kraftnät,
LOLE amounts to 0.19 hours per year on average, while EENS amounts to
69.3 MWh per year. It should be noted, however, that there is a great deal of
variation.Some winter periods see no problems at all, while the risk of power
shortages may be significantly higher during years with cold winters and
during years in which an unusually large number of problems arise with
regard to interconnectors or production. However, it should be noted in this
respect that the model has included a great deal of consumption flexibility
and storage on the continent. If this flexibility should fail to be realised, the
simulated power shortages would increase.
In the event that nuclear power is phased-out and replaced with
weather-dependent, unpredictable electricity production, for example from
wind and solar power, it will be necessary to implement measures in the
form of increased demand flexibility, energy storage and fast-balancing
electricity production capacity in order for such an electricity system to
248 Svenska kraftnät – Long-term market analysis 2018 (Ref. SVK 2018/2260). 249 Svenska kraftnät – Long-term market analysis 2018 (Ref. SVK 2018/2260).

149 (199)
function. Research and development, as well as the commercial conditions
for these technical solutions, are of crucial importance when deciding which
solutions to employ. This is explained further under Heading 4.6.
4.5 The Internal Energy Market dimension
4.5.1 Electricity interconnection
4.5.1.1 Current level of interconnection and major interconnections.
At the end of 2018/beginning of 2019250, Sweden had an interconnection
level of 27%. Total import capacity was 10 350 MW and installed production
capacity amounted to 39 026 MW. Existing connections with neighbouring
countries are shown in Table 31.
Table 31. Current connections and import capacity (max. NTC).
From Type Name MW
Denmark AC 1 700
Denmark HVDC Konti-Skan 1&2 740
Finland AC 1 100
Finland HVDC Fenno-Skan 1&2 1 200
Lithuania HVDC NordBalt 700
Norway AC 3 695
Poland HVDC Swe-Pol link 600
Germany HVDC Baltic cable 615
Total 10 350
4.5.1.2 Projections for increased interconnection requirements (including for 2030)
The interconnection level is expected to reduce slightly towards 2027, to
26%, despite Sweden increasing interconnections to neighbouring countries.
New connections are shown in Table 32. The decrease in interconnection
level is caused by the expected significant expansion of domestic renewable
production, which thus contributes to the level decreasing.
Table 32. New connections by 2027.
From Type Name MW
Finland AC 3:e AC 900
Germany HVDC Hansa Power Bridge 700
Total 1600
250 Svenska Kraftnät – The Power Balance on Sweden’s Electricity Market, 2018 report (Ref. 2018/587).

150 (199)
There are no further plans for interconnections from 2027 onwards.
However, analyses show that the construction of additional connections may
be beneficial from a socio-economic perspective, particularly if nuclear
power is phased-out in the long term. This is the subject of ongoing analysis
by Svenska kraftnät. An estimated service life of 60 years is frequently cited
as a benchmark for nuclear power.
Nuclear power plants will continue to operate for as long as they are
profitable for the owners and safety requirements are met, which may be
either shorter or longer than the expected 60 years.
Internal reinforcement of the Swedish national grid is currently under way
for the purpose of reducing bottlenecks between electricity price areas and
enabling additional connections and interconnections. The Nord-Syd
(North-South) programme251, which includes some fifty different projects, is
addressing this problem and will run until around 2040.
4.5.2 Energy transmission infrastructure
4.5.2.1 Important characteristics of existing electricity and gas
transmission infrastructure.
Existing infrastructure for electricity
Sweden is an elongated country, with most electricity consumption
occurring in the south and hydroelectric power production in the north.
Sweden is split into five electricity price areas, see Figure 32.
251 Svenska kraftnät – The NordSyd investment package: Significant reinforcement of the Swedish national electricity grid between electricity price areas 2 and 3 (March
2019).

151 (199)
Figure 32 Electricity price areas.
Source Target
SE 1 SE 1
NO 1 NO 1
DK 1 DK 1
FRE FRE
RU RU
EE EE
LV LV
LT LT
Source: Drawn up by NordPool and the Swedish Energy Agency.
Nuclear power is localised in electricity price area 3, but is expected to be
gradually phased-out as the reactors age and/or as profitability decreases.
Wind power is primarily exploited in the north of Sweden, as a result of
good project locations and the fact that it is easier to obtain authorisation to
build electricity networks there, despite the fact that spot prices are generally
lower in the north compared with the south.
The main function of the national grid is thus to transmit electricity from the
north of Sweden to the south. This function is supported by the expansion
of wind power in the north of Sweden. The configuration of the national
grid is shown in Figure 33.

152 (199)
Figure 33. National electricity grid 2017.
Source: Svenska kraftnät.
Source Det Svenska stamnätet för el består av 15 000 km kraftledningar, 160 transformator- och kopplingsstationer och 16 utlandsförbindelser.
Target Sweden’s core electricity network consists of 15 000 km of power lines, 160 substations and 16 interconnections.
400kV ledning 400 kV line 275kv ledning 275 kV line 220kV ledning 220 kV line HVDC (likström) HVDC (direct current) Samkörningsförbindelse för lägre spanning än 220kV Interconnections for voltages below 220 kV Planerad/under byggnad Planned/under construction Vattenkraftstation Hydroelectric power station Värmekraftstation Thermal power station Vindkraftpark Wind farm Transf./kopplingsstation Substation

153 (199)
Planerad/under byggnad Planned/under construction SVERIGE SWEDEN NORGE NORWAY ESTLAND ESTONIA LETTLAND LATVIA DANMARK DENMARK LITAUEN LITHUANIA
Hydroelectric power in Norway and north Sweden also represents a crucial
balancing resource for the whole of the Nordic synchronous power
system252.
There are hours during which the transmission from north to south is
insufficient. For this reason, Sweden is split up into different price areas on
the basis of the structural bottlenecks present in the network. Although
structural bottlenecks are to be removed, it is not viable, from a
socio-economic perspective, for the same price to always be guaranteed
throughout Sweden.
Gas infrastructure
The Swedish natural gas system is small in comparison to most other natural
gas networks in Europe. Only 30 of Sweden’s 290 municipalities have access
to the natural gas network in western Sweden. Gas enters Sweden via the
Danish Dragör pipeline. In Sweden, the transmission network is owned and
operated by Swedegas AB, which also has responsibility for balancing the
Swedish natural gas network. The system of balancing responsibility has
changed since the introduction of a joint balancing zone between Sweden
and Denmark, which entered into force on 1 April 2019. Imbalances are
corrected by the Balancing Area Manager (BAM), which is jointly owned by
Swedegas AB and Energinet.
There is also a town and vehicle gas network in the Stockholm area, which is
owned by Gasnätet Stockholm AB. The production and supply of gas to the
town gas network mainly occurs from a gas plant in Stockholm, which
supplies both biogas and liquefied natural gas (LNG).
There are also smaller regional and local gas networks throughout Sweden.
Many of these small local networks are mostly used to transport biogas
intended for vehicles from a production site to refuelling stations.
4.5.3 Projections for network expansion requirements until
at least 2040 (including 2030)
Future need for network expansion
252 All electricity price areas in the Nordic region with the exception of DK1, i.e. electricity price areas that are interconnected via alternating current.
154 (199)
Electricity network
Svenska kraftnät has a Ten-Year Network Development Plan253, which is
updated every two years. In addition, there is the NordSyd investment
package, which includes some fifty different projects whose main purpose is
to strengthen the capacity between electricity price areas 2 and 3 and to
replace a number of older lines running between these two areas. These
projects will run until 2040. However, the actual investments included in the
package may be reviewed in the event that requirements change in the
period up to 2040.
The network development plan is based on various different scenarios254 for
the period to 2040. The most important elements of the scenarios are
nuclear power, wind power and electricity consumption. Nuclear power is
expected to be gradually phased-out as the reactors age, with no current
plans for new reactors. Ringhals reactor 2 was decommissioned in 2019 and
Ringhals reactor 1 will be decommissioned during 2020, as per the owners’
announcement. The remaining six reactors will continue to operate for as
long as is safe and profitable. It is not possible to predict how long those
reactors will continue to operate, but a service life of approximately 60 years
is often cited, which would suggest that the reactors will continue to be
operational until the first half of the 2040s, depending on the year in which
they were commissioned. However, nuclear power plants will continue to
operate for as long as they are profitable for the owners and safety
requirements are met, which may be either shorter or longer than the
expected 60 years. All reactors are located in electricity price area 3.
Wind power continues to expand, driven in the short term by the fact that
the electricity certificate system has been extended to 2030. However, wind
power is starting to prove commercially competitive without any support
system and it now seems that the target set for 2030 in the electricity
certificate system255 may be achievable as early as the first few years of the
2020s. One challenge posed by wind power expansion is that most new wind
farms seem to be being built in electricity price areas 1 and 2, despite the fact
that the majority of electricity consumption occurs in electricity price areas 3
and 4. The potentially lower price for electricity in the north of the country
is offset by better wind conditions and generally clearer authorisation
procedures.
Future electricity consumption represents a major uncertainty factor, but
electrification of both transport and industry processes is a powerful driving
force. Sweden and the Nordic region are also attractive locations in which to
253 Svenska kraftnät – System Development Plan 2018-2027 (November 2017). 254 Svenska kraftnät – Long-term market analysis 2018 (SVK 2018/2260). 255 For more information on the objective of the electricity certificate system, see Heading 3.1.2.

155 (199)
establish data centres, largely because of their low electricity prices, cool
climate, and generally stable markets and political systems.
At European level, moreover, the scenarios for future development of
power systems and electricity markets created by ENTSO-E256 are partly
based on the various scenarios used by the transmission system operators
themselves. These scenarios are partly at European level and partly at
regional level, specifically the Regional Group Baltic Sea (RGBS) for
Sweden.
Gas network
There are currently no development forecasts relating to the Swedish natural
gas network.
4.5.4 Electricity and gas markets, energy prices
4.5.4.1 Current situation on the electricity and gas
markets, including energy prices
The electricity market
The electricity market is made up of a wholesale and a retail market.
Electricity is traded between producers and larger consumers on the
wholesale market. Sweden’s transmission system is linked to Denmark,
Norway, Finland, Germany, Poland and Lithuania, and, indirectly, to the
whole of Europe. The largest marketplace on the wholesale market is the
NordPool spot market. This is a day-ahead market, where trading takes place
via an auction process that accounts for transmission capacity in the
electricity network between Sweden’s four bidding zones. There is also an
intraday market, where participants are able to adjust their positions as
required. A number of entities that have responsibility for balancing have a
financial responsibility for maintaining balance during the planning stage,
but, during operating hours, Svenska kraftnät is responsible for maintaining
the balance of the electricity system and carrying out necessary positive and
negative adjustments, by trading in balancing power on the real-time market,
operated in conjunction with other Nordic system operators.
The electricity cost for end consumers consists of the electricity trade price,
electricity network price, energy tax and value-added tax (VAT). In addition
to the above costs, many retailers pay a fixed annual fee, which they pass on
to the end consumer. This annual fee is usually in the range of SEK 100 to
500. All of these costs are subject to VAT.
256 ENTSO-E & ENTSOG – TYNDP 2018, Scenario Report.

156 (199)
Electricity traders are obliged to purchase electricity certificates
corresponding to a given share of their customers’ electricity consumption.
Since 2007, the electricity certificate fee has been included in the electricity
trade price.
Figure 34 is based on typical customers consuming either 2 000 or
20 000 kWh, who have a variable electricity price contract in electricity price
area 3. The costs are calculated at the 2018 price level and are averaged.
Figure 34 Cost (electricity price area 3) including annual fees and excluding VAT and other taxes.
Source Target
SEK/år SEK/year
År Year
Source: Swedish Energy Markets Inspectorate
Electricity network tariffs consist of a fixed cost and a variable cost
(transmission fee). VAT is paid on both the fixed subscription fee and the
variable transmission fee.
Figure 35 shows network costs for the three most common types of
domestic customers. The costs are calculated at the 2018 price level and are
averaged.

157 (199)
Figure 35 Network tariffs for domestic customers 2015-2018.
Source Target
SEK/år SEK/year
Lägenhet 16A, 2 000 kWh/år Apartment 16A, 2 000 kWh/year
Villa 20A, 20 000 kWh/år Detached house 20A, 20 000 kWh/year
Villa 25A, 30 000 kWh/year Detached house 25A, 30 000 kWh/year
Source: Swedish Energy Markets Inspectorate
The gas market
Sweden does not produce natural gas; however, biogas is produced on a
smaller scale. The natural gas consumed in Sweden mainly comes from the
Danish gas fields in the North Sea, via the Dragör line257. Because of the
design of the Swedish gas network, the Swedish natural gas market is closely
linked to the Danish market. Stakeholders in the Swedish natural gas system
may, therefore, also be active on the Danish gas market, particularly
Gaspoint Nordic, which has been a member of the pan-European gas
exchange platform, PEGAS, since 24 November 2016.
Consequently, competition, price trends and transparency on the Swedish
natural gas market are largely dependent on trends in Denmark. The
Swedish natural gas market’s affiliation with the Danish market was further
strengthened on 1 April 2019 with the creation of a joint balancing zone
between the countries. The project, known as the Joint Balancing Zone258,
began in 2017 and has been implemented in collaboration with end
consumers, gas suppliers, network owners and supervisory authorities in
Sweden and Denmark. Its aim is to increase market size and to ensure even
greater security of supply.
All trading of gas in the natural gas network in western Sweden is carried out
257 It should be noted that, during the redevelopment of the Danish Tyra gas field from the autumn of 2019 to the summer of 2022, both Sweden and Denmark’s gas
markets will be supplied by imported gas from continental Europe. 258 https://www.swedegas.se/sv-SE/Vara%20tjanster/Systemansvar/Joint%20Balancing%20Zone.

158 (199)
through Gaspoint Nordic/PEGAS. Operators must have an agreement in
place with the Danish transmission system operator Energinet.dk. Through
Gaspoint Nordic/PEGAS, an operator may trade in gas and transport
capacity on a daily, weekly, monthly, quarterly and annual basis. Intraday
trading also occurs. Energinet.dk, which has responsibility for balancing the
Danish transmission system, uses Gaspoint Nordic/PEGAS’ intraday
market to manage the balance in the Danish natural gas network.
The price on Gaspoint Nordic/PEGAS is based on supply and demand and
also forms the basis of what is known as the balancing price used by
Energinet to resolve imbalances between market players.
Trading in domestically produced biogas also occurs outside the natural gas
market in western Sweden. This happens most commonly when a particular
biogas producer produces biogas and sells the gas produced to a specific
customer, for example a municipal operator. The price that is set depends on
local conditions and may also be affected by the cost of competing fuels,
such as the price of diesel.
4.5.4.2 Development forecasts based on existing instruments and
measures until at least 2040 (including 2030)
An evolution of the price of electricity is being developed as part of the
work on the long-term energy scenarios259. The price of electricity follows
the TIMES-Nordic model and is based on assumptions relating to fossil fuel
prices and prices for emission allowances obtained from the Commission.
Electricity price trends for the EU baseline scenario are shown in Figure 36.
The price of electricity is calculated as an annual average for Sweden, which
is treated as a price area.
The price of electricity increases from 2030 to 2040 as a result of fuel prices
and prices for emission allowances increasing throughout that period.
259 Swedish Energy Agency – Scenarios of Sweden’s energy system 2018 (ER2019:7).

159 (199)
Figure 36 Electricity price trend according to the Swedish Energy Agency’s EU baseline scenario, SEK/MWh.
Source Target Systempris System price Referens EU EU baseline
4.6 Research, Innovation and Competitiveness dimension
4.6.1 The current situation within the low-carbon
technologies sector and, to the greatest possible extent, its
position on the global market (this analysis should be carried
out at EU level or global level)
The annual budget of the National energy research and innovation
programme is approximately SEK 1.6 billion. Sweden excels in a number of
fields of research and innovation, including the field of low-carbon
technologies, and is also at the forefront of international efforts in the fields
listed below.
Efficient biofuels for low-carbon energy transition, forestry and
bioenergy
Efforts in this field are focused on:
• fuel supply; cultivation and extraction of biofuels, logistics, planning and fuel processing, with a focus on domestic biofuels
from forests, arable land, waste, and marine biomass;
• energy transformation; processes for producing electricity and heat in cogeneration installations and products of what are known as combined heat and power plants, in which surplus heat is used to produce pellets, biofuels or other energy carriers, for example.
Sweden is a global leader in the field of biofuels and waste-based
cogeneration. Research has played an important role in the development of
efficient and environmentally friendly biofuel- and waste-based cogeneration
plants.

160 (199)
A great deal of research is being carried out in Sweden in relation to the use
of forests as carbon sinks and the efficient use of bioenergy stocks. The aim
of the project ‘Cost-effective and sustainable harvesting of fuels based on
forest products’ was to find a way to use machinery more efficiently and
widely in order to reduce the cost per cubic metre of extracting fuels based
on forest products and to be able to spread machine costs over more hours.
The project also focused on the extraction of small trees and best practice
for drying and breaking down small trees for roadside storage. The project
enhanced Swedish expertise in this field and the results provide a basis for
more competitive fuels based on forest products.
The Industriklivet (Industrial Evolution) initiative – resource
optimisation, energy efficiency measures and carbon neutrality in
industry
Sweden is at the forefront of research aimed at helping energy-intensive
industry become more energy and resource efficient, with the ultimate aim
of eliminating carbon emissions completely. The Industriklivet260 initiative is a
long-term campaign to reduce greenhouse gas emissions in industry. A total
of SEK 300 million per year will be spent during the period 2018-2040 in
order to support the transition in Swedish industry towards zero emissions
of greenhouse gases into the atmosphere in 2045. During 2019, the Swedish
parliament acted on a proposal from the government to earmark a further
SEK 200 million for this initiative, partly to increase the original remit and
partly as a supplement to facilitate financing of measures contributing to
negative greenhouse gas emissions261. The initiative provides support to
companies at every step, from research and innovation projects to pilot and
full-scale plants. The target group for this support measure is made up of
industries with what are known as process-related emissions, but also
universities or research institutes.
HYBRIT
Within the framework of HYBRIT (HYdrogen BReakthrough Ironmaking
Technology), which is financed by the Industriklivet initiative, research and
pilot studies are under way in Sweden that may result in a breakthrough for
fossil-free production of steel from iron ore. In addition to the support
received from the Industriklivet initiative, the three HYBRIT-related
projects described below have also received a total of SEK 906 million in
funding from industry.
In 2016, a preliminary study received a grant of SEK 7.2 million and, in
February 2017, the decision was made to support a four-year research
project within the framework of the National energy research and
260 Government press release, https://www.regeringen.se/pressmeddelanden/2017/08/langsiktig-satsning- for-att-minska-industrins-utslapp-av-vaxthusgaser/ 261 Bill No 2018/19:99, Report No 2018/19:FiU21, Parliamentary Letter No 2018/19:288.

161 (199)
innovation programme. As part of this research project, studies were carried
out into processes for fossil-free pellet production, hydrogen direct
reduction,262 and the use of sponge iron263 in electric arc furnaces, as well as
ways of supplying electricity for hydrogen production and storage. The
research project has a budget of SEK 99 million, with the Swedish Energy
Agency providing SEK 54 million in funding and the remaining SEK 45
million coming from the private sector.
During 2018, SEK 9.7 million was awarded for a feasibility study aimed at
identifying the conditions for a pilot plant, as well as its basic design,
location, and technology choices for further development. Later that same
year, a total of SEK 528 million was awarded for the construction of two
pilot plants. In one pilot plant, studies will be conducted on the
development of fossil-free heating technology for sintering iron ore pellets.
These studies aim to reduce emissions, but also to improve knowledge for
designing an entirely new pelletisation process. In the other pilot plant,
studies will be conducted to develop a process in which hydrogen gas is used
to produce sponge iron from iron ore pellets, with that sponge iron then
being smelted in an electric arc furnace to produce steel. Both the feasibility
study on the pilot plant and the pilot plants themselves were authorised
through the Industriklivet initiative.
Transition to a renewable electricity system and use of smart grids
The Forum on smart electricity networks is a national forum set up by the
Swedish government in 2016, see Heading 3.4.3. There are also a number of
national centres and research and innovation programmes relating to smart
electricity networks, namely SamspEL, the Swedish Centre for Future
Electricity Grids and Energy Storage (SweGRIDS) and KTH ACCESS
Linnaeus Centre (ACCESS-Autonomic Complex Communication
Networks, Signals and Systems).
Wind and solar energy are priority fields within Swedish energy research,
with a number of projects under way in this field. One of these is the project
‘High-efficiency silicon multi-junction solar cells’. The aim of the project is
to develop silicon multi-junction solar cells. The ultimate goal is to
demonstrate dual-junction solar cells with an efficiency level of close to 30%
and triple-junction solar cells with an efficiency level of approximately 35%.
Research and demonstration in the transport sector
Swedish authorities provide funding to a number of programs and
large-scale projects that cover the entire chain, from cultivation of raw
materials for bio-based motor fuels to the use of new fuels. All of the
programmes listed below are funded within the framework of the National
energy research and innovation programme. Strategic Vehicle Research and
262 Direct reduction, https://www.jernkontoret.se/sv/om-oss/biblioteket/ordlista/ordlista-d/. 263 Sponge iron, https://www.jernkontoret.se/sv/om-oss/biblioteket/ordlista/ordlista-j/.

162 (199)
Innovation (Fordonsstrategisk Forskning och Innovation – FFI) also
receives funding from the Agency for Innovation Systems, VINNOVA.
• FFI, a collaboration between the state and the automotive industry with regard to joint funding for research, innovation and development activities, with a focus on the fields of climate, environment and safety.
• The Renewable Fuels and Systems 2018-2021 collaboration programme, a collaboration between the Swedish Energy Agency and the Swedish Knowledge Centre for Renewable Fuels (f3).
• The Swedish Gasification Centre (Svenskt Förgasningscentrum – SFC), a research centre where numerous academic bodies collaborate with industry.
• The Battery Fund Programme, a research programme
focusing on battery recycling and batteries for electricity system and automotive applications.
• Transport-Efficient Society, a research programme aimed at developing new knowledge and increasing competence in academia, institutes, the public sector and industry, by supporting research, development, innovation and demonstration and thus helping to ensure a transport-efficient society that is equal, accessible and resource efficient.
• A maritime programme aimed at creating a sustainable maritime transport system.
One example of such a project is the company RenFuel K2B AB, which
received support to develop and test its technology for producing renewable
petrol and diesel from raw forest products at pilot scale. In the pilot project,
lignin will be extracted from raw forest products at a pulp mill and
transformed into an oil. The oil will then be transformed into renewable
petrol and diesel in a conventional refinery.
The transition to electricity in the transport sector creates new opportunities.
Large-scale battery production is crucial to Sweden’s key role in this
transition and in order to reduce the climate impact of the transport sector,
both in Sweden and worldwide. As part of this process, Northvolt Labs was
awarded a sum of up to SEK 146 million for a pilot plant for large-scale
battery production in Sweden. This decision represents an important step
towards a new domestic industry and sustainable energy systems. The
project relates to the construction and operation of a pilot plant for
producing lithium-ion batteries, located in Västerås. The project is divided
up into a number of phases and will run from 2018 to the end of 2023. In
addition to testing and validating a new production and process model that
will reduce the environmental impact of battery production, the pilot plant
will also function as a research and development centre for sustainable and
flexible battery production. The construction of a pilot plant in Västerås is a
crucial step on the road to establishing Northvolt’s battery factory in

163 (199)
Skellefteå, and has triggered the creation of a European battery production
supply chain. The support provided is also helping to create an ecosystem of
Swedish companies across the entire battery value chain – from raw
materials to battery systems. It is estimated that around 100 people, in
addition to research and development personnel, will be employed at the
pilot plant in Västerås. The factory in Skellefteå is expected to be fully
operational in 2023 and should directly create between 2 000 and 2 500
jobs264.
A contract for a research and innovation platform for a fossil-free freight
transport system has been awarded to a large consortium, Triple F265, by the
Swedish Transport Administration. Triple F is focusing on three challenges:
a more transport-efficient society, energy-efficient and fossil-free vehicles
and aircraft; and a greater share of renewable fuels. The expected outcome is
sector-wide collaboration and knowledge building to help reduce CO2
emissions in the freight transport system in line with set targets.
Electric aircraft may help reduce both direct emissions from aviation and the
effects of altitude adjustments, particular over shorter distances, which may
prove useful for air routes subject to public procurement for reasons of
regional policy, amongst other things. A fully electric aircraft was flown for
the first time in Sweden in 2018. The Swedish aviation industry is working to
develop hybrid or fully electric aircraft with support from the ELISE
(Elektrisk lufttransport i Sverige – Electric Air Transport in Sweden)
initiative, amongst others. This initiative aims to have the first certified
Swedish-made hybrid aircraft, with a flight limit of 400 km, flying domestic
services in 2026. In the longer term, and as electric aircraft evolve, the need
for charging infrastructure in the aviation industry will increase.
Energy-related building research
The Swedish Energy Agency, as sectoral authority, has primary responsibility
for the coordination of energy-related building research. Projects in this area
are funded by Formas and VINNOVA, as well as by the Swedish Energy
Agency. The Swedish Consumer Agency, the National Board of Housing,
Building and Planning, and the Environmental Protection Agency also have
energy-related responsibilities in the construction sector. A key characteristic
of energy-related building research is its system-wide perspective, with the
aim of achieving resource- and energy-efficient construction through
collaboration. The Swedish Energy Agency focuses on energy efficiency in a
number of programs: Research and innovation for energy-efficient
construction and housing, Design for energy efficiency in everyday life, and
Energy efficiency in the lighting sector.
264 Press release from the municipality of Skellefteå dated 12 June 2019 http://www.mynewsdesk.com/se/skellefteakommun/pressreleases/klart-foer-byggstart-av-
northvolts-batterifabrik-i-skellefteaa-2885665. 265 https://triplef.lindholmen.se/.
164 (199)
From research to market
Sweden was named the 2019 innovation leader in the European Innovation
Scoreboard, followed by Finland, Denmark and the Netherlands.266 The
above report provides a comparative analysis of innovation performance in
EU countries, other European countries, and regional neighbours. The
report compares relative strengths and weaknesses of national innovation
systems (Human resources, Attractive research systems, Innovation-friendly
environment, Finance and support, Firm investments, Innovators, Linkages,
Intellectual assets, Employment impacts and Sales impacts) and helps
countries identify areas they need to address.
The transition to a sustainable energy system is creating a growing global
demand for new technologies and new services. Due to its commercial and
international nature, energy research and innovation in Sweden offers
significant potential to meet this demand. Sweden provides support to
companies for business development and the commercialisation and
distribution of new energy technologies and services, at various different
stages of development. This support is provided until such time as the
innovation has achieved a stage of maturity at which private operators are
willing to take on, finance and pursue continued development. Over the last
three years, agencies have intensified their efforts to reach out to innovative
companies and offer various different kinds of support. One of the tools
used is the ‘A Challenge from Sweden’ initiative – a challenge-driven
innovation programme. The programme brings together relevant customers,
suppliers and investors across the globe, in order to facilitate society’s
transition towards carbon-free growth. The initiative focuses on ambitious
challenges with the potential to transform fields such as fossil-free transport
and 100% renewable energies. The programme uses competitions, tests and
events to inspire the commercialisation of sustainable solutions and the
creation of viable projects.
Sweden has supported several successful companies in bringing their
research and innovations to market. In the field of solar energy, these
include, for example, Exeger (Heffa Solar – a new cost-efficient Grätzel
solar cell). In the field of marine energy, they include, for example,
CorPower Ocean AB, high-efficiency Wave Energy Converter (WEC),
Minesto, Waves4Power and Ocean Harvesting Technologies.
Pilot and demonstration collaborations between public and private operators
Sweden has also supported successful pilot and demonstration projects in
collaboration with public and private operators.
266 https://ec.europa.eu/growth/industry/innovation/facts-figures/scoreboards_en.

165 (199)
• AB Volvo and Scania AB’s zero-emission haulage through the manufacture of electric, hybrid, plug-in hybrid and other hybrid vehicles, including fuel cell vehicles and heavy machinery, and support for the development of electric roads.
• Smart electricity networks, with demonstrations carried out in
Norra Djurgårdsstaden, Hyllie and Gotland.
4.6.2 Public and – if available – private spending on
research and innovation relating to low-carbon technologies,
current number of patents and current number of researchers.
Public and private spending
State contributions to research amounted to SEK 37.5 billion in 2018.
Funding for the National energy research and innovation programme
accounted for SEK 1.43 billion, i.e. approx. 3.8% of this amount267.
Table 33 shows the allocation of funds awarded within the framework of the
National energy research and innovation programme in millions of SEK and
industry funding, as a percentage of total funding during the period
2015-2018. Other private spending is difficult to estimate.
Table 33. Public and private funding within the framework of the National energy research and innovation programme 2015-2018.
2015 2016 2017 2018
Total state funding and business contributions
MSEK 1 890 (100%)
MSEK 2 287 (100%)
MSEK 2 671 (100%)
MSEK 2 969 (100%)
Swedish Energy Agency
MSEK 1 075 (57%)
MSEK 1 212 (53%)
MSEK 1 309 (49%)
MSEK 1 247 (42%)
Companies/representative intermediary organisations
MSEK 815 (43%) MSEK 1,075 (47%)
MSEK 1,362 (51%)
MSEK 1,722 (58%)
Number of patents
There was a total of 893 Swedish patent applications in energy-related fields
filed domestically during the period 2013-2015, and 1 080 filed worldwide.
Number of researchers
The number of active doctoral candidates and senior researchers employed
in projects funded to a level of at least 20% by the National energy research
and innovation programme is shown below. The proportion of female
project managers is approximately 32%.
2018: 1 098 (771 men, 327 women)
267 https://www.scb.se/hitta-statistik/statistik-efter-amne/utbildning-och-forskning/forskning/statliga-anslag-till- forskning-och-utveckling/pong/statistiknyhet/statliga-
anslag-till-forskning-och-utveckling-2018/.

166 (199)
2017: 1 202 (896 men, 306 women)
2016: 1 183 (861 men, 322 women)
2015: 1 071 (768 men, 303 women)
4.6.3 Breakdown of current price components making up
the three main price components (energy, network charges
and taxes/fees)
Electricity price components
The electricity price paid by an end consumer consists of three main
components: the electricity trade price, network charges, and VAT and other
taxes. Taxes are levied on the price of the product, electrical energy, and
VAT is payable on the taxes, electricity and network charges. For a typical
apartment-dwelling customer (2 000 KWh annual consumption) with a
variable electricity price contract, the total electricity cost for 2018 was, on
average, SEK 299 a month. Network charges account for the largest share
(41%) of the electricity cost for apartment-dwelling customers. Figure 37
shows a breakdown of the electricity price components for customers with
an annual consumption of 2 000 KWh.
Figure 37. Breakdown of electricity price components — apartment-dwelling customers (2 000 KWh annual consumption) with a variable electricity price contract during 2018.
Source Target SEK/månad SEK/month januari January februari February mars March april April maj May

167 (199)
juni June juli July augusti August september September oktober October november November december December Energiskatt och moms Energy tax and VAT Rörligt pris exkl moms Variable price, excluding VAT Moms elnät VAT electricity network Nätavgift Network charges
Source: Swedish Energy Markets Inspectorate.
For a typical detached house-dwelling customer (20 000 KWh annual
consumption) with a variable electricity price contract, the total electricity
cost for 2018 was, on average, SEK 1 854 a month. For detached
house-dwelling customers, the variable electricity price accounted for the
largest share (51%) of the electricity cost. Figure 38 shows a breakdown of
the electricity price components for customers with an annual consumption
of 20 000 KWh.
Figure 38. Breakdown of electricity price components — detached house-dwelling customers (20 000 KWh annual consumption) with a variable electricity price contract during 2018.
Source Target SEK/månad SEK/month januari January februari February mars March april April maj May juni June juli July augusti August september September oktober October november November december December Energiskatt och moms Energy tax and VAT Rörligt pris exkl moms Variable price, excluding VAT Moms elnät VAT electricity network Nätavgift Network charges
Source: Swedish Energy Markets Inspectorate.
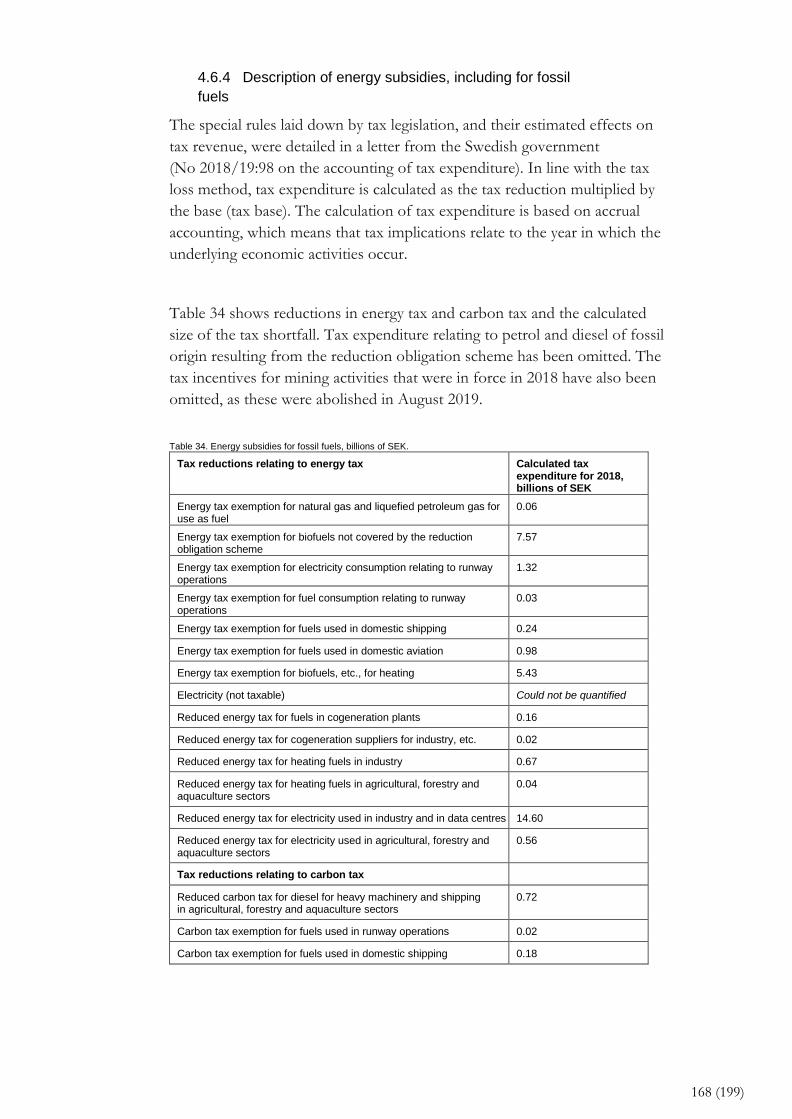
168 (199)
4.6.4 Description of energy subsidies, including for fossil
fuels
The special rules laid down by tax legislation, and their estimated effects on
tax revenue, were detailed in a letter from the Swedish government
(No 2018/19:98 on the accounting of tax expenditure). In line with the tax
loss method, tax expenditure is calculated as the tax reduction multiplied by
the base (tax base). The calculation of tax expenditure is based on accrual
accounting, which means that tax implications relate to the year in which the
underlying economic activities occur.
Table 34 shows reductions in energy tax and carbon tax and the calculated
size of the tax shortfall. Tax expenditure relating to petrol and diesel of fossil
origin resulting from the reduction obligation scheme has been omitted. The
tax incentives for mining activities that were in force in 2018 have also been
omitted, as these were abolished in August 2019.
Table 34. Energy subsidies for fossil fuels, billions of SEK.
Tax reductions relating to energy tax Calculated tax expenditure for 2018, billions of SEK
Energy tax exemption for natural gas and liquefied petroleum gas for use as fuel
0.06
Energy tax exemption for biofuels not covered by the reduction obligation scheme
7.57
Energy tax exemption for electricity consumption relating to runway operations
1.32
Energy tax exemption for fuel consumption relating to runway operations
0.03
Energy tax exemption for fuels used in domestic shipping 0.24
Energy tax exemption for fuels used in domestic aviation 0.98
Energy tax exemption for biofuels, etc., for heating 5.43
Electricity (not taxable) Could not be quantified
Reduced energy tax for fuels in cogeneration plants 0.16
Reduced energy tax for cogeneration suppliers for industry, etc. 0.02
Reduced energy tax for heating fuels in industry 0.67
Reduced energy tax for heating fuels in agricultural, forestry and aquaculture sectors
0.04
Reduced energy tax for electricity used in industry and in data centres 14.60
Reduced energy tax for electricity used in agricultural, forestry and aquaculture sectors
0.56
Tax reductions relating to carbon tax
Reduced carbon tax for diesel for heavy machinery and shipping in agricultural, forestry and aquaculture sectors
0.72
Carbon tax exemption for fuels used in runway operations 0.02
Carbon tax exemption for fuels used in domestic shipping 0.18

169 (199)
5. IMPACT ASSESSMENT OF PLANNED INSTRUMENTS
AND MEASURES
5.1 Effects of planned instruments and measures as
described under Heading 3 on energy systems and emissions
and removals of greenhouse gases, and comparison with
projections on the basis of existing instruments and measures
(according to the description under Heading 4).
5.1.1 Development forecasts relating to energy systems and
emissions and removals of greenhouse gases and, if relevant,
emissions of atmospheric pollutants in accordance with
Directive (EU) 2016/2284 in line with planned instruments and
measures, for at least the ten-year period following the period
covered by the plan (including the last year of the period
covered by the plan), including relevant instruments and
measures at Union level.
The Swedish parliament has adopted a climate policy framework for
Sweden, see Heading 1.2, in order to ensure that ambitious climate
objectives are set, that the government will plan and take decisions to
achieve the objectives, that the government and parliament follow up on
adopted policies, and that independent experts evaluate the government’s
overall policies.268 A climate action plan is to be submitted for each term of
office. Accounting and follow-up is to be carried out annually and the
development of instruments and measures is to take place on an ongoing
basis. Sweden thus has a system in place for achieving the climate objectives
set, but has yet to plan all of the instruments required to achieve those
objectives.
For the purpose of following up and improving some of the most important
instruments implemented, Sweden is also working on what are known as
control stations at intervals of one or more years. The purpose of these
control stations is to continuously evaluate these instruments and, if
necessary, adjust them.
Fuel switching/reduction obligation scheme
On 28 June 2018, the government invited the Swedish Energy Agency to
investigate and submit proposals on reduction levels for the period 2021 to
2030, whether a joint reduction level for petrol and diesel fuel should be
introduced, and whether pure and high-blended liquid biofuels should be
covered by the reduction obligation scheme or should continue to be
promoted by way of a tax exemption. The Agency was also to investigate
whether it was possible for the reduction obligation scheme to be made
more cost-effective. The Agency reported on this issue on 4 June 2019 and
supplemented the report on 25 October 2019. The process for establishing
268 Bill No 2016/17:146, Report No 2016/17:MJU24, Parliamentary Letter No 296/17:320.

170 (199)
progressively higher reduction levels for the years following 2020 is currently
under way before the Government Offices and is expected to be completed
during 2020.
The aim of the reduction obligation scheme is to reduce petrol and diesel
emissions by blending them with biofuels having low life-cycle emissions.
The amount of energy from biofuels required to meet the obligation is
determined by the life-cycle emissions of the biofuels used. The higher the
life-cycle emissions, the greater the volume of biofuels required for blending,
and vice versa. The extent to which the use of fossil fuels decreases as a
result of this obligation scheme is therefore not just determined by the
reduction levels set for each year, but also by the biofuels used.
The amount of energy from biofuels required to meet the obligation is also
determined by the amount of energy from fossil fuels used. Measures
relating to energy efficiency, a transport-efficient society, and the
electrification of the transport sector reduce the amount of energy from
fuels covered by the obligation scheme. The reduction obligation scheme
interacts with other instruments in this way, such as the bonus-penalty
system that contributes towards increased electrification of the transport
sector.
5.1.2 Assessment of the interaction between instruments
(between existing and planned instruments and measures
with a political dimension and between existing and planned
instruments and measures with various dimensions) until at
least the last year of the period covered by the plan,
particularly in order to provide a solid understanding of the
effects of energy efficiency and energy saving measures on
the size of the energy system and in order to reduce the risk
of unnecessary energy supply investments.
The aim of sectoral energy efficiency strategies, see Heading 1.2, which are
designed to help achieve the target of 50% more efficient energy use by
2030, is to establish dialogue at an early stage between the Swedish Energy
Agency, various different sectors and relevant authorities on matters relating
to appropriate indicative objectives and measures in each sector for
contributing, in a cost-effective manner, towards achieving the national
energy and climate targets. As a result of this work, carried out in association
with relevant authorities and sectoral operators, a broad consensus can be
reached, while also ensuring that those operators become increasingly
engaged when implementing national policy. The key starting point for
developing these sectoral strategies is the target of 50% more efficient
energy use in Sweden in 2030 compared to 2005, but consideration is also to
be given to the target of 100% renewable electricity production by 2040.
These strategies must also take into account that Sweden is to have zero net
emissions of greenhouse gases into the atmosphere by 2045 at the latest, in

171 (199)
order to subsequently achieve negative emissions, and that the target for the
transport sector is a 70% reduction in greenhouse gas emissions compared
to 2010.
5.1.3 iii) Assessment of the interaction between existing and
planned national instruments and measures, and between
those instruments and measures and the climate and energy
policy measures of the European Union.
Interaction between instruments and measures for air and climate
Atmospheric pollutants and climate change are closely interlinked in many
respects and represent a challenging area, due to their effects at both
regional and global level. Future climate change will affect atmospheric
pollutant concentrations, distribution patterns, depositions and exposure.
The magnitude of these effects and the direction they take will depend on
the evolution of climate change, amongst other things. In parallel with this,
there are a number of atmospheric pollutants that have a climate-altering
effect.
As emissions often come from the same societal activities, there is a strong
incentive to coordinate strategies for air and climate measures and
instruments in order to maximise environmental benefits. Ambitious action
on climate change is crucially important in order to exploit synergies, avoid
conflicts between objectives, and reduce costs for society as a whole. Air
pollution control policy needs further development in a manner integrated
with both climate policy and energy policy in order to be as effective as
possible.
Energy efficiency and energy saving measures across various different
sectors of society, including, for example, industry, transport, heating of
premises and housing, and product performance, offer numerous
opportunities for air and climate synergies. If Sweden achieves its target of
increasing energy efficiency by 50% from 2005 to 2030, this may have
positive effects on various different environmental areas.
Pursuant to the National Emissions Ceilings Directive269, Sweden is
committed to reducing emissions of certain atmospheric pollutants.
According to the latest estimates, Sweden will need to implement further
measures to reduce emissions of ammonia by 2020 and nitrogen oxides by
2030270. With regard to environmental quality standards for outdoor air271
269 Directive (EU) 2016/2284 of the European Parliament and of the Council of 14 December 2016 on the reduction of national emissions of certain atmospheric
pollutants, amending Directive 2003/35/EC and repealing Directive 2001/81/EC. 270 Environmental Protection Agency – Air pollution control programme – Draft strategy for cleaner air in Sweden (NV-06767-17). 271 Air Quality Regulation (2010:477).

172 (199)
and the EU’s limit values for air quality272, a number of measures are needed
in order to cut concentrations of nitrogen dioxide and particulate matter
(PM10) in congested areas. In order to be able to additionally meet the
long-term generational goal of environmental policy, additional air pollution
control measures to improve air quality273 and reduce depositions of
acidifying and eutrophifying air pollution will also be needed to protect
human health and the environment. In March 2019, the Swedish
government adopted a National air pollution control programme that
describes how Sweden plans to implement measures and instruments to
satisfy the emissions reduction requirement set out by the National
Emissions Ceilings Directive. It is crucially important that the periodic
revisions of Sweden’s Air pollution control programme seek to exploit
synergies with action on climate change.
The transport and use of bioenergy represent two areas of particular
strategic importance in terms of potential synergies and conflicts between air
pollution control and climate.
Developments within the transport sector will be crucial in terms of
opportunities for achieving Sweden’s 2030 emissions commitment in respect
of nitrogen oxides, but this will also affect progress in respect of other
atmospheric pollutants. The government’s decision to adopt the National air
pollution control programme identified measures for achieving the 2030
climate target for the transport sector, as part of the measures covered by
the Air pollution control programme to reduce emissions of nitrogen oxides.
Trends in emissions of nitrogen oxides will be strongly dependent on what
proportion of the vehicle fleet is powered by internal combustion engines,
particularly diesel engines, in the period to 2030. Positive measures for
reducing emissions of both atmospheric pollutants and greenhouse gases
include increased electrification of the vehicle fleet, a more
transport-efficient society, and energy efficiency.
Future strengthening of common EU rules on the CO2 requirement for
light-duty vehicles and the introduction of corresponding requirements for
heavy duty vehicles will also create positive synergistic effects on emissions
of nitrogen oxides by 2025 and 2030. In practice, this requirement entails
widespread introduction of electric vehicles.
Increased biomass consumption contributes towards reducing greenhouse
gas emissions from fossil fuels, but may entail negative effects on air quality.
During biomass combustion, emissions of atmospheric pollutants, including,
but not limited to, particulate matter, black carbon, benzo(a)pyrene and
272 Directive 2008/50/EC of the European Parliament and of the Council of 21 May 2008 on ambient air quality and cleaner air for Europe. 273 Here, particularly important atmospheric pollutants include particulate matter, black carbon, ground-level ozone and benzo(a)pyrene.

173 (199)
nitrogen oxides, may increase if they are not offset by exhaust gas cleaning.
A transition to biofuels in the vehicle fleet reduces greenhouse gas emissions
but does not help reduce emissions of nitrogen oxides. Emissions of
nitrogen oxides from diesel cars run on fossil diesel are approximately the
same as from diesel cars run on biodiesel. Emissions of nitrogen oxides
from cars run on biogas are slightly lower. Therefore, in order to satisfy
Sweden’s commitments under the National Emissions Ceilings Directive, it
is important to have a more transport-efficient society and increased
electrification of the vehicle fleet in Sweden’s urban areas.
5.2 Macroeconomic and – as far as possible – health,
environmental, educational, skills-related and social
consequences, including with regard to fair transition (in
terms of costs, benefits and cost efficiency) of planned
instruments and measures as referred to under Heading 3,
until at least the last year of the period covered by the plan,
including a comparison with projections based on existing
instruments and measures.
It has been highlighted in several reports that the costs of climate change for
society may be very high. Perhaps the best known of these is called the Stern
Review274, which was published in 2006 and is named for its lead author, Sir
Nicholas Stern. In his report, Stern notes that if the world does not take
action, the overall long-term costs and risks of climate change will be
equivalent to losing at least 5% of global GDP each year, now and forever.
If a wider range of risks and impacts is taken into account, the estimates of
damage could rise to 20% of GDP or more. Stern also considers that ‘the
costs of not acting far outweigh the costs of action’; a finding he later
repeated in a research article from 2015 and elsewhere. The negative effects
would impact a wide range of stakeholders. From a global perspective, the
Swedish government believes that meeting these targets is also a step
towards equality, as, in many countries, women are generally more at risk
from climate change, work in more exposed environments, and suffer to a
greater extent than men from the disasters caused by climate change.
Limiting global warming also contributes, in a positive way, towards
achieving several other environmental quality targets. The environmental
quality targets that are most affected by climate change, either directly or
indirectly, are those relating to air, eutrophication and biodiversity.
However, many of the consequences of Sweden’s long-term climate
objectives primarily depend on how the objectives are achieved and under
what conditions. The ease or difficulty with which targets are achieved
depends on factors such as technological development and behavioural
changes, which are difficult to predict. For example, digitalisation may
274 Stern, Nicholas – Review on the Economics of Climate Change (2006).

174 (199)
accelerate and facilitate development that helps achieve climate targets. If the
rest of the world does not adapt, the cost of achieving Swedish climate
targets increases. The positive consequences of climate change adaptation in
Sweden may also be diminished if the rest of the world does not adapt, for
example the possibility of exporting Swedish climate solutions and
environmental technologies may be restricted.
In its two reports A climate policy framework for Sweden (SOU 2016:21)
and A climate and air pollution control strategy for Sweden (SOU 2016:47),
the Environmental Objectives Council, see Heading 1.3, compiled a number
of estimates of the socio-economic consequences of achieving the milestone
targets for 2030 and 2040, the milestone target for the transport sector, and
the long-term emissions target. Many of these estimates were obtained using
different models, which, in turn, have different points of focus and are based
on different assumptions relating, amongst other things, to the structure of
the instruments and global developments, as well as links between different
parts of the economy. This means that, although the results of the model
calculations are not directly comparable with one another, they can help
create an overall picture of the socio-economic consequences.
With regard to the milestone target for 2030, the Environmental Objectives
Council entrusted the task of calculating the socio-economic costs275 to the
National Institute of Economic Research based on a number of assumptions
identified by the Council. The assumptions mainly relate to the transport
sector, for example future energy efficiency. On the basis of these
assumptions, calculations show that a cost-effective climate policy for the
milestone target, compared with a less ambitious climate target, may result in
a GDP in 2030 that is 0.2 to 1.5% lower than the baseline scenario.
However, the National Institute of Economic Research stresses that there is
a great deal of uncertainty associated with the calculations and that some
costs are not represented in the results. Moreover, the National Institute of
Economic Research considers that a more accurate cost estimate cannot be
provided until an instruments package has been developed. The
Environmental Objectives Council considers that the possibility of using
complementary measures may help reduce the costs of achieving the
milestone target, as well as other climate targets. Furthermore, the possibility
of using complementary measures should also help reduce the costs of
achieving other milestone targets.
The consequences of achieving the milestone target in the transport sector
are comparable to the consequences of the milestone target for 2030, as the
instruments and measures used to meet those targets are substantially the
same. There is an even greater degree of uncertainty in the calculations
surrounding the milestone target for 2040 and the long-term emissions 275 SOU 2016:47

175 (199)
target. How those consequences will affect various different stakeholders
depends on the structure of future instruments and on global developments.
Greenhouse gas emissions from the transport sector must be reduced
considerably. The stakeholders that are most dependent on the transport
sector today may be affected to a relatively greater degree, unless this is
offset by technological developments that make climate-smart transport
cheaper and more accessible. Therefore, research and innovation are
required in order to facilitate the development of climate-smart transport, in
parallel with a policy to help make alternatives available. For example,
continued digitalisation may provide an alternative to physical resources and
also contribute to efficiency gains within the transport sector, due, for
example, to improved logistical solutions and more efficient traffic
management.
With regard to industry in general, climate change adaptation in Sweden and
worldwide will result in benefits for certain sectors, while others may be
negatively affected. Services and products that are more climate-friendly will
provide advantages over more emissions-intensive competitors. Similarly,
climate change adaptation will affect the labour market by creating new jobs
in companies and sectors with low emissions intensity or that offer
sustainable solutions, for example as a result of an increased production of
bio-based fuels and agricultural materials to replace products made from
fossil raw materials. Since the long-term target covers greenhouse gas
emissions from all activities in Sweden, this may also have an impact on
industries currently operating under the European Union Emissions Trading
System (EU ETS). Milestone targets do not cover the trading sector,
however, meaning that the medium-term consequences for industry
primarily concern developments within the trading system. The long-term
emissions target, which also includes emissions falling under the EU ETS,
requires a more ambitious approach in the EU ETS. The strengthening of
this system must be carried out in such a way as to avoid increasing the risk
of carbon leakage. While a policy for achieving climate targets may have a
positive effect on attaining several other environmental quality targets, for
example with regard to Clean air and A good built environment, there may also
be conflicts between targets based on the manner in which climate change
adaptation occurs.
5.3 Overview of investment needs
5.3.1 Existing investment flows and assumptions on future
investment with regard to planned instruments and
measures.
Investments in electricity production
The results of the calculation under this heading are based on the EU
baseline scenario from the Swedish Energy Agency’s report on long-term
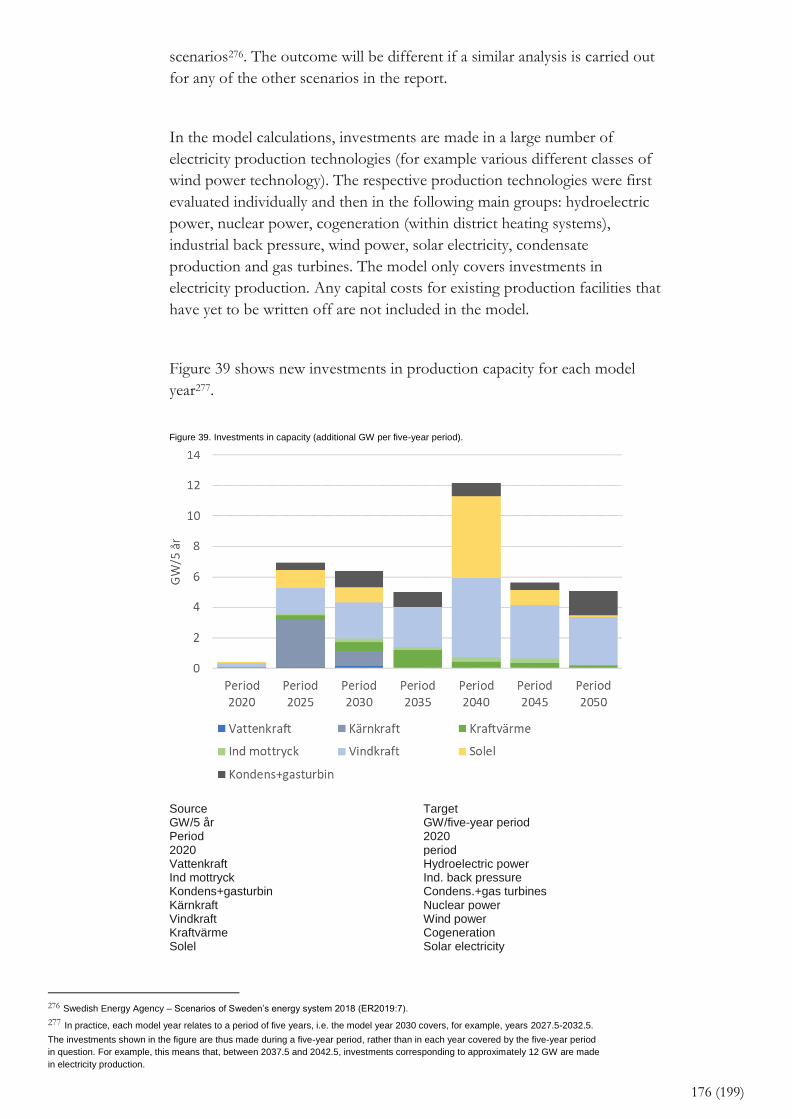
176 (199)
scenarios276. The outcome will be different if a similar analysis is carried out
for any of the other scenarios in the report.
In the model calculations, investments are made in a large number of
electricity production technologies (for example various different classes of
wind power technology). The respective production technologies were first
evaluated individually and then in the following main groups: hydroelectric
power, nuclear power, cogeneration (within district heating systems),
industrial back pressure, wind power, solar electricity, condensate
production and gas turbines. The model only covers investments in
electricity production. Any capital costs for existing production facilities that
have yet to be written off are not included in the model.
Figure 39 shows new investments in production capacity for each model
year277.
Figure 39. Investments in capacity (additional GW per five-year period).
Source Target GW/5 år GW/five-year period Period 2020
2020 period
Vattenkraft Hydroelectric power Ind mottryck Ind. back pressure Kondens+gasturbin Condens.+gas turbines Kärnkraft Nuclear power Vindkraft Wind power Kraftvärme Cogeneration Solel Solar electricity
276 Swedish Energy Agency – Scenarios of Sweden’s energy system 2018 (ER2019:7). 277 In practice, each model year relates to a period of five years, i.e. the model year 2030 covers, for example, years 2027.5-2032.5.
The investments shown in the figure are thus made during a five-year period, rather than in each year covered by the five-year period
in question. For example, this means that, between 2037.5 and 2042.5, investments corresponding to approximately 12 GW are made
in electricity production.

177 (199)
Source: Swedish Energy Agency.
It should be noted that no indication as to total installed capacity can be
inferred from investments in capacity. The sum of new investments over a
longer period may exceed the installed capacity. Some investments are in fact
made in order to replace previous investments that have expired as a result
of the age limit (the technical lifespan) and that have different utilisation
timeframes (i.e. different energy-to-capacity ratios). Nuclear power
investments are made in order to extend that lifespan, from a technical
lifespan of 35 years to 60 years.
Figure 40 shows investments in monetary terms. It is assumed that the entire
investment is charged to the model year in which it is made. This refers to
the immediate investment cost, i.e. the investment costs excluding interest
costs during the construction period. As in Figure 39, each model year
actually represents a five-year period. The investment is charged during this
period. In order to obtain the annual investment during a certain year, divide
the five-year period (model year) that includes the year in question by five.
Figure 40. Investments in millions of SEK per five-year period, charged to the model years (five-year period) during which the investment is made (‘overnight’ cost).
Source Target Investering, "övernatt” (MSEK/5 år) Investment, ‘overnight’ (MSEK/5-year period) Period 2020
2020 period
Vattenkraft Hydroelectric power Ind mottryck Ind. back pressure Kondens+gasturbin Condens.+gas turbines Kärnkraft Nuclear power Vindkraft Wind power Kraftvärme Cogeneration Solel Solar electricity

178 (199)
Source: Swedish Energy Agency.
Despite the fact that investments in cogeneration capacity, expressed in GW,
are lower than investments in wind power, for example (see Figure 39), the
difference calculated in terms of monetary investment, in SEK, between
wind power and cogeneration is much smaller. This is because the entire
cogeneration investment is allocated to electricity production, including
investments for district heating production. For waste-based cogeneration,
for example, the specific investment cost is thus very high per unit of
electricity. If some of the investment cost is allocated to heat production,
which may be reasonable, then, naturally, a reduced cost is allocated to
electricity production. However, there is no clear, objective answer as to
how such allocation is to be carried out.
An alternative method of calculating investments is to annualise278 them over
the economic lifecycle of each investment and according to its imputed
interest. This is shown in Figure 41, where each individual investment is
annualised and allocated to its respective technology group. In other words,
the annualised investment cost is the same as the annual capital cost. It is the
individual calendar year that is relevant here, rather than the five-year
periods given in Figure 40. The costs associated with historical investments,
where parts of the economic lifecycle remain to be charged, are not included
here. It is thus not a total capital cost for electricity production that is
shown, but merely new investments from 2020 onwards, albeit not those in
respect of which a decision to adopt has already been made. Therefore, it is
not possible on the basis of Figure 41 to establish whether the total capital
costs associated with electricity production will increase or decrease in the
long term.
278 An annualised cost is an annual cost (payment) that includes both an interest cost (based on the imputed interest) and an amortisation. As a result of this
annualisation, the investment is thus repaid in equal instalments each year (the annual cost) over the economic lifecycle of the investment.

179 (199)
Figure 41. Investments in millions of SEK/year annualised over the economic lifecycle and based on the imputed interest of the investment in question. (Capital costs relating to ‘historic’ investments are not included here).
Source Target Annialiserad investering (MSEK/ år) Annualised investment (MSEK/year) Vattenkraft Hydroelectric power Ind mottryck Ind. back pressure Kondens+gasturbin Condens.+gas turbines Kärnkraft Nuclear power Vindkraft Wind power Kraftvärme Cogeneration Solel Solar electricity
Source: Swedish Energy Agency.
The annualised investments increase over time, as investments are made on
an ongoing basis (but to varying degrees in accordance with Figure 39) over
the calculation period. This means that the annualisations accumulate, that is
to say that the annualisation of new investments during model year x is
added to the annualisations resulting from investments made during the
preceding model years (x-1, x-2, etc). Written-off investments that no longer
contribute to the sum of annualised investments serve to counteract an
increase over time. The fact that the growth rate of the annualised
investments decreases towards the end of the calculation period, for example
with regard to solar electricity and wind power, may be interpreted as
meaning that new investments are largely offset by written-off investments
that no longer entail any capital cost.
Investments in the national grid
There are four main driving forces behind network (national grid)
investments:
• Connection of new electricity production, with the majority

180 (199)
consisting of new wind power. The greatest volume of wind power is expected to be connected in the north of Sweden.
• The increased need for connections between the Nordic countries and between the Nordic countries and continental Europe.
• Considerable increases in consumption in metropolitan areas result in substantial network investments in order to secure the supply of electricity to these areas. Together with the expected phase-out of nuclear power in the south of Sweden, this also increases the national grid’s need for transmission capacity from north to south.
• Network development is also driven by the need for reinvestments. The oldest parts of the Swedish national grid will need to be renewed over the coming decades.
The network investments reported in the System Development Plan279
during the planning period for the years 2018-2027 amount to SEK 60
billion, of which SEK 45 billion is expected to be paid out during the
planning period for the years 2018-2027. Of this sum, SEK 22 billion is
made up of reinvestments in existing stations and lines, with the remaining
SEK 23 billion consisting of new investments, see Figure 42 and Figure 43.
Figure 42 Investment levels for the years 2018-2027 broken down according to the main driving forces for network investments.
Source Target
Mnkr MSEK
Systemförstärkning System reinforcement
Marknadsintegration Market integration
Reinvestering Reinvestment
Anslutning Connection
Source: Svenska kraftnät.
279 Svenska kraftnät – System Development Plan 2018-2027.
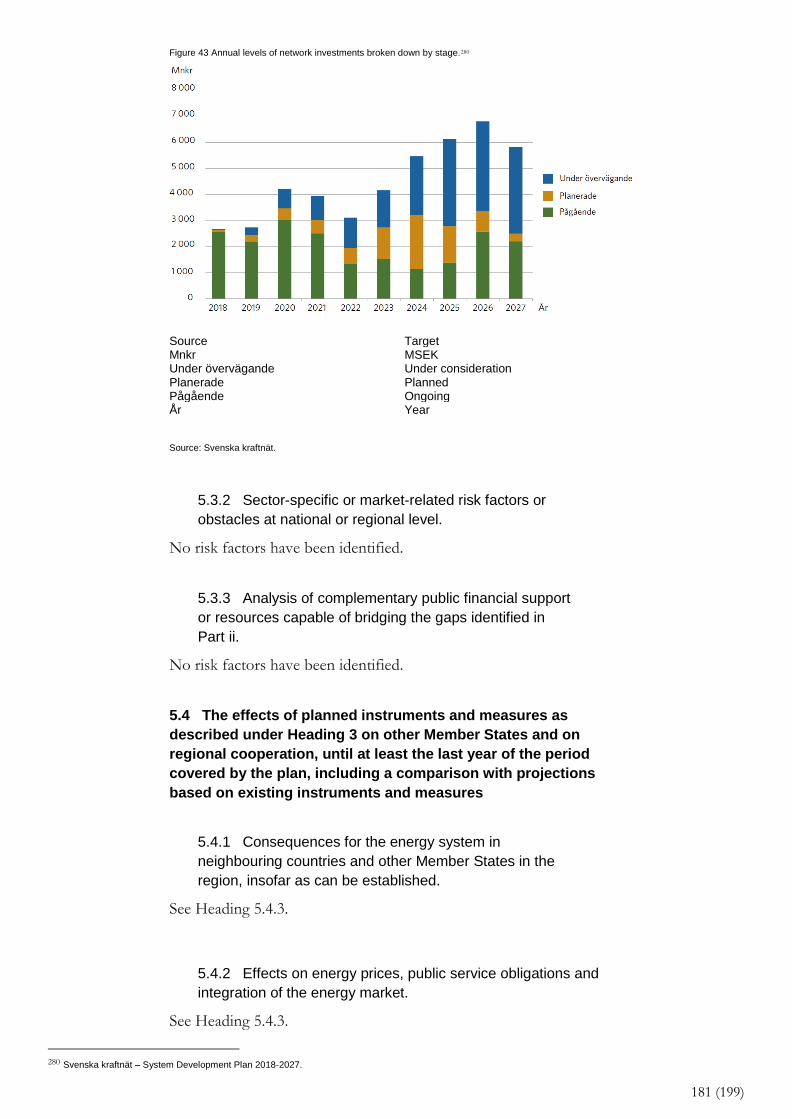
181 (199)
Figure 43 Annual levels of network investments broken down by stage.280
Source Target Mnkr MSEK Under övervägande Under consideration Planerade Planned Pågående Ongoing År Year
Source: Svenska kraftnät.
5.3.2 Sector-specific or market-related risk factors or
obstacles at national or regional level.
No risk factors have been identified.
5.3.3 Analysis of complementary public financial support
or resources capable of bridging the gaps identified in
Part ii.
No risk factors have been identified.
5.4 The effects of planned instruments and measures as
described under Heading 3 on other Member States and on
regional cooperation, until at least the last year of the period
covered by the plan, including a comparison with projections
based on existing instruments and measures
5.4.1 Consequences for the energy system in
neighbouring countries and other Member States in the
region, insofar as can be established.
See Heading 5.4.3.
5.4.2 Effects on energy prices, public service obligations and
integration of the energy market.
See Heading 5.4.3.
280 Svenska kraftnät – System Development Plan 2018-2027.
182 (199)
5.4.3 If relevant, consequences for regional cooperation.
In 2016, Nordic Energy Research, the platform for joint energy research and
policy development under the Nordic Council of Ministers and financed
jointly by the Nordic governments, published the report Nordic Energy
Technology Perspectives 2016281 in collaboration with the International
Energy Agency, and a report into regional long-term, cost-effective,
low-carbon emissions technology roadmaps for the Nordic countries. The
study provides a detailed scenario-based analysis into how the Nordic
countries can achieve a near carbon-neutral energy system in 2050 (Carbon
Neutral Scenario, CNS), and compares this with a Nordic 4°C Scenario
(4DS) that reflects the Nordic contribution to the IEA’s global 4°C
Scenario.
The analysis carried out in Nordic Energy Technology Perspectives 2016 is
centred on a scenario where Nordic energy-related CO2 emissions drop by
85% by 2050. The name – the Carbon Neutral Scenario (CNS) – reflects
wording used in official targets, although carbon neutrality requires offsets
to be used for the remaining 15%. The roadmap for CO2 reduction
established in the CNS scenario should therefore be seen as a minimum
requirement. In order to limit global warming to 1.5°C, in line with the
Declaration on Nordic Carbon Neutrality from January 2019282, it is likely
that additional measures will be needed in order to reduce emissions.
Nordic Energy Research has also drafted a follow-up report on progress
towards carbon neutrality in the Nordic countries: Tracking Nordic Clean
Energy Progress 2019283. The report tracks Nordic progress towards a
carbon-neutral society by highlighting major trends and examples where
Nordic solutions may have a global impact. The report was launched in
October 2019. Some of the most important results from the report include:
For the period 2013 to 2016, the Nordic countries are on track to achieve carbon neutrality, even with higher than expected GDP growth, but it is likely that further measures
will be needed to continue this trend.
The positive trend is seen mainly in the power and heating sectors, which contribute with significant reductions in CO2
emissions, from 60.7 MtCO2 in 2007 to 37.4 MtCO2 in 2016, in line with the intermediate CNS target of 19.2 MtCO2 in 2030.
281 https://www.nordicenergy.org/project/nordic-energy-technology-perspectives/. 282 https://www.regeringen.se/48febb/contentassets/afd1e82263dc4fbba6a1b0c15357faee/declaration-on-nordic-climate-neutrality. 283 https://www.nordicenergy.org/publications/tracking-nordic-clean-energy-progress/

183 (199)
The share of renewable energy in total energy input for the Nordic countries combined increased from 29% in 2006 to 39% in 2016.
The share of electric vehicles in the light-duty vehicle fleet is on track for the 2020 level of 4.1%, in line with the Carbon Neutral Scenario (CNS).
For particularly challenging sectors, it is noted that:
o Energy consumption and emissions in the industry sector have decreased, but it is difficult to reduce process emissions.
o Bioenergy should be used primarily in ‘high-value sectors’
(transport), and sustainability remains a challenge.
o CCS must be demonstrated on a large scale.

184 (199)
16/01/2020
2 annexes
Ministry of Infrastructure
Annex 1 to Sweden’s Integrated National Energy and Climate Plan
Compilation of national consultation documents on
Sweden’s Integrated National Energy and Climate Plan

185 (199)
Overview
Below are some impacts based on stakeholders’ more comprehensive
overview of the plan. Generally speaking, stakeholders view the
development of the National Energy and Climate Plan positively, as a
summary of Swedish energy and climate policy. Only one stakeholder
considers that the plan should be completely revised.
However, several stakeholders, including the Swedish Gas Association, the
Swedish Bioenergy Association, the WWF and the Swedish Public Transport
Association, express doubts about the fact that the plan only covers adopted
instruments and measures.
A number of stakeholders view the plan as an opportunity to influence and
raise the profile of Swedish viewpoints and requirements.
Meeting the plan’s targets
The WWF considers that greater importance should have been attached in
the plan as to how Swedish targets and instruments can be translated into
contributions/forecast outcomes that the Commission can directly add to
contributions from other countries, in particular the energy efficiency target.
It also notes that the plan sends the message that Sweden will not achieve its
national climate targets (milestone target for 2030 and the target for the
transport sector), nor the national target for 100% renewable electricity
production by 2030. Therefore, it considers that the plan should reflect on
how these targets are to be achieved, even if adopted instruments are not in
place.
The Swedish Society for Nature Conservation observes that the plan does
not include any instruments for achieving the national target on net-zero
emissions and that the plan should include ways to close the gap.
100% Förnybart (100% Renewable – a non-profit organisation) is critical of
the fact that the plan does not reflect the long-term climate strategy and
does not address the ways in which the national target for net-zero
emissions by 2045 is to be achieved.

186 (199)
The Swedish Public Transport Association believes that the plan should be
supplemented with conclusions and analyses as to whether, taken together,
existing and planned instruments will result in the stated targets being
achieved.
Greenpeace considers that the plan should be supplemented to include the
risks that Sweden will not achieve its targets and to report on the
conclusions of the Swedish Climate Policy Council, according to which
current policies are insufficient to achieve the targets.
The Swedish Bioenergy Association believes that the plan should be
coordinated with all Swedish climate targets and should indicate
developments needed to achieve those targets in the period to 2030.
Sweden’s contribution to renewable energy by 2030
A number of stakeholders (100% Förnybart, WWF, the Swedish Society for
Nature Conservation, Västra Götaland Regional Council and the Swedish
Wind Energy Association) consider the contribution to be too low.
100% Förnybart, WWF, the Swedish Wind Energy Association and the
Swedish Windpower Association believe that the contribution should be
80% by 2030. For example, the Swedish Wind Energy Association points
out that Sweden’s target of 100% renewable electricity by 2040 will require
well over 80% renewable electricity in 2030.
The Swedish Windpower Association considers that the plan should indicate
80% renewable electricity in 2030, in order to meet the national target of
100% renewable energy by 2040. The importance of network expansion is
also highlighted in this respect.
100% Förnybart does not believe the scenario reflects the strong
performance of wind power.
The Swedish Bioenergy Association notes that the development trajectory
should begin with the expected share of renewables in 2020, rather than the
national target for Sweden of 50%.

187 (199)
The Swedish Society for Nature Conservation believes that the contribution
is too low in light of the development of wind power, the national target of
100% renewable electricity by 2040 and the 63% reduction in emissions in
the non-trading sector by 2030. The Swedish Wind Energy Association
considers that the rapid development of wind power should be visible in the
scenario and notes that Swedish wind power is expected to double by 2022,
thus accounting for 25% of electricity consumption: 40 TWh wind power.
Approx. 60 TWh onshore and offshore wind power by 2030 is reasonable.
The Swedish Bioenergy Association believes that the development of
bioenergy has been underestimated and would almost result in stagnation of
this renewable energy source after 2020. Its own assessment is a 30 TWh
higher contribution by 2030, by which time the total share of renewables
would amount to 74.5% (66.5% + 8%). It also believes that it is not the EU
baseline scenario that should be used, but rather the scenario in which the
reduction obligation scheme quotas are taken into account.
The Swedish Association of Energy Companies believes that the national
contribution to renewables is reasonable, on the basis of the decisions taken
and the recommended criteria.
The Swedish Petroleum and Biofuels Institute believes the plan will result in
huge demand for biofuels during the transition, and that the sector’s role in
satisfying Swedish and EU ambitions is growing ever more relevant. The
long-term validity and stability of regulations and forecasts are prerequisites
for the fuel industry to invest and take a leading role in implementing the
plan.
It also believes that, before entering into any binding commitments under
the plan, it should be ensured that any ambitious goals set by Sweden are not
used by other countries to reduce their targets, thus ensuring Sweden’s
ambitious goals continue to make a net positive contribution to EU targets.
Moreover, it points out that any revised plan may only include more
ambitious goals and that this should be a cause for restraint, due to changing
environmental factors over time. It also considers that Sweden should
incorporate a caveat that the plan applies to currently established regulations.
The Swedish Gas Association believes that the plan should be supplemented
with an assessment/scenario showing how Sweden’s future
developments/contributions may appear if further measures and
188 (199)
instruments are put in place.
Sweden’s contribution to energy efficiency by 2030
The Swedish Society for Nature Conservation considers that there is a
higher potential for energy efficiency and finds it striking that a more
ambitious contribution to energy efficiency is not included in the plan.
WWF believes that the plan should respond to the Commission’s
recommendation on energy efficiency, and should reflect on the potential
for and include a more ambitious contribution to energy efficiency. It also
believes that consideration should be given to the ongoing work involving
instruments in the form of, for example, white certificates, and processes to
revise energy requirements in building regulations.
100% Förnybart considers that the plan should include a more ambitious
contribution to energy efficiency.
Bioenergy and gas
The Swedish Gas Association believes that the role of biogas and gas should
be given greater prominence, and notes the lack of information concerning
gas oil and hydrogen in the energy system.
100% Förnybart considers that the role of biogas in replacing natural gas
should be highlighted.
The Swedish Petroleum and Biofuels Institute considers that the plan results
in an overwhelming demand for biofuels during the transition, and that the
forecast relating to electric cars is understated.
Greenpeace believes that some parts of the plan take a seemingly positive
view on natural gas and biofuels, highlighting, by way of example, the
description of the LNG terminal in Gothenburg.
The Swedish Steel Producers’ Association considers that the plan should be
supplemented with a strategy for expanding the gas network and its role in
the future energy system, and that the plan should describe the future
demand for bioenergy.

189 (199)
Transport
The Swedish Car, Truck and Bus Manufacturers and Importers’ Association
(Bil Sweden) has doubts as to the forecast development of vehicles (of all
fuel types), as it believes that growth in chargeable vehicles will be
considerably faster.
The Swedish Petroleum and Biofuels Institute believes that the targets
identified in the plan with regard to the 70% reduction in emissions in the
transport sector should give consideration to the restrictions set out in
Article 26 of the Renewable Energy Directive. It also believes that the plan
should be supplemented by a description of how the commitment set out in
Article 25 is to be met.
KTH considers that the plan should be expanded with regard to the
environmental effects of the electrification of transport.
Power issues and the lack of security of supply targets
In light of the current shortage of capacity and the forecast power situation,
the Swedish Association of Energy Companies believes that the section of
the plan covering security of supply has serious shortcomings in terms of
concrete measures.
The Swedish Steel Producers’ Association considers that the plan should
clarify the strategies to be used to guarantee climate-neutral energy and
long-term power and transmission capacity in the electricity system, as well
as necessary measures for guaranteed security of electricity supply.
KTH believes that the section on security of supply should be expanded, in
particular with regard to issues on responsibility for security of supply.
The Swedish Wind Energy Association considers that wind power’s
contribution to an electricity production system with better geographical
distribution should be taken into account.
The role of regional and local stakeholders
Klimatkommunerna (an association of cities, towns and regions in Sweden)
asks that the role of communities be clarified and highlighted in the plan.

190 (199)
Like SKR (the Swedish Association of Local Authorities and Regions),
Klimatkommunerna wishes the plan to be used as an opportunity to
highlight key Swedish requirements and on EU legislation, in order for these
to be promoted in terms of implementation at both national and local level.
SKR believes that the plan should highlight stakeholder engagement, efforts
and opportunities.
Fossil energy
The Swedish Society for Nature Conservation considers that the plan should
justify the need for complete phasing-out of fossil fuels in Sweden, and
methods to do so.
100% Förnybart believes that a prohibition on the use of fossil fuels should
be introduced.
Other
KTH considers it important that the plan tie in to the work towards a
national strategy for wind power and highlight authorisation problems
associated with establishing new wind farms.
Greenpeace believes that Heading 5 is underdeveloped and should be
supplemented by comprehensive impact assessments, for example the
Environmental Protection Agency’s input to the government’s climate policy
action plan, the Swedish Climate Policy Council’s annual report, and the
government’s two climate reports for the 2019 and 2020 Finance Acts.
SKR believes that the plan should highlight global climate benefits rather
than territorial emissions.
Shadow analysis AB considers that the plan is too nationalistic, given that
Sweden is part of a wider context involving the electricity market and
EU-ETS.
The Swedish Meteorological and Hydrological Institute (SMHI) proposes
that information relating to the National Expert Council for Climate
Adaptation be added.
The Swedish Bioenergy Association believes that the plan should be strongly

191 (199)
supported in parliament. The Swedish Association of Energy Companies
considers that there are sections of the plan that lack explicit targets and
policies for achieving same, such as the internal market and security of
supply, and that these sections should be further developed within the plan.
Research institutes of Sweden AB believes that the roadmaps developed as
part of the Fossilfritt Sverige (Fossil-Free Sweden) initiative may be more
clearly integrated into the plan. It also observes that there is a general lack of
objectives for timeframes of less than 10 years (2030) and considers that the
plan should be supplemented to include ways of streamlining authorisation
processes.
The Swedish Agency for Economic and Regional Growth believes that the
entire range of actions under Thematic Objective 4 of the regional fund
should be shown.
Shadow analysis AB has been critical of the short consultation timeframes
for gathering observations on the plan.
The Swedish University of Agricultural Sciences considers it unfortunate for
a research policy objective to be based on a current political objective.
The Swedish Concrete Association believes that competition should be
clarified in the plan, including with regard to the roadmaps developed as part
of the Fossilfritt Sverige initiative.
Research institutes of Sweden AB believes that the roadmaps developed as
part of the Fossilfritt Sverige initiative can be more clearly integrated into the
plan. It also observes that objectives for timeframes shorter than from now
until 2030 are lacking within the plan.
KTH considers that the plan should be developed in terms of a circular
economy, including with regard to extending the lifecycle of electricity
production, for example wind power and recycling of batteries from the
transport sector for energy storage.
The Swedish Wood Fuel Association takes the view that the EU baseline
scenario should give consideration to changes in taxation on cogeneration.

192 (199)
16/01/2020
2 annexes
Ministry of Infrastructure
Annex 2 to Sweden’s Integrated National
Energy and Climate Plan
Calculation of annual and cumulative energy savings
pursuant to Article 7, 7(a) and 7(b) of the Energy
Efficiency Directive.
193 (199)
Energy savings in housing and services (buildings)
Electricity savings alone are reported in the housing and services sector. This
is because current levels of direct oil consumption for heating purposes in
housing and services is very low, whereas the price elasticity information
available is based on conditions when oil consumption was significantly
higher. The potential of switching from direct electric heating, which is the
most common heating method in smaller buildings, to air-to-air heat pumps
is great. It is also true that, at present, a large proportion of heating,
particularly in multi-dwelling buildings, takes place through district heating,
where technical lock-in effects reduce the potential of switching to other
heating sources, for example geothermal heat pumps.
In order to estimate the relationship between electricity consumption and
electricity prices in the housing and services sector, a dynamic model284284 is
used, which consists of two parts. This model consists, on the one hand, of
a long-term linear relationship between electricity consumption and the
independent variables of price, income and heat demand and, on the other
hand, a more short-term, dynamic relationship based on deviations in energy
consumption from the long-term relationship and/or changes in any of the
underlying variables (price or income) between the preceding and current
time period.
Those selected parts of the model description that are used to estimate long-
and short-term price elasticity are shown in Annex 1 to Sweden’s plan for
implementing Article 7 of the Energy Efficiency Directive285 for the period
2014-2020286. The memorandum of the Swedish Energy Agency287 provides
data and estimated results and discusses new elasticities for housing and
services.
The price elasticity estimates provided by the Swedish Energy Agency show
that a higher electricity price reduces electricity consumption in the housing
and services sector. A price increase of 10% indicates a long-term reduction
in electricity consumption of approximately 5.2%. In the short term,
electricity consumption decreases by 1.1% with a price increase of 10%. It
284 The model was developed by professor Runar Brännlund at the Centre for Environmental and Resource Economics – CERE, Umeå University (www.cere.se). It is
described in more detail in the report Electricity demand in the Swedish housing sector. 285 Directive 2012/27/EU of the European Parliament and of the Council of 25 October 2012 on energy efficiency, amending Directives 2009/125/EC and 2010/30/EU
and repealing Directives 2004/8/EC and 2006/32/EC. 286 Memorandum of the Ministry of Enterprise, Energy and Communications, N2013/5035/E: Notification of Sweden’s plan for implementing Article 7 of the Energy
Efficiency Directive. Annex 1 Estimation of price elasticity for electricity consumption in the housing and services sector, 2013. 287 Memorandum of the Swedish Energy Agency, 2019: Method for calculating the effects of energy and carbon taxes on energy consumption. Reference number:
2018–12739.

194 (199)
takes a long time for households and the services sector to fully adjust to
changes in prices and income. Buildings, heating systems and other
apparatus do not change greatly from year to year, meaning that one can
only make small adjustments to electricity consumption from one year to
another as a result of, for example, a change in electricity price. However,
this does not mean that long-term changes can be disregarded when
calculating cumulative energy savings. Certain households and companies
adjust faster than others.
The aforementioned elasticities have been used to calculate electricity
savings resulting from the fact that the Swedish electricity tax in the housing
and services sector is higher than the minimum taxation levels set by the EU
and that, in combination with other complementary instruments, this
triggers a reduction in electricity consumption compared with the situation if
these instruments were not in place.
The only difference between the reference scenario (EUmin) and alternative
scenario (SE) is the final consumer price of electricity (including excise
duties and VAT). The calculations start from a price difference of
approximately 50%, which is based on 2015 prices. These calculations also
account for the fact that the Swedish VAT rate is higher than the minimum
taxation level set by the EU (25% compared with 15%). In practice,
however, VAT is only paid by households and companies that do not have a
right to deduct. The calculations are based on the latest available data, with
that year then being used for the subsequent year. The difference in
electricity consumption between the alternative and reference scenario is
calculated in line with this.
Table 1 shows an estimate of the annual and total cumulative electricity
saving in the housing and services sector during the period 2014-2030.
Table 1. Annual and cumulative energy saving in the housing and services sector
∆El TWh/year
∆El cum. TWh
2014 -10.8 -10.8
2015 -11.6 -22.4
2016 -11.4 -33.8
2017 -11.3 -45.1
2018 -11.7 -56.7
2019 -11.7 -68.4
2020 -11.7 -80.1

195 (199)
2021 -11.7 -91.7
2022 -11.7 -103.4
2023 -11.7 -115.1
2024 -11.7 -126.7
2025 -11.7 -138.4
2026 -11.76 -150.1
2027 -11.7 -161.7
2028 -11.7 -173.4
2029 -11.7 -185.0
2030 -11.7 -196.7
The calculations carried out by Sweden in 2013 are based on available
statistics prior to 2014 and price elasticities for the period 1975-2010. The
results in Table 1 are based on the latest available statistics prior to 2019 and
price elasticities for the period 1975-2017288. The revised calculations
account for differences in VAT between Sweden and the EU. In addition,
certain simplifying assumptions are made regarding input data as compared
to the 2013 calculations289.
Table 1 shows a conservative estimate that Swedish instruments will
contribute a cumulative energy saving of approx. 197 TWh in the housing
and services sector during the period 2014-2030. A conservative estimate of
the cumulative energy saving for the period 2021-2030 is approx. 117 TWh.
All data are updated on an annual basis by the Swedish Energy Agency in
conjunction with the publication of new official statistics. The Swedish
Energy Agency will also work to develop the calculation methods further, as
they underestimate the effects of taxation at present. In connection with the
reporting of energy savings achieved pursuant to the EU’s Governance
Regulation290, the calculations may be updated.
Energy saving in the transport sector
A reduced consumption of petrol and diesel is reported overall in the
transport sector. Savings of pure biofuels and electricity are not reported.
As is the case for buildings, the relationship between energy consumption
and energy price for petrol and diesel in the transport sector is estimated
288 Memorandum of the Swedish Energy Agency, 2019: Method for calculating the effects of energy and carbon taxes on energy consumption. Reference number:
2018–12739. 289 A summary statement of assumptions and prerequisites for the 2013 calculations is provided in Annex 1 to the Memorandum of the Ministry of Enterprise, Energy
and Communications, N2013/5035/E: Notification of Sweden’s plan for implementing Article 7 of the Energy Efficiency Directive, 2013. 290 Regulation (EU) 2018/1999 of the European Parliament and of the Council of 11 December 2018 on the Governance of the Energy Union and Climate Action,
amending Regulations (EC) No 663/2009 and (EC) No 715/2009 of the European Parliament and of the Council, Directives 94/22/EC, 98/70/EC, 2009/31/EC, 2009/73/EC, 2010/31/EU, 2012/27/EU and 2013/30/EU of the European Parliament and of the Council, Council Directives 2009/119/EC and (EU) 2015/652 and repealing Regulation (EU) No 525/2013 of the European Parliament and of the Council.

196 (199)
using a dynamic model291, which consists of a long-term relationship
between total fuel consumption and the independent variables of price and
income and a more short-term dynamic relationship based on deviations in
fuel consumption from the long-term relationship and/or changes in any of
the underlying variables between the preceding and current time period
(short-term dynamics). Annex 2 to Sweden’s 2013 notification relating to
Article 7292 provides a detailed description of the model, which is used to
estimate both long- and short-term price elasticity, and of the simulations
carried out in 2013 relating to energy saving as a result of higher rates of
taxation in Sweden compared to the minimum levels of taxation set by the
EU. In 2019, the Swedish Energy Agency estimated new elasticities for
petrol and diesel in the transport sector. The present effect calculations are
based on these elasticities. The Swedish Energy Agency’s 2019
memorandum293 includes data, the results of the estimates, discussions and
possible applications for the new elasticities.
The 2019 estimates of price elasticity show that a higher petrol price reduces
petrol consumption, and that a higher diesel price reduces diesel
consumption. The results also show that – as expected – petrol and diesel
are substitutes in the long term. This means that, everything else being equal,
higher petrol prices result in increased diesel consumption. Naturally, this is
interpreted as meaning that some substitution occurs from petrol cars to
diesel cars. The reverse is true with regard to high diesel prices. In this
respect, it is particularly relevant to consider cross-price elasticity for petrol
and diesel when calculating the cumulative energy saving of high petrol and
diesel prices.
The estimated and processed elasticities from 2019 have been used to
calculate the energy saving resulting from the fact that VAT and energy and
carbon taxation levels in Sweden are higher than the minimum levels of
taxation set by the EU and that, in combination with other complementary
instruments, this triggers a reduction in energy consumption compared with
the situation if these instruments were not in place. These calculations also
account for the fact that the Swedish VAT rate is higher than the minimum
taxation level set by the EU (25% compared with 15%).
The only difference between the reference scenario (EU) and alternative
291 The model was developed by professor Runar Brännlund at the Centre for Environmental and Resource Economics, CERE, Umeå University (www.cere.se), and is
described in more detail in the report The effects on energy saving from taxes on motor fuels: The Swedish case, CERE Working Paper 2013:6. 292 The Ministry of Enterprise, Energy and Communications, Plan for implementing Article 7 of the Energy Efficiency Directive, 5 December 2013, Ref. N2013/5035/E (in
part). 293 Memorandum of the Swedish Energy Agency, 2019: Method for calculating the effects of energy and carbon taxes on energy consumption. Reference number:
2018–12739.

197 (199)
scenario (SE) for energy saving simulations is the final consumer price of
petrol and diesel (including excise duties and VAT). The calculations are
based on an average price difference of 50% for petrol and 42% for diesel,
which is based on 2015 price levels. The calculations are based on the latest
available data, with that year then being used for the subsequent year. The
difference in fuel and energy consumption between the alternative and
reference scenario is calculated in line with this.
Table 2 (petrol) and Table 3 (diesel) show an estimate of the annual and total
cumulative fuel and energy saving in the transport sector during the period
2014-2030.
Table 2. Annual and cumulative energy saving for petrol in the transport sector.
∆P TWh/year
∆P cum. TWh
2014 -4.5 -4.5
2015 -5.1 -9.6
2016 -5.9 -15.5
2017 -5.4 -21.0
2018 -5.2 -26.2
2019 -5.2 -31.5
2020 -5.2 -36.7
2021 -5.2 -41.9
2022 -5.2 -47.2
2023 -5.2 -52.4
2024 -5.2 -57.7
2025 -5.2 -62.9
2026 -5.2 -68.2
2027 -5.2 -73.4
2028 -5.2 -78.6
2029 -5.2 -83.9
2030 -5.2 -89.1
Table 3. Annual and cumulative energy saving for diesel in the transport sector.
∆D TWh/year
∆D cum. TWh
2014 -0.2 -0.2
2015 -0.3 -0.5
2016 -0.3 -0.9
2017 -0.3 -1.2
2018 -0.3 -1.5
2019 -0.3 -1.9
2020 -0.3 -2.2

198 (199)
2021 -0.3 -2.5
2022 -0.3 -2.8
2023 -0.3 -3.1
2024 -0.3 -3.4
2025 -0.3 -3.7
2026 -0.3 -4.1
2027 -0.3 -4.4
2028 -0.3 -4.7
2029 -0.3 -5.0
2030 -0.3 -5.3
The calculations carried out by Sweden in 2013 are based on available
statistics prior to 2014. The results in Table 2 and 3 are based on the latest
available statistics prior to 2019294. The price elasticities used relate to the
period 1976-2017295.Certain simplifying assumptions are made regarding
input data as compared with the 2013 calculations296.
A conservative estimate of the cumulative energy saving for petrol and diesel
in the transport sector as a result of Swedish instruments for the period
2014-2030 of approx. 95 TWh can be obtained from the sum of the results
in Table 2 and Table 3. A conservative estimate of the cumulative energy
saving for the period 2021-2030 is approx. 56 TWh. It should be noted that
the calculations do not currently give consideration to the reduction
obligation scheme. This scheme increases fuel price at the pump, which may
therefore be relevant to a future analysis of the effects of this instrument, in
the same way as for taxation. The estimated energy saving reported for the
transport sector is thus to be regarded as low. All data are updated on an
annual basis by the Swedish Energy Agency in conjunction with the
publication of new official statistics. The Swedish Energy Agency will also
work to develop the calculation methods further, as they underestimate the
effects of taxation at present. In connection with the reporting of energy
savings achieved pursuant to the EU’s Governance Regulation297, the
calculations may be updated.
Energy saving in other sectors
The energy saving in industry and agricultural sectors was calculated in
294 Calculation data are available at the Government Offices, Ref. I2019/00931/E. 295 Memorandum of the Swedish Energy Agency, 2019: Method for calculating the effects of energy and carbon taxes on energy consumption. Reference number:
2018–12739. 296 The assumptions and requirements for the 2013 calculations are described in Annex 1 to the Memorandum of the Ministry of Enterprise, Energy and
Communications, N2013/5035/E: Notification of Sweden’s plan for implementing Article 7 of the Energy Efficiency Directive, 2013. 297 Regulation (EU) 2018/1999 of the European Parliament and of the Council of 11 December 2018 on the Governance of the Energy Union and Climate Action,
amending Regulations (EC) No 663/2009 and (EC) No 715/2009 of the European Parliament and of the Council, Directives 94/22/EC, 98/70/EC, 2009/31/EC, 2009/73/EC, 2010/31/EU, 2012/27/EU and 2013/30/EU of the European Parliament and of the Council, Council Directives 2009/119/EC and (EU) 2015/652 and repealing Regulation (EU) No 525/2013 of the European Parliament and of the Council.

199 (199)
Sweden’s 2013 notification. A simpler linear model is used, where the price
difference resulting from the higher levels of taxation in Sweden is
multiplied by the long-term own-price elasticities for various fuels in order
to determine the long-term decrease in demand. By assuming a linear
increase in effect across the seven years of the period up to full effect in
2020, the long-term annual and cumulative energy saving during the period
2014-2020 is estimated to be approximately 3 TWh (cumulative 12 TWh) for
the sector of industry forming part of the EU ETS and 0.34 TWh
(cumulative 1.4 TWh) for the sector of industry not forming part of the EU
ETS. For agricultural sectors, the long-term saving is estimated to be
0.54 TWh (cumulative approx. 2 TWh). The effects are calculated for
different sectors and activities. The price elasticities used represented an
average value for various sectors and were based on data relating to the
period 1990-2004.
Effects in industry and agricultural sectors have not been calculated for
2021-2030, as previous calculations resulted in relatively small effects
compared with the housing and services and transport sectors. Agricultural
sectors have relatively low energy consumption and are subject to both tax
deductions and exemptions. Industry also continues to be subject to
relatively large tax deductions and exemptions, but there are industries that
do pay tax and carbon tax deductions and exemptions have also decreased in
recent years.
The fact that the effects of taxation in the aforementioned sectors has not
been calculated is another reason why estimates of energy-saving effects as a
result of energy and carbon taxes in Sweden are conservative ones.