SW P1 1 1 - World Bank Documents and Reports
82
This paper is prepared for staff use and is not for publication. The views CAtAL0O No. 156 expressed are those o.' the author and not necessarily those of the Bank. INTERNATIONAL BANK FOR RECONSTRUCTION AND DEVELOPMENT INTERNATIONAL DEVELOPMENT ASSOCIATION INTl Economic Staff Working Paper No. 111 SW P1 1 1 July 26, 1971 R RECONM* v: gn. N U1 VLPEWT WASIIINGTQN, D.C. 20161 The Economics of International Trade in Cotton-Type Textiles This paper examines the major elements of comparative advantage which presently favor the development of the textile industry in developing countries and account for developing countries' success in exporting cotton ard cotton-type textiles to industrialized countries. It then seeks to assess whether technological changes which are now taking place, or which are soon likely to take place, will lead to an erosion of such comparative advantage. Policy options for both the developing and the industrialized countries are then discussed. Mr. Shepherd is completing a thesis on textiles at the Centre for Contemporary European Studies, University of Sussex. He wrote this paper while attached to the Industrialization Division of the Economics Department in the summer of 1970. He will be joining the Young Professional Program in September 1971. Economics of Industry Division Prepared by: Geoffrey Shepherd Public Disclosure Authorized Public Disclosure Authorized Public Disclosure Authorized Public Disclosure Authorized Public Disclosure Authorized Public Disclosure Authorized Public Disclosure Authorized Public Disclosure Authorized
-
Upload
khangminh22 -
Category
Documents
-
view
1 -
download
0
Transcript of SW P1 1 1 - World Bank Documents and Reports

This paper is prepared forstaff use and is not forpublication. The views
CAtAL0O No. 156 expressed are those o.'the author and notnecessarily those ofthe Bank.
INTERNATIONAL BANK FOR RECONSTRUCTION AND DEVELOPMENT
INTERNATIONAL DEVELOPMENT ASSOCIATIONINTl
Economic Staff Working Paper No. 111 SW P1 1 1July 26, 1971 R
RECONM* v: gn. N U1 VLPEWTWASIIINGTQN, D.C. 20161
The Economics of International Trade in Cotton-Type Textiles
This paper examines the major elementsof comparative advantage which presentlyfavor the development of the textileindustry in developing countries and accountfor developing countries' success inexporting cotton ard cotton-type textiles toindustrialized countries. It then seeks toassess whether technological changes whichare now taking place, or which are soonlikely to take place, will lead to an erosionof such comparative advantage. Policy optionsfor both the developing and the industrializedcountries are then discussed.
Mr. Shepherd is completing a thesis on textilesat the Centre for Contemporary European Studies,University of Sussex. He wrote this paper whileattached to the Industrialization Division ofthe Economics Department in the summer of 1970.He will be joining the Young Professional Programin September 1971.
Economics of Industry Division
Prepared by: Geoffrey Shepherd
Pub
lic D
iscl
osur
e A
utho
rized
Pub
lic D
iscl
osur
e A
utho
rized
Pub
lic D
iscl
osur
e A
utho
rized
Pub
lic D
iscl
osur
e A
utho
rized
Pub
lic D
iscl
osur
e A
utho
rized
Pub
lic D
iscl
osur
e A
utho
rized
Pub
lic D
iscl
osur
e A
utho
rized
Pub
lic D
iscl
osur
e A
utho
rized

TABLS OF CONIT&Sr
Introduction
1
I Comparative Advantage in the Present and Recent Past 4
II Comparative Advantage in the Future 23
III Policy Options for Developing and Industrialized
Countries 42
Annex: Factor Intensity and Comparative Advantage 1 - 8
List of Tables

INTRODMCTION
1. The problems of international trade in cotton-type textiles arewell known. Some developing countries have capitalized on comparativeadvantages to make cotton textiles one of their msst successful manufacturedexports to industrialized countries whilst the latter have set up an arrayof restrictions to protect their own cotton industries. International tradein cotton textiles between industrialized and developing countries continuesto be controlled, in a departure from G.A.T.T. free trade princip2es, bythe Long Term Arrangement for International Trade in Cotton Textiles.Pres.sure is now building up, notably in the Unit.ad States, for a similararrangement, whether at the national or international level, covering man-made fiber and wool textiles. I/ Textiles are a major problem in inter-nation.a trade threatening repercussions in other branches. This paperaims to examine the economics of international trade in cotton-type textilesin order to clarify some of the issues involved in this departure from free-trade assumptions.
2. Thn main reasons for the successful ir4Oinntation and exportactivity of cotton industries in some developingt *.ounlries are well known.There may be some grouncis - mo.tly the chainging technology of the industry -for industrialized countries niaiming that. this comparative advantage isnot applicable to .ae future. Many industrialt7e1 countries seek to protecttheir cotton industries not only on these grounds" hut also on the groundsthat the adjustment implied in acceding to a changing international divisionof labor would cause too many domestic problems.
3. Several long-term issues appear to be involved. Their analysisseems relevant not only for textiles but also for any other export industrieswhich developing countries might eventually move into as a group. Fortextiles industrialized countries may have to think in terms of three broadfuture possibilities. If it is decided that 1hb advantages of pursuing Lheinternational division of labor are outweighe1 oy the costs of adjustment,industrializnd countries might continue to protect their uncompetitiveindustries. The two broad alternatives to t.'" are for the cotton industriesof industrialized countries to become internationally competitive or forindustrialized countries to abandon, partially at least, activity in thecotton industry in favor of an industrial activity more suited to theirendowments, real wage rates and investment policies.
4. This paper seeks to maXe some contribut'on to such a long-term lookat the cotton industry by diecussing three related issues. In Part I thebases of the comparative advan+goe %h1ih developing countries presently enjoyin cotton textile production are discussed. tar LI treats the possibilitiesof reversal or erosion of this comparative advantage. This might come about
1/ See parit.i Of Exports of Cot.ton Textiles fromn Develoning Countries to theEuropean Economic Communitz and the Jnited_Kin do -9-197, EconomicsDepartment Working Paper No. 52.
through rapid technological 1evelopoents in the cotton infdstry which wouldrender it relatively capital-Intensive and more suited to thc economicposition of lndustriliyied couritrie3. it might happen through changingpatterns of consuiptioii in theae countrios favoring textile products which,again, were more suited to production in industrialized countries. InPart III the conclusions to this examiriation of possiblo changes lead intoa discussion of the various policy tecnniques and opportunities open toindustrialized and developing countries. 1/
5. Although initially _oncerned with prospects for developing countrLes'exports of manufacturei to industria2ized countries, this paper concentrateson the problem from the point of view or tndustriaaized countries. Develop-ments in these countrie3 determine market prospects for developing countries.However, a modicum of discussion from a developing country viewpoint isinevitable as all devolnpingr *: ntries are not equally competitive in cotton-type textiles. Discu:;: -.:n cf e.niparative aovantage deriving from differentfactor endowments has tradltlioa,..ly iLuen conceived of in terms of two-countrymodels uid, partly by exlensi,n, in terms of two homogeneous groups,industrialized and ,' vur!a,: couintries, but this degree of simplification isunrealistic in a stuty o. int,brn.otxona. trade for a specific product. Thereis a continuuim of levels of 'l.-velopment as well as a multitude of combinationsof factors and conditionn of p,roduction which means that certain developingcountries are better placed t-han othere to compete in world markets. Whilstthe term develorping cr)untr2ea will be considered -.n this paper as a more orless homogeneous natpgory in the more general discussion of comparativeadvantage 2/ it will !be ne-essary in a suhsequently more precise discussionof the locaLion of comparative advantage t. distinguish between tha mor3advanced of these, the so-called vemi-industrialized countries, 3/ and theless advanced.
6. Data is mainly taken from industrialized countries though someinformation on production costs will come from some developing countries.Data will be derived from censuses and surveys of manufactures which, sincethere is a relative paucity of up-to-date historical series, will be supportedwith more qualitative material. Much of it comes from three countries only -the United States, Canada anrl the United Kingdom - because census and otherdata about changes in the cotton industry seem more readily available than
I/ In this paper comparative advantage is generally equated with realizedcomparative advantage (or cost competitiveness). The section on thelocation of compara.ive advantage is in a sense a discussion of underwhat conditions potential becomes realized comparative advantage.
2/ Developing countries cover U.N. Economic Class II together with theSouthern European countries excluding Italy. See para. 8 of EconomicsDepartment Working Paper No. 52.
3/ Japan, though an industrialized country, has sufficient in common withsemi-industrialized countries, relatively low wages and high productivityand consequently large textile.exports, to be discu3sed in conjunctionwith these countries.

from other industrialized countries. 1/ It was felt particularly importantto review developments in the U.S. and Canada, the highest wage countries,whilst the U.K. provides a useful contrast in that its cotton industry 2/is to acne extent typical of those of Western Europe (and different fromthose of North America).
7. Although the exports of developing countries have been traditionallybased on cotton, man-made fiber textiles are becoming an increasingly importantpart of international trade in textiles. Alt.hough the cotton industry inindustrialized countries is increasingly losing its icentity within an over-all textile industry, it is felt justified to continue to talk of aseparate cotton industry. The cotton industry sLill does have some id3ntityin industrialized countries. Moreover, it has a clear identity and tenidscompletely to dominate other textiles in devaloping countries; this isreflected in the predominance of cotton-type textiles in the developingcountries' textile exports. A discussion of the cotton industry cannotafford to ignore developments in two related industries, man-made fibers a3a supplier industry and apparel as a customer industry. These will bediscussed, albeit in more general terms, along with the cotton industry.
8. Finally two assumptions concerning economie development indeveloping countries underly this paper. First, exports of manufacturesfrom developing to industrialized countrles can be beneficial to bothparties. This ib often being called Into question more frequently by theformer and intra-developing couintry trade is prpoennd as an alternative. Y6tthey are not mutually exclusive. It is assnimnd thnat exports of manufactureshave an important role to play in earning foreign exchange to permit the,)urchase of goods and know-how only available from more advanced industrialeconomies.
9. The second assumption is that the ;tt.ttg .,p of an industry forexport such as the cotton textilo iriduntry which is typically labor-intensivedoes lot run counter to development strategie.5 whicfth may ror instance bebased on capital-intensive indlintries. Now. tho'e is a very real danger ofdomestic development strateg5es n'vprsely affecting nn industry's capacityto export but it is felt thAt the two rdevelopment pathnt are not necessarilymutually exclusive. Moreover, a ttellinp, argument. is that the cotton industryis alreadty in place in many developing countries and .as proved to be botha "natural" import substitution and export industry.
1/ The U.K. is relatively rich in published informttion on the textile industrywhilst published information from North America was supplemonted byinformation sought directly from texti3e eom .n.es and other textileinterests.
2/ In this paper the cotton -_y.Lonm processing indu:.r.ry will be referred to,irrespective of the fiber processed, as the cotton industry.
I. COMPARATIVE ADVAZ'TAGE IN TiE PRESWNT AND RECENT PAST
10. This part of the paper will seek to establish the major elementsexplaining the general export success that certain developing countries haveachieved today in cotton-type (mostly cotton) textiles. This will beessentially a static view of intornational competitiveness whilst Part IIwill be a drnamic view, looking at the same trade determinants and askingwhether any changes in international competitiveness can be predicted.
11. The elements of comparative advantage are that bundle of factorswhich give certain countries absolute cost advantages in certain products.Comparative advantage, baesd on many - and not all measurable - factorsbecomes translated into absolate advantage by means of the exchange rate. 1/Part I will firstly discuss the most important elements of comparativeadvantage and, where possible, attach some measure to them. Its approachwill be very general in that countries will be regarded in the two broadgroups of industrialized and developing countries. Secondly, a discussionof the available cost information will seek not only to confirm the findingsof the earlier discussion, but also to locate comparative advantage moreprecisely, to see for instance which developing countries have the greatestcomparative advantage ,;nd to offer some reasons for this.
The Sources of Co2merative Advantage
12. The theory of internal.ional trade determination is at present anarea of great dispute. It is not the intentJor here to discuss this theoryin depth, but, in brief, in the last few years the theory of comparativeadvantage stemming from different factor endowments (principally labor andcapital endowment,), which huas been the prinelpa) theory of trade determinationfor much of the c -tury, has increasingly come under fire because it did notseem to correspcld to the real internationa] trade eituation. For instancethe fastest groith in internwitional trade has been observed to occur betweenindustrialized countries with similar factor endowmonts, instead of betweenindustrialized and developing countries where 1raditional comparativeadvantage theory might have suggested 'he greatest benefits from trade,thanks to the widely different factor endowments of the two groups. As aresult new theories of trade determination have been advanced. Many of thesetend to have supplemented, qualified or simply redefined the traditionaltheory rather than to have replaced it. For instance the traditional viewof comparative advantage in terms of two homogeneouxs inputs, labor and capital,has been criticized as an oversimplification and further factors have beensuggested such as natural reaources, technological capital and entrepreneurahip.
1/ See para. 33. The best measure of comparative advantage, though notnecessarily an indicator of the sources or this advantage, would beabsolute costs over the whole range of internationally traded productsbut these are not of course available.

The theory has also been criticised as being too static and not allowing forchanges in comparative advantage. 1/
13. For the purpose of this paper it will be postulated that thedeterminants of international trade aro many and often complicated, thoughsome are clearly more important than others. If this is an "ad hoc"approach to theory, it reflects the current, confused state of the theory.Essentially it postulates that the theory of comparative advantage, whichemphasizes the relative scarcity of capital and 3abor in different countries,is very relevant in certain prod'cts, including cotton-type textiles, thatare traded between industrialized and developed countries 2/; at the same timeadr4.tionnl, qualifying theories of trade determination are reflected in theadditional important elements of comparative advantage which are set outbelow. Many of these additional determinants result from modifications ofthe implicit assumption of traditional comparative advantage theory that thereis free trade: this theory tends to ignore barriers to trade arising fromcommercial policy (of importing and exporting countries), psychologicalattitudes and costs of transport and communications. 3/
314. The following are postulated to he, the major overall determinants(in terms of industrialized and developing countries as groups) of comparativeadvantage in internationally traded manufactures and to specifically accountfor cmparative a'4 wantage in cotton-type textiles: 4/
i. Fac.or-intensity in tnerms of lhuman (lahor and entrepreneurship)and physical (innorporating technological) capital: traditionally the cottonindustry has required comparatively low levels of capital intensity.
ii. The supply conditions or inputs: the cotton industries ofdeveloping countries have in the past either been partly resource-based orat least obtained inputs at world prices.
iii. The nature of the product, determining both the size of theoverall market and the product's suitabilit.y for international trade: cottontextiles have been, frma the point of view of patterns of demand at lowincome levels, a prime candidate for early import substitution in developingcountries and they arm, from the point of view of foreign demand mostly ahighly standardized, hence tradeable, product.
iv. The scale factor: although most countries (includJng manyindustrialized countries ) have failed to achieve optimal scales of production
1/ See para.l of Annex, Factor-Intensity and Cor.orativa Advantage, which liststhe major restrictive assumptions of traditional comparative advantage theory.See also H.G. Johnson, Comparative Coat and Commercial Policy ThnorY fora Developing World Econony, Wick-r;tu Stockholm, 1968, for a reviewof the current state of international trade theory.
2/ See Annex, paras. 6-12, for a justification of this approach.
3/ In some waya the theory would seem to bo of more value in a normative thana positive context.
hi/ The ranking implies no order of importance.

in the cotton InjuotLry, 3ac hiats not proven a specially . -Fdvantageousfeature to doveloping countries in establishing cotton industries andexpor 4 ing their prodSuct.
v. The structure of the industry in terms of the factor-intensitycompatibility of its component parts anid the effect of the physical structure(the horizontal versus the vertical organiz.atien of the industry) cn exportand import prospects: not only have some of the cotton industries ofdeveloping countries been able to profit from the labor-intensity of agparelindustry and thus maximize their comparative advantage, they have alsobeen able to profit fromn a tendency for horizontal organization in the cottonindustry, its customer industries and related chains of distribution toencourage imports in preference to domestic 3upplies.
vi. Monopoly: neither scale, terhnological factors nor supplyconditions of inputs have ereated monopolistic conditions in the cottonindustry which might have been exploited by industrialized countries. 1/
vii. International factor movexments: these have been comparativelysmall in the cotton industry.
viii. Protectiun: thia has tended to be higher for cotton-typetextiles In indust-riali ed countries than tor other manufactures and hasclearly inhibited exrorts from developing countries. However, it is a clearconsequence of the overall comparative advantage enjoyed by developingcountries. 2/
15. It is proposed to pay particular attention to the first element ofcomparative advantage, factor-intensity since this is demonstrably a veryimportant element and to make some detailed assessments of labor-inten3ityin cotton-type textiles. Following this, some of the remaining elements ofcomparative advantage will be discussed, perforce in qualitative terms.
Factor-intensity in the Cotton Industry
16. The annex to this paper, Factor-intensity and Comparative Advantagesfirstly establishes through the work of Hal B. Lary, the use of value addedper e- yee as a measure of the value of human and capital servicesrequii.. -i different indus,;ries and therefore as a useful guide to themeasur',1.i,".t of factor-intensity in manufacturing industry. 3/ Secondly, itestablishes, on the basis of some empirical work by UNCTAD, the importanceof f%ctor-intensity aB a determinant of the export success of developing
I/ The advent of man-made fibers has changed both the supply conditions ofinputs and the monopoly aspects of international trade in cotton-typetextiles but such changes are considered in Part II since the presentstatic view of comparative advantage mostly concerns deve'loping countries'export success in cotton textiles.
2/ This aspect of comparative advantage has been covered in the EconomicsDepartment Papers on U.K., E.E.C. and U.S. imports of cotton-type textilesbut will again be referred to in Part III.
i/ See Annex, paras. 3 to 5.
- 7 -
countries in certain manufactures amongst which were cotton fabrics, clothingand non-cotton fabrics. 1/
17. The measurement of factor intensity with value added data shouldbe qualified in the case of textiles. Possibly lower-than-average rates ofunionization (or of union activity), employment of a high proportion offemale labor and the tendency of textile industries to be situated in areaslacking alternative employment prospects may help to depress wage valnieadded. 2/ Low profit levels, low levels of advertising and R & D expenditaremay have a similar effect on non-wage value added. On the other hand level,of protection, which are generally higher than in other industries, may havean opposite effect. 3/ In spite of these qualifications, value added figuresprovide the best available source of information on comparative factor-intensity in the cotton industry. [L
18. The proposed measurement of factor intensity is simple. Valueadded per employee iTn the relevant textile branches will be expressed as apercentage of average value added per employee in all manufacturing. Itshould be stressed that this approach cannot give the precisest of indicationsof the location of comparative advantage, not on'y ior reasons of theinaccuracies inherent in value added figures bu%. Lor two other main reasons.Firstly, it is insufficient to assume that an industry in an industrializedcountry which is loss capital-intensive than the average (i.e. 100 per cent)will, all other thirngs being equal, cede a comparative advantage to developingcountries. The "cut-off" point may have to be as low as 60 par cent of theaverage before the effects of labor-intensity can be strongly felt; but thiswill differ over time and fram industrialized country to industrialized
1/ Ibid., paras 6 to 12. This evidence is reinforced by attitudes pruvalentin the cotton industries of industrialized countries: it is felt that,since the labor-intensity of the industry is at present the greatestdisadvantage facing these industries in industrialized countries, asuccessful attempt to make the industry relatively capital-intensivewould solve the problem of imports in industrialized countries.
2/ In som European countries imwigrant labor is employed in the cottonindustry at rates above the national average, probably with similareffects.
3/ It has been held that the general downward price movement of textileproducts may have depressed textile value added but such movements caneither affect profit levels - in any case low in the cotton industry -or themselves be the result of productivity gatrjs or falling input prices.
is Since moreover the qualifications tend not to have become more pronouncedover time, they will not vastly upset a view of changing factor intensityin the cotton indistry as measured by value added data over time.

country, and will depend upon the st-ate of industrialization of developingcountries. Secondly, the inclusion of all manufactures in, an attempt tomeasure comparative advantage tbased on factor intensity is strictlyunrealistic because of the "ailings of tls factor intensity theory.Measurement would be improved, for ins;ance, by excluding resource-basedindustries and possibly non-standardized goods industries, if this could beaccurately done. 1/
19. Value added figures are derived from censuses and surveys ofmanufactures; the former are generally more accurate than the latter as theyare carried out on a complete enumeration, as opposed to a sample, basis butthe accuracy of either will vary from country to country. It is proposedfirstly to present the data in an internationally comparable fornm and second2yto present the data that Is available from industrialized countries in areasonably detailed form.
20. The only large scale exercise in the presentation of internationallycomparaole census data is provided by the U.N. in its Growth of World Industryseries. Table 1 is drawn from this source and gives the value added peremployee ratio for spinning, weaving, finishing, 2/ and for the clothingindustry for selected years from 1953 to 1967 for-somo of the countries,industrialized and developing, most concerned in international trade intextiles. The major conclusions to be drawn from the table are that, ingeneral hoth apinning, weaving, finishing and clothing are well belowaverag ._iels of capita.L-intensity in manufacturing, more markedly in thecase of Industrialized than developing countriee, 3/ and more markedly inthe case of clothing than spinning, weaving, and finishing. What the tabledoes not show is which other industries might come lower in the factor-inten3ity league. Hal B. Lary's comparison of 13 major manufacturing industrygroups for nine countries showed textiles and apparel to be the two lowestranked industries in industrialized countries whil t in developing countriesthey tended to dispute bottom place with furniture tid leather. 4/
1 It could be even further argued that certain internationally tradedservices should be included.
2/ This aggregates 3 processes and gives data for the whole textile industry,but given * i- -- 'rities of, say, wool and cotton weaving this shouldnot over- Fe rosult.
3/ The facto ty of textiles in developing countries is nearer theaverage pr ,..1l due to the greater weight of labor-intensive industries,especially textiles, in total manufacturing.
h1 Hal B. Lary; Imports of Manufactures from Less Developed Countries, 1968,see charts 8, 9 and 10, pp. 67-69.

- 9 -
21. Navionally published censuses provide more detailed informationconcerning the factor-intensity "league". Information is presented forthree industrialized countries with large cotton industries, the U.K., theU.S. and Canada, which have detailed, historical and up-to-date censusinformation and it is hopes that, along with the U.N. figures, these willsuffice to establish a valid picture for other industrialized countries.
22. Of these three countries the information provided by the U.K. isthe most detailed (see Tables 2 and 3). Table 2 establishes, from thebreakdown of about 100 U.K. industries, which of these are at comparablelevels with, or lower levels than, the f;ctor intensity of the relevantbranches of textiles ai.d clothing. It will be seen that te2tiles, andclothing even more so, are very near the bottom of the factcr-intensityleague. 1/ Moreover, inasmuch as total value added in 1968 (last column)is a guide to the size of domestic markets for given products 2/, it wouldseem that the size of markets of labor-intensive industries outside textilesand clothing is limited. The exceptions are bread and flour confectionery,which, by its nature, is not a candidate for significant international trade,and biscuits, footwear and pottery.
23. The U.K. additionally breaks down cereits data into finer detailthan at the three-digit industrial classification of Table 2. Table 3 givesthis breakdown for the principal activities of the cotton industry accordingto process and fiber input. 3/ Table h and 5 give comparable, if lessdetailed, information for the :. 'ted States and Canada. Both these sets ofdata are more complete, in terms .- annual coverage, than the U.K. data. V/
,h. From these three sources a general picture of relative factorintensities emerges. The clothing industry is clearly the most labor-intensive of the industries under consideration. The U.K. censua also putshousehold textiles in the same area. 5/ Spinning and weaving are slightly
1/ Of course if th6 industry breakdown were even more Ietailed according tocomponent processes in any one industry, such processes as assembly maywell come to be very labor-intensive.
2/ The value added figu.-e understates the domestic market weaving wherethere is a very large unfavorable trade balance.
3/ Detailed figures from the 1968 census are not yet available.
1* For Canada there is an annual census of manufactures and ror the U.S.there is an annual survey and quinquennial cor..;us of manufactures.
5/ In North America, and to - ..;-ge extent Europe, the household textilesindustry does not have .. ;c-ntity separate from that of the cottonindustry since the r3la-.vely simple cutting and hemming operations canbe conveniently carried out in cotton mills.

more capital intensive but at leve's Compa-hble with each other. Finishing,though less capital-intenmive than the -.nulf'aturing average, comes outclearly as the cotton inrdustry's most cau- :.i;-nt.ensive operation.
25. The cotton industry'3 processiiug of man-made fibers ter.ds to bemore capital-intensive thar. that of cotton. The U.S. data suggests that thisis most marked t.. fiii 'hing. This wc,uld seem reasonable because differentfibers r7quire definite modi"ications in this process. However, at thespinninr and weaving sLdges the processes are ulmost identical and thedifferences in capital-intensity are probaLly more apparent than real. 1/One reason for this maiy be that the monopoly aspects of man-made fibersupply, together with the continuing large-scale practice of fiber brandadverti:oing have combined to lend a monopoly aspect to man-made fibertex iles. Another reason may be that since man-made fibers have generallybeen more expensive than cotton, they have tended to be used in higherquality textiles requiring greater skills in production and more complicatedequipment.
Other Determinants of CULInP.WAL: ve Advantage
26. In several developing countries, principally Mexico, U.A.R., Turkey,India, Pakistan and Brazil, the cotton industry is a partly resource-basedindustry in the sense t.hat these countries grow cotton in quantity. Whilstthe resource-base may have been irstrwnental in the establishment of theindustry, there is little reason to suppose that it play3 an important positiverole in internatiopal competitiveness in cotton textile3. For instancesuccessful exporting developing countries of SouthoasG Asia, do not growtheir own cotton. In fact a rt Airce-base might prove a liability, eitherwhere a country cannot produce cotton at world prices or where the existenceof cotton growing might lead to protective barriers against imports of man-made fibers for textile processing and re-export.
27. A barrier to international trade which has interedted economistsin recent years is that caused by dirferent patterns of demand in differentcountries. In fact it has been suggested that similaritie3 in patterns ofdemand between industrialized countries account for the faster growth of tradebetween these countries than that between industrialized and developingcountries. This particular barrier would seem to be less of an obstacleto exports from developing countries in textiles than ir. other products sincedemand for textiles is a primary demand felt even at comparatively low incomelevels. It is of course true that low-income demand may be for coarse,
1/ A sma2-. part of the explanation may lie in the fact that man-made fibersor blends (e.g. polyester-cotton) require slightly more air-conditioningor slightly more sophisticated blending equipment than cotton alone. Orthe other hand man-made fibers are generaL,y sulbject to fever breakagesthan cotton and are less costly to ,lean.

- li -
stannardized textiles whilst high-incomo demand miay h-. -.or high-quality,
fashion textile's but the axistence cf a textilo ,n_us.ty to satisfy the
form2er needs creates the possibility of an expcrt :r..- . at least
itl standardizsd goods. As in the case of resource-cnre.y.r.ent. exp rting
on the basis of a home mark-3t is not an unqualified advantage. Itnilst the
home market may be very important in the initial establishment oi the
industry, it by no means necessarily centributes to the industry's ability
to corn-te internationally.
21. One can expect developing co;:ntries to export standardized goods
more easily than non-standardized goods to markets whnrri di-stance, sophisticated
tastes and great nroduct differentiation might require certain additional
market. research skills of exporters i.e. where there is a high cost of entry
into new m.arkets: cotton-type textiles, especially in the yarn and grey
cloth stare and in some cases in the finiehed cloth aid made-up stage, are
highly standardized, either in the sense that tb-ra ir a mtall number of
very in:prortant, product types or in the sense th2t. proc-Jet types are nasily
and precisely specifiable. This featurs of the product nas undoubtedly
contributed to the export success of dGvel.oping countries: for instance
st.randardi%a4 nn has allowed importing agenciese n some industrialized
c:-irtries 1/ to seek out new sources e^ textile imports and there has been
no cost of entry for new suppliers. However, thp f'nshion (anc rat+inna. taste)
element which is rore or less present in much of finish-3d clot-., and made-
up goods sets cer.. n limitat.ions to the advantages of standardiz-.tion;
although certain lines in these products are standardized, for instance many
household textiles and lower-end-of-the-market clothing, trade barriers auch
a:; the cost of communication and entry into new markets reassert themselves.
29. There is in the cotton induistry, especially 5.n finishing, a certain
scale of production which developing comtries, and indeod most industrialized
countries, do not lways ach.ieve. 2/ A typical optimal scale is quoted
today as being foi- spinning 30,OOO7to hO,ooo spindles and for weaving
standardized goods up to 500 conventional modern looms. A finishing unit,
1/ Princip.ally cloth converters and importers and, large retail purchasing
groups such as department stores.
P/ The work on compar-ative advantage in the Annex, based on UNCTAD work,
includnd a test for the effect of a scale factor (value added par establish-
ment). It was concluded that the smaller the optimal. scale of an industry,
the botter a developing country's performance. however, ths result was
fairly weak, both in terms of the size of the regression coefficient and
of the estimated sLanuiard error. In any cajc, ..no subse.nuent exclusion,
from the sample of 57 products, of nine clearly resoirrce-based products
weakened the regression coefficient (see Table A-i).

- 12 -
however, might require the output of up to four optimally sized weavingsheds 1/. In spinning and weaving there is little to suggest that thefailure to achieve optimal scale of production significantly erodes thecomparative advantage of developing countries. However, it may well bethat the higher optimal scale of finishing, together with the high capital-intensity of the process relative to spinning and weaving, and the natureof the market for finishcsd cloth, contributes to the lack of competitivenessof many developing countries in cloth finishing. There is one clear instancewhere this failure may be important: the cotton industry of North Americagenerally operates at optimal scales and this is one of the important reason3why it can to some extent compensate for its large disadvantages stemmingfrom high wages. However, whilst North America can to some extent overcomeits wage disadvantages vis-a-vis Western Europe, it is unable to do so vis-a-vis the most competitive developing countries.
30. Apart from the general effect that various natural ind imposedbarriers have on overall levels of trade, there is probably a secondaryeffect on the structure of trade. It would seem reasonable to suppose thatsuch barriers tend to encourago trade later rather than earlier in thevertical stages of production of a final product. In this way, for instance,transport and foreign selling costs per unit of value added could be minimized.This would suggest that compatibility in the factor-intensities of verticallyrelated production processes might increase overall comparative advantage.In the case of textiles there is a strong compattbility in the major processes.The following table gives a typical value added breakdown and factor intensityranking for the various stages of making a finished item of clothing in anindustrialized country (the figures should be taken as very broad indications): ?
Share in total Value added per employeevalue added (manufacturing 100)
Spinning 15 60Weaving 20 60Finishing 25 75Making-up h0 55
-aigu 62 (average weightedby share of valueadded)
1/ Textile Council, Cotton and Allied Textiles, Vol.I, 1969, paras 335 and 336.In spinning and weaving optimal size tends to reflect managerialconsiderations whereas in finishing it tends to reflect technicalindivisibilities.
2/ Based on orders of magnitude suggested by cost studies (see for instanceTables 6 to 8) for fabrics in industrialized Western European countriesand for apparel making-up in similar countries ;from Profiles ofManufacturing Establibhments, Vol.II, U.N., 1968). Finishing costs varygreatly according to the finish: compared to total value added by spinningand weaving, a print finish can cost as much or more, a dyed finish cancost one half to as mucz, and a plain white finish (e.g. sheets) mig:ntcos' about one-third.

- 13 -
F'inishing is clearly the most capital-intensive operation and accounts forabout one-quarter of value added (but could according to the type of finishaccount for up to one-third). It is clearly the "weak link in the chain" offactor-intensity compatibility, but very labor-intensive; making-up on theother hand accounts for a substantial proportion of total value added and bringathe weighted average of value added per employee down to a low level. Thusthe factor-intensity structure of textile production would seem to suggestthat developing countries can maximize their comparative advantage byexporting as finished a product as possible; it provides a cogent explanationof why developing country cotton-type textile exports are concentrated inthe grey cloth and clothing categories, the two points of maximizedcomparative advantage in the vertical production process. In connectionwith this observation on factor-intensity compatibility, there is a prevalentattitude in the U.S. cotton industry that, even if the U.S. were competitivewith imports at the fabric stage, the developing countries' advantages inmaking-up would more than compensate and the U.S. iports problem wouldremain.
31. Traditionally the production, distribution and retailing oftextiles have been organized along predominantly vertical lines inindustrialized countries; hence one stage in the production process hasbeen able to freely seek its inputs from the cheapest supplier, in manycases foreign. If would be wrong to exaggerate the importance of this asa positive factor which particularly encourages textile imports sincesimilar situations prevail in other industries. However, in certain cases,most notably that of the U.K., the excessively horizontal organization ofthe industry has been attributed with a propensity to encourage importsmore than might otherwise be the case. 1/ Moreover, any moves towa-dsvertical organization may have a discouraging effect on imports, not ofcourse because the simple existence of a vertical firm would force certainstages of production to use uncompetitive domestic inputs, but becausecertain savinge such as reduced selling costs and, more importantly,increased control of production, quality and delivery dates would makedomestic products more competitive.
32. Neither monopolistic tendencies nor international factor movezuntsseem to havo had a great effect on international competitiveness in cotton-type textiles. Cotton industries, usually consisting of marn firms and oftensubject to comparatively high levels of importsp have not tended to acnopoly.
1/ In particular U.K. converters (merchants with little or no producingfunction) account for a larger (if falling) proportion of grey clothimports than merchants in other countries. IL has often been felt thattheir role in importing has aggravated the market disruption problem.See, for inatance, p. 83 of Caroline Miles, Lancashire Textiles: aCase Study of Industrial Change, 1968 for a description of their Fole.

International factor movements have also been comparatively small as regardsthese industries but two phonomena are worthy of note. There is a tendencyfor some European cotton industries to tlse large amounts of immigrant labor(often at higher than average national rates): this buttresses thecompetitive position of such industries which often suffer acute laborshortage problems, especially on the night shift. 1/ On tVe other handthe tendency for international movements of capital has been for industr alized(or relatively industrialized countries such as Hong Kong) to invest in low-wage countries: this has as yet only been an ip ortant phenomenon in itscontribution (mostly through Japanese investment) to the establishment ofcotton industries in Southeast Asia.
Absolute Costs
33. V It hardly needs to be said that businessmen do business on thebasis of absolute prices and costs rather than on the basis of comparativecosts. What needs to be made clear is the relation between the two. Thefollowing is a very simplified explanation of the relationship. 2/ In orderthat two countries can enter into international trade with each other, theymust in theory fix a currency exchange rate lying somewhere between theextreme points of the countries' comparative advantage and disadvantage inthe products to be traded. This means in theory that a country will alwayshave an absolute cost advantage where it has a comparative cost advantage.Thus the absolute cost advantage over industrialized countries that developingcountries might enjoy in saveral cotton textile products would reflecttheir comparative advantage 'n these products. A shift in the location ofcomparative advantage over time would be reflected either in cheaper costsin the country profiting from this shift, or in adjustment in exchange rates.This simple relationship may of course be largely distorted by elementswhich isolate economies from the world economy such as protection and multiple(and over-valued) exchange rates, etc.
34. Although businessmen trade according to prices, price informationin cotton-type textiles is often unreliable and in some cases can be criticizedas not reflecting real (long term) costs which are of course more closelyrelated to comparative advantage. Informati c on costs is rare. The onlyrecently published source of such information is by the U.K. Textile Councilwhich commissioned a study on international costs from Wierner Associates, Inc.of New York. Werner's study provided production costs for "upper quartile"mills (i.e. mills having lower total costs than three-quarters of the industry)in 10 countries for 4 yarns and 3 fabrics which were important in inter-nat'onal trads whilst the Textile Council Productiv.ty Center undertook theDams. exercise for tsie U.K. The data reflect costs in October/November 1967.
1/ For the U.K. see Appendix XXVI, "A sample survey of the labor force inspinning and weaving" in Textile Council, Cotton and Allied Textiles, Vol.I.
2/ For a fuller explanation see G. Haberler, The Theory or InternationalTrade with its Application to Commercial Policy, 1936, p. 131.

- 15 -
35. The Textile Council published the cost data in two forms. Itpresented the princ-pal Werner findings without alteration in an annex toits 1969 survey of the problems of the U.K. cotton industry. 1/ It tookthese same findings and modified them, principally by up-dating andstandardizing raw material prices, standardizing for each fabric the weightof yarn consumed per yard, and standardizing depreciation charges. Thesemodified costs were incorporated into the main body of the study and servedas the basis of calculation for some of the study's recommendations. 2/Given the difficulties and possiele errors involved in modification o? costfigures, it has been felt preferable to use the cost figures as supplied byWerner for this paper.
36. Tables 6 and 9 reproduce the figures supplied by Werner (and theTextile Council Productivity Centre) as set out in the Annex to Cotton andAllied Textiles. They are of course subject to the usual warnings aboutaccuracy, etc. 3/ Table 10 reproduces two additional tables from the studywhich relate overall costs to wage costs and productivity. Table 11reassembles the cost information of Tables 6 and 9 on an index basis for thesake of comparability. h/ On the whole the cost information gives a moreconfusing picture than census information. In particular it becomes clearthat the "expected" comparative advantage of tieveloping countries doies notmanifest itself in every case. However, a comparative advantage of developingcountries in spinning and weaving, more so the latter, is generallydemonstrable and t..rtain evident trends can be pointed out.
37. Clean fiber costs in Table 11 approximately represent the price ofinputs in the cotton industry. 5,' Even in cotton there are sometimes
1/ Textile Council, Cotton and Allied Textiles, Vol.I, Annex 1.
2/ For the modified costs see Chapter 5, "International Costs", of Cottonand Allied Textiles, Vol.1
3/ The opinion has been expressed that JApanese costs are particularly lowand may reflect export pricing more than domestic cost. The Indian cottonindustry ;.as felt that its costs should have been higher whilst othersources have felt that they should have been lower. Doubt has also beenexpressed about the comparability of Werner coats with U.K. ProductivityCentre costs.
W/ In this table Germany is used as the basis of the index since, of all thocountries under comparison it is one of the highest wage rountries. TheU.S. would have provided a better index basis exc'pt that width variationsin some of the U.S. fabrics make the cost information slightly moresuspect.
5/ But the clean fiber cost includes a small amount of preparatory processing.Also other inputs which "all under "supplies and maintenance" are notincluded.
- 16 -
surprising variations in th3s figure. GCnerrlly more labor-intensiveprocesses in low-labor countries a3low :;lightly lower quality cotton tobe processed but the saving is small. Houever, in two particular caseshigh-priced cotton inputs render the end-product uncompetitive. One..case is Portugal which is obliged to buy short staple cotton from its Africancolonies at high prices. The other case is India which pays way aboveworld pricus for lorng-staple cotton: thi:b helps make it uncacpetitive incombed cotton yarn.
38. In the same way India and Pakistan (and to a 16sser extent Portugal)are made uncompetitive in man-made fiber goods because of the high pricesthey pay for rayon and very high prices they pay for polyester. Thisreflects the disadvantage that can be incurred in protecting domestic man-made fiber industries.
39. In spinning the competitiveness of the developing countries in thecost study tends to worsen in higher counts. This might be expected since,the higher the count, the slightly more capital-intensive the spinningprocess. Also those developing cour,tries catering for a large home markettend to specialize in lower counts. Even at the lower of the four counts(20s and 32s) the developing countries' advantages would not seem to beoutstanding except in the case of Hong Kong. The information of Table 12throws some light on this since Hong Kong clearly combines low (though notthe lowest) wages wit.h 'iiglh productivity. This is generally true also ofJapan whose wage levels are njearer to the developing than the industrializedcountries of the cost co:nparison. rTh very low wages prevailing in Portugal,India and Pakistan are insuificient to offset their low productivity vis-a-vis Hong Kong and Japan. 1/
4SO. In weaving the developing countries an the whole show costadvantages, more strongly in the rayon and polyester/cotton fabrics thanin sheeting. 2/ Moreover, the developing countries other than Hong Kong tendto perform better in weaving than spinning. Except in sheeting thy clearlyhave lower costs than almost all the industrialized countries except Japan.
1,1. The picture in finishing is less clear, partly due to the comparative.paucity of information, (cost data on two finishes only) and the non-homogeneityof finishing processes. 3/ The developing countries except Hong Kong seem
1/ It is also interesting to note that the U.K. does very badly due tocomparatively kigh wage costs and low productivity whilst the U.S. alsodoes badly since very high productivity cannot offset very high wages.
2/ This is evidencc that developing countries do not have a lesser comparativeadvantage in the processing of man-made fibers than in the processing ofcotton (see para. 25).
3/ See para. 176 of Cotton and Allied Textiles, Vol.;. It is also true thatsome finishing in some developing countries is qualitatively inferior.There have, for .nstance, been complaints in the U.K. about the qualityof both Spanish and Indian finishes, although both countries are believedto be reasoi.ably competitive in actual finishing costs.

- 17 -
ciearly less competitive in the finishing of sheeting but achieve averagecosts in the printing of the rayon fabric.
42. In addition to this published information sane (unpublishn;) costinformation has been prepared for the World Bank cn the cottor industry ofMorocco, using the Werner data as a basis of comparison. 1/ Aoroccan costscome out high compared to most of the Werner countries, though not too highto preclude all possibilities of Moroccan exports to the E.E.C., one of itsmajor markets where it has preferential access. Morocco occupies a positionin the cost "league" similar to, but lower than, that of India, Pakistan andPorTugal, i.e. in the low-wage/low productivity group. Its low positioneven in this group reflects to some extent its wage costs at 31 pence perhour in spinning and 36 pence per hour in weaving which are by far thehighest in this group and indeed ccmparable with those of Hong Kong andJapan (see Table 10).
W3. A further large-scale international cost study, commissionedfrom another consultant and as yet unpublished, was also carried out forseveral cotton-type textile products for mills of similar levels ofcoupetitiveness (upper quartile) to those in the Werner study and at roughlythe same time (1967). Detailed results from tii.; study are not available butcertain broad trends in costs may throw same light on the information fromWerner. Firstly, in value added by spinning and weaving a clear hierarchyof competitiveness .er several products emerges for the six principalcountries compared. The order from lowest to highest cost, is: Hong Ko;,g,India, Japan, Portugal, U.K. and Germany; moreover, the first four countries,the low-wage countries, have very clear cost advantages over the two high-s- re countries: costs in the former are typically one-half to two-thirds ofzosts in the latter. However, it should be remembered from the Werner datathat the U.K. and Germany, the former more than the latter, are amongst thehighest-cost countries. In spite of this the study suggests greater absolutecost advantages for developing countries than Werner and, unlike Werner. itsuggests that India is competitive enough to oust Japan from second placein the ranking. Whilst trade trends have not seemed to bear out thisparticular conclusion, there is some broad concordance in this and the Wernerspinning/weaving cost data. 2/ This study has more detail than Werner onfinishing costs: it suggests that in fact neither high-wage nor low-wagecountries possess clear cost advantages over each other.
h4t. Overall the cost data suggest a general absolute advantage for low-wage countries in spinning and weaving, though not by any means for all products
1/ Some caution should be exercised as Moroccan costs were from May, 1970and Werner costs from October, 1967.
2/ The differences in detail between the two studies emphasize the need toapproach all cost data with caution.

and for all low-wage countries. In nj.' ng low-wage countries are lerscompetitive, although acrording to cost, .;lone they are not necessarilyuncompetitive. When costs .re t.ranlalLerl nto prices, it must be rememberedthat low-wage countries.are compelirg w.th high-wage countries on the latter'sdomestic markets and thei atainrnent of ftijual or only slightly lower costiby exporting countries will not betoken competitiveness once transport andmarket entry coste and qua)ity/ftashio:n consideritions, not to mentionprotective barriers, are taKen rtio accuivut. On the other hand it may betree that whereas exporL pricbzs are set by the most competitive (e.g. upperquartile) mills, domestic prices may reflect average levels of competitiveness. 1/
The Location of Comparative Advantage Amongst Develocing Countries
I5. Although th- cost information suggests a general correlation betweenlowest costs and lowe:t wages (as predicted by fact.or-intensity and comparativeadvantage), the most competJtive -o.antries, whilst they are lou-wage, do notnecessar-ly have the )owes! w,t!... / Whilst it is relatively easy toideitify which are the most. cuuupetitive countries and the technical reasonsfor their cost advdntagd, it it mune dif'ficult to establish the underlyingeconomic causation. The cost information, bearing out evidence from tradetrends, 3/ snlggest.s a general cost league Ir cotton-type textiles in thefo2lowing broad groups of 3atbrnationally trading countries:
Low wage countries: i. .3t@mi-industrial ized countries and Japan: low wagesanid quite high productivity.
ii. Other exporting developing countries: low wagesand low productivity.
High wage countries: i. European industrialized countries: high wages andhigh productivity.
ii. North Amierica: highest wages and highestproductivity.
1/ Inasmuch as export prices often reflect marginal pricing and domesticprices have to bear the corresponding burden of this, a similar situationobtains.
2/ Hong Kong and Japan have the highest wages in the low wage group ofcountries whilst Taiwan and South Korea, also leading exporters, havefar lower wages. An American Textile Manufacturers' Institute 1968wages survey (quoted in Far Eastern Economic Review, Asian Textile Survey,1969-70, p.82) gives the following hourly textile wage rates in U.S.cents: Japan 36; Hong Kong 25, ?akistan 14, India IL, Taiwan 13, SouthKorea 8.
3/ See the general conclusions of the Economics Depart.ment Working Paperson E.E.C., U.K. and U.S. imports of cotton-type textiles.

- 19-
Whilst the cost information concludes that low wages (reflecting labor-intensity; c.f. the earlier comparative advantage information) are anecessary condition of competitiveness, it also underlines the importanceof a certain level of productivity. Since productivity raflects theavailability of capital in both human and physical form, the "shorthand"explanation of the export success of certain Southeast Asian developingcountries 1/ is to say that they are semi-industrialized, i.e. the mostadvanced developing countries. This however, begs the question to someextent: it is difficult to define semi-industrialization and certain suchcountries may for instance, have a less broad industrial base than othercountries ostensibly at earlier stages of development.
h6. This is not to dery that the absolute lev6l of development doesnot play an important part in export competitiveness in cotton-type textilesin particular and labor-intensive manufactures in general. Only a smallnumber of developing countries export manufactures in significant amountswhilst most developing countries seem to be capable of exporting .:'imaryproducts only (where their comparative Advantage often largely resides innatural resource endowment). This is to suggest that. several developingcountries have a sufficiently solid industrial 1--; and siifficicnt resourcesof capital and labor to be potentially compPtiti.j, in iott.on-type textiles.The failure to achieve competitiveness reflects as much domestic policieswhich have the effect of isolating these countries from international tradeas their absolute .dvel of development.
47. In many such countries high levels of protection, either throughquantitative restrictions or through tariffs, virtually shut off domestic- c'ducers from the competition of imports and inefficiency is fostered.Protection may be made possible by markets which are large enough to supportan industry producing for the home r.Arket only, even at relatively inefficientlevels. If exporting takes place under such conditions, it is often amarginal activity and the inefficiencies of domestic production are of coursereflected in export prices.
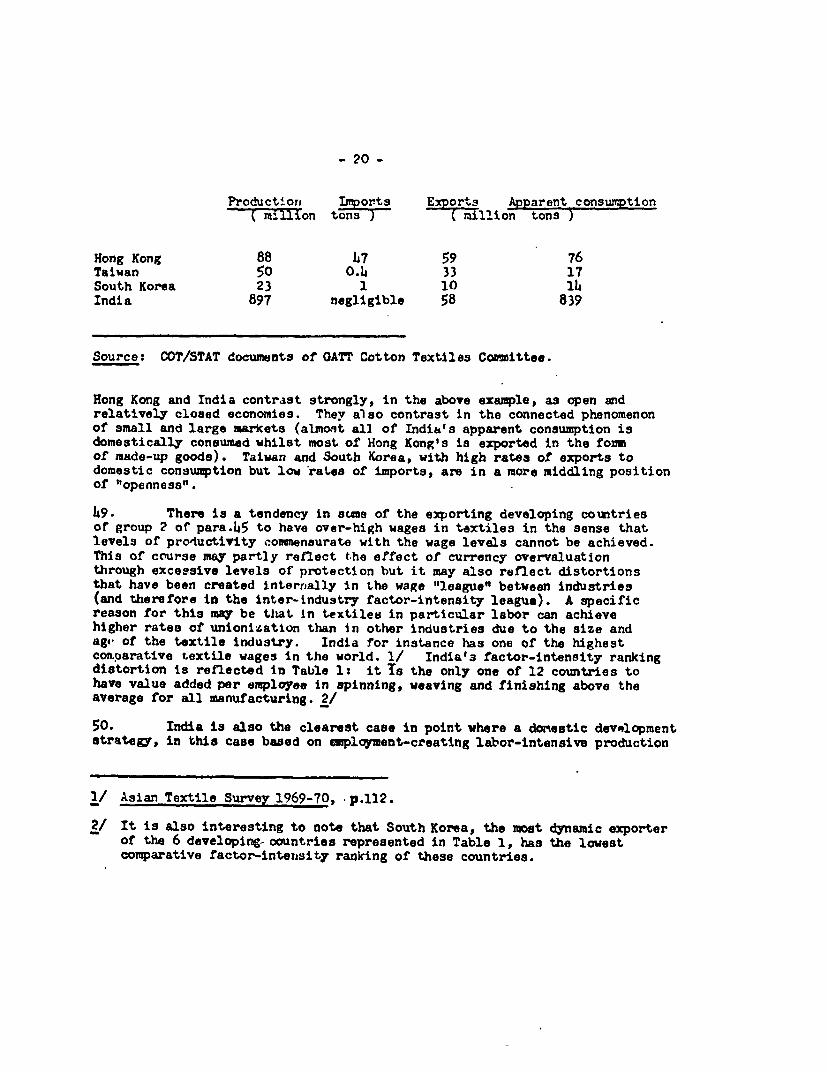
4s8. However, if the semi-industrialized economies are comparatively open,they are not, with the important exception of Hong Kong, open in a veryclear sense because they also prot-ect, if to a lesser degree, their domesticmarket:;. They are open economies in that they tend to be small countrieswhich have to depend on foreign trade; exporting cannot therefore be a marginalactivity. The following comparison of product.ion, apparent consumption andtrade in cotton cloth for four developing countries illustrates this point:
1/ Specifically Hong Kong, Taiwan, South Korea bui Japan also reflectssimilar characteristics.
- 20 -
Productiort Imports Exports9 Apparent consumption- mTllion tons
Hong Kong 88 597 76Taiwan 50 O.4 33 17South Korea 23 1 10 l4India 897 negligible 58 839
Source: OOT/STAT documents of OATT Cotton Textiles Coaittee.
Hong Kong and India contrast strongly, in the above example, as open andrelatively closed economies. They also contrast in the connected phenomenonof small and large markets (almoet all of India's apparent consumption isdomestically consumed whilst most of Hong Kong's is exported in the fornof made-up goods). Taiwan and South Korea, with high ratea of exports todomestic consumption but low rates of imports, are in a more middling positionof "openness".
W9. There is a tendency in acne of the exporting developing countriesof group 2 of para.45 to have over-high wages in textiles in the sense thatlevels of productivity commenaurate with the wage levels cannot be achieved.This of course may partly reflect the effect of currency overvaluationthrough excessive levels of protection but it may also reflect distortionsthat have been created internally in the wage "league" between industries(and therefore in the inter-industry factor-intensity leagus). A specificreason for this may be that in textiles in particular labor can achievehigher rates of unionization than in other industries due to the size andage' of the textile industry. India for instance has one of the highestcon.oarative textile wages in the world. 1/ India's factor-intensity rankingdistortion is reflected in Table 1: it Is the only one of 12 countries tohave value added per employee in spinning, weaving and finishing above theaverage for all manufacturing. 2/
50. India is also the clearest case in point where a donestic developmentstrategy, in this case based on enplcyment-creating labor-intensive production
1/ Asian Textile Survey 1969-70, p.112.
2/ It is also interesting to note that South Korea, the most dynamic exporterof the 6 developing- oountries represented in Table 1, has the lowestcomparative factor-intensity ranking of these countries.

_ 21 -
methods, runs counter to export competitiveness. For instance, India, witha similar textile wage rate to that of Taiwan, had in 1967 only 17 per centof its looms automatic as against 70 per cent in Taiwan. South Korea, witha wage rate half that of India, achieved 32 per cent automatic looms. 1/
51. It would be wrong to see the advantages of semi-industrializedcountries in terms of productivity and the openness of the economy alone.Table 10 shows for instance that once high Hong Kong productivity combineswith its high (relative to other developing countries).wage rate to give unitlabor costs, it does not consistently achieve the lowest labor costs.Moreover its rates of machine productivity in terms of machine output peryear, which together hith the cost off capital, deturmines unit depreciationcosts, are not a great deal better than those of some developing countries. 2/A significant key to the advantage of tle semi-industrialized countries mayin fact lie in the relatively easy availabil4ty of capital which reflectscertain chance factors. 3/ The first of these, a historical factor, was thebenefit that Hong Kong and Taiwan derived from the emigration of mainlandChinese entrepreneurs (some bringing their equipment with them) in 1908. Thesecond, or geographical factor, has been the investment of Japan and, on asmaller scale, Hong Kong in textiles (among other products) in neighboringlow-wage countries. W/
Comparative Advantage: Conclusions
52. Of all the trade determinants discuissed there are several reasonsfor citing labor-intensity as the mos1. important; but, if it is the mostimportant, it is largely by virtue of the absence of other inhibiting factorsrch as product differentiation (non-stanv)ardizatitn) or monopoly conditions.The question of whether the labor-intensity advantage of developing co'.ntriescan be sustained in the future concerns not only changes in the relativefactor-intensity of cotton-type textile production, but also the developmentof possible inhibiting factors together with, or even alternatively to,the pure factor-intensity determinant.
53. On the one hand the cost data generally mirrored census data inasmuchas developing countries were seen to possess greater advantages in spinningand weaving than in finishing. On the other hand it showed that comparative
1/ Statisttcs on auLtomatic looms from GATT document OOT/W11l5/add.3, statisticssupplied to the Cotton Textiles Committee by the International Federationof' Cotton and Allied Textiles Tndlstries. Automatic looms are those loomswhich automatically rcplenish the yarn supply to the shuttle; this is doneby hand with non-automatic looms.
2/ Sec Cotton and Alliei ITxtiles, Vol.II, Annex A, tables 9 and lb for machineproductivity in the Werier~oosts study.
3/ It is the sense of the availability of capital that these countries canperhaps most clearly be defined as semi-industrialized.
4/ See for instance an account of curren'. Japanese ovorseas textil.e invest-ment in Asian Text.ile Survey, 1969-70, p.l43.

advantage was not an automat.Ic result of low wages but also required acertain level of produetivity whLch is lpsn likely to be achieved the morea country is isolated .rom the effects of international trade and cannot.mobilize its potential comparative advantage.
II. COMPARATIVE ADNVANYTAGE IN TTz FUiTUI.!
54. In Part II it is proposed to look at changes in the cotLon industrywhich are taking place or might take place and which might alter the balanceof comparative advantage. The cotton industries . irAustr 4 alized countrieshave claimed such changes, specifically in two areas. Fir,_'-, they havemaintained that technological advances are resulting in a capital-intensification of the cotton industry relative to other industries with theresult that, from the point of view of factor-intensity, cotton-type textileproduction is becoming an activity more suited to the factor endowments ofindustrialized countries. Secondly, there may be different forms of sub-stitution in the industry, in inputs processes and end-products. This mayalso damage the competitive position of developing countries,-either becausethe latter are uncompetitive in new types of inputs or processes or becausethe end-product is becoming more de-standardized (and increaoingly fashion-oriented). 1/
Factor-Intensity Reversal: The Claims of Cotton I-.dustries of IndustrializedCountries
55. Given the importance of lahor-intensity as a source of comparativeadvantage .n cotton-type textiles, ehinges in the technology of the cottonindustry, making it an industry with relatively high capital requirements perworker, woulA clearly threaten the competitive position of developing countries.In the Annex there is a brief disrussion of factor-intensity reversal fromthe general viewpoint of economists. 2/ They have not on the whole come toe.itnimous conclusions: the most prevalent opinion is that there is not much
evidence of factor-intensity reversa1, except in some cases in agriculturewhere the importance of resource endowment partly invalidates a view offactor-intensity simply in terms of labor and capital.
56. In spite of this, the claims of certain cotton industries, notablyin industrialized countries in Western Europe', are insistent enough for thepossibility of factor-intensity reversal to be seriously examined. Morerapid technojogical advance in the cotton industry than in others is all themore feasible since the effect of price competition, a phenomenon moreuniversal and sustained in the cotton industry than in others, may well havebeen to incite a "competitive responae" lin some industrialized countries. 3/
1/ Changes in the trade determinants listed in para.l1 will in fact be examinedbut not in the same order.
2/ Annex, parao. 13 to 16.
3/ Hal B. Lary in a section of ilis study, "Technical advance and factor-intensities: the rase of cotton textiles", p.81, op.cit., suggests sucha competitive response. His approach to the problem of factor-intensityreversal, in particular his challenging of the eotton industry's claims,provided a starting point for the present discussion.

As was noted in para 15 of the Annex, rela.ive capital-intensification(this time in the sense Oa increased output per worker rather than asuperior technology) ray aJso result from improved efficiency. In WesternEurope, average levels of efficiency in the cotton industry seem lowerthan in other industries and there is ample room for improvement which mightlead to sore rise in the industry's ranking in the factc:-intensity "league".ImprovAment from this source does not, however, contain the poter,tial forlarge-scale factor-intensity reversal of technological advance. 1/
57. The evidence for capital-intersification in the cotton industry hasmost frequently been presented by means Of capital-labor ratios comparingthe most recent investment figure per workplace (or per worker) required ina new mill with earlier such figures The best known example of this is the0.E.C.L 's study, Modern .utton Industry - A Capital-Intensive Indtustry,which in 1965 could concludd that the cotton industry was no longercomparatively labor-intensive siimply by pointing out the industry's growinginvestment requirements (whiich in isulation undoubtedly look impressive). 2/In the following y'jar GATT'.s A Study oz} Cotton Textiles was able to state:"A modern cotton industry is r.z;.r;i'.: as heing among the most highly capital.-intensive of the manufacturing industries" on the basis of similar evidence. 3/A recent article by Dr. W. Linn',uann, id which is one of thc most authoritativepresentations of the cotton industry 37case, quotes typical investmentfigures per p.faical workplace for a new integrated spinning and weaving millas follows:
1958: $ 20,000 ) from) OECD
1963:. $ 60,000 - 80,000 ) sources
1969: $ 100,000 (Linneman's estimate)
These approaches to the measurement of increasing capital-intensity havesuffered the drawbacks of simply comparing present with part performance and
1/ The clothirg industry in industrialized countries has not on the whole madesimilar claims of factor-intensity reversal.
2,' See Part II, Chapter II of the study. The evidence thus presented ofcapital-intensification then indirectly becomes tLe junLification of highlevels of protection in industrializdd countries; see pp. 131-133.
3/ GATT, 1966, p. 55.
" Consequences of the Increasing Capital Intensity cf the Cotton TextileIndustry", Cotton and Allied Textile Industries, Vol.10, 1969, InternationalFederation of Cotton and Allied Textile industries.

- 25 -
not comparing performance with the rest of industry. 1/ Where corparisonshave been made with the rest of industry, they have tended to be based oncomparisons, for instance, of optimal investment levels in the cotton industryand average investment levels in industry as a whole. 2/ Clearly, it cannotbe denied that capital-intensification has occurred inJthe cotton industry,but the point is often lost that this is a necessary condition of maintainingcompetitiveness where wage costs arc rising. Capital-intensification has tobe looked at relatively, i.e. in terms of the rest of manufacturing'industry.A further criticism of sone of the quoted capital-lahor ratios is that theyhave tended to be expressed in terms of investment per workplace whereas,since most new plants are run on three shifts; investment per employee wouldmore accurately reflect capital costs.
58. A second approach to measurement of technological change in thecottci industry has been provided by the evolution of gross investment peremployee over time in the cotton industry compared to the rest of the industry.This exercise provides more comparability than the former and has lent someweight to the thesis of capital intensification. Linnemann quotes a morethan two-fold increase in the capital-intensity of the German cotton industrysince 1950 according to this criterion, as compArof' to a two-third increasein the capital goods industry was way below the 'ndnistry average in the early1950s and has now grown very near to that average. The following figures forthe U.S. are reasonably representative of most industrialized countries:
Investment per Employee in the Cotton industry(Manufacturing - 100)
1953 1958 1962 1967
Cotton weaving ) 6 32 79 75Synthotic weaving) 30 62 93Yarn, except wool n.a. 37 93 109
Source: U.S. Censuses & Surveys of Manufactures
Investment figures are very cyclical and can at best only provide generaltrends but there has been in the 1950s and 1960s an undeniably increasingtrend in investment per employee compared to the national average. This is
1/ As well as Hal B. Lary, p.85, op.cit, the Economist has pointed out thatsuch a demonstration of capital-intennifiration m,;st be on a comparativebasis with the rest Of industry ("Textiles not just for the Poor",pp. 68-69, November 22, 1969).
2/ In Para 351 of Cotton and AlliAd TextAles, Vol.I, for instance, a best-practice present (196T-69) or near-future value added per employeefi-gurefor the cotton industry is compared with an average value added peremployee figure for manufacturing in 1967.

- 26 _
discussed later in para 64.
59. It is important to note that the claims that have been made forcapital-intensification generally concern an ongoing process, not a developmentthat has yet to manifest itself. Already in 1965 Modern Cotton Industry wasable to say that capital-intensification was "practically complete in theUnited States and Japan, but still slowly proceeding in Europe". 1/
Factor-Intensity Reversal: The Evidence of Census Data
60. It is proposed once more to use value added per employee figures,on this occasion over time, ds a measure of changes in capital-intensity onthe grounds that the value-added figure represents the best availableapproximation to the services of physical and human capital. The reservationswhich qualify these figures should be recalled. Moraover, with copa2risonover time there is an additional problem >f distortions from cyclicalfluctuations but the fluctuations in valut. added would not seem to be sogreat as to seriously impair the vLlue Of the figures. 2/
61. The data is limited to the same census figures as those used forthe static picture of comparative advantage. in view of the claim of themid-1960s that the capital-intensification of the industry was almost completein the U.S. and since the U.S. has the highest ratio of wage to capitalcosts in the world, the U.S. data is amongst the most important from industrializedcountries. Canada is also a very high wage country. The U.K. is a lower-wagecountry with a less rationalized cotton industry and, since big efforts havebeen made in the 1960s to rationalize, any capital-intensification may tendto reflect this to some degree. Whilst the U.K. and Canada are relativelyliberal importers from low-cost sources, the U.S. is in a middling position.It is difficult to say how levels of protection might affect capital-intensification: whilst it might be thought that low levels of protectionwere a spur to capital-intensification and high levels precluded the need forcapital intensification, the cotton industry has tended to argue the oppositeeffect. 3/
62. Table 1, giving broad information froa 12 countries, shows almostno discernible trends towards mounting capital-intensity in spinning, weaving,finishing, except in the case of the U.S. and Canada. This is generally true
1/ O.E.C.D. op.cit.
2/ Tne U.S. and Canadian data suggest that, in years where the cotton industry'sbusiness cycle is at odds with that of industry in general, value addedper employee is not distorted by more than about 5 percentage points.For the U.K. all the censuses since 195L have reflected comparable, goodtrading conditions in textiles and in all manufacturing except for 1958when cwparable, bad conditions prevailed for both.
3/ I cora.rable census time series were available for some of the moreprotectionist European countr:es, this point could be better pursued.It is 'tcrn up again in para 107.

- 27 -
of clothing too. The more detailed country tables 'Tables 2 to 5) are moredifficult to interpret: while there has been no ma.or capital-intensification,there may have been some minor cases or indeed incipient trends.
63. In the case of the U.K. there seems to have been a substantialupward movement in value added per employee in cotton spinning in the fouryears preceding 1968, but there is not a marked upward trend elsewhere. l/In the U.S. there is no clear trend towards capital-intensity jxcept, takenover the whole period, in yarn mi]ls. However, at the very end of theperiod there is an upward movement in synthetic weaving and finishing whichmay constitute a trend. On the other hand this movement may simply be eithercyclicai, or, inasmuch as it corresponds to a downward trend In cottonweaving and finishing, might betoken short-term gains (i.e. higher profits)in synthetics at the expense of cott.on due lo the recent U.S. boom insynthetic fiber fabrics. In all three countries the figures suggest thatduring the late 1950s the cotton industry rell in the faotor intensity"league" compared to its position in the early 1950s and that it capital-intensified relatively until about the early 1960s to regain its earlierposition and has since hardly moved up the league. The clothing industry bycontrast has tended to show a consistently declining position in the "league"from the early 1950s onwards. 2/
6l. The vague indications of the "curve" in the cotton industrymentioned above ta-.y to some extent with investment data. Investment peremployee has had (as noted in para 58) a tendenny to move towards the averagefor manufacturing by the mid 1960s. This may correspond to the cottonindustry's recovery of earlier levels of capital-intensity. It wculd seemin this case that large increases in investment per employee (when expressedin terms of the average for manufacturing) are associated with small increasesin capital-intensity.
65. In summar4- capital-intensificatior in the cotton industry is farfrom proven. If the phenomenon exists, it is certainly not as far advancedas the OECD maintained in 1965 (see para 59) and there can as yet be no talkof actual factor-intensity reversal: only in the case of Canadian synthetictextile mills does spinning and iuenving approach the average value added peremployee for all manufacturing. Factor-intensity reversal would seem at
1/ The large lump in U.K spinning value added per employee may he partlyaccounted for by the fact that Minimum List Heading U12 (Spinning anddoubling in the cotton and flax system) includes the treatment of continuousfilament yarn (texturizing and bulking, etc.) which has by far the highestlevels of value added per employee and is by r;: the fastest growingsub-division in MLH 412.
2/ The cotton industry has usually maintained that technical change in theindustry was labor saving in the sense that the share Of labor in totalcosts was diminishing. The evidence of value added doe's not support this.There has been some small reduction over time of wage value added intotal value added but this has hardly differed from a similar trend inall man-afactures.

best to be an incipiunt phenomenon 1/ and the next two sections will atteMp.to examine whether this is so, firsTly l,hrough d more qualitative approachto rapital-intensification and the industry's expectations of it and secondlyby presenting some evidenee on future coat: from Cotton and Allied Textiles.
Factor-Intensity Reversal: A Qualitative Assessment
66. The following very brief disuss.Ion of machinery developments andthe cotton industry's future expectations of such aevelopments relies partlyon information gathered direetly f'rom IJ.S. and Canadian textile firms.' Itwas felt thaLt higher wage rates in North America tian in Europe might Orovideir.creasdd incentives for capital-intensification of the cotton industry. Itwas also felt that the North American experience might to scme extent pointthe direction that Europe would move in as wage rates rose.
67. During the 1950s there was a general stagnation in terms ofmachinery developments in s<inning, a:j1 weaving. 2/ This is undoubtedlyreflected in the falling leveis of relative capital intensity between theearly and late 1950s observeca in para 64l. The 1960s saw substantial improve-ments in machinery performance. although the machinery remained conventional.Spinning tended to profit more from these developments than weaving: semi-automated ars.1 automated epiraniceg systems were developed to cut down on thenwuzter of sepurate operatiorns in spinnirng. In weaving efforts wereconcentrated on improving loom speeds ralher tnan on directly replacing menby machines. 3/ Any development in comparative capital intensity that might.have been observed in the cenrsuj* data would be ai:counted for by such"conventional" devulopnieu1s anti it is perhaps significant that a trend towardsrelative capital intensificatiorn, albeit very small, was more noticeable(on the basis of U.K. ard IT.S. tigures only) in spinning than in weaving.The most recent important deve]opmtents, which have been that of theshuttleless loom and open-end spinninl, have as yet not been adopted to asufficiently large comterc.al scale to be reflected in even the most recentcensus information and, clearly, a degree of specuLation is involved in a
1/ Some of the phenomenon might be accounted for by the industry manufacturingproducts incorporating higher value added per employee. The possibilitiesof this will be discussed later in para 85. In any case the possibilitiesof such upgrading are limited.
2/ ?y the 1950s ring spindles and automatic looms had in most cases ousted mulespindles and simple mechanical looms in industrialized countries. The mostsignificant exception was the UJ.K. which was very late in modernizing.
3/ The actual spinning process only accounts for about 60 per cent of the cost ofyarn 'oroduction and the existence of a chain of preliminary processes such asblencina, carding and dlrawirg has provided a certain potential for automation...e ,eav;.ng process accounts for about 75 per cent of the cost of clothproc_.2ction and a corresponding move to automationi has not taken place inpre.,aratoy processes, partly because the main process accounted for a greaterpa.to t;'he cos. ard ,artly zetat:e the preparatory processes mainly concorn twosep on OcSe£ t:.e r'.ratio. of the warp and weft yarns.
- 29 -
discussion of future developments in capital-intensity. I/
68. The shuttleless loom has been developed in order to increase machinespeeds by means of dispensing with the heavy shuttle that inserts the weftyarn. The shuttle ha' been replaced variously by air and water jets, rapiersand light projeetiles (gripper shuttle). Although substantial savings inunit labor costs are associated with those new types of loom, 2/ they do notas yet represent anything but a small proportion of th total number of looms.For instance only 2 per cent of looms in the U.K. were shuttleless in 1968. 3/In the U.S. for the sar.e year 1.2 per cent of cotton looms and 2.1 per centof man-made f'ber looms were shuttleless. 4/ The seaming reticence ofthe industry to invest in these looms reflects several uncertainties.There are certain production problems associated with shuttleless looms,such as unconventional selvedges and the rnecessity of producing long-run,standardized goods, which make manufacturers reticent to make outlys thatrneed to be substantially larger than for more conventional looms.
69. Open end spinning (or hreak-npinning), by drawing a stream ofseparated fibers into a rotating "pot" and spinning them directly, cuts downon the large number of processes involved, even in antomated systems ofring spinning. It is a more recent introduction than shuttleless weavingand has so far only been operated on any spale in Japan. Again, unit laborcost savings, at a more moderate level than in shuttleless weaving, areassociated with it, but it is a far more unknown procesr, than shuttlelessweaving from both a cost and a performance point of view. Manufacturers havedoubts about the strength of the yarn produced and have large reservationsahout the high investment out.)ay. 6/
In general Nortlh American manufacturers, though interested in theseUdW developments and envisaging eventual, rather than immediate, investment,do not feel that the industry will be able to do more than simply keep pace
1/ There have also been significant lahor-s-tving developments in finishing but,since infrrmation on these is more fragment.ary and since the thesis ofrelative capital-intensificAtion lts mostly applied to spinning and weaving,these developments are not considered here. See paras 321-32t&,Cotton andAllied Textiles, Vol.I.
2/ See Chapter 7 of Cotton and Allied Textiles, paras 306-320.
3/ "The Diffusion of New Technology: a study of ten processes in nine industries",p.63, National Institute Economic Review, No. 4z8, May 1969. One of the tenprocesses examined is shuttleless looms.
d/ U.S. DThpartment of Commerce,Current Inclustry Reports-Cotton Broadwoven Goods:Sunmmta!y for 1968 and Man-Madc 3roa..ovon Goods: Summary for 1968.
5/ See Chapter 7 of Cotton and Al]ied Textiles, paras 298-305.
6/ However, several open-end syst.ems are being commercially developed andprice reductions in machinery are expected.

- 30 -
with tne rising wage rate. In this resDoct spinning is felt to be moreprone than weaving to labor-saving techrical change if only because there"are clear possibilities of shortening the process.
71. Indastridl engineerinig, I.e. work reorganization and rationalization,has been felt by some to have contributed as much, if not more, toincroased productivity in NorLh Amnri(a as machinery developments. In Europe,moreso than in North America, there is still a large potential for suchsavings. In the U.K. where tne potential is possibly the greatest, Cottonand All2ed Textiles has calculated that labor productivity could be improvedu to o20per cent by increased specialization in spinning and weaving, i.e.a reduction in the variety of production and increase in the length of runs,whichi would bring U.K. labor productivity up to American levels. 1/
72. There is a belief ir th- industry that electronic applications, etc..to the production process wi3l eventually render produtction of yarns andfabrics automated to a very hjigh degree. Such developments are not howeverforeseen hefore twenty ycai-s and are too hypothetical to be taken intoconsideration in the presenit discus3ion, especia3ly as parallel developmentsare presumably sought in other industries.
73. If the European cotton In.1ustry has generally been more convincedof the possibilities of relative capitdl-intetnsification than the NorthAmerican industry, this rei'lets two rnaai factors: firstly that Europeanwage rates are siguificbtntly luwtir (at about half the U.S. level; see Table 1i);se-oirudly that Eutope lads grent.er scopb ror rationalization. At the sametime these wage rdtas iare ccEt.inually rtsing and nullifying part at least ofthe prxiucLivity improvement that car, be gained from better machines dndwork organuization. 2/
7l. It shoujld be rmemmn,ered that factor-intensity is but one, if themost important, cf the actual production characteristics (i.e. excludinginput supply coniditionis aid nature of thet product) determining comparativeadvant.ge in cotton-type te)ctiles. The present and future (i.e. in themedium term, excluding electronic produt:tion control, etc.) developments inthe cotton industry are not expected to make it into a significantly larger-scale or higher-teehnology industry. 3/ Even more important perhaps is thatas yet the clothing industry has showin little propensity to become relatively
/ Cotton and Allied Textiles, Vol.I, page 62, and paras 334-350.
2/ It is also reasonable to suppose that developing countries' wages will riseless slowly, if only because there will presumably be new low-cost-hign-productivity countries to take the place of, say, Japan and Hong Kong whentheir wage rates begin to preclude international competitiveness.
3/ Scale will become larger and technology higher but the more advanced of thedevelo?ing countries will be able to absorb the changes whilst the lessadvanced will still find that their wages to capital cost ratio dictate.iW't-e use of more conventional, labor-intensive machinery.
- 31 -
capital-intensive: the competitiveness of developing countries at thisstage may well, therefore, jeopardize the effort-s of i.idustrialized countriesto improve productivity at earlier stages of manufacture. 1/
Factor-Intensity Reversal: Data on Future Costs
75. Cotton and Allied Textiles devotes a chapter to a forecast ofthe likely relative cost position of the U.K. "in a few years' time"(about five to six years after 1968) vis-a-vis its four main low-costcompetitors, Hong Kong, Portugal, India and Pakistan. 2/ Such anexercise has to make certain assumptions. It is assumed that a certaindegree of productivity advance will be secured by the use of new equip-ment: a fully modernized 1960 ring spinning mill 3/ i a weaving millusing shuttleless Sulzer loomrs. It is assumed that. the U.K. will make veryrapid strides in rationalization (there is a large potential but acorrespondingly large effort is required) which will bring its costs intoline with those of other industrialized countries. A third assumptionis that wage rates will remain unchanged in the medium term; this isperhaps the most dangerous assumption. L/ In spite of the "best practice"assumptions involved in this prediction of future costs, the exercisemerits some attention since, although it gives some evidence of the U.K.'simproving cost position, it does not bear out a thorough-going factor-intensity reversal.
76. The study does not, envisage that the U.K. could become completelycompetitive with imports from these low-cost sources, without at leastthe aid of a moderate tariff and the tariff-equivalence of transport costs.vhe result of manginal savings in yarn costs and more significant savingsLn fabric costs are as follows;
1/ This very idea has been expressed in strong terms by some representativesof the U.S. ootton industry. See para 30.
2/ Cotton and Allied Textiles, Vol.1, Chapter 8, "Future InternationalCosts".
3/ Open-end spinning was not considered as it is still effectively at theexperimental stage.
ii/ Actually wage costs per hour are expected to riae as increaaed shift-working will increase the shift-premium element in the wage bill. Theassumption is dangerous because, in addition to the points made inpara 73 and the footnote to this para, special factors may push uptextile wages rates in industrialized countries, for instance thetendency towards equal pay for women and, acute labor shortagespartly brought about by growing employment alternativea in previouslydepreesed regions.
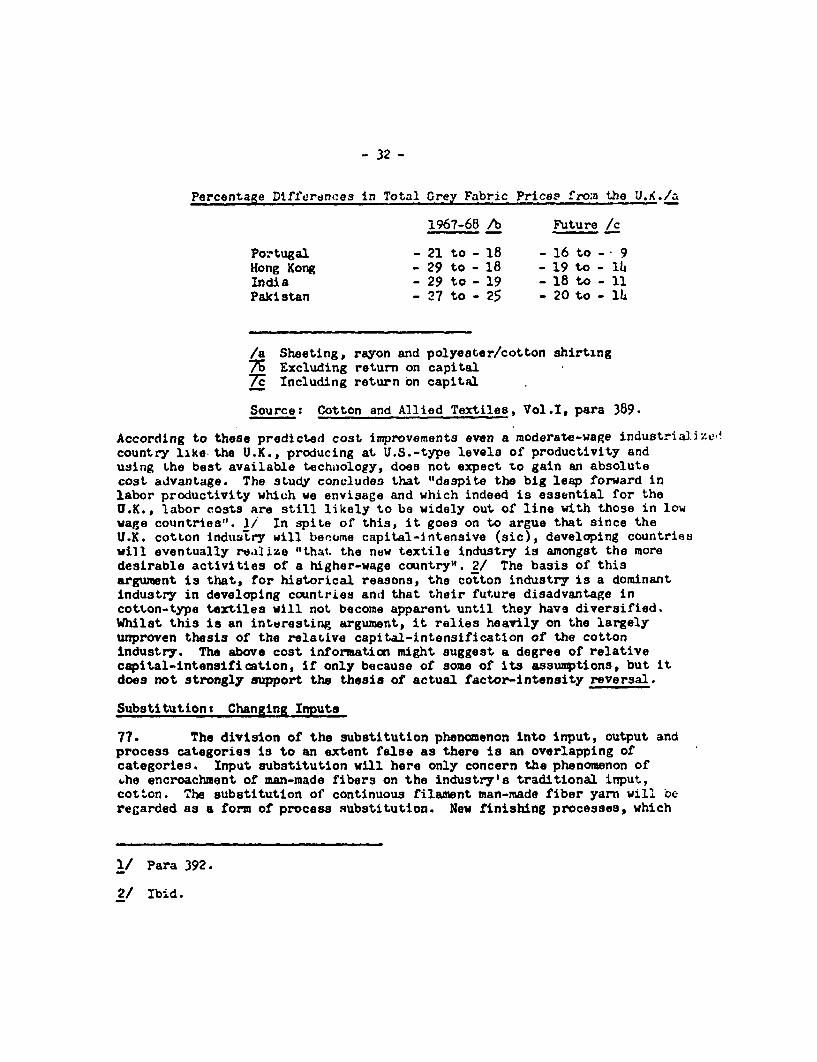
- 32 -
Percentage Diffterdnces in Total Grey Fabric Prices' fro:n the U.X./a
1967-68 /b Future /c
Portugal - 21 to - 18 - 16 to- 9Hong Kong - 29 to - 18 - 19 to - hIndia - 29 to - 19 - 18 to- 11Pakistan - 27 to - 25 - 20 to- 1h
/a Sheeting, rayon and polyester/cotton shirting7' Excluding return on capital7c Including return on capital
Source: Cotton and Allied Textiles, Vol.1, para 389.
According to these predicted cost improvements even a moderate-wage industrializ.'country like the U.K., producing at U.S.-type levels of productivity andusing Lhe best available techuology, does not expect to gain an absolutecost advantage. The study concludes that "despite the big leap forward inlabor productivity which we envisage and which indeed is essential for theU.K., labor costs are still likely to be widely out of line with those in lowwage countries". 1/ In spite of this, it goes on to argue that since theU.K. cotton industry will beeome capital-intensive (sic), developing countrieswill eventually re.alize "that. the new textile industry is amongst the moredesirable activities of a higher-wage country". 2/ The basis of thisargument is that, for historical reasons, the cotton industry is a dominantindustry in developing countries ani that their future disadvantage incotton-type textiles will not become apparent until they have diversified.Whilst this is an interesting argument, it relies heavily on the largelyunproven thesis of the relaLive capital-intensification of the cottonindustry. The above cost information might suggest a degree of relativecapital-intensification, if only because of some of its assumptions, but itdoes not strongly support the thesis of actual factor-intensity reversal.
Substitutiont Changing Inputs
77. The division of the substitution phenomenon into input, output andprocess categories is to an extent false as there is an overlapping ofcategories. Input substitution will here only concern the phenomenon of,he encroachment of man-made fibers on the industry's traditional input,cotton. The substitution of continuous filament man-made fiber yarn wil'l ceregarded as a form of process substitution. New finishing processes, which
1/ Para 392.
2/ Ibid.

- 33 -
in a se;;se represent new inputs, will be eiscu-sed under substitution ofoutputs. The question of substitution presents familiar difficulties offorecasting cuantitative changes; the rest of Part II will be concernedwith setting out the possibilities of change rather than with measuringthem.
78. The consumption of man-made fibers has been growing steadily formany years and increasingly threatening the share oI' cotton in the productionof the cotton industry. This growth corrnsponds to a steady fall in theirprice relative to that. of cotton. 1/ Th.e greate3t growth in man-made fibershas occurred in synthetics, 2/ and probably the most outstanding exampleof this is to be found in the United States where in the last few yearspolyester/cotton blends haive experienced a startling rate of growth infinal consumption. 3/ This has been reflected both in domest-c productionand in imports. Consumption of man-made fibers, especially synthetics, canbe expected to encroach further on that of cotton as man-made fiber pricescontinue to fall due to improved production techniques or larger scale ofproduction, and their qualities and attributes are improved on. This maybe especially true in Western Europe where, for instance, the polyester/cotton "boeom" -,s yet to happen (although Europa will not necessarilyfollow the United States). Forecasts made in C .;1 and Allied Textilessee a doubling to 30 per cent of man-made fibers' share in spun woven fabricsfrom 1968 to 1975. 1/
79. The effect that increasing consumption of man-made fibers willhave on the competitive prospects or ldvelopinig countries will depend ontheir ability to obtain theas riber:i at, nompetitive prices. 5/ Table 12,Y.eh gives some pricrs for rayon and polyes,ter in several countries, showshat., whereas ther it generally a world price for rayon, there are largevariations in polyp-..cr prices. The inahility or developlng countries,notably India, Pakistan and B3razil, to obtain synthetic fibera at world pricesreflects in part the high production costs that can be incurred by developing
l/ See, for instan.:e, Table 1, p. 7 of Cotton and Allied Textiles, Vol.!.
2/ Synthetic fibers (e.g. polyester, nylon) and cellulosic fibers, (e.g. rayon),the former petrochemicals-based and the latter made of regenerated vegetablematter, are the two principal "families" of man-made fibers. Syntheticsare generally highor priced and of superior quality.
3/ See, for instance Stuart F.G. Coan "Les Melanges Polyester Cotton aux U.S.A."in Industrie Francaise du Coton at des Fibrns Allies, No. 8, December 1969.
4/ Cotton and Allied Textiles, Vol.I, para WI. Given the U.S. boom this mayWell be a conservative estimaLe.
5/ It is assumed that the spinning and we.Lving costs of man-made fibers arethe same as those of cotton. See para 25 and footnote to para 40.

- JJi -
countrles, the olidopolistic abpects of the world market in man-madeilbers and the prevalence Ou import substitution over export policies incurtain developing countries.
00. Developing .ountries have a comparative disadvantage in man-madefiber produetion since the industry is clearly very capital-intensive. inthe U.K., value added ver employee in the industry was in 1968 at 198per cent of average manufact.uring value added per employee. In the U.S.in 19b?, ce-ful;osic fiLbers were at 117 per cent and synthetic at 162 percent. Moreover, the industry requires a very Large scale of operation. 1/The scale ftctor is probably a greater barrier to competitiveness than theabsolute capital-intensity, especially as the industry tends to be "machine-paced". 2/ The comparative disadventage ol developing countries isreflected in industrialized cvuntries' small 4.mports of man-made fibersfrom developing countries. i/
81. This does not necessarily mean, however, that developing countriesneed be completely incompetitive in man-made fiber production. L/ A verymportant reason for this is that international investment in man-madefibers is substantial either in the form of foreign subsidiaries orlicensing arrangements. South-East Asian countries for instance have, withthe notable exception of Hong Kong, established man-made fiber industriesthrough Japaiiese inveLUnent. 5/
82. Even if cout competitiveness can be achieved, however, foreigninvestment can have certain implications for the export potential of developingcountries which arise fron the tendency of world synthetic fiber productionto oligopoly. Licensing and other forms of investment often carry commitmerc:spreventing the subsequent export of fiber production, in fiber or textilerorm, which can act as a stronger barrier to developing countries' exportsthan simple cost considerations.
83. This particular situation, which presents barriers to certaindeveloping couintries' exports of man-made fiber textiles, brings up again
1/ Compare for instance the scale factor of the synthetics industry with thatof other industries in Annex Table A-2.
2/ That is high capital requirements combine with low skill requirements. InAnnex Table A-2 synthetic fibers have a comparatively low ratio of wagevalue added to total vaJue added.
3/ See Annex Table A-2 (in the American census terminology, "synthetics"covers all man-made fibers).
i/ Low costs are more likely in cellulosics than synthetics. India, forins.ance, produces rayon at world prices (see Table 12).
5J See "Asia's Xan-Made Fibers", p. 40, Asian Textile Survey 1969-70.
certain points made in the earlier section: "Loaat:on of GorparativeAdvantag,e". Many countries, which have chosen to est.,blish .an-made fiberindustries which either produce at high cost or are not allowed to export,are choosing a development strategy that is based on import-substitutionand effectively bars exports. Exceptions to this are Taiwan and SouthKorea, who produce} import and export man-made fibers. This may partlyreflect the participation of Japan in these industries, but also reflectscertain customs drawback arrangements that these countries have. Taiwanhas, for instance, recently been importing polyester only for re-export. 1/Countries which do not produce man-made fiDers can of course obtain themat world prices. 2/ Hong Kong, for instance, which has no man-made fibersindustry and has no plans for one, obtains fibers more eheaply than anyother country except Japan. (See Table 12)
8L. Since industrialized countries undoubtedly retain a comparativeadvantage in the research and development of new fibers and fiber properties,developing countries will possibly suffer a dynamic comparative disadvantageinasmuch as new developments may tend to be monopolized by cotton industriesin industrialized countries because whey are cLose to the source of suchdevelopments. However, the experience of exporters to tne U.S. in the recentU.S. upsurge of man-made fiber textile imports su%gests that at bestindustrialized countries can only secure a temporary advantage from large-scale innovations such as the move into pnlyester/cotton. The semi-industrialized cou .-ies of Southeast Asia have, together with Japan,monopolized low-cost 3ourees of man-made fibAr textile imports even more thanwas the case in cotton textile imports. The major effect, then of theincreasing consumption of man-made fibers in industriallzed countries has beento put other developing country exporters at even more of a disadvantagecompared to the Southeast Asian countries than was the case with purelycotton textile exports.
Substitution: Changing Output
85. There are two main ways, not mutually exclusive, in which cottonindustries in industrialized countries can seek to lessen the Impact of importcompetition M'y changing the nature of their product. Firstly, they cansimply up-grade their product within given market conditions. Secondly, theycan seek to change these market conditions by enlarging the market and
1/ Asian Textile Survey, 1969-70, p. 184.
2/ As Table 12 shows, there is not in reality one world price for man-madefibers, and price differentials are increased by the existence of listversus discount prices and branded versus unbranded fiber prices. Thirdmarkets can of course even obtain below-world prices if oligopolisticproducers d.ump.
36
de-stanaardizing the product. U'pgrading means a move into higher qualityproducts requiring greater cill, an.i possioly cap:.tal, requirements. ;odisadvantage is entailed for exporting countries since up-grading meansabandonment of the lower ent Of the marKetL. This is in effect what hash4ippened to some exteutt in th, U.K. and in Scanditiavian markets where impor..levels are also high. l/
86. A major prob_ez4 of tho end-market for textiles in industrializedcou.ntries, both frmn the point of view of the domestic industry and of;ore_gn suppliers, is that. it is re2atively unaynamic. Ih.lst the incomeelastic,.ty of consumer demand for all textiles is generally below unity inindustrialized countries, elasticity for the product of the cotton industryis even lower since compet-iag rorms: of textile production, especiallyknitting, are growing at the, expense of woven cloth. 2/ Clothing manufaCL'r rand retaileru in industriia1ied "oiuitries are making some attempt to ex,:Ino.tne market mr,e quickly by crearing, through advertLising ana improved ae:'etc., more fashion-conscioustiess or brand-awareness.
d7. -h.s development has gone furthest in the U.S. where there islarge-s.ald] advertising of clothing (and hleand-advertising of man-made fi1.er:1,at the reta-l level. 3/ A similar development has occurred in housenoldtextiles. Tne increasing fashion element instilled in sheets, for example,has helped ll.S. manuficturers maintai,i their markets. Except in the caspof xieh hou-ehold artinles, (whose production frxm the fiber to the packapoi.artitle and alws whose .uLrkel.Lng art gener.lly controlled directly by thecotton In.itmtry), pdaj dftlempt, by firms in the industry to create brandawareness tn fabrics have larg.-ly falled. Fabrics tend to remain astariddrdized article a,i- the- ,-1tton industry gains from the achievements 07retail advertising only indlret-tly through overall enlargement of the nar.<e .
88. In the U.K. advertinIng seems to have been less effective than inthe U.S. Some recent researci on consumer attitudes towards clothingpurchases concluded that there was a low degree of consumer brand-loyaltyto man-made fibers and to clothang and that increased advertising was notjustified. L/ Cotton and Allied Text.iles reported that firms in the cotLon
1/ Upgrading can be observed in U.K. census figures since they are rela'.velydetailed. In particular, yarn-dyed cloth, which has a higher value acdedper employee figure and a higher fashion content than grey cloth, raiea.its share of total cotton industry weaving value added frcm 3 per cent tr.95L to 24 per cent in 1963.
2/ _.ncme elasticities of demand are quoted for textile consumption at 0.8rpc cen'n and for products of the textile industry at 0.65 per cent in theZ. .C. :n J. de Bandt L'Industrie Textile de la C.E.E.(Rapport preLaer.tea ;, Cci..ssion de Monnuntures _uropeennes), 1969.
3/ :. _.cst of November 2?, 1969, reported that the U.S. was the c-_'y:r.___< ^ '_ed country where an ;ncreasing proportion of income was being
s cioth;ng.
_/ ._:o:_ 2_z^o: .c Deve.c?;-.. C::.ce, Your R:turr- __ Clothing r p?-arad by.._.rv9__ __ _..W_ss~_'9 U ;::_ .J _)U - ° Z4 ?- P.-
- 37 -
industry cid not feel that there was much to gain from fabric advertising. 1/
89. In both the U.S. and the U.K. an increasingly differentiatedmarket for clothing does not necessarily mean increased differentiation atthe weaving stage. In fact cost ronsiderations dictate that fabricspecifications be as standardized as possible. It is at the finishingstage that differentiation can be 'elt strongly. The results of a surveyincorporated irn Cotton and AlVled Textiles surgosted that fabric buyersgave design and style pr.o.-ty over price in choosing certain finishedfabrics. ?/ Above ainn beyond design considerations, markets in industrializedcountries are increasingly demanding finishes imparting certain propertiessuch as ea.sy-care eh.rarteristies to tne cloth. Industrialized countrieswill tena to retain a corparative advantage in developing new finishes, buton the whole most f'inishes are generally available to the world (and notvery susreptible to orand advertising).
90. Attempts in industrialized countries to differentiate markets formade-un textile goods do not, then, seem to have a very strong effect up tothe grey cloth stage. It is only in finished cloth and made-up articlesthat such atte, *tB miglht be felt strongly. It in izpossible to judge fromthe informatio-- available the success or differt-ititon efforts or theirsubsequent eff'ec-L on i.Yports from low-rost sour':us, but it is probable thatthe "low end or the marset", i.e. standardized items or finished cloth andclothing. will rem; .& rcasonanly large part of the total market inindustrialized countres. Some of the more advanced developing countries,typically the South-Asian countries, with diligent market intelligence areheing able to break into the more fashion-oriented parts of the market. 3/
-t-istitution: Changing Processes
91. The rotton-type textile exports of developing countries have beenlargely concentrated in spun, woven textiles for apparel and household uses.Three main sources of process substitution can be singled out as actual orpotential threats to these traditional textile markets in industrializedcountries. These are: continuous filament (man-made fiber) yarn replacingspun yarn anr Knitted goods and non-woven goods replacing woven goods.Knitting especially has made very large gains at the expense of weaving.
92. The following tablo reproduces forecasts made in Cotton and AlliedTextiles for changes in the market share of different textile systems up to1975:
I/ Cotton and Allled Textiles, Vol.1, paras L90-Lo3.
21/ Cotton and AllSecd Textiles, Vol.1, para 515.
3/ This is helped by relatively falling costs of communication andrapid transport.

U.K.: Share of Ccnstrntion Forerj;sts for Different Textile Szs'-?z'per cent J
Actual ForecastY9_67r 197:, l975
WovensSpuns 52 L6 37Filament 12 12 13Wool-type 9 8 7
KnittedWarp 12 16 20Weft 15 16 lo
Non -Conventiona3 1 2 5
Total 100 100 10O
Total in million sq.yd.eqiv. 1125 3250 1600of which: spun woven 1630 1500 1330
/a Excludes trade in made-up garments.
Source: Appendix IX, Cotton and Allied Textiles, Vol.I
The overall effect of substitution, especially knitting, on demand for spunwoven fabr cs will be to etminish t,ieir share. Spun yarn may, however, beable to maintain present levels of activity since decreasing demand from the:weavirg sector will be offset by increasing demand from other sectors, suchas knitting and carpets. 1/
93. The following table of U.S. textile shipment forecasts providessome caMparisons with the U.S forecasts. Shipments of course only reflecteonsunption if the relationship of foreign trade to production remainsconstant. Since an extrapolation of U.S. textile trade points to a growingunfavorable balance, the forecasts vill tend to underestimate consumpti )ngrowth. 2/
I/ Appendix II, para. 16, Cotton and Allied Textiles, Vol.I.
2/ Foreign trade io In any case in a smaller ratio to production thanin the U.K.
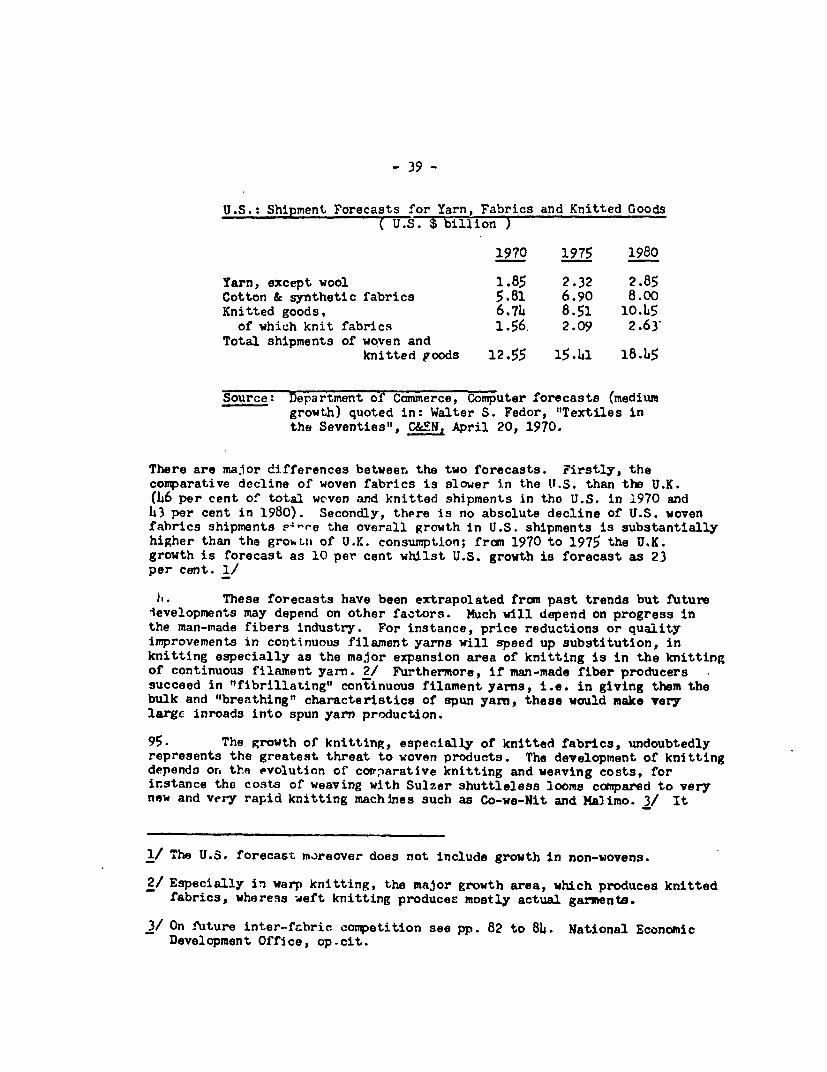
- 39 -
U.S.: Shipment Forecasts for Yarn, Fabrics and Knitted Goods( U.S. $ billion )
1970. 1975 1980
Yarn, except wool 1.85 2.32 2.85Cotton & synthetic fabrics 5.81 6.90 8.00Knitted goods, 6.7L 8.51 10.I5
of which knit fabrics 1.56. 2.09 2.63Total shipments of woven and
knitted poods 12.55 15.41 16.15
Source: Department of Commerce, Computer forecasts (mediumgrowth) quoted in: Walter S. Fedor, "Textiles inthe Seventies", C&EN, April 20, 1970.
There are major differences betweer. the two forecasts. Firstly, thecomparative decline of woven fabrics is slower in the U.S. than the U.K.(L6 per cent of total woven and knitted shipments in tho U.S. in 1970 and43 per cent in 1980). Secondly, there is no absolute decline of U.S. wovenfabrics shipments -r:"e the overall growth in U.S. shipments is substantiallyhigher than the grohLtl of U.K. consumption; from 1970 to 1975 the U.K.growth is forecast as 10 per cent whilst U.S. growth is forecast as 23per cent. 1/
1h. These forecasts have been extrapolated from past trends but future1evelopments may depend on other factors. Much will depend on progress inthe man-made fibers industry. For instance, price reductions or qualityimprovements in continuous filament yarns will speed up substitution, inknitting especially as the major expansion area of knitting is in the knittingof continuous filament yarn. 2/ Furthermore, if man-made fiber producerssucceed in "fibrillating" continuous filament yarns, i.e. in giving them thebulk and "breathing" characteristics of spun yarn, these would make verylargc inroads into spun yarn production.
95. The growth of knitting, especially of kcnitted fabrics, undoubtedlyrepresents the greatest threat to woven products. The development of knittingdepends on the evolution of corparative knitting and weaving costs, forir.stance the costs of weaving with Sulzer shuttleless looms ccmpared to verynew and very rapid knitting machines such as Co-we-Nit and MaJimo. 3/ It
1/ The U.S. forecast moreover does not include growth in non-wovens.
2/ Especially in warp knitting, the major growth area, which produces knittedfabrics, whereas weft knitting producec mostly actual garmenta.
3/ On future inter-fabric competition see pp. 82 to 8i. National EconomicDevelopment Office, op.cit.

- 140 -
also cepends on the evolution of comnarative fiber costs and qualities. .o,'nistance the "boom" in knitted nylon shirts and sheets in Western Europe :n
the 1960s reflected both nylon's low price and its easy-care qualities.The subsequent perfection of polyester/cotton easy-care finishes and thefalling price of polyester may well hdv- created the conditions for wovenshirts and sheets to recover their share oet the market.
96. The outlook for non-woven goods, 1/ which have mostly disposableuses, seems more limited. Whilst some cos. advantage might be achieved a.the fabric level, making-up costs are simi tar to those incurred for normatextile goods and the resultant overall cJ.;t tends to be too high for a;-:posable article. There are further prc.lems of consumer acceptance of
-conventional materials. Whilst non-wovens have bright prospects in..._Ous non-apparel applications (hospitals, for inJtanze). their prcspec-s
in apparel are not thought to be vcry good. 2/ Developments in the autormz.Wmof making-up processes, such as the welding, instead of stitching of seam..could however, make non-woven goods viable in the future.
97. The several forms of substitution constitute a definite erosion a:'-.rkets which developing countries have traditionally supplied. This may be-necially critical where the overall market itself is only growing slowly.
c consumption patterns are changing, they are not, with the expection o'.on-wovens which in any case tend to cater for specialized markets, chang[IrF,to products which developing countries could not export. Already r,,anydevelcping countries are exporting knitted goods. Again the increased roleof man-made fibers in these substitutes underlines the importance of developinigcountries being able to obtain man-made fibers at world prices.
Conclusions
98. The most recent (196R) evidence from census data strongly suggest.!-.that, whilst there may have been some small cases of rclative capital-intensification, the claim of certain cotton industries in industrializedcountries during the 1960s that the industry was becoming more capital-intensive than many other industries was certainly not true. The latesogenerations of spinning and weaving equipment may offer Western Europe somepossibilities of relative capital-intensification, but higher wage rates andsmaller potential for rationalization may preclude this in North America.However, re-equipment in industrialized countries is not proceeding very fast
1/ 'Rroadl-y speaking these are fabrics made of punched or needled felts, O
.bers and reinforced paper. For a more exact definition see p. 7, ChaseXanhattan Ba..k, The Expanding Market for Non-Wovens in the U.S.A., 1969.
2/ Sec. "Short Life Fabrics", pp. 8L to 86, Rational Economic Developmert0:`c6, op.cit., Chase Manhattan Bank, op.cit., p. 12, sees some moderateincr,ase in consumer demand for apparel but est mated 1975 sales of$63-?3 million would represent only one per cent of tDtal woven fari cs.ipmanL forecasts for this year.
3/ T; cv>ognce of income elast-.cities of demand in para 86 suggests t-at E.E.C.Mare^- '*OAd develop rather along slow U.K. lines than along moreci.-...:ec :._z. -ines.

- Li -
and may be nullified by wage rises when it is eventually achieved on a largescale.
99. The precise effect of substitution is difficult to establish butthe following general conclusions cas be made. It is not likely thatsubsti+ution will be far-reaching enough to shut out developing countries;there will still be large markets for standardized goods such as grey wovenfabrics and certain simple made-up goods, but these markets will be theleast dynamic. They may in fact present difficult obstacles to somedeveloping countries as man-made fibers become increasingly important inputsfor some standaraized goods. In man-made fibers, as in other forms ofsubstitution, it is again certain developing countries, those which are themost "trade-oriented", which will suffer least from substitution. Theywill be able to obtain man-made fibers at competitive rates, they will beable to react to some fashion developments at least, and they will probablybe the countries which can move with the most ease into exporting knittedgoods.
III. POLICY OPTIC'NS FOR DEVE'rOP.G hYD I'3DUSTRIALIZED COUNT.-:.c
100. Part III wi'Ll attempt to apply the conclusions of Parts I and IIto the commercial policy options that are open to industrializ6d countriesand, in a briefer fashion, to the export options for developing countries.
Developments in Comparative Advantage
101. The census and cost data presented in Part I of this paper,together with the evidence of trade tre:-ds in the working papers on U.K.,E.E.C. and U.S. imports, give 3t.rong evidence of a realized comparativeadvantage of developing countries in cottnn-type textiles. The majordeterminant of this advantage is the compar.atlve labor-intensity of thecotton and clothing industries; it also dep--ds on the general absence ofinhibiting or distc.-ting factors in international trade such as product-differentiation, monopoly and unequal supply conditions of inputs.
102. Certain developm"ents in industrialized countriuis, however,threaten this comparative advantage, parti eu)arly in the case of the lessadvanced developing countries. The cotton indiustry's attempts to becomecompetitive througi increasingly capital-intensive methods of production,through destandardization of protlucts and through the increased use of man-made fibers, though not entirely sucresaful, navo if anything strengthenedthe competitive position aJso of the nemi-industrialized Southeast Asiancountries vis-a-vis the less advanced developing countries.
103. These attempts by cotton industries in industrialized countries tore-establish competitivity have in many instances been accompanied bysectoral re-organization schemes, often govornment sponsored, 1/ aimed atscrapp'ng obsolete or idle equipment and financing new equipment. Thisclearly points to a generalized "competitive response" to the problem oflow-cost imports.
Protection in Industrialized Countries
lol. At the same time there has also been a generalized protectiver.sponse which has had two, not necessarily compatible, aims; firstly tocreate the conditions for a successful competitive response, i.e. the "reborn-infant-industry" 2/ argument; secondly to dampen or nullify the comparativeadvantage of developing countries. The protactive response has beeninstitutionalized in the Long Term Arrangement for International Trade inCo-tton Textiles. This, as a special exception to GATT rules9 has since 1962
1/ See para 122.
2/ Hal B. Lary, op.cit. p.81.

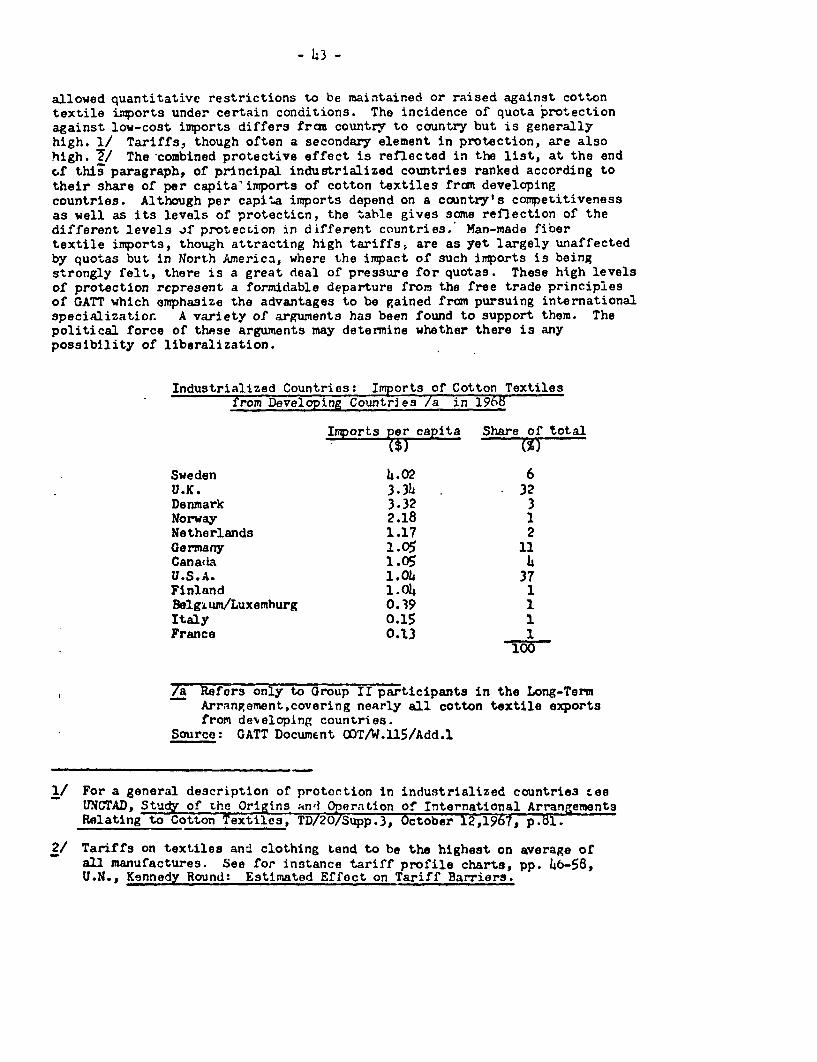
- 1-3 -
allowed quantitative restrictions to be maintained or raised against cottontextile imports under certain conditions. The incidence of quota protectionagainst low-cost imports differs frcu country to country but is generallyhigh. 1/ Tariffs, though often a secondary element in protection, are alsohigh. 7/ The combined protective effect is reflected in the list, at the endcf this paragraph, of principal industrialized countries ranked according totheir share of per capita' imports of cotton textiles from developingcountries. Although per capita imports depend on a country's competitivenessas well as its levels of protecticn, the tahle gives same reflection of thedifferent levels if protection in different countries.' Man-made fibertextile imports, though attracting high tariffs, are as yet largely unaffectedby quotas but in North America, where the impact of such imports is beingstrongly felt, there is a great deal of pressure for quotas. These high levelsof protection represent a formidable departure from the free trade principlesof GATT which emphasize the advantages to be gained from pursuing internationalspecializatior. A variety of arguments has been found to support them. Thepolitical force of these arguments may determine whether there is anypossibility of liberalization.
Industrialized Countries: Imports of Cotton Textilesfrom Developing Countries /a in 196t3
Imports per capita Share of total
Sweden 4.02 6U.K. 3.3I 32Denmark 3.32 3Norway 2.18 1Netherlands 1.17 2Germany 1.05 11Canaia 1.05 hU.S.A. 1.04 37Finland 1.04 1Belgium/Luxemburg 0.39 1Italy 0.15 1France 0.13 1
100
/a Refers only to Group II participants in the Long-TermArrangement,covering nearly all cotton textile exportsfrom de%eloping countries.
Source: GATT Document OOT/W.115/Add.l
1/ For a general description of protection in industrialized countries *eeUNCTAD, Study of the Origins and Operation of International ArrangementsRelating to Cotton Textiles, TD/20/Supp.3, October 12,1967, p.bl.
2/ Tariffs on textiles and clothing tend to be the highest on average ofall manufactures. See for instance tariff profile charts, pp. 46-58,U.N., Kennedy Round: Estimated Effect on Tariff Barriers.

105. The most general and persuasive argument is that which deniesthe feasibility of economic adjustT..ent, i.e. the transfer of resourcesfrom contracting to expanding industriee. This denial may reflect nroblema
peculiar to the cotton industry created by immobile labor (typicallyhousewives) in areas lacking alternative employment; it may reflect the
cost of retraining labor or re-uqing -apital resources. The argument is
usually renresented as a plea to protect labor - a plea particularlytelling in the U.S. where the Cotton Industry's location in the Southe.-nStates ana its generally low wage rates mean employment of predominantlylow-income labor. Equally telling, though seldum explicitly representedas such, is its validity as a plea to protect business; after all, evenif the cost of adjustment is not too high for the econony overall, it maywell be too high for the textile entrepreneur. 1/
lOo. The second ii3portant arguidnt., the "reborn-infant-industry"ar-ument, has been used far more frequently itn Western Europe than in theU.S. This probably reflects ihat loder Eurcpean wage rates are thoiught to
give more potential than itt the U.S. for cutton industries to becomecompetitive through re-equipment. It probably also represents an ex post
facto justification tor various reorganization schemes in Europe. The new
infant industry argument is open to critLcisM on several grounds. Firstly,
the evidence on whirih it has been based has been unsound, mostly because
its proponents have not argued the capital intensification of the cotton
industry in terms of othor industries but in terms of its own past
perlormance. On the basis of :,lich evidence, not only governments, but also
certain international organizations with some concern in development, have
espoused the view that LXector-intor.stLy reversal is oocurring in the cotton
industry. Such a view cail lead to important cotmercial policy and investment
decisions.
107. The data in Part II did not suggest factor-intensity reversal.
Such capital-intensification as ihas taken plaze, may reflect either that
protection has successfully clannelled R and D resources into the cottonindustry 2/, or that the absence of protection has spurred on modernization.
On this topic there is no agreement in studies on the cotton industry:
Cotton and Allied Textiles states that "Historical data does seem to suggest
that. countries with tile highest rate of growth of productivity (in 1958-
1963) were those suffering the least penetrati-n from low-cost imports", 3/
1/ The argiment denying the feasibility of adjustment also appears in aslightly different form. It often results from the proponents' failureto grasp the mechanism of adiustment, rather than their denial of its
feasibility: increased imports are seen only in terms of jobs lost, not
of labor transferable to othier occupations. The primacy of the protection-
of-labor argument in the U.S. also ref?ects its high rates of unemployment
compared to Europe.
2/ Also that rising levels of value added per employee relative to the rest
of industry were achieved partly through rising levels of protection of
value added.
3/ Para 11, Vol.I.
- 25 -
whereas Professor de Bandt sees a correlattion in the oppOsite direction:
"Il faut rappeler que lea pays qui ont lea balances extra-C.E.E. n4gatives,
ont Sgalement des balances intra-c.E.E. negatives. Ceci ne les empeche
cependant pas dlavoir connu les rythmes d'accroissement les plus Elev6s
de la production et de la p.roductivit6 (et grace & celle-ei. )l.i/
10c. Desp.te the fact that it is clearly debatable that "infant-
industry" protection is the railckest way +o moderrn:zation, tne argunent
remrains vdry attractive to industrial ized countries. Given even the
possibility of their cotton industries becoming coxpetitive, industrialized
countries will be all the less inclined to think in terms of reduced levels
of protection and the cost of adjustment that this may involve.
109. The reborn-infant-industry argument contains other dubious
assutntions. Wh:4st infant industry rrotection is accepted as a measure
that could be taken by developing countries acnordarg to the .vUles of
international trade (Part TV of the GATT), the same rule is not applicable
to industrialized countries. If this argunent for protection attains
"respectability" in the case of the cotton industry, it might create a
dangerous precelent for other industries. Secondly it assumes that a
relatively capital-intensive industry in industrialized countries will
automatically be more competitive than a relatively labor-intensive industry
in developing countries. 2/
II(. The third arigument for protection, which is especially strong in
the U.S., i3 the argurJent against malpractices In international trade.
Malprac.tices are undeniably wiieespread and the argument is applied to low-
-ost imports from many sources. The main malpractices are as follows:
i. Export subsidies: there is a widespread practice, particlarly
among some of the lesa-advanced developing countries, of subsidizing exports
of cotton textiles.
ii. Marginal pricingt high protection of the dmneatic marketa
of certain low-cost ccrmtries allows then to export at margical, (and
difrerentiated according to export market) or even duping pricea. This Is
a more difficult "malpracticet ' to consider than Wi) since a great deal of
the world's exports are to an extent marginally priced.
1/ J. de Bandt, cp.cit., p 122. His assertion is sore in line with much
current economic thinking.
2/ This is by no means proven, if only because theru i a greater mobility
of factors of production in industrialized than in deveioping countries.
The argument, in its sirmplest terms, is that if country Ak has only one
industry, x, and country B has two industries, x and y, country Ak has
the ccwarative advantage in x and B the comparative advantage in y.
3/ Paras 100-102, Cotton and Allied Textiles Vol.I, give asce account of
such arrangements affecting British istports.
- L6 -
iii. East B'loc export pricing: East Bloc countries export at
dumping prices since their prices do not reflect their costs. The E.E._.
complains particularly that textiles are used as "currency" in barter deals
with Eastern Europe. 1/ A particular ccmplaint against Hong Kong export3,
no doubt reflecting a'bsolute "innocence" in respect of subsidization or
marginal pricing, is that it profits from Chinese yarn and cloth imports
(the accusation is made in spite of Hong Kong's rigorous and internationally
accepted Certificate of Origin SysteM).
iv. Ixport restrictions by exporting countries: industrialized
countries argue against some developing countries, but Japan in particular,
that a certain amount of reciprocity is required: that Japan should respona
in kind to their liberal import policies for textiles and other Japanese
exports.
v. Maldistribution of imports: the U.K. and the U.S. argue that
other industrialized countries should accept a comparable and "fair"
burden of imports from developing countries. 2/
111. These arglments provide much ammunition for protectionists, but
in a sense they tend to cloud the basic issues. Legitimate argxents
against particular cases of malpractices become a general argurmnt against
low-cost imports from all sources, whatever the degree of innocence of
malpractices. There is also a confusion of issues: particular arguments
against East Bloc and Japan imports should be kept separate from the argument,
es5;entially involving subsidization against developing countries. The
question of subsidization itself cl,uds the issue o, comparative advantage
since it suggests, contrary to the evidence of this paper, that developing
countries are net internationally compstitive. 3/ What is clear is that
liberal import policies cannot be demanded of industrialil.ed countries in the
name of GATT principles when .iome developing countries have export policies
inconsistent with GATT. L/
112. There are residual arguments for protection, espoused by cotton
industries and labor unions rather than by goverximents, which, if they are
not as "serious" and politically effective as the preceding arguments,
testify to the strength of protectioijist feeling. There are arguments which
pretend some concern for developing countries: protection, they maintain,
discourageL not only mono-industrialization in developing countries but also
1/ J. de Bandt, op.cit., p.126 .
2/ In absolute terms the U.S. "burden" of irports from developing countries
is large, but it is not large in per capita terms (see table in para 104).
3/ Some of the developing countries tend of course to be uncompetitive in
th'e markets of industrialized countries, but the fiercest competition
c,JZhes not from domestic goods on these markets, but from competing imports
from low-cost sources.
/ In any case the cost of suosidization may often be too high for exporting
countries.
- L7 -
"sweat-shop" labor conditions. This last contention in its most extreme
manifestation sees "sweat-s.op" production as a malpractice or "unfairtY
advantage called ;'social dunping". 1/ It is further argued that cotton is
to an extent a "atrategic" incustry and, in the U.S. erpecially, that
textile import restrictions help the balance-of-payments situation.
113. The protectionist umbrella, then, covers a surprising diversity of
arguments. Some of these criticise the assumptions of automatic adjustment
implicit In oonventional trade theory and practice 2/, whilst others are
clearly anti-economic. EXtraneous political considerations also introduce
complications, a prime example being the role of the race and poverty issues
in some U.S. arguments. In spite of their diverse origins, however, the
arguments together represent a powerful political force which promises poor
immediate prospects for liberalization, especially as the lobby for
liberalization is clearly less organized than the protectionist lobby.
Liberalization in In-untrialized Countries
ilh. There is one central argument for liberalization: increased
international specialization means increased wealth. All the post-war moves
to reduce trade barriers and create common markets, etc., among industrialized
countries testify to their recognition of the importance of international
spocializaticn.
115. This kind of specialization between industrialized countries is
essentially based on economies of scale. A now potential for specialization,
this time based on differing factor endowments, presents itself as develcping
countries reach the stage where they can supply industrialized countries
with many of their needs in terms of labor-intensive manufactures. Specifically,
once industrialized countries abandon the most labor-intensive industries
in favor of imports, they can use the resources thus liberated in higher-
value industrios. There will be higher returns to labor and canital and
consumers will profit by ^btaining labor-intensive manufactures from the
cheapeat foreign sources. Moroever, the extent to which developing cointries
can realize their export potential will determine the extent of their
purchase cf capital and other sophisticated goods frcua industrialized
countries.
116. In fact, the future growth rates of industrialized countries may
well be decided, in large part at least, by their willingness or capacity to
upgrade production through the pursuance of international specialization.
For instance Japan's reliance on foreign trade and its rapidly rising wage
rates are obliging it to export some of its more labor-intensive operations
1/ Hence demands by U.S. labor unions for international labor standards
and minimum wages.
2/ Such an implicit assurption is made, for inatance, in tariff-cutting
rounds.
- La) -
and to move irnto r.igaer-value aztivitles. I/ Japan represents an extreme
case of _djustzaent to changing conditions of international competitivity; it
also represents an exLreme case of rapic growth. Most other induutrializedcountries, less reliant on foreign trade and with slower-growing wage bills,
have as yet showed little realization of this potential source of growth
and consequently little ±intention of moving out of labor-intensive aci.avities.
It is possible to discern the beginnings of such n realAzation in government
circles, but as yet on a very general levcl. In the E.E.C. for instance the
agricultural problem is essentially one of a low-yielding industry. 2/
117. A further, and presently particularly relevant, argument for
liberalization, is that protection invites retaliation - (this in a sen3e
simply restates the free-trado principles underlyirig modern international
trade practice). There have been warnings recently, for instance, within
GATT about the dangers of a new trade war. 3/
118. The argument for liberalization is unnassailable as long as the
costs of adjustment, such as unemployment and the exacerbation of regional
problems, are not too high. There is a strong line of thought that the cost
in industrialized countries is .oo high, (viz. the first of the protectionist
azrguments, para 105), therefore the possibilities of liberalization are
contirngent on the feasibility of adjustment. Adjustment assistance measures
to meet the problems of uncompetitive dorestic industries are by no means
new. Many such measures have been carried out in industrialized countries
over the last ten years; these have been both public and private initiatives,
many of them specifically aimed ..t the cotton industry. Adjustmentassistance, however, covers a wide range of aims and methoda which must be
defined specifically with the present concern in mind: the feasibility of
liberalization through adjustment.
119. Adjustment assistance policies have had two main aims2 "(1) to
increase competitiveness and productivity through modernization and
rationalization of oquipment; and/or (2) to encourage the transfer of
factors of production into other 1iner of activity". h/ The ccopetitive
1/ Japanese foreign textile investmenta have already been mentioned in para 32.
See also para 20, Jack Baranson, The Automotive Industry in the Republic
of China, IBRu, on Japanese automotive investments abroad.
2/ The recent report La Politique Industriqlle de la Corvunaute, Memorandum
de la Conmission au Conseil, liarch 16, 1970, (the "Colonna Reportn),
recognizes the need for the E.E.C. to adapt to new situations of inter-national competitivity.
3/ "Bid to avoid Trade War", The Times, August 3, 1970.
I/ Para 71, UNCTAD, The Anplication of Safeguard Clauses and AdJuetment
Assistance )easures to industries facing ILport Competition, TD/19/Supp.2,
January 11, 1.

- 49 -
response (1) and the transfer-of-activity r'esponse (2) are not incompauiblesince increased competitivity mar involve upgraaing of the product andabandonment of the lower end of the domestic mirket to imports. However,it is essentially the second objective which is the means to liberalization,especially as competitive response policies are often unsuccessful andthe industry continues to rely on protection.
120. The competitive response policy relies mostly on aids toenterprises; these can take the form of investment grants and accelerateddepreciation allowances, etc. If productivity improvement also requiresthe scrapping of obsolete or idle capacity, there may also be premiums forscrapping equipment and certain grants and relocation facilities extendedto redundant labor. The transfor-of-activity policy might be expected toinvolve principally the relocation of labor (since capital tends to be lessspecialized and more mobile than labor). Again, however, there might be apremium element involved as a compensation to firms going out of businessbut, more importantly, there might oe incentives to fims outside theitricken sector to relocate in areas where labor is becoming redundant.
121. The transfer-of-activity policy would seem to require governmentintervention where it is not necessarily required by the competitive responsepolicy since the latter can be and often is a private industry initiative.Industries can for instance make levies on their members which finance R andD, investment and scrapping. A policy aimed at tranr.ferring resourees fromone sector to another, on the other hand, would requiire public assistancesince it would probably involve more than one industry, and aince clearlyno industry can be expected to preside over its own demise or decline.
122. Both UNCTAD and the Cotton Textiles Committee of GATT have donesome descriptive work on actual ad.justment policies. 1/ Most of these arespecifically aimed at the cotton i.idustry, although sm e,such as provisionsIn the 1962 U.S. Trade Expansion Act and thA E.E.C. Social Fund, aregenerally applicable to all industrial sectors which may be hit by theeffects of increasing international specialization. 2/ The policies aimedat the cotton industry have very v.ach tended to be o? the competitive responsekind. Some of these polieies, such as preonntn Dutch government credits forInvestment or past U.S. tax-relief measures. have simply aided re-equipment.Others, such as the U.K. Cotton Industry Act 1959 and a French para-fiscaltextile tax 31/ have additionally e.ontained scrapping and labor compensation
1/ OATT, Cotton Textiles 1962-1968: Trends in Production and Trade andPolicy Measures Arfonting Them, COT/WillS, SepterDer 26, 1969, pp 32-65;UNCrAD, Adjusament Assisuince Measure3, TD/B/C.2/86, November 20, 1969.
2/ UtNCTAD, op.cit., paras 28-35 and 56-60.
3/ OATT op.cit., see pp 1O-51 for a description of government measures inthe cotton Industries of industrialized countries.

- 5o -
elomonts. Theie last elements do not imply a transfer-of-activity policy, 1/they simply indicate that modernization in a relatively otagnant marketmeans fever machines and.fewer workers.
123. A transfer-of-activity policy would require alternative, or atleast additional, measures, offering labor redepolywrnt and retrainingschemes and regional incentivea for indu3trial re'rocation. This last measureseems to have been under-emphasized in some literature on adJustmientassistance. It may well be crucial, since, if other industries are relocatedin predominantly cotton-industry areas, redeployment could easily beeffected through the higher wagec they eruld offer to the labor in the cottonindustry. 2/
121. No such policy has yet materialized. The:oe is however aninteresting development in Canada which amounts to a semi-conmitment toreduce protection of the textile industry. The main point of proposednew legislation is to "create conditions In which the Canadian textile andclothing industries continue to move progressively towarns viible lines ofproduction on an increasingly competitive b&si3 internationally". 3/ Thespecific aim is for Canada to be able to compete internationally with onlynormal tariff protection. Quota protection will be given on eertainproducts only when damage, or threatened damago frem imports to domesticproducers can be proven and ory if plans can be submitted by theseproducers to restructure, phase out or upgrade their production. Whilstthere is, then, the suguestion that Canada will abandon those lines in whichit cannot compete, the provisions for relocating displaced labor are lessclearly mapped out. h/ However, there is at least a coaitment to solvethe imports problem Tn d positive manner. 5/
125. Up till now not any Industrialized countries have faced majorproblems of adjustment, if only because of the import containment policies
1/ The U.K. moasures# while taking place under conditions of falli-gproduction, were aimed at arresting the trend.
2/ There may of course also be a competitive response In the cotton Industryto competition for Its labor.
3/ Statement to the House of Commons on the Textile Policy made by theHonourable Jean-Luc Pepin,- nister of Industry, Trsae and Commerce,May lb 97,p. 9.
/ Labor dislocation problems would mostly be tackled according tonormally established programs by the Department of Manpower and,Iigration.
5/ IThs U.K., already a comparatively liberal importer, has undertaken tophase out quotas from 1972 cnwards; but it will also introduce in1972 a tariff on previously tariff-free cotton textile imports fromCommonwealth sources.

- 51 -
that have prevailed. The U.K. is a mu'or exception. Increasing importssince the middjle 1950s have spurred on a contraction of the industry thathas been taking place, through the loss of export markets, since the1920s. Althcugh contraction has been rapid by any criteria (levels ofactivity have been halved in less than twenty years), it has been achievedin a fairly orderly manner. The Lancashire area has borne the brunt ofthis contraction but haS successfully managed to diversity into otheractivities such as engineering without suffering levels of unemplloymenttoo far above the national average. I/ The Lancashire area is adamittedlynot a depressed one, but neither 13 It designated as one of the areas ofmaximum growth. 2/ Alternative employment prospects have, however, grown-steadily but this may be partly the result of the wartime relocati n ofindustry outaide South-East England.
126. The U.K. experience suggests that the potential of adjustmentwithout govornment aid may have been underestimated in some instances. TheU.S. cotton industry, for instance, although it is concentrated intraditionally poor areas of the South, is beginning to feel the pressureof new industries, attracted by the relatively low wage rates, moving intothe area and coespeting for labor. This Is rwfleeted not only in an upwardpressure on wages but also in a growing rate of 3abor turnover in cottonmills. 3/ The labor situation is generAlly tighter in Europe than in NorthAmerica, and European cotton industries have experipnced similar di'nicultiesin hiring (especially on shift-work) and retaining labor. Li/
127. That the main thrust of adjustmont asiiatance has so far been ofthe ccaentitive response variety is understandable sinee, clearly, it isthe easier alternative both for Rovenumnts and, even more, for industries.But the competitive response a involve certain costs to the government,(and protection involves certain costs to the consumer), which, if theindustry fails to achieve international crmpetitivity, are wasted. ifdeveloping countries have the long-term advantagq in much of cotton type,textile production 5/ as this paper has suggested, the costs ivolved inthe alternative policy of transfer-of-activity are far more likely to berecouped. Not enough Is known about the modalities and costs of this kindof adjustment assistance and, clearly, the subject requires more study.
1/ Cotton and Allied Textiles, Vol.l, para Li16, and Lancashire and MArseysideIndustrial Devolopment Asmnclation, The Decline of the Cotton and coalMining Industries of Lancashire 1961.
2/ It is officially an intermediate or "greya area.
3/ On the U.S. industry's labor problems asee "Troubled Textiles," WallStreet Journal, July 29, 1970.
IJ Cotton and Allied Textiles, Vol.I, par8 416.
F/ Clearly the fashion and speciality elements in tex..iles are importantenough for domestic industries to retain some of the domestic market.

- 52 -
However, it may be more feasible and less cos:.ly t/ than has often been*ho-ught: Dast U.K. experience and the present laDor problems f'acing cottonindustr:es in several industrialiled countries suggest tha. the effect ofrelocated or new industries competing for labor in traditional textile areasmight be an effective means of adjustment.
Policy p'.ions for Developing Countries
128. The options open to developing countries partly depend, ofcourse, on the cc-uercial policies puriued by industrialized countries anddevelon.ments in such policies are unpredictab.e. The imediate outlookfor liberalization seem to be poor; the Long-Term Arrangement nas beenrenewed for another threR years and controls on man-made fiber imports,in the U.S. at ledast, seem Imiunent. Moreover several countries havepressing doMestic problems which may disincline them to taake on an additionaladjustment problem. For Instance, the E.E.C. gives priority to problemsarising from agricultural adjustment. In the langer tern it may be wrongto dinmisa the possibility or liberalization since countriea may come torealize its potential as a means of growth. In any case there are alreac2ysome comixtments to liberalization in several countries.
129. In the event of a move in industrialized countries towardsliberalization, 2/ such a move would at best be slow, not only be-aiseadjustment problems must be minimized but also becau._e it is onl; to beexpected that transfer-of-activity policies will be acoompanie' by competitiveresponse policies. Inctustrialized countries would naturally try to preserveas much of the cotton industry as could be internationally copetitive. 3/On top of the slow pace of liberalization, there are other elements whichsuggest that prospecto for developing countries are l.mited. Firs ly,there is a general world over-capacity in the cotton industry. It is a"natural" and easy industry candidate for industrializing countries andconsequently a "natural" export candidate. The investment plans ofindustrializing countries suggest that this problem of over-capacity willIncrease. Secondly demand in industrialized countries for the products ofthe cotton Industry, Including woven made-up goods, io amongst the moat
1/ To a certain extent the tendency to put too high a cost on adjustmentmay simply reilect an attitude, prevalent in industrialized countries,whict. lS not conducive to adjustment. The cotton Industry on the wholeseems unwilling to think of diversifying out of textiles or alternativelyof investing abroad. Such an attitude, presimably the reault of alargely dcmestic-market-orlented mentality in terms of trade, contrastsvery strongly witn the attitudes manlfest in Japan's textile investmentsabroad.
2/ The question of how liberalization might be effected is one that i' nottackled here. C1early, however, liberalization would be most feasibleif it were closely coord'Inated between industrialized countries.
3/ This is the ossence of the proposed Canadian policy.

- 53 -
undynamic. Unless other industrialized countries follow the apparent trendin North America of a reviving market for textiles, there may even be anabsolute decline in the size of the market if knitted goods, for instance,substitute at a fast enough rate. Thirdly, liberalization, especially ifit were across-the-board, would tend to be monopolized by the most competitivedeveloping countries, those in Southeast Asia, especially given theirad %ntages in securing man-made fibers at world prices.
130. Liberalization, then, would by no means be a panacea for the wholedeveloping world. On the cther hand it would mean significant gains forthe handfUl of countries best in a position to profit from it. For instance,if the twelve industrialized countries in the table in para 104 were toraise their per capita cotton textile iwports from developing countriesfrom the 1968 average of $1.18 to the U.K. level of $3.3t (with impo.tfrom developing countries supplying about 30 per cent of the domesticmarKet), the export receipts of developing countries would be roughlytripled. Thare would be similar opportunities for increased exports inman-made fiber textiles. In the present circumstances it seems that thecountries most likely to profit from liberalization would be those ofSoutheast Asia unless other developing countries took active measures torealize their potential comparative advantage: notably productivityimprovements, the securing of cheaper man-made fibers and, if these countrieswished to upgrade thdir exports to made-up goods, the acquisition of marketintelligence skills.
131. For those countries wishing to develop cotton industries who standto gain the least from liberalization, there are very limited alternatives.An increase in intra-developing country trade has very limited possibilitiesfor the reason that all developing countries seek to be self-sufficient intextiles. The greatest potential lies in raising domestic levels of textileconsumption.
132. The rather pessimistie conclusions that have been drawn for theexport prospects of developing countries in cotton-type textiles may havesome validity for other manufactures which become future export candidates.The seeds df protection against other product.s are already sown in, forinstance, the proposed U.S. trade legislation. There may also be groundsfor arguing that as soon as developing countries try to capitalize ontheir comparative advantage in a given product by exporting it in largequantities, industrialized countries may make a competitive response. Bythe sophisticatiDn of production techniques and patterns of demand theymight be able to reduce the export prospects of developing countries inthis particular product or, aL the very least, to Justify protection on"reborn-infant-industry" grounds.

FACTOR INTENSITY AND COMPARATIVE ADVAN TAGE
1. It is generally recognized that the theory of inteinational tradedetermination is in a state of flux and that trade determinants are far morecomplicated than is suggested by the Hckscher-Ohlin theory of comparativeadvantage stemming from different factor endowments. This has been the mostwidely-accepted theory of international trade for much of this century, butpartly owing to the tendency for observed trade trends not to conform tothe prediotions of the theory, it has been increasingly question)6d. Theprincipal assumptions of the theory - the identity of factor qualities,production functions, consumption patterns and input, prices between countries,constant returns to scale, and the international immobility of factors ofproduction - are all more or 3ess questionable and have lcd to modifications,if not rejections, of the theotry. 1/ As far as trad3e relations betweenindustrialized and developing countries go, however, there is still awidespread belief that a large part. of trade determination is accounted forby the traditional two Hekscher-Ohlin factors: labor and capital and theirrelative scarcity or abundance in industrialized and developing countries. 2/Labor-intensity has always been felt in the particular case of cottontextiles to be a prime determinant of the developing countries' exportsuccees. An advantage of this clearly over-simplified theory is that, since,compared to more complicated theories, to an exLent it is measurable, itmay at least provide sone bioad indications or the sources of comparativeadvantage. This annex will firstly attempt to establish the best measureof factor endowment in this two-factor model, and secondly to 6xamine someempirical work on the role of factor endowment in explaining trade trendsbetween developing and industrialized countries.
2. This test of the Hekscher-Ohlin theory assumes the strong-factor-intensity hypothesis, i.e. that industries can be internationally rankedaccording to factor-intensity (this follows from the assumed identity ofproduction functions and from constant returns to scale). The final partof this Annex will question this assumption and the phenomenon of factor-intensity reversal will be briefly discussed.
I/ See H.G. Johnson, Comparative Cost and Commercial ?olicy Theory for aDeveloping World Economy, Wicksell Lecture, Stockholm, 196b, for areview of the current state of international trade theory.
2/ But the third factor, natural resources, is increasingly realized tobe important in many cases.
Annex Page 2
The Measurement of Factor-Intensity
3. To test the Hekscher-Ohlin theory economists have traditionallysought to correlate observed trade trends (i.e. realized comparativeadvantage) with a measure of factor-intensity in an industry, a capital-labor ratio of one sort or another. The measure of factor-intensity hasproved problematic and inaccurate measures may well have been partly toblame for some past failures of the theory to account for fact. Forinstancs the famous "Leontief paradox" that, contrary to the factor-endowment prediction of the Hekscher-Oblin theory, the UJ.S. exportedlabor-intensive products, has since been tentatlvely explained by thefailure of Loontief's particular form of measurement of factor intensity,fixed assets per worker, to include human, as well as physical, capital. 1/
4. It is proposed to use here as a measure of factor-intensity valueadded per employee. This form of measurement has been principally developedby Hal. B. Lary in Iomorts of Manufactures from Less Developed Countries.Lary's main thesis is that wage value added per emplcyee represents withsame accuracy the skill or human capital-level required by a given industrywhilst the rest of value added per employed, non-wage value added, reflectsthe physical capital re6qirements of an industry. These two measures,i.e. total vr.lue added per employee, permit, unlike measures in previousstudies relying more on capital stock figures, "an integrated treatmentof the flow_, of eervices rendered by capital and labor in manufacturing". 2/
5. Lary argues that wage value added per employee reasonably* reflects different skill levels in different industries 3/ but thatdifferent levels of unionization, different non-monetar7 payments to laborand higher wage rates in growth industries can distort the overall pattern.Non-wage value added is more oroblematic in that not much more than halfof it represents expenses rclated to physical assets. However, using1957 U.S. census data, Lary found a meaningful relationship between non-wage value added and capital stock. W/ The major distortions introducedinto non-wage value added as a reflection of capital services derivod fromdifferent rates of advertising, of R & D expenditure, and of profit levelsfrom industry to industry. There was also the effect of business cyclefluctuations but this did not seem to be over great.
1/ See H.G. Johnson, op.cit., p.12.
2/ Hal B. Lary, op.cit. p 19.
I/ Ibid., see pp. 35-40.
l/ Ibid., see pp. 40-4i8.

LIST OF TABLES
Table 1 Selected Countries: '(lue Add.ed per Euployee in the Sp;nning,Weaving and Finishing end in the Clothing Industries as aPercentage of Value Added per Employee in Manufncturing, 1953,
1958, 1962 and 1967.
Table 2 United Kingdom: Industries with Low Value Added por Emnloyee,1958, 1963 'nd 1968.
Table 3 United Kingdom: Value Added per Employee in Selected Te,tileIndustries and the Apparel Industry' as a Pe-centage of ValueAdded per Eqloyee in Manufacturing, 195h, 1958, l963, and 1966.
Table 4 United States: Value Added per Emplc ee in Selected TextileIndustries and the Apparel Industry us a Percentage of ValueAdded per Foployee in Manufacturing, 1;'53 and 1958 to 1968.
Table 5 Canada: Value Added per Employee in Selected Textile Industriesand the Apparel Industry as a Percentage of Value Added perEmployee in Manufacturing, 3953, and 1958 to 1966.
Table 6 Netherlands: Value Added per 19ployee in Selected TextileIndustries and Ready-Made Clothing .actories as a Percentage ofValue Added per Eaployee in Manufactu'ing, 1953 and 1958 to 1967.
Table 7 Textile Council Int.ernational Coats Studyt Costs for "UpperQuartile" Mille in 11 Countries: Cotton Sheeting(construction 60/60, 20s/20s).
Table 8 Textile Council International Costs Stued: Costs for "UpperQuartile'! Mills in 11 Countriest Spun Rayon Fabric(construction 88 x 66, 32s/32s).
Table 9 Textile Council International Coats Study: Costs for "UpperQuartile" Mills in 11 Countries: Polyester/Cotton Shirting(construction: 92x80, 40ex0Os, except for Japan and Pakistan:123x66, 5a/h5s).
Table 10 Textile Council International Costs Stuady: Costs for "UpperQuartile" Mills in 11 Countries, 1967: Combed Cotton Yarn(50s).
Table 11 Textile Council International Costs Study: Spinning and WeavingtWags Costs, Productivity and Labor Cou"ta.
Table 12 Production Costs for 11 Countries by Stage of Production on anIndex Basis, 1967.
Table 13 Prices for Man-Made Fibers in Selected Oountrieo in Late 1967.
Table A - 1 Regression Results of C'zparative Advantage Tests.
Table A - 2 Data used in Coeparative Advantage Tests.
Annex Page 3
Factor Intensity as a Source of Comparative Advantage
6. A recent UNCTAD paper, The performance of developing countries asexporters of manufactures to the develo ped markot economies, I/ set out totest the theory of comparative advantage stemming fromerelative factorendowment usirg value added per employee as a guide to factor intensity.The 1963 trend ahare of developing countries in the totaL imports ofeighteen industrialized countries from 1960 to 1966 was taken for 57manufactured products at the SITC 3-digit level. 2/ The paper sought toexplain some of this share by those measurable factors suggested by economictheory as being the most relevant, skill requirements, physical capi'talrequirements and, in an attempt to make a correction for the unrealassumption of constant returns to scale, a scale factor. Accordingly wageand non-wage value added and value added per establishment were taken fromthe U.S. 1963 census for industries corresponding to the 57 productheadings and regressed (logarithmically) against the above ,mport share. 3/
7. The result of the regression (in row 1 of Table A-l) was thatthese three factors were held to explain 4&0 per cent of the import share.Whilst this is not a high correlation, it is a positive result, given theknown, if not measurable, distortions occasioned by other determinants oftrade and given the inaccuracies, firstly of value added data as a reflectionof factor intensi y secondly of marrying trade with census statistics.
8. As might be expected from the t.heory, skiU requirements, ref'ectedin wage value added per employee, rose as the developing countries' importshare fell. The theory would also lead one to expect a similar relationshipin physical capital requirements: however, this was not the case and it wasfound that a rise in non-wage value added correlated positively with a ris6in import share (although the regression coefficient was lower than thatfor average value added). The paper saw this particular result as adistortion introduced by three possible factors. The most likely of thesewas that the inclusion of very capital-intensive resource-based industriesaffected the result. A aecond factor was thought to be foreign ownershipin certain industries in developing countries which would mitigate thecapital constraint problem. Thirdly, it was felt that in snoe cases
1/ TD/B/C.2/91, 22 December 1969.
2/ See Table A-2. These were products for which in any one of the yearsunder consideration developing country exports to industrialized countriestotalled at least U.S. $3 million. The study excluded certain itemsthat were questionably manufactures or would otherwise clearly distortresults. There was also an originnl sample of 66 products but petroleumproducts and non-ferrous metals were subsequently excluded as clearlyresource-based industries in order to obtain a better result.
3/ The same exo-,cise was also carried out uoing the U.K. 1963 census butpoorer results were obtained due to the problems of marrying trade andproduction statistics.
Annex Page li
developing countries had to resort to capital intensive industries in aneffort to overcome the scarcity of skilled labor. However, the UNCTADpaper did not attempt to measure the extent of the "distortion" introducedby these three factors.
9. A closer look at the figures used in the regression seemed tosuggest the possibility of the first and third of these sugg6stions atleast. Firstly, it was clear that the more obviously resource-based industriesgave extreme results: their share of imports was higher than might beexpected from the performance of other industries with similar 16vels ofnon-wage value added per employee. This suggested that correlation mightbe improved with the additional removal of the most clearly resource-basedindustries. Nine industries were accordingly removed 1/ and the correlationcoefficient was improved by 9 percentage points (see row 2 of Table A-l).
10. Secondly, the figures suggested that industries with a low ratioof wage value added to total value added, i.e. industrieo where low skilllevels were combined with high capital requirements, did better than mightbe expected from the performance of other industries with similar levels ofnon-wage value added per employee. 2/ Accordingly some regressions wererun introducing this ratio as a variable along with wage value added andtotal value added. Both regressions, using 57 and 148 observations, improvedslightly on the original regression, (see rows 3 to 6 of Table A-l). Thesimilarity of the results of these last two regressions is hardly surprisingsince wage value added and total value added generally move in the samedirection and are, in any case, related by the ratio factor of wage to totalvalue added. Of the two regressions the one containing value added is tobe preferred to the wage value added one because it has smaller estimatedstandard errors. 3/
Il. Both the latter regressions are felt to be more satisfactory andlogical results from the point of view of the role of physical capitalrequirements than the first regression. This impression is reinforced bya closer look at the actual data which clearly show that of the LW8 products(once the nine closely resource-based industries are removed) only 12manage to attain a share of imports in excess of 10 per cent (and rising to29 per cent). The average capital intensity of these products, whether interus of human or phyical capital is well below the average for the 48 and
I/ These are lieted at the end of Table A-2 under "Additional products forsample of 57 products" (Nos. 4I9 to 57).
2/ This corresponds with observations that have sometimes been made ofcomparatively high labor productivity in "machine-paced" industries.
3/ For the sake of comparability the scale factor is retained in theregressions, but its exclusion would not greatly alter the result.
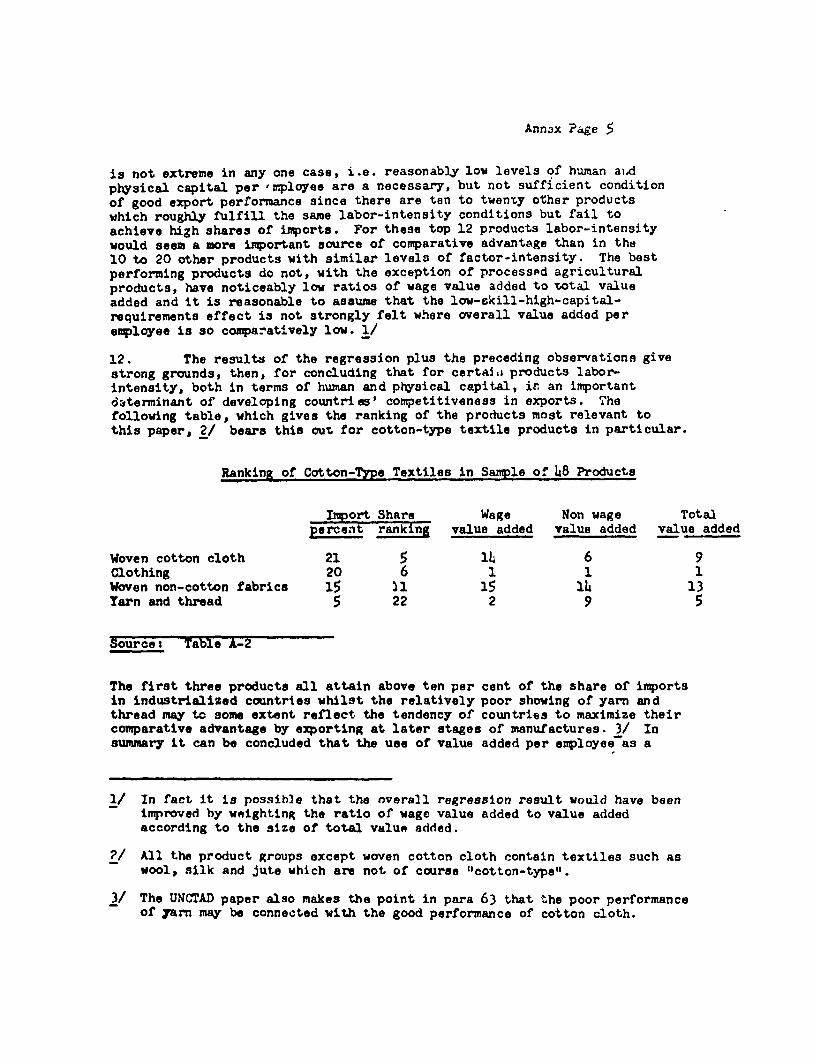
Ann3x Page 5
is not extreme in any one case, i.e. reasonably low levels of human aidphysical capital per mployee are a necessary, but not sufficient conditionof good export performance since there are ten to twenty other productswhich roughly fulfill the same labor-intensity conditions but fail toachieve high shares of imports. For these top 12 products labor-intensitywould seem a more important aource of comparative advantage than in the10 to 20 other products with similar levels of factor-intensity. The bestperforming products do not, with the exception of processud agriculturalproducts, have noticeably low ratios of wage value added to total valueadded and it is reasonable to assume that the low-skill-high-capital-requirements effect is not strongly felt where overall value added peremployee is so comparatively low. 1/
12. The results of the regression plus the preceding observations givestrong grounds, then, for concluding that for certAija products labor-intensity, both in terms of human and physical capital, in an importantdaterminant of developing countrias' competitiveness in exports. Thefollowing table, which gives the ranking of the products most relevant tothis paper, 2/ bears this out for cotton-type textile products in particular.
Ranking of Cotton-Type Textiles in Sample of 48 Products
oISort Share Wage Non wage Totalpercen ranking value added value added value added
Woven cotton cloth 21 5 14 6 9Clothing 20 6 1 1 1Woven non-cotton fabrics 15 11 15 14 13Yarn and thread 5 22 2 9 5
Source: Table A-2
The first three products all attain above ten per cent of the share of importsin industrialized countries whilst the relatively poor showing of yarn andthread may to some extent reflect the tendency of countries to maximize theircomparative advantage by exporting at later stages of manufactures. 3/ Insummary it can be concluded that the use of value added per employee as a
1/ In fact it is possible that the overall regression result would have beenimproved by weighting the ratio of wage value added to value addedaccording to the size of total value added.
P/ All the product groups oxcept woven cotton cloth contain textiles such aswool, silk and jute which are not of course "cotton-type".
3/ The UNCrAD paper also makes the point in para 63 that the poor performanceof Yarn may be connected with the good performance of cotton cloth.
Annex Page fi
guide to labor-intensity in cotton-type textiles wi1l provide a usefulmeasure to one of the developing countries' principal sources of comparativeadvantage in these products.
Factor Intensity Reversal
13. Normally, in order that incustries can be internationally rankedaccording to factor-intensity (the strong factor-intensity assumption of theHekscher-Uhhlin theory), all industries must have (in addition to constantreturns to scale) an elasticity of substitutior. of capital for labor of thesame magnitude. 1/ In this way, as the ratio of wages to capital costs-changes from one country to another or changes over time in one coitntry,different industries, though changing in absolute factor-intensity would notchange their factor-intensity ranking within one country. If however theelasticity of substitution differs from industry to industry, that is, ifone industry substitutes capital for labor at a faster rate than others,factor-intensity reversal may occur. If factor-intensity is a leadingsource of-comparative advantage, then such a reversal would clearly confusethe issue of which countries hold a comparativa advantage in which products.In a world where the strong-factor-intensity assumption holds good, it canbe demonstrated, in theoretical terms at least, that a capital-poor countrywill obtain absolute cost advantage in labor-intensive products and acapital-rich country in capital-intensive products. It is far more difficultto know which country will obtain the ahsolute cost advantage in a givenproduct which the capital-poor country manufactures labor-intensivelyrelative to the rest of its industry and the capital-rich country manufacturescapital-intensively relative to the rsst of its industry.
1T. Economists have concentrated on factor-intensity reversal since theearly 1960s mostly in terms of the Constant Elasticity of Substitution (C.E.S.)production function. If this particular production function prevails,different industries will have different, inherent and constant elasticitiesof substitution of capital for labor. The chart below, gives a hpotheticalillustration of the possibilities of factor-intensity reversal with C.E.S.production functions for countries at different stages of development. 2/The capital-labor ratio or degree of ccpital-intensity (K/L) is plottedagainst the ratio of wages to capital costs (w/r) (logarithmically so thatthe C.E.S. is represented by a straight line). Clearly the normal criteriaof com:parative advantage cannot hold if, as in the chart, food products arelabor-intensive in Southern Asia and capital-intensive in the U.S.
1/ This is nornmally taken to be unity as, for instance, in the Cobb-Douglasproduction function.
2/ The chart is also illustrative of what might happen in one country overtime in a world of given technological possibilities as the cost oflabor relative to capital rises.

Annex Page 7
itypvtiel¢icail llZrestrition of ixotnr-lortrittaty R.-versfl/s l.ft/lt rilenint
Elasticity ul Su%.Iitiitimtl Ui'tw#.e'i Capital id lbhaor
K
I...~~~~~~~~~~~~~~~I
L+ 1_1+ .L LJ . Lj .. ; I. -
.outErr JapeR W*slern UAktedAsia cUrO" Aonto$
Sources Hal B. Lary, Imports of Manufactures fromLasn Dsvelooed iuntieos p. 5h.
15. The C.E.S. production function uikes two assumptions, as indeeddo other theoretical production functions, which do not accurately reflectreal-world conditions. Firstly, in thn C.E.S. production function thelevel of technology is given and countries chose a combination of laborand capital, according to their ratio of labor to capital costs, withinthe area of known technological possibilities. Secondly, theoreticalproduction functions assume maximum efficiency in any combination of capitaland labor. Now, it would seem an acceptable hypothesis that "unsystematic"
Annex Page d
factor-intensity reversfal can occur Lhrough different industries havingtemporarily different elasticities of substitution of capital frr labor:this mnight be the result either of technological adtvance occaring atdiffter.int rates in different indiustrtus at a certain moment or of industriesfunctioning with difterent degrees of effiriency over time. Such unsy3tematicchanges in factor-intensity may even havo identifiable causations: unequallevels of protection of different industries may allow some to devote moremoney to R & D than others; unequal levels of competition from imports maylead to a "competitive response" and consequent productivity increases inthose industriea most affected by imports.
16. Economists do not seem to have provided an unanimous answer on theexistence and incidence of factor-intdneity reversal in the present-dayworld. Fram Lary's discussion of factor-intensity reversal 1/ it seemsthat the strongest examples of this phenomenon have come from agriculturalproducts where in any case the third factor, natural resources, pleys animportant role. However, whilst it seems difficult to establish actualcases of factor-intensity reversal in manufacturing industry, the possibilityof such a reversal, especially in an "unsystematic" form, cannot be ruledout as a potential phenomenon. 2/
1/ Hal B. Lary, op. cit., pp. 51-58.
2/ This may be particularly true as developing countries, with potentiallylarge advantages from their low wages, move increasingly into manufacturingfor export to industrialized countries.

LIST OF TABLES
Table 1 Selected Countries: r alue Added per Employee in the Sp;nning,Weaving and Finishing ind in the Clothing industries as aPercentage of Value Added per Employee in Manufncturing, 1953,
1958, 1962 and 1967.
Table 2 United Kingdom: Industries with Low Value Added per Emnloyee,1958, 1963 -nd 1968.
Table 3 United Kingdom: Value Added per Employee in Selected TextileIndustries and the Apparel Industi7 as a Pe-centage of ValueAdded per Eployee in Manufacturing, 195h, 1958, 3963, and 1966.
Table 4 United States: Value Added per Emplc ee in Selected TextileIndustries and the Apparel Industry &a a Percentage of ValueAdded per Esployee in Manufacturing, 1:'53 and 1958 to 1968.
Table 5 Canada: Value Added per Employee in Selecteud Textile Industriesand the Apparel Industry an a Percentage of Value Added perEmployee in Manufacturing, 3953, and 1958 to 1966.
Table 6 Netherlands: Value Added per Employee in Selected TextileIndustries and Ready-Made Clothing 2actories as a Percentage ofValue Added per Employee in Manufactuzing, 1953 and 1958 to 1967.
Table 7 Textile Council International Cost.s Studyt Costs for "UpperQuartile" Mills in 11 Countries: Cotton Sheeting(construction 60/60, 20s/20s).
Table 8 Textile Council International Costs Study: Costs for "UpperQuartiles Mills in 11 Countries: Spun Rayon Fabric(construction 88 x 66, 32s/32s).
Table 9 Textile Council International Costs Study: Costs for "UpperQuartile" Mills in 11 Countries: Polyester/Cotton Shirting(construction: 92x8 0, 4LOsx4O, except for Japan and Pakistan:123x66, 45s/s5a).
Table 10 Textile Council International Costs Study: Costs for "UpperQuartile" Mills in 11 Countries, 1967: Combed Cotton Yarn(50s).
Table 11 Textile Council International Costs Study: Spinning and Weaving?Wage Costs, Produotivity and Labor Copts.
Table 12 Production Costs for 11 Countries by Stage of Production on anIndex Basis, 1967.
Table 13 Prices for Man-Made Fibers in Selected O0untries in Late 1967.
Table A - 1 Regression Reaults of Cmparative Advantage Teats.
Table A - 2 Data used in Covparative Advantage Testa.
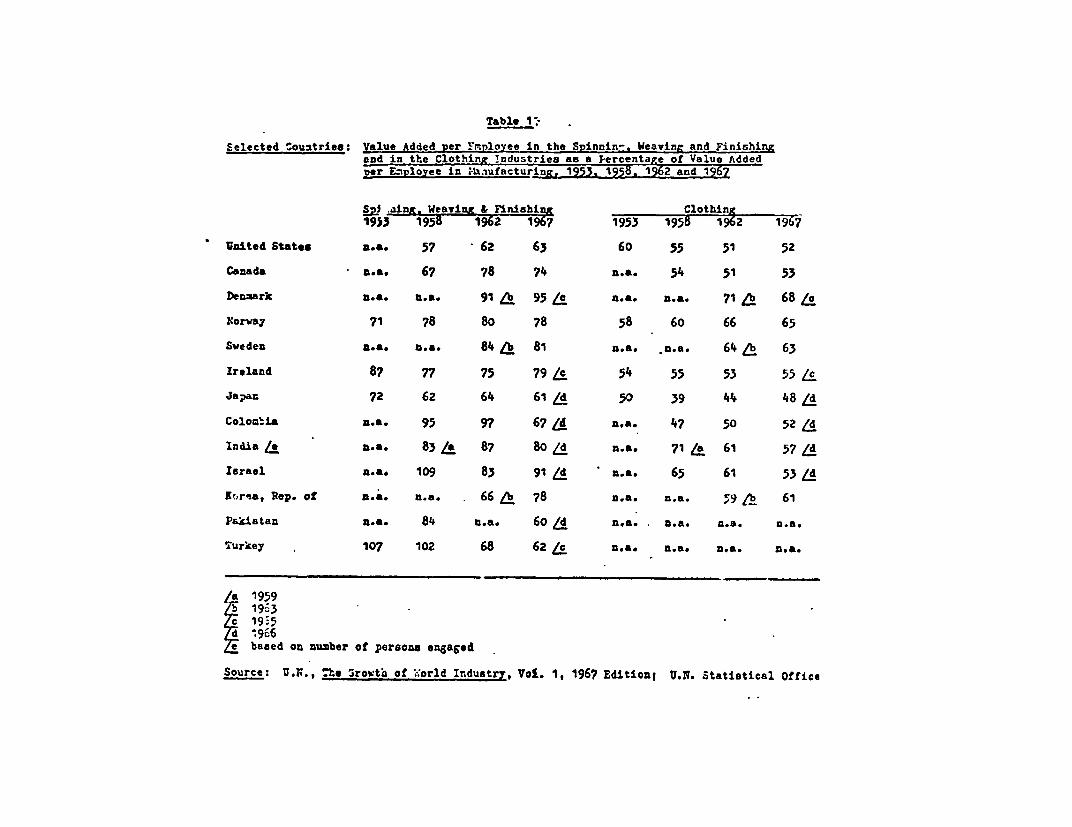
Table 1t
Selected Countries: Value Added Per FYnloyee In the Spinnin., Weaving and Finishingand in the Clothing industries as a Percenta of Value Addedoer Emnloyee in ;anufacturing, 19-51.1958. t6 and 1967
aim,. Weavinx & EFinishiain clothinj
1953 1958 1962 1967 1953 1958 1962 196j
United States n.-. 57 62 63 60 55 51 52
Canada A.e. 67 78 74 n.&. 54 51 53
Denzark U.A. n.a. 91 / 95 A n.a. n.a. 71 / 68 /g
Norwa7 71 78 80 78 58 60 66 65
Sweden n.a. aa. 84 S 81 n.a. ,n.a. 64 b 63
Ireland 87 77 75 79 /c 54 55 53 55 S
Japar. 72 62 64 61 d 50 39 44 48 d
Coloabli n.-. 95 97 67 d n.a. 47 50 52 -
India / a.a. 83 La 87 80 d n.a. 71 A 61 57 L
Israel n.n. 109 83 91 d n.a. 65 61 53 d
&orea, Rep. of a.a. n.a. 66 b 78 n.a. n.a. 59 /b 61
Pakistan a.&. 84 n.a. 60 , n.a. n.a. n.a. a.e.
Turkey 107 102 68 62 / n.-. n.a. n.a. nea.
/a 195919i-3
Zi19:5*966based on number of persons engaged
Source: UJ., The Srowth of W.orld Industry, Vol. 1, 1967 Edition; U.N. Statistical Office

Tabl e 2
United Kingdoi.: Induwtries with Low Value Added Per Employee, 1958.1963 & 1968 /a
Value added por employee as apercentage of value added in Total valuo
_ma_ nufacturin added in 1Q68MLH Industry 1955 1$53 1S59W (b million)
Textile Industry
412 Spinning & doubling on thecotton & flax system 53 53 68 1114.9
h13 Weavinf of cotton,linen,oilk& man-made fibers 60 6h 63 86.1
415 Jute 62 62 55 15.9416 Rope,twine and net 7h 73 55 8.8417 hosiery & other knitted goods 72 69 72 195.1148 Lace 72 78 66 10.0421 Narrow fabrics 70 66 61 22.2422 Made-up textiles 53 57 59 41.4h23 Textile finioshng 75 77 78 86.o
Clothing Industz
hl Weatherproof outerwear 55 54 59 27.9h42 Men's & bqor ' ailored outerwear 52 1h9 h8 104.8h43 Women's & girls " 6 a4 61 55 59.9W1h Overalls & Men's shirts,
underwear, etc. 47 8 17 42.3145 Dreases,lingerie,infante' wear *to. 53 50 50 91.9
446 Hats, caps & millinery 62 58 51 10.0449sl Corsets & miscellaneous dress
iliuatries 66 63 66 38.5149:2 Gloves 56 57 52 8.3
Other Industries
212 Bread and flour confeotioeary 1 73 70 215.9213 Biscuits 78 89 79 79.1352 Watches & clocks 71 78 68 16.2382 Motor cycle & pedal cycle
manufacturing 79 73 69 26.0384 Locomotives & railway track
equipment 66 62 54 18.1385 Railway carriages,wagooe & trains 77 67 60 38.4432 Leather goods 63 61 58 23.6150 Footwear 69 70 70 140.64wO Pottery 62 62 61 66.9
1475 Wooden containers & baskets 71i 72 71 214.61479 Misacellaneos wood & cork amu-.
tactures 76 75 75 30.1493 Brushes & brooms 81 71 69 15.3
U1 Manufacturing Industry 100 100 100 16,012.2
/a These are the 29 of about 100 industries whose value added per employee in 1968 didnot exceed 80 percent of average value added per employee in amufacturlng.
Source: Report on the Census of Production for 1958 and 1963; Board-of-Trgde Journal,31st December,- I9T

Table 3
United Klngdot Value Added per bWployee in Selected Textile Industries and the Apparelldusta asa Fercentageof value Adde pr EmlyeIn Manufacturing,
195b, 1958, 1963 and 1968l
NLd IndustaT 1,°02 5 1963 1968
12 Spitoing & dombling in the cotton & flnz stems 66 53 54 68
of which firms with 25 or more employees principally engaged in:cotton spinning 68 50 48 n.a.waste cotton spinning 10i 80 61 n.a.man-made fiber & DixtU%re spinning 75 h8 56 n.e.
hI3 Weaving of cotton, linen, dilk & maw-made tioers 64 60 64 63
of wich firths with 25 or more .zployees principally engaged lt
grey cotton weaving 63 52 54 n.a.grey man-made fiber or mixture weaving 69 63 64 n.a.weaving of fln4sbed yarns, all fibers 59 70 71 o.a.
W22 Made-up housebold textiles and bankerchiefs 50 53 50 59
h23 Tuxttle finishing 87 75 77 78
of which firim with 25 or more euplayees princips,11y engaged In:
finishing on the cotton systeg an follows:yarn finishing 57 67 6; n.a.cloth bleaching 74 59 74 o.a.cloth dyeing 91 60 77 n.a.cloth printing 108 70 67 n.a.cloth finishing 85 71 130 n.e.
L41-450 Clothing & footwear 59 58 - 57 56
Source; Rer,ort on the Census of Yroducton bor 1Y54, 195o and 1963; Board of Trade Jourrnl, Decermber 3J,19b9.
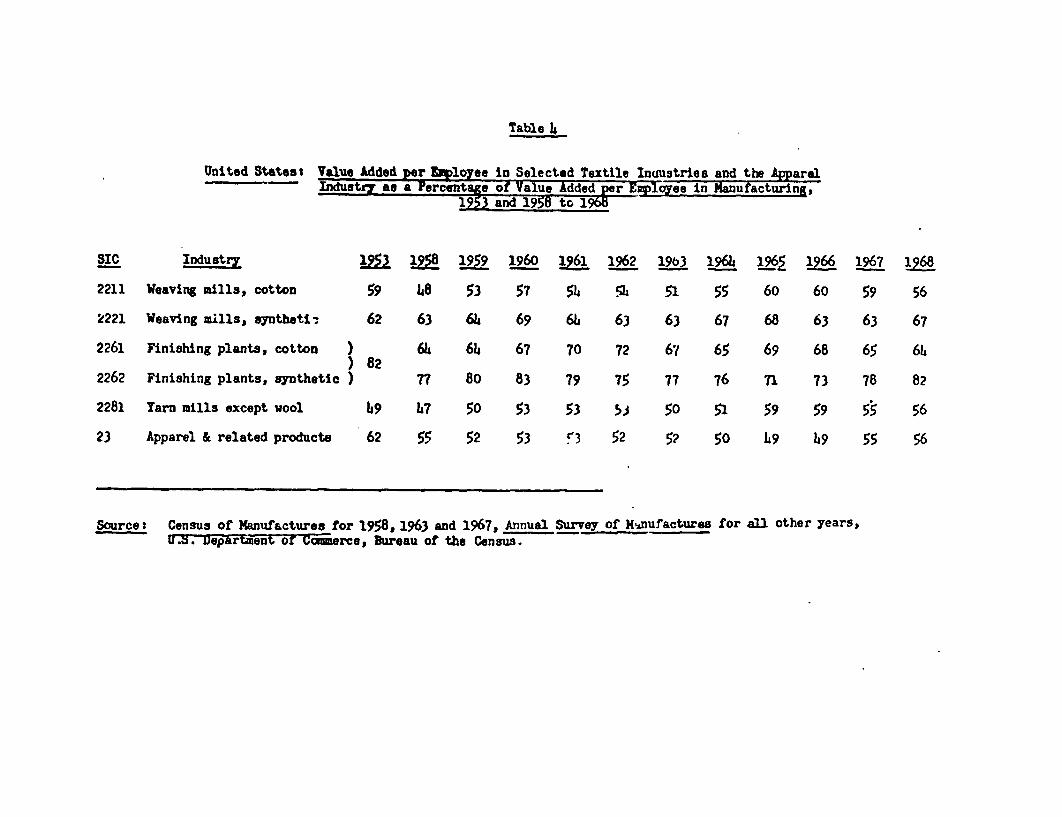
Table 4
United Statess Value Added per E loyee in Selected Textile Inoustries and the Apparel-InduBtry ae a Perntage -Of Vae Added per Gpqeein Manufacturi2g,
and 1955 to 1968
SIC Industry 9 1 1959 1960 1962 l9b3 196h 1965 1 1967 1
2211 Weaving mills, cotton 59 48 53 57 54 %. 51 55 60 60 59 56
2221 Weaving mills, syntheti, 62 63 64 69 61 63 63 67 68 63 63 67
2261 Finishing plants, cotton ) 64 64 67 70 72 67 65 69 68 65 64)82
2262 Finishing plants, synthetic ) 77 80 83 79 75 77 76 71 73 78 82
2281 Yarn mills except wool I9 W7 50 53 53 5i 50 51 59 59 55 56
23 Apparel & related products 62 55 52 53 53 52 5? 50 h9 h9 55 56
Source: Census of Manufactures for 1958, 1963 and 1967, Annual Survey of _Mnufacturas for all other years,U .S. iepart ent or Comerce, Bureau of the Census.

Table5
Canada: Value Added per Employee in Selected Textile Industries and the Apparel
Industry as a Percentage of Value Added per Employee in Manufacturing,1953., and 1955 to 1966 la
sIC Industry 1953 1958 1959 1960 1961 1962 1963 1964 1965 1966
183 Cotton yarn & cloth mills 53 54 58 62 69 68 71 71 68 68
201 Synthetic textile mills 83 79 91 92 96 98 103 101 85 81
218 Textile dyeing finishing plants 67 67 69 74 75 85 83 77 78 76
2h31 - Clothing2499 industries 58 53 53 52 51 51 52 51 50 52
/a Figures up to and including 1959 are not strictly coanparable with subsequent figures due to a revised
Standard Industrial Classification. Figures up to and inclIding 1960 are also not strictly comparable
with subsequent figures since up to this date valuo added was only that derived from manufacturing
activity whilst after this date, the figures were derived from total activity.
Source: Until 1960: General Review of the Manufacturing Industriea cf' Canada.
From 1961: Manufacturina Industries of Canada.Dominion Bureau of Statistics.
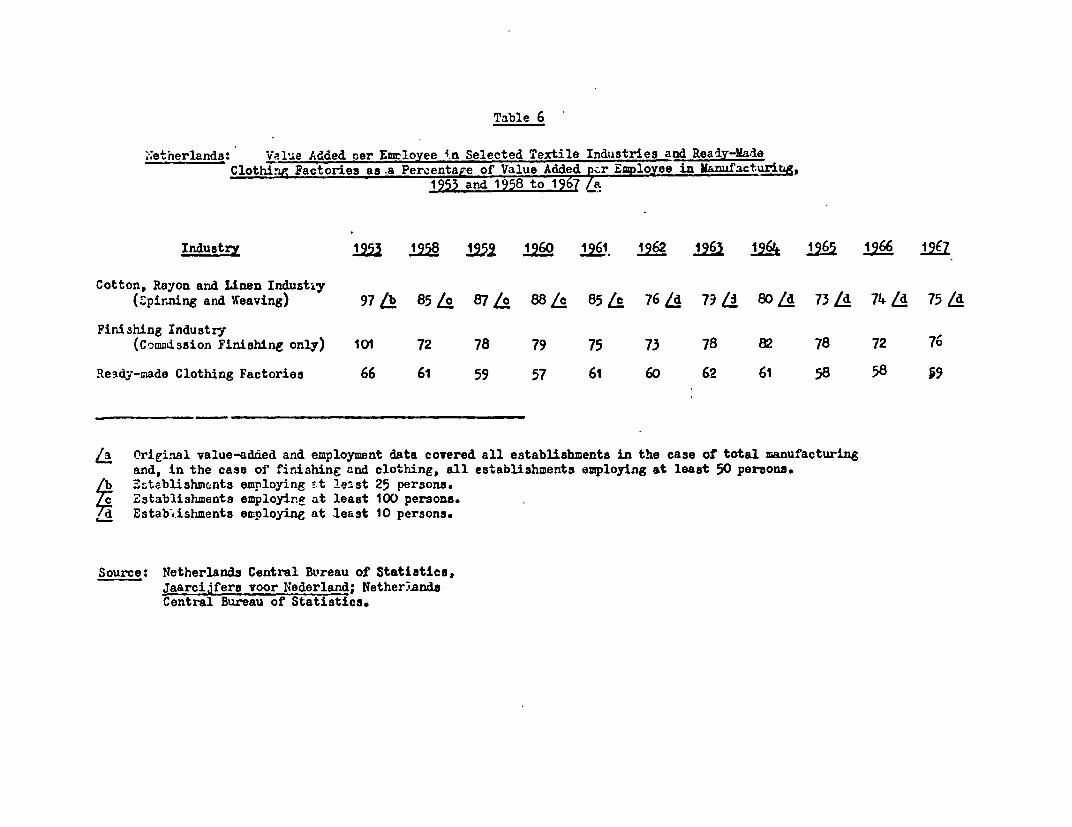
Table 6
..etherlands: Value Added ner Emeloyee 4rn Selected Textile Industries and Ready-MadeClothing Factories as.a Percentage of Value Added pcr Emloyee in anwufacturirM,
1953 and 1958 to_19 67 L/
rndustry 19 l 1960 1961 2_ 6 22 1965 1966 1967
Cotton, Rayon and Linen Indust3y(Spirning and Weaving) 97Lb 85/o 87 Z 88 /c 85 L 76 Ld 79 L 80 d 73 Id 74Ld 75 L
Finishing Industry(Comaission Fini8hing only) 101 72 78 79 75 73 78 82 78 72 76
Ready-made Clothing Factoriea 66 61 59 57 61 60 62 61 58 58 59
La Original value-added and employment data covered all establishments in the case of total -anufacturingand, in the case of tirishing and clothing, all establishments employing at least 50 persons.
ib EZtablishments emnloying -t least 25 persons.Establishments employing at least 100 persona.
- Establishments employing at least 10 persons.
Source: Netherlands Central Bureau of Statiatics,Jaarcijfers voor Nederland; NetherlandsCentral Bureau of Statistics.

Table 7
Textile Council International Costs StudyC for 1per zartile" Mills In U CountrjesT- Cotton Sheeti const rcticat 60r60, 20s/202
Wcal HongUK USA Ausitia Frazim Hollarn PonugAl Gcmy Kons India bpan ftkiiiae
SPWNING 2 (iOMFaru cost *_ 27.00 29.60 3100 29. 3 2. 25. 246S 26.317 21.40Was cost _ 2.06 330 3.50 3.0 3.3 3.20 2.30 4.14 3.31 3.60
C:n iSbv cost 31.1 29.03 33.30 34.50 32.60 37.96 3270 27.30 30S0 29.6S 25.00LI3 6.1) 4.24 4.65 5.36 4.03 3.6 31.23 4.19(c) 3.26(c) 2.R4)
Su:...:cs and m tinteamu I.4 OtS 0.96 0.7) O C.43 1.13 0S7 Q76 0 60 0.17:A orc.Xad 2.3 5.05 L23 1.96 2.25 .25 2.04 104 I.19 1.32 2.26
Dc-rw:tton 2L2 1.22 3.42 3.90 3.30 3.02 .96 I I2 09) 1.00 2.2AMrri r.totton ud fnarn (a) (b) 1.90 3M 1.21 1.10 0.9S 3.42 2.06 3J3 1.16(b) I.11
Yarn cog. Cududing seli 45.9 44.26 45.531 4697 45 431 47.67 4S 90 315.32 39 6 37.02 34.33SC':1r- 13.0 1.69 1.73 .3 3.32 2.93 47.04 2.12 2.40 0I90 I.,0V. In W..Z usci in tabric coiL 41.0' 46.00 47.30 46.30 46.30 50.70 47.00 3740 42.30 33.00 33.60
W-AVINC (d g:ncar yau
Fa bre sidth-inc.sc 92 303 92 aL 92 92 92 92 92 92 56 92 nt 3 92 csL Sj I S2cnt.Lb. y .emtr yrd 0.6U 0.36 Q752 0.676 0.61 0.6S2 0.731 Q6S2 0 731 0 0454 .746 0.306 Q741 0301 Q740
Yar.' cost basd on price &ba 32.6 3950 33.67 31.97 32.70 31.92 37.05 310) 27.40 '9.23 31.56 31 64 2S.16 0.93 26.34.bot: 9.1 30 13(c 9.13(c 4.64 5.02 3.45 4.12 5.70 2.59 2.70(c 4.36(c I 30 4.35 1.61(c) 3.E5(c
Sup:-. cs a..nd ma;ntcau . .... 2.1 1.23 1 Q90 *1.12 1.74 2.15 I .5i 1.01 1 s4 1 .59 0 611M.4di*se.;ba8 iS 4.67 I~9.55(dl 1.76 3.75 2.38 3.38 2.46 3.03 039 9L*74.d ol 7.7d 0 2W>Jwccim.on 3.6 0.72 1.77 1.78 1.74 1.46 1.92 0.92 1.26 f 063 ' 0 70 3025(Ar %i rtiOtioea NID (a) (b) 2.75 J 11 1.43 1.56 13.56 3.U3 I3.9 3S9 0.4,b 1340
Gnry fabe cm 469 5950 32.40 4215 43.n7 44.59 47.52 45.49 34.95 27.21 It 66 15 36 40.3 16.34 40.44
Tr%:sL\oGr :d41ia~ar W6~ 231 1.06 1.24 1.69 3.50 I.0 1.46 0 0 1.21 0 60 030)b:lcJ3
s 10 1.9S }> 4.07 2.70 2.40 i.50 3.33 2.22 L63 2.t33 9.23 093r 3.3 1.70 9.30O h% L2.9 1.77 L37 3.13 3.00 2.40 2.61 3.33 L29 L.3 I.30
Fsbric col cauin stair' 5L.9 63.83 56.47(d] 493 531.02 53.59 54S7 531d4 41.93 32.64 54.913d 19.24 4|*S6d( 2034 1 49 54(djSclIfog 1.9 2.44 -_ .32 212 L64 4.76 263 317 0.65 - 0.33 - 049 | -
Fabric ck t 54b4 66.27 5647 52.17 53.14 54.23 59.63 54.47 45.20 33.49 394.I 2007 43.56 2063 49.54
of %h:ch(1: i21.5 2500 22.50 23.42 22.20 27.72 22.24 2000 13.98 9.0S 7.63
spinn:ng' 9.7 13.05 8 4.26 L47 317 7.10 9.00 5.67 4 03 2.25 2.13o ansig 14.3 39.55 1 I0.38 18.0 32.67 10.47 11.43 7.55 7.95 4.22 5.4J
finnshin; 6.0 4.78 I 6.3 7.24 7.00 7.3 636 6.9S 5.6) 3.33 3.30
N;OTE: Tec5gurcs of spinning tabour costs for the Coaincntal cuntries exdudin* PosngL am comidered to3breprgantative orthc bcst nath thai Wpr quartnb mills In t, counirmo* In4.C .s I utcs arc not queted Cirety but amr obtainod by uimps cmiuladon fkinm do consuttaut tatirmate
(a) .o cs1:bntic roort fnncc irc:uded.tbl Ad-.- *n-r,.o irc:uCcd *nt!z &g:;ing cost.(cl V: nc-.nc; labour nc;udod waLf sup,:y and maintenan.(;) Sc:hn %..xcUdCt3.(1) Cena.n nona-:..s frfngc bercfiu iuch as cheap meals and dormicories not InduddSor e: ye rn rte;cy c:olh t alTen; olsA
Source: Textile Council, Cotton and Aali.d Textiles, t701. II, ADne% I.

Table 8
Textile Council International Costs Stuet:Costs forQu ttJ ]Eartile" H_ilr in 1i C n-tr1es
Spun j ayon FY ri c( Construction: ixF5xj, 32s/32s )
West HO.'UK USA Astrfa Fant Ho:land Potuita Wewnny Kong bItt Japai.n Paituln
SP3SIN-,%G 32 (J3FTbc coet _ 23.0 24.00 24.60 74.40 2806 24 00 21.60 36.310 19.6 4000lVa;i cost _ 1.25 I.20 I.20 IO0 1.4 1.00 2.30 3.20 2.17 3 0Clean More cat 2i2s2 -9#; '4 11! t0 2 54 25 4tS 8°7 4|3 }bX
fibre CO.? * 2j~~~~~~~~~~~~~~~ 2{fl ~~~~~ 234 91 230 23.fl20. .20Sr ,-8 manteinancet 2.0 0.92 126 1.1 1.17 OJ 1.6S I .02 1.17 1.10 1.7
M .:. o'' el cad 3.6 5.20 2.74 2 60 288 * 1.38 240 1< 6 2.0 2.69 4I IDe-r :-I on 2.9 3.34 4.7 5 5 4 5 3.07 4 00 2 05 1.72 1.41 396Adm .. s.raton nrd finanee (a )(b) 2.07 1.12 I 08 O" 1.11 1.23 3 02 2.5 L14(b) 2.77
Ya- Cost.ci . ........ in I 4: 4 46.03 4*004 4140 40.96 41.59 40 41 36 26 a2n 3.l39w0 5909Se .1.:m-1 24 I.84 1.60 2.46 1.70 295 1.40 227 2.L6 1.64 2.56
a rn; nrte used ini fabnc cest 565- 47.90 41.650 42.90 42.70 43150 41.r0 31 SO 55.70 24 OD 6 00
V EA I\G (d /lincar yafd)
F !ntc w4JtS.-irt:fl 39c Ps - 39ats 391 391 391 391 391 39) 43 391est. 391 31 I "t391 Lbs. y-rnS-near yard 0.22 0.29.| 0;235 0.224 0.219 0.219 0.240 0.231 0.240 0.271 0.244 cQSS 0.233 01239
YF r colt based on price abow 12 4 13 94 12.21 9.31 9.39 9 35 10.45 9.63 9.25 ISA.< 13.59 816S 14.43 1481L3:-:--,r 36 5.03(c> 4.39(c) 1 3S0 4.15 445 2 21 5 03 2.22 2.31(cc 2 Ocl 2.08 1.61(c) 1.65(cS- - cs and nain:enance 10 043 11 0.76 0 89 0 92 0.S0 306 0 f .O I .e 0.6S 0 64
.- c'c.-h,.d 1.4 1.57 1.2.521 2.2 1376 060 207 .067 09022 . 073 I 'to 5CDcrrcm.lon 0.4 0 26 i 0r 05d L2 2. 24 2 7I 0 S0 2 37 0 67 0914 0 78 0 71A.jnipriira? on and finane (*3(b) 3.25 IJ 1.07 0.82 092 0.65 21.24 1.12 .37 0.3(b) 1.96 JGrey f.ibric cost 38.8 2245| 20.65 1 I67 19.11 1958 15.51 21.42 1462 22 21 1990 18.41 2045 21.67
Fl'lSI !NC (d /lineary ) .lardLabour 1.3 1.67 16 3 24 4.10 3.80 1.81 3.62 3.52 07 12.43 075 1| M.cria . 2.0 2.72 It 653 2.30 2.9 3.00 3.11 2.84 292 3.91 lb 607 2PD 320 7.9nO:hct 2.8 3.05 3.42 421 ..00 3.88 3.22 3.60 2.31 IJ 3170 39 n J
Fabric cost. exchlding ulling 24.9 2939 27.18(d) 2Z133 3032 30.30 24.33 31.70 22.66 29.20 2 35.97(d 26.36 FP.20 i 29.64(jSel!mn: 2.2 1.11 2 1 .64 1.22 3.9S 1.56 1.52 1.10 0.46 I - 0.90 066 : -
Fabrk co * 26.0 31.00 27.18 29.77 31.54 32.36 23.89 322 23.76 29.66 25.97 27:26 2J.3G 29.64
of hhf) .whc_1!c|Ci3a 'ibre 5.0 8.52 5 3.65 3.66 5.37 6.63 3.38 3.32 1098 I 55 1004 spinningt 4.3 43 8 3.33 3.42 3.41 L59 3.;6 3.02 335 2L94 3.70I sewinn &6.4 8.51 1 9.36 9.72 10.23 5.06 11.77 3.37 4.73 9.73 6.0finshing 6.1 7.44 | 9.46 1.21 30.30 3.82 10.28 8.04 |6.99 |7.9 75.
:OTC: Thc fi5urcsotspinning abourcots for the Continental countris excluding Portupd an crnderd tobe epmentiwv orthe beu. rather tha thsw qmarcik , ts b these cow .* Indicat-s figures atn not quoted directly but ar obtained by imple cakulation rotm the cuhaatsnW atlimletm
(a) No eC:Omate for finance inc!uCed.(b) AdministrAlon inc:uded with se3nig coL.(c) itcntitsce labour included with suppy and rnintensanc.td) Sclling inceudd.(c) Certain non-ush fringe bcntis such as chep mals and dormiuos n Wudd.(C) E%cluding yarn and greY Cloth 113,q CtO'°.Source: Textile Council, Cotton and Allied Textiles, Vol.n!, Azinex.l
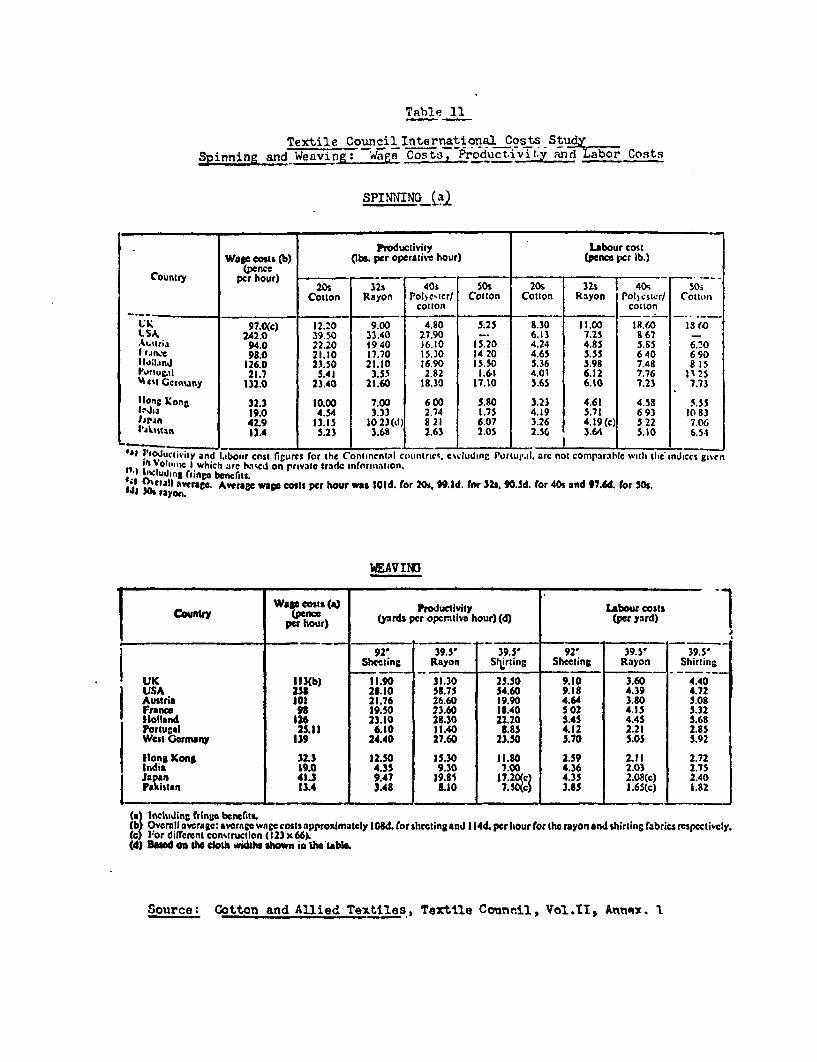
Textile Council International Costs StudSpinning and Weaving Ham Costs3, Productivit.y and Labor Costs
SPINNING_t _~~~~~~~~~
Productivity Labour costWatc costs (b) blb per operatiwv hour) (pence per lb.)
(penceCountry per hour) _ _ _ _ _ _
20s 32s 40N SOs 20s 32s 40, 50-5Cotton Rayon Pol)c ter/ Cotton Cotton Rayon Pol)cstcr/ Cotttwti
cotton cotton
97.0(c) 12.20 9.00 4.80 5.25 8.30 11.00 18.60 15s0LSA, 242.0 39.50 33.40 27.90 -. 6.13 7.25 8 67 -At.%ri |J94.0 22.20 1940 16.10 15.20 4.24 4.85 5.65 6. 01J sim 98.0 21.10 17.70 15.30 14 20 4.65 5.55 640 690IlO;I.nd 126.0 23.50 21.10 16.90 15.50 5.36 5.98 7.48 8 15Partu..ll 21.7 5.41 3.55 2.82 1.61 4.01 6.12 7.76 11 251A '<t Gcrniany 132.0 23.40 21.60 18.30 17.10 5.65 6.10 7.23 7.73
,long );onC 32.3 10.00 7.00 6 00 5.80 3.23 4.61 4.55 5.55lrtjia 19.0 4.54 3.33 2.74 1.75 4.19 5.71 6 93 10 83)Jjrn 42.9 13.15 10 23(d) 8 21 6.07 3.26 4.19(c) 5 22 7.06L I asm 13.4 5.23 3.68 2.63 2.05 2.56 3.64 5.10 6.54
*) Ptoductivity and Iabour cost riure's for the Continnt:ci cotintrict. mludinC Portural. arc not comparabtle with te' indiccs givcnit OVotlk- I which are bactd on private tradc information.1i ImIiuding ruinp benfrits.
4 COhrall Averatc Average wae eosts per hour was loid. for 2o. 9.Id. fne 322. 90.5d. for 40s and 97.6d. rot 50s.6181 3IN rayon.
WSAVIND
Wag costs (a) Productivity Labour costsCwnly nper hour) (yards per opentlive hour) (d) (per yard)
_ _ _ _ h o u r) __
92, 39.5' 39.5' 92, 39.5' 39.5SSheKj ing Rayon Slirtine SheetinC Rayon Shirting
UK I1I3(b) 11.90 31.30 25.50 9.10 3.60 4.40USA 258 28.10 58.75 54.60 9.18 4.39 4.72Awustria 101 21.76 26.60 19.90 4.6St 3.80 5.08France 19.50 23.60 18.40 5 02 4.15 5.32tlollands 126 23.10 2S.30 22.20 5.45 4.45 5.68PortuCal 25.11 6.10 11.40 1.85 4.12 2.21 2.85West Gctrn ny 139 24.40 27.60 23.50 5.70 5.05 5.92
tlons Kong 323 12.50 15.30 11.80 2.59 2.11 2.72ltidia 19.0 4.3S 9.30 7.00 4.36 2.03 2.75Jnpan 41.3 9.47 19.85 17.20(c) 4.35 2.08(c) 2.40Pakistan 13.4 3.48 L.o 7.50(c) 3.8S 1.65(c) 1.82
(a Including fringe beneflts.( Overmll average: averao wagCcosts approximatcly 108d. forslecting and I I4d. per our for the rayon and shirting rabrics rcspcctivcly.Cc) For diffemrnt con'tructlon ( 123 x 66)(d) Da_od on th cloth widtha iho 'Ie tabbe.
Source: Cotton and Allied Textiles, Textile Casne.il, Vol.11, Annex. I
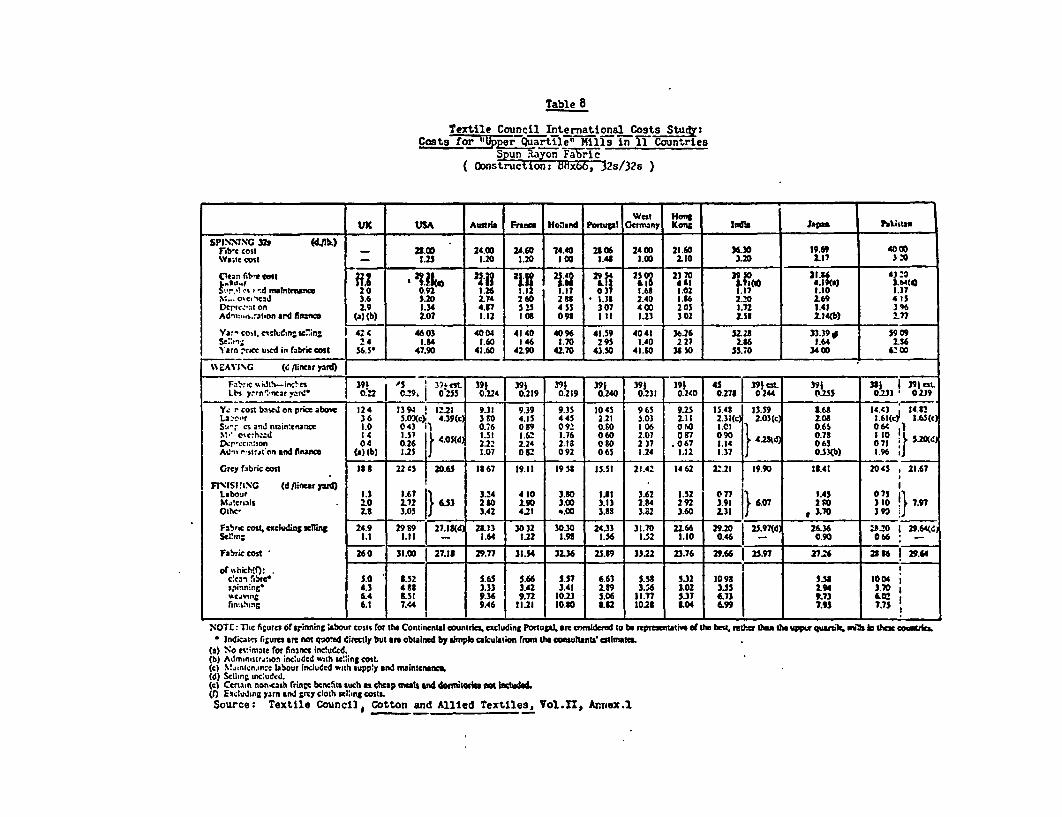
Table 8
Tetxtile Council International Costs Stutsr:Costs for !iDper Puartile Mills1 in Ii Cot ntries
Spupn Raon Fabric(ODnstrucetion: Mlx66, 32s/32s)
West "ongVt USA AWaIs Frnc Hooland Poepl Germrany Kons iniat Jat Pakstia
SPISN2N%G 32, (Mjb6)TibI cost ) 23.00 24.00 24.60 14.40 2106 2400 21.60 330 19.69 40 00Wa;te cost _ 1.25 1.20 1.20 100 1.48 1.00 2.10 3.20 2.7 ) -0
ft i n eisee >t ' 2 f9 :pj ' ' j029 2 2J 2 21 3 432.20
'-! It -nd maInteunce 20 0.92 126 I 2. * 1.7 03 1.6t 1.02 1.7 1.10 1.37M. o0~ c, 2d 8 3.6 5.20 2.7 2 2 1.35 2.40 I.1o 2.50 2 69 41IDerr.:.-t on 2.9 1.34 4.7 5 4 55 3 07 400 2 03 1.72 1.41 3 6Adtm ... s..-ahonard fifrnlCO (.)(b) 2.07 1.12 I 0 0 91 III 1.23 302 L 5S 2.14(b) 2.77
Ya?-colt. cldC .n g 2 4.4 4603 4004 4140 4096 41.59 4041 3e.26 5L28 3 3
.39
# 5909SC:: 1-- * 2 * 1.84 1.60t 1 46 1.70 2"f 1.40 2 27 2.96 1.64 2 56Yarn -rscc used in fabric cost 56.5. 47.90 41.60 42.90 42.70 43.50 41.60 38 SO 55.70 34 00 2 00
|% £FAVI%G (d linar yard)
Fab -c widt%-incrn 391 5 379tst 39S 39) 391 39) 39) 39_ 45 391 est 391 3) 1 391 ntLI y'rn.nearyan? i 0.22| 0255 0.24 219 0.219 .240 0.2S 0.2i0 027S 0244 | Q255 023l 02.9
Y.n r- co:t bascd on price above 12 4 13 94 1 212 9.32 9.39 9.35 1045 9 65 9.215 15.48 13.59 t.68 14.43 24 .
L3:,t,-,r ~~~36 5.02(e, 4.39(cl 380 4.25 445 2.22 5.03 2.22 2.32(c)I 2.03(c 2.01 2.62Cc)' 2.6(c)S:z,-- cs and nizincenansc 1.0 0 43 0'7 . Q O9 092 QtO 1 06 0 (4 IQI 0Q6s 0 6 )MO c'e,hczd 24 1.57 4A d 1.51 1.62 1.76 060 2.07 067 090 4IL 0Q78 20 1oDMr -ec .:on 04 0.26 2.22 2.24 2.12 0 0O 2 37 .0 67 1.14 063 0 71 r SAnd r-strjton and finance (a) (b) 1.25 . L.07 0 82 0 92 0 65 1.24 1.12 J.7 . 053(b) 1.96 ,JGrey f(bric cost 188 22 ') 20.65S 13 67 19.11 19 58 15.51 21.42 14 62 22.21 19.90 13.41 2045 I2.67
Fl' ISMXIG (d /linearr ya I ILabour 1.3 1.67 3.) 3.24 420 3.t0 IJI 3.62 1.52 0o77 .45 075M.acrials 2.0 2.72 IJ 6.53 2 t0 2.90 3.0 3.13 2.34 2 92 3.93 IJ 6.07 2 $0 3 20 7.97O:the, 2.8 3.05 3.42 4.21 .00 3.88 3.22 3.60 2.31 I) 0 399
Fabric cost. excludings uling 24.9 2959 27.1(d 21.23 3032 30.30 2433 31.70 22.66 29.20 25.97(d 00 26.36 2 0 9 eScl!in; 2.2 2.22 2 .64 2.22 3.911 2.56 2.152 2.20 10.46 I - 0.90 0 66 : -
Fabriccost 260 321.00 27.28 297.7 3134 5326 25.89 33.22 23.76 29.66 25.97 27.26 25S6 i 29.64
of hkhicl(r): . F iCIeak fibre 5.0 a5.2 5.65 5.66 5.57 6.63 5.58 5.32 1098 1 S5 1004 2spinning- 4.3 4 S8 3.33 3.42 3.41 289 3.; 1.02 | 355 | 794 ?3.70I vmJvn- 6.4 5.51 9.36 9.72 20.23 5.06 11.77 5.37 6.73 9.73 6.fin.shin 6.1 7.44 9.46 11.21 10.30 .82 10.2s 504 G6.99 | 7.75
NOTC: nTe figurcs ofsrinning abour costs foe the Continental countris excluding Portugl. am trAeuldered lo b repre ative ( the besmt. nhu mts the u qualek. tt b thm colee.
* Indka2te rlgures aem not quoted dimectly but wte obtained by sniplo calcutation rrm theo cwuhanlW ctiruteL.(a) No evimawe for finance inc!udcd.(b) Admingstrjl?om inc?udcd wvih Se::ing CstL(c) Mainicn.incc labour inc;uded with supp?y and mraintenanc.Id) Seling inc:udcd.(c) Certain non-cash frint bceneus tuch as cheap mtes nd dttr4 toel. not Inlud(O) Escluding yam and grey cloth MeINis costLSource; Textile Council Cotton and Allied Textiles, Vol.11, Annex.1

Table ?
Textile C'ouncil International Costa StuyCosts for_ rQuartle7ff1 Ilountries
VyUeAterW7otton Shirtitf(OmStnuctions 92x840,Os/i0, except for Japan kistan: 123x66,lh5SA5)
Wcst HongUK I U0. Austri Fraux Holand Ponupl Genany Kong India ..Jpap Pakistan
F-co t _ 49.13 46126 51.90 6295 75.30 61.40 60.43 103.50 49.76 139.6).vx ;X::s: 3.91 6.14 4.60 5.35 5.11 4.30 5.t7 1I.50 4.97 12.t0
C.=- 5brc i 57. 5301 69.40 63.50 68.50 53.41 6f 0 66.'0 202.00 54.73 125431 =3oLr 126 5.67(c) 5.85 640 7.4* 7.76 7.22 J.38 693') s 2(') 5.IO(c)
SL..s andnii3n3ar 3.2 2.5 1.92 1.63 1.4 067 2.14 2.37 1.61 pt I.S0S:;; o .cd~ 5.S 9.61 163 3.65 3.t0 3.27 4t5 2 49 3.26 2.45 5 6)
4.3 2.24 6.75 6.80 6.50 10OS 5.90 2.69 2.55 .70 5.47A-.ian6am ac (a) (b) 3.55 L16 1.98 1.75 4.06 2.4 4.94 11.64 xv( t.50
Yamgr. w8t odaSt W 9. n73.65 t9.73 54 01 5 57 19 22 t 55 53.17 227.99 6 37 179 00ISe- 5.7 3.16 3.40 48 2.56 5.20 1.4 L39 4.3 2.16 392Yra-i ;r md in abk icos 1176- 41.80 9.20 S6 90 92.70 114.40 91.14 55.60 23L40 72.50 3u.00
A EAV%IC (dr.mncu ryad)_
FaSncwa-id:-! 3c1 1 4122 391 aS. 391 391 391 391 39i 39i 41 I 391 cit. 3!9 35 391 es..L:,. z:3.ivcr)ard-0.21 0.282 I 23 0.212 0.23 0.21 025 0 22 0.224 0.275 0.226 020 0.2) Of:3
Yam mg aud onprim bon 24.7 23.06 I 2.98 19.73 35.26 1946 23890 19.39 39 20 64.05 I 52.2 25.25 4216 43 'S4.4 S.7(c 4.72(c 5.0S 53 2 5.61 265 5.92 2.72 3.34(c) L75(c 2.40 4 26(c 3<S2(c
S2^..-sa. du int;aine I3 0.69 1 1.09 I.26 1.49 1.67 IJ5 0.95 1.13 0 90 0 10 13..." r.4. 2 2.7I 2 02 X282 0.76 2.49 3.32 2.28 .3( 0.73 3.30
33.90 3.~~~196 2. 2.7 3.2 3238050b'33D>c_aror . 0.3 0.41 3.07 3.3O 2.05 1.02 21.6 0.t7 2.63 0.6S 072 1 7.63(.Adm:r.ntrnion LA finu (A (b) 1.43 1.36 1.14 1.21 1.02 1.27 1.n2 4 s61 1 0.5b) .49
G-rey falx:c cmi 32.5 390 21.94(d8 30.29 29 00 3. 3A 1. 26.58 76.04 163.78(d , 20 413s 505 52 qs(d~S.9 1.27 - 3.32 1.46 2.96 3.96 2.36 2.33 IJ - 0.88 1 .2 .
To &g.- fsbric mu 33.5 35.17 28.94 32111 30.46 31.13 35.08 33.24 27.91 77.S2 63.78 2I.29 53.45 52 96
of %:Cch (f)lc-!1 nx w3e, ILI 3496 14.70 13.3 14.34 8.75 13.90 14.85 55.60 11.44 35.365Or.tn:n;- 66 724 4.32 4.22 4.48 5.52 4.70 3.75 7.15 2S 5 617w avin 7.6 IO.54 0.56 0I.5" I 3.71 7.32 32.39 7.3 33.99 5.26 7.97
NOT: The cguru of spinning l&bour costs for the Continental countris, ecluding Pon l, I are cnsiderd to be repranadve .o thcbcnt, rathe than the upperu quafllef mli sin ithes CA, ntri.es* I34cates f%urn acr not quoted dirctIly but ars obsaned by Dmple eiculaJon fro A th coumant aitat
(a) No c:::.-ute 'or £nnnre inc:uCed.(b) AC- nistr:on i.,Kuded *.:h se: in; cost.(c) M3.n .nar":abour nc:ided with muppy and mainzenaM(C) Se:: r-g lCcd. .
(c) Ce:....-o-.cash frin:e bcndent sucA as gp measb and doams notl() EC46ns yam ad gry c oth sc icg costs.
Source: Textile Council, Cotton and Allied Textiles,LjYol.11, Annex 1.

Table 10
Toxtile Council International Costs StudyCosts for "Upper Quartile"M H lls in 11 Countries, 1967
Combed Cotton Yarn (50.)
%.:.,:: %.ne exucpi Jp.wl.i: cltws18v-o lb. ;
Wct I 1on;I J % l.a ' a.aal- I 4.allolli v'oi tioga.l cinti.amlu 41s1i 161.11.1 J.111.ti Ij'Ai,.41i
I,h, % it 54) 54' it) 484 14 12 55 46. 84) 29.840 5930 48.40 24 hOWj,1tol 1250 1.14) II %) I1.16 11.7(0 10.50 14 14) q .14 540
CI..aa u,4li.. .Zt 51! h4 48) 4,2.10 59.64) 43.91 %8.51 44l30 71 40 57 t4 31.00I .t.sur I-, S (a 2t\ f.) x Is I 1 2! 7.7 % S; S 0.834I 7.Uhl i 6 541e Suppi'c .ndJ Ml.llnICl.44C.c 1 .44 2 tt I b7 1.NS I.7 2.30 2.41 1.96 2 as 2.59Msall ow va:aJ it (m) 4 42 4.20 4.30 i 12 4 54 1 t5 4 05 1.05 7 75DLpaicesaion 5.70 7.40 7.70 7 35 114.7) 6.30 4.18 3.l49 2.18 7.JjAdaaliaiiinstMa..l .and.
tuiuncc () (IhI ! 14 214 1.91 4 12 2 54 6.60 5.49 .1 V531. 5.23
clhing It6.72 ,4. 140 5.4 1 83.341 l4l8 81.941 t2 9I l 9 Y2 7( 12 60.56Sdlaallg 5.10 3 28 2.33 2.52 4.09 2.42 2.63 4.93 1 03 2 74)
I ;ar,na t 94.82 Kg l. 87.64 _b5.83 84.17 84.33 65.24 103.85 79.15 63.26
..r ~hssIh 41):d.v.aa lI'we .4 142 t4 x) 62 .14) 59.4.4) 41 -)I 50 A 40.30 71.40 57 84 14 00~pUiaaia@ 33 MI !2 10 22 t;l 21.71 36 17 23.41 22.31 25.52 IN 28 !9 56
NO) I l.: I Iic figtirv% of spnnang l.ahoti . III . rr 11w (lgal a.fntal c.ulinalicC, 4 liluding l'arig.I, arc contod.cod.d lit he rc'luk:*la4JInia. o1'4lllc Iv.:s rallies, th:in lhc tilirwr itri,:ilikh ivl-k1 n 1liw Ics otinti ic,.
ak4ilCatL!% ligaearcI are i1tlt o4toao.1 tJrcoll, i4iat *i. obaljinc.j by suaplpc c.a4. ;ilation fiont Ilc .onsul4tntx' cbliniatc%.1J) NC) cstn1.It.a 4t,r in.ancc *n l0.lal.th) t"a1,lls> lilLeitdcl u lth wilinig tobt.(%:) Maintenance labour tmulue ld s44lt %upply and n1aitdena,o.Id) Stling inLiuded.Ic) Cfrtain nn.sa3h rinte bcncfits %twh as cheap mnals andi dorrniurscb not ua h led.0) I:xCludng ram and grty Outh %ellmny wo
5ource: Textile Councll, Cotton and Allied Textiles, Vol.II, Annex l.

Table 12
Productian Costs for 11 Countries by Stage of Production on an Index Basis 1967 a(Germany 100)
U.K. U.S. Austria France letberlands Portugal Oe Raug KSo India JAan Pakistan
Cotton Sheetina
Clean fiber 97 89 102 106 100 116 100 83 94 91 76Spinning(20s) 107 138 92 94 97 79 100 65 95 69 87Weaving(60xS0) 106 139 81 83 94 78 100 56 105 91 105Finishing(bleaching) 94 64 102 114 110 116 100 110 11.5 129 i43Total value added 103 109 92 92 99 99 100 78 99 82 96Total cost 101 lW. 96 98 100 109 100 83 101 89 91
Spun Rayon Fabrie
Clean fiber 92 117 101 103 *102 118 100 95 153 87 173Spinning(20a) 121 125 94 96 96 Si 100 85 93 83 107WeaAng(8bz66) 54 72 80 83 87 43 100 45 54 83 56Finishing(printing) 59 64 92 109 105 86 100 78 59 77 78Total value added 78 70 87 94 97 70 100 67 57 78 70Total cost 78 82 90 95 97 78 100 72 78 82 89
Polyester/Cotton Shirtnst
Clean fiber 87 68 106 96 103 135 100 107 32B 82 261Spinning(45a) 140 127 92 92 95 124 100 .80 125 61 1314Weaving (92x0O)/b 64 82 87 89 96 60 100 61 92 k3 77Total value added 111 86 90 89 8? 84 100 68 94 51 86Total cost 101 87 97 92 94 106 100 84 192 64 159
Combed Cotton Yarn
Clean fiber 91 n.a. 109 106 102 75 100 69 125 99 53Spinning(508) 144 a.&. 94 97 101 151 100 95 109 78 126Total ocst 109 n.o. 106 lo0 102 100 100 77 123 91 75
/ For U.S., India, Japan and Pakistan eatiates of value added t1 stae have bgo cobnorted frce non-ctndard widths to thepecified vidth and are therefore subject to error.
Lb Except for Japan and Pakistan. See Table 10
Sourcet Tables 8 - 11.

Table 13
International Prices for Man-MadA Fibers in SelectedCountries in Late 1967
( U.S. cents per lb.7
Rayon staple Polyester
United States 28 61
Austria 26-28 80-81
France 2b 72
Netherlands 28 80-82
Portugal 29.Sh (100-105) b (Terlenka)
Germany 26-28 80
Hong long 21.6 75.5 (terylene)58.0 (Japanese)
India 28.18 /a 2h8.0
Jpawn 18.05-19.69 73.2-80.8 (branded)56.8-59.3 (unbranded)
Pakistan 40 222.0 /c
Brasil n.a. 122.2
A& Manufactured In India. Imports not allowed.
& Price of S£port plus duty and sales tax.
/a Pli<e of lport pls c duty and nales tax.
Source: All countries except Brasils Werner Inc., Brazil: UNIDO,The Brazilian Synthetio Polyer Induatry. 1969.

Regrsiont Results of Comparative Advantage Tests
Number of Coefficient Estimated Regression Co3fficientsIndependent Variables Observations of Correlation Constant Term S K V E
1. 3 + K + B 57 0.140 12.4z1 - 3.90 0.90 -0.20(0.91) (0.31) (0.10)
2. S . I + E 48 0.49 12.78 - 3.64a 0.46 -0.12(0.98) (0.36) (0.12)
3. S + R + 1 57 O.42 10.98 - 2.72 -1.57 -0.214( 0.77) (0.50) (0.12)
4. s + R + B 48 0.50 12.59 _ 3.21 -0.87 -0.12( 0.78) (0.62) (0.12)
5. V 4 R + I 57 0.42 10.98 -2.72 -4.29 -0.24(0.79) (1.O8) (0.12)
6. V + R + E 48 0.50 12.614 -3.22 -I.09 -0.12(0.78) (1.17) (0.12)
Note: The figures in parenthesis under the estimated regression coefficients are the estimated standard errors.
S - wage value addedK - non-wage value addedV - total value addedR - wage value added as a percentage o' total value addedE - value added per establishment
Source: Table 2.

3 a. 2~~~~~~~1 A A- qVi 0c0;;e(Ce &Ruut>.],,w§.at. . .g'4A2tRsaa§ . . .R .sS 2 0OOOOOOOOOOOOOO8000oo OOOOOOOOOOtOOOOOOOOOOOoOooo 000000o00
C C: ous*02.@1osa^<^9 {swtt^sS;iag! F§a5 t ..msi~li~ p- %3S..4.4 . - '@'sos so~t.Q .4 m 9.1r-QQ,g O 09.'O
31 ~ p-td~V~V%~U~ft.e~ ~ t.U~ 4 A4 0 =-'~D. oi
-Gk dto " -9 * A
II p-uo.o..oo; Qq, ^ ;Vt-qUV- ;V wa;ueS;D%V s-.4 hot-.4*Qf
03 3~~~ .4Q~~~ ~~u.0 U-1 A
YZ ftp-ftM . .. 1. . .. .. . .. .. .53e .4 .. X,2
W, %0""-IF ~~~~~~~~~~~~~~~9C 0 l1 -~ l0 - .
o' .i u; ii l- -X a.. ft 0 43t0 " I
~~~~~~t .- tI lt.1~ll
I ~ ~~~~~~~~~~~~~~P I _3 * P* s1
o "^°wa S, 48 w a__ o _ _ i'^k*_ !s gl n dL il " i i1 .4