Determination of prioritization for maintenance of the upper ...
Upload
independentCategory
view
6download
0
Journal of Applied Ecology
2009,
46
, 82–91 doi: 10.1111/j.1365-2664.2008.01598.x
© 2008 The Authors. Journal compilation © 2008 British Ecological Society
3Blackwell Publishing Ltd
Surrogacy and persistence in reserve selection:
landscape prioritization for multiple taxa in Britain
Aldina M. A. Franco
1
*, Barbara J. Anderson
2
, David B. Roy
3
, Simon Gillings
4
, Richard Fox
5
,
Atte Moilanen
6
and Chris D. Thomas
1,2
1
Department of Biology, University of York, PO Box 373, York YO10 5YW, UK;
2
UKPopNet, Department of Biology, University of York, PO Box 373, York YO10 5YW, UK;
3
NERC Centre for Ecology and Hydrology, Monks Wood, Abbots Ripton, Huntingdon, Cambridgeshire PE28 2LS, UK;
4
British Trust for Ornithology, The Nunnery, Thetford, Norfolk IP24 2PU, UK;
5
Butterfly Conservation, Manor Yard, East Lulworth, Dorset BH20 5QP, UK; and
6
Metapopulation Research
Group, Department of Biological and Environmental Sciences, PO Box 65, 00014 University of Helsinki, Finland
Summary
1.
A principal goal of protected-area networks is to maintain viable populations of as many speciesas possible, particularly those that are vulnerable to environmental change outside reserves. Ideally,one wants to be able to protect all biodiversity when selecting priority areas for conservation.
2.
Using the area-prioritization algorithm ZONATION, we identified the locations where UKBiodiversity Action Plan (BAP) species of mammals, birds, herptiles, butterflies and plants occur inconcentrated populations with high connectivity. Both these features are likely to be correlated withpopulation persistence. The analyses were successful in maintaining a high proportion of theconnectivity of narrow-range species, and large total amounts of the connectivity of wider-rangespecies over 10% of the land surface of Great Britain.
3.
Biodiversity Action Plan (BAP – high priority) species of one taxonomic group were notparticularly good surrogates (indicators) for BAP species of other taxonomic groups. Hence,maintaining population concentrations of one taxonomic group did not guarantee doing likewisefor other taxa.
4.
Species with narrow geographic ranges were most effective at predicting conservation success forother species, probably because they represent the range of environmental conditions required byother species.
5.
Synthesis and applications.
This study identifies landscape-scale priority areas for conservationof priority species from several taxonomic groups, using the Zonation software. ‘Indicator groups’were only partially successful as predictors of priority areas for other taxonomic groups, andtherefore, the identification of priority areas for biodiversity conservation should include informationfrom all taxonomic groups available. Larger areas should be protected to account for species notincluded in the analyses. Conservation solutions based on data for many different species, andparticularly those species with narrowly defined ranges, appear to be most effective at protectingother rare taxa.
Key-words:
amphibians, birds, butterflies, conservation, mammals, plants, protected areas,reptiles, Zonation, biodiversity
Introduction
Reserve selection and area prioritization approaches aim toidentify locations where species are most likely to persist(Margules & Pressey 2000; Rodrigues
et al
. 2004). Prioritizationapproaches require some knowledge of the distribution ofspecies. A major constraint is that there is no region in the
world where the distribution and abundance patterns of everyspecies is known. Thus, relatively well-known taxa, vegetationtypes or physical attributes of the environment are often usedto guide conservation planning (Howard
et al
. 1998; Margules &Pressey 2000; Margules, Pressey & Williams 2002). Theefficacy of this approach, for biodiversity as a whole, dependson how well the conservation of these surrogates will protecttaxa that were not included within the original planningprocess (Moritz
et al
. 2001; Gladstone 2002; Margules
et al
.
*Corresponding author. E-mail: [email protected].
Landscape prioritization in Britain
83
© 2008 The Authors. Journal compilation © 2008 British Ecological Society,
Journal of Applied Ecology
,
46
, 82–91
2002; Kati
et al
. 2004; Lamoreux
et al
. 2006), especially at thespatial resolution required for on-the-ground conservationplanning.
The second major constraint is the difficulty in identifyingthe locations where species are most likely to persist. Thepotential value of reserve networks built on one taxonomicgroup for another (test) group has most commonly beenmeasured by a ‘species counting approach’, whereby onerepresentation of each test species within the reserve net-work counts as ‘inclusion’. Few studies have consideredthe amount of representation in the context of analysingthe efficacy of surrogates (Rondinini & Boitani 2006). Inaddition, reserve selection methods tend to select for over-dispersed protected area networks and sites at the edges ofspecies’ distributions (Branch, Benn & Lombard 1995;Araújo & Williams 2000; Gaston
et al
. 2001), rather thanprotecting core areas where populations might be most likelyto persist (e.g. Araújo & Williams 2001; Cabeza & Moilanen2001; Moilanen
et al
. 2005; van Teeffelen, Cabeza & Moil-anen 2006). It is largely unknown whether reserve selectionapproaches based on selecting regions where species of thebuilding taxonomic group are more likely to persist willalso protect areas where other taxa are most likely topersist (Bonn, Rodrigues & Gaston 2002; Kremen
et al
.2008). In this study, we evaluate how well reserve networksdesigned to maintain
concentrations of populations
(i.e.those more likely to be viable and persist) for one taxonomicgroup are likely to protect
concentrations of populations
ofother taxa.
Surrogates can never be perfect, and thus, it is important toidentify the characteristics of taxa that make them reliableindicators of conservation value for other species. Forexample, geographically localized species may act as moresuccessful surrogates than random draws of species (Moritz
et al
. 2001; Lawler
et al
. 2003; Tognelli 2005). Whatever the‘ideal’ surrogates might be, in practice, country conservationbodies identify priority species (e.g. national Red Lists) usinga diversity of criteria, enact legislation to protect them, andset targets to maintain populations of these taxa [e.g. 2010targets (www.cbd.int/2010-target/)]. Therefore, it is importantto identify whether reserve networks built to protect suchspecies will protect the sites where non-listed species are morelikely to persist and, given the strong taxonomic bias in redlisting, whether they will protect threatened species of othertaxonomic groups (Brooks
et al
. 2001; Lawler
et al
. 2003;Moore
et al
. 2003).The first major goal of this study is to analyse whether
reserve networks designed to protect concentrations ofpopulations of one taxonomic group (indicator group species)also protect concentrations of populations of other groups(test group species). The second major goal is to evaluate theextent to which variation in taxonomic affiliation, range size,and number of species included in the analysis influence theefficiency with which surrogates protect concentrations oftest species. All analyses are carried out using 2-km gridresolution data for mammals, birds, amphibians and reptiles,butterflies and plants in Britain.
Materials and methods
D ISTRIBUTION
DATA
AND
MODELLING
APPROACHES
We used the species listed as priorities for conservation action underthe UK Biodiversity Action Plan (UK BAP). This plan was the UK’sresponse to the Convention of Biological Diversity. Distributiondata was available at 2
×
2 km (tetrad) grid for 62 plant species, 11mammals, 4 herptiles (1 reptile and 3 amphibian species weregrouped together), 9 butterflies and 22 birds. The data sets includedistribution information from the recent atlases: 1970 to 2000 datafor mammals (Arnold 1993), herptiles (Arnold 1995), and plants(Preston, Pearmanm & Dines 2002), 1995–1999 for butterflies(Asher
et al
. 2001) and 1988–1991 for birds (Gibbons, Reid &Chapman 1993). Presence/absence data were used. Marine species,and birds that strictly depend on marine resources for feeding, wereexcluded.
In the bird atlas, volunteer recorders were asked to visit at least 8of the 25 tetrads in each 10
×
10-km grid square (Gibbons
et al
.1993). We modelled species distributions to obtain a probability ofoccurrence value for all tetrads including the unsurveyed tetrads.Models were built using the amount of each of 13 classes (SupportingInformation, Table S1) from the 1990 Land Cover Map (originalresolution 25 m) (Fuller, Groom & Jones 1994) in the square, plusaltitude and geographical location (x and y coordinates, OrdnanceSurvey grid reference) as predictors. For more details, see SupportingInformation, Appendix S1.
SELECTION
OF
PRIORITY
AREAS
FOR
CONSERVATION
Priority areas were selected using Zonation (Moilanen
et al
. 2005;Moilanen 2007), a reserve selection software designed to identifynetworks of areas with
concentrations of populations
for manyspecies simultaneously. The algorithm incorporates the dispersalability of each species which determines whether separate sites are‘connected’, and whether unoccupied sites can be colonized. Cellswhere species are present have high connectivity values. Emptyneighbouring cells also have some connectivity, their connectivity‘value’ (below) increases with the number and proximity (weightedby each species’ ability to disperse) of nearby occupied cells. Areaswith aggregations of population/s have high connectivity as individ-uals can easily disperse between neighbouring sites. Connectivityvalues were calculated for every cell, for each species separately, toprovide population connectivity surfaces of individual species(correlated with the likelihood that populations will persist; Hanski1998; Hanski & Ovaskainen 2000), and these surfaces were thenused within the Zonation software. The Zonation meta-algorithm(Moilanen 2007) determines the proportion of the total connectivityof each species summed across the study area (Britain) that iscontained within each grid cell and then iteratively discards loca-tions (grid cells) of lowest proportional connectivity value across allspecies. The removal process starts from the edge of the area, thusmaintaining a high degree of structural connectivity in the remain-ing area. Once a cell is removed from a species’ distribution, a partof the species’ connectivity is removed; thus, the remaining grid cellswill contain a higher proportion of the species’ overall remainingconnectivity. This causes those cells to increase in value and becomeharder to remove (Moilanen
et al
. 2005; Moilanen 2007). In the finalsteps of the ranking process, a small percentage of grid cells remainbut all species are still represented, following the principle of com-plementarity (Williams
et al
. 1996; Margules & Pressey 2000;

84
A. M. A. Franco
et al.
© 2008 The Authors. Journal compilation © 2008 British Ecological Society,
Journal of Applied Ecology
,
46
, 82–91
Cabeza & Moilanen 2001). These cells represent the top priority coreareas for species conservation and contain high connectivity areasfor all species. The Zonation software and user manual (Moilanen &Kujala 2006) are freely available from www.helsinki.fi/bioscience/consplan.
In Zonation, the connectivity value
S
of cell
i
, for each species
j
, iscommonly modelled using an exponential function of the distance
d
(in km) from all
k
cells that are occupied by the same species, takinginto account the species’ ability to disperse (
α
j
) and the size of thepopulation in cell
k
(
A
kj
):
S
ij
=
∑
k
exp(
−
α
j
d
ik
)
A
kj
(Moilanen &Nieminen 2002). In this study, presence/absence data were used forall taxonomic groups (except the birds for which the probability ofoccurrence from modelled distributions was used), and thus, thepopulation in cell (
A
kj
) is a value between 0 and 1 in all cases.Connectivity values are calculated for all cells for each species. Withmodelled bird distributions, cells
i
are weighted by the probability ofoccurrence value obtained from the model outcome. The values of
α
correspond to movements of individuals: these ranged from 0·25 forthe most dispersive species (10% of individuals disperse more than9·2 km), to 3 (10% move more than 0·76 km). These alpha valueswere based on prior knowledge of species dispersal capacities forbutterflies (Cowley
et al
. 2001) and birds (Wernham
et al
. 2002). Forother taxa, we attributed an alpha value within this range, takinginto account the relative ability of each species to disperse (Support-ing Information, Table S2). This procedure was an approximationand not based on dispersal studies. The plants are the group with thelowest average dispersal value and correspondingly, the highest
α
(average 2·71) and the birds have the highest dispersal ability and thelowest average
α
(0·36).Maps (Fig. 1) show the highest priority 10% of Britain for the
BAP species in each taxonomic group. We evaluated how the best10% areas obtained for each taxonomic group protected the connectivityof the remaining groups. We display 10% of Britain as an example,although this is not necessarily the target for conservation (Rodrigues& Gaston 2001). Information used for red-listing inevitably variesamong taxonomic groups because different types of data areavailable. Birds and mammals could be classified as UK BAPpriority species on the basis of small range or population size orlarge population declines (for which data exist), whereas range sizecriteria predominate for taxa with less complete data. To understandthe consequences of this effect, we determined the 95% range sizequartile of all species from the other taxonomic groups and carriedout the selection of priority areas for bird and mammal species witha range size below this threshold.
Distribution information at 2-km resolution is available for
all
resident breeding butterflies and birds in Britain (57 butterfly and176 bird species, as defined above), allowing us to carry out additionalanalyses. We evaluated how the best 10% of the landscape obtainedfor the BAP species performed at protecting the connectivity of non-BAP species.
FACTORS
AFFECTING
THE
EFFIC IENCY
OF
SURROGATES
AT
SMALL
-
SCALE
RESOLUTION
We assessed the efficacy of surrogates by gradually adding moretaxonomic groups, more species and species with different rangesizes (building species) to the analysis and quantified how thesolutions protected the remaining species (test species). Generalizedlinear models (GLM) with a
normal
error distribution and
identity
link function (Venables & Ripley 2002) were used to determinewhich attributes of the building species were most important formaximizing the connectivity of the test species.
For birds and butterflies, we tested the effect of range size, and carriedout a sub-sampling approach. All 57 butterflies and 176 birds (analysedseparately) were sorted according to range size, with the first halfdesignated LARGE range size species and the second half SMALLrange size species. Large-range species were then randomly split intwo sub-samples, as were the small-range species. The randomi-zation procedure ensured comparable sub-samples (for range sizeaverages and variances): the two smallest range species were takenfirst and one of them was randomly assigned to each of the twosub-samples, then proceeding to the next pair of species, and so on.A Zonation solution was built for each sub-sample. Thus, we couldassess the extent to which the Zonation solution built using half thesmall-range butterfly species protected the connectivity of the remainingsmall-range butterfly species, and of the large-range butterfly species,etc. To test the similarity between solutions, we used Spearman rankcorrelations.
Results
SELECTION
OF
PRIORITY
AREAS
FOR
CONSERVATION
FOR
D IFFERENT
TAXONOMIC
GROUPS
Figure 1 shows the top-ranked (hereafter ‘best’) 10% ofBritain, resulting from the landscape prioritization algorithm,for each taxonomic group (BAP species). Solutions wereespecially effective for plants, butterflies and herptiles,maintaining an average of over 95% of the connectivity of thetarget species within 10% of the land surface, and reasonablyeffective for mammals and birds (italicized diagonal in Table 1).
When all species were included simultaneously in theanalysis (Fig. 1f), on average 72% of the connectivity of all108 BAP species was contained within the best 10% of theland surface. This all-species analysis contained 94% and 76%of the connectivity of BAP plants and herptiles, respectively,but only 30% and 31% of the connectivity of the morewidespread BAP birds and mammals (underlined values inTable 1).
Birds lost the highest proportion of their connectivity perunit area lost, whereas 80% of the landscape could be removedwithout causing any depletion/loss to the BAP plants’connectivity (Fig. 2a). This difference arose because BAPplants have much smaller range sizes than BAP birds: loss ofa part of the landscape will eliminate some of the bird species’connectivity. Due to the widespread ranges of BAP birds andmammals, protection of 10% of the landscape was not enoughto maintain high proportions of their connectivities.Nonetheless, because BAP birds and mammals had relativelylarge range sizes to start with, these groups, and especiallybirds, had high average total amounts (as opposed to propor-tion) of connectivity in the best 10% solution obtained whenusing all BAP species in the analysis (Fig. 2b). It is onlypossible to maintain a relatively small
proportion
of theconnectivity of large-range species in a small reserve network,but the
total amount
of their connectivity protected is higherthan for small-range species (Fig. 3).
To understand if the Zonation solutions are equally goodfor small- and large-range size species, the 95% quartile of therange size of all BAP species (except birds and mammals) was

Landscape prioritization in Britain
85
© 2008 The Authors. Journal compilation © 2008 British Ecological Society,
Journal of Applied Ecology
,
46
, 82–91
determined: a figure of 327 10
×
10-km grid squares. Whenonly the small-range size BAP bird and mammal species areincluded in the analyses (species that occur in less than 327grid squares), the Zonation solutions show an improvement,relative to all-bird and all-mammal solutions, in protectingthe connectivity of the other taxonomic groups (Table 1).This improvement is significant for birds (Z
(2)57
=
−
3·029,
P
= 0·002), but marginal for small-range size mammals(Z
(2)98
=
−
1·773,
P
= 0·07).
The map with the best 10% of Britain obtained for plants(Fig. 1a) showed a high degree of fragmentation in the dis-tribution of the threatened plant species at this scale, whilethe map obtained for birds was the least fragmented. This dif-ference could have arisen because of: the much smaller rangesizes of BAP plants than birds, the larger number of BAPplant species (62 vs. 22 BAP bird species), the lower dispersalability of plants (average
α
= 2·7 for plants; 0·3 for birds;Table 1), or because the birds had modelled distributions
Fig. 1. The highest-ranking 10% of Britain to protect the connectivity of the BAP species of each taxonomic group, ordered by average rangesizes: (a) plants (smallest average range sizes), (b) butterflies, (c) herptiles, (d) mammals, (e) birds (largest average range sizes), (f ) solutionobtained using all groups in the analysis.

86
A. M. A. Franco
et al.
© 2008 The Authors. Journal compilation © 2008 British Ecological Society,
Journal of Applied Ecology
,
46
, 82–91
(and a different sampling strategy). Our solutions were notparticularly sensitive to estimated dispersal parameters, asassessed by comparing the order in which cells were removedby Zonation using species-specific
α
values (the main results)
with the order of removal when every species was assignedα = 2 (Spearman ρ = 0·96 for plants and butterflies; ρ = 0·86for mammals, ρ = 0·80 for birds, and ρ = 0·81 for all BAPspecies; the original herptile solution already used α = 2 forevery species).
Table 1. Average proportion of connectivity included in each group’s best 10% solution, using BAP species from each taxonomic group
Indicator group (used to build Zonation solution)
Plants Butterflies Herptiles Mammals Mammals* Birds Birds* All BAP species
Test group Average proportion of connectivity in 10% solutionPlants 0·991 0·184 0·130 0·137 0·185 0·143 0·150 0·944Butterflies 0·207 0·951 0·202 0·202 0·249 0·167 0·204 0·667Herptiles 0·292 0·249 0·993 0·175 0·206 0·228 0·237 0·763Mammals 0·185 0·255 0·208 0·612 0·503 0·139 0·160 0·315Mammals* 0·259 0·375 0·278 0·721 0·878 0·179 0·225 0·466Birds 0·122 0·127 0·102 0·125 0·146 0·417 0·398 0·307Birds* 0·141 0·163 0·082 0·140 0·191 0·626 0·667 0·453
All BAP species† 0·168 0·182 0·138 0·142 0·183 0·149 0·161 0·720
Characteristics of the taxonomic groupNo. of species 62 9 4 11 5 22 12 108Average range size‡ 58·8 102·3 242·3 464·5 73·0 784·9 65·7 285·5Average total connectivity 104·7 210·5 611·1 1557·6 563·3 10 611·6 713·6 2419·7Average α value 2·7 1·1 2 0·7 0·45 0·3 0·35 1·9
*subset with small range size species (species present in <327 10 × 10 km grid squares which corresponds to the 95% quartile of the range size of plants, butterflies and herptiles).†average for all BAP species excluding the indicator group used to run the analysis.‡average number of 10 × 10 km grid squares per BAP species.Values in italics are for analyses where indicator and test species are the same as one another; for underlined values, test species are a subset of the indicator species.
Fig. 2. Amount of original distribution (connectivity) retained foreach taxonomic group when determining priority areas for BAPspecies in those taxonomic groups. (a) Proportion of originaldistribution as a function of proportion of the landscape remainingas lower priority areas are removed. (b) Relationship between averageproportion of connectivity retained in the best 10% of the landscapeand the average total connectivity retained.
Fig. 3. The (a) proportions and (b) total amounts of connectivity ofeach species in the within-taxon Zonation solutions when selectingthe ‘best’ 10% of Britain. Range size is the number of 10 × 10 km gridsquares occupied by each species in Britain.
Landscape prioritization in Britain 87
© 2008 The Authors. Journal compilation © 2008 British Ecological Society, Journal of Applied Ecology, 46, 82–91
EFFICACY OF INDICATOR GROUPS
There was some overlap in Zonation solutions (Fig. 1)obtained for each taxonomic group, but indicator taxamaintained only a fairly small proportion (0·18 on average;compared to the null expectation of 0·10) of the connectivityof test species in the top 10% of Britain (Table 1). The best areasfor maintaining the largest proportion of the connectivity ofone group did not coincide particularly well with the bestareas for protecting the connectivity of other groups.Butterflies (and small-range mammals) were the bestindicator groups, and herptiles the worst, although none ofthe groups was particularly good. The best 10% of Britain forbutterflies protected 96% of the BAP butterflies’ connectivity,but only 18% (about twice as good as choosing locations atrandom) of the connectivity of BAP species in all othertaxonomic groups (Table 1). In contrast, when all BAPspecies were included in the analysis, on average 72% of theconnectivity of all species was protected, still in 10% of theland surface.
ARE BAP SPECIES GOOD AT PROTECTING THE CONNECTIV ITY OF NON-BAP SPECIES?
For butterflies, the BAP-species and all-species Zonationsolutions were correlated (Spearman ρ = 0·77, n = 6136,P < 0·001, comparing the removal order of the best 10% ofcells). The solution obtained with all butterfly species is betterthan the solution obtained with only the BAP species atprotecting the connectivity of all species of butterflies(Z(2)57 = −4·108, P < 0·001). The BAP species maintained onaverage 26% of the connectivity of the 46 non-BAP butterfliesand 96% of the connectivity of the BAP species in the best10% of cells (Table 2). If all butterfly species are included, 43%and 83% of the connectivity of non-BAP and BAP species ismaintained in the best 10% of cells, respectively. The samepattern can be seen for birds, albeit with lower averageproportional protection, and there is no significant difference
between the connectivity of all birds protected by the all-birdspecies and BAP-bird solutions (Z(2)176 = −0·517, P = 0·605).
CAN SELECTION OF SURROGATES BE IMPROVED?
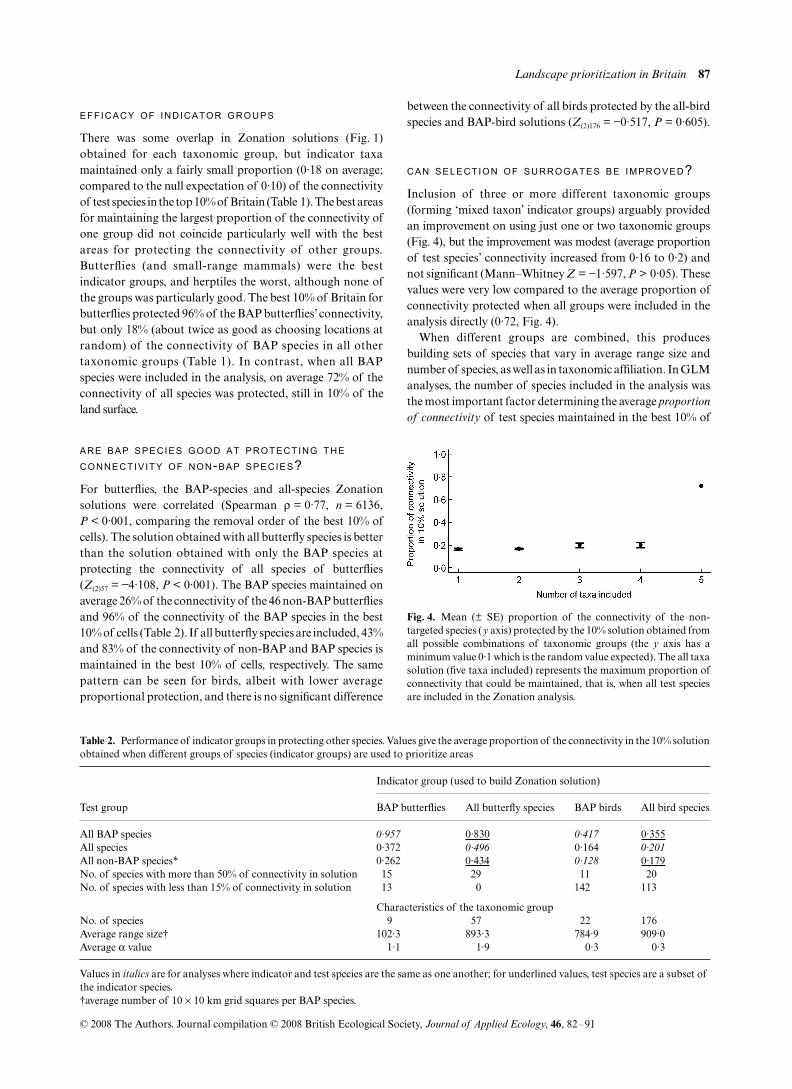
Inclusion of three or more different taxonomic groups(forming ‘mixed taxon’ indicator groups) arguably providedan improvement on using just one or two taxonomic groups(Fig. 4), but the improvement was modest (average proportionof test species’ connectivity increased from 0·16 to 0·2) andnot significant (Mann–Whitney Z = −1·597, P > 0·05). Thesevalues were very low compared to the average proportion ofconnectivity protected when all groups were included in theanalysis directly (0·72, Fig. 4).
When different groups are combined, this producesbuilding sets of species that vary in average range size andnumber of species, as well as in taxonomic affiliation. In GLManalyses, the number of species included in the analysis wasthe most important factor determining the average proportionof connectivity of test species maintained in the best 10% of
Table 2. Performance of indicator groups in protecting other species. Values give the average proportion of the connectivity in the 10% solutionobtained when different groups of species (indicator groups) are used to prioritize areas
Test group
Indicator group (used to build Zonation solution)
BAP butterflies All butterfly species BAP birds All bird species
All BAP species 0·957 0·830 0·417 0·355All species 0·372 0·496 0·164 0·201All non-BAP species* 0·262 0·434 0·128 0·179No. of species with more than 50% of connectivity in solution 15 29 11 20No. of species with less than 15% of connectivity in solution 13 0 142 113
Characteristics of the taxonomic groupNo. of species 9 57 22 176Average range size† 102·3 893·3 784·9 909·0Average α value 1·1 1·9 0·3 0·3
Values in italics are for analyses where indicator and test species are the same as one another; for underlined values, test species are a subset of the indicator species.†average number of 10 × 10 km grid squares per BAP species.
Fig. 4. Mean (± SE) proportion of the connectivity of the non-targeted species (y axis) protected by the 10% solution obtained fromall possible combinations of taxonomic groups (the y axis has aminimum value 0·1 which is the random value expected). The all taxasolution (five taxa included) represents the maximum proportion ofconnectivity that could be maintained, that is, when all test speciesare included in the Zonation analysis.

88 A. M. A. Franco et al.
© 2008 The Authors. Journal compilation © 2008 British Ecological Society, Journal of Applied Ecology, 46, 82–91
the land surface. For average total connectivity, species rangesize was most important (Table 3). The most effective indicatorgroups contained large numbers of small-range species, regardlessof the taxonomic group to which they belonged.
Effects of range size were also seen in additional analysesof all bird and all butterfly species (Fig. 5). For butterflies,large- and small-range size (building) species were equallygood at predicting the best areas for protecting small-rangesize test species (solid and dashed black lines are intermingled:Fig. 5). For birds, small-range size species were the best predictorsof other small-range size species (solid black lines lie abovethe dashed black lines: Fig. 5). The connectivity of small-range size species is better predicted by other species (blacklines) than is the connectivity of large-range size species (greylines), which is useful since small-range size species areusually more important for conservation actions. In general,the results show that small-range size species are more effectivethan large-range size species in prioritizing areas for conser-vation, with small-range building species on average protectingsome 29% (birds) to 45% (butterflies) of the connectivity ofsmall-range testing species in the best 10% solutions.
Discussion
SELECTION OF PRIORITY AREAS FOR LONG-TERM PERSISTENCE OF BAP SPECIES
Twentieth century agricultural intensification and other humanactivities radically transformed the UK landscape, confiningmany species to small areas of semi-natural habitats, andgenerating large population declines in others (Pain &Pienkowski 1997). Biodiversity Action Plan (BAP) species arethose for which the UK government has set targets of tryingto stop their decline by 2010 (www.cbd.int/2010-target).To meet the 2010 biodiversity targets (CBD 1992) and thetargets and requirements of other relevant strategies andlegislation, protecting areas where these species have thegreatest chances of long-term survival appears to be appro-priate. We had access to data from UK BAP species belongingto five taxonomic groups. Zonation identifies areas where thegreatest concentrations of species populations exist, which isa relative measure of the likelihood of population/speciespersistence (Moilanen et al. 2005). To guarantee long-termpersistence, one would ideally obtain information on thecapacity of each landscape to support viable populationsthrough detailed population viability analyses. Unfortunatelythis information is difficult to obtain for every species inmulti-species systems (Carroll et al. 2003), even in a relativelydata-rich part of the world. The connectivity approximationadopted within Zonation is probably one of the best approachesavailable, although solutions obtained should be tested forrobustness to population extinction (Early & Thomas 2007).
Our maps represent the best 10% of the landscape for eachof the five taxonomic groups analysed and also for the full setof 108 BAP species analysed. Ten per cent was selected fordisplay purposes, and it might not be enough for the effectiveprotection of all species (Rodrigues & Gaston 2001). Aswith other reserve selection algorithms, Zonation usescomplementarity principles (Williams et al. 1996), but incombination with the distribution smoothing (connectivity)technique, it retains areas with larger concentrations ofspecies populations, and not just species presences (Moilanenet al. 2005). The solution with the best 10% of Britain for allBAP species is able to maintain over three-quarters of theconnectivity of small-range plants and herptiles, and two-thirds of the butterfly connectivity (many of which haveextremely small distributions; Cowley et al. 1999), but lessthan one-third of the connectivity of the more widespreadmammals and birds. This indicates that a larger area needs tobe managed for the effective long-term protection of these
Table 3. Results of the GLM analysis. Effects of the characteristics of the indicator group on average total and proportion of connectivity inthe 10% solution. β is the constant value obtained in the GLM
GLM
Characteristics of indicator group
No. of taxonomic groups Average range size No. of species β
Average total connectivity −0·224 (n.s.) −5·756 (<0·001) −0·133 (n.s.) 9·430 (<0·001)Average proportion of connectivity 0·006 (n.s.) 0·975 (n.s.) 3·093 (0·004) 11·923 (<0·001)
Fig. 5. Efficacy of Zonation solutions built using random samplesof small- and large-range species at maintaining the connectivityof non-target small and large-range species. Each line represents aseparate random selection of species.

Landscape prioritization in Britain 89
© 2008 The Authors. Journal compilation © 2008 British Ecological Society, Journal of Applied Ecology, 46, 82–91
species (alternatively, the criteria for conservation listing mayhave been lower for some taxa). Measures that promotespecies conservation in the wider countryside could be a solutionfor the effective protection of threatened species with largerange sizes. Nevertheless, these two groups still have largetotal amounts of connectivity in the solutions, showing thatthe Zonation approach is adequate to identify priority areasfor large-range size species.
The results obtained for birds are based on models ofprobability of occurrence and not raw distribution data, asused for the other taxonomic groups. Although the presence/absence and modelled solutions were correlated (see SupportingInformation, Appendix S1), we selected the latter becausepotentially good quality sites that were not surveyed couldthen be identified and included in the selection of priorityareas for conservation.
As with other area selection algorithms, that attempt toprioritize areas where species are more likely to persist (Cabeza& Moilanen 2001; Briers 2002; Nicholson et al. 2006), Zonationdoes not assess the availability of suitable habitat within theunderlying landscape, and therefore, Zonation will prioritizeempty cells that are close to cells that are occupied even ifno suitable habitat is available in those cells. Furthermore,Zonation assumes that species can move in all directionsequally and does not take into account landscape barriers andthe fact that some species may only disperse if specific habitatsare available. Therefore, the priority areas should be regardedas regions within which more specific conservation measuresshould be undertaken (cross-checking with habitat layers;establishing conservation programmes for specific habitats;habitat restoration).
EFFICACY OF INDICATOR TAXA
The results indicate that, at 2 × 2-km resolution, the bestareas for maintaining the largest proportion of the con-nectivity of one group do not coincide well with the best areasfor protecting the connectivity of the other groups; this con-clusion is similar to studies based on species occurrences(Prendergast et al. 1993; van Jaarsveld et al. 1998). At thisresolution, the BAP species of one taxonomic group takentogether are not particularly good surrogates for determiningthe best areas for protecting the combined BAP species ofother taxonomic groups, albeit better than random. Ideally,one should have distribution information on all species toselect priority areas for their conservation. Since completedata on all taxa is rare, this implies that distribution/habitatmodels will often have to be used to establish priority areas(Moilanen et al. 2005; Kremen et al. 2008), as with the birdsin this study.
ARE BAP SPECIES GOOD SURROGATES FOR ALL SPECIES?
The ability of species of high conservation value (BAPspecies) to act as surrogates in the protection of non-threatenedspecies apparently depends on the number of species considered
and their range sizes. While BAP birds were good surrogatesof all bird species, threatened butterfly species were notparticularly good surrogates for conserving populationconcentrations of all butterfly species, as found by otherauthors examining species representation (Bonn et al. 2002).Nonetheless, conservation of threatened and non-threatenedspecies is compatible; the connectivities of both the existingBAP and non-BAP species were well-represented when weconsidered both groups together (Table 2). Because specieswith small range sizes are maintained disproportionatelywithin Zonation, the all-butterfly analysis maintained theBAP species (most of which have small range sizes) well. Theproportion of connectivity maintained for bird species wasmuch lower than for butterflies, given that many birds (evenBAP species) are widespread (and ranges sizes are possiblyinflated due to the use of modelled distributions). BAP andall-species bird solutions were relatively similar, probably dueto the larger number of species and to a diversity of range sizesof the BAP species.
WHAT IS A GOOD SURROGATE?
Identification of an efficient group of surrogate taxa was notfeasible, and there was little direct advantage to including adiversity of taxonomic groups in the analysis. Other authorsfound that indicator groups work well if they have similarecological requirements to the non-targeted species they aretrying to represent (Kremen 1992; Caro & O’Doherty 1999).
We did find that including large numbers of species, andspecies with small-range sizes, improved the average proportionof connectivity and the total connectivity protected in the testspecies; just as other authors have also found that range sizeis important for the effectiveness of umbrella species (Brookset al. 2001; Lawler et al. 2003). Thus, a small number of speciesare unlikely to represent the distribution patterns of everyother species accurately. In addition, small-range species usuallyoccupy specific types of environments, and thus, inclusionof many such species is likely to represent a wide range ofenvironmental conditions, and therefore, coincidentally toprotect other specialized species. The more detailed analysesof bird and butterfly distributions showed that species withsmall ranges can be effective surrogates for other small-rangespecies, increasing the connectivity protected some threeor four times over what would be expected from a randomselection of protected areas (at 10% of Britain selected; Fig. 5).If this conclusion proves to be general, then populationconcentrations of small-range species can be used to identifythe locations where population concentrations of other small-range species are likely to be located (Vos et al. 2008).
Conclusions
Our analyses were carried out for arguably the five best-knowntaxonomic groups in Britain, where there is a strong traditionof wildlife survey by a large number of volunteers and, thus,high-resolution distribution information. The data areconsistently collected, they are compiled by non-governmental

90 A. M. A. Franco et al.
© 2008 The Authors. Journal compilation © 2008 British Ecological Society, Journal of Applied Ecology, 46, 82–91
organizations and governmental agencies involved in con-servation, and the information is rigorously evaluated to providethe distribution maps used. Whilst the data are not perfect, itis unlikely that better data exist at such a fine resolution (2-kmgrid) for other countries. Even with such high quality data,the low capacity of one taxonomic group to predict priorityareas for another suggests that ‘indicators’ are only weaksurrogates for other taxa at the scale of analysis at whichdetailed conservation planning is typically carried out. Onlyincreasing the total area under conservation is likely to beentirely effective at maintaining viable populations of taxathat are not included in conservation assessments directly. Ifsurrogates are to be used, small-range size species appear tobe relatively effective at protecting the connectivity of otherspecies with small ranges, thereby increasing the expectedpersistence of non-target species. Our results help defineBritish priority areas for population persistence of the speciesconcerned, and the UK government is committed to the con-servation of the designated BAP species.
Acknowledgements
We were supported by UKPopNet, financed by NERC and Natural England.We thank all of the recorders responsible for collecting the data, JoeChipperfield, Jane Hill, and two anonymous referees.
References
Araújo, M.B. & Williams, P.H. (2000) Selecting areas for species persistenceusing occurrence data. Biological Conservation, 96, 331–345.
Araújo, M.B. & Williams, P.H. (2001) The bias of complementarity hotspotstoward marginal populations. Conservation Biology, 15, 1710–1720.
Arnold, H.R. (1993) Atlas of Mammals in Britain. HMSO, London.Arnold, H.R. (1995) Atlas of Amphibians and Reptiles in Britain. HMSO, London.Asher, J., Warren, M., Fox, R., Harding, P., Jeffcoate, G. & Jeffcoate, S. (2001)
The Millennium Atlas of Butterflies in Britain and Ireland. Oxford UniversityPress, Oxford.
Bonn, A., Rodrigues, A.S.L. & Gaston, K.J. (2002) Threatened and endemicspecies: are they good indicators of patterns of biodiversity on a nationalscale? Ecology Letters, 5, 733–741.
Branch, W.R., Benn, G.A. & Lombard, A.T. (1995) The tortoises (Testudinidae)and terrapins (Pelomedusidae) of southern Africa: Their diversity, distributionand conservation. South African Journal of Zoology, 30, 91–102.
Briers, R.A. (2002) Incorporating connectivity into reserve selection procedures.Biological Conservation, 103, 77–83.
Brooks, T., Balmford, A., Burgess, N., Hansen, L.A., Moore, J., Rahbek, C.,Williams, P., Bennun, L.A., Byaruhanga, A., Kasoma, P., Njoroge, P.,Pomeroy, D. & Wondafrash, M. (2001) Conservation priorities for birds andbiodiversity: do East African Important Bird Areas represent speciesdiversity in other terrestrial vertebrate groups? Ostrich, Suppl. 15, 3–12.
Cabeza, M. & Moilanen, A. (2001) Design of reserve networks and the persistenceof biodiversity. Trends in Ecology & Evolution, 16, 242–48.
Caro, T.M. & O’Doherty, G. (1999) On the use of surrogate species in con-servation biology. Conservation Biology, 13, 805–14.
Carroll, C., Noss, R.E., Paquet, P.C. & Schumaker, N.H. (2003) Use ofpopulation viability analysis and reserve selection algorithms in regionalconservation plans. Ecological Applications, 13, 1773–1789.
CBD. (1992). Convention on Biological Diversity, 1992. Convention onBiological Diversity: Text and Annexes. In <www.biodiv.org>, pp. 1–34.Secretariat of the Convention on Biological Diversity, Montreal, Canada.
Cowley, M.J.R., Thomas, C.D., Thomas, J.A. & Warren, M.S. (1999) Flightareas of British butterflies: assessing species status and decline. Proceedingsof the Royal Society, Series B, 266, 1587–1592.
Cowley, M.J.R., Thomas, C.D., Roy, D.B., Wilson, R.J., Leon-Cortes, J.L.,Gutierrez, D., Bulman, C.R., Quinn, R.M., Moss, D. & Gaston, K.J. (2001)Density-distribution relationships in British butterflies. I. The effect ofmobility and spatial scale. Journal of Animal Ecology, 70, 410–425.
Early, R.I. & Thomas, C.D. (2007) Multispecies conservation planning:identifying landscapes for the conservation of viable populations using localand continental species priorities. Journal of Applied Ecology, 44, 253–262.
Fuller, R.M., Groom, G.B. & Jones, A.R. (1994) The Land Cover Map ofGreat Britain: an automated classification of Landsat Thermatic Mapperdata. Engineering & Remote Sensing, 60, 553–562.
Gaston, K.J., Rodrigues, A.S.L., van Rensburg, B.J., Koleff, P. & Chown, S.L.(2001) Complementary representation and zones of ecological transition.Ecology Letters, 4, 4–9.
Gibbons, D.W., Reid, J.B. & Chapman, R.A. (1993) The New Atlas of BreedingBirds in Britain and Ireland: 1988–1991. T & A D Poyser Ltd, London.
Gladstone, W. (2002) The potential value of indicator groups in the selection ofmarine reserves. Biological Conservation, 104, 211–220.
Hanski, I. (1998) Metapopulation dynamics. Nature, 396, 41–49.Hanski, I. & Ovaskainen, O. (2000) The metapopulation capacity of a
fragmented landscape. Nature, 404, 756–758.Howard, P.C., Viskanic, P., Davenport, T.R.B., Kigenyi, F.W., Baltzer, M.,
Dickinson, C.J., Lwanga, J.S., Matthews, R.A. & Balmford, A. (1998)Complementarity and the use of indicator groups for reserve selection inUganda. Nature, 394, 472–475.
Kati, V., Devillers, P., Dufrene, M., Legakis, A., Vokou, D. & Lebrun, P. (2004)Hotspots, complementarity or representativeness? Designing optimalsmall-scale reserves for biodiversity conservation. Biological Conservation,120, 471–480.
Kremen, C. (1992) Assessing the indicator properties of species assemblages fornatural areas monitoring. Ecological Applications, 2, 203–217.
Kremen, C., Cameron, A., Moilanen, A., Phillips, S., Thomas, C.D., Beentje, H.,Dransfeld, J., Fisher, B.L., Glaw, F., Good, T.C., Harper, G.J., Hijmans,R.J., Lees, D.C., Jr., E.L., Nussbaum, R.A., Raxworthy, C.J., Razafimpa-hanana, A., Schatz, G.E., Vences, M., Vieites, D.R., Wright, P.C. & Zjhra,M.L. (2008) Aligning conservation priorities across taxa in Madagascarwith high-resolution planning tools. Science, 320, 222–226.
Lamoreux, J.F., Morrison, J.C., Ricketts, T.H., Olson, D.M., Dinerstein, E.,McKnight, M.W. & Shugart, H.H. (2006) Global tests of biodiversityconcordance and the importance of endemism. Nature, 440, 212–214.
Lawler, J.J., White, D., Sifneos, J.C. & Master, L.L. (2003) Rare species and theuse of indicator groups for conservation planning. Conservation Biology, 17,875–882.
Margules, C.R. & Pressey, R.L. (2000) Systematic conservation planning.Nature, 405, 243–253.
Margules, C.R., Pressey, R.L. & Williams, P.H. (2002) Representing bio-diversity: data and procedures for identifying priority areas for conservation.Journal of Biosciences, 27, 309–26.
Moilanen, A. (2007) Landscape Zonation, benefit functions and target-basedplanning. Unifying reserve selection strategies. Biological Conservation, 134,571–579.
Moilanen, A. & Kujala, H. (2006) The Zonation Conservation Planning Frame-work and Software v.1·0. Edita, Helsinki, Finland.
Moilanen, A. & Nieminen, M. (2002) Simple connectivity measures in spatialecology. Ecology, 83, 1131–1145.
Moilanen, A., Franco, A.M.A., Early, R.I., Fox, R., Wintle, B. & Thomas,C.D. (2005) Prioritizing multiple-use landscapes for conservation: methodsfor large multi-species planning problems. Proceedings of the Royal Society,Series B, 272, 1885–1891.
Moore, J.L., Balmford, A., Brooks, T., Burgess, N.D., Hansen, L.A., Rahbek, C. &Williams, P.H. (2003) Performance of sub-Saharan vertebrates as indicatorgroups for identifying priority areas for conservation. Conservation Biology,17, 207–218.
Moritz, C., Richardson, K.S., Ferrier, S., Monteith, G.B., Stanisic, J., Williams, S.E.& Whiffin, T. (2001) Biogeographical concordance and efficiency of taxonindicators for establishing conservation priority in a tropical rainforestbiota. Proceedings of the Royal Society, Series B, 268, 1875–1881.
Nicholson, E., Westphal, M.I., Frank, K., Rochester, W.A., Pressey, R.L.,Lindenmayer, D.B. & Possingham, H.P. (2006) A new method for conservationplanning for the persistence of multiple species. Ecology Letters, 9, 1049–1060.
Pain, D.J. & Pienkowski, M.W. (1997) Farming and Birds in Europe: TheCommon Agricultural Policy and its Implications for Bird Conservation. 1stedn. Academic Press, London.
Prendergast, J.R., Quinn, R.M., Lawton, J.H., Eversham, B.C. & Gibbons, D.W.(1993) Rare species, the coincidence of diversity hotspots and conservationstrategies. Nature, 365, 335–37.
Preston, C.D., Pearmanm, D.A. & Dines, T.D., eds. (2002) New Atlas of theBritish and Irish Flora. Oxford University Press, Oxford, UK.
Rodrigues, A.S.L. & Gaston, K.J. (2001) How large do reserve networks needto be? Ecology Letters, 4, 602–609.

Landscape prioritization in Britain 91
© 2008 The Authors. Journal compilation © 2008 British Ecological Society, Journal of Applied Ecology, 46, 82–91
Rodrigues, A.S.L., Ackakaya, H.R., Andelman, S.J., Bakarr, M.I., Boitani, L.,Brooks, T.M., Chanson, J.S., Fishpool, L.D.C., da Fonseca, G.A.B.,Gaston, K.J., Hoffmann, M., Marquet, P.A., Pilgrim, J.D., Pressey, R.L.,Schipper, J., Sechrest, W., Stuart, S.N., Underhill, L.G., Waller, R.W.,Watts, M.E.J. & Yan, X. (2004) Global Gap Analysis: priority regions forexpanding the global protected-area network. Bioscience, 54, 1092–1100.
Rondinini, C. & Boitani, L. (2006) Differences in the umbrella effects ofAfrican amphibians and mammals based on two estimators of the area ofoccupancy. Conservation Biology, 20, 170–179.
Tognelli, M.F. (2005) Assessing the utility of indicator groups for the conser-vation of South American terrestrial mammals. Biological Conservation,121, 409–417.
van Jaarsveld, A.S., Freitag, S., Chown, S.L., Muller, C., Koch, S., Hull, H.,Bellamy, C., Kruger, M., Endrody-Younga, S., Mansell, M.W. & Scholtz,C.H. (1998) Biodiversity assessment and conservation strategies. Science,279, 2106–2108.
van Teeffelen, A.J.A., Cabeza, M. & Moilanen, A. (2006) Connectivity,probabilities and persistence: comparing reserve selection strategies.Biodiversity and Conservation, 15, 899–919.
Venables, W.N. & Ripley, B.D. (2002) Modern Applied Statistics with S.Springer, New York.
Vos, C.C., Berry, P., Opdam, P., Baveco, H., Nijhof, B., O’Hanley, J., Bell, C. &Kuipers, H. (2008) Adapting landscapes to climate change: examples ofclimate-proof ecosystem networks and priority adaptation zones. Journal ofApplied Ecology, 45, 1722–1731.
Wernham, C.V., Toms, M.P., Marchant, J.H., Clark, J.A., Siriwardena, G.M. &Baillie, S.R., eds. (2002) The Migration Atlas: Movements of the Birds ofBritain and Ireland. T. & A.D. Poyser, London.
Williams, P., Gibbons, D., Margules, C., Rebelo, A., Humphries, C. & Pressey, R.(1996) A comparison of richness hotspots, rarity hotspots, and com-plementary areas for conserving diversity of British birds. ConservationBiology, 10, 155–174.
Received 27 March 2008; accepted 5 November 2008Handling Editor: Jack Lennon
Supporting Information
Additional Supporting Information may be found in theonline version of this article:
Appendix S1. Modelling bird distributions
Table S1. Land cover map 1990 classes used to constructmodels for bird distributions. Classes are based on the 17‘Key’ cover types
Table S2. British Action Plan (BAP) species list
Table S3. Summary statistics for model performance ofGLM (Hawfinch) and GAMs (all other species) obtained forall bird species
Please note: Wiley-Blackwell are not responsible for thecontent or functionality of any supporting materials suppliedby the authors. Any queries (other than missing material)should be directed to the corresponding author for the article.
Copyright © 2022 FDOKUMEN