Surface rheology, equilibrium and dynamic features at interfaces, with emphasis on efficient tools...
15
Surface rheology, equilibrium and dynamic features at interfaces, with emphasis on efficient tools for probing polymer dynamics at interfaces Francisco Monroy a, ⁎ , Francisco Ortega a , Ramón G. Rubio a , Manuel G. Velarde b a Departamento de Química Física I, Facultad de CC. Químicas, Universidad Complutense, Ciudad Universitaria s/n, 28040 Madrid, Spain b Instituto Pluridisciplinar, Universidad Complutense, Paseo Juan XXIII, 1, 28040 Madrid, Spain Available online 5 May 2007 Abstract Adequately probing interfacial or (free) surface waves offers the possibility of exploring qualitative and quantitative equilibrium and rheological features hence large scale and long time dynamics. Several experimental techniques are briefly reviewed. The combination of capillary waves experiments with methods based on analyzing the mechanical deformation of the surface allows to explore dynamics from the microsecond scale up to collective phenomena relaxing at very long times, seconds, minutes or even hours. Results related to the scaling behavior of insoluble polymer films, and to the existence of a glass transition in quasi-2D systems are also discussed. © 2007 Elsevier B.V. All rights reserved. Keywords: Surface rheology; Langmuir polymer films; Surface waves; Capillary waves; Scaling Contents 1. Introduction ............................................................. 175 2. Surface rheology ........................................................... 176 3. Surface wave experiments ...................................................... 177 3.1. Surface Quasi-Elastic Light Scattering (SQELS) ....................................... 178 3.2. Electrocapillary waves (ECW)................................................. 180 4. Mechanical relaxation experiments .................................................. 181 4.1. Stress relaxation ........................................................ 181 4.2. Oscillatory barrier compression ................................................ 181 5. Langmuir polymer films (LPFs) ................................................... 182 5.1. Equilibrium features ...................................................... 182 5.2. Dynamics of semidilute (entangled) Langmuir polymer films: scaling, local dynamics and reptation motion ........ 184 5.3. Non-linear elasticity ...................................................... 186 5.4. Glassy polymers: non-Debye relaxations ........................................... 186 Acknowledgments ............................................................. 188 Appendix A. From (equilibrium) spontaneous fluctuations to (non-equilibrium) driven-fluctuations ................... 188 References ................................................................. 189 1. Introduction A great number of problems on surface and interface science deal with molecular motions and relaxation at fluid surfaces containing surfactants or polymer molecules [1]. In fact, modern soft-matter physics has opened a great number of questions dealing with the dynamics of soft surfaces, and, particularly, with polymer dynamics at interfaces or at reduced dimensionality, e.g. polymer chains in pores or confined between solid walls. Among these systems, adsorbed polymer films represent a paradigmatic example; in fact, polymer films are, frequently, considered as model systems to explore this new Advances in Colloid and Interface Science 134–135 (2007) 175 – 189 www.elsevier.com/locate/cis ⁎ Corresponding author. 0001-8686/$ - see front matter © 2007 Elsevier B.V. All rights reserved. doi:10.1016/j.cis.2007.04.023
-
Upload
independent -
Category
Documents
-
view
3 -
download
0
Transcript of Surface rheology, equilibrium and dynamic features at interfaces, with emphasis on efficient tools...

Science 134–135 (2007) 175–189www.elsevier.com/locate/cis
Advances in Colloid and Interface
Surface rheology, equilibrium and dynamic features at interfaces, withemphasis on efficient tools for probing polymer dynamics at interfaces
Francisco Monroy a,⁎, Francisco Ortega a, Ramón G. Rubio a, Manuel G. Velarde b
a Departamento de Química Física I, Facultad de CC. Químicas, Universidad Complutense, Ciudad Universitaria s/n, 28040 Madrid, Spainb Instituto Pluridisciplinar, Universidad Complutense, Paseo Juan XXIII, 1, 28040 Madrid, Spain
Available online 5 May 2007
Abstract
Adequately probing interfacial or (free) surface waves offers the possibility of exploring qualitative and quantitative equilibrium andrheological features hence large scale and long time dynamics. Several experimental techniques are briefly reviewed. The combination of capillarywaves experiments with methods based on analyzing the mechanical deformation of the surface allows to explore dynamics from the microsecondscale up to collective phenomena relaxing at very long times, seconds, minutes or even hours. Results related to the scaling behavior of insolublepolymer films, and to the existence of a glass transition in quasi-2D systems are also discussed.© 2007 Elsevier B.V. All rights reserved.
Keywords: Surface rheology; Langmuir polymer films; Surface waves; Capillary waves; Scaling
Contents
1. Introduction . . . . . . . . . . . . . . . . . . . . . . . . . . . . . . . . . . . . . . . . . . . . . . . . . . . . . . . . . . . . . 1752. Surface rheology . . . . . . . . . . . . . . . . . . . . . . . . . . . . . . . . . . . . . . . . . . . . . . . . . . . . . . . . . . . 1763. Surface wave experiments . . . . . . . . . . . . . . . . . . . . . . . . . . . . . . . . . . . . . . . . . . . . . . . . . . . . . . 177
3.1. Surface Quasi-Elastic Light Scattering (SQELS) . . . . . . . . . . . . . . . . . . . . . . . . . . . . . . . . . . . . . . . 1783.2. Electrocapillary waves (ECW). . . . . . . . . . . . . . . . . . . . . . . . . . . . . . . . . . . . . . . . . . . . . . . . . 180
4. Mechanical relaxation experiments . . . . . . . . . . . . . . . . . . . . . . . . . . . . . . . . . . . . . . . . . . . . . . . . . . 1814.1. Stress relaxation . . . . . . . . . . . . . . . . . . . . . . . . . . . . . . . . . . . . . . . . . . . . . . . . . . . . . . . . 1814.2. Oscillatory barrier compression . . . . . . . . . . . . . . . . . . . . . . . . . . . . . . . . . . . . . . . . . . . . . . . . 181
5. Langmuir polymer films (LPFs) . . . . . . . . . . . . . . . . . . . . . . . . . . . . . . . . . . . . . . . . . . . . . . . . . . . 1825.1. Equilibrium features . . . . . . . . . . . . . . . . . . . . . . . . . . . . . . . . . . . . . . . . . . . . . . . . . . . . . . 1825.2. Dynamics of semidilute (entangled) Langmuir polymer films: scaling, local dynamics and reptation motion . . . . . . . . 1845.3. Non-linear elasticity . . . . . . . . . . . . . . . . . . . . . . . . . . . . . . . . . . . . . . . . . . . . . . . . . . . . . . 1865.4. Glassy polymers: non-Debye relaxations . . . . . . . . . . . . . . . . . . . . . . . . . . . . . . . . . . . . . . . . . . . 186
Acknowledgments . . . . . . . . . . . . . . . . . . . . . . . . . . . . . . . . . . . . . . . . . . . . . . . . . . . . . . . . . . . . . 188Appendix A. From (equilibrium) spontaneous fluctuations to (non-equilibrium) driven-fluctuations . . . . . . . . . . . . . . . . . . . 188References . . . . . . . . . . . . . . . . . . . . . . . . . . . . . . . . . . . . . . . . . . . . . . . . . . . . . . . . . . . . . . . . . 189
1. Introduction
A great number of problems on surface and interface sciencedeal with molecular motions and relaxation at fluid surfacescontaining surfactants or polymer molecules [1]. In fact,
⁎ Corresponding author.
0001-8686/$ - see front matter © 2007 Elsevier B.V. All rights reserved.doi:10.1016/j.cis.2007.04.023
modern soft-matter physics has opened a great number ofquestions dealing with the dynamics of soft surfaces, and,particularly, with polymer dynamics at interfaces or at reduceddimensionality, e.g. polymer chains in pores or confinedbetween solid walls. Among these systems, adsorbed polymerfilms represent a paradigmatic example; in fact, polymer filmsare, frequently, considered as model systems to explore this new

176 F. Monroy et al. / Advances in Colloid and Interface Science 134–135 (2007) 175–189
physics (see Ref. [2] for a recent review). Neutron and X-raytechniques, in combination with classical spectroscopy, are verypowerful microscopic probes of structure and dynamics. Time-resolved versions of the scattering techniques, i.e., X-rayphoton correlation spectroscopy (XPCS) and neutron spin-echo(NSE), have also emerged as powerful probes of themicroscopic dynamics in these soft and fragile systems [3].However, long-time relaxation phenomena, like collectivediffusion, or more sophisticated mechanisms of relaxation likepolymer reptation motions, arm retractions, etc… show in somecases too slow a dynamics to accomplish their coherencerequirements. In this context, XPCS has been successfully usedto follow slow collective dynamics in solid-supported thinpolymer films undergoing the glass transition [4]. Howeverhigh-brilliance synchrotron sources are needed to carry outthese experiments. It is in some special cases, dealing with fluidinterfaces with long lasting evolving or decaying features,where the surface rheology supported methodology emerges asa most adequate probe of interfacial dynamics.
2. Surface rheology
It is well known that many surface active substances (inshort, surfactants), polymers with polar groups among them,tend to adsorb at fluid interfaces, forming either Gibbsmonolayers, when adsorbed from a bulk solution of thepolymer, or Langmuir films when, being insoluble in theadjacent bulk fluid phases, the polymer can be spread and lateradsorbed at the interface. From an equilibrium point of view,the surface tension, γ, is in both cases decreased with respectto the value of the bare interface γ0. The adsorbed film exertsa certain surface pressure (Π=γ0−γ) which can be seen as thedecrease of surface free energy per area unit resulting from thespontaneous adsorption of the film. The surface pressure istherefore the thermodynamic quantity which characterizes thestability of the equilibrium state of the adsorbed film. In orderto study the system under dynamical conditions let us considera small surface dilation caused by an infinitesimal change ofthe area accessible to the interfacial film, δA(t). Consequently,the adsorption state of the film changes and thus the surfacepressure proportionally varies in a small quantity δΠ(t) whichevolves in time. The change in surface pressure, whichdepends on the time scale probed in an experiment, can bewritten as:
yPðtÞ ¼ PðtÞ �P0 ¼ ∂P∂A
yA ¼ �eðtÞuðtÞ; ð1Þ
where eðtÞ ¼ �A0∂P∂A
is the time-dependent dilational mod-
ulus, that accounts for the elastic energy storage on dilatingthe film. This equation can be in fact conceived as a generaltime-dependent response function, where a surface stress δΠappears as the consequence of an stimulus applied as acompression strain u(t)=δA /A0. In this context the propor-tionality constant ε(t) is the material function, which usuallycontains both dilational and shear components, ε(t)=εK+εS.
For fluid systems, the shear component is vanishing.Therefore, for fluid films at equilibrium, the dynamic modulusequals the Gibbs elasticity ε0:
eðtÞYe0 ¼ C∂P∂C
� �eq
; ð2Þ
where Γ=1/A is the surface concentration.In the limit of constant elasticity modulus, Eq. (1) is formally
equivalent to Hooke's law for a pure elastic 2D-body. If frictionis present some delay may exist in the response function, whichcan be written in terms of a viscoelastic modulus including adissipation operator:
�yPðtÞ ¼ eðtÞduðtÞ ¼ eðtÞ þ jðtÞ ∂∂t
� �duðtÞ: ð3Þ
The second dissipative term in Eq. (3) accounts for theviscous losses, that are proportional to the dilation rate(Newton's law). The proportionality factors are respectivelythe elastic modulus ε(t) and the dilational viscosity κ(t), thatalso depends on time, t. A linear viscoelastic modulus can bedefined as:
eðtÞ ¼ � ∂Pð∂A=AÞ
� �T
: ð4Þ
For an small-amplitude oscillatory motion [δA(t)∼eiωt] offrequency ω, this complex modulus is a complex quantity:
eðxÞ ¼ eðxÞ þ ixjðxÞ: ð5ÞThe viscoelastic dilational modulus contains information
about how the surface pressure changes on dilating the film, andthus, about the changes on the adsorption state and themolecular conformation stressed by the external deformation.These changes are, in general, dependent of the time scaleprobed in the particular rheological experiment (or of thefrequency ω of the applied deformation in surface wavesexperiments). The constitutive viscoelastic parameters ε(ω) andωκ(ω) obtained as a function of ω contain the time-dependentresponse of the system subject to a small disturbance, i.e., theyallow one to probe the surface dynamics of the adsorbed film.
At equilibrium, or when the film is disturbed along a long-time quasi-static path (ω→0 for oscillatory strains), no viscouslosses are effectively present in the stress response whichbecomes purely elastic. The surface dilation causes aninstantaneous change in surface concentration, δA/A=−δΓ/Γ.Then, the elasticity modulus equals the compression modulus,which can be obtained from the relative slope of the equilibriumisotherm:
eðxY0Þ ¼ e0 ¼ C∂P∂C
� �T
: ð6Þ
And the dilational viscosity reaches its frequency-indepen-dent Newtonian limit:
jðxY0Þ ¼ j0: ð7Þ

Fig. 2. Schematic representation of the surface roughness caused by thermalenergy at a fluid interface. The roughness generates extra area, consequently theso created excess of surface energy acts as a restoring force of the flat shape. Anysurface curvature induced by thermal roughness tends to be restored by the(local) Laplace overpressure [see Eq. (10)].
177F. Monroy et al. / Advances in Colloid and Interface Science 134–135 (2007) 175–189
The linear viscoelastic response of the adsorbed film obeysthe Kramers–Kronig relationships, from which one canconclude that the elastic response increases monotonicallywith the frequency of the deformation. At variance, the viscosityκ decreases with frequency [5]. Moreover, the followinginequalities must be fulfilled:
eðxÞze0xjðxÞVeðxÞ : ð8Þ
Fig. 1 summarizes the material response predicted for aviscoelastic polymer film exhibiting terminal relaxation due tochain diffusion, e.g. reptation or arm retraction motions. Oncethe relevance of the dilational modulus has been established,then in order to get insight on surface dynamics, a challengingquestion arises: how to measure it? To make ε(t) experimentallyaccessible two different complementary approaches are possi-ble: a) mechanical relaxation, and b) surface wave experiments.The direct rheological methods, and in particular, mechanicalstress relaxation, allow obtaining the dilational modulus fromthe stress response function of the film. After straining the filmby a fast external dilation of the interfacial plane one may recordthe stress relaxation by simply monitoring the changes insurface pressure as a function of time, ΔΠ(t). In a complianceexperiment the film is stressed by a suitable pressure gradient,and then the resulting flow is monitored [6]. In practice, thesemethods are restricted to a time scale beyond a few seconds, thetime needed to strain the film.
On the other hand, the study of the propagation of small-amplitude surface waves, excited either by thermal agitation orby an external drive (electrical or mechanical), represents the
Fig. 1. Typical plot of the linear viscoelastic moduli of a material undergoingnear-exponential relaxation.
second set of methods of surface rheology. This approach doesnot allow the direct determination of the response functions.Surface hydrodynamics becomes necessary to calculate theviscoelastic parameters from the dispersion curve of the surfacemodes. As compared with the direct relaxation experiments, thesurface wave methods are more intricate, not only from aconceptual and interpretative point of view, but also withrespect to the designing and setting up of the equipment.
3. Surface wave experiments
Fluid surfaces are not fully stagnant as, even at equilibrium,due to thermal energy (noise level depending on temperature)they present some time-dependent roughness or waviness (seeFig. 2). Thus, either, under thermal agitation or subjected tomechanical stresses, any displacement of the fluid interface withrespect to the flat level shape can be conceived as a surfacemotion driven by an external force (random or otherwise) andrestored (eventually overshooting the equilibrium level)through of the viscoelastic response of the adjacent phasesand eventually of the interface itself.
For thermal random motion, the interfacial shape can bedescribed by a Fourier series of independent plane wavespropagating within the xy-plane and slightly penetrating thebulk phases adjacent to the interface (this depends on thedynamic or shear viscosity of the liquid). If the equilibrium levelposition of the interfacial plane is placed at z=0, displacementsof the surface, u(r,t), can be written as follows:
uðr; tÞ ¼Xq
uqðqÞei½qdr�xðqÞt�; ð9Þ
where the sum extends over all wave vectors q. The relationshipbetween q and the frequency ω(q) is the dispersion relation.
Surface tension γ is considered as a main restoring force forsurface transverse motions (ripples or capillary waves) (seeFig. 3): any local curvature causes a γ-governed Laplace stresswhich tends to restore the planar equilibrium shape of theinterface.
fz ¼ g∂2uz∂x2
: ð10Þ
Gravity is also a relevant restoring force, albeit for muchlonger waves than ripples [7,8].

Fig. 3. Transverse and longitudinal (in plane, dilational) motions at a fluidinterface. The cubes represent surface-active molecules (in short, surfactants)responsible of a surface-tension decrease and the horizontal arrows represent theMarangoni stress due to surface tension gradients created by the surfactantconcentration gradient.
178 F. Monroy et al. / Advances in Colloid and Interface Science 134–135 (2007) 175–189
As earlier mentioned, in the case of interfaces with anadsorbed film, the surface plane itself can show elastic andviscous features, or so-called dilational viscoelasticity. Thereare two main types of surface viscoelastic parameters, shear (S)and compression (K). However, the compression modulus isusually several orders of magnitude larger than the shearmodulus [9]. Both viscoelastic parameters govern, coupledtogether, the longitudinal interfacial motion, or Marangoni flow,which is driven by the surface tension gradient due to surfaceincrease in the area A [7,8]. The shear component can beindependently measured with appropriate devices [10], butusually the whole dilational modulus is the dominant parameterin surface rheology. The longitudinal restoring force is thenproportional to the dilational modulus through [11]:
fx ¼ dgdx
¼ eðxÞ∂2ux∂x2
: ð11Þ
The response functions in Eqs. (10) and (11) represent,respectively, the boundary conditions for the transverse andlongitudinal motions of the interface. Then, when thehydrodynamic equations are solved for oscillatory motion(Eq. (9)) the dispersion is obtained:
D ¼ Lð e; q;xÞdTðg; q;xÞ � Cðg; qÞu0: ð12Þ
Here, the constant C couples the longitudinal quantity L(ε),which only depends on the dilational modulus, with thetransverse one T(γ), governed by surface tension. This couplingconstant depends only on density ρ and shear or dynamicviscosity η of the adjacent bulk phases. C is near-zero formechanically symmetric interfaces, e.g. an oil/water interface ora suspended membrane, for which both modes, capillary anddilational, can be considered as decoupled. The couplingconstant takes non-zero values for air/liquid interfaces, whichshow kinematic asymmetry:
Cðg; qÞ ¼ ½xgðq� mÞ�2p0: ð13ÞThe penetration depth m−1 of the surface velocity field
depends on density ρ and as earlier noted on the viscosity η ofthe liquid beneath:
m2 ¼ q2 � ixq=g: ð14Þ
For viscoelastic films adsorbed at an air/fluid interface the L(ε) and T(γ) functions the dispersion relation [Eq. (12)] liquidbecome:
Lð e; q;xÞ ¼ eðxÞq2 þ ixgðqþ mÞTðg; q;xÞ ¼ gq2 þ ixgðqþ mÞ � x2q=q:
ð15Þ
Hence, capillary and dilational modes are found coupledtogether at the free surface of a liquid. Accordingly, thedilational parameters can be obtained from the analysis of thepropagation characteristics of capillary waves probed bytransverse waves devices (see Ref. [12] for a general review).This dispersion equation has two different solutions corres-ponding to two modes: capillary and longitudinal or dilationalwaves [7,8]. At a given q, complex roots are obtained (ω=ωq+ iΓq, frequency, ωq, and Γq, damping factor). For bare interfaces(ε=κ=0) a limiting solution can be obtained; one is theKelvin's law for the frequency of capillary waves propagatingon the free surface of a liquid:
x2q ¼
g
qq3; ð16Þ
and the other is Stokes' law accounting for the damping due tothe viscous friction with the bulk liquid:
Cq ¼ 2gqq2: ð17Þ
If viscoelastic dilational effects exist the capillary dampingexceeds this minimum value expected for bare interfaces.
Methods based on exciting capillary waves or ripples are themost frequently used, in particular, light scattering by thermallyexcited capillary waves (SQELS), or propagation of mono-chromatic transverse waves excited at a given frequency bymechanical or electrical actuators. Since transverse motioncauses strong fluctuations of refractive index (between the valuecorresponding to the liquid n∼1.3 and that of air, n∼1), opticalmethods based on capillary waves are much more used thanthose probing longitudinal modes, which are directly governedby the relevant dilational modulus. Capillary modes (ripples)are easier visualized than longitudinal waves.
3.1. Surface Quasi-Elastic Light Scattering (SQELS)
This method probes the light scattered by thermally excitedcapillary waves. The quasi-elastic scattering arises from fluctua-tions of refractive index due to (random) capillary roughness.Because of the small amplitude of these fluctuations, buzN
2∼kBT/γq2∼5 Å for non-critical interfaces at room temperature. Thisproduces a very small amount of scattered light, and theheterodyne detection is preferred in currently used set-ups [12].
In a typical configuration (see Fig. 4), a monochromatic andvertically polarized light beam coming from a continuous laser(He–Ne λ=0.633 μm or Ar+ λ=0.415 μm, operating at 25 mW)is directed to the interface at a reflectivity geometry (incidentangles of θi=45–50° work well at air/water interfaces, butgrazing incidence is usually necessary at oil/water or criticalinterfaces, where the optical contrast is vanishing). Before being

Fig. 4. Typical geometry of a SQELS experiment.
Fig. 5. Typical autocorrelation functions obtained by the SQELS technique attwo different values of q. The symbols are experimental data for an air/waterinterface. The lines are the best fit to Eq. (19).
179F. Monroy et al. / Advances in Colloid and Interface Science 134–135 (2007) 175–189
reflected by the interface, the light beam passes through atransmission diffraction grating with constant spacing (e.g.,d=275 μm). Diffraction orders travel at well-defined directionsθn given by the Bragg condition, d sin θn=nλ. By using a long-focus converging lens (f.l.=1 m), the diffracted beams and thetransmitted main-beam (which contains more than a 95% of thelight intensity) are focused together at the interface plane, formingthere a one-to-one image of the diffraction grating. A photo-multiplier tube collects the heterodyne beating of each diffractionorder n reflected by the interface (local oscillator) together withthe light scattered in the same direction, which is due to surfacefluctuations occurring at a wavevector qn given by:
qn ¼ 2pksinhn coshi ¼ 2pn
dcos hi: ð18Þ
In fact, the use of diffraction gratings is key because theheterodyne beating allows not only improving the signal to noiseratio by orders of magnitude, but also it eliminates spuriousscattering contributions coming from mechanical disturbances ofthe surface. In order to inhibit these noisy contributions,appropriate tools on an anti-vibration table are used. Nevertheless,the diffraction grating is the more efficient anti-vibration elementsince only the light scattered by surface waves of equal length tothat of the “optical spatial template” created by the grating on thesurface is coherentlymixedwith the light reflected in this direction.
Then the heterodyne signal Iq(t)∼uq2 can be analysed, either
by autocorrelation in the time domain, or by measuring thepower spectrum of the detected intensity Pq(ω) by means of aFourier-transform spectrum analyzer. Since at equilibriumthermal energy is distributed over all the excited modes,equipartion imposes that the scattering intensity decreases withwave-vector as Iq∼kBT/γq
2.Fig. 5 shows some examples of autocorrelation functions
which can be adequately fitted to a dependence of the type:
GðtÞ ¼ hIðsÞIðt þ sÞi ¼ hu2z ðsÞu2z ðt þ sÞi¼ AcosðxqtÞe�Cqte�bt2=2 þ GðlÞ ð19Þ
where ωq is the propagation frequency of the capillary modeand Γq its wave damping factor. The baseline G(∞) is
proportional to the averaged intensity allowing to analyze theoptical reflectivity of the surface. Due to the finite size of thedetected spot Δq, the autocorrelation function is affected ofsome extra instrumental damping β. The latter is accounted forby a Gaussian function of width β which increases with theproduct q1/2 Δq as:
b ¼ Dxqc23xq
Dqq
c23
g
q
� �1=2
q1=2Dq: ð20Þ
If detection in the frequency range is chosen, the spectrum oflight scattered by a q-mode is nearly Lorentzian-distributedaround the propagation frequency ωq; here, the band-widthΔωq=2 Γq is due to the dissipation existing within the capillarymode. If the instrumental broadening is properly accounted for,the experimental spectra can be fitted well by the convolutionwith the Gaussian instrumental function, more precisely by theVoigt profile:
Pzðq;xÞ ¼ FT½GðtÞ�cZ x
0
C2q
4C2q þ ðx V� xqÞ2
e�ðx V=2bÞ2dx V:
ð21ÞAlternatively, the exact expression for the power spectrum
can be easily obtained from the fluctuation-dissipation theoremthat for capillary modes yields:
Pzðe; g; qxÞ ¼ kBTpx
ImLðe; q;xÞ
Dðe; g; q;xÞ� �
: ð22Þ
Actually, the detected power spectrum PExp(ω) is theconvolution between the theoretical spectrum and the Gauss-ian-like instrumental function I(β)∼exp(ω2/4β2):
Pexpðe; gÞ ¼ Pzðe; gÞ � IðbÞ: ð23Þ
Fig. 6 shows a typical example of experimental spectra of thethermal modes of a liquid surface at different wavevector, q.
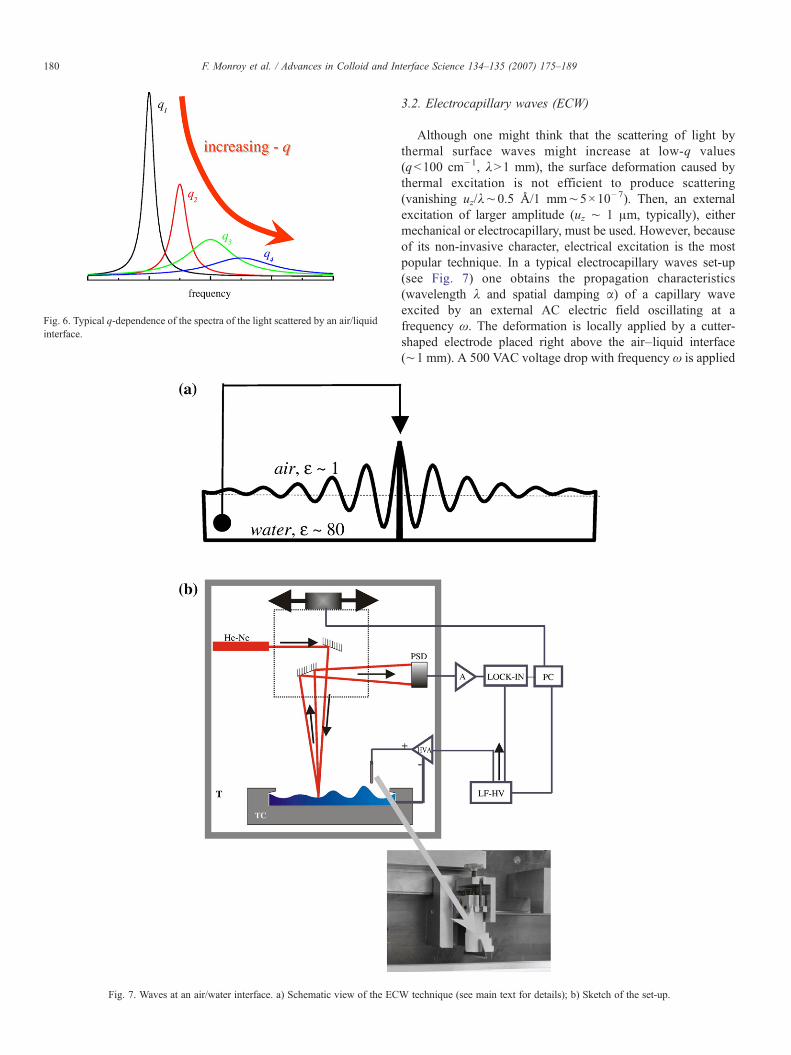
Fig. 7. Waves at an air/water interface. a) Schematic view of the EC
Fig. 6. Typical q-dependence of the spectra of the light scattered by an air/liquidinterface.
180 F. Monroy et al. / Advances in Colloid and Interface Science 134–135 (2007) 175–189
3.2. Electrocapillary waves (ECW)
Although one might think that the scattering of light bythermal surface waves might increase at low-q values(qb100 cm−1, λN1 mm), the surface deformation caused bythermal excitation is not efficient to produce scattering(vanishing uz/λ∼0.5 Å/1 mm∼5×10⁻⁷). Then, an externalexcitation of larger amplitude (uz ∼ 1 μm, typically), eithermechanical or electrocapillary, must be used. However, becauseof its non-invasive character, electrical excitation is the mostpopular technique. In a typical electrocapillary waves set-up(see Fig. 7) one obtains the propagation characteristics(wavelength λ and spatial damping α) of a capillary waveexcited by an external AC electric field oscillating at afrequency ω. The deformation is locally applied by a cutter-shaped electrode placed right above the air–liquid interface(∼1 mm). A 500 VAC voltage drop with frequency ω is applied
W technique (see main text for details); b) Sketch of the set-up.

181F. Monroy et al. / Advances in Colloid and Interface Science 134–135 (2007) 175–189
between this electrode and the liquid. Since a difference ondielectric constant exists between both sides of the interface, thedeformable interface follows instantaneously the direction ofthe applied electric field. This dielectric ponderomotivedeformation is proportional to the square of the applied fielduz∼E2(ω0)∼ (cos ω0)
2∼ cos (2ω0), the response has afrequency twice that of the applied field, ω=2ω0 typical ofparametric excitation dynamics [12].
The spatial profile of the excited electrocapillary wave isthen scanned by laser reflectometry. A low intensity He–Nelaser is focused and then reflected by the interface; here, thereflected beam oscillates as the surface does. Surface oscilla-tions are monitored by a position sensitive photodiode (PSD)placed at 1 m distance, by detecting the intensity locked-withinthe excitation signal in a lock-in amplifier which allows to plotthe amplitude and the phase difference of the excited capillarywave as a function of the distance to the excitation point, x. Thesignal so detected is scanned as a function of x by translating theimpinging point of the reflectometric probe. After the signal isprocessed the spatial profile of the ECW is obtained:
uzðxÞfcos2pkxþ /
� �e�ax: ð24Þ
The method allows one to obtain the wavelength λ (=2π/q),and the spatial damping α as a function of ω the excitationfrequency of the ECW. Both, α and the temporal damping Γq
obtained in the SQELS experiments are mutually relatedthrough the group velocity of the surface wave, U=∂ω/∂q,obtained from the dispersion relation:
Cq ¼ UðxÞa ¼ ∂x∂q
a: ð25Þ
Data analysismust be performed through the numerical solutionof the dispersion equation [Eqs. (12)–(15)] which must solved forgiven propagation parameter values, ω and q=(2π/λ)− iα.
Fig. 8. Step-compression experiment. The bottom part shows the fast reductionof the area of the film. This produces a fast increase of Γ that relaxes down to itsequilibrium state.
4. Mechanical relaxation experiments
4.1. Stress relaxation
Experiments of mechanical rheology can be easily per-formed in standard Langmuir troughs (and eventually inpendant drop or bubble devices). Particularly, the stressrelaxation σ(t) can be recorded as a function of time t after asudden uniaxial in-plane compression of the Langmuir film isperformed with the barriers of the trough. The surface stress isdefined as σ(t)≡ΔΠ(t)=Π1(t)−Π1(t→∞) [13]. As a conse-quence of the surface compression a surface pressure gradientΔΠ appears. This creates a dilational stress σD that acts asrestoring force for recovering the initial state of the film whenstrain ceases. Then, after compression of the film the surfacepressure, Π1(t)=γ0−γ (γ being its surface tension and γ0 thatof the bare liquid), relaxes to its value at equilibriumΠ1(t→∞).The surface dilation, θ=−ΔA/A0=− (A0−A) /A0=ΔΓ/Γ, istypically adjusted in order to accommodate a strain within the
linear elastic regime (θ≤10%). In a typical experiment the filmarea A is rapidly reduced by the compression factor θ withrespect to the initial area A0 (see Fig. 8).
Routinely, it must be checked that the viscoelastic responseis linear at this strain level and the signal-to-noise ratio of therecorded signal is high enough. At sufficiently long times thesystem recovers always an equilibrium state in accordance withthe equilibrium isotherm.
4.2. Oscillatory barrier compression
The barriers of the trough can be subjected to a sinusoidalmotion at a constant frequency ω. It is important that the strainperturbation was a true sinusoidal function. Fourier transformanalysis (FT) of the strain perturbation shows the absence offrequency components superimposed on the fundamentalfrequency, ω. In order to rule out any influence of the timedependence of the pressure sensor response to a change ofpressure, blank experiments at different sensor-to-barrierdistances must to be performed. It has also to be checked thatthe material parameters are not biased by the propagation timeof the compression wave, which is at least one order ofmagnitude lower than the experimental period (typically higherthan 1 s). Films are strained in the Langmuir trough by anuniaxial in-plane compression of amplitude u. Depending onthe trough dimensions u can be varied from 0 to 50%, althougha typical experiment within the linear regime involvescompression–expansion cycles smaller than 10 per cent of theinitial surface area A0. Since the Langmuir trough has a fixedwidth, the strain ratio is actually an elongation/compressionratio. If the trough barriers are placed at a distance L we have:
uuA0 � AA0
¼ L0 � LL0
: ð26Þ
In order to perform experiments at constant frequency butvariable strain amplitudes the barrier speed c is in practiceconveniently changed (u=c/ω).

Fig. 9. Chain length dependence of the gyration radius of poly-(ter-butylacrylate) films on water. The dashed line is the fit to RG∼b Nν with ν=0.73 forNNNC and ν=1 for NbNC.
Fig. 10. Typical shape of the isotherms of Langmuir polymer films for good-(Π∼Γ3) and poor-solvent (Π∼Γ7) conditions.
182 F. Monroy et al. / Advances in Colloid and Interface Science 134–135 (2007) 175–189
Note that because of the uniaxial character of the compressivedeformation, both the applied strain u and the response stress σD
have hydrostatic compression (xx) and in-plane shear (xy)components. In terms of a generalized stress function, thedilational response function can be written as follows:
rðx; uÞu eðx; uÞdu; ð27Þwhere ε(ω;u) is in general a frequency-strain-dependentdilational modulus, containing two components coupled togeth-er, the hydrostatic component (K) and the shear one (S) [14–17]:
e ¼ eK þ eS: ð28ÞAt small enough strain levels the elastic response is linear,
i.e., only at u→0 the dilational modulus is a strain-independentconstant taking values close to the equilibrium compressionmodulus, ε0.
With a sinusoidal applied strain, its time dependence has theform:
uðtÞ ¼ u02ð1þ eixtÞ; ð29Þ
where u0 is the strain amplitude. Only in the linear regime (ifu0→0 then σ=constant u0) the elastic response closely followsthe driving sinusoidal shape of frequencyω imposed by the strain:
PðtÞ ¼ P0 þ rðtÞrðtÞ ¼ r0
21þ eiðxtþ/rÞh i
:ð30Þ
Here, σ0 is the amplitude of the stress response, measuredwith respect to the pressure background Π0, and ϕσ is a phasefactor accounting for the viscous delay in the response. In fact, apurely elastic response leads to a zero phase difference, whichreaches a maximum value of π/2 for a non-elastic viscous fluid.In the linear regime, the elasticity modulus ε and the dilationalviscosity κ can be obtained as follows:
e ¼ jejcos /r xj ¼ jejsin /r
where jej ¼ r0u0
: ð31Þ
At high strains (the actual limit strongly depends on eachsystem!), the viscoelastic response becomes non-linear, and thesinusoidal model in Eq. (30) cannot be a good description of thestress response. Thus, the usual methods of Fourier-transformrheology have to be used when the oscillation of the barriersdrives the system beyond the linear regime [18]. For a givenstrain, the non-linear stress can be expanded as:
rðtÞ ¼ r0eixt þ r1e
2ixt þ r2e3ixt þ N ð32Þ
where σ1, σ2, σ3, … are the amplitudes of the harmonics. For 3-D systems, obeying time reversibility σ(− t)=σ(t), only oddharmonics might be present in Eq. (32), in agreement withexperiments using 3-D polymer systems. However, evenharmonics have been observed for systems in which the time-symmetry of the stress tensor components is broken, e.g.polymer liquid crystals or agarose gels [19]. In order to analyzethe behavior of the monolayers beyond the linear regime, theexperimental Π–Π0 curves have to be Fourier analyzed, andthe corresponding spectrum is obtained [20]. It is worth tonotice that a reasonable noise/signal ratio in the FT spectrumcan be achieved only if the time resolution is maximized and ifthe experimental data contain a large number of periods(typically at least 50 periods).
5. Langmuir polymer films (LPFs)
5.1. Equilibrium features
In general, Langmuir polymer films are considered as two-dimensional objects since their thickness do not exceed theFlory radius, RF, of the structural unit, the polymer chain, whichis proportional to the polymerization degree N, i.e. the averagenumber of monomers of the polymer chains. The radius of agiven chain follows a well defined scaling law RF∼b NN
(Flory's law), which stresses the proportionality between thesize of the chain, RF, and that of the monomer, b (typically∼0.1 nm for flexible chains). This proportionality is influencedby the strength of interactions with the surrounding mediumthrough the Flory scaling exponent ν. So, ν=1/2 at poor-

Fig. 12. Viscoelastic parameters obtained from SQELS experiments in PVAcfilms at 25 °C. Symbols are experimental results and lines the best fits to aMaxwell model.
Fig. 11. Upper figure: Isotherms of poly-(ter-butyl acrylate) films at 25 °C onwater. The molecular weight ranges from 102 to 106 Da. Bottom figure: samedata plotted in reduced (rescaled) variables. The slope of the straight linecorresponds to good-solvent conditions (ν=0.75).
183F. Monroy et al. / Advances in Colloid and Interface Science 134–135 (2007) 175–189
solvent conditions, ν=0.58 in the melt or the Θ-state, ν=3/4for chains conformed in 2D at good-solvent-like conditions and,ν=1 for rigid rods, i.e. the maximum contour length of a rigidchain in the highest extension limit is RF=L=b N.
The nature of the solvent does not show up in the case ofpolymer films adsorbed at interfaces. In adsorbed two-dimen-sional films, the polymer chains lye at the interface between twobulk media consequently losing one degree of freedom withrespect to the 3D conformation. Thus, there exists an entropicpenalty on adsorption, the driving-force for spontaneousadsorption being the decrease in interfacial tension. One cantherefore conceive an adsorbed polymer chain as the result of theinterplay between different forces: monomer–monomer, chain–chain and the adsorption forces, including all the interactions ofthe polymer with the interface. In this case, the interface itselfplays the role of the solvent in bulk solutions, and it is in this sensethat one must define the thermodynamic quality of the solvent.This concept, usual in bulk, refers to the strength of the adsorptioninteraction in the case of interfacial films. Then, good-solventconditions refer to net cohesive adsorption interactions betweenthe polymer and the interface. In the opposite case, weakadsorption, as compared with the monomer-to-monomer interac-tion leads to adsorbed polymers at poor-solvent conditions. Chainconformation at adsorbed films is then governed by the strengthand directionality of the adsorption forces compared with theintra- and inter-chain interactions. From a structural point of viewgood-solvent conditions are equivalent to high excluded-volumeconformations like the extended coil or the flexible worm-likeconformations. The poorer is the adsorption interaction thesmaller becomes the excluded volume, yielding compressed coilconformations in order to minimize contacts with the interface,
and to increase those between monomers inside the chain. All ofthese structural features strongly influence the concentrationdependence of the surface pressure isotherm, Π–Γ.
In the dilute regime (Πb1 mN/m), Π slightly increases withthe surface concentration of the polymer in the film, Γ, closelyfollows the ideal gas law at high dilution, Π∼kBT Γ. As Γ isincreased in this regime, chain interactions emerge imposingdeviations from the ideal behavior well quantified as virialcontributions to the surface pressure:
PkBTC
¼ 1þ B2ðTÞCþ N ð33Þ
If Γ is further increased, the adsorbed chains are no longerisolated becoming into mutual contact at Γ=Γ⁎, the overlap-ping concentration. At this particular concentration, thepolymer concentration in the film becomes similar to themonomer concentration within a single chain, i.e. Γ⁎ and RF
are mutually related by:
C⁎ ¼ N
pR2F
: ð34Þ
Then, one can easily obtain the chain size RF from the Π–Γisotherms, which have been experimentally found to closelyobey the Flory law, RF∼ l Nν when the chain size is increased.For illustration, Fig. 9 shows 2D-sizes measured in Langmuir

Fig. 14. Dilational viscosity of PVAc films at Γ∼Γ⁎⁎ as a function offrequency. Three relaxation regimes are visible through the 10-decade windowprobed.
184 F. Monroy et al. / Advances in Colloid and Interface Science 134–135 (2007) 175–189
films of different samples of poly-(ter-butyl acrylate) (PtBAc)with N ranging 102–104. A length of the statistical segmentl∼0.5 nm, similar to the bulk value, can be obtained from theordinate at N=1; additionally, a value of ν∼0.75, compatiblewith good-solvent conditions, arises from the slope of the log–log plot when N is higher than a critical value, NNNC∼100.Beyond this a limit the Gaussian-statistics does not describewell the polymer conformation (Mwb10 kDa).
At Γ=Γ⁎, we enter the semidilute regime and Π stronglyincreases with the surface concentration. Here, it is customary tofit the Π–Γ isotherms to a N-independent power law with theFlory exponent ν such as:
PfN0Cy where yf2m=ð2m� 1Þ: ð35Þ
Then, if ν=3/4 (good-solvent conditions, y=3), the surfacepressure increases as Π∼Γ 3. Stepper dependencies areobserved as the solvent quality becomes poorer, e.g. at the Θ-state, ν=0.58 (y=7) and the surface pressure increases asΠ∼Γ7. So, in the hypothetic limit ν=1/2, a hard-sphere-likedivergence is expected. At a surface concentration exceeding acritical value Γ⁎⁎ we reach the concentrated regime; the surfacesolvent is almost excluded and the film becomes purelypolymeric. At ΓNΓ⁎⁎ the surface pressure reaches a plateauvalue corresponding to the saturation of the film.
Fig. 10 summarizes the differences on the Π–Γ isothermsarising from the change in the solvent quality of the interface.Good-solvent conditions (ν=0.75, y=3) mean that the adsorp-tion energy of each monomer is high enough to overcome themonomer-to-monomer interaction responsible of the coiledconformation typical of bulk solutions; as a consequence thechains flatten, maximizing the number of contacts with the
Fig. 13. Γ-scaling of the terminal relaxation time τ and of the dilational viscosityκ, as obtained from step-compression experiments performed on PVAc films at25 °C. Lines correspond to the power-laws predicted by reptation theory.
interface and getting an extended (eventually wormlike)conformation. On the other hand, the lower this adsorptionenergy is the poorer the solvent quality, thus favoring quasi-2Dpancake-like conformations (de Gennes' pancake) over 2D-extended contours. The hard-sphere-like limit behavior (y→∞)is raised at Θ-solvent conditions (ν=0.5), i.e. when theadsorption energy is overcome by intrachain interactions.
The adequacy of the power-law description of the semidilutebranch of the Π–Γ isotherms might underlie the existence of are-scalable characteristic distance, ξ inversely decreasing withthe increase in polymer concentration, ξ∼Γ−ν/(2ν−1). Accord-ingly, the scaling law of the surface pressure in the semidiluteregime can be written as:
PP⁎ ¼ n
n⁎
� �m
: ð36Þ
Since any local property, such as the osmotic pressure, mustbe N-independent and ξ⁎∼RF∼Nν, Π⁎∼kBT/RF
d∼N−dν, thenm+d=0. For Langmuir polymer films,m=−d=−2. The scalinglaw in Eq. (35) is then recovered, Π∼kBT/ξ
2∼N0 Γ2ν /(2ν − 1).Fig. 11 shows experimental isotherms obtained for the abovementioned films of PtBAc. Among them, those correspondingto long enough polymers (NNNC) cluster together whenrescaled by the coordinates of the overlapping point, i.e. Π/Π⁎=(Γ/Γ⁎)2ν/(2ν−1).
Although the Π–Γ isotherms have been usually interpretedin terms of these scaling-like power laws [21,22] it must bestressed that the data in Fig. 11 constitute the first strong pieceof evidence about the adequacy of the scaling description ofpolymer films at good-solvent conditions in terms of anelemental distance ξ [23].
5.2. Dynamics of semidilute (entangled) Langmuir polymerfilms: scaling, local dynamics and reptation motion
Water-insoluble, but slightly hydrophilic, linear polymers,such as poly-vinylacetate (PVAc) and alkyl polyacrylates, havepolar groups allowing for adsorption at the air/water interface(A/W). In these films most monomers of a given chain remainadsorbed at the A/W interface, as deduced from the analysis of

Fig. 16. Experimental stress–strain curves of Langmuir PVAc films at differentΓ 's within the concentrated regime (Γ≫Γ⁎⁎): (–▪–) 1.40 mg/m2; (–•–)2.1 mg/m2; and (–▴–) 3.0 mg/m2. Vertical arrows mark the non-linear strainthreshold, uC, after which a pseudo-plastic plateau is entered (uC becomessmaller as Γ increases). The small-strain linear regime (u0→0) is zoomed in theinset figure. Straight lines represent Hookean linear fits performed in thisregime, σ=εHookeu.
Fig. 15. Top figure: oscillatory barrier experiment on PVAc films at 25 °C whena 20%-strain is imposed. Notice that the system response is not sinusoidal.Bottom figure: phase and amplitude of the FT-spectrum of the sinusoidal resultsshown at the top figure.
185F. Monroy et al. / Advances in Colloid and Interface Science 134–135 (2007) 175–189
the Π-A isotherms in the dilute regime. When the chains enterthe semidilute regime at Γ⁎, each one can be seen as a chain of“pancake-shaped” blobs, as first proposed by de Gennes [24]. Insuch cases the Flory exponent, obtained from the shape of thesemidilute branch of the Π–Γ isotherm [Eq. (35)], is found tobe close to the good-solvent value (ν∼3/4), as expected forcohesive adsorption forces between the polymer and the A/Winterface. Thus semidilute and concentrated state can be thoughtas a 2D gel made of entangled chains, as corroborated fromellipsometry and X-ray reflectivity experiments (see Ref. [21]and references therein). The physical properties of this 2D-gelcan be then accurately described by the characteristic distanceξ∼Γ −ν/(2ν−1), the distance between entanglement points. Infact, the equilibrium properties (Π∼ε0∼ kBT/ξ
2) and therheological parameters (ε, κ) of a variety of Langmuir polymersfilms at good-solvent conditions have been described in termsof ξ-based power-laws [21,22].
From the analysis of the high-frequency rheological dataobtained from capillary waves experiments, internal orsegmental relaxation times can be probed. Fig. 12 shows, as arepresentative example, the Maxwell-like viscoelastic relaxa-tion observed in PVAc films at SQELS-frequencies [25], whichis characterized by a rather large strength Δε/ε0∼0.5 and arelaxation time τ0 in the microsecond window.
A high value of the activation energy EA∼30kBT, pointingout the collective character of the probed motion, has beencalculated from the Arrhenius-like T-dependence of therelaxation times [25]. Local motions in the sub-millisecondwindow are typically found in these experiments. The spatialscale involved here ξ0∼ (Dτ0)
1/2≤1 nm, corresponds to highlycorrelated segmental motions. Perhaps, the particular evolutionobserved here arises from the internal motions of the blobscomprised between entanglement points, but this point remainsyet a matter of debate. In fact, since diffusion within a givenblob with n monomers and size, Rblob∼ξ∼nν is governed by aRouse-like diffusion coefficient DR∼D0/n∼D0 ξ−1/ν, theinternal relaxation time might scale as:
s0cn2
DR
f 1D0
n2þ1=m; ð37Þ
i.e., τ0∼ξ3.3∼Γ −5∼Π −1.6 at good-solvent conditions, whilestronger dependencies are expected at poor-solvent conditions(ν=0.52); τ0∼ ξ4∼Γ − 13.5∼Π −1.9. In fact, Π-decreasingrelaxation times are always found from the rheologicalinformation achieved on surface waves experiments (SQELS),as experimentally observed [25–27].
On the other hand, mechanical relaxation experiments offeran invaluable probe of meso-macroscopic dynamics. Largespatial-scale collective motions, eventually involving the trans-fer of the whole chain along the tube of the reptation model,ξtube∼ (Dτ)
1/2≥1 μm, can be detected from the long-timeterminal dynamics probed on these experiments, τN100 s [23].
Fig. 13 shows the representative example of Langmuir filmsof PVAc, for which the terminal relaxation times have beenobtained from stress relaxation experiments performed atincreasing surface concentrations in the semidilute andconcentrated regimes [28]. These experiments reveal strong

Fig. 18. Relaxation curves of poly-(4-hydroxy-styrene) films at constantpressure (Π∼Π⁎⁎) and as a function of temperature. β is the stretchingparameter describing the deviations from the Debye behavior. Lines are the bestfits to a stretched exponential function.
Fig. 17. Surface coverage ϕ dependence of the relaxation times of poly-(4-hydroxy-styrene) films at 25 °C (ϕ is the fractional covered area considering thateach chain occupies πRg
2 at Γ⁎). Data were obtained at the millisecond rangewith the ECW technique. ϕC is the critical concentration of the percolationtransition at the random close-packing of polydisperse circles. Data at ϕN1 areavailable because the monolayer can be further compressed, upon deformationof the circular cross section of the pancakes followed by z-growing.
186 F. Monroy et al. / Advances in Colloid and Interface Science 134–135 (2007) 175–189
dependencies of the relaxation times on the chain size andpolymer concentration, τrep∼N3 Γ3, as predicted by thereptation theory formulated by de Gennes [24,29]. Also, theNewtonian limit of the dilational viscosity is found to followstrong reptation-like Γ-dependencies, κ0∼Γ 6. All thesedynamical features together with the experimental verificationof the validity of the scaling description of both, equilibriumand dynamical properties, in terms of the entanglement distanceξ, allow us to support the suitability of the de Gennes' picture ofpolymer gels for describing 2D polymer solutions, as Langmuirpolymer films at good solvent conditions.
We have also pointed out that 2D polymer dynamics can bescanned over a broad frequency window by combining togetherviscoelastic information arising from SQELS, ECW andmechanical relaxation experiments. Fig. 14 shows the ω-dependence of the dilational viscosity of PVAc films as arepresentative example of broadband mechanical rheology ofLangmuir polymer films.
5.3. Non-linear elasticity
As explained above, oscillatory barrier experiments allow usto get insight on the material response functions of Langmuirpolymer films in linear and non-linear regimes. Fig. 15 shows atime plot of the pressure response in a typical sinusoidalexperiment for a Langmuir film of PVAc at 25 °C and atΓ∼Γ⁎⁎ (Π⁎⁎∼15 mN/m). This experiment was performed onthe non-linear regime at a strain amplitude ca. 30% and at afrequency ω=5.4 mHz. By considering the fundamental modeand the two first odd harmonics (ω0, 3ω0 and 5ω0) the non-linear response function in Eq. (32) is able to accurately fit thedata within the experimental uncertainty (the fitting curves arehidden by the experimental points). As expected, the FT-spectrum (see Fig. 15b) also shows three components at welldefined frequencies, ω0=0.032±0.005 Hz matching theexperimentally imposed one (ω0=0.034 Hz), and the next oddharmonics, 3ω0 and 5ω0.
Normally, non-linear elasticity emerges at high strains fordense states of Langmuir films. Fig. 16 shows the σ0–u0 curvesobtained at different polymer concentrations in the concentratedregime of PVAc films. Notice that, as Γ is increased a pseudo-plastic plateau begins to develop at smaller strains. This plastic-like feature is characterized by a decrease from the un-dependenceof the response, from the Hooke-like n=1 behavior, characteristicof the linear regime (uCNu→0), to a weaker nb1 dependence atuNuC. Here, the film becomes softer than at lower strains, i.e. theeffective elasticity modulus, obtained from the slope of the σ–ucurves, decreases as the film is strained.
The strength of the plastic-plateau is characterized by a yieldstress extrapolated at zero strain, σY. Data in Fig. 16 show thatthe two parameters, position uC and strength σY of the plasticplateau, become smaller as the polymer concentration increases,i.e., plasticity is directly related to the polymer density.
5.4. Glassy polymers: non-Debye relaxations
For a long time the fluid-to-solid transition in two-dimensional systems has been speculated to be stronglyfrustrated by the dominance of large-scale fluctuations, mainlywhen the supporting media is liquid, as in the case of Langmuirfilms. However, 2D-freezing, leading to crystalline solids, hasbeen observed in Langmuir films of small non-polymericsurfactants [30] and of colloidal particles [31]. The KTHNYtheory has yielded in these cases a good theoretical support [32].Concerning amorphous matter there is no good argumentagainst the existence of 2D-glassy solids at temperatures low

Fig. 20. a) Dispersion relation for interfacial or surface waves. Units: Abcissa-cm; ordinate -cm/s. □ Capillary waves, (▪) gravity waves and (♦) capillary-gravity waves with values corresponding to deep layers of liquid toluene in theabsence of Ma-stress. ⋄ Internal gravity waves in a toluene layer with densitydifference Δρ=0.04 g/cm in the absence of Ma-stress. ⑩ as in the precedingcase, but Δρ=0.016 g/cm in the absence of Ma-stress. Δ Mass transfer-drivenripples marked by double lines. • heat transfer-driven waves (in Fig. 20b alsomarked by double lines). ▣ undamped internal gravity waves excited by surfacewaves simultaneously occurring. damped ripples triggered by surface waves.
as in the preceding case, but generated by mechanical vibration of thecontainer (with and without Ma-stress). b) Enlarged view of the bottom part ofFig. 20a shows internal gravity waves, Ma-driven waves marked by double lines(signatures of surface waves and internal gravity waves) and longitudinal ordilational, dispersion-free surface waves with (☉) and ( ). Further we show theabove undamped internal gravity waves (▣) and damped internal gravity waves(▪) and (★) connected with surface waves.
Fig. 19. Top figure: T-dependence of the stretching parameter β of P4HS films atΓ⁎. Bottom figure: Arrhenius plot of the stress-relaxation time.
187F. Monroy et al. / Advances in Colloid and Interface Science 134–135 (2007) 175–189
enough. In fact, numerous glassy-like features have beenreported in the literature: emerging shear-elasticity [33], non-trivial divergence of the surface viscosity [34] and formation ofmonolayer structures and textures compatible with frozenamorphous states [35]. The most significant features commonto glassy systems concern their dynamical-mechanical proper-ties. As earlier discussed, they can be easily obtained fromexperiments on the mechanical response after a smalldisturbance is applied: i) non-Debye linear response functionsand, ii) non-Arrhenius T-dependence of the relaxation times. Inorder to test for glassy-like dynamics in 2D experimental studies(mechanical-stress relaxation [36], surface waves [37] and shearviscosity [38]) have been performed on Langmuir films of anamorphous glass-forming polymer: poly-(4-hydroxy-styrene)(P4HS). Former studies have clearly pointed out the poor-solvent character of the air/water interface as adsorbent for thispolymer (ν∼0.57) [13,26]. It means that intra-chain monomer-to-monomer interactions are more favorable than monomer-interface adsorption, thus, only a few monomers in a chain areresponsible for adsorption at the air/water interface, soremaining in a flatten coiled configuration, the de Gennes'pancake. From a dynamic point of view two differentconformations are available depending on temperature: at lowenough T (below Tg) every chain might be internally frozen,gaining more and more conformational freedom as T increases,eventually reaching the melt state at high-T, well above the glasstransition. As a consequence, if chains were polydisperse, as itis the case of P4HS, a percolation transition from a fluid (sol-like) state to a solid (gel-like) state might be observed attemperatures low enough and polymer concentration above awell defined threshold, ΓC. This is the behavior experimentally
observed in Langmuir films of P4HS at 20 °C for both,equilibrium (Π, ε0) and dynamical properties (ε, ωκ), measuredin the kHz range by the ECW device [37]. Fig. 17 clearly pointsout the dynamic signature of the presence of this percolation-like fluid-to-solid transition. The divergence of the mechanicalrelaxation times is observed at millisecond range, where thecollective diffusive translation of nm-sized pancakes is found torelax (from the Stokes–Einstein relationship, DT=kBT/6πηRg,the fundamental relaxation time of a bare sphere is τ0∼Rg
2/DT∼0.1 ms) [37].
Depending on chain density and temperature, significantdeviations from the single exponential behavior typical of fluid

188 F. Monroy et al. / Advances in Colloid and Interface Science 134–135 (2007) 175–189
films have been found in the glass-forming polymer. Fig. 18clearly shows that at low T the relaxation function deviates fromthe Debye-like shape (∼e−t/τ) to a stretched-exponentialbehavior (∼exp[− (t/τ)β], βb1) as the system crosses from theun-connected sol-like phase (fluid-like, ΓbΓC) to the percolatedsolid-like one (ΓNΓC). This is a clear signature of the crossoverbetween an homogenous dynamics typical of a 2D-colloidalfluid made of isolated elements (ΓbΓC) and an highlyheterogeneous collective relaxation of a disordered solid-likearrangement (percolated, ΓNΓC) of rigid elements. Thisanomalous behavior of glassy matter can be easily understoodassuming a dynamical arrest of the disordered structure, whichrelaxes mechanical stresses through of “bottleneck” mechan-isms involving the scarce free space available in the structure.
As a consequence, the temperature dependence of therelaxation times might strongly depart from the Arrheniusdependence, typical of fluids. Fig. 19 shows for the consideredsystem the terminal relaxation times of the high-T fluid phasefollows a single Arrhenius plot characterized by a relatively lowactivation energy typical of viscous fluid (∼3kBT ). However, astrong non-Arrhenius deviation, characterized by a much higheractivation energy (N20kBT ), is observed at ca. 30 °C, where thesystem undergoes the fluid-to-solid transition and the relaxationdynamics becomes highly cooperative (β≪1).
A general conclusion of our studies in Langmuir films ofglassy polymers is that, as observed for free-standing (or weaklyadsorbed) micron-sized thin polymer films [2], laminarconfinement induced by a spatial reduced dimensionalitypromotes surface-induced molecular mobility yielding finitereductions in the glass transition temperature of the filmmaterial [Tg(2D)∼30 °C] with respect to the bulky one [Tg(2D)∼125 °C]. Thus, Langmuir polymer films have beenpresented for the first time as a paradigmatic example of 2Dvitrification [37–39].
Acknowledgments
This research has been supported by the Spanish Ministeriode Educación y Ciencia (Grants BQU2003-1556, MAT2003-1517, VEM2003-20574-C03-03, FIS2006-01305 and FIS2006-12281-C02-01) and by the Comunidad de Madrid (Grants 07N/0028/2002, INTERFASES S05-MAT-227 and NANOBIO-MS05-MAT-283).
Appendix A. From (equilibrium) spontaneous fluctuationsto (non-equilibrium) driven-fluctuations
In the main text a survey has been presented of methodol-ogies useful to probe both equilibrium spontaneous interfacialor free surface fluctuations and mechanically or electrically-driven yet equilibrium-like fluctuations. Those fluctuations tendto appear as waves. As earlier noted, the transverse waves areconsequence of the overshooting effect of the local Laplaceoverpressure, particularly with low (dynamic or shear) viscosityliquids. The other type of interfacial fluctuations mentioned is inthe form of longitudinal or dilational waves, easily visualizedwhen a liquid surface is covered by a insoluble surfactant
monolayer. Noteworthy is that at variance with transversewaves the longitudinal waves tend to be dispersionless[7,8,40,41]. As earlier noted, in the presence of both surfacetension and gravity, transverse waves span the spectrum fromrather short wavelengths (ripples) to longer ones (gravitywaves). Note that if following adsorption at the interface there isalso absorption of a rather light surfactant hence developing aconcentration gradient across the bulk of a liquid layer thenanother wave disturbance that may occur is an internal wave.Internal waves originate in the overshooting due to the restoringgravity force in a stably stratified liquid layer and hence arerelated to the buoyancy in the fluid. Internal waves tend also toshow up ripple signatures at the open surface. As it has alsobeen mentioned in the main text interfacial fluctuations andinterfacial behavior at large are significantly altered by thepresence of surfactants and, indeed, by surfactant concentrationgradients. It has been mentioned that the latter may induce flowor alter an existing one including flow associated to waves. Letus add a few comments about the role of such Marangonistresses (or Marangoni effect) on ripples and longitudinal ordilational waves.
Fig. 20 illustrates how non-equilibrium-driven fluctuationsappear in a dispersion relation kind of plot [41]. For comparisonwith the behavior of the earlier discussed (equilibrium)spontaneous fluctuations or even with that of mechanicallydriven waves we provide a comprehensive plot in Fig. 20a. Anenlarged view of the wave behavior induced by surfactantconcentration gradients is provided in Fig. 20b (surface Ma-waves). It is to be noted that strictly speaking the functionalrelationship between velocity and wavelength or frequency andwavelength in the case of surface Ma-waves is not a truedispersion relation. Generally, the latter concept refers to linearwaves, those discussed in the main text. In the Ma-driven casewe are clearly outside equilibrium (and, consequently, noiselevel and temperature play little if any significant role) and thewaves are nonlinear (velocity depends on amplitude andvelocity or amplitude depend on the level of the drive, theMarangoni stress due to the surfactant concentration gradient).Noticeable relatively to the bare interface or, better, to theunstressed surface, there is a lowering of velocity values for agiven wavelength due to the Marangoni effect. Typicalvelocities for liquids like toluene with a free surface open toair perturbed by a surface concentration gradient of, e.g.,pentane are in the range of a centimeter per second, an order ofmagnitude below the standard values. A systematic explorationof the kind earlier discussed for equilibrium fluctuations for thecase of Ma-induced waves, ripples, longitudinal or internal, isstill pending. As for the equilibrium case, from the explorationof the dynamics of such disturbances much can be inferredabout interfacial processes and interfacial behavior. Suchinformation could be used to complement our understandingof dynamical processes at interfaces probing equilibriumdisturbances as discussed in the main text. Indeed, changesdue to the Marangoni stress, including its influence on surfacewaves and accompanying flows, lead to changes on theadsorption and molecular organization features like in thecase of polymers at interfaces.

189F. Monroy et al. / Advances in Colloid and Interface Science 134–135 (2007) 175–189
References
[1] Fleer GJ, Cohen Stuart MA, Scheutjens JMHM, Cosgrove T, Vincent B.Polymers at interfaces. Cambridge: Chapman-Hall; 1993.
[2] Forrest JA, Jones RAL. The glass transition and relaxation dynamics inthin polymer films. In: Karim A, Kumar S, editors. Thin polymer surfacesand thin films. Singapore: World Scientific publishing; 2000.
[3] Sikharulidze I, Farago B, Dolbnya IP, Madsen A, de Jeu WH. Phys RevLett 2003;91:65504.
[4] Kim H, Rúhm A, Lurio LB, Basu JK, Lal J, Lumma D, et al. Phys Rev Lett2003;90:068302.
[5] Ferry JD. Viscoelastic properties of polymers. New York: Wiley; 1980.[6] Hilles H, Ph.D. thesis, Madrid (2006).[7] Nepomnyashchy AA, Velarde MG, Colinet P. Interfacial phenomena and
convection. London: Chapman & Hall/CRC; 2002.[8] Birikh RV, Briskman VA, Velarde MG, Legros JC. Liquid interfacial
systems. Oscillations and instability. N.Y.: Marcel Dekker Inc.; 2003.[9] Maru HC, Wasan DT. Chem Eng Sci 1979;34:1295.[10] Barentin C, Ybert C, diMeglio JM, Joanny JF. J FluidMech 1999;397: 331.[11] van den Tempel M, Lucassen-Reynders E. Adv Colloid Interface Sci
1983;18:281.[12] Langevin D, editor. Light scattering by liquid surfaces and complementary
techniques. Surfactant Sci. Series. New York: Marcel Dekker; 1989.[13] Monroy F, Rivillon S, Ortega F, Rubio RG. J Chem Phys 2001;115:530.[14] Petkov JT, Gurkov TD, Campbell BE, Borwankar P. Langmuir
2000;16:3703.[15] Cicuta P, Terentjev EM. Eur Phys J E Soft Matter 2000.[16] Earnshaw JC. Adv Colloid Interface Sci 1996;68:1.[17] Noskov BA, Loglio G. Colloids Surf A Physicochem Eng Asp 1998;143:
167.[18] Wilhelm M. Macromol Mater Eng 2002;287:83.[19] Sagis LMC, Ramaekers M, van der Linde E. Phys Rev E Stat Phys Plasmas
Fluids Relat Interdiscip Topics 2001;63:051504-1.
[20] Hilles H, Monroy F, Bonales LJ, Ortega F, Rubio RG. Adv ColloidInterface Sci 2006;122:67.
[21] Kawagucchi M. Prog Polym Sci 1993;18:341.[22] Vilanove R, Rondelez F. Phys Rev Lett 1980;45:1502.[23] Hilles H, et al. (in preparation).[24] de Gennes PG. Scaling concepts in polymer physics. Itaca, New York:
Cornell Univ. Press; 1979.[25] Monroy F, Ortega F, Rubio RG. Phys Rev E Stat Phys Plasmas Fluids
Relat Interdiscip Topics 1998;58:7629.[26] Monroy F, Ortega F, Rubio RG. J Phys Chem B 1999;103:2061.[27] Monroy F, Rivillon S, Ortega F, Rubio RG. J Chem Phys 2001;115:230.[28] Monroy F, Hilles H, Ortega F, Rubio RG. Phys Rev Lett 2003;91:268302.[29] de Gennes PG. Phys Today 1983;36:33.[30] Sharpe D, Earnshaw JC, Haig K, Li Y. Phys Rev B 1997;55:6260.[31] Denkov ND, Velev OD, Kralchevski PA, Ivanov IB. Nature 1993;361:26.[32] Strandburg KJ. Rev Mod Phys 1998;60:161.[33] Barentin C, Muller P, Ybert C, Joanny J-F, di Meglio J-M. Eur Phys J E
Soft Matter 2000;2:153.[34] Monroy F, Ortega F, Rubio RG. Eur Phys J B Cond Matter Phys
2000;13:745.[35] Zhu J, Eisenberg A, Lennox RB. J Am Chem Soc 1991;113:5583.[36] Hilles H, Ortega F, Rubio RG, Monroy F. Phys Rev Lett 2004;92:255503.[37] Monroy F, Ortega F, Rubio RG, Ritacco H, Langevin D. Phys Rev Lett
2005;95:056103.[38] Hilles H, Ortega F, Rubio RG, Monroy F. Phys Rev Lett (submitted for
publication).[39] Hilles H, Ortega F, Monroy F, Maestro A, Rubio RG, Velarde MG. J Chem
Phys 2007;126:124904.[40] Velarde MG. Bénard layers, overstability and waves. Dynamics of spatio-
temporal cellular structures-henri bénard centenary review. Springer tractsin modern physics. New York: Springer; 2006. p. 129–45.
[41] Linde H, Velarde MG, WaldhelmW, Loeschcke K, Wierschem A. Ind EngChem Res 2005;44:1396 [and references therein].