Polylactic acid fibre-reinforced polycaprolactone scaffolds for bone tissue engineering
Upload
independentCategory
view
1download
0
Surface Modification by Plasma Treatment
Nanofibers
Surface Modification of Electrospun PolycaprolactoneNanofiber Meshes by Plasma Treatment to EnhanceBiological PerformanceAlbino Martins, Elisabete D. Pinho, Susana Faria, Iva Pashkuleva, AlexandraP. Marques, Rui L. Reis, and Nuno M. Neves*
Keywords:� biodegradable materials
� biological activity
� nanofibers
� surface analysis
� wetting
A critical aspect in the development of biomaterials is the optimization of
their surface properties to achieve an adequate cell response. In the present
work, electrospun polycaprolactone nanofiber meshes (NFMs) are treated
by radio-frequency (RF) plasma using different gases (Ar or O2), power (20
or 30W), and exposure time (5 or 10min). Morphological and roughness
analysis show topographical changes on the plasma-treated NFMs. X-ray
photoelectron spectroscopy (XPS) results indicate an increment of the
oxygen-containing groups, mainly –OH and –C––O, at the plasma-treated
surfaces. Accordingly, the glycerol contact angle results demonstrate a
decrease in the hydrophobicity of plasma-treated meshes, particularly in the
O2-treated ones. Three model cell lines (fibroblasts, chondrocytes, and
osteoblasts) are used to study the effect of plasma treatments over the
morphology, cell adhesion, and proliferation. A plasma treatment with O2
and one with Ar are found to be the most successful for all the studied cell
types. The influence of hydrophilicity and roughness of those NFMs on their
biological performance is discussed. Despite the often claimed morpho-
logical similarity of NFMs to natural extracellular matrixes, their surface
properties contribute substantially to the cellular performance and therefore
those should be optimized.
1. Introduction
Biomaterials can be used to tailor the biophysical and
biochemical milieus that direct cellular behavior and function
into the desired regeneration of tissues.[1] Thus, they may play
[�] Prof. N. M. Neves, A. Martins, E. D. Pinho, Dr. I. Pashkuleva
Dr. A. P. Marques, Prof. R. L. Reis
3B’s Research Group – Biomaterials, Biodegradables and
Biomimetics
Department of Polymer Engineering, University of Minho
Headquarters of the European Institute of Excellence on Tissue
Engineering and Regenerative Medicine
AvePark, Zona Industrial da Gandra, S. Claudio do Barco,
4806-909 Caldas das Taipas, Guimaraes (Portugal)
E-mail: [email protected]; [email protected]
DOI: 10.1002/smll.200801648
small 2009, 5, No. 10, 1195–1206 � 2009 Wiley-VCH Verlag Gmb
a significant role in the modern strategies of regenerative
medicine and tissue engineering. A number of naturally
derived polymers, such as collagen, gelatine, albumin,
chitosan, and starch, have already been shown to have
properties relevant to many biomedical applications.[2]
Prof. N. M. Neves, A. Martins, E. D. Pinho, Dr. I. Pashkuleva
Dr. A. P. Marques, Prof. R. L. Reis
IBB – Institute for Biotechnology and Bioengineering
PT Government Associated Laboratory, Braga (Portugal)
Dr. S. Faria
Research Centre Officina Mathematica, Department of Mathemat-
ics for Science and Technology, University of Minho
Campus de Azurem, 4800-058 Guimaraes (Portugal)
H & Co. KGaA, Weinheim 1195

full papers N. M. Neves et al.
1196
However, biodegradable polymers belonging to the aliphatic
polyester family currently represent the most attractive group
of polymers that meet various medical and physical demands
for safe clinical applications.[3] This is mainly due to their
biocompatibility, acceptable degradation rates, and versatility
regarding physical and chemical properties.[4] Undoubtedly,
three of themost significantmembers of the aliphatic polyester
family are polyglycolide (PGA), polylactide (PLA), and
poly(e-caprolactone) (PCL). Among them, PCL is the most
hydrophobic and degrades by hydrolysis of its ester bonds
under physiological conditions at a much slower rate than
PGA and PLA.[5] It has been shown that PCL is biocompatible
for some applications[4,6] and it has exceptional ability to form
compatible blends and copolymers with a wide range of other
polymers, resulting in materials with unique ranges of
properties.[5,7]
Much attention has also been devoted to the electrospin-
ning technique as an innovative processing method for
biodegradable polymers.[8–10] It is a versatile technique
allowing for the production of polymeric ultrafine fibers with
diameters ranging from a few micrometers down to tens of
nanometers.[10,11] Besides the dimensional reduction to the
nanolevel, the ability of this technique to shape materials with
morphologies mimicking the extracellular matrix (ECM) of
many tissues in the body is relevant to control cell affinity and
adhesion.[9,12] The cell behavior on nanostructured surface
materials has been extensively studied.[12,13] Indeed, an
enhanced cell attachment and proliferation was observed on
nanostructured surfaces in comparison to the microstructured
surfaces.[14]
An ideal biomaterial should have adequate bulk proper-
ties, while the surface should have enhanced affinity with cells.
As it is very difficult to design biomaterials combining bulk
properties and surface properties, a common approach is to
produce biomaterials with adequate bulk properties followed
by a surface modification to enhance the surface properties.
The surface modification of a biomaterial can be achieved by
various techniques, including treatments by flame, corona
discharge, plasma, photons, electron beam, ion beam, X-ray,
and g-ray.[15,16] In the present study, plasma treatment was the
selected process to modify the surfaces of electrospun PCL
nanofiber meshes (NFMs). Plasma treatment is a versatile and
effective method for modifying the surface properties or
introducing desired chemical groups at the surface of a
material without affecting its bulk properties.[15,17,18] Themost
apparent effects of plasma treatment are surface cleaning,
microetching, and surface activation (attachment of chemical
Figure 1. SEM micrographs of untreated and plasma-treated PCL NFMs. A)
www.small-journal.com � 2009 Wiley-VCH Verlag Gm
groups, modification of surface charge, increase of the surface
free energy).[18] A common application of this technique is to
improve the surface hydrophilicity by forming oxygen-
containing groups at the surface of the materials.[19–21] In
recent years, plasma surface modifications have been used
very intensively in the field of biomedical materials
research.[15,17,18] Typical examples of plasma-modified poly-
mers used for cell culture experiments are Primaria1 and
tissue culture polystyrene (TCPS). Both types of polymer
surfaces induce good cell adhesion in vitro, but are not able to
fulfill the requirements for a prosthetic implant material.[22]
The aim of the present study was to produce electrospun
PCL NFMs and modify their surfaces in order to improve the
adhesion and proliferation of cells. Untreated and plasma
modified NFMs were characterized using various surface-
sensitive techniques, namely scanning electron microscopy
(SEM), interferometric optical profilometry, contact angle
measurement, and X-ray photoelectron spectroscopy (XPS).
These techniques enable the evaluation of changes in surface
topography, hydrophilicity, and surface chemistry as a result of
the treatment. Different assays were used to characterize the
effects of the plasma treatments over fibroblast, chondrocyte,
and osteoblastic cell lines when seeded on the plasma-treated
and untreated PCL NFMs. The biological relevance of each
plasma treatment was assessed, analyzing the cell attachment,
morphology, viability, and proliferation. To the best of our
knowledge, this is the first systematic study where different
plasma treatment conditions for electrospun biodegradable
NFM modification was reported with respect to
the performance of different cell types, and aiming at the
regeneration of different tissues.
2. Results
2.1. Morphological Characterization of Plasma-TreatedElectrospun Nanofibers
The SEM photomicrographs of the untreated and plasma-
treated electrospun PCL NFMs are shown in Figure 1. The
O2-plasma treatments analyzed by SEM revealed that
the 10min treatment with 30W power induced melting of
the thinner nanofibers (Figure 1B). This effect creates more
open space between the fibers still present in the mesh. When
the exposure time or the power was reduced, fibers with
irregular morphology and nonuniform diameter and spherical
terminated ends were observed. The melting of thinner fibers
was also observed when the working atmosphere was changed
Untreated PCL NFM. B) O2 at 30 W for 10 min. C) Ar at 30 W for 10 min.
bH & Co. KGaA, Weinheim small 2009, 5, No. 10, 1195–1206

Surface Modification by Plasma Treatment
Table 1. Surface roughness parameters (mm) of some plasma-treated and untreated electrospun PCL NFMs. Ra: roughness average; Rq: RMSroughness.
Roughness
Parameters
Untreated O2 30 W,
10 min
O2 30 W,
5 min
O2 20 W,
10 min
O2 20 W,
5 min
Ar 30 W,
10 min
Ar 30 W,
5 min
Ar 20 W,
10 min
Ar 20 W,
5 min
Ra 2.01 1.40 2.26 2.65 2.51 1.86 1.97 2.05 4.72
Rq 2.49 1.95 2.81 3.30 3.31 2.41 2.51 2.63 6.55
Figure 2. Optical profilometry images of the untreated PCL NFMs (A), O2-treated at 30 W for 10 min (B), Ar-treated at 20 W for 5 min (C).
Figure 3. Glycerol contact angle values of untreated and plasma-
modified PCL NFMs as a function of time.
to Ar. The exception was the treatment at 30W power and
10min exposure in which the nanofibers appear with blunted
ends (Figure 1C).
The surface roughness parameters of the untreated and
plasma-treated electrospun NFMs are shown in Table 1. The
average surface roughness, Ra, of untreated NFMwas 2.01mm
and its surface profile obtained in interferometric optical
profilometry is presented in Figure 2A. Generally, for the
conditions involving higher power and longer exposure times,
the surface of the PCL NFM becomes smoother with an
average roughness of 1.40mm for O2-plasma (Figure 2B) and
1.86mm for Ar plasma. Conversely, the lower power and
shorter exposure time resulted in a rougher surface, with a Ra
value of 2.51mm in the O2-plasma treatment and 4.72mm in
the Ar-plasma treatment (Figure 2C).
2.2. Hydrophilicity of Plasma-Treated ElectrospunNanofibers
Contact angle measurements for the untreated and
plasma-treated electrospun PCL NFMs were performed to
determine the effect of treatments on the surface hydro-
philicity. The measurements were carried out at different time
periods: the initial time points are the most important because
they reflect the moment when the materials come into contact
with body fluids. Measurements for longer times were
intended to evaluate the equilibrium surface wettability. A
direct comparison between each couple—modified versus
untreated—PCL NFMs was performed. A Kruskal–Wallis
statistical analysis test was performed for each couple and time
period, and statistically significant differences were obtained
(p< 0.00001). Dunnett’s test for multiple comparisons was
used to determine the plasma treatments that led to
statistically significant differences when compared with
untreated NFMs.
Initially, the contact angle measurements were performed
using water. Untreated PCL NFMs demonstrated a water
contact angle of 1308 (data not shown), and this value was
small 2009, 5, No. 10, 1195–1206 � 2009 Wiley-VCH Verlag Gmb
shown to be stable during the studied time periods.
Considering the water contact angle of Ar-treated samples,
a decrease of 208 was observed (data not shown), that is, the
surfaces became less hydrophobic. Oxygen-treated NFMs
presented water contact angles below 208, which could not be
detected by the high speed camera. To overcome this
difficulty, a highly viscous polar liquid, glycerol, was used
instead of water to characterize the differences in contact
angle of the surface-modified NFMs.
As can be observed in Figure 3, O2-plasma treated NFMs
presented significantly smaller contact angles than untreated
NFMs (p< 0.01). The only exception was the treatment with
O2 at 20W for 5min. Conversely, the Ar-treated NFM at 30W
for 10min also presented significantly lower values of contact
angle (p< 0.01) when compared to untreated PCLNFMs. The
combined effect of power and exposure time on the surface
hydrophilicity should be highlighted: 30W and 10min
exposure resulted in the most hydrophilic surface, while
20W and 5min did not show any significant difference in
hydrophilicity. Additionally, the drop spreading profiles
changed for the different plasma treatments in accordance
with the results presented before. Thus, it becomes clear that
the different surface treatments have significant effects on the
hydrophilicity of the NFMs.
H & Co. KGaA, Weinheim www.small-journal.com 1197

full papers N. M. Neves et al.
Table 2. Elemental composition of some plasma-treated and untreated electrospun PCL NFMs. C: carbon; O: oxygen.
Elements Untreated O2 30 W,
10 min
O2 30 W,
5 min
O2 20 W,
10 min
O2 20 W,
5 min
Ar 30 W,
10 min
Ar 30 W,
5 min
Ar 20 W,
10 min
Ar 20 W,
5 min
C 80.5 75.3 70.7 77.0 79.0 82.2 82.6 73.1 72.2
O 19.0 23.9 27.7 22.9 19.9 16.7 16.5 23.3 22.7
C/O ratio 4.24 3.15 2.55 3.36 3.96 4.92 5.00 3.13 3.18
1198
2.3. Chemical Composition of Plasma-TreatedElectrospun Nanofibers
XPS was used to analyze the surface chemistry of
electrospun PCL NFMs before and after plasma treatment.
As expected and according to the chemical structure of PCL,
the XPS analysis of the untreated NFM indicated that the
surface was dominated by carbon (80.5%) and oxygen (19.0%)
species (Table 2). Generally, the elemental composition
analysis of the plasma-treated samples showed a decrease of
carbon content, probably due to the melting process. The
oxygen content increases because of the surface oxidation. The
exceptions were the PCLNFMs treated withAr atmosphere at
30W for 10 and 5min, where the carbon content was
enhanced. The melting process was more pronounced in the
NFMs treated with Ar at lower power, as well as with O2 at
30W for 10 and 5min. The increment of oxygen, depending
on the plasma treatment, oscillates between 19.9%, for the
O2-plasma treatment at 20W for 5min, and 27.7% for the
O2 treatment at 30W for 5min. The C/O ratio decreases in all
conditions of plasma treatment with the exceptions already
mentioned.
High-resolution peak analysis of carbon 1s (C1s) at the
surface was performed for both untreated and plasma-treated
PCL NFMs to determine the chemical functional groups
present at the surface. All studied materials exhibited three
components of the C1s core level peak, which correspond to
the aliphatic carbon bonds (–C–C– or –C–H), carbon single
bonded to oxygen (–C–OH or –C–O–), and carbonyl
functional groups (–C––O) located at approximately 285,
287, and 289 eV, respectively (Figure 4). As was expected,
Figure 4. High resolution C1s core level signals of untreated (A) and O2-treated electrospun
PCL NFMs at 30 W for 5 min (B).
considerable differences were detected in
the intensity of these peaks for the
untreated and plasma-treated electrospun
PCL NFMs (e.g., O2 treatment at 30W for
5min). Thus, the XPS analyses confirmed
that the plasma treatments lead to different
surface chemistry, which in turn affects the
wettability and, consequently, the cell
attachment.
2.4. Cellular Performance overPlasma-Treated ElectrospunNanofibers
Themorphology of the cells cultured on
untreated and plasma-treated electrospun
PCL NFMs was examined by SEM. For
comparative purposes, biological studies
were also performed in TCPS coverslips as
an optimized substrate for 2D cell culture.
www.small-journal.com � 2009 Wiley-VCH Verlag Gm
These observations were conducted in the first day after cell
culture, because the alterations of the surface induced by the
plasma treatments have a major influence at the beginning of
the cell adhesion process. SEM micrographs of the direct
contact assay with fibroblast-like cells showed a typical
spindle-shape morphology of cells cultured on Ar-treated
PCL NFMs at 30W for 5min and at 20W for 10min (Figure 5I
and J). Cells were observed to be dispersed and stretched at
the surface of the both plasma-treated and untreated mesh-
like fibrous structure. The round shape of the chondrocyte-like
cells was only kept on untreated PCLNFMs (Figure 6C). Poor
chondrocyte attachment was observed on PCL NFMs
subjected to plasma-treatment with O2 at 30W for 10min
and Ar at 30W for 10min (Figure 6D and H), which is
understandable since those cells tend to prefer hypoxic
environments. On the O2-treated NFMs at 20W for 10min,
Ar-treated at 30W for 5min and at 20W for 10min, the cells
presented a flattened morphology, covering almost all the
available surface of the meshes. SEM micrographs from the
assays with osteoblast-like cells demonstrated that the 2DPCL
solvent-cast membrane induces the maintenance of the cell
morphology (i.e., cuboid shape) (Figure 7B), as well as on the
TCPS surface (Figure 7A). The largest amount of cells was
observed on the NFMs treated with O2 at 20W for 10min, Ar
at 30W for 5min, and Ar at 20W for 10min, forming a
continuous layer of spread cells. For all the other plasma-
treated samples, the cells adhered and interacted with the
nanofibrous structure, spreading over the surface.
A metabolic activity-based (MTS) assay was used to
determine cell viability of the three cell types along the testing
periods on the different studied surfaces. For these assays, a
bH & Co. KGaA, Weinheim small 2009, 5, No. 10, 1195–1206

Surface Modification by Plasma Treatment
Figure 5. SEM micrographs of L929 cells growing onto untreated and plasma-treated PCL NFMs, after 1 day of culture. A) TCPS. B) PCL sovent-cast
membrane. C) Untreated PCL NFM. D) O2 at 30 W for 10 min. E) O2 at 30 W for 5 min; F) O2 at 20 W for 10 min; G) O2 at 20 W for 5 min; H) Ar at 30 W for
10 min; I) Ar at 30 W for 5 min; J) Ar at 20 W for 10 min; K) Ar at 20 W for 5 min.
Figure 6. SEM micrographs of ATDC5 cells growing onto untreated and plasma-treated PCL NFMs, after 1 day of culture. A) TCPS. B) PCL sovent-cast
membrane. C) Untreated PCL NFM. D) O2 at 30 W for 10 min. E) O2 at 30 W for 5 min. F) O2 at 20 W for 10 min. G) O2 at 20 W for 5 min. H) Ar at 30 W for
10 min. I) Ar at 30 W for 5 min. J) Ar at 20 W for 10 min. K) Ar at 20 W for 5 min.
standard TCPS surface was used as a control. For each cell
type and culture period, the Kruskal–Wallis test was carried
out in order to evaluate significant differences (p< 0.00001)
between the studied surfaces in terms of cell activity.
Additionally, a Dunnett’s test for multiple comparisons was
performed to determine which plasma treatment has a
significant influence on the cell behavior when compared to
standard TCPS. The results are shown in Figures 8–10.
small 2009, 5, No. 10, 1195–1206 � 2009 Wiley-VCH Verlag Gmb
In the case of the fibroblastic cell type, the statistical
analysis demonstrated that PCLNFMsmodified byO2-plasma
at 30W for 10min and at 20W for 10min are not appropriate
substrates for cell adhesion (p< 0.01) considering their values
of cell viability after 1 day of culture (Figure 8). The other
plasma treatments did not present statistically significant
differences when compared with the untreated PCL NFMs or
the TCPS. After 3 days of culture, the NFMs treated with O2 at
H & Co. KGaA, Weinheim www.small-journal.com 1199
full papers N. M. Neves et al.
Figure 7. SEM micrographs of Saos-2 cells growing onto untreated and plasma-treated PCL NFMs, after 1 day of culture. A) TCPS. B) PCL sovent-cast
membrane. C) Untreated PCL NFM. D) O2 at 30 W for 10 min. E) O2 at 30 W for 5 min. F) O2 at 20 W for 10 min. G) O2 at 20 W for 5 min. H) Ar at 30 W for
10 min. I) Ar at 30 W for 5 min. J) Ar at 20 W for 10 min. K) Ar at 20 W for 5 min.
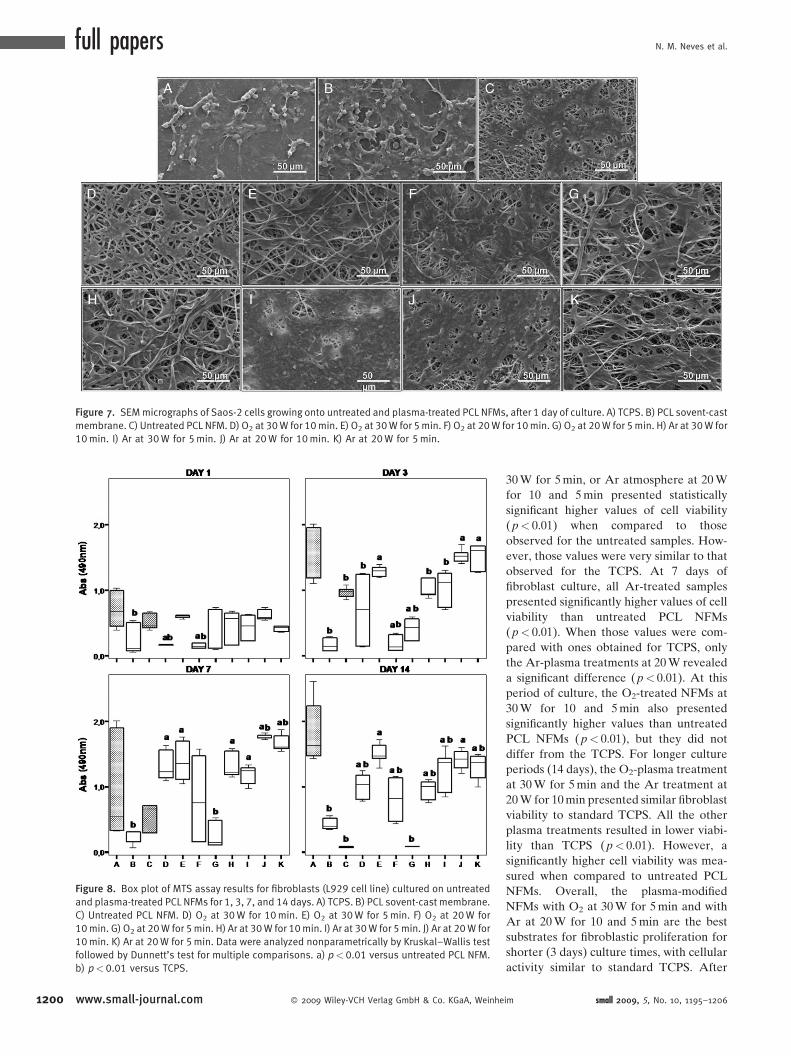
Figure 8. Box plot of MTS assay results for fibroblasts (L929 cell line) cultured on untreated
and plasma-treated PCL NFMs for 1, 3, 7, and 14 days. A) TCPS. B) PCL sovent-cast membrane.
C) Untreated PCL NFM. D) O2 at 30 W for 10 min. E) O2 at 30 W for 5 min. F) O2 at 20 W for
10 min. G) O2 at 20 W for 5 min. H) Ar at 30 W for 10 min. I) Ar at 30 W for 5 min. J) Ar at 20 W for
10 min. K) Ar at 20 W for 5 min. Data were analyzed nonparametrically by Kruskal–Wallis test
followed by Dunnett’s test for multiple comparisons. a) p< 0.01 versus untreated PCL NFM.
b) p< 0.01 versus TCPS.
1200 www.small-journal.com � 2009 Wiley-VCH Verlag GmbH & Co. KGaA, Weinhe
30W for 5min, or Ar atmosphere at 20W
for 10 and 5min presented statistically
significant higher values of cell viability
(p< 0.01) when compared to those
observed for the untreated samples. How-
ever, those values were very similar to that
observed for the TCPS. At 7 days of
fibroblast culture, all Ar-treated samples
presented significantly higher values of cell
viability than untreated PCL NFMs
(p< 0.01). When those values were com-
pared with ones obtained for TCPS, only
the Ar-plasma treatments at 20W revealed
a significant difference (p< 0.01). At this
period of culture, the O2-treated NFMs at
30W for 10 and 5min also presented
significantly higher values than untreated
PCL NFMs (p< 0.01), but they did not
differ from the TCPS. For longer culture
periods (14 days), the O2-plasma treatment
at 30W for 5min and the Ar treatment at
20W for 10min presented similar fibroblast
viability to standard TCPS. All the other
plasma treatments resulted in lower viabi-
lity than TCPS (p< 0.01). However, a
significantly higher cell viability was mea-
sured when compared to untreated PCL
NFMs. Overall, the plasma-modified
NFMs with O2 at 30W for 5min and with
Ar at 20W for 10 and 5min are the best
substrates for fibroblastic proliferation for
shorter (3 days) culture times, with cellular
activity similar to standard TCPS. After
im small 2009, 5, No. 10, 1195–1206

Surface Modification by Plasma Treatment
7 days of culture, the samples treated with O2 at 30W for
10min and with Ar at 30W for 10 and 5min are the ones that
performed better in terms of cellular proliferation.
Regarding the influence of the different plasma treatments
over chondrocytic cell (ATDC5 cell line) behavior, the
surfaces modified by O2-plasma at 30W for 5min and at
20W for 10min, as well as the Ar-treated NFMs at 20W for
10 and 5min, presented significantly higher values of cell
viability in the first day of culture (p< 0.01) when compared to
the viability of ATDC5 observed for untreated PCL NFMs
(Figure 9). However, only the treatments by O2 presented
significantly higher cellular activity than TCPS (p< 0.01). This
tendency was kept for longer culture time (3 days) with only
the exception of Ar-treated NFMs at 20W for 5min.
Moreover, the NFMs treated in Ar atmosphere at 30W for
10min also presented higher cellular viability than untreated
NFMs (p< 0.01). In comparison with TCPS, only the
O2-treated at 20W for 10min NFMs presented higher cellular
activity (p< 0.01). O2-treated NFMs for a shorter time period
(5min) showed significantly lower values of cellular activity
(p< 0.01). The Dunnett’s test performed on data obtained
after 7 days of culture revealed that the untreated PCL NFMs
as well as the ones treated withO2 at 30Wand 20W for 10min,
with Ar at 30W for 5min and at 20W for 5min show higher
Figure 9. Box plot of MTS assay results for chondrocytes (ATDC5 cell lin
untreated and plasma-treated PCL NFMs for 1, 3, 7, and 14 days. A) TCPS. B
membrane. C) Untreated PCL NFM. D) O2 at 30 W for 10 min. E) O2 at 30 W
20 W for 10 min. G) O2 at 20 W for 5 min. H) Ar at 30 W for 10 min. I) Ar at 3
at 20 W for 10 min. K) Ar at 20 W for 5 min. Data were analyzed nonparamet
Wallis test followed by Dunnett’s test for multiple comparisons. a) p<0.01
PCL NFM. b) p< 0.01 versus TCPS.
small 2009, 5, No. 10, 1195–1206 � 2009 Wiley-VCH Verlag Gmb
values of cell viability than standard polystyrene (p< 0.01),
which is a remarkable result. After 14 days of culture, only the
plasma treatment with O2 at 30W for 5min and with Ar at
20W for 5min presented higher values of cell viability than
untreated PCL NFMs (p< 0.01). The treatments with O2 also
presented higher cellular activity than TCPS (p< 0.01). Taken
as a whole, the O2-treated NFMs at 30W for 5min always
show a better performance in cell adhesion and proliferation
than untreated PCL NFMs for shorter culture periods (up to
3 days). For longer culture periods (>7 days), the Ar-treated
NFMs at 20W for 5min demonstrated the support of higher
cellular activity.
Concerning the influence of plasma-treatment over the
activity of osteoblast-like cells after 1 day of culture, the
plasma treatments with O2 at 30W for 5min and Ar at 30W
for 10min induced significantly higher cellular viability than
untreated PCL NFMs (p< 0.01), but similar to the perfor-
mance observed for TCPS (Figure 10). After 3 days of culture,
the NFMs treated with O2 at 30W for 5min and 20W for
10min, andAr at 30W for 10min and 20W for 5min presented
significantly higher values of cell viability (p< 0.01) when
compared to untreated NFMs. Those values are well in the
range of those observed for standard polystyrene. After 7 days
of culture, only theO2-treated NFMs at 30W for 5min andAr-
e) cultured on
) PCL sovent-cast
for 5 min. F) O2 at
0 W for 5 min. J) Ar
rically by Kruskal–
versus untreated
H & Co. KGaA, Weinhei
treated NFMS at 20W for 5min presented
comparable cellular activity to TCPS, as
revealed by the Dunnett’s test. Those
conditions together with the Ar-plasma
treatment at 30W for 10min also presented
significantly higher cellular performance
than untreated NFMs (p< 0.01) for longer
time culture periods (14 days). In fact, these
plasma treatment conditions presented
similar cellular viability to TCPS, demon-
strating its suitability for longer cell cultur-
ing periods. It could also be observed that
the O2-treated NFMs at 30W for 5min were
consistently the most effective in all the
culturing periods and the NFMs treated
with Ar at 20W for 5min was also very
effective after 3 days of cell culture.
3. Discussion
The engineering of nanoscale surfaces
allows tailoring the material surface char-
acteristics, which can lead to significant
effects upon the cellular behavior. The main
advantage of this engineering approach
is the ability to design the material
surfaces to provide microenvironments
closer to the native ECM and thus facilitate
cell activity.[23] Theoretically, an optimal
substrate for cells should emulate as near as
possible the topographical and biochemical
nature of the native tissue. In the present
study, nanostructured materials with
morphologies similar to the native ECM
m www.small-journal.com 1201

full papers N. M. Neves et al.
Figure 10. Box plot of MTS assay results for osteoblasts (Saos-2 cell line) cultured on
plasma-treated and untreated PCL NFMs for 1, 3, 7, and 14 days. A) TCPS. B) PCL sovent-cast
membrane. C) Untreated PCL NFM. D) O2 at 30 W for 10 min. E) O2 at 30 W for 5 min. F) O2 at
20 W for 10 min. G) O2 at 20 W for 5 min. H) Ar at 30 W for 10 min. I) Ar at 30 W for 5 min. J) Ar
at 20 W for 10 min. K) Ar at 20 W for 5 min. Data were analyzed nonparametrically by Kruskal–
Wallis test followed by Dunnett’s test for multiple comparisons. a) p<0.01 versus untreated
PCL NFM. b) p< 0.01 versus TCPS.
1202
were produced by electrospinning. Electrospun-processed
materials have the potential to generate scaffolds capable of
providing ECM-like surfaces, facilitating cell–matrix and cell–
cell interactions, and therefore being very useful for tissue
engineering strategies. However, cells recognize not only
topographical clues on the surfaces, but also the surface
chemistry, which can significantly influence their behavior.
Surface functionalization of biodegradable synthetic polymers
has been successfully achieved by plasma treatments, thus
decreasing their intrinsic hydrophobicity.[16] However, only
recently has the plasma surface modification of 3D polymer-
based structures been considered as an alternative route to
enhance their biological performance. The difficulties in the
surface modification of scaffolds by plasma are raised by the
requirement for highly porous and interconnected samples
(the pores must be wider than the mean free path of the
electrons and the Debye length[24]). Thus, this technique is
suitable to modify electrospun structures because of its
inherent interconnectivity. Moreover, unlike other physical
and chemical surface modification techniques, the plasma
action is limited to 10 nm below the surface and does not affect
the bulk properties of the material.[15,17,18,25] The selection of
appropriate treatment conditions is very important since the
nanosized structure of NFMs should not be compromised, and
www.small-journal.com � 2009 Wiley-VCH Verlag GmbH & Co. KGaA, Weinh
nor should its cellular performance.
Depending on the treatment conditions
used, such as the type of gas, pressure,
temperature, time of exposure, and intensity
(or power), both chemical and some phy-
sical characteristics of the surface may be
tailored to develop optimal interactions
with cells and tissues.[26]
The electrospun NFMs subjected to
different plasma treatments were morpho-
logically characterized by SEM. This ana-
lysis showed that thinner nanofibers were
not present in some plasma conditions
probably because of polymer melting that
could be due to an undesired increment of
the reaction chamber temperature or by the
electric power used. Other works report-
ed significant morphological alterations
induced by plasma surface modification.[27]
The analysis of the morphological altera-
tions was also performed by the character-
ization of the surface roughness. This
analysis may be performed by various
techniques such as atomic force microscopy
(AFM) or interferometric optical profilo-
metry. The latest was selected in this study
because of its ability to scan a larger area
than byAFM. Someworks in literature[28,29]
confirmed an increase in surface roughness
after the plasma treatment, due to polymer
melting at the surface. This effect increases
directly with the duration of the treatment.
Recently, Wei et al.[30] modified the surface
of electrospun polyamide 6 nanofibers by
cold gas plasma treatment and observed
that the surface roughness of the fiber was greatly increased
when compared to the surface of the untreated fiber. The
results obtained in the present study with plasma treatments at
low power and exposure time confirm those previous
observations. However, for longer treatment times and higher
power, a smoothing of the surface nanofibers was observed,
which may have been due to the partial polymer melting
during the plasma treatment.
Contact angle analysis is a highly sensitive technique for
the determination of the surface wettability. Moreover, the
surface energy can be quantified using standard polar and non-
polar liquids and some well-established models. However, this
test is also dependent on the surface roughness. In fact, the
NFMs present a quite rough surface and the data herein
reported is particularly valid for comparative purposes. The
untreated electrospun PCLNFM is highly hydrophobic (with a
measured water contact angle of �1308). A decrease of the
contact angle due to the plasma treatments was observed
mainly after the O2 treatments. These results demonstrated
that plasma treatment is an effective method to increase the
surface hydrophilicity of polyester NFMs. Recently, Lai
et al.[20] showed that poly(ethylene terephthalate) (PET)
smoother surfaces at the microscale led to smaller contact
angles. Generally,[19,21] plasma-induced polar chemical groups
eim small 2009, 5, No. 10, 1195–1206

Surface Modification by Plasma Treatment
such as oxygen-containing groups tend to increase the surface
energy of the polymers and thus enhance their hydrophilic
behavior. O2-plasma treatment is commonly used to introduce
those functional groups at the nanofiber surface.[19] It has been
shown already that much of the oxidation is caused by radical
reactions between the polymer chain backbone and atomic
oxygen in the plasma, leading to various functionalities such as
hydroperoxides, carbonyls, carboxylic acids, and peracids.[31]
A higher content of oxygen-containing groups (namely, –O–H
and –C––O) were detected by XPS in our plasma-treated
electrospun PCL NFMs. As previously stated, these changes
result in a significant increase in the hydrophilicity of the
surfaces. Indeed, Lai et al.[20] stated that the C––O bond is the
main factor controlling the hydrophilicity of polymer surfaces.
AlthoughAr is an inert gas, plasma-treatment with this gas can
also introduce oxygen-containing functionality at the sur-
face.[20] This effect is caused by reaction between the free
radicals at the surface created during the treatment and the
oxygen existing in the air.
As previously mentioned, the main purpose of this work
was to define conditions of the treatment that result in surfaces
favorable for cell growth. We have used different cell types
(i.e., fibroblasts, chondrocytes, and osteoblasts) to validate the
efficacy of a defined plasma-treatment. Among the plasma-
treated electrospun NFMs, the ones modified in an O2
atmosphere at 30W for 5min and with Ar at 20W for 5min
can be classified as optimal substrates for the cell adhesion and
proliferation. The NFMs treated at those conditions show
similar cell viability as the one observed for TCPS. In the case
of O2-modified NFM at 30W for 5min, we believe that the
observed cellular activity is mainly due to the increased
hydrophilic character of the NFM (glycerol contact angle
�308). Similar results were observed for human skin
fibroblasts whose spreading increased along chemically
characterized gradient surfaces going from the most hydro-
phobic toward the hydrophilic end.[32] Among the hydrophilic
surfaces, differences in charge and wettability significantly
influence cell attachment but not spreading or cytoskeleton
organization. Surface hydrophilicity (208–408 water contact
angle) is the major parameter promoting high levels of cell
attachment.[33] However, another study demonstrated that the
maximum adhesion and growth of various cell types (ovary,
fibroblast, and endothelial cells) on polymer surfaces with a
wettability gradient appeared around water contact angles of
558.[34] Therefore, the optimum value of the contact angle for
optimal cell adhesion is somewhat inconclusive in the
literature, varying between 208 and 708.The samples treated at these conditions also presented the
highest oxygen content (XPS analysis), indicating the
importance of the surface chemistry for cell adhesion. The
oxygen atoms at the surface may be part of the carbonyl,
carboxyl, ester, or hydroxyl groups.[35] However, it is not clear
which of these groups is the most effective in influencing the
cell–biomaterial interaction. It has been suggested[36] that the
oxygen from the carboxyl group is more effective in promoting
this interaction, while the oxygen derived from the ester and
hydroxyl groups is less effective. However, authors suggested
that the presence of hydroxyl groups was beneficial for cell
adhesion.[37] Furthermore, a selective blocking of the hydroxyl
small 2009, 5, No. 10, 1195–1206 � 2009 Wiley-VCH Verlag Gmb
groups was shown to result in the inhibition of the adhesion of
baby hamster kidney cells or leukocytes, while blocking the
carboxyl groups did not affect cell adhesion.[38]
The NFMs treated in an Ar atmosphere at 20W for 5min
presented a more hydrophobic character (glycerol contact
angle �1108), most probably because of the surface roughness
observed for this treated NFM. It was stated previously that
surface topography is a key factor affecting cellular morphol-
ogy, proliferation, and differentiation.[23] Our experimental
results also confirm many reports describing an increased
proliferation of osteoblastic cells on rough substrata.[39,40]
However, it is also possible to find reports where it is
demonstrated that the surface roughness negatively affects the
adhesion, proliferation, and differentiation of different cell
types, namely osteoblasts and chondrocytes.[41] Furthermore,
SEM micrographs of bone cells on biomaterials with different
surface roughnesses generally demonstrate that the cell
spreading and monolayer formation was more effective on
smoother surfaces.[42] In the case of fibroblastic cells, there are
many studies demonstrating the slower cell proliferation on
rough substrates compared to smooth surfaces.[29,40,43] Thus,
wemay say that the effect or influence of the surface roughness
on the cell adhesion and proliferation is not consensual in the
literature.
Many authors write that the NFMs are morphologically
similar with the ECM of many tissues and that this similarity
must enhance the cell behavior at the surface of those
structures. Herein, we showed that the surface chemistry has,
at least, as strong of an effect over cell activity as the structural
morphology of the NFMs. Thus, we propose that the
performance of NFMs also requires chemical surface
optimization.
4. Conclusions
Electrospun PCL NFMs were submitted to different
plasma treatments including the gas used (O2 and Ar), the
electrical power, and the exposure time. The goal was to
obtain enhanced cellular response at the surface of NFMs by
adjusting the treatment conditions. SEM micrographs and
surface roughness analysis demonstrated the induction of
topographical alterations by the plasma treatments. The
contact angle analysis revealed that the electrospun NFMs
became generally more hydrophilic after the applied mod-
ifications. The most significant changes in the wettability were
observed for O2-treated NFMs. XPS results indicated higher
oxygen-contents at the surface of plasma-treated NFMs,
including hydroxyl (–OH) and carbonyl (–C––O) functional-
ities. However, the relative content of these functional groups
was dependent on the specific conditions used.
Different cell types, namely fibroblasts (L929 cell line),
chondrocytes (ATDC5 cell line), and osteoblast-like (Saos-2)
cells, adhered and proliferated at the surface of plasma-treated
nanofibrous structures. It was possible to define treatment
conditions leading to enhanced cell adhesion and faster
proliferation, namely O2 at 30W for 5min and Ar at 20W for
5min. Using those conditions, both the hydrophilic behavior
and the roughness of the NFM surfaces were affected.
H & Co. KGaA, Weinheim www.small-journal.com 1203

full papers N. M. Neves et al.
1204
Therefore, both those plasma treatment conditions could be
further applied in the development of biomaterials with
enhanced biological performance independently of the tissue
to be regenerated.
It was shown that one treatment with O2 and one with Ar
outperform significantly the other treatment conditions and
also the untreated NFMs. Our results show that the biological
performance of NFMs can be improved by the careful control
of its surface properties without compromising significantly
the overall morphology of the nanofibers.
5. Experimental Section
Electrospinning Process: A polymeric solution of 17% w/v PCL
(TONETM, Union Carbide Chemicals and Plastics Division; New
Jersey) was prepared using an organic solvent mixture composed
of chloroform (Aldrich; Germany) and N,N-dimethylformamide
(Aldrich) (7:3 ratio). The solution was electrospun at 9–10 kV, a
needle-to-ground collector distance of 20 cm, and a flow rate of
1.0 mL hS1. The nonwoven fibrous meshes were collected on a flat
aluminum foil and the solvent evaporation was performed at room
temperature during at least 2 days.
Surface Modification by Plasma Treatment: The PCL NFMs
obtained by electrospinning were modified by plasma treatment.
The treatment was performed in a PlasmaPrep 5 reactor (GaLa
Instrumente, Germany) with a chamber size of 15-cm diameter
and 31-cm length (volume 5 L) and with fully automated process
control. The samples were clamped between both electrodes and
the chamber was evacuated. Two different gases (O2 or Ar) were
used and the chamber was filled with the working gas five times
prior to the treatment. A radio frequency (RF) source operating at
13.56 mHz was used and the power intensity (20 or 30 W) was
applied for either 5 or 10 min. The pressure of the plasma
chamber was kept at 0.2 mbar in all conditions by controlling the
working gas flow. When the higher power level (30 W) and longer
treatment time (10 min) were used as working conditions, an
increase of the temperature inside the chamber was observed
(�35 -C).
Surface Characterization of Untreated and Plasma-Treated PCL
Nanofiber Meshes: SEM: Untreated and plasma-treated electro-
spun PCL NFMs were sputter-coated with gold (Fisons Instruments,
model SC502; England) for 2 min at 15 mA. The samples were
further analyzed by SEM (Leica Cambridge, model S360; England).
Interferometric Optical Profilometry: The surface topography
of the untreated and plasma-treated electrospun PCL NFMs was
assessed by noncontact profilometry using an interferometer
profiler (Wyko-Veeco, model NT1100; USA) equipped with the
WycoVision1 32 analytical software. Topographic roughness
parameters average roughness (Ra) and root mean square (RMS)
roughness (Rq) were both determined for each sample. Each
sample was evaluated, at least, at two randomly selected and
representative specimen locations.
Contact Angle Measurements: The static contact angles were
measured at room temperature with a Contact Angle Equipment
(DataPhysics Instruments, model OCA 15plus; Germany). The
www.small-journal.com � 2009 Wiley-VCH Verlag Gm
values were obtained by the sessile drop method. The used
liquids (water and glycerol, HPLC grade, 3mL) were applied by a
motor driven syringe at different zones of each sample and the
measurement time was extended until 5 min. At least five
measurements were carried out for each sample and the
presented data are averaged values for those measurements.
XPS: Analysis of the untreated and plasma-modified electro-
spun NFMs was performed using an VG Escalab 250 iXL ESCA
instrument (VG Scientific; UK), equipped with Al-Ka 1,2 mono-
chromatized radiation at 1486.92 eV in the X-ray source. Due to
the nonconductive nature of the samples, it was necessary to use
an electron flood gun to minimize the surface charging accumula-
tion. The neutralization of the surface charge was performed by
using both a low energy flood gun (electrons in the range of 0.00–
14.00 eV) and an electrically grounded stainless steel screen was
placed directly at the sample surface.
The XPS measurements were carried out using monochromatic
Al-Ka radiation (hn¼1486.92 eV). Photoelectrons were collected
from a takeoff angle of 90- relative to the sample surface. The
measurement was performed in a constant analyzer energy mode
(CAE) with 100.00 eV pass energy for the screening stage and
20.00 eV pass energy to obtain high resolution spectra.
Charge referencing was carried out by setting the lower binding
energy C1s hydrocarbon (CHx) peak at 285.00 eV. The spectra
fitting is based on a x-squared algorithm used to determine the
effectiveness of the peak fit. Surface elemental composition was
determined using the standard Scofield photoemission cross
section.
Biological Assays:Cell Lines: Three types of cell lines were
used: L929, a mouse lung fibroblastic cell line; the Saos-2, a
Human primary osteosarcoma cell line; and the ATDC5, a mouse
condrocyte teratocarcinoma-derived cell line, all supplied by
European Collection of Cell Cultures (ECACC; UK). L929 and
Saos-2 cells were maintained in Dulbecco’s Modified Eagle’s
Medium (DMEM) (Sigma–Aldrich; Germany) supplemented with
10% heat-inactivated fetal bovine serum (Biochrom AG; Germany)
and 1% antibiotic–antimycotic solution (Gibco; GB). ATDC5 cells
were cultured in DMEM-F12 (Gibco; GB) supplemented with 10%
heat-inactivated fetal bovine serum (Biochrom AG) and 2 mM L-
glutamine (Sigma–Aldrich). All cell types were cultured in a
humidified incubator at 37 -C, in 5% CO2 atmosphere. The media
were routinely replaced every 2–3 days.
Cell Seeding: Prior to the biological assays, the untreated and
plasma-modified PCL NFMs were sterilized by ethylene oxide. The
sterile samples of NFMs and controls, PCL solvent-cast mem-
branes, and TCPS coverslips, were placed in 24-well cell culture
plates (Costar1, Corning; NY). A 50mL cell suspension containing
1T 105 cells was added to each cm2 of each sample and controls.
The biological parameters were assessed at different culture
periods: 1, 3, 7, and 14 days.
Evaluation of Cell Morphology: To evaluate the cell adhesion
and morphology, the constructs (cells–NFMs) were fixed with
2.5% glutaraldehyde (Sigma; USA) in phosphate buffer saline
(Sigma) solution, for 1 h at 4 -C. The samples were further
dehydrated through a graded series of ethanol and coated in a
gold sputter coating equipment (Fisons Instruments, model
SC502; England) for 2 min at 15 mA, and analyzed by SEM (Leica
Cambridge, model S360; England).
bH & Co. KGaA, Weinheim small 2009, 5, No. 10, 1195–1206

Surface Modification by Plasma Treatment
Metabolic Activity Analysis (MTS Assay): At each defined
culture period, cell viability and proliferation was determined
using the CellTiter 961 AQueous One Solution Cell Proliferation
Assay (Promega; USA). Briefly, this assay is based on the
bioreduction of a tetrazolium compound, 3-(4,5-dimethylthiazol-
2-yl)-5-(3-carboxymethoxyphenyl)-2-(4-sulfofenyl)-2H-tetrazolium
(MTS), into a brown formazan product that is soluble in water. This
conversion is accomplished by the production of nicotinamide
adenine dinucleotide phosphate (NADPH) or nicotinamide ade-
nine dinucleotide (NADH) by the dehydrogenase enzymes existing
in metabolically active cells. The absorbance relative to the
quantity of formazan product is directly proportional to the
number of living cells in culture, and was measured at 490 nm in a
microplate reader (Bio-Tek, model Synergie HT; USA). Three
specimens per condition and per time point were characterized.
Statistical Analysis: Statistical analysis was performed using
the SPSS statistic software (Release 8.0.0 for Windows). Firstly, a
Shapiro–Wilk test was used to ascertain about the normality of
the data and the results showed that the data was not following a
normal distribution. For this reason, a Kruskal–Wallis test followed
by Dunnett’s test for multiple comparisons was performed to
analyze the effect of the various plasma treatments performed on
material the hydrophilicity and cellular performance. The p-values
lower than 0.01 were considered statistically significant in the
analysis of the results.
Acknowledgements
This work was partially supported by the European Integrated
Project GENOSTEM (LSH-STREP-CT-2003-503161) and the
European Network of Excellence EXPERTISSUES (NMP3-CT-
2004-500283). The Portuguese Foundation for Science and
Technology for the project Naturally Nano (POCI/EME/58982/
2004) and the Ph.D. grant of A. Martins (SFRH/BD/24382/2005)
is also acknowledged.
[1] J. A. Hubbell, Nat. Biotechnol. 1995, 13, 565.
[2] J. F. Mano, G. A. Silva, H. S. Azevedo, P. B. Malafaya, R. A. Sousa, S.
S. Silva, L. F. Boesel, J. M. Oliveira, T. C. Santos, A. P. Marques, N.
M. Neves, R. L. Reis, J. R. Soc. Interface 2007, 4, 999.
[3] C. M. Agrawal, R. B. Ray, J. Biomed. Mater. Res. 2001, 55, 141.
[4] C. G. Pitt, M. M. Gratzl, G. L. Kimmel, J. Surles, A. Schindler,
Biomaterials 1981, 2, 215.
[5] H. Tsuji, Y. Ikada, J. Appl. Polym. Sci. 1998, 67, 405.
[6] a) G. Ciapetti, L. Ambrosio, L. Savarino, D. Granchi, E. Cenni,
N. Baldini, S. Pagani, S. Guizzardi, F. Causa, A. Giunti, Biomaterials
2003, 24, 3815; b) D. W. Hutmacher, K. W. Ng, C. Kaps,
M. Sittinger, S. Klaring, Biomaterials 2003, 24, 4445; c) X. X.
Shao, D. W. Hutmacher, S. T. Ho, J. C. Goh, E. H. Lee, Biomaterials
2006, 27, 1071.
[7] H. Tsuji, Y. Ikada, J. Appl. Polym. Sci. 1996, 60, 2367.
[8] a) R. Dersch, M. Steinhart, U. Boudriot, A. Greiner, J. H. Wendorff,
Polym. Adv. Technol. 2005, 16, 276; b) Z. M. Huang, Y. Z. Zhang,
M. Kotaki, S. Ramakrishna, Compos. Sci. Technol. 2003, 63, 2223.
[9] A. Martins, J. V. Araujo, R. L. Reis, N. M. Neves,Nanomedicine 2007,
2, 929.
small 2009, 5, No. 10, 1195–1206 � 2009 Wiley-VCH Verlag Gmb
[10] J. Zeng, X. Chen, X. Xu, Q. Liang, X. Bian, L. Yang, X. Jing, J. Appl.
Polym. Sci. 2003, 89, 1085.
[11] D. H. Reneker, I. Chun, Nanotechnology 1996, 7, 216.
[12] a) Z. Ma, M. Kotaki, R. Inai, S. Ramakrishna, Tissue Eng. 2005, 11,
101; b) L. A. Smith, P. X. Ma, Colloids Surf. B 2004, 39, 125.
[13] a) K. Fujihara, M. Kotaki, S. Ramakrishna, Biomaterials 2005, 26,
4139; b) W. J. Li, K. G. Danielson, P. G. Alexander, R. S. Tuan,
J. Biomed. Mater. Res. A 2003, 67, 1105; c) W. J. Li, R. Tuli,
X. Huang, P. Laquerriere, R. S. Tuan, Biomaterials 2005, 26,
5158; d) B. M. Min, G. Lee, S. H. Kim, Y. S. Nam, T. S. Lee, W.
H. Park, Biomaterials 2004, 25, 1289; e) C. Xu, R. Inai, M. Kotaki,
S. Ramakrishna, Tissue Eng. 2004, 10, 1160; f) F. Yang, C. Y. Xu, M.
Kotaki, S. Wang, S. Ramakrishna, J. Biomater. Sci. 2004, 15, 1483.
[14] K. Tuzlakoglu, N. Bolgen, A. J. Salgado, M. E. Gomes, E. Piskin, R. L.
Reis, J. Mater. Sci. Mater. Med. 2005, 16, 1099.
[15] C. M. Chan, T. M. Ko, H. Hiraoka, Surf. Sci. Rep. 1996, 24, 1.
[16] S. Wang, W. Cui, J. Bei, Anal. Bioanal. Chem. 2005, 381, 547.
[17] P. K. Chu, J. Y. Chen, L. P. Wang, N. Huang, Mater. Sci. Eng. Rep.
2002, 36, 143.
[18] a) M. Ibnabddjalil, I. H. Loh, C. C. Chu, N. Blumenthal, H. Alexander,
D. Turner, J. Biomed. Mater. Res. 1994, 28, 289; b) I. H. Loh, H. L.
Lin, C. C. Chu, J. Appl. Biomater. 1992, 3, 131.
[19] N. Y. Cui, N. M. D. Brown, Appl. Surf. Sci. 2002, 189, 31.
[20] J. Lai, B. Sunderland, J. Xue, S. Yan, W. Zhao, M. Folkard, B. D.
Michael, Y. Wang, Appl. Surf. Sci. 2006, 252, 3375.
[21] E. M. Liston, L. Martinu, M. R. Wertheimer, J. Adhes. Sci. Technol.
1993, 7, 1091.
[22] D. Briem, S. Strametz, K. Schroder, N. M. Meenen, W. Lehmann,
W. Linhart, A. Ohl, J. M. Rueger, J. Mater. Sci. Mater. Med. 2005, 16,
671.
[23] R. G. Flemming, C. J. Murphy, G. A. Abrams, S. L. Goodman, P. F.
Nealey, Biomaterials 1999, 20, 573.
[24] A. Hollander, Surf. Coat. Technol. 2005, 200, 561.
[25] S. C. Baker, N. Atkin, P. A. Gunning, N. Granville, K. Wilson, D.
Wilson, J. Southgate, Biomaterials 2006, 27, 3136.
[26] Z. Gugala, S. Gogolewski, J. Biomed. Mater. Res. A 2006, 76, 288.
[27] K. Park, Y. M. Ju, J. S. Son, K. D. Ahn, D. K. Han, J. Biomater. Sci.
2007, 18, 369.
[28] Y. Wan, X. Qu, J. Lu, C. Zhu, L. Wan, J. Yang, J. Bei, S. Wang,
Biomaterials 2004, 25, 4777.
[29] J. Yang, J. Bei, S. Wang, Biomaterials 2002, 23, 2607.
[30] Q. F. Wei, W. D. Gao, D. Y. Hou, X. Q. Wang, Appl. Surf. Sci. 2005,
245, 16.
[31] L. Lianos, C. Quet, T. M. Duc, Surf. Interface Anal. 1994, 21, 14.
[32] T. Groth, G. Altankov, Biomaterials 1996, 17, 1227.
[33] K. Webb, V. Hlady, P. A. Tresco, J. Biomed. Mater. Res. 1998, 41,
422.
[34] J. H. Lee, G. Khang, J. W. Lee, H. B. Lee, J. Colloid Interface Sci. 1998,
205, 323.
[35] S. Haiber, X. Ai, H. Bubert, M. Heintze, V. Bruser, W. Brandl, G.
Marginean, Anal. Bioanal. Chem. 2003, 375, 875.
[36] E. A. Vogler, R. W. Bussian, J. Biomed. Mater. Res. 1987, 21, 1197.
[37] J. H. Lee, H. B. Lee, J. Biomater. Sci. 1993, 4, 467.
[38] A. S. Curtis, J. V. Forrester, C. McInnes, F. Lawrie, J. Cell Biol. 1983,
97, 1500.
[39] a) I. Degasne, M. F. Basle, V. Demais, G. Hure, M. Lesourd,
B. Grolleau, L. Mercier, D. Chappard, Calcif. Tissue Int. 1999,
64, 499; b) K. Hatano, H. Inoue, T. Kojo, T. Matsunaga, T. Tsuji-
sawa, C. Uchiyama, Y. Uchida, Bone 1999, 25, 439; c) J. Lincks,
B. D. Boyan, C. R. Blanchard, C. H. Lohmann, Y. Liu, D. L. Cochran,
D. D. Dean, Z. Schwartz, Biomaterials 1998, 19, 2219; d) O. Zinger,
G. Zhao, Z. Schwartz, J. Simpson, M. Wieland, D. Landolt, B. Boyan,
Biomaterials 2005, 26, 1837.
[40] T. P. Kunzler, T. Drobek, M. Schuler, N. D. Spencer, Biomaterials
2007, 28, 2175.
[41] a) K. Anselme, M. Bigerelle, B. Noel, E. Dufresne, D. Judas, A. Iost,
P. Hardouin, J. Biomed Mater. Res. 2000, 49, 155; b) K. Anselme,
H & Co. KGaA, Weinheim www.small-journal.com 1205

full papers N. M. Neves et al.
1206
P. Linez, M. Bigerelle, D. Le Maguer, A. Le Maguer, P. Hardouin,
H. F. Hildebrand, A. Iost, J. M. Leroy, Biomaterials 2000, 21, 1567;
c) B. D. Boyan, J. Lincks, C. H. Lohmann, V. L. Sylvia, D. L. Cochran,
C. R. Blanchard, D. D. Dean, Z. Schwartz, J. Orthop. Res. 1999, 17,
446; d) J. Y. Martin, Z. Schwartz, T. W. Hummert, D. M. Schraub,
J. Simpson, J. Lankford, Jr, D. D. Dean, D. L. Cochran, B. D. Boyan,
J. Biomed. Mater. Res. 1995, 29, 389; e) Z. Schwartz, J. Y. Martin,
D. D. Dean, J. Simpson, D. L. Cochran, B. D. Boyan, J. Biomed.
Mater. Res. 1996, 30, 145.
www.small-journal.com � 2009 Wiley-VCH Verlag Gm
[42] K. Anselme, M. Bigerelle, J. Mater. Sci. Mater. Med. 2006, 17, 471.
[43] a) B. Grossner-Schreiber, M. Herzog, J. Hedderich, A. Duck, M.
Hannig, M. Griepentrog, Clin. Oral Implants Res. 2006, 17, 736;
b) M. Kononen, M. Hormia, J. Kivilahti, J. Hautaniemi, I. Thesleff,
J. Biomed. Mater. Res. 1992, 26, 1325.
bH & Co. KGaA, Weinheim
Received: November 6, 2008Published online: February 25, 2009
small 2009, 5, No. 10, 1195–1206
Copyright © 2022 FDOKUMEN