Optimization of a Broadband VHF Lumped-Element Ferrite Circulator
Surface effects in the magnetic properties of crystalline 3 nm ferritenanoparticles chemically synthesized
E. Lima, Jr.,1 E. De Biasi,1 M. Vasquez Mansilla,1 M. E. Saleta,1 F. Effenberg,2
L. M. Rossi,2 R. Cohen,3 H. R. Rechenberg,3 and R. D. Zysler1,a�
1CONICET-CNEA, Centro Atómico Bariloche and Instituto Balseiro, 8400 S. C. de Bariloche, Rio Negro,Argentina2Instituto de Química, Universidade de São Paulo, 05508-000 São Paulo, Brazil3Instituto de Física, Universidade de São Paulo, 05315-970 São Paulo, Brazil
�Received 17 June 2010; accepted 16 October 2010; published online 30 November 2010�
We have systematically studied the magnetic properties of ferrite nanoparticles with 3, 7, and 11 nmof diameter with very narrow grain size distributions. Samples were prepared by the thermaldecomposition of Fe�acac�3 in the presence of surfactants giving nanoparticles covered by oleicacid. High resolution transmission electron microscopy �HRTEM� images and XRD diffractionpatterns confirms that all samples are composed by crystalline nanoparticles with the spinel structureexpected for the iron ferrite. ac and dc magnetization measurements, as well in-field Mössbauerspectroscopy, indicate that the magnetic properties of nanoparticles with 11 and 7 nm are close tothose expected for a monodomain, presenting large MS �close to the magnetite bulk�. Despite thecrystalline structure observed in HRTEM images, the nanoparticles with 3 nm are composed by amagnetically ordered region �core� and a surface region that presents a different magnetic order andit contains about 66% of Fe atoms. The high saturation and irreversibility fields in the M�H� loopsof the particles with 3 nm together with the misalignment at 120 kOe in the in-field Mössbauerspectrum of surface component indicate a high surface anisotropy for the surface atoms, which isnot observed for the core. For T�10 K, we observe an increase in the susceptibility and of themagnetization for former sample, indicating that surface moments tend to align with applied fieldincreasing the magnetic core size. © 2010 American Institute of Physics. �doi:10.1063/1.3514585�
I. INTRODUCTION
The understanding of the magnetic properties of iron ox-ide nanoparticles, specifically the ferrites, has a strong sig-nificance, since they present a broad spectrum of applica-tions, from electronics to biomedicine. Magnetic behavior inreduced size particles �below 5–6 nm depending of the struc-tural characteristics� is expected to be strongly affected bysurface effects as it was evidenced in many ferro-, ferri-, andantiferromagnetic nanocrystalline materials. At the sametime, size reduction in nanoparticles enhances the presenceof defects, such as broken bonds and vacancies within theparticle.1–15
Depending on the synthesis method, different morpholo-gies, and crystalline order degree of ferrite nanosystems areobtained. As a consequence, different magnetic propertieswere observed for those systems. Serna et al.16 showed byMössbauer spectroscopy �MS� and magnetization measure-ments that systems composed of nanoparticles prepared by asimilar way �laser pyrolysis�, slightly changing the tempera-ture of the synthesis, and with the same size �3.5 nm�,present distinct degrees of magnetic disorder that could beunderstood in terms of structural differences �in whole par-ticle, not only in the surface� and not related to the particlesize. For free-defects 7 nm magnetite monocrystals,17 theobserved magnetic properties are the expected for a magneticmonodomain: M�H� curves at high-temperatures are well de-
scribed by the Langevin function with a magnetic moment of8000 �B, the change to the blocked regime occurs in the61–100 K temperature range �observed in the M�T� curves,depending on the applied magnetic field value�, while MS
�80 emu /g is close to the bulk value �90–95 emu /g �Ref.18��, evidencing that the high crystallinity of the systemmakes no valid the expected surface effects on the magneticproperties.
In the literature, there are indications of more compli-cated spin structures for nanoparticles with reduced size asconsequence of the competition between the surface andbulk magnetocrystalline anisotropies. Evidences of distinctmagnetic configuration of small nanoparticles were found byMonte Carlo simulations on nanoparticles with radius 6times or 15 times grater than the interatomic distance, show-ing a “throttled” spin structure, with the surface spins ori-ented normally to the surface while the core spins are parallelto each other.19 In Ref. 5, a speromagneticlike structure wasobserved for �-Fe2O3 phosphate-coated nanoparticles withdiameter of 3–10 nm as result for the interplay between sur-face anisotropy, exchange, and interparticle interactions.
It has been observed that nanoparticles synthesized bythermal decomposition of organometallic salts at high tem-peratures usually show less surface magnetic effects thanthose obtained by other chemical methods, e.g., coprecipita-tion, due to the increment of the crystallinity degree in thesynthesis process.20–22 Recently, Serna and co-workers23
showed that the changes in the magnetic properties of ferritenanoparticles produced by this method with the reduction ina�Electronic mail: [email protected].
JOURNAL OF APPLIED PHYSICS 108, 103919 �2010�
0021-8979/2010/108�10�/103919/10/$30.00 © 2010 American Institute of Physics108, 103919-1
Downloaded 03 Dec 2010 to 200.0.233.52. Redistribution subject to AIP license or copyright; see http://jap.aip.org/about/rights_and_permissions
the diameter down to 5 nm are continuous as consequence ofthe high crystallinity degree of the nanoparticles. In addition,the particles synthesized by thermal decomposition are com-monly covered by a surfactant �e.g., oleic acid�, and the sur-face chemical bonding between the organic compound andthe magnetite also reduces the relevance of the surface mag-netic effects.24
In structural disordered surfaces, spin configuration isdetermined by the competition between the weakened ex-change interaction and the surface anisotropy induced at eachsite by its immediate neighborhood. In this way, the spinconfiguration of the surface region in a nanoparticle presentsmany stable states with a broad distribution of energy barri-ers and a multiminima magnetic surface energy, leading tothe canting of the surface moments which remain frozen in acluster-glass-like ordering. Thus, the surface effects, thatmay dominate the magnetic properties of nanoparticles, arerelated to the chemical, physical and morphological charac-teristics of the system. Therefore, systematic studies aimingto associate the morphology and the magnetic properties ofnanoscaled iron oxide systems are necessary to future tech-nological applications. However, the understanding of theinfluence of the morphology on the magnetic properties ofiron oxide nanoparticles is far from being complete. Thereexist antecedents of amorphous6,25 and crystalline26 nanopar-ticles, where the surface effects dominate the magnetic be-havior. In theses cases, a magnetic order of the spins in thesurface is produced at low temperatures, increasing the ef-fective exchange with the core and their magnetic effectiveanisotropy. However, the surface spins are not incorporatedto the core, leading the whole particle to a frustrated spinglass like behavior.
In the present work, we have focused on the size depen-dence of the magnetic properties of systems composed bycrystalline ferrite nanoparticles synthesized by high-temperature chemical method with d�3, 7, and 11 nm, andnarrow grain size distribution. As-made nanoparticles arecovered by a monolayer of oleic acid strongly linked to thesurface. High resolution transmission electron microscopy�HRTEM� images and x-ray diffraction �XRD� showed thatthe nanoparticles in all samples are crystalline. According toour magnetization measurements as function of field andtemperature �M�H ,T��, as well in-field �up to �MHapp
=12 T� MS results, exist strong differences between themagnetic behavior of the larger nanoparticles, with highermagnetic order degree, than the smallest one, which presenta magnetically ordered core and a different magnetic order atthe surface.
II. EXPERIMENTAL DETAILS
A. Sample preparation
Nanoparticles with tailored size and narrow diameterdistribution were prepared by the high-temperature decom-position of Fe�III� acetylacetonate �Fe�acac�3� in the pres-ence of surfactants and of a long-chain alcohol.27,28 Specifi-cally, the samples were prepared by adding 1.5 mmol ofFe�acac�3 together with 1.5 mmol of 1,2 octanediol �long-chain alcohol� to 30 mL of diphenyl ether, followed by the
addition of the surfactants oleylamine and oleic acid. Thesize of the particle was tailored by the surfactant:precursormolar ratio ��Surf.�:�Prec.�� according to Ref. 29. The syn-thesis solution was magnetically stirred and heated up to itsboiling point at 533–538 K. The reaction was allowed toproceed for 120 min. After that, the solution was removedfrom the heating source and allowed to cool down to roomtemperature. The nanoparticles were separated by centrifuga-tion �10000 rpm /10 min� and washed with a mix of ethanoland toluene �10:1� solution. Final sample consists in a blackpowder constituted by ferrite nanoparticles covered with anorganic layer composed by oleic acid, which is stronglylinked to the surface, improving the chemical stability, pre-venting oxidation of Fe2+, and avoiding agglomeration. Thesamples were labelled A11, A7, and A3 according to themean diameter obtained from the TEM analysis. Differentelementary analyses by atomic absorption �CHNS and ICP-AES� allow us to estimate independently the real amount oforganic mass in each sample.
B. Experimental techniques
TEM and HRTEM images were made in a PhilipsCM200 �200 kV� transmission electron microscope. Thesamples were prepared by dropping a colloidal solution ofNPs onto a carbon-coated copper grid. XRD patterns werecollected in �-2� geometry with a Philips W1700 diffracto-meter, using Cu K� radiation ��=0.15 406 nm�.
In order to avoid dipolar interactions among the particlesin the magnetic measurements, the nanoparticles were dis-persed in a polymeric matrix �polyethylamine� in a concen-tration of �1% w /w. Magnetization as a function of tem-perature M�T� were measured in zero-field-cooling �ZFC�and field-cooling �FC� conditions in a commercial supercon-ducting quantum interference device �SQUID� magnetome-ter. ac-susceptibility measurements with f =0.1, 1, 10, 100,and 997 Hz, and ac-field amplitude of 2 Oe and zero dcapplied field �T=2–300 K� were made in a commercialSQUID magnetometer. Magnetization loops at T�2 K�M�H�� were measured in both, a commercial vibratingsample magnetometer with a maximum applied field of 90kOe and in a SQUID magnetometer, as specified for eachmeasurement presented. Magnetization data were normalizedwith the mass of Fe3O4 nanoparticles present in the samplesaccording to the ICP-AES results.
MS were taken at 4.2–300 K in a liquid He flow cryostatwith a conventional constant-acceleration spectrometer intransmission geometry using a 57Co /Rh source. Mössbauersamples were prepared by dispersing 20 mg of the respectivepowder samples in boron nitride and pressing it betweenacrylic discs. For in-field measurements, the sample wasmounted in the bore of a 140 kOe superconducting magnet,in a vertical source-sample-detector setup such that the di-rection of gamma-ray is parallel to the direction of appliedfield. For these measurements, a sine-shaped velocity wave-form was used to minimize mechanical noise. All MS spectrawere fitted by using Lorentzian line shapes with a nonlinearleast-square program �NORMOS�, calibrating the velocityscale with a �-Fe foil at 300 K. When necessary a hyperfine
103919-2 Lima, Jr. et al. J. Appl. Phys. 108, 103919 �2010�
Downloaded 03 Dec 2010 to 200.0.233.52. Redistribution subject to AIP license or copyright; see http://jap.aip.org/about/rights_and_permissions
field distribution was employed. Isomer shift �IS� values arerelative to �-Fe at 300 K. As consequence of the experimen-tal setup, for MS spectra collected at low temperatures, thetemperature of the source during the spectrum acquisitionmust to be considered as an important factor to the IS valuesobserved in order to compare with the expected ones, i.e., asmentioned below, we observe low values of IS that is prob-ably related with the change in the temperature of the sourcewith the reduction in the temperature in the experiment.
III. RESULTS
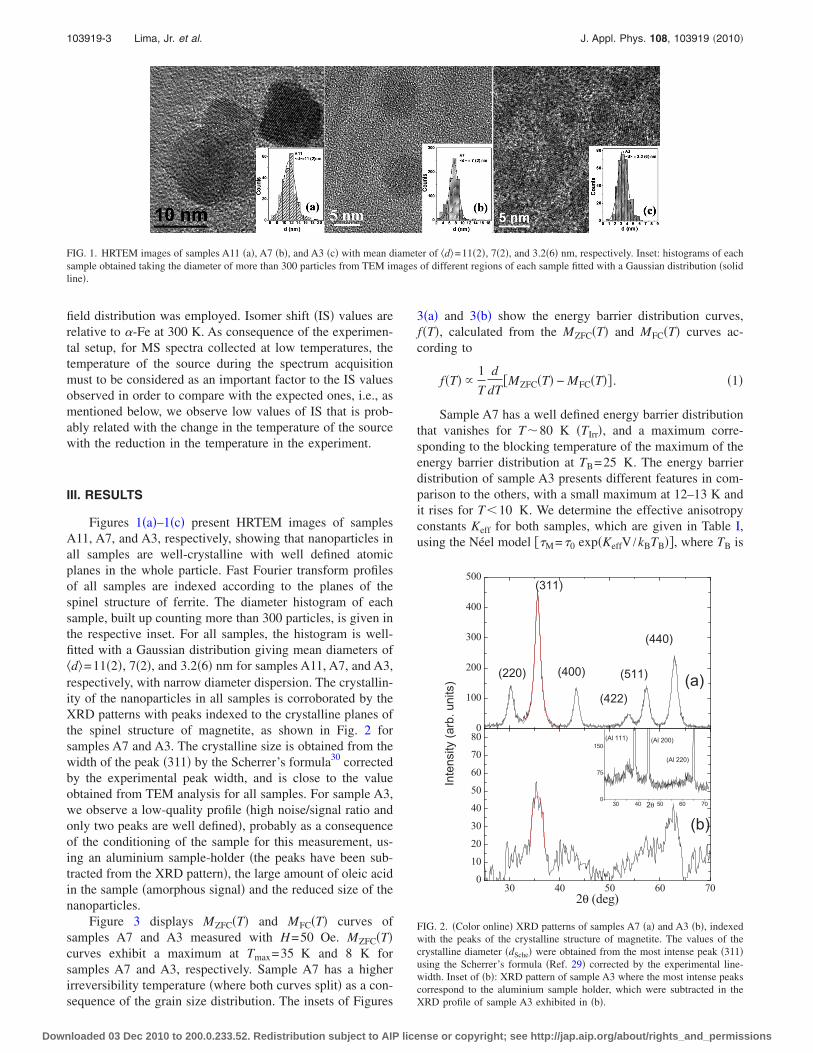
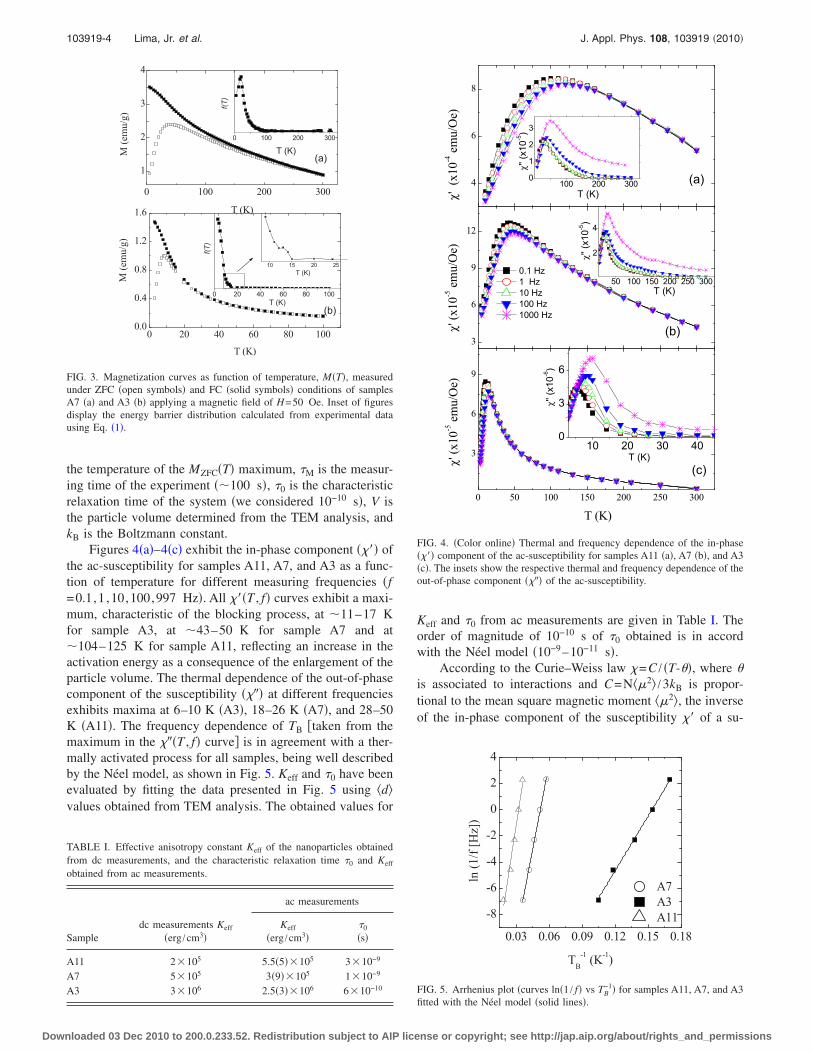
Figures 1�a�–1�c� present HRTEM images of samplesA11, A7, and A3, respectively, showing that nanoparticles inall samples are well-crystalline with well defined atomicplanes in the whole particle. Fast Fourier transform profilesof all samples are indexed according to the planes of thespinel structure of ferrite. The diameter histogram of eachsample, built up counting more than 300 particles, is given inthe respective inset. For all samples, the histogram is well-fitted with a Gaussian distribution giving mean diameters of�d�=11�2�, 7�2�, and 3.2�6� nm for samples A11, A7, and A3,respectively, with narrow diameter dispersion. The crystallin-ity of the nanoparticles in all samples is corroborated by theXRD patterns with peaks indexed to the crystalline planes ofthe spinel structure of magnetite, as shown in Fig. 2 forsamples A7 and A3. The crystalline size is obtained from thewidth of the peak �311� by the Scherrer’s formula30 correctedby the experimental peak width, and is close to the valueobtained from TEM analysis for all samples. For sample A3,we observe a low-quality profile �high noise/signal ratio andonly two peaks are well defined�, probably as a consequenceof the conditioning of the sample for this measurement, us-ing an aluminium sample-holder �the peaks have been sub-tracted from the XRD pattern�, the large amount of oleic acidin the sample �amorphous signal� and the reduced size of thenanoparticles.
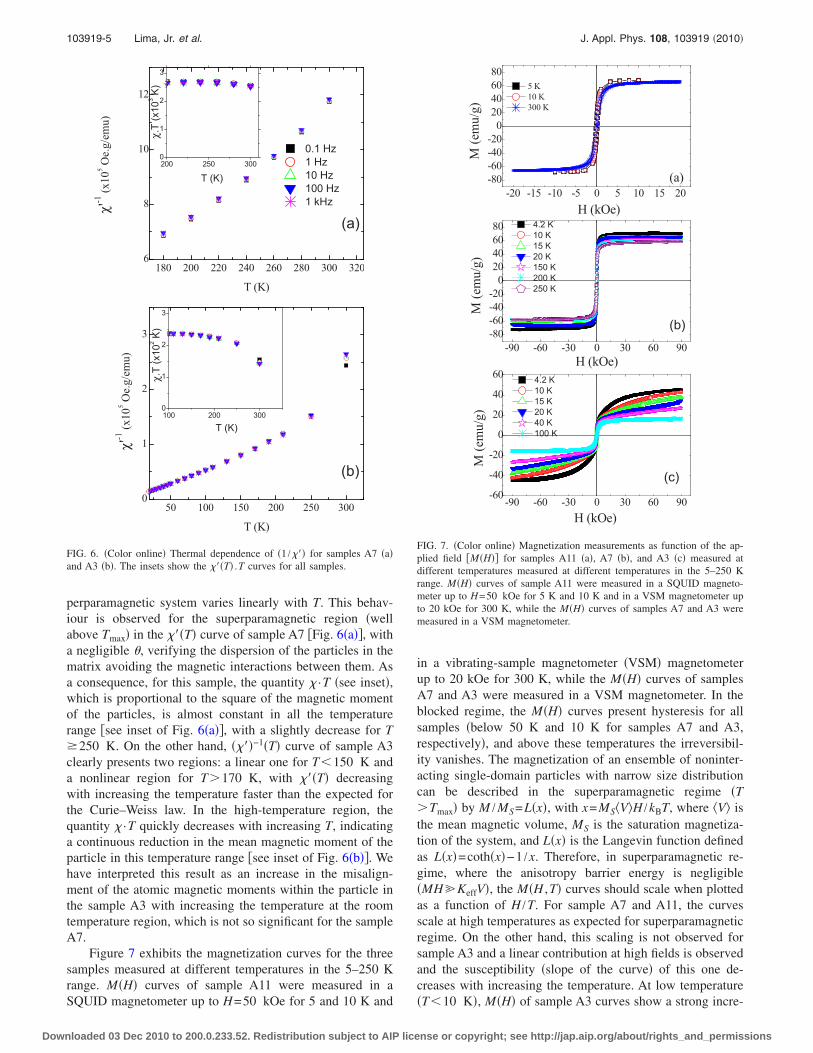
Figure 3 displays MZFC�T� and MFC�T� curves ofsamples A7 and A3 measured with H=50 Oe. MZFC�T�curves exhibit a maximum at Tmax=35 K and 8 K forsamples A7 and A3, respectively. Sample A7 has a higherirreversibility temperature �where both curves split� as a con-sequence of the grain size distribution. The insets of Figures
3�a� and 3�b� show the energy barrier distribution curves,f�T�, calculated from the MZFC�T� and MFC�T� curves ac-cording to
f�T� 1
T
d
dT�MZFC�T� − MFC�T�� . �1�
Sample A7 has a well defined energy barrier distributionthat vanishes for T�80 K �TIrr�, and a maximum corre-sponding to the blocking temperature of the maximum of theenergy barrier distribution at TB=25 K. The energy barrierdistribution of sample A3 presents different features in com-parison to the others, with a small maximum at 12–13 K andit rises for T�10 K. We determine the effective anisotropyconstants Keff for both samples, which are given in Table I,using the Néel model �M=0 exp�KeffV /kBTB��, where TB is
FIG. 1. HRTEM images of samples A11 �a�, A7 �b�, and A3 �c� with mean diameter of �d�=11�2�, 7�2�, and 3.2�6� nm, respectively. Inset: histograms of eachsample obtained taking the diameter of more than 300 particles from TEM images of different regions of each sample fitted with a Gaussian distribution �solidline�.
0
100
200
300
400
500
30 40 50 60 700
10
20
30
40
50
60
70
80
(b)
Intensity(arb.units)
(440)
(511)
(422)
(400)
(311)
(220) (a)
2θ (deg)
30 40 50 60 700
75
150
(Al 220)
(Al 200)(Al 111)
2θ
FIG. 2. �Color online� XRD patterns of samples A7 �a� and A3 �b�, indexedwith the peaks of the crystalline structure of magnetite. The values of thecrystalline diameter �dSche� were obtained from the most intense peak �311�using the Scherrer’s formula �Ref. 29� corrected by the experimental line-width. Inset of �b�: XRD pattern of sample A3 where the most intense peakscorrespond to the aluminium sample holder, which were subtracted in theXRD profile of sample A3 exhibited in �b�.
103919-3 Lima, Jr. et al. J. Appl. Phys. 108, 103919 �2010�
Downloaded 03 Dec 2010 to 200.0.233.52. Redistribution subject to AIP license or copyright; see http://jap.aip.org/about/rights_and_permissions
the temperature of the MZFC�T� maximum, M is the measur-ing time of the experiment ��100 s�, 0 is the characteristicrelaxation time of the system �we considered 10−10 s�, V isthe particle volume determined from the TEM analysis, andkB is the Boltzmann constant.
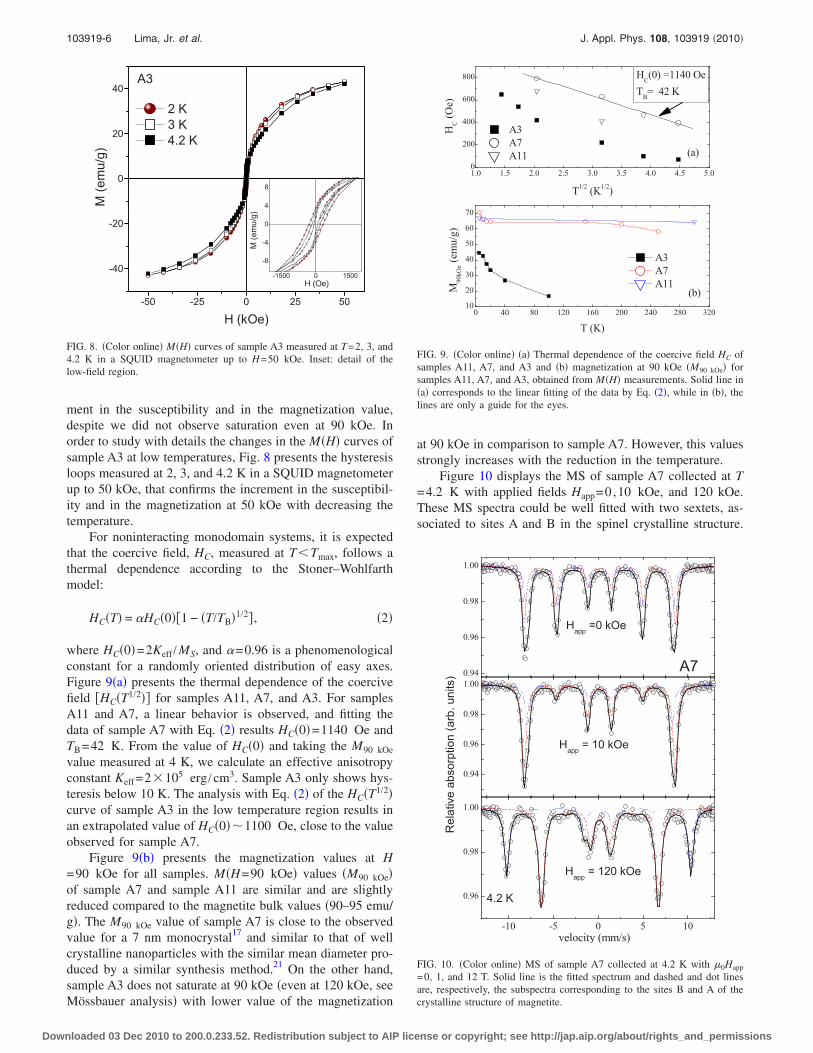
Figures 4�a�–4�c� exhibit the in-phase component ���� ofthe ac-susceptibility for samples A11, A7, and A3 as a func-tion of temperature for different measuring frequencies �f=0.1,1 ,10,100,997 Hz�. All ���T , f� curves exhibit a maxi-mum, characteristic of the blocking process, at �11–17 Kfor sample A3, at �43–50 K for sample A7 and at�104–125 K for sample A11, reflecting an increase in theactivation energy as a consequence of the enlargement of theparticle volume. The thermal dependence of the out-of-phasecomponent of the susceptibility ���� at different frequenciesexhibits maxima at 6–10 K �A3�, 18–26 K �A7�, and 28–50K �A11�. The frequency dependence of TB �taken from themaximum in the ���T , f� curve� is in agreement with a ther-mally activated process for all samples, being well describedby the Néel model, as shown in Fig. 5. Keff and 0 have beenevaluated by fitting the data presented in Fig. 5 using �d�values obtained from TEM analysis. The obtained values for
Keff and 0 from ac measurements are given in Table I. Theorder of magnitude of 10−10 s of 0 obtained is in accordwith the Néel model �10−9–10−11 s�.
According to the Curie–Weiss law �=C / �T-��, where �is associated to interactions and C=N��2� /3kB is propor-tional to the mean square magnetic moment ��2�, the inverseof the in-phase component of the susceptibility �� of a su-
0 100 200 300
1
2
3
4
0 20 40 60 80 1000.0
0.4
0.8
1.2
1.6f(T)
M(emu/g)
T (K)
(a)
0 100 200 300
T (K)
f(T)
M(emu/g)
T (K)
(b)
0 20 40 60 80 100T (K)
10 15 20 25T (K)
FIG. 3. Magnetization curves as function of temperature, M�T�, measuredunder ZFC �open symbols� and FC �solid symbols� conditions of samplesA7 �a� and A3 �b� applying a magnetic field of H=50 Oe. Inset of figuresdisplay the energy barrier distribution calculated from experimental datausing Eq. �1�.
TABLE I. Effective anisotropy constant Keff of the nanoparticles obtainedfrom dc measurements, and the characteristic relaxation time 0 and Keff
obtained from ac measurements.
Sampledc measurements Keff
�erg /cm3�
ac measurements
Keff
�erg /cm3�0
�s�
A11 2�105 5.5�5��105 3�10−9
A7 5�105 3�9��105 1�10−9
A3 3�106 2.5�3��106 6�10−10
4
6
8
0 50 100 150 200 250 300
3
6
9
3
6
9
12
χ'(x10
-4emu/Oe)
(a)100 200 3000
1
2
3
T (K)
χ'(x10
-5emu/Oe)
T (K)
T (K)
χ''(x10-5 )
χ''(x10-5 )
(c)
χ''(x10-6 )
T (K)10 20 30 40
0
3
6
0.1 Hz1 Hz10 Hz100 Hz1000 Hz
χ'(x10
-5emu/Oe)
(b)
50 100 150 200 250 300
2
4
FIG. 4. �Color online� Thermal and frequency dependence of the in-phase���� component of the ac-susceptibility for samples A11 �a�, A7 �b�, and A3�c�. The insets show the respective thermal and frequency dependence of theout-of-phase component ���� of the ac-susceptibility.
0.03 0.06 0.09 0.12 0.15 0.18
-8
-6
-4
-2
0
2
4
A7A3A11
ln(1/f[Hz])
TB-1 (K-1)
FIG. 5. Arrhenius plot �curves ln�1 / f� vs TB−1� for samples A11, A7, and A3
fitted with the Néel model �solid lines�.
103919-4 Lima, Jr. et al. J. Appl. Phys. 108, 103919 �2010�
Downloaded 03 Dec 2010 to 200.0.233.52. Redistribution subject to AIP license or copyright; see http://jap.aip.org/about/rights_and_permissions
perparamagnetic system varies linearly with T. This behav-iour is observed for the superparamagnetic region �wellabove Tmax� in the ���T� curve of sample A7 �Fig. 6�a��, witha negligible �, verifying the dispersion of the particles in thematrix avoiding the magnetic interactions between them. Asa consequence, for this sample, the quantity � ·T �see inset�,which is proportional to the square of the magnetic momentof the particles, is almost constant in all the temperaturerange �see inset of Fig. 6�a��, with a slightly decrease for T�250 K. On the other hand, ����−1�T� curve of sample A3clearly presents two regions: a linear one for T�150 K anda nonlinear region for T 170 K, with ���T� decreasingwith increasing the temperature faster than the expected forthe Curie–Weiss law. In the high-temperature region, thequantity � ·T quickly decreases with increasing T, indicatinga continuous reduction in the mean magnetic moment of theparticle in this temperature range �see inset of Fig. 6�b��. Wehave interpreted this result as an increase in the misalign-ment of the atomic magnetic moments within the particle inthe sample A3 with increasing the temperature at the roomtemperature region, which is not so significant for the sampleA7.
Figure 7 exhibits the magnetization curves for the threesamples measured at different temperatures in the 5–250 Krange. M�H� curves of sample A11 were measured in aSQUID magnetometer up to H=50 kOe for 5 and 10 K and
in a vibrating-sample magnetometer �VSM� magnetometerup to 20 kOe for 300 K, while the M�H� curves of samplesA7 and A3 were measured in a VSM magnetometer. In theblocked regime, the M�H� curves present hysteresis for allsamples �below 50 K and 10 K for samples A7 and A3,respectively�, and above these temperatures the irreversibil-ity vanishes. The magnetization of an ensemble of noninter-acting single-domain particles with narrow size distributioncan be described in the superparamagnetic regime �T Tmax� by M /MS=L�x�, with x=MS�V�H /kBT, where �V� isthe mean magnetic volume, MS is the saturation magnetiza-tion of the system, and L�x� is the Langevin function definedas L�x�=coth�x�−1 /x. Therefore, in superparamagnetic re-gime, where the anisotropy barrier energy is negligible�MH�KeffV�, the M�H ,T� curves should scale when plottedas a function of H /T. For sample A7 and A11, the curvesscale at high temperatures as expected for superparamagneticregime. On the other hand, this scaling is not observed forsample A3 and a linear contribution at high fields is observedand the susceptibility �slope of the curve� of this one de-creases with increasing the temperature. At low temperature�T�10 K�, M�H� of sample A3 curves show a strong incre-
180 200 220 240 260 280 300 3206
8
10
12
50 100 150 200 250 3000
1
2
3
0.1 Hz1 Hz10 Hz100 Hz1 kHzχ'
-1(x10
5Oe.g/emu)
T (K)
(a)
200 250 3000
1
2
3
χ.T(x10
3K)
χ'-1(x10
5Oe.g/emu)
T (K)
(b)
100 200 3000
1
2
3
T (K)
χ.T(x10
2K)
T (K)
FIG. 6. �Color online� Thermal dependence of �1 /��� for samples A7 �a�and A3 �b�. The insets show the ���T� .T curves for all samples.
-90 -60 -30 0 30 60 90-80-60-40-20020406080
-20 -15 -10 -5 0 5 10 15 20-80-60-40-20020406080
-90 -60 -30 0 30 60 90-60
-40
-20
0
20
40
60
4.2 K10 K15 K20 K150 K200 K250 K
M(emu/g)
H (kOe)
(b)
5 K10 K300 K
M(emu/g)
H (kOe)
(a)
4.2 K10 K15 K20 K40 K100 K
M(emu/g)
H (kOe)
(c)
FIG. 7. �Color online� Magnetization measurements as function of the ap-plied field �M�H�� for samples A11 �a�, A7 �b�, and A3 �c� measured atdifferent temperatures measured at different temperatures in the 5–250 Krange. M�H� curves of sample A11 were measured in a SQUID magneto-meter up to H=50 kOe for 5 K and 10 K and in a VSM magnetometer upto 20 kOe for 300 K, while the M�H� curves of samples A7 and A3 weremeasured in a VSM magnetometer.
103919-5 Lima, Jr. et al. J. Appl. Phys. 108, 103919 �2010�
Downloaded 03 Dec 2010 to 200.0.233.52. Redistribution subject to AIP license or copyright; see http://jap.aip.org/about/rights_and_permissions
ment in the susceptibility and in the magnetization value,despite we did not observe saturation even at 90 kOe. Inorder to study with details the changes in the M�H� curves ofsample A3 at low temperatures, Fig. 8 presents the hysteresisloops measured at 2, 3, and 4.2 K in a SQUID magnetometerup to 50 kOe, that confirms the increment in the susceptibil-ity and in the magnetization at 50 kOe with decreasing thetemperature.
For noninteracting monodomain systems, it is expectedthat the coercive field, HC, measured at T�Tmax, follows athermal dependence according to the Stoner–Wohlfarthmodel:
HC�T� = �HC�0��1 − �T/TB�1/2� , �2�
where HC�0�=2Keff /MS, and �=0.96 is a phenomenologicalconstant for a randomly oriented distribution of easy axes.Figure 9�a� presents the thermal dependence of the coercivefield �HC�T1/2�� for samples A11, A7, and A3. For samplesA11 and A7, a linear behavior is observed, and fitting thedata of sample A7 with Eq. �2� results HC�0�=1140 Oe andTB=42 K. From the value of HC�0� and taking the M90 kOe
value measured at 4 K, we calculate an effective anisotropyconstant Keff=2�105 erg /cm3. Sample A3 only shows hys-teresis below 10 K. The analysis with Eq. �2� of the HC�T1/2�curve of sample A3 in the low temperature region results inan extrapolated value of HC�0��1100 Oe, close to the valueobserved for sample A7.
Figure 9�b� presents the magnetization values at H=90 kOe for all samples. M�H=90 kOe� values �M90 kOe�of sample A7 and sample A11 are similar and are slightlyreduced compared to the magnetite bulk values �90–95 emu/g�. The M90 kOe value of sample A7 is close to the observedvalue for a 7 nm monocrystal17 and similar to that of wellcrystalline nanoparticles with the similar mean diameter pro-duced by a similar synthesis method.21 On the other hand,sample A3 does not saturate at 90 kOe �even at 120 kOe, seeMössbauer analysis� with lower value of the magnetization
at 90 kOe in comparison to sample A7. However, this valuesstrongly increases with the reduction in the temperature.
Figure 10 displays the MS of sample A7 collected at T=4.2 K with applied fields Happ=0 ,10 kOe, and 120 kOe.These MS spectra could be well fitted with two sextets, as-sociated to sites A and B in the spinel crystalline structure.
-50 -25 0 25 50
-40
-20
0
20
40
2 K3 K4.2 K
M(emu/g)
H (kOe)
A3
-1500 0 1500
-8
-4
0
4
8
M(emu/g)
H (Oe)
FIG. 8. �Color online� M�H� curves of sample A3 measured at T=2, 3, and4.2 K in a SQUID magnetometer up to H=50 kOe. Inset: detail of thelow-field region.
0 40 80 120 160 200 240 280 32010
20
30
40
50
60
70
1.0 1.5 2.0 2.5 3.0 3.5 4.0 4.5 5.00
200
400
600
800
A3A7A11M
90kOe(emu/g)
T (K)
(b)
A3A7A11
HC(0) =1140 OeTB= 42 K
HC(Oe)
T1/2 (K1/2)
(a)
FIG. 9. �Color online� �a� Thermal dependence of the coercive field HC ofsamples A11, A7, and A3 and �b� magnetization at 90 kOe �M90 kOe� forsamples A11, A7, and A3, obtained from M�H� measurements. Solid line in�a� corresponds to the linear fitting of the data by Eq. �2�, while in �b�, thelines are only a guide for the eyes.
0.94
0.96
0.98
1.00
0.94
0.96
0.98
1.00
-10 -5 0 5 10
0.96
0.98
1.00
Happ = 120 kOe
Happ = 10 kOe
Happ =0 kOe
A7
velocity (mm/s)
Relativeabsorption(arb.units)
4.2 K
FIG. 10. �Color online� MS of sample A7 collected at 4.2 K with �0Happ
=0, 1, and 12 T. Solid line is the fitted spectrum and dashed and dot linesare, respectively, the subspectra corresponding to the sites B and A of thecrystalline structure of magnetite.
103919-6 Lima, Jr. et al. J. Appl. Phys. 108, 103919 �2010�
Downloaded 03 Dec 2010 to 200.0.233.52. Redistribution subject to AIP license or copyright; see http://jap.aip.org/about/rights_and_permissions
We obtain an IS of �0.25 mm /s and 0.36 mm/s for sites Aand B, respectively, and the quadrupolar shift �2�� is aboutzero for both sites. These IS and Quadrupolar shift valuesand the hyperfine field �see table I� obtained from the fittingprocedure of the MS spectra collected at Happ=0 are veryclose to those observed for well-crystallized magnetitenanoparticles31,32 and bulk material.33 Because of the strongantiferromagnetic exchange, in the in-field MS spectra, theeffective field of sublattice A increases, while Beff of sublat-tice B decreases according to Refs. 34 and 35
B� eff�Happ� = B� hyp�0� + �MH� app,
�B� eff�2 = �B� hyp�2 + �MH� app2 + 2�B� hyp�
��MH� appcos��� , �3�
where �M is the permeability of the material. In addition, therelative intensities of the six-line MS spectrum are given by
3:4 sin2���
1 + cos2���:1:1:
4 sin2���1 + cos2���
:3, �4�
where ��� is the mean angle between the spin and the �-raydirection �parallel to the applied field in our experimentalsetup�. As the magnetic moments of the particles align to theapplied field, lines 2 and 5 vanish when �=0 or 180°. TheMS spectrum collected with �MHapp=1 T shows a reducedintensity for lines 2 and 5 of both subspectra �A and B�,leading to cos���=0.94 and 0.88, respectively. However,�MHapp=1 T is not enough to complete resolve the two sub-spectra, which is almost complete with �MHapp=12 T,where we obtain cos���=1.00 and 0.96 for subspectra A andB, respectively. By using Eq. �3� with the obtained values ofBeff from the fitting procedure and the calculated ones forcos���, we observe that the values of Bhyp at �MHapp=1 and12 T are very close to the observed for �MHapp=0. In thisway, the spins in sample A7 are significantly aligned with theexternal field for Happ=10 kOe and almost completely alignsat 120 kOe. Relevant hyperfine parameters obtained fromfitting procedure of MS spectra of sample A7 are given inTable II. Sample A11 present similar MS spectra than sampleA7, excepting that for �MHapp=12 T the intensities of lines2 and 5 vanish for both subspectra.
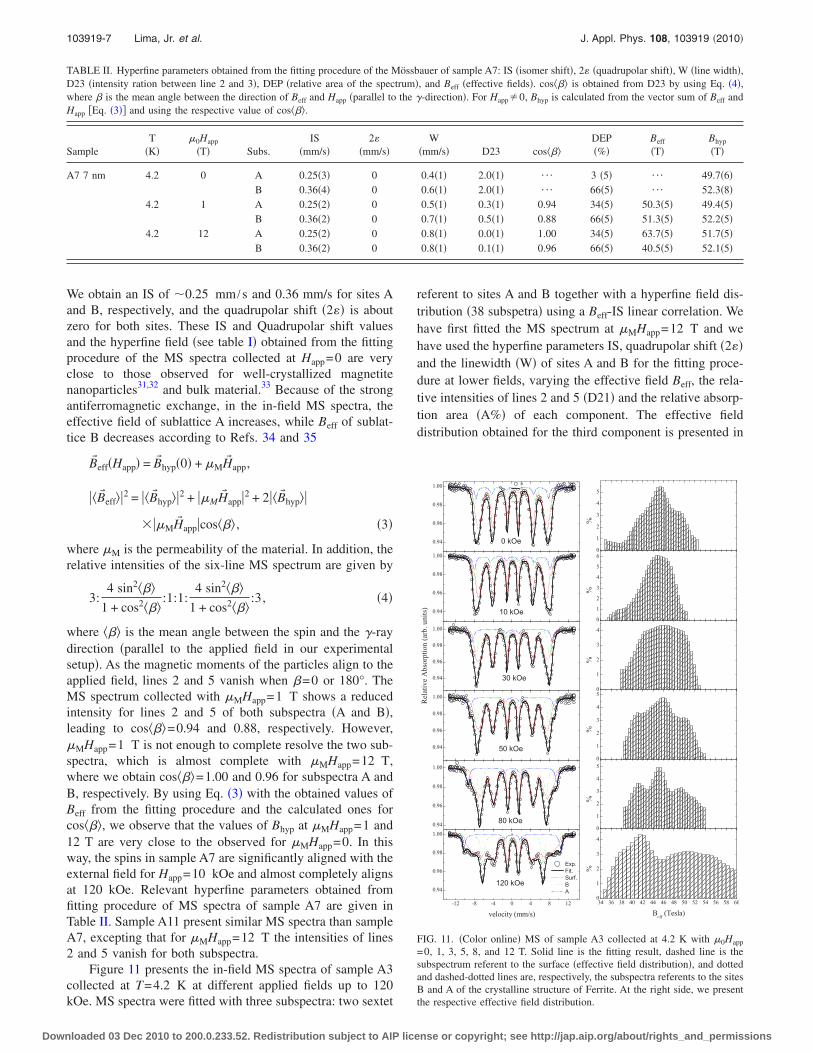
Figure 11 presents the in-field MS spectra of sample A3collected at T=4.2 K at different applied fields up to 120kOe. MS spectra were fitted with three subspectra: two sextet
referent to sites A and B together with a hyperfine field dis-tribution �38 subspetra� using a Beff-IS linear correlation. Wehave first fitted the MS spectrum at �MHapp=12 T and wehave used the hyperfine parameters IS, quadrupolar shift �2��and the linewidth �W� of sites A and B for the fitting proce-dure at lower fields, varying the effective field Beff, the rela-tive intensities of lines 2 and 5 �D21� and the relative absorp-tion area �A%� of each component. The effective fielddistribution obtained for the third component is presented in
TABLE II. Hyperfine parameters obtained from the fitting procedure of the Mössbauer of sample A7: IS �isomer shift�, 2� �quadrupolar shift�, W �line width�,D23 �intensity ration between line 2 and 3�, DEP �relative area of the spectrum�, and Beff �effective fields�. cos��� is obtained from D23 by using Eq. �4�,where � is the mean angle between the direction of Beff and Happ �parallel to the �-direction�. For Happ�0, Bhyp is calculated from the vector sum of Beff andHapp �Eq. �3�� and using the respective value of cos���.
SampleT
�K��0Happ
�T� Subs.IS
�mm/s�2�
�mm/s�W
�mm/s� D23 cos���DEP�%�
Beff
�T�Bhyp
�T�
A7 7 nm 4.2 0 A 0.25�3� 0 0.4�1� 2.0�1� ¯ 3 �5� ¯ 49.7�6�B 0.36�4� 0 0.6�1� 2.0�1� ¯ 66�5� ¯ 52.3�8�
4.2 1 A 0.25�2� 0 0.5�1� 0.3�1� 0.94 34�5� 50.3�5� 49.4�5�B 0.36�2� 0 0.7�1� 0.5�1� 0.88 66�5� 51.3�5� 52.2�5�
4.2 12 A 0.25�2� 0 0.8�1� 0.0�1� 1.00 34�5� 63.7�5� 51.7�5�B 0.36�2� 0 0.8�1� 0.1�1� 0.96 66�5� 40.5�5� 52.1�5�
0.94
0.96
0.98
1.00
0.94
0.96
0.98
1.00
0.94
0.96
0.98
1.00
0.94
0.96
0.98
1.00
0.94
0.96
0.98
1.00
-12 -8 -4 0 4 8 12
0.94
0.96
0.98
1.00
BCDEF
0 kOe0
1
2
3
4
5
%
10 kOe0
1
2
3
4
5
6
%
RelativeAbsorption(arb.units)
30 kOe0
1
2
3
4
%
50 kOe0
1
2
3
4
5
%
A
80 kOe0
1
2
3
4
5
%
Exp.Fit.Surf.BA
velocity (mm/s)
120 kOe
34 36 38 40 42 44 46 48 50 52 54 56 58 600
1
2
3
4
%
Beff (Tesla)
FIG. 11. �Color online� MS of sample A3 collected at 4.2 K with �0Happ
=0, 1, 3, 5, 8, and 12 T. Solid line is the fitting result, dashed line is thesubspectrum referent to the surface �effective field distribution�, and dottedand dashed-dotted lines are, respectively, the subspectra referents to the sitesB and A of the crystalline structure of Ferrite. At the right side, we presentthe respective effective field distribution.
103919-7 Lima, Jr. et al. J. Appl. Phys. 108, 103919 �2010�
Downloaded 03 Dec 2010 to 200.0.233.52. Redistribution subject to AIP license or copyright; see http://jap.aip.org/about/rights_and_permissions
the right column of Fig. 11, and it was associated to thesurface presenting a different magnetic order in comparisonto the ordered core �sites A and B�.
Sites A and B of sample A3 have similar hyperfine pa-rameters to those of sample A7, except by slightly smallereffective fields and wide linewidth. The effective field Beff ofsites A and B increases and decrease, respectively, almostlinearly with Happ, as expected because of the strong antifer-romagnetic exchange between these sublattices. The intensi-ties of lines 2 and 5 of components A and B are two withrespect to lines 3 and 4 for �MHapp=0 T �the value expectedfor a randomly oriented powder�, decrease for �MHapp
=1 T �1.4� and vanish for �MHapp�3 T. The values of Bhyp
at �MHapp�0 T, calculated from Beff and cos��� by usingEq. �3�, are close to the observed for Happ=0. At �MHapp
=0 T, the effective field distribution of the surface compo-nent presents a wide peak at Beff45–46 T. Increasing Happ
up to 30 kOe, we observe an enlargement of the Beff distri-bution, but a maximum at Beff45–46 T remains. For�MHapp=5 and 8 T, three maxima at Beff41–42, 45–46,and 49–50 T. Finally, at �MHapp=12 T, we observe a verybroad distribution with two maxima at Beff41–42 and49–50 T. The hyperfine parameters obtained for all Happ val-ues were: IS=0.30 mm /s, 2�=0 mm /s, and D23 variesaround 2. The broad effective field distribution of surfacecomponent and the values of D23 observed indicate that theangle �, between Bhyp and Happ in our experimental setup,covers the angular space between 0° and 180°, even at�MHapp=12 T, probably as a consequence of a random dis-tribution for the spins easy axis at surface of the particle.However, the increment of Happ leads to an increment in theorientation of surface spins with external region, despite it isfar from complete. In another way, the magnetic core of thenanoparticles, consisting in the sublattices A and B, is ori-ented with the external field for at �MHapp�3 T.
Concerning the relative absorption area of each compo-nent, we obtain 68%, 21%, and 11% for the surface, site Band site A components, respectively, for all Happ values.These results confirm that surface atoms are numericallydominant �about 69% of the Fe ions� and have a differentmagnetic order in comparison to the core �sites A and B�.
IV. DISCUSSION
Samples A11 and A7 present a high crystallinity degree,as verified from TEM and XRD analysis. MS values ob-served for sample A7 is large with respect to many samplespresented in the literature and it is similar to the value ob-served for 11 nm nanoparticles �sample A11� and it is not faraway from the bulk value, indicating the quasicomplete mag-netic ordering for this sample. In accordance, the thermaldependence of HC is the expected for a monodomain with anextrapolated value close to the expected for bulk magnetite atlow temperatures. In addition, the value of Keff obtained forsamples A11 and A7 from the Néel model applied to theac-susceptibility data are close to the magnetocrystalline an-isotropy constant of bulk magnetite �2–5�105 erg /cm3�,indicating no other contribution to the anisotropy for thesesystems, which is also corroborated on the f�T� curve of
sample A7 presented in the inset of Fig. 3�a�. In-field MSshows that nanoparticles of samples A7 and A11 are com-posed by the magnetic sublattices A and B antiferromagneti-cally coupled that are mostly aligned with at Happ=10 kOeand almost perfectly aligned at 120 kOe.
Nanoparticles of sample A3 also present an elevated de-gree of crystallinity, as evidenced from HRTEM. However,our results show a different magnetic behaviour for sampleA3 in comparison to the larger nanoparticles samples. Appar-ently, sample A3 exhibits typical MZFC�T� and MFC�T�curves. However, at low temperatures �T�10 K�, we ob-serve an increment in the f�T�, as consequence of an increas-ing in the energy barrier at this region �see inset of Fig. 3�b��.We can associate the maximum observed at 11–12 K �seeinset of Fig. 3�b�� to the blocking process of a ferromagneticordered region �core�, while the rise in the energy barrierindicates an increase in Keff at low temperatures associated tosurface effects, as also evidenced in the increase in HC�T�and HIrr�T� �see M�H� analyses�. The values of Keff and 0
obtained by Néel model from ac measurements for sampleA3 are slightly larger and faster, respectively, than those ob-served for sample A7. These parameters were obtained fromthe peak at ���T� curves, which are associated to the corecomponent, without or with a small contribution of the sur-face atoms. On the other hand, the surface moments insample A3 are also responsible of the reduced magnetization,the high-field linear susceptibility �10 K�T�40 K�, andthe high saturation field �higher than 120 kOe�. In-fieldMössbauer data also evidence a different hyperfine structurefor sample A3 in comparison to larger particle, with the fea-ture of two phases: a ordered phase with two sublattice �Aand B� antiferromagneticaly coupled associated to a core ofthe particle, and a different magnetic configuration where themagnetic moments are far to be completely aligned to theapplied field even at �MHapp=12 T associated to the surfaceof the particle.
The anomalous magnetic behavior observed for sampleA3 appears to be not compatible with well-crystalline nano-particles. Considering the diameter of the particle �3 nmfrom TEM analysis�, the interplanar distance for the ferritecrystalline structure �plane �311�� of 0.250 nm, and assuminga roughness of 1.5 times of the interplanar distance, by asimple geometric calculations we obtain that 66% of the at-oms are localized in the border of the particle. In fact, ac-cording to our fitting of in-field Mössbauer data, the contri-bution of the nonferrimagnetic component is 69% of ironions. This value is also in convergence when comparing theM90 kOe value �high field region� of sample A3 at 100 K withM90 kOe value of sample A11 at 100 K: about 70%. There-fore, the number of surface atoms in the 3 nm nanoparticlesgeometrically calculated is close to the values obtained byin-field Mössbauer and magnetization measurements. Thus,these results reinforce that the magnetic moments with amagnetic configuration distinct to the ferrimagnetic orderedcore in sample A3 are confined to the border of the particles.
The results pointed above explain the different magneticbehavior of 3 nm nanoparticles despite the crystallinity evi-denced by HRTEM and XRD analyses. The crystallinity ofsample A3 is also necessary to explain some characteristics
103919-8 Lima, Jr. et al. J. Appl. Phys. 108, 103919 �2010�
Downloaded 03 Dec 2010 to 200.0.233.52. Redistribution subject to AIP license or copyright; see http://jap.aip.org/about/rights_and_permissions
observed in the magnetic measurements at very low tempera-tures �T�10 K�: high field magnetization value in this tem-perature region, the blocking process of the ordered regionevidenced in the M�T�FC and M�T�ZFC curves, and the fittingwith Arrhenius Law of the maxima in ���T� curves. Theincrease in the magnetization observed at low temperature isprobably a consequence of a partial surface spin orderingprocess. At low temperatures, by influence of the crystallineanisotropy and exchange interaction, some of the surfacespins are incorporated to the magnetically ordered core, withdifferent behavior in comparison to some systems mentionedbefore.6,25,26 For intermediate temperatures, the thermal en-ergy is greater than exchange and anisotropy terms, and thecore behaves like a single domain independently to the sur-face. Finally, for T 200 K, the core starts to disorder. Crys-talline 5 nm magnetite nanoparticles were reported in theliterature, which shows high magnetization �about 60 emu/g�and low coercivity field at low temperatures without a con-siderable contribution of a disordered region.23 The differ-ences between the nanoparticles of Ref. 23 and our 3 nmnanoparticles consist in the particle size reduction from 5 nmto 3 nm leading to the increment in about 2 times in thesurface/volume ratio.
One possible spin configuration at the surface is a mag-netically disordered phase. A more complex magnetic ar-rangement, such as a noncollinear one, is another valid pos-sibility. Anyhow, this work clearly evidences the differentmagnetic behavior of the surface in comparison to the ferri-magnetic core, despite the crystallinity of the 3 nm nanopar-ticles confirmed by HRTEM images. This feature is pro-duced by topographical effects: the lattice relaxation of thelast or two atomic layers in the surface, the changes in theelectronic structure imposed by the border, the covalent bind-ing of the oleic acid, and/or the presence of vacancies ofoxygen in this region. However, magnetization measure-ments indicate a change at low temperature �T�10 K�,probably associated to an increment in the exchange interac-tion �which compete also with the thermal fluctuations� be-tween the surface atoms and the core, that continuously in-crease with decreasing T, overriding the surface anisotropy,and acts aligning the surface atoms to the external appliedfield.
We also notify that the reduction in the magnetic mo-ment of the 3 nm nanoparticles observed above 200 K in theac-susceptibility measurements is not associated to the sur-face atoms, whose the magnetic susceptibility is very smallat 100 K in comparison to the core. Probably, it is associatedto a reduction in the magnetic moment of the superparamag-netic core component, indicating a reduction in the orderingtemperature of the whole 3 nm nanoparticles.
V. CONCLUSIONS
Crystalline 3 nm, 7 nm, and 11 nm nanoparticles presentdistinct magnetic behaviour, as evidenced by magnetization,ac-susceptibility and in-field Mössbauer data. For sampleswith 7 and 11 nm particle sizes, we observe magnetic well-ordered systems, while for 3 nm sample we verify two dif-ferent magnetic components: a ferrimagnetic ordered core
and a surface with distinct magnetic configuration. We haveestimated by MS and magnetization measurements that, atlow temperatures, about 70% of Fe atoms are in the surfacemagnetic component, which coincide with geometrical cal-culation assuming that the last two atomic layers are in-volved in the magnetic surface behaviour. The high satura-tion and irreversibility fields in the M�H� loops of sample A3together with the spin misalignment at 120 kOe in the in-field MS of surface component indicate a high surface aniso-tropy for this component. We observe a recovering of themagnetic properties in this sample, such as magnetizationand susceptibility, in the magnetization measurements at lowtemperatures �T�10 K�. According our analyzes, the mag-netic properties of crystalline 3 nm nanoparticles are domi-nated by topographical characteristics at the surface, with areduction in the exchange contribution in surface regionagainst the thermal energy for T 10 K, and an increment ofthe surface anisotropy contribution. Moreover, we observe areduction in the magnetic order of the core for T 200 K.
ACKNOWLEDGMENTS
The authors are indebted to Dr. G. F. Goya and Dr. J.Arbiol for the TEM image of sample A3 presented in Fig.1�b�. E. Lima, Jr. �at 2007 and 2008� and M. E. Saleta thank,respectively, to the Brazilian agency FAPESP and Argen-tinean agency CONICET for their fellowships during thework of this paper. This work was supported by the Brazilianagency FAPESP, Argentinean agencies CONICET and Min-CyT, and by the Joined Project CAPES-MinCyT �Brazil-Argentina� BR/08/24.
1R. H. Kodama, A. E. Berkowitz, E. J. McNiff, Jr., and S. Foner, Phys. Rev.Lett. 77, 394 �1996�.
2R. H. Kodama, A. Salah, A. Makhlouf, and A. E. Berkovitz, Phys. Rev.Lett. 79, 1393 �1997�.
3B. Martínez, X. Obradors, L. I. Balcells, A. Rouanet, and C. Monty, Phys.Rev. Lett. 80, 181 �1998�.
4F. Gazeau, J. C. Bacri, F. Gendron, R. Perzynski, Y. L. Raikher, V. I.Stepanov, and E. Dubois, J. Magn. Magn. Mater. 186, 175 �1998�.
5E. Tronc, A. Ezzir, R. Cherkaoui, C. Chanéac, M. Nogués, H. Kachkachi,D. Fiorani, A. M. Testa, J. M. Grenèche, and J. P. Jovilet, J. Magn. Magn.Mater. 221, 63 �2000�.
6E. De Biasi, R. D. Zysler, C. A. Ramos, H. Romero, and D. Fiorani, Phys.Rev. B 71, 104408 �2005�.
7H. Kachkachi, A. Ezzir, M. Noguès, and E. Tronc, Eur. Phys. J. B 14, 681�2000�.
8R. D. Zysler, M. Vasquez-Mansilla, and D. Fiorani, Eur. Phys. J. B 41, 171�2004�.
9S. A. Makhlouf, F. T. Parker, F. E. Spada, and A. E. Berkowits, J. Appl.Phys. 81, 5561 �1997�.
10E. C. Sousa, C. R. Alves, R. Aquino, M. H. Sousa, G. F. Goya, H. R.Rechenberg, F. A. Tourinho, and J. Depeyrot, J. Magn. Magn. Mater. 289,118 �2005�.
11E. Winkler, R. D. Zysler, and D. Fiorani, Phys. Rev. B 70, 174406 �2004�.12R. D. Zysler, M. Vasquez-Mansilla, C. Arciprate, M. Dimitrijewits, D.
Rodriguez-Sierra, and C. Saragovi, J. Magn. Magn. Mater. 224, 39 �2001�.13H. R. Rechenberg, E. C. Souza, J. Depeyrot, M. H. Sousa, R. Aquino, F.
A. Tourinho, and R. Perzynski, Hyperfine Interact. 184, 9 �2008�.14S. Pal, P. Dutta, N. Shah, G. P. Huffman, and M. S. Seehra, IEEE Trans.
Magn. 43, 3091 �2007�.15T. N. Shendruk, R. D. Desautels, B. W. Southern, and J. van Lierop,
Nanotechnology 18, 455704 �2007�.16C. J. Serna, F. Bodker, S. Morup, M. P. Morales, F. Sandiumenge, and S.
Veintemillas-Verdaguer, Solid State Commun. 118, 437 �2001�.17P. Dutta, A. Manivannan, M. S. Seehra, N. Shah, and G. P. Huffman, Phys.
Rev. B 70, 174428 �2004�.
103919-9 Lima, Jr. et al. J. Appl. Phys. 108, 103919 �2010�
Downloaded 03 Dec 2010 to 200.0.233.52. Redistribution subject to AIP license or copyright; see http://jap.aip.org/about/rights_and_permissions
18J. Smit and H. P. J. Wijn, Ferrites �Philips’ Technical Library, Eindhoven,The Netherlands, 1959�.
19Y. Labaye, O. Crisan, L. Berger, J. M. Greneche, and J. M. D. Coey, J.Appl. Phys. 91, 8715 �2002�.
20A. G. Roca, J. F. Marco, M. del Puerto Morales, and C. J. Serna, J. Phys.Chem. C 111, 18577 �2007�.
21N. Pérez, P. Guardia, A. G. Roca, M. P. Morales, C. J. Serna, O. Iglesias,F. Bartolomé, L. M. García, X. Batlle, and A. Labarta, Nanotechnology19, 475704 �2008�.
22V. B. Barbeta, R. F. Jardim, P. K. Kiyohara, F. B. Effenberg, and L. M.Rossi, J. Appl. Phys. 107, 073913 �2010�.
23A. G. Roca, M. P. Morales, K. O’Grady, and C. J. Serna, Nanotechnology17, 2783 �2006�.
24P. Guardia, B. Batlle-Brugal, A. G. Roca, O. Iglesias, M. P. Morales, C. J.Serna, A. Labarta, and X. Batlle, J. Magn. Magn. Mater. 316, e756 �2007�.
25E. De Biasi, C. Ramos, R. D. Zysler, and H. Romero, Phys. Rev. B 65,144416 �2002�.
26E. Winkler, R. D. Zysler, M. Vasquez Mansilla, and D. Fiorani, Phys. Rev.
B 72, 132409 �2005�.27S. Sun, H. Zeng, D. B. Robinson, S. Daoux, P. M. Rice, S. X. Wang, and
G. Li, J. Am. Chem. Soc. 126, 273 �2004�.28S. Sun and H. Zeng, J. Am. Chem. Soc. 124, 8204 �2002�.29J. M. Vargas and R. D. Zysler, Nanotechnology 16, 1474 �2005�.30B. D. Cullity, Elements of X-Ray Diffraction �Addison-Wesley, Reading,
Massachusetts, 1978�.31E. Lima, Jr., J. M. Vargas, H. R. Rechenberg, and R. D. Zysler, J. Nanosci.
Nanotechnol. 8, 5913 �2008�.32E. Lima, Jr., A. L. Brandl, A. D. Arelaro, and G. F. Goya, J. Appl. Phys.
99, 083908 �2006�.33L. F. Gamarra, G. E. S. Brito, W. M. Pontuschka, E. Amaro, A. H. C.
Parma, and G. F. Goya, J. Magn. Magn. Mater. 289, 439 �2005�.34C. N. Chinnasamy, A. Narayanasamy, N. Ponpandian, K. Chattopadhyay,
H. Guérault, and J.-M. Grenèche, J. Phys.: Condens. Matter 12, 7795�2000�.
35N. N. Greenwood and T. C. Gibb, Mössbauer Spectroscopy �Chapman andHall, London, 1971�.
103919-10 Lima, Jr. et al. J. Appl. Phys. 108, 103919 �2010�
Downloaded 03 Dec 2010 to 200.0.233.52. Redistribution subject to AIP license or copyright; see http://jap.aip.org/about/rights_and_permissions
Copyright © 2022 FDOKUMEN