Waves on Elastic Rods and Helical Spring Problems - CiteSeerX
Upload
independentCategory
view
0download
0
arX
iv:1
002.
0512
v1 [
cond
-mat
.sof
t] 2
Feb
201
0
Surface and smectic layering transitions in binary mixtures of parallel hard rods
Daniel de las Heras∗
Departamento de Física Teórica de la Materia Condensada,Universidad Autónoma de Madrid, E-28049 Madrid, Spain
Yuri Martínez-Ratón†
Grupo Interdisciplinar de Sistemas Complejos (GISC), Departamento de Matemáticas,Escuela Politécnica Superior, Universidad Carlos III de Madrid,Avenida de la Universidad 30, E–28911, Leganés, Madrid, Spain
Enrique Velasco‡
Departamento de Física Teórica de la Materia Condensada and Instituto de Ciencia de Materiales Nicolás Cabrera,Universidad Autónoma de Madrid, E-28049 Madrid, Spain
(Dated: February 2, 2010)
The surface phase behavior of binary mixtures of colloidal hard rods in contact with a solidsubstrate (hard wall) is studied, with special emphasis on the region of the phase diagram thatincludes the smectic A phase. The colloidal rods are modelled as hard cylinders of the same diameterand different lengths, in the approximation of perfect alignment. A fundamental–measure densityfunctional is used to obtain equilibrium density profiles and thermodynamic properties such assurface tensions and adsorption coefficients. The bulk phase diagram exhibits nematic-smectic andsmectic-smectic demixing, with smectic phases having different compositions; in some cases they aremicrofractionated. The calculated surface phase diagram of the wall-nematic interface shows a veryrich phase behavior, including layering transitions and complete wetting at high pressures, wherebyan infinitely thick smectic film grows at the wall via an infinite sequence of stepwise first–orderlayering transitions. For lower pressures complete wetting also obtains, but here the smectic filmgrows in a continuous fashion. Finally, at very low pressures, the wall-nematic interface exhibitscritical adsorption by the smectic phase, due to the second-order character of the bulk nematic-smectic transition.
PACS numbers: 64.70.M-,61.30.Hn,61.20.Gy
I. INTRODUCTION
The wetting behavior of molecular smectic (S) liquidcrystals in contact with a solid substrate [1–5] or at theirvapor-liquid crystal interfaces [6–10] has been an activeresearch area since the 80’s. Partial or complete wet-ting behaviors of the S phase have been found when theisotropic (I) or nematic (N) phases are stable at bulk.Some liquid crystals exhibit a sequence of first-order lay-ering transitions on decreasing the temperature slightlyabove the IS or NS bulk transition temperatures [1–10],indicating that the partial and complete wetting régimescan be mediated by a finite (or infinite) sequence of step-wise layer-adsorption transitions.
Usually the wetting behavior depends on specific in-teractions between the surface and the liquid crystalmolecules, and molecular characteristics such as dipolesor length of alkyl chains. Depending on the strength ofthe interactions, solid substrates inducing orientationalordering of molecules may favor partial or complete wet-ting of the substrate by the N or S phases when the I
∗Electronic address: [email protected]†Electronic address: [email protected]‡Electronic address: [email protected]
phase is stable at bulk, while those substrates promotingorientational disorder favor partial wetting behavior.
Freely-suspended smectic films, consisting of a fewsmectic layers surrounded by vapor (V), are formed bysome liquid crystals and constitute another example ofphase transitions induced by the presence of a surface.These films exhibit the so-called thinning transitionswhereby the film thickness decreases stepwise as one orseveral layers (depending on the film heating rate) melt[11–13].
As usual in statistical mechanics, lattice models werethe first to be applied to the study of the surface phasebehavior of smectic liquid crystals. For example, a ver-sion of the Lebwohl-Lasher model, extended to includethe smectic phase, was used to study the systematics oflayering phenomena [14].
Density-functional theory (DFT) has been also suc-cessfully applied to the study of the surface phase be-havior in liquid crystals adsorbed on solid substrates.The extension of the MacMillan theory to non-uniformphases with the inclusion of surface interaction potentialsaccounted for layering and thinning transitions [15, 16].However, DFT models that incorporate repulsive inter-actions (reflecting molecular volume and shape) using ei-ther the Local- (LDA) [17] of Weighted-Density Approx-imation (WDA) [18], plus anisotropic attractive interac-tions via a mean-field approximation, turned out to be

2
more realistic models for the calculation of surface phasediagrams. This is due to the fact that (i) the liquid crys-tal bulk phase behavior (e.g. values of coexistence den-sities and orientational order parameters) is better cal-culated from DFT, and (ii) interfacial properties, suchas the width of the interface or the oscillatory behaviorof the density profiles, are much better accounted for,due to the proper inclusion of pair correlations betweenparticles.
For example, the wetting behavior of a smectic filmin contact with an attractive wall has been successfullystudied in Ref. [19], where the authors found complete orpartial wetting by smectic depending on the strength ofthe external potential. A infinite (complete wetting) orfinite (partial wetting) sequence of layering transitionswas found, some of them ending in a prewetting line.Layering transitions at the V-I interface near the V-I-Striple point, and thinning transitions in freely-suspendedsmectic films, have been successfully studied using similarversions of DFT based on WDA and perturbation theory[20].
Finally, recent theoretical works have applied relatedmodels for hard rods in contact with a wall and/or con-fined between two walls. These studies were based ondifferent approximations: Onsager with restricted orien-tations [21, 22], Onsager with Parsons-Lee rescaling andfree orientations [23, 24] and also a WDA functional ap-proximation [25, 26]. The surface phase diagram of a fluidof hard spherocylinders in contact with a single wall pro-moting different surface anchoring was analysed in Ref.[23]. In Refs. [25, 26] the surface phase diagram obtainedfor the confined fluid includes capillary nematization andsmectization of the fluid, and a sequence of layering tran-sitions of the confined smectic as the width of the slit poreis changed.
Practically all the experimental work on the wettingbehavior of liquid crystals has been focused on one-component systems, the extension to mixtures being apending issue. Adsorption phenomena in liquid crystalmixtures have a fundamental interest since bulk demix-ing transitions between two phases, at least one of thembeing smectic, would add much more complexity to thesurface phase behavior. A recent theoretical work, basedon Onsager theory, has analysed the phase behavior ofthe I-N interface of binary mixtures of hard spherocylin-ders [27]. Also, the substrate-isotropic interface of amixture of hard parallelepipeds has been studied withinthe Zwanzig approximation [28]. However, it would beinteresting to extend these studies to the high-pressurerégime, where the smectic phase is stable.
One of the aims of the present work is to elucidatethe role of the smectic phase in the interfacial phase be-havior of binary mixtures. Recent theoretical models ofmixtures of colloids (spherical or rod-like) and polymers[29–32] (based on the model proposed in Ref. [33] oron the recent fundamental-measure functional for hard-sphere/hard-needle mixtures [34]) have shown that theentropic character of particle interactions, together with
the coupling between species generated by the externalsurface potential, results in a rich phase behavior. Forhigh polymer fugacities, partial wetting of the interfacebetween the substrate and the fluid poor in colloidal par-ticles by the fluid rich in colloidal particles was obtained.In the partial wetting régime, a sequence of up to fourlayering transitions was found. At lower fugacities com-plete wetting is reached via a first-order wetting transi-tion (located below the critical point). These results wereconfirmed by Monte Carlo (MC) simulations [35].
Colloidal rod-like fluids and their mixtures are paradig-matic systems exhibiting liquid-crystal textures similarto those of molecular fluids, but the interaction betweentheir components have an entropic origin due to short-ranged repulsive forces. Intense experimental work onpure and mixed suspensions has been done in the lasttwo decades, demonstrating this analogy [36]. Also, re-cent work has shown the importance of smectic layeringin the kinetics of the NS phase transition in colloidalrods [37], confirming the analogy between molecular andcolloidal fluids as regards the surface-enhanced smecticordering near a bulk phase transition.
The aim of the present article is to theoretically anal-yse the surface phase diagram of a colloidal binary mix-ture of rods with the same breath but different lengthsLi (i = 1, 2); in the following we use a length ratios = L2/L1 = 3, with short species being labelled as 1and the long species as 2. Particles interact through ahard repulsive potential and are constrained to be per-fectly aligned along a nematic director, with their mainaxes perpendicular to a hard wall (W), thus simulatingperfect homeotropic anchoring. This restriction, whichconsiderably simplifies the model, is valid as long as oneis only interested in the surface phase behavior of parti-cles exhibiting a high degree of orientational order. Thestudy concerns the wetting properties of these mixtureswhen a smectic film partially or completely wets theWN interface. Our theoretical tool is based on density-functional theory, more specifically on a recently pro-posed Fundamental-Measure Functional (FMF) for bi-nary mixtures of parallel hard cylinders [38].
The impact of restricted orientations was analysed byShundyak and van Roij in the context of the Onsagertheory [39], using the Zwanzig model (discrete orienta-tions). It was found to lead to spurious nematic phaseswith very high orientational order. Smectic phases werenot analysed by Shundyak and van Roij but spurioussmectic phases might well exist in Onsager theory. Theparallel particle approximation implicit in the FMF ap-proach is not expected to lead to any such anomalousphases, since the FMF theory contains a much bettertreatment of correlations, hence of the ordered phases.
As we will see later, the surface phase diagram of themodel exhibits three different wetting behaviors depend-ing on the value of pressure: (i) At high pressure p wefind complete wetting by smectic via an infinite sequenceof layering transitions as the nematic binodal of the bulkNS transition is approached. These layering transitions

3
end in corresponding surface critical points characterised
by values of critical pressure p(n)c , n = 1, 2, .... (ii) For
sufficiently low pressure such that p < p(n)c , ∀n, wetting
by the smectic film becomes continuous, with adsorptioncoefficients diverging logarithmically. And (iii) for pres-sures below the tricritical point, where the bulk NS tran-sition changes from first to second order, we find criticaladsorption by smectic. In this case a modified adsorp-tion coefficient diverges logarithmically on approachingthe second-order bulk NS transition. This divergence isa direct consequence of the NS bulk correlation lengthdiverging at the transition.
The article is organized as follows. Sec. II is devotedto the presentation of the theoretical model and the nu-merical details relevant for the calculation of the bulk(Sec. II A) and surface phase diagrams (Sec. II B). InSec. III we present the results obtained from numericalfunctional minimization. This section is divided into Sec.III A, where the phase behavior of this particular mixtureis described, Sec. III B, which contains a description ofthe layering transitions, and Sec. III C, devoted to thestudy of the wetting behavior. Finally some conclusionsare drawn in Sec. IV. Two appendices are included whichcontain mathematical details on the bifurcation analy-sis (Appendix A) and the derivation of the interfacialGibbs-Duhem relation with composition and pressure asindependent variables (Appendix B).
II. THEORETICAL MODEL
Our particle model consists of a binary mixture of par-allel hard cylinders, with both species having the samediameter, D1 = D2 = D, chosen so as to set the ratioof transverse particle area and cylinder length squaredof the short species to unity, i.e. πD2/4L2
1 = 1. Thisimplies a particle aspect ratio of L1/D1 = 0.89. Sincewe choose a length ratio s ≡ L2/L1 = 3, the aspectratio of the other particle is L2/D2 = 2.66. As density-functional theory and simulations show, a one-componentfluid of parallel hard cylinders presents a phase sequencenematic-smectic-crystal, which is independent of the as-pect ratio. The smectic phase of freely rotating hardspherocylinders is known to begin for aspect ratios >∼ 4.1,and we should expect a similar behavior for freely rotat-ing hard cylinders. Since the phase behavior of a binarymixture of parallel particles with identical diameters butdifferent lengths depends only on the ratio L2/L1, ourmodel might describe a freely rotating binary mixture ofcylinders with aspect ratios L1/D1 > 4.1 and L2/L1 = 3,both of which would have a smectic phase. Therefore,our choice guarantees that, in the one-component limits,the mixture would possess stable smectic phases at highenough pressure in the freely-rotating case.
A. Bulk smectic phase
A fundamental-measure density-functional theory forbinary mixtures, in the version proposed in [38] andtested against MC simulations in [40], will be used in allcalculations. We will consider a mixture which presents anon-uniform structure along the z direction. The excessfree-energy density reads
ΦL31 = n
− ln (1− η) +3η
1− η+
η2
(1− η)2
, (1)
where we drop the z-dependence for the sake of conve-nience and have defined the weighted densities
n(z) =1
2
∑
i
[ρ∗i (z − κi/2) + ρ∗i (z + κi/2)] , (2)
η(z) =∑
i
∫ z+κi/2
z−κi/2
ρ∗i (z′)dz′, (3)
with η(z) the local packing fraction of the mixture. In-dex i in all sums is assumed to run for i = 1, 2. We havedefined the dimensionless densities ρ∗i (z) = ρi(z)L
31, and
z coordinates are also in units of L1. The κi parame-ter is the particle length of species i in the same units.Our choice for Li gives κ1 = 1 and κ2 = s = 3. Thefree-energy functional per unit area can be calculated asβF/A =
∫
dz [Φid(z) + Φ(z)], with β−1 = kBT the in-verse thermal energy and
Φid(z) =∑
i
ρi(z) [lnViρi(z)− 1] , (4)
the ideal part of the free-energy density, where Vi is thethermal volume of species i. Now we specify for the smec-tic phase, which is the lowest symmetry phase consideredin this work and has the property ρi(z + kd) = ρi(z)(with d the smectic period and k ∈ Z). The pressure ofthe mixture can be calculated as
βpL31 = d−1
∫ d
0
n(z)
1− η(z)+
3n(z)η(z)
[1− η(z)]2
+2n(z)η(z)2
[1− η(z)]3
dz. (5)
During the numerical minimization we have used the fol-lowing constraints: (i) the value of the pressure p is fixed,and (ii) the composition of the mixture, x ≡ x1 = ρ1/ρ,is also set in advance. Here ρ = ρ1 + ρ2 is the totalmean density (calculated from the constant-pressure con-
straint), while ρi = d−1∫ d
0ρi(z)dz is the mean density of
the i-th species. The Gibbs free-energy functional perparticle, defined as
βg[ρ1, ρ2] = ρ−1
d−1
∫ d
0
[Φid(z) + Φ(z)] dz + βp
, (6)

4
has been minimized with respect to the densities ρi(z).We do this numerically by first discretising the densi-ties, defining a grid with points zk = z0 + k∆ (k =0, ..., N), and then minimising the function g(ρ1,ρ2)with respect to the components of the vectors ρi =[ρi(z0), · · · , ρi(zN )], and also with respect to d, using aconjugate-gradient algorithm. N is the number of gridintervals. The width of the intervals was taken to be∆/L1 = 0.01, and N∆ = md, where m is the numberof smectic periods within the minimization box. Varyingx between 0 and 1 and using the common-tangent con-struction for the function βg(x), we have calculated thecoexistence values for x and ρ. Repeating the above pro-cedure for different pressures, we obtained the demixingbinodals.
When the NS transition is of the second order, one canuse a bifurcation analysis to find the total packing frac-tion η =
∑
i ρ∗i κi and the smectic period d at bifurcation
(the local and total packing fractions are equal in thenematic phase. In the smectic phase the average of thelocal fraction η(z) over one period gives the total packingfraction η). Also, with the aim to check the relative sta-bility of the S with respect to the columnar (C) phase, weextended the bifurcation analysis to include the colum-nar symmetry. For this purpose we need to solve thefollowing set of equations:
H(q, η) = 0, ∇H(q, η) = 0, (7)
where the wave vectors q = (0, q) and q = (q⊥, 0) are ap-propriate for the S and C symmetries, respectively. Theseequations have to be solved for the absolute minimum ofH(q, η) ≡ det[H(q, η)] as a function of q, with H(q, η) a2× 2 matrix defined by the elements
H(q, η) =
1− ρ1c11(q, η) −ρ1c12(q, η)
−ρ2c12(q, η) 1− ρ2c22(q, η)
, (8)
with cij(q, η) the Fourier transforms of the direct cor-relation functions calculated from the second functionalderivatives of the free energy functional βF [ρi] with re-spect to ρi(r) and ρj(r
′). Expressions for these functionsand explicit results for the NS and NC spinodals can befound in Appendix A.
B. Wall-fluid interface
The aim is to calculate the equilibrium density profilesof the two species in the presence of a hard wall. Thewall is located at z = 0 and the long axes of cylindersare perpendicular to the wall. Thus, perfect homeotropicalignment of the nematic director is assumed. This modelmay apply to experimental systems where homeotropicanchoring is forced by surface treatment [41–44] or by theapplication of an external field (see [45] for an exampleon colloidal discs).
The values of the chemical potentials of the two compo-nents, µi, will be fixed, which means that the conditionsof the bulk fluid, far from the wall, will be specified in ad-vance and maintained fixed during the minimisation. Weminimise the grand potential functional per unit area,
Ω[ρi]
A=
F [ρi]
A+∑
i
∫
[vi(z)− µi] ρi(z)dz, (9)
with respect to the density profiles ρi(z). The externalpotentials are defined by
βvi(z) =
∞, z ≤ Li/2,
0, z > Li/2,i = 1, 2. (10)
To numerically implement the minimization we proceedby first choosing values for the pressure p and the com-position of the mixture at bulk, x, and from here calcu-lating the chemical potentials µi and the dimensionlesstotal density ρ∗ = ρL3
1 at an infinite distance from thewall, using the following expressions, which apply to thebulk nematic phase:
βpL31 =
ρ∗(1 + η)
(1 − η)3, (11)
and
βµi = lnxi + ln
(
ρ∗
1− η
)
+η(3− 2η)
(1− η)2
+ρ∗(4− 3η + η2)
(1− η)3κi, i = 1, 2. (12)
The implicit Eqn. (11) has to be solved iteratively toobtain ρ∗. In the minimisation the usual boundary con-ditions at a large distance H from the wall, ρi(H) = xiρ,have to be imposed. H , the width of the minimiza-tion box, is chosen in such a way as to guarantee thatthe structure of the WN interface can be accommodatedwithin the box and at the same time the boundary con-ditions are satisfied. Finally, the surface tension of the
interface is calculated as γWN = Ω[ρ(e)i ]/A + pH , with
ρ(e)i the equilibrium density profiles.
One of our aims is to obtain the wetting behaviour ofthe mixture when nematic conditions are fixed at bulkand the NS demixing transition is approached. Thismeans that we need to calculate the surface tension ofthe WS interface for values of the chemical potentials µi
corresponding to NS coexistence. Therefore µi can becalculated from Eqn. (12). However, if the bulk phase isa smectic, and consequently the density profiles are notuniform in bulk, the boundary conditions depend on theparticular value of H chosen, which considerably compli-cates the numerical minimization. To avoid this problem,we choose to define a symmetric box by using the follow-

5
ing external potentials:
βvi(z) =
∞, z ≤ Li/2,
0, Li/2 < z < H − Li/2,
∞, z ≥ H − Li/2.
(13)
We minimize Ω[ρi] with respect to ρi(z) by choosing Hlarge enough to accommodate two WS interfaces. How-ever, due to long-ranged commensuration effects gener-ated by the confinement of a layered phase with periodd in a slit of width H , the minimized grand potentialexhibits an oscillatory behavior as a function of H , withan asymptotically decaying amplitude. To overcome thisproblem, we defined the curve obtained from the local
minima of Ω[ρ(e)i ]/A and extrapolated to H → ∞ to
obtain the value of 2γWS (i.e. two times the surface ten-sion of the WS interface).
To find the surface tension of the NS interface we fol-lowed a similar procedure: we defined a box of width H
with boundary conditions ρi(0) = ρi(H) = ρ(N)i (the den-
sities of the bulk nematic phase coexisting with smectic)at both ends of the box. Choosing an initial guess forρi(z), 0 < z < H (close to the profiles of the coexistingbulk smectic phase), we minimized the grand potential toobtain 2γNS (i.e. two times the surface tension of the NSinterface). Again the value of H has to be large enoughto accommodate two NS interfaces. Having the surfacetensions of all the three different interfaces, one can studythe wetting behavior of the system, which is discussed inSec. III C.
Adsorption coefficients will also be used as a convenientmeasure of the wetting and adsorption properties of theWN interface. The adsorption coefficients of both speciesare defined as
Γi =
∫ H
0
[
ρi(z)− ρ(N)i
]
dz, i = 1, 2. (14)
In Appendix B a derivation is presented of the interfacialGibbs-Duhem relation expressed in terms of the indepen-dent variables x and p. Using this equation, a relationbetween the derivative of γWN with respect to the com-position variable x and the adsorption coefficients can beobtained:
βdγWN
dx= U(x, p)
(
Γ2
1− x−
Γ1
x
)
, (15)
where U(x, p), a function of bulk composition and pres-sure, is always positive if the binary mixture is stableagainst NN demixing. This relation has been tested (seeAppendix B) to check for consistency of our numericalminimization procedure. Also, the sum rule relating thebulk pressure with the densities at the wall (contact the-orem), βp = ρ1(L1/2)+ρ2(L2/2), which is automaticallysatisfied by the functional, provides another check for nu-merical accuracy. For example, for a mixture with bulk
pressure βpL31 = 1 and composition x = 0.82, we obtain
(ρ1(L1/2) + ρ2(L2/2))L31 = 0.994, 0.997 and 0.999 for
values of the discretisation interval along the z axis of∆L−1
1 = 0.0100, 0.0050 and 0.0025, respectively (obvi-ously, in the limit where ∆z → 0, the sum rule becomesexact).
III. RESULTS
This section is devoted to the presentation of the re-sults obtained from our theoretical model. It is dividedinto three different sections. In Sec. III A we presentand describe the main features of the bulk phase dia-gram. Secs. III B and III C are devoted to the layeringtransitions and to the wetting behavior, respectively.
A. Bulk phase diagram
The bulk phase diagram of the binary mixture, shownin Fig. 1, has been calculated using bifurcation analy-sis and density-functional minimization, as described inSec. II A. Two NS spinodals (dashed curves in Fig. 1),calculated from the bifurcation analysis, depart from theone-component limits x = 0 and x = 1 (where, as definedabove, x is the composition of the mixture as given bythe fraction of short particles). The values of pressure inboth spinodals increase as the composition of the mix-ture becomes farther from these limits, indicating thatthe two species cannot be easily accommodated into asmectic arrangement. The spinodal lines end in a tri-critical point (filled circle) and a critical end point (filledsquare), respectively. Functional minimization indicatesthat the Gibbs free energy of the smectic phase is al-ways a convex function of composition x in the neigh-bourhood of (and above) these lines, which proves thatthe NS transition is of second order, with the smecticorder parameter increasing from zero at the bifurcation.For pressures above the tricritical point but below thecritical end point, the mixture segregates into a smecticphase rich in the long species and a nematic phase richin the short species.
Two different smectic phases occur in the region ofsmectic stability. These phases are distinguished by therelative location of the density peaks of the two species.In the smectic phase labelled as S1 the profiles are inphase, with density peaks of the two species located atthe same positions, which define the location of the smec-tic layers. In the phase called S2 the density profilesare out of phase, forming alternating smectic layers: thisphase exhibits microfractionation [46–48]. The smecticmixtures with a higher fraction of species 1 (the shortcomponent) are denoted with a prime in Fig. 1. Exam-ples of density profiles corresponding to these two smec-tic phases are shown in Figs. 2(a)-(d). Several regionsof smectic coexistence exist in the mixture: S1-S2 in anarrow pressure interval between a critical and a triple

6
0 0.2 0.4 0.6 0.8 1x
0
0.5
1
1.5
2
βpL
13 S1S2
S1’
S2’
N
FIG. 1: (Colour online). Bulk phase diagram of the binarymixture of parallel hard cylinders in the reduced pressureβpL3
1–composition x plane (with x = x1, the fraction of shortparticles). Dashed curves represent second-order NS tran-sitions, while solid lines are the binodals of the NS or SSdemixing transitions. The shaded area is the region of in-stability. Stability regions of nematic and different smecticphases are denoted by letters (see text). Colour lines indicatethe conjectured wetting behaviour along the NS lines: criticaladsorption (red), complete wetting by S2 smectic phase with-out layering transitions (blue), and complete wetting by S1
phase mediated by layering transitions (green). Circles: crit-ical points. Square: critical end-point. Triangle: tricriticalpoint.
point, S′1-S
′2 in a corresponding interval between critical
and triple points, and S1-S′1 and S1-S
′2 coexistences at
high pressure (triple points have been indicated by hori-zontal dashed lines in the figure).
We now comment on the possible stability of thecolumnar phase. A complete calculation of the stabil-ity of the columnar phase by free-energy minimisation is,at present, a highly difficult task. The difficulties stemfrom the computation of two-particle weighted densities[38]. Therefore, we have implemented a bifurcation anal-ysis, which gives the conditions under which the nematicphase becomes unstable with respect to columnar-likefluctuations. As shown in Appendix A, the NC spinodal,signalling the instability of the nematic phase againstcolumnar-like fluctuations, is always located above theNS spinodal for all values of composition. This is an in-dication that at least part of the phases depicted in thephase diagram of Fig. 1 could be stable, and that the sur-face behaviour to be described below could represent thereal surface behaviour of the model. However, one has tobe cautious, since a first-order nematic-columnar and/orsmectic-columnar phase transition could be greatly dis-placed with respect to the spinodal lines. Experimen-tally, rod-like colloidal particles always have some degreeof polydispersity. Diameter polydispersity would tend todestabilise the columnar phase against the smectic phase,while breadth polydispersity would have the opposite ef-
0 0.2 0.4 0.6 0.8 1z/d
0
0.1
0.2
0.3
ρL13
0
0.2
0.4
0.6
0.8
1
ρL13
(a)
(b)
0 0.2 0.4 0.6 0.8 1z /d
0
0.2
0.4
ρL13
0
0.1
0.2
0.3
0.4
ρL13
(c)
(d)
FIG. 2: Density profiles of (a) S1, (b) S2, (c) S′2 (c), and (d)
S′1 phases in one smectic period. Values of smectic period
are: (a) d/L1 = 3.495, (b) 3.835, (c) 1.433, and (d) 1.237.In all figures solid and dashed curves correspond to species2 and 1, respectively. Values of reduced pressure and com-position, (βpL3
1, x), are: (a) (1.20, 0.06), (b) (1.04, 0.28), (c)(1.75, 0.83), and (d) (1.75, 0.88).
fect [49]. The final balance may depend on several effectsin a delicate manner. Therefore, one has to be cautiousuntil the following aspects are considered: (i) particlepolydispersity in length and breadth, and (ii) full mini-mization of the density functional with respect to densityprofiles having columnar symmetry. We do not pursuethis analysis here, which is left for future work.
B. Layering transitions
In this section, which constitutes the cornerstone of thepresent work, we present a detailed study of the layeringtransitions in the mixture. The stable bulk phase (inthe region infinitely away from the wall) will be chosento be a nematic phase, characterised by particular val-ues of pressure and composition. We first consider thecase where the pressure is given a value βpL3
1 = 1.30 andthe bulk composition x is decreased from a high valueclose to unity. As the nematic branch of the NS1 bin-odal is approached, a sequence of layering transitions isfound. At each of these transitions a new smectic layer,mostly composed of particles of the long species, appearsthrough a first-order (interfacial) phase transition. Thisis illustrated in Fig. 3, where four equilibrium WN in-terfaces containing 0, 1, 2 and 3 smectic layers composed(essentially) of particles of species 2 are shown. Thesestructures will be denoted by WNi, with i the number ofadsorbed layers.
The structure of the WN0 interface is interesting.Right at the wall there is a mixture of highly localisedlong and short particles with similar densities. For in-creasing distance from the wall the density structure be-comes much weaker [see Fig. 3(a)]. At the first (WN0-

7
0
0.4
0.8
1.2ρL
13
0 10 20z/L
1
0
0.4
0.8
1.2
ρL13
0 10 20 30z/L
1
(a)
(b)
(c)
(d)
WN0
WN1
WN2
WN3
FIG. 3: Density profiles of species 1 (dashed line) and 2 (solidline) for βpL3
1 = 1.30 and (a) x = 0.6800, (b) 0.6400, (c)0.61400 and (d) 0.6120 (coexistence value of composition isxcoex = 0.6115). The symbol WNi (i = 1, 2, 3...) denotes theinterfacial structure containing i adsorbed layers.
WN1) layering transition, the wall becomes fully coveredby long particles and a single very high density peak ap-pears [Fig. 3(b)]. On further decreasing x, the system ex-hibits a sequence of phase transitions, WNi-WNi+1, eachinvolving the addition of a further highly localised peakof the long particles. At x = xcoex = 0.6115 (the com-position of the bulk nematic phase coexisting with theS1 phase at bulk), the wall is completely wet by the S1
phase, which means that a macroscopically thick smec-tic film (consisting of an essentially infinite number ofsmectic layers) is interposed between the wall and thenematic phase. We have found up to 12 layering transi-tions as x → xcoex with x > xcoex. Access to higher-orderlayering transitions was not possible within the accuracyof our numerical procedure.
In Fig. 4 the behavior of the WN surface tensionγ = γWN, as a function of composition, is shown. Thelocation of the WNi−1–WNi layering transition is ob-tained from the intersection of the surface tensions cor-responding to the two structures. The surface tensionof the WN0 structure, shown in the inset, is somewhatpeculiar: just before the WN0–WN1 layering transition,the surface tension exhibits a maximum. This behaviorcan be explained by resorting to Eqn. (15) and not-ing that the surface tension slope is exactly zero at x∗ =
Γ1/(Γ1+Γ2) = ρ1/(ρ1+ρ2), where ρi = H−1∫ H
0ρi(z)dz,
i.e. when the composition of the mixture at bulk coin-cides with its interfacial value. If x > x∗, i.e. when theinterfacial composition is lower than the bulk value, theslope of the surface tension is positive, while the oppositeoccurs for x < x∗.
The adsorption coefficients Γi, defined in (14), are plot-ted in Fig. 5 as a function of x. As can be seen, Γ2
abruptly increases at the layering transitions while Γ1
abruptly decreases, i.e. the WN interface exhibits ad-
0 0.004 0.008 0.012 0.016x-x
coex
0.18
0.185
0.19
0.195
0.2
0.205
β γ L
12
0.05 0.1 0.15
0.24
0.26 WN0
WN1
WN2WN3
WN4
WN1
FIG. 4: Surface tension of the wall-nematic interface versuscomposition x−xcoex for reduced pressure βpL3
1 = 1.3. Sym-bols WNi denote the different branches corresponding to wall-nematic interfaces containing i adsorbed smectic layers. Theinset shows the surface tensions for the WN0-WN1 surfacephase transition.
sorption of the long species and desorption of the smallspecies. This is the natural interfacial path that con-nects a nematic phase located far from the wall, and richin short particles, with a smectic film located next to thewall, and rich in long species, as x → xcoex.
Repeating the same calculations, but at a lower valueof pressure, βpL3
1 = 1.15, we find that the first two layer-ing transitions disappear, while the higher-order transi-tions WNi−1–WNi, with i > 2, remain. Fig. 6(b) showsthat, although the WN0–WN1 and WN1–WN2 transi-tions are absent, the adsorption coefficients significantlyincrease in the neighborhood of the transition points cor-responding to a higher pressure. This behavior is consis-tent with the occurrence of critical points for the WN0–WN1 and WN1–WN2 transitions at critical pressures inthe interval 1.15 < βpL3
1 < 1.30. Fig. 6(a) shows a par-tial sequence of layering transitions involving up to 12surface layers (the maximum number that our numericalscheme can deal with). It is reasonable to think that thelayering transitions will continue up to the bulk transi-tion in infinite number (complete wetting scenario).
A surface phase diagram that includes the first fourlayering transitions is shown in Fig. 7. The followingtrends can be extracted from the figure: (i) all layeringtransition curves approach the nematic binodal as thepressure is increased (for a number of layers > 5 thecurves are too close to the nematic binodal and are notvisible in the figure); (ii) the critical points, where layer-ing transitions terminate, move to lower pressures as thenumber of layers increases for i ≥ 2. It is interesting tonote that the critical point of the WN0–WN1 transition islocated below that of the WN1–WN2 transition; this fea-ture is related to the strong ordering of the WN interfacejust before the WN0–WN1 transition. In any case, lay-ering transitions terminate at pressures where the bulk

8
10-5
10-4
10-3
10-2
10-1
x-xcoex
-2
-1.5
-1
-0.5
0Γ 1L
12
0-1
1-2
2-3
3-4
(a)
10-5
10-4
10-3
10-2
10-1
x-xcoex
0
0.4
0.8
1.2
Γ 2L12
3-4
2-3
1-2
0-1
(b)
FIG. 5: Adsorption coefficients of (a) species 1, (b) species2, as a function of composition x − xcoex (in logarithmicscale). Dotted lines indicate the transition points betweentwo equilibrium interfaces. The value of the reduced pressureis βpL3
1 = 1.3. Labels indicate the number of layers of thestructures involved in each layering transition.
10-4
10-3
10-2
10-1
x-xcoex
0
0.2
0.4
0.6
0.8
1
Γ 2L12 2-3
3-4
10-6
10-4
10-2
x-xcoex
0
0.5
1
1.5
2
2.5
Γ 2L12
11-12
2-3
(a) (b)
FIG. 6: (a) Adsorption coefficient of species 2 as a functionof x−xcoex (in logarithmic scale). Equilibrium structures arerepresented by continuous curves, while dashed vertical linesindicate layering transitions (metastability branches are notmeant to be complete). (b) A zoom showing the first twolayering transitions (in this case adsorption of the first twolayers does not proceed via surface phase transitions). Thepressure is fixed at βpL3
1 = 1.15. Labels indicate the numberof layers of the structures involved in each layering transition.
NS demixing transition becomes weak or disappears, i.e.when βpL2
1 ≃ 1.
We note that, depending on the wetting scenario forthe WS′
2 interface, the layering transition curves couldor could not continue above the NS′
2 spinodal; for exam-ple, the wetting régime could change to a partial wettingrégime, similar to that found in Ref. [19]. Since interfa-cial calculations with a bulk smectic phase are difficult,we have not carried out this programme in the presentwork.
Next we briefly discuss the transition strength alongthe layering transition curves. In Fig. 8 the gap in theadsorption coefficient of species 2 at coexistence of the
WNi−1 and WNi structures, ∆Γ(i)2 = Γ
(WNi)2 − Γ
(WNi−1)2 ,
is plotted as a function of composition along the layeringtransition curves and for various indices i. The general
0 0.02 0.04 0.06 0.08x-xcoex
1.0
1.2
1.4
1.6
1.8
βpL
13
S2’
WN0
WN1
WN2
WN3
FIG. 7: Layering transitions (solid curves) between WNi−1
and WNi interfacial structures (with i the number of adsorbedlayers) in the reduced pressure–composition plane. The crit-ical points of the transitions are shown with open circles.Dashed line is the NS′
2 second order transition.
0.5 0.6 0.7 0.8
x
0
0.1
0.2
0.3
0.4
0.5
∆Γ2
L12
FIG. 8: Coexistence gap of the adsorption coefficient of the
second species, ∆Γ(i)2 , at the WNi−1–WNi layering transitions
as a function of composition and for various indices i. Symbolsrefer to layering transitions WN0–WN1 (circles), WN1–WN2
(stars), WN2–WN3 (squares) and WN3–WN4 (triangles).
trend observed is that, as more layers get involved, thetransition becomes stronger (i.e. the gap at coexistence islarger). As the index i of the layering transition increases,
the gap ∆Γ(i)2 tends to saturate, corresponding to the fact
that the additional layers adsorbed do not feel the effectof the wall and therefore contribute to the adsorptioncoefficient with a constant quantity.
We end this section with a comment on the origin of thelayering transitions. As shown in [50], two-dimensionalone-component hard-rod fluids in contact with a hardwall do not exhibit layering transitions even though thebulk transition is of first order [40]. This is also probably
9
the case in the corresponding three-dimensional fluid, al-though we have not performed explicit calculations forthe current model. Therefore, one tentative explanationfor the phenomenology found in the mixture is that layer-ing transitions are due to the entropic coupling betweenthe two species mediated by the hard wall: next to thewall, where particle densities are high, both species com-pete for the gain in entropic volume. Just above the lay-ering transition, a mixed layer packs less efficiently, andshort particles are abruptly depleted from that region,with the subsequent abrupt increase in long particles.This conclusion would not be affected by the discoveryof layering transitions in the calculations of Somoza et al.[19], who use particles with additional soft, temperature-driven interactions; in this fluid the mechanism behindthe layering transitions would be completely different.
A look at the structure of the density profiles of theWN0 interface [Fig. 3(a)] can help us understand thiseffect from a different perspective. The density maximaof the two species are clearly separated, due to the dif-ferent lengths of the particles (density is maximum ex-actly at contact with the wall). However, the maximaof the bulk smectic phase are in phase (S1 smectic). Itis only because a sharp change in the interfacial struc-ture occurs, via a first-order layering transition, that theinterface can relax to a structure compatible with thatin the bulk, i.e. with the correct relative phase. Thismechanism operates even for structures WNi with largei, when the effect of the wall is not crucial, because thedensity maxima of the two species, in the region betweenthe already-formed smectic layers and the nematic, arealways displaced one with respect to the other. At lowerpressures, such that the bulk smectic phase is S2, there isno such incompatibility between the bulk structure andthe structure imposed by the wall, and the layering tran-sitions vanish.
C. Wetting behavior
To obtain a global picture of the wetting behavior ofthe mixture, we have concentrated on four different val-ues of reduced pressure: βpL3
1 = 1.25 and 1.30 (locatedabove the bulk triple point, see Fig. 1), 1.00 (below thetriple point and above the tricritical point), and 0.495(below the tricritical point). In the first two cases we havefound the phenomenology described in Sec. III B, i.e. aninfinite sequence of layering transitions leading to com-plete wetting of the WN interface by the S1 phase. Usingthe procedures described in Sec. II B, we have calculatedthe surface tensions of the WN, WS1 and NS1 interfacesfor x = xcoex, which are necessary to discuss the wettingbehaviour. Their values are collected in Table I. As cor-responds to complete wetting by the S1 phase, the surfacetensions fulfill Young’s law γWS1
= γWN + γNS1(the value
of γWN at x = xcoex can be computed by extrapolation ofγWNi
with i → ∞. In practice i = 32 already gives enoughaccuracy to assess the wetting behaviour. Note that, in
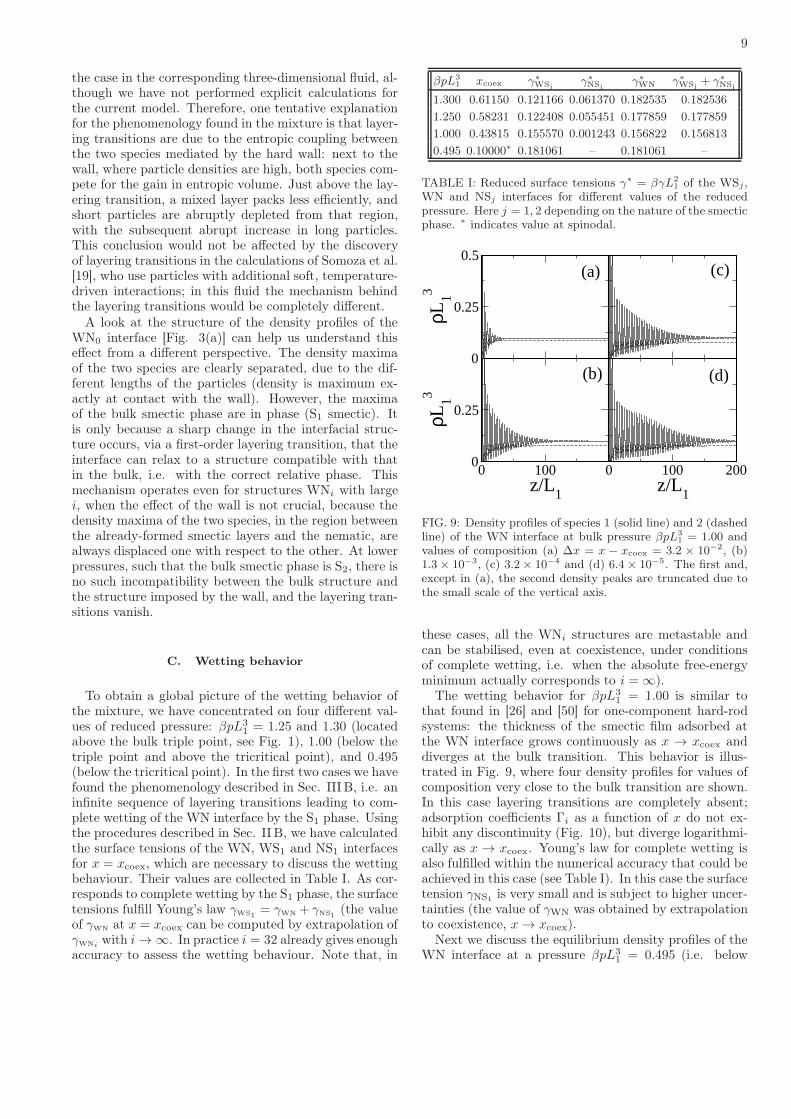
βpL31 xcoex γ∗
WSjγ∗NSj
γ∗WN γ∗
WSj+ γ∗
NSj
1.300 0.61150 0.121166 0.061370 0.182535 0.182536
1.250 0.58231 0.122408 0.055451 0.177859 0.177859
1.000 0.43815 0.155570 0.001243 0.156822 0.156813
0.495 0.10000∗ 0.181061 – 0.181061 –
TABLE I: Reduced surface tensions γ∗ = βγL21 of the WSj ,
WN and NSj interfaces for different values of the reducedpressure. Here j = 1, 2 depending on the nature of the smecticphase. ∗ indicates value at spinodal.
0
0.25
0.5
ρL13
0 100z/L
1
0
0.25
ρL13
0 100 200z/L
1
(a)
(b)
(c)
(d)
FIG. 9: Density profiles of species 1 (solid line) and 2 (dashedline) of the WN interface at bulk pressure βpL3
1 = 1.00 andvalues of composition (a) ∆x = x − xcoex = 3.2 × 10⁻², (b)1.3× 10⁻³, (c) 3.2× 10⁻⁴ and (d) 6.4× 10⁻⁵. The first and,except in (a), the second density peaks are truncated due tothe small scale of the vertical axis.
these cases, all the WNi structures are metastable andcan be stabilised, even at coexistence, under conditionsof complete wetting, i.e. when the absolute free-energyminimum actually corresponds to i = ∞).
The wetting behavior for βpL31 = 1.00 is similar to
that found in [26] and [50] for one-component hard-rodsystems: the thickness of the smectic film adsorbed atthe WN interface grows continuously as x → xcoex anddiverges at the bulk transition. This behavior is illus-trated in Fig. 9, where four density profiles for values ofcomposition very close to the bulk transition are shown.In this case layering transitions are completely absent;adsorption coefficients Γi as a function of x do not ex-hibit any discontinuity (Fig. 10), but diverge logarithmi-cally as x → xcoex. Young’s law for complete wetting isalso fulfilled within the numerical accuracy that could beachieved in this case (see Table I). In this case the surfacetension γNS1
is very small and is subject to higher uncer-tainties (the value of γWN was obtained by extrapolationto coexistence, x → xcoex).
Next we discuss the equilibrium density profiles of theWN interface at a pressure βpL3
1 = 0.495 (i.e. below

10
10-4
10-3
x-xcoex
-2
-1.6
-1.2
Γ 1L12
0.5
1
1.5
Γ 2L12
(a)
(b)
FIG. 10: Adsorption coefficients of species 2 (a) and 1 (b)as a function of composition (in logarithmic scale) near thewetting transition. The reduced bulk pressure is βpL3
1 = 1.0.
the tricritical point) and, more specifically, the behaviorof the adsorption coefficients as the bulk NS spinodal isapproached. Let x∗ be the composition of the spinodalat a given pressure. Since the NS transition is of secondorder, we should find critical adsorption, similar to thatoccurring at the liquid-vapour critical point where theadsorption diverges logarithmically as dictated by mean-field theory. Far from the wall and close to the bulk spin-odal, the WN interface exhibits oscillations with a periodd∗ (the smectic period at bifurcation). Thus, the devi-ation of density profiles from their bulk values is betteraccounted for by the quantity |ρi(z) − ρi| (the analogueof the order parameter in the anti-ferromagnetic Isingmodel), and it is convenient to define modified adsorp-tion coefficients as
Γ∗i =
∫ H
0
|ρi(z)− ρi|dz. (16)
The behaviors of Γ2 and Γ∗2 as a function of x − x∗ are
illustrated in Fig. 11. It can be seen from the figure that,while Γ2 seems to reach a plateau as x → x∗, the modi-fied coefficient Γ∗
2 diverges logarithmically as predicted bymean-field theory for a critical adsorption phenomenon[51]. The value of the plateau is difficult to determinedue to the huge values of H required to accommodatethe weakly damped interfacial oscillations that extendvery far from the wall when x ∼ x∗. The range of theseoscillations is of the order of the smectic bulk correla-tion length, which diverges at x = x∗. Finally, we havechecked that the system also exhibits critical adsorptionin the neighbourhood of the NS′ spinodal curve (at higherpressure and composition).
We end this section with a discussion on the impact
10-4
10-3
10-2
10-1
x-x*
0.04
0.06
0.08
0.1
Γ 2L12
(a)
10-4
10-3
10-2
10-1
x-x*
0
1
2
3
4
Γ 2∗ L12
(b)
FIG. 11: The original (a) and modified (b) adsorption coef-ficients of second species as a function of bulk compositionnear the NS second order transition at βpL3
1 = 0.495. In (a)the curve is a guide to the eye. In (b) the line is a logarithmicfit.
of the parallel-particle approximation on the wetting be-haviour. Complete wetting (either continuous or via a se-quence of layering transitions) of a hard wall by a binarymixture of hard particles is governed by two factors: (i)the effective entropic interactions between particles andthe wall, and (ii) the distance of the bulk state point fromthe demixing binodal. Since both the free- and restricted-orientations models contain these two features, we onlyexpect quantitative deviations between the two as faras the wetting behaviour is concerned. The situationwith respect to the critical adsorption phenomenon isdifferent, because this is due to the second-order charac-ter of the nematic-smectic transition, which may becomeweakly first order for small perturbations of particle ori-entations with respect to perfect alignment. In a modelwith free orientations the critical adsorption behaviourcould be superseded by complete (continuous) wetting.
IV. CONCLUSIONS
In this work we have studied the surface adsorptionphenomena of a liquid-crystal colloidal mixture that has astable smectic phase at moderate pressures. The mixtureis described by means of a very simple model consistingof perfectly aligned hard particles, while the substrateis a hard wall inducing perfect homeotropic anchoringand nematic boundary conditions far from the wall arechosen. Even with these simple assumptions, the bulkand surface phase diagrams are so rich that we have con-centrated only on the analysis of a single mixture withlength ratio s = L2/L1 = 3. The theoretical tool used isa recently developed fundamental-measure density func-tional for mixtures of parallel cylinders [38].
We have found a bulk phase diagram with secondorder NS transitions at low pressures, followed by NSdemixing above a tricritical point. In the low and highcomposition regions of the phase diagram two criticalpoints exist, above which two smectic phases, one ofthem micro-fractionated, coexist. Coexistence is ended

11
by corresponding triple points at higher pressures. Atthe highest pressures investigated smectic demixing isfound, with each smectic rich in one of the species. Abifurcation analysis corroborates that the NC spinodal isalways above the NS spinodal, but does not completelyclarify the question about the absolute stability of thesmectic against the columnar phases. In any case, we donot expect the NS, and possibly also the SS, demixingtransitions to be preempted by the columnar phase atlow pressures.
The surface phase diagram has three different wettingrégimes. The first one, located below the tricritical point,exhibits critical adsorption as the composition of the bulknematic phase approaches the NS spinodal. In the secondrégime, located approximately above the tricritical pointand below the triple point (the exact boundaries wouldrequire further analysis), there exists complete wettingof the substrate by a smectic film whose thickness di-verges logarithmically as x → xcoex. Finally, the thirdrégime is located above the triple point and is charac-terized by the presence of layering transitions that ulti-mately lead to complete wetting. A previous theoreticalstudy of one-component hard-rod fluids using a densityfunctional model [19] found layering phenomena in thesemi-infinite system due to strong attractive interactionsbetween the wall and the fluid particles. By contrast,layering transitions in hard-rod liquid-crystal mixturesadsorbed on a hard wall, as shown in the present study,is a direct consequence of the wall-mediated entropic in-teraction between the two species.
We expect that the present work serves as a start-ing point to initiate experimental studies on the surfacephase behavior of liquid-crystal colloidal mixtures con-sisting of particles that interact through short-ranged re-pulsive forces, and having a stable bulk smectic phase.These experiments could be guided by the phenomenol-ogy found in the present study. Our future theoreti-cal studies will analyse the adsorption phenomenologyof films in the neighbourhood of the bulk triple point, achallenging problem that could provide further interest-ing phenomena.
Acknowledgments
We gratefully acknowledge financial support from Co-munidad Autónoma de Madrid (Spain) under grantsNANOFLUID, MOSAICO and S-0505/ESP-0299. Thiswork is partly financed by grants FIS2005-05243-C02-01, FIS2007-65869-C03-01, FIS2008-05865-C02-02 andFIS2007-65869-C03-C01 from Ministerio de Educación yCiencia (SPAIN).
Appendix A: Bifurcation analysis
To implement the bifurcation analysis, we use the fol-lowing expressions for the Fourier transforms of the direct
correlation functions [38, 52]:
ρicij(q, η) = xi
2lijΨ0(q⊥)χ(
q‖lij)
+liljΨ1(q⊥)χ(
q‖li/2)
χ(
q‖lj/2)
, (A1)
where li = Li/〈L〉, lij = (li + lj)/2, 〈L〉 =∑
i xiLi, withq‖ and q⊥ in units of 〈L〉 and D/2, respectively. We havedefined χ(x) ≡ sin(x)/x and
Ψ0(q) = 4y
J1(2q)
q+ 2yJ0(q)
J1(q)
q
+y(1 + 2y)
[
J1(q)
q
]2
, (A2)
Ψ1(q) = 4y2
J1(2q)
q+ 2(1 + 2y)J0(q)
J1(q)
q
+(1 + 6y + 6y2)
[
J1(q)
q
]2
, (A3)
with y = η/(1− η) and Jn(x) the n-th order Bessel func-tion of first kind. The NS spinodal can be obtained bysolving Eqs. (7) with q⊥ = 0, q‖ = q, and
H(q, η) = 1 +∑
i
xi 2Ψ0(0)liχ(qli)
+ Ψ1(0)l2iχ
2(qli/2)
− [∆Ψ0(0)χ(q∆l/2)]2, (A4)
where ∆l = l1 − l2, ∆2 = 〈l2〉 − 1 being the the poly-dispersity coefficient, with 〈l2〉 =
∑
i xil2i . For columnar
symmetry q‖ = 0, |q⊥| = q, and we find
H(q, η) = 1 + 2Ψ0(q) + Ψ1(q) + ∆2[
Ψ1(q)−Ψ20(q)
]
.
(A5)
To search for a possible NN demixing scenarios, we needto solve H(0, η) = 0 for ∆ as a function of η, whichprovides the NN spinodal:
∆2 =1 + 2Ψ0(0) + Ψ1(0)
Ψ20(0)−Ψ1(0)
=
(
1
η− 1
)21 + 4η + η2
7− 2η − η2.
(A6)
For our particular mixture (L2 = 3L1), the pressure ofthe NN critical point is βpL3
1 ≈ 10. This result showsthe metastable character of the NN demixing against NSdemixing (see Sec. III A).
In Fig. 12 the NS and NC spinodals, in the pressure–composition plane, are shown. They never intersect andthe former is always below the latter. This fact indicatesthat in the low-pressure region of the phase diagram, cal-culated in Sec. III A, the nematic and smectic phasescould actually be stable against the columnar phase.
Appendix B: Interfacial Gibbs-Duhem relation
In this section we obtain the thermodynamic relation(15) involving the derivative of the WN surface tension

12
0 0.2 0.4 0.6 0.8 1x
0
1
2
3
4
βpL
13
FIG. 12: NS (solid) and NC (dashed) spinodals in the reducedpressure–composition plane.
with respect to composition and the adsorption coeffi-cients Γi. Starting from the interfacial Gibbs-Duhem re-lation dγ = −
∑
i Γidµi, we have
dγ
dx= −
∑
i
Γidµi
dx. (B1)
For fixed pressure p0 the chemical potentials µi(x, ρ(x))are only functions of x because ρ(x) is defined implicitlythrough the constraint p(x, ρ(x)) = p0. Then:
dρ
dx= −
∂p/∂x
∂p/∂ρ. (B2)
Taking into account that
dµi
dx=
∂µi
∂x+
∂µi
∂ρ
dρ
dx, (B3)
and using Eqs. (12), (11) and (B2), we finally find
βdµi
dx=
(−1)i−1
xi−
∆lη2(7− 2η − η2)(1 − li)
(1 + 4η + η2)(1 − η)2(B4)
which, after insertion in (B1), gives the final result (15),with
U(x, p) = 1−η2(7− 2η − η2)∆2
(1 + 4η + η2)(1 − η)2. (B5)
The function η(x) in Eq. (B5) can be found from theconstant-pressure constraint. Comparing Eqs. (A6) and(B5), which contain the same and only density factorthat can change sign, we conclude that U(x, P ) ≥ 0 onlywhen the mixture is stable against NN bulk demixing. Tocheck for consistency of our numerical minimization pro-cedure, we compare dγ/dx, as calculated from Eq. (15)[i.e. using the adsorption coefficients Γi obtained from
0.7 0.75 0.8x
-0.2
-0.1
0
0.1
0.2
dγ∗ /d
x
0.7 0.75 0.8x
0
2
4
6
∆dγ
∗ /dx
(x10
-4)
FIG. 13: Derivative of the reduced surface tension of the WNinterface, γ∗ = βγWNL
21, with respect to composition x, ob-
tained from numerical differentiation of the function γ(x). Inthe inset the difference between this derivative and that ob-tained from Eqn. (15) is plotted (wiggles are due to noise inthe numerical derivative). The value of the reduced pressureis βpL3
1 = 1.3.
the equilibrium density profiles ρ(e)i ] with the numerical
derivative with respect to x of the surface tension γ ob-tained after minimization. Both results are plotted inFig. 13 (for the WN interface) for βpL3
1 = 1.3. As canbe seen, both methods reproduce the same function withhigh accuracy, which demonstrates that our calculationsare fully consistent. Note that the slope of the surfacetension is equal to zero (and consequently γ has a max-imum as a function of x) for x = Γ1/(Γ1 + Γ2) [see Eq.(15)], i.e. when the bulk composition is identical to therelative fraction of adsorption coefficient of species 1.
[1] B. M. Ocko, Phys. Rev. Lett. 64, 2160 (1990).[2] R. Lucht and Ch. Bahr, Phys. Rev. Lett. 78, 3487 (1997).[3] T. Moses, Phys. Rev. E 64, 010702(R) (2001).[4] T. Jin, G. P. Crawford, R. J. Crawford, S. Zumer, and
D. Finotello, Phys. Rev. Lett. 90, 015504 (2003).[5] Y. G. J. Lau, R. M. Richarson, and R. Cubitt, J. Chem.
Phys. 124, 234910 (2006).[6] B. M. Ocko, A. Braslau, P. S. Pershan, J. Als-Nielsen,
and M. Deutsch, Phys. Rev. Lett. 57, 94 (1986).[7] P. S. Pershan, A. Braslau, A. H. Weiss, and J. Als-
Nielsen, Phys. Rev. A 35, 4800 (1987).[8] R. Lucht, Ch. Bahr, G. Heppke, and J. W. Goodby, J.

13
Chem. Phys. 108, 3716 (1998); R. Lucht, P. Marczuk,Ch. Bahr, and G. H. Findenegg, Phys. Rev. E 63, 041704(2001).
[9] R. Lucht, Ch. Bahr, and G. Heppke, J. Phys. Chem. B102, 6861 (1998); Phys. Rev. E 62, 2324 (2000).
[10] M. Fukuto, O. Gang, K. J. Alvine, B. M. Ocko, and P.S. Pershan, Phys. Rev. E 77, 031607 (2008).
[11] T. Stoebe, P. Mach, and C. C. Huang, Phys. Rev. Lett.73, 1384 (1994).
[12] A. J. Jin, M. Veum, T. Stoebe, C. F. Chou, J. T. Ho, S.W. Hui, V. Surendranath, and C. C. Huang, Phys. Rev.E 53, 3639 (1996).
[13] E. I. Demikhov, V. K. Dolganov, and K. P. Meletov,Phys. Rev. E 52, R1285 (1995).
[14] Z. Pawlowska, G. F. Kventsel, and T. J. Sluckin, Phys.Rev. A 36, 992 (1987); Z. Pawlowska, T. J. Sluckin, andG. F. Kventsel, Phys. Rev. A 38, 5342 (1988).
[15] J. V. Selinger and D. R. Nelson, Phys. Rev. A 37, 1736(1988).
[16] L. V. Mirantsev, Phys. Lett. A 205, 412 (1995).[17] M. M. Telo da Gama, Mol. Phys. 52, 584 (1984); E.
Martin del Rio, M. M. Telo da Gama, E. de Miguel andL. F. Rull, Phys. Rev. E 52, 5028 (1995).
[18] L. Mederos and D. E. Sullivan, Phys. Rev. A 46, 7700(1992).
[19] A. M. Somoza, L. Mederos and D. E. Sullivan, Phys. Rev.Lett. 72, 3674 (1994); Phys. Rev. E 52, 5017 (1995).
[20] Y. Martínez-Ratón, A. M. Somoza, L. Mederos and D.E. Sullivan, Faraday Discuss. 104, 111 (1996).
[21] R. van Roij, M. Dijkstra and R. Evans, Europhys. Lett.49, 350 (2000).
[22] R. van Roij, M. Dijkstra and R. Evans, J. Chem. Phys.113, 7689 (2000).
[23] D. de las Heras, L. Mederos, and E. Velasco, Phys. Rev.E 68, 031709 (2003).
[24] D. de las Heras, E. Velasco, and L. Mederos, J. Chem.Phys. 120, 4949 (2004).
[25] D. de las Heras, E. Velasco, and L. Mederos, Phys. Rev.Lett. 94, 017801 (2005).
[26] D. de las Heras, E. Velasco, and L. Mederos, Phys. Rev.E 74, 011709 (2006).
[27] K. Shundyak and R. van Roij, J. Phys.: Condens. Matter13 (2001).
[28] L. Harnau and S. Dietrich, Soft Matter 3, 159 (2007).[29] J. M. Brader, R. Evans, M. Schmidt, and H. Löwen, J.
Phys.: Condens. Matter 14, L1 (2002).[30] R. Evans, J. M. Brader, R. Roth, M. Dijkstra, M.
Schmidt, and H. Löwen, Phil. Trans. R. Soc. Lond. A359, 961 (2001).
[31] R. Roth, J. M. Brader, and M. Schmidt, Europhys. Lett.63, 549 (2003).
[32] P. Bryk, J. Chem. Phys. 125, 204709 (2006).
[33] P. Bolhuis and D. Frenkel, J. Chem. Phys. 101, 9869(1994).
[34] M. Schmidt, H. Löwen, J. M. Brader, and R. Evans,Phys. Rev. Lett. 85, 1934 (2000).
[35] M. Dijkstra and R. van Roij, Phys. Rev. Lett. 89, 208303(2002).
[36] See for example: G. J. Vroege and H. N. W. Lekkerkerker,Rep. Prog. Phys. 55, 1241 (1992); M. Adams, Z. Dogic,S. L. Keller and S. Fraden, Nature 393, 349 (1998); H.Stark, J.-I. Fukuda and H. Yokoyama, Phys. Rev. Lett.92, 205502 (2004); H. Maeda and Y. Maeda, Phys. Rev.Lett. 90, 018303 (2003).
[37] Z. Dogic, Phys. Rev. Lett. 91, 165701 (2003).[38] Y. Martínez-Ratón, J. A. Capitán and J. A. Cuesta,
Phys. Rev. E 77, 051205 (2008)[39] K. Shundyak and R. van Roij, Phys. Rev. E 69, 041703
(2004).[40] J. A. Capitán, Y. Martínez-Ratón and J. A. Cuesta, J.
Chem. Phys. 128, 194901 (2008)[41] K. E. Vaughn, M. Sousa, D. Kang, and C. Rosenblatt,
Appl. Phys. Lett. 90, 194102 (2007).[42] Y. Yi, G. Lombardo, N. Ashby, R. Barberi, J. E. Maclen-
nan, and N. A. Clark, Phys. Rev. E 79, 041701 (2009).[43] D. Zhao, W. Huang, H. Cao, Y. Zheng, G. Wang, Z. Yang
and H. Yang, J. Phys. Chem. B 113, 2961 (2009).[44] T. Beica, R. Moldovan, I. Zgura, S. Frunza, and M.
Poterasu, J. Optoelectron. Adv. Mat. 8, 1512 (2006).[45] K. Zhao, C. Harrison, D. Huse, W. B. Russel and P. M.
Chaikin, Phys. Rev. E 76, 040401 (2007).[46] T. Koda and H. Kimura, J. Phys. Soc. Japan 63, 984
(1994).[47] G. Cinacchi, E. Velasco and L. Mederos, J. Phys.: Con-
den. Matter 16, S2003 (2004).[48] G. Cinacchi, Y. Martinez-Raton, L. Mederos and E. Ve-
lasco, Mol. Cryst. Liq. Cryst. 465, 121 (2007).[49] A. M. Bohle, R. Holyst and Thomas Vilgis, Phys. Rev.
Lett. 76, 1396 (1996).[50] Y. Martínez-Ratón, Phys. Rev. E 75, 051708 (2007).[51] The bifurcation point for βpL3
1 = 0.495 is at x∗ = 0.10000as obtained numerically from Eqns. (7) and (A4). Thedata for Γ∗
2 in Fig. 10 are very sensitive to x − x∗ closeto the bifurcation point, especially when plotted in loga-rithmic scale. An unwanted consequence of this is thatthe first two values in Fig. 10 exhibit a slight curva-ture if the above value of x∗ is used. This situation isimproved if x∗ is obtained from a fit to the functionΓ∗2 = −a log (x− x∗) − b, with a, b and x∗ free param-
eters. The fit gives x∗ = 0.09987. The data plotted in thefigure were obtained using this modified value.
[52] Y. Martínez-Ratón and J. A. Cuesta, Mol. Phys. 107,415 (2009).
Copyright © 2022 FDOKUMEN