Supporting the Forecasting of Uncertain Product Demand in ...
271
SUPPORTING THE FORECASTING OF UNCERTAIN PRODUCT DEMAND IN SUPPLY CHAIN WITH DIGITAL TOOLS by Elias Abou Maroun Thesis submitted in fulfilment of the requirements for the degree of Doctor of Philosophy - Industry Doctorate Program under the supervision of Professor Didar Zowghi, Dr Renu Agarwal and Dr Babak Abedin University of Technology Sydney Faculty of Engineering and Information Technology May 2021
-
Upload
khangminh22 -
Category
Documents
-
view
3 -
download
0
Transcript of Supporting the Forecasting of Uncertain Product Demand in ...
SUPPORTING THE FORECASTING OF UNCERTAIN PRODUCT DEMAND IN SUPPLY CHAIN WITH DIGITAL TOOLS by Elias Abou Maroun Thesis submitted in fulfilment of the requirements for the degree of Doctor of Philosophy - Industry Doctorate Program under the supervision of Professor Didar Zowghi, Dr Renu Agarwal and Dr Babak Abedin
University of Technology Sydney Faculty of Engineering and Information Technology May 2021
6.

i
STATEMENT OF ORIGINAL AUTHORSHIP
I, Elias ABOU MAROUN declare that this thesis is submitted in fulfilment of the
requirements for the award of Doctor of Philosophy, in the Computer Science School / Faculty
of Information Technology and Engineering at the University of Technology Sydney.
This thesis is wholly my own work unless otherwise reference or acknowledged. In addition,
I certify that all information sources and literature used are indicated in the thesis.
This document has not been submitted for qualifications at any other academic institution.
This research is supported by the Australian Government Research Training Program.
Signature of Candidate
_________________________
Elias ABOU MAROUN
Production Note:
Signature removed prior to publication.

ii
Dedication
This dissertation is dedicated in memory of my dear father Dib Tanios ABOU MAROUN and
beloved maternal grandmother Nelly MAROUN, whom both entered eternal life during this
research project.
To my dear father Dib, you played a significant role in my life, and I cannot thank you enough
for the numerous sacrifices you made for the family. With your inspiration, love, and support,
I have been able to meet challenges head-on. In your final moments, you were filled with
words of encouragement and support, which I drew on to persevere with my studies and fulfil
my ultimate goal. I promised to make you proud by continuing my studies to achieve this
significant academic goal. I wish you were with me to share in the celebrations and success
of my achievement.
To my beloved grandmother Nelly, your faith, cheekiness and words of wisdom are forever
cherished. Thank you for supporting me spiritually throughout this research project.
"One of the hardest lessons in life is letting go.
Whether it's guilt, anger, love, loss.
Change is never easy, you fight to hold on, and you fight to let go".
Khalil Gibran

iii
Acknowledgements
Foremost, I thank God, our heavenly Father, for all the guidance and love he blessed me with
during this journey.
This PhD would not have been possible without the support of the industry partner. I am
grateful to all my managers and colleagues whom I have had the pleasure to work with during
this and other related projects. I would like to thank all the people who generously gave their
time to participate in the interviews, questionnaire, and experiments.
I would like to express my deep and sincere gratitude to my principal research supervisor,
Professor Didar Zowghi, who gave me the opportunity to research under her guidance and
provided me with invaluable insight and knowledge. Professor Zowghi's professional
leadership taught me a great deal about scientific research. With many challenges in my
personal and work life, Professor Zowghi was always considerate, conscientious and made
this experience seamless.
I would also like to thank my thesis committee, Dr Renu Agarwal, for her knowledge,
expertise in this study, and for driving me to achieve my best. Dr Jay Daniel for his support
and encouragement and Dr Babak Abedin for his insightful comments and critique.
To my mother, Adla Abou Maroun, thank you for always being supportive of my studies.
Your unconditional love and care mean everything to me and the family.
Thanks to my parents-in-law, Peter and Sally Georges, for their support, kindness, and always
being available to help my children while I was completing this study.
Finally, nobody has been more important to me in pursuing this research project than my
family, to whom I owe a great deal. I would like to thank my wife Leila for her continuous

iv
patience, unconditional support and positive encouragement throughout this journey. I would
not have been able to complete this without her support. To my wonderful children, Patrick
and Sophia, you were my inspiration along this journey and are the two most important people
in my life. I love you both dearly and look forward to spending my extra free time with you.
This thesis is only a beginning of my journey.
Elias Abou Maroun
"Progress lies not in enhancing what is, but in advancing toward what will be."
Khalil Gibran

v
List of papers/publications included
ABOU MAROUN, E., DANIEL, J., ZOWGHI, D. & TALAEI-KHOEI, A. 2018.
Blockchain in Supply Chain Management: Australian Manufacturer Case Study, Service
Research and Innovation, Australasian Symposium on Service Research and Innovation,
Springer, Sydney, Australia, pp. 93-107.
ABOU MAROUN, E., ZOWGHI, D. & AGARWAL, R. 2018. Challenges in forecasting
uncertain product demand in supply chain: A systematic literature review. Managing the many
faces of sustainable work, 32nd Annual Australian and New Zealand Academy of
Management, ANZAM, Auckland, New Zealand.
List of papers to be submitted for publication
ABOU MAROUN, E., ZOWGHI, D., AGARWAL, R. & ABEDIN, B. 2018. Exploring
Uncertain Product Demand in Supply Chain: Systematic Review and a Theoretical
Framework
ABOU MAROUN, E., ZOWGHI, D., AGARWAL, R. & ABEDIN, B. 2020. End-to-end
supply chain barriers in forecasting uncertain product demand: A field Study
ABOU MAROUN, E., ZOWGHI, D., AGARWAL, R. & ABEDIN, B. 2018. Forecasting
uncertain product demand in supply chain: A Digital Toolkit.

vi
Table of Contents
Contents
1 Introduction ..................................................................................................................... 1
Chapter Overview .................................................................................................... 1
Background .............................................................................................................. 1
Industry Environment ............................................................................................... 3
Industry Problem – the context ................................................................................ 4
Pilot Study ................................................................................................................ 7
Research Scope ........................................................................................................ 8
Goals....................................................................................................................... 10
Research Design ..................................................................................................... 12
1.8.1 Phase 1: Environment ..................................................................................... 14
1.8.2 Phase 2: Solution Build .................................................................................. 15
1.8.3 Phase 3: Evaluation of the Toolkit .................................................................. 16
Research Contributions .......................................................................................... 16
Practice Contributions ............................................................................................ 18
Novelty and Originality .......................................................................................... 18
Outline of this Thesis ............................................................................................. 19
2 Systematic Literature Review ........................................................................................ 21
Chapter Overview .................................................................................................. 21
Background ............................................................................................................ 22
2.2.1 What is uncertain product demand? ............................................................... 23
2.2.2 Overview of Supply Chain ............................................................................. 24
Results from Systematic Literature Review ........................................................... 28
vii
2.3.1 Forecasting methods used for uncertain demand ............................................ 28
2.3.2 Barriers faced in forecasting uncertain demand ............................................. 36
2.3.3 Solutions addressing barriers in forecasting uncertain demand...................... 44
Discussion .............................................................................................................. 49
2.4.1 Relationships between barriers, solutions and methods ................................. 50
2.4.2 Benefits and Limitations of UPD forecasting methods .................................. 57
2.4.3 Judgmental adjustment decision making framework ..................................... 59
Chapter Summary ................................................................................................... 63
3 Methodology and Research Design ............................................................................... 65
Chapter Overview .................................................................................................. 65
Research Methodology ........................................................................................... 68
Research Activities – Method used in this research study ..................................... 70
3.3.1 Phase 1: Environment ..................................................................................... 73
3.3.2 Phase 2: Design and Build .............................................................................. 83
3.3.3 Phase 3: Evaluate ............................................................................................ 92
Limitations of research design ............................................................................... 95
Ethical Considerations ............................................................................................ 96
Summary ................................................................................................................ 97
4 Field Study ..................................................................................................................... 98
Chapter Overview .................................................................................................. 98
Sales and Operations Planning at ALM ................................................................. 98
4.2.1 Step1. Gather base data and analyse ............................................................... 99
4.2.2 Step 2. Demand Planning ............................................................................. 101
4.2.3 Step 3. Inventory and Supply Planning and Balancing ................................ 101
4.2.4 Step 4. Pre- S&OP and S&OP ...................................................................... 102
Findings from the pilot study ............................................................................... 102

viii
Findings from the interview study ....................................................................... 108
4.4.1 Internal Barriers ............................................................................................ 110
4.4.2 External Barriers ........................................................................................... 124
Findings from the requirements prioritisation ...................................................... 129
Discussion ............................................................................................................ 133
Chapter Summary ................................................................................................. 142
5 Solution Design ........................................................................................................... 144
Chapter Overview ................................................................................................ 144
Background .......................................................................................................... 145
Development of the tool ....................................................................................... 146
5.3.1 High-Level Requirements ............................................................................. 146
5.3.2 Architecture and Technologies ..................................................................... 147
5.3.3 Data Repository ............................................................................................ 148
5.3.4 User Interface................................................................................................ 148
Market Segmentation Tool ................................................................................... 149
5.4.1 Market segmentation options ........................................................................ 151
Market Intelligence Tool ...................................................................................... 152
5.5.1 Market intelligence options .......................................................................... 156
Collaborative Forecasting Model ......................................................................... 156
5.6.1 CFM options ................................................................................................. 160
Toolkit in Action .................................................................................................. 161
5.7.1 Insights .......................................................................................................... 162
5.7.2 Forecasting .................................................................................................... 163
5.7.3 Presentation .................................................................................................. 165
Discussion ............................................................................................................ 166
Chapter Summary ................................................................................................. 167

ix
6 Evaluation .................................................................................................................... 169
Chapter Overview ................................................................................................ 169
Evaluation Purpose ............................................................................................... 169
Evaluation Framework ......................................................................................... 172
Ex ante naturalistic evaluation methods ............................................................... 173
6.4.1 Stakeholder feedback .................................................................................... 173
6.4.2 Validation test ............................................................................................... 174
Ex post naturalistic and artificial evaluation methods .......................................... 174
6.5.1 System Testing ............................................................................................. 174
6.5.2 Focus Group ................................................................................................. 175
6.5.3 Questionnaire ................................................................................................ 178
Ex post artificial evaluation methods ................................................................... 182
6.6.1 Role-play based simulation........................................................................... 182
6.6.2 End-user testing ............................................................................................ 183
Discussion ............................................................................................................ 184
Chapter Summary ................................................................................................. 185
7 Conclusion ................................................................................................................... 187
Introduction .......................................................................................................... 187
Research Goals ..................................................................................................... 188
Research and Industry contributions .................................................................... 193
7.3.1 Contributions to the Body of Knowledge ..................................................... 193
7.3.2 Solutions to Problems in Practice ................................................................. 194
Implications for industry ...................................................................................... 194
Implications for research ...................................................................................... 195
Future research directions .................................................................................... 196
Limitations ........................................................................................................... 197

x
Reflections ............................................................................................................ 199
Appendix A: Ethics Approval from HREC UTS ................................................................ 201
Appendix B: Industry User Stories ...................................................................................... 207
Appendix C: Digital Toolkit solution screens ..................................................................... 210
Appendix D: The Questionnaire .......................................................................................... 214
Appendix E: Interview Questions ........................................................................................ 216
Appendix F: Systematic Literature Review Protocol .......................................................... 217
Appendix G. Systematic Literature Review Details ............................................................ 233
G1. Systematic Literature Review Execution .................................................................. 233
G2. Results from Systematic Literature Review ............................................................. 235
Appendix H. Results from Card sorting exercise ................................................................ 239
References ........................................................................................................................... 242

xi
List of Figures
Figure 1 Research model and methodology .......................................................................... 13
Figure 2 Percentage of barriers in the internal and external dimension ................................ 38
Figure 3 Internal and External dimensions of Barriers, and solutions .................................. 50
Figure 4 Relationship between forecasting barriers and adopted solutions for uncertain
product demand in supply chain ............................................................................................ 52
Figure 5 Relationship between forecasting methods and adopted solutions for uncertain
product demand in supply chain ............................................................................................ 53
Figure 6 Encapsulation of barriers, solutions & methods of uncertain product demand in the
supply chain into a research framework ................................................................................ 54
Figure 7 Decision making framework for UPD using judgmental adjustments .................... 62
Figure 8 Relationship between DSR process, research goals and research chapters ............ 67
Figure 9 Hevner (2007) Design Science Research Cycles .................................................... 72
Figure 10 DSR research environment cycle .......................................................................... 75
Figure 11 SLR research Methodology ................................................................................... 76
Figure 12 Directed quality content analysis strategy used .................................................... 82
Figure 13 Digital toolkit development cycle ......................................................................... 84
Figure 14 Card sorting steps .................................................................................................. 88
Figure 15 Card sorting exercise taking place at ALM ........................................................... 91
Figure 16 Design science research framework (adapted from (Pries-Heje et al.'s, 2008a) ) . 93
Figure 17 Sales and operations planning schedule and steps ................................................ 99
Figure 18 Figure 18Front end of supply chain at ALM (sales order process) ..................... 105
Figure 19 Backend of supply chain (sourcing, manufacturing and distribution) ................ 107
Figure 20 Number of participants contributed against the derived category ....................... 108
Figure 21 Top 10 barriers in forecasting demand ................................................................ 109
Figure 22 Top 10 barriers by participant groups ................................................................. 110
Figure 23 Dimensions to consider for high prioritization (Lehtola et al.'s, 2004) ............... 131
Figure 24 Ven diagram of forecasting barriers from SLR and ALM field study ................ 135
Figure 25 Fishbone diagram of the internal organisational barriers .................................... 137
Figure 26 Main user interface .............................................................................................. 148
Figure 27 Four-quadrant segments ...................................................................................... 150

xii
Figure 28 Downstream customer market segmentation screen ........................................... 151
Figure 29 Market intelligence architecture .......................................................................... 153
Figure 30 Sample customs export data ................................................................................ 154
Figure 31 Market intelligence screen .................................................................................. 155
Figure 32 CFM system tiers ................................................................................................ 157
Figure 33 CFM Menu .......................................................................................................... 160
Figure 34 Product level forecast .......................................................................................... 163
Figure 35 BOM cube showing the vandaled components required ..................................... 164
Figure 36 Forecast cube view .............................................................................................. 165
Figure 37 Design science research evaluation methods selected ........................................ 172
Figure 38 SLR process execution ........................................................................................ 234
Figure 39 Publication by journal and year of resultant studies ........................................... 236
Figure 40 Research methodologies used in resultant studies .............................................. 236
Figure 41 Primary geographic location of resultant studies ................................................ 237

xiii
List of Tables
Table 1 Forecasting Methods ................................................................................................ 29
Table 2 Domain application of forecasting methods. ............................................................ 33
Table 3 Forecasting barriers grouped against category & dimension ................................... 36
Table 4 Forecasting barriers and adopted solutions grouped against category & dimension 45
Table 5 Benefits and limitations of UPD forecasting methods ............................................. 57
Table 6 Reasons for judgmental adjustment decision ........................................................... 60
Table 7 Front end supply chain barriers .............................................................................. 104
Table 8 Back end barriers of supply chain .......................................................................... 106
Table 9 Dimensions for medium and low prioritization ...................................................... 131
Table 10 Best and worst features from focus group discussion .......................................... 177
Table 11 Summary of questionnaire results ........................................................................ 180

xiv
Abstract
This thesis examines the barriers faced in forecasting uncertain product demand within an
electrical luminaire manufacturer in Australia. As luminaire technology has rapidly advanced
in the last decade, the organisations' processes and systems for forecasting demand are no
longer adequate. The accurate forecasting of uncertain product demand in the supply chain is
understood to have financial consequences for organisations at all levels. Forecasting
uncertain product demand is a fundamental part of the supply chain's sales and operations
planning process. It lies at the strategic and tactical level within an organisation. The size and
complexity of forecasting uncertain product demand are regarded as one of the more
challenging activities in the supply chain. This is especially the case in the luminaire industry,
where demand uncertainty, lack of historical data, and competitive environments coexist.
Hence, judgemental adjustments are required to the forecast. The goal of adjusting the forecast
is to optimise accuracy by allowing forecasters to contribute to the organisations' sales
forecast. Our industry research's general premise is that the process of forecasting uncertain
product demand in the supply chain could be improved in terms of transparency, efficiency,
effectiveness, and useability by embedding a form of a digital toolkit. Many of the existing
methods, tools, and approaches in forecasting uncertain product demand are either too
complex for practice or cannot solve the barriers. In this research, we take a design science
approach to investigate both state-of-the-art and state-of-the-practice to identify the barriers
in forecasting uncertain product demand. We then develop and evaluate a software toolkit to
support practitioners in forecasting uncertain product demand.
The first stage of the research is a systematic literature review involving a thorough review
and critical analysis of existing theories on forecasting uncertain product demand. A pilot

xv
study is then conducted to gain in-depth information about the overall supply chain domain
and understanding who should formally be interviewed. The activities were informal and ad-
hoc, it involved a walk around the office and asking informal questions to supply chain
stakeholders, observing how people perform tasks and reading existing documentation. This
is followed by a field study at the Australian Luminaire Manufacturer (ALM1), which consists
of semi-structured interviews with end-to-end supply chain stakeholders and the elicitation of
stakeholder requirements which we prioritise by using the card-sorting method. Based on the
requirements prioritised, a toolkit is designed and developed to support the organisation in
forecasting uncertain product demand. The designed and developed toolkit provides a set of
tools, yet a cohesive set of software components that can be utilised to support the forecasting
of uncertain product demand. The toolkit includes market segmentation and market
intelligence reporting, a full forecasting model, and a framework to make forecast
adjustments. The final stage of the research involved the evaluation of the toolkit. This
involved a focus group and questionnaire with end-users. The research findings were also
presented to the organisations executive management.
The empirical evaluations conducted showed that the toolkit improves the overall
effectiveness of forecasting uncertain product demand. It was also revealed that the
consideration of judgemental adjustments in the forecasting toolkit was both beneficial and
practical for stakeholders.
This thesis offers interesting insights and valuable directions for managers contemplating
investing in improving accuracy in forecasting uncertain product demand in the supply chain.
1 Fictitious name used to maintain confidentiality

The research methods used and the successful application of the toolkit in the ALM were both
novel and unique from previous work on forecasting uncertain product demand.
xvi

1
1 Introduction
Chapter Overview
This chapter establishes the context for the research being undertaken. It introduces the
dissertation topic, provides background information on the dissertation's theoretical and
academic context, and identifies the industry environment and industry problems for the
research study. Justification for conducting the research and a brief description of the
methodology is also included. The chapter also outlines the research scope and establishes the
goals of the research. Finally, this chapter concludes with the research contributions and a
brief outline of this dissertation's subsequent chapters.
Background
Inventory investment is one of the most significant financial investments made for most
manufacturing or distribution organisations. For many organisations, their inventory has a
limited lifespan due to being perishable. Therefore, organisations need to try to hold as low
inventory levels as possible while still meeting the required customers' product demand.
Organisations are intensely under pressure due to competition and the expectation to provide
customers with the product shortly after the customer orders that product. This next day or
same day service expectation from customers creates a strain on the organisations' supply
chain. Supply chains are known to be large, complex and often unpredictable (Arshinder et
al.'s, 2008). Operational management of supply chains requires methods and tools to enable
organisations to better understand how unexpected disruptions occur and what impacts they
will have on the flow of goods to meet customer demands (Qi et al.'s, 2017).

2
Traditionally supply chains had a 'make-to-stock' paradigm which in many cases have been
replaced by 'make-to-order', where the final part of manufacturing a product is performed after
a customer order is received. This make-to-order model is particularly suited in organisations
that produce customised products. Organisations need to decide on the number of components
they source or stock-keeping units (SKU) they manufacture before the customer demands it
in the next sales. This problem is known as uncertain demand forecast and is established to
be one of the more critical and challenging activities within the sales and operation planning
(S&OP) conducted by organisations when managing supply chains. Sales and operations
planning involves a combination of people, process and technology (Noroozi and Wikner,
2017). S&OP is defined as 'a process to develop tactical plans that provide management with
the ability to strategically direct its businesses to achieve competitive advantage continuously
by integrating customer-focused marketing plans for new and existing products with
management of supply chain' (Richard E. Crandall, 2018, p.153). In this context, three major
types of uncertainty arise, the uncertainty of the demand forecast, uncertainty in the external
process and uncertainty in the internal supply process (Keskinocak and Uzsoy, 2011). The
forecasting of uncertain product demand and inaccuracy in forecasts remain areas of most
importance to researchers and practitioners. Over the last decades or so, forecasting demand
in Australian Luminaire Manufacturer (ALM) has been established as a more critical and
challenging activity.
Therefore, the industry research described in this thesis studies, constructs and evaluates a
toolkit to support the organisation in its sales and operations planning (S&OP) activities. This
thesis aims to support and enable greater transparency in forecasting and collaboration
between supply chain stakeholders. The aim is achieved through a set of four goals. This
research investigates the barriers faced in forecasting uncertain product demand, and if a

3
software toolkit could be designed and constructed, that would lead to improvements in terms
of transparency2, efficiency3, effectiveness 4and useability5. In particular, we are interested in
supporting the organisations forecasting capabilities. Our aim also relates to the gaps
identified in our systematic literature review (section 2.5)
Industry Environment
Australia's largest luminaire manufacture and distributor (ALM) has a wide range of product
portfolios focusing on serving the roadway & infrastructure, commercial & industrial,
consumer and retail market segments of the electrical industry. ALM incorporates engineering
and design, research, manufacturing, international sourcing, importation and distribution. It
allows ALM to develop new products for consumer acceptance. It also offers flexibility in
designing variations and bespoke designs from one unit to thousands of units. There are
currently over 15000 stock keeping units (SKU's) ranging in complexity from small and
inexpensive products to large heavy-duty products for industrial use. Most of these SKUs are
variations of the main product types, either directly sourced from suppliers and are known to
be box-in-box-out products or assembled in house from basic components and/or intermediate
products' suppliers provide.
ALM's commercial business procures approximately 11000 components sourced from
over 20 manufacturing suppliers located mainly in China and some European countries. 5
suppliers are used frequently while over fifteen are used very infrequently. One of the
suppliers is ALM's manufacturing plant, the sole manufacturing facility of luminaire goods in
2 Transparency refers to the information that flows amongst stakeholders to inform informed decision-making and take the right action (Hosseini et al.'s, 2018). 3 Efficiency refers to the resources (such as time or effort) expended with the speed with which users can achieve goals (Standardization, 2013). 4 Effectiveness refers to the accuracy and completeness with which users can achieve specified goals (Standardization, 2013). 5 Useability refers to the extent to which a system, product or service can be used by specified users to achieve specified goals with effectiveness, efficiency, and satisfaction in a specified context of use (Standardization, 2013).

4
Australia. The distribution of SKU's of every single supplier follows the typical ABC 6
analysis pattern, where many SKUs show no demand or consumption in one or more years.
The ordering policy of the procurement department is supplier dependent. At the time of the
study, there are two types of purchasing instruments used by ALM, system forecasting and
customer demand-driven purchasing. System forecasting is based on material requirements
planning (MRP), a planning and inventory control system in the enterprise resource planning
(ERP) system. It aims to safeguard adequate inventory levels are kept and assure that the
required materials needed to manufacture goods are available when needed. Consideration
needs to be taken if stock is ordered and does not meet the minimum requirement of the
supplier; does the organisation proceed with the sale and purchase excess stock and risk
having an overstock which results in additional overheads. Customer demand-driven orders
(Indent Stock) is the second instrument, this instrument does not consider historical sales. The
sales forecasting side of indent stock is complex, as customers can make a frequent or
infrequent purchase of small to large item quantities and expect immediate service. Large
"institutional" customers (hospitals, retail, sports stadiums, commercial buildings, industrial
and large manufacturers) typically place large orders through contractors or wholesalers but
usually allow a reasonably long delivery time.
Industry Problem – the context
The Australian electrical luminaire industry has intensely changed in the last decade due to
the rapid advancements in technology. Traditionally, for decades the luminaire industry was
labour intensive and low value-adding. However, since replacing traditional and fluorescent
6 A method for classifying inventory items based on consumption value

5
luminaires with the introduction of light-emitting diodes (LED), the lighting industry has
turned into a semi-conductor based industry. This technology change has introduced many
challenges, the most relevant challenges include:
Traditionally, the conception and manufacturing phase for a luminaire product was
relatively extensive, for example, organisations may spend 1-2 years developing a new
product. The demand for the new product design and production of this product can
last for a long period, such as 4-5 years or even longer. However, since the
introduction of the LED luminaire, products now have a very short lifetime. The
product development phase is only 3-6 months. New product designs and tooling for
manufacturing, such as components, fixtures, moulds and cutting equipment etc., can
only be used for 6-9 months until the next product generation is introduced.
Traditionally, lighting source/control gear and luminaires are generally different
products. Luminaire organisations would design light fittings only and not be involved
in selecting light source and control gear. However, since the introduction of LED,
organisations need to design the light source and electronics to ensure they are
compatible with the design.
The luminaire industry's manufacturing has changed from sheet metal forming, die
castings, assembly to surface mount technology (SMT), a method that produces circuit
boards by placing components directly to the surface of the printed circuit board
(PCB). This manufacturing method is different from legacy lighting sources such as
incandescent and halogen as it requires a controlled environment.
Technological advances have changed the landscape of the luminaire industry and
created a homogenous environment. Formerly the industry was dominated by a
handful of large organisations with a strong footprint in signature designs. However,

6
today organisations are using the same product designs. Where there is innovation in
a product, it is often replicated and spread out to the whole industry quickly.
The luminaire industry is now even more innovative compared to the old luminaire
industry. Since the competition is very intensive and margins are eroding,
organisations are trying their best to make themselves a step ahead of their
competitors. Due to the intense competition, organisations have tried to reduce costs
by using thermal plastics to replace sheet metal, using non-isolated driver technology
to replace traditional transformer driver technology, or even using graphene to replace
die castings to reduce weight.
Moore's law (1965) applies in the semiconductor industry, where the unit cost is
falling as the number of transistors in dense integrated circuit boards rises. In the
luminaire industry, product prices drop every 6 months as next-generation products'
performance improves over the same period. However, since 2-3 years ago, LED chips
contribute a smaller percentage to the overall cost of the product as it seems, Moore's
law is slowing down. However, the market is not stable, varied products and prices
cause additional confusion to the consumer.
Due to the rapid improvements in technology, the product lifespan has changed to as
low as 6 months, hence the speed to market is crucial. The supply of products is an
intricate part of the industry as it consists of multiple segments of the electrical
industry, currently, the flow of information in the supply chain is siloed and
information cannot be easily shared and accessed.
Since LED first appeared in the market, it was recognized as high-end technology for
the future, so many organisations rushed into the luminaire industry, however, they
did not realise that besides the LED chips and packaging, everything else is still just

7
simple assembly. Hence, the entry-level into the industry was low and the large
amounts of capital money invested created tremendous competition in the lighting
industry compared to the previous decades.
The above-listed industry problems are mostly found in the lighting industry which has
created challenges in forecasting product demand by the Australian Luminaire Manufacturer.
Other known industries that face similar problems include agriculture (Shukla and Jharkharia,
2013), fashion (Nenni et al.'s, 2013) and spare parts (Van der Auweraer et al.'s, 2017). Chapter
4 will discuss the specific organisational challenges in forecasting uncertain product demand
being faced.
Pilot Study
A preliminary exploration was conducted at ALM to evaluate the current process of
forecasting uncertain product demand in the supply chain. The pilot study involved a series
of pre-interview exploration activities at ALM to gain in-depth information about the overall
supply chain domain and understanding who should formally be interviewed. The activities
were informal and ad-hoc, it involved a walk around the ALM office and asking informal
questions to supply chain stakeholders (informal chats), observing how people perform tasks
and reading existing documentation that was made available. This exploration confirmed and
improved our existing knowledge of the supply chain before conducting the full-scale research
project. Through exploration, a lack of a holistic picture was found on where and how
technology supports the processes carried out. The process include ordering a product from a
supplier through to the customer delivery. This resulted in designing a supply chain process

8
map (section 4.3). The supply chain process map was developed to demonstrate the main
touchpoints from a customer ordering a product to the sourcing and manufacturing to
consumers afterward. The map intends to increase our understanding of the overall supply
chain domain at ALM and help us determine the activities and behaviours that impact
achieving accurate forecasting of uncertain product demand. The process map provides a
quick visual overview of the processes taken in the organisation and is used as a reference
tool during the identification of the barriers in forecasting uncertain product demand. The
process map was in continuous development until the solution phase (chapter 5) because of
the changing business environment/model, processes and technologies. We do not suggest
that every supply chain process or technology is identified in the process map, however, we
suggest that the map illustrates the core processes from ordering a product through to delivery.
Research Scope
Although forecasting uncertain product demand has received a reasonable degree of attention
in the research literature to date, there remains a justified need for new tools that the
practitioners can easily utilise in a luminaire manufacturing organisation. The Australian
Luminaire Manufacturer is the sponsor of this research study. In this industry research project,
we are interested in investigating the state-of-the-art and the state-of-the-practice in an
Australian luminaire manufacturer to develop and evaluate a toolkit that assists practitioners
in forecasting uncertain product demand. This research's principal focus is on improving the
organisations' transparency, efficiency, effectiveness, and useability in forecasting uncertain
product demand. These terms have been defined in section 6.2. The following constraints limit
the scope of the research:

9
1. Many barriers can be considered in forecasting uncertain product demand, however,
this research primarily focuses on improving only the agreed prioritised business
requirements introduced by the organisations executive leadership team.
2. Many methods have been proposed in the literature to improve the accuracy of
forecasts, e.g. (Croston's method, Bootstrap, Auto-Regressive Moving Average, Holt-
Winters etc.). However, in this thesis, we focus primarily on utilising an existing time
series method and improving judgemental adjustments by developing a collaborative
forecasting model. It is important to note that the extent to which this work's
contribution can improve the accuracy of the forecast is considered outside of the
scope due to inherent limitations such as the time required to test and evaluate the
forecast and complexities involved.
3. We develop and test the Australian luminaire manufacturer's toolkit, while other
applications in industries such as fashion and agriculture are not fully explored. This
limitation is per the industry doctorate program agreement.
4. We develop a toolkit as a proof of concept for the research project. Since the software
is in prototype form, the Australian manufacturer's software testing is informal and
hence user-level security access is not essential.
This industry research can attract wide interest among practitioners, therefore we believe that
the toolkit developed for this organisation would benefit most industries that face the same
barriers in forecasting uncertain product demand. In particular, the toolkit enables a
collaborative approach where multiple stakeholders can work towards a common goal.

10
Goals
Our industry research's general hypothesis is that the organisations' process of forecasting
uncertain product demand in the supply chain could be improved in terms of transparency,
efficiency, effectiveness, and useability by using a digital toolkit. Furthermore, it is
hypothesised that the digital toolkit developed would be particularly beneficial for the
organisations' stakeholders (category managers, sales managers and demand planners) when
performing forecasting.
As described and evaluated in this thesis, we design and develop a toolkit that provides
transparency, efficiency, effectiveness, and useability in the forecasting process and enables
collaboration within the stakeholders involved in the organisation. Subsequently, the
following research goals and related questions have been established to examine and validate
these hypotheses.
Research Goal 1: Review and critically analyse the existing state-of-the-art in
forecasting uncertain product demand in the supply chain from empirical literature,
including the existing methods, barriers, and solutions.
Research question 1: What methods are used in forecasting uncertain product demand in the
supply chain?
Research question 2: What are the barriers faced in forecasting uncertain product demand in
the supply chain?

11
Research question 3: What solutions have been adopted to address the barriers in forecasting
uncertain product demand in the supply chain?
Research Goal 2: Investigate and survey the current state-of-the-practice in forecasting
uncertain product demand in Australian Luminaire Manufacturer.
Research question 4: What do supply chain stakeholders from the Australian Luminaire
Manufacturer perceive as state-of-the-practice in forecasting uncertain product demand?
Research question 5: What are the high-level requirements from the Australian Luminaire
Manufacturer to address the barriers of forecasting uncertain product demand?
Research Goal 3: Design a toolkit to support the organisation in forecasting uncertain
product demand.
Research question 6: Can the identified high-level requirements be used to design and
implement a toolkit to support the organisation in forecasting uncertain product demand?

12
Research Goal 4: Evaluate the toolkit's performance for supporting forecasting
uncertain product demand in terms of improvements in transparency, efficiency,
effectiveness and useability.
Research question 7: How transparent is the toolkit in the forecasting process and results of
forecasting uncertain product demand?
Research question 8: How efficient is the toolkit in improving the process of forecasting
uncertain product demand?
Research question 9: How effective is the toolkit in improving the process of forecasting
uncertain product demand?
Research question 10: How useable is the toolkit in improving the process of forecasting
uncertain product demand?
Research Design
Design science research is the research methodology used in this thesis (Chapter 3), according
to Hevner et al.'s (2004), design science creates and evaluates IT artefacts intended to solve
identified organisational problems. In this study, the toolkit developed is referred to as the
artefact. Following the design science research process, we develop our research design
organised into three phases (Figure 1).

13
Figure 1 Research model and methodology

14
Phase 1 is focused on defining the state-of-the-art and state-of-the-practice and identify
industry problems (chapters 2 & 4). In phase 2 we build artefacts (chapter 5) based on the
identified problems in phase 1. The artefact as an outcome of this phase becomes the research
study's object and is the final deliverable to the organisation. Phase 3 (chapter 6) evaluates the
artifact developed in phase 2 to establish if the artifact works as intended and the defined goals
have been achieved. The artefacts are developed as a prototype for evaluation purpose. It is
important to understand the why and how of the artefact to ensure that it worked or failed in
practice. According to the principles of design science research, the evaluations also
contribute to the continuous improvement and iterative development of the artefacts as prior
phases are revisited to refine the solution as deemed essential. This evaluation process is a
crucial and essential activity. It guarantees that the goals of the newly designed and developed
artefacts in the design science research are achieved and that the artefact work as intended
(Gonzalez and Sol, 2012, Peffers et al.'s, 2012).
1.8.1 Phase 1: Environment
The design science research methodology starts with reviewing the most important works on
the industry research problem. This is a crucial phase of the research process, as it provides a
broad view of current studies that experts in the field have presented. Phase 1 of the thesis
comprises the following activities: (1) A scoping exercise to document the current end-to-end
supply chain at a high level (pilot study). This is presented in section 4.3. The scoping allowed
us to map the overall supply chain and identify the pain points in the organisation and confirm
our knowledge of the supply chain. (2) A systematic literature review is undertaken to identify
the barriers, methods and adopted solutions in forecasting uncertain product demand. This is
presented in chapter 2. The primary objective of the review is to provide a foundation for the
research, this involved a thorough review and analysis of empirical studies on and around

15
forecasting uncertain product demand. This systematic literature review identified that
judgmental forecast adjustment is the most cited supply chain literature barrier. (3) A field
study to understand the current state-of-the-practice in forecasting uncertain product demand.
This is presented in section 4.4. This involved in-depth interviews with practitioners who are
involved in the forecasting of product demand in ALM.
The field study's purpose was two-fold: (i) to understand the barriers faced in the state-of-the-
practice in forecasting uncertain product demand; (ii) to elicit the high-level requirements of
the toolkit development in phase 2. Furthermore, this provided us with the ability to triangulate
the results. Triangulation is used to cross-validate the literature review study (the state-of-the-
art) and field study (the state-of-the-practice). As part of the problem identification in the
environment, it was revealed that the decision-making process in judgemental adjustments is
not robust and systematic enough. The systematic literature review and field study findings
have led to the development of a conceptual framework (Chapter 2). This framework was
refined further once the field study was completed.
1.8.2 Phase 2: Solution Build
The solution phase involves designing and developing the toolkit to support the organisation
in forecasting uncertain product demand (Chapter 5). The toolkit will provide transparency in
forecasting, efficiency in the numbers, effectiveness in the process, and being useable. The
solution was built based on the conceptual framework defined in phase 1 to guide stakeholders'
decision-making process. Phase 2 is composed of the following activity: (4) Card Sorting
exercise used to prioritise business requirements elicited from the field study. The card sorting
exercise provided us with the rationale behind practitioners' requirements and prioritisation
reasons. The solution development involved an iterative process where prototypes are revised

16
based on stakeholders' feedback and design rationale over multiple development sprints.
Iterative development aims to ensure that different viewpoints are explored in the organisation
and unnecessary assumptions are not made. This phase of the project remained in progress
until the final refinements made and after receiving feedback and performing rigorous
evaluation in Phase 3.
1.8.3 Phase 3: Evaluation of the Toolkit
According to design science procedure, it is critical to evaluate whether the designed artefact
can effectively solve the problem that motivated its creation (Hevner et al.'s, 2004). We
evaluate and validate the artefacts developed in the build phase to determine if we have
achieved our research goals. Phase 3 of the thesis comprises the following activities: (1) Focus
group for obtaining qualitative insights and evaluation feedback from practitioners of the
toolkit. This is presented in chapter 6. The goal of using the focus group method was to
encourage dialogue between participants and provide a means of gathering information for
iterative development. (2) The questionnaire will gather quantitative and qualitative data for
analysis as they are efficient and less intrusive data collection methods. The evaluation also
provides empirical evidence from the organisation about the toolkit's performance for
forecasting uncertain product demand to improve transparency, efficiency, effectiveness, and
useability. We directly address our Research goal 4 in chapter 6 Error! Reference source
not found.by empirically evaluating the toolkit.
Research Contributions
This industry research uses the design science method (Hevner et al.'s (2004)) to identify
critical barriers in forecasting uncertain demand. Thus digital artifacts are produced as

17
solutions to support the organisation's ability to forecast uncertain demand. The research
presented in this thesis provides several valuable contributions to the body of knowledge and
to supply chain management.
The following are the key contributions of this research:
1. A detailed systematic literature review and analysis of the current state-of-the-art in
forecasting uncertain product demand, including the barriers, techniques and solutions
adopted to address the barriers.
2. A novel decision-making framework to help practitioners make judgmental
adjustments to a forecast through a repeatable and clear decision-making framework.
3. A qualitative field study that covers the end-to-end barriers in forecasting uncertain
product demand in the supply chain of the ALM organisation.
4. Novel digital toolkit to support the supply chain management process and overcome
some of the barriers in forecasting uncertain product demand in the ALM organisation.
5. Empirical evidence on the toolkit's performance for forecasting uncertain product
demand regarding transparency, efficiency, effectiveness, and usability.

18
Practice Contributions
In addition, the research presented in this thesis provides several helpful solutions to the
problems in practice, including:
1. Directly addressing the area of judgmental adjustment by implementing and
encouraging an appropriate degree of structure and rigour.
2. Using the presented approach and the digital toolkit for forecasting, this thesis
demonstrates that practitioners will manage detailed level forecasts better and have
greater transparency in the forecasting process.
3. The digital toolkit presented in the thesis addresses the lack of market intelligence and
segmentation; the toolkit enables practitioners to visualize and reference large
amounts of information effortlessly.
Novelty and Originality
The novelty and originality presented in the research were not restricted to the specific
industry of the investigated organisation. Triangulation of methods used to investigate the
barriers in forecasting uncertain product demand (i.e. industry process map, systematic
literature review, field study) ensured the research's novelty and originality was not restricted
to the specific context. Furthermore, the use of open source technology and forecasting
method as a mechanism to build the digital toolkit and provide the capability for practitioners
to make judgmental adjustments was new and innovative and allowed us to implement
forecasting intelligence into the toolkit for stakeholder dashboard visualisation. The literature
review yielded no results about applications of a specific algorithm to the specific research

19
problem. To support this claim, the literature review lack of sources on showing the algorithm
being used .
Outline of this Thesis
The rest of this thesis is structured as follows:
Chapter 2: Systematic Literature Review
This chapter presents a review of the available literature on forecasting uncertain product
demand in the supply chain, including barriers faced, methods used, and solutions adopted to
address the barriers. This chapter aims to provide a theoretical underpinning for the research
by critically analysing and synthesising empirical studies.
Chapter 3: Methodology and Research Design
This chapter introduces the research methodology and design adopted for this industry
research project. We select design science as the appropriate research methodology to answer
the research questions and deliver a digital artefact to solve the problems in the ALM
organisation. The research activities are presented and then described.
Chapter 4: Field Study
In this chapter, we survey the current state-of-the-practice barriers of forecasting uncertain
product demand. We present the initial scoping of the overall supply chain and challenges
practitioners face within the ALM organisation. The results of the in-depth interviews we
conducted with practitioners is presented and discussed. The elicitation of high-level
requirements and their prioritisation using card sorting is also presented.
20
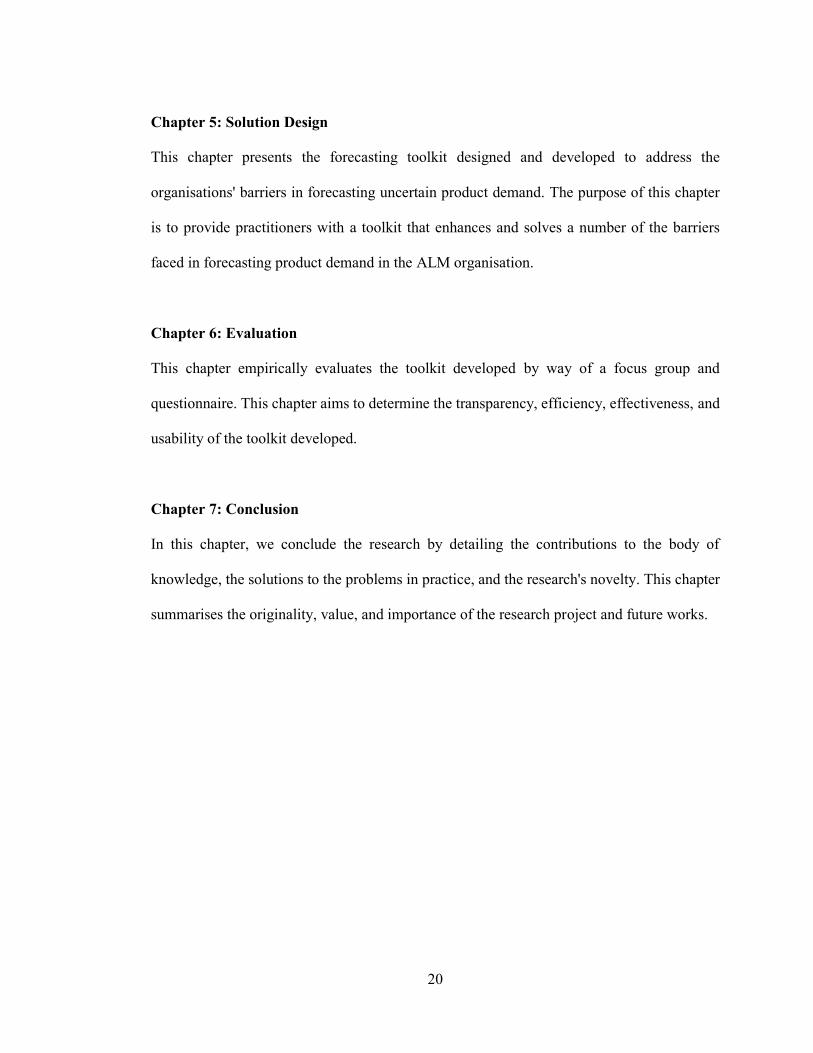
Chapter 5: Solution Design
This chapter presents the forecasting toolkit designed and developed to address the
organisations' barriers in forecasting uncertain product demand. The purpose of this chapter
is to provide practitioners with a toolkit that enhances and solves a number of the barriers
faced in forecasting product demand in the ALM organisation.
Chapter 6: Evaluation
This chapter empirically evaluates the toolkit developed by way of a focus group and
questionnaire. This chapter aims to determine the transparency, efficiency, effectiveness, and
usability of the toolkit developed.
Chapter 7: Conclusion
In this chapter, we conclude the research by detailing the contributions to the body of
knowledge, the solutions to the problems in practice, and the research's novelty. This chapter
summarises the originality, value, and importance of the research project and future works.

21
2 Systematic Literature Review
Chapter Overview
In the previous chapter, we introduced the background of the Australian Luminaire
Manufacturer organisation and the main aspects of the industry research, including the
industry problem, scope, goals, methodology and contributions. As a result, we were able to
identify a real need for the development and enhancement of a new and improved forecasting
approach for uncertain product demand. The goal of the new approach is to improve
transparency and efficiency in the organisation. This chapter will review the relevant
theoretical concepts and background that underpin the research presented in this thesis. This
chapter aims to provide a theoretical foundation for our research by conducting an extensive
literature search and investigating the state-of-the-art in forecasting uncertain product demand
(Research Goal 1). There have been several systematic reviews in the supply chain that have
used guidelines such as (Hart, 1998, Bryman, 2012): (1) source identification, (2) source
selection, (3) source evaluation, and (4) data analysis. We examine evidence-based research
related to forecasting uncertain product demand in the supply chain related to our industry
problem. The literature review was initiated by following guidelines of (Kitchenham and
Charters, 2007). According to the guidelines, researchers must develop a plan and execution
process of the systematic literature review to show the rigour of the review and make the
results reliable and transparent. The protocol developed is presented in full details in Appendix
F. The literature review provides a context for the research from both empirical and theoretical
perspectives. A good review should provide comprehensive coverage and focus on the
concepts related to the research problem by following a structured approach of locating all the
relevant sources for review (Webster and Watson, 2002). The findings from this systematic

22
review provide important insights and directions for our research in a particular direction for
the field study (chapter 0) and solution design (chapter 5). The systematic literature review
execution and qualitative results are presented in full details in Appendix G.
This chapter is organised as follows: A background is first provided on supply chain and
forecasting uncertain product demand (chapter 2.2), followed by a systematic analysis of the
state-of-the-art in forecasting uncertain demand focusing on the available methods (chapter
2.3.1), barriers (chapter 2.3.2), and solutions adopted (chapter 2.3.3). This will be followed
by our analysis and discussion on the relationships between the barriers, methods and
solutions (chapter 2.4.1), the benefits and limitations of uncertain product demand (chapter
2.4.2) and proposing a decision making framework for judgemental adjustments (chapter
2.4.3. A summary (chapter 2.5) of the entire chapter is then provided.
Background
There are three significant types of uncertainty that plague supply chains: uncertainty of the
demand forecast, uncertainty in the external process, and uncertainty in the internal supply
process (Keskinocak and Uzsoy, 2011). These can be attributed to three forces: (1) supplier
uncertainty, arising from on-time performance, lateness, and degree of inconsistency; (2)
manufacturing uncertainty, arising from process performance, machine breakdown, supply
chain performance; and (3) customer/demand uncertainty, arising from forecasting errors,
irregular orders (Chen and Paulraj, 2004). To manage and reduce uncertainty in the supply
chain, frameworks such as (Angkiriwang et al.'s, 2014, Wadhwa et al.'s, 2008) have been
developed to deal with changing business environments by achieving better supply chain
flexibility. However, achieving flexibility in organisations has been noted to be costly
(Gunasekaran and Ngai, 2004).

23
This study researches the customer/demand uncertainty as the need for accurate forecasts of
uncertain product demand (UPD) is well recognised in literature Syntetos and Boylan (2005),
(Danese and Kalchschmidt, 2011b, Syntetos and Boylan, 2001), for both operations
management (Amoako-Gyampah and Meredith 1989), and supply chains (Cox and Loomis,
2006; Ekzos, C., Mansuri, S. A., Bourlakis, M., 2006; Parvin Jr. and Beruvides, 2017). The
following section describes what uncertain product demand is.
2.2.1 What is uncertain product demand?
Uncertain product demand relates to customer orders that are not known in advance, where
certain product demand is when standard orders are placed based on a known demand
(Doukidis and Vrechopoulos, 2006).
Traditionally supply chains had a 'make-to-stock' paradigm which in many cases have been
replaced by 'make-to-order' where the final part of manufacturing or configuration of a product
is postponed as much as possible, usually, until a customer order is received (Lee and Tang,
1997). This make-to-order model is particularly suited for organisations that produce
customised products to satisfy demand in a market environment where there are diverse
customer taste and preferences, rapid developments in technology and globalization of
management (Hsu and Wang, 2004). Organisations need to decide on the number of
components they source or stock-keeping units (SKU) they manufacture before the customer
demands it in the next sales. This problem is known as uncertain demand forecast and has
widely been studied in economics and supply chain management (SCM) (Kempf et al.'s,
2018).

24
2.2.2 Overview of Supply Chain
Supply chains are known to be large, complex and often unpredictable as they are spread over
multiple organisational departments and include four essential functions: sales, distribution,
production, and procurement (Arshinder et al.'s, 2008). However, to obtain effective output,
supply chains' operational management requires robust methods and strategies that serve dual
purposes. First, these strategies should help a firm reduce the cost and/or improve customer
satisfaction under normal circumstances (Tang, 2006). Second, the same strategies should
enable organisations to better understand how unexpected disruptions occur, the impacts they
will have on the flow of goods to meet customer demands (Qi et al.'s, 2017) and how to sustain
the organisations' operations during and after a major disruption (Tang, 2006). The ability to
have visibility in the supply chain provides opportunities for managers to plan efficiently and
react appropriately to accurate information (Ali et al.'s, 2017). The visibility in the supply
chain created a flow of information that directly impacts the production scheduling, inventory
control, and delivery plans of members in the supply chain (L. Lee et al.'s, 2004).
2.2.2.1 Sales and Operations Planning
Supply chain management involves the sales and operations planning process which lies at
the strategic and tactical level. Sales and operations planning (S&OP) involves a combination
of people, process and technology (Noroozi and Wikner, 2017). The demand forecast is a
process that is carried out within the S&OP process of an organisation. S&OP is defined as 'a
process to develop tactical plans that provide management with the ability to strategically
direct its businesses to achieve competitive advantage continuously by integrating customer-
focused marketing plans for new and existing products with management of supply chain'
(Richard E. Crandall, 2018, p.153). Several authors (e.g. (Grimson and Pyke, 2007, Wallace,

25
2008, Oliva and Watson, 2011, Noroozi and Wikner, 2017)) have suggested that five formal
steps are performed in S&OP. Research has also focused on the design and methodology
approach of S&OP (e.g. (Kjellsdotter et al.'s, 2015, Wagner et al.'s, 2014, Belalia and Ghaiti,
2016, Jesper and Patrik, 2017)). Based on these studies, it is suggested that S&OP is not a
'one-size-fits-all' process and that there is a need to consider the internal company context,
external company context and the specific industry to address the unique S&OP problem
(Jesper and Patrik, 2017). In the supply chain context, there are integration issues that impact
the S&OP process. Integration can be considered both vertical and horizontal, where vertical
integration refers to linking the strategic plan, business plan, financial plan and long-term
objectives to short-term operational planning. Horizontal integration is concerned with the
"cross-functional" integration considering both inter-and intracompany activities (Thomé et
al.'s, 2012, Thomé et al.'s, 2014). Grimsson and Pyke (2007), state that traditional S&OP is
'internally focused and technologically challenged'. The S&OP process is considered more
about employees participating in the process setup than just using a set of models or software
(Bower, 2012, Grimson and Pyke, 2007, Petropoulos and Kourentzes, 2014). It is more
important to have a well-documented and understood S&OP business process than to have
sophisticated software (Grimson and Pyke, 2007).
2.2.2.2 Forecasting methods
There has been significant research on forecasting methods in the supply chain, largely work
of Croston's influential article (Croston, 1972) which for many years has been neglected but
in the last 15 years has gained prominence i.e. 286 citations (Scopus accessed July 27, 2019),
to the adaptions of Croston's method such as Syntetos-Boylan Approximation (SBA)
(Syntetos and Boylan, 2001). Alternative approaches have been proposed such as

26
Bootstrapping the use of statistical models such as Auto-Regressive Moving Average
(ARMA), Discrete ARMA (DARMA) model, and integer-valued ARMA (INARMA). Most
forecasting methods are completely or partially based on the observations of historical data
and deal with a limited range of variations of the demand these are well suited for known
demand (WemmerlÖV and Whybark, 1984). There are multiple reviews (e.g.(Jesper and
Patrik, 2017, Noroozi and Wikner, 2017, Thomé et al.'s, 2012, Tuomikangas and Kaipia,
2014) in SCM and related concepts, however, they do not adequately cover forecasting
uncertain product demand. On the other hand, there are paucity methods used for uncertain
demand as uncertainty has usually been associated with known demand (Bartezzaghi et al.'s,
1999).
Over the last 3 decades, it has been found (Cox and Loomis, 2006) that there has been a trend
in textbooks to include more statistical and judgmental methods. Also, it was found that
textbooks spend more time on integrating judgement with quantitative methods. A vast debate
is ongoing regarding the usefulness of quantitative methods and qualitative methods such as
judgmental adjustments, for example, Sanders and Manrodt (2003), provide a review on the
contributions to this debate. Eksoz et al.'s (2014) find that judgmental adjustments cannot be
ignored due to contextual information in uncertain demand. Therefore, it is a requisite to
modify statistical forecasts due to the descendent information available such as a forecaster's
experience, competitor related and /or environmental related rumours.
2.2.2.3 Forecasting Challenges
Forecasting is the fundamental step of demand management that optimizes customer
satisfaction through the supply chain's capabilities (Albarune and Habib, 2015). The
inaccuracy in product forecasting has been understood to have dire consequences for the

27
supply chain's intra- and inter-organisational levels (Fildes et al.'s, 2009). Poor accuracy in
the forecast leads to stockouts (Fildes et al.'s, 2009), excess inventory (Worthen, 2003), and
not achieving target service levels (Baecke et al.'s, 2017, Fildes et al.'s, 2009). Accurate
forecasting is complex and hence difficult due to the inter-related nature of the data series, the
presence of unusual non-repetitive events, trend shifts in demand (Fildes and Beard, 1992),
and the antecedent factors of global sourcing (Stanczyk et al.'s, 2017), including bullwhip
effect arising from dynamics of inventory management in supply chains (Lee et al, 1997; Chen
and Paulraj, 2004).
The size and complexity of forecasting uncertain demand at the individual Stock Keeping
Unit (SKU) create additional difficulties in forecasting each period and necessitates the use of
statistical methods (Syntetos et al.'s, 2010b), such as, simple exponential smoothing (SES),
Croston's method (Croston, 1972), and Syntetos-Boylan Approximation (SBA) (Syntetos and
Boylan, 2005). While statistical methods have been studied and compared (Petropoulos et
al.'s, 2019) they alone cannot solve all the barriers faced in forecasting uncertain product
demand. The use of judgmental adjustments to existing statistical method forecasts is typically
relied on by organisations to improve forecast accuracy because domain experts' knowledge
represents a previously unmodelled component (Lawrence et al.'s, 2006). Several studies (e.g.
(Fildes et al.'s, 2009, Trapero et al.'s, 2013, Goodwin and Fildes, 1999, Goodwin, 2002)), have
demonstrated that experts can still add value because they are better at recognizing when
adjustments to a forecast are made based on their experience, additional information, and
when unexpected events occur. However, other studies (e.g. (Syntetos et al.'s, 2009, Franses
and Legerstee, 2013, Lawrence et al.'s, 2006)), found that experts place too much weight on
their forecast adjustments and the overall improvement does not significantly outperform
statistical forecasts as the accuracy of judgmental adjustments reduces over time.

28
The current literature lacks a sound theoretical basis to link the barriers in forecasting
uncertain product demand with forecasting methods and adopted solutions. Our research
results (chapter 2.3) provide a theoretical foundation and systematically identify diverse
literature to investigate uncertain product demand forecasting in the supply chain, barriers
being faced, forecasting methods used, and forecasting solutions adopted in supply chain.
Results from Systematic Literature Review
This section presents the SLR results related various concepts used for problem definition and
scoping of the research and to answer the research questions for Goal 1. The results for the
following research questions are reported:
Research question 1: What methods are used in forecasting uncertain product demand in the
supply chain?
Research question 2: What are the barriers faced in forecasting uncertain product demand in
the supply chain?
Research question 3: What solutions have been adopted to address the barriers in forecasting
uncertain product demand in the supply chain?
2.3.1 Forecasting methods used for uncertain demand
There is a total of 38 methods identified, to give a more comprehensive picture of the results
obtained, Error! Reference source not found.Table 1 maps the studies against each method
adopted.

29
Table 1 Forecasting Methods
Forecasting
Methods
Description Extracted from the following
studies
Single/Simple Exponential Smoothing. (SES)
This method is based on averaging (smoothing) past values of a time series exponentially by using a smoothing factor between 0 and 1.
(Fildes et al.'s, 2009), (Huang et al.'s, 2014), (Petropoulos et al.'s, 2014), (Petropoulos et al.'s, 2016b), (Syntetos et al.'s, 2010a), (Ma et al.'s, 2016), (Syntetos et al.'s, 2015), (Trapero et al.'s, 2012), (Zied Babai et al.'s, 2014), (Goodwin et al.'s, 2007), (Heinecke et al.'s, 2013)
Other Derived Methods
Other custom methods or modifications are not common in the literature. i.e. integer programming, Sample Average Approximation (SAA) method
(Chao, 2013), (Chen-Ritzo et al.'s, 2010), (Franses and Legerstee, 2013), (Hansen and Grunow, 2015), (Hemmelmayr et al.'s, 2010), (Krishnan et al.'s, 2011), (Laurent Lim et al.'s, 2014), (Disney et al.'s, 2016)
Croston's Method A method specialized for dealing with intermittent demand and evolved from the SES method.
(Petropoulos et al.'s, 2014), (Petropoulos et al.'s, 2016b), (Snyder et al.'s, 2012), (Syntetos et al.'s, 2015), (Zied Babai et al.'s, 2014), Heinecke et al., 2013)
Syntetos-Boylan Approximation (SBA)
Developed based on Croston's method to decrease the error of bias.
(Petropoulos et al.'s, 2014), (Petropoulos et al.'s, 2016b), (Syntetos et al.'s, 2010a), (Syntetos et al.'s, 2015), (Zied Babai et al.'s, 2014), Heinecke et al., 2013)
Naïve Simple method where last periods actuals are used as this period's forecast without any adjustments.
(Fildes et al.'s, 2009), (Petropoulos et al.'s, 2014), (Petropoulos et al.'s, 2016b), (Trapero et al.'s, 2012), (Zied Babai et al.'s, 2014), (Goodwin et al.'s, 2007)
Autoregressive AR (1)
Autoregressive is a stochastic calculation in which the forecast is estimated based on a weighted sum of past values.
(Ali et al.'s, 2012), (Krishnan et al.'s, 2011), (Trapero et al.'s, 2012), (Ali et al.'s, 2017)
Simple Moving Average (SMA)
Assumes the average of the actual period is good behaviour for forecasting the future. It is also used to forecast long term trends
(Ali et al.'s, 2012), (Petropoulos et al.'s, 2014), (Trapero et al.'s, 2012), Ali et al., 2017)
Holt's Exponential Smoothing (Holt)
Sometimes called double exponential smoothing, it is an extension of SES with a trend factor.
(Petropoulos et al.'s, 2014), (Moser et al.'s, 2017), (Goodwin et al.'s, 2007)
Bootstrap A modern approach to a statistical method where alternative estimates can be derived.
(Fildes et al.'s, 2009), (Porras and Dekker, 2008), (Syntetos et al.'s, 2015)

30
Damped Exponential Smoothing (Damped)
This variation offers a dampening factor multiplied on the trend component of Holt's method to enhance control over the trend which may dominate the forecast.
(Petropoulos et al.'s, 2014), (Goodwin et al.'s, 2007)
Teunter, Syntetos and Babai (TSB) Method
Forecasts of the non-zero demands are multiplied by the forecast of the probability that a non-zero demand will occur
(Petropoulos et al.'s, 2014), (Zied Babai et al.'s, 2014)
Base-times-lift A simple exponential smoothing model generates baseline forecasts, and then makes adjustments for any incoming promotional event.
(Huang et al.'s, 2014), (Ma et al.'s, 2016)
Auto-regressive moving average (ARMA)
This model is primarily used to forecast stationary products.
(Ali et al.'s, 2012), Ali et al., 2017)
Autoregressive Distributed Lag (ADL)
It is a simple regression style model that can consider the effect of the price and promotional variables.
(Huang et al.'s, 2014), (Ma et al.'s, 2016)
Poisson distribution (P)
A model used to forecast the probability of events occurring.
(Porras and Dekker, 2008), (Snyder et al.'s, 2012)
Average of statistical and judgmental
The average of a chosen statistical method and the average of judgmental adjustment are added together to form a forecast.
(Petropoulos et al.'s, 2016a), (Fildes and Goodwin, 2007)
Decision Support System
An information system containing data and rules used to help decision makers come up with a forecast value.
(Nenes et al.'s, 2010), (Trapero et al.'s, 2013)
Lease absolute shrinkage and selection operator (LASSO)
A statistical regression method that performs both variable selection and additional information to enhance accuracy.
(Huang et al.'s, 2014), (Ma et al.'s, 2016)
Holt-Winters Involves the use of three smoothing factors, a simple smoothing factor, a trend smoothing factor and a seasonality factor.
(Petropoulos et al.'s, 2014)
Linear Regression A method that measures one variable's relationship to another such as the demand to time; each of which is dependent.
(Petropoulos et al.'s, 2014)
Linear Trend also known as Trend-Line
Provides a line of best fit to a time series of historical data.
(Petropoulos et al.'s, 2014)
Zero Forecast Forecasting Series that uses previous Actuals as a baseline.
(Snyder et al.'s, 2012), (Zied Babai et al.'s, 2014)
Negative binomial This is an extension of the Poison model where better predictions may be obtained from distributions.
(Snyder et al.'s, 2012),
Hurdle shifted Poisson
Where a probability of a non-zero demand in a period is allowed to change over time and where demand occurrence is smoothed over time.
(Snyder et al.'s, 2012),
Autoregressive Integrated Moving Average (ARIMA)
Ability to model stationary and non-stationary data
(Trapero et al.'s, 2012)

31
Theta The method aims at breaking down the data into simpler series, a decomposition approach is used to create the so-called Theta-lines.
(Petropoulos et al.'s, 2014)
Normal distribution (N) model also known as Gaussian distribution
A continuous probability model that occurs naturally in many situations. This can also be referred to as the bell curve.
(Porras and Dekker, 2008)
Generalized Bass Used to model the likelihood of a new product being adopted.
(Krishnan et al.'s, 2011)
Aggregate- disaggregate intermittent demand approach (ADIDA)
A method used to reduce lower frequency demand by reducing zero demand or disaggregating the demand.
(Petropoulos et al.'s, 2016b)
Inverse Aggregate- disaggregate intermittent demand approach (iADIDA)
A method used to reduce the variances in demand sizes and focuses on the estimation of inter-demand variables
(Petropoulos et al.'s, 2016b)
Judgmental adjustment alone
An intuitive judgment used when there is a lack of data i.e. (when a new product is being launched, or when a new competitor enters the market)
(Fildes and Goodwin, 2007)
A statistical forecast judgmentally adjusted
A statistical method is used and adjusted manually by the forecaster.
(Fildes and Goodwin, 2007)
Average of two statistical methods
The average of two different statistical method results is added together to produce a forecast.
(Goodwin et al.'s, 2007)
Bayesian forecasting Used to calculate the probability of future uncertain events that are based upon relevant evidence relating to historical data.
(Yelland, 2010)
Echelon An echelon model consists of three decision areas: the forecasting and orders sector tracks the incoming customer orders, maintains the echelon sales forecast, and generates material orders.
(Udenio et al.'s, 2015)
Harvey and Fernandes
Uses a discounted moving average instead of an exponentially weighted average and a negative binomial distribution instead of a Poisson distribution.
(Snyder et al.'s, 2012)
Variable Neighborhood Search (VNS)
Set of predefined neighbours are explored in iterations to provide a better result.
(Hemmelmayr et al.'s, 2010)
Blattberg-Hoch '50% method, 50% manager' involves taking the mean of a judgmental and a statistical forecast.
(Fildes et al.'s, 2009)
Out of 66 papers, 30 studies investigated several different forecasting methods with a total
frequency of 90. Two papers (Petropoulos et al.'s, 2014) and (Zied Babai et al.'s, 2014)

32
evaluated five or more forecasting methods. According to Table 1Error! Reference source
not found., out of 66 papers, 11 studies have examined simple exponential smoothing (SES)
and a further 6 studies have looked at Croston's Method, Syntetos-Boylan Approximation
(SBA) and Naïve. These methods have attempted to address some of the barriers in forecasting
uncertain demand. Our analysis of these methods did not reveal if there is one best method to
overcome the barriers in forecasting uncertain demand. These methods will be further
analysed in chapter 2.4.2.
The included studies were used to evaluate the wide range of industries where the forecasting
methods have been applied (see Table 2). There are 23 industries that the studies cover, SES
was the most used method in our studies used 21 times across 10 different industries. Simple
exponential smoothing was the first forecasting method proposed in 1956 to be used for
uncertain demand (Brown, 1957). Several papers indicate that using SES works and performs
well (Snyder et al.'s, 2012, Syntetos et al.'s, 2015, Petropoulos et al.'s, 2014), whether or not
a more complex method is worth the considerable added complexity is questionable. Our data
analysis also supports this, showing many complex statistical methods are used less across
industry. In contrast, judgmental adjustment and SES are applied across many industries that
produce goods, particularly electronics manufacturing.
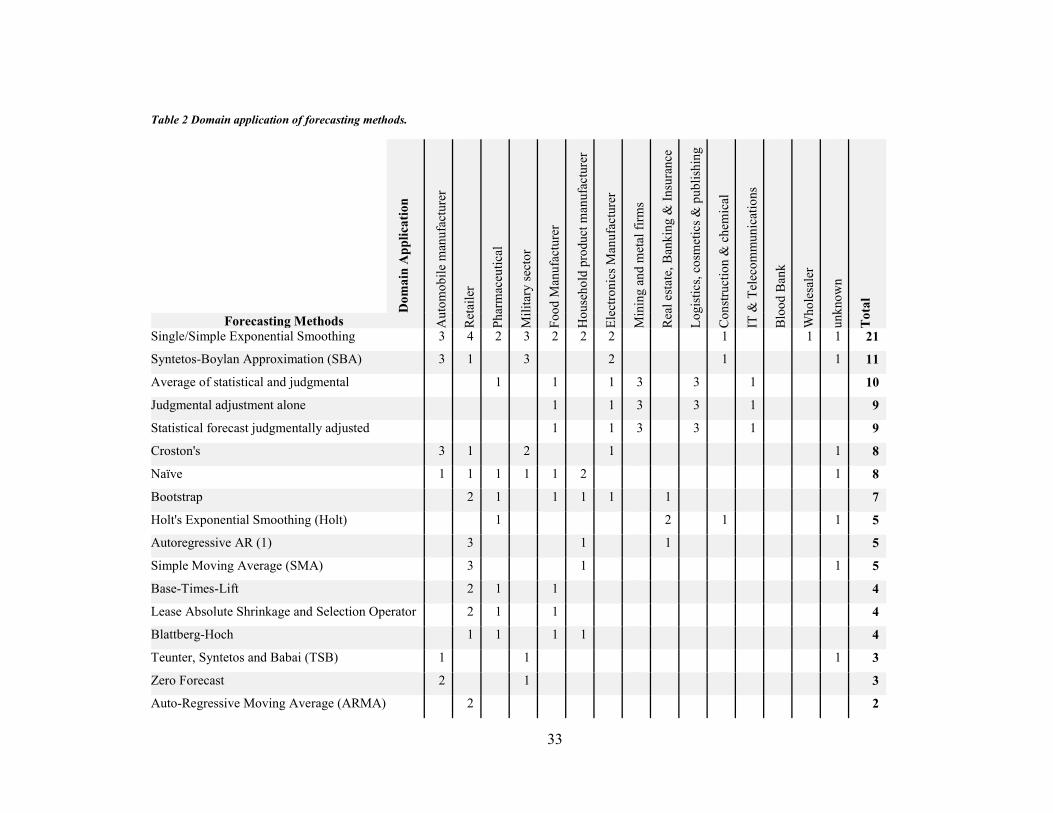
33
Table 2 Domain application of forecasting methods.
Dom
ain
App
licat
ion
A
utom
obile
man
ufac
ture
r
Ret
aile
r
Phar
mac
eutic
al
Mili
tary
sect
or
Food
Man
ufac
ture
r
Hou
seho
ld p
rodu
ct m
anuf
actu
rer
Elec
troni
cs M
anuf
actu
rer
Min
ing
and
met
al fi
rms
Rea
l est
ate,
Ban
king
& In
sura
nce
Logi
stic
s, co
smet
ics &
pub
lishi
ng
Con
stru
ctio
n &
che
mic
al
IT &
Tel
ecom
mun
icat
ions
Blo
od B
ank
Who
lesa
ler
unkn
own
Tot
al
Forecasting Methods Single/Simple Exponential Smoothing 3 4 2 3 2 2 2 1 1 1 21
Syntetos-Boylan Approximation (SBA) 3 1 3 2 1 1 11
Average of statistical and judgmental 1 1 1 3 3 1 10
Judgmental adjustment alone 1 1 3 3 1 9
Statistical forecast judgmentally adjusted 1 1 3 3 1 9
Croston's 3 1 2 1 1 8
Naïve 1 1 1 1 1 2 1 8
Bootstrap 2 1 1 1 1 1 7
Holt's Exponential Smoothing (Holt) 1 2 1 1 5
Autoregressive AR (1) 3 1 1 5
Simple Moving Average (SMA) 3 1 1 5
Base-Times-Lift 2 1 1 4
Lease Absolute Shrinkage and Selection Operator 2 1 1 4
Blattberg-Hoch 1 1 1 1 4
Teunter, Syntetos and Babai (TSB) 1 1 1 3
Zero Forecast 2 1 3
Auto-Regressive Moving Average (ARMA) 2 2

34
Autoregressive Integrated Moving Average 1 1 2
Autoregressive Distributed Lag (ADL) 1 1 2
Poisson distribution (P) 1 1 2
Aggregate-Disaggregate Intermittent Demand
Approach 1 1
2
Inverse Aggregate-Disaggregate Intermittent
Demand Approach 1 1
2
Decision Support System 1 1 2
Holt-Winters 1 1
Damped Exponential Smoothing 1 1
Linear Regression 1 1
Linear Trend 1 1
Negative Binomial 1 1
Hurdle Shifted Poisson 1 1
Theta 1 1
Normal Distribution (N) 1 1
Generalized Bass 1 1
Average of two statistical methods 1 1
Bayesian 1
Echelon 1 1
Harvey and Fernandes 1 1
Variable Neighborhood Search (VNS) 1 1
Other Derived Methods 1 1 3 1 2 1 1 11
21 24 13 13 11 10 9 9 8 5 4 3 2 1 14 155

35
Over time improvements have been made to forecasting methods, the development of Croston's
method is based on exponential smoothing is said to be much more beneficial for uncertain demand
over SES. Many improvements have been made to Croston's original method, including the Syntetos
and Boylan method (known as the SBA method for Syntetos-Boylan Approximation). In the
empirical study, Gutierrez et al.'s (2008) have tested all three: SES, Croston's original method, and
the SBA method. These methods also had the highest frequency in the selected studies and are used
in multiple industries including the electronics industry

36
2.3.2 Barriers faced in forecasting uncertain demand
The barriers identified are divided into two categories namely, internal barriers and external
barriers. In Table 3 we present all the barriers given in the studies that are considered to be
causing internal and external barriers in forecasting uncertain product demand. Internal
barriers are found to be within an organisations' internal environment made up of employees,
management, communication and culture (Parmar et al.'s, 2016). The external barriers relate
to outside factors that can impact an organisation in its ability to forecast demand.
Table 3 Forecasting barriers grouped against category & dimension
Category Dimension Forecasting Barrier
Internal Technology Fragmented information technology
Difficulties analysing information being shared
Changes in technology
Product Product price change
New product introduction
Substitute product introduction
Product customization
Large product range
Short product lifecycle
Marketing Promotions and advertising activity
Management Senior management influence
Political influence
Lack of agility
Communication Judgmental adjustment
Poor communication
Operations Safety stock
Rough estimates on inventory level
Too many forecast methods
External Culture Lack of trust
Exaggeration of demand forecast
Environment Weather

37
Holidays
Strikes
International crisis
Change in Government policy/regulation
Unique events i.e. sporting event
Seasonality
Suppliers Lead times
Loss of key players i.e. supplier, manufacturer
Technology Social media
Competitors Competitor activities i.e. promotions, advertising
Out of the 66 studies, 33 studies express internal barriers faced in forecasting uncertain
product demand and make 50% of the results, while 17 papers are reporting external barriers
only. It is interesting to note that in our SLR we found that many forecasting demand barriers
still exist today, the most prominent problem identified by the internal category is product
related and for external, it is the environment. Figure 2 shows the percentages of the studies
selected that have barriers in these dimensions.

38
Figure 2 Percentage of barriers in the internal and external dimension
The most frequent barrier occurring in the product dimension is the product price change
which impacts the ability to forecast demand accurately. The highest frequent barrier
occurring within the environment dimension is the seasonality, which affects customer
purchasing habits and the demand for products. Overall the highest barrier mentioned in the
studies is the judgmental adjustments from the internal category and communication
dimension, which causes bias and reduces the forecast accuracy. Several studies (Fildes and
Goodwin, 2007, Fildes et al.'s, 2009, Syntetos et al.'s, 2016) have attempted to address this
barrier by asking managers to justify their adjustments which have shown to discourage
adjustments made without a factual basis. The comparison of previous judgmental adjustment
performance has also been used in several studies (Fildes and Goodwin, 2007, Franses and

39
Legerstee, 2013, Goodwin et al.'s, 2007) to try and reduce this barrier by allowing forecasters
to compare previous results of their adjustment to help them understand the sales forecast. A
brief description of these dimensions follows:
1. Technology. This dimension encompasses technological barriers faced in forecasting
demand. A representative article is “Organizational factors in sales forecasting
management “ by (Davis and Mentzer, 2007) found that sales forecasting information
resides on multiple systems maintained by different functional areas, or, in the worst case,
by an employee in a personal program on a desktop computer. It also states that
fragmented Information Technology resources require manual intervention that
introduces errors that degrade data integrity. The technology dynamics are also discussed
by (Vanpoucke et al.'s, 2014). The paper found that introducing new technology requires
a dynamic environment where organisations can adapt to change. For instance, (Fildes
and Goodwin, 2007) found that one of the reasons for using judgmental adjustments is
due to changes in technology.
2. Product. This dimension discusses the product-related barriers such as product
customization, product price change, new or substitute product introduction, large product
ranges and short product lifecycles. A representative article is “Sales and operations
planning in systems with order configuration uncertainty” by (Chen-Ritzo et al.'s, 2010).
This study discusses order configuration uncertainty created by configure-to-order supply
chains. A stochastic model was used, and it was shown to have significant benefits in
profit and revenue. Several organisations today require product customization abilities to
remain competitive. For instance, (Poulin et al.'s, 2006) developed a framework that

40
comprised eight personalization options for golf clubs that can be combined to perform a
complete personalized offer. The business orientation is said to be important for the
strategy an organisation takes on its product range. For instance, (Lynch et al.'s, 2012)
found that having a balanced business orientation approach reduces vulnerability to
change within the supply chain and enables a more flexible and agile response. For
example, having a production orientation forces the decision to rationalize product range
to meet customization needs.
3. Marketing. This topic relates to promotions, campaigns and advertising that aim to modify
customer behaviour. A representative article is “Against your better judgment? How
organizations can improve their use of management judgment in forecasting” by (Fildes
and Goodwin, 2007) This research demonstrated that promotional and advertising
activities were the main reasons for adjusting statistical forecasts. Applying a statistical
method to these events would be difficult due to the lack of history. Incorporating
marketing information, including prices and promotions on the focal product's sales, has
been studied: e.g, (Huang et al.'s, 2014) refined the marketing information then identified
the most relevant explanatory variables and applied the Autoregressive Distributed Lag
(ADL), model. It was found that the method generated substantially more accurate
forecasts across a range of product categories than the benchmark models that were simple
exponential smoothing and base-times-lift. However, the study also found that an
automatic ADL model proved to be costly and seen to be difficult to implement for most
organisations due to the lack of expertise.

41
4. Management. Articles on this topic typically focus on political influence on a forecast by
management in an organisation. A representative article is “The effects of integrating
management judgement into intermittent demand forecasts” by (Syntetos et al.'s, 2009).
This study looks at the value being added, or not, when statistically derived forecasts are
judgmentally adjusted by management. The study finds that an excessive upward
adjustment to inventory levels can be motivated by political factors such as pressure from
senior management to obtain high service levels. It has also been found that negative
adjustments or inventory replenishment related decisions by management perform better
than positive ones. Other studies have concluded that management generally deviate from
the outcomes of a statistical method. For example (Boulaksil and Franses, 2009) survey
results suggest that one out of every two experts completely ignore statistical-based
forecasts and create their own.
5. Communication. This topic tends to contain articles identifying communication barriers
within firms such as the lack of cross-functional communication in marketing, sales,
operations and finance. A representative article is “Effective forecasting and judgmental
adjustment: an empirical evaluation and strategies for improvement in supply-chain
planning” by (Fildes et al.'s, 2009) examined 16 case studies. They found that the
coordination and communication between the different organizational units involved in
the supply chain operations are flawed. (MacGregor, 2001) also found that poor
communication leads to double counting or omissions in the forecast.
6. Operations. Articles look at the SCM as a cross-functional company concept to improve
coordination of entire value chains and the bottlenecks that arise. A representative article

42
is “Electronic supply network coordination in agri-food networks. Barriers, potentials, and
path dependencies” (Fritz and Hausen, 2009). The study establishes barriers to adopting
SCM improvements such as the need for high safety stock due to varying demand that
often leads to large remaining stocks and the inefficiencies in order processing. The study
finds that due to different structures, behaviours, a large variety of process and interface
variants leads to inefficiency of the entire value network and too low reactivity in the
production of products.
7. Culture. Research in this topic includes forecasting exaggeration, trust between supply
chain partners and the contracts that can mutually reinforce each party. A representative
article is “A rewarding-punishing coordination mechanism based on Trust in a divergent
supply chain” by (Pezeshki et al.'s, 2013). This study develops a new rewarding-punishing
coordination mechanism based on trust between supply chain tiers. Honest and deceptive
partners are a differentiation factor that is considered. The results show that including a
trust decimal factor performs better than having no trust mechanism in all situations.
8. Environment. This topic has articles exploring areas such as international crisis, holidays,
seasonality, and unique events that impact product demand forecasting. A representative
article is “'Horses for Courses' in demand forecasting” (Petropoulos et al.'s, 2014).
Through empirical investigations of popular forecasting methods, the study found that
seasonality is one influence that needs to be considered in forecasting intermittent
demand. Another article (Fildes and Goodwin, 2007) found that there are many
environmental reasons i.e. weather, holidays strikes, for why statistical forecasts are
adjusted to cater for this uncertainty. Further results by (Gil-Alana et al.'s, 2008) results

43
show that a simple method with seasonal variables outperforms more complex methods
over short horizons.
9. Suppliers. This topic relates to the barriers faced with lead times and the loss of key
players in the supply chain such as suppliers. A representative article is “ An examination
of the role of Business orientation in an uncertain business environment” (Lynch et al.'s,
2012). This paper investigates whether an over-dependence on a dominant business
orientation increases the risks in sustaining successful business performance in an
uncertain business environment. Some characteristics with a production orientation
organisation found lead times had to be reduced from their supplier from 11-12 weeks to
7-8 weeks. This is due to the heightened uncertainty of demand levels and the desire to
hold fewer inventory levels. In a relationship orientation organisation, a loss of key players
at both the manufacturing and supplier level was shown to result in heightened tension
amongst the horizontal layers within the supply chain.
10. Competitors. This dimension relates to competitor activities such as competitor
promotions product launches or product price changes that may impact the demand
forecast. A representative article is “The value of competitive information in forecasting
FMCG retail product sales and the variable selection problem" (Huang et al.'s, 2014). This
study finds that in a competitive market, tension increases among suppliers as all players
fight hard to chase sales in a difficult market. A competitive market's effect leads to an
abundance of information such as promotions that are also noted to be overlooked by
organisations.

44
It is important to note that these dimensions are not mutually exclusive, where some overlap,
such as in the internal environment, marketing overlaps with operations. The creation of
promotions by marketing can cause a lack of inventory in operations which creates a strain on
uncertain product demand forecasting. The overlaps between these barriers can be due to a
lack of vertical or horizontal integration in a firm. There are also external barriers that overlap
such as government policy and lead times. The change in government policy may increase
lead times of importing products and lead to barriers in forecasting uncertain product demand.
The identified internal and external barriers inform future researchers of the barriers that need
to be considered in the field. Several of the dimensions should be given priority for future
research such as the product, management, and communication for internal barriers and
environment and culture for external barriers as they make up most of the selected studies'
barriers.
2.3.3 Solutions addressing barriers in forecasting uncertain demand
To effectively provide solutions to address the barriers in forecasting uncertain product
demand, it was very important first to identify the barriers. Not all the studies explicitly
mentioned how to address the barriers identified in forecasting uncertain demand. Out of the
66 studies only 35 studies 53%, present a solution on how these barriers can be addressed and
improve the forecast accuracy. The solutions have been categorised by internal solutions and
external solutions (Table 4). Internal solutions can be applied within an organisation whereas
external solutions can be applied externally in the supply chain such as with suppliers or
retailers. It is also noteworthy that not all the dimensions from the barriers were used, the
dimensions are not exclusive to the internal or external category as they may overlap when
looking at an end to end supply chain.

45
Table 4 Forecasting barriers and adopted solutions grouped against category & dimension
Category Dimension Forecasting Barrier Forecasting solution adopted
Internal Technology Fragmented information technology Deployment of IT
Difficulties analysing information
being shared
Changes in technology
Product Product price change Product rationalisation and
standardisation
Timing New Product release
New product introduction
Substitute product introduction
Product customization
Large product range
Short product lifecycle
Marketing Promotions and advertising activity Not mentioned
Management Senior management influence Use multiple measures of
forecast accuracy
Compare past performance of
various forecasting methods.
Gatekeeping decisions
Strong leadership support
Improve functional alignment
Combine forecasts from
approaches that differ
Political influence
Lack of agility
Communication Judgmental adjustment Judgmental Adjustment
Ask managers to justify their
judgments
Poor communication
Operations Safety stock Redistribution of stock
Vendor managed inventory
Rough estimates on inventory level
Too many forecast methods
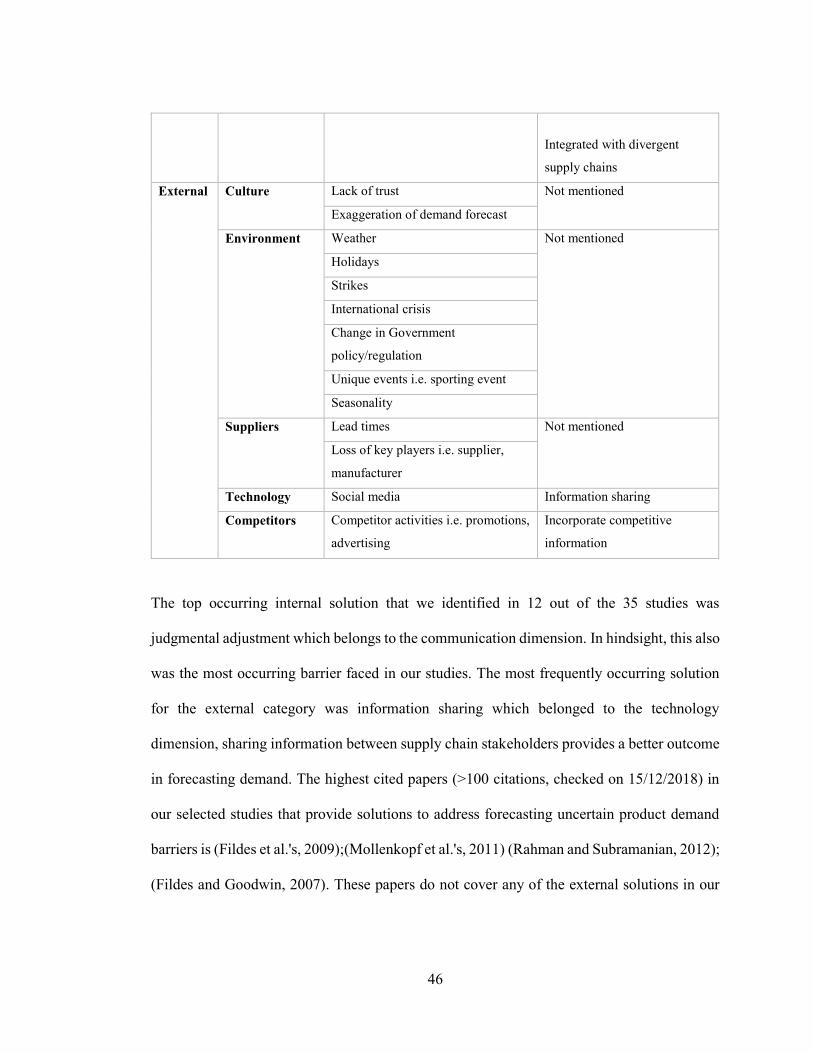
46
Integrated with divergent
supply chains
External Culture Lack of trust Not mentioned
Exaggeration of demand forecast
Environment Weather Not mentioned
Holidays
Strikes
International crisis
Change in Government
policy/regulation
Unique events i.e. sporting event
Seasonality
Suppliers Lead times Not mentioned
Loss of key players i.e. supplier,
manufacturer
Technology Social media Information sharing
Competitors Competitor activities i.e. promotions,
advertising
Incorporate competitive
information
The top occurring internal solution that we identified in 12 out of the 35 studies was
judgmental adjustment which belongs to the communication dimension. In hindsight, this also
was the most occurring barrier faced in our studies. The most frequently occurring solution
for the external category was information sharing which belonged to the technology
dimension, sharing information between supply chain stakeholders provides a better outcome
in forecasting demand. The highest cited papers (>100 citations, checked on 15/12/2018) in
our selected studies that provide solutions to address forecasting uncertain product demand
barriers is (Fildes et al.'s, 2009);(Mollenkopf et al.'s, 2011) (Rahman and Subramanian, 2012);
(Fildes and Goodwin, 2007). These papers do not cover any of the external solutions in our

47
findings and primarily focus on 9 out of the 12 internal solutions. A summary of the
dimensions used follows:
1. Technology. Articles on this topic identify technological solutions to overcome the
barriers in forecasting uncertain product demand. A representative article is “Operating
internationally - The impact on operational performance improvement” (Demeter, 2014).
This study investigates how the level of international presence impacts the operational
performance of companies. The study finds that the best operational performance strategy
is by having a strategy that supports investment in supply chain management, technology,
quality, and human resource. It was found that well-developed information technology
provides a higher rate of information sharing between partners on forecasts and
inventories, leading to shorter reaction times to changes. (Vanpoucke et al.'s, 2014) found
that sharing information through supplier integrative capability (SIC) enabled buyers to
sense changes in the supply environment, enhancing process flexibility and cost-
efficiency.
2. Product. This topic has articles exploring areas such as product rationalisation and
standardisation of products to improve forecasting demand accuracy. A representative
article is “The antecedents and consequences of product variety in new ventures: An
empirical study“(Patel and Jayaram, 2014). (L. Fisher and D. Ittner, 1999) defines an
organisations product variety as the “breadth of products that a firm offers at a given time”.
The study finds that product and process modularity enhance the benefits of product
variety and mitigates the costs that arise from increasing product variety further. Product

48
modularity is said to share common modules, where features of products are designed
around a standard base unit.
3. Management. Articles on this topic typically discuss cultural improvements such as strong
leadership support, gatekeeping decisions that can be made to address the barriers in
forecasting uncertain product demand. A representative article is “Creating value through
returns management: Exploring the marketing-operations interface“ by (Mollenkopf et
al.'s, 2011). This study explores the returns management phenomenon across a multi-
disciplinary, managerial spectrum. The study finds that the functional integration at the
marketing and operations interface in an organisation leads to better alignment of
corporate resources and creates higher levels of customer value. (Slagmulder et al.'s, 2003)
study finds that Sainsbury sales managers develop a culture change so that people with
different talents continuously offer ideas to improve the existing supply chain.
4. Communication. Articles on this topic typically discuss ways to communicate better
judgmental adjustments made to statistical forecasts. A representative article is “Against
Your Better Judgment? How Organizations Can Improve Their Use of Management
Judgment in Forecasting” (Fildes and Goodwin, 2007). The study explores how to
communicate management judgement in the forecasting process effectively. The study
finds if organisations follow basic principles such as requiring managers to communicate
their adjustment by justifying in writing and assessing the adjustment results it would
improve forecast accuracy.

49
5. Operations. This topic tends to contain articles that relate to managing supply chain
operations in an organisation. A representative article is “Does supply chain visibility
enhance agility” by (Brusset, 2016). This study addresses how best to achieve agility in
supply chain management. To achieve this operational capability the study shows that
having external and internal managerial processes enhance agility. (Davis and Mentzer,
2007) Developing cross-functional processes secure a “buy-in” from key stakeholders in
the organisation, which assured that a consensus sales forecast was used in decision-
making across the organization's functional areas.
6. Competitors. Articles look at the use of competitors’ information to achieve superior
forecasting performance. A representative article is “The value of competitive information
in forecasting FMCG retail product sales and the variable selection problem” (Huang et
al.'s, 2014). This study investigates competitive price and competitive promotion in
forecasting products at the Universal Product Code (UPC) level for retailers. The study
finds that the value of using competitive information in forecasting retailer product sales
at the UPC level is substantial as forecasting accuracy improves as the forecast horizon
increases.
Discussion
This section elaborates on the findings by identifying the relationships between forecast
barriers, solutions that address these barriers, and the related forecasting methods used in the
studies. We also provide the benefits and limitations of the most common methods.
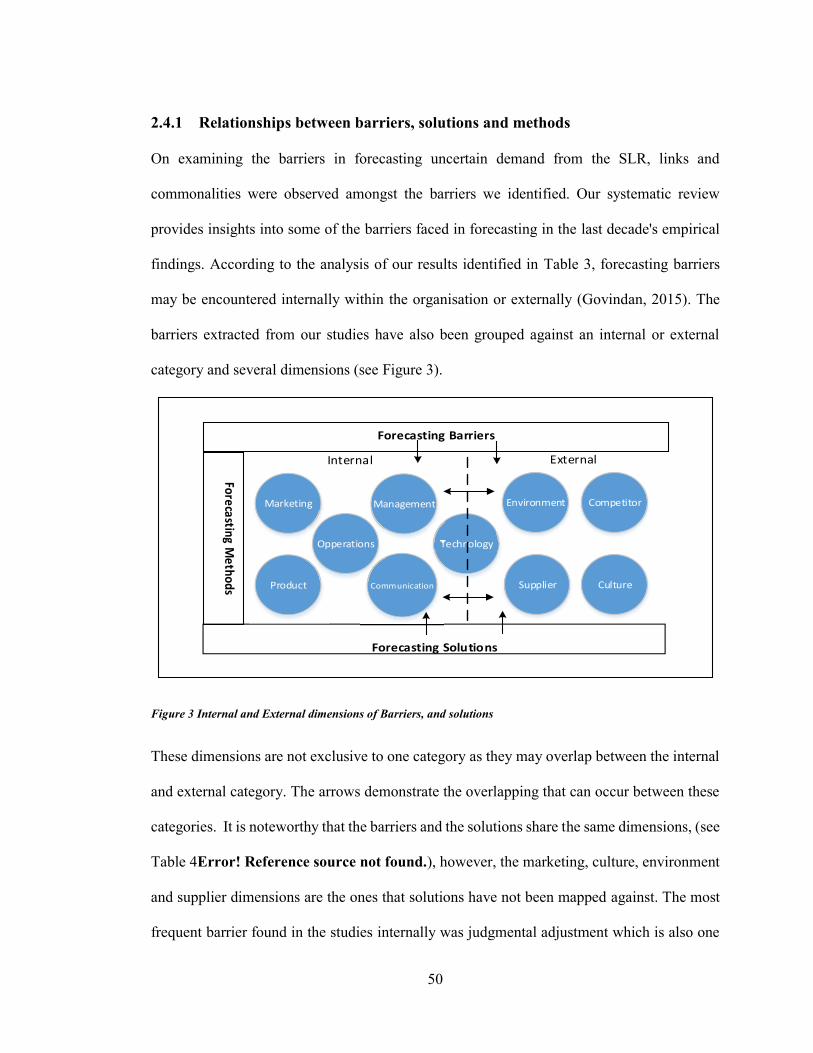
50
2.4.1 Relationships between barriers, solutions and methods
On examining the barriers in forecasting uncertain demand from the SLR, links and
commonalities were observed amongst the barriers we identified. Our systematic review
provides insights into some of the barriers faced in forecasting in the last decade's empirical
findings. According to the analysis of our results identified in Table 3, forecasting barriers
may be encountered internally within the organisation or externally (Govindan, 2015). The
barriers extracted from our studies have also been grouped against an internal or external
category and several dimensions (see Figure 3).
Forecasting Barriers
Forecasting Solutions
CultureProduct
TechnologyTechnology
Communication
Marketing
Technology
Management Environment
Supplier
Competitor
Forecasting Methods Product
Opperations
Internal External
Figure 3 Internal and External dimensions of Barriers, and solutions
These dimensions are not exclusive to one category as they may overlap between the internal
and external category. The arrows demonstrate the overlapping that can occur between these
categories. It is noteworthy that the barriers and the solutions share the same dimensions, (see
Table 4Error! Reference source not found.), however, the marketing, culture, environment
and supplier dimensions are the ones that solutions have not been mapped against. The most
frequent barrier found in the studies internally was judgmental adjustment which is also one

51
of the frequently used methods in our empirical studies for forecasting, used across 11
industries with total use of 31 applications as depicted in Table 2.
We have further mapped the relationships between the barriers and solutions to address the
barriers (see Figure 4) and the methods that support the solution (see Figure 5) used in the 66
empirical papers. To navigate the information provided in Figure 4 and Figure 5, we give an
example. The last row of the Barriers’ list on the left-hand side table is the “competitor
activities” barrier. The solution offered in the literature in the middle table is two:
“Information sharing” and “incorporate competitive information”. The methods used with the
information sharing solution is “simple moving average” which is on the right-hand side table.
We concede that the list we have provided in Figure 2 does not imply that all the possible
methods for all possible solutions are covered. However, to report our SLR findings, we need
to remain faithful to the selected studies' information.

52
Figure 4 Relationship between forecasting barriers and adopted solutions for uncertain product demand in supply chain

53
Figure 5 Relationship between forecasting methods and adopted solutions for uncertain product demand in supply chain

54
Our analysis reveals how organisations address the barriers we identified in RQ2, with the
relevant methods RQ1.
Figure 6 encapsulates our overall structure of the research results into a research framework
made up of three main parts; the barriers in forecasting uncertain product, which have been
categorized against dimensions, the forecasting methods and the adopted solutions used to
address the barriers. This generic framework will be valuable to supply chain practitioners as
it integrates the three parts and provides a high-level view of uncertain product demand in any
supply chain context.
Figure 6 Encapsulation of barriers, solutions & methods of uncertain product demand in the supply
chain into a research framework

55
It is noteworthy that the relationship of the mapped forecasting methods derived against the
solutions in Figure 5 shows the solutions that they address from the empirical papers and are
not exclusive to these solutions only. Any of these forecasting methods may be used in
combination with judgmental adjustment to improve the accuracy of the forecast, however,
the appropriateness between the forecast method and particular domain should be considered,
as the success of the forecast can vary depending on the company context (Fildes et al.'s, 2009,
Danese and Kalchschmidt, 2011a). The solution that covered the most barriers (6 in total) is
information sharing that was applied to the following barriers:
1 Competitor Activities
2 Trust
3 Inaccurate estimates on inventory level
4 Safety Stock
5 Promotions and advertising activities
6 Difficulties analysing information being shared
Davis and Mentzer Davis and Mentzer (2007), consider three types of information as
being appropriate to forecasting: data concerning the financial development of the market
(e.g., inflation, foreign currency rates, etc.), data gathered from individual customers (e.g.,
sales plan, customer forecast, etc.), data concerning the particular market sector (e.g., overall
technology trends). Considering all the information relevant to forecasting and assessing how
each data can be blended into a forecast is vital to enhance forecast accuracy (Danese and
Kalchschmidt, 2011a).
Several papers describe the large amounts of available data within organisations that can be
used to improve forecast accuracy. However, due to the scale and difficulty of the forecasting

56
task, it is overall complex and often impractical for all SKUs to be given specific consideration
by demand planners (Fildes et al.'s, 2009, Huang et al.'s, 2014). Also, to include any
alternative explanatory variables such as a reason for a judgmental adjustment at this level
becomes cumbersome (Franses and Legerstee, 2013). Research literature suggests that
decision-makers often struggle to make sense of the available data and use it wisely (Shang et
al.'s, 2008, Huang et al.'s, 2014).
Information sharing can be considered as a solution to forecasting uncertain demand.
Mollenkopf et al.'s (2011), found evidence by conducting interviews with global supply chain
directors, operation managers and marketing director in Italy and the USA. The study
suggested the more marketing and operations groups share information (regarding customer
orders, pricing, delivery options and the underlying operational costs of various sale terms),
the better aligned the two groups will be. Dubey et al.'s (2018), also concluded that sharing
relevant, complete, accurate and confidential information would contribute to better visibility
in terms of inventory and demand in supply chains. However, it is noteworthy that the
abundance of information available and the complex task at hand in forecasting means that
this is not a simple solution. Wang et al.'s (2005), finds that information sharing cannot
eliminate the bullwhip effect; however, it can eliminate the effect of uncertain information
distortion and improve the performance of supply chains effectively. Further research could
investigate how best to capture and share this information to improve uncertain demand
forecast. This is considered as a gap in the body of work reported in the SLR.

57
2.4.2 Benefits and Limitations of UPD forecasting methods
The most common methods used widely in different forecasting demand domains are simple
exponential smoothing (SES), Croston’s, Syntetos-Boylan Approximation (SBA) and Naïve
method. These methods have the highest frequency in our studies (Table 6 Appendix B). All
of them except for Naïve are known to be parametric methods (Ma et al.'s, 2016) which have
mainly been demonstrated to provide a practical use for forecasting. These methods need less
computing power, which is important when demands for very large SKUs have to be forecast
(Ma et al.'s, 2016). These methods also require less specialist knowledge and are thus more
transparent and resistant to potentially damaging judgmental interventions (Syntetos et al.'s,
2015). Table 5 provides the benefits and limitations of the most common methods in our
studies. It is important to note that the benefits and limitations derived are based on various
data sets and accuracy measures used in the studies.
Table 5 Benefits and limitations of UPD forecasting methods
Forecasting
Method
Benefits Limitations
Single/Simple
Exponential
Smoothing.
(SES)
This method is a simple parametric method
that requires little specialist knowledge and
is thus more transparent and more resistant
to potential harmful judgmental
adjustments(Ma et al.'s, 2016). It is the most
popular and cost-effective statistical
extrapolation methods(Yelland, 2010). SES
is said to be stable and best used when the
focal product is relatively stable and is not
on promotion(Huang et al.'s, 2014). This
method also requires a smaller amount of
computing power, which is important when
many SKUs have to be forecast (Ma et al.'s,
2016).
Single Exponential Smoothing
(Single) adopts no trend or seasonal
patterns, hence it does not perform
well for long forecasting horizons as it
cannot predict the trend in data
(Petropoulos et al.'s, 2016b). It
neglects promotions or the fact that,
even during the periods when the focal
product is not being promoted, its
sales could also be driven by
promotions of other competitive
products (Huang et al.'s, 2014).

58
Croston's
Method
Croston’s method is based on exponential
smoothing and is also a parametric
method(Ma et al.'s, 2016), it has been found
to perform well for intermittent demand
(Petropoulos et al.'s, 2014, Syntetos et al.'s,
2015). Although this method's considerable
bias exists both theoretically and
empirically, the Croston method achieves
good inventory performance (Zied Babai et
al.'s, 2014, Petropoulos et al.'s, 2016b).
Croston method is biased high due to
an error in the mathematical
derivation of expected demand. This
leads to overcompensation and
increased customer service and
inventory investment (Syntetos et
al.'s, 2015, Zied Babai et al.'s, 2014).
Syntetos-
Boylan
Approximation
(SBA)
Syntetos-Boylan Approximation (SBA) is
also a parametric method. It has been found
to produce overall better performance than
Croston's method as it produces fewer
biases in forecasts (Petropoulos et al.'s,
2016b).
Despite SBA designed to advance
Croston’s method, the Croston
method consistently gave better stock
level performance than the SBA
method (Syntetos et al.'s, 2015).
Naïve Naïve is the best option if there is a presence
of randomness (Petropoulos et al.'s, 2014).
Naïve also was found to achieve superior
accuracy in datasets that are highly
intermittent (Petropoulos et al.'s, 2016b)
and where a large forecasting horizon is
required (Petropoulos et al.'s, 2014).
Does not perform well with zero
forecast values (Petropoulos et al.'s,
2016b).
Our research identifies more complex methods, (e.g. IADIDA, ADIDA, ADL); however,
these do not seem to be used widely. This may be because the methods are difficult to interpret,
and they rely on the expertise that may well not be available in an organisation (Huang et al.'s,
2014). While both qualitative and quantitative forecasting methods are essential, our findings
reveal that using the judgmental adjustments method is still the highest occurring barrier. It
has been stated that it is impossible to claim that companies applying quantitative and complex
methods (such as LASOO or ADIDA models) achieve better results (Lawrence et al.'s, 2000)
than using only the Judgmental method (Makridakis et al.'s, 1998). The combination of

59
various forecasting methods may drive an increase in efficiency of accuracy (Makridakis et
al.'s, 1998). The ‘50% model, 50% manager’ heuristic suggested by (Blattberg and Hoch,
1990) includes taking the mean of management judgments and statistical forecasts such as
SES or SBA. Blattberg and Hoch found that this simple strategy was successful because of
statistical methods and human judgment's complementary strengths and weaknesses. In fact,
Vereecke et al.'s (2018), conclude that mature companies use methods that include the
effective combination of statistical methods and human judgment, taking into account
contingencies and product segmentation. This may explain why 31 applications in our studies
have used a combination of qualitative and quantitative method.
2.4.3 Judgmental adjustment decision making framework
Judgmental adjustments was the barrier with the highest frequency in our SLR due to various
reasons, such as the subjective responses to demand signals that result in increases in internal
costs, uncertainty, and volatility (Duan et al.'s, 2015). The empirical studies also indicated that
sales managers might face political pressures to favour a particular outcome. For example,
Syntetos et al.'s (2016) found that when performance is measured and rewarded according to
service levels achieved, managers will generally overstate the forecasts to prevent them from
running out of stock. This can lead to manufacturers carrying more inventories, especially
when the order frequency is uncertain or because managers adjust their forecasts based on
overreactions (Duan et al.'s, 2015, Chao, 2013). The managers may also tend to ‘see’ patterns
where there are not necessarily any patterns at all. Typically, more minor forecast adjustments
are made to the forecast that by no means account for any benefits or, even worse, they may
also damage the forecast accuracy (Syntetos et al.'s, 2016). There have been contradictory
views in the literature. Some have shown that minor adjustments were often ineffective in

60
improving the forecast and that significant adjustments are especially useful in correcting
statistical forecasts (Fildes et al.'s, 2009). However, these adjustments can be needless or even
damaging when used without understanding how the method chosen derived the forecast
(Syntetos et al.'s, 2015). It can be said that judgmental adjustment is essential with any chosen
statistical method; however, this does not guarantee an improvement in the forecast.
We have developed a decision-making framework (Figure 7) from our findings to help
forecasters make judgmental adjustments through a repeatable and clear decision-making
process. The literature has noted that frequently forecasts are adjusted because forecasters are
confused with decisions (Fildes et al.'s, 2009). The proposed framework could be used as a
process to avoid optimism bias and confusion of forecasts and decisions on judgmental
adjustments. Table 6 explains each reason in the framework when an adjustment is not
essential or needs to be revised. The footnotes against the judgmental adjustment decision are
reflected in Figure 7.
Table 6 Reasons for judgmental adjustment decision
Judgmental Forecast
Adjustment decision
Reason Studies
1. Adjustment not
essential
Small adjustments were often ineffective
in reducing forecast error.
(Fildes et al.'s, 2009)
2. Revise Adjustment Forecasters did not attempt to review the
reasons for previous wrongly interpreted
judgmental adjustment, which, is a cause
of major forecast error.
(Fildes et al.'s, 2009) , (Fildes and
Goodwin, 2007)
3. Revise Adjustment Without understanding the previous
accuracy measures or how the forecast
was produced, these adjustments can be
unnecessary or even harmful.
(Davis and Mentzer, 2007),
(Syntetos et al.'s, 2016), (Trapero
et al.'s, 2013), (Ali et al.'s, 2017)

61
4. Revise Adjustment Positive adjustments tended to lead to
larger errors than negative ones.
(Syntetos et al.'s, 2016), (Fildes
and Goodwin, 2007), (Goodwin
et al.'s, 2007)
5. Revise Adjustment There is a lack of communication and
coordination among different business
departments engaged in supply chain
operations, sales or marketing.
(Davis and Mentzer, 2007),
(Fildes and Goodwin, 2007)

62
Forecast Judgmental Adjustments
Is this a negative adjustment to the
forecast?
Is there a clear valid driver for this change?
NoYes
Is this a small adjustment to the
forecast?
Yes
1. Adjustment not essential
No
Is this adjustment due to a big loss in
the previous period?
Yes
Is the loss due to a previous judgmental
adjustment?
No
Is this adjustment due to a
promotion?
Yes
Yes
Have different organisational
units been consulted?
No
Yes
Adjustment may be essential
No
Have you reviewed previous accuracy
measures?
Is this adjustment due to clear
market intel?
No Yes No
Yes No
Have different organisational
units been consulted? NoYes
Have different organisational
units been consulted? NoYes
Yes No
Has the reason for the previous
adjustment been reviewed?
Have different organisational
units been consulted? NoYes
Yes No
Have different Have different Have different organisational
units been consulted? NoYes
Have different Have different Have different organisational
units been consulted
Have different Have different Have different Have different organisational
units been consulted?YesYes No ? NoNoYes
Have different Have different Have different organisational
units been consulted? NoYes
5. Revise Adjustment
Adjustment may be essential
Adjustment may be essential
5. Revise Adjustment
Adjustment may be essential
5. Revise Adjustment
Adjustment may be essential
5. Revise Adjustment
3. Revise Adjustment
4. Revise Adjustment
2. Revise Adjustment
Figure 7 Decision making framework for UPD using judgmental adjustments

63
It is important to note that any essential adjustment made through the decision making
framework should also justify the adjustment. This is in line with (Syntetos et al.'s, 2016)
where it was found that there is the potential of forecast performance improvement from
adjustments that are made with a justification. Not only does this help with the performance
but it will also be useful in the learning process of practitioners and towards an understanding
of why decisions may still be erroneous (Franses and Legerstee, 2009). It is also important to
point out that all essential adjustments need to be communicated with the different
organisation business units to ensure information is being shared. The only adjustment that
may be essential and does not require organisational units to be consulted is when a clear valid
driver for a negative forecast adjustment is present. Studies found forecasters achieve better
forecasts when making negative adjustments because their information is more realistic
(Fildes et al.'s, 2009, Trapero et al.'s, 2013).
Chapter Summary
This chapter presented a systematic literature review of 66 scholarly articles that deal with
forecasting uncertain product demand in supply chain, one that is recent and relevant to supply
chain practitioners and academics. The SLR has painted a rich picture of the complex practices
by including many internal and external barriers that play their role in forecasting uncertain
product demand, the methods being used, and solutions offered to address the barriers, as
encapsulated in an integrated framework. The SLR enabled us to organise and structure these
barriers into related themes and identify the most frequent barriers discovered in the literature
of the last decade. The most frequently used methods by industry have also been identified.
These results help us understand all the issues related to the design of more effective strategies
for forecasting in the supply chain domain. Furthermore, our SLR results inform us about
various aspects of the internal/external organisation barriers faced and how they can be

64
mitigated. Our research has also enabled us to develop a novel framework for judgmental
adjustments.
Our study has revealed an extremely large body of research literature both empirical and non-
empirical available on this topic. However, while analysing the included studies to answer our
research questions, we found some literature gaps. Figure 24 highlights the current research
and industrial practice gaps. The following is a list of concepts that are not adequately
explored within the current empirical literature that provides convincing evidence for our
research:
1. Judgmental adjustments are a double-edged sword, it has been claimed to improve
forecasting uncertain demand and decrease forecast accuracy. The success of this
crucial part of forecasting needs to be further explored
2. The combination of solutions such as statistical methods, judgmental adjustments and
information sharing that mitigate the barriers of forecasting uncertain demand in the
literature is not empirically investigated and measured.

65
3 Methodology and Research Design
Chapter Overview
The previous chapter reviews the available literature on forecasting uncertain product demand
in the supply chain, including barriers faced, methods used, and solutions adopted to address
the barriers. This chapter aims to introduce the research methodology and design adopted for
this industry research project. Design science research methodology is chosen for this industry
research project to discover and identify opportunities and problems in forecasting uncertain
product demand relevant to the Australian Luminaire Manufacturer (ALM) and inventing or
creating new or improved digital artefact to address the problems. There are other relevant
methodologies, such as action research (Adelman, 1993) and applied research. However,
action research is suited for social science, where understanding human-interaction
touchpoints are critical during the problem identification phase (Iivari and Venable, 2009).
Applied research is used to increase what is known about a problem and aims at arriving at
research findings that can solve the problems (Hedrick et al.'s, 1993). Design science research
is suitable for this research as it is centred on practical problem-solving. The results from
scientific justification such as understanding, predicting or explaining a phenomenon can be
used to design solutions to solve complex and relevant problems faced in the real world and,
by that means, to contribute to the theory of the discipline in which it is applied (Lukka, 2003).
Given the nature of the industry research project, proposing and developing a solution for a
real-life problem, the researcher decided to proceed with the design science research method.
This method will be used to ascertain and recognise problems applicable to the ALM
organisation and provide an unambiguous approach to formulating the design and building a

66
novel artefact that deals with the barriers in forecasting uncertain product demand. Figure 8
depicts the overall relationships between design science research, the research goals and the
research chapters.

67
Chapter 1
Introduction1.Background2.Industry problem2.Scope of Research3.Goals of Research4.Research Design5.Contributiions
Chapter 3
Research Methodology
1.Design Science Research process2.Research activities3. Ethical approval
Introduction to the thesis
DSR Phase 1: Establish awareness of problem
DSR Phase 3: Evaluation
Evaluation 1. Evaluation of the digital toolkit – Focus Group, Questionnaire, Testing, Simulation, UAT
Chapter 6
Conclusion to the thesisResearch
Goal 4
Literature Review Research Goal 1
Key forecasting Barriers Technology Product Communication Culture Suppliers Competitors Management
Key forecasting Methods Single/Simple Exponential
Smoothing Syntetos-Boylan
Approximation (SBA) Average of statistical and
judgmental Judgmental adjustment alone
Key forecasting Solutions Judgmental Adjustments Deployment of IT Combine forecasts from
different approaches Information sharing Product rationalisation
Conclusion and Recommendations1. Fulfilment of the research goals2. Contribution to the knowledge base3. Limitations of the research project4. Recommendations for future research
Chapter 7
Development of conceptual solution1. The development of the digital toolkit2. Digital Toolkit in action
Chapter 5
Research Goal 3
Exploratory interview To explore and gain knowledge on the current
issues in forecasting uncertain product demand in the state of practice
Semi structured Interview To look into the perspectives and opinions from end
to end supply chain stakeholders that a practicing or are impacted by barriers faced in forecasting uncertain product demand
Chapter 4 Research Goal 2
DSR Phase 2: Design and Development
Chapter 2
Figure 8 Relationship between DSR process, research goals and research chapters

68
First, a pilot study exploration was carried out at ALM about the overall supply chain and
concepts relevant to the study was provided. Our existing knowledge of the organisation was
confirmed (Chapter 4.2). Subsequently, a systematic review of the literature associated with
forecasting product demand was performed to understand the theoretical background and
obtain deeper insights into the research problem (Chapter 2). Further to this, a survey of the
current state-of-the-practice is performed through a qualitative field study to explore what the
experts thought and the daily barriers they faced in forecasting uncertain product demand
(Chapter 4.4). The qualitative field study results provided the preliminary requirements
elicitation tasks that were essential to extract initial requirements and features of the toolkit.
Furthermore, the two chapters' results (Chapter 2 & Chapter 4) allowed for the iterative update
of our supply chain mapping. In the development phase, the actual deliverable (i.e., the toolkit)
was designed and developed (Chapter 5). This artefact was then evaluated (Chapter 6) and the
industry research was concluded (Chapter 7).
In this chapter, we will describe in detail the methodology and research design we have
applied. This chapter begins by elaborating on the chosen research design and provides an
overview of the basis of design science research. We provide the research outputs and discuss
the activities we have completed as part of the research method. We also provide the overall
research strategy and the relationship between the design science research process, our
research goals and the research chapters in this thesis. Finally, the limitations of the research
design and our ethical considerations are provided.
Research Methodology
Hevner et al.'s (2004) identifies two main research paradigms in the information systems (IS)
discipline: natural science and design science. Natural science (also known as behavioural

69
science paradigm), is concerned with developing and verifying theories explaining or
predicting human and organizational behaviour. The design science research (DSR) paradigm
seeks to create innovation through analysis, design of artefacts and implementation that
extends the capabilities of human and organisation behaviour.
March and Smith (1995) describe the two research paradigms as follows:
1) Natural science tries to understand reality by explaining how and why things are.
Natural science comprises traditional research in physical, biological, social, and
behavioural domains.
2) Design science attempts to create things that serve human purposes. It is technology-
oriented. Its products are assessed against value or utility criteria (i.e. does it work? Is
it an improvement?). Rather than producing general theoretical knowledge, design
scientists produce and apply knowledge of tasks or situations to create effective
artefacts.
The first characteristic of design science research is that it is driven by problem-solving and
the second distinguishing characteristic is the rigid nature of the research outcome. The design
science research, which is the driver of this research project aims to create new and innovative
solution artefacts such as governance strategies, decision support systems and methods for
information system evaluations (Shrestha et al.'s, 2014). In addition, March and Smith (1995)
looked at design science research to seek and explore new solution alternatives to solve
problems, explain this exploratory process, and improve the problem-solving process and
serve human purposes. Furthermore, the artifact's interaction with its environment may lead
to theorizing about the artefact's internal workings or the environment.

70
Design science research includes four output types: constructs, models, methods, and
instantiations. These research outputs are described by (March and Smith, 1995) as follows:
Constructs: Provides the vocabulary and symbols used to define and understand problems
and solutions. Instances include concepts, syntax or language (vocabulary and symbols) used
in a specified context of a problem to find a solution. They have a significant impact on how
problems are conceived, and they enable the construction of models for the problem and
solution domains.
Models: A set of statements or propositions that describe a set of constructs to solve a problem
such as, mathematical models, diagrammatical models, logic models, abstractions and
representations. These can simply be viewed as a representation of how things are.
Methods. A set of steps that are used to achieve a task such as, algorithms and guidelines.
They are based on the underlying constructs (language) and a representation (model) of the
solution.
Instantiations. A realization of an artefact in its environment for example an information
system that stores, retrieves and analyses customer data. Instantiations ultimately provide real
proof that the constructs, models and methods can be operationalised and work in a real-world
context.
Research Activities – Method used in this research study
Design science consists of three cycles of development activities (see Figure 9), the
environment which is where researchers establish awareness of the problem (chapter 3.3.1),
the designing, building of the artefact (chapter 3.3.2) and evaluation (chapter 3.3.3). The
environment cycle results in observations and interactions among people, organisation and

71
technical systems to achieve a particular goal (Iivari, 2015). In the context of this research
project, the interactions are conducted in the ALM environment and supply chain domain,
particularly for knowledge analysis, scoping and gap analysis. This design science
environment research cycle becomes the foundation for the next cycle: designing, building
(chapter 3.3.2), and evaluation (chapter 3.3.3) of the artifacts. The design cycle is regarded as
the heart of any design science research project (Hevner and Chatterjee, 2010). We refer to
Wieringa (2009) in chapter 3.4 to describe the type of problems we are investigating. Once
the problems have been observed and identified the development of the initial artefact is
followed. Subsequently, once the artefact is built, the developed artifact's evaluation process
is initially required to justify solving the identified problems. This requires multiple iterations
of the design cycle in design science research before commencing the third (rigour) cycle.
Hevner (2007) points out that evaluating a design science research artefact must be well
conducted to ensure its validity. In particular, Hevner et al.'s (2004) propose that the
evaluation could be analytical, case study, experimental, field study or simulation. In the
context of our research project, the evaluation processes involve: feedback from ALM experts,
questionnaire, focus group, testing and role-play simulation. The evaluation process will be
elaborated in detail in this chapter.

72
Figure 9 Hevner (2007) Design Science Research Cycles
The third stage of Hevner’s three-cycle design science research activities is the rigour cycle
(Figure 9). This is the justification of whether the research contributes to a new knowledge
base (Gregor, 2006). It is contingent on thorough research and referencing the knowledge base
to guarantee that the designs produced are research contributions and not routine design
(Hevner et al.'s, 2004). The research outcome, that is the artefact per se, should be
communicated for the theoretical contribution of the research (Shrestha et al.'s, 2014) or the
research artefact should help address the current problem for practitioners (Sein et al.'s, 2011).
In addition contributions to the knowledge base as results of design science research may
include extensions to original theories and methods discovered during the research, new meta
artefacts such as design processes and products, and all the experiences gained from
performing the research and field testing of the artefact in the application environment
(Hevner, 2007).
This research is constructed in three phases as depicted in Figure 1. Phase 1 focuses on
defining the research problem (Chapter 2) and understanding its application (Chapter 0).

73
Phase 2 is the design and development of the toolkit solution (Chapter 5). This toolkit is
designed and developed based on the identified challenges in forecasting uncertain product
demand identified from the previous phase. The output of this phase is the initial design and
development of the digital toolkit. In Phase 3, the toolkit developed in Phase 2 is evaluated.
The evaluations performed (Chapter 6) to the toolkit contribute to the continuous
improvement of the developed artefact. The evaluation ensures that the developed toolkit
works as intended. The evaluation aims to show that the artefact can be implemented in the
environment and used by practitioners. The evaluation also demonstrates that the forecasting
toolkit results will drive an improvement in transparency, efficiency, and effectiveness in the
product demand forecasting process in the organisation.
3.3.1 Phase 1: Environment
The environment is a critical phase of the research cycle. It establishes an awareness of the
research problem and provides the foundations that set the research project's direction. This
phase of the research is also known as the problem investigation. Information about the
application domain such as the people, organisational systems and technical systems is asked
and understood. The information includes the industry research project's contextual
background, any existing theories that form part of a precursor to the research process.
Wieringa (2009) describes four categories of how a problem is investigated and each of these
leads to different emphases in the problem investigation process:
Problem-driven investigation – stakeholders experience problems that need to be
diagnosed before solving them. Important tasks in the problem-driven investigation
describe problematic phenomena, formulating and testing a hypothesis about their
causes and identifying priorities for problems to be solved.

74
Goal-driven investigation – considers a situation in which there are maybe no problem
experienced but where there are nevertheless reasons to change the world in
agreement with some goals. In all cases of solution-driven problem investigation,
important tasks are describing stakeholder goals, defining and operationalising them,
and identifying priorities of goals.
Solution-driven investigation – technology is in search of problems that can be solved
with it. Problem investigation, in this case, would start with an investigation of the
properties of the new technology; and solution design would be an exploration of ways
in which it could be used to achieve new goals.
Impact-driven investigation – also called evaluation research, focuses on the outcome
of past actions rather than preparing to design future solutions. Important tasks in
evaluation research describe solutions implemented earlier, identifying their impacts
and explaining these impacts in terms of properties of the implemented solutions,
identifying relevant stakeholder goals, translating these into criteria and applying
these to the impacts.
This industry research project falls under the category of problem-driven investigation, which
begins by identifying and defining opportunities and practical problems in an actual
application environment (ALM). It starts by looking into the realm of inquiry, a study of the
existing knowledge (chapter 2). At this stage, the theory is used to understand the problems
i.e. the barriers in forecasting uncertain product demand in supply chain. The design science
research Phase 1 of this thesis is composed of three corresponding activities (see Figure
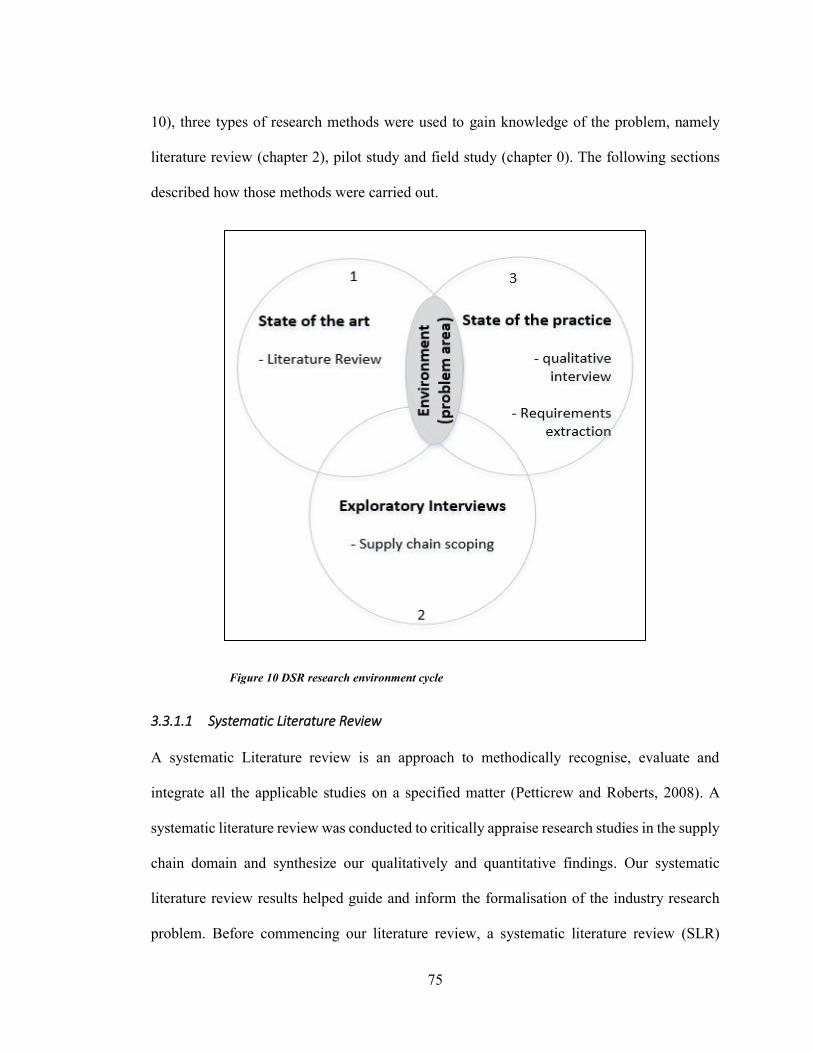
75
10), three types of research methods were used to gain knowledge of the problem, namely
literature review (chapter 2), pilot study and field study (chapter 0). The following sections
described how those methods were carried out.
Figure 10 DSR research environment cycle
3.3.1.1 Systematic Literature Review
A systematic Literature review is an approach to methodically recognise, evaluate and
integrate all the applicable studies on a specified matter (Petticrew and Roberts, 2008). A
systematic literature review was conducted to critically appraise research studies in the supply
chain domain and synthesize our qualitatively and quantitative findings. Our systematic
literature review results helped guide and inform the formalisation of the industry research
problem. Before commencing our literature review, a systematic literature review (SLR)

76
protocol was developed (see Appendix F) for conducting the SLR. The protocol contained our
search strategy's details guided by the research questions, inclusion/exclusion criteria, quality
assessment criteria, data extraction strategy, and data synthesis and analysis guidelines. The
protocol was tested for evaluating the completeness of our search string, and the correctness
of our inclusion/ exclusion criteria and data extraction strategy. The protocol was sent to one
external reviewer who is an expert in SLR. Minor recommended changes from the reviewer
related to the research questions were incorporated. During the execution, the steps of the
protocol were further refined. The literature review was then initiated by following guidelines
of (Kitchenham and Charters, 2007), These guidelines propose three main phases of SLR, (1)
planning, (2) execution, and (3) reporting results (see Figure 11). The execution and results
of the SLR phases are explained in chapter 2.
Phase1: Planning
Phase 2: Execution
Phase 3: Reporting Results
Planning
Formulate research question Develop review protocol Validate Protocol
Execution
Search relevant literature Perform selection of primary studies Evaluate articles quality Perform data extraction Synthesize the data
Reporting
Write up the SLR
Figure 11 SLR research Methodology

77
The systematic literature review's goal was to undertake a comprehensive search for empirical
publications on digital electronic databases with the follwong aims. (1) identify the barriers
faced in forecasting uncertain product demand in supply chain, (2) identify the forecasting
methods used for forecasting product demand; and (3) identify how the barriers of forecasting
uncertain product demand be addressed. The review resulted in 66 studies from the literature
for the period 2008-2019. Our findings revealed many barriers in forecasting product demands
that still exist today apart from choosing the most appropriate forecasting technique. Chapter
2.3.2 lists the top ten barriers of forecasting uncertain product demand mentioned in the
literature
The execution of the literature review process is detailed and discussed in Appendix G1. All
the barriers and gaps are presented and examined based on the existing works of literature.
The literature review confirmed an important research gap in addressing the barriers in
forecasting uncertain product demand in particular judgemental adjustments made to a
statistical or mathematical forecast. The systematic literature review is presented and
discussed in chapter 2.
3.3.1.2 Pilot Study
We conducted a pilot study containing a series of pre-interview exploration activities at ALM
to gain in-depth information about the overall supply chain domain and understand who
should formally be interviewed. The activities were informal and ad-hoc, it involved a walk
around the ALM office and asking informal questions to supply chain stakeholders (informal
chats), observing how people perform tasks and reading existing documentation that was
made available. These exploratory activities allowed us to confirm our domain knowledge
and understanding of the organisation, job roles within the forecasting process and the overall

78
supply chain processes. It also ensured our understanding of the problem made sense and
allowed us to identify who in the supply chain should be interviewed formally (chapter 4).
The additional insights gained allowed us to develop a process map of the supply chain and
map the main pain points experienced by supply chain stakeholders. The process map was
part of making sense of the environment and documented in chapter 4.2Error! Reference
source not found. of this thesis.
3.3.1.3 Field Study
The field study's primary goal (chapter 0) was to investigate the barriers faced in forecasting
uncertain product demand in ALM and leading to eliciting high-level requirements for a
possible solution to the problem of forecasting uncertain product demand. The qualitative field
study specifically intended to explore what the experts thought and the daily barriers they
faced in forecasting uncertain product demand and what they believed would overcome these
barriers. Furthermore, the field study was anticipated to triangulate the result of the literature
review (chapter 2), the purpose of triangulation is to cross-validate the literature review study
(the-state-of-the-art) and field study (state-of-the-practice).
Following the process map and SLR, we planned for conducting an interview study in the
field. Alternative to interview study is focus group or observation. We did not do a focus
group because we did not want participants to be influenced by one another. As we were
talking to different groups, we wanted to discover the individuals own knowledge and
experience. Face-to-Face interviews were our choice for gaining a deeper understanding of
the barriers in the manufacturing organisation. A Survey was also not appropriate as it only
captures surface knowledge and not deep knowledge. Our SLR provided us with state-of-the-
art knowledge and understanding of the forecast methods used (chapter 2.3.1), barriers in

79
forecasting uncertain product demand (chapter 2.3.2) and the solutions that can be adopted to
overcome them (chapter 2.3.3). Interviews offer rich qualitative data when a topic needs
deeper insight (Schultze and Avital, 2011). Interviews acquire participants' views and
thoughts by speaking face-to-face with them and allowing participants freedom to express
their thoughts and experience on the topic. Using our supply chain knowledge and the
knowledge gained from the first two steps of our research, we designed a set of interview
questions, among other topics, to identify the barriers faced by participants. The interview
questions that were used during the study can be found in Appendix I.
3.3.1.3.1 Interview questions
The interviews were semi-structured and open-ended questions. Open-ended questions do not
have any prescribed answer to be selected by participants. The questions were aimed at three
specific business units in the organisation. A set of generic questions was derived for all
participants and a set of specific questions for the operations participants and the
sales/category. The interviewees were asked to provide their views and experiences related to
the questions asked. The interview questions were focused on exploring how forecasting is
currently carried out in ALM, what barriers are being faced and how participants believe these
barriers can be overcome. The relatively detailed questions from the specific set of questions
allowed the interviewer to pay close attention to the participants’ experience. In contrast, the
open-ended answers allowed the interviewer to follow up with probing questions with any
specific questions during the interview.
3.3.1.3.2 Participants
The criterion for selecting the interviewees was that participants were involved in the
forecasting of product demand or were impacted by it. Based on the criterion the participants

80
were from across the supply chain. The participants belonged to the following three business
units: sales/category, operations and finance/IT. An external supplier and customer of ALM
were also selected as they impacted the supply chain forecasting. Human ethics approval
(chapter 3.5) was obtained from the UTS Human Research Ethics Committee (HREC) before
contacting any participants. The participants were approached by sending them an invitation
letter (Appendix A) from the university supervisor via email. A participant information sheet
that outlined their rights was also included. Follow up email was used to secure an appropriate
time and location for the interview appointment.
A total of 21 participants were invited to participate in the interview study. 20 participants
accepted, all 20 interviews took place during April–May 2018 in Sydney and each lasted an
average of 39 minutes. At the time of the interview, participants were given a consent form
(Appendix A). They were asked to read it carefully and understand their rights. The
participants were also briefed on their data, data safekeeping, and the complaints procedure
to UTS HREC. Once participants expressed their understanding and acceptance they were
asked to sign the consent form. The interviews were audio-recorded, however, participants
were also informed that at any time during the interview they were free to ask not to be
recorded. At the end of the interview, participants were informed that they could contact us
if they would like to know the research's progress and would also be notified about any
publications made from the study. Each interview record was named with a code as a means
for de-identification and later transcribed. A separate list of participants details and the code
assigned to them is kept separately and confidential. Out of the 20 participants, 8 belong to
the sales and category teams, 5 working in operations. 5 had experience either in finance, or
information technology. One external customer and an international supplier were also part of
the 20 interviews. The interviewees' names, the companies or their job titles will not be

81
revealed in this research within compliance with HREC’s confidentiality obligation at UTS to
accept this research. The transcripts of the interviews were analysed using NVivoTM software.
3.3.1.3.3 Data Analysis
The method adopted for data collection was directed qualitative content analysis (QCA)(Hsieh
and Shannon, 2005). The conventional approach of content analysis is limited as it fails to
develop a complete understanding of the context, thus failing to identify key categories (Hsieh
and Shannon, 2005). Multiple studies (Hsieh and Shannon, 2005, Elo and Kyngäs, 2008,
Zhang and Wildemuth, 2009, Mayring, 2014) suggest different strategies for conducting
directed QCA. The directed content analysis approach aims to validate or conceptually extend
a theoretical framework or theory (Hsieh and Shannon, 2005). Directed content analysis was
selected because it enabled us further to describe the existing prior research (SLR). We adopt
(Hsieh and Shannon, 2005) second analysis strategy, the first strategy is similar however it
deals with reading the textual data and highlighting the text first before coding. The method
was selected because it allowed the initial coding to start with a theory or relevant research
findings. We feel confident that our initial coding will not bias the identification of relevant
text as they were not used to form interview questions.
The steps of the analysis strategy used once all the interview recordings were transcribed are
as follows:
1. Setting the initial categories and codes based on the results of the systematic literature
review.
2. Reading the whole text and mapping of the respondent’s answers to interview
questions against relevant predetermined codes from SLR.
3. Identification of new categories and codes from interview data
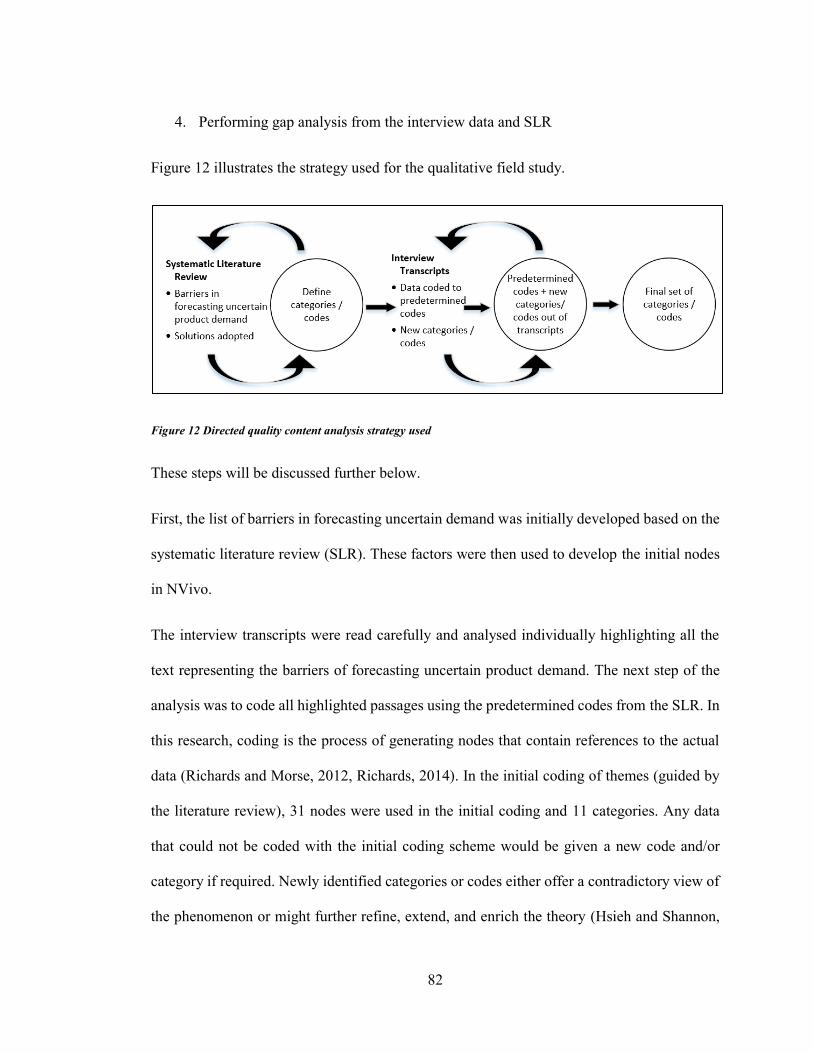
82
4. Performing gap analysis from the interview data and SLR
Figure 12 illustrates the strategy used for the qualitative field study.
Figure 12 Directed quality content analysis strategy used
These steps will be discussed further below.
First, the list of barriers in forecasting uncertain demand was initially developed based on the
systematic literature review (SLR). These factors were then used to develop the initial nodes
in NVivo.
The interview transcripts were read carefully and analysed individually highlighting all the
text representing the barriers of forecasting uncertain product demand. The next step of the
analysis was to code all highlighted passages using the predetermined codes from the SLR. In
this research, coding is the process of generating nodes that contain references to the actual
data (Richards and Morse, 2012, Richards, 2014). In the initial coding of themes (guided by
the literature review), 31 nodes were used in the initial coding and 11 categories. Any data
that could not be coded with the initial coding scheme would be given a new code and/or
category if required. Newly identified categories or codes either offer a contradictory view of
the phenomenon or might further refine, extend, and enrich the theory (Hsieh and Shannon,

83
2005). Annotations were also written to store the researches reflection and ideas that emerged
about the particular text.
The gap analysis attempts to find the differences between the SLR barriers and the findings
from the interview study. By mapping the answers to the interview questions, the differences
and irrelevant nodes from both the literature review and interview findings can be identified.
This analysis can be used to help gain further insights from the initial findings. An item by
item comparison was conducted to identify which dimensions and factors found in interview
transcripts are not supported by the SLR findings. The emerging pattern of themes from the
data not in the initial findings is looked at. The identification and analysis of the new themes
will be discussed in chapter 0
3.3.2 Phase 2: Design and Build
Following the design science research paradigm, this phase discusses an artifact's design and
development to solve the problem identified in Phase 1. This is essentially the design cycle of
Hevner’s DSR three-cycle (Hevner, 2007). Figure 13 depicts a high-level view of the solution
produced at the end of the research project. The design framework's input is the results of
phase 1 of the DSR cycle (problem area).

84
Figure 13 Digital toolkit development cycle
The literature review provided the grounding to the research project and showed the barriers
faced, forecasting methods used and adopted solutions. The literature review also found that
judgemental adjustments are among the most used techniques used in forecasting uncertain
product demand and the highest barrier in forecasting demand. This research allowed us to
develop a novel decision-making making framework embedded in the toolkit design (Chapter
5). The pilot study confirmed our knowledge of the environment and informally identified the
forecasting demand barriers at ALM and developed a map of the overall supply chain. The
results from the field study lead to eliciting high-level requirements for a possible solution to
the problem. The requirements were prioritised (Chapter 3.3.2.1) by the executive
stakeholders to determine the required features of the solution. The purpose of the iterative
development cycle between the developer and stakeholders is to validate and verify the digital
toolkit as soon as the features are made available. This is to ensure most errors identified are
fixed before moving onto the final stages of testing and deployment.

85
In design science research, there have been various evaluation techniques proposed (Prat et
al.'s, 2014a, Peffers et al.'s, 2012, Pries-Heje et al.'s, 2008b, Venable et al.'s, 2012b, Gonzalez
and Sol, 2012). Peffers et al. Peffers et al.'s (2012) describe the evaluation process by defining
that it can be conducted “ex ante” (before) or “ex post” (after) the artefact construction. This
evaluation is a crucial and an essential activity. It guarantees that the new proposed and
developed artefacts in the DSR are achieved and works as intended (Gonzalez and Sol, 2012,
Peffers et al.'s, 2012). Phase 2 of the design science research will be revisited to refine the
toolkit as results of the evaluation conducted in Phase 3.
3.3.2.1 Requirements prioritisation
Requirements prioritization is recognised as an important activity in the requirements
engineering lifecycle (Moisiadis, 2002) and product development (Lehtola et al.'s, 2004). In
most projects not all the requirements can be implemented because of limited time and
resources. Therefore, decisions need to be made about which requirements need to be
delivered first and the remaining removed for future release. According to Wiegers (Wiegers,
2003) information about priorities is needed, not just to ignore the least important
requirements but also to help project managers solve conflicts, plan for staged deliveries, and
make the necessary trade-offs. Prioritization is an essential element in considering changes in
requirements, particularly rapid changes over time often referred to as requirements volatility.
Zowghi and Nurmuliani (2002) refer to requirements volatility as the potential for change in
the business environment, fluctuation in users’ requirements (instability), and disagreement
among users/stakeholders on requirements (diversity).
Requirements prioritization is the setting of ranks or ratings of importance to a set of
requirements based on certain criteria like goals, risks, quality, value to the stakeholders
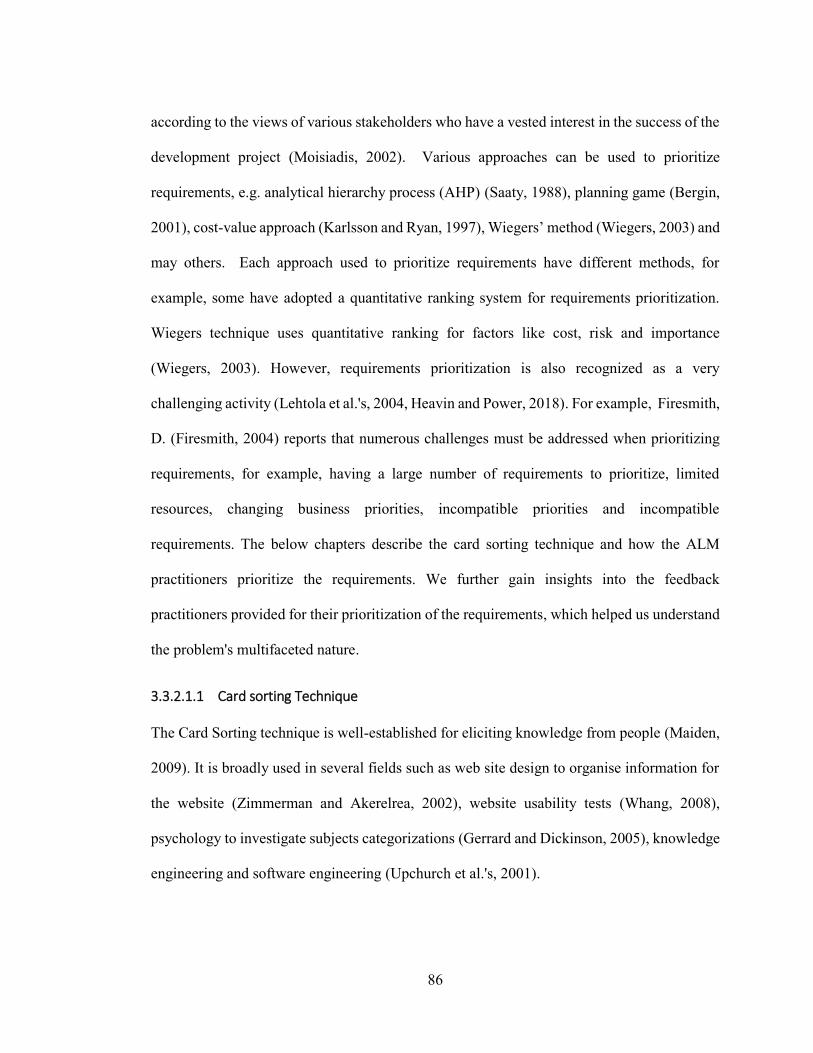
86
according to the views of various stakeholders who have a vested interest in the success of the
development project (Moisiadis, 2002). Various approaches can be used to prioritize
requirements, e.g. analytical hierarchy process (AHP) (Saaty, 1988), planning game (Bergin,
2001), cost-value approach (Karlsson and Ryan, 1997), Wiegers’ method (Wiegers, 2003) and
may others. Each approach used to prioritize requirements have different methods, for
example, some have adopted a quantitative ranking system for requirements prioritization.
Wiegers technique uses quantitative ranking for factors like cost, risk and importance
(Wiegers, 2003). However, requirements prioritization is also recognized as a very
challenging activity (Lehtola et al.'s, 2004, Heavin and Power, 2018). For example, Firesmith,
D. (Firesmith, 2004) reports that numerous challenges must be addressed when prioritizing
requirements, for example, having a large number of requirements to prioritize, limited
resources, changing business priorities, incompatible priorities and incompatible
requirements. The below chapters describe the card sorting technique and how the ALM
practitioners prioritize the requirements. We further gain insights into the feedback
practitioners provided for their prioritization of the requirements, which helped us understand
the problem's multifaceted nature.
3.3.2.1.1 Card sorting Technique
The Card Sorting technique is well-established for eliciting knowledge from people (Maiden,
2009). It is broadly used in several fields such as web site design to organise information for
the website (Zimmerman and Akerelrea, 2002), website usability tests (Whang, 2008),
psychology to investigate subjects categorizations (Gerrard and Dickinson, 2005), knowledge
engineering and software engineering (Upchurch et al.'s, 2001).
87
The utmost problem for Card Sorting effectiveness is that the participants and the researcher
involved should understand the domain adequately (Maiden and Rugg, 1996). In this study,
the participants were familiar with and understood the domain (Chapter 2) being elicited (i.e.
forecasting uncertain product demand in the supply chain). Furthermore, the researchers’
understanding of barriers in forecasting uncertain product demand and requirements
prioritization has improved significantly through the long-term field study (Chapter 4) at the
ALM.
There are two primary methods for performing card sorts, Open card sorting and Closed card
sorting (Spencer, 2004). Open card sorting typically requires the stakeholders to sort a series
of cards containing a description of domain entities into groups according to their
understanding. Furthermore, the stakeholder must explain the rationale for how the cards are
sorted (Zowghi and Coulin, 2005). To make this technique more effective, it is important that
all the essential entities are included in the process and requires that both the analyst and
participants have sufficient knowledge of the domain; otherwise, this technique produces
wrong results (Rehman et al.'s, 2013). Closed card sorting is identical to Open card sorting
except participants are asked to place cards into pre-established groups (Spencer, 2004).
Studies have shown that card sorting has many benefits that make it a useful technique for
eliciting knowledge. First, the card sorting process is simple to understand and simple to do
(Maiden, 2009, Fincher and Tenenberg, 2005). Second, card sorts require minimal technology
to be performed almost anywhere (Maiden, 2009). Third, the card sorting results can serve as
inputs for another technique (Upchurch et al.'s, 2001). Finally, the card sorting results can also
be used to develop further classifications such as information architecture hierarchies for web

88
sites (Zimmerman and Akerelrea, 2002). Figure 14. Depicts the card sorting steps that were
carried out at the organisation. The overall card sorting was completed over four days.
Figure 14 Card sorting steps
3.3.2.1.2 Participants
The closed card sorting exercise involved executive management stakeholders in our card
sorting exercise. The management members selected were the chief financial officer, chief
transformation officer and operations manager, we sent a meeting invitation to participants
requesting their contribution to the study. Before the card sorting exercise, the participants
were also sent a copy of the field study to provide them with more context around the high-
level user stories that we derived from the field study. The 3 participants involved in this

89
study were selected because they represented key decision-makers in forecasting product
demand in the supply chain and have a high-level view of the organisation. These participants
accepted to take part in the Card Sorting exercise, which was planned over a combined one-
hour meeting time slot organised according to all the participant’s availability.
3.3.2.1.3 Card sorting materials
Prior to the Card Sorting exercise commencing, a list of high-level user stories was prepared.
The user stories can be viewed in Appendix B. User stories describe functionality that will be
valuable to a system user (Cohn, 2004). The user story typically follows a simple template:
As a <user>, I want < goal> so that <reason>. These user stories were extracted from the
results of ALM elicitation interviews with stakeholders. We elicited the barriers (pain points)
in forecasting uncertain product demand from 20 participants belonging to the following three
business units: sales/category, operations and finance/IT.
A set of 25 cards were produced, each with a short user story. The user story includes the
stakeholder requesting the change, the requested change in functionality and, the rationale or
reason for the requested change. Each user story was typed on a 3” x 5” card. The cards used
were numbered and were all identical in colour, dimension, so that the results can be recorded
after each session. In addition to the 25 cards, 3 blank cards were also produced to allow the
stakeholders to write a user story that they believe was important and not present. In total
there were 28 cards available for each stakeholder.
3.3.2.1.4 Card sorting procedures
The primary and secondary researcher coordinated a card sort activity conducted over a one-
hour session with the participants. Since the requirements at this early stage are usually
expressed as high-level product features or functions, the interaction between various

90
stakeholders can be done quite easily (Moisiadis, 2002). Subsequently, with the executive
stakeholders' daily tight schedule and very limited time available, this exercise involved only
‘single-criterion sorts’, (i.e. sorting the identical set of cards, by relative importance criterion).
Prior to the card sorting activity proceeding, we provided a short presentation and discussed
the overall research project progress. Following this discussion, the card sorting activity
commenced in the following seven steps:
1. Instructions and a brief explanation of how to perform the card sorting exercise was given
to the participants. The sorting's main purpose was to prioritize user stories related to the
barriers in forecasting uncertain product demand.
2. The participants were each given a set of 28 cards. Before sorting the cards, the participants
were given time to read over all the cards and familiarise themselves with the cards'
contents.
3. According to their criteria, the participants were advised to arrange the cards into categories
of low, medium and high priority. Each participant placed a set of cards on the table and
organised them into three categories. The participants were permitted to discuss or seek
clarification of the user stories between themselves or with the facilitator as they felt
necessary. Figure 15 illustrates the participant’s sorting the cards.
4. The participants were also instructed that if they thought of an additional user story based
on their expertise which is not covered in the cards provided, they can write it down on the
blank cards provided.
5. Upon completion of the card sorting, each card's unique numbers are used to record the
participants’ chosen prioritization group of each user story and recorded on a spreadsheet.

91
6. Following the analysis of the results, the results were deidentified and shared amongst the
three participants.
7. A meeting was organised with each participant to obtain further information about the
participants’ reason why they chose to prioritize the cards in the manner they did. These
meetings were recorded and later transcribed for analysis.
Figure 15 Card sorting exercise taking place at ALM
3.3.2.1.5 Analysis
The purpose of the study was to validate and establish prioritization of the user stories for our
solution, the data collected (priorities and reasons) are in textual form and the analysis of the
results is qualitative. Considering that we used a small group of participants (3) from one
organisation, statistical analysis is not suitable. This study's data were analysed in terms of:
number of cards prioritized by category, lists of user stories stakeholder, lists of the
92
participants’ reason for prioritization, and the commonality (agreement) between the
participants on the prioritizations.
The agreement between participants reason for the prioritization of the requirement is
important. There are two types of agreement, verbatim and gist. Verbatim agreement occurs
when two or more participants use precisely the same words as each other. Gist agreement
occurs when two or more participants use different words for the same meaning (Kent, 2002).
An example of a gist agreement between two card sorting exercise participants is the
following; “The reason I have put that as a low is simply because I do not believe the sales
representative should be driving the supply chain I see it as the other way around”. Another
participant stated, “The reason why I put that as low because I do not think the sales
representative needs to do that. He needs to have trust in people to come up with that thing”.
Content analysis was used to assess the commonality between the respondent’s reasons for
the card prioritization. The respondents’ reasons are grouped into dimensions for each
priority. Where there is an agreement, the situation is straight forward, where there is a
disagreement, this needs to be investigated if possible (Rugg and McGeorge, 2005).
3.3.3 Phase 3: Evaluate
According to the framework for design science, it is critical to evaluate whether the designed
artefact can effectively solve the problem that motivated its creation (Hevner et al.'s, 2004).
There is limited guidance in the design science literature on the strategies and methods for
empirical evaluation of information system (Kitchenham et al.'s, 2006, Prat et al.'s, 2014b).
Hevner et al.'s (2004) identify evaluation as crucial and summarise five classes of evaluation
methods appropriate in the design science methodology, with 12 specific methods (mentioned
in brackets).

93
1. Observational (Case Study, Field Study)
2. Analytical (Static and Dynamic Analysis, Optimization and Architecture analysis)
3. Experimental (Controlled Experiment, Simulation)
4. Testing (Black Box, White Box)
5. Descriptive (Informed Argument, Scenarios)
However, there is a lack of guidance for selecting between designing the evaluation part of
design science research (Venable et al.'s, 2012a). Pries-Heje et al.'s (2008a) proposes a 2-by
2 design science research method selection framework (see Figure 16 below) and provides
guidance for considering how to choose among them.
Figure 16 Design science research framework (adapted from (Pries-Heje et al.'s, 2008a) )

94
The framework encompasses both Ex Ante (before artefact construction) and Ex Post
evaluation (after artefact construction) orientations as well as naturalistic settings (e.g., case
studies) versus artificial settings (e.g., lab experiments).
Ex Ante evaluation provides models for theoretically evaluating an artefact design based on
an uninstantiated artefact such as a system design specification alone or a partial prototype.
The evaluation is primarily dominated by the economic concerns of whether the system is
worth the cost. Ex post evaluation is an evaluation after an artefact has been constructed. (i.e.
an instantiation)
The naturalistic evaluation setting explores an artifact's performance within its real
environment (in our case this is the ALM organisation). The evaluation involves a real setting
with real people and real systems (Sun et al.'s, 2006), therefore it is always empirical.
Naturalistic methods include case studies, focus groups, surveys, phenomenology and action
research. The naturalistic paradigm's dominance is that it brings design science research a
stronger internal validity (Venable et al.'s, 2012a).
An artificial evaluation setting evaluates an artefact in a contrived and non-realistic way.
According to (Sun et al.'s, 2006), it is unreal in some ways, such as unreal users, unreal
systems and especially unreal problems. The evaluation involves laboratory experiments,
simulations, mathematical proofs, theoretical arguments, field experiments and criteria bases
analysis. Artificial and naturalistic evaluations each have their strengths and weaknesses.
Venable et al.'s (2012a) noted that more than one method could be used, mixing artificial and
naturalistic evaluation and qualitative and quantitative methods, leading to a robust design
science research evaluation.

95
In this research project, Phase 3 uses various evaluation methods to validate the digital toolkit
output of Phase 2. We establish an evaluation framework (chapter 6.3) to define and relate
the evaluation's key concepts. Early on in the development phase, the research project
deploys iterative testing by the researcher and feedback from executive stakeholders to ensure
any inadequacies identified in the digital toolkit are resolved during the development
iteration. The refinement of the digital toolkit during the development iteration paves the way
for greater validity in the artifact's design and development. The validation in this phase
evaluated the artefact to determine if the research goals have been achieved.
Limitations of research design
As with all qualitative based research methods, there are natural limitations to the research
design. The qualitative research method is more concerned with the details of the samples
studied rather than the representation of a population (Creswell, 2009, Leedy and Ormrod,
2005) Hence, the results obtained from the qualitative method may not apply to other contexts.
However, it is not the intention of this research project to generalise the results obtained. The
research design and execution of this research project has been explained insufficient details
in the research introduction (chapter 1.8) and later on in the research method (chapter 3) and
field study (chapter 0), to make the study repeatable, so that other researchers may be able to
perform similar studies in different contexts.
The number of respondents and the detail of the questions could also be considered as
limitations on the research project, however, this has been minimized by the strict criteria for
participation, the iterative analysis and refinement of the questions and the opportunity for
follow-up questions and response clarification during the study.

96
Cultural and educational biases may also be a factor. Some respondents originate from a more
technical and process-oriented environment, whereas others from a more managerial,
financial or sales background. The respondents' memory and opinions may be overly affected
by their more recent experiences or by their most significant successes and failures. To reduce
this bias, invitations to participate in the interview study were not sent by the researcher who
worked in the organisation. The principal supervisor was brought in to ensure the outcome
and overall results of the qualitative field study remained unbiased.
Limitations in the data collection tools also exist, specifically semi-structured interviews. The
interview participants’ responses were based on their opinion, memory, and experiences. It is
possible that the responses did not factually describe what actually happened. The semi-
structured interview was designed to repeat some similar questions at different stages of the
process. This allowed the participants’ responses to be verified, and further clarification could
be sought from the participants if required.
We acknowledge that the focus group results may have been biased as it was conducted by
the researcher, who is also an employee of the organisation. However, this was counteracted
by providing participants with an anonymous questionnaire and ensuring the moderator did
not attract additional attention during evaluation by attempting to make the researchers'
involvement as unobtrusive as possible. However, we concede that the digital toolkit
developed should also be tested in other industries to see if it is appropriate to be applied in
different contexts and if the evaluation results are alike.
Ethical Considerations
For this industry research project, the University of Technology Sydney (UTS), Human
Research Ethics Committee (HREC) approval was obtained before conducting the field study

97
and contacting any participants involved in the research project according to the UTS
guidelines. An application was prepared and submitted for UTS HREC. The approval was
granted in March 2018; the approval number is UTS HREC REF NO. ETH17-2021. The
purpose of obtaining ethics approval is to ensure that the research was conducted with
integrity, and the confidentiality and privacy of the participants were maintained. All the
participants should be protected from harm, loss of privacy and deception. All the participants
must also be invited to join this study; hence, the interview could not take place without
written consent from the participants. The participants were approached by sending them an
invitation letter (see Appendix A) from the university supervisor via email. A participant
information sheet (see Appendix A) which outlined their rights was also included. Participants
were also given a consent form (see Appendix A), they were asked to read it carefully and
understand their rights. The participants were also briefed on their personal data, data
safekeeping, and the complaints procedure to UTS HREC. Once participants expressed their
understanding and acceptance they were asked to sign the consent form. Participants were
also informed that they could contact us if they would like to know the research's progress.
Summary
This chapter reviewed the research based on the design science research methodology used in
this thesis. A design science approach is followed to design and develop a toolkit to support
ALM stakeholder in forecasting uncertain product demand. This research is organized in three
iterative phases. Phase 1 is the identification and establishment of the research problem. There
are three activities undertaken in this phase. Phase 2 fundamentally is the artefact design and
development based on the environment in Phase 1. Phase 3 is the evaluation phase of the
artefact. All these phases are elaborated on in corresponding chapters in this thesis and shown
in Figure 8.

98
4 Field Study
Chapter Overview
In the previous chapter, we described and justified the research methodology we have chosen,
and activities performed to address the research and industry problem. This chapter will
provide our pilot study and the specific activities we performed to survey and map the supply
chain process of the Australian Luminaire Manufacturer (ALM). This chapter aims to provide
a foundation for our research by investigating and surveying the current state-of-the-practice
in forecasting uncertain product demand in the Australian Luminaire Manufacturer. The pilot
study's outcome was to help us further understand the sales and operations planning process
(chapter 4.2) at ALM and document a process map of the supply chain (chapter 4.3). The
process map graphically shows the path of the current processes in the end-to-end supply
chain. The process map provides a quick high-level visual overview of the end-to-end process
flow involved in receiving customer orders to manufacture and deliver the products. The
extensive field study (chapter 4.4) investigates the current state-of-the-practice in forecasting
uncertain product demand (Research Goal 2) in ALM. The results from our qualitative
interview study form our high-level requirements. The technique used to prioritise the
requirements is discussed (chapter 4.5) followed by a discussion (chapter 4.6). Following a
summary is presented (chapter 4.7) of the entire chapter.
Sales and Operations Planning at ALM
The below section details the sales and operations planning process at ALM. This has been
documented through our informal discussions during the pilot study.

99
The sales and operations planning (S&OP) is a process in the supply chain that is performed
once a month where ALM executive management meets to review projections for demand-
supply, inventory, and the resulting financial impact. The S&OP is a decision-making process
that ensures the company tactical plans align with the overall business strategy (Cox and
Blackstone, 2002). Several steps are carried out monthly in the S&OP process, these have
been grouped into 4 stages. Figure 17 illustrates the steps that are taken and the sequence they
are performed.
Figure 17 Sales and operations planning schedule and steps
The below sections will discuss the steps that are performed as part of the S&OP process.
4.2.1 Step1. Gather base data and analyse
The first step of the sales and operations planning is the data gathering, this step prepares the
relevant data to be sufficient to answer the question regarding the expected product demand.

100
However, the data required to represent product demand accurately is not readily available for
reasons that include the changing competitive landscape, non-stationary demand, the inability
to record lost sales and the challenge of quantifying expert opinion (Chen-Ritzo et al.'s, 2010).
The data gathering process at ALM is time-consuming due to the double handling of the data
each month. There are 5 data sources that are used to extract the required demand data. These
include the enterprise resource planning (ERP) Movex system, demand solutions (DSX)
system, TM1 online analytical processing database, customer relationship management
(CRM) system and any market intelligence.
The ERP system data provides a snapshot of the position of the business. Data such as the
inventory position, ABC frequency at SKU level, what business areas they sit in, item type of
product and all the other characteristics of the item. This ensures that the data can meet all
stakeholder requirements. The DSX system provides a statistical SKU level forecast by the
district based on historical sales adjustments. Judgemental adjustments are made to this
forecast by supply chain stakeholders before loading this through to the ERP system. A new
product development forecast is also derived through the TM1 system. This originates from
the Gross Margin Return on Investment model (GMROI), which contains all the relevant
details and expected forecast for 12month. The category team manages this due to the lack of
historical data available for the DSX system to perform a forecast. The S&OP analysis is
multilayered as it involves a range of data sets from the actual historical sales, stock on hand,
order book, proposal and manufacturing orders. A substantial amount of work is carried out
to align the data by the product SKU. Once these are aligned, the analyst manually pivots the
data into excel and saves a file for each month. It has been noted that the data gathering and
analysis process lacks automatic processing and business rules. This process's ultimate goal

101
is for the analyst to determine the base forecast and the lumpy demand. The lumpy demand is
defined as sales that are either a specific project, container buys, promotions, or new product
launches. Following the gathering and analysis of the data, the demand plan is created.
4.2.2 Step 2. Demand Planning
The demand plan produces the initial cut of the first forecast (Chen-Ritzo et al.'s, 2010), it
mainly focuses on forecasting demand for present and new products based on past events
(Noroozi and Wikner, 2017), with all the assumptions that have been collated from the various
systems above. Additionally, the demand plan also acknowledges the uncertainty associated
with the initial demand plan's forecast set (Chen-Ritzo et al.'s, 2010). For example, what
opportunities does the business foresee winning based on what they think will happen?
Meetings are scheduled at ALM with regional managers, executive sales managers, and the
category team to gather any market intelligence. The business is planning to move out of a
particular technology and towards a new form. These meetings are scheduled to determine the
demand and inventory perspective from the supply chain stakeholders. During these
discussions, the S&OP analysts have validated the positions of the projects, by knowing what
the stakeholders believe they are going to win and what they are communicating with the
customers. Based on these discussions the demand plan is then created to align with the
outcome of the discussions. Following the demand plan, the inventory and supply of products
are considered in the next step of the S&OP process.
4.2.3 Step 3. Inventory and Supply Planning and Balancing
The demand plan is then used for the supply planning and balancing step where capacity
planning is performed based on, available capacity and inventory levels (Noroozi and Wikner,
2017). An analysis is performed on the core range of product inventory to determine if there
is a critical stock situation for the top-selling 50 SKUs. If a critical stock level is found and

102
the business will go below safety stock levels the business determines what action it needs to
take. The analysts try and determine why there is not enough stock to attempt to address this
problem, this could either be that ALM either oversold stock or did not manage the stock
levels correctly. Meetings are carried out with the purchasing team and manufacturing for the
capacity planning of manufacturing. People must gather from different related areas to provide
a platform for cross-functional discussion and decision-making (Wallace, 2004).
These meetings' objective is to determine if there are any constraints in manufacturing the
stock such as resources constraints, supplier or vendor problems, or if the safety levels are set
too low. Any concerns at this point are escalated to ALM management and a balance demand
and supply meeting is scheduled. The balance demand and supply meeting is performed with
key stakeholders, including the chief operations officer (COO), to evaluate what demands the
business can meet, what demands the business cannot fulfill, the impacts, and any ongoing
issues. The chief operations officer determines any actions that need to be performed before
the final pre-S&OP and S&OP meeting.
4.2.4 Step 4. Pre- S&OP and S&OP
In the Pre-S&OP a meeting is held to discuss what has taken place in steps 2 and 3. The chief
operations officer (COO) can sign off on certain things so the operations team can progress
with the plan. Following the pre-S&OP meeting, an executive S&OP meeting is scheduled
and it is when the business puts forward its operations plan to the executive team. At this
meeting adjustments to the S&OP forecasts can still be made by the executive team.
Findings from the pilot study
We now present the pilot study findings that resulted in a process map of the supply chain at
ALM.

103
Figure 18 demonstrates the front end processes of the supply chain at ALM. There are two
possible ways for an opportunity to be identified for ALM. Firstly a sales representative
obtains a lead and enters the details into the customer relationship management (CRM) (1.
Enter in any new opportunities not captured from BCI). The other way is to retrieve
opportunities from the online building and construction information (BCI) platform and load
them into the CRM system. The BCI data contains all development approvals (DA) submitted
to the local government authority for approval. A filter is applied to the BCI data to ensure
only opportunities with a DA value greater than $50,000 are retrieved and loaded into the
CRM.
Once the opportunity data is in the CRM system it is reviewed and allocated to a sales
representative to pursue (2. Review & allocate opportunities). The sales representative will
engage with the customer (3. Customer engagement) to determine customer requirements. A
customer master quote (4. Create master quote) is produced for the opportunity. The purpose
of the master quote is so that the sale representative can reproduce the quote for multiple
wholesalers or contractors who are tendering for the same opportunity. Individual quotes can
then be produced (5. Create individual customer quote) by duplicating the master quote to be
sent out to multiple contacts such as wholesalers or contractors. These individual quotes can
be modified to meet the specific needs of the wholesaler or contractor. Multiple versions can
exist of a quote and the one that the customer accepts (6. Quote accepted) proceeds to an order.
A customer order is created (7.customer order created) in the CRM sent through to the
enterprise resource planning (ERP) system. This order can still be modified however not in
the CRM, it can only be updated in the ERP system. Once the order is finalized, the products

104
are sent out with the invoice to the customer. Table 7 highlights the front end supply chain
barriers that have been identified as the process map was produced.
Table 7 Front end supply chain barriers
Process Number Barriers identified
1.Enter in new opportunities N/A
2.Review & allocate opportunities N/A
3.Customer engagement Misunderstanding of product specification requirement
Customer not clear on lead times required for product
4.Create a master quote Master quote does not reflect the individual quote
5.Create individual customer quote Customer accepts product specifications without all key
project stakeholders approval i.e. Architect
6.Quote accepted Customer changes product required
Customer overstates order requirements
7.Customer order created Customer order in CRM does not match the original
order created
The customer order is not the same as the quote

105
BCI Web Service
Sales Team
SQL Server Integration Service
Product Development Request (PDR)
2. Review & allocate Opportunities
BCI Opportunities
1. Enter in any new opportunities not captured from BCI
ALM Commercial &Industrial Segment
ERP
Sales Team
Workfront Web Service PDR Request
ALM roadway Segment *
customer
Master Quote
7. Customer order created
Sales Rep
Existing Product?
Quote#1QuoteQuote#2QuoteQuote#3Account &Product
Details loaded
Account/Product/PDR details loaded
AcceptedRejected
6. Quote#3 Accepted
Yes
4.Create master quote
Create customer order
Create customer order
Rejected
No
5. Create individual customers quote
Product Design Request (PDR)
Assessment
PDR Made and Approved
3. Customer Engagement
CUSTOMER
ORDER
*process not depicted in diagram
Converted to order
Figure 18 Figure 18Front end of supply chain at ALM (sales order process)

106
The back end of the ALM supply chain Figure 19 demonstrates the steps that take place once
an order has been placed. There are three sources of products that ALM offers customers. The
three sources are; 1. Overseas finished goods, 2. Locally manufactured or 3. Locally modified.
Overseas finished goods are products that are bought from overseas and on-sold to ALM
customers. Locally manufactured products are where components are bought from suppliers
and the product is manufactured/assembled in the ALM factory once all the components are
available. Locally modified products are when existing products are modified locally to meet
a specific customer requirement. Table 8 highlights the back end supply chain barriers that
have been identified as the process map was produced.
Table 8 Back end barriers of supply chain
Product Source Barriers identified
1 Overseas finished good Supplier may no longer make the component required
Supplier may no longer exist
Supplier makes a slight modification to the component
after the first batch is sent
2.Locally manufactured Products are miss placed in the warehouse and not
found when required.
3.Locally modified N/A

107
C
U
S
T
O
M
E
R
O
R
D
E
R
1. Overseas Finished Goods
2. Locally Manufactured
3. Locally Modified
Raise purchase order with Supplier
Manufacture Warehouse/ Pick Product
Delivery Doc
Delivery
PaymentAfter Sales Support
Manufacture create proposal
Order Bill of Materials (BoM) /
Required Components are determined
Design Engineers Lab and Compliance
Once confirmed Confirm
Proposal
Raise PO
Raise PO/ MoQManufacture goods
internally
Use ordered components
If components available
Product Design Request
QA/QCCreate new SKU in ERP
Freight
Supplier sends goods
Proposal PO Firm PO
Approved by Purchasing
Officer
Supplier Confirmation
Obtain confirmation
All orders Allocated
Automaticaly
Print Picking Slip
MOVEX - ERP
Customer Service
release Order
Overnight Invoice Run
Invoice Sent
Figure 19 Backend of supply chain (sourcing, manufacturing and distribution)

108
Findings from the interview study
We now present the quantitative findings that resulted after evaluating the barriers in
forecasting uncertain product demand.
Figure 20 shows all the categories that were identified after the data analysis was completed.
The customer and culture categories are two new categories that were established and were
not part of our SLR. The total number of participants who mentioned a barrier in forecasting
uncertain product demand is primarily dominated by the culture, product, technology and
communication. These four categories contained the highest contributions from all participant
groups. The results of all the categories will be presented further below.
Figure 20 Number of participants contributed against the derived category
The top 10 barriers mentioned by the participants are shown in Figure 21. Some theme names
come from the SRL e.g. seasonality and poor communication others purely from the thematic

109
analysis, e.g. lack of understanding and lack of data governance. Overall the barrier with the
highest number of mention is a lack of commitment.
Figure 21 Top 10 barriers in forecasting demand
The results in Figure 22 illustrate that each business group interviewed have a different set of
their top 10 barriers. The sales and category teams are the only ones included in all the top 10
barriers.
0 2 4 6 8 10 12 14 16 18
Lack of commitment
Poor Communication
Lack of Data Governance
Seasonality
Difficult to understand market
Inadequate Information systems
Lack of understanding
Lack of horizontal alignment
Lack of Data
Short product lifecycle
Field Study SLR

110
Figure 22 Top 10 barriers by participant groups
Our findings have been grouped into internal and external barriers. Internal barriers are found
to be within an organisations’ internal environment made up of employees, management,
communication and culture (Parmar et al.'s, 2016). The external barriers relate to outside
factors that can impact an organisation in its ability to forecast demand. A brief description of
our findings including quotations from the interviews within each of the categories follows.
4.4.1 Internal Barriers
Organisations are known to suffer significantly from the insufficiencies of their supply chain
and as a result, they need to recognize their supply chain positioning and the variables outside
their control (Adebanjo, 2009). Internal barriers are found to be within an organisations’
internal environment which is made up of employees, management, communication and
organisational culture (Parmar et al.'s, 2016). The internal barrier is a high-level category that
contains all the barriers related to the organisation factors.

111
4.4.1.1 Organisational Culture
This category relates to the behaviours and needs of supply chain stakeholders, including
customer behaviour and their service/product needs. Studies (Min et al.'s, 2005, Thernøe et
al.'s, 2003) have referred to culture as a driving force behind effective supply chain
management and organisational collaboration. All participants interviewed have expressed at
least one barrier related to culture that impacts forecasting uncertain product demand. These
will be discussed in more detail below:
Lack of commitment: Commitment refers to the willingness and dedication one gives
to a cause or activity. 18 interviewees stated that lack of commitment was a contributing
barrier in forecasting uncertain product demand. Although organisations may have
forecasting plans in place, they typically require the cooperation of many people,
Armstrong and Brodie (2005) found that sometimes an organisation fails to do what it
intends to do because of a lack of commitment to the plan by key people such as senior
managers. This is evident in ALM, a sales and category group participant who indicated
that ALM faces its own internal barriers in lacking commitment in the forecast, “We all
need to own this process not just the person that's having that conversation with the
customer”. This lack of commitment is also stated to impact the supplier and the cost of
products: “The business requests a better price except they do not commit for a long-term
forecast...”
Lack of horizontal alignment: This barrier refers to the alignment between an
organisations functional units, it can be defined as the coordination or fit of strategic
goals, structures, and tactics of different units of the organisation with each other
112
(Rosemann and vom Brocke, 2015, Palmer III, 2007). Almost half of the interviewees
expressed that a lack of horizontal alignment is a contributing barrier in forecasting
uncertain product demand. The results demonstrate that there appears to be a
disconnection between different departments in the organisation. A participant from the
Finance/IT group stated, “They come up with these great ideas what they want to do, but
the impact on the other departments they have got no idea”. Key performance indicators
(KPI) are also said to be contributing to this barrier, a participant from the operations team
stated “one team's KPIs is to reduce the number of SKUs we have they just keep killing
and switching things off. The other team's KPIs is to introduce new products and they
conflict with each other.
Lack of confidence: Christopher (2004) defines supply chain confidence as how much
faith the various stakeholders in the supply chain have in themselves to do what they say
they are going to do. 6 respondents stated that there is a lack of confidence in the sales
forecasting numbers and process. It has been stated by a participant from the Finance/IT
group that “historically we have issues with salespeople trying to over-promise the
quantity, then the demand planner will cut off, okay if you say 10,000 I am only going to
order 8,000, that is one of the things that they do and then all of a sudden we need 12,000
and we do not have enough.” A supplier also found ALM to be lacking confidence in the
forecast numbers stating, “Since I have worked with ALM I have always struggled with
getting a right forecast… ”
Lack of trust: 6 interviewees have stated that lack of trust was a barrier in achieving
accuracy in forecasting demand. Trust is a term with many meanings (Williamson and

113
economics, 1993), it is a term for clustering of perceptions (C, 1992) and is central and
critical during periods of uncertainty (McKnight et al.'s, 2000). Most respondents state
that the lack of trust is due to salespeople over-promising the forecast demand. In addition
to this, a sales and category team members stated that “Salespeople have a history of
telling customers what they want to hear which just gets us into trouble further down the
track. . Only one participant from the operations group stated that lack of trust is a barrier;
“Whatever their budget number was, was what they'd tell you they're going to sell and
there was no honesty in that. From an operational point of view, I understand what you're
giving the board but that was 6 months ago, I want to know what we are doing in the next
3 months. if that is lower or higher I do not care, we are here to make sure that the right
stock is here for you”.
Lack of agility: Agility in the supply chain refers to the ability to quickly react to changes
such as new product innovations and market demand changes (Christopher, 2000). To
gain market share and achieve a forecast, timing to market and agile supply chain
management is known to be important in modern logistics (Miao and Xi, 2008). Overall
the results demonstrated that ALM is lacking in the ability to adapt its sales forecast, It
has been stated a participant from the Finance/IT group: “we need to be quicker” another
participant from the sales and category group stated: “When we develop a product we are
developing it with a view to bringing it in within the next 6 months. The fact of the matter
is it's generally 9 months before we get it in and what's happened in the market in that
period can have an impact on demand.”

114
Fixed mindset: This barrier assumes a person’s ability, talent or intelligence are simply
fixed. Two participants from the Finance/IT group stated this as a barrier, one responded
said: “A lot of things are just done because that's how they've always done it, which I find
bizarre”. It was also stated that “a lot of staff don't like change, long term, staff that have
been here a long time can be poisonous to other staff if they're not happy. That's a real
problem because they can wear you down with their negativity.”
High staff turnover: 2 respondents believe that there have been a lot of people departing
the business and new people joining the business which has impacted ALMs forecasting
capability, one participant from the sales and category group stated: “I think we've lost
that art, and we'll get it back but it will just take time, of having that deep and meaningful
conversation with the customer”.
4.4.1.2 Product
This category relates to forecasting barriers related to the organisations’ products. This
category shows that 15 respondents state that there are forecasting demand barriers related to
the product category.
Short Product Lifecycle: Lapide (2001) defines a short lifecycle product as one that
is only sold for a limited or finite period, at least in its most recent formulation. 8
respondents stated that the products short lifecycle plays a role in forecasting product
demand. Several respondents stated that the product lifecycle is 6 months before it is
superseded with a new product. A participant from the operations group has stated
that this short product lifecycle is due to “the speed that technology is changing”. A

115
participant from the sales and category group also states that “things that I forecast
today for the next 3 months, in month 2 can suddenly change the demand just because
new technology is coming in that month”.
New Product Introduction: 6 participants stated that a new product introduction into
the market causes forecasting barriers. A participant from the operations group
expressed that “when we release a new product we don’t provide the sales team with
all the details and specs, such as what is good about this product and the sales team
don’t know when new products are coming”. A participant from the sales and category
group also stated that “sometimes new product launch will just completely replace
something that you have already, you can cannibalise on some of your sales” it’s been
said by an operations participant that “if it’s our own product eating us or the
competitor product, we need to know so we can drop the forecast”.
Product Price Change: All respondents that believe the product price change is a
barrier in forecasting product demand are from the sales and category group. One
participant stated that “our pricing system is too complicated”. The other participants
all related this barrier to the price erosion of products, “the forecast links into your
price point, say we are forecasting today the launch of the product is 5, 6 months so
price might already have moved in the market, you might be out of the market with
your price”.
Substitute product introduction: This barrier relates to products that are replaced
with another to provide alternatives to customers. 2 respondents stated this to be a

116
barrier in forecasting demand. A participant from the sales and category group states
that the transitioning from one product to another cause’s issues within the
organisation and the customer: “We might change the style of the product a bit because
it will be the next generation and that can create a problem for us, reintroducing the
next generation and it will have an impact on demand because the market had this
code item listed on their system and although fundamentally it's the same, it's our new
improved version, it's now a different code, either A they can't find it or B they haven't
loaded it”.
Product customisation: The customization of products is an important offering for
ALM as it provides a competitive edge against the competitors. Both respondents for
this barrier are from the operations group and they state that “the trouble I find all the
time is we tend to want to do variations too much. If they keep chopping and changing
and making their own special key or version for this customer just for 5, 10, 15 pieces
is it worth going through the headache and hard work behind there to supply. If it's a
bulk order a couple of thousand units it would make it worth it. “.
Large product range: ALM benefits from offering a large array of products to appeal
to a wide range of potential customers, these products may be a variation of the same
product in different sizes and colour. The difficulties in forecasting a large product
range has been stated by participants in the sales and category group and operations
“ALM has more than 30,000 SKU right, we have to forecast a lot of different
products.” The drawback of offering a wide range of products creates additional data

117
and complexity in managing the product range. It is noteworthy that the organisation
is in the process of rationalizing the product range to alleviate this barrier.
Safety stock: This relates to ALM’s additional quantity of products or components
that are held to reduce the risk of being out of stock and also ensure there is a buffer
if there is a spike in customer orders. 2 participants stated this as a barrier, a participant
from the operation group stated that safety stock should be revised given that the
forecast is being missed due to a lack of components, “Who knows what we should be
holding. Who knows how much buffer stock we should be holding for the contract.
We should just bring in low-value components that are required…”.
4.4.1.3 Technology
This category refers to the information technology tools/applications that are used in the
organisation. The technology category results show that 16 respondents believe that
inadequate information technology is a barrier for forecasting uncertain product demand. 4
respondents are from the Finance/IT group, 7 sales and category group and the remaining 5
from operations. No supplier or customer of ALM considered information technology as a
barrier.
Inadequate Data Governance: Newman and Logan (2006) define data governance
as “the collection of decision rights, processes, standards, policies and technologies
required to manage, maintain and exploit information as an enterprise resource”. Data
governance is important because it defines policies and procedures to ensure proactive
and effective data management. The adoption of data governance enables

118
collaboration from various levels of the organisation to manage enterprise-wide data
and it provides the ability to align various data related programs with corporate
objectives (Wende, 2007). Most respondents from this factor stated that ALM is
reliant on excel and many things are done manually, “we do a lot of manual work here
and it’s very easy to make mistakes or misread some things.” Further to this, a
participant stated that, “the forecast we do here is too brief and there are too many
forecasts, there should only be one forecast, it should be a bottom-up forecast”.
Another participant raised the same point stating, “The thing is we still have the actual
forecast, the potential forecast, we even have the contracts”.
Lack of Data: Most participants also believe that there is a lack of available data, “in
our industry, there are no reports on competitors’ products, customer feedback,
customer pricing, market analysis; it’s mostly what you sort of create from what you
find out, there is no database or anything”. Another participant raised the same point
“we don't see what the competitors are selling, it's only a bit of experience and there's
no place we can go and buy the data because there isn't any. You talk to the
wholesalers and if you're lucky you might get their volumes”. Further to this one
interviewee said “people are reluctant to give you data and it's a unique industry like
that because you can't get the data”. A different perspective was given by a participant
when there is data, it can vary across the country, “even though we have one industry,
it varies dramatically from state to state because there are dominant players in certain
states.” The methodology used for the data analysis also stated to be inadequate due
to the lack of available data, “we use historical data for our reference when we do
forecast but our industry has changed; we are part of electronic products right now.

119
Electronic for the like of PCB boards and chips, they change every three to six months
and when we are still using the traditional method using historical data from Excel
spreadsheets…”
Inadequate Enterprise Information Systems: ALM embraces enterprise
information systems such as Movex for its enterprise resource planning system (ERP),
demand solutions (DSX) for statistical forecasting, customer relationship
management system (CRM) for managing, project opportunities, quotes and orders.
Almost half of the interviewees stated barriers in enterprise information systems, from
the reliability of the systems such as, “we can’t rely only on the CRM data only, we
need to build relationships with the sales team and managers”, through to concerns
with the data in the systems such as “we could do much better with the accuracy of
the information. An interesting point made by a participant is that human intelligence
is still required with the CRM system, “with CRM it's all about scanning that data
and separating real versus fiction because a lot of quotes are repeated, multiple
customer has been quoted the same item, what's real, what timelines are really true,
a quote was done 3 months ago, the customer wanted it in June the project is now
delayed to July so unless you have that human interface who is talking to the customer
all the time, or that human interface updating CRM all the time, that discipline I don't
think is there in the business as of now which needs to improve..”. It is noteworthy to
note that the CRM system is also fairly new in the business as stated by an interviewee
“It is new to the business, so the business is learning in terms of how effective it can
be…” Other systems that the participants found contributing to the barriers include
the DSX where one participant stated, “DSX worked well with our traditional product

120
when they were around longer, but now it’s not as good”. Another participant put this
down to “I don't think that there's enough… qualitative input”. Further to this an
interviewee stated that “the DSX doesn’t know what’s coming in the future, it needs at
least 12 months’ worth of data”. In addition to these system barriers, participants also
stated interconnectivity between systems as a problem, “I think if CRM and Movex
were a little bit more connected, it might help in terms of having all the history of sales
of the item, like if you have that, it might help”.
4.4.1.4 Communication
This category refers to the communication and collaboration between stakeholders of the
supply chain. Results show that 7 participants from the sales/category team and 5 operations
participants experience communication barriers in achieving forecasting accuracy for
uncertain product demand. We now give more details about all the barriers under this
category.
Ineffective communication: Participant from the sales and category group states that
during the holiday period the organisation fails in communicating, “There’s an email
that goes out to everyone saying Chinese New Year so get your orders in before
February, okay well does that mean everything or what does that mean, what
products, you know what does it actually impact on - is it all the metal products...”
This was also raised with the business's communication during the European vacation
in August or September. Another participant from the sales and category group states
that the business fails in communicating new generation products well, “we haven’t
communicated a new generation of product through to our customers well and expect

121
the product continually to have growth, instead it goes through a ramp process”.
Communication in the organisation is also said to be poor by an operations participant
when a products bill of material (BOM) is being changed due to a product
development request (PDR), “we don't know what they've changed to the BOM so if
they change it to different drivers and boards they've still got to be tested and stuff to
make sure it works and it's quality tested. That's where we shouldn’t be promising
any dates or lead times…” Another participant from the operations group also touched
on this point and the poor communication on PDRs, “They want a fitting, but it's
slightly modified, this is what I want. You look at it and then see all the holes, the
questions that need to be asked. You haven't told me what type of ceiling it's going to
go into, you haven't told me what colour you want it painted, you haven't told me...”
Lack of understanding: Due to poor communication, respondents' lack of
understanding is also a highly noted barrier. Interviewees stated that there is a lack of
understanding when forecasting demand, “The margin cycle is not understood, and
the category person had a lack of understanding of the industry and a lack of
understanding of the product itself”. The sales team also face this barrier in the
organisation “I think the biggest thing with forecasting for this organisation is just
people understanding it. I still get frustrated with some of my sales representatives,
they see that we have something in stock and they don't forecast it...” Another
participant also highlighted a similar point, “I think one of the big things is our sales
team don't fully understand the backend of operations. Technology has got us to the
point where you and I can hop on the internet tomorrow and get something from e-
Bay, Ali Baba and it's delivered within 4 to 5 days. So, I think a lot of the guys in the

122
sales team think that they actually don't understand the complexity of the supply chain
and they don't understand why it's not sitting on the shelf.” Overall the results for
communication demonstrate that poor communication and a lack of understanding are
two factors that are playing a part in the barriers of forecasting uncertain product
demand in the organisation, one interviewee stated that “You would talk forecast and
demand to some of the other business units and it will go over the top of their head
because it's not anything of interest and that really affects me”.
Judgmental adjustment: This node refers to forecasters incorporating factors that
may not be accounted for in a statistical forecast, such as promotions, large sporting
events, holidays, or recent events that are not yet reflected in the data. However, the
advantages of judgmental adjustments come to fruition only when the right conditions
are present and come with biases and limitations (Hyndman and Athanasopoulos,
2018). It is noteworthy that this factor had the lowest mention in the communication
category. Only one interviewee from the sales and category group stated this factor
“A 60% project win certainty to someone could mean something different to someone
else”. The participants' view is that a judgmental certainty percentage placed on a
project being won could be interpreted differently by the business.
4.4.1.5 Marketing
This category relates to the overall electrical industry market and ALM’s marketing strategy.
The role of marketing in the supply chain is to balance the procurement by providing demand
information and improving the growth of the business by providing industry knowledge (Min

123
and Mentzer, 2000). Overall almost half of the participants stated it is difficult to understand
ALM’s market. 5 out of the 8 interviewees are from the sales and category group.
Difficult to understand the market: Participants have raised multiple points, a
participant from the Finance/IT group stated that ALM is said to be “sales led here
not marketing led”. Several participants have mentioned that there is a lack of data
from the overall industry market, a participant from the Finance/IT group put this
down to “our market research is not that great”. One participant from the Finance/IT
group went further to state that “there is lots of competition in the market, so we try
and please the customer with any way we can and put the pressure back on the
business and supply chain.” A participant from the sales and category group stated
that the trouble in achieving a better forecast is that “the industry is very
misunderstood, it's not well defined because you got multiple players who are not in
the industry but are still selling products from the industry”. Another participant from
the sales and category group stated that not only does ALM require local market
knowledge from the sales team and people such as specifiers and contractors but ALM
“needs to engage the manufacturer that means China suppliers right now. We need
to know what happens in the market globally, like US or European, what are they
doing…” A supplier participant also confirmed the ALM market is a challenge by
stating that ALM is “a small-scale market and very fragmented in Australia compared
to the rest of our customers. It’s not like the UK and USA where there is a dominant
player such as home depot or cooper, their position on their forecast is more accurate,
but I think it’s because of the nature of the market”. Overall one interviewee from the
sales and category group summed the market barriers as “our business market share

124
is less than 20 per cent, we have 5,000 competitors, and everyday everything changes
very, very quickly. We are the largest yet we only own 20 per cent, so you can
understand the complexity…”
4.4.2 External Barriers
The external barriers relate to outside factors that can impact an organisation in its ability to
forecast demand. Below are the external barriers that impact ALM in forecasting product
demand.
4.4.2.1 Environment
The environment category refers to either ALM’S surroundings, including natural, seasonal
and political forces that have an impact on the environmental surroundings. 12 participants
provided insights into the barriers faced in this category.
Seasonality: participants from the finance/IT and sales/category group stated that
ALM “needs to consider the Chinese shut down period”. The reason for this was stated
by a participant “every year we have issues during Chinese New Year time that either
- everything gets sent too early or because the factories are closing down, we can't do
anything until Chinese New Year is over and then we have to get a delivery then, that
costs a lot of air freights…” The results for operations group show that forecasting
demand is impacted during Christmas period. “On the big projects the guys want to
finish their projects by December, there are those targets, everyone tries to work
towards getting the job done before Christmas shutdown. So, end of the year gets
crazy”. However, another participant stated the opposite of this “in ALM it’s totally
different, our demand goes down during November, December because that’s when a

125
lot of contractors go on leave.” The customer participant stated that “the holiday
period impacts our projects and at most times we don’t consider our suppliers holiday
shut down and their own suppliers’ shutdown as well”.
Change in government policy/regulation: A participant from the sales and category
group stated that “from the manufacturing side and China government, they have
imposed a heavy law or regulation against the environmental protection in China and
also most of the carton-making manufacturers, also some of the die-casting
manufacturing plant and powder-coating plant; so they have to move away from the
city area and then they tighten the control about the regulation and environmental
ethical issues. So most of the factory in this section closes. It impacts the whole supply
chain. So, the minimum order quantity of the printing, the ordering of the ink or the
powder we use; that will have a serious impact on the whole manufacturing supply
chain”. ALMs supplier also stated that “due to what’s going on between China and
the United States some of the components such as semiconductors are taking longer
to retrieve”.
4.4.2.2 Supplier
This category relates to the barriers faced with suppliers of components or finished goods to
ALM. 7 participants stated that there is a form of barrier in forecasting product demand due
to ALM suppliers. These barriers are the following:
Minimum order quantity (MoQ): The minimum order quantity is the lowest amount
of stock that ALM is willing to sell to a customer. 5 participants stated that the MoQ

126
of suppliers creates a barrier in meeting ALMs forecast. A sales and category group
member stated that “we might have an MOQ of 5,000 pieces but if our annual sales
are 3000, what do we do? do we do it or don't we do it, probably not”. If ALM decides
to purchase the excess stock, it has been stated by a sales and category group member
that ALM “need to find another channel to sell”. An interviewee also from the sales
and category group stated that ALM’s own MoQ can impact the forecast, “customer
can say that your MOQ is too high and then, you go back to the supplier, you give
them the order, they increase the price and that changes your numbers”.
Lead times: Only ALMs supplier stated that the lead time has an impact on the
forecast, “we cannot go to our sourcing supplier and negotiate components for a
certain price and secure timing as the category team have no obligation to commit to
the forecast”.
No Golden Sample: This is the final approved product sample created by the factory
manufacturing the product. One participant from the finance/IT group stated that at
times there are “issues with QA, somehow the golden sample does not arrive here to
be tested and all of a sudden the product arrives which has happened to us…” This
relates to receiving the products ordered before receiving the golden sample for testing
and quality assurance.
4.4.2.3 Competitor
This category relates to the barriers faced in forecasting due to ALMs competitor activities.

127
Competitor activities: 5 participants stated barriers in forecasting demand due to
competitor activities, most participants stated that there has been an increase in
competitors coming into the market. A participant from the sales and category group
stated that “the market is a very highly competitive market”. Further to this, a
participant from the sales and category team stated the reason for the increase in
competition is because “there's no risk - the barrier to market is very, very low. So, I
can set up a business and go to China today and be a distributor for a company and
the product is half the price and my overheads are very low”. A participant from the
sales and category group also highlighted that at times ALM’s competitors are also
their customer: “some of our customers are our competitors, that makes it even more
interesting because you get, let's say our wholesaler selling to you, they're buying
from us, grab our product, find out where we're buying it from in China and go to
them direct and brand it as their own brand. They know it's proven, we've done all
the testing on it, why buy from us”.
4.4.2.4 Customer
This category relates to ALM’s customers who purchase products directly or indirectly
through wholesalers.
Sell-in and Sell-through: This category refers to wholesalers or retailers buying
goods from ALM as sell-in and customers that buy the products from the wholesalers
or retailers as sell-through. Two participants stated that ALM needs to better
understand this, one participant from the finance/IT group stated that: “we might be
number one in selling in and number five in selling out which means that we’re leaving
128
a lot of stock in a channel which means that we can't then sell new products because
they're not going to take new products until they've sold the old products. We need to
understand all those different permeations”. A participant from the sales and category
group stated that: “one of the problems affecting our forecasting demand, was the sell-
through. We were getting sales into a branch but then we weren't getting repeat
orders, repeat business which obviously impacts on our demand. The reason why was
because they weren't selling it back out into the market”.
Return of products: This category refers to customers returning products back to
ALM resulting in an impact on forecasting demand. Only one participant from the
finance/IT group mentioned this barrier and stated that “we'll take it back but tell them
there's a restocking fee, they've always got a story. They hang up and they ring the
rep, the rep goes to the manager, the manager goes I'll waive the restocking fee so
then we bring it back”. It has also been mentioned that in some instance “they're happy
to bring the stock back and if you do a value to order, so if they say we want to bring
these ones back because they're not moving, and there's $2,000 worth, we have to put
another order through for $2,000 then we waive the restocking fee because they're
just swapping the stock over”. This relates to old stock that is returned and no fee is
applied, the old stock is then put back into the warehouse and has an impact on
inventory as most likely a different product has superseded it.

129
Findings from the requirements prioritisation
We now present the findings from the cards prioritisation technique used on our requirements.
At the end of the card sorting session, the participants were asked to provide their reasons for
the prioritization of the requirements. A one-on-one time slot session with each participant
was arranged according to the participants’ availability. During the session, participants were
also asked to provide their opinion on the card sorting technique performed. Overall the
participants viewed card sorting as a good technique to use for prioritization. The following
are comments that reflect the participants’ positive view:
“I found it quite simple, it is an easy way of doing it”
“… It is interesting to see how the cards are categorised in the end, in particular how our
selections compare with each other”
“… good, easy and a fast way of getting it done”
For the reasons on the prioritization, one participant provided their reasons for placing the
cards for each category (H, M, L). The other two participants provided reasons for the
prioritization of each card. The reasons expressed by these two participants were recorded,
and a transcript was generated using an online software translation tool7. The reasons provided
by the participants were used to gain further insights into the prioritization of requirements.
Lehtola et al.'s (2004) study indicate three main points of view are more or less explicitly
taken into account when setting priorities. We use these points of view to create dimensions
that can enable us to develop a multi-dimensional matrix for all requirements. The particularly
7 https://www.rev.com

130
useful dimensions constructed for the reasons of prioritizing requirements are customer,
business and implementation. The customer dimension involves the customer relationships
and the importance of these to the organisations' profit. The business dimension involves
business issues that may influence a requirement, such as competitor behaviour or government
regulation. The implementation dimension deals with the importance of the requirements'
logical implementation order, associated cost, and resources. The multi-dimensional matrix
may be populated with all the requirements after categorisation has been carried out. For
example, when stakeholders need to prioritize the requirement, they can refer to the matrix to
determine the implementation effort, customer significance and the business justification for
each requirement for their prioritization. These dimensions will be discussed further below.
Figure 23 encapsulates the primary reasons participants chose against each dimension for the
high priority category. In the customer dimension, any requirement viewed to be important to
ALM external customer is said to be a reason to prioritize as high. The business dimension
considered the impact the requirement had on the organisations' suppliers and the importance
of having data integrity and visibility. The implementation dimension considered
requirements that were achievable and had a positive effect on the requirements dependencies.

131
Figure 23 Dimensions to consider for high prioritization (Lehtola et al.'s, 2004)
Table 9 depicts the participants’ reason against each dimension for medium and low
prioritization category. It’s noteworthy that our interview study's low requirements were seen
to be more of a cultural and training problem in the business dimension. For example, “As a
sales representative, I want details of new products available so that I am knowledgeable.”
This requirement is viewed as a training issue and deemed a low priority for a digitization
solution.
Table 9 Dimensions for medium and low prioritization
Medium
Priority
Customer Business Implementation
Needs will never
be perfect
Doesn't have to be perfect. It just
has to be accurately correct
Achievable behind the scenes
once the high priority
requirements are accomplished

132
Flexibility is
essential and
required
Can’t match competitors, need to
have a balance
Limited value for the effort
required
Not critical for day to day
activities
Not relevant to stakeholders’ job
Low
Priority
Not critical for
customer
Communication issue NA
Training required
Not part of stakeholder’s job
Teamwork required
User stories may be deemed to be important for the user story stakeholder, however they are
not viewed by the card sorting participants as important to ALM external customers, for
example, “As a product engineer, I want a commitment on the product specifications so that
we can plan more accurately”. Two participants view this requirement to have a negative
impact on ALM customers therefore it has been categorised as a low requirement.
The ALM participants who were engaged in the card prioritisation session displayed a wide
variety of expertise about the difficulty related to the barriers in forecasting uncertain product
demand. Throughout the card prioritisation session, we have note that each participant viewed
the reasons for prioritizing the requirements differently. For instance, 5 cards had different
prioritization from each participant. Each participant raised different reasons, such as the
Chief Financial Officers’ reason for prioritization, that the requirement can be accomplished
by achieving the higher categorised requirements first. Other participants such as Chief
Transformation Officer was mostly concerned about the requirement and the reason for his
priority was that it was a main pain point for the business. Understandably, the ALM

133
practitioners used their expertise and knowledge according to their role and experience to
prioritize the requirements. Understanding the various opinions and the relationship between
business units and area of concern is particularly valuable for prioritizing requirements.
The prioritization of requirements arising from our Card Sorting exercises contributes
considerably to refining our solutions. Given that the study was carried out in the ALM setting,
the requirements prioritization and reasons for them will be particularly applicable to this
organization's work. Appendix H provides the quantitative results from the card prioritisation
technique used. The technique we described here could easily be replicated by any
organisation that requires the understanding of prioritization of requirements.
Although prioritizing the requirements described in this study emerged from practitioners of
one organisation, many reasons for prioritization are generic and indicative within other
organisations. Finally, this card sort exercise's outcomes are an important source of
information for the design and development of our digital toolkit (chapter 5).
Discussion
The findings' analysis provides insights into the barriers faced in forecasting uncertain product
demand from the industry’s perspective. The interview study allowed us to extract user stories
which then become our high-level requirements. The Card Sorting exercise at ALM has
emerged as a highly useful technique for examining the practitioner’s view on requirements
prioritization. To our knowledge, the Card Sorting technique has never been used in ALM
previously, it has received positive feedback from all the stakeholders who were engaged in
the card sorting exercise. The participants revealed the card sorting technique to be simple to
use and felt that it supported them to collaborate when considering and deciding on
requirements prioritization.

134
Figure 24 provides the result of our comparison of the literature review findings and the
interviews, highlighting the current research and industrial practice gap. The systematic
literature review covers different industries where the interview study is from the Australian
electrical industry.

135
Figure 24 Ven diagram of forecasting barriers from SLR and ALM field study

136
ALM field study includes most of the barriers identified from the research literature. Out of
31 barriers provided by the research community we have mapped 22 of those in our interview
study and created an additional 14 barriers which were not present in our SLR. Many of the
barriers from the interview study originate as organisational barriers. These barriers have been
used to create a fishbone analysis diagram (Figure 25). The fishbone diagram and analysis
typically evaluate the causes and sub-causes of one particular problem and, therefore, help
uncover all the symptoms of any business problem (Bose, 2012).

137
Figure 25 Fishbone diagram of the internal organisational barriers

138
The fishbone analysis depicted reveals that the major issue here is an inaccurate forecast.
Forecasting provides the input for planning production; process design, capacity planning,
aggregate planning, scheduling and inventory management (Kumru and Kumru, 2014).
Inaccurate forecast leads to stockouts (Fildes et al.'s, 2009), excess inventory (Worthen, 2003),
and not achieving target service levels (Baecke et al.'s, 2017, Fildes et al.'s, 2009). The
fishbone analysis helps to go inside the root cause, ALM fishbone analysis reveals the main
problems for inaccurate forecasts and the driving barriers and reasons.
When carrying out exploratory research such as this research, Strauss and Corbin (1998)
explain the value of returning to the literature after data collection is completed to confirm the
findings. As such, the literature is used to provide an additional source of data providing
triangulation.
Cultural Problems: Organisational culture is known to be a resisting force to effective supply
chain management (Fawcett et al.'s, 2008). In ALM It’s noteworthy that except for high staff
turnover all of the cultural barriers are also sub-causes in the other 5 categories depicted in
Figure 25, strikingly most appear under inadequate information technology. This establishes
that culture and information technology barriers are closely connected. This is also consistent
with Cabrera et al.'s (2001) findings that successful technology assimilation requires either
the technology to fit the organizational culture or the culture to be shaped to fit the behavioural
requirements of the technology. As identified in the findings, the cultural barrier was
mentioned by the highest number of participants in our study, however, there is a lack of
research that focuses on cultural barriers of forecasting product demand. According to a
survey conducted by Beardsley et al.'s (2006), to shape culture in an organisation, executives
indicated that they need to focus on the more complex aspects of culture, such as how people

139
make decisions, how they interpret instructions and deadlines, and how they resolve conflict.
Martin and Grbac (2003) study found that an organisations orientation also shapes culture. An
organisation focused on having a market orientation is found to have a culture driven towards
generating market information, cross-functionally sharing that market information, and
rapidly responding to that market information to positively impact the organization's
performance.
Rapid product change: The growing speed of change in technology, increased competition
and global operations sets new requirements for managing products. Manufacturers
production capacity is often capable of producing a broad range of low-cost, high-quality
products with short lead times in varying lot sizes according to customer specifications
(Mason et al.'s, 2002). ALM is capable of producing customer-specific products, however,
due to the rapid advancement in technology, its product lifecycle has changed in the last 10
years, participants state that this has brought additional barriers in forecasting product
demand, from having a large range of products to difficulties in managing pricing of products
and long product launch processes. Kaipia et al.'s (2006) empirical study also find that the
large growth in the number of active product families and product introductions in an
electronics company increases the complexity in planning for demand and supply. The large
growth of product also creates more data for the organisation; Varma and Khan (2015) found
that due to the increased complexity of data, uncertainty risk in supply chains is growing.
Kaipia et al.'s (2006) study concluded that due to the large product offering, the managing of
products in different life cycles becomes more important and the management of the product
portfolio must become a routine day-to-day business for companies

140
Inadequate Information Technology: Information Technology provides a mechanism for
organisations to effectively gather, store, access, share, and analyze data (Swafford et al.'s,
2008). Having more information about the end consumer of products and services provides a
critical means of reducing future demand uncertainty (Ali et al.'s, 2017). In ALM, its
enterprise information systems are deemed inadequate due to poor data governance and a lack
of commitment. We argue that the increase in products and complexity of data such as
different rebate structures, pricing points and changing product group mix creates additional
complexity in analysing the data. The use of multiple excel files to perform tasks results in a
high risk of errors and repetition in tasks. The creation of multiple forecast versions and excel
files creates complexity. Simultaneously, ALM experiences a lack of data and the inability to
share data with stakeholders in the supply chain. Fawcett et al.'s (2007), found that there are
two distinct dimensions for information sharing, connectivity and willingness which both
impact operational performance and are critical to developing a real information sharing
capability. The willingness to share information proves to be the backbone for various formal
coordination initiatives such as Collaborative Planning, Forecasting and Replenishment
(CPFR), Efficient Consumer Response (ECR) and Forecast Information Sharing (FIS) (Ali et
al.'s, 2017). Sharing information has forced organisations into significant supplier reduction
programs and a partnering mentality with fewer strategically chosen suppliers (Flint, 2004).
Information sharing processes are seen as supply chain improvement strategies (Cavusoglu et
al.'s, 2012).In the supply chain literature, the dominant view suggests that the process should
be formalized and strictly scheduled (Oliva and Watson, 2011). However, barriers arise in
organisations because the managers dealing with the supply chain do not realize the real
benefits of information sharing and do not have confidence in information-sharing systems
(Marsh and Flanagan, 2000). Hence, designing enterprise information systems not only has

141
technological or informational dimensions, but also involves the coordination and facilitation
of cross-organisational interactions of multiple departments, which is necessary to make
information sharing system function. Thus, it is only through integration of information and
resources can a supply chain adapt as demand changes.
Communication Failure: There is evidence from ALM participants that the channels of
communication are inefficient. Certain teams do not liaise effectively with each other,
resulting in poor information flow. The lack of trust in using new systems such as CRM has
also resulted in poor communication this may be attributed to people being change-averse and
unwilling to share information for fear of exposing their weakness to others (Fawcett et al.'s,
2008). It is important in a manufacturing environment where product variety is high to react
to changing conditions fast and as important as timely information is that the information is
correct. Sigala (2007) study found that enabling easier real-time information sharing among
supply chain partners fosters and supports new collaboration forms. However, we argue that
a lack of data governance information may not be reliable and might result in even poorer
communication and performance.
Market competitiveness: Marketing covers a wide domain (e.g., branding, competitive
behaviour, segmentation, advertising and positioning), however, from a supply chain
perspective, organisations need to consider and understand what their downstream clients and
their customers’ customers need and want. Despite the speed of market change brought by
numerous factors, not least of which is technological and economic, the lack of marketing
intelligence creates barriers for ALM to accurately forecast product demand. It’s been stated
by participants that ALM is a sales-oriented organisation and not marketing, Flint (2004)

142
research shows that organisations that have a market orientation are focused on gathering,
disseminating, and responding to market data better than those that are not which enhances
the effectiveness of their marketing strategies. ALM’s lack of data in market intelligence may
explain why the organisation is sales-oriented, where the primary focus is on making a sale
with products available. However, this may be limiting ALM’S capacity, where (Martin and
Grbac, 2003) research shows that by having a market orientation organisation, rapid reactions
to shifts in the demand of consumers and to competition activities, which in turn leads to
superior business performance, are not achievable in other respects.
Management Influence: Our findings concur with Fildes and Goodwin (2007), where
management influences their own forecasts or adjust forecasts without consulting the
forecasters - possibly for political reasons. Nevertheless, we also argue that these adjustments
frequently disguise the underlying cause of forecast performance. For example, a narrow focus
on forecast accuracy ignores the significant effects of timeliness on sales forecasting
performance. (Davis and Mentzer, 2007).
Chapter Summary
In this study, we determined the major barriers in forecasting uncertain product demand in an
Australian electrical manufacturer supply chain. We examine the barriers faced in forecasting.
While these barriers may appear trivial when stated in an article, they often become the major
roadblock to successful forecasting applications. Ultimately after the analysis our two-step
exploratory research has concluded the following points:

143
From the 32 barriers covered in the research literature, 22 have been identified in our
study. Furthermore, an additional 14 barriers have been identified in this field study. All
these are considered forecasting uncertain product demand barriers present in ALM.
The number of interview participants that reflected a barrier in forecasting product
demand was highest among the cultural barriers followed by product, technological and
communication.
The fishbone analysis of qualitative empirical data suggests that the barriers are closely
intertwined.
Finally, this research forms part of our ongoing project for developing a digital toolkit solution
that addresses the organisations highest prioritised barriers in forecasting uncertain product
demand.
This will help the supply chain research community recognize, appreciate and provide
solutions to the ‘real’ industry problems, rather than working on research artifacts such as
forecasting techniques without real industrial consideration, evaluation and feedback.

144
5 Solution Design
Chapter Overview
In the previous chapter, we analysed and presented the field study on the barriers of
forecasting uncertain product demand from the Australian Luminaire Manufacturer (ALM).
We extracted high-level requirements from the field study and described the method
performed for prioritisation of the requirements. Insights into the organization's barriers were
presented, including a fishbone diagram that depicts the major issues in inaccurate forecasts.
In this chapter, we will present our solution and give details of the toolkit developed based on
the design science methodology (chapter 3). We will describe the toolkit's development and
its features (chapter 5.3) we will also present the tool in the organisation setting (chapter 5.7).
This will be followed for a discussion (chapter 5.8) and summary (chapter 5.9) of the entire
chapter.
Therefore, this chapter aims to present the design and implementation of a toolkit that supports
the organisation in forecasting uncertain product demand. (Research Goal 3). The tool's
overriding intention is to improve transparency in the forecasting process (Research Question
7) -and making forecasting product demand more effective and efficient to practitioners and
helping the organisation achieve its goals. We also aim to offer researchers an example of how
the toolkit developed can be applied in the industry where barriers in forecasting product
demand are experienced.

145
Background
Sales Forecasting accuracy is a challenging yet worthy task that many organisations aim to
improve. Organisations tend to use historical sales data to predict the future; however, this
data may not be a good indicator. Due to the historical data's uncertainty, organisations can
use different attractive tools to help them improve overall forecasting performance. Most of
these tools are quantitative in nature, where the organisations' historical sales data is used to
identify patterns in the demand and forecast future demand. However, because historical data
is unlikely to be a good indicator of what will happen in the future, judgemental adjustments
are required to the forecasts. The goal of adjusting the forecast is to optimise accuracy by
allowing forecasters to contribute to the organisations' sales forecast.
Judgemental adjustments enable collaborative forecasting, collecting and reconciling the
information from diverse sources inside and outside the organisation (Singh, 2002). For
judgemental adjustments to be helpful in the forecasting, they need to be input at the stock
keeping unit SKU required level and frequent. The forecast level is crucial as it can provide
different views such as aggregate levels by region, customer chain and product groups. It is
well known that data aggregation leads to better statistical results (Singh, 2002).
As a result, the aim of the developed forecasting toolkit described in this chapter was to design,
develop and implement tools that offer solutions to the barriers identified in the field study
conducted at the organisation. Our toolkit is intended to be used by stakeholders involved in
forecasting product demand in the organisation. The forecasting toolkit results will also drive
an improvement in transparency, efficiency, and effectiveness in the product sales forecasting
process in the organisation.

146
Development of the tool
The industry tool's development was subject to several important constraints, which had to be
considered since they influenced design and development. Firstly, the system had to be
developed for the industry organisation (section 4.5), thereby running on the organisations’
infrastructure platforms and standard operating environment (section 5.3.2). Secondly, the
system had to be developed in the organisation with the researcher and available resources
within an appropriate timeframe to the stakeholder’s concerned and the industry doctorate
program's overall schedule. Finally, because the system was developed using design science
methodology, the development had to support an interactive and incremental approach with
stakeholders within the organisation (Hevner et al.'s, 2004).
The previous chapters described the research problem in the state-of-the-work and the state-
of-the-practice. This discovery phase provided the preliminary requirements elicitation tasks
essential to extract the tool's initial requirements and features.
5.3.1 High-Level Requirements
The detailed list of all the high-level requirements (user stories) synthesised from the
interview study (See Appendix B). Based on the card sorting exercise (Chapter 3.3.2) the user
stories with the highest priorities and most consensus were used to form the requirements for
the tool. At a high level, and following the research goals, the tool should 1) improve the
efficiency of forecasting product demand with a minimum amount of wasted effort and
expense. 2) Directly address selected barriers often encountered during forecasting product
demand in practice, and 3) deliver a suitable and effective tool for forecasting product demand
by providing the ability for practitioners and the organisation to achieve its goals

147
The two main functional areas required within the tool were established through the elicitation
process as 1) visualization of information 2) Product Forecasting model. Although the tool
use was in workshops for evaluation, it was determined that the tool should be used in this
setting and within the day-to-day business environment.
5.3.2 Architecture and Technologies
The architecture and technology used to develop the forecasting tool needed to conform to the
organisations’ available systems and resources. Subsequently, through evaluation of available
technologies, it was decided that the visualisation part of the tool would be an online
dashboard application. Utilising the organisations existing architecture and technology
platform (Microsoft PowerBI business analytics service, Infor enterprise resource system,
WhereScape RED data warehouse) with R programing language incorporated where
necessary. The architecture and technologies used for the forecasting model were based on a
business performance management software suite that the organisation used (IBM Planning
Analytics formerly known as Cognos TM1) with Python and Excel incorporated to facilitate
the requirements. The advantages of the specific technologies chosen include the fact that they
are existing platforms embedded in the organisation and that the current stakeholders are
involved in using these technologies hence there is a minimal learning curve for the
stakeholders. Furthermore, the amount of time required to produce a working solution for the
functionality required to address the organization's barriers is considered less time consuming
when compared to introducing other new technology options into the business such as
Microsoft Analysis Services with XMLA scripts. Given the underlying environment, the tool
was intentionally developed in a modular design to allow it to be scalable and flexible to
changing business needs and potential integration of other new technologies and tools that
may be introduced into the organisation over time.

148
5.3.3 Data Repository
The foundation of the tool is a central data warehouse (DW) that consists of multiple
repositories such as the enterprise resource planning system (ERP), customer relationship
management (CRM), customs export data and financial sales targets. The DW enables the
retrieval of large amounts of data from disparate systems for different periods. The DW
enables integrating data from disparate system across the business for analysis and
visualisation using the toolkit developed.
5.3.4 User Interface
The main user interface (UI) consists of a dashboard that provides users the capability to
navigate through the different components of the toolkit while interacting with the available
tools. Figure 26 displays the main dashboard window after a successful login. There are three
major functions, being 1) Market Segmentation 2) Market Intelligence 3) Collaborative
Forecasting Model.
Figure 26 Main user interface

149
Market Segmentation Tool
Market Segmentation is a tool for discovering a group of categories/classes of customers
which can naturally be grouped according to the information available (Ren et al.'s, 2010,
Hong, 2012). The improved identification and classification of various market segments, help
match the customer wants and needs and the organisations' ability to satisfy them (McDonald
et al.'s, 2003). The overall aim of the market segmentation tool is to identify high-profit
segments, which is the segments that are likely to be the most profitable or have the potential
to become profitable. Segmentation also enables the organisation to focus on the selected
segment and tailor specific strategies or refine existing marketing strategies to match each
segment. Furthermore, in addition to identifying and defining market segments, the market
segmentation tool addresses some of the barriers often experienced in forecasting uncertain
product demand. Specifically, this tool addresses the following user story “as a regional
manager, I want consistency and integrity in the data so that I can manage outcomes better”.
There are various clustering techniques used to derive market segmentation in practice (Chang
et al.'s, 2007, Wang, 2010, Yiakopoulos et al.'s, 2011), each technique has its drawbacks and
benefits. In consultation with stakeholders within the organisation, the tool's segmentation is
based on revenue dollars and standard variable margin percentage. Other factors that could be
taken into consideration in further development of the segmentation include demographic
(customer statistics), geographic (location), volume (amount purchased) and benefits (product
features). The results of the four-quadrant analysis depicted in Figure 27 identify the area
where the company should focus.

150
Figure 27 Four-quadrant segments
Each quadrant contains a segment where the data is plotted based on the revenue and standard
variable margin. This allows the organisation to adapt individual strategies i.e. pricing, cost
control, sales stimulation and marketing for each segment. Further to this, to obtain an overall
view of the end-to-end supply chain, the market segmentation tool was developed with the
following three options:
Upstream - involves anything received by the organisation such as raw materials or finished
goods from its external suppliers.
Internal - the product groupings (Light Source) that the organisation offers

151
Downstream - the organisations' external distributors also known as the customers of the
organisation.
The market segmentation model enabled users to view a screen for each of the above options.
Figure 28 below demonstrates the visualisation tool for customer segmentation.
Figure 28 Downstream customer market segmentation screen
The remainder of the screens can be viewed in Appendix C.
5.4.1 Market segmentation options
The available options for the visualisation of the market segmentation are accessible from the
right-hand side of the visualisation. These options allow users to select the different segments
of the supply chain and features. The following are the features available:
Market Segmentation: enables the user to switch between the three different sections
of the supply chain. (Upstream, Internal, Downstream). Refer to Appendix C for the
views of the different sections of the supply chain

152
District: This allows users to view the selected supply chain section by a specific
district or national level.
Bonus Group: provides the user options to view the visualisation by a specific
product group.
X-axis: The x-axis is the horizontal line in the visualization that runs left to right. It is
a dynamic reference that provides the average SVM% based on the options the user
selects.
Y-axis: This is the vertical line on the visualisation that provides the average revenue
based on the user's selections.
Segment key: The key identifies the quadrant based on the colour scheme of the
plotted data. The following are the four quadrants in the visualisation tool:
o HR-HM: High Revenue - High Margin
o HR-LM: High Revenue - Low Margin
o LR-HM: Low Revenue - High Margin
o LR-LM: Low Revenue - Low Margin
Market Intelligence Tool
Market intelligence (MI) helps the organisation keep track of their competitors and the
industry's general state. Market intelligence is defined as a process designed to constantly
produce knowledge for organisations from dispersed data and information for strategic market
positioning (Jamil, 2013). The MI tool is part of addressing the following user story “As a
category manager, I want to know the price of competitor products so that I can make informed

153
decisions” in forecasting uncertain product demand. In particular, it addresses the user story
“As a category manager, I want access to more market intelligence data so that we can make
decisions with a complete set of data”. Following the field study and feedback received from
the business, a tool was required to monitor and analyse competitor products imported into
the Australian market. The MI tool allows users to navigate and analyse competitor products
including quantity being imported and the cost. This provides the business with the capability
of determining the sale price once additional costs and margin are added. Further to this the
market intelligence tool provides insights into the luminaire market and helps identify any
trend. This information helps managers in forecasting any potential changes occurring in the
market.
The technologies used for the MI tool are SQL server, Wherescape Red, Python and Microsoft
Power BI. The MI tool's overall architecture comprises three sections as depicted in Figure
29, data source, data aggregation/translation, and visualisation.
Figure 29 Market intelligence architecture
Customs Export Data
Provider
Data WarehouseWeb portal
Source Staging Production
ERP
Data Sources Data Storage / Aggregation and Translation
Visualizations
Google Translate
APIHS Data Extract
Translated Data

154
Data Sources: The data sources section contains the required system that would provide the
data for the tool. There are two sources of data; the ERP system and the Customer Export data
portal.
Data Aggregation and Translation: This section enables the raw data preparation process
for cleansing, aggregation, and storage within the data warehouse. The data is transferred into
the source tables, where the original data is stored before any transformation occurs. The
staging area is then used to prepare the data by cleaning, transforming and reconciling the
data. The customs export data was obtained in the mandarin language, Figure 30 depicts a
sample of the data. This data was translated into English by passing the data through google
translate via a python script. The validity of Google translation was checked by two external
colleagues who were bilingual in English and mandarin. They randomly selected several
records and checked the accuracy of the translation. It was found that the translation accuracy
for the field required was adequate for the tool. Both the mandarin and English data are stored
in the data warehouse to eliminate the need to reprocess the same translations in the future.
Figure 30 Sample customs export data
The data warehouse's staging area is also used for testing purposes before promoting to the
production area.

155
Visualisation: The visualisation of the market intelligence tool is the presentation layer to the
stakeholders. Figure 31 depicts a screen the users display when selecting LED Flood Lighting
from the main user interface (chapter 5.3.4).
Figure 31 Market intelligence screen
The market intelligence screen presents the user with competitor import information such as
the date, brand, product description, unit price, quantity and currency.
The following describes the information presented:
Date: This presents the user with the date of product importation into Australia from China.
Brand: This enables the user to identify the brand of the product being imported. This is also
typically the company the product belongs to.
Product Description: enables the user to identify the product being imported into the market.
Unit Price: the total value the product is known to be purchased for.
Quantity: the total quantity of products being imported into the country.

156
Currency: the currency the products have been purchased for from the supplier.
5.5.1 Market intelligence options
There were no options available for the market intelligence tool other than selecting a product
grouping from the main menu screen. However, having received feedback from the tool's
evaluation during the evaluation phase (Chapter 6) a change was made to the tool after the
stakeholders' evaluation. Feedback was received on users wanting to have the ability to view
the specifications of products so that the products can be compared like for like. This resulted
in enabling users to select the product photo and the specifications displayed on the screen
(See appendix C).
Collaborative Forecasting Model
The collaborative forecasting model (CFM) provides a tool that allows users to input and
reconcile forecast information, enabling the process of collecting and reconciling product
forecasts in the organisation. The tool's primary role is to provide the organisation with a
single unified forecast where forecasting can be carried out at multiple levels. The CFM
contains four levels of the forecast, three of which are user derived and one that is derived by
the system. The three-level forecasts are as follows:
Business Chain Forecast: This forecast consists of analysing sales by customers and
inputting the forecast at the business chain level. In collaboration with the leadership team,
the regional manager is responsible for completing the forecast at this level.
Light Source Forecast: This forecast represents a grouping of similar products combined to
form a light source, i.e. (LED, Traditional). The total forecast aggregates up to equal to the
total business chain forecast

157
Product Forecast: This is the detailed level forecast and specific to the stock-keeping unit
(SKU). This forecast aggregates up to the light source forecast, which then aggregates to the
total business chain level.
Bill of Material Forecast (BOM): The BOM is a system derived forecast based on the users'
product forecast. This forecast determines the components required to manufacture the
products the users have forecast.
The major benefit of the CFM is the ability to reconcile differing user views of the product
demand. The CFM (See Figure 32) has been constructed based on four tiers, the data sources,
data warehouse, forecasting and visualisations.
Figure 32 CFM system tiers
Each tier aims to allow the solution to be constructed with different components that are
interoperable and flexible for implementation and allow for any additional modifications that
the organisation may require. The following describes and purpose of each tier:
DW
ERP
Data Sources Data Warehouse Visualizations
Adj Forecast
Actual
User InputForecast Model
CRM
Forecasting
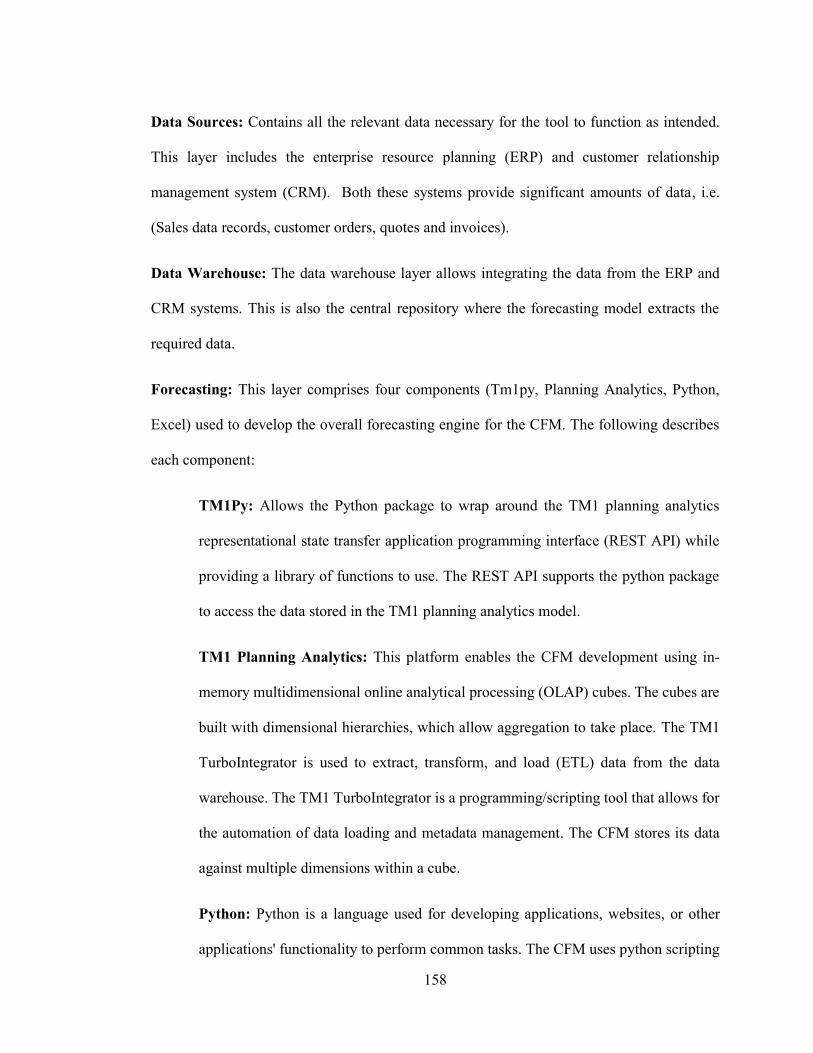
158
Data Sources: Contains all the relevant data necessary for the tool to function as intended.
This layer includes the enterprise resource planning (ERP) and customer relationship
management system (CRM). Both these systems provide significant amounts of data, i.e.
(Sales data records, customer orders, quotes and invoices).
Data Warehouse: The data warehouse layer allows integrating the data from the ERP and
CRM systems. This is also the central repository where the forecasting model extracts the
required data.
Forecasting: This layer comprises four components (Tm1py, Planning Analytics, Python,
Excel) used to develop the overall forecasting engine for the CFM. The following describes
each component:
TM1Py: Allows the Python package to wrap around the TM1 planning analytics
representational state transfer application programming interface (REST API) while
providing a library of functions to use. The REST API supports the python package
to access the data stored in the TM1 planning analytics model.
TM1 Planning Analytics: This platform enables the CFM development using in-
memory multidimensional online analytical processing (OLAP) cubes. The cubes are
built with dimensional hierarchies, which allow aggregation to take place. The TM1
TurboIntegrator is used to extract, transform, and load (ETL) data from the data
warehouse. The TM1 TurboIntegrator is a programming/scripting tool that allows for
the automation of data loading and metadata management. The CFM stores its data
against multiple dimensions within a cube.
Python: Python is a language used for developing applications, websites, or other
applications' functionality to perform common tasks. The CFM uses python scripting

159
to run a time series forecasting procedure, retrieving actual data from the TM1
planning analytics cube to return a forecast based on the procedure.
TM1 Excel Add-in: The TM1 excel add-in component provides worksheet functions
that allow users to interact with the CFM model. The interaction that users have with
the model is not limited to obtaining the actual values and inputting the forecast.
Visualisations: This layer provides users with the reporting and understanding of the forecast
data by utilising visual representations to the data. Multiple visualisations have been created
to form part of the CFM tool these are as follows:
Decision making framework: this framework guides the decision making process
that users of the CFM are making when adjusting the forecast. The framework is
accessible from the main user interface (chapter 5.3.4). The framework was developed
as part of the systematic literature review (chapter 2.4.3).
Judgemental Adjustment Review: enables stakeholders of the system to visualise
the adjustments made to the different levels of the forecast. The user can identify any
adjustments made, who adjusted it, when it was adjusted, the reason chosen for
adjusting, and any comments entered.
Forecast Accuracy: this enables the users to view the accuracy of the user derived
forecast. The forecast accuracy is based on prior actual periods that have occurred and
are measured against what was forecasted. The period is adjustable and may be
selected by the user.
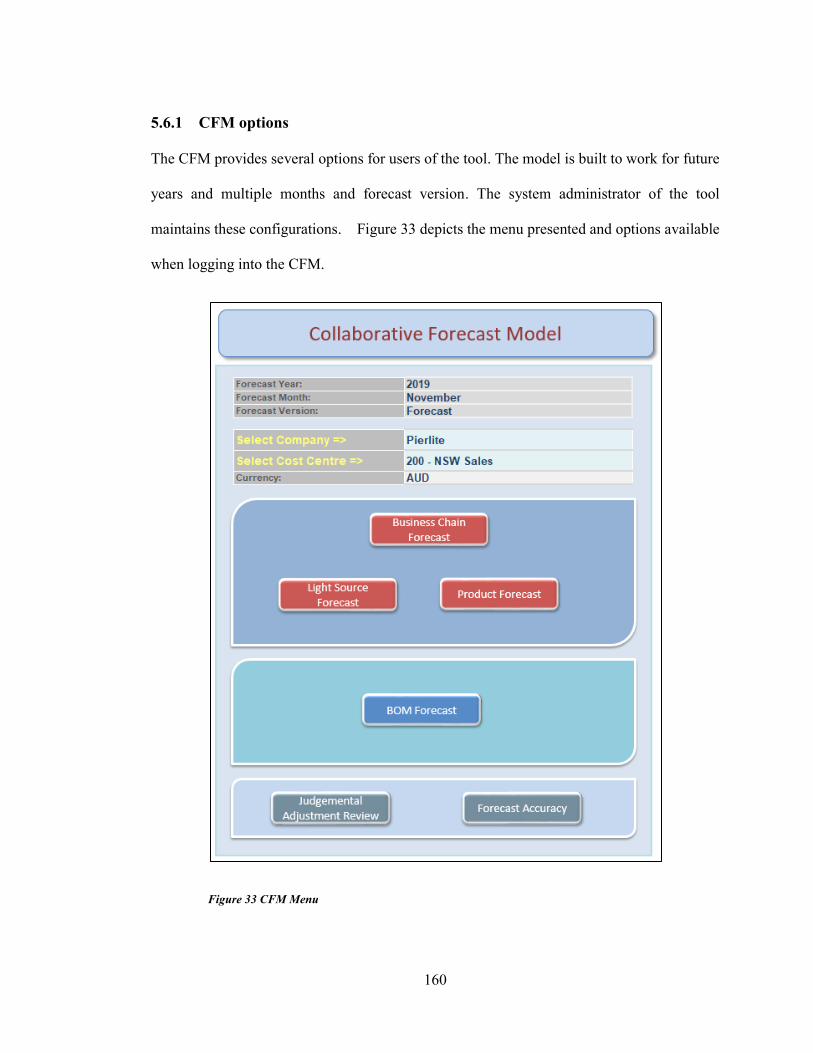
160
5.6.1 CFM options
The CFM provides several options for users of the tool. The model is built to work for future
years and multiple months and forecast version. The system administrator of the tool
maintains these configurations. Figure 33 depicts the menu presented and options available
when logging into the CFM.
Figure 33 CFM Menu

161
Below is an explanation of the options available:
Company: This option enables users of the tool to forecast for different companies of the
organisation. Each company can have an individual forecast at different levels.
Cost Centre: This enables users to select a specific cost centre to forecast, i.e 200 – Sydney,
300- Melbourne etc.
Currency: This option works with the company selection; if a foreign company is selected
such as NZ, the currency will automatically change to New Zealand dollars.
Red Forecast buttons: These enable users to select a specific forecast level to make
adjustments to the forecast. These options only work once the above selections have been
made. The three-level user derived forecast is discussed in chapter 5.6.
BOM Forecast button: This enables users to view the system generated forecast once the
user derived forecast is complete. The bill of materials forecast determines the components
required to manufacture forecast derived by the users.
Grey Forecast buttons: These options provide users with the capability of reviewing the
forecast adjustments made and the forecast accuracy.
Toolkit in Action
The following section provides an overall walkthrough of the forecasting tool usage's
functionality and features in the Australian Luminaire Manufacturer organisation. Although
not all the features and screens are demonstrated, this section provides an overview of the
general steps taken by users of the tool to forecast product demand. The below illustration has
been divided into three simple stages being 1) Insights – Exploring data by running the
marketing intelligence and market segmentation tools for quickly gaining a valuable

162
understanding of the competitive market and the performance of the market segments, 2)
Forecasting – Analysis of historical data, exploring and adjusting the forecast, and 3)
Presentation - production of the results of the forecast.
5.7.1 Insights
The first step of the new forecasting tool is for the participating users to log into the power BI
system. The users will receive a main user interface menu; as depicted in chapter 5.3.4, the
analyst can then navigate to the required functionality. The market intelligence and market
segmentation will both be available for users. It is important to note that the users' data security
has not been enabled for this research demonstration. The intention for the market
segmentation is that sales representatives and regional managers will only have access to the
states they are responsible for. The national manager and the executive leadership team will
have access to all states. Appendix B presents the additional screens available to users.
The market intelligence is intended to be provided to all users of the systems with no security
exceptions. For this demonstration, Figure 31 depicts the LED Flood light market
intelligence. Market intelligence intends to present the largest competitors in the industry. The
data for most of the organisations' competitors can be viewed, however, it was decided that
the competitors with the highest import value are to be shown. There are further options that
users can view; these include market intelligence for LED Highbay, LED Strip lighting and
LED Panel. However, they are not illustrated in this demonstration (see Appendix C). The
user can remain logged in to the system while moving on to the next step, the collaborative
forecasting model.

163
5.7.2 Forecasting
The next step in the forecasting tool is where users log in to the planning analytics model via
the excel TM1 add-in ribbon and are presented with a menu of the forecast's different levels
(chapter 5.6.1).
The users participating in the forecasting make their way through reviewing the historical
sales and forecast generated by the time series algorithm. Considering the market intelligence,
market segmentation and any other sources of information the user is able to make the
necessary adjustments to the forecast. Figure 34 depicts the product level forecasting screen
that has been started.
Figure 34 Product level forecast
We can see that there is the capability of adjusting the forecast and selecting a reason for the
adjustment via a dropdown list; these reasons were derived from the literature review and field
study. However, it is noteworthy to note that during the validation phase stakeholders
provided feedback after using the CFM and suggested that the user should have the capability

164
to add multiple reasons for an adjustment to the forecast. This feedback was considered and a
new screen was constructed to enable users to provide multiple reasons for an adjustment
made. Appendix D contains the screen for the reasons an adjustment is made to the forecast.
When the participants complete the forecast, the data is automatically stored in the CFM. This
task is repeated for the different levels of the forecast. The information that has been generated
is then used to produce a bill of material forecast automatically. The bill of materials cube
(Figure 35) is used to determine the components required to meet the forecast demand.
Figure 35 BOM cube showing the vandaled components required

165
At this point in the forecast process, the information is ready for the presentation phase as
described below.
5.7.3 Presentation
Once the system users have entered the forecast at the various levels, the information can be
reviewed collaboratively, or individually by management, or relevant stakeholders in the
organisation. At this stage, the forecast is locked and no further user input is possible. For the
walkthrough, the data used in the reporting presented is fictitious. The overall reporting
available for users is depicted in (chapter 5.6.1). It is noteworthy that as the users complete
the forecast and adjustments, the user details are captured to ensure management knows who
is making adjustments to the forecast. The reporting is available both in the CFM via excel
and through the Power BI menu, the reason for this is so that executive management can view
the output through the main user interface. Also, using the OLAP system to develop the CFM,
stakeholders can slice and dice the forecasting cube at various layers and intersections to view
the data as they please. Figure 36 depicts the cube view that shows the forecast versus the
actual for the Sydney cost centre.
Figure 36 Forecast cube view

166
System users can either select a single value or multiple values from the cube dimensions, to
create a new view with a particular subset of the data required.
Discussion
Several additional features were considered for the forecasting tools, including embedding
product quote information, customer opportunity information, and additional statistical
forecast options; however, these were not implemented as part of the CFM solution. The
reason for excluding these features is mainly due to the value they provide compared to the
overall goal of the industry research project. Additional features were considered valuable to
have; however, they were considered to be rather out of scope with the toolkit's overall focus
and objective. These features include use of workflows to manage the timing and completion
of the different levels of the forecast. Also considered were features such as automating the
accessibility of values based on the user's role and automating the reporting. However, these
were only partially developed as they require considerable effort and time to implement and
evaluate to an adequate level that would enhance the overall research project results.
The use of the organisations' available platforms and technologies in the toolkit development
has given us and the organisation several important advantages, including developing the
toolkit cost-effectively by eliminating the need to build specific applications from scratch. It
has provided an opportunity for scalability, where the business can modify their processes or
systems easily and effectively. It has also lowered the learning curve, as stakeholders of the
toolkit are experienced with the existing systems.
Furthermore, in addition to addressing the user stories and providing the tool to address the
issues often experienced in the organisation with forecasting uncertain product demand, the
tool allows users to communicate openly, access critical forecasting information that is

167
central, traceable and reportable. In effect, the tool allows the stakeholders to be actively
engaged in the forecast, thereby encouraging accountability, ownership, and stakeholders'
commitment. The tool overcomes a major limitation of many forecasting systems where non-
time series information is typically not formally handled by decision support systems devoted
to forecasting – a so-called forecasting support system (Webby et al.'s, 2005). The tool
developed not only provide market intelligence and market segmentation; it provides a
platform for forecasting that also allows users to incorporate judgemental adjustments and
encourages the use of contextual reasons for these adjustments. The solutions better inform
forecasters by providing systematic guidance that can be utilised to inform and/or train the
judgment. To achieve this, we have endeavoured to use the tool as flexible and configurable
as possible while still providing an appropriately structured and rigorous foundation for
forecasting uncertain product demand and constructivist learning.
Chapter Summary
The dominant paradigm in time series forecasting is that statistical methods are more accurate
than a judgemental approach. Several forecast support systems are available that promote
advanced statistical methods, increased forecast accuracy, and useable interface (Yurkiewicz,
2003, Tashman and Hoover, 2001). However, it appears that non-time series information is a
significant factor in determining the final forecast (Webby et al.'s, 2005). Studies have shown
that people prefer judgemental forecasting methods (Lawrence et al.'s, 2000, Winklhofer and
Diamantopoulos, 2003). It provides an essential and vital part in developing the forecasting
tool's solution and features through direct interactions with forecasting stakeholders and the
organisational context.

168
The most relevant and important aspect of the tool constructed is that the tool does not
necessarily require significant expertise or substantial experience, nor depends on the
selection and implementation of any other process. As a result, we believe that the tool can
be applied in various organisations and not only in the electrical industry. Also the tool is
particularly suited to novice analysts and those organisations lacking forecasting expertise.
However, the forecasting tool's acceptance and adoption is also heavily dependent on the ease
of learning and its appropriateness to the organisation. These and other aspects related to the
forecasting tool will be tested through evaluation in the following chapter.

169
6 Evaluation
Chapter Overview
In the previous chapter, we described the design and development of the toolkit comprising
of three tools, (1) Market Segmentation (chapter 5.4), (2) Market Intelligence (chapter 5.5),
and (3) the Collaborative Forecasting Model (chapter 5.6). This chapter will develop our
evaluation framework, describe our evaluation methods, and present the results of the
evaluations for the developed toolkit. The ethical considerations detailed in chapter 3.5 of this
thesis were also applied to the planning, preparation, and evaluation analysis. A range of
different methods and techniques can be applied in design science research to build, evaluate,
and improve artifacts, including benchmarking, surveys, interviews prototypes, and
simulations (Sonnenberg and Brocke, 2012, Helfert et al.'s, 2012, Hevner et al.'s, 2004).
Researchers have known that incorporating components of several methods enhances the
viability and fidelity of evaluations (Bledsoe and Graham, 2005). Our evaluation involves a
focus group (chapter 6.5.2), system testing (chapter 6.5.1), and a questionnaire (chapter
6.5.3). The incorporation of multiple evaluation methods can help better understand the needs
of stakeholders and the end-users (Bledsoe and Graham, 2005). This will be followed by the
discussion (chapter 6.7) and a summary of the entire chapter (chapter 6.8).
Evaluation Purpose
The purpose of the evaluations described in this chapter was to provide empirical evidence
as to the performance of the toolkit for forecasting uncertain product demand. Also to directly
address our Research Goal 4, in terms of how useable the toolkit is in improving transparency
(RQ7), how efficient the toolkit is (RQ8), how effective it is (RQ9) and how useable the

170
toolkit is (RQ10). Without evaluation, our design science research outcomes are an
unsubstantiated assertation that the implemented artefact will achieve its purpose.
Transparency refers to the information that flows amongst stakeholders to inform informed
decision-making and take the right action (Hosseini et al.'s, 2018). DiPiazza Jr and Eccles
(2002) refer to transparency as the obligation to willingly provide stakeholders with the
information needed to make decisions. Hence transparency depends on the availability of
information, the conditions of its accessibility and how the information, which has been made
transparent, may pragmatically support the user’s decision-making process (Turilli and
Floridi, 2009). Concerning the toolkit's transparency, the measurement we have chosen is the
overall level of detail available in the toolkit, that is, the information available for users to
make informed decisions (e.g. market intelligence by product segmentation, market
segmentation by customer grouping and detailed forecasting). This measurement was
selected because it relates directly to the availability of information during the digital toolkit
and the information available from the toolkit output.
Efficiency refers to the resources (such as time or effort) expended with the speed with which
users can achieve goals (Standardization, 2013). It can be measured by using indicators such
as the time users take to complete a task and the user's rate of input, for example, using a
mouse or keyboard (Frøkjær et al.'s, 2000). Concerning our toolkit's efficiency, the
measurement we have chosen is the response time of the toolkit, meaning the overall time it
takes to respond to a user’s request (e.g. inputting a forecast, retrieving judgemental
adjustments, and reporting). This measurement was selected because it relates directly to the
speed of the effort expended during the use of the toolkit and it is relatively easy to identify,
count, and compare.

171
Effectiveness refers to the accuracy and completeness with which users can achieve specified
goals (Standardization, 2013). It can be measured using indicators such as the results' quality
(Frøkjær et al.'s, 2000). As a result, and concerning our toolkit's effectiveness, the
measurement chosen is the quality of the results and if the results are useful to the user (e.g.
toolkit results help to achieve goals, helps in the decision-making process, and results are
practical for use). This measurement was selected because it relates directly to the amount of
effort expended and the completeness of information extracted from toolkits.
Useability The International Organisation for Standardization (ISO) defines useability as “the
extent to which a system, product or service can be used by specified users to achieve
specified goals with effectiveness, efficiency, and satisfaction in a specified context of use”
(Standardization, 2013). As a result, and concerning our toolkit's useability, the measurement
chosen is how user-friendliness the toolkit is to achieve a task. This measurement was selected
because it directly relates to users experiences with the toolkit developed.
We performed a focus group and questionnaire to cover the different aspects of effectiveness,
efficiency, useability, and satisfaction (i.e. the users’ comfort with, and positive attitudes
towards using the toolkit) (Frøkjær et al.'s, 2000). Using both the questionnaire (chapter 6.5.3)
and focus group (chapter 6.5.2) methods for the evaluation enables us to compare the focus
group discussion and questionnaire results. Our questionnaire was based primarily on system
usability scale (SUS) (Brooke, 1996) questions as this method allows for low-cost
assessments of useability in industrial systems evaluation and is widely regarded and
commonly used in research and practice (e.g. (Sauro and Kindlund, 2005, Igwe, 2004)). The
focus group was based on using stimulus materials, such as the use of the artefact prototype

172
and questionnaire, this encouraged dialogue among the participants (Oates and Alevizou,
2017)
Evaluation Framework
As described later in this section, we endeavoured to develop a structured and rigorous
evaluation strategy for the toolkit with respect to the research goals, the time available on the
industry research project, and resources accessible from the Australian Luminaire
Manufacturer (ALM). We use the design science research evaluation method selection
framework (Figure 16) described in (chapter 3.3.3 ) to present our evaluation strategy (Figure
37).
Figure 37 Design science research evaluation methods selected
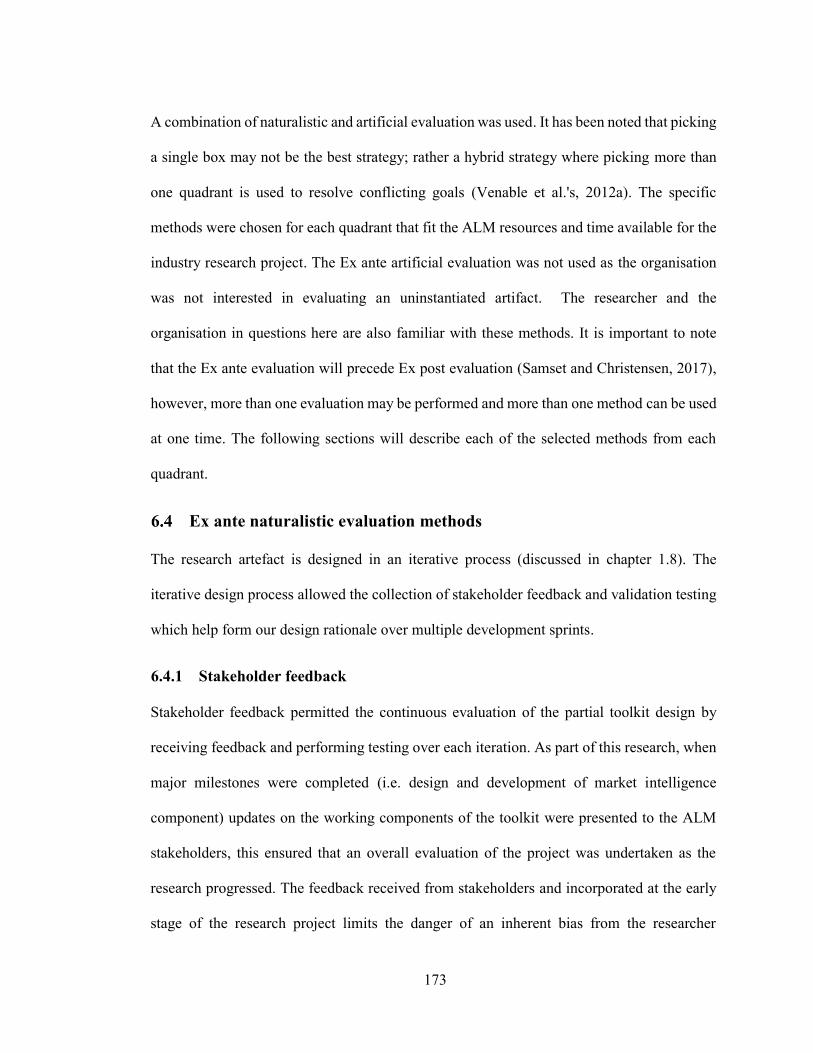
173
A combination of naturalistic and artificial evaluation was used. It has been noted that picking
a single box may not be the best strategy; rather a hybrid strategy where picking more than
one quadrant is used to resolve conflicting goals (Venable et al.'s, 2012a). The specific
methods were chosen for each quadrant that fit the ALM resources and time available for the
industry research project. The Ex ante artificial evaluation was not used as the organisation
was not interested in evaluating an uninstantiated artifact. The researcher and the
organisation in questions here are also familiar with these methods. It is important to note
that the Ex ante evaluation will precede Ex post evaluation (Samset and Christensen, 2017),
however, more than one evaluation may be performed and more than one method can be used
at one time. The following sections will describe each of the selected methods from each
quadrant.
Ex ante naturalistic evaluation methods
The research artefact is designed in an iterative process (discussed in chapter 1.8). The
iterative design process allowed the collection of stakeholder feedback and validation testing
which help form our design rationale over multiple development sprints.
6.4.1 Stakeholder feedback
Stakeholder feedback permitted the continuous evaluation of the partial toolkit design by
receiving feedback and performing testing over each iteration. As part of this research, when
major milestones were completed (i.e. design and development of market intelligence
component) updates on the working components of the toolkit were presented to the ALM
stakeholders, this ensured that an overall evaluation of the project was undertaken as the
research progressed. The feedback received from stakeholders and incorporated at the early
stage of the research project limits the danger of an inherent bias from the researcher

174
(Anderson, 2010). The numerous times' stakeholders were involved throughout the
development for feedback also ensures that the risk of useability problems are minimised
(Holzinger, 2005).
6.4.2 Validation test
We performed problem discovery useability testing during the iterative development process
throughout the design science research cycle. Usability testing is also known as a validation
test that early in development tends to be exploratory and tests early design concepts (Lazar
et al.'s, 2017). The goal of problem discovery useability testing is to uncover as many
useability problems as possible (Tullis and Albert, 2013). Also to verify/validate the quality
and compliance with the requirements.
The researcher was involved in all lifecycle stages of the development of the tool including
testing. Once the final artefact development sprints were completed any further validation
moved towards ex post, ending with the final toolkit design.
Ex post naturalistic and artificial evaluation methods
This quadrant was followed after the ex-ante and consisted of five evaluation methods as
shown in Figure 37. These methods have both naturalistic and artificial settings and will be
discussed below.
6.5.1 System Testing
Functional testing was carried out by the researcher at the end of each development sprint.
Functional testing aims to validate the correct operation of a digital system concerning its
expected functionality (Kwok-Woon and Siewiorek, 1983). Since the toolkit developed is
considered a proof of concept prototype for ALM, testing is limited and informal, i.e. not

175
documented in this thesis. Formal testing would have to be planned and carried out to convert
the toolkit prototype into a production environment.
6.5.2 Focus Group
A focus group is a qualitative research technique to discuss ideas with a group of participants
(Morgan, 1988). The discussion is kind of a group interview, with the session lasting not more
than two hours. The session involves not more than 12 participants and is based on a particular
topic of interest directed by a moderator (Morgan, 1988). Focus groups typically use stimulus
materials such as prototypes or questionnaires to encourage dialogue among the participants
(Oates and Alevizou, 2017). The focus group participants are encouraged to express their
opinions about the topic of interest and enrich each other’s views and elicit important opinions
and perceptions about the artefact.
Stewart and Shamdasani (2014) give several reasons that focus groups are an appropriate
evaluation technique for design science research:
Allows direct interaction with participants who are the domain experts and the
potential users of the artefact. The researcher can also clarify the design artefact.
Provides the flexibility for an open format and the ability to deal with a wide range
of design ideas.
Produces a large amount of information allowing researcher designers to obtain a
good view of the artefact design and any other organisation issues that may impact
the design.
Provides a good setting to acquire new design ideas, opinions or problems that may
not be covered in individual interviews.

176
6.5.2.1 Planning the focus group
The focus group's goal was to collect users’ opinion and their evaluation of the artefact
developed in terms of four criteria: transparency, effectiveness, efficiency, and useability. For
design science research, the focus group participants should be from a population familiar
with the application environment for which the artefact is designed so they can adequately
inform the refinement and evaluation of the artefact (Tremblay et al.'s, 2010). The
participants' recruitment was from the ALM organisation and was not random but rather
based on the participants' experience, position, and knowledge concerning the artefact being
discussed. The participants selected were also potential users of the proposed artefact. The
characteristics used to select the participants ensured that we maximise the opportunity to
capture different valuable perceptions. There were nine participants in total, they represented
five departments (sales, category, finance, IT and operations). This combination of
participants' objective was to decrease the threat to validity and increase the rigour and
relevance of the evaluation. The participants had an average experience of 4 years working
at ALM. The researcher acted the role of the focus group moderator.
6.5.2.2 The running of the focus group
A detailed agenda for the focus group was organized before the commencement of the focus
group. The focus group commenced with the moderator greeting the participants as they
entered. The participants were seated in a U-shape arrangement known to encourage
collaboration (Krueger, 2014). The focus group started by first requesting consent for the
focus group to be recorded. The focus group was recorded to capture the discussion accurately.
The focus group began with a one-hour PowerPoint presentation describing the overall
research, presenting the high-level user stories and each digital tool that addresses the user

177
stories. During the presentation, oral discussions were also allowed and the moderator
provided clarification when required.
The moderator asked several questions during the focus group, these questions were divided
into four groups: design, navigation, structure and best/worst features. The questions were
answered in a collaborative approach where each participant did not need to wait to be asked.
This was done as different participants had more to say on some items and less on others.
Hence, the participants did not need to wait for others to finish and a group discussion was
able to take place. The moderator encouraged all participants to contribute their opinion on
the digital toolkit presented. For the best/worst features of the group of questions, participants
were asked to mention what they thought were the best and worst characteristics of the toolkit
presented. Table 10 identifies the best and worst features that the participants mentioned.
Further to this, the features identified were also voted on during the focus group and recorded.
Table 10 Best and worst features from focus group discussion
Feature Best / Worst Voting
Multi-level forecasting best consensus
Competitor Intelligence does not include ALM product import worst 5 participants
Automated bill of materials (BOM) forecasting best 6 participants
Retrieval of the forecast is simplified best consensus
Lack of ability to add more than one comment for a
judgemental adjustment
worst consensus
Human input is still required to achieve the desired result worst 2 participants
Ability to report on judgemental adjustments best 7 participants
Measurable judgemental adjustment reasons best 5 participants

178
The voting results were immediately discussed with the group. The session then continued
with a demonstration of the toolkit. The moderator performed a role-playing simulation on
how the toolkit could be used in the organisation (chapter 6.6.1) and participants were able to
observe and ask for clarification. The session ended with the moderator providing details
about how the participants can access the toolkit for their use and evaluation. A questionnaire
(chapter 6.5.3) was also provided at the end of the session to gather further evaluation after
using the toolkit.
6.5.2.3 Observation Notes
During the focus group session, most participants were quiet at the start. However, as the
session progressed and the moderator asked open-ended questions the groups’ interest level
increased and participants became more involved and confident in the discussion.
It was noticed that during the session if one or two participants were highly engaged in the
discussion then this had an overall significant and positive impact on the other participants’
engagement in the discussion. It was also observed that the role-play simulation of the digital
toolkit reaffirmed the presentation and participants further questioned and sought
clarifications on their understanding and view of the digital toolkit.
6.5.3 Questionnaire
At the end of the focus group, all participants were given a questionnaire (see Appendix D:
The Questionnaire) to complete. The questions were derived based on the evaluation of the
toolkit's performance (Research Goal 4). Participants were given 10 business days to
complete the questionnaire and return it to the researcher. In accordance with subsequent
Ethics Approval (see Appendix A) we have not identified the participants by name. Some
participants asked for extra time to complete the questionnaire, however, the time needed was

179
for the participants to test the toolkit developed before completing the questionnaire. None of
the participants contacted the researcher for assistance or advice regarding the questionnaire.
The anecdotal feedback received from participants was that the questionnaire was certainly
understandable
The questionnaire was used to collect feedback about the participants' opinions and experience
using the digital toolkit they had used (chapter 6.6.2). The questionnaire contained 10
questions, however, in addition to the questionnaire additional information was sought
through email to reduce the amount of time to transcribe. These questions have been added to
form part of the questionnaire and forms part of our continuous feedback loop in our agile
development approach. The results were consolidated into a single spreadsheet where the
scores for each Likert scale were combined and calculated. The calculation is based on
frequency analysis and a points system whereby each ‘Strongly Agree, was worth + 2 points,
each ‘Agree’ +1, each ‘Neutral’ 0, each ‘Disagree’ -1, and each ‘Strongly disagree’ was worth
-2, in accordance with the research methods knowledge base (Trochim, 2020). As there were
9 responses to the questionnaire in total, each statement had a maximum (highest) a possible
total of + 18 if all participants strongly agreed and a minimum (lowest) possible total of -18
if all participants strongly disagreed.
As shown in Table 11 below, the highest marked statements have a score of +14 out of a
possible maximum of +18. These were the statements that the participants most strongly
agreed with; the toolkit helped me be more productive (S04), the toolkit is effective to use
(S07) (i.e. users ability to achieve a goal), and I would find it easy to get the forecasting model
to do what I want it to do (S10). Overall each category had at least one statement with the
highest mark except for the transparency category.

180
Table 11 Summary of questionnaire results
Statement
Stro
ngly
Agr
ee (+
2)
Agr
ee (+
1)
Neu
tral
(0)
Dis
agre
e (-
1)
Stro
ngly
disa
gree
(-2)
Tot
al S
core
(S01) Overall there is a sufficient level of detail in
the forecasting model
5 3 1 +9
(S02) My interaction with the forecasting model
would be clear and understandable
5 3 1 +9
(S03) The forecasting model provides data
integrity and completeness
4 2 3 +10
Transparency: +28
(S04) The toolkit helps me be more productive 6 2 1 +14
(S05) The response time of the toolkit is good 2 4 3 +8
(S06) The solution is consistent and fits well
within the organisation
5 4 +10
Efficiency: +32
(S07) The toolkit is effective to use 6 2 1 +14
(S08) The results of the toolkit are useful 5 2 2 +12
(S09) The results of the toolkit are of good quality 5 1 3 +11
Effectiveness: +37
(S10) I would find it easy to get the forecasting
model to do what I want it to do
7 2 +14
(S11) Learning to operate the digital solutions
would be easy for me
6 3 +12
(S12) The tool was easy to navigate 6 1 2 +13
Useability: +39
Out of a possible maximum total of +54 the highest-ranked category was useability with a
score of + 39 closely followed by Effectiveness with a score of +37. These results suggest that
the participants felt strongly that the toolkit is effective while also being simple to navigate

181
and use. The results also show that the lowest marked statement with a score of +8 out of a
possible +18 was the response time of the toolkit is good, meaning this was the least strongest
statement the participants agreed with.
Two of the three lowest marked statements with a score of +9 each out of a possible maximum
of +18 was that the overall toolkit had a sufficient level of detail in the forecasting model. The
interaction with the forecasting model would be clear and understandable. Therefore, it is
foreseeable that the tool's transparency was the lowest ranking category of statements with a
score of +28 out of a possible maximum score of +54. However, it is noteworthy that many
neutral responses in the category may be attributed to the fact that participants were not in a
state to confirm their statements. This may have been a result of their lack of experience with
the toolkit.
At the end of the questionnaire, participants were asked to give their opinion of the toolkit's
most positive and negative aspects. For the positive opinions, three of the nine participants
mentioned that the toolkit was easy to use and understand. One participant mentioned “It is
systematic, easy to retrieve records for analysis and decision making”, another participant
stated “clear indicator and easy to understand” and thirdly “enables alignment of functions
and easy to use”. While three other participants suggested that the toolkit provides the required
level of details. A participant stated, “very detailed and provides good insights” a second
participant stated “users can dig into details and focus on more of the important items” thirdly
“provides the required level of the detail with the ability to drill down into the forecast
numbers”. Two of the participants stated that the visualisations and visibility of information
the toolkit provides are very useful. Stating; “the visibility of information - it enables key
personnel to engage in discussions to make clear business decisions” secondly, “The

182
availability of the reports to everyone is easy to access and the visualisation is valuable as it
shows what the future would look like”. Finally, one participant cited that “the toolkit
improves the overall forecasting process and minimises human error”.
When participants were asked to provide their opinion on the most negative aspects of the
toolkit, opinions received from the participants included; three participants suggested that to
make judgemental adjustments, the toolkit should enable users to select more than one reason
for the judgemental adjustment. Two participants suggested a clear training and
responsibilities is established for the collaborative forecasting model to avoid misuse and
misunderstanding. One participant suggested that the toolkit should be connected to the
customer relationship management (CRM) system data in the future. One participant stated
human input is still required to achieve a more accurate result. The remaining participants did
not provide any negative aspects.
Although this data alone has limited analysis value, the cross-analysis of this data with the
evaluation from the focus group results was used to later draw some useful conclusions
(chapter 6.7) on the transparency, efficiency, effectiveness and useability of the digital tool.
Ex post artificial evaluation methods
This quadrant consisted of two evaluation methods as shown in Figure 37. These methods
have both artificial settings (i.e simulated values) and will be discussed in the below section
6.6.1 Role-play based simulation
The general concept of a role-play based simulation is an imitation of how a system would
work (Goldsman, 2007). It can be a particularly effective technique for providing a concrete
basis for discussion by illustrating an artifact's major principles and arousing interest
(Freeman, 2020). Simulations are known to be used for several applications, such as training

183
users of new systems and supporting arguments to justify going ahead with system
development (Council, 1998). A role-play simulation was performed at ALM as part of the
focus group to verify that the toolkit performs satisfactorily. In this scenario, ALM can be
considered a form of a thought experiment where a toolkit is carried out in an artificial setting
with simulated values. This allowed the researcher to experiment and demonstrate the artefact
to participants with various forms of multi-actor users such as a category manager, sales
representative, operations stakeholder and management. The reactions from the participants
were explored and noted. It is noteworthy that the artefact evaluation should not be limited to
the role-play simulation, therefore we allow for further end user testing to take place, experts
performed an evaluation by using the toolkit prior to completing the questionnaire (chapter
6.5.3). The experts' evaluation will be described in the section below.
6.6.2 End-user testing
The end-user testing allowed participants to have firsthand experience with the final toolkit
prototype for their evaluation. The researcher prepared one single testing environment for the
toolkit and used for all participants to ensure they all had the same conditions. The test
environment allowed participants to “play” with the toolkit to explore and understand how the
toolkit works. Users had free will to choose which functionality to use or tasks they would
like to complete in the toolkit. Participants were not limited to only try certain functionality
based on their roles, the features and functions of the toolkit were accessible by all
participants. All participants were presented with the same simulated values for the forecast
and they were able to make adjustments at the different forecast levels available. After testing
the toolkit, participants had the opportunity to provide valuable feedback in the questionnaire
(chapter 6.5.3), particularly the useability and most negative/positive aspects of the toolkit.

184
Discussion
The digital toolkit evaluation consisted of several phases (functionality testing, focus group
discussion, role-play simulation, end-user testing and questionnaire evaluation). Thus it was
also possible to compare the results gained by the different methods used. The use of multiple
evaluation methods has strengthened the validity and reliability of the results. The results of
the evaluation were used to refine the design and build of the digital toolkit. The focus group
discussion allowed for in-depth exploration of why the participants think the way they do
whereas questionnaire results reveal usually only what people think, not why (Shull et al.'s,
2007). The end-user testing produced a more detailed analysis of usability although the most
severe problems were found already in the focus group discussions. As compared to the
questionnaire, the focus group provided information on more detailed issues since there was
time to ask and discuss more questions. The various evaluation methods allowed us to make
changes to the toolkit, such as the inclusion of ALM product import information into the
market intelligence solution and allowed for the ability for users to add multiple comments
for a judgemental adjustment.
From the evaluations' results, we can see that the useability received the most positive
feedback from participants. Given the tool was developed using existing technologies (i.e.
TM1, PowerBi) that the participants were familiar with and used daily in their usual tasks,
this may be a factor in the high positive result. Overall the digital toolkit developed received
high results in useability, effectiveness and efficiency, indicating that the participants
themselves found the tool easy to understand, learn, and, more importantly, use. Of the main
categories in the questionnaire, transparency recorded the lowest total points in the
questionnaire. This may well be a product of confusion with the questionnaire's statements or
the participants understanding of transparency (i.e. insufficient explanations of the category
185
provided), rather than an accurate impression of the results produced. However it is
noteworthy that in group situations, where participants are known to each other, their point of
view may be influenced by others due to social acceptability, or participants may provide the
wrong information to prevent disagreements to take place (Sim and Waterfield, 2019). It is
therefore a category that may well need to be further evaluated.
Chapter Summary
The use of multiple evaluation methods within the design science research framework (Pries-
Heje et al.'s, 2008a) presented in this chapter provides several potential benefits. Ex ante
evaluation methods helped shape our decisions on developing the digital toolkit and limit the
danger of an inherent bias from the researcher. The Ex post evaluation methods provide us
with the assessment of the value created from the digital toolkit. Although existing literature
assumes that only one kind of evaluation will be necessary to demonstrate both the artefact’s
utility, fitness, or usefulness (Gill and Hevner, 2013). We recommend combining two or more
methods in evaluating an artefacts transparency, effectiveness, efficiency and usability.
Through the evaluations presented in this chapter, we were able first to establish that cyclic
feedback and testing are useful methods for the early stages of designing and developing an
artefact. Furthermore, the toolkit's development in an agile and iterative approach with the
continuous evaluation proved that using the digital toolkit goals was successful as they
improved overall effectiveness, efficiency, and transparency concerning forecasting uncertain
product demand at ALM. Although the findings were proven within only one organisation
with real stakeholders, the overall findings from the various evaluation methods used were
consistent, and therefore comparable.

186
It was also imperative that the evaluation participants match the intended audience and users
of the digital toolkit. We were able to maintain very high construct validity and reliability for
all of the evaluations by comparing the results from the different evaluation methods.
Although the researcher was actively involved in the focus group and the data collection and
analysis. This potential bias risk was minimized by the use of both qualitative and quantitative
metrics from multiple data sources (i.e. questionnaire, focus group, simulation) for evaluation
including the use of an anonymous questionnaire feedback

187
7 Conclusion
Introduction
The problem being investigated in this thesis is faced in different industries; however, each
industry presents unique parameters. For example, in the pharmaceutical industry, the
packaging and labelling standards (Shah, 2004). This thesis investigated the barriers in
forecasting uncertain product demand in the Australian Luminaire Manufacturer organisation.
The luminaire industry has distinctive features. We developed and evaluated a digital toolkit
to support practitioners in forecasting uncertain product demand. The research has been
carried out and presented in three phases according to the research design. Phase 1 presented
the investigation of the environment and scoping the industry research problem. This phase
was described in Chapters 1, 2 and 4 to present the industry problem, the literature review and
qualitative field study for investigating the barriers of forecasting uncertain product demand
in the supply chain respectively. Phase 2 presented the solution design and development of a
digital toolkit in Chapter 5. The solution design involved elicitation of high-level requirements
from the qualitative field study followed by requirements' prioritization. The toolkit developed
comprises three tools, market segmentation tool, market intelligence tool and collaborative
forecasting model. Phase 3 consisted of Chapter 6 that described an evaluation framework,
the evaluation methods used, and the evaluation results for the developed toolkit. In this
chapter, the thesis goals and contributions are revisited and the implications of the
contributions are presented. Finally, the future research directions, limitations and personal
reflections are presented.

188
Research Goals
The research was conducted using Hevner et al.'s (2004) design science research methodology
to achieve our goals that are revisited as follows:
Research Goal 1: Review and critically analyse the existing state-of-the-art in
forecasting uncertain product demand in the supply chain from empirical literature,
including the existing methods, barriers, and solutions.
To achieve Goal 1, a review and critical analysis of the existing literature was performed.
Chapter 2 thoroughly addressed the following three questions:
Research question 1: What methods are used in forecasting uncertain product demand
in the supply chain?
The identification of methods (section 2.3.1) used in forecasting uncertain product demand
revealed 38 methods that attempted to address some of the barriers in forecasting uncertain
demand. Our analysis of these methods did not reveal if there is one best method to overcome
the barriers. Following are the top 10 frequently used methods from the literature:
1. Single/Simple Exponential Smoothing
2. Syntetos-Boylan Approximation (SBA)
3. Average of statistical and judgmental
4. Judgmental adjustment alone
5. Statistical forecast judgmentally adjusted
6. Croston's
7. Naïve

189
8. Bootstrap
9. Holt’s Exponential Smoothing (Holt)
10. Autoregressive AR (1)
Research question 2: What are the barriers faced in forecasting uncertain product
demand in the supply chain?
Section 2.3.2 identified 31 barriers faced in forecasting uncertain product demand grouped
into internal or external categories. Overall the highest barrier mentioned in the studies is the
judgmental adjustments from the internal category that belongs to the communication
dimension, which causes bias and reduces the forecast accuracy.
Research question 3: What solutions have been adopted to address the barriers in
forecasting uncertain product demand in the supply chain?
In section 2.3.3 we identified 16 solutions used to address barriers in forecasting uncertain
product demand. We grouped the solutions into internal or external categories. The top
occurring internal solution identified was the use of judgmental adjustment which belongs to
the communication dimension. In hindsight, this also was the most occurring barrier faced in
the studies. The most frequently occurring solution for the external category was information
sharing which belonged to the technology dimension, sharing information between supply
chain stakeholders provides a better outcome in forecasting demand.
Research Goal 2: Investigate and survey the current state-of-the-practice in forecasting
uncertain product demand in Australian Luminaire Manufacturer.

190
To achieve Research Goal 2, a qualitative field study was performed to investigate and survey
the current state-of-the-practice presented in chapter 4. The following main research question
guided the goal:
Research question 4: What do supply chain stakeholders from the Australian Luminaire
Manufacturer perceive as state-of-the-practice in forecasting uncertain product
demand?
In section 4.4, the qualitative field study findings with practitioners from ALM revealed each
business group interviewed has a different set of their top 5 barriers faced in forecasting
uncertain product demand. The following are the overall top 5 frequently mentioned barriers
extracted from the interview study:
1. Lack of commitment
2. Poor Communication
3. Lack of data governance
4. Seasonality
5. Difficult to understand the market
Research question 5: What are the high-level requirements from the Australian
Luminaire Manufacturer to address the barriers of forecasting uncertain product
demand?
In section 5.3.1 a detailed list of all the high-level requirements (user stories) was extracted
from the stakeholders' interviews and presented. Furthermore, the prioritised set of user
stories were provided in section 4.5 was developed by performing a card sorting exercise. The
user stories with the highest priorities and most consensus from management were used to
form the requirements to forecast uncertain product demand barriers.

191
Research Goal 3: Design a toolkit to support the organisation in forecasting uncertain
product demand.
We designed and implemented a toolkit to achieve Goal 3 and the results were presented in
chapter 5 that was guided by the following research question:
Research question 6: Can the identified high-level requirements be used to design and
implement a toolkit to support the organisation in forecasting uncertain product
demand?
Chapter 5 presents the details of the digital toolkit solution's design and development based
on the design science methodology. The digital toolkit is developed to satisfy the requirements
extracted from the field study and prioritised.
Research Goal 4: Evaluate the toolkit's performance for supporting forecasting
uncertain product demand in terms of improvements in transparency, efficiency,
effectiveness and useability.
The evaluation phase aimed to assess the toolkit's performance and was completed as
described in chapter 6. Goal 4 was guided by the following research questions:
Research question 7: How transparent is the toolkit in the process and results of
forecasting uncertain product demand?

192
Both Ex Ante (before artefact construction) and Ex Post evaluation (after artefact
construction) were used in chapter 6 to evaluate the transparency of the digital toolkit
designed. The results revealed that the digital toolkit enables greater transparency in
forecasting and collaboration between supply chain stakeholders. The digital toolkit provides
details, which is information that flows amongst stakeholders for informed decision-making
and taking the right action (Hosseini et al.'s, 2018). DiPiazza Jr and Eccles (2002) .
Research question 8: How efficient is the toolkit in improving the process of forecasting
uncertain product demand?
Both the focus group and questionnaire show that the digital toolkit is efficient in the overall
time it takes to respond to a user’s request. The results revealed that the overall time it takes
for users requests such as reporting or retrieving judgemental adjustments from the toolkit is
with a minimum amount of wasted effort and expense.
Research question 9: How effective is the toolkit in improving the process of forecasting
uncertain product demand?
The results revealed that the toolkit produces useful results for the users. The participants felt
strongly that the toolkit is effective while also being simple to navigate and use. The
effectiveness of the toolkit enabled users to achieve specified goals (Standardization, 2013).
The results of the effectiveness of the toolkit produced the second-highest score in the
questionnaire results.
Research question 10: How useable is the toolkit in improving the process of
forecasting uncertain product demand?

193
The end-user testing and validation testing produced a detailed analysis of the usability of
the toolkit. The results revealed that the toolkit enabled ease of navigation, accessibility of
information and simplicity to learn the toolkit. This has resulted in the highest score for the
useability of the toolkit in the questionnaire.
Research and Industry contributions
The research presented in this thesis provides 5 significant and valuable contributions to the
body of knowledge as listed below:
7.3.1 Contributions to the Body of Knowledge
1. A detailed systematic literature review and analysis of the current state-of-the-art in
forecasting uncertain product demand (chapter 2), including the barriers (section
2.3.2), methods (section 2.3.1) and solutions adopted section (2.3.3) to address the
barriers.
2. A novel decision-making framework helps practitioners make judgmental adjustments
to a forecast through a repeatable and clear decision-making approach (section 2.4.3).
3. A qualitative field study (chapter 4) covers the end-to-end barriers (section 4.4) in
forecasting uncertain product demand in the ALM organisation's supply chain.
4. Novel digital toolkit (chapter 5) supports the supply chain management process and
overcome some of the barriers in forecasting uncertain product demand in the ALM
organisation.

194
5. Empirical evidence (chapter 6) defines the toolkit's performance for forecasting
uncertain product demand, with respect to transparency, efficiency, effectiveness, and
usability.
7.3.2 Solutions to Problems in Practice
Also, the research presented in this thesis provides several helpful solutions to the problems
in the Australian Luminaire Manufacturer including:
1. Directly addressing the area of judgmental adjustment by developing a decision
making framework (section 2.4.3) and embedding it into the collaborative forecasting
model through reporting (appendix C).
2. Using the presented digital toolkit for forecasting, this thesis demonstrates (section
6.5) that practitioners will manage detailed level forecasts and have greater
transparency and effectiveness in the forecasting process.
3. The digital toolkit presented in the thesis also addresses the lack of market intelligence
(section 5.5) and segmentation (section 5.4); the tool enables practitioners to visualize
and reference large amounts of information effortlessly.
Implications for industry
This study provides interesting insights for managers contemplating investing in improving
accuracy in forecasting uncertain product demand in the supply chain. In particular, the study
offers several useful directions to managers involved in forecasting product demand in the
supply chain. First, this study's results can be used to understand the barriers organisations
face internally and externally in forecasting uncertain product demand (RQ2) and the solutions

195
adopted to address these barriers (RQ3). Secondly, this study highlights the methods used
across multiple supply chain industries (RQ1) and the importance of judgmental adjustments
in the forecasting process. The success of judgmental adjustment in the forecast depends on
the commitment of managers and the maturity of the process. A framework has been
developed to help forecasters make judgmental adjustments through a repeatable and clear
decision-making method. Our study uses empirical results from literature review across
multiple supply chain industries, which may offer guidance to organisations and their top
managers
One of the major criticisms of the research community is about the validity of the problem
and acceptance and applicability of the solution in real world or industry (Davis and Hickey,
2002, Wieringa, 2005). A richer picture could have been painted if more stakeholders were
interviewed. However, to reduce the threat of validity, I ensured that when analysing the
transcripts of the interviews, when I did not see any new insights coming out, I had reached
saturation point, and no new information was received.
The biggest threat to validity is my own bias that could have impacted some of my decisions
or results. This threat has been mitigated by checking the results with my supervisor, who is
an independent person.
Finally, the extraction of high-level requirements resulting from an interview study and the
development of a digital toolkit bridges the gap between the literature and the knowledge from
expert practitioners in the industry.
Implications for research
This research has significant implications on theory and the body of knowledge in the
following three ways:

196
1. Regarding the environment (problem space), an increased general understanding and
knowledge gained in the field of supply chain, in particular, the forecasting of uncertain
product demand. This is as a result of both the literature review (chapter 2) and survey of
practice (chapter 4).
2. As part of the research, the design and development of a digital toolkit in the solution space
(chapter 5) provides a foundation for other researchers to develop further additional support
for forecasting uncertain product demand.
3. The successful demonstration of the evaluation (chapter 6) of the digital toolkit use
specifically for forecasting uncertain product demand in ALM provides guidance in using a
multi-faceted evaluation approach.
Future research directions
This study provides both theories and practice with several valuable and much-needed
contributions. Several opportunities exist for the development of future work to enhance the
results and extend their implications.
Considering the environment phase, more participants for the qualitative field study would
have naturally provided more data on state-of-the-practice, particularly from the external
stakeholders, such as the supplier and customer. This would arguably present a more complete
picture of opinions and attitudes on the barriers faced in forecasting uncertain product demand.
Further development of some of the partially implemented (e.g. Judgemental adjustment rules
and reporting) and out of scope features (e.g. Forecast accuracy) would provide the toolkit
users greater functionality and confidence. Given judgemental adjustments is the highest
mentioned barrier. Also, one of the solutions that may be adopted to overcome the barriers in

197
forecasting uncertain product demand, further exploration, and research on judgment
adjustment is an important exploration in future research.
It will also be useful to explore the possibilities of using the toolkit designed in other industries
and observe its performance. However, processes and human factors need to be considered as
each organisations sales and operations planning process will be unique. In addition to this,
human factors such as toolkit adoption forecasting users will also need to be considered.
Limitations
This section discusses the limitation of the industry research project. First, although we have
consistently followed a stringent search and selection following the guidelines of evidence-
based paradigm to ensure our sample's completeness in the systematic literature review, there
may be some further articles that have not been included in our data collection that we are not
aware of. When we were forming our search string, using our pilot search, and testing, we did
not use all alternate terms for ‘‘uncertain’’ demand. We discovered this later in the data
extraction stage. By performing a thorough secondary search strategy, we believe that we have
successfully compensated for this limitation. However, we acknowledge that there may have
been some papers that could have been added to our sample should we have used these
additional terms. Secondly, we were only interested in empirical studies investigating
forecasting uncertain product demand, so perhaps we may have undervalued the present state
of research. However, to minimize this limitation, we reviewed some of the papers that were
not empirical and found that these studies provide the same insights that we have obtained
from the empirical studies, for example, Du et al.'s (2008) and Li et al.'s (2012) find that lead
times impact uncertainty in the supply chain and the increase in the lead time can to a certain
extent decrease supply risk. Other studies claim that the introduction of information systems
198
or models such as the use of a variance-retentive stochastic dynamic programming algorithm
in decision support systems (Basu and Nair, 2014), Grey Jump models (Lin et al.'s, 2008)
and improved Holt-Winters (HW) model (Ferbar Tratar, 2015) help in forecasting short life
span products and uncertain product demand.
Thirdly, the papers that were screened are based on our inclusion, and exclusion criteria and
the data extracted from the included studies were based on our research questions. Hence, the
results of the selected papers, together with data analysis, were subjective. However, to ensure
research quality, the chosen papers have been reviewed and evaluated by PhD supervisor
randomly selecting and reviewing some papers from the data sample. The findings reveal a
high degree of consistency in the papers selected among the two authors.
Finally, there are inherent limitations to the research design. The qualitative approach is more
concerned with the ALM organisations supply chain than the general population's
representation. In other words, in the luminaire industry, it is challenging to claim overall
generalizability; hence our results may not be applicable in all contexts. This research is not
claiming generalizability in the larger sense. However, for any organisations with similar
characteristics described in this thesis, generalizability can be applied. We further concede
that there are inherent limitations in evaluating the model in the real world. However, the
research design has been explained in enough details so that others can repeat or perform
similar studies in different contexts. There is also a possibility that there may have been some
unconscious bias as the researcher is an ALM organization employee. However, this was
limited as each group of participants were asked the same questions. The interviews were also
recorded so that the researcher did not need to rely on his memory.

199
There are also limitations in the data collection, namely the semi-structured interview
questions. As participants were asked to answer semi-structured questions, participants’
responses are based on their experience, perception and memory. Respondents might have
overlooked certain barriers that do not impact them or have decided to report on more
desirable barriers and do not directly impact their positions in the organisation, hence the
number of barriers reported is likely to be underestimated. It is also possible that respondents
did not describe what is happening in the organisation.
Reflections
Reflecting on the research work performed in this thesis, we can analyse our research
experience and journey. Having been given an industry problem by ALM, this was the basis
of the research. The exploration of the state-of-the-art and state-of-the-practice environment
was critical as it provided us with deep knowledge and understanding of the industry problem.
The systematic literature review and qualitative field study were extremely useful methods to
critically analyse existing research and our industry knowledge.
Reflecting on some of the challenges experienced in performing an industry research project
is the continuous change in the business model at ALM. This also brought a human dimension
where several vital stakeholders left the business during this study, and new employees joined.
It was important to ensure the research project remained on track by providing regular
feedback to the executive leadership team.
Although the design, development and evaluation of the digital toolkit was for the ALM, it
would have been interesting to examine how the tool could be used, and its performance
observed in other domains.

200
I appreciate that this research was industry-based, where an industry problem was investigated
and a digital toolkit solution was designed and developed to address the organisation’s main
barriers in forecasting uncertain product demand. We hope that as a result of this research,
future researchers and practitioners will be better informed and have the resources to develop
further effective and sophisticated digital tools for forecasting uncertain product demand in
the supply chain.

201
Appendix A: Ethics Approval from HREC UTS HREC Approval Granted - ETH17-2021 [email protected] Sent: Wed, Mar 21, 2018, 4:28 PM To: Didar.Zowghi, Elias.AbouMaroun, Research.Ethics
Dear Applicant
Thank you for your response to the Committee's comments for your project titled, "……. supply chain improvement". Your response satisfactorily addresses the concerns and questions raised by the Committee who agreed that the application now meets the requirements of the NHMRC National Statement on Ethical Conduct in Human Research (2007). I am pleased to inform you that ethics approval is now granted.
Your approval number is UTS HREC REF NO. ETH17-2021.
Approval will be for a period of five (5) years from the date of this correspondence subject to the provision of annual reports.
Your approval number must be included in all participant material and advertisements. Any advertisements on the UTS Staff Connect without an approval number will be removed.
Please note that the ethical conduct of research is an on-going process. The National Statement on Ethical Conduct in Research Involving Humans requires us to obtain a report about the progress of the research, and in particular about any changes to the research which may have ethical implications. This report form must be completed at least annually from the date of approval, and at the end of the project (if it takes more than a year). The Ethics Secretariat will contact you when it is time to complete your first report.
I also refer you to the AVCC guidelines relating to the storage of data, which require that data be kept for a minimum of 5 years after publication of research. However, in NSW, longer retention requirements are required for research on human subjects with potential long-term effects, research with long-term environmental effects, or research considered of national or international significance, importance, or controversy. If the data from this research project falls into one of these categories, contact University Records for advice on long-term retention.
You should consider this your official letter of approval. If you require a hardcopy please contact [email protected]. To access this application, please follow the URLs below:

202
* if accessing within the UTS network: https://rm.uts.edu.au * if accessing outside of UTS network: https://remote.uts.edu.au , and click on "RM6 - ResearchMaster Enterprise" after logging in.
We value your feedback on the online ethics process. If you would like to provide feedback please go to http://surveys.uts.edu.au/surveys/onlineethics/index.cfm
If you have any queries about your ethics approval or require any amendments to your research in the future, please do not hesitate to contact [email protected].
Yours sincerely,
Associate Professor Beata Bajorek Chairperson UTS Human Research Ethics Committee C/- Research & Innovation Office University of Technology, Sydney E: [email protected] I:https://staff.uts.edu.au/topichub/Pages/Researching/Research%20Ethics%20and%20Integrity/Human%20research%20ethics/human-research-ethics.aspx

203
INVITATION LETTER
FORECASTING UNCERTAIN PRODUCT DEMAND
IN SUPPLY CHAIN
Dear ___________
My name is Professor Didar Zowghi. I am an academic at the University of Technology Sydney.
My PhD student Mr Elias Abou Maroun and I are conducting research into forecasting unknown product demand and would welcome your assistance. The research will involve an interview conducted at ………… by Elias and should take no more than 60 minutes of your time. I have asked you to participate because you have expertise and/or involved in the forecasting of product demand at ……...
You are under no obligation to participate in this research and you are rest assured that your participation will have no impact on your employment or relationship with ………….
Your contribution will be valuable to this research. If you are willing to assist us, please email Elias ([email protected]) within one week of the date you receive this invitation.
Yours sincerely,
Professor Didar Zowghi Faculty of Engineering and Information Technology University of Technology, Sydney (UTS) [email protected] Phone: +61 2 9514 1860
NOTE:
This study has been approved by the University of Technology, Sydney Human Research Ethics Committee. If you have any complaints or reservations about any aspect of your participation in this research that you cannot resolve with the researcher, you may contact the Ethics Committee through the Research Ethics Officer (ph: +61 2 9514 2478 [email protected]), and quote the UTS HREC reference number. Any complaint you make will be treated in confidence and investigated fully and you will be informed of the outcome.
INVITATION LETTER
Production Note:Signature removed prior to publication.
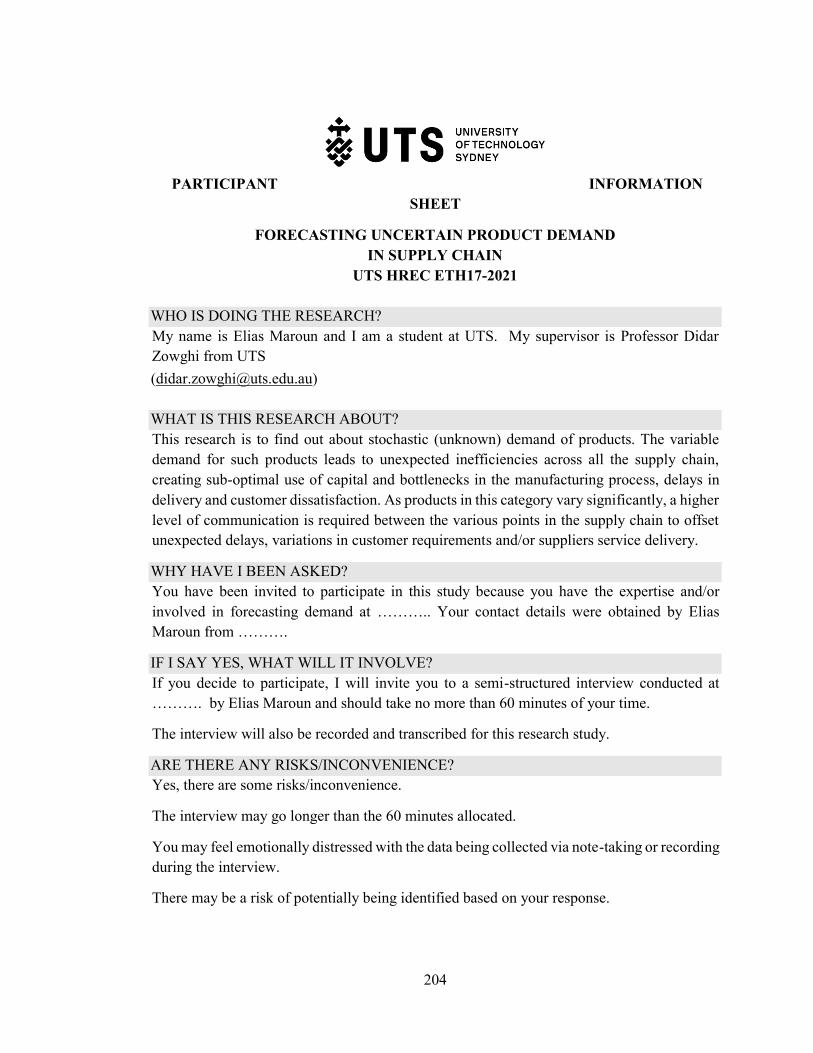
204
PARTICIPANT INFORMATION SHEET
FORECASTING UNCERTAIN PRODUCT DEMAND IN SUPPLY CHAIN
UTS HREC ETH17-2021
WHO IS DOING THE RESEARCH? My name is Elias Maroun and I am a student at UTS. My supervisor is Professor Didar Zowghi from UTS ([email protected]) WHAT IS THIS RESEARCH ABOUT? This research is to find out about stochastic (unknown) demand of products. The variable demand for such products leads to unexpected inefficiencies across all the supply chain, creating sub-optimal use of capital and bottlenecks in the manufacturing process, delays in delivery and customer dissatisfaction. As products in this category vary significantly, a higher level of communication is required between the various points in the supply chain to offset unexpected delays, variations in customer requirements and/or suppliers service delivery.
WHY HAVE I BEEN ASKED? You have been invited to participate in this study because you have the expertise and/or involved in forecasting demand at ……….. Your contact details were obtained by Elias Maroun from ……….
IF I SAY YES, WHAT WILL IT INVOLVE? If you decide to participate, I will invite you to a semi-structured interview conducted at ………. by Elias Maroun and should take no more than 60 minutes of your time.
The interview will also be recorded and transcribed for this research study.
ARE THERE ANY RISKS/INCONVENIENCE? Yes, there are some risks/inconvenience.
The interview may go longer than the 60 minutes allocated.
You may feel emotionally distressed with the data being collected via note-taking or recording during the interview.
There may be a risk of potentially being identified based on your response.

205
This risk is mitigated by carefully de-identifying the interview transcripts, and give a code name to each interview. The list of interviewees and their corresponding code will be kept in a secure locked location that is only accessible to Elias.
DO I HAVE TO SAY YES? Participation in this study is voluntary. It is completely up to you whether or not you decide to take part.
WHAT WILL HAPPEN IF I SAY NO? If you decide not to participate, it will not affect your relationship with the researchers or ……. Lighting. If you wish to withdraw from the study once it has started, you can do so at any time without having to give a reason, by contacting Elias Maroun at ([email protected])
If you withdraw from the study, any interview that has been recorded or transcripts will be destroyed.
CONFIDENTIALITY By signing the consent form, you consent to the research team collecting and using personal information about you for the research project. All this information will be treated confidentially. All interview recordings and transcripts taken will be stored in a lockable draw and accessible only by the research team. Your information will only be used for this research project.
In any publication, the information will be provided in such a way that you cannot be identified.
WHAT IF I HAVE CONCERNS OR A COMPLAINT? If you have concerns about the research that you think I can help you with, please feel free to contact me at [email protected]
You will be given a copy of this form to keep.
NOTE: This study has been approved by the University of Technology Sydney Human Research Ethics Committee [UTS HREC]. If you have any concerns or complaints about any aspect of the conduct of this research, please contact the Ethics Secretariat on ph.: +61 2 9514 2478 or email: [email protected]], and quote the UTS HREC reference number. Any matter raised will be treated confidentially, investigated and you will be informed of the outcome.

206
CONSENT FORM FORECASTING UNCERTAIN PRODUCT DEMAND
IN SUPPLY CHAIN UTS HREC ETH17-2021
I ____________________ agree to participate in the research of forecasting uncertain product demand in supply chain UTS HREC ETH17-2021 being conducted by Elias Maroun, University of Technology, Sydney (UTS), [email protected]. I have read the Participant Information Sheet or someone has read it to me in a language that I understand. I understand the purposes, procedures and risks of the research as described in the Participant Information Sheet.
I have had an opportunity to ask questions and I am satisfied with the answers I have received.
I freely agree to participate in this research project as described and understand that I am free to withdraw at any time without affecting my relationship with the researchers or the University of Technology Sydney.
I understand that I will be given a signed copy of this document to keep.
I agree to be:
Audio recorded I agree that the research data gathered from this project may be published in a form that:
Does not identify me in any way
May be used for future research purposes
I am aware that I can contact Elias Maroun if I have any concerns about the research. ________________________________________
____/____/____
Name and Signature [participant]
Date
________________________________________ ____/____/____ Name and Signature [researcher or delegate] Date

207
Appendix B: Industry User Stories
Card No #
User Story Category Who
1 As a sales representative, I want supply chain traceability of the products my customers have ordered so that I am promptly aware of any delays.
culture sales representative
2 As a product engineer, I want a commitment on the product specifications so that we can plan more accurately.
culture product engineer
3 As a supplier, I want the business to provide and commit to a forecast so that we can provide competitive pricing.
culture supplier
4 As a sales manager, I want my sales representatives forecast to be trusted so that they are encouraged to use the system.
culture Sales manager
5 As a supply chain stakeholder, I want to know the lifecycle of the product so that we can manage demand.
Product Supply chain stakeholder
6 As a sales representative, I want details of new products available so that I am knowledgeable.
Product sales representative
7 As a category manager, I want to know the price of competitor products so that I can make informed decisions.
Product Category manager
8 As a finance manager, I want simplified SKU structures across the product range, so I can make quick decisions.
Product Finance Manager
9 As a supply chain stakeholder, I want consistency in the data used so that we can overcome repeating tasks.
Technology Supply chain stakeholder
10 As a supply chain stakeholder, I want accuracy of the data so that we can make informed decisions.
Technology Supply chain stakeholder
11 As a category manager, I want access to more market intelligence data so that we can make decisions with a complete set of data.
Technology Category manager
12 As a sales representative manager, I want better data integrity in the system so that I can manage outcomes better.
Technology sales representative

208
13 As a sales representative manager, I want better communication on product availability during the holiday periods so that I can communicate better with our customers.
Communication sales representative
14 As a product engineer, I want visibility on changing the bill of materials of product development requests so that we can plan better.
Communication product engineer
15 As a supply chain stakeholder, I want better training across all the departments so that communication is uniform.
Communication Supply chain stakeholder
16 As product engineer, we need to produce products that fulfil multiple customer requirements to reduce the number of SKU.
Product product engineer
17 As supply chain stakeholder, we need to understand our sell-in and sell-through to keep new stock flowing through the channel.
customer Supply chain stakeholder
18 As a sales representative manager, we need to reduce our product launch time to market to increase market share.
Product Sales manager
19 As a supply chain stakeholder, we need to restrict the customer exchange policy, so we don’t get caught up with old stock.
culture Supply chain stakeholder
20 As a sales representative, I want simpler pricing structures so that I can work more effectively with my customers.
Product sales representative
21 As category manager, we need to manage our suppliers' minimum order quantity (MoQ) so that we don’t have to over order.
Suppliers Category manager
22 As a supply chain stakeholder, we need transparency and visibility on the transitioning of components to newer versions.
Product Supply chain stakeholder
23 As a finance manager, we need to do detailed forecasts, so we can better measure the business performance.
Product Finance Manager
24 As a sales representative manager, we need to communicate the introduction of next-generation products to the market, so our customer's systems are up to date.
Communication Sales manager

209
25 As a supply chain stakeholder, we need visibility of the timing of phase-in and phase-out of products.
Communication Supply chain stakeholder
26 Blank
27 Blank
28 Blank

210
Appendix C: Digital Toolkit solution screens
Product Segmentation
Supplier Segmentation

211
Market Intelligence Screens
Highbay Lighting
LED Strip Lighting

212
LED Panel Lighting
Flood Light specification (chapter 5.5.1)

213
Collaborative forecasting model
Judgmental Adjustments due to competitor activities

214
Appendix D: The Questionnaire
1. Business Unit (circle one below)
Sales/Category Finance/IT Operations
2. ALM Experience
Less than 1 year b. 2-4 years c. 5-7 years d. More than 7years
3. Learning to operate the digital solutions would be easy for me? Strongly agree neutral strongly disagree 1 2 3 4 5
4. I would find it easy to get the forecasting model to do what I want it to do? Strongly agree neutral strongly disagree 1 2 3 4 5 In your opinion does the forecasting model provide data integrity and completeness? Strongly agree neutral strongly disagree 1 2 3 4 5
5. My interaction with the forecasting model would be clear and understandable. Strongly agree neutral strongly disagree
Card # User Story Digital Solution 4 As a regional manager, I want my sales representatives
forecast to be trusted so that they are encouraged to use the system.
Facebook Prophet + Judgemental Adjustments
10 As a supply chain stakeholder, I want accuracy of the data so that we can make informed decisions.
Facebook Prophet + Judgemental Adjustments
11 As a category manager, I want access to more market intelligence data so that we can make decisions with a complete set of data.
Market Intelligence + Customer/ Product Segmentation
12 As a regional manager, I want better data integrity in the system so that I can manage outcomes better.
Market Intelligence + Customer/ Product Segmentation
23 As a finance manager, we need to do detailed forecasts, so we can better measure the business performance.
Facebook Prophet + Judgemental Adjustments

215
1 2 3 4 5 6. Overall there is sufficient level of detail in the forecasting model
Strongly agree neutral strongly disagree 1 2 3 4 5
7. The solution is consistent and fits well within the organisation Strongly agree neutral strongly disagree 1 2 3 4 5
8. In your opinion, what is the most negative aspect of the digitisation of the solution
9. In your opinion, what is the most positive aspect of the digital solution?
10. If you have any additional comments or questions about the editor functionality, please feel free to write them here

216
Appendix E: Interview Questions
# Question In Study General Interview Questions 1 What are the steps that you take to forecast unknown product demand? Yes 2 What type of data is used to forecast these unknown product demands? Yes 3 What challenges do you face in achieving a more accurate forecast? Yes 4 Why are these challenges occurring? Yes 5 How do you think these challenges can be addressed? No 6 What internal organisation challenges do you face in forecasting unknown product demand? Yes 7 Do you think the ability to visualise data in forecasting demand could help address some of
these challenges? No
8 What specific data visualisation do you think can help? No Operations 1 How long does a product development request (PDR) process take and what are the
challenges faced? Why? Can this be improved, How? No
2 When purchasing is turned off what happens to the safety stock and forecast? No 3 Is there any seasonality for products and how is this treated with the forecasting? Yes 4 What is the product lifecycle of products and how is this managed regarding forecasting? Yes
Sales and Category 1 How do you go about preparing the business for a potential opportunity Yes 2 What are some of the challenges that you may face from a customer or project point of view
with forecasting the product demand? Yes

217
Appendix F: Systematic Literature Review Protocol
A Systematic Literature Review Protocol for
Forecasting Product Demand in Supply Chain
Elias Abou Maroun [email protected]
Didar Zowghi [email protected]
FEIT, School of Computer Science University of Technology Sydney
Version 3
January 2018

218
TEAM STRUCTURE
Dr Didar Zowghi
Professor of Computer Science Faculty of Engineering and Information Technology University of Technology, Sydney [email protected]
Co-Investigator, Secondary Reviewer, Author
Elias Abou Maroun
PhD Student Faculty of Engineering and Information Technology University of Technology, Sydney [email protected]
Principal Investigator, Primary Reviewer, Author

219
Abstract
Context
Australian businesses often rely on Business Construction and Infrastructure (BCI) data to monitor construction projects across the country which generates a stream of prospective business opportunities as they arise. BCI is a commercial data provider that various manufacturers and businesses in Australia purchase access to. Each project indexed by BCI generates several manufacturing and construction projects. The size of the data maintained by BCI is large and is continuously changing. This research project is to develop an intelligent decision support system to identify the most promising leads to a given manufacturing context to be used within forecasting and sales and operations planning.
Supply chain planning is an important process that is carried out within the supply chain management framework, it can have many impacts on an organisations success or failure in the industry. The forecasting or prediction of product demand in an organisation requires many aspects to be considered, such as inventory, transportation, warehousing capacity, revenue, and cash flow. Managing the product item supply and demand uncertainties is difficult due to the consequences that arise from unknown demand fluctuations such as the reduction of customer satisfaction, financial loss, the loss of market share and reputation damage. The setting of a sales goal for the sales team helps in motivating the salespeople to exceed those. However, concerns are raised if the demand estimate is not as accurate as it could be. This sales forecast is used by finance to project the costs, capital needs, and expected profit levels.
The overall research conducted as part of the thesis requirement is designed to achieve the following specific aims:
A. Explore the approach organisations have taken to reduce unknown product demand fluctuation and the impact this has had on the organisation.
B. Identify and investigate the tools and methods used to provide a better demand forecast for fluctuating demand.
C. Develop and test a scalable model or process that improves forecasts against fluctuating demand of products due to uncertainty in projects.
Objective
Following the Evidence-Based Research Paradigm guidelines, the objective of this Systematic Literature Review (SLR) is to gather all the published empirical evidence about intelligent decision support systems and forecasting of unknown customer product demand (2007 – 2017).

220
The SLR aims to aggregate and explore empirical studies on forecasting unknown product demand in the supply chain. This SLR specifically focuses on unknown product demand.
Method
The Systematic Literature Review (SLR) adopts guidelines from an Evidence-Based Software Engineering and Systematic Reviews, principally using the SLR guidelines from [1]. We will be carrying out all the steps outlined in the guidelines for performing systematic literature reviews in software engineering.
Expected Outcomes
From the systematic review results, we hope to gain answers to the research questions and find any gaps that have not yet been explored or that may be under-explored. We aim to enhance our understanding to develop a solution to improve the organisations forecasting capabilities for product demand and provide better visualisation.
KEYWORDS
1. Forecasting | Forecast | Prediction | Predict | Predicting 2. Product | Products | Stock Keeping Unit | SKU | Market 3. Demand| Order | Sales |Availability |Stochastic 4. Supply Chain | Planning | Procurement | Manufacturing | Inventory
INTRODUCTION
Customer’s demand set organisations entire supply chain in motion. It generates a course of actions that organisations need to respond to such demand by ensuring the necessary components and products are in place to satisfy the customer’s order [2]. The uncertainty of customer demand is a challenging problem in manufacturing organisations that leads to poor business performance and dissatisfied customers. If the customer's demand were constant or known with certainty well in advance, then a supply chain operation would be a straightforward exercise of ordering goods [2]. However, as the demand for products is not known for projects thus a forecast is required. The use of forecasting needs to apply to the regular consuming items and the irregular products that fluctuate and have a nonlinear sales trend [6]. Forecasting aims to predict the demand for a specific item in the future and reserve the amount of item based on the forecasting results [3]. Forecasting is important for all decision tasks from, inventory management, sales and operations planning and strategic management [4]. Since excess inventory leads to high holding costs and stockouts can greatly impact operations performance, there is a great need for accurate demand forecasting [5].
The adoption of technology within organisations and consumers is rapidly occurring, the speed at which consumers are expecting goods and services to be supplied is also shrinking. Organisations are competing on a global stage due to the speed of transactions occurring

221
worldwide and freight and transportation efficiencies. This adds strain on the organisation that doesn’t have a lean and agile supply chain that can forecast the consumer’s needs. Consequently, we need to research the use of forecasting to cater for unknown consumer demand.
BACKGROUND AND MOTIVATION
Efficient replenishment planning is a very important problem for industry [7]. The accurate replenishment of products during any period may be impossible for some products due to a stochastic demand [8]. The focus of this study is on cost-saving opportunities in the delivery of products impacted by cavitation demand also known as noisy demand[9]. The variable demand for such products leads to unexpected inefficiencies across all the supply chain (SC), creating sub-optimal use of capital and bottlenecks in the manufacturing process, delays in delivery and customer dissatisfaction. As products in this category vary significantly, a higher level of communication is required between the various points in the supply chain to offset unexpected delays, variations in customer requirements and/or suppliers service delivery. Inventory related decisions are crucial for increasing efficiency and improving customer service level. Demand forecasting and stock control both contribute equally towards a decision making process [9]. The study will deliver cost savings by reducing communication problems and adding intelligence to the supply chain, where problems are recurring. The intelligence will support communication in newly created communication channels and enhance the forecasting capacity of the organisation.
RESEARCH QUESTIONS
This study is guided by the following question: “How can organisations better forecast stochastic demand for products that are used in projects and reduce the gap between the forecast and actual sales”. Though this research question guides the wider study, it is multi-disciplinary and too broad to shape a SLR, instead the authors propose the following narrower questions:
RQ1 In studies of demand planning in the supply chain, what forecasting technique are the most frequently analysed in the empirical literature.
RQ2 In studies of demand planning in the supply chain, what are the challenges being faced in forecasting stochastic product demand
RQ3 In studies of demand planning in the supply chain, what research methods are used for forecasting stochastic product demand.
SEARCH STRATEGY

222
The following steps will be performed to search for the relevant studies.
1. We will derive major search terms from the Research Question(s). 2. List the keywords found in the article and identify relevant synonyms and alternative
words that are used in published literature. The resulting terms will be connected using Boolean OR to incorporate alternative synonyms and Boolean AND operators to link major terms to construct a complete search string.
3. We will select a range of A-rated conference/journal proceedings in online databases for searching. The search string will be customized for the online databases’ interfaces. The string will be applied to the title and abstracts. The searches will be open for date range between (2007 and 2017).
4. We will store the results (citations and abstracts) using Endnote8 and Excel9. For every database, we will maintain a separate library. For sharing the final set of included papers we will be using google drive10 online.
Major Search Terms
Based on our research questions, we have the following four major search terms:
1. Forecasting 2. Product 3. Demand 4. Supply Chain
8 www.endnote.com 2 https://office.live.com/start/Excel.aspx 3 www.google.com.au/drive/
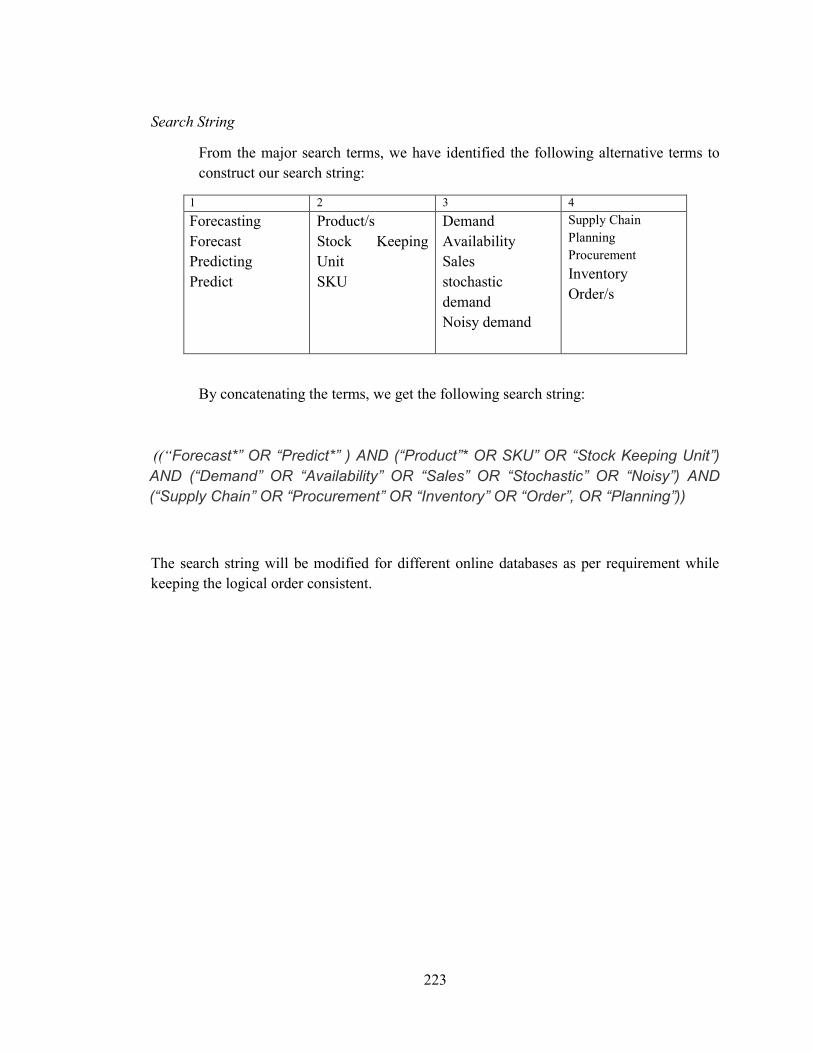
223
Search String
From the major search terms, we have identified the following alternative terms to construct our search string:
1 2 3 4 Forecasting Forecast Predicting Predict
Product/s Stock Keeping Unit SKU
Demand Availability Sales stochastic demand Noisy demand
Supply Chain Planning Procurement Inventory Order/s
By concatenating the terms, we get the following search string:
((“Forecast*” OR “Predict*” ) AND (“Product”* OR SKU” OR “Stock Keeping Unit”) AND (“Demand” OR “Availability” OR “Sales” OR “Stochastic” OR “Noisy”) AND (“Supply Chain” OR “Procurement” OR “Inventory” OR “Order”, OR “Planning”))
The search string will be modified for different online databases as per requirement while keeping the logical order consistent.

224
Online Databases
We will apply the search string on a range of online databases to ensure that we do not miss any related study.
o Google Scholar (http://scholar.google.com.au) o ProQuest (http://www.proquest.com) o IEEE Explore (http://ieeexplore.ieee.org/Xplore o Springerlink (http://www.springerlink.com) o Business Source Complete EBSCO (https://www.ebscohost.com) o Emerald (http://www.emeraldinsight.com) o Science Direct (http://www.sciencedirect.com) o Trove (http://trove.nla.gov.au) o ACM Digital Library (http://dl.acm.org) o Sage Journal (http://online.sagepub.com) o JSTOR (http://www.jstor.org) o Scopus (https://www.elsevier.com) o Taylor and Francis Online (http://www.tandfonline.com)
All papers will be given a unique identification number based on the database from which it was retried. These unique identification numbers will be used to create a trace among various documents.
Specific conferences and journals
Given Forecasting product demand is a common problem within multiple industries, significant research into the field may be found in conference publications that may not be available in the above databases. The below specific conferences and journals are also suggested for inclusion in the research.
Conferences
- IEEE International Conference on Service Operations and Logistics, and
Informatics (SOLI)
Journals
- European Journal of Operational Research
- International Journal of Production Economics
- Journal of Management
- Journal of Operations Management
- Journal of Forecasting

225
- International Journal of Project Management
- Journal of International Management
- Decision Support Systems
STUDY SELECTION CRITERIA
Once all the results are obtained from all selected sources, we will apply the selection criteria to filter out the irrelevant studies. The Primary Reviewer will apply criteria on all papers and the Secondary Reviewer will randomly check among the results to reduce any selection bias. Any issues related to the selection of a paper will be resolved by discussion.
The following criteria will be applied in steps;
1. IF (‘the result is a thesis/general article/editorial/book review/’) THEN EXCLUDE ELSE GOTO step 2
2. IF ( ‘the study is investigating forecasting product demand and/or stochastic demand in the supply chain’ ) THEN GOTO step 3 ELSE EXCLUDE
3. IF (‘the paper is giving results based on EMPIRICAL investigation and not on personal opinions, theory or conceptual work and general surveys’) THEN INCLUDE ELSE EXCLUDE
Any duplicate citations (papers) will be discarded before applying the selection filter. Research papers retrieved from all search engines will be given an identification number from which it was retrieved. If more than one paper is using/describing results from the same study or is in multiple publications from one study for a conference and extended journal versions, they will be treated as one study.
Based on the retrieved results, we will perform secondary searches by scanning and reviewing the references and citations at the end of the papers. Those papers that would stand eligible for consideration will be treated with the same inclusion/exclusion criteria set for primary search selection. The resultant studies will be associated with the parent paper for trace from which it was retrieved.
Once the selection process is complete, new final identification numbers would be given to the included studies.
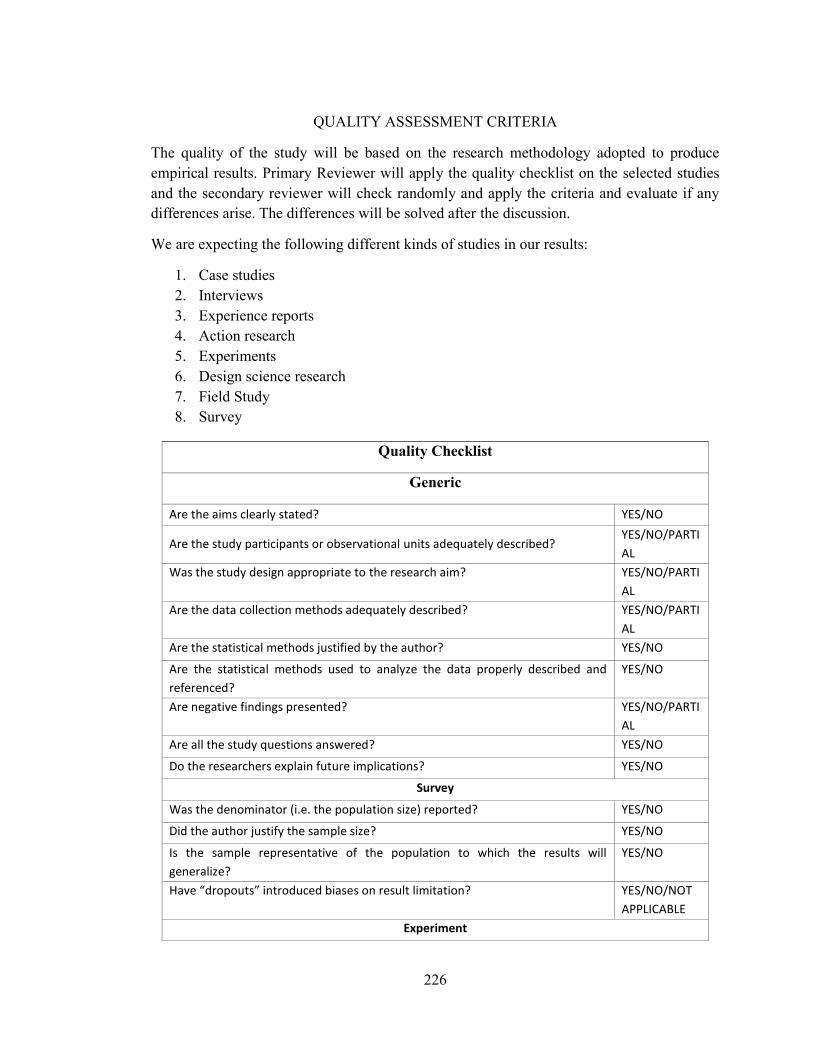
226
QUALITY ASSESSMENT CRITERIA
The quality of the study will be based on the research methodology adopted to produce empirical results. Primary Reviewer will apply the quality checklist on the selected studies and the secondary reviewer will check randomly and apply the criteria and evaluate if any differences arise. The differences will be solved after the discussion.
We are expecting the following different kinds of studies in our results:
1. Case studies 2. Interviews 3. Experience reports 4. Action research 5. Experiments 6. Design science research 7. Field Study 8. Survey
Quality Checklist
Generic
Are the aims clearly stated? YES/NO
Are the study participants or observational units adequately described? YES/NO/PARTI
AL
Was the study design appropriate to the research aim? YES/NO/PARTI
AL
Are the data collection methods adequately described? YES/NO/PARTI
AL
Are the statistical methods justified by the author? YES/NO
Are the statistical methods used to analyze the data properly described and
referenced?
YES/NO
Are negative findings presented? YES/NO/PARTI
AL
Are all the study questions answered? YES/NO
Do the researchers explain future implications? YES/NO
Survey Was the denominator (i.e. the population size) reported? YES/NO
Did the author justify the sample size? YES/NO
Is the sample representative of the population to which the results will
generalize?
YES/NO
Have “dropouts” introduced biases on result limitation? YES/NO/NOT
APPLICABLE
Experiment

227
Quality Checklist
Generic
Were treatments randomly allocated? YES/NO
If there is a control group, are participants similar to the treatment group
participants in terms of variables that may affect study outcomes?
YES/NO
Could the lack of blinding introduce bias? YES/NO
Are the variables used in the study adequately measured (i.e. are the variables
likely to be valid and reliable)?
YES/NO
Case Study Is a case study context defined? YES/NO
Are sufficient raw data presented to provide an understanding of the case? YES/NO
Is the case study based on theory and linked to existing literature? YES/NO
Are ethical issues addressed properly (personal intentions, integrity issues,
consent, review board approval)?
YES/NO
Is a clear Chain of evidence established from observations to conclusions? YES/NO/PARTI
AL
Experience Report Is the focus of the study reported? YES/NO
Does the author report personal observation? YES/NO
Is there a link between data, interpretation and conclusion? YES/NO/PARTI
AL
Does the study report multiple experiences? YES/NO
Some of the checklist items will be graded on yes/no and a few with partially. Scores will also be assigned according to the grades, 1 for Yes, 0 for No and 0.5 for Partial. The total sum of the scores will be used for the quality assessment of studies.
The decision about the ranking of the studies based on the quality score will be taken after we get the results. We wish to include all selected papers for analysis, as a part of our exploratory research. But we would check for the significance of the difference that low-quality papers are making on the overall analysis. Also, the quality of the conference/journal where the paper is published would be considered if we have to decide for including a low-quality paper.

228
DATA EXTRACTION
We will design data extraction forms in MS Excel to input the information we require from the papers to answer our research questions. There will be two forms, one for generic information and the other would be for specific information.
Following data will be extracted for generic form;
1. Title 2. Authors 3. Journal or conference 4. Name of journal or conference 5. Type of conference or journal 6. Publication year 7. Full citation 8. The geographical location (where the study was conducted) 9. Type of study (research method)
Following data will be extracted for the specific form to answer our research questions;
RQ1 In studies of demand planning in the supply chain, what forecasting technique are the most frequently analysed in the empirical literature.
What was the technique used in stochastic product demand planning? (E.g. statistical distribution, decision support tree, etc)
RQ2 In studies of demand planning in the supply chain, what are the challenges being faced in forecasting stochastic product demand
What challenges are being faced? How was the challenge addressed?
What outcomes were reported?
(e.g. positive/negative/neutral/other) who were the outcomes directed towards (e.g. researchers, industry, both) and what type of outcomes?
RQ3 In studies of demand planning in the supply chain, what research methods are used for forecasting stochastic product demand.
What methodologies were used? (e.g. Case study, action research, survey, observations, design science etc.)

229
To what extent and how were these methods empirically evaluated? (% of studies that state how the method was empirically chosen or evaluated e.g. “only 20% of studies evaluated the method they were using”)
DATA SYNTHESIS AND ANALYSIS
After completion of data extraction, we will aggregate the results to make them ready for further analysis. There will be two kinds of analysis we would perform; general and specific. For general analysis we would find out the following patterns in our results;
1. Frequency of publication in the following periods to assess the trend of investigation over the past 10 years (2008 – 2018)
2. Frequency of type of study (Research Methodology)
We do not have any prior plan for the type of analysis that we will apply to the results from diverse studies in our results. It is due to the fact that we are performing this Systematic Review for exploration. Therefore, the specific analysis technique will be decided once we have all the results available.
SLR ACTIVITY TIMELINE
Sr# Activity Dates Roles of Members Status 1 Protocol Development October Elias: Protocol Development
Didar: Protocol Development and Review
completed
2 Protocol Review and updates
February Didar: Final Review Mauneera Bano: External Review
completed
3 Protocol Review and Updates
February Elias: test search string and modify for each search engine
completed
4
Exec
utio
n
Primary Searches To be decided Elias: print off abstracts for primary searches
completed
Study selection To be decided Secondary Searches
To be decided
Data Extraction To be decided Quality Assessment
To be decided
Conflict Resolution
To be decided

230
Data Synthesis To be decided 4 Reporting (Technical
Report and conference/journal Paper)
To be decided To be decided
PILOT TESTING
Journal/Conference Search Through
Publisher Results
European Journal of Operational Research Abstract / Title Elsevier 100 International Journal of Production Economics Abstract / Title Elsevier 37 Journal of Management Abstract / Title Sage Publications 24 Journal of Operations Management Abstract / Title Elsevier 10 Journal of Forecasting Abstract / Title John Wiley & Sons, Inc. 25 International Journal of Project Management Abstract / Title Elsevier 7 Journal of International Management Abstract / Title Elsevier 8 Decision Support Systems Abstract / Title Elsevier 57 IEEE International Conference on Service Operations and Logistics, and Informatics (SOLI)
Abstract / Title IEEE 70
Total Results 338
REFERENCES
1. Kitchenham, B.A., D. Budgen, and P. Brereton, Evidence-based software engineering and
systematic reviews. Vol. 4. 2015: CRC Press.
2. Syntetos, A.A., et al., Supply chain forecasting: Theory, practice, their gap and the future.
European Journal of Operational Research, 2016. 252(1): p. 1-26.
3. Qifend Zhou, R.H.T.L., A Two-Step Dynamic Inventory Forecasting Model for Large
Manufacturing - IEEE Conference Publication, in 2015 IEEE 14th International Conference
on Machine Learning and Applications. 2015, IEEE: Miami, FL, USA.
4. Petropoulos, F., et al., ‘Horses for Courses’ in demand forecasting. European Journal of
Operational Research, 2014. 237(1): p. 152-163.
5. Biyu, Z.J., Forecasting Intermittent Demand Based on Grey Theory - IEEE Conference
Publication. 2009, IEEE: Changsha, Hunan, China.
6. Tanaka, K., A sales forecasting model for new-released and nonlinear sales trend
products. Expert Systems with Applications, 2010. 37(11): p. 7387-7393.
7. Louly, M.A., A. Dolgui, and F. Hnaien, Optimal supply planning in MRP environments for
assembly systems with random component procurement times. International Journal of
Production Research, 2008. 46(19): p. 5441-5467.
8. Kitaeva, A.V., et al., Demand Estimation for Fast Moving Items and Unobservable Lost
Sales**This work was supported by the Competitive Growth Program of the Tomsk State
University for 2013-2020 years. IFAC-PapersOnLine, 2016. 49(12): p. 598-603.
9. Ferbar Tratar, L., Forecasting method for noisy demand. International Journal of
Production Economics, 2015. 161(Supplement C): p. 64-73.

231
GLOSSARY
Noisy Demand: Unpredictable demand patterns expressed in probabilities
Stochastic: Having a random probability distribution or pattern that may be analysed statistically but may not be predicted precisely.
Cavitation: The formation of empty space or voids

232
Quality assessment criteria
The scoring on the quality assessment checklist was based on three possible answers to the questions; yes = 1, partial = 0.5 and no = 0. If any of the criteria did not apply to any study then it was excluded from evaluation. The studies that scored less than 50% in the quality assessment were excluded as they were not providing adequate information on the studies research methodology.
Generic Assessment No Question Possible Answer Q1 Are the aims clearly stated? Yes/No Q2 Are the study participants or observational units adequately
described? Yes/No/Partial
Q3 Was the study design appropriate for the research aim? Yes/No/Partial Q4 Are the data collection methods adequately described? Yes/No/Partial Q5 Are the statistical methods used to analyze the data properly
described and referenced? Yes/No
Q6 Are the statistical methods justified by the author? Yes/No Q7 Are negative findings presented? Yes/No/Partial Q8 Are all the study questions answered? Yes/No Q9 Do the researchers explain future implications? Yes/No
Survey Q1 Was the denominator (i.e. the population size) reported? Yes/No Q2 Did the author justify the sample size? Yes/No Q3 Is the sample representative of the population to which the
results will generalize? Yes/No
Q4 Have “dropouts” introduced biases on result limitation? Yes/No/Partial Experiment
Q1 Were treatments randomly allocated? Yes/No Q2 If there is a control group, are participants similar to the
treatment group participants in terms of variables that may affect study outcomes?
Yes/No
Q3 Could the lack of blinding introduce bias? Yes/No Q4 Are the variables used in the study adequately measured (i.e.
are the variables likely to be valid and reliable)? Yes/No
Case Study Q1 Is the case study context defined? Yes/No Q2 Are sufficient raw data presented to provide an understanding
of the case? Yes/No
Q3 Is the case study based on theory and linked to existing literature?
Yes/No
Q4 Are ethical issues addressed properly (personal intentions, integrity issues, consent, review board approval)?
Yes/No
Q5 Is a clear Chain of evidence established from observations to conclusions?
Yes/No/Partial

233
Appendix G. Systematic Literature Review Details According to the SLR guidelines, it is necessary to explicitly explain the planning and execution procedure of SLR to display the transparency and rigour of the process and make the results reliable and repeatable. In this appendix, the planning and execution of the systematic review are given for further information. G1. Systematic Literature Review Execution From our research question, we derived four major terms to be used for our search process: which included the following search words as shown in brackets: Forecasting (Forecast; Predicting; Predict), Product (Products; Stock Keeping Unit; SKU), Demand (Availability; Sales; Stochastic; Unknown; Noisy; Uncertain) and Supply Chain (Planning; Procurement; Inventory; Order; Orders). The first step in the execution of our method depicted in Figure 38 was performing a pilot search on Google scholar using our major terms. We retrieved a total of 303 papers in our step 1 results. The papers were scanned, and any relevant new terms were derived. We then derived our search string using Boolean AND/OR operators with our major and alternative terms.
ON ABSTRACT ((“Forecast*” OR “Predict*”) AND (“Product*” OR SKU” OR
“Stock Keeping Unit”) AND (“Demand” OR “Availability” OR “Sales” OR “Stochastic” OR “Noisy” OR “Unknown” OR “Uncertain”) AND (“Supply Chain” OR “Procurement” OR “Inventory” OR “Order*”, OR “Planning”))
The search string was used on relevant high ranked journals and conference proceedings11 for searching. The third author who is considered an expert in SCM supplied a list of top-ranked SCM Journals. For the primary search we executed the search string on selected specific resources, we retried a total of 338 papers in our results from step 2. We also applied a limit on the year during this primary search, we posed the limit between 2007 and 2018 to ensure we capture the most recent works on forecasting demand in the supply chain. Irrelevant papers that had been retrieved due to a poor search execution by online search engines were filtered out at step 3 of the SLR process. Any papers not in the English language and papers that were published before 2007 were excluded. We were left with 178 relevant papers.
11 Based on Australian CORE ranking core.edu.au

234
Figure 38 SLR process execution
In step 4 we read the full short-listed papers and performed a three-step quality assessment as follows:
Step 4.1: Quality of the study – The studies that have utilised poorly described research methods or have not used real data from the industry were filtered out. A decision was also made that any paper which used simulation with random data (not based on real data) did not meet the selection criteria and was excluded. Duplicate studies or studies that were not relevant to the supply chain or were Literature reviews, PhD or Masters theses were also excluded. We used the quality assessment checklist from SLR guidelines (see Appendix F). The quality assessment was not used for scoring or ranking but rather to filter out low-quality publications at the time of data extraction. All the papers that scored more than 50% were included in our review and all the others were excluded. For any differences, we had in selecting the appropriate literature the decision of the second author (Supervisor) was considered final.

235
Step 4.2: Quality of the publication outlet – For evaluating the quality of the outlet where the papers have been published, we utilized the ABDC (Australian Business Deans Council) ranking of 201612. ABDC is committed to review and ensure the quality list rankings of journals. The outlets where the selected papers were published may not necessarily indicate the quality of the paper itself. To ensure the quality of the included papers, we already have assessed them through the quality checklist as described above and provided in Appendix F. Step 4.3: Assessment of the impact of the paper – To assess the impact of the published papers, we checked their citations through Google Scholar. Out of 178 relevant papers, 54 remained, and 2 were excluded based on their low quality when evaluated against our quality assessment checklist (Appendix F). We were left with 52 empirical studies in Step 4. We then performed step 5 where we devised a secondary search strategy which included two steps to ensure that we do not miss any of the relevant studies. The secondary search strategy ensured the completeness of our results.
As part of Step 5 we performed a two-step secondary search and selection of studies as follows:
Step 5.1 of our secondary search was to complete a snowball scan on all the references in our selected studies. We scanned and reviewed all references that were cited greater than four times in our included studies. Using this snowballing approach, twelve articles were identified and added. The selected studies were applied to the same inclusion/exclusion criteria. However, in the screening process, they were found to be published before 2007 and had not provided any new and noteworthy insights that were not included in the selected studies of the last 10 years. Step 5.2 of our secondary search had a selection criterion to check the publication profiles of four authors who were cited in our selected studies 10 or more times for their work on forecasting uncertain demand. These authors are: Fildes, R, Syntetos, A. A, Gardner, E. S, and, Cachon, G.P. We scanned all their published papers (from 2007 onwards) and those that were eligible for consideration were treated with the same two-step study selection criteria described above. We retrieved a further 14 studies that were relevant and were not included in our primary search results, these studies were included in the final list. At the end of these two steps of secondary search strategy, we ended up with a total of 66 papers for our final inclusion.
G2. Results from Systematic Literature Review As part of the research methodology phase 3 of reporting results, in this section, we describe the quality characteristics extracted from the 66 empirical studies. Out of the 66 studies, 49 are from A* ranked journals from ABDC, which indicates we have an overall high-quality set of result. All the papers that have been included in our review were those that contained
12 www.abdc.edu.au/master-journal-list.php

236
sufficient information about the research method used and hence they scored above 50% in the quality assessment checklist provided in Appendix F. Out of the 66 papers, the average number of papers per years is 5.5 papers for the period chosen. The highest studies found were in 2015 followed by 2014 and 2007. Figure 39 shows an overall summary of the resultant studies by journal and year.
Figure 39 Publication by journal and year of resultant studies
It is important to note that 60 of the included studies (22 from Journal of Production Economics, 17 from the European Journal of Operational research, 13 from International Journal of Forecasting and 8 from Journal of Operations management), are published in high ranked outlets with highest impact factors for many years. Our collection of the 66 empirical studies contains 37 experiments, 14 case studies and 15 surveys, 35 have used a statistical method in the research method (Figure 40).
Figure 40 Research methodologies used in resultant studies
The percentages of research methods utilized in the included studies are experiments 56%, case studies 23%, survey 21%. From 2008 through to 2018 there is an average of 3 studies

237
that are using a mathematical method and almost all of them are of very high quality and are published in A+ ranked journals.
One-third of the 66 studies are from the United Kingdom (
Figure 41). Other countries with the most studies are the USA, France and the Netherlands.
Figure 41 Primary geographic location of resultant studies
ANALYSIS
Based on the 3-phase SLR research methodology discussed in chapter 3, we now provide our findings to answer the research questions based on the data extraction from our set of 66 studies and their analysis. We used Excel for coding, syntheses and analysis of the studies. First, we extracted all the forecasting methods, barriers in forecasting and the solutions adopted to address the barriers which were later used for classification and cross-analysis. Thematic coding was used for the barriers in forecasting and the solutions adopted to address these barriers to identify common themes. Firstly, internal and external categories were derived, and the barriers and solutions extracted from the studies were coded against them. We then further identified multiple themes focusing on internal and external classifications of barriers. Similar themes identified were synthesized and dimensions of the results were created to provide further depth of barriers by incrementally creating several dimensions. Dimensions are generally categorical data and have also been called a variable (Nickerson et al.'s, 2013). In this paper, we define our dimensions as the characteristics of the barriers faced and solutions adopted in forecasting uncertain product demand. We created 6 dimensions for internal barriers and 5 for external, there was only one common dimension between the two categories which is “technology”. All the barriers and solutions derived from the studies were then classified against a dimension.

238
The identification number of the studies were captured against each barrier, solution and method extracted, frequency analysis was then carried out against this coding. Data was extracted in excel on the methods supporting a solution and which barriers were addressed by the solutions extracted. This analysis allowed us to produce the relationships between the barriers, solutions and methods (chapter 2.4.1), as well as in coming up with the decision-making framework (chapter 2.4.3)

239
Appendix H. Results from Card sorting exercise The card sorting exercise was completed by all participants within the scheduled meeting. 36 cards were placed against the high priority, 24 medium and 15 low. The three blank cards provided were not used by any participants.
CRITERIA AND PRIORITIES
The participants were not given specific criteria to priorities the cards, the participants were only instructed to place the cards into one of the three priorities provided (high, medium & low priority). As depicted in Fig 3. the most used priority category by the participants (48%) was a high priority.
Fig. 3. Percentage of cards sorted against priority
Out of the 25 cards provided, 23 had at least one participant placing it in the high priority. Both cards number 13 “As a sales representative manager, I want better communication on product availability during the holiday periods so that I can communicate better with our customers.” and card number 19 “As a supply chain stakeholder, we need to restrict the customer exchange policy, so we don’t get caught up with old stock.” had no participants placing them in high priority. Using the unique number for each user story, Fig 4. Illustrates the total number of unique cards placed in each priority.
High48%
Medium32%
Low20%
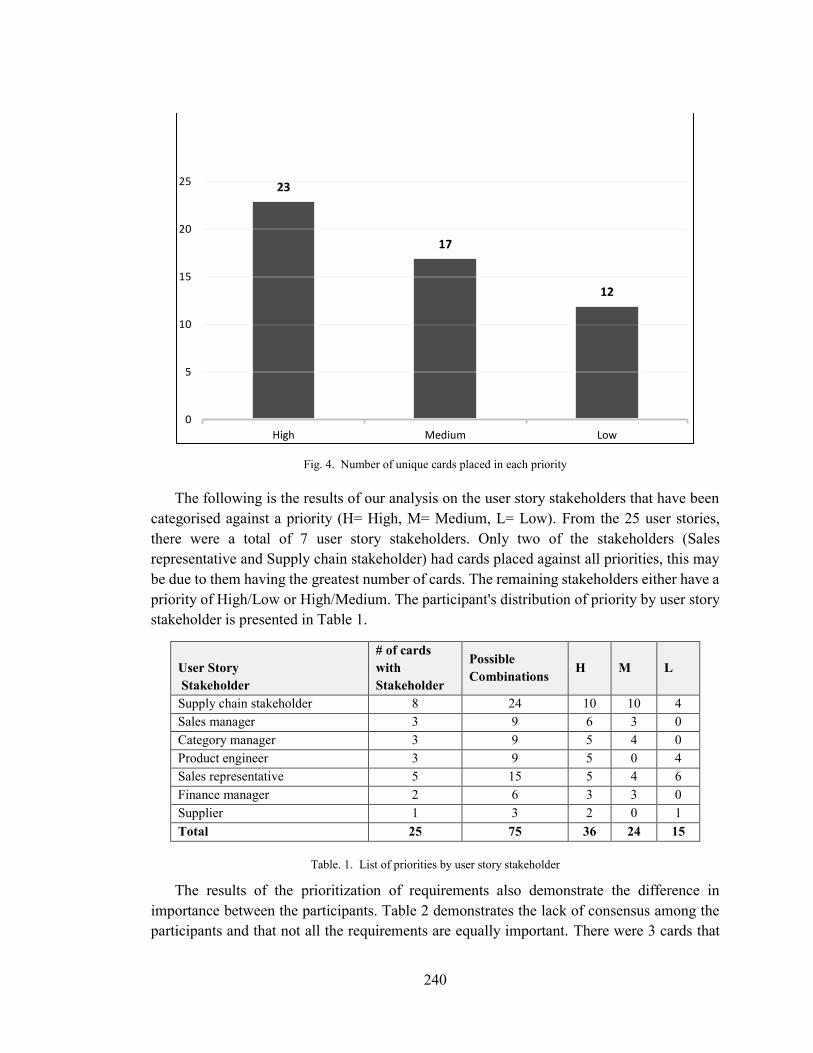
240
Fig. 4. Number of unique cards placed in each priority
The following is the results of our analysis on the user story stakeholders that have been categorised against a priority (H= High, M= Medium, L= Low). From the 25 user stories, there were a total of 7 user story stakeholders. Only two of the stakeholders (Sales representative and Supply chain stakeholder) had cards placed against all priorities, this may be due to them having the greatest number of cards. The remaining stakeholders either have a priority of High/Low or High/Medium. The participant's distribution of priority by user story stakeholder is presented in Table 1.
User Story Stakeholder
# of cards with Stakeholder
Possible Combinations
H M L
Supply chain stakeholder 8 24 10 10 4 Sales manager 3 9 6 3 0 Category manager 3 9 5 4 0 Product engineer 3 9 5 0 4 Sales representative 5 15 5 4 6 Finance manager 2 6 3 3 0 Supplier 1 3 2 0 1 Total 25 75 36 24 15
Table. 1. List of priorities by user story stakeholder
The results of the prioritization of requirements also demonstrate the difference in importance between the participants. Table 2 demonstrates the lack of consensus among the participants and that not all the requirements are equally important. There were 3 cards that
23
17
12
0
5
10
15
20
25
High Medium Low

241
had consensus among the participants, 2 cards (#4, #16) having all 3 participants categorizing them with high priority and 1 card (#19) with medium priority.
Card # H M L 4 3 - - 16 3 - - 19 - 3 -
Total Consensus 2 1 -
Table. 2 Total number of cards that had consensus

242
References ADEBANJO, D. 2009. Understanding demand management challenges in intermediary food
trading: a case study. Supply Chain Management: An International Journal, 14, 224-233. ADELMAN, C. 1993. Kurt Lewin and the Origins of Action Research. Educational Action Research,
1, 7-24. ALBARUNE, A. R. B. & HABIB, M. M. 2015. A study of forecasting practices in supply chain
management. 4, 55-61. ALI, M. M., BABAI, M. Z., BOYLAN, J. E. & SYNTETOS, A. A. 2017. Supply chain forecasting when
information is not shared. European Journal of Operational Research, 260, 984-994. ALI, M. M., BOYLAN, J. E. & SYNTETOS, A. A. 2012. Forecast errors and inventory performance
under forecast information sharing. International Journal of Forecasting, 28, 830-841. ANDERSON, C. 2010. Presenting and evaluating qualitative research. American journal of
pharmaceutical education, 74, 141-141. ANGKIRIWANG, R., PUJAWAN, I. N. & SANTOSA, B. 2014. Managing uncertainty through supply
chain flexibility: reactive vs. proactive approaches. Production & Manufacturing Research, 2, 50-70.
ARMSTRONG, J. & BRODIE, R. 2005. Forecasting for Marketing. University Library of Munich, Germany.
ARSHINDER, KANDA, A. & DESHMUKH, S. G. 2008. Supply chain coordination: Perspectives, empirical studies and research directions. International Journal of Production Economics, 115, 316-335.
BAECKE, P., DE BAETS, S. & VANDERHEYDEN, K. 2017. Investigating the added value of integrating human judgement into statistical demand forecasting systems. International Journal of Production Economics, 191, 85-96.
BARTEZZAGHI, E., VERGANTI, R. & ZOTTERI, G. 1999. A simulation framework for forecasting uncertain lumpy demand. International Journal of Production Economics, 59, 499-510.
BASU, P. & NAIR, S. K. 2014. A decision support system for mean–variance analysis in multi-period inventory control. Decision Support Systems, 57, 285-295.
BEARDSLEY, S. C., JOHNSON, B. C. & MANYIKA, J. M. 2006. Competitive advantage from better interactions.
BELALIA, Z. & GHAITI, F. The impact of three forecasting methods on the value of vendor managed inventory. 2016 3rd International Conference on Logistics Operations Management (GOL), 2016. 1-7.
BERGIN, J. 2001. Learning the Planning Game: an extreme exercise [Online]. Available: https://csis.pace.edu/~bergin/xp/planninggame.html [Accessed 01/10 2019].
BLATTBERG, R. C. & HOCH, S. J. 1990. Database models and managerial intuition: 50% model+ 50% manager. Management Science, 36, 887-899.
BLEDSOE, K. & GRAHAM, J. 2005. The Use of Multiple Evaluation Approaches in Program Evaluation. American Journal of Evaluation, 26, 302-319.
BOSE, T. K. 2012. Application of fishbone analysis for evaluating supply chain and business process-a case study on the St James Hospital. International Journal of Managing Value and Supply Chains (IJMVSC), 3, 17-24.
BOULAKSIL, Y. & FRANSES, P. H. 2009. Experts' Stated Behavior. INFORMS Journal on Applied Analytics, 39, 168-171.
BOWER, P. 2012. Integrated business planning: is it a hoax or here to stay? The Journal of Business Forecasting, 31, 11.

243
BROOKE, J. J. U. E. I. I. 1996. SUS-A quick and dirty usability scale. 189, 4-7. BROWN, R. G. Exponential smoothing for predicting demand. Operations Research, 1957. INST
OPERATIONS RESEARCH MANAGEMENT SCIENCES 901 ELKRIDGE LANDING RD, STE …, 145-145.
BRUSSET, X. 2016. Does supply chain visibility enhance agility? International Journal of Production Economics, 171, 46-59.
BRYMAN, A. 2012. Social research methods, Oxford; New York, Oxford University Press. C, W. H. 1992. Identity and Control: Structural Theory of Social Action. Princeton University Press. CAVUSOGLU, H., CAVUSOGLU, H. & RAGHUNATHAN, S. 2012. Value of and interaction between
production postponement and information sharing strategies for supply chain firms. Production and Operations Management, 21, 470-488.
CHANG, H.-J., HUNG, L.-P. & HO, C.-L. J. E. S. W. A. 2007. An anticipation model of potential customers’ purchasing behavior based on clustering analysis and association rules analysis. 32, 753-764.
CHAO, G. H. 2013. Production and availability policies through the Markov Decision Process and myopic methods for contractual and selective orders. European Journal of Operational Research, 225, 383-392.
CHEN-RITZO, C. H., ERVOLINA, T., HARRISON, T. P. & GUPTA, B. 2010. Sales and operations planning in systems with order configuration uncertainty. European Journal of Operational Research, 205, 604-614.
CHEN, I. J. & PAULRAJ, A. 2004. Understanding supply chain management: critical research and a theoretical framework. International Journal of Production Research, 42, 131-163.
CHRISTOPHER, M. 2000. The Agile Supply Chain. Industrial Marketing Management, 29, 37-44. CHRISTOPHER, M. 2004. Mitigating supply chain risk through improved confidence. International
Journal of Physical Distribution & Logistics Management, 34, 388-396. COHN, M. 2004. User stories applied: For agile software development, Addison-Wesley
Professional. COUNCIL, N. R. 1998. Statistics, Testing, and Defense Acquisition: New Approaches and
Methodological Improvements, Washington, DC, The National Academies Press. COX, J. E. & LOOMIS, D. G. 2006. Improving forecasting through textbooks — A 25 year review.
International Journal of Forecasting, 22, 617-624. COX, J. F. & BLACKSTONE, J. H. 2002. APICS dictionary, Amer Production & Inventory. CRESWELL, J. 2009. Research Design : Qualitative, Quantitative, and Mixed Methods Approaches
/ J.W. Creswell. CROSTON, J. D. 1972. FORECASTING AND STOCK CONTROL FOR INTERMITTENT DEMANDS.
Operational Research Quarterly, 23, 289-303. DANESE, P. & KALCHSCHMIDT, M. 2011a. The impact of forecasting on companies’ performance:
Analysis in a multivariate setting. International Journal of Production Economics, 133, 458-469.
DANESE, P. & KALCHSCHMIDT, M. 2011b. The role of the forecasting process in improving forecast accuracy and operational performance. International Journal of Production Economics, 131, 204-214.
DAVIS, A. M. & HICKEY, A. M. J. R. E. 2002. Requirements researchers: Do we practice what we preach? 7, 107-111.
DAVIS, D. F. & MENTZER, J. T. 2007. Organizational factors in sales forecasting management. International Journal of Forecasting, 23, 475-495.

244
DEMETER, K. 2014. Operating internationally - The impact on operational performance improvement. International Journal of Production Economics, 149, 172-182.
DIPIAZZA JR, S. A. & ECCLES, R. G. 2002. Building public trust: The future of corporate reporting, John Wiley & Sons.
DISNEY, S. M., MALTZ, A., WANG, X. & WARBURTON, R. D. H. 2016. Inventory management for stochastic lead times with order crossovers. European Journal of Operational Research, 248, 473-486.
DOUKIDIS, G. J. & VRECHOPOULOS, A. P. 2006. Consumer Driven Electronic Transformation. European Journal of Information Systems, 15, 108-108.
DU, J., MENG, Q. & ZHANG, H. The impact of lead time on supply risk based on multi-agent simulation. 2008 IEEE International Conference on Service Operations and Logistics, and Informatics, 12-15 Oct. 2008 2008. 2439-2444.
DUAN, Y., YAO, Y. & HUO, J. 2015. Bullwhip effect under substitute products. Journal of Operations Management, 36, 75-89.
DUBEY, R., ALTAY, N., GUNASEKARAN, A., BLOME, C., PAPADOPOULOS, T. & CHILDE, S. J. 2018. Supply chain agility, adaptability and alignment: Empirical evidence from the Indian auto components industry. International Journal of Operations & Production Management, 38, 129-148.
EKSOZ, C., MANSOURI, S. A. & BOURLAKIS, M. 2014. Collaborative forecasting in the food supply chain: A conceptual framework. International Journal of Production Economics, 158, 120-135.
FAWCETT, S. E., MAGNAN, G. M. & MCCARTER, M. W. 2008. Benefits, barriers, and bridges to effective supply chain management. Supply Chain Management: An International Journal, 13, 35-48.
FAWCETT, S. E., OSTERHAUS, P., MAGNAN, G. M., BRAU, J. C. & MCCARTER, M. W. 2007. Information sharing and supply chain performance: the role of connectivity and willingness. Supply Chain Management: An International Journal, 12, 358-368.
FERBAR TRATAR, L. 2015. Forecasting method for noisy demand. International Journal of Production Economics, 161, 64-73.
FILDES, R. & BEARD, C. 1992. Forecasting systems for production and inventory control. International Journal of Operations & Production Management, 12, 4-27.
FILDES, R. & GOODWIN, P. 2007. Against your better judgment? How organizations can improve their use of management judgment in forecasting. Interfaces, 37, 570-576.
FILDES, R., GOODWIN, P., LAWRENCE, M. & NIKOLOPOULOS, K. 2009. Effective forecasting and judgmental adjustments: an empirical evaluation and strategies for improvement in supply-chain planning. International Journal of Forecasting, 25, 3-23.
FINCHER, S. & TENENBERG, J. 2005. Making sense of card sorting data. Expert Systems, 22, 89-93.
FIRESMITH, D. 2004. Prioritizing requirements. Journal of Object Technology, 3, 35-48. FLINT, D. J. 2004. Strategic marketing in global supply chains: Four challenges. Industrial
Marketing Management, 33, 45-50. FRANSES, P. H. & LEGERSTEE, R. 2009. Properties of expert adjustments on model-based SKU-
level forecasts. International Journal of Forecasting, 25, 35-47. FRANSES, P. H. & LEGERSTEE, R. 2013. Do statistical forecasting models for SKU-level data benefit
from including past expert knowledge? International Journal of Forecasting, 29, 80-87. FREEMAN, L. A. J. J. O. I. S. E. 2020. Simulation and role playing with LEGO blocks. 14, 3.

245
FRITZ, M. & HAUSEN, T. 2009. Electronic supply network coordination in agrifood networks. Barriers, potentials, and path dependencies. International Journal of Production Economics, 121, 441-453.
FRØKJÆR, E., HERTZUM, M. & HORNBÆK, K. 2000. Measuring usability: Are effectiveness, efficiency, and satisfaction really correlated? Proceedings of CHI 2000, 345-352.
GERRARD, S. & DICKINSON, J. 2005. Women's working wardrobes: a study using card sorts. Expert Systems, 22, 108-114.
GIL-ALANA, L. A., CUNADO, J. & PEREZ DE GRACIA, F. 2008. Tourism in the Canary Islands: forecasting using several seasonal time series models. Journal of Forecasting, 27, 621-636.
GILL, T. G. & HEVNER, A. R. J. A. T. O. M. I. S. 2013. A fitness-utility model for design science research. 4, 1-24.
GOLDSMAN, D. 2007. Introduction to simulation. Proceedings of the 39th conference on Winter simulation: 40 years! The best is yet to come. Washington D.C.: IEEE Press.
GONZALEZ, R. A. & SOL, H. G. 2012. Validation and Design Science Research in Information Systems. In: MORA, M., GELMAN, O., STEENKAMP, A. & RAISINGHANI, M. S. (eds.) Research Methodologies, Innovations and Philosophies in Software Systems Engineering and Information Systems. IGI Global.
GOODWIN, P. 2002. Integrating management judgment and statistical methods to improve short-term forecasts. Omega, 30, 127-135.
GOODWIN, P. & FILDES, R. 1999. Judgmental forecasts of time series affected by special events: Does providing a statistical forecast improve accuracy? Journal of Behavioral Decision Making, 12, 37-53.
GOODWIN, P., FILDES, R., LAWRENCE, M. & NIKOLOPOULOS, K. 2007. The process of using a forecasting support system. International Journal of Forecasting, 23, 391-404.
GOVINDAN, K. 2015. The optimal replenishment policy for time-varying stochastic demand under vendor managed inventory. European Journal of Operational Research, 242, 402-423.
GREGOR, S. 2006. The Nature of Theory in Information Systems. MIS Quarterly, 30, 611-642. GRIMSON, A. & PYKE, D. 2007. Sales and operations planning: an exploratory study and
framework. The International Journal of Logistics Management, 18, 322-346. GUNASEKARAN, A. & NGAI, E. W. 2004. Information systems in supply chain integration and
management. European journal of operational research, 159, 269-295. GUTIERREZ, R. S., SOLIS, A. O. & MUKHOPADHYAY, S. 2008. Lumpy demand forecasting using
neural networks. International Journal of Production Economics, 111, 409-420. HANSEN, K. R. N. & GRUNOW, M. 2015. Planning operations before market launch for balancing
time-to-market and risks in pharmaceutical supply chains. International Journal of Production Economics, 161, 129-139.
HART, C. 1998. Doing a literature review : releasing the social science research imagination, London, Sage Publications.
HEAVIN, C. & POWER, D. J. 2018. Challenges for digital transformation – towards a conceptual decision support guide for managers. Journal of Decision Systems, 27, 38-45.
HEDRICK, T. E., BICKMAN, L. & ROG, D. J. 1993. Applied research design: A practical guide, Sage Publications.
HEINECKE, G., SYNTETOS, A. A. & WANG, W. 2013. Forecasting-based SKU classification. International Journal of Production Economics, 143, 455-462.

246
HELFERT, M., DONNELLAN, B. & OSTROWSKI, L. 2012. The Case for Design Science Utility and Quality - Evaluation of Design Science Artifact within the Sustainable ICT Capability Maturity Framework. Systems. Signs &Amp; Actions, 6, 46-66.
HEMMELMAYR, V., DOERNER, K. F., HARTL, R. F. & SAVELSBERGH, M. W. P. 2010. Vendor managed inventory for environments with stochastic product usage. European Journal of Operational Research, 202, 686-695.
HEVNER, A. 2007. A Three Cycle View of Design Science Research. Scandinavian Journal of Information Systems, 19.
HEVNER, A. & CHATTERJEE, S. 2010. Design Science Research in Information Systems. Design Research in Information Systems: Theory and Practice. Boston, MA: Springer US.
HEVNER, A. R., MARCH, S. T., PARK, J. & RAM, S. 2004. Design Science in Information Systems Research. MIS Quarterly, 28, 75-105.
HOLZINGER, A. 2005. Usability Engineering Methods For Software Developers. Commun. ACM, 48, 71-74.
HONG, C.-W. 2012. Using the Taguchi method for effective market segmentation. Expert Systems with Applications, 39, 5451-5459.
HOSSEINI, M., SHAHRI, A., PHALP, K. & ALI, R. 2018. Four reference models for transparency requirements in information systems. Requirements Engineering, 23, 251-275.
HSIEH, H.-F. & SHANNON, S. E. 2005. Three Approaches to Qualitative Content Analysis. Qualitative Health Research, 15, 1277-1288.
HSU, H.-M. & WANG, W.-P. 2004. Dynamic programming for delayed product differentiation. European Journal of Operational Research, 156, 183-193.
HUANG, T., FILDES, R. & SOOPRAMANIEN, D. 2014. The value of competitive information in forecasting FMCG retail product sales and the variable selection problem. European Journal of Operational Research, 237, 738-748.
HYNDMAN, R. J. & ATHANASOPOULOS, G. 2018. Forecasting: principles and practice, OTexts. IGWE, C. 2004. Review: Standardizing Usability Metrics Into a Single Score. IIVARI, J. 2015. Distinguishing and contrasting two strategies for design science research.
European Journal of Information Systems, 24, 107-115. IIVARI, J. & VENABLE, J. 2009. Action research and design science research - Seemingly similar but
decisively dissimilar. JAMIL, G. L. 2013. Approaching Market Intelligence Concept through a Case Analysis: Continuous
Knowledge for Marketing Strategic Management and its Complementarity to Competitive Intelligence. Procedia Technology, 9, 463-472.
JESPER, K. & PATRIK, J. 2017. Context-based sales and operations planning (S&OP) research: A literature review and future agenda. International Journal of Physical Distribution & Logistics Management, 0, null.
KAIPIA, R., KORHONEN, H. & HARTIALA, H. 2006. Planning nervousness in a demand supply network: An empirical study.
KARLSSON, J. & RYAN, K. 1997. A cost-value approach for prioritizing requirements. IEEE software, 14, 67-74.
KEMPF, K. G., KESKINOCAK, P. & UZSOY, R. 2018. International Series in Operations Research & Management Science.
KENT, A. 2002. Encyclopedia of library and information science. Vol. 71 Vol. 71, New York, Dekker. KESKINOCAK, P. & UZSOY, R. 2011. Planning Production and Inventories in the Extended
Enterprise.

247
KITCHENHAM, B., AL-KHILIDAR, H., BABAR, M. A., BERRY, M., COX, K., KEUNG, J., KURNIAWATI, F., STAPLES, M., ZHANG, H. & ZHU, L. 2006. Evaluating guidelines for empirical software engineering studies. Proceedings of the 2006 ACM/IEEE international symposium on Empirical software engineering. Rio de Janeiro, Brazil: Association for Computing Machinery.
KITCHENHAM, B. A. & CHARTERS, S. 2007. Guidelines for performing Systematic Literature Reviews in software engineering. EBSE Technical Report EBSE-2007-01.
KJELLSDOTTER, I. L., ISKRA, D.-P., ANNA, F., C., D. H. & RIIKKA, K. 2015. Contingency between S & OP design and planning environment. International Journal of Physical Distribution & Logistics Management, 45, 747-773.
KRISHNAN, T. V., FENG, S. & BEEBE, T. 2011. Modeling the demand and supply in a new B2B-upstream market using a knowledge updating process. International Journal of Forecasting, 27, 1160-1177.
KRUEGER, R. A. 2014. Focus groups: A practical guide for applied research, Sage publications. KUMRU, M. & KUMRU, P. Y. 2014. Using artificial neural networks to forecast operation times in
metal industry. International Journal of Computer Integrated Manufacturing, 27, 48-59. KWOK-WOON, L. & SIEWIOREK, D. P. Functional Testing of Digital Systems. 20th Design
Automation Conference Proceedings, 27-29 June 1983 1983. 207-213. L. FISHER, M. & D. ITTNER, C. 1999. The Impact of Product Variety on Automobile Assembly
Operations: Empirical Evidence and Simulation Analysis. L. LEE, H., PADMANABHAN, V. & WHANG, S. 2004. Information Distortion in a Supply Chain: The
Bullwhip Effect. LAPIDE, L. 2001. A simple approach for short product lifecycle forecasting. The Journal of Business
Forecasting, 20, 18. LAURENT LIM, L., ALPAN, G. & PENZ, B. 2014. Reconciling sales and operations management with
distant suppliers in the automotive industry: A simulation approach. International Journal of Production Economics, 151, 20-36.
LAWRENCE, M., GOODWIN, P., O'CONNOR, M. & ÖNKAL, D. 2006. Judgmental forecasting: A review of progress over the last 25 years. International Journal of forecasting, 22, 493-518.
LAWRENCE, M., O'CONNOR, M. & EDMUNDSON, B. 2000. A field study of sales forecasting accuracy and processes. European Journal of Operational Research, 122, 151-160.
LAZAR, J., FENG, J. H. & HOCHHEISER, H. 2017. Chapter 10 - Usability testing. In: LAZAR, J., FENG, J. H. & HOCHHEISER, H. (eds.) Research Methods in Human Computer Interaction (Second Edition). Boston: Morgan Kaufmann.
LEE, H. L. & TANG, C. S. 1997. Modelling the Costs and Benefits of Delayed Product Differentiation. Management Science, 43, 40-53.
LEEDY, P. D. & ORMROD, J. E. 2005. Practical research : planning and design. LEHTOLA, L., KAUPPINEN, M. & KUJALA, S. Requirements prioritization challenges in practice.
International Conference on Product Focused Software Process Improvement, 2004 Heidelberg. Springer, 497-508.
LI, Y., XU, X., ZHAO, X., YEUNG, J. H. Y. & YE, F. 2012. Supply chain coordination with controllable lead time and asymmetric information. European Journal of Operational Research, 217, 108-119.
LIN, Y., SHAOCHUAN, F., YUN, W. & YUQING, F. Application of Grey Jump Model to forecast fluctuating inventory demand. 2008 IEEE International Conference on Service Operations and Logistics, and Informatics, 12-15 Oct. 2008 2008. 1209-1214.

248
LUKKA, K. 2003. The Constructive Research Approach. LYNCH, J., MASON, R. J., BERESFORD, A. K. C. & FOUND, P. A. 2012. An examination of the role
for Business Orientation in an uncertain business environment. International Journal of Production Economics, 137, 145-156.
MA, S., FILDES, R. & HUANG, T. 2016. Demand forecasting with high dimensional data: The case of SKU retail sales forecasting with intra- and inter-category promotional information. European Journal of Operational Research, 249, 245-257.
MACGREGOR, D. G. 2001. Decomposition for judgmental forecasting and estimation. Principles of forecasting. Springer.
MAIDEN, N. 2009. Card Sorts to Acquire Requirements. IEEE Software, 26, 85-86. MAIDEN, N. A. M. & RUGG, G. 1996. ACRE: selecting methods for requirements acquisition.
Software Engineering Journal, 11, 183-192. MAKRIDAKIS, S., WHEELWRIGHT, S. C. & HYNDMAN, R. J. 1998. Forecasting Methods and
Applications. 3rd ed. New York: John Wiley & Sons. MARCH, S. & SMITH, G. 1995. Design and Natural Science Research on Information Technology. MARSH, L. & FLANAGAN, R. 2000. Measuring the costs and benefits of information technology in
construction. Engineering Construction and Architectural Management, 7, 423-435. MARTIN, J. H. & GRBAC, B. 2003. Using supply chain management to leverage a firm's market
orientation. Industrial Marketing Management, 32, 25-38. MASON, S., H. COLE, M., T. ULREY, B. & YAN, L. 2002. Improving Electronics Manufacturing Supply
Chain Agility Through Outsourcing. MCDONALD, M., CHRISTOPHER, M. & BASS, M. 2003. Market segmentation. Marketing: a
complete guide. London: Macmillan Education UK. MCKNIGHT, D. H., CHERVANY, N. L. & HUMPHREY, H. H. THE MEANINGS OF TRUST. 2000. MIAO, X. & XI, B. 2008. Agile forecasting of dynamic logistics demand. Transport, 23, 26-30. MIN, S. & MENTZER, J. T. 2000. The role of marketing in supply chain management. International
journal of physical distribution & logistics management, 30, 765-787. MIN, S., ROATH, A. S., DAUGHERTY, P. J., GENCHEV, S. E., CHEN, H., ARNDT, A. D. & GLENN
RICHEY, R. 2005. Supply chain collaboration: what's happening? The International Journal of Logistics Management, 16, 237-256.
MOISIADIS, F. The fundamentals of prioritising requirements. Proceedings of the systems engineering, test and evaluation conference (SETE’2002), 2002.
MOLLENKOPF, D. A., FRANKEL, R. & RUSSO, I. 2011. Creating value through returns management: Exploring the marketing-operations interface. Journal of Operations Management, 29, 391-403.
MOORE, G. E. 1965. Cramming more components onto integrated circuits. McGraw-Hill New York, NY, USA:.
MORGAN, D. L. 1988. Focus groups as qualitative research, Thousand Oaks, CA, US, Sage Publications, Inc.
MOSER, P., ISAKSSON, O. H. D. & SEIFERT, R. W. 2017. Inventory dynamics in process industries: An empirical investigation. International Journal of Production Economics, 191, 253-266.
NENES, G., PANAGIOTIDOU, S. & TAGARAS, G. 2010. Inventory management of multiple items with irregular demand: A case study. European Journal of Operational Research, 205, 313-324.
NENNI, M. E., GIUSTINIANO, L. & PIROLO, L. 2013. Demand Forecasting in the Fashion Industry: A Review. International Journal of Engineering Business Management, 5, 37.

249
NEWMAN, D. & LOGAN, D. 2006. Governance is an essential building block for enterprise information management. Gartner Research, Stamford, CT, 4.
NICKERSON, R. C., VARSHNEY, U. & MUNTERMANN, J. 2013. A method for taxonomy development and its application in information systems. European Journal of Information Systems, 22, 336-359.
NOROOZI, S. & WIKNER, J. 2017. Sales and operations planning in the process industry: A literature review. International Journal of Production Economics, 188, 139-155.
OATES, C. J. & ALEVIZOU, P. J. 2017. Conducting focus groups for business and management students, Sage.
OLIVA, R. & WATSON, N. 2011. Cross-functional alignment in supply chain planning: A case study of sales and operations planning. Journal of Operations Management, 29, 434-448.
PALMER III, R. C. Assessing information alignment in production organizations. Proceedings of the Human Factors and Ergonomics Society Annual Meeting, 2007. SAGE Publications Sage CA: Los Angeles, CA, 981-985.
PARMAR, V., SHAH, H. J. I. J. O. E. D. & RESEARCH 2016. A literature review on supply chain management barriers in manufacturing organization. 4, 2321-9939.
PATEL, P. C. & JAYARAM, J. 2014. The antecedents and consequences of product variety in new ventures: An empirical study. Journal of Operations Management, 32, 34-50.
PEFFERS, K., ROTHENBERGER, M., TUUNANEN, T. & VAEZI, R. 2012. Design Science Research Evaluation In: K. PEFFERS, M. ROTHENBERGER & KUECHLER, B. (eds.) Design Science Research in Information Systems: Advances in Theory and Practice. Springer-Verlag Berlin Heidelberg.
PETROPOULOS, F., FILDES, R. & GOODWIN, P. 2016a. Do 'big losses' in judgmental adjustments to statistical forecasts affect experts' behaviour? European Journal of Operational Research, 249, 842-852.
PETROPOULOS, F. & KOURENTZES, N. 2014. Improving forecasting via multiple temporal aggregation. Foresight: The International Journal of Applied Forecasting, 2014, 12-17.
PETROPOULOS, F., KOURENTZES, N. & NIKOLOPOULOS, K. 2016b. Another look at estimators for intermittent demand. International Journal of Production Economics, 181, 154-161.
PETROPOULOS, F., MAKRIDAKIS, S., ASSIMAKOPOULOS, V. & NIKOLOPOULOS, K. 2014. ‘Horses for Courses’ in demand forecasting. European Journal of Operational Research, 237, 152-163.
PETROPOULOS, F., WANG, X. & DISNEY, S. M. 2019. The inventory performance of forecasting methods: Evidence from the M3 competition data. International Journal of Forecasting, 35, 251-265.
PETTICREW, M. & ROBERTS, H. 2008. Systematic reviews in the social sciences: A practical guide, John Wiley & Sons.
PEZESHKI, Y., BABOLI, A., CHEIKHROUHOU, N., MODARRES, M. & AKBARI JOKAR, M. R. 2013. A rewarding-punishing coordination mechanism based on Trust in a divergent supply chain. European Journal of Operational Research, 230, 527-538.
PORRAS, E. & DEKKER, R. 2008. An inventory control system for spare parts at a refinery: An empirical comparison of different re-order point methods. European Journal of Operational Research, 184, 101-132.
POULIN, M., MONTREUIL, B. & MARTEL, A. 2006. Implications of personalization offers on demand and supply network design: A case from the golf club industry. European Journal of Operational Research, 169, 996-1009.

250
PRAT, N., COMYN-WATTIAU, I. & AKOKA, J. 2014a. Artifact Evaluation in Information Systems Design Science Research - A Holistic View. In 18th Pacific Asia Conference on Information Systems (PACIS2014). Chengdu, China.
PRAT, N., WATTIAU, I. & AKOKA, J. 2014b. Artifact Evaluation in Information Systems Design Science Research ? A Holistic View. Proceedings - Pacific Asia Conference on Information Systems, PACIS 2014.
PRIES-HEJE, J., BASKERVILLE, R. & VENABLE, J. 2008a. Strategies for Design Science Research Evaluation.
PRIES-HEJE, J., BASKERVILLE, R. & VENABLE, J. R. 2008b. Strategies for Design Science Research Evaluation. Proceedigns of the 16th European Conference on Information Systems (ECIS 2008). Galway, Ireland.
QI, Y., HUO, B., WANG, Z. & YEUNG, H. Y. J. 2017. The impact of operations and supply chain strategies on integration and performance. International Journal of Production Economics, 185, 162-174.
RAHMAN, S. & SUBRAMANIAN, N. 2012. Factors for implementing end-of-life computer recycling operations in reverse supply chains. International Journal of Production Economics, 140, 239-248.
REHMAN, T., KHAN, M. N. A. & RIAZ, N. 2013. Analysis of requirement engineering processes, tools/techniques and methodologies. International Journal of Information Technology and Computer Science (IJITCS), 5, 40.
REN, Y., YANG, D. & DIAO, X. 2010. Market segmentation strategy in internet market. Physica A: Statistical Mechanics and its Applications, 389, 1688-1698.
RICHARD E. CRANDALL, W. R. C. C. C. C. 2018. Principles of Supply Chain Management, Second Edition.
RICHARDS, L. 2014. Handling qualitative data: A practical guide, Sage. RICHARDS, L. & MORSE, J. M. 2012. README FIRST for a User's Guide to Qualitative Methods,
SAGE Publications. ROSEMANN, M. & VOM BROCKE, J. 2015. The six core elements of business process
management. Handbook on business process management 1. Springer. RUGG, G. & MCGEORGE, P. 2005. The sorting techniques: a tutorial paper on card sorts, picture
sorts and item sorts. Expert Systems, 22, 94-107. SAATY, T. L. 1988. What is the analytic hierarchy process? Mathematical models for decision
support. Springer. SAMSET, K. & CHRISTENSEN, T. 2017. Ex Ante Project Evaluation and the Complexity of Early
Decision-Making. Public Organization Review, 17, 1-17. SANDERS, N. R. & MANRODT, K. B. 2003. The efficacy of using judgmental versus quantitative
forecasting methods in practice. Omega, 31, 511-522. SAURO, J. & KINDLUND, E. 2005. Making Sense of Usability Metrics: Usability and Six Sigma. SCHULTZE, U. & AVITAL, M. 2011. Designing interviews to generate rich data for information
systems research. Information and Organization, 21, 1-16. SEIN, M., HENFRIDSSON, O., PURAO, S., ROSSI, M. & LINDGREN, R. 2011. Action Design Research.
MIS Quarterly, 35, 37-56. SHAH, N. 2004. Pharmaceutical supply chains: key issues and strategies for optimisation.
Computers & Chemical Engineering, 28, 929-941. SHANG, J., TADIKAMALLA, P. R., KIRSCH, L. J. & BROWN, L. 2008. A decision support system for
managing inventory at GlaxoSmithKline. Decision Support Systems, 46, 1-13.

251
SHRESTHA, A., CATER-STEEL, A. & TOLEMAN, M. 2014. How to Communicate Evaluation Work in Design Science Research? An Exemplar Case Study. 25th Australasian Conference on Information Systems (ACIS). Auckland, New Zealand.
SHUKLA, M. & JHARKHARIA, S. 2013. Agri‐fresh produce supply chain management: a state‐of‐the‐art literature review. International Journal of Operations & Production Management, 33, 114-158.
SHULL, F., SINGER, J. & SJØBERG, D. I. K. 2007. Guide to Advanced Empirical Software Engineering, Springer-Verlag.
SIGALA, M. 2007. RFID Applications for Integrating and Informationalizing the Supply Chain of Foodservice Operators. Journal of Foodservice Business Research, 10, 7-29.
SIM, J. & WATERFIELD, J. 2019. Focus group methodology: some ethical challenges. Quality & Quantity, 53, 3003-3022.
SINGH, H. J. O. E., AVAILABLE AT: HTTP://WWW. SUPPLYCHAIN. COM/WHITEPAPERS/PDF/COLLAB ORATIVEFORECASTING. PDF 2002. Collaborative forecasting.
SLAGMULDER, R., GROTTOLI, D. & CORSTEN, D. 2003. Sainsbury's (A): transforming the supply chain.
SNYDER, R. D., ORD, J. K. & BEAUMONT, A. 2012. Forecasting the intermittent demand for slow-moving inventories: A modelling approach. International Journal of Forecasting, 28, 485-496.
SONNENBERG, C. & BROCKE, J. V. 2012. Evaluation Patterns for Design Science Research Artefacts.
SPENCER, D. 2004. Card Sorting: A Definitive Guide - Boxes and Arrows. . STANCZYK, A., CATALDO, Z., BLOME, C. & BUSSE, C. 2017. The dark side of global sourcing: a
systematic literature review and research agenda. International Journal of Physical Distribution & Logistics Management, 47, 41-67.
STANDARDIZATION, I. T. I. O. F. 2013. ISO/TS 20282-2: 2013 (en). Usability of consumer products and products for public use—Part 2: Summative test method.
STEWART, D. W. & SHAMDASANI, P. N. 2014. Focus groups: Theory and practice, Sage publications.
STRAUSS, A. & CORBIN, J. 1998. Basics of qualitative research: Techniques and procedures for developing grounded theory, 2nd ed, Thousand Oaks, CA, US, Sage Publications, Inc.
SUN, Y., KANTOR, P. B. J. J. O. T. A. S. F. I. S. & TECHNOLOGY 2006. Cross‐Evaluation: A new model for information system evaluation. 57, 614-628.
SWAFFORD, P. M., GHOSH, S. & MURTHY, N. 2008. Achieving supply chain agility through IT integration and flexibility. International Journal of Production Economics, 116, 288-297.
SYNTETOS, A. A., BABAI, M. Z., DAVIES, J. & STEPHENSON, D. 2010a. Forecasting and stock control: A study in a wholesaling context. International Journal of Production Economics, 127, 103-111.
SYNTETOS, A. A. & BOYLAN, J. E. 2001. On the bias of intermittent demand estimates. International Journal of Production Economics, 71, 457-466.
SYNTETOS, A. A. & BOYLAN, J. E. 2005. The accuracy of intermittent demand estimates. International Journal of Forecasting, 21, 303-314.
SYNTETOS, A. A., KHOLIDASARI, I. & NAIM, M. M. 2016. The effects of integrating management judgement into OUT levels: In or out of context? European Journal of Operational Research, 249, 853-863.
252
SYNTETOS, A. A., NIKOLOPOULOS, K. & BOYLAN, J. E. 2010b. Judging the judges through accuracy-implication metrics: The case of inventory forecasting. International Journal of Forecasting, 26, 134-143.
SYNTETOS, A. A., NIKOLOPOULOS, K., BOYLAN, J. E., FILDES, R. & GOODWIN, P. 2009. The effects of integrating management judgement into intermittent demand forecasts. International Journal of Production Economics, 118, 72-81.
SYNTETOS, A. A., ZIED BABAI, M. & GARDNER, E. S. 2015. Forecasting intermittent inventory demands: simple parametric methods vs. bootstrapping. Journal of Business Research, 68, 1746-1752.
TANG, C. S. 2006. Robust strategies for mitigating supply chain disruptions. International Journal of Logistics Research and Applications, 9, 33-45.
TASHMAN, L. J. & HOOVER, J. 2001. Diffusion of forecasting principles through software. Principles of Forecasting. Springer.
THERNØE, C., SKJOETT‐LARSEN, T. & ANDRESEN, C. 2003. Supply chain collaboration: Theoretical perspectives and empirical evidence. International Journal of Physical Distribution & Logistics Management, 33, 531-549.
THOMÉ, A. M. T., SCAVARDA, L. F., FERNANDEZ, N. S. & SCAVARDA, A. J. 2012. Sales and operations planning: A research synthesis. International Journal of Production Economics, 138, 1-13.
THOMÉ, A. M. T., SOUSA, R. S. & SCAVARDA DO CARMO, L. F. R. R. 2014. The impact of sales and operations planning practices on manufacturing operational performance. International Journal of Production Research, 52, 2108-2121.
TRAPERO, J. R., KOURENTZES, N. & FILDES, R. 2012. Impact of information exchange on supplier forecasting performance. Omega, 40, 738-747.
TRAPERO, J. R., PEDREGAL, D. J., FILDES, R. & KOURENTZES, N. 2013. Analysis of judgmental adjustments in the presence of promotions. International Journal of Forecasting, 29, 234-243.
TREMBLAY, M. C., HEVNER, A. R. & BERNDT, D. J. J. C. 2010. Focus groups for artifact refinement and evaluation in design research. 26, 599-618.
TROCHIM, W. M. 2020. Research methods knowledge base. TULLIS, T. & ALBERT, B. 2013. Chapter 3 - Planning. In: TULLIS, T. & ALBERT, B. (eds.) Measuring
the User Experience (Second Edition). Boston: Morgan Kaufmann. TUOMIKANGAS, N. & KAIPIA, R. 2014. A coordination framework for sales and operations
planning (S&OP): Synthesis from the literature. International Journal of Production Economics, 154, 243-262.
TURILLI, M. & FLORIDI, L. 2009. The ethics of information transparency. Ethics and Information Technology, 11, 105-112.
UDENIO, M., FRANSOO, J. C. & PEELS, R. 2015. Destocking, the bullwhip effect, and the credit crisis: Empirical modeling of supply chain dynamics. International Journal of Production Economics, 160, 34-46.
UPCHURCH, L., RUGG, G. & KITCHENHAM, B. 2001. Using card sorts to elicit web page quality attributes. IEEE Software, 18, 84-89.
VAN DER AUWERAER, S., BOUTE, R. & SYNTETOS, A. 2017. Forecasting Spare Part Demand with Installed Base Information: A Review.
VANPOUCKE, E., VEREECKE, A. & WETZELS, M. 2014. Developing supplier integration capabilities for sustainable competitive advantage: A dynamic capabilities approach. Journal of Operations Management, 32, 446-461.

253
VARMA, T. N. & KHAN, D. 2015. Information technology and e-risk of supply chain management. VENABLE, J., PRIES-HEJE, J. & BASKERVILLE, R. A Comprehensive Framework for Evaluation in
Design Science Research. 2012a Berlin, Heidelberg. Springer Berlin Heidelberg, 423-438. VENABLE, J., PRIES-HEJE, J. & BASKERVILLE, R. 2012b. A comprehensive framework for evaluation
in design science research. Proceedings of the 7th international conference on Design Science Research in Information Systems: advances in theory and practice. Las Vegas, NY: Springer-Verlag.
VEREECKE, A., VANDERHEYDEN, K., BAECKE, P. & VAN STEENDAM, T. 2018. Mind the gap – Assessing maturity of demand planning, a cornerstone of S&OP. International Journal of Operations & Production Management, 38, 1618-1639.
WADHWA, S., SAXENA, A. & CHAN, F. T. S. 2008. Framework for flexibility in dynamic supply chain management. International Journal of Production Research, 46, 1373-1404.
WAGNER, S. M., ULLRICH, K. K. R. & TRANSCHEL, S. 2014. The game plan for aligning the organization. Business Horizons, 57, 189-201.
WALLACE, T. F. 2004. Sales and operations planning: the how-to handbook, TF Wallace & Co. WALLACE, T. F. 2008. Sales and Operations Planning: The How-To Handbook, Steelwedge
Software. WANG, C.-H. J. E. S. W. A. 2010. Apply robust segmentation to the service industry using kernel
induced fuzzy clustering techniques. 37, 8395-8400. WANG, J., JIA, J. & TAKAHASHI, K. 2005. A study on the impact of uncertain factors on information
distortion in supply chains. Production Planning & Control, 16, 2-11. WEBBY, R., O'CONNOR, M. & EDMUNDSON, B. 2005. Forecasting support systems for the
incorporation of event information: An empirical investigation. International Journal of Forecasting, 21, 411-423.
WEBSTER, J. & WATSON, R. 2002. Webster and Watson literature review. MIS Quarterly, 26. WEMMERLÖV, U. & WHYBARK, D. C. 1984. Lot-sizing under uncertainty in a rolling schedule
environment. International Journal of Production Research, 22, 467-484. WENDE, K. 2007. A model for data governance-Organising accountabilities for data quality
management. ACIS 2007 Proceedings, 80. WHANG, M. 2008. Card-Sorting Usability Tests of the WMU Libraries’ Web Site. Journal of Web
Librarianship, 2, 205-218. WIEGERS, K. E. 2003. Software Requirements, Microsoft Press. WIERINGA, R. 2009. Design science as nested problem solving. Proceedings of the 4th
International Conference on Design Science Research in Information Systems and Technology. Philadelphia, Pennsylvania: Association for Computing Machinery.
WIERINGA, R. J. R. E. 2005. Requirements researchers: are we really doing research? 10, 304-306.
WILLIAMSON, O. E. J. T. J. O. L. & ECONOMICS 1993. Calculativeness, trust, and economic organization. 36, 453-486.
WINKLHOFER, H. & DIAMANTOPOULOS, A. J. I. J. O. F. 2003. A model of export sales forecasting behavior and performance: development and testing. 19, 271-285.
WORTHEN, B. 2003. Future Results Not Guaranteed; Contrary to what vendors tell you, computer systems alone are incapable of producing accurate forecasts. CIO, 1-1.
YELLAND, P. M. 2010. Bayesian forecasting of parts demand. International Journal of Forecasting, 26, 374-396.

254
YIAKOPOULOS, C., GRYLLIAS, K. C. & ANTONIADIS, I. A. J. E. S. W. A. 2011. Rolling element bearing fault detection in industrial environments based on a K-means clustering approach. 38, 2888-2911.
YURKIEWICZ, J. J. O. T. 2003. Forecasting software survey. 30, 34-46. ZIED BABAI, M., SYNTETOS, A. & TEUNTER, R. 2014. Intermittent demand forecasting: An
empirical study on accuracy and the risk of obsolescence. International Journal of Production Economics, 157, 212-219.
ZIMMERMAN, D. & AKERELREA, C. 2002. A group card sorting methodology for developing informational Web sites.
ZOWGHI, D. & COULIN, C. 2005. Requirements Elicitation: A Survey of Techniques, Approaches, and Tools. In: AURUM, A. & WOHLIN, C. (eds.) Engineering and Managing Software Requirements. Berlin, Heidelberg: Springer Berlin Heidelberg.
ZOWGHI, D. & NURMULIANI, N. A study of the impact of requirements volatility on software project performance. Ninth Asia-Pacific Software Engineering Conference, 2002., 4-6 Dec. 2002 2002. 3-11.