Investor First Name Investor Middle Name Investor Last Name ...
ARTICLE IN PRESS
0301-4215/$ - se
doi:10.1016/j.en
�Tel.: +31-5
E-mail addr
Energy Policy 34 (2006) 461–480
www.elsevier.com/locate/enpol
Support systems for the diffusion of renewable energy technologies—an investor perspective
Valentina Dinica�
Center for Clean Technology and Environmental Policy, University of Twente, P.O. Box 217, 7500 AE, Enschede, The Netherlands
Available online 10 August 2004
Abstract
Concern over climate change impacts and the projected depletion of fossil fuels has urged more governments to adopt policies that
stimulate the diffusion of renewable energy technologies (RET). With an increasingly diverse suite of support instruments, the
question emerges as to which instruments or combinations are able to achieve faster, more substantial diffusion results. Although
various support instruments were extensively addressed in policy studies, there is still no consensus. This is partly because many
policy studies take a policy-maker approach in comparing support instruments, leaving relationships between policy design and
policy results as a black box. This paper proposes an investor-oriented perspective to analyze the diffusion potential of support
systems for RET. The main argument is that it is not the type of support instrument but rather its risk/profitability characteristics
that influence investor behavior and the rate of diffusion. The two instruments most frequently discussed and compared are the feed-
in-tariff and the quota model. The analysis in this paper concludes that policy design is crucial: while often feed-in tariffs are
applauded and quota system feared, feed-in tariffs may also bring about disappointing diffusion results when poorly designed while
quota systems may be also conceived as attractive instruments for independent power producers.
r 2004 Elsevier Ltd. All rights reserved.
Keywords: Renewable energy technologies; Diffusion; Policy risks
1. Introduction
The use of renewable energy resources for electricitygeneration has many advantages compared to fossil fuelor nuclear energy. Renewable resources are indigenous,no/low cost and contribute to the diversification of theenergy resource basis. This significantly increases thesecurity of supply, taking into account the political risksand expected depletion of fossil fuel. Additionally,renewable energy resources reduce environmental andhuman health impacts and are the only types of energycurrently available that respond to the compellingchallenge of sustainable development.
However, currently, the generation of electricity basedon renewable energy technologies (RET) is more
e front matter r 2004 Elsevier Ltd. All rights reserved.
pol.2004.06.014
3-489-4171; fax: +31-53-489-4850.
ess: [email protected] (V. Dinica).
expensive than the conventional technologies usingfossil fuels, large hydropower and nuclear energy. Thereare three main groups of reasons on which the economicand financing obstacles rest. Firstly, the methods usedfor the cost assessment of energy projects are inap-propriate. Awerbuch (1996, 2003a) argues that theaccounting and financial assessment methods used bytraditional engineering economics for electricity projectsare outdated, making renewable energy technologyprojects appear more expensive. The use of standardfinance models accounting would produce differentresults. Engineers and planners use arbitrary discountrates for fuel costs and operating expenses in calculatingthe levelized electricity generating costs, while not takinginto account the financial risks associated with the costsof electricity projects (Awerbuch, 2003a), leading to asystematic overestimation of the costs of renewable-based electricity. Awerbuch (2003b) estimates that usingmarket risk adjusted textbook finance theories results in
ARTICLE IN PRESSV. Dinica / Energy Policy 34 (2006) 461–480462
generation costs for gas-based generation plants in therange of 60–100% higher than currently considered. Heargues that risk-based methods based on the CapitalAsset Pricing Model would produce more realistic costassessments for RET for electricity generation (RET-E),with the consequence of reducing or even eliminating theeconomic obstacle. Another reason why RET-E appearmore expensive is suggested by Wright (2002), arguingthat that for conventional electricity technologies ‘‘theadditional infrastructure costs required for large con-ventional power projects such as transmission anddistribution lines, and pipeline infrastructure for naturalgas, is often not factored into the overall costs’’.However, they are always included in total investmentcosts per kW for RET-E.
Secondly, the failure to internalize the external costsof electricity generation from conventional technologiesis largely responsible for the persistence of the costdifference with RET. The costs of the environmentaland human health impacts of fossil-based and nucleartechnologies are not reflected in the electricity produc-tion costs. There are serious methodological difficultiesin establishing full range and scale of consequences offossil fuels and nuclear energy use. Thirdly, fossil-based,nuclear and large hydropower technologies have beenheavily subsidized for decades. In spite of the privatiza-tion and/or liberalization of electricity industries inmany industrialized countries, fuel subsidies from publicbudgets or from consumers’ bills are still maintained.With the liberalization of electricity industries duringthe 1990s in many industrialized countries, the electricityprice has lowered and is expected to continue to decreasein short-term. This raises the magnitude of the economicobstacle for RET-E. However, governments in manycountries are still interested to support RET-E, in viewof the many benefits it clearly brings in electricityproduction.
However, countries differ both in their levels ofambition for the greening of electricity supply and theirpreferences for support schemes. In the EuropeanUnion, these differences were reflected in the debatepreceding the adoption of the 77/2001 Directive onRenewable Electricity. After years of dialogue, MemberStates could not agree on a common framework forRET support (Lauber, 2002). The 77/2001 Directivestated that due to limited experience with nationalschemes, it would be premature to decide on aCommunity-wide framework regarding supportschemes. The European Council decided to assess thediffusion results of national support schemes at the endof 2005 and eventually propose a common framework.In this context, assessment of RET-E installed capacitypotential represented by various support systems has re-emerged as an important question at the top of theagendas of researchers and policy-makers. This paperaddresses this crucial issue.
This paper argues that current analyses in thepolicy literature of the diffusion potential of varioustypes of support instruments have some short-comings. The description and analysis of supportsystems is not sufficiently helpful for understandingthe consequences for the extent of diffusion. Classifica-tions and analyses of support instruments’ character-istics are mainly made from the perspective ofpolicy-makers. The way financial aspects of supportsystems are described is also not sufficiently suggestivewith regard to attracting potential investors. Policy-makers, analysts and advisers should be askingquestions such as: To what extent are policy instrumentsable to unlock the financial resources of potentialinvestors? Would investors be confident enough tocommission larger plants and elaborate long-terminvestment strategies, which aggregate at industry levelsto create prospects for targeted increases in renewableenergy capacity? Would they rather invest strategicallyin small-size power plants and/or in projects using old-and-tested design technologies, leading to more incre-mental progress in the greening of electricity supply?The paper proposes a different way of analyzinggovernmental support for the market introduction anddiffusion of RET-E, addressing economic and financingbarriers of such technologies. Taking an investorperspective on the analysis of support systems con-tributes to the academic discussion as it helps open theblack box between policy design and policy results. Italso enables policy-makers to perform ex ante analysisof the diffusion potential of policy proposals for RET-Esupport frameworks.
The paper starts with a discussion in Section 2 ofthe analytical perspectives currently dominatingstudies on the diffusion potential of policy instrumentsthat address the economic and financing obstaclesof renewable energy production. In Section 3, I presenta policy analysis approach that uses investors asthe central unit of analysis for diffusion potential.This consists of a combined assessment of the risks facedby investors under the applicable support systems, andthe profitability potential for investments in RET-Eprojects.
Section 4 may be regarded as central to this paper:here I suggest a framework for the risk analysis ofsupport systems. The profitability of investments is avariable that may be straightforwardly assessed withmethods available in economics. The issue of riskassessment is more challenging. This section suggests acode for translating policy language into investorlanguage. In Section 5, I explain the assertion that theanalysis of support instruments from the risk–profit-ability perspective is more fruitful in understanding thechances and rhythm of installed capacity growth ofRET-E. Section 6 concludes this paper with a series ofpolicy recommendations.
ARTICLE IN PRESS
1The report Financing Renewable Energy Systems studied the
financing of five renewable technologies—solar thermal, photovoltaic,
wind, hydropower and biomass systems—in Austria, Denmark,
Germany, Italy, the Netherlands, Spain, Sweden and the United
Kingdom (Langniss, 1999).
V. Dinica / Energy Policy 34 (2006) 461–480 463
2. Configurations of support systems and approaches in
analyzing them
In this paper, I define ‘support system’ as the entirecollection of support instruments applicable to enablethe market introduction and continuous diffusion ofRET-E. This takes place in a certain setting—usually acountry—at a certain time, for the removal of two typesof barriers facing RET-E: the economic barrier (or‘expensiveness’) and financing barriers (or the difficultyof obtaining project finance loans or the interest ofequity investors). A support system may consist of asingle support instrument (e.g. a production subsidy),but most often a support system is made up of severalinstruments. Support systems are often dynamic, asgovernments phase-in and out various instruments dueto changing goals, learning effects or budgetaryconsiderations.
Governments in industrialized countries used a largevariety of support instruments during the 1980s and the1990s to stimulate the adoption of RET-E. Thediversification of instruments increased since the mid-1990s, mainly as result of electricity industries’ liberal-ization and the national policies for climate changemitigation. Configuration diversity poses a significantchallenge for policy analysts, especially regarding theapproach when describing support systems used indifferent countries and/or in different periods of time.While in many cases support systems often have in theirconfiguration a prominent instrument that can beviewed as the backbone of the support system, in somecases an array of support instruments is used, theinteraction of which alters the incentive framework toinvest in RET compared to an incentive embedded inthe ‘core’ instrument alone. So far, researchers andmarket/policy analysts describing or evaluating supportsystems for RET-T implemented in various countrieshave used very different ways of describing andcategorizing them (for a detailed typology see Dinica,2003, pp. 19–33; also Ackermann et al., 2001). One ofthe most frequently used typologies is that differentiat-ing between price-based models—or feed-in-tariffs,versus quota/quantity models of support (e.g. Haaset al., 2004; Hvelplund, 2001; Menanteau et al., 2003;Lauber, 2004; Meyer, 2003; Huber et al., 2002;ECN, 2002b).
Two important comments need to be made regardingmost currently used policy analysis approaches andtypologies. First, they do not incorporate the aspect ofthe extent of financial support offered by the supportinstruments or the configurations of support systemsclassified as such. The extent of price support is at leastequally important for investors as the type of instrumentit comes from. Details on the extent of financial supportare present in numerous country surveys on renewablespolicy and market results. They look at the prices per
kWh guarantees or price ranges possible under thesupport instruments described, as well as at thepercentages of investment subsidies and/or tax reductionapplicable to groups of project owners or types of RET-E plants. But since the quality, availability anddistribution of renewable resources differ among coun-tries, these indicators are not satisfactory in assessingand comparing the extent of financial support indifferent countries. Two countries may offer the sameprice support for a certain type of RET-E. However, dueto differences in the quality of resources—and often alsodifferences in the institutional context with conse-quences for financing and permitting/administrativecosts—the production costs incurred by RET-E gen-erators may be largely different. This would result indifferent diffusion patterns with consequences for thediffusion results in the two countries with the sameextent of price support. It would be more desirable toanalyze the extent of financial support with the help ofan indicator that dispenses of the cost impacts of somany exogenous factors.
Second, there is the issue of risks facing RET-Einvestors, and the relationship between risks andreturns. There is one stream of the policy literature,which addresses—to various extends—the issue of thefinancial risks induced by specific types of supportinstruments (e.g. Lemming, 2003; Rader and Wiser,1999; Wiser and Pickle, 1997; Helm, 2002; Kahn, 1996;Menanteau et al., 2003; KPMG, 1999; Langniss, 1999;Harris and Navarro, 2000; Mitchell, 1994). Many ofthem refer to the risk premiums for project financeloans, attracted by instruments that pose high risks inRET-E projects. However, only rarely do analyseselaborate further on the consequences of supportinstrument’ risks for the investment behavior of devel-opers. Mostly the issue of likelihood of market entry isaddressed, while some studies refer also to the type ofeconomic actors likely to enter the market. Similarly, thetheoretical expectations regarding (changes in) diffusionpotential are vague, whenever considered. Studies thatlooked at and compared the diffusion potential of feed-in and quota models have done so mainly empirically.
Several studies have looked into the issue ofconsequences of various types of risks and levels ofreturn for the diffusion patterns of RET-E. A prominentexample is a research project analyzing the prevailingfinancing schemes, constraints and financing parametersof renewable energy projects in eight European coun-tries, which also looked in the empirical case studies atthe motivation driving project owners (Langniss, 1999).1

ARTICLE IN PRESSV. Dinica / Energy Policy 34 (2006) 461–480464
The study proposes a typology of financing schemesdifferentiating between private finance, corporate fi-nance, project finance, participation finance and third-party finance. In describing the key features of each typeof financing scheme and the main findings regardingtheir use in the eight countries, the report also mentionsthe (range of) motivations that developers using eachfinancing scheme are likely to have. This way, invest-ments were observed to be ‘‘not economical in businessterms’’ or having ‘‘an appearance of environmentalconcern and public acceptability’’, ideologically moti-vated or fostering RET-E through track-record build-ing. This research project highlights empirical findingsregarding the relation between types of financingschemes, project sizes in terms of total investment costsper project, and the legal ownership form of project. Asimilarly interesting study was carried out by Mitchell(1994), who analyses the types of financing schemes,types of project developers and project sizes (also interms of total investment costs) for the United Kingdomunder the first two rounds of the Non-Fossil FuelObligation. A quite similar approach but with a less in-depth treatment was taken in the study in supportinstruments and financing mechanisms of the EnergyTechnology Support Unit of the British Department ofTrade and Industry (ETSU, 1996), covering 24 coun-tries. Such approaches are very fruitful in developinginsights into the likely diffusion potential of varioussupport instruments.
This brings into discussion a second stream of theliterature that contributes to the study of RET-Ediffusion: a series of financial-economics studies regard-ing investment options and strategies for energyprojects. For them the unit of analysis is generally nota support instrument or a particular regulatory frame-work, but an energy project/technology, seen in themany dimensions of the context in which it is developed.Some studies regard energy projects in general (e.g.Hines, 1997; Islas and Jeronimo, 2001; Jechoutek andLamech, 1995; Bond and Carter, 1995; Dunkerley, 1995;Churchill, 1995; David and Wong, 1994), while othersrefer to RET-E projects in particular (e.g. Welp andSchimana, 2002; Awerbuch, 2000, 2003a; Ingersoll et al.,1998; Gish, 1999; Mendis, 1997; Gregory, 1997;Langniss, 1999). They address the financial risks forRET-E projects in general, that is beyond the risksassociated with support instrument(s), and offer pre-cious insight into how investors and project developersanalyze the risks associated with different investmentstrategies. For example, Awerbuch (2000) discusses therisks and costs of investing in photovoltaics and howinvestors make decisions on technology choice andproject size (by means of loan size), as compared toother investment opportunities in the energy field orother fields. He brings to attention the fact that thecurrent use by investors and lenders of traditional
energy valuation models undervalue photovoltaic tech-nology. This technology and other RET-E are capitalintensive but they pose lower risks on costs than fossilfuels. He encourages lenders and investors to use aportfolio cost approach in assessing technology andproject options. This way ‘‘PV, which ‘costs more’ servesto reduce the cost of a fossil-generating portfolio at anygiven level of risk’’ (Awerbuch, 2000, p. 1026).
Merging the insights from the economic-financingstream of the literature with those developed in thepolicy literature stream would be most beneficial forunderstanding what underlies diffusion results and howcould governments design and fine-tune comprehensivepolicy packages—addressing the wide range of obstaclesto RET-E, to support the sustained adoption of RET-Eamong investors.
3. A risk–profitability approach to analyze support
systems
The investment behavior of project developers and theattitude of financing agents toward RET-E investmentsare to large extent shaped by the risks on projects’returns. But they are also influenced by the profitabilityof projects. As most RET-E are more expensive thanconventional electricity generation systems they have tocompete with—due to reasons discussed in Section 1,support instruments are used to enable investments.These should be able to at least cover the cost-gaps, andallow developers to yield some profit on their invest-ment. I propose to describe and analyze the supportsystems addressing the economic and financing barriersof RET-E adoption in terms of two characteristics:
�
aggregated risks on the economic feasibility andprofitability of RET-E projects emerging from thesupport instruments used and their interaction, and�
range of project profitability that emerges from allsupport instruments that investors are eligible to usefor the production of RET-E electricity, next to theeventual income from marketing the generatedelectricity on the market.This approach also has the advantage of parsimony,keeping in mind the diversity and complexity of supportsystems encountered in practice, as well as the countlessconfigurations that could be conceived through thecombination of support instruments.
The choice to characterize support systems in terms oflevel of risks for the economic feasibility and profit-ability of RET-E projects is motivated by the impor-tance of knowing what types of economic actors asupport system is likely to attract and whether tradi-tional financing agents in the country in question wouldbe willing to support the sustained diffusion of RET-E.

ARTICLE IN PRESS
3‘‘Equity’’ is a term used in financing literature to refer to the cash
payments made by project developers, while ‘loan’ or ‘debt’ are the
terms referred for the payments made by financing agents—commer-
cial banks, saving banks/funds, pension funds, insurance companies.
This does not exclude financing agents providing equity to finance
projects.4In addition to the internal rate of return on projects, both
theoretical and empirical studies discuss the internal rate of return
for equity investors. In order to avoid confusion, we use the terms
V. Dinica / Energy Policy 34 (2006) 461–480 465
Different types of economic actors have differentrequirements with regard to risk on project returns.Some are more flexible than others, but higher riskinvestment contexts require higher profits. Traditionalfinancing agents—such as commercial banks, pensionfunds, saving funds and so on—also have specific risklevel requirements. Generally they tend to be more riskadverse than project developers.
Support instruments could, intently or not, pose riskson project returns, which could discourage certain typesof economic and financing actors from the business ofRET-E electricity production. But risks on projectreturns are also influenced by other variables as well.Guidelines and empirical literature for power plantinvestment advise developers of electricity generationprojects to carefully scrutinize the following types ofrisks before taking the decision to invest: resourcequality, availability and cost risks, technology risks,construction risks, planning approval risks, environ-mental impact risks (i.e. impacts or pollution beyondthat permitted by competent authorities), interest raterisks, currency exchange risks, operation risks, institu-tional and other regulatory risks2 (Ingersoll et al., 1998;Pollio, 1998; Bond and Carter, 1995; Hines, 1997,pp. 189–209; Welp and Schimana, 2002; Jechoutekand Lamech, 1995; Rose et al., 1997; Islas andJeronimo, 2001).
Financing agents look at a range of risks thatencompasses that of project developers. This rangeincludes the credit worthiness of project developers,to the extent to which their financial reserves andmarket-valuable assets are sufficient for the reimburse-ment of loans when project returns decrease belowthe limit of economic viability. In addition to projectrisks and company characteristics, financing agentsalso look at industry characteristics such asindustry structure, economics, maturity and stability(Finnerty, 1996). Industry characteristics also influenceboth the timing of project developers to enter themarket and its detailed investment plans. Although theexistence and reliability of a contract for electricitypurchase and price risks are at the core of the investmentdecisions, these other risks and considerations men-tioned significantly influence the decision to invest andthe particularities of project development plans. I arguethat support system risks are important bridges avail-able for understanding the relationship between supportsystem design and investors’ decisions to finance RET-Eprojects.
Regarding the second characteristic—the range ofprojects’ profitability—its selection is motivated by theneed to measure the extent of financial backing offered
2In this category, Langniss (1999) mention among others: generally
applicable tax regulations, environmental, economic and energy
policies, aspects of administrative culture.
by support systems. With this, comparisons can be madebetween countries and, even at the same time, acrosstypes of renewable technologies. This characteristicoffers a second bridge between the design of supportsystems and investors’ decisions to finance RET-Eprojects. This indicator is suggestive for the attractive-ness of support systems for project developers andfinancing agents. Project profitability is an economicindicator for power plants that incorporates both theinterest rate required by the financing agent (when loansare used) and the profits of project owners/developers,referred to in the financing literature as returns onequity.3
I label ‘project profitability’ what in the financing andeconomic literature is often referred to as the ‘internalrate of return’ of projects.4 Projects’ returns have toallow for the payment of debt to the financing agent, therecovery of equity investments by project developer/owner, the payment of operation and maintenance costs,fuel costs (when necessary), taxes and other fees such asland rents and insurance. They also have to allow for thepayment of interest rates on debt to financing agents andfor equity returns to project owners. These last twovariables constitute the basis for calculating project’sprofitability in the form of a rate.5 Very roughly therelationship between project returns and project gainscan be represented as below.
project returns ¼ ðdebt reimbursement payments
þ equity recovery paymentÞ
ðþoperating=maintenance costs
þ fuel costsþ taxes
þ other regular fees=expensesÞ
þ project gains: (1)
Project gains are understood here as representing thesum of the total amount to be paid in the form ofinterest rates to loan financiers and the total amount tobe paid in the form of equity returns to the equityinvestors of the project.
project gains ¼ total amount paid as interest rate
þ total amount paid as returns on equity: (2)
‘project profitability’ and ‘equity returns’.5See Hadley et al. (1993) for a more detailed discussion on
profitability with specifications for renewable power investments in
the USA by different types of economic actors, with different tax
obligations.
ARTICLE IN PRESSV. Dinica / Energy Policy 34 (2006) 461–480466
By arranging different types of financing schemes,project developers may end up with different possiblelevels of project gains. Project profitability is not anamount but a rate. In the financial structure of theproject, loan will contribute with a share of Y% onwhich the loan financier requires a certain interest rate,and equity will contribute with a share of Z% of totalproject costs on which investors will require a certainequity return. When no bank loans are used to financethe project (Z ¼ 100%), then the project profitability isthe same with the return on equity, since the projectowner is the only financing agent. Simply stated
project profitability ¼ ½Y% of total project costs�
�½interest rate in %�
þ ½Z% of total project costs�
�½equity returns in %� ð%Þ: (3)
The financial structure of projects, the interest ratelevel and the equity returns requirement are stronglyinfluenced by the risks to which the RET-E project isexposed, including risks associated with the supportsystem.
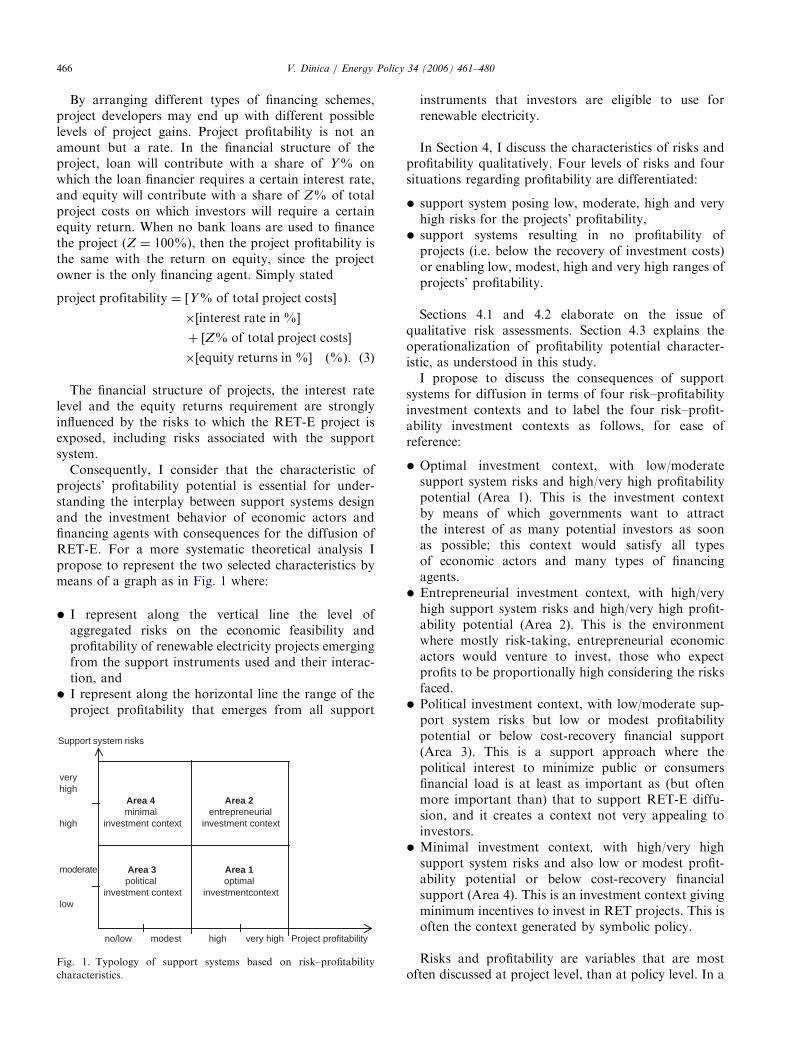
Consequently, I consider that the characteristic ofprojects’ profitability potential is essential for under-standing the interplay between support systems designand the investment behavior of economic actors andfinancing agents with consequences for the diffusion ofRET-E. For a more systematic theoretical analysis Ipropose to represent the two selected characteristics bymeans of a graph as in Fig. 1 where:
�
Su
vehi
hi
m
lo
Fig
ch
I represent along the vertical line the level ofaggregated risks on the economic feasibility andprofitability of renewable electricity projects emergingfrom the support instruments used and their interac-tion, and
�
I represent along the horizontal line the range of theproject profitability that emerges from all supportpport system risks
rygh
Area 4 Area 2minimal entrepreneurial
gh investment context investment context
oderate Area 3 Area 1political optimal
investment context investmentcontextw
no/low modest high very high Project profitability
. 1. Typology of support systems based on risk–profitability
aracteristics.
instruments that investors are eligible to use forrenewable electricity.
In Section 4, I discuss the characteristics of risks andprofitability qualitatively. Four levels of risks and foursituations regarding profitability are differentiated:
�
support system posing low, moderate, high and veryhigh risks for the projects’ profitability,�
support systems resulting in no profitability ofprojects (i.e. below the recovery of investment costs)or enabling low, modest, high and very high ranges ofprojects’ profitability.Sections 4.1 and 4.2 elaborate on the issue ofqualitative risk assessments. Section 4.3 explains theoperationalization of profitability potential character-istic, as understood in this study.
I propose to discuss the consequences of supportsystems for diffusion in terms of four risk–profitabilityinvestment contexts and to label the four risk–profit-ability investment contexts as follows, for ease ofreference:
�
Optimal investment context, with low/moderatesupport system risks and high/very high profitabilitypotential (Area 1). This is the investment contextby means of which governments want to attractthe interest of as many potential investors as soonas possible; this context would satisfy all typesof economic actors and many types of financingagents.�
Entrepreneurial investment context, with high/veryhigh support system risks and high/very high profit-ability potential (Area 2). This is the environmentwhere mostly risk-taking, entrepreneurial economicactors would venture to invest, those who expectprofits to be proportionally high considering the risksfaced.�
Political investment context, with low/moderate sup-port system risks but low or modest profitabilitypotential or below cost-recovery financial support(Area 3). This is a support approach where thepolitical interest to minimize public or consumersfinancial load is at least as important as (but oftenmore important than) that to support RET-E diffu-sion, and it creates a context not very appealing toinvestors.�
Minimal investment context, with high/very highsupport system risks and also low or modest profit-ability potential or below cost-recovery financialsupport (Area 4). This is an investment context givingminimum incentives to invest in RET projects. This isoften the context generated by symbolic policy.Risks and profitability are variables that are mostoften discussed at project level, than at policy level. In a

ARTICLE IN PRESSV. Dinica / Energy Policy 34 (2006) 461–480 467
certain national investment context, individual projectsmay be able to yield different levels of profitability (e.g.due to differences resource quality, permitting costs, inthe financing arrangements such as interest rates anddebt-to-equity ratio), while the specific aspects sur-rounding a project (such as resource environmentalregulations, technological design used, etc.) may exposeprojects to different overall investment risks. The policyanalysis approach proposed here acknowledges thatsome individual projects may have substantial differ-ences in risk–profitability profiles. Nevertheless, itmaintains that at national level it could be able to tracea range of investment risks associated with the supportsystem and a range of project profitability that arerepresentative for the majority of projects commissionedand/or potential investors.
Support system risk is one of the many types ofrisks investors take into account when deciding theextent of their (financial) commitment to the RET-Eindustry and the particularities of their investmentplans—project size, nature of projects: strategic/commercial/self-generation, choice of technologicaldesign innovativeness and type of financing scheme.However, there are indications in empirical studiesdocumenting investment decisions—available in thespecialized national and international (renewable)energy journals—that both instrument risks and theextent of price support hold powerful explanatorypower for the diffusion patterns and results. Section 4proposes a framework for the analysis of risksassociated with the support instruments used toencourage RET-E adoption.
6The label ‘strategic instruments’ is used here simply to refer to all
policy instruments that are not included in the direct arrangements for
the trade of electricity from renewable energy resources—meant as
physical streams of electricity and/or the ‘greenness’ of RET-E by
means of tradable green certificates. These instruments can have
consequences for trade patterns and power purchase price indirectly by
means of: direct financial support, improving the accessibility to
financing resources and/or improving the market position of RET-E.
However, it is analytically very useful to differentiate between two
components of support systems, as done in Table 1, in order to more
systematically investigate where the various types of risks on investors,
where they originate and how they interact. The labels themselves are
here not as important as the purpose they serve for analysis.
4. Analysis of support system from the risk perspective
This section proposes a framework for the analysis ofthe risks for investors, emerging from the design ofsupport systems. Support systems pose risks to inves-tors, which are ultimately political risks, in thatinstruments or their details could change duringprojects’ economic lifetime, lowering the profitabilitypotential, or making them no longer economicallyfeasible. But to some extent they can be also marketrisks when certain price or trade aspects are left fornegotiations between buyers and sellers of RET-Eelectricity. I adopt the view on risks of Megill (1988),who argues that risk refers to an opportunity of loss.From the perspective of support systems, risks can beseen as the likelihood of not getting a certain targetedprofitability on projects. Under the theoretical assump-tion that no other risks affect the project except forthose associated with the support system, the overallpossibility of failing to receive the targeted projectprofitability for a RET-E project could be qualitativelydescribed as outcome of a series of possibilities, each
representing a design element in the support system. Forexample:
�
the possibility of failing to ensure demand for RET-Eelectricity purchase;�
the possibility of failing to have the purchase contractrenewed, or to find contracts on the free market at all,when no governmental guarantee on demand isoffered;�
the possibility that the price per kWh in the tradearrangements will change (more than expected at themoment of investment);�
the possibility that the application of each (addi-tional) support instrument—next to the protectedtrade arrangements—will be prematurely terminatedor substantially reduce the financial support offered.The overall chance of success for a project can be thenapproximated as the product of the underlying negativepossibilities taken into account.
I propose to analyze support systems’ risks bydistinguishing between the trade component and thestrategic-instruments component6 of support systems.The elements proposed for the analysis of the twocomponents are shown in Table 1. The trade componentrefers to the forms of support that directly concern tradearrangements for RET-E electricity or tradable greencertificates (TGCs). Trade could rely on governmentallyguaranteed demand for RET-E electricity. In this case,regulations are usually rooted in the legal framework forthe organization and functioning of the electricitysector—the electricity law and/or accompanying gov-ernmental or ministerial regulations. The regulatoryframework specifies one or more of the followingelements: how much electricity will be purchased fromeach RET-E generator and/or at company level and/orindustry level, for how long, at what prices, and how theprices are calculated and changed. The availability andtype of governmentally guaranteed purchase of RET-Eelectricity, the availability of a contract for electricitypurchase, the length and reliability of that contract(whenever contracts are also regulated), as well as thepredictability and reliability of the price for purchase areall crucial factors for the decision of economic and

ARTICLE IN PRESS
Table 1
Risk analysis of support systems
Trade arrangements
Elements Characteristics/forms
Type of demand for purchase of RET-E electricity Guaranteed purchase for individual RET-E plants:
Unlimited purchase
Limited purchase
Quota purchase at industry level. Trade flexibility:
With tradable green certificates
Without tradable green certificates
Contractual relations for ‘Guaranteed purchase for individual RET-E
plants’
Contract duration
Availability of options for extension of purchase after termination of
contract
Quantity
Price design for ‘Guaranteed purchase for individual RET-E plants’ Price components
Method of price calculation
Price types
Decisions mechanism
Strategic instruments
Target Types
Direct financial/price support Investment subsidies
Production subsidies
Direct fiscal incentives
Financing accessibility Soft loans
Governmental guarantee on project loan
Project aggregation programs
Third party financing
Improved market position Indirect fiscal incentives
V. Dinica / Energy Policy 34 (2006) 461–480468
financing actors to invest in RET-E projects. I proposeto describe trade arrangements in terms of threeelements: type of demand, contractual parameters, whenalso part of instrument design, and price. The analysis ofthe forms of these elements leads to the assessment ofdemand risks, contract risks and price risks associatedwith trade arrangements. Together they form the traderisks of the support system.
The ‘strategic-instruments’ component of supportsystems may include instruments such as those men-tioned in Table 1. They refer to the forms of interventionthat:
�
improve the economics of RET-E projects; instru-ments such as, investment subsidies, productionsubsidies not incorporated in trade arrangements,and direct fiscal incentives, could be introduced eitherin parallel with some form of governmentallyguaranteed trade arrangement for RET-E electricity,or as unique instruments to enable the profitability ofRET-E projects;�
contribute directly to the reduction of financingbarriers; such instruments are soft loan schemes,governmental guarantees on project loans, third-party financing by a public agency, project ag-gregation programs whereby the government pro-cures a large loan that is subsequently dividedamong small investors; further, instruments can beused that;
�
improve the market position of RET-E, in terms ofinvestors and/or consumer choice between renewableand conventional energy technologies; examples hereare the indirect fiscal incentives such as electricityconsumption taxes, or taxes on the carbon content ofenergy resources.4.1. Design of governmentally supported trade
arrangements
4.1.1. Types of demand and demand risks
I differentiate among two commonly used typesof demand for RET-E electricity purchase, fromthe perspective of potential investors, as mentioned inTable 1. The first type is that of governmentally
guaranteed purchase for individual RET-E plants.This can be designed in the forms of unlimited purchaseguarantee or limited purchase guarantee. In thefirst case, regulations oblige electricity companies tobuy RET-E electricity from any generator locatedin its region of licensed operation. The purchaseobligation holds for unlimited amounts of electricityproduced by eligible RET-E plants. When such a

ARTICLE IN PRESS
7For an interesting analysis of contractual prices and price risks see
Comnes et al. (1995, pp. 15–28).
V. Dinica / Energy Policy 34 (2006) 461–480 469
type of demand is guaranteed in the law, demand risksare low.
The limited purchase guarantee for individual RET-Eplants can be implemented as an obligation to buy onlya limited volume of electricity from each generationplant (e.g. the electricity produced in the first 20,000hours of plant operation). Investments under this typeof demand are attractive mainly for the types ofdevelopers, technologies and sites where the costs andrequired profitability can be recovered through theelectricity volumes with a guaranteed purchase. Anotherscheme that has been used is to guarantee RET-Eelectricity purchase for a specified contract duration, forexample 8 years as it was practiced in Italy based onLaw No. 9/91 of January 1991 jointly with CIPProvision No. 6/92 of April 1992, or 5 years as it hasbeen so far in Spain based on Royal Decrees 2366/1994and 2818/1998. Under this type of demand, the analysisof demand risks basically merges with the analysis ofcontract risks (see below). For technologies usingintermittent resources, the risks under such type ofguarantee may be higher, the shorter contracts arebecause of the possibility of insufficient electricityproduction during the respective period to recover theinvestment costs. This is due to poor predictability ofsome intermittent sources (such as wind and small-hydropower resources). Consequently, there is the riskthat project returns received on the base of thesecontracts cannot cover investment costs, variable costsand still ensure minimum levels of profitability in theperiod available. However, under both forms of limitedpurchase guarantee it is possible that after the termina-tion of the guaranteed purchase, even if returns lower,projects still have an overall profitability that satisfiesthe owners.
The second type of demand is very different from theprevious ones and refers to quota purchase guarantee atindustry level. It assumes that certain electricitycompanies or consumers must provide evidence by acertain deadline that they bought or consumed specifiedvolumes of RET-E electricity. The quota type ofdemand is discussed in Section 4.1.2.
When governmentally guaranteed trade arrangementsoffer the type of demand ‘guaranteed purchase forindividual RET-E plants’, the assessment of contractrisks and price risks is also necessary, as proposed in thefollowing two sub-sections. Section 4.4 illustrates therisk analysis of governmentally guaranteed purchase forindividual RET-E plants’ (commonly referred to as‘feed-in-tariff’ support), in interaction with two othersupport instruments that were used in Spain.
4.1.1.1. Contract risks. The literature on power plantinvestment indicates the importance of securing a long-term and fixed-price electricity purchase contract beforethe plant is constructed (David and Wong, 1994;
Ingersoll et al., 1998; Gish, 1999; Hines, 1997; Joskow,1995; Burr, 1999; Murray, 1998; Sidak and Spulber,1998; Woo et al., 2001). The shorter the contract and/orthe more vague the legal framework referring tocontractual aspects, the higher contract risks are (Gish,1999; Hines, 1997). The core characteristics of contrac-tual relations that can be considered in analyzingcontract risks are: duration, the options for contractextension after termination, quantity; next to them thereis also the aspect of contractual purchase price whichcan be analyzed in the context of the price design as setin the legal framework.
4.1.1.2. Price risks. Price risks may come from twosources: the legal framework and from the details forcontractual purchase price. The legal framework mayallow for different degrees of freedom for buyers andsellers of RET-E electricity to set contractual prices. Thegovernment may prescribe tariffs that apply for thetrade of RET-E electricity. This may be set throughunilateral decision by the government or one of itsministries/agencies, or it may be taken based onconsultations with the industry. But governments mayprefer to give various kinds of guidelines for price designby contractual parties, such as the price components tobe taken into account, the frequency of price update,and set price floor and/or price ceiling that have to beobserved by buyers and sellers. As regards pricecomponents, legal provisions may for example prescribeor suggest the voluntary inclusion in contractual price ofa premium for the environmental benefits of RET-Eand/or premium for the contribution of RET-T tosecurity of supply in the system.
Price risks are related to the extent to which, and theforms in which, the following aspects are regulated: howthe price for RET-E electricity should be calculated andwhat are the included price components, whether thepurchase price should take specific levels, how often isthe price reviewed, who decides on these price aspectsand how.7 Consequently, I propose to describe the pricedesign aspect based on the following characteristics:
�
price components: prescribed, suggested, not indi-cated;�
price types: tariffs, ceilings, floors, no limits indicated; � frequency of updating: no updating, annual, severalyears;
� decision system: directive, consultation.4.1.2. Quota guaranteed purchase at industry level
This type of governmentally guaranteed trade ar-rangement can take a large variety of forms dependingon: the level in the value chain of electricity supply

ARTICLE IN PRESS
Table 2
Quota design variables for the assessment of demand risks and price risks
Assessment of demand risks Assessment of price risks
Who are the obligees, if they have the right to own renewable plants,
and if banking/borrowing is allowed
The cost-discharge mechanism; and the presence of price floors and
ceilings
Which cost-discharge mechanism applies and what is the penalty for
non-compliance
The lifetime of certificates and the frequency of compliance proof
The time horizon of the obligation/duration RET project eligibility Type of penalty for non-compliance and the destination of penalty
funds
The split of the obligation in technological bands
V. Dinica / Energy Policy 34 (2006) 461–480470
where the obligation is placed, whether obligees have theright to comply with the obligation by investing in RET-E projects or only by means of purchasing from othercompanies, and whether the obligation can be fulfilledby means of TGCs or only through the purchase ofphysical streams of electricity.
The risks for non-obligee investors under a quota typeof demand depend on the extent to which certain aspectsare addressed in the obligation design. The key designaspects and the forms they can take are mentioned inTable 2. Under quota types of demand, regulations donot cover the aspects of contractual relations becauseobligees need to have the opportunity to look for thelowest cost option of complying. Regarding pricedesign, the aim in principle is to minimize governmentalintervention. However, because investors need to have areference for the assessment of the economic viabilityand profitability of the plants they intend to build, undersome regulatory approaches certain aspects of quotaobligations are designed in such a way as to offeracceptable levels of price risks. Hence, under the quotatype of demand, investors can make assessmentsregarding only demand and price risks. I suggest thatthis is evident in the interaction of the forms of certainquota design variables in Table 2.
For the mitigation of demand and price risks, RET-Egenerators may search to conclude private contracts.Intuitively, investors are more likely to be interested inlong-term contracts, while obligees may rather beinterested in short-term contracts. But experience andresearch so far suggests that the incentives of generatorsand obligees to engage in short or long terms contractsemerge from the design of the quota obligation.8 From
8For example, the Renewable Portfolio Standard implemented in
Texas since 1999 has given the incentive of obligated electricity
suppliers to conclude many long-term contracts of 10–25 years (see
Langniss and Wiser, 2003, p. 530). However, in Italy long-term
contracts are less common, as quota design does not give obligees the
incentive for long-term fixed-price purchase, although this would have
been desired by generators. For an insightful analysis of forward
contracts, prices and financial risks for RET-E investors under the
proposed system of tradable green certificates see Lemming (2003).
Lemming (2003) argues that quota design may give incentives to RET-
E generators to avoid forward fixed-price contracts when there are
higher-return prospects for spot-market trade of certificates.
the investor standpoint: when the perceived demand ishigh, or assessed as sufficient to justify investment,power plants are also built in conditions of having onlya short-term contract, or not having a contract availableyet—i.e. having to rely on the spot exchange in powerpools. Such power plants are referred to as ‘merchantplants’. Section 4.1.3 makes a theoretical discussion fortwo example of quota design, in order to illustrate how arisk analysis could be conducted based on the approachproposed in Table 2.
4.1.3. Analysis of two possible designs of quota type of
demand at industry level
In Table 3, I proposed for illustration two configura-tions of quota obligation design and TGC systems.Variables were given forms so as to result in differentsupport risk circumstances for non-obligee investorsinterested to invest in a specific type of RET-T. Incontrast to governmentally guaranteed purchase con-tracts for individual RET-T projects, the quota type ofdemand may introduce an additional risk for investors,related to the competition among RET-T, unless thequota obligation is split per technological bands. Forboth examples the obligation assumes a gradual increasein quota level. It is assumed that for Configuration 1,RET-E projects may receive TGC during the first 10years of production.
Configuration 1 is an example low support instrumentrisks. This comes from the assessment of low demandrisks and low-modest price risks. The forms of itsvariables create a framework of demand risks that canbe assessed as low because of several reasons. Firstly,the obligees—distribution companies—cannot own gen-eration plants. As they can only be buyers of RET-Eelectricity or green certificates, potential investors arespared of the uncertainties related to the investmentstrategies versus purchase strategies of obligees torespond to their quota requirements. Similarly, theuncertainties related to the obligees strategies ofborrowing and banking are removed. Secondly, whendistributors comply with their obligations they candischarge the TGC costs on a general levy fund (madeup of levies paid by all electricity consumers), while ifthey do not comply they have to pay the average price of

ARTICLE IN PRESS
Table 3
Theoretical examples of configurations of TGC-based quota
Variables in the design of quota obligation Configuration 1 Configuration 2
1. The obligee Distribution firms Suppliers
2. Cost discharge Limited levy fund on all consumers Own customers of obligee
3. Right of obligee to own generation plants No Yes
4. Price ceiling Yes Yes
5. Price floor Yes No
6. Penalty for non-compliance Pay average price from own financial
resources
Pay price ceiling from own financial resources
7. Recycling of financial penalty To generators with unsold TGC Among compliant obligees
8. Lifetime of certificates 1 year 4 years
9. Frequency of compliance proof 3 year 2 years
10. Banking No Yes
11. Borrowing No No
12. Split of obligation in technology bands Yes No
13. Time horizon obligation Large—20 years Short—8 years
V. Dinica / Energy Policy 34 (2006) 461–480 471
TGC for each missing certificate from their quota, fromthe company’s own financial resources. This combina-tion is able to boost confidence in demand for RET-Einvestors, since obligees will have a strong incentive tobuy green electricity/certificates. Thirdly, the long-termhorizon of obligation increases confidence in investmentcosts recovery, even when investments are done at alater time after obligation start, in order to have a betterunderstanding of how the market works. Fourthly,when the quota obligation is split among technologybands, both demand and price risks are reduced,eliminating competition with other RET-T technologies.
Further, price risks can also be assessed as low inConfiguration 1 based on the following signals. Firstly,price ceiling and floors exist, which enables investorsderive some expectations regarding project returns.Besides, the fact the obligees can discharge costs on anall-consumers levy fund leads to the assumption that,under pressure to comply, there might be a willingnessto accept price proposals close to the legal ceiling.Secondly, non-compliant obligees have to pay penalties,and the penalty fund is distributed among generatorswith unsold certificates. This assures generators thateven when they cannot sell (all) green certificates, theywould still have income from the support instrument.However, one attractive aspect may be that the lifetimeof certificates is shorter than the time interval whenobligees have to prove compliance. This does not allowgenerators the flexibility to wait and search for attractiveTGC prices. They might have to accept lower pricesbefore deadline, while obligees are in the position topostpone buying closer to the compliance deadline.When the supply is larger than the demand, generatorswith unsold certificates will not receive any income fortheir TGC as long as all obligees comply with theirobligation. Overall price risks may be assessed asbetween low and modest. However having in view thatRET-T projects may get TGC for the first 10 years of
production, while the obligation assumes a gradualincrease in quota level, and on the background of lowdemand risks, the overall support instrument risks canbe assessed as low.
Configuration 2 is an example of high risks quotadesign for non-obligee investors. This comes from theassessment of high demand risks and modest–high pricerisks. Demand risks for potential investors who are notquota obligees can be assessed as high. Firstly, theobligees have the right to own RET-E plants. Un-certainties on the demand size that non-obligees couldserve emerge because of lack of information regardingthe buying versus investment strategies of obligees, aswell as the possibility that obliges are banking the self-produced certificates. Secondly, an obligation timehorizon of only 8 years would enable the recovery—with more certainty—of investment costs only wheninvestments are done in the first years of the obligation.Thirdly, the fact that the quota obligation is not split intechnological bands increases both demand and pricerisks.
Price risks can be assessed as between modest andhigh. On the one hand, the lifetime of certificates islonger than the compliance frequency. This enablesgenerators to search longer for prices are correspond totheir expectations. But on the other hand, the recyclingof financial penalties is directed toward compliantobligees. This represents a possible price risk for non-obligee investors, as they will get nothing for the unsoldTGC, while the time horizon of the obligation is short.Besides, there are no price floors that investors couldtake as orientation for estimating project returns, whilethe cost-discharge mechanism assumes that expenses areborn by own customers of obliges. In contrast to thesituation when quota expenses could be discarded on thegeneral levy fund on all consumers, in this case obligeeshave a strong incentive to buy TGC as cheaply aspossible. Therefore, only when supply is low compared
ARTICLE IN PRESSV. Dinica / Energy Policy 34 (2006) 461–480472
to quota level, can the design aspect of having thelifetime of certificates longer than the frequency ofcompliance can lead to modest price risks for non-obligee investors. However, on the background of highdemand risks, the overall risks of the instrument can beassessed as high for non-obligees. However, this quotadesign may still generate good diffusion results since it isattractive for obligees to invest—as long as they can doit at costs lower than those incurred by competingsuppliers to comply with their quota (this quota designplaces obligees in competition compared to the preced-ing example where the cost-discharge mechanism wascompetition neutral).
Two conclusions may be drawn from these twotheoretical examples. Firstly, whenever the quota designallows for obligees to comply by owning RET-Tgeneration capacity, the instrument creates two groupsof developers, and the risk–profitability characteristicsof the instrument have to be assessed for both in orderto get insight in the likely diffusion patterns and results.Secondly, quota obligations may be designed in waysthat pose both low risks and high risks on non-obligeeRET-T investors. Given different ranges of projectprofitability potential, the quota type of governmentallyprotected trade arrangements may result in any of thefour types of investment contexts differentiated in Fig. 1.
4.2. Risks associated with other support instruments
In Table 1, I labeled as ‘strategic instruments’ all theother schemes that governments may use to supportRET-E overpass the economic and financing barriers.They could help by means of: direct additional financialsupport, improving the accessibility of financing re-sources or improving the market position of RET-E vis-a-vis conventional electricity. I suggest that the risksfrom such instruments can be analyzed in terms of:
(a)
the timing of their application: before the entry ofthe operation of the power plant, or during part orthe entire economic lifetime of the plant;(b)
its position in the regulatory hierarchy, that isparliamentary law, governmental decision or minis-terial order;(c)
the context in which policy support mechanisms areused;(d)
the preferred policy style of economic actors in thecountry.As regards the timing of their application, one candistinguish instruments posing low/no risks because theyare implemented in the phase of project preparation orconstruction. For example, the following instrumentscan be considered as posing low risks: third-partyfinancing, project aggregation programs for governmen-tally negotiated large project finance loans, governmen-
tal guarantee on project loans and investment subsidies.Once these forms of support have been implemented, theprofitability or viability of projects during the operationphase is not exposed to risks if the instrument iswithdrawn, because withdrawal would affect only plantsto be built in future. When the implementation ofinstruments takes place during part or the entireeconomic lifetime of the plant, risk analysis needs tocombine the other three criteria mentioned above. Thisis the case of production subsidies and fiscal incentives—both direct and indirect. Many debates so far focused onthe desirability of fiscal incentives versus productionsubsidies.
In some countries (potential), RET-E generatorsmight tend to consider fiscal incentives less desirablethan production subsidies (e.g. in Spain), because theyare often complex and the eligibility of various types ofeconomic actors/legal status of the company is notalways clear. Besides, more public authorities are ofteninvolved in the implementation of fiscal incentives and,when regulations are not clear enough or leaving toomuch scope for the interpretation of fiscal authorities orlocal agencies, this is perceived to put the economics ofRET-E projects at risk. The perception that productionsubsidies are less risky than fiscal instruments isstrengthened when developers have confidence in thepolitical commitment for RET-E support, and whenother environmental policy goals were achieved withreliable production subsidies schemes in the past.Besides, when production subsidies help indirectly othernational or local goals such as electricity supply inpoorly/no electrified regions or the creation of jobs andindustrial basis in economically depressed areas, the riskperception can also improve.
In other countries, fiscal incentives may be viewed bydevelopers as less risky. The argument used is that theycannot be attacked by the lobby of conventional powerindustry as easily as production subsidies, because theyare compatible with market principles and do not distortcompetition. In some countries, where there is atradition of operating with fiscal instruments to achievepublic goals, the use of fiscal instruments can moreeasily be accepted as low risk support instruments thanin countries which are just experimenting with it.Consequently, the risks of support instruments can beperceived differently in different national contexts andempirical research should take into account suchpossible ‘cultural biases’.
4.3. Representing support systems in the risk/profitability
matrix
In terms of the analytical process for risk assessment,qualitative assessments can be made on a scale with fourlevels: low, moderate, high and very high. Assessmentson this scale can be made in a first step separately for
ARTICLE IN PRESSV. Dinica / Energy Policy 34 (2006) 461–480 473
demand risks, contract risks and price risks, as resultingfrom the governmentally guaranteed trade arrangementswith obligees. In the second step, their interactionshould be interpreted from the perspective of how couldlong-term risks affect projects’ returns (see Section 4.4).This would result in the assessment, on the same four-scale level, of the trade arrangements’ risks. After that, ifother support instruments are simultaneously appliedfor the same type of RET-E, the analysis can becontinued with the risk assessment of individualinstruments, as suggested in Section 4.2. Finally, theinteraction of all instruments and trade arrangements(governmentally guaranteed as well as market trade) canbe studied in terms of overall risks they pose and howthey contribute to the profitability potential of projects.Section 4.1.3 has given an example of high-risk quotaguarantees purchase for independent power producersusing RET-E. Section 4.4. gives an example of a high-risk support system that includes governmentallyguaranteed purchase from individual RET-E projects,investment subsidies and third-party financing by agovernmental agency.
As regards the project profitability characteristic, inprevious empirical analyses I conducted based on thisanalytical approach to support systems, I operationa-lized it as follows: low, up to 4%; modest, 4–8%; high,8–12%; very high, 412%. This operationalization wasdeveloped based interviews with more than 60 projectdevelopers and market analysts from Spain, UnitedKingdom and the Netherlands (see Dinica, 2003, pp.633–636), as well as analyses of a rich diversity ofempirical material on the issue of RET-E projects’economics and financing. In empirical research, profit-ability can be assessed by using one of the followingapproaches: (1) direct profitability data from developers,market experts and available empirical material such asgovernmental documents, journal articles or conferencepapers; and (2) qualitative assessments from developerswhen data are treated as confidential, combined withcomparisons of production costs and extent of price/financial support, using information from developers,market experts and empirical material.
4.4. Support system in Spain, 1980–1994
Altough the Spanish system of RET-E support basedon the 1997/8 regulatory framework has been largelydiscussed in the literature for the success of the so-called‘feed-in tariff’ on wind energy use, little has beenpublished about what happened in an earlier periodbased on the same type of instrument. Between 1980 and1994, the market introduction of RET-E in Spain wassupported by:
9The RET-E generators were however specifically required ‘‘to
abstain from selling the excess electricity to third-party’’ as the
� electricity industry was still organized based on monopoly principles.governmentally guaranteed purchase for individualRET-E projects, defined in the 82/1980 Energy
Conservation Law as: right to grid connection;contracts for the sale of surplus electricity to thelocal energy utility;9 guaranteed fixed-price deter-mined by Ministry of Industry and Energy; only aspecified target group could benefit of guaranteedpurchase; many RET-E projects also benefited of:J third-party financing;J investment subsidies.
According to the legal text, the target group forgovernmentally guaranteed contracts was formed byself-generators having surplus RET-E electricity, de-monstration projects and small-hydropower (o5MW)commercial generators (except for projects developed bydistribution companies). In practice, a series of com-mercial projects based of non-hydro renewable re-sources were nevertheless also developed. Theirnumber increased after 1990, becoming dominant atthe end of the first diffusion period in 1994. One maywonder: Why does it make sense to look at the risksincurred by developers that are not in the legally definedtarget group? The 1991–2000 Spanish Plan for EnergySaving and Efficiency set targets of 168MW windcapacity by 2000, and 779MW new small-hydropowerplants—among other technologies, and expected theirachievement solely through (partly) self-generationprojects. That is why the 82/1980 Law was also targetedat self-generators’ support. But because the interest inself-generation projects proved very low, commercialprojects started to be accepted for contracts with localenergy utilities, in order to reach the policy targets(Ocharan de la Camara, 2001). From here, one canimply that—although accepted, looking from a legalperspective, demand risks were basically very high forcommercial non-hydro renewable plants, since they werenot specifically mentioned in the target group. However,there were no demand risks for small-hydropower plants(o5MW) and for (partly) self-generation and demon-stration non-hydro RET-E projects.
As regards the duration of purchase contracts, therewas no legal provision mentioning this (also not in thegovernmental documents issued in the implementationof the law), or the criteria for contract extension, in caseonly short-term contract, were given by local energyutilities, or how much would be considered as ‘surpluselectricity’. Empirical research revealed that contractduration varied widely between 2 years and projectlifetime, depending on who were the project developersor equity investors (Dinica, 2003, pp. 188–192). Forwind energy most of the grid-connected projectscommissioned in this period had the financial involve-ment of the purchasing energy utilities, the govern-mental renewables agency—Institute for Energy Saving

ARTICLE IN PRESSV. Dinica / Energy Policy 34 (2006) 461–480474
and Diversification (IDAE)—and manufacturers.10 Inthese cases, there were long-term or project lifetimecontracts. Therefore, for some projects developers couldhedge against instrument-related contract risks bychoosing the investment partners strategically or simplybecause they were key actors in the decision-makingprocess for approving RET-E projects. But, seen atindustry level, the phrasing of the ‘governmentallyguarantee’ posed very high contract risks. The absenceof legal provisions on minimum contract length andcontract extension prospects had the consequence ofcreating financing obstacles for many developers,blocking the access to ‘project finance’ loans. Contractrisks weighted heavy in the risk analysis of financingagents, as lenders pointed out many times during thenational workshops for renewables promotion orga-nized during the 1990s by IDAE.
The price for trade arrangements can be assessed fromthe standpoint of legal text analysis as posing very highrisks because. Although a purchase price was guaran-teed in the law, no level or details on the design of pricewere specified in the law. The price level was set in theform of a feed-in tariff, by Order of Minister of Energyand Industry. The Ministry was given all competences asto what positive aspects of renewables generation wereto be taken into account and to what extent would theybe financially valued. There were no consultations with(potential) project developers regarding the price com-ponents to be taken into account, price type and level.Setting tariffs assumed a ‘directive’ type of decision-making. In addition, decisions at ministerial level wereseen by economic actors potentially more politicallyunstable than decisions at governmental and parliamen-tary level, especially when tariffs have to be annuallyrevised.11 The law also did not offer any price floors thatdevelopers could take as orientation in making theirbusiness plans. Having in view these considerations, theprice risks associated with the governmentally guaran-teed trade arrangements can be assessed as very high.Besides, the feed-in tariff was quite small. Scatteredinformation indicates an average price for electricityfrom small-hydropower plants of 6.3 Ec/kWh, while forwind electricity it varied between 6.1 and 7.2 Ec/kWh.For biomass electricity the feed-in tariff was not evenregulated in ministerial orders but negotiated betweenindividually between the few producers and energyutilities (Dinica, 2003, pp. 194–195).
Looking at the legal framework during 1980–1994 therisks associated with trade arrangements were different
10Small-hydropower projects had a more diverse ownership, while
biomass electricity projects were very scarce because the extent of price
support was not enough to make them profitable.11Manuel Delas, the President of the Association of Renewable
Energy Producers in Spain, ‘‘Position paper’’ 2001 available at the
association’s website: http://www.appa.es; also interview with Manuel
Bustos, public relations officer of the same association, April 2001.
for commercial non-hydro projects (hence includingwind and biomass) than for the rest of RET-E projects.The risks associated with trade arrangements can beassessed as high for all types of small-hydropowerprojects, and for self-generation and demonstrationrenewable wind and biomass projects. This comes fromthe assessed low demand risks for the target group, butvery high contract risks and very high price risks.However, for commercial generators using wind orbiomass resources, demand risks were very high sincethey were not specifically mentioned in the target group.This makes the overall risks associated with tradearrangements for such projects as very high. Interviewedproject developers and market analysts have alsoassessed this support instrument as posing (very) highrisks (Dinica, 2003, pp. 189–195, 225–226). This isreflected by the fact that—with few exceptions—it wasvery difficult to obtain project finance loans for any typeof RET-E projects during these years.
Since the mid-1980s, another scheme was alsointroduced: third-party financing by IDAE. This wasused in order to build confidence in RET-E amongpotential investors and it also aimed to help those whowould have liked to invest but lacked access to financialresources. This scheme does not change the risk–profit-ability profile of the governmentally regulated tradearrangements at industry level. The scheme transfers allproject risks from the project initiator to the third-partyfinancier, who is exposed to the same risks as the otherproject developers in the industry.
Next to this instrument, investment subsidies werealso used during those years. The 1983, 1986 and 1991energy policy plans set various levels of investmentsubsidies for wind and small-hydropower technologies.Investment subsidies were given mostly on a case-by-case basis, depending on the needs and particularities ofthe projects for which applications were made. Subsidiescould cover at maximum 60% during the 1980s of totaleligible investment costs, and maximum 50% up to1994. Some wind demonstration projects and manysmall-hydropower projects also used investment sub-sidies from the European Union. The use of investmentsubsidies did not change the support system related risksof projects. When the government cancels or interruptsthe application of such instrument, this cannot endangerthe economic feasibility or profitability of already builtprojects.
Investment subsidies made the difference betweeneconomically not feasible and (very) high profitabilityproject for wind and biomass electricity technologies.Between 1980 and 1994, the least financial supportwas given for biomass technology because it wasconsidered as not ready for considerable diffusion. Forwind technology, investment subsidies enabled projectprofitability levels in the range of 10–20%, depending onresource location and quality, and also due to variations
ARTICLE IN PRESSV. Dinica / Energy Policy 34 (2006) 461–480 475
in the level of subsidies among projects (Dinica, 2003,pp. 228–229). This placed wind technology in anentrepreneurial investment context (see Fig. 1). Withoutthe use of investment subsidies, the support system forwind technology using the so-called feed-in-tariff modelwould have been of ‘minimal investment context’ type.The same holds for small-hydropower plants, whichbenefited of entrepreneurial investment contexts up to1994. Adding to the modest price support per kWh,investment subsidies enabled high (8–12%) and veryhigh (412%) profitability for most projects built(Dinica, 2003, pp. 234–235). However, for biomasselectricity technologies the lack of widespread invest-ment subsidies left projects unprofitable. Confrontingthe same levels of (very) high risks, developers ofbiomass projects had to operate in a minimal investmentcontexts where only projects mainly aiming at self-generation and demonstration were interesting.
Being able to specify the risk–profitability of theinvestment context is very helpful in deriving expecta-tions on the diffusion potential. Section 5 formulatessome theoretical expectations on the diffusion patters ofRET-T projects and the likely short–medium termdiffusion potential for the four types of investmentcontexts differentiated. Having in view the constrains onthe size of this paper, the analysis in Section 5 appliesonly to support systems that include the type of demand‘governmentally guaranteed purchase for individualRET-T plants’ or support systems that only use one ormore combinations of ‘strategic instruments’ as men-tioned in Table 1. Looking at the diffusion potential ofsuch support systems (as dependent variable) impliesthat the capacity increase at industry level is not known.
5. Diffusion potential of support systems
The analysis of support systems for RET-E electricityfrom the perspective of potential investors is morehelpful than the incumbent approaches in policy studies,as it facilitates the development of expectations regard-ing the likely rate of market growth. In this section, Iexplain how such expectations can be derived.12 Themain assumptions used in this analysis are that:
�
except for the financing and economic obstacles, noother obstacles impede the diffusion of RET-E, suchas environmental and administrative opposition; thisassumption is necessary whenever one wishes tounderstand the ‘investment appetite’ created bysupport systems aimed at the economic and financingaspects of RET-E plants alone;�
there are no restrictions on the market entry for thebusiness of RET-E electricity;12For an in-depth study see Dinica (2003).
�
generation, in terms of type of project owner; � there is sufficient availability of technically exploitablerenewable resources that would enable a significantcontribution of the respective RET-E in the nationalelectricity supply.
The theoretical argument is that the risk–profitabilityprofile of a support system influences the marketdiffusion patterns of the respective technology. In theirturn, diffusion patterns influence the results of thesupport system. In this paper, I discuss the likely resultsin short–medium term—expressed as the level ofinstalled capacity increase in a period of 5–10 years.The relationships are represented in Fig. 2.
In order to analyze diffusion, five indicators fordiffusion patterns can be seen as suitable analytical linksfor understanding the investment appetite under thefour types of support configurations:
�
What kinds of (economic actors) developers would beinterested to invest and which is their financialstrength?�
What are the main reasons motivating their invest-ments: commercial, strategic or self-generation inter-ests?�
What kinds of financing arrangements are they ableto make or willing to use? and�
What could be the size of projects in which they arewilling to invest?I believe these indicators are very significant whenquantifying the speed of renewable technology marketgrowth.
Considering what forms these indicators may take inthe four types of risk–profitability investment contexts,one can hypothesize that diffusion patterns can beconsiderably different. This has consequences for therate of market growth. In addition, the effectiveness of asupport system is influenced by factors specific to thenational context. An in-depth study on the diffusion ofwind electricity technology in the Netherlands, Spainand the United Kingdom (Dinica, 2003) revealed thatthe most important contextual factors are: the businessculture (especially in terms of technology perception andrisk-flexibility) and minimal business requirements (interms of interest rates and equity returns) of thedomestic economic actors and financing agents.
Under optimal investment contexts (see Fig. 1), theuse of all types of financing schemes is possible—external schemes such as project finance, institutionalfinance and all types of internal financing schemes, suchas corporate finance, private finance or communityfinance. Investors may use both internally available cashand loans from banks or specialized financing housessince the system combines the attractiveness of (very)high profitability and low/modest risks. Given the

ARTICLE IN PRESS
economic policy aggregated risks diffusion effectiveness support systems project profitability patterns (MW increase)
Fig. 2. Basic analytical framework for the analysis of the diffusion potential.
V. Dinica / Energy Policy 34 (2006) 461–480476
availability of project finance banks loans, a largediversity of types of developers can be expected (as longas legislation does not restrict market entry), rangingfrom electricity companies, industrial corporations fromother economic branches, specialized financing agents,to small developers such as communities, cooperatives,small and medium sized forms or private individuals.Nevertheless, the business culture of traditional finan-cing agents may impede investments by small devel-opers, and in some cases also by larger developers thatare new entrants into the energy business. Althoughsome developers may be mainly interested in self-generations, others will invest motivated by somestrategic considerations—such as new technologicaldesigns testing, green image considerations, local busi-ness opportunity or ideology. Overall, commercialmotivation will be the main driver to invest. Medium-and large-size projects will probably predominate. Theadoption of innovative technological designs of therestive type of RET-E is likely to be frequently observedin the diffusion boom expected. These forms of diffusionpatterns are very likely to lead to a high investmentinterest. If there are no other obstacles for diffusion, alarge increase in the renewable capacity installed can beobserved in short–medium term.
Under entrepreneurial investment contexts, it is likelythat there will be a smaller number of financing agentswilling to provide project finance bank loans. Therefore,project developers have to rely on internally availableresources such as company cash reserves, market-valuable assets, and the cash availability of cooperativemembers or private savings of individuals. Given thehigh risks, however, not as many economic actors wouldbe interested to invest in commercial projects as in theoptimal context. This is particularly the case during thefirst stages of diffusion when technology risk perceptionsare also high, increasing the risks on project returns.Commercial projects in this context are more likely to bebuilt by electricity companies and by large industrialcorporations that are more accustomed with doingbusiness in high-risk environments.
Small developers may also invest, usually when theyhave self-generation interests. The market entry ofsmall- and medium-size companies that never operatedin the energy field is unlikely, or at least not significant.Given the need for internal financial resources—equitycorporate debt and private debt—combined with theexposure of these financial sources to high risks, projectsizes are likely to be on average at industry level in therange of small to medium-size. Large developers and
projects using ‘project finance’ types of loans could be inthe ‘large-size’ range. Since project finance schemes areunlikely, small/medium sizes should be expected. Theseforms of diffusion patterns are likely to lead to onlymodest investment interest, and to a lower increase inthe capacity installed in short–medium term underentrepreneurial support systems, as compared to opti-mal investment contexts.
Under political investment contexts, internal finan-cing schemes are likely to predominate. Loan financingmight take place but depends on the business profit-ability requirements of the banks operating in therespective national context. Only a few types offinancing agents would be willing to approve projectfinance loans when the profitability potential is low,while several may join the investors when there ispotential for modest profitability. The presence ofcommercial projects will be smaller than in the case ofthe ‘optimal context’. This is mainly due to a decrease inthe group of large developers that would be attracted toinvest, the more the profitability potential drops. Largecorporations and electricity companies have often cut-off equity-return criteria of 8–10% or higher that can beseen as the border between modest and high profitabilityin Fig. 1.
Small developers are more likely to be interested inRET-E as a business with mainly commercially moti-vated projects or for (partly) self-generation purposes.Large developers with lower cut-off equity requirementswould also find this type of context attractive to draw upmore ample investment plans. Given the expectedpredominance of small developers and the limitedavailability of project finance loans, projects are likelyto be within the range of small sizes. Consequently, Iexpect such forms of diffusion patterns to lead to onlysmall/modest investment interest, depending on theminimal business requirements (profitability) of thedomestic economic actors and financing agents. This islikely to lead to the same—at best—but more likelylower levels of installed capacity increase in short–-medium term, as compared to entrepreneurial invest-ment contexts.
Under minimal investment contexts internal financingschemes are likely to predominate. Only very few typesof financing agents would be willing to approve projectfinance. The number of economic actors interested tostart a new business area with commercial RET-E plantsis likely to be very small. Small developers may buildcommercial projects or partly self-generation projects. Alimited presence of large developers is likely to be
ARTICLE IN PRESSV. Dinica / Energy Policy 34 (2006) 461–480 477
observed, with investments in mainly small-scale strate-gically motivated projects. These are more apt to beelectricity companies investing on the basis of greenimage considerations or concerned with the security ofconventional fuel supply. Numerically, this investmentcontext will not be able to stimulate as many projects asthe political and entrepreneurial investment contexts.Considering the (very) high risks in the support system,the sizes of projects are more likely to be in the range of‘very small’. All these considerations lead to theexpectation of only a very limited investment interest.A very small installed capacity increase may be observedin short–medium term under minimal investmentcontexts.
In conclusion, theoretical analyses suggest that diffu-sion patterns may take substantially different forms inthe four investment contexts differentiated based onsupport system risks and ranges of project profitability.Diffusion patterns have consequences for the rate ofmarket growth. The investment interest generated inshort–medium term is likely to be significantly differ-ent.13
The analysis of the old system of RET-E support inSpain in Section 4.4 illustrates that what in the literatureis generally refereed to as ‘feed-in tariffs’ may be alsodesigned as unattractive for potential investors. Between1990 and 1995 there were only few new biomasselectricity projects built in the minimal investmentcontext created, totaling around 50MW (data for the1980s not available). They were all small-size plants forpartly self-generation purposes and strategic projects todispense of biomass organic wastes in an environmen-tally friendly manner. The owners were large industrialproduction companies, and in few cases also agriculturalcooperative and smaller private companies, usingconventional direct-combustion technologies for organicwastes.
The entrepreneurial investment context created forsmall-hydropower technology produced by 1994 around550MW of new projects that were chiefly financed byenergy utilities, some large companies specialized in thecommercial generation of hydropower-based electricity,industrial and technology companies, and some project-specific joint venture companies. Project finance loanswere hardly possible due to the risks in the legalframework, constraining the range of possible projectdevelopers and the rate of diffusion. However, the sametype of investment context was available for windtechnology and it led by the end of 1994, to only77MW of wind power capacity in Spain, mostly small-
13The theoretical predictions for the four investment contexts have
been empirically tested, in an in-depth study (Dinica, 2003) in eight
case studies. They regarded the diffusion of wind technology in Spain,
The Netherlands and the United Kingdom, as well as the diffusion of
biomass and small-hydropower technologies in Spain. Empirical
findings confirmed overall to large extent the theoretical predictions.
size projects, financed based on the financial resources ofproject developers or corporate finance, and owned bylarge companies (Dinica, 2003, pp. 246–256). The mainfactor that was found to influence the diffusion resultsfor wind technology is the perception of high technologyrisks among potential developers. The policy lesson isthat developers are not willing to accept in the same timetwo important types of risks on project profitability:technology risk perception and support instrument risk.Hence for the market introduction of a RET-E, anentrepreneurial investment context is not appropriate,while for the continued diffusion of a familiar technol-ogy such a support system might bring better results.Section 6 presents the conclusions of the paper.
6. Conclusion
In this paper, I argued that taking an investorperspective on the analysis of governmental supportsystems could be helpful in underpinning the diffusionpatterns and potential of RET-E. Policy language can betranslated into investor language by looking at supportsystems from the perspective of the risk and profitabilitypotential they generate for project developers. Suchapproach enables a more systematic comparison of theattractiveness for investors of:
�
different types of RET-E in the same country; � the same type of RET-E in various countries; and � the same type of RET-E in the same country overtime.
However, this approach has several limitations:
�
while the approach proposed is parsimonious in thatit assumes the analysis and changes in only twoindicators—instrument(s) risks and profitability po-tential—the qualitative ex ante analysis of instru-ment(s) risks requires laborious legal text analysis bythe researcher(s); perceptions may not correspond tothose of potential developers; to overcome this,potential investors could also be interviewed andinvolved in research;�
investors are confronted with a wider range of risktypes (see Section 3) and this can be reflected in thediffusion patterns;�
the assumption that no other obstacles influencediffusion—except for the financing and economicobstacles that the support system addresses—is some-times not met in practice, which influences theobserved diffusion results.The shortcoming of not incorporating other/all risktypes is actually common for all policy studies, since thekey question is how to design policy and/or whatinstruments to use to stimulate the diffusion of RET-E

ARTICLE IN PRESSV. Dinica / Energy Policy 34 (2006) 461–480478
given fact that due to various reasons (see Section 1)such technologies are still expensive and difficult tofinance. The characteristics of risks and profitabilityoffer a bridge between the question of policy design andthe question of investment decision processes. But tofully understand investment patterns and RET-Tinvestor behavior, the analysis needs to move in thedirection of the financial-economics literature, whichscrutinizes how all risks facing a project influence theparticularities of investment decisions. This paper can beseen as a step in converging the two perspectives, to theextent necessary to answer the question of policy designfor economically feasible projects. To induce a sustaineddiffusion of RET-E the policy package may need toexpand beyond the types of support instrumentsmentioned in Table 1. The design of comprehensivepolicy packages—addressing a wider range of challengesto investors—requires more insight into financial-economics and consideration of more risk types thanincluded in this study. However, it needs to be kept inmind that in economic-financials the typical unit ofanalysis is a project, and circumstances may differ verywidely for projects, in ways that even comprehensivepolicy packages may not be able to fully cover.
As regards the assumption that no other obstaclesinfluence diffusion, this actually affects ex post analyses.However, looking at the number and total capacity ofproject proposals submitted to (all relevant) authoritiesfor permitting—hence including those that for variousobstacles could not be finally implemented—still enablesthe assessment of the ‘investment appetite’ created bythe support system addressing the economic andfinancing barriers. In this sense, the diffusion potentialcan still be analyzed. A study which simultaneouslyconsiders theoretically the influence of all types ofobstacles could hardly formulate theoretical expecta-tions. Empirically, an ‘all-inclusive’ approach would notbe able to specify—given some observed diffusionresults—which obstacles were accountable for observa-tions and to what extent. Under the approach taken inthis paper, the researcher is more likely to be able toobserve that—for example a support system wasattractive economically and made financing easy butthe policy package was not comprehensive enough toalso address the administrative (or grid connection, orenvironmental) obstacle which is hence responsible forthe (empirically found amount of) unfulfilled marketshare growth.
Two sets of policy recommendations emerge from theapproach taken in this paper: one regards the design ofsupport systems and one regards the choice and changeof support system types in terms of risk–profitabilityprofiles.
Awareness on the ranges of profitability that supportsystem enable is necessary both in the phase of policydesign and at the time of its fine tuning in later stages of
diffusion. Policy-makers should look at the businessrequirements of domestic economic actors—both finan-cing agents and potential project developers—in termsof minimum project profitability or minimum equityreturns expected. This needs to be compared to thefinancial impact of the policy instruments used. Arealistic comparison requires updated knowledge on theproduction costs and how different factors that play arole in production costs evolved lately.
Further, a more careful consideration of the risksassociated with policy design—sometimes unintention-ally—is necessary. While a totally risk free policy maynot be feasible, it is important that support systemenables investors to predict within reasonably narrowranges the payment on a long-term basis. The weakerthe predictability of payment streams is, the higher thefinancial leakages—high interest rates and higher thannormally required equity return—and the more ineffec-tively the public financial support will be spent. Forexample, research showed that in national contextswhere most economic actors are strongly risk adverse,the legal guarantee of RET-E electricity purchase is notsufficient to create an attractive investment context, evenwhen the profitability enabled is (very) high. Asorientation for investors, it is necessary to also mentionthe guaranteed contract duration. Further, the finetuning of support—especially with regard to price—needs to be made at higher levels of decision-making.Decisions at ministerial level appear to be associatedwith increasing investment risks than governmentaldecisions, which are in their turn seen as more riskythan parliamentary decisions.
Moreover, in order to create an attractive investmentcontext, complex and versatile payment streams need tobe avoided. The operation of one or few clear supportschemes increases the range of developers likely tounderstand and able to assess their financial impact.Transparency and stability in support system mayincrease the number and diversity of economic actorsinvolved in RET-E generation. But in order to achievetransparency and stability in support systems, govern-ments need to define what they want to achieve and why,as clearly as possible. When support systems are highlyversatile with frequent change in support instrumentstypes or when annual price revisions based on uni-laterally decided un-transparent price design, they mayhave damaging impacts on diffusion. Policy-makersshould not stop their responsibility for RET-E diffusionwith the implementation of support systems. Diffusionpatterns need to be continuously monitored in order totimely observe which are the prospects for the continuityof diffusion processes and which other obstaclesobstruct the working of the system.
The market introduction of RET-E should be bestattempted by means of optimal support systems (seeFig. 1). The chances to raise wide investment interest are

ARTICLE IN PRESSV. Dinica / Energy Policy 34 (2006) 461–480 479
higher when technology introduction takes place bymeans of high profitability/low risks contexts. At latertime a shift toward entrepreneurial or political invest-ment contexts may be operated. Such as shift may takesome project developers out of the market. But othermay be willing to stay after making long-term invest-ment strategies in renewable energy. A ‘shifted route’ insupport system may bring more types of economic andfinancing agents in the business of renewable energy,and more installed capacity, than a start up with apolitical or an entrepreneurial investment context.Entrepreneurial investment contexts may give resultsfor more mature technologies, when investors do nothave to cumulate support instrument risks with technol-ogy risk perception. Nevertheless, the use of high-risksupport systems—entrepreneurial and minimal—makeslittle economic sense. Because of high interest rates andexpectations on very high equity returns under highrisks, with the same amount of public financial support,more capacity increase may be achieved in optimalinvestment contexts than in entrepreneurial investmentcontexts offering similar profitability potential. Simi-larly, given a certain budget to finance RET-E diffusion,more capacity increase may be achieved in politicalinvestment contexts than in minimal investment con-texts offering similar profitability potential.
Renewable policies that fail to recognize the impor-tance of the profitability in support system design andthe risks attached to it are by essence problematic.Profitability is a crucial driver for stimulating largedevelopers to join the renewables market and lend theirfinancial weight and influential presence to breakthrough the economic and financial obstacles to diffu-sion. The level of risks associated with support instru-ments and legal framework should also become aconstant concern for the policy design agenda. Provid-ing for public financial support while introducinginvestment risks is a self-defeating approach.
References
Ackermann, T., Andersson, G., Soder, L., 2001. Overview of
government and market driven programs for the promotion of
renewable power generation. Renewable Energy 22, 197–204.
Awerbuch, S., 1996. Capital budgeting, technological innovation and
the emerging competitive environment of the electric power
industry. Energy Policy 24 (2), 195–202.
Awerbuch, S., 2000. Investing in photovoltaics: risk, accounting and
the value of new technology. Energy Policy 28 (14), 1023–1035.
Awerbuch, S., 2003a. Determining the real cost: why renewable power
is more cost-competitive than previously believed. Renewable
Energy World 6 (2).
Awerbuch, S., 2003b. Do renewables cost more? Shifting the grounds of
debate. Presentation at the Sonderborg Conference on Renewable
Energy—Renewable Energy in the Market: New Opportunities’’,
Sonderborg, Denmark, 17–19 September 2003, available at http://
www2.mim.dk/reconference/dias/Shimon%20Awerbuch.doc.
Bond, G., Carter, L., 1995. Financing energy projects: experience of the
international finance corporation. Energy Policy 23 (11), 967–975.
Burr, M., 1999. Energy finance 101—new risks require new approaches
to financing energy projects. Independent Energy 29 (2), 10–19.
Comnes, G.A., Belden, T.N., Kahn, E.P., 1995. The price of electricity
from private power producers. Lawrence Berkeley Laboratory,
Berkeley.
Churchill, A.A., 1995. Beyond project finance. The Electricity Journal
8 (5), 22–30.
David, A.K., Wong, K., 1994. Investment in competitive electricity—
scope for incentive contracts. Energy Economics 16 (1), 27–35.
Dinica, V., 2003. Sustained diffusion of renewable energy—politically
defined investment contexts for renewable electricity technologies
in Spain, the Netherlands and the United Kingdom. Twente
University Press, Enschede, The Netherlands.
Dunkerley, J., 1995. Financing the energy sector in developing
countries. Energy Policy 23 (1), 929–939.
Energie Research Center Nederland (ECN), 2002b. In: de Lange, T.J.,
van Dijk, A.L., Beurskens L.W.M. (Eds.), European Renewable
Electricity for the Dutch Market—an Overview of Policies,
Potentials, Costs and Implications for the Dutch Renewable
Electricity Market. ECN-C-2-034.
Energy Technology Support Unit (ETSU) of the Department of Trade
and Industry (DTI), 1996. A Review of Overseas Financing
Mechanisms and Incentives for Commercial Renewable Energy
Projects: Main Report, Vol. 1. ETSU K/FR/00026/REP/1,
Contractor Ilex Associates, UK.
Finnerty, J.D., 1996. Project Financing: Asset-based Financial
Engineering. Wiley, New York.
Gish, P.A., 1999. Project financing of renewable energy projects in
Europe: an improving market. Suffolk Transnational Law Review
XXII (2), 405–440.
Gregory, J., 1997. Financing Renewable Energy Projects: a Guide for
Development Workers. Intermediate Technology Publications,
London.
Haas, R., Eichhammer, W., Huber, C., Langniss, O., Lorenzoni, A.,
Madlener, R., Menanteau, P., Morthorst, E., Martins, A., Oniszk,
A., Schleich, J., Smith, A., Vass, Z., Verbruggen, A., 2004. How to
promote renewable energy systems successfully and effectively.
Energy Policy 32 (6), 833–839.
Hadley, S.W., Hill, L.J., Perlack, R.D., 1993. Report on the study of
the tax and rate treatment of renewable energy projects. Oak Ridge
National Laboratory, US Department of Energy, ORNL-6772,
December 1993.
Harris, F., Navarro, P., 2000. Promoting wind energy development in
an era of restructuring. The Electricity Journal, 34–39.
Helm, D., 2002. A critique of renewables policy in the UK. Energy
Policy 30 (3), 185–188.
Hines, M.A., 1997. The Development and Finance of Global Private
Finance. Quorum Books.
Huber, C., Haas, R., Faber, T., Resch, G., Green, G., Twidell, J.,
Ruigrok, W., 2002. Promoting renewables: which instrument is
optimal for society? Feed-in-tariff, tradable quotas ory? In:
Sayigh, A.A.M. (Ed.), Paper presented at the World Renewable
Energy Congress VII (WREC 2002), Koln, July 2002. Elsevier,
Amsterdam.
Hvelplund, F., 2001. Political price or political quantities? New Energy
8, 18–23.
Ingersoll, E., Imatteo, R., Vysatova, R.A., 1998. Financing large-scale
increases in photovoltaic production capacity through innovative
risk management structures and contracts. Special Report of
Renewable Energy Policy Project (REPP), of the Center for
Renewable Energy and Sustainable Technology (CREST) in the
United States, December.
Islas, J., Jeronimo, U., 2001. The financing of the Mexican electrical
sector. Energy Policy 29 (12), 965–973.
ARTICLE IN PRESSV. Dinica / Energy Policy 34 (2006) 461–480480
Jechoutek, K., Lamech, R., 1995. New directions in electric power
financing. Energy Policy 23 (11), 941–953 (Elsevier).
Joskow, P., 1995. Restructuring and Regulatory Reform in Network
Industries: from Hierarchies to Markets. Massachusetts Institute of
Technology.
Kahn, E., 1996. The production tax credit for wind turbine
power plants is an ineffective incentive. Energy Policy 24 (5),
427–435.
Economic Research and Policy Consulting (KPMG), 1999. A system
of Green Certificates report commissioned by the Dutch Ministry
for Economic Affairs, The Netherlands.
Langniss, O. (Ed.), 1999, Financing Renewable Energy Systems. Kiel,
London.
Langniss, O., Wiser, R., 2003. The renewables portfolio standard in
Texas: an early assessment. Energy Policy 31 (6), 527–535.
Lauber, V., 2002. Renewable energy at the EU level. In: Danyel, R.
(Ed.), Handbook of Renewable Energies in the European Union.
Peter Lang, Frankfurt, pp. 25–36.
Lauber, V., 2004. REFIT and RPS: options for a harmonised
community framework. Energy Policy 32, 1405–1414.
Lemming, J., 2003. Financial risks for green electricity investors and
producers in a tradable green certificate market. Energy Policy 31
(1), 21–32.
Megill, R.E., 1988. An introduction to exploration economics.
Pennwell Publishing Company, Tulsa, OK.
Menanteau, P., Finon, D., Lamy, M.L., 2003. Prices versus quantities:
choosing policies for promoting the development of renewable
energy. Energy Policy 31 (8), 799–812.
Mendis, M.S., 1997. Financing renewable energy projects: constraints
and opportunities. Silver Spring, Alternative Energy Development.
Meyer, N., 2003. European schemes for promoting renewables in
liberalised markets. Energy Policy 31 (7), 665–676.
Mitchell, C., 1994. The renewable non-fossil obligation—a case of the
barriers to energy technology development. Doctoral Thesis,
University of Sussex, United Kingdom.
Murray, B., 1998. Electricity Markets—Investment and Performance
Analysis. Wiley, New York.
Ocharan de la Camara, Enrique, 2001. Technical adviser of the
General Sub-direction of Energy Planning Ministry of Economy
(former employee of the Ministry of Industry and Energy MINER)
interviews in April and August 2001.
Pollio, G., 1998. Project finance and international energy development.
Energy Policy 26 (9), 687–697.
Rader, N.A., Wiser, R., 1999. Strategies for supporting wind energy: a
review and analysis of state policy options. National Wind
Coordinating Committee in the US, July 1999, available at
http://www.nationalwind.org/pubs.
Rose, J., Muthiach, S., Fusco, M., 1997. Financial engineer in the
power sector. The Electricity Journal, 79–86.
Sidak, J.G., Spulber, D.F., 1998. Deregulatory Takings and
the Regulatory Contract—the Competitive Transformation of
Network Industries in the United States. Cambridge University,
Cambridge.
Welp, G., Schimana, D., 2002. Dealing with risks aspects for financing
renewable energy projects. In: Sayigh, A.A.M. (Ed.), Paper
Delivered for the World Renewable Energy Congress VII (WREC
2002), Koln July 2002. Elsevier, Amsterdam.
Wiser, R., Pickle, S., 1997. Financing investments in renewable energy:
the role of policy design and restructuring. University of
California, Lawrence Berkeley National laboratories, Environ-
mental Energy Technologies Division, LNBNL-39826, UC-1321,
Unites States.
Woo, C.K., Horowitz, I., Hoang, K., 2001. Cross hedging and
forward-contract pricing of electricity. Energy Economics 23 (1),
1–15.
Wright, R.W., 2002. Private capital and private markets. In: Sayigh,
A.A.M. (Ed.), Paper presented at the World Renewable Energy
Congress VII (WREC 2002), Koln July 2002. Elsevier, Amsterdam.
Further Reading
Bernow, S., Biewald, B., Marron, D., 1990. Avoided cost contracts can
undermine least-cost planning. Energy Policy 18, 624–630.
Berry, T., Jaccard, M., 2001. The renewable portfolio standard: design
considerations and an implementation survey. Energy Policy 29 (4),
263–277.
Cerveny, M., Resch, G., 1998. Feed-in tariffs and regulations
concerning renewable energy and electricity generation in Eur-
opean countries. Energieverwentungsagentur, Vienna.
Energie Research Center Nederland (ECN), 2000. In: Groenendaal,
B.J., de Lage, T.J., Lako, P., van Roosmalen, J.A.M., Tool, C.J.J.,
de Wild-Scholten, M.J. (Eds.), Critical Success Factors for the
Large Scale Introduction of Grid-Connected Photovoltaic Sys-
tems—a Survey Focusing on Non-technical Aspects. ECN-C-00-
086, November 2000.
Energie Research Center Nederland (ECN), 2002a. In: Lako, P. (Ed.),
Learning and Diffusion for Wind and Solar Power Technologies.
ECN-C-2-001, April 2002.
Energy Research Center Netherlands (ECN), 2001. Energy Market
Trends in the Netherlands 2000. ECN, Petten, The Netherlands.
Langniss, O., 1996. Instruments to foster renewable energy invest-
ments in Europe a survey under the financial point of view.
Renewable Energy 9 (1–4), 1112–1115.
Langniss, O., 1997. Green prices: approaches and potential. German
Aerospace Center, Research Study Funded by the European
Parliament Contract No. IV/97/05.
Samuels, J., Wilkes, M., Brayshaw, R., 1999. Financial Management
and Decision Making. International Thomson Business Press,
London.
Viguier, L., 2001. Fair trade and harmonization of climate policies in
Europe. Energy Policy 29 (10), 749–753.
Copyright © 2022 FDOKUMEN